Investigating the use of digital technology in Jewellery Design
Upload
khangminh22Category
view
2download
0
– 1 –
Hong Kong Exchanges and Clearing Limited and The Stock Exchange of Hong Kong Limited take no responsibility for the contents of this announcement, make no representation as to its accuracy or completeness and expressly disclaim any liability whatsoever for any loss howsoever arising from or in reliance upon the whole or any part of the contents of this announcement.
CITYCHAMP WATCH & JEWELLERY GROUP LIMITED冠城鐘錶珠寶集團有限公司
(Incorporated in the Cayman Islands with limited liability)(Stock Code: 256)
ANNUAL RESULTS ANNOUNCEMENTFOR THE YEAR ENDED 31 DECEMBER 2020
The board of directors (the “Board”) of Citychamp Watch & Jewellery Group Limited (the “Company”) hereby announces the audited consolidated results of the Company and its subsidiaries (collectively referred to as the “Group”) for the year ended 31 December 2020 together with comparative figures for the year ended 31 December 2019 as follows:

– 2 –
CONSOLIDATED STATEMENT OF COMPREHENSIVE INCOMEFor the year ended 31 December 2020
2020 2019Notes HK$’000 HK$’000
Interest income from banking business 156,731 220,821Interest expenses from banking business (28,703) (37,359)
Net interest income from banking business 5a 128,028 183,462
Service fees and commission income from banking business 258,001 280,627
Service fees and commission expenses from banking business (61,007) (68,066)
Net service fees and commission income from banking business 5b 196,994 212,561
Trading income from banking business 5c 21,702 57,230Service fees and commission income
from financial business 5d 10,721 3,195Interest income from financial business 5d 184 165Sales of goods from non-banking and
financial businesses 5e 1,405,812 2,249,737Rental income from non-banking and
financial businesses 5e 11,108 9,915
Total revenue 1,774,549 2,716,265
Cost of sales from non-banking and financial businesses (647,405) (1,004,030)
Other income and other net gains or losses 6 98,333 104,393Selling and distribution expenses (550,428) (817,889)Administrative expenses (728,432) (777,114)Share of loss of joint ventures (494) (1,343)Share of profit of associates 3,180 17,675Finance costs from non-banking business 7 (82,956) (95,320)
(Loss)/profit before income tax 8 (133,653) 142,637Income tax expense 9 (25,176) (71,456)
(Loss)/profit for the year (158,829) 71,181
– 3 –
2020 2019Notes HK$’000 HK$’000
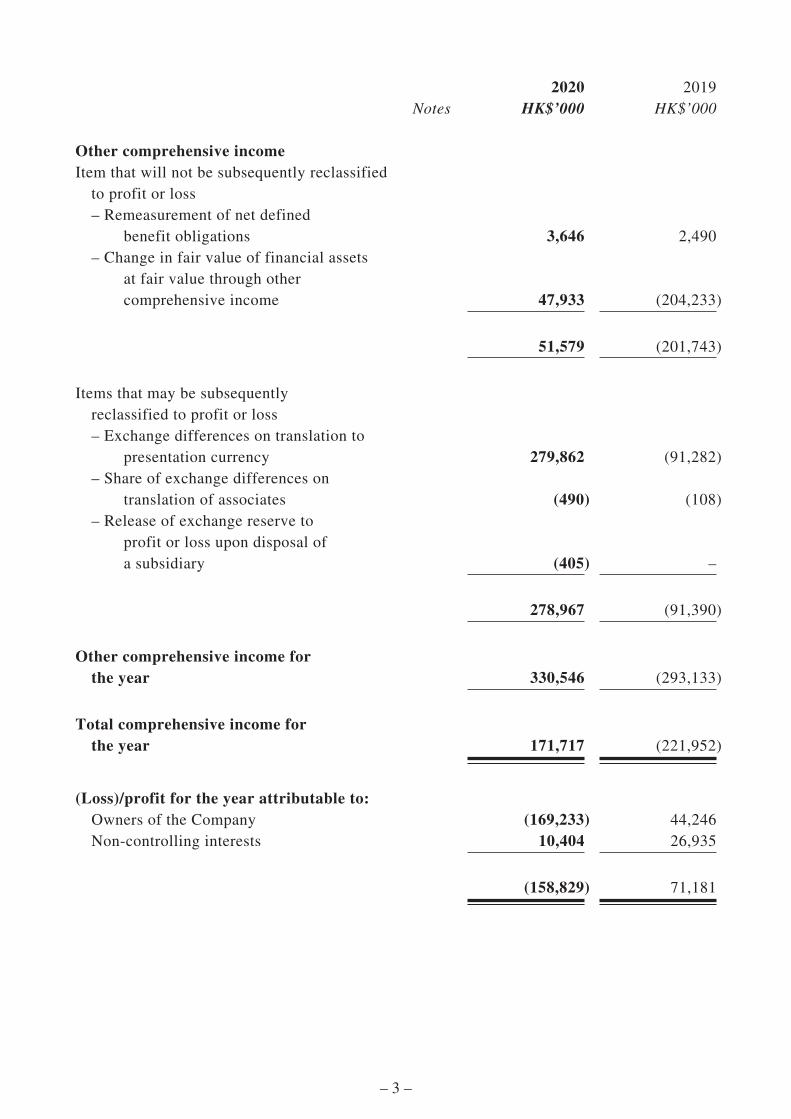
Other comprehensive incomeItem that will not be subsequently reclassified
to profit or loss– Remeasurement of net defined
benefit obligations 3,646 2,490– Change in fair value of financial assets
at fair value through other comprehensive income 47,933 (204,233)
51,579 (201,743)
Items that may be subsequently reclassified to profit or loss– Exchange differences on translation to
presentation currency 279,862 (91,282)– Share of exchange differences on
translation of associates (490) (108)– Release of exchange reserve to
profit or loss upon disposal of a subsidiary (405) –
278,967 (91,390)
Other comprehensive income for the year 330,546 (293,133)
Total comprehensive income for the year 171,717 (221,952)
(Loss)/profit for the year attributable to:Owners of the Company (169,233) 44,246Non-controlling interests 10,404 26,935
(158,829) 71,181
– 4 –
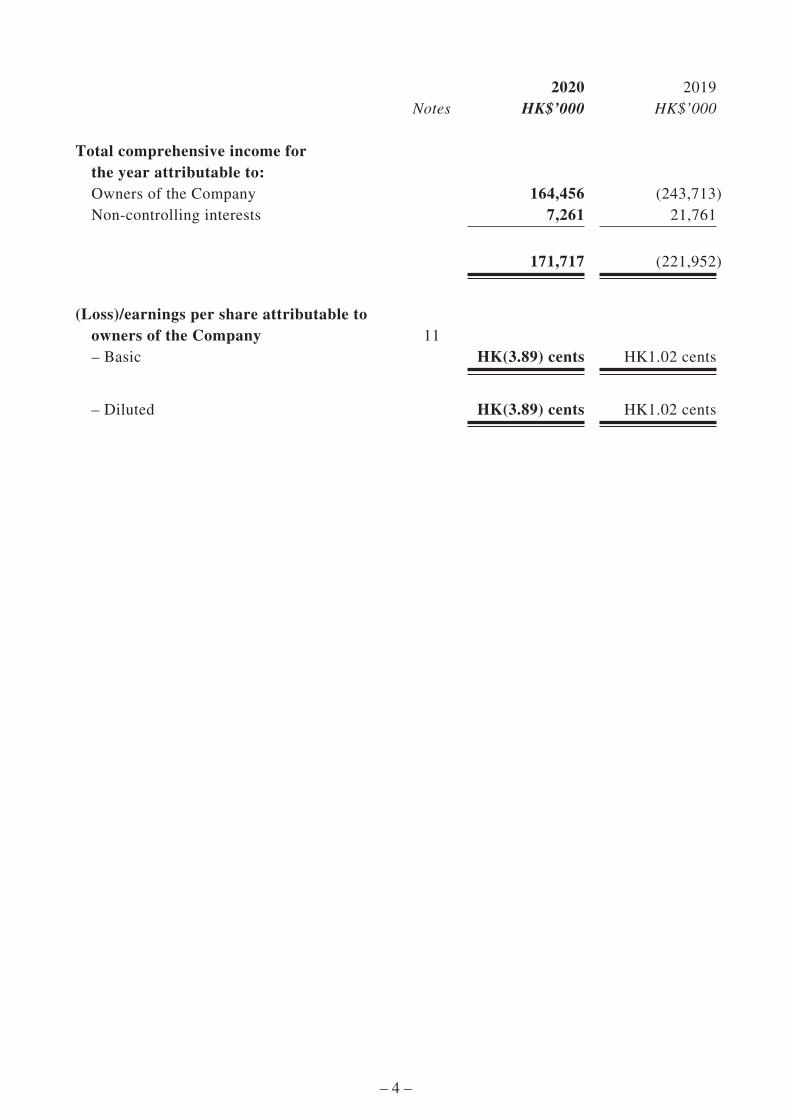
2020 2019Notes HK$’000 HK$’000
Total comprehensive income for the year attributable to:Owners of the Company 164,456 (243,713)Non-controlling interests 7,261 21,761
171,717 (221,952)
(Loss)/earnings per share attributable to owners of the Company 11– Basic HK(3.89) cents HK1.02 cents
– Diluted HK(3.89) cents HK1.02 cents

– 5 –
CONSOLIDATED STATEMENT OF FINANCIAL POSITIONAs at 31 December 2020
2020 2019Notes HK$’000 HK$’000
AssetsCash and deposits 5,612,645 4,897,246Due from clients 2,463,225 2,093,250Due from banks 5,466,260 4,901,198Trading portfolio investments 80,310 227,903Financial assets at fair value through
other comprehensive income 470,794 422,861Derivative financial assets 29,224 10,275Trade receivables 12 391,747 478,262Other financial assets at amortised cost 1,449,886 1,307,960Inventories 2,255,553 2,257,966Income tax recoverable 2,299 7,706Interests in joint ventures 602 1,096Interests in associates 113,176 115,486Property, plant and equipment 1,270,726 1,148,049Investment properties 195,427 182,186Intangible assets 13 54,415 52,089Goodwill 14 1,144,071 1,065,051Deferred tax assets 13,961 11,626Other assets 370,874 416,871
Total assets 21,385,195 19,597,081

– 6 –
2020 2019Notes HK$’000 HK$’000
LiabilitiesDue to banks 2,639 17,968Due to clients 13,965,477 11,963,052Derivative financial liabilities 31,334 54,788Trade payables 15 360,624 411,427Contract liabilities 13,824 18,565Income tax payables 36,799 55,577Borrowings 16 1,564,822 1,740,362Provisions 368 –Lease liabilities 57,570 83,975Deferred tax liabilities 55,377 59,881Due to a shareholder 12,000 12,000Due to directors 21,233 22,241Other liabilities 526,901 496,356
Total liabilities 16,648,968 14,936,192
EquityEquity attributable to owners of
the CompanyShare capital 435,189 435,189Reserves 3,983,490 3,819,883
4,418,679 4,255,072Non-controlling interests 317,548 405,817
Total equity 4,736,227 4,660,889
Total liabilities and equity 21,385,195 19,597,081
– 7 –
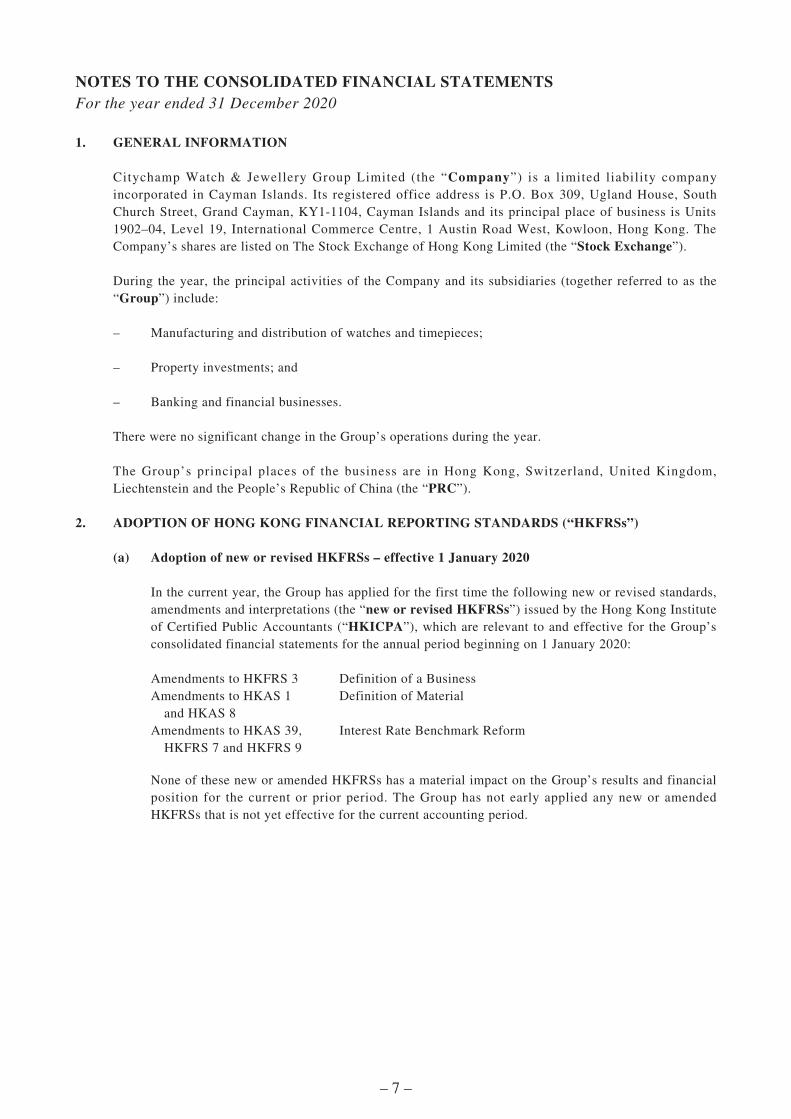
NOTES TO THE CONSOLIDATED FINANCIAL STATEMENTSFor the year ended 31 December 2020
1. GENERAL INFORMATION
Citychamp Watch & Jewellery Group Limited (the “Company”) is a limited liability company incorporated in Cayman Islands. Its registered office address is P.O. Box 309, Ugland House, South Church Street, Grand Cayman, KY1-1104, Cayman Islands and its principal place of business is Units 1902–04, Level 19, International Commerce Centre, 1 Austin Road West, Kowloon, Hong Kong. The Company’s shares are listed on The Stock Exchange of Hong Kong Limited (the “Stock Exchange”).
During the year, the principal activities of the Company and its subsidiaries (together referred to as the “Group”) include:
– Manufacturing and distribution of watches and timepieces;
– Property investments; and
– Banking and financial businesses.
There were no significant change in the Group’s operations during the year.
The Group’s principal places of the business are in Hong Kong, Switzerland, United Kingdom, Liechtenstein and the People’s Republic of China (the “PRC”).
2. ADOPTION OF HONG KONG FINANCIAL REPORTING STANDARDS (“HKFRSs”)
(a) Adoption of new or revised HKFRSs – effective 1 January 2020
In the current year, the Group has applied for the first time the following new or revised standards, amendments and interpretations (the “new or revised HKFRSs”) issued by the Hong Kong Institute of Certified Public Accountants (“HKICPA”), which are relevant to and effective for the Group’s consolidated financial statements for the annual period beginning on 1 January 2020:
Amendments to HKFRS 3 Definition of a BusinessAmendments to HKAS 1
and HKAS 8Definition of Material
Amendments to HKAS 39, HKFRS 7 and HKFRS 9
Interest Rate Benchmark Reform
None of these new or amended HKFRSs has a material impact on the Group’s results and financial position for the current or prior period. The Group has not early applied any new or amended HKFRSs that is not yet effective for the current accounting period.

– 8 –
(b) New or revised HKFRSs that have been issued but are not yet effective
The following new or revised HKFRSs, potentially relevant to the Group’s consolidated financial statements, have been issued but are not yet effective and have not been early adopted by the Group.
Amendments to HKAS 1 Classification of Liabilities as Current or Non-current and Hong Kong Interpretation 5 (2020), Presentation of Financial Statements – Classification by the Borrower of a Term Loan that Contains a Repayment on Demand Clause5
Amendments to HKAS 16 Proceeds before Intended Use3
Amendments to HKAS 37 Onerous Contracts – Cost of Fulfilling a Contract3
HKFRS 17 Insurance Contracts5
Amendments to HKFRS 3 Reference to the Conceptual Framework4
Amendments to HKFRS 10 and HKAS 28
Sale or Contribution of Assets between an Investor and its Associate or Joint Venture6
Amendment to HKFRS 16 Covid-19-Related Rent Concessions1
Amendments to HKAS 39, HKFRS 4, HKFRS 7, HKFRS 9 and HKFRS 16
Interest Rate Benchmark Reform – Phase 22
Amendments to HKFRS Standards
Annual Improvements to HKFRSs 2018–20203
1 Effective for annual periods beginning on or after 1 June 20202 Effective for annual periods beginning on or after 1 January 20213 Effective for annual periods beginning on or after 1 January 20224 Effective for business combinations for which the date of acquisition is on or after the
beginning of the first annual period beginning on or after 1 January 20225 Effective for annual periods beginning on or after 1 January 20236 The amendments shall be applied prospectively to the sale or contribution of assets occurring
in annual periods beginning on or after a date to be determined
Amendments to HKAS 1 – Classification of Liabilities as Current or Non-current and Hong Kong Interpretation 5 (2020), Presentation of Financial Statements – Classification by the Borrower of a Term Loan that Contains a Repayment on Demand Clause
The amendments clarify that the classification of liabilities as current or non-current is based on rights that are in existence at the end of the reporting period, specify that classification is unaffected by expectations about whether an entity will exercise its right to defer settlement of a liability and explain that rights are in existence if covenants are complied with at the end of the reporting period. The amendments also introduce a definition of ‘settlement’ to make clear that settlement refers to the transfer to the counterparty of cash, equity instruments, other assets or services.
Amendments to HKAS 16 – Proceeds before Intended Use
The amendments prohibit deducting from the cost of an item of property, plant and equipment any proceeds from selling items produced while bringing that asset to the location and condition necessary for it to be capable of operating in the manner intended by management. Instead, the proceeds from selling such items, and the cost of producing those items, is recognised in profit or loss.
– 9 –
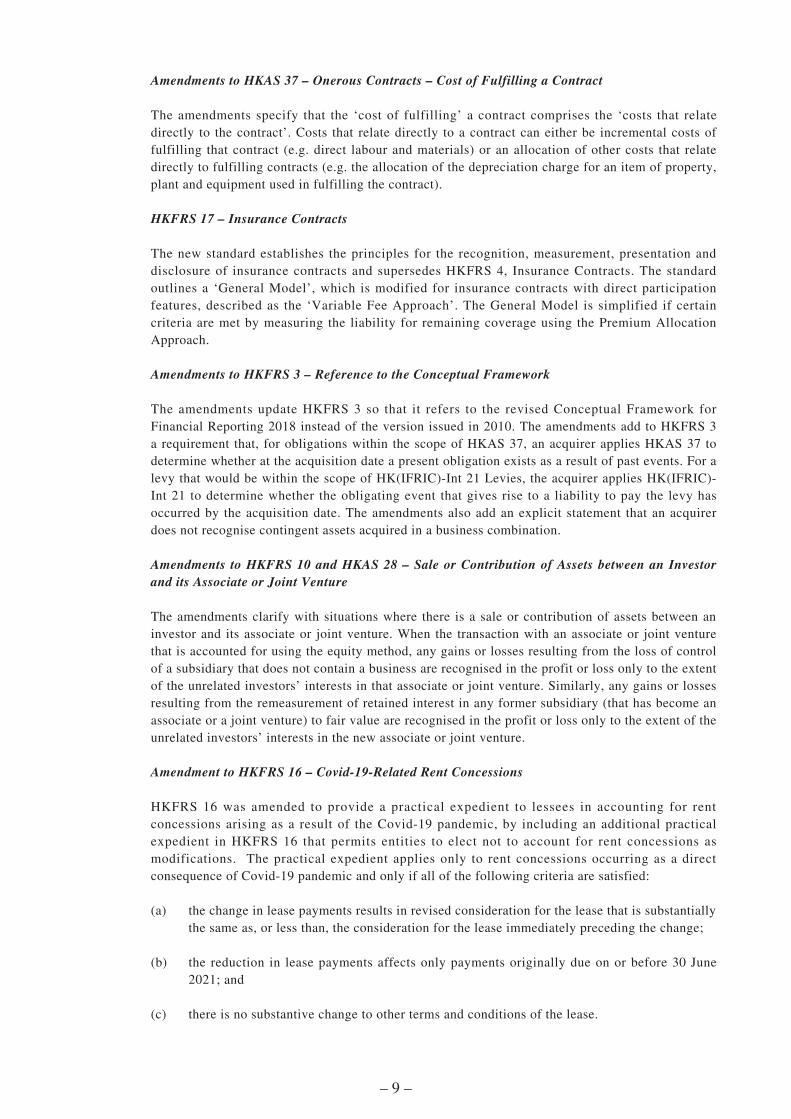
Amendments to HKAS 37 – Onerous Contracts – Cost of Fulfilling a Contract
The amendments specify that the ‘cost of fulfilling’ a contract comprises the ‘costs that relate directly to the contract’. Costs that relate directly to a contract can either be incremental costs of fulfilling that contract (e.g. direct labour and materials) or an allocation of other costs that relate directly to fulfilling contracts (e.g. the allocation of the depreciation charge for an item of property, plant and equipment used in fulfilling the contract).
HKFRS 17 – Insurance Contracts
The new standard establishes the principles for the recognition, measurement, presentation and disclosure of insurance contracts and supersedes HKFRS 4, Insurance Contracts. The standard outlines a ‘General Model’, which is modified for insurance contracts with direct participation features, described as the ‘Variable Fee Approach’. The General Model is simplified if certain criteria are met by measuring the liability for remaining coverage using the Premium Allocation Approach.
Amendments to HKFRS 3 – Reference to the Conceptual Framework
The amendments update HKFRS 3 so that it refers to the revised Conceptual Framework for Financial Reporting 2018 instead of the version issued in 2010. The amendments add to HKFRS 3 a requirement that, for obligations within the scope of HKAS 37, an acquirer applies HKAS 37 to determine whether at the acquisition date a present obligation exists as a result of past events. For a levy that would be within the scope of HK(IFRIC)-Int 21 Levies, the acquirer applies HK(IFRIC)-Int 21 to determine whether the obligating event that gives rise to a liability to pay the levy has occurred by the acquisition date. The amendments also add an explicit statement that an acquirer does not recognise contingent assets acquired in a business combination.
Amendments to HKFRS 10 and HKAS 28 – Sale or Contribution of Assets between an Investor and its Associate or Joint Venture
The amendments clarify with situations where there is a sale or contribution of assets between an investor and its associate or joint venture. When the transaction with an associate or joint venture that is accounted for using the equity method, any gains or losses resulting from the loss of control of a subsidiary that does not contain a business are recognised in the profit or loss only to the extent of the unrelated investors’ interests in that associate or joint venture. Similarly, any gains or losses resulting from the remeasurement of retained interest in any former subsidiary (that has become an associate or a joint venture) to fair value are recognised in the profit or loss only to the extent of the unrelated investors’ interests in the new associate or joint venture.
Amendment to HKFRS 16 – Covid-19-Related Rent Concessions
HKFRS 16 was amended to provide a practical expedient to lessees in accounting for rent concessions arising as a result of the Covid-19 pandemic, by including an additional practical expedient in HKFRS 16 that permits entities to elect not to account for rent concessions as modifications. The practical expedient applies only to rent concessions occurring as a direct consequence of Covid-19 pandemic and only if all of the following criteria are satisfied:
(a) the change in lease payments results in revised consideration for the lease that is substantially the same as, or less than, the consideration for the lease immediately preceding the change;
(b) the reduction in lease payments affects only payments originally due on or before 30 June 2021; and
(c) there is no substantive change to other terms and conditions of the lease.

– 10 –
Rent concessions that satisfy these criteria may be accounted for in accordance with this practical expedient, which means the lessee does not need to assess whether the rent concession meets the definition of lease modification. Lessees shall apply other requirements of HKFRS 16 in accounting for the rent concession.
Accounting for rent concessions as lease modifications would have resulted in the Group remeasuring the lease liability to reflect the revised consideration using a revised discount rate, with the effect of the change in the lease liability recorded against the right-of-use asset. By applying the practical expedient, the Group is not required to determine a revised discount rate and the effect of the change in the lease liability is reflected in profit or loss in the period in which the event or condition that triggers the rent concession occurs.
Amendments to HKAS 39, HKFRS 4, HKFRS 7, HKFRS 9 and HKFRS 16 – Interest Rate Benchmark Reform – Phase 2
The amendments address issues that might affect financial reporting when a company replaces the old interest rate benchmark with an alternative benchmark rate as a result of the interest rate benchmark reform (the “Reform”). The amendments complement those issued in November 2019 and relate to (a) changes to contractual cash flows in which an entity will not have to derecognise or adjust the carrying amount of financial instruments for changes required by the Reform, but will instead update the effective interest rate to reflect the change to the alternative benchmark rate; (b) hedge accounting in which an entity will not have to discontinue its hedge accounting solely because it makes changes required by the Reform, if the hedge meets other hedge accounting criteria; and (c) disclosures in which an entity will be required to disclose information about new risks arising from the Reform and how it manages the transition to alternative benchmark rates.
Amendments to HKFRS Standards – Annual Improvements to HKFRSs 2018–2020
The annual improvements amends a number of standards, including:
• HKFRS 1, First-time Adoption of Hong Kong Financial Reporting Standards, which permit a subsidiary that applies paragraph D16(a) of HKFRS 1 to measure cumulative translation differences using the amounts reported by its parent, based on the parent’s date of transition to HKFRSs.
• HKFRS 9, Financial Instruments, which clarify the fees included in the ‘10 per cent’ test in paragraph B3.3.6 of HKFRS 9 in assessing whether to derecognise a financial liability, explaining that only fees paid or received between the entity and the lender, including fees paid or received by either the entity or the lender on other’s behalf are included.
• HKFRS 16, Leases, which amend Illustrative Example 13 to remove the illustration of reimbursement of leasehold improvements by the lessor in order to resolve any potential confusion regarding the treatment of lease incentives that might arise because of how lease incentives are illustrated in that example.
• HKAS 41, Agriculture, which remove the requirement to exclude taxation cash flows when measuring the fair value of a biological asset using a present value technique.
The Group is in the progress of making assessments of the potential impact of these new or revised HKFRSs upon initial application.
– 11 –
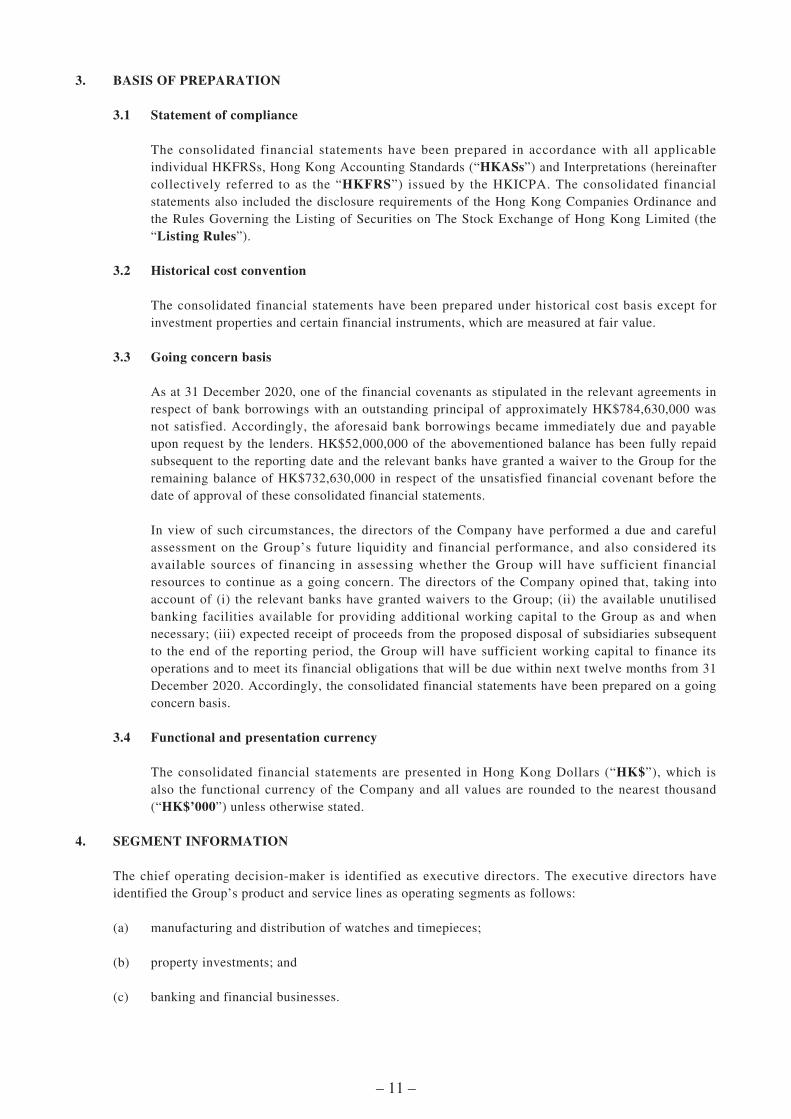
3. BASIS OF PREPARATION
3.1 Statement of compliance
The consolidated financial statements have been prepared in accordance with all applicable individual HKFRSs, Hong Kong Accounting Standards (“HKASs”) and Interpretations (hereinafter collectively referred to as the “HKFRS”) issued by the HKICPA. The consolidated financial statements also included the disclosure requirements of the Hong Kong Companies Ordinance and the Rules Governing the Listing of Securities on The Stock Exchange of Hong Kong Limited (the “Listing Rules”).
3.2 Historical cost convention
The consolidated financial statements have been prepared under historical cost basis except for investment properties and certain financial instruments, which are measured at fair value.
3.3 Going concern basis
As at 31 December 2020, one of the financial covenants as stipulated in the relevant agreements in respect of bank borrowings with an outstanding principal of approximately HK$784,630,000 was not satisfied. Accordingly, the aforesaid bank borrowings became immediately due and payable upon request by the lenders. HK$52,000,000 of the abovementioned balance has been fully repaid subsequent to the reporting date and the relevant banks have granted a waiver to the Group for the remaining balance of HK$732,630,000 in respect of the unsatisfied financial covenant before the date of approval of these consolidated financial statements.
In view of such circumstances, the directors of the Company have performed a due and careful assessment on the Group’s future liquidity and financial performance, and also considered its available sources of financing in assessing whether the Group will have sufficient financial resources to continue as a going concern. The directors of the Company opined that, taking into account of (i) the relevant banks have granted waivers to the Group; (ii) the available unutilised banking facilities available for providing additional working capital to the Group as and when necessary; (iii) expected receipt of proceeds from the proposed disposal of subsidiaries subsequent to the end of the reporting period, the Group will have sufficient working capital to finance its operations and to meet its financial obligations that will be due within next twelve months from 31 December 2020. Accordingly, the consolidated financial statements have been prepared on a going concern basis.
3.4 Functional and presentation currency
The consolidated financial statements are presented in Hong Kong Dollars (“HK$”), which is also the functional currency of the Company and all values are rounded to the nearest thousand (“HK$’000”) unless otherwise stated.
4. SEGMENT INFORMATION
The chief operating decision-maker is identified as executive directors. The executive directors have identified the Group’s product and service lines as operating segments as follows:
(a) manufacturing and distribution of watches and timepieces;
(b) property investments; and
(c) banking and financial businesses.
– 12 –
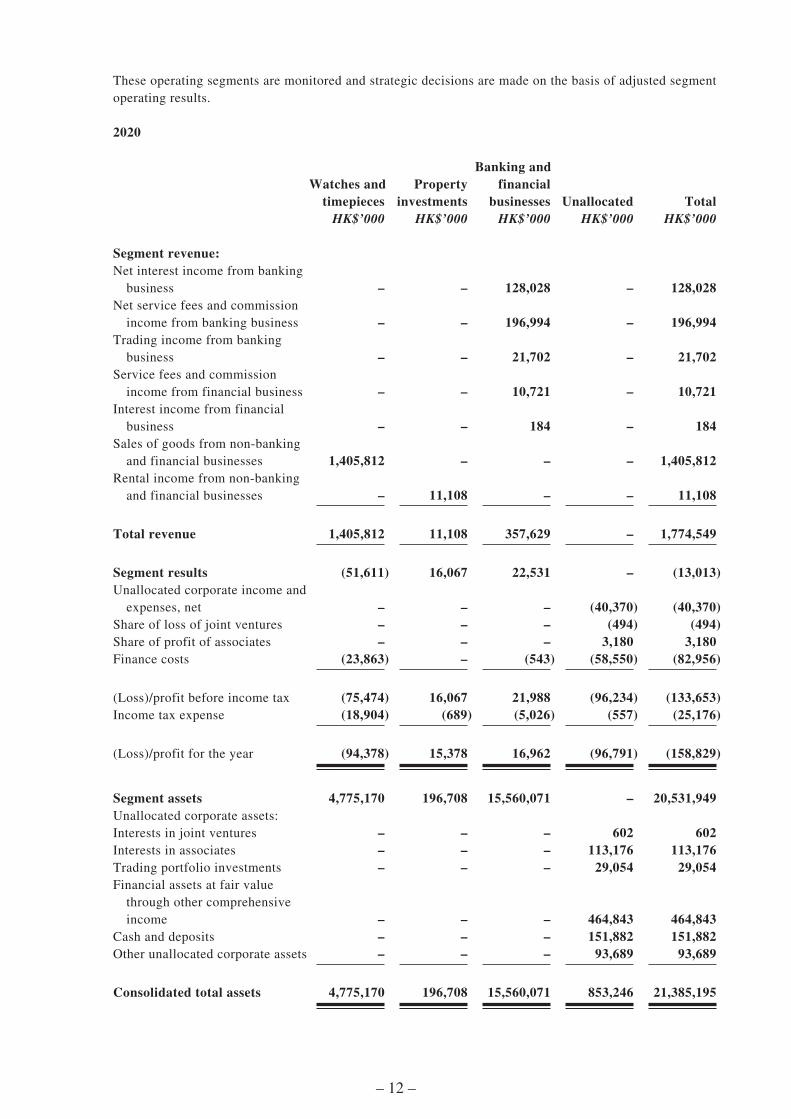
These operating segments are monitored and strategic decisions are made on the basis of adjusted segment operating results.
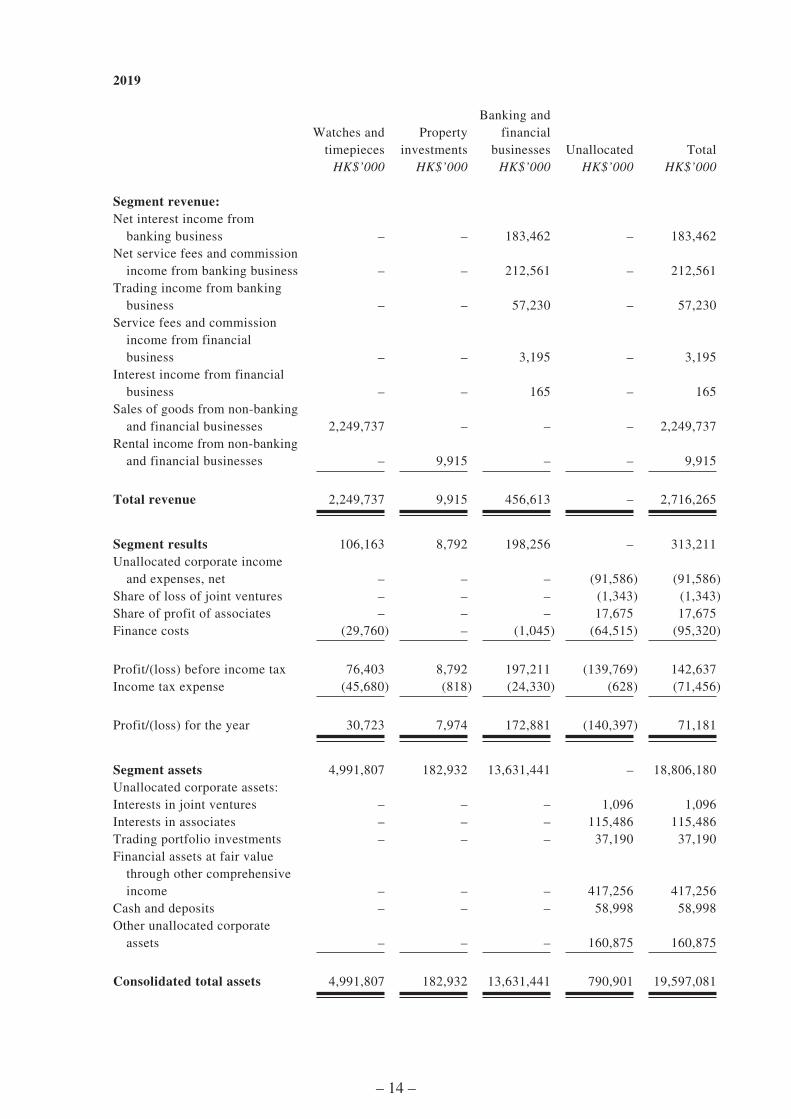
2020
Watches andtimepieces
Propertyinvestments
Banking andfinancial
businesses Unallocated TotalHK$’000 HK$’000 HK$’000 HK$’000 HK$’000
Segment revenue:Net interest income from banking
business – – 128,028 – 128,028Net service fees and commission
income from banking business – – 196,994 – 196,994Trading income from banking
business – – 21,702 – 21,702Service fees and commission
income from financial business – – 10,721 – 10,721Interest income from financial
business – – 184 – 184Sales of goods from non-banking
and financial businesses 1,405,812 – – – 1,405,812Rental income from non-banking
and financial businesses – 11,108 – – 11,108 Total revenue 1,405,812 11,108 357,629 – 1,774,549
Segment results (51,611) 16,067 22,531 – (13,013)Unallocated corporate income and
expenses, net – – – (40,370) (40,370)Share of loss of joint ventures – – – (494) (494)Share of profit of associates – – – 3,180 3,180Finance costs (23,863) – (543) (58,550) (82,956)
(Loss)/profit before income tax (75,474) 16,067 21,988 (96,234) (133,653)Income tax expense (18,904) (689) (5,026) (557) (25,176)
(Loss)/profit for the year (94,378) 15,378 16,962 (96,791) (158,829)
Segment assets 4,775,170 196,708 15,560,071 – 20,531,949Unallocated corporate assets:Interests in joint ventures – – – 602 602Interests in associates – – – 113,176 113,176Trading portfolio investments – – – 29,054 29,054Financial assets at fair value
through other comprehensive income – – – 464,843 464,843
Cash and deposits – – – 151,882 151,882Other unallocated corporate assets – – – 93,689 93,689
Consolidated total assets 4,775,170 196,708 15,560,071 853,246 21,385,195

– 13 –
Watches andtimepieces
Propertyinvestments
Banking andfinancial
businesses Unallocated TotalHK$’000 HK$’000 HK$’000 HK$’000 HK$’000
Segment liabilities 1,109,730 30,627 14,283,267 – 15,423,624Unallocated corporate liabilities:Borrowings – – – 1,125,028 1,125,028Amount due to a shareholder – – – 12,000 12,000Lease liabilities – – – 19,336 19,336Other unallocated corporate
liabilities – – – 68,980 68,980
Consolidated total liabilities 1,109,730 30,627 14,283,267 1,225,344 16,648,968
Other segment informationInterest income and other interest
income 3,365 214 630 13 4,222Expected credit losses on trade
receivables (16,960) – – – (16,960)Expected credit losses on
other assets (826) – – – (826)Provision of expected credit
losses on due from banks and customers – – (278) – (278)
Provision for litigation risks, net – – (1,907) – (1,907)Provision for inventories (13,088) – – – (13,088)Reversal of provision for
inventories 12,819 – – – 12,819Depreciation and amortisation (121,057) – (21,611) (19,205) (161,873)Additions to non-current assets 61,864 – 128,993 87 190,944Net surplus on revaluation of
investment properties – 9,723 – – 9,723
– 14 –
2019
Watches andtimepieces
Propertyinvestments
Banking andfinancial
businesses Unallocated TotalHK$’000 HK$’000 HK$’000 HK$’000 HK$’000
Segment revenue:Net interest income from
banking business – – 183,462 – 183,462Net service fees and commission
income from banking business – – 212,561 – 212,561Trading income from banking
business – – 57,230 – 57,230Service fees and commission
income from financial business – – 3,195 – 3,195
Interest income from financial business – – 165 – 165
Sales of goods from non-banking and financial businesses 2,249,737 – – – 2,249,737
Rental income from non-banking and financial businesses – 9,915 – – 9,915
Total revenue 2,249,737 9,915 456,613 – 2,716,265
Segment results 106,163 8,792 198,256 – 313,211Unallocated corporate income
and expenses, net – – – (91,586) (91,586)Share of loss of joint ventures – – – (1,343) (1,343)Share of profit of associates – – – 17,675 17,675Finance costs (29,760) – (1,045) (64,515) (95,320)
Profit/(loss) before income tax 76,403 8,792 197,211 (139,769) 142,637Income tax expense (45,680) (818) (24,330) (628) (71,456)
Profit/(loss) for the year 30,723 7,974 172,881 (140,397) 71,181
Segment assets 4,991,807 182,932 13,631,441 – 18,806,180Unallocated corporate assets:Interests in joint ventures – – – 1,096 1,096Interests in associates – – – 115,486 115,486Trading portfolio investments – – – 37,190 37,190Financial assets at fair value
through other comprehensive income – – – 417,256 417,256
Cash and deposits – – – 58,998 58,998Other unallocated corporate
assets – – – 160,875 160,875
Consolidated total assets 4,991,807 182,932 13,631,441 790,901 19,597,081
– 15 –
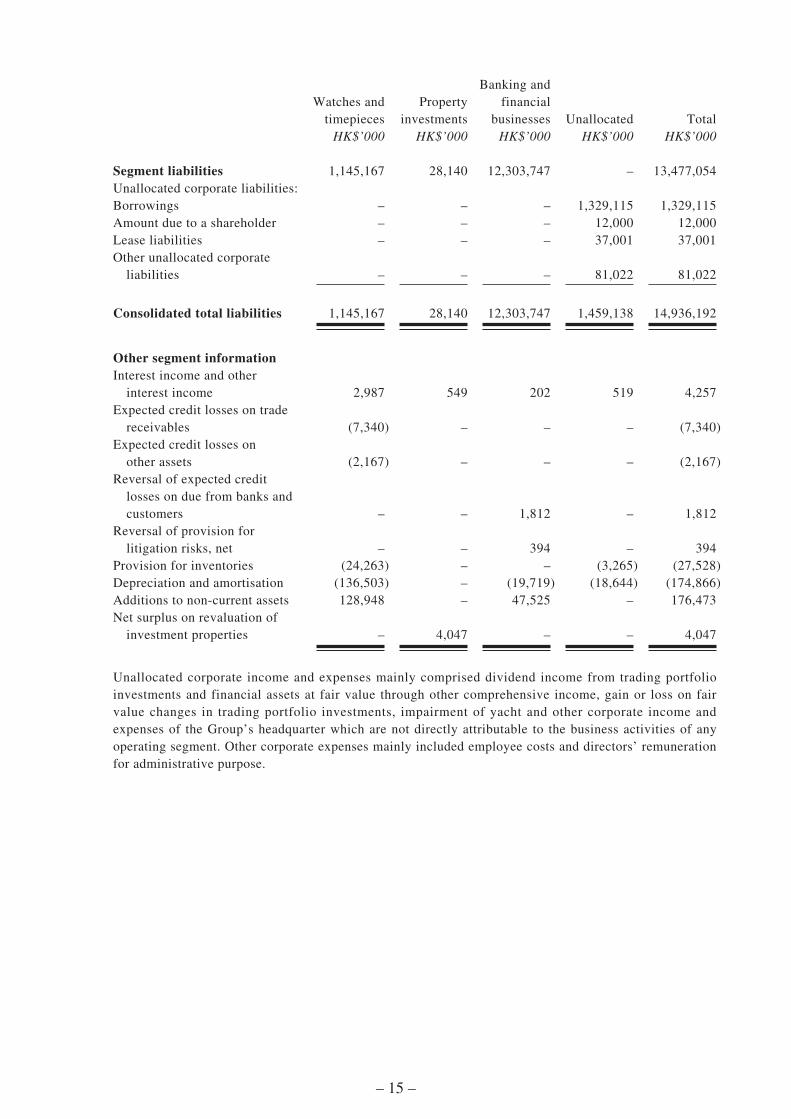
Watches andtimepieces
Propertyinvestments
Banking andfinancial
businesses Unallocated TotalHK$’000 HK$’000 HK$’000 HK$’000 HK$’000
Segment liabilities 1,145,167 28,140 12,303,747 – 13,477,054Unallocated corporate liabilities:Borrowings – – – 1,329,115 1,329,115Amount due to a shareholder – – – 12,000 12,000Lease liabilities – – – 37,001 37,001Other unallocated corporate
liabilities – – – 81,022 81,022
Consolidated total liabilities 1,145,167 28,140 12,303,747 1,459,138 14,936,192
Other segment informationInterest income and other
interest income 2,987 549 202 519 4,257Expected credit losses on trade
receivables (7,340) – – – (7,340)Expected credit losses on
other assets (2,167) – – – (2,167)Reversal of expected credit
losses on due from banks and customers – – 1,812 – 1,812
Reversal of provision for litigation risks, net – – 394 – 394
Provision for inventories (24,263) – – (3,265) (27,528)Depreciation and amortisation (136,503) – (19,719) (18,644) (174,866)Additions to non-current assets 128,948 – 47,525 – 176,473Net surplus on revaluation of
investment properties – 4,047 – – 4,047
Unallocated corporate income and expenses mainly comprised dividend income from trading portfolio investments and financial assets at fair value through other comprehensive income, gain or loss on fair value changes in trading portfolio investments, impairment of yacht and other corporate income and expenses of the Group’s headquarter which are not directly attributable to the business activities of any operating segment. Other corporate expenses mainly included employee costs and directors’ remuneration for administrative purpose.
– 16 –
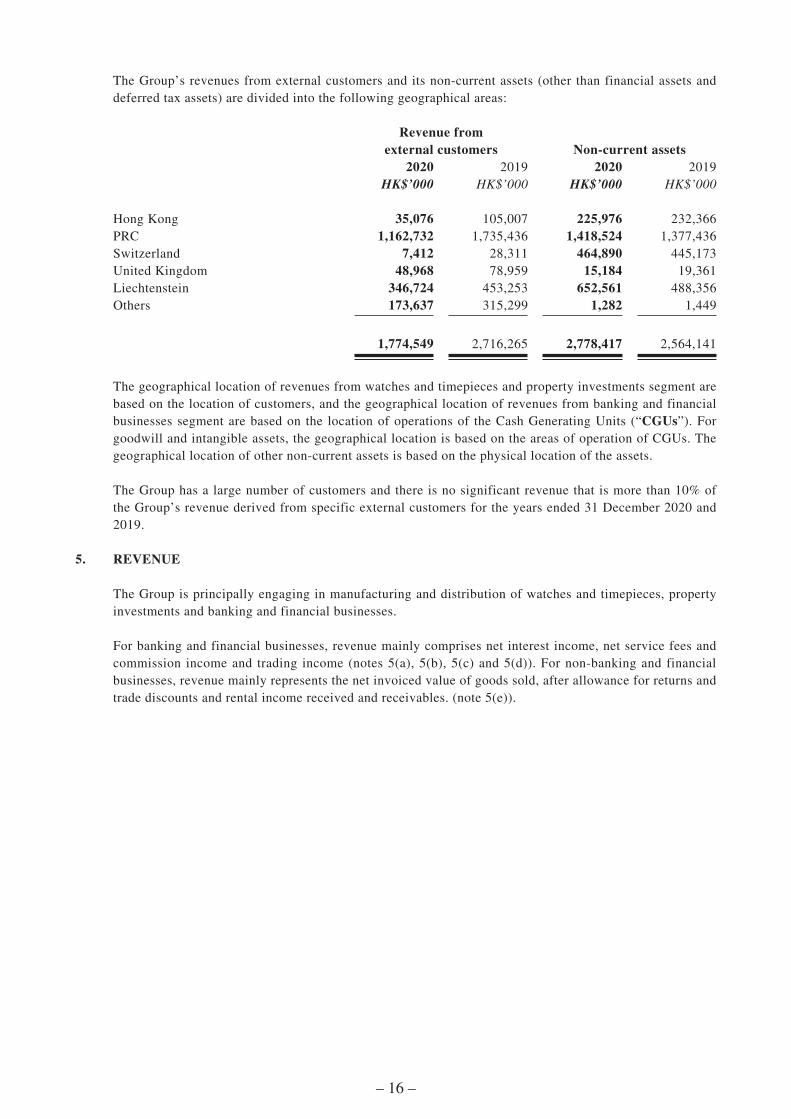
The Group’s revenues from external customers and its non-current assets (other than financial assets and deferred tax assets) are divided into the following geographical areas:
Revenue fromexternal customers Non-current assets
2020 2019 2020 2019HK$’000 HK$’000 HK$’000 HK$’000
Hong Kong 35,076 105,007 225,976 232,366PRC 1,162,732 1,735,436 1,418,524 1,377,436Switzerland 7,412 28,311 464,890 445,173United Kingdom 48,968 78,959 15,184 19,361Liechtenstein 346,724 453,253 652,561 488,356Others 173,637 315,299 1,282 1,449
1,774,549 2,716,265 2,778,417 2,564,141
The geographical location of revenues from watches and timepieces and property investments segment are based on the location of customers, and the geographical location of revenues from banking and financial businesses segment are based on the location of operations of the Cash Generating Units (“CGUs”). For goodwill and intangible assets, the geographical location is based on the areas of operation of CGUs. The geographical location of other non-current assets is based on the physical location of the assets.
The Group has a large number of customers and there is no significant revenue that is more than 10% of the Group’s revenue derived from specific external customers for the years ended 31 December 2020 and 2019.
5. REVENUE
The Group is principally engaging in manufacturing and distribution of watches and timepieces, property investments and banking and financial businesses.
For banking and financial businesses, revenue mainly comprises net interest income, net service fees and commission income and trading income (notes 5(a), 5(b), 5(c) and 5(d)). For non-banking and financial businesses, revenue mainly represents the net invoiced value of goods sold, after allowance for returns and trade discounts and rental income received and receivables. (note 5(e)).

– 17 –
Revenue recognised during the year is as follows:
(a) Net interest income from banking business
2020 2019HK$’000 HK$’000
Interest income from banking business arising from:Interest income – due from banks 91,259 151,973Interest income – due from clients 25,899 26,840Interest income from trading portfolio investments – 387Interest income from mortgage loans 19,240 15,824Interest income from money market papers 551 878Interest income from financial assets 18,963 24,955Negative interest income/(expense) on due to clients 819 (36)
156,731 220,821
Interest expenses from banking business arising from:Interest expense on due to banks (24,437) (33,268)Interest expense on due to clients (3,163) (3,551)Interest expense for issued debt instruments – (352)Negative interest income on due from banks and clients (1,103) (188)
(28,703) (37,359)
Net interest income from banking business 128,028 183,462
(b) Net service fees and commission income from banking business
2020 2019HK$’000 HK$’000
Service fee and commission income from banking business arising from:
Commission income from loans 4,215 6,935Brokerage fees 54,412 30,654Custody account fees 24,714 26,276Commission on investment advice and asset management 92,597 99,256Commission income from service fees 39,554 59,006Commission income from fiduciary fees 413 455Commission income from retrocession 4,923 5,758Other commission income 37,173 52,287
258,001 280,627Service fees and commission expenses from banking business (61,007) (68,066)
Net service fees and commission income from banking business 196,994 212,561

– 18 –
(c) Trading income from banking business
2020 2019HK$’000 HK$’000
Debt instruments 28 (113)Securities 30 81Forex and precious metals 40,915 56,527Funds (19,271) 735
Trading income from banking business 21,702 57,230
(d) Revenue from financial business
2020 2019HK$’000 HK$’000
Service fees and commission income 10,721 3,195Interest income 184 165
Revenue from financial business 10,905 3,360
(e) Revenue from non-banking and financial businesses
2020 2019HK$’000 HK$’000
Sales of goods 1,405,812 2,249,737Rental income 11,108 9,915
Revenue from non-banking business and financial businesses 1,416,920 2,259,652

– 19 –
6. OTHER INCOME AND OTHER NET GAINS OR LOSSES
2020 2019HK$’000 HK$’000
Gain on fair value changes in trading portfolio investments, net 36,567 20,368Net surplus on revaluation of investment properties 9,723 4,047Gain on disposal of property, plant and equipment 531 159Bank and other interest income from non-banking business 4,222 4,257Dividend income from trading portfolio investments 1,417 1,061Dividend income from financial assets at fair value through other
comprehensive income 8,815 12,263Sales of scrap materials 22 152Other operating income 14,880 19,222Government subsidies (note (a)) 21,474 20,936(Provision of)/reversal of provision for litigation risks (1,907) 394(Provision of)/reversal of expected credit losses for due
from banks and clients (278) 1,812Provision of expected credit losses for other financial assets
at amortised cost (29,348) (291)Exchange gain, net 27,643 12,462Other sundry income, net 4,572 7,551
98,333 104,393
Note:
(a) Government subsidies mainly comprised of unconditional subsidies received for subsidising the Group’s business.
7. FINANCE COSTS FROM NON-BANKING BUSINESS
2020 2019HK$’000 HK$’000
Interest charged on corporate bonds – 18,605Interest charged on bank borrowings, bank overdrafts
and other borrowings 79,456 69,784Margin loan interests 109 2,298Interest on lease liabilities 3,391 4,633
82,956 95,320
– 20 –
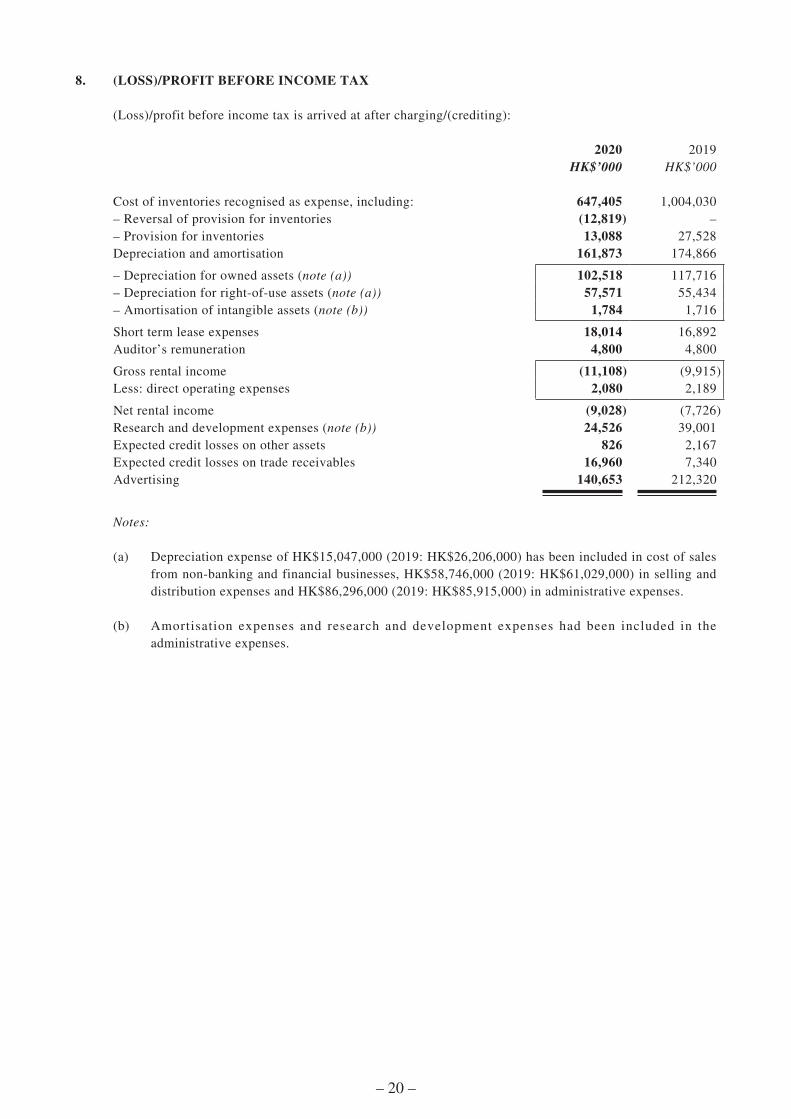
8. (LOSS)/PROFIT BEFORE INCOME TAX
(Loss)/profit before income tax is arrived at after charging/(crediting):
2020 2019HK$’000 HK$’000
Cost of inventories recognised as expense, including: 647,405 1,004,030– Reversal of provision for inventories (12,819) –– Provision for inventories 13,088 27,528Depreciation and amortisation 161,873 174,866
– Depreciation for owned assets (note (a)) 102,518 117,716– Depreciation for right-of-use assets (note (a)) 57,571 55,434– Amortisation of intangible assets (note (b)) 1,784 1,716
Short term lease expenses 18,014 16,892Auditor’s remuneration 4,800 4,800
Gross rental income (11,108) (9,915)Less: direct operating expenses 2,080 2,189
Net rental income (9,028) (7,726)Research and development expenses (note (b)) 24,526 39,001Expected credit losses on other assets 826 2,167Expected credit losses on trade receivables 16,960 7,340Advertising 140,653 212,320
Notes:
(a) Depreciation expense of HK$15,047,000 (2019: HK$26,206,000) has been included in cost of sales from non-banking and financial businesses, HK$58,746,000 (2019: HK$61,029,000) in selling and distribution expenses and HK$86,296,000 (2019: HK$85,915,000) in administrative expenses.
(b) Amortisation expenses and research and development expenses had been included in the administrative expenses.

– 21 –
9. INCOME TAX EXPENSE
For the year ended 31 December 2020 and 2019, Hong Kong profit tax has been provided for certain subsidiaries within the Group and is calculated at 16.5% on the estimated assessable profits (2019: 16.5%). The subsidiaries established in the PRC are subject to income taxes at tax rates ranging between 15% and 25% (2019: 15% and 25%). Overseas tax is calculated at the rates applicable in the respective jurisdictions.
The Group is also subject to PRC withholding tax at the rate of 5% or 10% (2019: 5% or 10%) in respect of its PRC sourced income earned, including rental income from properties in the PRC, dividend income derived from PRC incorporated company.
2020 2019HK$’000 HK$’000
Current tax for the yearHong Kong 577 669PRC 24,883 45,149Liechtenstein 6,767 25,027Switzerland 1,527 1,122
Deferred tax for the year (8,578) (511)
Total income tax expense 25,176 71,456
10. DIVIDENDS
The directors do not recommend the payment of dividend for the year ended 31 December 2020 (2019: Nil).
– 22 –
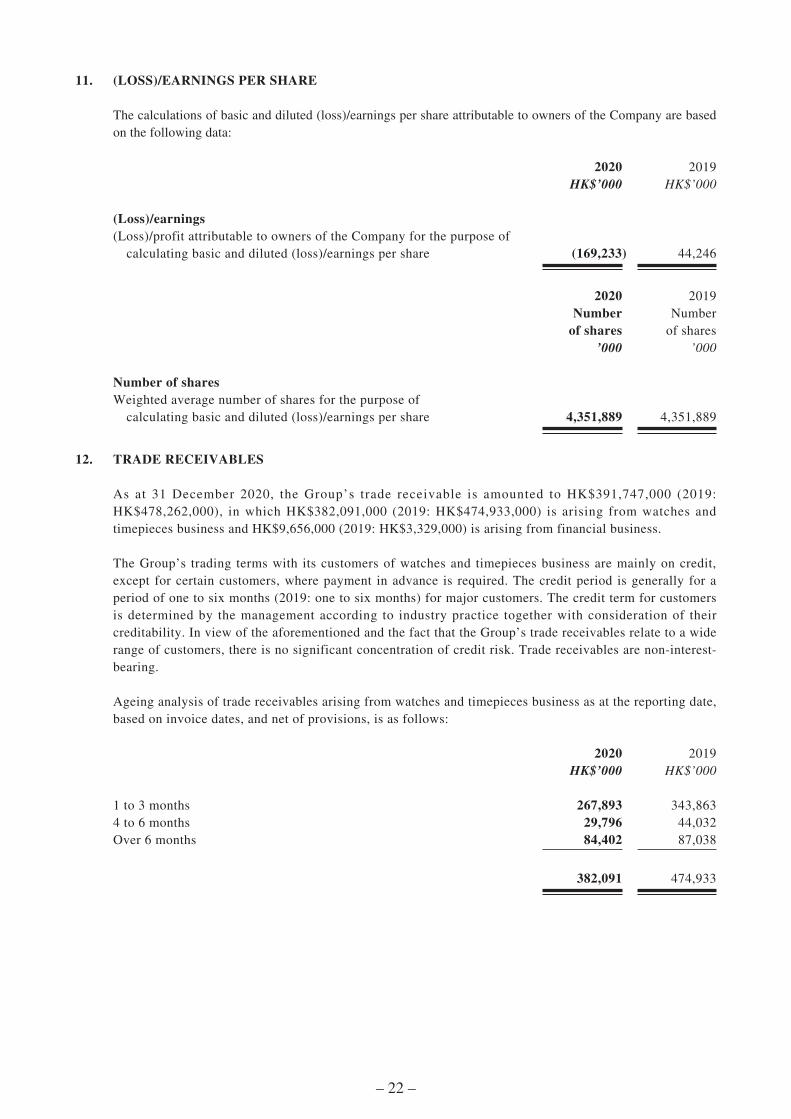
11. (LOSS)/EARNINGS PER SHARE
The calculations of basic and diluted (loss)/earnings per share attributable to owners of the Company are based on the following data:
2020 2019HK$’000 HK$’000
(Loss)/earnings(Loss)/profit attributable to owners of the Company for the purpose of
calculating basic and diluted (loss)/earnings per share (169,233) 44,246
2020 2019Number
of sharesNumber
of shares’000 ’000
Number of sharesWeighted average number of shares for the purpose of
calculating basic and diluted (loss)/earnings per share 4,351,889 4,351,889
12. TRADE RECEIVABLES
As at 31 December 2020, the Group’s trade receivable is amounted to HK$391,747,000 (2019: HK$478,262,000), in which HK$382,091,000 (2019: HK$474,933,000) is arising from watches and timepieces business and HK$9,656,000 (2019: HK$3,329,000) is arising from financial business.
The Group’s trading terms with its customers of watches and timepieces business are mainly on credit, except for certain customers, where payment in advance is required. The credit period is generally for a period of one to six months (2019: one to six months) for major customers. The credit term for customers is determined by the management according to industry practice together with consideration of their creditability. In view of the aforementioned and the fact that the Group’s trade receivables relate to a wide range of customers, there is no significant concentration of credit risk. Trade receivables are non-interest-bearing.
Ageing analysis of trade receivables arising from watches and timepieces business as at the reporting date, based on invoice dates, and net of provisions, is as follows:
2020 2019HK$’000 HK$’000
1 to 3 months 267,893 343,8634 to 6 months 29,796 44,032Over 6 months 84,402 87,038
382,091 474,933
– 23 –
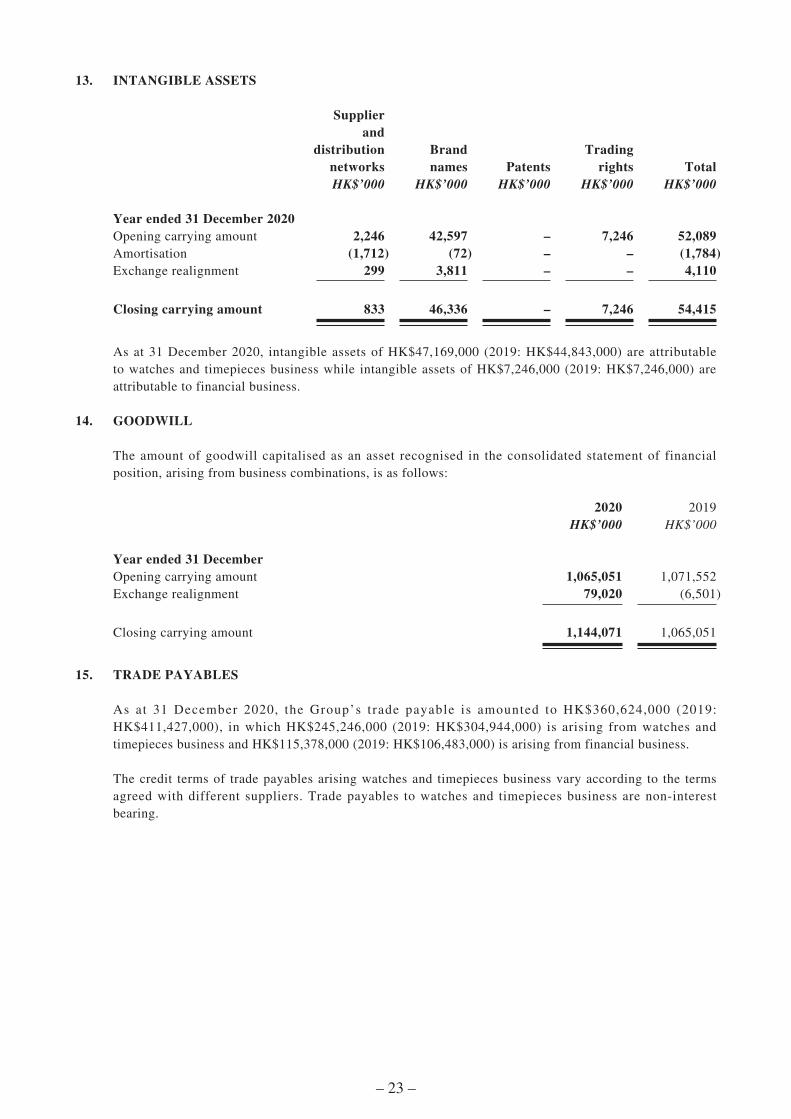
13. INTANGIBLE ASSETS
Supplier and
distribution networks
Brand names Patents
Trading rights Total
HK$’000 HK$’000 HK$’000 HK$’000 HK$’000
Year ended 31 December 2020Opening carrying amount 2,246 42,597 – 7,246 52,089Amortisation (1,712) (72) – – (1,784)Exchange realignment 299 3,811 – – 4,110
Closing carrying amount 833 46,336 – 7,246 54,415
As at 31 December 2020, intangible assets of HK$47,169,000 (2019: HK$44,843,000) are attributable to watches and timepieces business while intangible assets of HK$7,246,000 (2019: HK$7,246,000) are attributable to financial business.
14. GOODWILL
The amount of goodwill capitalised as an asset recognised in the consolidated statement of financial position, arising from business combinations, is as follows:
2020 2019HK$’000 HK$’000
Year ended 31 DecemberOpening carrying amount 1,065,051 1,071,552Exchange realignment 79,020 (6,501)
Closing carrying amount 1,144,071 1,065,051
15. TRADE PAYABLES
As at 31 December 2020, the Group’s trade payable is amounted to HK$360,624,000 (2019: HK$411,427,000), in which HK$245,246,000 (2019: HK$304,944,000) is arising from watches and timepieces business and HK$115,378,000 (2019: HK$106,483,000) is arising from financial business.
The credit terms of trade payables arising watches and timepieces business vary according to the terms agreed with different suppliers. Trade payables to watches and timepieces business are non-interest bearing.
– 24 –
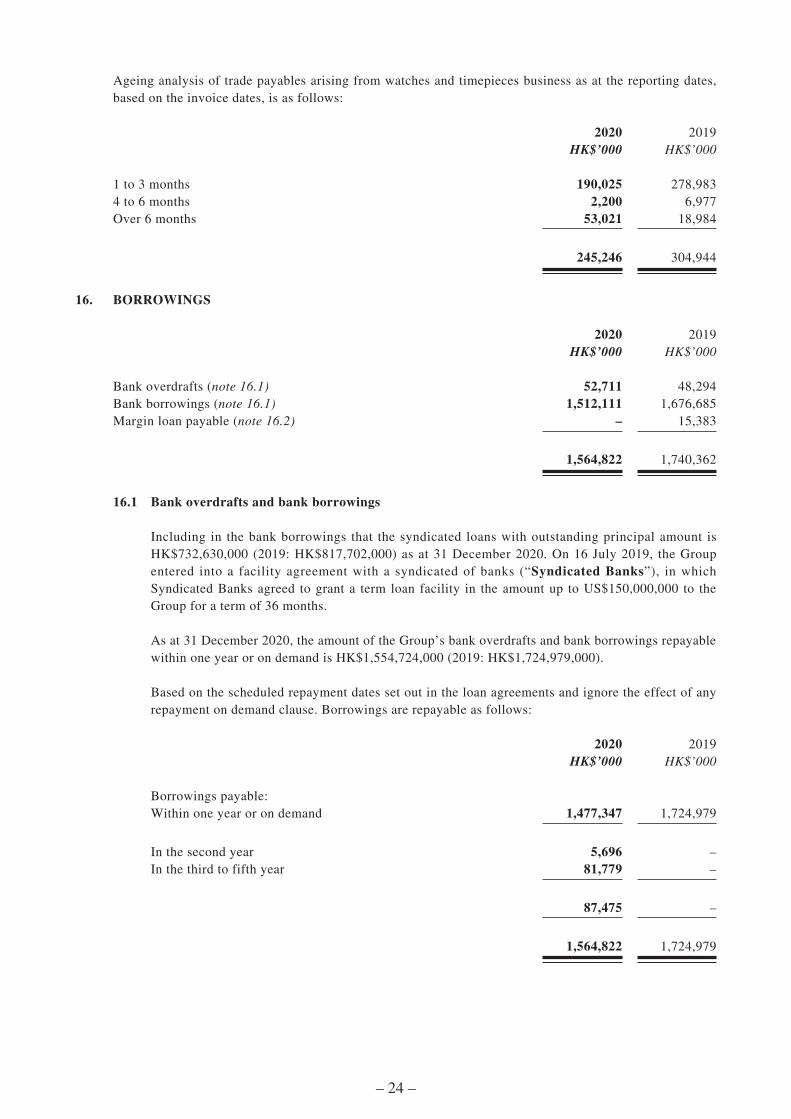
Ageing analysis of trade payables arising from watches and timepieces business as at the reporting dates, based on the invoice dates, is as follows:
2020 2019HK$’000 HK$’000
1 to 3 months 190,025 278,9834 to 6 months 2,200 6,977Over 6 months 53,021 18,984
245,246 304,944
16. BORROWINGS
2020 2019HK$’000 HK$’000
Bank overdrafts (note 16.1) 52,711 48,294Bank borrowings (note 16.1) 1,512,111 1,676,685Margin loan payable (note 16.2) – 15,383
1,564,822 1,740,362
16.1 Bank overdrafts and bank borrowings
Including in the bank borrowings that the syndicated loans with outstanding principal amount is HK$732,630,000 (2019: HK$817,702,000) as at 31 December 2020. On 16 July 2019, the Group entered into a facility agreement with a syndicated of banks (“Syndicated Banks”), in which Syndicated Banks agreed to grant a term loan facility in the amount up to US$150,000,000 to the Group for a term of 36 months.
As at 31 December 2020, the amount of the Group’s bank overdrafts and bank borrowings repayable within one year or on demand is HK$1,554,724,000 (2019: HK$1,724,979,000).
Based on the scheduled repayment dates set out in the loan agreements and ignore the effect of any repayment on demand clause. Borrowings are repayable as follows:
2020 2019HK$’000 HK$’000
Borrowings payable:Within one year or on demand 1,477,347 1,724,979
In the second year 5,696 –In the third to fifth year 81,779 –
87,475 –
1,564,822 1,724,979
– 25 –
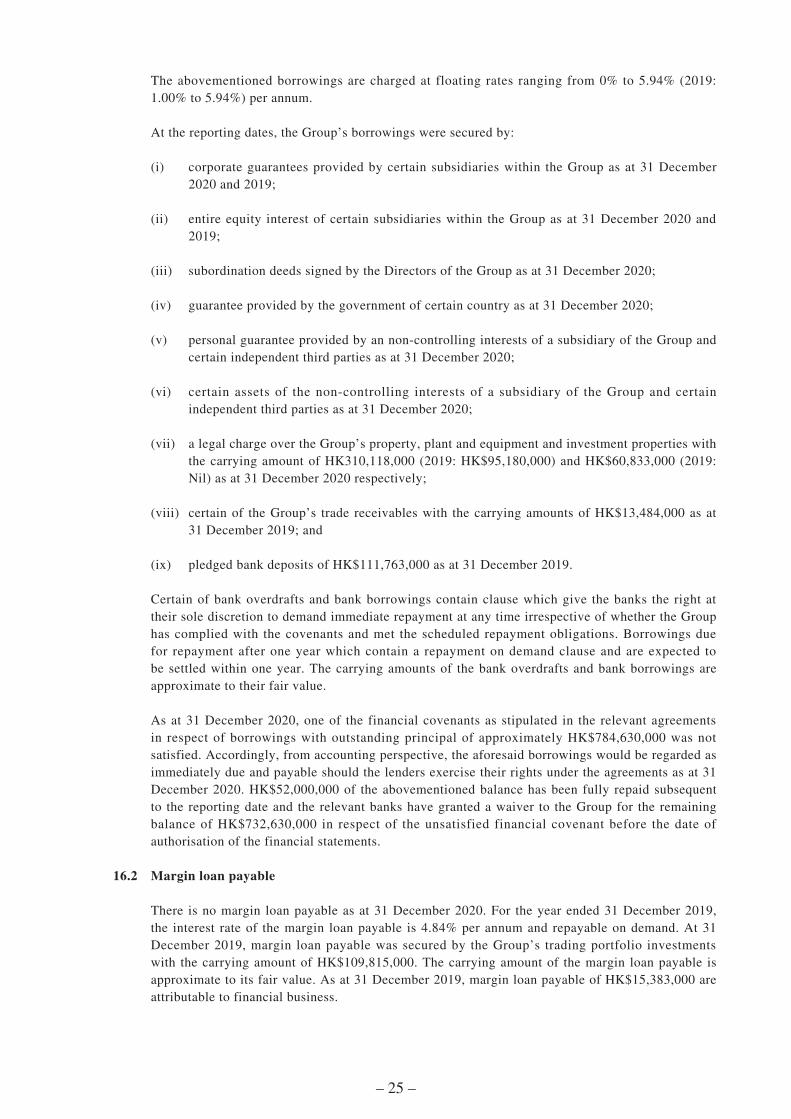
The abovementioned borrowings are charged at floating rates ranging from 0% to 5.94% (2019: 1.00% to 5.94%) per annum.
At the reporting dates, the Group’s borrowings were secured by:
(i) corporate guarantees provided by certain subsidiaries within the Group as at 31 December 2020 and 2019;
(ii) entire equity interest of certain subsidiaries within the Group as at 31 December 2020 and 2019;
(iii) subordination deeds signed by the Directors of the Group as at 31 December 2020;
(iv) guarantee provided by the government of certain country as at 31 December 2020;
(v) personal guarantee provided by an non-controlling interests of a subsidiary of the Group and certain independent third parties as at 31 December 2020;
(vi) certain assets of the non-controlling interests of a subsidiary of the Group and certain independent third parties as at 31 December 2020;
(vii) a legal charge over the Group’s property, plant and equipment and investment properties with the carrying amount of HK310,118,000 (2019: HK$95,180,000) and HK$60,833,000 (2019: Nil) as at 31 December 2020 respectively;
(viii) certain of the Group’s trade receivables with the carrying amounts of HK$13,484,000 as at 31 December 2019; and
(ix) pledged bank deposits of HK$111,763,000 as at 31 December 2019.
Certain of bank overdrafts and bank borrowings contain clause which give the banks the right at their sole discretion to demand immediate repayment at any time irrespective of whether the Group has complied with the covenants and met the scheduled repayment obligations. Borrowings due for repayment after one year which contain a repayment on demand clause and are expected to be settled within one year. The carrying amounts of the bank overdrafts and bank borrowings are approximate to their fair value.
As at 31 December 2020, one of the financial covenants as stipulated in the relevant agreements in respect of borrowings with outstanding principal of approximately HK$784,630,000 was not satisfied. Accordingly, from accounting perspective, the aforesaid borrowings would be regarded as immediately due and payable should the lenders exercise their rights under the agreements as at 31 December 2020. HK$52,000,000 of the abovementioned balance has been fully repaid subsequent to the reporting date and the relevant banks have granted a waiver to the Group for the remaining balance of HK$732,630,000 in respect of the unsatisfied financial covenant before the date of authorisation of the financial statements.
16.2 Margin loan payable
There is no margin loan payable as at 31 December 2020. For the year ended 31 December 2019, the interest rate of the margin loan payable is 4.84% per annum and repayable on demand. At 31 December 2019, margin loan payable was secured by the Group’s trading portfolio investments with the carrying amount of HK$109,815,000. The carrying amount of the margin loan payable is approximate to its fair value. As at 31 December 2019, margin loan payable of HK$15,383,000 are attributable to financial business.
– 26 –
17. EVENT AFTER REPORTING PERIOD
On 16 December 2020, the Company entered into the sale and purchase agreement, pursuant to which the Company has conditionally agreed to sell, and the purchaser has conditionally agreed to acquire, the sale shares and the sale loans of the following companies (the “Transaction”):
– International Volant Limited;– EB Brand Limited;– Jia Cheng Investment Limited;– Joyful Surplus International Limited;– Sharptech International Limited;– Unique Leader Limited; and– Sure Best Management Limited.
Details of the Transaction are set out in the Company’s announcements dated 16 December 2020 and 25 March 2021 and circular dated 25 February 2021. The proposed was not yet completed up to the date of this announcement.
Except for abovementioned, there were no material events occurred after the financial report date.

– 27 –
MANAGEMENT DISCUSSION AND ANALYSIS
OPERATING RESULT
For the year ended 31 December 2020, the Group recorded total revenue of approximately HK$1,774,549,000 (31 December 2019: HK$2,716,265,000), a decrease of HK$941,716,000 or 34.7% over 2019.
Operating expenses (including selling and distribution expenses and administrative expenses) for the year ended 31 December 2020 was approximately HK$1,278,860,000 (31 December 2019: HK$1,595,003,000), a decrease of HK$316,143,000 or 19.8% over 2019.
Gross profit generated from non-banking and financial businesses for the year ended 31 December 2020 was approximately HK$769,515,000 (31 December 2019: HK$1,255,622,000), a decrease of HK$486,107,000 or 38.7% over 2019.
Gross profit generated from banking and financial businesses for the year ended 31 December 2020 was approximately HK$357,629,000 (31 December 2019: HK$456,613,000), a decrease of HK$98,984,000 or 21.7% over 2019.
The EBITDA for the year ended 31 December 2020 was approximately HK$111,176,000 (31 December 2019: HK$412,823,000), a decrease of HK$301,647,000 or 73.1% over 2019.
Net loss after tax for the year ended 31 December 2020 was approximately HK$158,829,000 (31 December 2019: net profit after tax of HK$71,181,000).
PERFORMANCE
Our Group comprises three key divisions – watches and timepieces businesses, banking and financial businesses, and various investment businesses.

– 28 –
WATCHES AND TIMEPIECES BUSINESSES
I.A. Local Proprietary Brands
Zhuhai Rossini Watch Industry Limited
Proportions to Rossini’s total revenueby different types of sales
31 December2020
31 December 2019
31 December2018
Physical stores 54.1% 51.9% 55.6%E-commerce 40.8% 39.5% 33.4%Other 5.1% 8.6% 11%
Note: Other types of sales mainly include industrial tourism and group purchase.
For the year ended 31 December 2020, Zhuhai Rossini Watch Industry Limited (“Rossini”), a 91% subsidiary of the Group, recorded revenue of HK$579,647,000, a decrease of HK$362,915,000 or 38.5% from HK$942,562,000 in 2019. Net profit after tax attributable to owners of the Company for the year ended 31 December 2020 was HK$49,558,000, representing a decrease of HK$114,575,000 or 69.8%, from HK$164,133,000 in 2019.
In the past few years, the traditional retail model of watch industry has been challenged by the ever-growing e-commerce in Mainland China. The outbreak of COVID-19 further enlarged the existing challenges. During the first half of 2020, physical stores had limited operations due to social distancing measures, lock-downs and travel restrictions. To cope with this difficult time, Rossini immediately adjusted its strategies.
Firstly, by streamlined the management process, working efficiency of the employees were enhanced under COVID-19. As the demand for Rossini watches dropped significantly, Rossini reduced the number of employees and hence the labour costs in 2020. Rossini also streamlined the management structure so that the communication between management and employees became more effective. Also, more in-depth study to the ever-changing market and business model had been done to ensure the innovation and competitiveness of Rossini’s product. According to the development plan, forty new products were introduced during 2020, some of which got satisfactory sales performance. With the classical business type as a basic product line, woman’s fashion type as a breakthrough product line, and light smart sports type as a new product line, the market has paid attention to the development of the Rossini feature series.
– 29 –
Secondly, Rossini also put more focus on e-commerce to compensate the loss of revenue from physical stores.
The demand of watch reduced due to the breakout of COVID-19 since January 2020. As a result, overall sales for the year ended 31 December 2020 dropped significantly by 38.5% compare to 2019. However, e-commerce business in Mainland China was further boosted up by temporary lockdown and strict social distance polices. The management of Rossini reacted rapidly and allocated more resources on e-commerce channel to seize the new market. Although revenue from e-commerce for the year ended 31 December 2020 decreased to HK$236,552,000 from HK$371,957,000 last year, the contribution of which increased from 39.5% to 40.8%.
Specifically, Rossini kept expanding its territory for occupying more market shares by opening online distributors on the leading e-commerce platforms including Taobao, Tmall and JD. In addition, the shopping preferences of the Chinese consumers, especially those of the young generation, were influenced by key opinion leaders (KOL), who spread their views on social media live streaming applications. Rossini’s e-commerce team seized the current trend and as a result e-commerce live streaming became one of the spotlights in sales growth. In order to strengthen its brand awareness, Rossini actively explored new opportunities on popular social media platforms including Xiaohongshu, Kuaishou and Tik Tok, as well as sought more chance of cooperation with different kinds of potential KOL.
Owing to COVID-19 outbreak in 2020, the whole local tourism industry entered a harsh winter. Rossini’s revenue from industrial tourism was also inevitably affected. Throughout the year of 2020, the number of tourists was approximately 50,000 (2019: 370,000), and revenue from which was approximately HK$4,834,000 (2019: HK$71,124,000), representing a decrease of approximately 93% over the corresponding period of last year. In order to attract more local tourists, Rossini will design more specific events, i.e. talks, seminars and workshop, and provide more internal trainings to the tourists guides so as to promote Rossini’s industrial tourism.
With the favourable government policies, the gradual market resumption and the tremendous efforts taken by Rossini, Rossini’s performance in the second half of 2020 was improved.

– 30 –
EBOHR Group
EBOHR Group is composed of EB Brand Limited, EBOHR Luxuries International Limited (“EBOHR”), Shenzhen EBOHR Luxuries Online E-commerce Co., Ltd., PAMA Precision Manufacturing Limited and Shenzhen EBOHR PAMA Sales Co., Ltd.
Revenue of EBOHR Group for the year ended 31 December 2020 was HK$293,934,000, a decrease of HK$184,790,000 or 38.6%, from HK$478,724,000 in 2019. Net loss after tax for the year ended 31 December 2020 was HK$29,322,000, compared with net profit after tax of HK$7,121,000 in 2019.
The decline in profits was mainly attributable to several reasons. Firstly, COVID-19 significantly impacted the overall economy, people became more cautious in their consumption, especially in non-essential goods, leading to overall decrease in watch demands. Performance of physical stores were mostly affected under COVID-19, revenue dropped approximately 42.2% when compared to 2019. Apart from COVID-19, the competition from smart-watches also exercised a strong pressure on traditional watch sales. Fortunately, given that COVID-19 was under control in Mainland China in late 2020, and EBOHR organized various festival sales promotion to boost up the sales, EBOHR slightly improved the sales performance in the second half of 2020.
Secondly, the e-commerce sales did not perform well as online selling expenses increased continuously. For the year ended 31 December 2020, the e-commerce sales decreased to HK$101,586,000 from HK$133,093,000 last year, representing a drop of HK$31,507,000 or 23.67%. To maintain the brand awareness, EBOHR made use of the social platforms like Wechat and Tik Tok to deliver creative promotion on its products. This strategy brought a positive feedback from the customers eventually. EBOHR also actively explored the opportunities from live-streaming promotion. During 2020, EBOHR provided different trainings to its employees on promotional skills and formed its live-streaming team, aiming to improve the e-commerce sales by creating influence over the youth.
The rapid growth of digital economy is changing consumer behavior, especially teenager groups demanding for personality and diversity. Both Rossini and EBOHR Group are aggressively implementing strategies to enhance e-commerce. It is believed that the proportion of the e-commerce sales to both companies’ revenue and profit will steadily increase.

– 31 –
I.B. Foreign Proprietary Brands
Ernest Borel Holdings Limited
The Group held 64.08% equity interest in Ernest Borel Holdings Limited (“Ernest Borel”, together with its subsidiaries, the “Ernest Borel Group”) as at 31 December 2020.
For the year ended 31 December 2020, Ernest Borel Group recorded revenue of approximately HK$116,243,000, representing a decrease of HK$22,276,000 or 16.1% over HK$138,519,000 in 2019. Net loss after tax attributable to the owners of the Company was HK$4,645,000, representing a decrease of HK$45,472,000 or 90.7% over HK$50,117,000 in 2019.
Mainland China remained as the core market of the Ernest Borel Group. Revenue from Mainland China was approximately HK$114,154,000 for the year ended 31 December 2020, accounting for approximately 96.8% of its total revenue.
The extensive distribution network of the Ernest Borel Group covered retail markets in Mainland China, Hong Kong, Macau and Southeast Asian countries. As at 31 December 2020, Ernest Borel Group had 804 POS (31 December 2019: 772), comprising 664 POS in Mainland China, 54 POS in Hong Kong and Macau, and 86 POS in other areas, mainly in Southeast Asia and Taiwan.
In 2020, due to COVlD-19 and social disturbance activities in Hong Kong, the drop in the number of tourists coming to Hong Kong affected the watch and timepieces business substantially. Ernest Borel Group strengthened its e-commerce business by extending e-commerce sales platform in Mainland China and actively finding new distribution channels in Hong Kong and Macau. The duty-free shop and tourist groups at Hainan Free Trade Port brought opportunities to Ernest Borel Group as four shops were opened there at the end of 2020 and the sales were satisfactory. Ernest Borel Group also increased the communication with customers on products and sales policies and marketing activities to understand their needs in order to bring its brand awareness to a wider level.
With the superiority of brand awareness of Ernest Borel and the satisfactory economic recovery in Mainland China in the second half of 2020, it is expected that the demand of watches in Mainland China will gradually rise in 2021 which brings positive impact to domestic sales.

– 32 –
Other Foreign Proprietary Brands
Collectively, Corum, Eterna and The Dreyfuss Group Limited (the “Dreyfuss Group”) contributed revenue and net loss after tax for the year ended 31 December 2020 of HK$171,521,000 (31 December 2019: HK$399,023,000) and HK$128,128,000 (31 December 2019: HK$77,550,000), respectively.
Asia, Europe and the US have been the major markets for Corum. Asian and European market sales represented around 62% of the turnover of Corum. COVID-19 considerably damaged the overall sales performance of Corum. The shutdown of international tourism created obstacles to sales of luxury goods, including watches. As a result, the revenue of Corum fell by 66% in 2020.
COVID-19 shaked the Swiss watchmaking industry to its core. With temporary closures of the manufactures, Swiss watch exports dropped up to 81% in April 2020, as compared to April 2019.
The very low level of sales during the first quarter of 2020 put a lot of pressure on Corum. The management reacted quickly to cut the operating expenses drastically to compensate from the lack of revenue. The operating expenses have been reduced by 33% in 2020. Corum also disclosed a new positioning and marketing strategy in early 2020 and the feedbacks from the markets, the retailers, clients and other stakeholders were very positive. Some teasers of the new design of the Golden Bridge have also been disclosed in 2020. The different reactions revealed that Corum correctly addressed its positioning and marketing strategies.
According to recent studies from the watches insiders, Chinese consumers will be the main contributors to the growth in demand for the luxury goods over the next five years. With the slow recovery of tourism, Corum intends to penetrate the Chinese market by developing new distribution channels.
COVID-19 also affected both activity and turnover of Eterna, which reduced by around 26.7% when compared to 2019. During the year, Eterna mainly focused on cleaning stocks.
Eterna’s strongest markets remained in Europe, with entry into the British market in 2020. As shown by figures disclosed by the Federation of the Swiss Watch Industry at the end of 2020, Mainland China was the only market to post very strong growth at the end of the year. Thus Eterna plans to explore the Chinese market in the coming years.
– 33 –
The revenue for the year ended 31 December 2020 of Eterna Movement was heavily affected by COVID-19 with lockdown period imposed by the Swiss government from mid-March to end April and new measures beginning in October until year-ended 2020. COVID-19 also influenced the budgeted sales orders from Corum and Eterna. It led to smaller production activity during the year. Eterna Movement managed to cut most of its production costs in a higher ratio than the revenue reduction and succeeded in reducing the year-end loss in 2020 when compared to 2019.
UK is the Dreyfuss Group’s largest single market, representing 83% of its revenue for the year ended 31 December 2020. Three national lockdowns and tiered approach systems in between since the outbreak of COVID-19 in March 2020 influenced the Dreyfuss Group’s sales. Its total revenue for 2020 dropped 32% from last year. The Dreyfuss Group’s key objective during the year was to achieve break even by focusing on improving margins, better terms with customers, cost control and reducing stock level. The effectiveness was evidenced by the improvement in gross margin and cost reduction and control. The gross profit ratio increased 7.8% to 51.6% for 2020 by a continuous focus on customer profitability instead of revenue only. The total overheads and marketing costs reduced by approximately 36% and 52% respectively. Watch stock quantity across the Group at the end of 2020 reduced by 23.9% as compared to 2019.
The Dreyfuss Group has put efforts in developing the international market in order to reduce its reliance in the UK market. There was a decrease of POS in European market mainly due to COVlD-19. With the vaccine program introduced, it is expected that through the next 12–18 months, the European team, with a primary focus on Germany, can continue to achieve modest growth. On the other hand, POS in MENA region increased with Middle East areas as the top progressing business area for Rotary.
Backed by our competitive strengths and deep understanding of the needs of our customers, we will redeploy our resources to realize gains in efficiency and synergy and will build on the good progress we have made to provide long-term value.
l.C. Non-Proprietary Brands
Currently, the Group holds four distribution companies. Collectively, distribution companies contributed revenue and net profit after tax for the year ended 31 December 2020 of HK$216,220,000 (31 December 2019: HK$256,642,000) and HK$3,093,000 (31 December 2019: HK$11,598,000) respectively.
– 34 –
l.D. Watches and Timepieces Business – Others
Other non-major subsidiaries of the Group are also engaged in other non-major categories of watches and timepieces businesses, which collectively contributed revenue and net loss after tax for the year ended 31 December 2020 of HK$28,247,000 (31 December 2019: HK$34,267,000) and HK$14,882,000 (31 December 2019: HK$20,491,000), respectively.
BANKING AND FINANCIAL BUSINESS
II.A Bendura Bank AG
Revenue of Bendura Bank AG (“Bendura Bank” or the “Bank”) and its subsidiaries (the “Bendura Group”) for the year ended 31 December 2020 was HK$346,724,000, a decrease of HK$106,529,000 or 23.5% from HK$453,253,000 over 2019. Net loss of the Bendura Group after tax attributable to owners of the Company for the year ended 31 December 2020 was HK$3,633,000, representing a decrease of HK$128,770,000 from net profit of HK$125,137,000 over 2019. The result was due to further reduction in interest rate cuts in the US dollars, the impact of extraordinary adjustment effects in the balance sheet, and the reduction in client interaction, which was a consequence of travel restrictions due to COVID-19.
In interest-related business, the Bank continued to face low interest rates in Swiss Francs and Euros. Net interest income fell from CHF23.3 million in 2019 to CHF15.5 million in 2020.
Income from commission and service fee activities of the Bank recorded CHF20.9 million, showing a decrease of 12.1% over the previous year.
Client’s assets under management of the Bank climbed by CHF13.3 million year on year, ending at CHF3,685.7 million in 2020. The increase is mainly due to a pleasing net new money inflow of CHF203 million.
Due to lower income from foreign exchange transactions for clients and a negative valuation adjustment of an investment in the trading portfolio, the Bank’s income from financial transactions amounted to CHF2.8 million, about CHF4.3 million lower than the previous year.
The Bank made an impairment for the Wirecard AG notes investment of CHF3.07 million in June 2020 as elaborated in the Interim Report 2020 and an additional CHF0.5 million for the second half of 2020, totalling CHF3.57 million. There was also a negative valuation adjustment of an investment in the trading portfolio. As a result, the Bank has imposed more stringent risk policy such as level up the rating of investment grade to minimize the occurrence of, and loss from similar risk.

– 35 –
Business expenses of the Bank amounted to CHF31.5 million, representing an increase of 3.7% over previous year, primarily due to higher personnel costs.
As an innovative private bank, Bendura Bank continued to expand in trading and investment consulting for discrete clients. Considering the strong growth in advisory mandates and tailor-made strategy solutions, the Bank has introduced, alongside with its classic strategies, a whole range of new and innovative investment solutions in 2020.
The new solutions included launching a portfolio which invests globally and focuses primarily on Asian assets, namely “BENDURA Asian Dragon”, a portfolio which focuses on Eastern Europe, namely “BENDURA Eastern Eagle”, and a portfolio which follows an ESG integrated investment process including ESG impact investments, namely “BENDURA ESG Panda”. The creations will allow clients to combine any two or three of the above portfolios to fit the clients’ investment and ESG strategies and hence they can have more flexibility on their investing strategy.
As measures to deal with the impact of COVID-19, all employees of Bendura Bank were equipped with laptops. They worked from home and hence, the daily business were not affected. All digitalization projects will be pushed so that our employees will have full access to all necessary information when working at home. Besides, new software for online on boarding of clients will be implemented and similar software will be provided for new employees.
The Bank recorded a pleasing inflow of new money during 2020, which is a strong indicator of the Bank’s sustainable earning power. The global economy is expected to recover gradually in 2021. The Bank will maintain its existing strategy of highly specialized niche player. Starting in 2021, the Bank will strengthen the digitalization endeavours for the sake of stakeholders, meet the needs of international clients by enlarging the advisory and investment services offering, reduce marketing costs greatly, and introduce a direct costing approach within sales departments to focus on profit contribution margin.

– 36 –
II.B Shun Heng Finance Holding (Hong Kong) Limited
The Group currently conducts securities and asset management businesses under the umbrella of Shun Heng Finance Holding (Hong Kong) Limited (“Shun Heng Finance Holding”), which is 60% owned by the Group. It comprises Shun Heng Securities Limited and Hong Kong Metasequoia Capital Management Limited.
For the year ended 31 December 2020, Shun Heng Finance Holding contributed revenue and net profit after tax attributable to owners of the Company of HK$10,905,000 (31 December 2019: HK$3,360,000) and HK$4,535,000 (31 December 2019: HK$1,430,000) respectively.
Shun Heng Securities Limited
Shun Heng Securities Limited (“Shun Heng Securities”), a corporate licensed to conduct Type 1 (dealing in securities) regulated activity under the Securities and Futures Ordinance (the “SFO”), is mainly engaged in securities brokerage and margin businesses.
In addition to the traditional brokerage business, Shun Heng Securities has actively seek opportunities to grow the underwriting business for overseas bonds issued by Chinese enterprises. During 2020, Shun Heng Securities assisted in the completion of two private equity US dollar bond underwriting projects, with total issuance of US$46 million. As at end of 2020, Shun Heng Securities has successfully underwritten 9 bond projects with a cumulative amount of approximately US$0.86 billion, achieving brand awareness in Hong Kong Market.
Hong Kong Metasequoia Capital Management Limited
Hong Kong Metasequoia Capital Management Limited (“Metasequoia Capital”), a corporate licensed to conduct Type 4 (advisory on securities) and Type 9 (asset management) regulated activities under the SFO, is mainly engaged in asset management business.
Metasequoia Capital has launched two funds since its setting up, namely Global Opportunities Fund and Stable Growth Fund. Global Opportunities Fund invests mainly in securities markets in Mainland China, Hong Kong and the US, with assets under management from US$10.24 million initially to approximately US$12.49 million as at 31 December 2020. The Stable Growth Fund, launched in 2019, invests in domestic CNY bond and its assets under management reached approximately US$6.23 million as at 31 December 2020. As at 31 December 2020, the aggregate assets under management of Metasequoia Capital was approximately US$18.72 million (31 December 2019: US$23,560,000).
– 37 –
III.A Listed Equity Investment
Citychamp Dartong Company Limited
As at 31 December 2020, financial assets at fair value through other comprehensive income of the Group was HK$470,794,000. HK$131,636,000 was related to the listed equity investment in the equity share of Citychamp Dartong Company Limited (“Citychamp Dartong”). Citychamp Dartong is a company listed on the Shanghai Stock Exchange (Stock code: 600067) and engaged in real estate, enameled wire, banking and new energy. As at 31 December 2020, the Group owned 30,389,058 shares of Citychamp Dartong at the market price of RMB3.65 per share (equivalent to HK$4.33 per share) with the fair value of HK$131,636,000. The shares held by the Group accounted for 2.04% of the total issued share capital of Citychamp Dartong as at 31 December 2020. Such fair value accounted for 0.6% of the Group’s total assets.
The Group incurred a net loss on fair value change through other comprehensive income in investment in Citychamp Dartong of HK$3,540,000 for the year ended 31 December 2020, as a result of decrease in the share price of Citychamp Dartong from RMB3.98 (equivalent to HK$4.45) as at 31 December 2019 to RMB3.65 (equivalent to HK$4.33) as at 31 December 2020.
This is the Group’s long-term investment due held for dividend yield and long-term capital gain. Given its substantial land bank for development and profitability of certain business segments, we are optimistic about the future prospects of Citychamp Dartong.
Min Xin Holdings Limited
Investment in Min Xin Holdings Limited (“Min Xin”) (Stock code: 222) was measured at fair value through other comprehensive income. The Company intends to hold the investment on a long-term basis.
Min Xin is a company engaged in financial services, securities trading, real estate development, toll road and manufacturing. As at 31 December 2020, the investment in Min Xin was HK$333,207,000, i.e. 88,150,000 shares at the market price of HK$3.78 per share as at 31 December 2020. Such fair value of the investment accounted for 1.6% of the Group’s total assets. The shares held by the Company accounted for 14.76% of the total issued share capital of Min Xin as at 31 December 2020.
The Company incurred a net gain on fair value change in Min Xin’s investment of HK$51,127,000 for the year ended 31 December 2020 (31 December 2019: net loss of HK$210,679,000), as a result of increase in the share price of Min Xin from HK$3.20 as at 1 January 2020 to HK$3.78 as at 31 December 2020. For the year ended 31 December 2020, the Company’s dividend income from Min Xin was HK$8,815,000 (31 December 2019: HK$8,815,000).
– 38 –
III.B Property Investment
The properties in Mainland China and Hong Kong owned by the Group have been leased out, with stable rental returns to the Group for the year under review. During the year, these investment properties generated rental income of HK$11,108,000 (31 December 2019: HK$9,915,000). Net profit after tax from the property investment business for the year ended 31 December 2020 was HK$15,378,000 (31 December 2019: HK$7,974,000).
III.C Other Marketable Securities
The Group has acted as the founder investor and invested US$5.12 million in “Metasequoia Investment Fund SPC – Global Opportunities Fund SP” (the “Fund”) since 15 August 2017 in order to facilitate establishing the fund management business with an initial capital of US$10.24 million and the rest of the fund was subscribed by other investors with the capital of US$5.12 million. As of 4 May 2020, the Group redeemed 3,840 shares in the amount of US$5,907,000 of Metasequoia Investment Fund SPC which generated a profit of US$2,067,000 since August 2017 and US$655,000 for the period from 1 January 2020 to 4 May 2020 respectively.
As at 31 December 2020, the total net asset value of the Fund was US$12.49 million (31 December 2019: US$13.13 million), which composed by US$2.30 million and US$10.19 million for the Group and other inventors respectively. For the year ended 31 December 2020, the unrealized loss on fair value of the investment was approximately US$432,165 (31 December 2019: unrealized gain US$1,767,735).
– 39 –
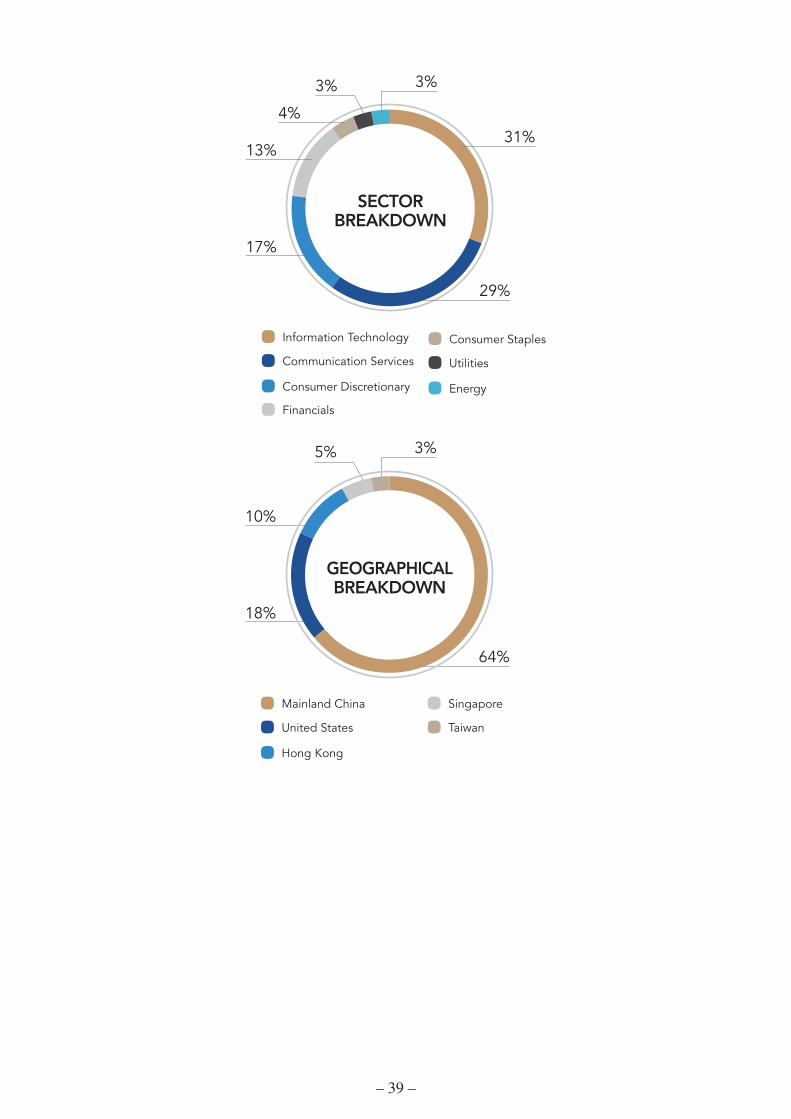
31%
29%
17%
13%
4%
3% 3%
Information Technology
Communication Services
Consumer Discretionary
Financials
Consumer Staples
Utilities
Energy
SECTORBREAKDOWN
Mainland China
United States
Hong Kong
Singapore
Taiwan
64%
18%
10%
5% 3%
GEOGRAPHICALBREAKDOWN
– 40 –
HEADQUARTER AND OTHERS
Losses from administrative expenses, finance costs and income tax of the headquarter and other non-major subsidiaries and/or non-major categories of businesses for the year ended 31 December 2020 was HK$61,187,000 (31 December 2019: HK$124,989,000).
FINANCIAL POSITION
(1) Liquidity, Financial Resources and Capital Structure
As at 31 December 2020, the Group had non-pledged cash and bank balances of approximately HK$5,612,645,000 (31 December 2019: HK$4,785,483,000). Based on the borrowings of HK$1,564,822,000 (31 December 2019: HK$1,740,362,000), due to a shareholder of HK$12,000,000 (31 December 2019: HK$12,000,000), due to directors of HK$21,233,000 (31 December 2019: HK$22,241,000) and shareholders’ equity of HK$4,418,679,000 (31 December 2019: HK$4,255,072,000), the Group’s gearing ratio (being borrowings plus due to a shareholder and due to directors divided by shareholders’ equity) was 36% (31 December 2019: 41%).
(2) Charge on assets
As at 31 December 2020, the Group’s borrowings were secured by:
(a) corporate guarantees provided by certain subsidiaries within the Group;
(b) equity interest of certain subsidiaries within the Group; and
(c) a legal charge over the Group’s property, plant and equipment and investment properties with the carrying amount of HK$310,118,000 (2019: HK$95,180,000) and HK$60,833,000 (2019: Nil) respectively.
(3) Capital commitment
Capital commitments as at 31 December 2020 were approximately HK$270,000,000 in total (31 December 2019: HK$482,652,000), for investment in an associate – Citychamp Allied International Limited and purchase of property, plant and equipment.
Except for the above, the Group had no other material capital commitments as at 31 December 2020.
– 41 –
FINANCIAL REVIEW
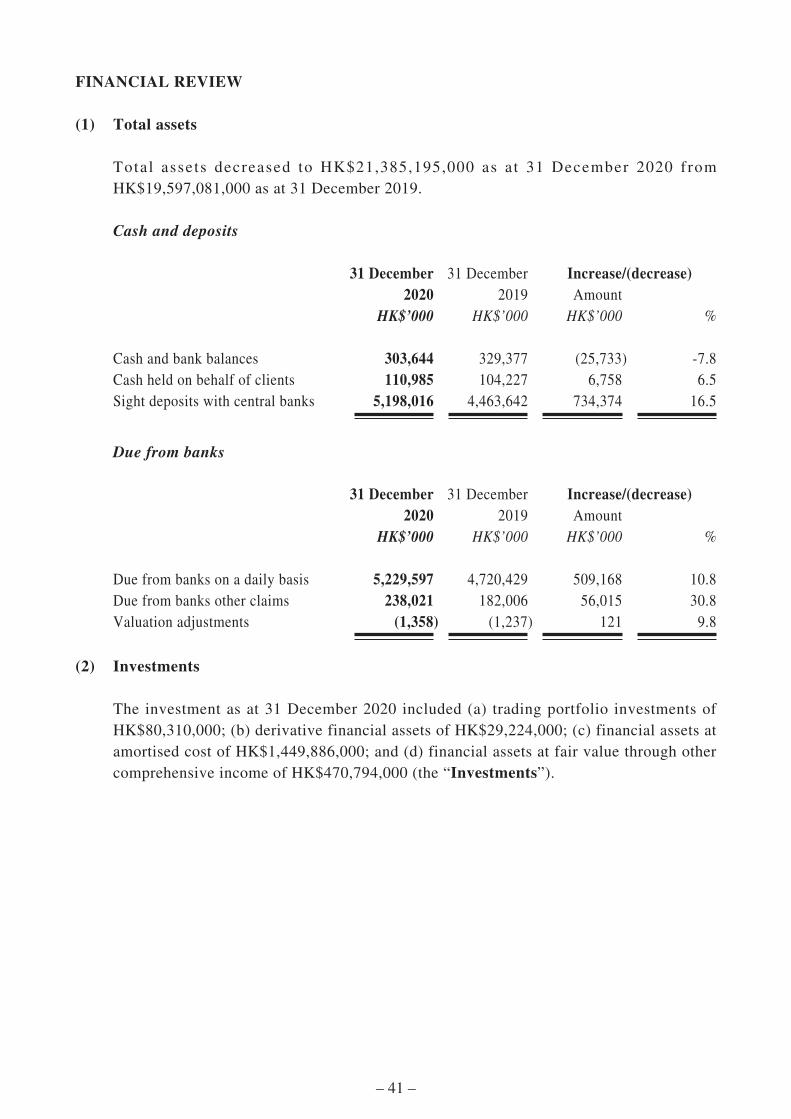
(1) Total assets
Total assets decreased to HK$21,385,195,000 as a t 31 December 2020 from HK$19,597,081,000 as at 31 December 2019.
Cash and deposits
31 December 2020
31 December 2019
Increase/(decrease)Amount
HK$’000 HK$’000 HK$’000 %
Cash and bank balances 303,644 329,377 (25,733) -7.8Cash held on behalf of clients 110,985 104,227 6,758 6.5Sight deposits with central banks 5,198,016 4,463,642 734,374 16.5
Due from banks
31 December 2020
31 December 2019
Increase/(decrease)Amount
HK$’000 HK$’000 HK$’000 %
Due from banks on a daily basis 5,229,597 4,720,429 509,168 10.8Due from banks other claims 238,021 182,006 56,015 30.8Valuation adjustments (1,358) (1,237) 121 9.8
(2) Investments
The investment as at 31 December 2020 included (a) trading portfolio investments of HK$80,310,000; (b) derivative financial assets of HK$29,224,000; (c) financial assets at amortised cost of HK$1,449,886,000; and (d) financial assets at fair value through other comprehensive income of HK$470,794,000 (the “Investments”).

– 42 –
(a) Trading portfolio investments of HK$80,310,000
31 December 2020
31 December 2019
HK$’000 HK$’000
Equity InstrumentsListed equity instruments in Hong Kong at market
value 649 69,042Listed equity instruments outside Hong Kong at
market value 4,522 78,307
Total equity instruments 5,171 147,349
Debt instrumentsUnlisted debt instruments of financial institutions 12,938 27,612
Total debt instruments 12,938 27,612
Investment fund unitsUnlisted investment fund unit 55,843 46,758
Total investment fund units 55,843 46,758
Investments in other financial products 6,358 6,184
Total trading portfolio investments 80,310 227,903

– 43 –
It is the objective of the Group to maintain certain level of liquidity in the form of trading portfolio investments for unplanned capital expenditure. The liquidity is usually parked with the listed equities in order to generate short term return.
As at 31 December 2020, there were HK$649,000 invested in a variety of listed equities in Hong Kong and HK$4,522,000 invested in Mainland China and overseas markets.
The debt instruments of HK$12,938,000 invested in the Mainland China by PRC company.
Trading assets of CHF3.0 million (equivalent to HK$26,118,000) represents the single investment by Bendura Bank in the form of an unlisted investment fund. Bendura Bank acquired above trading assets from a professional counterparty in March 2019. The investment policy of Bendura Bank AG includes strict implementation of the investment process and is subject to constant review by the investment committee.
Investments in other financial products consist of the financial product investments of HK$6,358,000 invested by Eternal Brands.
(b) Derivative financial assets of HK$29,224,000
31 December 2020
31 December 2019
HK$’000 HK$’000
Derivative financial assetsForward and option contracts 29,224 10,275
In the derivative financial assets of HK$29,224,000, there were forward and option contracts conducted by Bendura Bank.
Bendura Bank offers derivative products including currency forwards and swaps to its clients. These derivative positions were managed through entering back-to-back deals with external parties to ensure that remaining exposures are within acceptable risk levels. First-rate banks serve as counterparties, as is generally the case in trading business. It is not the objective of Bendura Bank to speculate the gain on the change in the price by conducting forward and option contracts without having invested in the underlying assets.

– 44 –
As at 31 December 2020, forward contracts of HK$29,224,000 related to FX swaps entered by Bendura Bank. Based upon risk/return considerations, client deposits denominated in foreign currencies were, in part, no longer invested on the interbank market but were swapped into Swiss francs using currency swaps and deposited with the Swiss National Bank (SNB). Income from the interest component of currency swaps exceeded the expense of SNB negative interest and the reduced level of interest from banks.
At as 31 December 2019, derivative financial assets of HK$10,275,000 related to forward and option contracts conducted by Bendura Bank.
(c) Other financial assets at amortised cost of HK$1,449,886,000
31 December 2020
31 December 2019
HK$’000 HK$’000
Listed debt instruments, at amortised costIssued by:Governments and public sector 84,447 82,373Financial institutions 1,053,351 778,199Corporations 312,088 447,388
1,449,886 1,307,960
Bendura Bank invested in listed debt instruments issued by government and public sector, financial institutions and corporations amounting to HK$1,449,886,000. The portfolio was composed of 79 listed debt instruments with different maturity, geography, segment and currency and hence, diversification is ensured. Almost all listed debt instruments were considered upper-medium grade and are subject to low credit risk. The average remaining term of the held-to-maturity investment is 2.4 years. Largest single investments are bond issued by European Investment Bank (CHF11 million) and followed by International Bank for Reconstruction and Development (CHF9 million). Both are triple-A issuers. Risk concentration is analysed and presented to the senior management on a monthly basis.

– 45 –
Relatively major listed debt instruments as at 31 December 2020 are as follows:
Issuer Nature of interest rate Sector Maturity date Value
(CHF’000) Bank of Montreal Fixed Financial corporations 22 December 2023 5,000 China Merchants Bank/Lux Fixed Financial corporations 19 June 2022 5,407 Abn Amro Bank Nv Floating Financial corporations 19 July 2022 7,071 Deutsche Bank Ag Floating Financial corporations 16 May 2022 7,566 Bank of Nova Scotia Floating Financial corporations 5 October 2022 8,166 Intl Bk Recon & Develop Fixed Financial corporations 19 March 2024 8,830 European Investment Bank Floating Financial corporations 24 March 2021 10,608 Others 112,391
Total 165,039
HKD Equivalent to (in ‘000) 1,449,886
Collectively, listed debt instruments, at amortised cost accounted for 6.8% of the Group’s total assets.
As at 31 December 2019, Bendura Bank invested in listed debt instruments issued by government and public sector, financial institutions and corporations amounting to HK$1,307,960,000, the portfolio was composed of 58 listed debt instruments with different maturity, geography, segment and currency and hence, diversification is ensured. Almost all listed debt instruments were considered upper-medium grade and are subject to low credit risk. Largest single investments are bond issued by International Bank for Reconstruction and Development (CHF19 million) and followed by European Investment Bank (CHF12 million). Both are triple-A issuers. Risk concentration is analyzed and presented to the senior management on a monthly basis.

– 46 –
Relatively major listed debt instruments as at 31 December 2019 are as follows:
Issuer Nature of interest rate Sector Maturity date Value
(CHF’000)
China Merchants Bank/Lux Fixed Financial Institutions 19 June 2022 5,426Deutsche Bank Ag Floating Financial Institutions 16 May 2022 7,591Abn Amro Bank Nv Floating Financial Institutions 19 July 2022 7,746Bank of Nova Scotia Floating Financial Institutions 5 October 2022 8,228Intl Bk Recon & Develop Fixed Financial Institutions 19 March 2024 9,670European Investment Bank Floating Financial Institutions 24 March 2021 11,631Intl Bk Recon & Develop Floating Financial Institutions 18 March 2020 19,364Others 92,845
Total 162,501
HKD Equivalent to (in ‘000) 1,307,960
(d) Other financial assets at fair value through other comprehensive income of HK$470,794,000
31 December 2020
31 December 2019
HK$’000 HK$’000 Listed equity instruments in Hong Kong 333,207 282,080Listed equity instruments outside Hong Kong 131,636 135,176Unlisted equity investment 5,951 5,605
470,794 422,861
Listed equity instruments of HK$131,636,000 related to investment in Citychamp Dartong and HK$333,207,000 related to investment in Min Xin. Details of investments in Citychamp Dartong and Min Xin are set out from page 37 of this announcement.

– 47 –
(3) Goodwill and Intangible assets
(a) Goodwill
Goodwill is arising from business combinations, and capitalised as assets in the consolidated statement of financial position. The Group engages professional valuer to conduct impairment testing on individual CGUs every financial year. As at 31 December 2020, the net carrying amount of Goodwill was HK$1,144,071,000 (As at 31 December 2019: HK$1,065,051,000), which mainly composed of the following CGUs:
2020 2019Segment HK$’000 HK$’000
Zhuhai Rossini Watch Industry Limited
Watches and timepieces 649,530 611,694
Bendura Group Banking Business 269,549 246,961Ernest Borel Group Watches and
timepieces 221,912 203,317Others 3,080 3,079
Total: 1,144,071 1,065,051
The increase in Goodwill was solely due to the exchange rate difference between foreign currencies and Hong Kong Dollar as at 31 December 2019 and 31 December 2020 respectively.
(b) Intangible assets
Intangible assets are arising from business combinations, and capitalised as assets in the consolidated statement of financial position. They included Supplier and distribution networks, Brand names, Patents and Trading rights. As at 31 December 2020, the net carry amount of Intangible assets was HK$54,415,000 (As at 31 December 2019: HK$52,089,000), which allocated to the following category:
2020 2019HK$’000 HK$’000
Supplier and distribution networks 833 2,246Brand Names 46,336 42,597Trading Rights 7,246 7,246
Total 54,415 52,089
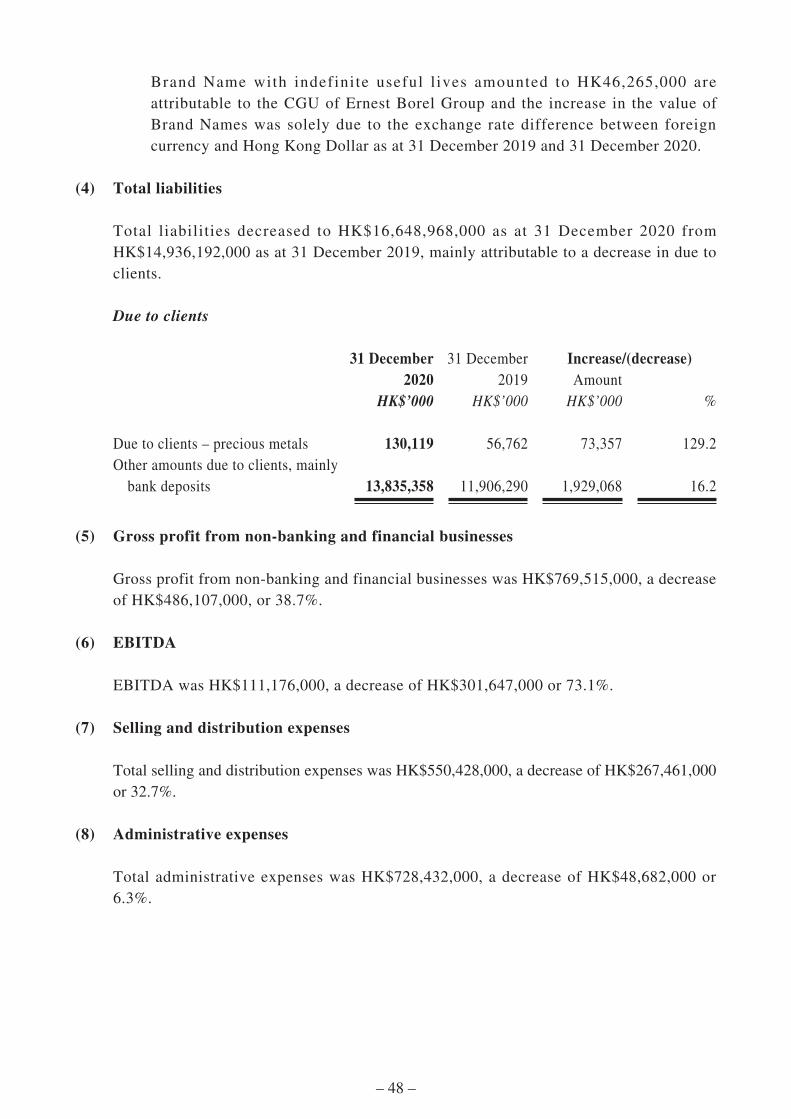
– 48 –
Brand Name with indefinite useful l ives amounted to HK46,265,000 are attributable to the CGU of Ernest Borel Group and the increase in the value of Brand Names was solely due to the exchange rate difference between foreign currency and Hong Kong Dollar as at 31 December 2019 and 31 December 2020.
(4) Total liabilities
Total liabilities decreased to HK$16,648,968,000 as at 31 December 2020 from HK$14,936,192,000 as at 31 December 2019, mainly attributable to a decrease in due to clients.
Due to clients
31 December 2020
31 December 2019
Increase/(decrease)Amount
HK$’000 HK$’000 HK$’000 %
Due to clients – precious metals 130,119 56,762 73,357 129.2Other amounts due to clients, mainly
bank deposits 13,835,358 11,906,290 1,929,068 16.2
(5) Gross profit from non-banking and financial businesses
Gross profit from non-banking and financial businesses was HK$769,515,000, a decrease of HK$486,107,000, or 38.7%.
(6) EBITDA
EBITDA was HK$111,176,000, a decrease of HK$301,647,000 or 73.1%.
(7) Selling and distribution expenses
Total selling and distribution expenses was HK$550,428,000, a decrease of HK$267,461,000 or 32.7%.
(8) Administrative expenses
Total administrative expenses was HK$728,432,000, a decrease of HK$48,682,000 or 6.3%.

– 49 –
(9) Share of profit of associates
The share of profit of Fair Future Industrial Limited (“Fair Future”), a 25% owned associate of the Group, was HK$3,180,000, representing a decrease of HK$14,495,000 or 82.0%. Fair Future is one of the leading OEM quartz watch manufacturers in Mainland China.
(10) Finance costs from non-banking business
Finance costs from non-banking business was HK$82,956,000, representing a decrease of HK$12,364,000 or 13.0%. It was composed of the interest charged on corporate bonds and the interest charged on bank borrowings, bank overdrafts and lease liabilities.
(11) Loss/profit attributable to owners of the Company
Loss attributable to owners of the Company was HK$169,233,000 (31 December 2019: profit of HK$44,246,000) for the year ended 31 December 2020.
(12) Inventories
Inventories was HK$2,255,553,000, a decrease of HK$2,413,000 or 0.1%.
OUTLOOK
COVID-19 continues to dominate the headlines, for both everyday life and developments of the global economy.
The central banks of major economies have pulled out all the policies since COVID-19 crisis began, pursuing unprecedented and decisive monetary expansion in order to support the economic activity. Similarly, the central banks of some smaller advanced economies, such as Australia and New Zealand, and emerging economies, such as India, have also resorted to unconventional measures. Fiscal measures are complemented by coherent and tough virus-containment strategies, which credibly enable economic reopening.

– 50 –
Mainland China has achieved apparent success in bringing epidemic under control and it is now the first major economy to recover from COVID-19. Coupled with the positive and strong economic fundamentals, Mainland China is expected to remain one of the world’s few countries where the citizens live and work normally. Owing to the unresolved COVID-19 challenges, major economies other than Mainland China are yet to recover. The short-term outlook for the global economy remains uncertain and will be highly dependent on the duration of COVID-19. Vaccines from Mainland China, the UK, the US and Europe, although not 100% proven effective, are available for injection starting from January 2021 in advanced countries. By the end of 2021, most population of both advanced and developing countries would have been injected with vaccine. Hence, the global economic growth is expected to be still negative before economies are practically reopened in 2022.
In 2021, the local proprietary watch brand business in Mainland China is expected to rebound gradually although slowly. Generally, the market conditions are expected to be optimistic in 2021. Our well-established e-commerce platform and our comprehensive and unique network across Mainland China would contribute to the slight recovery in 2021 and significant recovery in 2022 when both consumption propensity and consumer confidence are substantially re-established.
The foreign proprietary watch brand business, owing to the adverse impact of continuous social distancing, lock-downs and travel restrictions on their key markets where the general demand is relatively weak, remains very challenging in 2021. Apparently, the prospect in 2022 is expected to be slightly optimistic when major economies are gradually reopened.
Bendura Bank, although its operation and performance being affected by COVID-19, has developed organically as shown by the stability of asset under management, higher liquidity level and increased headcount. By combining human resources, market opportunities and risk management, and by drawing on the professionalism of its banking and financial businesses employees, a powerful banking and financial business segment with operations in Hong Kong, Mainland China and Europe will gradually evolve. The banking and financial businesses continue to perform with banking business as the main driver of revenue and profitability in the years to come. It is our objective to keep investing in the growth of the banking and financial businesses. Specifically, we intend to strengthen Bendura Bank’s capital base to support the sustainable growth of its credit business and to expand its geographical coverage and product coverage in Hong Kong, Mainland China, East Asia and strengthen Bendura Bank’s asset management business. Besides, we intend to pursue selective strategic investment and acquisition opportunities related to the banking business.

– 51 –
We have strong faith that the world will overcome this challenging period. Meanwhile our organization must adopt a new mindset and take this as the most important lesson that we should learn and improve from. Should the disposal of most watch companies be properly executed in the second quarter, if not in the third quarter, of 2021, the Group will then primarily focus on the banking and financial businesses. Given the competent human resources and strong infrastructure, the Group is well placed to meet the challenging economic environment and to grasp opportunities and keep striving for sustainable profitability under the new business structure.
EMPLOYEES AND REMUNERATION POLICY
Our sustained success would not be possible without the high levels of expertise, professionalism and commitment shown by our employees.
As at 31 December 2020, the Group had approximately 4,600 fulltime staff in Hong Kong and Mainland China and approximately 300 fulltime staff in Europe. The remuneration packages offered to the employees were determined and reviewed on an arm’s length basis with reference to the market condition and individual performance. The Group also provides other benefits to its employees, including year-end double pay, medical insurance and retirement benefits, and incentive bonuses are offered with reference to the Group’s operating results and employees’ individual performance. All employees of the Group in Hong Kong have joined the provident fund schemes. Employees of Group’s subsidiaries in Mainland China also have participated in social insurance scheme administrated and operated by local authorities and contributions were made according to the local laws and regulations.
FINAL DIVIDEND
The Board has resolved not to recommend to distribute a final dividend for the year ended 31 December 2020 (year ended 31 December 2019: nil).
CLOSURE OF REGISTER OF MEMBERS
The Company’s Annual General Meeting is scheduled to be held on Friday, 28 May 2021 (the “AGM 2021”). For the purpose of determining the entitlement to attend and vote at the AGM 2021, the register of members of the Company will be closed from Tuesday, 25 May 2021 to Friday, 28 May 2021, both days inclusive, during which period no transfer of shares will be registered. In order to be eligible to attend and vote at the AGM 2021, all transfer documents, accompanied by relevant share certificates, must be lodged with the Company’s Hong Kong branch share registrar, Tricor Secretaries Limited, at Level 54, Hopewell Centre, 183 Queen’s Road East, Hong Kong no later than 4:30 p.m. on Monday, 24 May 2021.

– 52 –
MATERIAL EVENTS AFTER CLOSURE OF FINANCIAL YEAR
Material events after closure of financial year are set out in note 17 of this announcement.
CORPORATE GOVERNANCE CODE
The Company is committed to maintain a standard of corporate governance that is consistent with market practices.
The Company has applied the principles and complied with all the applicable code provisions of the Corporate Governance Code (the “CG Code”) and Corporate Governance Report as set out in Appendix 14 to the Rules (“Listing Rules”) Governing the Listing of Securities on The Stock Exchange of Hong Kong Limited (the “Stock Exchange”) for the year ended 31 December 2020 except with the details disclosed below:
(i) CG Code E.1.2
CG Code E.1.2 stipulates that the Chairman of the board of directors (the “Board”) should attend the annual general meeting of the Company. The Chairman of the Board was unable to attend the annual general meeting of the Company held on 30 June 2020 (the “AGM 2020”) due to other business engagement.
(ii) CG Code A.6.7
CG Code A.6.7 stipulates that independent non-executive directors should attend general meetings. Three Independent Non-executive Directors did not attend the AGM 2020 due to other business engagements outside Hong Kong.
(iii) CG Code A.5.1
CG Code A.5.1 stipulates that the Nomination Committee must comprise a majority of independent non-executive directors. From 1 September 2020, after resignation of two Independent Non-executive Directors, to 5 November 2020, the Nomination Committee only comprised half of Independent Non-executive Directors. This matter has been addressed as two newly-appointed Independent Non-executive Directors were appointed as members of Nomination Committee on 6 November 2020.
The Chairman of the Board and Independent Non-executive Directors will endeavor to attend all future general meetings of the Company unless unexpected or special circumstances preventing them from doing so. The Board will continuously review and improve the corporate governance practices and standards of the Company to ensure that business activities and decision-making processes are properly regulated.
– 53 –
MODEL CODE FOR SECURITIES TRANSACTIONS BY DIRECTORS
The Company has adopted the Model Code for Securities Transactions by Directors of Listed Issuers (“Model Code”) as set out in Appendix 10 to the Listing Rules as the code of conducts for securities transactions by Directors of the Company. All the members of the Board have confirmed, following specific enquiry by the Company, that they have complied with the required standard as set out in the Model Code throughout the year ended 31 December 2020.
BOARD OF DIRECTORS
The principal focus of the Board is on the overall strategic development and direction of the Group. The Board also monitors the financial performance and the internal controls of the Group’s business operations. Moreover, the Board is responsible for performing the corporate governance duties. The Board has established a clear segregation of duties and responsibilities between the Board and the management as to which types of decisions are to be taken by the Board and which are to be delegated to management. This segregation of duties and responsibilities will be regularly reviewed by the Board. With the Chairman as a facilitator in the establishment that promotes discussion among Directors, all the Directors have brought a wide spectrum of valuable business experience, knowledge and professionalism to the Board for its efficient and effective delivery of the board functions.
BUY-BACK, REDEMPTION OR SALE OF LISTED SECURITIES OF THE COMPANY
The Company and its subsidiaries did not buy back any Company’s listed shares (whether on the Stock Exchange or otherwise) during the year ended 31 December 2020.
REVIEW OF CONSOLIDATED FINANCIAL STATEMENTS
The Audit Committee reviewed the consolidated financial statements for the year ended 31 December 2020. Based on this review and discussions with management, the Audit Committee was satisfied that the consolidated financial statements for the year ended 31 December 2020 were prepared in accordance with applicable accounting standards and fairly present the Group’s financial position and results for the year ended 31 December 2020.
– 54 –
SCOPE OF WORK OF BDO LIMITED ON THIS PRELIMINARY ANNOUNCEMENT
The figures in respect of the Group’s consolidated statement of financial position, consolidated statement of comprehensive income and the related notes thereto for the year ended 31 December 2020 as set out in this announcement have been agreed by the Group’s auditor, BDO Limited, to the amounts set out in the Group’s audited consolidated financial statements for the year. The work performed by BDO Limited in this respect did not constitute an assurance engagement in accordance with Hong Kong Standards on Auditing, Hong Kong Standards on Review Engagements or Hong Kong Standards on Assurance Engagements issued by the Hong Kong Institute of Certified Public Accountants and consequently no assurance has been expressed by BDO Limited on this preliminary announcement.
PUBLICATION OF ANNUAL RESULTS AND ANNUAL REPORT
The annual results announcement is published on the website of the Stock Exchange at www.hkexnews.hk and the Company’s websites at www.irasia.com/listco/hk/citychamp and www.citychampwj.com. The annual report of the Company for the year ended 31 December 2020 will be available on the respective websites of the Stock Exchange and the Company, and despatched to the shareholders of the Company in due course.
APPRECIATION
Our financial performance and strategic moves reflected the joint efforts of the board and management in successfully pursuing our mission. I would like to express my deep gratitude to our employees, customers, suppliers, bankers, professional consultants, business partners, and shareholders for their support.
By Order of the BoardCitychamp Watch & Jewellery Group Limited
Shang JianguangExecutive Director & Chief Executive Officer
Hong Kong, 30 March 2021
As at the date of this announcement, the Board comprises Mr. Hon Kwok Lung, Mr. Shang Jianguang, Mr. Shi Tao, Mr. Lam Toi Man, Mr. Bi Bo, Ms. Sit Lai Hei, Mr. Hon Hau Wong and Mr. Teguh Halim as the executive directors; and Dr. Kwong Chun Wai, Michael, Mr. Zhang Bin, Mr. Kam, Eddie Shing Cheuk and Mr. Li Ziqing as the independent non-executive directors.
Copyright © 2022 FDOKUMEN


![コプト語の複数定冠詞(ハンドアウト)[Coptic Plural Definite Article (handout)]](https://static.fdokumen.com/doc/165x107/6321a6dc64690856e108cc3b/coptic-plural-definite-article.jpg)