MCB - Arif Habib Savings and Investments Limited - PSX Data ...
91
-
Upload
khangminh22 -
Category
Documents
-
view
0 -
download
0
Transcript of MCB - Arif Habib Savings and Investments Limited - PSX Data ...


Vision, Mission and Core Values
Company Information
Notice of Annual General Meeting
Chairman’s Review Report
Directors’ Report
Pattern of Shareholding
Statement of Compliance with the Code of Corporate Governance
Review Report to the Members on the Statement of Compliancewith the Code of Corporate Governance
Financial and Business Highlights
Auditors’ Report to the Members
Statement of Financial Position
Statement of Profit and Loss Account
Statement of Comprehensive Income
Statement of Changes in Equity
Statement of Cash Flow
Notes to the Financial Statements
Form of Proxy
Conversion Of Physical Shares Into Book-Entry Form
Payment Of Cash Dividend Electronically (mandatory Requirement)
E-Dividend Mandate Form
02
03
04
13
14
15
17
36
38
41
43
44
49
50
51
52
53
54
85
89
1
2
3
4
5
6
7
8
9
10
11
12
13
14
15
16
17
18
19
20
Annual Report 2021MCB - Arif Habib Savings and Investments Limited

Vision
To become synonymous with Savings
Mission
To become a preferred Saving and Investment Manager in the domestic and regional markets
while maximizing stakeholders’ value
Core Values
The Company takes pride in its orientation towardsclient service. It believes that its key success
factors include continuous investment in staff,systems and capacity building and its insistence
on universal best practices at all times.
Annual Report 2021MCB - Arif Habib Savings and Investments Limited 02

COMPANY INFORMATION
Annual Report 2021MCB - Arif Habib Savings and Investments Limited 03
AM1Rating

NOTICE OF ANNUAL GENERAL MEETING
Annual Report 2021MCB - Arif Habib Savings and Investments Limited 04
September 30, 2021

NOTICE OF ANNUAL GENERAL MEETING
Annual Report 2021MCB - Arif Habib Savings and Investments Limited 05

NOTICE OF ANNUAL GENERAL MEETING
Annual Report 2021MCB - Arif Habib Savings and Investments Limited 06
mandatory requirement)
Conversion Book-Entry Form:

NOTICE OF ANNUAL GENERAL MEETING
Annual Report 2021MCB - Arif Habib Savings and Investments Limited 07

Annual Report 2021MCB - Arif Habib Savings and Investments Limited 08

Annual Report 2021MCB - Arif Habib Savings and Investments Limited 09

Annual Report 2021MCB - Arif Habib Savings and Investments Limited 10

Annual Report 2021MCB - Arif Habib Savings and Investments Limited 11
Annual Report 2021MCB - Arif Habib Savings and Investments Limited 12

CONVERSION OF PHYSICAL SHARESINTO BOOK-ENTRY FORM
Annual Report 2021MCB - Arif Habib Savings and Investments Limited 13

PAYMENT OF CASH DIVIDEND ELECTRONICALLY(MANDATORY REQUIREMENT)
Annual Report 2021MCB - Arif Habib Savings and Investments Limited 14

11 MCB - Arif Habib Savings and Investments Limited11 MCB - Arif Habib Savings and Investments Limited
CHAIRMAN’S REVIEW REPORT
Annual Report 2021MCB - Arif Habib Savings and Investments Limited 15
June 30, 2021 June 30, 2020
-------------Amount in Rupees----------
Management Fee / Investment Advisory Fee 752,077,846 673,851,616
Income from investments including profit on deposits 189,560,061 129,876,491
Profit before taxation 484,705,781 345,100,890
Profit after taxation 376,434,163 257,669,113
Earnings per share (EPS) 5.23 3.58
Dear Shareholders, I am pleased to present this Report to the members of MCB-Arif Habib Savings and Investments Limited on the overall performance of the Board and effectiveness of the role played by the Board in achieving the Company’s strategic objectives. The Audited Financial Statements for the year reveals the following about the performance of the Company, when compared with last year:
At the forthcoming AGM we will be pleased to present before our shareholders a final cash dividend of Rs. 2.75 per share for the year ended June 30, 2021, bringing the total cash dividend for the year to Rs. 5.00 per share. The Board’s Report has outlined detailed comments on the economy and I shall therefore refrain from repeating that information but focus on the broader issues. The economy, after suffering at the hand of covid-19, staged a strong recovery in fiscal year 2021 with GDP growth rate beating the initial government estimates by a healthy margin. In addition to lowering interest rates, out of the box solutions from SBP like Temporary Economic Relief Facility (TERF), Long Term Financing Facility (LTFF), Refinancing scheme for Wages helped in boosting the overall confidence in the economy. Furth ermore, government’s focus towards construction sector also in shape of the amnesty scheme also helped in shaping stronger than expected economic recovery. By the grace of Allah, intensity of covid -19 cases in Pakistan remained better than that of its neighbours, which led to healthy exports growth coupled with strong come back of large scale manufacturing. On the external front, healthy exports were very well supported by workers’ remittances, keeping current account resilient. Asset management industry also benefited from economic recovery and flushed liquidity leading towards healthy growth in assets under management, majority of which was contributed by the money market funds. Strong recovery in the stock market also improved equity and equity linked AUMs. Going ahead, industry is gearing up to widen the investors’ base, which I believe is the future of industry. This is where ou r cost efficient digital framework, iSave comes into play with an ability of reaching to masses. Moreover, as the ongoing pandemic crisis unfolds businesses and consumers increasingly have gone digital resulting in rise in e-banking transactions. This has further complimented the growth of Company’s online platform, iSave, whose growth has been phenomenal. Going forward, we believe the platform would continue to play significant role in achieving Company’s strategic goals. The Board set the Company’s strategic aims to uphold our vision, mission and core values. It exhibited high standards of business and professional conduct in managing and supervising affairs of the Company. The Company’s Board remained steadfast in steering the Company through the challenging year. During the year, the Board performed an in-house performance evaluation of the Board as a whole, its Committees & Chief Executive Officer. The overall rating of the Board is highly encouraging, particularly in respect to its composition, expertise, effective risk management, adequate system of internal controls and audit function. The Board has always focused on the preservation of the interests of shareholders and unit holders of the Funds under its management. The Board has in-place properly structured Committees, with each one having well-defined objectives and appropriate Terms of Reference ; performing their respective roles effectively and efficiently.

11 MCB - Arif Habib Savings and Investments Limited11 MCB - Arif Habib Savings and Investments Limited
CHAIRMAN’S REVIEW REPORT
Annual Report 2021MCB - Arif Habib Savings and Investments Limited 16
During the year, a total of twenty-four (24) meetings of the Board and the Committees of the Board were held which comprised of eleven (11) meetings of the Board of Directors, nine (9) meetings of the Audit Committee
and four (4) meetings of the Human Resource and Remuneration Committee. I wish to record my appreciation to the Board Members for the active participation and continuing guidance provided to the Management. It is worth reiterating that the Directors have played an effective role in the achievement of good results and in ensuring that the targets were met, by providing continuing guidance to the Management. I expect that the Company, through its Management team, will continue to work closely, firstly with, its valued clients, as well as, very importantly, with its employees, shareholders and stakeholders in a manner that makes one feel proud to be associated with MCB Arif Habib Savings and Investments Limited. Finally, I would like to thank all our shareholders, many of whom have stayed alongside us from the inception of our journey and I sincerely hope that the bond we share continues to flourish in the years ahead.
Mr. Haroun Rashid Chairman – Board of Directors MCB-Arif Habib Savings and Investments Limited

DIRECTORS’ REPORT
Annual Report 2021MCB - Arif Habib Savings and Investments Limited 17
The Board of Directors of MCB-Arif Habib Savings and Investments Limited (MCBAH) are pleased to present Report on the affairs of MCBAH for the year ended June 30, 2021.
PRINCIPAL BUSINESS
The Company is a Non-Banking Finance Company, licensed as Asset Management Company, Investment Advisor and Pension Fund Manager under the Securities and Exchange Commission of Pakistan’s regulatory regime.
THE BUSINESS ENVIRONMENT
Economy and Money Market Review
Fiscal year 2021 has proven to be a positive year with respect to economic performance. Country registered a GDP growth rate of 3.94 per cent outpacing the original target of 2.1 per cent for the outgoing fiscal year. This better than expected recovery has been due to relatively lower and stable interest rates, supportive financing schemes from SBP, amnesty scheme to encourage construction sector, resumption in demand and strong inflow of remittances supporting the overall consumption growth.
The growth momentum remained strong throughout the year as reflected in the performance of various sectors. Cement sector saw an impressive comeback in local dispatches as they witnessed a growth of about 20 per cent over last year in FY21. Sales of 2 and 3 wheeler units also rose at an impressive rate of approx. 39 per cent over last year in FY21 reflecting the resilience of economy. Similarly, the demand of petrol and diesel also increased by about 12 per cent and 16 per cent respectively over last year indicating a broader recovery in economy. Overall, Large Scale Manufacturing Index (LSM) has grown by about 14.6 per cent in first eleven months of the current fiscal year led by the cyclical sectors. On the external front, the country posted a current account deficit of USD 1.8 billion (-0.6 per cent of GDP) in the fiscal year 2021, a 58 per cent improvement when compared with last year deficit of USD 4.4 billion (-1.7 per cent of GDP). Despite a USD 30 billion deficit (about 23 per cent higher this year) on balance on trade in goods and services, current account deficit remained marginally negative due to strong inflow of workers’ remittances. Remittances jumped to USD 29.4 billion, up by 27 per cent when compared with USD 23.1 billion a year back. Inflation remained the chink in the armor for the government as rising food prices continued to create challenges for policy makers. Headline inflation represented by CPI averaged 8.9 per cent over last year, with food inflation averaging about 13 per cent during the period. The prices of perishable food items along with the price of wheat continued to advance higher as supply side disruptions and mismanagement caused the prices to soar. Nevertheless, core inflation as measured by Non Food Non Energy was still controlled and averaged 6.4 per cent for the period. Monetary Policy Committee maintained status quo throughout the year after successive cuts in previous meetings. While real interest rates remained negative, the central bank was cautious with regards to demand side pressures owing to covid-19 as well as comfort drawn from better external position.
As the economy started to open up, tax collection also improved and grew by about 18 per cent during the fiscal year which exceeded the revised target by PKR 30 billion. Fiscal deficit for the first nine months of the period clocked in at 3.6 per cent of GDP, compared to 3.8 per cent of GDP last year. Primary balance was even better at a surplus of 1.0 per cent of GDP compared to last year surplus of 0.4 per cent of GDP.
Yield curve started to slope upward after inflation trajectory was observed to be on the rising trend. 3, 5 and 10 Year bonds saw a rise of 146 bps, 138 bps and 125 bps respectively during the period.

Equity Market Review
KSE-100 Index posted a 38 per cent return for FY21, gaining 12,934 points to end the year at
47,356 points. This was the highest yearly return since FY14, when index achieved 41 per cent return during the year. Market’s resilience during the year was tested by re-emergence of
covid-19
wave II (October 2020) and III (February 2021), political unrest caused by opposition rallies and senate election. However, stronger than expected economic recovery and central bank’s initiatives (TERF, RDA and mandatory housing financing by banks) kept the positive momentum of the market intact.
Major positive contributors to the index remained Technology (385 per cent), Banks (36 per cent) and Cements (77 per cent) whereas despite 83 per cent jump in crude oil prices, index heavy E&Ps remained a laggard with 11per cent return. Market remained fairly liquid through the year with average daily traded volume jumped by 169 per cent to 528
million
shares compared to 196
million
shares changing hands in FY20. Whereas average value traded also jumped by 163 per cent YoY to USD 120
million
compared to USD 46
million
a year back.
Foreign investors continued their selling spree in FY21 as well with net selling of USD 387 million
compared to USD 285 million a year back. Whereas most of this selling was countered by individuals and companies with net buying of USD 332 million and USD 138 million, respectively.
Economy & Market – Future Outlook
Growth momentum is likely to continue in the coming year given the accommodative monetary and fiscal policies. Broader economy appears to be operating close to pre-covid-19 levels gauged by LSM growth, cement sales, auto sales, etc. We expect GDP growth to improve further in FY-22 but likely remain slightly lower from government target of 4.8per cent for FY-22. The recent surge in commodity prices poses challenges to both to Fiscal and External Accounts. On the fiscal side, targets for revenue and development expenditures are highly unlikely to be met. With imports resuming momentum, Current Account Deficit is expected to reach near 2.8 per cent of GDP which is likely to weaken the exchange rate to near 170 against USD by year end. Commodity prices and weaker currency are also likely to keep average inflation persistent and it may remain near 8.5 per cent. We therefore expect tightening of monetary policy later in the year and expect interest to reach upto 9 per cent by the year end. IMF program appears to remain on hold as government chooses to further pro-growth measures over austerity based conventional IMF reforms. Focus on growing exports and stimulate domestic demand through investment in construction and housing are the hallmarks of government pro-growth strategy. Enabling environment including stable interest rates, low cost financing schemes for housing and machinery imports and avoiding further increase in power tariffs are the key initiatives in this regard. Public Sector entities and in particular energy sector still remains a thorny issue in IMF talks and continue to remain a major challenge for the government despite recent steps taken to lessen the burden on public finances. A sharp deterioration in balance of payment account may force government to succumb to IMF policy framework and thus alter the economic growth trajectory.
From capital market perspective, particularly equities, markets are watchful of the 4th wave of covid-19 cases which do pose risks in the near term. As growth momentum continues, equities have potential to provide decent returns to investors. Risk premiums vis a vis 10-year bonds is currently at 3.6 per cent, compared to historical average of 1.3 per cent suggesting some upside due to re-rating would be possible. Earnings growth will be a key driver for the next few years. We therefore expect stronger returns from equity market to continue. Recent announcement about reclassification of PSX from MSCI Emerging Market Index to MSCI Frontier Market Index is to remain marginally positive thus local investors are likely to drive the market momentum.
DIRECTORS’ REPORT
Annual Report 2021MCB - Arif Habib Savings and Investments Limited 18

For debt holders, we expect Money Market Funds to
continue to seamlessly mirror policy rates throughout the year. On the other hand, government bonds have priced in the anticipated yield curve. We remain cautious at the current levels of bond yields and would continue to monitor the data points to capitalize on opportunities.
Mutual Fund Industry Review
The Net Assets of the open end mutual fund industry increased by about 37.2 per cent to PKR 1,018 billion in this fiscal year. Money market funds and Fixed Income funds experienced an influx of
investment as corporate liquidity swiftly moving towards mutual funds. Total money market funds grew by about 48 per cent during the period to PKR 467 billion. Within the money market sphere, the conventional funds dominated as they grew by about 39 per cent to PKR 285
billion. Equity and
related funds surged rapidly by 33 per cent from PKR 224 billion to PKR 299 billion over the year. Most of the rise in equity and equity linked fund assets can be attributed to a positive uptick in the market that was up approx. 38 per cent YoY owing to favorable investor sentiments.
In terms of the segment share, Money Market funds were the leader with a share of around 46 per cent, followed by Equity and Equity related funds with a share of 30 per cent and Income funds having a share of 24 per cent as at the end of the fiscal year. Mutual Fund Industry Outlook Record decline in interest rates have reinstated the confidence in risk asset classes. We expect liquidity to gear up towards equity and related funds. The sustainability of liquidity will however depend on how the economy transitions through this phase of pandemic. Our operations remained seamless and given our competitive edge due to aggressive investment in digital access and online customer experience, the environment provides an opportunity with growing number of investors available online. COMPANY's PERFORMANCE REVIEW
With the advent of Covid 19 pandemic in March 2020, the impact of Covid 19 continued in the financial year 2020-2021 which had been a year of disruption, adaption and recovery. COVID-19 pandemic has effectively put the world in reset mode, redefining life. MCBAH also adjusted its way of working to address the challenging situation. iSAVE
ensured the Company to deliver efficient,
smooth and seamless service to all its unit holders. Due to iSAVE, the Company was able to accelerate the migration of its customers to alternate delivery channels with relative ease and has successfully positioned the Company to grow its AUMs base manifold.
Financial Year 2020-2021
has been one of very successful years for the Company. The Company
also benefited from economic recovery and flushed liquidity leading towards healthy growth in Assets Under Management, majority of which was contributed by the money market funds. Resultantly, during the year,
the Company has shown significant growth and generated net increase in AUMs of Rs. 47.6 billion
resultantly as on June 30, 2021,
the Company is managing AUMs of Rs.155.4 billion compared to Rs.109.3 billion as on June 30, 2020. Increase in AUMs primarily in Money Market Funds coupled with
strong recovery in the stock market also improved equity and equity linked AUMs resulted the Company in additional generationof Management Fee/ Investment Advisory Fee of Rs. 78.1 million to earn Management Fee/ Investment Advisory Fee of Rs. 752million compared to 673.9
million last year.
Moreover, during the year due to active fund management, the Company was able to earn
Rs.189.6 million on its investment and placement of excess funds compared to Rs. 129.9 million in
the corresponding year.
Increase in AUMs coupled
with active fund management resulted in Company earning Profit after taxation of Rs.376.4 million compared to last year profit of Rs. 257.7 million.
DIRECTORS’ REPORT
Annual Report 2021MCB - Arif Habib Savings and Investments Limited 19

The Earnings Per Share of current financial year ended June 30, 2021 is Rs. 5.23 as compared to Rs. 3.58 per share in the previous financial year ended June 30, 2020.
The Board has proposed a final dividend of 27.5
per cent (Rs. 2.75
per share) for the year ended June 30, 2021 as compared to 22.5
percent (Rs. 2.25
per share)
for the year ended June 30,
2020. This is an additional to the interim dividend of 22.5
per cent
(Rs. 2.25 per share) as compared
to 10 per cent (Re. 1 per share) for the year ended June 30, 2020.
The Board of Directors of the Company has an overall responsibility to ensure that internal financial controls system of the company is adequate and is operating effectively.
The value of investment of employees in pension funds is Rs.64.4 million as per the audited financial statements for the year ended June 30, 2021 (Rs. 53 million for the year ended June 30, 2020). PRINCIPAL RISKS AND UNCERTAINTIES Asset under management (AUM) which is the life blood of asset management industry showed promising growth in FY21 and crossed Rs. 1 Trillion . This relates to business risk averseness of corporates due to covid-19 complimented by awareness created by Asset Management Companies. Corporate being financially educated sector are more inclined towards mutual fund investments as compared to general public. To attract new clients and facilitate existing clients in this highly competitive industry,
Asset Management Companies (AMCs) continued to offer more and more
online and Mobile based services. However, these web based services are prone to hacking and cyber-`attacks. These solutions require substantial costs to develop,
maintain and protect while the
demand for delivery of superior returns is not allowing increment in management fee. Thus, this continues to put pressure on margins of Asset Management Companies (AMCs). To cover up expenses and being profitable,
the only remedy is higher AUMs.
Government has become cautious on issues relating to ‘Know Your Customer ’
(KYC) requirements to cope up ‘Anti Money Laundering’
(AML) and ‘Combating the Financing of Terrorism’
(CFT). This puts high responsibility on Asset Management Companies (AMCs) to carefully perform Customer Due Diligence (CDD) as breach of these regulations might attract heavy penalties. This increases regulatory risk for Asset Management Companies (AMCs) and MCBAH is committed to ensuring compliance of these very demanding but necessary regulations.
Covid-19 continued to haunt economy in FY21. However, Government’s smart lock down policy, subsidies and other financial support packages offered by the Government for various economic sectors along with subsidized loans, deferral payments on debt and grants provided by various international donor agencies and friendly countries provided much needed financial support to the country. Economic chaos created by Covid-19 is expected to take some time to settle down both on international and local levels.
Further, there have not occurred any significant changes during the financial year concerning the nature of the business of the Company.
CORPORATE SOCIAL RESPONSIBILITY AND IMPACT ON ENVIRONMENT
The Company believes in ever growing change, sustainability and be more digitally connected with our customers. Therefore, the online portal, iSAVE , has always been the focus. Moreover, protecting the employees in the wake of Covid-19 has been its top priority. All employees were provided with the relevant resources to work comfortably from home while ensuring efficient customer services. It shows that the Company strives to improve the well-being of both its employees as well as customers.
DIRECTORS’ REPORT
Annual Report 2021MCB - Arif Habib Savings and Investments Limited 20

DIRECTORS’ REPORT
Annual Report 2021MCB - Arif Habib Savings and Investments Limited 21
ASSET MANAGER RATING
In the month of October 2020,
Alhamdulillah the Company achieved highest Asset Manager Rating of AM1. This rating reflects the Company’s position as one of the leading Asset Managers in the Asset Management Companies, strongly supported by strong control environment, structured investment processes, good governance framework and qualified management team.
The Stability Ratings of the Collective Investment Schemes under management of theCompany are as under:
As at June 30, 2021
As at June 30, 2020
-------------------------Stability rating--------------------
Rating agency
Pakistan Cash Management Fund
AA + (f)
AA + (f)
PACRA
Pakistan Income Fund
A + (f)
A + (f)
PACRA
MCB Pakistan Sovereign Fund
AA - (f)
AA -
(f)
PACRA
Pakistan Income Enhancement Fund
A + (f)
A + (f)
PACRA
MCB DCF Income Fund
(f)AA -
AA - (f)
PACRA
MCB Cash Management Optimizer
AA + (f) AA + (f)
PACRA
Alhamra Islamic Income Fund AA- (f) AA- (f) PACRA
Alhamra Daily Dividend Fund AA- (f) AA- (f) PACRA
Alhamra Islamic Money Market Fund
AA (f) AA (f)
PACRA The Mutual Funds Association of Pakistan (MUFAP) is executing the performance of the Mutual Funds on the basis of Mutual Funds’ returns. MCBAH has assumed the performance ranking of MUFAP for its equity based Collective Investments Schemes. HOLDING COMPANY MCB Bank Limited, being the parent company of MCB-Arif Habib Savings and Investments Limited, holds 51.33 per cent of the outstanding ordinary shares of the Company. CORPORATE GOVERNANCE
The Board comprises of eight (8) members including the Chief Executive Officer (CEO) and has a diverse mix of gender and knowledge. The Board consists of 1 female and 7 male directors, categorized as follows:
4 Non – Executive Directors;
3 Independent Directors; and
1 Executive Director (CEO).

DIRECTORS’ REPORT
Annual Report 2021MCB - Arif Habib Savings and Investments Limited 22
The details of above are as under:
Sr. No.
Name
Status
Membership in other Board Committees
1.
Mr. Haroun Rashid
Non-Executive Director
None
2.
Mr. Nasim Beg
Non-Executive Director
(i)
Audit Committee; and
(ii)
HR&R* Committee
3.
Mr. Ahmed Jahangir
Non-Executive Director
(i)
Audit Committee; and
(ii)
HR&R* Committee.
4.
Mr. Kashif A. Habib
Non-Executive Director
(i)
Audit Committee
5.
Syed Savail Meekal Hussain
Independent Director
(i)
Audit Committee
(ii)
HR&R* Committee
6.
Mirza Qamar Beg
Independent Director
(i)
Audit Committee (Chairman); and
(ii) HR&R* Committee (Chairman).
7. Ms. Mavra Adil Khan Independent Director
(i) HR&R* Committee
8. Mr. Muhammad Saqib Saleem
Executive Director
(i) HR&R* Committee
* HR&R stands for Human Resource and Remuneration
The Board of Directors review all significant matters of the Company. This includes, but not limited to, the Company’s strategic direction, annual business plans and targets, decision on long-term investments. The Board of Directors is committed to maintaining high standards of corporate governance. The Board of Directors is pleased to report that:
a. The financial statements, present fairly the state of affairs, the results of operations, cash flows and changes in equity;
b. Proper books of accounts of the Company have been maintained;
c. Appropriate accounting policies as stated in the notes to the financial statements have been consistently applied
in preparation of financial statements
and accounting estimates are
based on reasonable and prudent judgment;
d.
International
Financial Reporting Standards have been followed in the preparation of
financial statements and any departures there from have been adequately disclosed and explained;
e.
The system of internal control is sound in design and has been effectively implemented and monitored with ongoing efforts to improve it further;
f.
There are no significant doubts upon the Company’s ability to continue as going concern;
g.
There has been no material departure from the best practices of Corporate Governance,as detailed in the listing regulations;
h.
Key operating and financial data of the last 6
years in summarized form is annexed;

i.
The outstanding taxes, statutory charges and duties,
if any, have been fully disclosed in the
audited financial statements, for details please refer note no. 19.1, 19.2 and 20;
j.
The Board of Directors is ultimately responsible for Company’s system of internal control and for reviewing its effectiveness. The Board, whilst maintaining its overall responsibility, has delegated the detailed design and operation of the system of internal controls to the Chief Executive. Company’s system of internal controls comprises of clear governance structures, authority limits and accountabilities, well-understood policies and procedures. The Board meets quarterly to consider Company’s financial performance, financial and operating budgets, business growth and developmental plans, capital expenditure proposals and other key performance indicators. The Audit Committee receives reports on the system of internal financial controls from the external and internal auditors and reviews the process for monitoring the effectiveness of internal controls;
k.
As at June 30, 2021, the Company is in compliance with the requirements of Directors’
Training Program, as contained in Regulation No. 20 of the Code;
l. The Directors’ Remuneration Policy (The Policy) was approved by the Board of Directors in their 144th meeting held on September 14, 2018. The main features of the Policy are as under:
(i) With effect from September 14, 2018 each non-executive director will be paid a sum of rupees seventy five thousand (75,000) for attending the Board meeting / committees of the Board;
(ii) The Vice Chairman of the Board is entitled to certain perks and perquisites on
account of the additional responsibilities, which have been disclosed in the annexed audited financial statements, for details please refer note 32;
(iii) Payment for any extra services shall not be made to any executive director.
However, if a non-executive director perform any special services, the remuneration of the same will be pre-decided by the Board and in the absence of the quorum, by the general meeting of members of the Company;
(iv) Remuneration to executive director(s) shall be decided by the Board on
recommendation of the Human Resource and Remuneration Committee based on the role and responsibilities of the executive director and shall reflect
the individual’s roles, experience and responsibilities; and
(v)
Non-executive directors are not covered under any post retirement scheme of the Company.
m.
The detailed pattern of shareholding as on June 30, 2021
is annexed;
n.
A formal and effective mechanism is put in place for an annual evaluation of the Board’s own performance, members of the Board and Committees of the Board;
o. During the year, the Company undertaken the following transactions with related parties:
(i)
Disposal of furniture to MCB Islmic Bnak Limited.;
There are no other contracts or arrangements
entered into with any of the Related Parties
requiring disclosure under Section 208 of the Companies Act, 2017.
DIRECTORS’ REPORT
Annual Report 2021MCB - Arif Habib Savings and Investments Limited 23
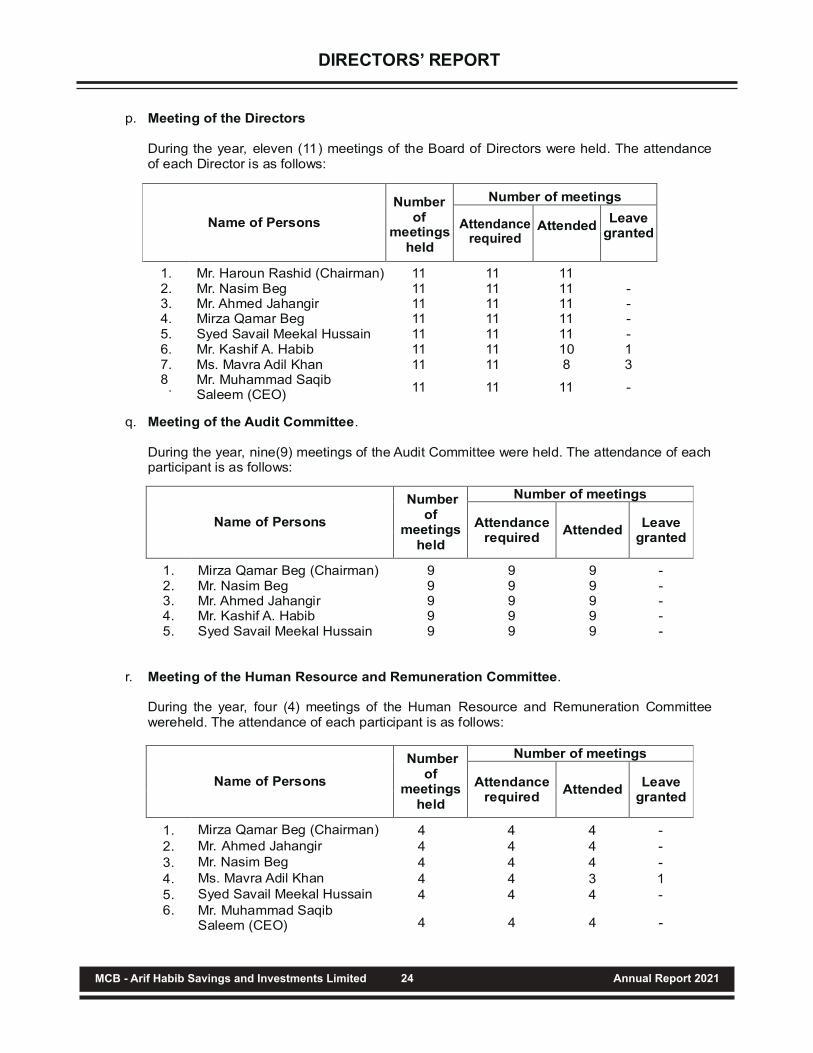
p.
Meeting of the Directors
During the year, eleven (11) meetings of the Board of Directors were held. The attendance
of each Director is as follows:
q. Meeting of the Audit Committee.
During the year, nine(9) meetings of the Audit Committee were held. The attendance of each participant is as follows:
1. Mirza Qamar Beg (Chairman) 9 9 9 -
Name of Persons
Number of
meetings held
Number of meetings
Attendance required
Attended Leave
granted
Name of Persons
Number of
meetings held
Number of meetings
Attendance required
Attended Leave
granted
2. Mr. Nasim Beg 9 9 9 - 3. Mr. Ahmed Jahangir 9 9 9 - 4. Mr. Kashif A. Habib 9 9 9 - 5. Syed Savail Meekal Hussain 9 9 9 -
r. Meeting of the Human Resource and Remuneration Committee. During the year, four
(4) meetings of the Human Resource and Remuneration Committee
wereheld. The attendance of each participant is as follows:
1.
Mirza Qamar Beg (Chairman)
4
2.
Mr. Ahmed Jahangir
4 3.
Mr. Nasim Beg
4
4.
Ms. Mavra Adil Khan
4 5. Syed Savail Meekal Hussain
4
6.
Mr. Muhammad Saqib Saleem (CEO)
4 4 4 4 4
4 4 4 3 4
4 4 4 -
- - - 1 -
1. Mr. Haroun Rashid (Chairman) 11 11 11
Name of Persons
Number of
meetingsheld
Number of meetings
Attendancerequired
Attended Leave
granted
2.
Mr. Nasim Beg
11
11
11
-
3.
Mr. Ahmed Jahangir
11
11
11
-
4.
Mirza Qamar Beg
11
11
11
-
5.
Syed Savail Meekal Hussain
11
11
11
-
6.
Mr. Kashif A. Habib
11
11
10
1
7. Ms. Mavra Adil Khan 11 11 8 3
8.
Mr. Muhammad Saqib Saleem (CEO)
11
11
11 -
DIRECTORS’ REPORT
Annual Report 2021MCB - Arif Habib Savings and Investments Limited 24

DIRECTORS’ REPORT
Annual Report 2021MCB - Arif Habib Savings and Investments Limited 25
AUDITORS
The current auditors, M/s KPMG Taseer Hadi& Co. Chartered Accountants are completing their Five (5) years term, and are thus not eligible for reappointment as per the requirement of Listed Companies (Code of Corporate Governance) Regulations, 2019 and shall retire on the conclusion of 21st Annual General Meeting. Moreover, in
the 73rd
Annual General Meeting of MCB Bank Limited, the Parent Company,
has appointed M/s A.F. Ferguson as the Bank’s statutory auditor for the
Financial Year 2021.
The Audit Committee considered and recommended M/s A. F. Ferguson & Co. Chartered Accountants as statutory auditors of the Company for the year ending June 30, 2022 and the Board of Directors has also endorsed the recommendation of the Audit Committee in the forthcoming Annual General Meeting. ACKNOWLEDGEMENT The Directors would like to thank Government of Pakistan , Securities & Exchange Commission of Pakistan and other regulatory bodies and express deep appreciation to our shareholders who have consistently demonstrated their confidence in the Company. We would also like to place on record our sincere appreciation for the commitment, dedication and innovative thinking put in by each individual of the Company and are confident that they will continue to do so in the future.
Kashif A Habib
Director
For and on behalf of Board
Muhammad Saqib Saleem Chief Executive OfficerKarachi: August 09, 2021

Annual Report 2021MCB - Arif Habib Savings and Investments Limited 26

Annual Report 2021MCB - Arif Habib Savings and Investments Limited 27

Annual Report 2021MCB - Arif Habib Savings and Investments Limited 28

Annual Report 2021MCB - Arif Habib Savings and Investments Limited 29

Annual Report 2021MCB - Arif Habib Savings and Investments Limited 30

Annual Report 2021MCB - Arif Habib Savings and Investments Limited 31

Annual Report 2021MCB - Arif Habib Savings and Investments Limited 32

Annual Report 2021MCB - Arif Habib Savings and Investments Limited 33
Annual Report 2021MCB - Arif Habib Savings and Investments Limited 34

Annual Report 2021MCB - Arif Habib Savings and Investments Limited 35

Categories of Shareholders Shareholders Shares Held Percentage
Directors and their spouse(s) and minor children
MR. NASIM BEG 4
49,822
0.07
MR. MUHAMMAD SAQIB SALEEM 1
500
0.00
MIRZA QAMAR BEG 1
500
0.00
MS. MAVRA ADIL KHAN 1
100
0.00
MR. HAROUN RASHID 1
500
0.00
MR. AHMED JAHANGIR 1
500
0.00
MR. MOHAMMAD KASHIF 1
4
0.00
SYED SAVAIL MEEKAL HUSSAIN 1 500 0.00
Associated Companies, undertakings and related parties 3 64,082,935 89.00
NIT and ICP - - -
Banks Development Financial Institutions, Non-Banking Financial Institutions 1 70 0.00
Modarabas and Mutual Funds 1 900,000 1.25
General Public
a. Local 738 3,837,279 5.33
b. Foreign 1 4 0.00
Foreign Companies 1
2,710,000
3.76
Others 12
417,286
0.58
Totals 768
72,000,000
100.00
Share holders holding 10% or more Shares Held Percentage
MCB BANK LIMITED 36,956,768 51.33
ARIF HABIB CORPORATION LIMITED 21,664,167
30.09
PATTERN OF SHAREHOLDING AS AT JUNE 30, 2021
Annual Report 2021MCB - Arif Habib Savings and Investments Limited 36

256
111
181
145
26
15
10
4
2
1
1
1
2
1
1
1
1
1
1
1
1
1
1
1
1
1
# Of Shareholders Total Shares Held
4,275
35,630
118,957
308,633
211,323
185,700
182,772
87,438
58,500
35,000
36,000
52,900
116,800
77,880
92,000
140,000
156,000
208,757
260,000
350,000
900,000
1,588,500
2,710,000
5,462,000
21,664,167
36,956,768
768 72,000,000
1 to
101 to
501 to
1001 to
5001 to
10001 to
15001 to
20001 to
25001 to
30001 to
35001 to
50001 to
55001 to
75001 to
90001 to
135001 to
155001 to
205001 to
255001 to
345001 to
895001 to
1585001 to
2705001 to
5460001 to
21660001 to
36955001 to
100
500
1000
5000
10000
15000
20000
25000
30000
35000
40000
55000
60000
80000
95000
140000
160000
210000
260000
350000
900000
1590000
2710000
5465000
21665000
36960000
Shareholdings' Slab
PATTERN OF SHAREHOLDING AS AT JUNE 30, 2021
Annual Report 2021MCB - Arif Habib Savings and Investments Limited 37

STATEMENT OF COMPLIANCE WITH (CODE OF CORPORATE GOVERNANCE) REGULATIONS, 2019
LISTED COMPANIES
Annual Report 2021MCB - Arif Habib Savings and Investments Limited 38

Annual Report 2021MCB - Arif Habib Savings and Investments Limited 39
STATEMENT OF COMPLIANCE WITH LISTED COMPANIES (CODE OF CORPORATE GOVERNANCE) REGULATIONS, 2019

Annual Report 2021MCB - Arif Habib Savings and Investments Limited 40
_____________ Haroun RashidChairman – Board of DirectorsMCB-Arif Habib Savings & Investments Limited
STATEMENT OF COMPLIANCE WITH LISTED COMPANIES (CODE OF CORPORATE GOVERNANCE) REGULATIONS, 2019

REVIEW REPORT TO THE MEMBERS STATEMENT OF COMPLIANCE WITH LISTED COMPANIES (CODE OF CORPORATE GOVERNANCE) REGULATIONS, 2019
Annual Report 2021MCB - Arif Habib Savings and Investments Limited 41

REVIEW REPORT TO THE MEMBERS STATEMENT OF COMPLIANCE WITH LISTED COMPANIES (CODE OF CORPORATE GOVERNANCE) REGULATIONS, 2019
Annual Report 2021MCB - Arif Habib Savings and Investments Limited 42

FINANCIAL & BUSINESS HIGHLIGHTS
Annual Report 2021MCB - Arif Habib Savings and Investments Limited 43
2016 2017 2018 2019 2020
Pre tax Margin % 46 36 27 12 41
Net Margin % 31 25 17 3 31
Performance
Return on assets % 11 9 6 1 11
Return on equity % 15 13 8 2 17
Leverage
Gearing (T-Debt:Equity) Times 0.40 0.43 0.43 0.40 0.46
Interest Coverage Ratio Times 768.06 472.94 477.53 18.75 40.90
Liquidity
Current Ratio Times 2.38 2.06 2.07 2.15 2.11
Valuation
Earnings per share Rs. 3.32 2.81 1.72 0.34 3.58
No. of ordinary shares 72 72 72 72 72
Historical trend
Management fee (Rs. in million) 704 664 702 731 674
Operating profit [PBIT] (Rs. in million) 349 285 196 81 337
Profit before tax (Rs. in million) 350
286
197
85
345
Profit after tax (Rs. in million) 239
202
124
24
258
Share capital (Rs. in million) 720
720
720
720
720
Shareholders equity (Rs. in million) 1,549
1,580
1,568
1,462
1,551
Total assets (Rs. in million) 2,174
2,264
2,244
2,044
2,266
2021
49
38
16
23
0.48
64.12
1.98
5.23
72
752
477
485
376
720
1,603
2,376

AUDITOR’S REPORT TO THE MEMBERS
Annual Report 2021MCB - Arif Habib Savings and Investments Limited 44

AUDITOR’S REPORT TO THE MEMBERS
Annual Report 2021MCB - Arif Habib Savings and Investments Limited 45

AUDITOR’S REPORT TO THE MEMBERS
Annual Report 2021MCB - Arif Habib Savings and Investments Limited 46

AUDITOR’S REPORT TO THE MEMBERS
Annual Report 2021MCB - Arif Habib Savings and Investments Limited 47

AUDITOR’S REPORT TO THE MEMBERS
Annual Report 2021MCB - Arif Habib Savings and Investments Limited 48

STATEMENT OF FINANCIAL POSITION AS AT 30 JUNE 2021
Chief Executive Officer Chief Financial Officer Director
Annual Report 2021MCB - Arif Habib Savings and Investments Limited 49
Note 2021 2020
(Rupees)
ASSETS
Non-current assets
Fixed assets 5 358,789,899 401,747,361
Long-term investments 6 638,596,952 533,563,426
Long-term loans and prepayments 7 14,161,597 7,062,588
Long-term deposits 4,994,903 5,289,229
1,016,543,351 947,662,604
Current assets
Receivable from related parties 8 543,936,536 537,446,025
Loans and advances 9 2,377,576 4,201,445
Deposits, prepayments and other receivables 10 43,794,004 30,508,123
Accrued mark-up 11 22,487 24,966
Short-term investments 13 685,758,449 661,620,881
Advance tax - net of provisions 14 39,149,452 64,293,766
Cash and bank balances 15 43,929,106 19,814,591
1,358,967,610 1,317,909,797
Total assets 2,375,510,961 2,265,572,401
EQUITY AND LIABILITIES
Share capital and reserves
Authorized share capital
72,000,000 (2020: 72,000,000) ordinary shares of Rs. 10 each 720,000,000 720,000,000
Issued, subscribed and paid-up share capital 16 720,000,000 720,000,000
Reserves 883,129,589 830,695,426
Total equity 1,603,129,589 1,550,695,426
LIABILITIES
Non-current liabilities
Deferred tax liability - net 18 67,176,622 55,968,562
Lease liability against right-of-use assets 12 18,001,467 33,454,709
Current liabilities
Unclaimed dividend 4,672,994 4,586,000
Current Portion of lease liability against right-of-use assets 12 32,347,100 27,191,338
Trade and other payables 19 650,183,189 593,676,366
Total liabilities 772,381,372 714,876,975
Total equity and liabilities 2,375,510,961 2,265,572,401
CONTINGENCIES AND COMMITMENTS 20
The annexed notes 1 to 42 form an integral part of these financial statements.

STATEMENT OF PROFIT OR LOSS ACCOUNT FOR THE YEAR ENDED 30 JUNE 2021
Annual Report 2021MCB - Arif Habib Savings and Investments Limited 50
Chief Executive Officer Chief Financial Officer Director
Note 2021 2020
Revenue
Management fee / investment advisory fee 21 752,077,846 673,851,616
Processing and other related income 52,056,974 31,792,154
Profit on bank deposits under effective interest method 22 1,366,115 3,823,104
Dividend income 19,588,106 9,103,218
Realized gain on sale of investments - net 23 49,793,111 67,277,271
Unrealized gain on re-measurement of
investments classified as 'financial assets at fair
value through profit or loss' - net 118,812,729 49,672,898
993,694,881 835,520,261
Expenses
Administrative expenses 24 (423,435,342) (415,166,101)
Selling and distribution expenses 25 (71,651,600) (64,841,310)
Financial charges 26 (7,443,547) (8,237,030)
Workers' welfare fund 27 (9,900,000) (7,000,000)
(512,430,489) (495,244,441)
481,264,392 340,275,820
Other income 28.1 3,441,389 4,929,289
Other expenses 28.2 - (104,219)
Profit for the year before taxation 484,705,781 345,100,890
Taxation 29 (108,271,618) (87,431,776)
Profit for the year 376,434,163 257,669,113
Earnings per share - basic and diluted 30 5.23 3.58
The annexed notes 1 to 42 form an integral part of these financial statements.
(Rupees)

STATEMENT OF COMPREHENSIVE INCOME FOR THE YEAR ENDED 30 JUNE 2021
Annual Report 2021MCB - Arif Habib Savings and Investments Limited 51
Chief Executive Officer Chief Financial Officer Director
Note 2021 2020
Profit for the year 376,434,163 257,669,113
Other comprehensive income for the year - -
376,434,163 257,669,113
The annexed notes 1 to 42 form an integral part of these financial statements.
(Rupees)

STATEMENT OF CHANGES IN EQUITYFOR THE YEAR ENDED 30 JUNE 2021
Annual Report 2021MCB - Arif Habib Savings and Investments Limited 52
Chief Executive Officer Chief Financial Officer Director
Revenue
Balance as at 01 July 2019 720,000,000 396,000,000 (60,000,000) 336,000,000 406,226,313 1,462,226,313
Transactions with owners recorded
directly in equity
Final dividend for the year
ended 30 June 2019 at
Rs. 1.35 per share - - - - (97,200,000) (97,200,000)
Interim dividend for the year
ended 30 June 2020 at
Rs. 1 per share - - - - (72,000,000) (72,000,000)
- - - - (169,200,000) (169,200,000)
Total comprehensive income
for the year
Profit after taxation for the year
ended 30 June 2020 - - - - 257,669,113 257,669,113
Other comprehensive income for
the year ended 30 June 2020 - - - - - -
Totall comprehensive income for the year - - - - 257,669,113 257,669,113
Balance as at 30 June 2020 720,000,000 396,000,000 (60,000,000) 336,000,000 494,695,426 1,550,695,426
Balance as at 01 July 2020 720,000,000 396,000,000 (60,000,000) 336,000,000 494,695,426 1,550,695,426
Transactions with owners recorded
directly in equity
Final dividend for the year
ended 30 June 2020 at
Rs. 2.25 per share - - - - (162,000,000) (162,000,000)
Interim dividend for the year
ended 30 June 2021 at
Rs. 2.25 per share - - - - (162,000,000) (162,000,000)
- - - - (324,000,000) (324,000,000)
Total comprehensive income
for the year
Profit after taxation for the year
ended 30 June 2021 - - - - 376,434,163 376,434,163
Other comprehensive income for
the year ended 30 June 2021 - - - - - -
Total comprehensive income for the year - - - - 376,434,163 376,434,163
Balance as at 30 June 2021 720,000,000 396,000,000 (60,000,000) 336,000,000 547,129,589 1,603,129,589
The annexed notes 1 to 42 form an integral part of these financial statements.
-------------------------------------------------------------------- (Rupees) ---------------------------------------------------------------------
Issued,
subscribed and
paid-up capital
Reserves Total
Capital
Share premium Deficit arising
on
amalgamation
Sub-total Unappropriated
profit

STATEMENT OF CASH FLOW FOR THE YEAR ENDED 30 JUNE 2021
Annual Report 2021MCB - Arif Habib Savings and Investments Limited 53
Chief Executive Officer Chief Financial Officer Director
CASH FLOWS FROM OPERATING ACTIVITIES
Profit for the year before taxation
Adjustments for non-cash and other items:
Depreciation of property and equipment
Depreciation of right of use assets
Amortization
Write off / Impairment on leasehold improvement & furniture and fixtures
Financial charges
Unrealized gain on the re-measurement of investments classified
as 'financial assets at fair value through profit or loss' - net
Gain on sale of investments - net
Provision against advisory fee receivable
(Gain) / loss on disposal of fixed assets - net
Operating cash flows before working capital changes
Movement in working capital
Decrease / (Increase) in current assets
Loans and advances
Deposits, prepayments and other receivables
Accrued mark-up on bank balances
Receivable from related parties
Increase / (decrease) in current liabilities
Unclaimed dividend
Trade and other payables
Income taxes paidFinancial charges paid
Net cash flows from operating activities
CASH FLOWS FROM INVESTING ACTIVITIES
Capital expenditure
Long-term loans and prepayments
Long-term deposits
Proceeds from disposal of fixed assets
Proceeds from the redemption of investments / purchase of investments - netNet cash flows from investing activities
CASH FLOWS FROM FINANCING ACTIVITIES
Dividend paidPayment of lease liability against right-of-use assetsNet cash flows from financing activitiesNet increase in cash and cash equivalentsCash and cash equivalents at the beginning of the yearCash and cash equivalents at the end of the year
The annexed notes 1 to 42 form an integral part of these financial statements.
Note 2021 2020
484,705,781 345,100,890
5.1 19,119,350 34,225,470 5.2 30,937,453 25,298,120 5.3 11,779,098 11,980,174 24 4,768,237 4,269,937 26 7,443,547 8,237,030
(118,812,729) (49,672,898) 23 (49,793,111) (67,277,271) 24 - 448,942 28 (2,461,340) 104,219
(97,019,495) (32,386,277) 387,686,286 312,714,612
1,823,869 5,766,923 (13,285,881) 24,294,456
2,479 156,246 (6,490,511) (37,792,684)
(17,950,044) (7,575,059)
86,994 329,062 56,506,823 58,178,989
426,330,059 363,647,605
(71,919,244) (71,662,109) (442,031) (1,301,942)
(72,361,275)
(72,964,051)
353,968,784
290,683,553
(13,716,804)
(9,364,152)
(7,099,009)
2,429,556
294,326
(802,041)
9,602,625
1,709,500
38,735,316
(91,897,882)
27,816,454
(97,925,019)
(324,000,000)
(168,870,938) 12 (33,670,723)
(27,238,622)
(357,670,723)
(196,109,560) 24,114,515
(3,351,026)
19,814,591
23,165,617 31 43,929,106
19,814,591
(Rupees)

Annual Report 2021MCB - Arif Habib Savings and Investments Limited 54
NOTES TO THE FINANCIAL STATEMENTS FOR THE YEAR ENDED 30 JUNE 2021
1 STATUS AND NATURE OF BUSINESS
1.1 MCB-Arif Habib Savings and Investments Limited ("the Company") was incorporated in the name of Arif Habib InvestmentManagement Limited (AHIML) on 30 August 2000 as an unquoted public limited company under the requirements of the CompaniesOrdinance, 1984. During 2008, AHIML was listed on the Karachi Stock Exchange Limited (now integrated into the Pakistan StockExchange Limited) by way of offer for sale of shares by a few of its existing shareholders to the general public. In the same financialyear, the name of AHIML was changed from "Arif Habib Investment Management Limited" to "Arif Habib Investments Limited"(AHIL). On 19 January 2011, a transfer agreement was signed between Arif Habib Corporation Limited (AHCL) [the then parent ofAHIL] and MCB Bank Limited (MCB Bank) [the then parent of MCB Asset Management Company Limited (MCB AMC)] for transferof the entire business of MCB AMC to AHIL to achieve synergies in business and to access a wider distribution network. Thescheme of amalgamation ("the Scheme") was approved by the shareholders of AHIL and MCB AMC in their respective extraordinarygeneral meetings held on 21 May 2011. The Scheme was also approved by the Securities and Exchange Commission of Pakistan(SECP) with the effective date of amalgamation being 27 June 2011 (the effective date). In accordance with the terms contained inthe Scheme, the Company became a subsidiary of MCB Bank Limited from the end of the year ended 30 June 2011 which owns
1.2
1.3
1.4
Net assets value as at
2021 2020
(Rupees in million)
Open-end Collective Investment Schemes (CISs)
Pakistan Income Fund 9,595 2,076 MCB Pakistan Stock Market Fund 12,397 8,804 MCB Pakistan Sovereign Fund 738 1,816 Pakistan Capital Market Fund 467 415 Pakistan Cash Management Fund 3,119 3,693
the Scheme, the Company became a subsidiary of MCB Bank Limited from the end of the year ended 30 June 2011 which owns51.33% ordinary shares in the Company till date. Pursuant to the merger of MCB AMC with and into AHIL, the name of AHIL hasbeen changed to MCB - Arif Habib Savings and Investments Limited, effective from 23 May 2013.
The Company is registered as a Pension Fund Manager under the Voluntary Pension System Rules, 2005, as an AssetManagement Company and an Investment Advisor under the Non-Banking Finance Companies (Establishment and Regulation)Rules, 2003.
The Company was assigned an Asset Manager rating of AM1 by Pakistan Credit Rating Agency Limited (PACRA). The rating wasdetermined by PACRA on 6 October 2020. Currently, the Company is managing the following funds under its management:
The registered office of the Company is situated at 2nd Floor, Adamjee House, I.I. Chundrigar Road, Karachi, Pakistan. TheCompany operates 16 (2020: 16) branches inside Pakistan.
3,119 3,693 Pakistan Income Enhancement Fund 630
707
MCB Pakistan Asset Allocation Fund 912
1,299
MCB DCF Income Fund 3,646
4,033
MCB Cash Management Optimizer 34,030
28,106
Alhamra Islamic Money Market Fund (Formerly: MCB Pakistan Frequent Payout Fund) 15,258
152 Alhamra Islamic Asset Allocation Fund 2,335
1,964
Alhamra Islamic Stock Fund 3,410
2,656 Alhamra Islamic Income Fund 5,575
4,442
Alhamra Islamic Active Asset Allocation Fund Plan - I -
341
Alhamra Islamic Active Asset Allocation Fund Plan - II -
177
Alhamra Daily Dividend Fund 2,279
3,237
Alhamra Smart Portfolio Fund 123
-
Pension Funds
Pakistan Pension Fund 1,933
Alhamra Islamic Pension Fund 1,354
1,723
1,058
Discretionary portfolio 57,014 42,550
The Company is also managing investments under discretionary and non discretionary portfolio management agreements, details of
Number of clients 37 36
Total portfolio at cost (Rs. in millions) 46,869 36,853
Total portfolio at market value (Rs. in millions) 47,074 35,426
Fee earned (Rupees in million) 47 33
which are given below:

Annual Report 2021MCB - Arif Habib Savings and Investments Limited 55
NOTES TO THE FINANCIAL STATEMENTS FOR THE YEAR ENDED 30 JUNE 2021
1.5
2 BASIS OF PREPARATION
2.1 Statement of compliance
-
-
-
In accordance with the requirements of Rule 9 of the Non-Banking Finance Companies (Establishment and Regulation) Rules, 2003,the Company has obtained insurance coverage from Jubilee General Insurance Company Limited against any loss that may beincurred as a result of employees' fraud or gross negligence. The insurance company has been assigned a credit rating of AA+ bythe Pakistan Credit Rating Agency Limited (PACRA).
These financial statements have been prepared in accordance with the accounting and reporting standards as applicable inPakistan. The accounting and reporting standards applicable in Pakistan comprise of:
International Financial Reporting Standards (IFRS) issued by the International Accounting Standards Board (IASB) as notifiedunder the Companies Act, 2017;
Provisions of and directives issued under the Companies Act, 2017 along with part VlllA of the repealed Companies Ordinance,1984; and
Non-Banking Finance Companies (Establishment and Regulations) Rules, 2003 (the NBFC Rules), Non-Banking Finance-
2.2 Consolidation of mutual funds by the asset management company
2.3 Basis of measurement
2.4 Functional and presentation currency
These financial statements are presented in Pakistani Rupee, which is the Company's functional and presentation currency.
2.5 Critical accounting estimates and judgments
Non-Banking Finance Companies (Establishment and Regulations) Rules, 2003 (the NBFC Rules), Non-Banking FinanceCompanies and Notified Entities Regulations, 2008 (the NBFC Regulations).
Where provisions of and directives issued under the Companies Act, 2017, part VlllA of the repealed Companies Ordinance, 1984,
the NBFC Rules and the NBFC Regulations differ from the IFRS, the provisions of and directives issued under the Companies Act,
2017, part VlllA of the repealed Companies Ordinance, 1984, the NBFC Rules and the NBFC Regulations have been followed.
SECP through a notification no. SRO 56(1)/2016 dated 28 January 2016, has directed that the requirements of consolidation under
section 228 of the Companies Act, 2017 and IFRS 10 "Consolidated Financial Statements" is not applicable in case of investment by
companies in mutual funds established under Trust Structure. Accordingly, the aforesaid requirements have not been considered in
the preparation of these financial statements.
These financial statements have been prepared on the basis of historical cost convention, except that investments are carried at fair
values in accordance with the requirement of International Financial Reporting Standard (IFRS) 9, 'Financial Instruments'.
- Property and equipment (Note 4.1.1)
- Intangible assets (Note 4.1.3)
- Right-of-use asset and related liability (Note 4.1.4)
- Classification of investments (Note 4.2.1.1)
- Impairment (Note 4.2.1.3)
Judgments made by management in the application of the accounting and reporting standards, as applicable in Pakistan, that have
the most significant effect on the amount recognized in these financial statements and estimates with a significant risk of material
adjustments to the carrying amount of assets and liabilities in the future years are as follows:
The preparation of financial statements in conformity with the accounting and reporting standards, as applicable in Pakistan, requires
the management to make judgments, estimates and assumptions that affect the application of policies and the reported amounts of
assets, liabilities, income and expenses.
The estimates and associated assumptions are based on historical experience and various other factors that are believed to be
reasonable under the circumstances, the results of which form the basis of making judgments about the carrying values of assets
and liabilities that are not readily apparent from other sources. Actual results may differ from these estimates. The estimates and
underlying assumptions are reviewed on an ongoing basis. Revisions to accounting estimates are recognized in the period in which
the estimate is revised if the revision affects only that period, or in the period of the revision and future periods if the revision affects
both current and future periods.
- Taxation (Note 4.3)
- Receivables (Note 4.6)
- Provisions (Note 4.10)

Annual Report 2021MCB - Arif Habib Savings and Investments Limited 56
NOTES TO THE FINANCIAL STATEMENTS FOR THE YEAR ENDED 30 JUNE 2021
-
- IFRS 16 – The amendment partially amends Illustrative Example 13 accompanying IFRS 16 by excluding the illustration ofreimbursement of leasehold improvements by the lessor. The objective of the amendment is to resolve any potential confusionthat might arise in lease incentives.
IFRS 9 – The amendment clarifies that an entity includes only fees paid or received between the entity (the borrower) and thelender, including fees paid or received by either the entity or the lender on the other’s behalf, when it applies the ‘10 per cent’ testin paragraph B3.3.6 of IFRS 9 in assessing whether to derecognize a financial liability.
3 CHANGES IN ACCOUNTING STANDARDS, INTERPRETATIONS AND AMENDMENTS TO PUBLISHED
APPROVED ACCOUNTING STANDARDS
a) Standards, interpretations and amendments to published approved accounting standards that are effective
but not relevant
b) Standards, interpretations and amendments to published approved accounting standards that are not yet effective
-
There are certain other new and amended standards, interpretations and amendments that are mandatory for the Company's
accounting periods beginning on or after 1 July 2020 but are considered not to be relevant or do not have any significant effect on
the Company's operations and therefore are not detailed in these financial statements.
Interest Rate Benchmark Reform – Phase 2 which amended IFRS 9, IAS 39, IFRS 7, IFRS 4 and IFRS 16 is applicable for
annual financial periods beginning on or after 1 January 2021, with earlier application permitted. The amendments introduce a
practical expedient to account for modifications of financial assets or financial liabilities if a change results directly from IBOR
reform and occurs on an ‘economically equivalent’ basis. In these cases, changes will be accounted for by updating the effective
interest rate. A similar practical expedient will apply under IFRS 16 for lessees when accounting for lease modifications required
The following International Financial Reporting Standards (IFRS Standards) as notified under the Companies Act, 2017 and theamendments and interpretations thereto will be effective for accounting periods beginning on or after 01 July 2021:
-
interest rate. A similar practical expedient will apply under IFRS 16 for lessees when accounting for lease modifications required
by IBOR reform. The amendments also allow a series of exemptions from the regular, strict rules around hedge accounting for
hedging relationships directly affected by the interest rate benchmark reforms. The amendments apply retrospectively with earlier
application permitted. Hedging relationships previously discontinued solely because of changes resulting from the reform will be
reinstated if certain conditions are met.
COVID-19-Related Rent Concessions (Amendment to IFRS 16) – the International Accounting Standards Board (the Board) has
issued amendments to IFRS 16 (the amendments) to provide practical relief for lessees in accounting for rent concessions. The
amendments are effective for periods beginning on or after 1 June 2020, with earlier application permitted. Under the standard’s
previous requirements, lessees assess whether rent concessions are lease modifications and, if so, apply the specific guidance
on accounting for lease modifications. This generally involves remeasuring the lease liability using the revised lease payments
and a revised discount rate. In light of the effects of the COVID-19 pandemic, and the fact that many lessees are applying the
standard for the first time in their financial statements, the Board has provided an optional practical expedient for lessees. Under
the practical expedient, lessees are not required to assess whether eligible rent concessions are lease modifications, and instead
are permitted to account for them as if they were not lease modifications.
The practical expedient introduced in the 2020 amendments only applied to rent concessions for which any reduction in lease
payments affected payments originally due on or before 30 June 2021. In light of persistence of economic challenges posed by
the COVID-19 pandemic, the Board has extended the practical expedient for COVID-19 related rent concessions by one year i.e.
permitting lessees to apply it to rent concessions for which any reduction in lease payments affects only payments originally due
on or before 30 June 2022.
Rent concessions are eligible for the practical expedient if they occur as a direct consequence of the COVID-19 pandemic and if
all the following criteria are met:
-
- any reduction in lease payments affects only payments originally due on or before 30 June 2022; and
- there is no substantive change to the other terms and conditions of the lease
-
- Annual Improvements to IFRS standards 2018-2020:
all the following criteria are met:
the change in lease payments results in revised consideration for the lease that is substantially the same as, or less than, theconsideration for the lease immediately preceding the change;
Onerous Contracts – Cost of Fulfilling a Contract (Amendments to IAS 37) effective for the annual periods beginning on or after 1January 2022 amends IAS 1 by mainly adding paragraphs which clarifies what comprises the cost of fulfilling a contract, Cost offulfilling a contract is relevant when determining whether a contract is onerous. An entity is required to apply the amendments tocontracts for which it has not yet fulfilled all its obligations at the beginning of the annual reporting period in which it first appliesthe amendments (the date of initial application). Restatement of comparative information is not required, instead theamendments require an entity to recognize the cumulative effect of initially applying the amendments as an adjustment to theopening balance of retained earnings or other component of equity, as appropriate, at the date of initial application.
The following annual improvements to IFRS Standards 2018-2020 are effective for annual reporting periods beginning on or after1 January 2022.

Annual Report 2021MCB - Arif Habib Savings and Investments Limited 57
NOTES TO THE FINANCIAL STATEMENTS FOR THE YEAR ENDED 30 JUNE 2021
-
-
IAS 41 – The amendment removes the requirement in paragraph 22 of IAS 41 for entities to exclude taxation cash flows whenmeasuring the fair value of a biological asset using a present value technique.
Property, Plant and Equipment: Proceeds before Intended Use (Amendments to IAS 16) effective for annual periods beginningon or after 1 January 2022 clarifies that sales proceeds and costs of items produced while bringing an item of property, plant andequipment to the location and condition necessary for it to be capable of operating in the manner intended by management e.g.when testing etc., are recognized in profit or loss in accordance with applicable Standards. The entity measures the cost of thoseitems applying the measurement requirements of IAS 2. The standard also removes the requirement of deducting the net salesproceeds from cost of testing. An entity shall apply those amendments retrospectively, but only to items of property, plant andequipment that are brought to the location and condition necessary for them to be capable of operating in the manner intended bymanagement on or after the beginning of the earliest period presented in the financial statements in which the entity first appliesthe amendments. The entity shall recognize the cumulative effect of initially applying the amendments as an adjustment to the
-
-
-
-
-
the amendments. The entity shall recognize the cumulative effect of initially applying the amendments as an adjustment to theopening balance of retained earnings (or other component of equity, as appropriate) at the beginning of that earliest periodpresented.
Reference to the Conceptual Framework (Amendments to IFRS 3) - Reference to the Conceptual Framework, issued in May2020, amended paragraphs 11, 14, 21, 22 and 23 of and added paragraphs 21A, 21B, 21C and 23A to IFRS 3 . An entity shallapply those amendments to business combinations for which the acquisition date is on or after the beginning of the first annualreporting period beginning on or after 1 January 2022. Earlier application is permitted if at the same time or earlier an entity alsoapplies all the amendments made by Amendments to References to the Conceptual Framework in IFRS Standards, issued inMarch 2018.
Classification of liabilities as current or non-current (Amendments to IAS 1) amendments apply retrospectively for the annualperiods beginning on or after 1 January 2023. These amendments in the standards have been added to further clarify when aliability is classified as current. The standard also amends the aspect of classification of liability as non-current by requiring theassessment of the entity’s right at the end of the reporting period to defer the settlement of liability for at least twelve months afterthe reporting period. An entity shall apply those amendments retrospectively in accordance with IAS 8.
Disclosure of Accounting Policies (Amendments to IAS 1 and IFRS Practice Statement 2) – the Board has issued amendmentson the application of materiality to disclosure of accounting policies and to help companies provide useful accounting policydisclosures. The key amendments to IAS 1 include:
requiring companies to disclose their material accounting policies rather than their significant accounting policies;
clarifying that accounting policies related to immaterial transactions, other events or conditions are themselves immaterial and-
-
-
-
clarifying that accounting policies related to immaterial transactions, other events or conditions are themselves immaterial andas such need not be disclosed; and
clarifying that not all accounting policies that relate to material transactions, other events or conditions are themselvesmaterial to a company’s financial statements.
The Board also amended IFRS Practice Statement 2 to include guidance and two additional examples on the application ofmateriality to accounting policy disclosures. The amendments are effective for annual reporting periods beginning on or after 1January 2023 with earlier application permitted.
Definition of Accounting Estimates (Amendments to IAS 8) – The amendments introduce a new definition for accountingestimates clarifying that they are monetary amounts in the financial statements that are subject to measurement uncertainty.
The amendments also clarify the relationship between accounting policies and accounting estimates by specifying that acompany develops an accounting estimate to achieve the objective set out by an accounting policy. The amendments areeffective for periods beginning on or after 1 January 2023, and will apply prospectively to changes in accounting estimates andchanges in accounting policies occurring on or after the beginning of the first annual reporting period in which the companyapplies the amendments.
Deferred Tax related to Assets and Liabilities arising from a Single Transaction (Amendments to IAS 12) – The amendmentsnarrow the scope of the initial recognition exemption (IRE) so that it does not apply to transactions that give rise to equal andoffsetting temporary differences. As a result, companies will need to recognise a deferred tax asset and a deferred tax liability for
-
The above amendments are not likely to have any material effect on the Company's financial statements.
temporary differences arising on initial recognition of a lease and a decommissioning provision. For leases and decommissioningliabilities, the associated deferred tax asset and liabilities will need to be recognised from the beginning of the earliestcomparative period presented, with any cumulative effect recognised as an adjustment to retained earnings or other componentsof equity at that date. The amendments are effective for annual reporting periods beginning on or after 1 January 2023 withearlier application permitted.
Sale or Contribution of Assets between an Investor and its Associate or Joint Venture (Amendments to IFRS 10 and IAS 28)
The amendment amends accounting treatment on loss of control of business or assets. The amendments also introduce newaccounting for less frequent transaction that involves neither cost nor full step-up of certain retained interests in assets that arenot businesses. The effective date for these changes has been deferred indefinitely until the completion of a broader review.

Annual Report 2021MCB - Arif Habib Savings and Investments Limited 58
NOTES TO THE FINANCIAL STATEMENTS FOR THE YEAR ENDED 30 JUNE 2021
4 SUMMARY OF SIGNIFICANT ACCOUNTING POLICIES
4.1 FIXED ASSETS
4.1.1 Property and equipment
Items of property and equipment are stated at cost less accumulated depreciation and accumulated impairment losses, if any.
The accounting policies set out below have been applied consistently to all the periods presented in these financial statements,except for the change mentioned in note 4 to these financial statements.
Subsequent costs are recognized as separate assets, as appropriate, only when it is probable that future economic benefitsassociated with the items will flow to the Company and the cost of the items can be measured reliably. All other repair andmaintenance costs are charged to statement of profit or loss account as and when incurred.
Depreciation is charged at the rates specified in note 5.1 using the straight line method on all items of property and equipment.Depreciation is charged from the month the asset is available for use while no depreciation is charged in the month of disposal.
The residual values, useful lives and depreciation methods are reviewed at each reporting period and adjusted, if appropriate, toreflect the current best estimate.
4.1.2 Capital work-in-progress
4.1.3 Intangible assets
The useful lives of intangible assets are assessed as either finite or indefinite.
4.1.3.1 Intangible assets with finite useful lives
After initial recognition, an intangible asset with finite useful life is carried at cost less accumulated amortization and accumulatedimpairment losses, if any. Amortization is charged at the rates specified in note 5.2 using the straight line method. Amortizationbegins from the month the asset is available for use and ceases in the month of disposal. The amortization period and amortizationmethod are reviewed at each financial year-end and are adjusted, if appropriate, to reflect the current best estimate.
All expenditure connected with specific assets incurred during installation and construction period are carried under capital work-in-progress. Items included in capital work-in-progress are stated at cost less accumulated impairment losses, if any. These aretransferred to the relevant category of property and equipment as and when these become available for use.
Intangible assets acquired separately are initially recognized at cost. Intangible assets acquired in a business combination arerecognized at fair values as at the acquisition date.
Subsequent costs are included in the asset's carrying amounts or recognized as a separate asset, as appropriate, only when it isprobable that future economic benefits associated with the item will flow to the Company and the cost of the item can be measuredreliably.
reflect the current best estimate.
4.1.3.2 Intangible assets with indefinite useful lives
Goodwill
Management rights
probable that future economic benefits associated with the item will flow to the Company and the cost of the item can be measuredreliably.
Intangible assets with indefinite useful lives are not amortized, but are tested for impairment annually, either individually or at thecash-generating unit level. After initial recognition, these are stated at cost less accumulated impairment losses, if any.
Goodwill acquired in a business combination is recognized as of the acquisition date at the excess of consideration transferred overthe acquisition date fair value of identifiable assets acquired and liabilities assumed. It represents future economic benefits arisingfrom other assets acquired in the business combination that are not individually identified and separately recognized.
For the purpose of impairment testing, goodwill is allocated from the acquisition date to each of the entity’s cash-generating units orgroup of cash-generating units that is expected to benefit from the synergies of the combination. Each unit or group of units to whichgoodwill is allocated represents the lowest level within the entity at which the goodwill is monitored for internal managementpurposes.
Management rights represent the present value of future cash flows relating to the management fee that would be earned by theCompany assuming growth factors, based on the necessary market assumptions, on Assets Under Management (AUMs) acquiredby the Company. This benefit also considers the fact that the economic lifetime of these AUMs is unlimited. Based on thisassumption, the intangible asset has been valued using certain valuation techniques.
At the time of initial recognition, the fair value of management rights had been determined by the management using the multiple-period excess earnings method. Under this method, the value of a specific intangible asset is estimated from the residual earningsafter fair returns on all other assets (if any) employed have been deducted from the asset’s after-tax operating earnings.

Annual Report 2021MCB - Arif Habib Savings and Investments Limited 59
NOTES TO THE FINANCIAL STATEMENTS FOR THE YEAR ENDED 30 JUNE 2021
Impairment
4.1.4 Right-of-use assets and their related lease liability
Right of-use assets
On initial recognition, right-of-use assets are measured at an amount equal to initial lease liability adjusted for any lease paymentsmade at or before the commencement date, plus any initial direct costs incurred and an estimate of costs to be incurred to dismantleand remove the underlying asset or to restore the underlying asset or the site on which it is located.
Right-of-use assets are subsequently stated at cost less any accumulated depreciation and accumulated impairment losses and areadjusted for any remeasurement of lease liability. The remeasurement of lease liability will only occur in cases where the terms ofthe lease are changed during the lease tenor.
Goodwill and management rights impairment reviews are undertaken annually or more frequently if events or changes incircumstances indicate a potential impairment. The carrying value of cash generating unit to which goodwill and management rightsis allocated is compared to the recoverable amount, which is higher of value in use and the fair value less cost to sell. Anyimpairment is recognized immediately as an expense in the statement of profit or loss account and is not subsequently reversed.
Lease liability against right-of-use assets
4.2 Financial instruments
4.2.1 Financial assets
On initial recognition, a financial asset is classified as measured at amortised cost or fair value through profit or loss (FVTPL).
A financial asset is measured at amortised cost if it meets both of the following conditions and is not designated as at FVTPL:
Right-of-use assets are depreciated over their expected useful lives using the straight-line method. Depreciation on additions (newleases) is charged from the month in which the leases are entered into. No depreciation is charged in the month in which the leasesmature or are terminated.
The lease liabilities are initially measured as the present value of the remaining lease payments, discounted using the interest rateimplicit in the lease, or if that rate cannot be readily determined, the Bank’s incremental borrowing rate.
The lease liability is subsequently measured at amortised cost using the effective interest rate method. The lease liability is alsoremeasured to reflect any reassessment or change in lease terms. These remeasurements of lease liabilities are recognised asadjustments to the carrying amount of related right-of-use assets after the date of initial recognition.
Each lease payment is allocated between a reduction of the liability and a finance cost. The finance cost is charged to the profit andloss account as markup expense over the lease period so as to produce a constant periodic rate of interest on the remainingbalance of the liability for each period.
A financial asset is measured at amortised cost if it meets both of the following conditions and is not designated as at FVTPL:
- it is held within a business model whose objective is to hold assets to collect contractual cash flows; and
-
4.2.1.1 Initial recognition and measurement
4.2.1.2 Subsequent measurement
The following accounting policies apply to the subsequent measurement of financial assets:
Financial assets at FVTPL
its contractual terms give rise on specified dates to cash flows that are solely payments of principal and interest (SPPI) on theprincipal amount outstanding.
All financial assets not classified as measured at amortised cost as described above are measured at FVTPL. On initial recognition,the Company may irrevocably designate a financial asset that otherwise meets the requirements to be measured at amortised costas at FVTPL if doing so eliminates or significantly reduces an accounting mismatch that would otherwise arise.
Financial assets are initially recognised at fair value plus transaction costs except for financial assets carried at fair value throughprofit or loss. Financial assets carried at fair value through profit or loss are initially recognised at fair value and transaction costs areexpensed in the statement of profit or loss account.
These assets are subsequently measured at fair value. Net gains and losses, including
Financial assets at amortised
cost
any profit / markup or dividend income, are recognised in statement of profit or lossaccount.
These assets are subsequently measured at amortised cost using the effective interestmethod. The amortised cost is reduced by impairment losses. Profit / markup income,foreign exchange gains and losses and impairment are recognised in profit or lossaccount.

Annual Report 2021MCB - Arif Habib Savings and Investments Limited 60
NOTES TO THE FINANCIAL STATEMENTS FOR THE YEAR ENDED 30 JUNE 2021
4.2.1.3 Impairment of financial assets
Financial assets at amortised cost
4.2.2 Financial liabilities
4.2.3 Derecognition
The Company applies simplified approach to measuring expected credit losses which uses a lifetime expected loss allowance for allfinancial assets at amortized costs. When determining whether the credit risk of a financial asset has increased significantly sinceinitial recognition and when estimating ECLs, the Company considers reasonable and supportable information that is relevant andavailable without undue cost or effort. This includes both quantitative and qualitative information and analysis, based on theCompany's historical experience and informed credit assessment and including forward-looking information.
Loss allowances for financial assets measured at amortised cost are deducted from the gross carrying amount of the assets and arepresent separately in the statement of profit or loss account. The gross carrying amount of a financial asset is written off when theCompany has no reasonable expectations of recovering of a financial asset in its entirety or a portion thereof.
Financial liabilities are recognized at the time when the Company becomes a party to the contractual provisions of the instrument.These are initially recognized at fair value and subsequently stated at amortized cost.
4.2.3 Derecognition
4.3 Taxation
Current
Deferred
4.4 Impairment of non-financial assets
The carrying amounts of the Company's assets are reviewed at the end of each reporting period to determine whether there is any
Deferred taxation is recognized using the balance sheet liability method on all major temporary differences arising between thecarrying amounts of assets and liabilities for financial reporting purposes and the amounts used for taxation purposes. Deferred taxliabilities are recognized for all taxable temporary differences. A deferred tax asset is recognized only to the extent that it is probablethat future taxable profits will be available against which the temporary differences can be utilized. Deferred tax assets and liabilitiesare measured at the tax rates that are expected to apply to the period when the asset is realized or the liability is settled, based onthe tax rates that have been enacted or substantially enacted by the end of the reporting period.
Financial assets are derecognized at the time when the Company loses control of the contractual rights that comprise the financialassets. Financial liabilities are derecognized at the time when these are extinguished i.e. when the obligation specified in the contractis discharged, cancelled, or expires. Any gain or loss on derecognition of financial assets and financial liabilities is taken to thestatement of profit or loss account.
Provision for current taxation is based on taxable income at the current rates of taxation after taking into account tax credits andrebates available, if any, and taxes paid under the final tax regime. The charge for the current tax also includes adjustments wherenecessary, relating to prior years which arise from assessments framed / finalized during the year.
4.5 Employee benefits - defined contribution plan
4.6 Receivables
4.7 Cash and cash equivalents
The carrying amounts of the Company's assets are reviewed at the end of each reporting period to determine whether there is anyindication of impairment loss. If such an indication exists, the asset's recoverable amount is estimated in order to determine theextent of impairment loss, if any. The resulting impairment loss is taken to the statement of profit or loss account except for theimpairment loss on revalued assets, which is adjusted against related revaluation surplus to the extent that the impairment loss doesnot exceed the surplus arising on revaluation of that asset.
Cash and cash equivalents are carried in the statement of financial position at cost. These include cash in hand, balances withbanks in current and savings accounts and short-term highly liquid investments that are readily convertible to known amounts ofcash (i.e. in three month) and which are subject to an insignificant risk of changes in value.
The Company and its employees have been contributing to the Alhamra Islamic Pension Fund or Pakistan Pension Fund at the rateof 8.33% of basic salary on employees' discretion. These pension funds were established under the Voluntary Pension SchemeRules, 2005 and the Company has been licensed to act as a pension fund manager of these funds. The Company's contributionalong with employees' contribution are paid to the above mentioned pension funds.
These are initially measured at the fair value of the consideration receivable. Subsequently, these are valued at amortized cost.These assets are written off when there is no reasonable expectation of recovery. Credit loss is based on the expected credit loss.
4.8 Trade and other payables
Liabilities for trade and other amounts payable are carried at cost, which is the fair value of consideration to be paid in the future forgoods and services whether or not billed to the Company.
Annual Report 2021MCB - Arif Habib Savings and Investments Limited 61
NOTES TO THE FINANCIAL STATEMENTS FOR THE YEAR ENDED 30 JUNE 2021
4.16.1 Geographical segment
The operations of the Company are currently based only in Pakistan.
The Board of Directors and Chief Executive Officer have been identified as the chief operating decision-makers, who are responsiblefor allocating resources and assessing the performance of the operating segments. Currently, the Company is functioning as asingle operating segment.
4.9 Revenue recognition
4.9.1 Management fee / investment advisory fee
-
-
4.9.2 Processing fee and other related income
4.9.3 Profit on bank deposits and investments
4.9.4 Dividend income
Remuneration for investment advisory and asset management services are recognized on an accrual basis.
Performance based remuneration for investment advisory services and management of discretionary portfolio are accrued oncethe terms of contract are honoured and the Company achieves the performance condition at the end of the period.
Processing fees is recognized once the services are provided to the unit holders in connection with their investments in collectiveinvestment schemes managed by the Company. Commission and related income are recognized on accural basis.
Profit on bank deposits and on investments are recognized on an accrual basis at effective interest rates. Premium or discount onacquisition of investments is amortized through the statement of profit or loss account over the remaining period till maturity usingthe effective interest method.
4.9.4 Dividend income
4.9.5 Gain / (loss) on sale of investments - net
4.10 Provisions
4.11 Offsetting of financial assets and liabilities
4.12 Basic and diluted earnings per share
The Company presents basic and diluted earnings per share (EPS) for its shareholders. Basic EPS is calculated by dividing thestatement of profit or loss attributable to ordinary shareholders of the Company by the weighted average number of ordinary sharesoutstanding during the year. Diluted EPS is determined by adjusting the statement of profit or loss attributable to ordinaryshareholders and the weighted average number of ordinary shares outstanding for the effects of dilutive potential ordinary shares, ifany.
Dividend income is recognized when the right to receive the dividend is established.
Gains / (losses) arising on sale of investments are included in the statement of profit or loss account on the date at which thetransaction takes place.
Provisions are recognised when the Company has a present legal or constructive obligation as a result of past events, it is probablethat an outflow of resources embodying economic benefits will be required to settle the obligation and a reliable estimate of theamount can be made. Provisions are reviewed at each balance sheet date and adjusted to reflect current best estimate.
Financial assets and financial liabilities are only offset and the net amount reported in the balance sheet when there is a legallyenforceable right to set off the recognised amount and the Company intends to either settle on a net basis, or to realise the assetand settle the liability simultaneously.
4.13 Proposed dividends and transfers between reserves
4.14 Foreign currency transactions
4.15 Commitments
4.16 Segment reporting
Foreign currency transactions are translated into the functional currency using the exchange rates prevailing on the dates oftransactions. Foreign exchange gains and losses resulting from the settlement of such transactions and from the translation at year-end exchange rates of monetary assets and liabilities denominated in foreign currencies are recognized in the statement of profit orloss account.
Commitments are disclosed in the financial statements at committed amounts. Commitments denominated in foreign currencies areexpressed in Rupee terms at the rates of exchange prevailing at the reporting date.
An operating segment is a component of the Company that engages in business activities from which it may earn revenues andincur expenses that relates to transactions with any of the other components of the Company.
any.
Dividends declared and transfers between reserves made subsequent to the reporting date are considered as non-adjusting eventsand are recognized in the financial statements in the period in which such dividends are declared / transfers are made.

Annual Report 2021MCB - Arif Habib Savings and Investments Limited 62
NOTES TO THE FINANCIAL STATEMENTS FOR THE YEAR ENDED 30 JUNE 2021
5 FIXED ASSETS Note 2021 2020
Property and equipment 5.1 25,660,653 45,363,804
Right-of-use assets 5.2 47,018,584 60,884,879
Intangible assets 5.3 284,280,323 295,498,678
Capital work in progress 5.4 1,830,339 -
358,789,899 401,747,361
5.1 Property and equipment
Note
As at 1 July 2020
Cost 55,234,935
28,793,272
17,221,864
45,978,793
4,237,270
151,466,134
Accumulated depreciation (35,925,068)
(21,960,664)
(9,542,085)
(24,138,932)
(1,328,060)
(92,894,809)
Accumulated impairment losses -
(561,390)
(3,248,387)
(9,397,744)
-
(13,207,521)
Net book value 19,309,867
6,271,218
4,431,392
12,442,117
2,909,210
45,363,804
Year ended 30 June 2021
Opening net book value 19,309,867
6,271,218
4,431,392
12,442,117
2,909,210
45,363,804
Additions during the year 7,118,523
1,637,661
1,675,844
893,694
-
11,325,722
Disposals during the year
Cost (951,394)
(11,178,668)
(10,715,340)
(13,002,140)
-
(35,847,542)
Accumulated depreciation 948,407
8,741,313
5,964,183
7,130,213
-
22,784,116
Accumulated impairment losses 561,390
2,522,470
2,838,280
-
5,922,140
(2,987)
(1,875,965)
(2,228,687)
(3,033,647)
-
(7,141,286)
Write offs during the year
Cost -
-
-
(20,481,412)
-
(20,481,412)
Accumulated depreciation -
-
-
15,713,175
-
15,713,175
5.1.1 -
-
-
(4,768,237)
-
(4,768,237)
Depreciation for the year (9,390,637) (2,454,893) (1,713,821) (4,502,520) (1,057,479) (19,119,350)
Closing net book value 17,034,766 3,578,021 2,164,728 1,031,407 1,851,731 25,660,653
As at 30 June 2021
Cost 61,402,064 19,252,265 8,182,368 13,388,935 4,237,270 106,462,902 Accumulated depreciation (44,367,298) (15,674,244) (5,291,723) (5,798,064) (2,385,539) (73,516,868) Accumulated impairment losses - - (725,917) (6,559,464) - (7,285,381) Net book value 17,034,766 3,578,021 2,164,728 1,031,407 1,851,731 25,660,653
Depreciation rates (% per annum) 25% 20% - 50% 10% 10% 25%
As at 1 July 2019
Cost 50,316,668
28,800,538
18,742,110
77,725,699
1,794,000
177,379,015
Accumulated depreciation (28,563,408)
(17,892,956)
(5,263,945)
(18,215,474)
(523,250)
(70,459,033)
Accumulated impairment losses -
-
(3,008,277)
(27,237,796)
-
(30,246,073)
Net book value 21,753,260
10,907,582
10,469,888
32,272,429
1,270,750
76,673,909
Year ended 30 June 2020
Opening net book value 21,753,260
10,907,582
10,469,888
32,272,429
1,270,750
76,673,909
Additions during the year 5,996,985
13,000
-
532,868
2,443,270
8,986,123
Disposals during the year
Cost (1,078,718)
(20,266)
(1,520,246)
(32,279,774)
-
(34,899,004)
Accumulated depreciation 1,061,888
20,266
406,097
10,301,442
-
11,789,693
Accumulated impairment losses -
-
630,158
20,678,332
-
21,308,490
(16,830)
-
(483,991)
(1,300,000)
-
(1,800,821)
Impairment during the year -
(561,390)
(870,267)
(2,838,280)
-
(4,269,937)
Depreciation for the year (8,423,548)
(4,087,974)
(4,684,238)
(16,224,900)
(804,810)
(34,225,470)
Closing net book value 19,309,867
6,271,218
4,431,392
12,442,117
2,909,210
45,363,804
As at 30 June 2020Cost 55,234,935
28,793,272
17,221,864
45,978,793
4,237,270
151,466,134
Accumulated depreciation (35,925,068)
(21,960,664)
(9,542,085)
(24,138,932)
(1,328,060)
(92,894,810)
Accumulated impairment losses -
(561,390)
(3,248,387)
(9,397,744)
-
(13,207,521)
Net book value 19,309,867
6,271,218
4,431,392
12,442,117
2,909,210
45,363,804
Depreciation rates (% per annum) 25% 20% - 50% 10% 10% 25%
(Rupees)
2021
Computers Office
equipments
Furniture and
fixtures
Leasehold
improvements
Vehicles Total
------------------------------------------------------------- (Rupees) --------------------------------------------------------------
------------------------------------------------------------- (Rupees) -------------------------------------------------------------
2020
Computers Office equipments
Furniture and fixtures
Leasehold improvements
Vehicles Total

Annual Report 2021MCB - Arif Habib Savings and Investments Limited 63
NOTES TO THE FINANCIAL STATEMENTS FOR THE YEAR ENDED 30 JUNE 2021
5.1.1
5.1.2 There were no disposal of fixed asset which has a book value of five hundred thousand rupees or more.
5.1.3
5.2 Right of use assets Note 2021 2020
Opening balance 60,884,879 -
Effect of initial adoption of IFRS 16 as at 01 July -
30,513,482
Additions during the year 22,768,921 57,445,375Amortization cost charged to profit and loss account 5.2.1 (30,937,453) (27,073,978)Effect of modification (1,825,359) -
Effect of termination (3,872,404) -
Closing balance 5.2.2 47,018,584 60,884,879
5.2.1 Allocation of amortization of right of use asset:
Administrative expenses 24 17,783,772 10,348,204
Selling and distribution expenses 25 13,153,681 16,725,774
30,937,453 27,073,978
5.2.2 These are being amoritsed upto 31 March 2024.
5.3 Intangible assets
As at 1 July 2020
Cost 82,473,074 82,126,933 192,000,000 356,600,007
Accumulated amortization (61,101,329) - - (61,101,329)
Net book value 21,371,745 82,126,933 192,000,000 295,498,678
Year ended 30 June 2021
Opening net book value 21,371,745 82,126,933 192,000,000 295,498,678
Additions during the year 560,743 - - 560,743
Amortization for the year (11,779,098) - - (11,779,098)
Closing net book value 10,153,390 82,126,933 192,000,000 284,280,323
As at 30 June 2021
Cost 83,033,817 82,126,933 192,000,000 357,160,750
Accumulated amortization (72,880,427) -
-
(72,880,427)
Net book value 10,153,390 82,126,933 192,000,000 284,280,323
Amortization rates (% per annum) 25% - 33%
As at 1 July 2019
Cost 82,095,045
82,126,933
192,000,000
356,221,978
Accumulated amortization (47,937,250)
-
-
(47,937,250)
Net book value 34,157,795
82,126,933
192,000,000
308,284,728
Year ended 30 June 2020
Opening net book value 34,157,795 82,126,933 192,000,000 308,284,728
Additions during the year 378,029 -
-
378,029
Amortization for the year (13,164,079) -
-
(13,164,079)
Closing net book value 21,371,745 82,126,933 192,000,000 295,498,678
As at 30 June 2020
Cost 82,473,074 82,126,933 192,000,000 356,600,007
Accumulated amortization (61,101,329) -
-
(61,101,329)
Net book value 21,371,745 82,126,933 192,000,000 295,498,678
Amortization rates (% per annum) 25%
------------------------------------------- (Rupees) ------------------------------------ -------
------------------------------------------- (Rupees) ------------------------------------ ------
2020
Management rights
TotalGoodwillComputer software
Goodwill
(note 5.3.1)
The Company had closed its Lahore branch during the year; accordingly leasehold improvements at the branch having carryingvalue of Rs. 4.768 million have been written off.
Included in the cost of property and equipment (including computer softwares) are fully depreciated assets which are still in useaggregating to Rs. 91.70 million (2020: Rs. 66.39 million).
Computer
software
Management
rights
(note 5.3.1)
Total
(Rupees)
2021

Annual Report 2021MCB - Arif Habib Savings and Investments Limited 64
NOTES TO THE FINANCIAL STATEMENTS FOR THE YEAR ENDED 30 JUNE 2021
5.3.1
5.3.2
5.3.3
5.3.4 Key assumptions used to determine the recoverable amounts
5.4
6 LONG-TERM INVESTMENTSNote 2021 2020
Investments in units of pension schemes - related parties
Financial assets at fair value through profit or loss 6.1 638,596,952
533,563,426
6.1 Financial assets at fair value through profit or loss
Pakistan Pension
Fund 805,305 -
805,305 266,239,774 311,872,289 45,632,515 245,136,795 266,239,774 21,102,979
Alhamra Islamic
Pension Fund 876,129 -
876,129 267,323,652 326,724,663 59,401,011 241,679,389 267,323,652 25,644,263
533,563,426 638,596,952 105,033,526 486,816,184 533,563,426 46,747,242
This represents renovation work in progress at the branches.
Budgeted Cash flows
Discount Rate
(Rupees)
The recoverable amount for the purpose of assessing impairment of goodwill and management rights allocated to CGU is based on value in use.The calculations performed by the Company, are based on a five year plan approved for its business unit. Value in use is determined bydiscounting the estimated future cash flows to be generated from the continuing use of CGU, using a discount rate of 13.7% (2020: 17%) thatreflects current market assessment of the time value of money and the risk specific to the asset. The management believes this to be a suitabletime scale over which to review and consider annual performance before applying a fixed terminal value multiple of 6% (2020: 6%) to the finalyear cash flow of the detailed projections. Based on this exercise at 30 June 2021, the recoverable amount of CGU exceeded the carryingamount.
In accordance with the requirements of IFRS 3: 'Business combinations', an acquiree shall measure goodwill acquired in a business combination,subsequent to initial recognition at cost less accumulated impairment losses, if any. Goodwill acquired in a business combination and intangibleassets having indefinite useful life shall not be amortized, instead, they shall be tested for impairment annually, or more frequently if events orchanges in circumstances indicate that they might be impaired, in accordance with International Accounting Standard (IAS) 36: 'Impairment ofAssets'. In addition, goodwill acquired in a business combination and intangible assets having indefinite useful lives shall be allocated to each ofthe acquirer's cash-generating unit (CGU) or a group of cash-generating units if they can be attributed directly, or allocated on a reasonable andconsistent basis.
Goodwill and management rights amounting to Rs. 274.13 million arised pursuant to the merger of MCB AMC with and into Arif HabibInvestments Limited in 2011.
The calculation of recoverable amounts of Goodiwll and Management rights for the purpose of impairment testing was based on value in use,estimated using discounted cash flows. Key assumptions used in determining the value in use calculation were as follows:
As part of impairment testing, the management has assured reasonably that impact of possible changes in any of the aforementioned keyassumptions would not cause the carrying value amount to exceed its recoverable amount.
Long Term Growth Rate
How Determined
Estimated cash flows were based on past experience.
Discount rate of 13.7% was used in the calculation. This discount rate represents cost of capital determined using theCapital Asset Pricing Model (CAPM) approach.
Discounted cash flow projections for five years have been used and long term growth rate of 6% in perpetuity has beenassumed on the basis of the growth rate of cash flows during the explicit forecast period.
Growth rates of assets under management
Growth forecast is based on management's best estimates and also takes into account past trends.
Cost to income ratio for asset management business is based on management's best estimate and also takes intoaccount past trends.
Cost to income ratio
Assumptions
----------- (Number of units) ----------- --------------------------------- (Rupees) ---------------------------------
Name of the
Investee fund
As at 01
July 2020
Purchase /
Redemption
As at 30
June 2021Carrying
amount
As at 30 June 2021 As at 30 June 2020
Market value Unrealized gain
Carrying amount
(before
revaluation)
Market value Unrealized gain

Annual Report 2021MCB - Arif Habib Savings and Investments Limited 65
NOTES TO THE FINANCIAL STATEMENTS FOR THE YEAR ENDED 30 JUNE 2021
7 LONG-TERM LOANS AND PREPAYMENTS Note 2021 2020
Loans
Secured - Considered good
- to executives 7.1 4,306,289 4,376,577
Unsecured - Considered good
- to executives 7.2 5,875,024 2,562,374
- to other employees -
2,111
7.3 10,181,313 6,941,062
Less: current portion of loans 9 (1,869,422)
(1,176,024)
8,311,891 5,765,038
Prepayments
Prepaid commission 7.4 16,847,454 5,234,305
Less: current portion 10 (10,997,748) (3,936,755)
5,849,706 1,297,550
14,161,597 7,062,588
7.1
7.2
7.3
7.3.1 Reconciliation of carrying amount of loans to executives is as follows:
2021 2020
Opening balance 6,938,951 7,848,761
Disbursements during the year 5,006,400 349,000
Repayments made during the year (2,301,090) (1,867,568)
Interest income on loan 537,052 608,758Closing balance 10,181,313 6,938,951
7.4
8 RECEIVABLE FROM RELATED PARTIES 2021 2020
Unsecured - considered good
Pakistan Income Fund 18,431,896 12,485,626
MCB Pakistan Stock Market Fund 122,311,547 103,862,961 MCB Pakistan Sovereign Fund 34,215,894 35,992,189 Pakistan Capital Market Fund 7,643,048 8,529,951 Pakistan Pension Fund 8,524,272 8,593,459 Alhamra Islamic Pension Fund 5,176,771 4,634,002 Pakistan Cash Management Fund 12,243,674 12,610,282
Pakistan Income Enhancement Fund 22,733,982 22,110,177
Pakistan Sarmaya Mehfooz Fund 4,267,360 4,267,360
MCB Pakistan Asset Allocation Fund 37,456,312 41,939,488
MCB Cash Management Optimizer 64,482,664 71,598,618
MCB DCF Income Fund 137,055,740 138,483,978
Alhamra Islamic Money Market Fund (Formerly: MCB Pakistan Frequent Payout Fund) 4,532,405 5,003,898
Alhamra Islamic Stock Fund 23,772,572 19,117,825
Alhamra Islamic Asset Allocation Fund 15,909,125 17,380,198
Alhamra Islamic Income Fund 14,454,260 16,092,180
Alhamra Islamic Active Asset Allocation Fund - Plan I -
39,275
Alhamra Islamic Active Asset Allocation Fund - Plan II -
19,979
Alhamra Daily Dividend Fund 435,889 3,280,594
Al-Hamra Smart Portfolio 9,888 -
Other proposed fund -
1,000,000
533,657,299 527,042,040
Advisory fee on account of discretionary portfolio management
Adamjee Life Assurance Company Limited 10,279,237
10,403,985
8.1 & 8.2 543,936,536
537,446,025
8.1 The above amounts represents receivable on account of management fee, federal excise duty, sales tax on management fee, sales load,conversion cost, reimbursement of expenses, selling and marketing expenses and other expenses paid on behalf of the related parties. Thisincludes Federal Excise Duty (FED) amounting to Rs. 407.16 million (2020: Rs. 407.16 million) which are receivable from the funds / portfoliosunder its management. The matter is further explained in note 19.2 to the financial statements.
(Rupees)
(Rupees)
(Rupees)
This represents interest-free loans amounting to Rs. 5.875 million (2020: 2.562 million) for a period of 5 years given to executives as per theterms of employment for the purchase of motor vehicles.
This represents commission paid on the issuance of bachat units of different funds under the management of the Company. The commissionamount is amortized over the period of the contract, unless redeemed earlier, in which case it is charged off immediately. However, in this casecertain amount is also recovered from the investor.
Based on month end balances, the maximum aggregate balance of loans to executives outstanding at any time during the year was Rs. 10.55million (2020: Rs. 7.82 million).
This represents interest based housing finance loan amounting to Rs. 4.306 million (2020: 4.377) given to executives at the rate of 4.5% per annum for a period of 20 years secured against the mortgage of house.

Annual Report 2021MCB - Arif Habib Savings and Investments Limited 66
NOTES TO THE FINANCIAL STATEMENTS FOR THE YEAR ENDED 30 JUNE 2021
8.2
8.3
Note 2021 2020
Pakistan Income Fund 19,131,574
12,485,626
MCB Pakistan Stock Market Fund 122,311,547
103,862,961
MCB Pakistan Sovereign Fund 35,066,803
35,992,189
Pakistan Capital Market Fund 8,808,028
8,529,951
Pakistan Pension Fund 8,733,457
8,593,459
Alhamra Islamic Pension Fund 5,202,290
4,634,002
Pakistan Cash Management Fund 12,510,670
12,610,282
Pakistan Income Enhancement Fund 23,574,569
22,110,177
Pakistan Sarmaya Mehfooz Fund 4,267,360
4,267,360
MCB Pakistan Asset allocation Fund 42,848,019
41,939,488
MCB Cash Management Optimizer 67,133,009
71,598,618
MCB DCF Income Fund 138,344,648
138,483,978
Alhamra Islamic Money Markery (Formerly: MCB Pakistan Frequent Payout Fund) 5,414,394
5,003,898
Alhamra Islamic Stock Fund 25,530,153
19,117,825
Alhamra Islamic Asset Allocation Fund 21,506,032
17,380,198
Alhamra Islamic Income Fund 18,426,787
16,092,180
Alhamra Islamic Active Asset Allocation Fund - Plan I 31,332
39,275
Alhamra Islamic Active Asset Allocation Fund - Plan II 18,888
19,979
Alhamra Daily Dividend Fund 3,544,122
3,280,594
Al-Hamra Smart Portfolio 9,888
-
Other proposed fund 1,000,000
1,000,000
Adamjee Life Assurance Company Limited 15,233,390
10,403,985
9 LOANS AND ADVANCES
Secured - Considered good
Current portion of loans to employees 7 1,869,422 1,176,024
Advances - Considered good
Advances to employees -
561,930
Advances to suppliers and contractors 508,154
2,463,491 508,154
3,025,421
2,377,576
4,201,445
10 DEPOSITS, PREPAYMENTS AND OTHER RECEIVABLES
Security Deposits 75,000 1,776,960
Prepayments
Current portion of prepaid commission against bachat unit 7 10,997,748 3,936,755
Insurance 11,101,389 7,059,970
Maintenance 533,132 1,840,236
Service level agreement 5,180,110 2,355,162
Software license 179,374 611,252
Registration fee 534,556 1,000,000
Others 174,000 203,920
28,700,309
17,007,295
Other receivables
Advisory fee receivable on account of portfolio management 10.1 23,005,861 23,720,613
Commission receivable 4,217,311 -
Others 197,640 405,372
27,420,812 24,125,985
Provision against advisory fee receivable 10.2 (12,402,117) (12,402,117)
43,794,004 30,508,123
(Rupees)
Above balances are mark-up free and unsecured. These are not past due not impaired, except for the FED balancesmentioned in note 8.1.
The related parties from whom the maximum aggregate amount outstanding at any time during the year (month-endbalance) are as under:
10.1 The above amounts represents receivable on account of portfolio management fee, federal excise duty and sales tax. Thisincludes Federal Excise Duty (FED) amounting to Rs. 5.72 million (2020: Rs. 5.72 million) which are receivable from theportfolios under its management. The matter is further explained in note 19.2 to the financial statements.

Annual Report 2021MCB - Arif Habib Savings and Investments Limited 67
NOTES TO THE FINANCIAL STATEMENTS FOR THE YEAR ENDED 30 JUNE 2021
10.2 Movement in provision against advisory fee receivable Note 2021 2020
Opening balance 12,402,117 11,953,175
Provision made during the year 24 - 448,942Closing balance 12,402,117 12,402,117
11 ACCRUED MARK-UP
This represents mark-up receivable on bank deposits.
12 LEASE LIABILITY AGAINST RIGHT-OF-USE ASSETS
Lease Liabilities as on 01 July 60,646,047
-
Recognised on initial adoption of IFRS 16 -
80,949,581
Addition during the year 22,508,885
-
Interest expense 26 7,001,516
6,935,088
Rental payments (33,670,723)
(27,238,622)
Effect of modification (1,598,704)
Effect of termination (4,538,454)
-
Lease liabilities as on 30 June 50,348,567
60,646,047
Less: Current portion of lease liabilities (32,347,100)
(27,191,338)
Non Current portion of lease liabilities 18,001,467
33,454,709
12.1 Lease liabilities are payable as follows.
Minimum Lease Future Finance Present value
Payments Cost of Minimum
Not later than one year 36,357,777
4,010,677
32,347,100
Later than one year and not later than five years 18,814,995
813,528
18,001,467
55,172,772
4,824,205
50,348,567
Less: Current portion (32,347,100)
18,001,467
12.2 Above balances have been discounted at the rates ranging between 8.01% to 14.95% per annum.
Note 2021 2020
13 SHORT-TERM INVESTMENTS - related parties
Financial assets at fair value through profit or loss 13.1 685,758,449
661,620,881
13.1 Financial assets at fair value through profit or loss
MCB Cash Management Optimizer 5,469,446 42,456,645 (47,861,324) 64,767 6,528,287 6,538,775 10,488 550,457,568 551,483,644 1,026,076
MCB Pakistan Stock Market Fund 1,422,539 4,693,951 (4,701,100) 1,415,390 134,192,866 146,676,096 12,483,230 108,237,657 110,137,237 1,899,580
Alhamra Islamic Stock Fund -
2,164,502
-
2,164,502
25,000,000 24,437,229 (562,771) -
-
-
Pakistan Income Fund -
16,123,878
(8,971,450)
7,152,428
386,258,093 388,253,829 1,995,736 -
-
-
Alhamra Smart Portfolio -
1,200,000
-
1,200,000
120,000,000 119,852,520 (147,480) -
-
-
MCB DCF Income Fund -
9,344
(9,344)
-
-
-
-
-
-
-
MCB Pakistan Soverign Fund -
10,956
(10,956)
-
-
-
-
-
-
-
Pakistan Cash Management Fund -
2
(2)
-
-
-
-
-
-
-
Alhamra Islamic Money Market Fund -
18,763,729
(18,763,729)
-
-
-
-
-
-
-
Alhamra Daily Dividend Fund -
3,502,354
(3,502,354)
-
-
-
-
-
-
-
671,979,246 685,758,449 13,779,203 658,695,225 661,620,881 2,925,656
14 ADVANCE TAX - NET OF PROVISIONS Note 2021 2020
Advance tax 85,489,067
87,375,718
Income tax refundable 14.1 50,723,943
50,723,944
136,213,010
138,099,662
Provision for taxation for the year 29 (97,063,558)
(73,805,896)
39,149,452
64,293,766
14.1
15 CASH AND BANK BALANCES Note 2021 2020
Balances with banks in
- profit and loss sharing accounts 15.1 10,156,387
10,172,752
- current accounts 15.2 33,767,897
9,636,339
43,924,284
19,809,091
Cash in hand 4,822
5,500
43,929,106
19,814,591
15.1
(Rupees)
--------------------------------------------------- (Rupees) --------------------------------------- ------------
As at 30 June 2020
Carrying
value Market value Unrealized gain /
(loss)
Carrying value (before
revaluation)Market value Unrealized gain
As at 30 June 2021
These represent deposits made with various commercial banks carrying profit rates ranging between 6.52% to 6.9% (2020: 6.5% to 12.5%) per annum. These also include balances in accounts maintainedwith related parties; MCB Bank Limited amounting to Rs. 5.453 million (2020: Rs. 5.701 million) which carries mark-up at the rate of 5.5% (2020: 10%) per annum and MCB Islamic Bank Limited amountingto Rs. 0.340 million (2020: Rs. 0.327 million) which carries mark-up at the rate of 6.8% (2020: 10.38%) per annum.
Represents Income tax refundable as per the returns filed by the Company, except for the tax years 2010, 2011, 2017 and 2018, amounting to Rs. 27.9 million which is based on the assessment orders.
2021
(Rupees)
(Rupees)
Name of the Investee Fund
As at 01
July 2020
Purchases /
dividend
reinvested
Redemptions As at 30
June 2021
-------------- (Number of units / deals) ---------------
(Rupees)
15.2
15.3 During the year ended 30 June 2015, the Company had obtained a short-term running finance facility under mark up arrangement with MCB Bank Limited (a related party) amounting to Rs. 500 million. Thefacility carried mark-up at one month KIBOR+0.5% (2020: KIBOR+0.5%) per annum. The facility when availed will have to be secured against the pledge of government securities i.e. PIBs and T-Bills and willexpire on 31 August 2021. However, the facility was unutilized as at 30 June 2021 (none was utlised duriing the year).
These represent balances in accounts maintained with conventional banks and include amounts placed with MCB Bank Limited (a related party) amounting to Rs. 6.455 million (2020: Rs. 4.366 million).

Annual Report 2021MCB - Arif Habib Savings and Investments Limited 68
NOTES TO THE FINANCIAL STATEMENTS FOR THE YEAR ENDED 30 JUNE 2021
16 ISSUED, SUBSCRIBED AND PAID-UP CAPITAL
2021 2020 Note 2021 2020
Ordinary shares of Rs.10 each
5,000,000 5,000,000 - Fully paid in cash 50,000,000
50,000,000
31,000,000 31,000,000 - Allotted as bonus shares 310,000,000
310,000,000
36,000,000 36,000,000 - Issued for consideration other than cash 17.1 360,000,000
360,000,000
72,000,000 72,000,000 720,000,000
720,000,000
16.1 Shares held by the related parties of the Company 2021 2020
Particulars of the shareholders
MCB Bank Limited - percentage of holding 51.33% (2020: 51.33%) 36,956,768
36,956,768
Arif Habib Corporation Limited - percentage of holding 30.09% (2020: 30.09%) 21,664,167
21,664,167
Adamjee Insurance Company Limited - percentage of holding 7.59% (2020: 7.59%) 5,462,000
5,462,000
Directors, spouses and their minor children - percentage of holding 0.04% (2020: 0.04%) 29,326
29,326
Others 1,200
1,200
Note 2021 2020
17 DEFICIT ARISING ON AMALGAMATION
Deficit arising on amalgamation 17.1 60,000,000 60,000,000
17.1
18 DEFERRED TAX LIABILITY - NET Note 2021 2020
Deferred tax liability on taxable temporary differences- Intangible assets 75,190,106 64,613,575 - Right-of-use asset 13,635,390 19,291,940 - Investments at fair value through profit or loss 1,768,869 (391,359)
90,594,365
83,514,156
Deferred tax asset on deductible temporary differences
- Property and equipment (other than right of use assets) (4,328,055)
(5,523,312) - Provision against advisory fee (3,596,614)
(3,596,614)
- Finance cost on interest free loans (891,989)
992,105 - Liability against right-of-use asset (14,601,085)
(19,417,773)
(23,417,743)
(27,545,594)
18.1 67,176,622
55,968,562
18.1 Movement of deferred tax liability - net
Balance as at
1 July 2019
Recognized in
profit and loss
account during
the year ended
30 June 2020
Balance as at 30
June 2020
Recognized in
profit and loss
account during
the year ended
30 June 2021
Balance as at 30
June 2021
Taxable temporary
differences
- Intangible assets 56,787,409
7,826,166
64,613,575
10,576,531
75,190,106
- Right-of-use assets -
19,291,940
19,291,940
(5,656,550)
13,635,390
- Investments at fair value through profit or loss (4,939,642)
4,548,283
(391,359)
2,160,228
1,768,869
51,847,767
31,666,389
83,514,156
7,080,209
90,594,365
Deductible temporary
differences
- Property and equipment (other than right
of use assets) (5,046,559)
(476,753)
(5,523,312)
1,195,257
(4,328,055)
- Provision against advisory fee (3,466,421)
(130,193)
(3,596,614)
-
(3,596,614)
- Finance cost on interest free loans (992,105)
1,984,210
992,105
(1,884,094)
(891,989)
- Lease liability against right of use assets - (19,417,773) (19,417,773) 4,816,688 (14,601,085)
42,342,682 13,625,880 55,968,562 11,208,060 67,176,622
18.2 Deferred tax balance has been recognized at the rate at which these are expected to be settled or realized.
--------------------------------------------------------------- (Rupees) --------------------------------------------------------------
(Number of shares) (Rupees)
(Number of shares)
(Rupees)
(Rupees)
2021
In accordance with the scheme of amalgamation of MCB Asset Management Company Limited (MCB AMC) and Arif HabibInvestments Limited (AHIL), the entire undertaking of MCB AMC including all properties, assets, liabilities, receivables, payablesand all other rights and obligations were transferred into and vested in the Company as on the effective date. As part of theScheme, the Company issued and allotted 36 million ordinary shares of Rs. 10 each, as fully paid shares, to the registeredordinary shareholders of MCB AMC in the ratio of 1.2 ordinary shares of the Company for each share of Rs. 10 of MCB AMC asconsideration. Deficit arising on amalgamation represents difference in share capital of AHIL and MCB AMC at the time ofmerger.

Annual Report 2021MCB - Arif Habib Savings and Investments Limited 69
NOTES TO THE FINANCIAL STATEMENTS FOR THE YEAR ENDED 30 JUNE 2021
19 TRADE AND OTHER PAYABLES Note 2021 2020
Accrued expenses 123,429,377
106,891,203
Workers' welfare fund 19.1 48,669,050
38,769,050
Withholding tax payable 2,958,091
1,573,528
Indirect taxes and duties payable 19.2 419,057,465
422,580,282
Payable to facilitators / distributors 56,069,206
23,862,303
650,183,189
593,676,366
19.1 Workers' welfare fund
19.2 Federal Excise Duty (FED) payable on remuneration of the management company
20 CONTINGENCIES AND COMMITMENTS
20.1
20.2
20.3
(Rupees)
However, out of abundant caution, the management has decided to provide for SWWF amounting to Rs. 48.7 million (2020: 38.8 million) with
effect from 01 July 2014.
In light of the judgment passed by the Supreme Court, the Management believes that the Company is not liable to pay any amounts under the
Workers' Welfare Fund Ordinance, 1971, accordingly an amount of Rs. 14.442 million was reversed on 12 January 2017. Further, as aconsequence of the passage of 18th Amendment to the Constitution, levy for Workers' Welfare was also introduced by the Government ofSindh (SWWF) which was effective from 01 July 2014. The Company believes that contribution to Workers' Welfare Fund under the SindhWorkers' Welfare Act, 2014 is not applicable on the Company as it is not a Financial Institution as required under SWWF Act, 2014.
The Supreme Court of Pakistan vide its order dated 10 November 2016 has held that the amendments made in the law introduced by the
Federal Government for the levy of Workers' Welfare Fund were not lawful as this is not in the nature of tax and therefore could not havebeen introduced through the money bill. The Federal Board of Revenue has filed review petitions against the above judgment which arecurrently pending with the Supreme Court of Pakistan.
Through Finance Act, 2008, the Federal Government introduced amendments to the Workers' Welfare Fund (WWF) Ordinance, 1971
whereby the definition of industrial establishment was extended. The amendments were challenged at various levels and conflictingjudgments were rendered by the Lahore High Court, Sindh High Court and Peshawar High Court. Appeals against these orders were filed inthe Supreme Court.
As per the requirements of the Finance Act, 2013, Federal Excise Duty (FED) at the rate of 16% on the remuneration of the Management
Company has been applied effective 13 June 2013 on assets under its management (related parties). The Management company is of theview that since the remuneration is already subject to the provincial sales tax, further levy of FED may result in double taxation, which doesnot appear to be the spirit of law.
The matter has been collectively taken up by the Management Company jointly with other Asset Management Companies together with their
respective Collective Investment Schemes through their trustees, through a Constitutional Petition filed in the Honorable Sindh High Court(SHC) on 4 September 2013 challenging the levy of FED. The Sindh High Court in its decision dated 16 July 2016 maintained the previousorder passed against other constitutional petition whereby levy of FED has been declared to be 'Ultra Vires' the Constitution. The DeputyCommissioner Inland Revenue has filed an appeal against the said SHC order in the Honorable Supreme Court of Pakistan and thus theCompany is carrying liability for Federal Excise Duty (FED) amounting to Rs. 412.88 million (2020: Rs. 412.88 million) as a matter ofabundant caution. This amount has also been classified as a balance receivable from related parties and portfolios (in nots 8.1 amounting toRs. 407.16 million and note 10.1 amounting to Rs. 5.72 million respectively) and would be payable only after final verdict as explained above.
On 30 January 2017, the Additional Commissioner Inland Revenue [ACIR] passed an order under section 122(5A) of the Income Tax
Ordinance, 2001 amending the assessment for tax year 2011 after making certain additions / disallowances in the profit or loss account andcreated a demand of Rs. 25.567 million. The disallowances mainly pertained to apportionment of expenses, management / processing feeand related income sharing, amortization of management rights / goodwill created on merger of the MCB Asset Management Company (MCBAMC) into the Company etc. The Company filed an appeal before the Commissioner Inland Revenue – Appeals [CIR-A] against theimpugned order and notice of demand issued there against. The CIR-A annulled the Order of the ACIR by deleting demand on all the issuesraised therein. An appeal against the order of CIR-A has been filed before the Appellate Tribunal Inland Revenue [ATIR] by the CommissionerInland Revenue. The Company, in consultation with its tax advisor, is confident of a favourable outcome.
The Punjab Revenue Authority issued a show cause notice no. PRA/AM.70/14/18 dated 20 June 2014 requiring the Company to pay Sales
Tax under the Punjab Sales Tax on Services Act, 2012 with effect from 22 May 2013 on management fee earned in Punjab. The matter hasbeen collectively taken up by the Management Company jointly with other Asset Management Companies together with their respectiveCollective Investment Schemes through their trustees, by filing a petition on 08 July 2014 in the Sindh High Court (SHC) challenging theabove notice. The SHC has ordered suspension of the show cause notice till the next hearing of appeal in its Order dated 10 July 2014. Themanagement is expecting no outflow of economic resources as the payment relating to sales tax has already been made to Sindh RevenueBoard and in case the decision is made against the Company the same is required to be settled between the two authorities.
The case of the Company was selected for audit by the Commissioner Inland Revenue, Zone III, Large Taxpayers Unit, Karachi for tax year
2014 vide letter dated 09 November 2016. The audit proceedings were conducted by the Deputy Commissioner Inland Revenue [DCIR] and aShow-Cause Notice [SCN] dated 10 February 2017 was issued thereafter. Based on a (then) recent judgment of a superior court, the SCNwas challenged on legal grounds. However, the DCIR did not agree with the legal objections raised and passed an order dated 24 March2017 under section 122(1) of the Income Tax Ordinance, 2001 after making certain additions / disallowances in the statement of profit or lossaccount and created a demand of Rs. 93.398 million The disallowances mainly pertained to apportionment of expenses, management /processing fee and related income sharing, amortization of management rights / goodwill created on merger of the MCB AMC into theCompany etc. An appeal before the CIR-A was filed by the Company which has been adjudged in favor of the Company in respect of major

Annual Report 2021MCB - Arif Habib Savings and Investments Limited 70
NOTES TO THE FINANCIAL STATEMENTS FOR THE YEAR ENDED 30 JUNE 2021
disallowances made in the Order of the DCIR. In respect of the matters confirmed by the CIR-A, the Company has filed an appeal before theATIR. For issues deleted / set-aside by the CIR-A, an appeal has also been filed by the Commissioner Inland Revenue before the ATIR. TheCompany, in consultation with its tax advisor, is confident of a favourable outcome in respect of th e said appeals.
20.4
20.5
20.6
20.7
20.8
20.9
20.10
On 24 November 2017, the Company received two orders pertaining to tax years 2015 and 2016 passed by the ACIR and DCIR raising
demands of Rs. 119.350 million and Rs. 142.008 million respectively. The disallowances mainly pertained to apportionment of expenses,management / processing fee and related income sharing, amortization of management rights / goodwill created on merger of the MCB AMCinto the Company, treatment of provision for FED as income of the Company etc. The Company filed separate appeals before the CIR-Aagainst the impugned orders and notices of demand issued there against. During the year ended 30 June 2018, orders of CIR-A werereceived against the said appeals. For issues decided against the Company, appeals before the ATIR have been filed by the Company. TheCompany, in consultation with its tax advisor, is confident of a favourable outcome in respect of th e said appeals.
On 29 February 2016, the DCIR passed an order under section 122(1) of the Income Tax Ordinance, 2001 relating to the tax year 2010 of
MCB AMC making certain additions / disallowances in the return. The Company filed an appeal before the CIR-A against the said order. TheCIR-A vide order dated December 11, 2017 deleted the disallowances made by the DCIR. Subsequently, the ACIR relating to tax year 2010of MCB AMC treated tax deduction under section 153(1)(b) on service as minimum tax creating demand of Rs 0.980 million on 04 May 2016.The Company filed an appeal before CIR-A. The CIR-A vide order dated 22 January 2018 has confirmed the treatment of ACIR. TheCompany has filed an appeal before the ATIR against the order of CIR-A. The Company, in consultation with its tax advisor, is confident of afavourable outcome in respect of the said appeals.
On 29 April 2017, a notice under section 122(9) of the Income Tax Ordinance, 2001 was issued by the ACIR to conduct the amendment of
assessment proceedings for tax year 2011 of the pre-merger entity MCB AMC. On 03 July 2017 an order under section 122(5A) of theIncome Tax Ordinance, 2001, was passed to conclude the said proceedings. A demand of Rs. 4.85 million has been raised by the ACIR bymaking disallowances mainly pertaining to apportionment of expenses, management / processing fee and related income sharing anddisallowance of brought forward losses. The Company has filed an appeal before the CIR-A against the impugned order and notice ofdemand issued there against. During the year ended 30 June 2018, order of the CIR-A was received by the Company whereby the demandon major issues was deleted. In respect of the matters confirmed by the CIR-A, the Company has filed an appeal before the ATIR. For issuesdeleted / set-aside by the CIR-A, an appeal has also been filed by the Commissioner Inland Revenue before the ATIR. The Company, inconsultation with its tax advisor, is confident of a favourable outcome in respect of the said appeals.
On 29 March 2017, the ACIR passed an order under section 122(5A) of the Income Tax Ordinance, 2001 amending the assessment for tax
year 2012 after making certain additions / disallowances in the statement of profit or loss account and created a demand of Rs. 82.841million. The disallowances mainly pertained to apportionment of expenses, management / processing fee and related income sharing,amortization of management rights / goodwill created on merger of the MCB AMC into the Company, disallowance of brought forward losses /refunds of prior periods etc. The Company filed an appeal before the CIR-A against the impugned order and notice of demand issued thereagainst. The CIR-A annulled the Order of the ACIR by deleting demand on all the issues raised therein. An appeal against the order of theCIR-A has been filed before the ATIR by the Commissioner Inland Revenue. The Company, in consultation with its tax advisor, is confident ofa favourable outcome in respect of the said appeals.
The DCIR vide notice dated 6 March 2020 issued under section 182 of the Income Tax Ordinance, 2001 initiated proceedings for levy of
penalty of Rs. 2.97 million for alleged failure to furnish the return under section 114 by due date. The Company have submitted its reply in
During the year ended 30 June 2019, the Sindh Revenue Board has issued two orders dated 03 October 2018 and 10 October 2018 raising a
demand of Sindh Sales Tax Rs. 3.8 million and 1.2 million along with penalty of Rs. 4.04 million and Rs. 1.4 million respectively wherein inputtax claimed by the Company against various transactions has been disallowed by the assessing Officer on the ground that the output taxagainst the same has not been offered by the respective vendors. Appeals against the aforesaid both orders have been filed before theCommissioner Appeals, SRB which is still pending. On the basis of factual and legal grounds, the Company in consultation with its taxconsultant anticipates a favorable outcome of the aforesaid appeal.
On 05 June 2017, the Company received an order passed by the Assistant Commissioner - Sindh Revenue Board [AC,SRB] wherein a
demand of Sindh Sales Tax of Rs.10.62 million along with penalty of Rs. 6.33 million and default surcharges (to be calculated at the time ofpayment) was established for short levy and payment of Sindh Sales Tax on its services and for claiming inadmissible input tax during taxperiods from July 2011 to June 2015. An appeal against the aforesaid order was filed before the Commissioner Appeals-SRB who upheld theorder of the Assistant Commissioner, SRB in its appellate order. An appeal had filed before the Appellate Tribunal, SRB against aforesaidorder of the Commissioner Appeals, SRB. The Appellate Tribunal, SRB has remanded back the case to the Commissioner Appeals - SRB topass fresh speaking order after verifying the records on merit.
During the year ended 30 June 2021, Commissioner Appeals - SRB issued an Order on 28 June 2021 whereby the demand raised by ACSRB amounting to Rs. 10.62 million was comfirmed in totality. The Company, being aggreived with said order, filed appeal before theAppellate Tribunal, SRB against aforesaid order. The stay was granted by Appellate Tribunal on 06 July 2021. The Company in consultationwith its tax consultant anticipates a favourable outcome of the aforesaid appeal/case.
20.11
20.12
20.13 During the year ended 30 June 2021, the Sindh Revenue Board issued a Show Cause Notice on 15 April 2021 on account of short payment
of Sindh Sales Tax amounting to Rs. 9.97 million pertaining to Tax Periods July 2015 till June 2016. The Company in consultation with its taxconsultant anticipates a favourable outcome of the Show Cause.
The DCIR vide notice dated 17 January 2020 issued under section 161(1A) of the Income Tax Ordinance, 2001 initiated proceedings
regarding monitoring of withholding taxes pertaining to tax year 2018. Requisite details have been submitted to the department.
The DCIR vide notice dated 13 September 2018 issued under section 214D of the Income Tax Ordinance, 2001 requested for audit and
furnishing of detail, evidences and information. The Company have submitted its reply in consultation with its tax consultant for drop ofproceeding initiated under section 214D as the selection of audit was made after the provision of section 214D were ommitted by the FinanceAct 2018. The Company anticipates a favourable outcome of the aforesaid reply.
consultation with its tax consultant and anticipates a favorable outcome of the aforesaid reply.

Annual Report 2021MCB - Arif Habib Savings and Investments Limited 71
NOTES TO THE FINANCIAL STATEMENTS FOR THE YEAR ENDED 30 JUNE 2021
21 MANAGEMENT FEE / INVESTMENT Note 2021 2020
ADVISORY FEE
Collective Investment Schemes - related parties
MCB Cash Management Optimizer 113,905,358
107,718,466
MCB DCF Income Fund 68,375,349
75,210,236
MCB Pakistan Asset Allocation Fund 33,024,003
33,875,018
Alhamra Islamic Money Market Fund (Formerly: MCB Pakistan Frequent Payout Fund) 3,983,829
3,293,884
MCB Pakistan Sovereign Fund 13,246,798
51,430,415
MCB Pakistan Stock Market Fund 258,317,102
200,056,654
Pakistan Cash Management Fund 3,693,028
3,006,590
Pakistan Capital Market Fund 13,229,329
10,551,381
Pakistan Income Enhancement Fund 7,928,518
13,518,645
Pakistan Income Fund 50,679,459
30,545,698
Alhamra Islamic Income Fund 24,059,931
29,613,509
Alhamra Islamic Stock Fund 78,026,666
59,851,221
Alhamra Islamic Asset Allocation Fund 69,111,498
53,240,826
Alhamra Active Asset Allocation Fund Plan I 38,678
206,419
Alhamra Active Asset Allocation Fund Plan II 42,489
117,047
Alhamra Daily Dividend Fund 6,319,526
7,646,973
Alhamra Smart Portfolio Fund 3,297
-
743,984,858
679,882,982
Pension schemes - related parties
Alhamra Islamic Pension Fund 20,803,805 15,561,717
Pakistan Pension Fund 31,446,417 28,170,523
52,250,222 43,732,240 21.1 796,235,080 723,615,222
Investment advisory fee from discretionary and non discretionary
portfolio management 21.2 53,612,886 37,837,104
849,847,966
761,452,326
Less: Sindh sales tax (97,770,120)
(87,600,710)
752,077,846
673,851,616
21.1
21.2
22 PROFIT ON BANK DEPOSITS
This represents income earned under interest / mark-up arrangements with conventional and islamic banks.
23 REALIZED GAIN ON SALE OF INVESTMENTS - NET 2021 2020
Gain on redemption of units of collective investment schemes 49,793,111 67,277,271
(Rupees)
The Company is managing investments under discretionary and non discretionary portfolio management agreements.Investment advisory fee from the discretionary portfolios is calculated on a daily / monthly basis by charging specified rates tothe net asset value of the portfolios as stated in the respective agreements with the clients. Details of this portfolio are given innote 1.4 of these financial statements.
Management fee from open-end Collective Investment Schemes is calculated by charging the specified rates to the net assetvalue / income of such schemes as at the close of business of each calendar day. In accordance with Regulation 61 of theNBFC Regulations, 2008, the fee so charged to Collective Investment Schemes shall be within allowed expense ratio limit andshall not exceed the maximum rate of management fee as disclosed in the Offering Document.
(Rupees)

Annual Report 2021MCB - Arif Habib Savings and Investments Limited 72
NOTES TO THE FINANCIAL STATEMENTS FOR THE YEAR ENDED 30 JUNE 2021
24 ADMINISTRATIVE EXPENSES Note 2021 2020
Salaries, allowances and other benefits 311,881,716
271,073,192
Legal and professional charges 11,955,104
7,402,138
Travelling and conveyance charges 852,307
1,071,302
Rent, utilities, repairs and maintenance 51,254,987
70,938,970
Office supplies 4,241,423
1,058,741
Auditors' remuneration 24.2 3,346,303
3,333,567
Directors' meeting fee 10,275,000
6,150,000
Insurance 1,737,088
2,062,412
Depreciation on property and equipment 5.1 19,119,350
34,225,470
Depreciation on right of use assets 5.2.1 17,783,772
10,348,204
Amortization 5.3 11,779,098
13,164,079
Stamp duty and taxes 888,696
8,212,200
Registrar fee 679,234
551,253
Printing and stationery 4,026,744
4,878,539
Telephone expenses 5,002,793
4,497,172
Entertainment expenses 3,446,844
2,735,679
Books, periodicals and subscription 23,626,285
20,397,977
Provision against advisory fee receivable 10.2 -
448,942
Write off / impairment on property and equipment 5.1 4,768,237
4,269,937
486,664,981
466,819,774
Charged to the Collective Investment Schemes (CISs) 24.1 (63,229,639)
(51,653,673)
423,435,342 415,166,101
24.1
24.2 Auditors' remuneration Note 2021 2020
Audit fee 2,434,500 2,434,500 Half yearly review fee 348,000
348,000
Fee for the review of compliance with the best practices of the Code of
Corporate Governance 96,000
96,000 Out of pocket expenses 467,803
455,067
3,346,303
3,333,567
25 SELLING AND DISTRIBUTION EXPENSES
Salaries, allowances and other benefits 152,567,297 131,480,755 Commission expense 25.1 101,549,220 104,041,657 Marketing and other expenses 54,941,453 47,570,606 Depreciation on right of use assets 13,153,681 16,725,774 Other branches expenses 10,420,724 7,626,308 Printing and stationery 1,046,107 1,650,033
333,678,482 309,095,133
Charged to the Collective Investment Schemes (CISs) 25.2 (262,026,882) (244,253,823) 71,651,600 64,841,310
25.1 This includes an amount of Rs. 21.228 million (2020: Rs. 32.909 million) pertaining to MCB Bank Limited (a related party).
25.2 SECP vide its Circular 40/2016 dated 30 December 2016, prescribed certain conditions on Asset Management Companies(AMCs) for charging of selling and marketing expenses to open end equity, asset allocation and index funds initially for three years(from 01 January 2017 till 31 December 2019) for opening of new branches in cities, except Karachi, Lahore, Islamabad andRawalpindi. The said condition was amended through Circular No. 11 of 2019 dated 5 June 2019, according to which an AMCmay charge selling and marketing expenses to all types of open end mutual funds except for Fund of Funds against the costpertaining to opening and maintenance of all branches in all cities. Under this circular, expenses amounting to Rs. 262.027 million(2020: 244.254 million) have been charged by the Company to the respective Collective Investment Schemes (CISs) under itsmanagement during the year which is less than the actual related expenses.
(Rupees)
(Rupees)
The SECP vide S.R.O No. 1160 (1) / 2015 dated 25 November 2015 introduced amendments in the NBFC Regulations 2008. As aresult of these amendments, the management company may charge fees and expenses pertaining to registrar services,accounting, operations on Collective Investment Schemes up to a maximum of 0.1% of average annual net assets of the scheme.The maximum cap of 0.1% of average annual net assets was removed by SECP vide S.R.O No. 639 (1) / 2019. However theamount charged cannot be more than the related actual expenses. Accordingly, expenses amounting to Rs. 63.23 million (2020:Rs. 51.65 million) have been charged by the Company to the respective Collective Investment Schemes (CISs) under itsmanagement during the year.

Annual Report 2021MCB - Arif Habib Savings and Investments Limited 73
NOTES TO THE FINANCIAL STATEMENTS FOR THE YEAR ENDED 30 JUNE 2021
26 FINANCIAL CHARGES Note 2021 2020
Bank charges 442,031
1,301,942 Interest on lease liability against right-of-use assets 12 7,001,516
6,935,088
7,443,547
8,237,030
27 WORKERS' WELFARE FUND
Workers' welfare fund 9,900,000
7,000,000
28 OTHER INCOME AND OTHER EXPENSES
28.1 Other income:
Income from financial instruments
Liability no longer payable written back - 3,479,010 Interest income on housing finance loan 537,052 608,758
Income from non-financial instruments
Gain on disposal of fixed assets - net 2,461,340 - Others 442,997 841,521
3,441,389 4,929,289
28.2 Other expenses
Net loss on disposal of fixed assets - (104,219)
29 TAXATION
Current 100,510,480 73,458,995
Prior (3,446,922) 346,901
97,063,558 73,805,896
Deferred 18.1 11,208,060 13,625,880
29.1 108,271,618
87,431,776
29.1 Relationship between income tax expense and accounting profit
Accounting profit for the year before taxation 484,705,781 345,100,890
Tax at the applicable rate of 29% (2020: 29%) 140,564,676 100,079,258 Tax effect of income taxed at lower rate (37,251,820) (30,883,911)Inadmissible expenses 8,405,684 17,889,528 Prior year tax (3,446,922) 346,901
108,271,618 87,431,776
29.2
(Rupees)
The income tax returns upto tax year 2020 have been filed under the self assessment scheme and aredeemed to be finalized under section 120 of the Income Tax Ordinance, 2001. Deemed assessments forcertain tax years have been amended by the department on account of various issues as explained in note 20to the financial statements.

Annual Report 2021MCB - Arif Habib Savings and Investments Limited 74
NOTES TO THE FINANCIAL STATEMENTS FOR THE YEAR ENDED 30 JUNE 2021
30 EARNINGS PER SHARE
30.1 Basic
2021 2020
Profit for the year after taxation 376,434,163 257,669,113
Weighted average number of ordinary shares outstanding during the year 72,000,000 72,000,000
Basic earnings per share 5.23 3.58
30.2 Diluted
31 CASH AND CASH EQUIVALENTS Note 2021 2020
Cash and bank balances 15 43,929,106 19,814,591
32 REMUNERATION TO THE CHIEF EXECUTIVE OFFICER, DIRECTORS AND EXECUTIVES
Chief Executive
OfficerDirectors Executives
Chief Executive Officer
Directors Executives
Managerial remuneration 12,431,388 - 63,651,045 10,968,876 - 55,084,986
Year-end incentive 8,000,000 - 28,985,750 6,000,000 - 16,393,000
Rent and house maintenance 5,594,124 - 28,642,994 4,935,996 - 24,788,262
Car allowance 4,299,680 - 20,380,193 4,641,600 - 17,581,226
Utilities 1,243,140 - 6,365,133 1,096,884 - 5,508,495
Medical 1,243,140 - 6,365,037 1,096,884 - 5,508,495
Retirement benefits 1,104,249 - 5,514,234 915,264 - 4,550,557
Meeting fee - 10,275,000 - - 6,150,000 -
Others 647,890 - 2,209,654 470,201 - 1,853,054
34,563,611 10,275,000 162,114,040 30,125,705 6,150,000 131,268,075
Number of persons 1 8 27 1 7 21
The Company is also providing a personal secretary, servant and health insurance facilities to Vice Chairman.
Earnings per share has been computed by dividing profit after taxation for the year by the weighted average number of ordinaryshares outstanding during the year:
Diluted earnings per share has not been presented as the Company does not have any convertible instruments in issue as at 30June 2021 and 2020 which would have any effect on the earnings per share if the option to convert is exercised.
The aggregate amount charged in the financial statements for the remuneration including all benefits to the Chief Executive Officer,Directors and Executives of the Company is as follows:
Executive means an employee of a listed company other than the chief executive and directors whose basic salary exceeds Rs. 1.2million in a financial year. The chief executive officer and executives are also provided with medical facilities in accordance with theirentitlements.
Particulars
2021 2020
------------------------------------------------------------------ (Rupees) ------------------------------------------------------------------
(Rupees)
(Number of shares)
(Rupees)
(Rupees)

Annual Report 2021MCB - Arif Habib Savings and Investments Limited 75
NOTES TO THE FINANCIAL STATEMENTS FOR THE YEAR ENDED 30 JUNE 2021
33 OPERATING SEGMENTS
34 FINANCIAL INSTRUMENTS
Financial risk management objectives and policies
- Market risk
- Liquidity risk
- Credit risk
34.1 Market risk
Market risk comprises of three types of risk: currency risk, yield / interest rate risk and other price risk.
34.1.1 Currency risk
34.1.2 Yield / interest rate risk
Exposure to interest rate risk
The interest rate profile of the Company's interest-bearing financial instruments is as follows:
Variable rate instrument 2021 2020
Loans to employees 4,306,289
4,376,577
Bank balances (saving accounts) 10,156,387
10,172,752
14,462,676
14,549,329
Fixed rate instrument
The Company does not have any exposure to fixed rate financial instruments.
Cash flow sensitivity analysis for variable rate instruments
None of the Company's liabilities are subject to interest rate risk.
Market risk is the risk that the fair value or the future cash flows of a financial instrument may fluctuate as a result ofchanges in market prices (e.g. foreign exchange rates, interest rates, equity prices, etc.). The objective of market riskmanagement is to manage and control market risk exposures within acceptable parameters, while optimizing thereturns to shareholders.
The Company functions as a single operating segment. Income derived from the management fee of open-endcollective investment schemes and pension funds and that derived from the management of discretionary portfoliosaccount for 94% and 6% (2020: 96% and 4%) respectively of the total income earned during the year.
The Board of Directors of the Company has the overall responsibility for the establishment and oversight of theCompany's risk management framework. The Board of Directors is also responsible for developing and monitoring theCompany's risk management policies. The Company has exposure to the following risks from its use of financialinstruments:
A reasonably possible change of 100 basis points in interest rates at the reporting date would have increased /decreased the statement of financial position and statement of profit or loss account by Rs. 0.15 million (2020: Rs.0.15 million). The analysis assumes that all other variables remain constant.
(Rupees)
Yield / interest rate risk is the risk that the fair value or future cash flows of a financial instrument will fluctuate becauseof changes in market interest rates.
Currency risk is the risk that the fair value or future cash flows of a financial instrument will fluctuate because ofchanges in foreign exchange rates. Presently, the Company is not exposed to currency risk as all transactions arecarried out in Pak Rupees.
The Company’s policy is to manage market risk through diversification and selection of securities within specifiedlimits set by the Board of Directors.

Annual Report 2021MCB - Arif Habib Savings and Investments Limited 76
NOTES TO THE FINANCIAL STATEMENTS FOR THE YEAR ENDED 30 JUNE 2021
The Company's net exposure to interest rate risk, analysed by the earlier of contractual repricing o r maturity date is as follows:
On balance sheet financial instruments
Financial assets
Investments -
-
-
-
-
-
1,324,355,401 1,324,355,401
Loans 50,000 100,000 151,269 199,998 3,805,022 4,306,289 5,875,024 10,181,313
Long-term deposits -
-
-
-
-
-
4,994,903 4,994,903
Receivable from related parties -
-
-
-
-
-
543,936,536 543,936,536
Deposits and other receivables -
-
-
-
-
-
15,093,695 15,093,695
Accrued mark-up -
-
-
-
-
-
22,487 22,487
Cash and bank balances 10,156,387 -
-
-
-
10,156,387 33,772,719 43,929,106
10,206,387 100,000 151,269 199,998 3,805,022 14,462,676 1,928,050,765 1,942,513,441
Financial liabilities
Lease liability against right-of-use assets 1,139,685 6,349,093 8,980,401 15,877,921 18,001,467 50,348,567 -
50,348,567
Unclaimed dividend -
-
-
-
-
-
4,672,994 4,672,994
Trade and other payables -
-
-
-
-
-
179,498,583 179,498,583
1,139,685 6,349,093 8,980,401 15,877,921 18,001,467 50,348,567 184,171,577 234,520,144
On-balance sheet gap (a) * 9,066,702 (6,249,093) (8,829,132) (15,677,923) (14,196,445) (35,885,891) 1,743,879,188 1,707,993,297
Off-balance sheet gap (b) -
-
-
-
-
-
-
-
Total interest rate sensitivity
gap (a+b) 9,066,702 (6,249,093) (8,829,132) (15,677,923) (14,196,445) (35,885,891)
Cumulative interest rate
sensitivity gap 9,066,702 2,817,609 (6,011,523) (21,689,446) (35,885,891) (71,771,782)
On balance sheet financial instruments
Financial assets
Investments -
-
-
-
-
-
1,195,184,307 1,195,184,307
Loans 17,967 36,632 56,740 120,246 4,144,992 4,376,577 2,562,374 6,938,951
Long-term deposits -
-
-
-
-
-
5,289,229 5,289,229
Receivable from related parties -
-
-
-
-
-
537,446,025 537,446,025
Deposits and other receivables -
-
-
-
-
-
13,500,828 13,500,828
Accrued mark-up -
-
-
-
-
-
24,966 24,966
Cash and bank balances 10,172,752 -
-
-
-
10,172,752 9,641,839 19,814,591
10,190,719 36,632 56,740 120,246 4,144,992 14,549,329 1,763,649,568 1,778,198,897
Financial liabilities
Lease liability against right-of-use assets 282,676 6,431,592 6,732,901 13,744,169 33,454,709 60,646,047 -
60,646,047
Unclaimed dividend -
-
-
-
-
-
4,586,000 4,586,000
Trade and other payables -
-
-
-
-
-
130,753,506 130,753,506
282,676 6,431,592 6,732,901 13,744,169 33,454,709 60,646,047 135,339,506 195,985,553
On-balance sheet gap (a) * 9,908,043 (6,394,960) (6,676,161) (13,623,923) (29,309,717) (46,096,718) 1,628,310,062 1,582,213,344
Off-balance sheet gap (b) -
-
-
-
-
-
-
-
Total interest rate sensitivity
gap (a+b) 9,908,043 (6,394,960) (6,676,161) (13,623,923) (29,309,717) (46,096,718)
Cumulative interest rate
sensitivity gap 9,908,043 3,513,083 (3,163,078) (16,787,001) (46,096,718) (92,193,436)
* The on-balance sheet gap represents the net amounts of on-balance sheet items.
34.1.3 Price risk
Maturity over
six months to
one year
Maturity after
one year
Sub-
total
Particulars
Interest / mark-up bearing
TotalMaturity up to
one month
Maturity
over one
month to
three
months
Maturity over
six months to
one year
Maturity after
one year
2021
Sub-
total
------------------------------------------------------------------------------------------------------------------------------------------------------------- (Rupees) ---------------------------------------------------------------------------------------
Non-interest /
mark up bearing
------------------------------------------------------------------------------------------------------------------------------------------------------------- (Rupees) --------------------------------------------------------------------------------------
Maturity over
three months
to six months
2020
Particulars
Interest / mark-up bearing
Non-interest /
mark up bearingTotalMaturity up to
one month
Maturity over
one month to
three months
Maturity over
three months
to six months
Price risk is the risk that the fair value or future cash flows of a financial instrument will fluctuate as a result of changes in market prices (other than those arisingfrom interest rate risk or currency risk) whether those changes are caused by factors specific to the individual financial instrument or its issuer or factorsaffecting all similar financial instruments traded in the market.
The Company is exposed to price risk because of investments held by the Company in units of open-end collective investment schemes and pension fundsmanaged by the Company itself. The investments are marked to market based on the net assets value which are declared for each fund on a daily basis. Seniormanagement of the Company reviews these investments on a regular basis. Furthermore, the Investment Committee of the Company also reviews andapproves all significant investment decisions.

Annual Report 2021MCB - Arif Habib Savings and Investments Limited 77
NOTES TO THE FINANCIAL STATEMENTS FOR THE YEAR ENDED 30 JUNE 2021
34.2 Credit risk
The Company's financial assets are neither past due nor impaired as at the reporting date.
2021 2020
Financial assets Note
Investments 6 & 13 1,324,355,401 1,195,184,307
Long term deposits 4,994,903 5,289,229
Loans 7.3 10,181,313 6,938,951
Receivable from related parties 8 543,936,536 537,446,025
Deposits and other receivables 10 15,093,695 13,500,828
Accrued mark-up 22,487 24,966
Bank balances 15 43,924,284 19,809,091
1,942,508,619 1,778,193,397
As at 30 June As at 30 June Rating agency
2021 2020
MCB Cash Management Optimizer AA+(f) AA+(f) PACRA
MCB DCF Income Fund AA-(f) AA-(f) PACRA
Alhamra Islamic Income Fund AA-(f) AA-(f) PACRA
MCB Pakistan Sovereign Fund AA-(f) AA-(f) PACRA
Pakistan Cash Management Fund AA+(f) AA+(f) PACRA
Pakistan Income Enhancement Fund A+(f) A+(f) PACRA
Pakistan Income Fund A+(f) A+(f) PACRA
Alhamra Daily Dividend Fund AA-(f) AA-(f) PACRA
Alhamra Islamic Money Market Fund AA(f) - PACRA
Ratings of other Funds are not available.
Latest available ratings of banks with which deposits are kept are as follows:
Rating agency
BANK Short-term Long-term Short-term Long-term
MCB Bank Limited A1+ AAA A1+ AAA PACRA
Summit Bank Limited A-1 A- A-1 A- JCR-VIS
Faysal Bank Limited A1+ AA A1+ AA PACRA
MCB Islamic Bank Limited A1 A A1 A PACRA
Bank Alfalah Limited A1+ AA+ A1+ AA+ PACRA
Credit risk is the risk that a counterparty will fail to discharge an obligation and cause the other party to incur afinancial loss. The entire portfolio of financial assets of the Company (except for cash in hand) is subject to credit risk.However, the management believes that the Company's credit risk is minimal as major portion of financial assetscomprise investments in or receivables from its Funds under management which are financially sound.
The maximum exposure to credit risk before any credit enhancements at 30 June 2021 is the carrying amount of thefinancial assets as set out below:
(Rupees)
--------------------------------------------(Rating)--------------------------------------------
In case of 1% increase / decrease in the net asset values of the investments subject to price risk, the profit for theyear after taxation of the Company would be higher / lower by Rs. 13.244 million (2020: Rs. 11.952 million), othercomprehensive income for the year would be higher / lower by Rs. Nil (2020: Rs. Nil) and total comprehensiveincome for the year would be higher / lower by Rs. 13.244 million (2020: Rs. 11.952 million).
---------------------------------(Stability rating)--------------------------
As at 30 June 2021 As at 30 June 2020
Latest ratings of the Funds from which amounts are receivable or where the Company has invested in are as follows:
Annual Report 2021MCB - Arif Habib Savings and Investments Limited 78
NOTES TO THE FINANCIAL STATEMENTS FOR THE YEAR ENDED 30 JUNE 2021
34.3 Liquidity risk
Carrying
amount
Contractual cash
flows
Six months or
less
Six to twelve
months
One to Five
Years
Non-Derivative Financial liabilities
Lease liability against right-of-use assets 50,348,567
55,172,772
16,173,550
20,184,227
18,814,995
Trade and other payables 179,498,583
179,498,583
179,498,583
-
-
Unclaimed dividend 4,672,994
4,672,994
4,672,994
-
-
234,520,144
239,344,349
200,345,127
20,184,227
18,814,995
Carrying amount
Contractual cash flows
Six months or lessSix to twelve
monthsOne to Five Years
Non-Derivative Financial liabilities
Lease liability against right-of-use assets 60,646,047
70,465,840
20,251,773
13,595,669
36,618,398
Trade and other payables 130,753,506
130,753,506
130,753,506
-
-
Unclaimed dividend 4,586,000
4,586,000
4,586,000
-
-
195,985,553
205,805,346
155,591,279
13,595,669
36,618,398
35 RECONCILIATION OF MOVEMENTS OF LIABILITIES TO
CASH FLOWS ARISING FROM FINANCING ACTIVITIES Reserve
Balance as at 1 July 2020 60,646,047
4,586,000
494,695,426
559,927,473
Profit for the year -
-
376,434,163
376,434,163
Dividend declared during the year -
324,000,000
(324,000,000)
-
Dividend paid during the year -
(324,000,000) - (324,000,000)
Interest exepense on lease / addition 23,373,243
- - 23,373,243
Lease rental paid (33,670,723) - - (33,670,723)
Balance as at 30 June 2021 50,348,567 4,586,000 547,129,589 602,064,156
Reserve
Balance as at 1 July 2019 -
4,256,938
406,226,313
410,483,251
Profit for the year -
-
257,669,113
257,669,113 Dividend declared during the year -
169,200,000
(169,200,000)
-
Dividend paid during the year -
(168,870,938)
-
(168,870,938) Recognition of lease liability on adpotion of IFRS 16 87,884,669
-
-
87,884,669
Lease rental paid (27,238,622)
-
-
(27,238,622)
Balance as at 30 June 2020 60,646,047
4,586,000
494,695,426
559,927,473
36 FAIR VALUE OF FINANCIAL INSTRUMENTS
Fair value hierarchy
- Level 1
quoted prices (unadjusted) in active markets for identical assets or liabilities;
- Level 2
- Level 3
inputs for the asset or liability that are not based on observable market data (i.e. unobservable inputs) (level 3).
Unappropriated
profit
Lease liability
against right-of-
use assets
Total
Total
Lease liability against right-of-
use assets - Current
Unclaimed dividend
Unappropriated profit
Liabilities
-----------------------------------------------------------(Rupees) -------------------------------- ---------------
-----------------------------------------------------------(Rupees) -------------------------------- ----------------
Liquidity risk is the risk that the Company will encounter difficulty in meeting its financial obligations as they fall due. Liquidity risk arises because of the possibility that theCompany could be required to pay its liabilities earlier than expected or difficulty in raising funds to meet commitments associated with financial liabilities as they fall due.The Company’s approach to managing liquidity is to ensure, as far as possible, that it will always have sufficient liquidity to meet its liabilities when due, under bothnormal and stressed conditions, without incurring unacceptable losses or risking damage to the Company's reputation. Following are the contractual maturities of theCompany's financial liabilities (based on the remaining period to maturity):
inputs other than quoted prices included within level 1 that are observable for the asset or liability, either directly (i.e. as prices) or indirectly (i.e. derived from prices)(level 2); and
International Financial Reporting Standard 13, 'Fair Value Measurement' requires the Company to classify fair value measurements using a fair value hierarchy thatreflects the significance of the inputs used in making the measurements. The fair value hierarchy has the following levels:
The estimated fair value of all other assets and liabilities is considered not to be significantly different from carrying values as the items are either short-term in nature orare periodically repriced.
The fair values of investments in units of open-end collective investment schemes and pension schemes are based on the net assets value announced by the Companyat each reporting date.
Underlying the definition of fair value is the presumption that the Company is a going concern without any intention or requirement to curtail materially the scale of itsoperations or to undertake a transaction on adverse terms.
Fair value is the amount for which an asset could be exchanged, or liability settled, between knowledgeable willing parties in an arm's length transaction. Consequently,differences can arise between carrying values and fair value estimates.
2021
-----------------------------------------------------------(Rupees) -------------------------------- -------------------------
2020
-----------------------------------------------------------(Rupees) -------------------------------- -------------------------
2020
2021
Liabilities
Unclaimed
dividend

Annual Report 2021MCB - Arif Habib Savings and Investments Limited 79
NOTES TO THE FINANCIAL STATEMENTS FOR THE YEAR ENDED 30 JUNE 2021
On-balance sheet
financial instruments
Financial
assets at FVTPL
Amortised
cost
Other financial
liabilities
Total Level 1 Level 2 Level 3 Total
Financial assets
measured at fair value
Long-term investments 638,596,952
-
-
638,596,952
-
638,596,952
-
638,596,952
Short-term investments 685,758,449
-
-
685,758,449
-
685,758,449
-
685,758,449
1,324,355,401
-
-
1,324,355,401
Financial assets not
measured at fair value
Loans -
10,181,313
-
10,181,313
Long-term deposits -
4,994,903
-
4,994,903
Receivable from related parties -
543,936,536
-
543,936,536
Deposits and other receivables -
15,093,695
-
15,093,695
Accrued mark-up -
22,487
-
22,487
Cash and bank balances -
43,929,106
-
43,929,106
-
618,158,040
-
618,158,040
Financial liabilities not
measured at fair value
Unclaimed dividend - - 4,672,994 4,672,994
Trade and other payables - - 179,498,583 179,498,583
- - 184,171,577 184,171,577
On-balance sheet
financial instruments
Investments Loans and receivables
Other financial liabilities
Total Level 1 Level 2 Level 3 Total
Financial assets
measured at fair value
Long-term investments 533,563,426 - - 533,563,426 - 533,563,426 - 533,563,426 Short-term investments 661,620,881 - - 661,620,881 - 661,620,881 - 661,620,881
1,195,184,307 - - 1,195,184,307
Financial assets not
measured at fair value
Loans - 6,938,951 - 6,938,951
Long-term deposits - 5,289,229 - 5,289,229
Receivable from related parties -
537,446,025
- 537,446,025
Deposit and other receivables -
13,500,828
-
13,500,828
Accrued mark-up -
24,966
- 24,966
Cash and bank balances -
19,814,591
-
19,814,591
-
583,014,590
-
583,014,590
Financial liabilities not
measured at fair value
Unclaimed dividend -
-
4,586,000
4,586,000
Trade and other payables -
-
130,753,506
130,753,506 -
-
135,339,506
135,339,506
37 CAPITAL MANAGEMENT
The Company’s objectives when managing capital are:
The table below analyses financial instruments measured at the end of the reporting period by the level in the fair value hierarchy into which the fair valuemeasurement is categorized:
The Company sets the amount of capital in proportion to risk. The Company manages the capital structure and makes adjustments to it in the light of changesin economic conditions and the risk characteristics of the underlying assets. Currently, the Company is financing its operations through equity and workingcapital.
Carrying amount Fair value
-------------------------------------------------------------------------------------------------------- (Rupees) -------------------------------------------------------------------------------------
As at 30 June 2020
Carrying amount Fair value
-------------------------------------------------------------------------------------------------------- (Rupees) --------------------------------------------------------------------------------------
- to safeguard the entity's ability to continue as a going concern, so that it can continue to provide returns to shareholders and benefits to other stakeholders, and
- to provide an adequate return to shareholders by pricing products and services that commensurate with the level of risk.
The Company is subject to externally imposed minimum equity requirement laid down under the NBFC Rules, 2003 and the NBFC Regulation, 2008 forproviding asset management services and investment advisory services and is required to maintain Rs. 230 million equity.
As at 30 June 2021

Annual Report 2021MCB - Arif Habib Savings and Investments Limited 80
NOTES TO THE FINANCIAL STATEMENTS FOR THE YEAR ENDED 30 JUNE 2021
38 TRANSACTIONS WITH RELATED PARTIES
38.1 Transactions with related parties during the year
Name of the related party Relationship and Nature of transaction 2021 2020
percentage of (Rupees)
shareholding
MCB BANK LIMITED Parent company with Commission and other expenses 39,482,665
31,756,623
51.33% Holding Profit on bank deposits 1,100,072
3,404,504
Bank charges 418,768
485,751
Branch sharing expenses 2,918,040
2,918,040
Dividend paid 166,305,456
86,848,405
Rent as per rental agreement 3,600,000
-
MCB ISLAMIC BANK LIMITED Subsidiary of Profit on bank deposits 14,487
18,613
Parent Company
NISHAT REAL ESTATE DEVELOPMENT Group Company Rent expense 1,078,736
4,112,483
COMPANY (PVT) LIMITED of Parent Company
NISHAT MILLS Group Company Gain on disposal -
516,009
LIMITED of Parent Company
ADAMJEE LIFE ASSURANCE COMPANY Group Company Investment advisory fee 29,049,502
20,226,346
LIMITED of Parent Company Amount paid against life assurance 2,536,337
11,461,130
ADAMJEE INSURANCE COMPANY Group Company Amount paid against insurance 18,814,140
9,934,772
LIMITED of Parent Company Amount received against insurance claim -
6,420,084
Dividend paid 24,579,000
10,910,345
Rent Expense 20,535,625
11,165,000
Dolmen City REIT Group Company of Investment advisory fee -
94,521
Associated Company
ARIF HABIB CORPORATION LIMITED Associate with 30.09% Dividend paid 97,488,752 - Holding Company
MCB CASH MANAGEMENT OPTIMIZER Funds under Management fee 100,801,203
95,326,076
management Reimbursement of expenses 23,726,302
19,381,299 Selling and marketing -
34,991,563
Dividend Income 13,153,768
15,796,808
Investment in units 4,282,129,797
7,863,350,328
Redemption of units 4,831,992,057
7,547,710,761
MCB DCF INCOME FUND Funds under Management fee 60,509,157
66,557,731
management Share of sales load 2,388,612
118,131
Back end load 251,941
43,100
Reimbursement of expenses 4,033,944
4,437,182
Selling and marketing 15,732,381
13,977,559
Investment in units 1,014,790
442,543,174
Redemption of units 1,015,540
446,650,374
ALHAMRA ISLAMIC INCOME FUND Funds under Management fee 21,291,973
26,206,645
management Share of sales load 1,591,871
1,407,497
Reimbursement of expenses 6,704,743
3,308,333
Sharia fee paid on behalf of the fund 744,193
900,000
Investment in units -
31,849
Redemption of units -
32,257
Selling and marketing 8,123,665
4,316,985
Back end load 55,080
-
MCB PAKISTAN ASSET ALLOCATION Funds under Management fee 29,224,782
29,977,892
FUND management Share of sales load 377,845
335,456
Reimbursement of expenses 1,244,539
1,664,666
Selling and marketing 11,084,595
15,730,552
Back end load 16,391
2,069,071
Redemption of units -
64
ALHAMRA ISLAMIC MONEY MARKET Funds under Management fee 3,525,512
2,914,941
FUND (Formerly : Mcb Pakistan Frequent management Reimbursement of expenses 20,640
178,089
Payout Fund) Selling and marketing 164,905 1,201,220
MCB Bank Limited (MCB) holds 51.33% ordinary shares of the Company as at the year end. Therefore, all subsidiaries and associated undertakings of MCB arerelated parties of the Company. Other related parties comprise of Arif Habib Corporation Limited with a holding percentage of 30%, companies having commondirectorship, collective investment schemes and voluntary pension schemes managed by the Company, directors, key management personnel and their close familymembers and retirement benefit plan. Contributions for staff retirement benefits are made as per the service rules. Transactions with the key management personnel comprising of their remuneration and loans are as per the terms of employees. Other transactions are at agreed rates. Details of such transaction are as follows:
Share of sales load 76,186 5,590
Sharia fee paid on behalf of the fund 276,429 -
Investment in units 1,867,665,457 -
Redemption of units 1,867,631,544 -
Dividend Income 1,388,096 -
Other Expenses 3,732,839 -
Annual Report 2021MCB - Arif Habib Savings and Investments Limited 81
NOTES TO THE FINANCIAL STATEMENTS FOR THE YEAR ENDED 30 JUNE 2021
Name of the related party Relationship and Nature of transaction 2021 2020
percentage of (Rupees)
shareholding
ALHAMRA ISLAMIC STOCK FUND Funds under Management fee 69,050,147
52,965,681
management Share of sales load 826,405
554,402
Reimbursement of expenses 3,452,507
2,648,283
Selling and marketing 44,882,596
28,788,631
Sharia fee paid on behalf of the fund 744,193
900,000
Investment in units 25,000,000
MCB PAKISTAN SOVEREIGN FUND Funds under Management fee 11,722,829
45,513,643
management Share of sales load 23,323
1,156,141
Reimbursement of expenses 1,262,456
2,154,844
Investment in units 590,222
450,215,700
Redemption of units 590,660
455,932,455
Selling and marketing 1,767,439
3,014,366
MCB PAKISTAN STOCK MARKET FUND Funds under Management fee 228,599,206
177,041,287
management Share of sales load 4,874,861
1,226,379
Back end load -
6,744
Reimbursement of expenses 11,429,960
8,852,063
Selling and marketing 148,589,484
99,928,897
Investment in units 447,420,886
389,604,452
Redemption of units 465,000,000
565,369,324
PAKISTAN CAPITAL MARKET FUND Funds under Management fee 11,707,371
9,337,507
management Share of sales load 13,691
13,475
Reimbursement of expenses 469,096
466,875
Selling and marketing 3,879,305
5,382,242
PAKISTAN CASH MANAGEMENT FUND Funds under Management fee 3,252,880
2,660,699
management Reimbursement of expenses 1,164,125
1,513,060
Investment in units 84
250,600,798
Redemption of units 84
250,778,502
Share of sales load 39,924
-
PAKISTAN INCOME ENHANCEMENT Funds under Management fee 7,016,389
11,963,403
FUND management Share of sales load 160,951
333,362
Reimbursement of expenses 686,426
708,783
Investment in units - -
Redemption of units - 290 Selling and marketing 3,195,090 3,400,581
PAKISTAN INCOME FUND Funds under Management fee 44,849,079
27,031,592
management Share of sales load 3,723,810
353,082 Reimbursement of expenses 5,309,004
1,640,108
Selling and marketing 2,592,765
2,127,512
Investment in units 895,291,631
199,475,848
Redemption of units 512,317,732
200,746,301
Dividend Income 4,769,279
-
ALHAMRA ISLAMIC ASSET Funds under Management fee 61,160,617
47,115,774
ALLOCATION FUND management Share of sales load 1,107,389
1,349,715
Back end load 11,240,019
12,427,201
Reimbursement of expenses 2,442,063
2,355,788
Selling and marketing 19,427,449
25,798,000
Sharia fee paid on behalf of the fund 744,194
900,000
ALHAMRA ISLAMIC PENSION FUND Funds under Management fee 18,410,447
13,771,432
management Share of sales load 572,313
331,794
Contribution to fund on behalf of the employees 20,302,057
13,426,223
PAKISTAN PENSION FUND Funds under Management fee 27,828,686
24,929,665
management Share of sales load 671,739
239,490
Contribution to fund on behalf of the employees 6,970,224
4,591,244
AL-HAMRA ISLAMIC ACTIVE ASSET Funds under Management fee 34,228
182,671
ALLOCATION FUND PLAN-I management Reimbursement of expenses 148,370
436,573
AL-HAMRA ISLAMIC ACTIVE ASSET Funds under Management fee 37,600
103,580
ALLOCATION FUND PLAN-II management Reimbursement of expenses 143,106
324,256
AL-HAMRA SMART PORTFOLIO Funds under Management fee 2,918
-
management Reimbursement of expenses 6,590
-
Investment in units 120,000,000
-
ALHAMRA DAILY DIVIDEND FUND Funds under Management fee 5,592,499
6,767,233
management Dividend Income 276,963
1,044,144
Investment in units 350,235,419 479,741
Redemption of units 350,235,419 37,183,741
Reimbursement of expenses 985,766 1,752,767
Selling and marketing 2,587,207 5,614,242
Bank Charges 720,048 -
Share of sales load 63,029 -

Annual Report 2021MCB - Arif Habib Savings and Investments Limited 82
NOTES TO THE FINANCIAL STATEMENTS FOR THE YEAR ENDED 30 JUNE 2021
38.2 Amount outstanding at year end
Name of the related party Relationship and Nature of transaction 2021 2020
percentage of (Rupees)
shareholding
MCB BANK LIMITED Parent company with Bank balance 11,755,764
10,067,104
51.33% Holding Other payable 4,380,075
4,380,075
Commission payable 4,492,704
3,671,827
MCB ISLAMIC BANK LIMITED Subsidiary of Bank balance 519,878
327,330
Parent Company Mark-up receivable 1,212
1,353
ADAMJEE LIFE ASSURANCE Group Company
COMPANY LIMITED of Parent Company Advisory fee receivable 2,736,923
2,860,457
NISHAT REAL ESTATE DEVELOPMENT Group Company Rent Deposit -
784,326
COMPANY (PVT.) LTD. of Parent Company
MCB DCF INCOME FUND Funds under Remuneration receivable 5,605,112
6,340,288
management Sales Load Receivable 36,252
54,969
Receivable against reimbursement of expenses 330,685
374,058
Receivable against selling & marketing expenses 3,918,724
4,721,237
Back end load receivable 171,540
-
Federal excise duty on remuneration 99,060,437
99,060,437
Federal excise duty on sales load 27,932,990
27,932,990
MCB PAKISTAN ASSET ALLOCATION Funds under Remuneration receivable 2,158,536
2,355,138
FUND management Sales Load Receivable 16,558
246,077
Back end load receivable -
-
Receivable against reimbursement of expenses 80,913
104,210
Receivable against selling & marketing expenses -
4,033,759
Federal excise duty on remuneration 19,027,350
19,027,350
Federal excise duty on sales load 16,172,955
16,172,955
Funds under Remuneration receivable 9,201,283
10,470,848
management Receivable against reimbursement of expenses 995,781
2,187,907
Sales Load Receivable -
-
Receivable against selling & marketing expenses - 4,654,264
Federal excise duty on remuneration 54,266,812 54,266,812
Federal excise duty on sales load 18,788 18,788 Closing balance of investment in units 6,538,775 551,483,642
ALHAMRA ISLAMIC INCOME FUND Funds under Remuneration receivable 1,793,235 1,887,943 management Sales Load Receivable 325,267
408,972
Receivable against reimbursement of expenses 608,189
357,973
Receivable against Shariah Fee 60,000
75,000
Receivable against selling & marketing expenses -
1,694,723 Federal excise duty on remuneration 8,639,183
8,639,183
Federal excise duty on sales load 3,028,386
3,028,386
MCB PAKISTAN STOCK MARKET FUND Funds under Remuneration receivable 23,299,687
15,904,439
management Sales Load Receivable 836,859
183,846
Other receivable -
-
Receivable against reimbursement of expenses 1,030,960
703,736
Receivable against selling & marketing expenses 38,437,423
28,269,543
Federal excise duty on remuneration 54,773,935
54,773,935
Federal excise duty on sales load 3,932,683
3,932,683
Closing balance of investment in units 146,676,096
109,436,502
PAKISTAN INCOME FUND Funds under Remuneration receivable 7,651,531
1,709,855
management Sales Load Receivable 345,554
403,694
Receivable against reimbursement of expenses 852,806
175,851
Receivable against selling & marketing expenses -
614,221
Federal excise duty on remuneration 9,210,245
9,210,245
Federal excise duty on sales load 239,199
239,199
Other Receivable 132,561
132,561
Closing balance of investment in units 388,253,829
-
MCB PAKISTAN SOVEREIGN FUND Funds under Remuneration receivable 663,926
1,381,532
management Sales Load Receivable 8
355,019
Receivable against reimbursement of expenses 63,516
146,506
Receivable against selling & marketing expenses 290,630
911,319
Federal excise duty on remuneration 29,027,974
29,027,974
Federal excise duty on sales load 4,169,840
4,169,840
PAKISTAN CAPITAL MARKET FUND Funds under Remuneration receivable 1,338,866
790,450
management Sales Load Receivable - -
Receivable against reimbursement of expenses 39,190 34,976
MCB CASH MANAGEMENT OPTIMIZER
Receivable against selling & marketing expenses - 1,439,534
Federal excise duty on remuneration 5,872,250 5,872,250
Federal excise duty on sales load 392,742 392,742

Annual Report 2021MCB - Arif Habib Savings and Investments Limited 83
NOTES TO THE FINANCIAL STATEMENTS FOR THE YEAR ENDED 30 JUNE 2021
Name of the related party Relationship and Nature of transaction 2021 2020
percentage of (Rupees)
shareholding
ALHAMRA ISLAMIC STOCK FUND Funds under Remuneration receivable 6,456,723
4,815,010
management Sales Load Receivable 81,700
53,369
Receivable against reimbursement of expenses 285,696
213,054
Receivable against selling & marketing expenses 11,074,298
8,147,238
Receivable against Shariah Fee 60,000
75,000
Federal excise duty on remuneration 5,689,242
5,689,242
Federal excise duty on sales load 124,913
124,913
Closing balance of investment in units 24,437,229
-
PAKISTAN PENSION FUND Funds under Remuneration receivable 2,547,807
2,358,801
management Sales Load Receivable -
258,193
Federal excise duty on remuneration 5,976,465
5,976,465
Closing balance of investment in units 311,872,289
266,239,774
ALHAMRA ISLAMIC ASSET Funds under Remuneration receivable 7,384,899
3,633,832
ALLOCATION FUND management Sales Load Receivable 404,315
201,813
Back end load receivable 815,726
82,245
Receivable against reimbursement of expenses 198,040
160,789
Receivable against selling & marketing expenses -
6,180,374
Receivable against Shariah Fee 60,000
75,000
Federal excise duty on remuneration 5,910,300
5,910,300
Federal excise duty on sales load 1,135,845
1,135,845
ALHAMRA ISLAMIC PENSION FUND Funds under Remuneration receivable 1,874,842
1,414,549
management Sales Load Receivable 271,597
189,121
Federal excise duty on remuneration 3,030,332 3,030,332
Closing balance of investment in units 326,724,663 266,955,633
PAKISTAN SARMAYA MAHFOOZ FUND Funds under Federal excise duty on remuneration 1,960,082 1,960,082
(Matured) management Federal excise duty on sales load 2,307,278 2,307,278
PAKISTAN CASH MANAGEMENT FUND Funds under Remuneration receivable 217,783 512,154
management Receivable against reimbursement of expenses 62,402 165,245
Sales load receivable 30,605 -
Federal excise duty on remuneration 11,932,884 11,932,884
PAKISTAN INCOME ENHANCEMENT Funds under Remuneration receivable 1,188,734 202,575 FUND management Sales Load Receivable 20,666 28,731
Receivable against reimbursement of expenses 55,991 17,675 Receivable against selling & marketing expenses - 392,605 Federal excise duty on remuneration 16,589,808 16,589,808 Federal excise duty on sales load 4,746,222
4,746,222 Other receivable 132,561
132,561
ALHAMRA ISLAMIC MONEY MARKET Funds under Remuneration receivable -
221,657
FUND (Formerly: MCB management Sales Load Receivable 7,045
14,639
Pakistan Frequent Payout Fund) Receivable against reimbursement of expenses -
11,794 Receivable against selling & marketing expenses -
290,448
Receivable against Shariah Fee 60,000
- Federal excise duty on remuneration 840,741
840,741
Federal excise duty on sales load 3,624,619
3,624,619 Other payable (1,844,136)
-
AL-HAMRA ISLAMIC ACTIVE ASSET Funds under Remuneration receivable -
10,692
ALLOCATION FUND PLAN-I management Receivable against reimbursement of expenses -
28,583
AL-HAMRA ISLAMIC ACTIVE ASSET Funds under Remuneration receivable -
5,132
ALLOCATION FUND PLAN-II management Receivable against reimbursement of expenses -
14,847
ALHAMRA DAILY DIVIDEND FUND Funds under Remuneration receivable 433,744
776,026
management Payable against bank charges (32,653)
88,126
Closing balance of investment in units -
Receivable against reimbursement of expenses -
274,700
Receivable against selling & marketing expenses -
2,141,742
Sales load receivable 2,145
-
AL-HAMRA SMART PORTFOLIO Funds under Remuneration receivable 3,298
-
management Receivable against reimbursement of expenses 6,590
-
Closing balance of investment in units 119,852,520
-
Key management personnel of the Company comprises of the Directors, Chief Executive Officer and Executives. Their remuneration are disclosed in note 32 to thefinancial statements.

Annual Report 2021MCB - Arif Habib Savings and Investments Limited 84
NOTES TO THE FINANCIAL STATEMENTS FOR THE YEAR ENDED 30 JUNE 2021
Chief Executive Officer Chief Financial Officer Director
39 NUMBER OF EMPLOYEES
40 NON-ADJUSTING EVENTS AFTER THE REPORTING PERIOD
41 DATE OF AUTHORIZATION FOR ISSUE
These financial statements were authorized for issue on August 09, 2021 by the Board of Directors of the Company.
42 GENERAL
All amounts have been rounded off to the nearest rupee unless otherwise stated.
The total number of employees as at year end were 311 (2020: 295) and average number of employees were 303 (2020:311).
The Board of Directors in its meeting held on August 09, 2021has declared final cash dividend of Rs. 2.75 per share (2020:Rs. 2.25 per share declared on 18 August 2020). These financial statements do not include the effect of this appropriationwhich will be accounted for in the financial statements of the Company for the year ending 30 June 2022.

FORM OF PROXY 21st ANNUAL GENERAL MEETING
On October 26, 2021
21
Notes:

MCB ARIF HABIB SAVINGS & INVESTMENTS LIMITEDAdamjee House, 2nd Floor,
I.I. Chundrigar Road, Karachi
AFFIXCORRECTPOSTAGE
Fold H
ere
Fold Here
Fold Here


AFFIXCORRECTPOSTAGE
Fold H
ere
Fold Here
Fold Here
MCB ARIF HABIB SAVINGS & INVESTMENTS LIMITEDAdamjee House, 2nd Floor,
I.I. Chundrigar Road, Karachi

E-DIVIDEND MANDATE FORMMANDATORY CREDIT OF DIVIDEND INTO BANK ACCOUNT
Annual Report 2021MCB - Arif Habib Savings and Investments Limited 89