pendleton woolen mills slug discharge control plan & spill ...
Upload
unitedstatesgeologicalsurveyCategory
view
1download
0
Western Ecological Research Center
Stephens’ Kangaroo Rat (Dipodomys stephensi) Monitoring Protocol for MCB Camp Pendleton
Final Report
By Cheryl S. Brehme1, Kenneth P. Burnham2, Douglas A. Kelt3, Anthony R. Olsen4, Stephen J. Montgomery5, Stacie A
Hathaway1, and Robert N. Fisher1
Prepared for: Wildlife Management Branch AC/S Environmental Security Marine Corps Base Camp Pendleton U.S. Department of the Interior U.S. Geological Survey

Stephens’ Kangaroo Rat (Dipodomys stephensi) Monitoring Protocol for MCB Camp Pendleton
By Cheryl S. Brehme1, Kenneth P. Burnham2, Douglas A. Kelt3, Anthony R. Olsen4, Stephen J. Montgomery5, Stacie A
Hathaway1, and Robert N. Fisher1
Final Report
Prepared for: Wildlife Management Branch AC/S Environmental Security Marine Corps Base Camp Pendleton
1San Diego Field Station Western Ecological Research Center U.S. Geological Survey 4165 Spruance Road, Suite 200 San Diego, CA 92101 2Colorado Cooperative Fish and Wildlife Research Unit USGS, Biological Resources Division 201 Wagar Bldg Colorado State University Fort Collins, Colorado 80523 3Department of Wildlife, Fish, and Conservation Biology University of California, Davis 1 Shields Avenue Davis, CA 95616 4National Health and Environmental Effects Research Laboratory U.S. Environmental Protection Agency 200 S.W. 35th Street Corvallis, OR 97333 5SJM Biological Consultants 7071 Chapala Canyon Court San Diego, CA 92129
ii

U.S. Department of the Interior Lynn Scarlet, Acting Secretary
U.S. Geological Survey P. Patrick Leahy, Acting Director
U.S. Geological Survey, Reston, Virginia 2006 Revised and reprinted: 2006
For product and ordering information: World Wide Web: http://www.usgs.gov/pubprod Telephone: 1-888-ASK-USGS
For more information on the USGS—the Federal source for science about the Earth, its natural and living resources, natural hazards, and the environment: World Wide Web: http://www.usgs.gov Telephone: 1-888-ASK-USGS
Front Cover: Image of Stephens’ kangaroo rat (California Department of Fish and Game) Habitat Suitability Map of Stephens’ kangaroo rat on MCB Camp Pendleton (Randy Nagel, USFWS and
Cheryl Brehme, USGS)
Suggested citation: Brehme, C., Burnham, K., Kelt, D., Olsen, A., Montgomery, S., Hathaway, S., and R. Fisher. 2006. Stephens’ Kangaroo Rat (Dipodomys stephensi) Monitoring Protocol for MCB Camp Pendleton. Prepared for AC/S Environmental Security, Marine Corps Base, Camp Pendleton.
Any use of trade, product, or firm names is for descriptive purposes only and does not imply endorsement by the U.S. Government.
Although this report is in the public domain, permission must be secured from the individual copyright owners to reproduce any copyrighted material contained within this report.
iii

Table of Contents
Abstract........................................................................................................................................... 1
Introduction..................................................................................................................................... 3
Background..................................................................................................................................... 4 Stephens’ kangaroo rat ................................................................................................................ 4
Life History .............................................................................................................................. 4 Monitoring Methodologies and Evaluation ............................................................................. 6
MCB Camp Pendleton................................................................................................................. 7 Historical and current occurrence of SKR on MCB Camp Pendleton ........................................ 8
Protocol Design: Overview and Theory ........................................................................................12Key Considerations ................................................................................................................... 12 Monitoring Program Highlights ................................................................................................ 13 Design outputs ........................................................................................................................... 15
Protocol Specifics ..........................................................................................................................17SKR Habitat Mapping ............................................................................................................... 17 Sampling Scheme ...................................................................................................................... 20
Sample allocation................................................................................................................... 20 Phase 1: Burrow/ Sign Searches and Habitat Characterization ............................................. 21 Phase 2: Live-Trapping.......................................................................................................... 24
Analysis/ Output........................................................................................................................ 25 Assumptions .............................................................................................................................. 29
Management.................................................................................................................................. 31
Further Study Recommendations.................................................................................................. 32 Specific: Supplements to core protocol..................................................................................... 32
Burrow Searches: Detection probability ............................................................................... 32 Sign and Burrow Search: Testing Closed Population Model Assumptions.......................... 32 Effects of SKR Habitat Management..................................................................................... 32
Alternate methods of species confirmation: .............................................................................. 33 Scat......................................................................................................................................... 33 Hair snares.............................................................................................................................. 33
General: Information Gaps ........................................................................................................ 34 Dispersal................................................................................................................................. 34 Demography........................................................................................................................... 34
Acknowledgements .......................................................................................................................35
References .....................................................................................................................................36
Appendix 1. Scientific Panel and SKR Workshop members ........................................................42
Appendix 2. SKR Conceptual Model ............................................................................................43
Appendix 3. SKR Model of Seasonal Variability and Abundance ...............................................44
Appendix 4. SKR Life History & Stressors ..................................................................................45
Appendix 5. Comparison Tables: Monitoring Methods................................................................49
iv

v
List of Tables
Table 1. The loss of significant correlations between burrow counts and live-trapping as the proportion of SKR to DKR decreases (i.e. the ratio 1:1 would equal 50% SKR and 50% DKR)…………………………………………………………………………………………....11
Table 2. MCB Camp Pendleton SKR Monitoring Protocol Elements……………………………...16 Table 3. Criteria used for the Proposed SKR Habitat Quality Map…………………………..…….18 Table 4. Habitat characterization form for all SKR sample plots……………………………..……23 Table 5. Proposed data input structure (without covariates) for a single year using hypothetical
data…………………………………………………………………………………………..….27 Table 6. Examples of covariates that may be evaluated in SKR models........................................... 27 Table 7. Estimated precision in PAO and area estimates for the first year using simulated
datasets………………………………………………………………………………………….28 Table 8. Simple precision estimates for detecting SKR population decline on MCBCP using three
different sampling schemes. ..................................................................................................... .30 Table 9. Simple ANOVA design to study effects of management. ......................................... ……..33
List of Figures
Figure 1. Current and historical Stephens' kangaroo rat habitat within MCB Camp Pendleton mapped during 1996 (S. Montgomery, Tetratech) and 2003 (AMEC)………………………...9
Figure 2. MCBCP Monitoring results for SKR density (a) and SKR occupancy (b) on 10 grids sampled from 1996 to 2002 (excluded those that were not sampled all 4 years). ……………..11
Figure 3. Proposed habitat suitability map for SKR Monitoring Program…………………………19 Figure 4. Small mammal burrows…………………………………………………………………..22 Figure 5. Diagram of live-trapping grid on 50m x 50m sample plot……………………………….24

Stephens’ Kangaroo Rat (Dipodomys stephensi) Monitoring Protocol for MCB Camp Pendleton
By Cheryl S. Brehme1, Kenneth P. Burnham2, Douglas A. Kelt3, Anthony R. Olsen4, Stephen J. Montgomery5, Stacie A
Hathaway1, and Robert N. Fisher1
Abstract
This document presents a monitoring protocol for the Stephens’ kangaroo rat (Dipodomys
stephensi, SKR) on Marine Corps Base Camp Pendleton (MCBCP). A two-day scientific workshop was
held in 2004 for the purpose of designing this program. The workshop attendees included a four
member Scientific Peer Review Panel with expertise in spatial and statistical monitoring design and
SKR biology, and additional biologists from several federal, state, and local wildlife agencies. The
panel and other members reviewed and discussed SKR life history, conceptual models, monitoring
schemes, and detection methods before reaching consensus on the basics of a monitoring program.
Protocol specifics were determined by consultation among the USGS, the scientific panel, and MCBCP
after the workshop.
There is a large body of evidence to show that SKR populations are both spatially and
temporally dynamic. SKR abundance and capture probabilities are highly variable making detection of
demographic trends problematic and time intensive. Suitable habitat for SKR may also vary through
time and space in relation to disturbance and vegetation succession. This is particularly true on MCBCP,
where there is a relatively high level of disturbance from frequent fires and military training activities.
In consideration of these and other factors, we designed a relatively simple, multi-tiered, habitat-based,
adaptive monitoring program for SKR. This monitoring program will track yearly trends in the total
area occupied by SKR on base over a large number of fixed sample plots. It includes measurement of
habitat and environmental variables that are hypothesized to affect the probability of occupancy, rate of
colonization, and/or rate of extinction over time. Predictors that are found to be significant will be used
for habitat-based recommendations for management.
It is unknown whether trends in SKR distribution are directly related to trends in SKR
abundance; therefore, the program includes a density index. We considered active burrow counts for use
as an index, as they have been shown to correlate and trend with SKR density estimates from live-
trapping. However, previous monitoring efforts on MCBCP have shown that even in optimum habitat,
1

SKR frequently co-exist with the sympatric Dulzura kangaroo rat (Dipodomys simulans, DKR), and that
the proportion of SKR/DKR is both spatially and temporally variable. As a result, we cannot expect a
consistent relationship between kangaroo rat burrow counts and SKR abundance. Therefore, we chose a
multi-phased approach for sampling using a combination of active kangaroo rat sign searches and live-
trapping. The first phase involves a complete search for any potential kangaroo sign to include burrows,
tracks, and scat on sample plots. If any potential sign is observed, two nights of live-trapping will be
conducted for the second phase. The live-trapping results will be used to calculate a density index.
Because the species is rare, it is most efficient to stratify sampling effort based on the probability of
occupancy or habitat suitability. Thus, we have defined 17,795 ha of high, medium, and low suitability
habitat on MCBCP using previously mapped SKR habitat and established soil and vegetation
associations. During the first year(s), forty to fifty 50 m x 50 m plots within each stratum will be
randomly sampled to estimate expected occupancy rates. We will then optimize sampling for the highest
precision over the monitoring area. If there are no or very few SKR found in the lower suitability
habitat, we may focus all sampling to the high and medium suitability habitats. In the first year(s), lower
quality habitat will be sampled primarily to test our current assumptions about SKR, determine whether
low levels of SKR persist in these habitats, and to provide needed data for our habitat model. Once
sample allocation is optimized, we propose to keep all sample plots permanent in order to have the
greatest ability to detect trends over time. At the onset of the program, we will also be sampling 10 plots
that were monitored biennially from 1996 to 2002 in order to provide continuity with previous
monitoring efforts. We designed this program to be compatible with the SKR monitoring program on
the adjacent Naval Weapons Station, which, together with MCBCP, encompass one of the five proposed
"High Priority" Reserves for SKR by the US Fish and Wildlife Service. The program will be adaptive,
so that habitat quality boundaries, sample allocation, and other aspects of the protocol can be updated as
new information is gained.
This program provides the model framework for powerful statistical analyses of trends in
metapopulation dynamics, as well as the effects of habitat and environmental variables and management
actions on SKR populations. We hope this may serve as a model for monitoring trends in SKR
populations over a broader geographic scale, so that range-wide trends in spatial distribution and
relative density of this kangaroo rat can be assessed.
2

Introduction
On July 19th and 20th, 2004, a workshop was held in order to develop a scientifically valid and
cost-effective monitoring program for the Stephens’ kangaroo rat (Dipodomys stephensi, SKR) on
Marine Corps Base Camp Pendleton (MCBCP). The main objectives of this monitoring program are to
document short term variation and long-term trends in the distribution and status of Stephens’ kangaroo
rat population(s) on base. The workshop attendees included a four member Scientific Peer Review Panel
from the U.S. Geological Survey, U.S. Environmental Protection Agency, UC Davis, and SJM
Biological Consultants. The panel members were chosen for their considerable expertise in spatial and
statistical monitoring design as well as local and regional SKR biology. In addition, wildlife
professionals from the U.S. Geological Survey, MCBCP Camp Pendleton, U.S. Fish and Wildlife
Service, California Departments of Fish and Game (Riverside and San Diego), the San Diego County
Park Department, and Fallbrook Naval Weapons Station also participated in the discussions (Appendix
1). The workshop process was as follows:
1. Reviewed and revised a conceptual model of current knowledge and understanding of
SKR population structure, demographics, and stressors (Appendices 2, 3, & 4).
2. Reviewed what is known about the historic and current status of SKR on MCBCP
(Appendix 4).
3. Reviewed several current and/or proposed monitoring programs and sampling methods
for SKR and other similar kangaroo rat species (Appendix 5).
4. Reached consensus on best overall strategy to monitor the status of SKR population(s).
5. Discussed some specifics of protocol such as habitat mapping, sampling strategies, co-
occurrence issues with the Dulzura kangaroo rat (DKR), density indices, and utility for
management.
6. Visited Camp Pendleton for firsthand look at current monitoring grids, SKR and DKR
burrows, and low versus high quality habitat (Scientific Panel).
This report is a summary and compilation of the background materials, results and consensus
reached during this workshop. Protocol specifics were determined by consensus of the USGS, the
scientific panel, and MCBCP after the workshop. The theoretical and practical reasons for protocol
decisions and components are detailed below. We hope this may serve as a program model for
monitoring trends in SKR populations over a broader geographic scale, so that range-wide trends in
spatial distribution and relative density can be assessed. The basics of this program may also be helpful
for consideration of monitoring programs for other species with similar life history characteristics.
3

Background
Stephens’ kangaroo rat
Stephens’ kangaroo rat (Dipodomys stephensi, SKR) was listed as a threatened species by the
California Department of Fish and Game in 1971 and as an Endangered Species by the U.S. Fish and
Wildlife Service in September 30, 1988 due to extensive habitat loss, degradation, and fragmentation
(USFWS 1997). The SKR historically had a relatively small geographic distribution in western
Riverside, southwestern San Bernardino and northern San Diego Counties. The species has lost
approximately 50% of its historic habitat due to agriculture and residential development and is currently
estimated to occupy 25,000 acres (10,117 ha) in Riverside and San Diego counties. Most of these areas
support low density populations (<1 animal/ ha) of SKR (O'Farrell and Uptain 1989, USFWS 1997)
Life History
A detailed conceptual model of the Stephens’ kangaroo rat is presented in Appendix 4. In
summary, the Stephens’ kangaroo rat is a medium-sized nocturnal rodent of the family Heteromyidae.
Many rodents of this family are physiologically adapted to hot and arid environments (French 1993). To
minimize water loss while foraging, they collect seeds and other materials in external cheek pouches.
Heteromyid rodents also keep seed caches in and around their burrows for times when food resources
are low.
All kangaroo rats travel using bipedal locomotion (hopping on hind feet) and, therefore, require
open habitat on gentle slopes for efficient movement and foraging. Within its range, Stephens’ kangaroo
rat prefers open non-native herb and grassland habitat with minimal shrub cover, greater than 50% to
70% bare ground, and friable soils for digging and dust bathing (Bleich 1973, 1977, Thomas 1975,
O'Farrell and Uptain 1989, Goldingay and Price 1997, USFWS 1997). They eat primarily native and
non-native seeds, but also eat plant material and insects (Thomas 1975, Lowe 1997). By removing and
redistributing seed, they, like other kangaroo rats, help to maintain the open conditions they require and
may act as a keystone species for their habitat (Brown and Heske 1990, Goldingay et al. 1997, Brock
and Kelt 2004c). Creation and maintenance of SKR habitat is also largely attributed to natural and
unnatural disturbances such as fire, scouring, grazing, and shallow disking. In fact, most of these
methods have been successfully used for management (Price et al. 1993, 1994a, Kelt et al. 2005).
Because their burrows are sufficiently deep (23 to 46 cm; O'Farrell and Uptain 1987), they can easily
survive most fires and other surface disturbances and colonize the newly disturbed habitat. Vegetative
4

succession of thick grasses and/or shrubs create habitat that is not suitable for SKR and, as a result,
leads to rapid decline in population size (O'Farrell and Uptain 1987, 1989).
It is thought that adult SKR typically disperse only short distances (<50 m), but they are known
to make at least occasional long range (>1 km) movements, often using dirt roads or other open ground
as travel corridors (Thomas 1975, O'Farrell and Uptain 1989, Price et al. 1994b, Brock and Kelt 2004b).
SKR regularly co-occur with a sympatric species, the Dulzura kangaroo rat (Dipodomys simulans,
DKR), although DKR tend to prefer shrubland habitats (Goldingay and Price 1997).
Primary stressors to SKR habitat needs include:
1. Habitat fragmentation.
2. Succession to native scrub habitats or thick invasive grasslands.
3. Excessive soil compaction from off road vehicle use.
4. Lack of open habitat and/or corridors for dispersal.
The average life span of a Stephens’ kangaroo rat is reported to be 4 to 8 months, with
approximately 14 to 18% surviving beyond their first year (McClenaghan and Taylor 1993, Price and
Kelly 1994). These estimates do not distinguish between death and emigration, so actual survivorship
may be longer and a proportion of juveniles probably disperse to surrounding habitats. Females
typically begin estrous with the start of winter rains and conclude estrous after seed dispersal.
(McClenaghan and Taylor 1993). After gestating for about 30 days, they give birth to an average of two
to three young, twice yearly (Lackey 1967b). The young are then weaned from the nest between 18 and
22 days after birth. In prosperous years, females born in the spring may reproduce their first year
Primary stressors to survivorship and reproduction may include:
1. Low seed production due to drought.
2. Excessive predation pressure from owls, snakes, coyotes, fox, feral cats and/or invasive
ants.
3. Excessive competitive pressure from other rodents and/or ants who share the same
resource base.
4. Small and/or low density populations. May reduce mating due to Allee effects, where
widely dispersed, low-density populations are less likely to find mates. Increases
susceptibility to environmental and demographic stochastic events (Jones and Diamond
1976, Lande 1988, Berger 1990)
5
5. Direct mortality from consumption of pesticides, trampling, and road kill.
Large fluctuations in both distribution and density over time have been documented for this
species (O'Farrell and Uptain 1987, 1989, Price and Endo 1989, McClenaghan and Taylor 1993, Diffendorfer and Deutschman 2002, Montgomery 2004, Kelt et al. 2005). Ten-fold changes in
abundance within and among years are not uncommon. Densities also vary vastly over space due to
changes in habitat conditions and natural successional dynamics. Therefore, declines in population sizes
at some locations may be concurrent with increases at other locations (O'Farrell and Uptain 1989,
Diffendorfer and Deutschman 2002). Because of this evidence, we and others (Burke et al. 1991,
Spencer 2002, Price and Gilpin 1996, Mary Price personal communication) suspect that SKR primarily
follow a form of meta-population dynamics1, where availability of suitable habitat patches is spatially
and temporally dynamic (i.e. Fahrig 1992). This is contrary to traditional fixed populations that vary in
density over time, but exhibit no spatial heterogeneity.
Monitoring Methodologies and Evaluation
Currently and historically, two main approaches for monitoring SKR populations have been
used; live-trapping and active burrow counts. Live-trapping methods for small mammals are well
documented in the literature (e.g., Jones et al. 1996). Most efforts minimally include a standard transect
or grid of box traps, which are set out in a pattern and run for a number of consecutive nights. Most
efforts include the use of permanent or temporary marks on the animals in order to estimate density,
capture probabilities and/or other demographic parameters (abundance, birth rate, survivorship). To
date, trapping efforts for SKR have varied widely in grid size, session length and frequency. Capture
probability appears to be highest during the late summer and early fall periods when food resources are
low (O'Farrell and Uptain 1987, Montgomery 2002).
The second method for monitoring SKR populations is burrow counting (O'Farrell 1992,
Montgomery et al. 2005). This is less costly in terms of effort and is often used for initial habitat
assessment, as a replacement for live-trapping, or in conjunction with live-trapping. This method was
described by O'Farrell (1992) and involves searching for active SKR burrows in predefined areas (belt
transects or circular searches). Burrows must show some type of recent activity, such as loose soil,
footprints, and/or scat, in order to be counted. In areas where only SKR occur, burrow counts have a
consistent significant positive correlation to SKR density as determined by live-trapping (O’Farrell
1992, Diffendorfer and Deutschman 2002). In areas where the sympatric Dulzura kangaroo rats occur, 1A metapopulation is a set of local populations within some larger area, where typically migration from one local population to at least some other patches is possible (Hanski and Simberloff 1997). The degree of isolation between local populations can be high or low depending upon dispersal distance. Metapopulation dynamics are typically based on the equilibrium between colonization and extinction of local populations rather than demographics of individual local populations.
6

this method must be followed by live-trapping in order to confirm SKR presence. Burrow counts are
slightly complicated by the fact that SKR may share burrows with conspecifics. Brock and Kelt (2004c)
reported that the proportion of SKR that share burrows varied by location and, thus, influences the
relationship between burrow counts and number of animals present. Burrow counts are typically
conducted in the late summer and fall, after annual herbaceous vegetation has died and disarticulated, to
increase the probability of detecting burrow openings (O’Farrell 1992, Montgomery et al. 1997).
Diffendorfer and Deutschman (2002) recently conducted a statistical review of 14 SKR studies
using live-trapping and/or burrow counts. In summary, they verified positive correlations between live-
trapping and burrow counts, but found the slope of the relationship to be spatially and temporally
variable. They also reported very large spatial and temporal variability in SKR densities (live-trapping
and burrow counts) and capture probabilities. They concluded that it is difficult to detect large-scale
trends in SKR abundance because of their tremendous variability in numbers across time and space.
MCB Camp Pendleton
Marine Corps Base Camp Pendleton (MCBCP) is located on approximately 125,000 acres
within the Peninsular Ranges physiographic province of California. This province is characterized by a
narrow, sandy shoreline, seaside cliffs, coastal plains, low hills, canyons, and mountains that rise to
elevations of approximately 2,700 feet (NEESA 1984). MCBCP is bordered by the cities of San
Clemente and Oceanside to the northwest and southeast, while the Cleveland National Forest and the
Pacific Ocean border the northern and western portions, respectively. To date, the base is largely
undeveloped and encompasses the largest remaining expanse of undeveloped coastline and coastal
habitat in southern California. Because of this, many species that were once common throughout the
Peninsular Range now find refuge within the borders of MCBCP. MCBCP harbors the southwestern-
most “population units” of SKR, one of 11 populations units targeted for conservation by the U.S. Fish
and Wildlife Service (1997). SKR habitat within MCBCP, along with the neighboring Fallbrook Naval
Weapons Station, was designated as one of five “High Priority” Reserves for SKR.
Habitats within the MCBCP include oak woodlands, coastal sage scrub, native and non-native
grasslands, coastal dunes, riparian forest/woodland/scrub, as well as wetlands. Because of the use of the
land for military training, unique factors are present which affect habitats within MCBCP. First, most
land within MCBCP is at some time disturbed by military training activities. These disturbances include
troop movements on foot or in military vehicles, artillery fire, and bombing. Secondly, there is a high
frequency of fire within MCBCP, especially within and near, but not limited to, firing and bombing
ranges. Frequent fires may result in substantial changes in the vegetative composition of habitats,
including the transformation of chaparral and coastal sage scrub communities into grasslands (Zedler et
7

al. 1983, Callaway and Davis 1993, Keeley 2002). Stephens’ kangaroo rat is most often associated with
grasslands. The perennial and annual grasslands at MCBCP mainly occur on fine-textured soils of
coastal terraces and rolling hills with deeper soils at higher elevations. It is unknown how much of the
grasslands may be stable over time without regular disturbance. Many areas would be expected to revert
to shrubland or woodland habitats if disturbance were significantly reduced (MCBCP 2001). Finally,
there are a large number of dirt roads, paths, and firebreaks that support above activities. Dirt roads have
been shown to facilitate movement for SKR, whereas gravel and paved roads may be an impediment to
movement (O'Farrell and Uptain 1989, Brock and Kelt 2004b). Additionally, road edges created by
uplifting of the soil during road excavation and maintenance can create suitable soil conditions for
burrowing. For the most part, disturbances such as those described above are thought to have positive
effects on SKR habitat and populations, however, heavy disturbances may result in direct mortality
and/or destruction of habitat.
Historical and current occurrence of SKR on MCB Camp Pendleton
The total amount of historically and currently occupied habitat for SKR on MCBCP was
estimated to be 800 acres in 1996 (324 ha, Montgomery et al. 1997). Several additional locations within
artillery firing areas were confirmed in surveys conducted during 2001 and 2003 (AMEC 2004). We
will use the term “population groups” to describe animals residing in relatively distinct areas, although
it is unknown whether these groups represent multiple separate populations or one large
metapopulation.
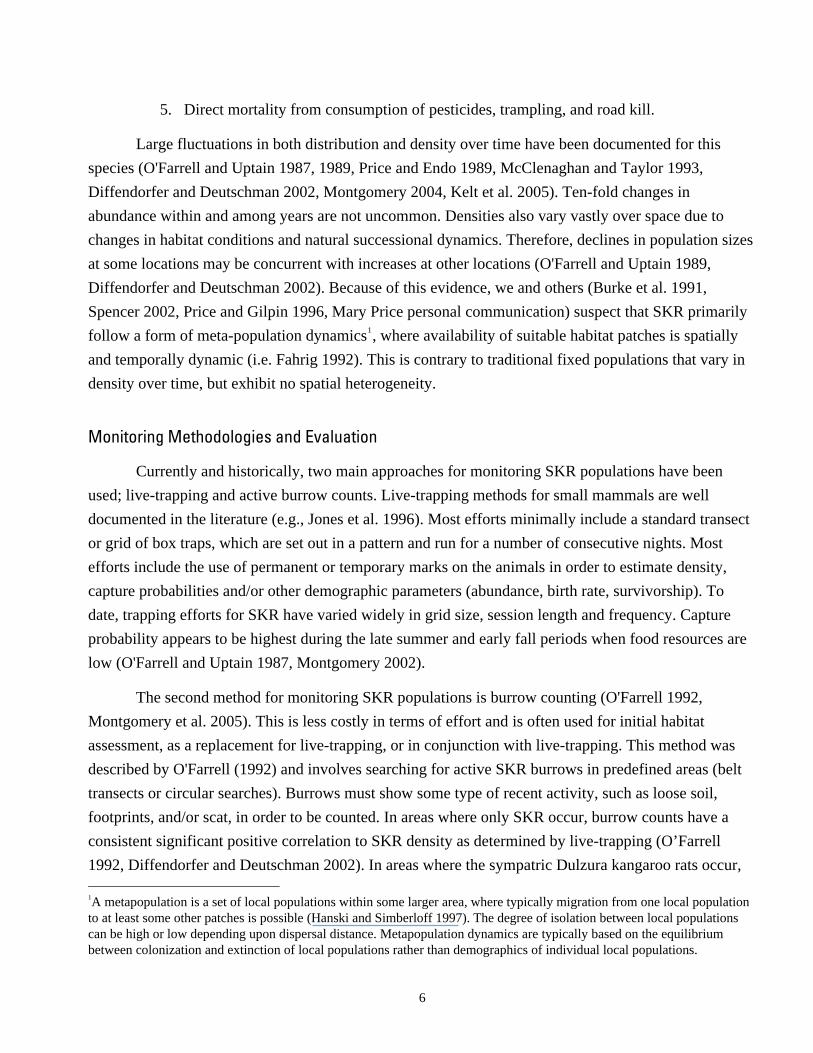
Historically, four general areas supported known population groups of SKR (Figure 1). First,
two small groups historically occupied habitat along the upland portion of lower San Mateo Canyon (1)
and San Onofre Canyon (2). No animals have been documented in San Onofre since 1992 and in San
Mateo since 1994, presumably as a result of concurrent base projects, so these population groups are
thought to be extirpated (Montgomery 2002). Third, there is a very large discontinuous population
group south and east of the Zulu impact area in the central portion of the base (3). Many of the existing
SKR population groups occurring in this area are primarily found on habitat that is frequently disturbed
by training, such as artillery firing areas, live fire ranges, and impact areas. Occupancy of SKR within
adjacent dud producing impact areas is unknown, however, a wide strip along the south and west
perimeters of the Zulu and Whiskey impact areas, as well as portions of the Quebec impact area, may be
suitable for SKR. These areas potentially harbor SKR or at least provide suitable dispersal habitat.
Finally, there is a small group in the Juliett training area (4) abutting a much larger population on the
Fallbrook Naval Weapons Station. A portion of the Juliett area is now being managed as a mitigation
bank for SKR on MCBCP (USFWS 1992), but has not been subjected to regular disturbance. On many
8

9
Fallbrook Naval Weapons Station Boundary
Grasslands
1 San Mateo
3
4 Juliett
San 2 Onofre
areas of MCBCP, SKR co-occur with or are adjacent to populations of the Dulzura kangaroo rat
(Dipodomys simulans, DKR)
Figure 1. Current and historical Stephens' kangaroo rat habitat within MCB Camp Pendleton mapped during 1996 (S. Montgomery, Tetratech) and 2003 (AMEC). Population groups 1 to 4 are circled. Groups 1 and 2 are presumed extirpated. Group 3 encompasses all known SKR localities south of the dud producing Zulu impact area and north of the Santa Margarita River. Group 4 is contiguous with a larger SKR population located in the Fallbrook Naval Weapons Station. Black triangles denote locations of 13 old and new trapping grids used for monitoring SKR from 1996 to 2002.

A monitoring program for SKR on MCBCP was implemented from 1996 to 2002 (Montgomery
et al. 1997, Montgomery 2002, 2004). In summary, 13 survey grids (0.9 to 1.0 ha) were originally
placed to represent all historical and currently known SKR populations (Figure 1) occurring on sparse to
dense exotic annual grassland and/or native perennial grasslands, and sparse sage scrub (Montgomery et
al. 1997). The grids were surveyed during autumn every other year (1996, 1998, 2000, and 2002) using
both burrow counting and live-trapping methods (Montgomery 2004).
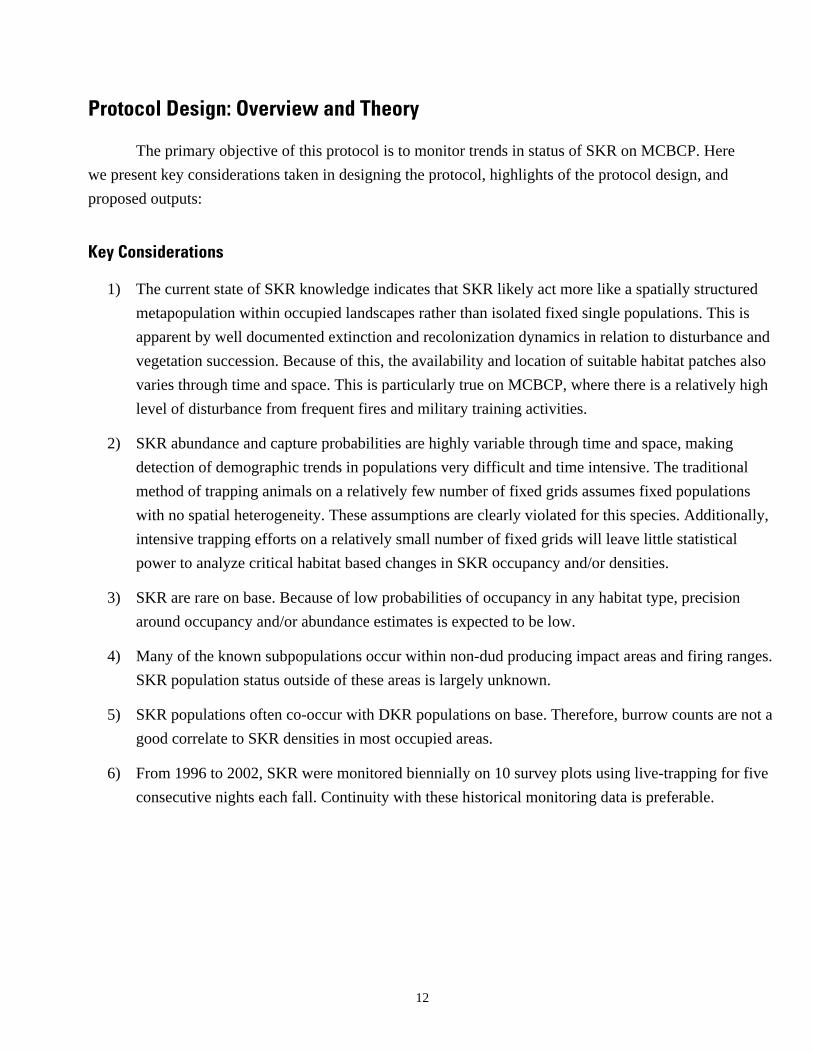
There were large variations in the number of captures and number of burrows among grids and
years (Figure 2a). Since three of the grids were not trapped each survey year (Population 1 & 2 grids
discontinued in 1998, 2000 and two new grids in Population 3 added), we analyzed the data for the 10
grids that were surveyed each year using mixed-model repeated measures ANOVA and follow-up
paired t-tests. SKR density, as measured by both trapping and burrow counts, varied by year
(F27,3=9.449, p<0.0005 and F27,3=4.895, p=0.008, respectively). Densities decreased from 1996 to 1998
and increased from 1998 to 2002 (Figure 2a). There were no significant differences in the sympatric
DKR densities among years (F27,3=0.957, p=0.427).
SKR occupancy among years followed a similar pattern to density, with an apparent pattern of
colonization, extinction, and recolonization in two of the grids. This pattern was exhibited in both live-
trapping and burrow counting. The sympatric DKR occupied six of the ten SKR grids among years
(Figure 2b).
Over all surveys, there was a very significant positive correlation between burrow counts and
trapping of SKR (r2= 0.770, p<0.0005, n=50), however, this correlation declined as the ratio of
SKR/DKR declined and was not significant when the ratio of SKR to DKR was less than or equal to
two (i.e. 66% SKR to 33% DKR) (Table 1). This situation occurred in 24% of the total surveys. Since
the current monitoring grids were chosen in the best known SKR habitats, we expect that these grids
represent some of the greatest ratios of SKR/DKR on MCBCP. Therefore, we do not believe burrow
counts will be a reliable method to use for an expanded monitoring program on MCBCP, where results
from randomly selected sites will be extrapolated to SKR status on MCBCP lands.
Overall, these results support our conceptual model of SKR dynamics and earlier conclusions on
SKR monitoring efforts. The scientific panel expected SKR occupancy to be a more stable monitoring
metric than SKR density. Between survey periods from 1996 to 2002, occupancy among grids varied by
25%, while density varied by 158% (trapping) and 226% (burrow counts).
10

0123456789
10
1996 1998 2000 2002
Year
No.
of g
rids
occu
pied
SKRBurrowsDKR
-5
0
5
10
15
20
25
30
35
40
1996 1998 2000 2002
Year
Mea
n de
nsity
SKRBurrowsDKR
**
*
**
**
A.
B.
Figure 2. MCBCP Monitoring results for SKR density (a) and SKR occupancy (b) on 10 grids sampled from 1996 to 2002 (excluded those that were not sampled all 4 years). Significant changes between years are denoted by asterisks (* p<0.05, ** p<0.01)
Table 1. The loss of significant correlations between burrow counts and live-trapping as the proportion of SKR to DKR decreases (i.e. the ratio 1:1 would equal 50% SKR and 50% DKR).
Proportion of SKR/ DKR1 n
Pearsons correlation coefficient p-value
≤ 1:1 8 0.087 0.838 ≤ 2:1 12 0.346 0.271
≤ 10:1 17 0.815 <.0005 ≤ 30:1 21 0.853 <.0005all data2 50 0.866 <.0005
1 calculated from 1996 to 2002 MCBCP SKR monitoring data (Montgomery 2004)2 includes grids with no captures and SKR only
11
Protocol Design: Overview and Theory
The primary objective of this protocol is to monitor trends in status of SKR on MCBCP. Here
we present key considerations taken in designing the protocol, highlights of the protocol design, and
proposed outputs:
Key Considerations
1) The current state of SKR knowledge indicates that SKR likely act more like a spatially structured
metapopulation within occupied landscapes rather than isolated fixed single populations. This is
apparent by well documented extinction and recolonization dynamics in relation to disturbance and
vegetation succession. Because of this, the availability and location of suitable habitat patches also
varies through time and space. This is particularly true on MCBCP, where there is a relatively high
level of disturbance from frequent fires and military training activities.
2) SKR abundance and capture probabilities are highly variable through time and space, making
detection of demographic trends in populations very difficult and time intensive. The traditional
method of trapping animals on a relatively few number of fixed grids assumes fixed populations
with no spatial heterogeneity. These assumptions are clearly violated for this species. Additionally,
intensive trapping efforts on a relatively small number of fixed grids will leave little statistical
power to analyze critical habitat based changes in SKR occupancy and/or densities.
3) SKR are rare on base. Because of low probabilities of occupancy in any habitat type, precision
around occupancy and/or abundance estimates is expected to be low.
4) Many of the known subpopulations occur within non-dud producing impact areas and firing ranges.
SKR population status outside of these areas is largely unknown.
5) SKR populations often co-occur with DKR populations on base. Therefore, burrow counts are not a
good correlate to SKR densities in most occupied areas.
6) From 1996 to 2002, SKR were monitored biennially on 10 survey plots using live-trapping for five
consecutive nights each fall. Continuity with these historical monitoring data is preferable.
12

In consideration of these and other factors, we designed a relatively simple, multi-tiered, habitat-
based, adaptive monitoring program for SKR. This monitoring program tracks trends in overall
occupancy of SKR on base and includes a relative density index. The basics of the program are listed
below and are presented in Table 2.
Monitoring Program Highlights
1) Habitat-based monitoring program for SKR occupancy.
Rather than focus on traditional time intensive capture-recapture methods for modeling animal
demographics on a small number of fixed plots, we chose a habitat based occupancy monitoring
scheme where a large number of plots are surveyed on a yearly basis. A loglinear modeling
program, such as PRESENCE (MacKenzie et al. 2002), will be used to estimate the proportion
of area occupied by SKR and correct for imperfect probabilities of detection. Covariate data, to
include habitat variables, environmental variables, presence of other species, and SKR density
indices will be collected at each sample plot. These data will be included in models to determine
what factors are significant in predicting occupancy and/or influence probabilities of detection.
Multi-year analysis will allow us to monitor extinction and colonization rates among sample
plots. Finally, this program can directly incorporate ongoing resource management and be used
to make informed management recommendations in the future.
2) SKR Density Index.
It is preferable to include some measure of SKR density since it is still unknown whether trends
in SKR occupancy and density are correlated. In addition, density may positively influence the
probability of detection and, therefore, should be included in any occupancy model. An index of
SKR density within strata will be generated from live-trapping data. Thus, we will also track
trends in SKR density over time.
3) Spatially stratified sampling of potential SKR habitat.
Because the species is rare, it is most efficient to stratify sampling effort based on probability of
occupancy. Thus, we have defined high-, medium-, and low-suitability habitat on MCBCP using
historic and currently known occupied habitat and established SKR soil and vegetation
associations. The first year, each strata will be randomly sampled with equal effort (40 to 50
random sample plots per strata) to determine expected occupancy rates. Then sampling effort
will be optimized for the best precision in the "focal monitoring area", defined as the high and
medium-suitability habitats, so as not to focus the bulk of sampling effort to habitats unlikely to
support SKR. Lower quality habitat will be sampled in order to test our current assumptions
13

about SKR, determine whether low levels of SKR persist in these habitats, and to provide
needed data for our habitat model. After the first several years, the need for continued
monitoring or revision of this stratum will be evaluated.
4) Continuity with 1996 to 2002 SKR monitoring efforts.
The thirteen original 1996-2002 monitoring plots will be defined as an additional stratum to be
sampled in their entirety (i.e. 100% probability of being sampled). This will allow continued
trend analyses for these sites while implementing a new protocol.
5) Two-tiered sample strategy.
A two-tiered approach will be used to survey all sample plots (see Sampling Scheme, below, for
details). This strategy will provide both proportion occupancy and density indices and account
for imperfect detection probabilities.
a) Habitat Characterization and Burrow Search.
Habitat is characterized based on variables expected to be related to SKR occupancy. Sample
units (50 m x 50 m) are methodically searched for any possible kangaroo rat burrows. If any
potential burrows are identified, follow-up live-trapping will take place.
b) Live-trapping.
Grids with potential SKR burrows will be trapped for two consecutive nights using a standard
25-trap grid design with 10 m spacing between traps.
6) Permanent sample plots.
Once the sample effort is optimized among strata and random plots are chosen within each
stratum (after the first five years), we propose all sample plots to be permanent. This design will
enable maximum power to detect trends over time and enhance ability to incorporate and
analyze effects of management actions on SKR. The large number of sample plots will allow for
accurate assessments of both status and trend for SKR on MCBCP.
7) Adaptive Protocol.
All elements of the protocol will be re-evaluated after the first 2 to 5 years of monitoring.
14

We propose a number of analyses and products to be generated for SKR monitoring.
Design outputs
1) Yearly estimates of occupancy with a density index.
A yearly map of SKR occupancy and density estimates for MCBCP. This map will contain
probabilities of occupancy and density indices with 90 & 95% confidence limits for the low,
medium, and high quality habitats, and historic monitoring plots. A separate map will be
generated showing the spatial distribution of SKR occupancy among individual plots.
2) Trend analysis.
Starting in second year of monitoring, calculated rates of occupancy , colonization, and
extinction within and among strata over time (i.e. rate of change in occupancy with 90 & 95%
confidence intervals.
3) Continued trend analysis of 13-predefined study sites (1996-2000).
4) Habitat and management analyses.
Analysis of habitat and other covariates for predicting occurrence, density and detectability of
SKR. Analysis of changes in occupancy and density in relation to habitat changes and
management actions on MCBCP. Significant predictors will be used to make habitat-based
recommendations for management.
5) Evaluation of monitoring program.
Every 2 to 5 years. Ability to update habitat model for SKR on MCBCP & adjust definitions of
high, medium, and low quality in concert with updated GIS habitat information for MCBCP as
well as SKR habitat modeling results. Evaluate sample sizes, survey procedures, and analyses
for utility for MCBCP objectives and power to detect SKR population trends.
15

Table 2. MCB Camp Pendleton SKR Monitoring Protocol Elements
Protocol Element Purpose(s) Procedure(s) Timing
Habitat Suitability Model To determine spatial extent of current and potential habitat.
Current knowledge of SKR habitat associations & distribution on MCBCP.
At onset of protocol.
To rate habitat and stratify sampling effort based upon likelihood of occupancy
Use of GIS layers (soils, slope, vegetation, pre-existing mapped SKR habitat and capture locations, impact area boundaries).
4 strata: 1) high, 2) medium & 3) low SKR suitability & 4) 1996-2002 monitoring plots.
Groundtruthing based on aerial photographs and site visits.
First year(s): Determine proportion area occupied within each stratum & SKR detection probabilities.
First year: 40-50 sample plots per stratum + 10 previous monitoring plots = 130-160 total sample plots
At onset of protocol.
Second/Third year: Optimize sample allocation based on first year data.
Second year: TBS, see "Sampling Scheme: Sample Allocation"
To monitor trends in potential habitat areas occupied by SKR, estimated density within and among strata.
Burrow/Sign Searches + Live-trapping in randomly chosen permanent sample plots ( 50 m2)
Late summer and Fall, Yearly
Burrow/ Sign Search and Habitat Characterization
To determine presence or absence of kangaroo rats
Complete survey of sample plots for any potential kangaroo rat burrows or sign
Late summer/ early Fall (Sept-Oct)
To collect habitat covariate data to model, better understand & predict SKR habitat relationships
Survey habitat characteristics thought to be associated with SKR presence.
Live-trapping surveys
To confirm presence or absence of SKR. Produce metric of density. Calculate detection and capture probabilities for models.
live-trap for 2 nights with standard 25 trap grid
Late summer and Fall (Oct-Nov)
Total acreage of habitat on MCBCP occupied by SKR. Probabilities of SKR occupancy within and among strata.
Density within and among strata
Multi-year: patch occupancy and extinction (i.e. metapop. growth rate)
Model habitat and other covariates for value in predicting SKR occupancy, detection, density, colonization, & extinction.
1MacKenzie et al. 2002, 2MacKenzie et al. 2003, 3Royle 2004, 4Royle and Nichols 2004
Sampling Protocol
Sample Allocation
Quality ratings to be re-evaluated every 2 to 5 years to coincide with new information
Analyses Program PRESENCE or equivalent: Occupancy1,2,3 and Point Count Model 4 (all). Program MARK (density index)
Yearly (all)
16

Protocol Specifics
In the following section, we describe each part of the protocol in detail. These are habitat
mapping, sampling scheme (sample allocation, burrow searches, live-trapping), data analysis, and
design assumptions.
SKR Habitat Mapping
The study area for future SKR monitoring on MCBCP includes all habitats that are currently
suitable for SKR or have reasonable potential to become suitable for SKR in the future. The study area
includes native and non-native grasslands, open woodlands with grassland understory, and coastal sage
scrub habitats on appropriate soils and slopes within four kilometers of all current and historically
known SKR habitat. Grasslands on loamy soils are included throughout the base. All developed land,
off-limit training areas, inappropriate soils, steep slopes, and other vegetation were not included in the
study area. The entire study area encompasses 17,795 ha (43,970 acres).
The study area is divided into three main strata: low, medium, and high suitability SKR habitat.
We also include the 1996-2000 sampling grids as a fourth stratum (Table 3, Figure 3). We hypothesize
that SKR occupancy will be more variable between than within strata. We can therefore optimize
sampling to improve efficiency of estimation, as well as provide individual estimations within each
stratum (i.e. Krebs 1989, Schreuder et al. 2004, Geissler and McDonald 2005).
Our designations of habitat quality for SKR were based upon established SKR habitat
associations and knowledge of the current and historical distribution of SKR on MCBCP (O'Farrell and
Uptain 1989, Montgomery et al.1997, Goldingay and Price 1997, Spencer 2002, AMEC 2004). Soil
quality definitions for SKR were provided by W. Spencer (unpublished ratings prepared for the San
Diego County Mammal Atlas). Specific criteria for each stratum are presented in Table 3. All initial
habitat designations were performed using ArcGIS software and available GIS layers. Groundtruthing
and aerial photographs obtained from Environmental Security AC/S (2003 Color Ortho (AC/S ES) and
2000 Color IR Ortho (SANDAG)) were used to verify and/or adjust MCBCP GIS vegetation layers
during the spring of 2005. During our groundtruthing efforts, we found low mapping accuracy for the
different grassland types (native, non-native, valley and foothill), so they were not separated in any
suitability definitions.
17

Table 3. Criteria used for the Proposed SKR Habitat Quality Map.
High All SKR habitat mapped in 1996 (Ref)All SKR captures through 2003 with 50m buffer
Medium Slope: < 50%Soil Classes2: 2, 3
Vegetation: Grasslands (native, non-native, valley and foothill), disturbed habitat, open engelmann oak woodland
Other Within 4 km of high quality stratum
Low a) Slope: < 50%Soil Classes2: 0,1,2,3
Vegetation: Grasslands (native, non-native, valley and foothill), disturbed habitat, open engelmann oak woodland
Other None
b) Slope: < 50%Soil Classes2: 2, 3
Vegetation: Coastal sage scrub, Coastal scrub-chaparral scrub, coast live oak open oak woodland
Other Within 4 km of high quality stratum1Impact areas and PPM habitat were excluded from all strata.2Soil quality rated for SKR (3= highest, 0= lowest), W. Spencer
SKR Habitat Quality Definitions for Strata1
18

19
Figure 3. Proposed habitat suitability map for SKR Monitoring Program

We chose an area of 50m × 50m for our sample unit. The sample unit size (2500 m2)
encompasses an area greater than the largest reported home range for SKR (1600 m2,Thomas 1975), is
small enough to be relatively homogeneous for habitat characterization, and is the established plot size
for SKR monitoring in the nearby Fallbrook Naval Weapons Station (Montgomery et al. 2005).
ArcGIS software was used to divide the entire study area into the 50m × 50m sample plots. Plots
that lie on habitat quality boundaries were assigned according to the majority of habitat within the plot.
Therefore, if the plot contained 60% “medium suitability” habitat and 40% “low suitability” habitat, the
plot fell into the “medium suitability” habitat boundaries.
Habitat suitability boundaries may be redrawn periodically to coincide with more precise
vegetation and soil mapping efforts on MCBCP. Our current model designations are based upon the
state of our current knowledge. Habitat suitability definitions may be revised based upon species-habitat
relationships that come out of analyses of the first several years of monitoring data. In addition,
significant associations may be shared with SKR researchers working on regional SKR habitat models
for greater understanding of the species.
Sampling Scheme
A total of 130 to 160 sample plots will be surveyed in the first year(s) among the strata. These
data will then be used to determine optimum sample allocation for the following years. All sample plots
will be characterized for habitat and landscape variables and surveyed for potential kangaroo rat
burrows. If there are no potential burrows, the plot will be deemed unoccupied. If any potential burrow
is identified in a sample plot, the plot will be live-trapped for two consecutive nights.
Sample allocation
In the first year, 40 to 50 sample plots will be randomly selected from each stratum; additionally,
the ten historical monitoring plots will be sampled. We will use the results (proportion occupied,
detection probabilities) from the first year to optimize sample size and allocation among the strata for
the following years (i.e. Cochran 1977, Krebs 1989). At that time, we will allocate the sampling effort
in order to obtain the best precision within the high and medium quality strata, which we will refer to as
the "focal monitoring area". Because there is a very large amount of low quality habitat, we do not
foresee expending substantial effort sampling habitat unlikely to support SKR. We will initially sample
the low quality habitat to determine whether low densities of SKR persist in these areas and to aid in
future habitat models. If, after the first one or two years, SKR occupancy in the low quality habitat is
determined to be too low to warrant continued effort (i.e. <4%), this stratum may be revised or removed
20

from the study. In that case, we may increase sampling effort in the focal monitoring area and
recommend the addition of random sampling units, if preferred by MCBCP, to obtain greater coverage
of the focal monitoring area over time. Otherwise, all sample plots will be permanent plots to be
sampled every year. This approach will yield the greatest power to detect positive or negative trends in
SKR occupancy and distribution on MCBCP (Elzinga et al. 1998, Schreuder 2004), which is the
primary goal of this monitoring program.
Phase 1: Burrow/ Sign Searches and Habitat Characterization
A complete search for active kangaroo rat sign (burrows, tracks, dust bathing sites, scat,
runways) will be conducted on each 50 m × 50 m sample plot. We define active kangaroo rat burrows as
those that are the proper size (approximately 1.5 inches in diameter), have loose soil, footprints, and/or
fresh scat with an obvious trail or clearing leading up to the entrance (Figure 4). Each sample plot will
be defined as potentially occupied by kangaroo rat(s) if it contains any kangaroo rat sign or one or more
possible active burrow(s). Kangaroo rat burrows may be confused with burrows of other rodents (mice,
gophers, squirrels). This is particularly true with gopher burrows, as they are the same diameter as SKR
burrows (Montgomery 2003). In addition, like many other rodents, SKR are thought to use burrows that
were previously dug by gophers or other species (Thomas 1975). Therefore, designation decisions will
be generous. All burrows that are presumed to be inhabited by gopher or squirrel will be examined
carefully for secondary sign such as appropriate scat, mounding (gopher burrows), and/or tracks for
confirmation. If there is any question to the surveyor, the plot will be designated as potentially occupied
for follow-up trapping. If a sample plot does not contain any kangaroo rat sign or potentially active
kangaroo rat burrows, it will be defined as "not occupied". In order to promote quality and consistency,
all participants will be trained in burrow identification and the number of surveyors will be kept to a
minimum. If a sample plot contains only one or two questionable burrows, a burrow probe (Peep-a-roo,
Sandpiper Technologies, Inc. Manteca, California) may be used to help confirm presence or absence.
Absence can only be confirmed using this method if the burrow(s) can be fully explored and contain
only a single entrance/exit hole. All surveys will be conducted in the late summer/early fall time period
when detectability of burrows is highest due to the drying and disarticulation of annual herbs and
grasses (O’Farrell and Uptain 1987, Montgomery 2002).
In addition to surveying for potential kangaroo rat sign and burrows, a number of habitat
variables will be recorded to use as covariates for habitat modeling (Table 4). All habitat characteristics
measured have been hypothesized to be important for SKR habitat suitability (O’Farrell and Uptain
1987, Montgomery et al. 1997, USFWS 1997) and were based on the current SKR habitat
characterization protocol for Fallbrook Naval Weapons Station (Montgomery et al. 2005).
21

a b
c d
Figure 4. Small mammal burrows. Kangaroo rat burrows with tracks and tail drags (a) and scat at entrance with apron of excavated soil (b), similar sized gopher burrows in clumped configuration with plugged openings (c), and much larger squirrel-sized burrow entrance (d). Note that kangaroo rats may use burrows dug by other small mammals, so observation of secondary sign is important. Lens cap is approximately 1.5 inches (40 cm) in diameter. Photos were taken in early (b-d) and late (a) spring.
22

23
Table 4. Habitat characterization form for all SKR sample plots. Field Measure/ Covariate Method Data Fields Purpose
LandscapeSlope clinometer Percent slope Habitat suitabilityAspect compass Degrees Habitat suitabilitySoil compaction penetrometer PSI Habitat suitability- burrow
suitability, vegetation growthSoil Texture TBD Sand (enter %) Habitat suitability
Silt (enter %)Clay (enter %)
Digital Photograph Digital Camera Photo Number VoucherVegetationVegetation Type From Zedler et al. 1997 Veg list + Other (write-in)Percent Cover- Open ground Visual estimate Enter % Habitat suitabilityPercent Cover- Annual Grasses Visual estimate Enter % Habitat suitabilityPercent Cover- Perennial Grasses Visual estimate Enter % Habitat suitabilityPercent Cover- Forbs Visual estimate Enter % Habitat suitabilityPercent Cover- Shrubs/Trees Visual estimate Enter % Habitat suitabilityD omprising >25% total cover in
ass layer (list)Habitat suitability
Dominant Species- ForbsVisual assessment
Species comprising >25% total cover in forb la
ominant Species- Annual GrassesVisual assessment
Species cannual gr
yer Habitat suitability
D es- Shrubs/TreesVisual assessment
Species comprising >25% total cover in shrub/tree la
ominant Speciyer (list)
Habitat suitability
Kangaroo Rat SignPresence of Active Kangaroo Rat Sign Search Y/N
IF YES to above: Type Systematic Visual Search burrows (1.5" diam.) with apron, burrows
(1.5" diam.) without apron, tracks, scat, dust bathing / cache sites, runways
Kangaroo Rat occupation
Individual Rodent Sign FormDType same as above same as aboveLocation GPS Lat/Lon
ate
gPreviously Marked? Y/N Pin flag, flag tape, other (choose one)N lew y Marked? Y/N Pin flag, flag tape, other (choose one)Burrow Probe Y/N
Animal found N Burrow empty, blocked, not able to ne
used?
gotiate turn, too narrowY Animal record- Would most likely be to
genus onlyPhoto Taken? Y Digital Camera VoucherDisturbance/ OtherPresence of road/ firebreak Search Y/N (Type: dirt road, gravel road, paved
road, firebreak)(Fill in distance for each: 0, 1-50, 51-200, >200 meters)
Habitat suitability/ dispersal
Recent Disturbance Visual search & estimate Vehicle tracks, footprints, fire, artillary (none, low or high- designation for each)
Management
Presence of gopher burrows Search, Visual estimate None/ Low/ High Habitat suitabilityPresence of squirrel burrows Search, Visual estimate None/ Low/ High Habitat suitability
Testing of temporal closure Assumption (see section "Supplements to Core Protocol")
Check potential burrow for krat presence/absence. Test utility of burrow probe.
Adapted from Montgomery et al. (2005)

Phase 2: Live-Trapping
SKR occurs sympatrically, and often syntopically, with DKR on MCBCP. Both kangaroo rats
are similar in size and there are no physical characteristics that distinguish SKR burrows from DKR
burrows; therefore, all sample plots containing potential kangaroo rat burrows will be live-trapped for
two consecutive nights. Trapping for two nights is needed to calculate and correct for imperfect capture
and detection probabilities (see analysis section). Capture probabilities for this species have been
reported to range from 22 to 100% (O'Farrell 1992, Montgomery 2002, 2003, Diffendorfer and
Deutschman 2002) and average 60% (14 studies, Diffendorfer and Deutschman 2002). Therefore, we
expect two nights should yield between 39 to 100 % (average 84%) of the total SKR occupying sample
plots. In order to increase the precision for estimates of PAO, detection and capture probabilities, at
least three sample plots will be trapped for three to four nights. These sample plots will be chosen
opportunistically as access to the training areas and survey scheduling will allow.
Twenty-five live-traps (Fifteen measuring 3×3.5×12 inches and ten measuring 4×4.5×15 inches)
will be placed in a 5 × 5 array, spaced approximately 10 m apart, on each plot (Figure 5). When obvious
kangaroo rat sign is within a few meters of a trapping point, the trap will be placed next to burrow
entrances, dust-bathing sites, or within runways to maximize capture success (O'Farrell 1992, Jones
1996). Diffendorfer and Deutschman (2002) report correlation coefficients of 57 to 66% when
comparing simulated results of a 5 × 5 grid trapped for two days to a 9 × 9 grid trapped for three days.
Thus, we expect this design will produce a reasonable index of SKR density.
50 m
50 m
Figure 5. Diagram of live-trapping grid on 50m x 50m sample plot. Nearby traps are placed near
kangaroo rat burrows (•) and trails (---) to increase probability of capture.
24

Trapping will be conducted during the late summer and fall months (September- November).
Fall months are reported to have the highest capture probabilities for SKR due to low availability of
food resources (O'Farrell and Uptain 1987) and temperatures are often mild during this period, which
should result in less stress to trapped animals. We also expect to be sampling the more stable adult
populations, as SKR young have likely dispersed or died (McClenaghan and Taylor 1993). Because
capture probabilities may decrease during full moon periods (O’Farrell 1974, Kaufman and Kaufman
1982, Price et al. 1984), we will attempt to conduct all trapping during new and part moon phases only.
Following approved protocols, trapping will be conducted by experienced small mammal
researcher(s) with a current U.S. Fish and Wildlife permit for trapping SKR. All traps will be set in the
afternoon using heat inactivated rolled oats as bait. If approved by USFWS, we will check traps in the
early morning only. If temperatures reach 55°F or below, in the case of heavy fog, if reproductive
females are found, or if not approved by USFWS, a midnight trap check will also be employed.
Individuals will be assessed for age, sex, and reproductive condition. For further species verification,
hind foot length, ear length, head length, preorbital width, and postorbital width measurements (Price et
al. 1992) will be taken of all kangaroo rats, and angle of bacula will be examined on all males (Lackey
1967a, Best and Schnell 1974). We will pull a small number of dorsal hairs and photograph at least one
individual identified as SKR and one individual identified as DKR on all occupied plots for voucher
purposes. All animals will be temporarily marked by clipping a small amount of fur from the hip area to
document recaptures.
Analysis/ Output
Proportion area occupied (PAO) will be calculated using a version of the logistic modeling
program PRESENCE. This program computes detection probabilities from the survey data that are then
used to produce an unbiased estimate of PAO. Calculations and equations are similar to those used for
capture-recapture analyses (MacKenzie et al. 2002, 2003). PRESENCE also enables these parameters
(PAO, detection probability) to be computed as a function of covariates. Thus, potential correlates to
SKR occupancy (habitat and landscape variables) and probability of detection (habitat & landscape
variables, environmental variables, animal density) can be evaluated. We will also explore presence-
absence models which incorporate repeated species count data (Royle and Nichols 2003, Royle 2004)
and species interactions (MacKenzie et al. 2004), although they are not currently designed for multi-
year data.
For preliminary analysis, we will assume the probability of detection for sign and burrow
searches is one. Therefore, variation in probability of detecting SKR will be from trapping data only.
There are several reasons for doing this. First, we expect that the probability of detecting an active
25

kangaroo rat burrow will be almost perfect, as we are systematically searching the entire sample plot
and being liberal in the designation of potential burrows. Second, because this portion of the dataset
necessarily contains 0's only (i.e. detection of possible kangaroo rat sign does not denote SKR
occupancy), PRESENCE cannot compute an accurate probability for this survey method (will
incorrectly estimate at near zero value). Finally, setting this parameter to one in the analysis will ensure
that SKR occupancy corrected for imperfect detection probabilities is not overestimated. We will test
this assumption in a supplemental study, detailed in the next section. For live-trapping, we will allow
PRESENCE to calculate SKR detection and capture probabilities directly from the data.
There is some question as to whether the current version of PRESENCE will be capable of
modeling this multi-phase design (i.e. model fitting difficulties with perfect or near perfect probability
of detecting burrow absence), however, a new version of PRESENCE is being developed that will easily
accommodate this data (D. MacKenzie, J. Nichols, J. Hines, personal communication). Therefore, first
year analyses may require the use of manual calculations along with PRESENCE to figure PAO
estimates corrected for imperfect detection probabilities within and among strata (Equation 1) and the
use of WinBUGS (MRC and Imperial College of Science, Technology and Medicine at St Mary's,
London) or other program to perform the covariate analyses.
Equation 1. Calculations for combining percent area occupied (PAO) means and variances within strata (burrow search and live-trap results) and among strata (high and medium suitability strata or “focal monitoring area”; Cochran 1977, Krebs 1989).
2
/
Stratum weight (equation 6.15)
Observed variance of stratum (equation 8.3)
Sample size in stratum
Sampling fraction in stratum /
h
h
h
h h h
W
s h
n h
f h
=
=
=
= =
n N
1ST =
L
h hh
N xx
N=
∑
ST = Stratified population mean per sampling unit
= Size of stratum
= Stratum number (1, 2, 3, , )
= Observed mean for stratum
= Total population size =
h
h
h
x
N h
h L
x h
N N∑
K
( ) ( )2 2
ST1
Variance of 1L
h hh
h h
w sx f
n=
= −⎡ ⎤⎢ ⎥⎣ ⎦
∑
Stratified proportion mean
Size of stratum h (ha)
Stratum number (1,2,3,…L)
Observed proportion mean for stratum h
Total area size (ha)
We present examples of proposed data input, covariates, and initial estimations of confidence
intervals for PAO both within and among the strata for the first year (Tables 5, 6, and 7). As explained
earlier, the PAO values produced from the first few years of monitoring will be used to optimize sample
allocation over the focal monitoring area (high and medium suitability strata) for future years (Cochran
1977, Krebs 1989). Precision around our parameter estimates will improve if covariates are found to
account for some heterogeneity in probabilities of detection and occupancy. Along with the habitat and
26

27
Type VarProbability of
Detection
Habitat % Shrub cover X% Annual herbs/ gras XSoil TypeSlope
Management Disturbance type (comDisturbance levelYears since last fire
Other SKR Density XDistance to nearest oc ation)Distance to nearest dir ation)
pothesized EffectCovariate
iable PAO
Xses X
XX
paction/artillery) XXX
cupied patch X (Colonizt road/ firebreak X (Coloniz
Hy
Table 6. Examples of covariates that may be evaluated in SKR models.
Plot Burrow Search Trap Night 1 Trap Night 2
1 - 0 0 Potential burrows identified No captures No captures2 - 1 1 Potential burrows identified SKR captured SKR captured3 0 - - N N/A4 0 - - N N/A5 - 0 1 P es SKR captured
Sampling Scheme ExplanationData InputDetection History
where 0= not detected, 1= detected, and "-" = not ngaroo rat sign in Phase 1 of protocol is entered as "-", as potential kangaroo rat detection of SKR.
o Potential burrows identified N/Ao Potential burrows identified N/A
otential burrows identified No captur
surveyed. Data input for potential ka sign and/or burrows is not a positive
Table 5. Proposed data input structure (without covariates) for a single year using hypothetical data.
landscape data collected during the burrow search surveys, we will also test the effects of other potential
covariates. These include those that may influence the likelihood of occupancy and colonization in
spatially structured populations, such as spatial relationships of sample plots (Stevens and Olsen 2002),
distance from nearest occupied patch (i.e. Stauffer 1985, Keitt et al. 1997) and distance from roads
(reviews Merriam 1993, Trombulak and Frissel 2000). Examples of covariates for analysis are presented
in Table 6.

28
Stratum
Proportion of plots with potential K-Rat
Burrows/Sign (pBS)*
SKR Burrow/Sign detection probability
(pBD)*
SKR live-trap detection probability
(pLT)*
Percent Area
Occupied (PAO)** PAO (se) 90% CL
Area Occupied
(ha) + 90% CL Result
High 50% 0.504 (.060) .402- .606 298- 448Medium 6.0 -7.5% 0.075 (.040) .007- .144 43- 837
Low 2.0 -2.5% 0.024 (.023) 0- .063 0- 703
High + Medium 12.5% 0.124 (.036) .063- .184 414- 1207
High 50% 0.504 (.089) .352- .657 261- 486Medium 6.0 -7.5% 0.075 (.044) .001-.149 9- 871
Low 2.0 -2.5% 0.047 (.046) 0- .125 0- 1400
Hi h + Medium 12.5% 0.124 (.040) .056- .191 368- 1253
High 50% 0.504 (.046) .426- .582 315- 431Medium 6.0 -7.5% 0.066 (.035) .006- .126 38- 738
Low 2.0 -2.5% 0.042 (.053) 0- .132 0-1478
High + Medium 12.5% 0.115 (.031) .063- .168 413- 1103
High 0.6 50% 0.504 (.060) .402- .606 298- 448Medium 0.4 6.0 -7.5% 0.077 (.039) .010- .145 56- 848
Low 0.2 2.0 -2.5% 0.021 (.018) 0- .052 0- 300
Hi h + Medium 12.5% 0.125 (.035) .066-.184 436- 1209
High 50% 0.873 (.096) .713- 1.0 527-740Medium 6.0 -7.5% 0.133 (.088) 0- .28 0- 1633 ↑ PAO ↑ Bias***
Low 2.0 -2.5% 0.079 (.054) 0- .169 0- 1899 ↓ Precision
Hi h + Medium 12.5% 0.217 (.079) .085- .348 2230- 9159
no
stra
ta
Hi h + Medium 0.6 1 0.6 12.5 0.13 (.049) .048- .212 317- 1392 ↓ Precision
*** Bias due to inability of program to estimate parameter with negative (0) data only.**Calculated using Equation 1. Combined results of live-trapping (using PRESENCE) and burrow counts for each stratum.
Parameter Estimates Output (n=50)
Con
trol
0.6 1.0 0.6
low
pLT
0.6 1.0 0.4
0.8
p BD n
ot fi
xe
g
g
g
g
d
0.6 not fixed 0.6
*pBS= proportion of grids with potential kangaroo rat burrows, pBD= probability of detecting an SKR burrow, if one or more is in plot, pLT= probability of capturing an SKR, if one or more is in plot
↓ Precision
• Precision
• Precision
Varia
ble
p BS
1.0 0.6
high
pLT
0.6 1.0
Table 7. Estimated precision in PAO and area estimates illustrated using simulated datasets. Simple models were generated under a number of possible scenarios. Sample allocation will be optimized for high and medium strata “focal monitoring area (high and medium strata)” after first year. Low suitability habitat estimates were highly variable for all runs except where pBS = 0.2. Precision will increase if any covariates account for a significant amount of heterogeneity in SKR occupancy.
28

29
The precision of PAO estimates (status) for any given year are important. However, we are
fundamentally interested in monitoring change over time. Therefore, the precision of our main index of
population growth or decline (rate of colonization/ extinction) is equally, if not more important. We can
maximize the precision to detect positive and negative trends by making all of our sample plots
permanent (re-sampled every year; i.e. Elzinga et al. 1998, Schreuder et al. 2004). This basically
removes nearly all variability between sample plots from the error term, thereby increasing the
statistical power to detect differences between years. Providing that we 1) have a large number of
samples and 2) our survey methods do not affect SKR occupancy among years, the use of all permanent
sample plots should not compromise the accuracy of our yearly PAO estimates (D. MacKenzie personal
communication). There are currently no readily available programs to estimate the power of detecting
trends in these types of patch occupancy models. However, simple comparisons for precision in
detecting population declines with permanent vs. random sample plots are presented in Table 8. After
two years of data are collected, we can estimate the actual precision around this parameter. As with
other parameters, confidence intervals around the rate of population growth or decline will improve if
covariates are found to account for heterogeneity in the rates of colonization and extinction.
For model selection and inference, we will follow the information-theoretic approach (Burnham
and Anderson 2002) and recommended methods for analyzing the fit of site-occupancy models
(MacKenzie and Bailey 2004)
A density index for SKR within each stratum will be calculated using a simple closed capture
model available in Program MARK (White and Burnham 1999). Estimates will be generated for the
following parameters: probability of initial capture, probability of recapture, and population size. The
population size estimate and 90% confidence interval will be used as our density index.
We will continue to concurrently analyze trends for the ten historic grids as presented in
Figure 2.
Assumptions
Any attempt to quantify changes in species occupancy may be biased if actual conditions do not
follow the basic assumptions of the statistical model. The following two assumptions are important to
our PAO model.
1. There is a perfect probability of detecting active kangaroo rat sign/burrows. This will be
tested with supplemental study 1, described below.

30
Sam
Perm
A
1
0.46) ifbarandom
2 test for correlated proportions (permanent) and chi-square test of independent proportions with continuity correction (random) using NCSS/PASS software (Kayesville, Utah). n = 50 per stratum
n/a
Estimates of initial sensitivity to detect SKR population decline with 90% confidence2
(a) Extinction only, no colonization
(b) Net extinction over background rates of 10% in
both colonization & extinction
ple SchemeHypothetical patch
occupancy dynamics1
anent sites onlyStratum Initial PAO estimate
Minimum detectable decrease in PAO
(Proportion)
Minimum detectable decrease in PAO
(Percentage)High 0.500 0.060 12%
Medium 0.075 0.060 80%
High + Medium 0.125 0.030 24%
High 0.500 0.110 22%Medium 0.075 0.080 -
High + Medium 0.125 0.050 40%
ll Random
High 0.500 0.180 36%Medium 0.075 0.134 -
High + Medium 0.125 0.103 77%
(a) assumes that no new patches become occupied. Therefore, if SKR occupancy is 0.50 for the high quality stratum in year 1, we can detect a decrease in SKR occupancy in year 2 of 0.06 (to or 12% with 90% confidence. (b) assumes that there are both extinction and colonization events between time 1 and time 2 (rates of 10% each) with an added net rate of extinction. Therefore,
initial SKR occupancy is 0.50 for the high quality stratum in year 1, we can detect a net decrease in SKR occupancy in year 2 of 0.11 (to 0.39) or 22% with 90% confidence over an above ckground colonization and extinction rates of 10% (i.e. 10% of the patches become unoccupied and the same number become newly occupied for no net change in occupancy). If all sites are
ly chosen each year, only the net change in occupancy is statistically testable.
McNemar's
Table 8. Simple sensitivity estimates for detecting SKR population decline between years. Two sampling schemes are compared; one in which all sites are permanent and resurveyed every year and another in which sites are randomly chosen each year. Precision for sampling schemes that use both types of sites would fall between these estimates. Note that the precision of detecting declines with permanent sites is reduced with increasing background levels of colonization and extinction, as this reduces the positive correlation of values between surveys.
30

2. The population is closed in both time and space. Therefore, no kangaroo rats are moving to
or from sample plots within the time of sampling. The model should be robust to all but large
systematic violations of this assumption (Kendall 1999) which we will test in supplemental
study 2, described below. We will also attempt to minimize any violations of this assumption
by 1) surveying in the fall, after we expect most juveniles have dispersed and reproductive
activity has ceased, and 2) conducting Phase 1 burrow searches and Phase 2 trapping as close
in time as possible.
Management
In the Draft Biological Assessment and Management Plan for SKR on MCBCP (1999), a goal to
keep a total of 1000 acres (405 ha) occupied by SKR was suggested. The final goal is currently
unknown, as it will be determined after future consultation with the Fish and Wildlife Service. Until a
final goal is reached, however, we will recommend specific management actions for SKR if the total
area occupied estimate with 90% confidence limits falls below 1000 acres (405 ha) within the high
suitability stratum. If, due to low occupancy or detection probability, these confidence limits are too
wide to be a useful threshold for management action, we may recommend use of lesser confidence
limits or estimated mean area occupied to trigger action. Even if corrected estimates of SKR occupancy
within MCBCP remain within the specified limits, we encourage ongoing management of SKR habitat.
We will also recommend management actions if SKR occupancy declines markedly for any of the
known population groups (p.8 and Figure 1). Management typically involves removal of shrub cover
(i.e. burning, scraping, grazing, mowing), but can also take the form of soil decompaction, digging
artificial burrows (S. Montgomery, personal communication), and/or reduced training impacts (i.e.
heavy vehicles and artillary). A detailed review of potential management actions for MCBCP is
presented by Tetratech Inc. (1999).
Management actions should be linked to this monitoring effort in order to evaluate their
effectiveness in increasing SKR habitat boundaries and/or densities. Management treatments can be
conducted, but not limited to the permanent study grids, so that the results on SKR populations can be
monitored through time. Disturbances created by fire or troop activities that are not the result of
purposeful management actions may also incorporated or evaluated separately for effects on SKR
occupancy and density in the model. A simple study design is presented below under Future Study
Recommendations.
31

Further Study Recommendations
First, we present a recommended list of supplemental studies to support or answer questions
related to the “core” protocol. Some of these studies are necessary for at least the first year of
monitoring, others are optional. Second, we recommend optional primary studies to fill in information
gaps in our basic knowledge of SKR biology. Although these studies may not be feasible at this time,
they would greatly increase our understanding of SKR if the opportunity presents itself in the future.
Specific: Supplements to core protocol
Burrow Searches: Detection probability
For our Phase 1 sampling, we assume that we have a perfect probability of detecting SKR
absence by the observed absence of any potentially active kangaroo rat burrows. We will continually
scrutinize this assumption by yearly live-trapping three randomly selected sample plots per strata that
were judged to be absent after conducting a thorough burrow search.
In addition, we will test the difference in detectability between observers by conducting double-
observer surveys for kangaroo rat burrows and other kangaroo rat sign on a predefined selection of 5 to
10 sample plots.
Sign and Burrow Search: Testing Closed Population Model Assumptions:
This aspect of the protocol will be implemented in the first year of surveys to test whether the
state of SKR occupancy (present/ absent) may change between the time of conducting sign/ burrow
searches and live-trapping. During the initial phase, in all sample plots with potentially active burrows,
we will mark at least one potentially active burrow with a pin flag and document the burrow with a
photograph. Upon returning to the sample plot for live-trapping, the flagged burrow will be reassessed
for potential occupancy and another photograph will be taken. We will also reassess all grids that are
live-trapped, including the nine initially absent sites (see Burrow Searches: Detection Probability) for
potential kangaroo rat burrows upon returning for live-trapping.
Effects of SKR Habitat Management
In order to study the effects of management on SKR populations, we recommend a simple
repeated measures ANOVA design that can be directly incorporated into the monitoring protocol. This
32

design could determine whether SKR return to historic habitat or move into adjacent habitat after
management and if so, the timeliness and duration of this response (Table 9). The management areas
would be chosen randomly from the set of permanent grids and/or chosen opportunistically in response
to MCBCP availability and land use constraints. Disturbance that is not related to active management
but that result in habitat clearance, such as fire or trampling, can also be evaluated in this manner.
Table 9. Simple ANOVA design to study effects of management.
Factors LevelsBetween-subject
Management Y/N (≥3 replicates each)Within-subject
Time Years (0,1,2,3,..)Response Variables
Occupation by SKR Y/NDensity of SKR quantitative or low/high
Normalize for following factors before study:Occupation status before treatmentDistance to nearest known current population
Alternate methods of species confirmation:
Scat
Often, scat can be found near the opening of active kangaroo rat burrows. We would like to
explore the development of an assay to differentiate SKR from DKR using mitochondrial DNA
obtained from shed epithelial cells found in scat (Foran et al. 1997). This may provide a cost effective
alternative to live-trapping for discriminating these two species.
Hair snares
Hair snares are commonly used as a cost-effective indirect detection method for medium and
large elusive mammals, such as fishers, martens, wolverines, lynx, and bears (Zielinski and.Kucera. 1995, Mills et al. 2000, Boulanger et al 2002). They have also been used with some success for smaller
mammals (Suckling 1978, Dickman 1986, Sanecki and Green 2005). We would like to explore the
development of a passive hair snare devise for kangaroo rats. Species could be identified based upon
hair characteristics or genetic analysis (Mills et al. 2000). Information gained from genetic analyses of
DNA extracted from hair follicles could not only be used to model SKR distribution and abundance but
could potentially be used to elicit information on population demography, heredity, and dispersal
(Girman et al. 2001, Boulanger et al 2002, Ernest et al. 2003, Valero 2004, Stanley and Royle 2005).
33

General: Information Gaps
Although the Stephens’ kangaroo rat has been relatively well studied in comparison to other
rodents, there are still large gaps in our basic knowledge of life history traits and population dynamics.
Dispersal
There have been few studies on SKR dispersal (Price et al. 1994b, Kelt 2005). Of these, most are
primarily based on live-trapping (i.e. “dispersal rings”, movements between grids) that can result in
underestimation of dispersal rates and distances, because movements in and out of the study grid often
cannot be differentiated from mortality and recruitment. The current evidence has shown that SKR are
fairly sedentary, although adults and juveniles do make long range movements greater than one
kilometer (Price et al. 1994b). There are many questions of SKR dispersal that need further study; Is
dispersal related to density? Are there patterns in the timing of dispersal? Is dispersal distance related to
sex or age class? Is the likelihood of dispersal between populations related to distance between suitable
habitat patches and/or availability of dispersal corridors? Because our monitoring protocol is conducted
only one time per year, we do not expect that permanent marking would reveal information on dispersal,
although documentation of some individual movements are possible. However, we can collect hair or
other tissue from captured individuals. We believe that genetic analyses of SKR populations in Camp
Pendleton using microsatellite DNA and other markers would be a cost-effective way to uncover
information on recent and historical dispersal dynamics (e.g. Boulanger et al. 2002, Ernest et al. 2003,
Valero 2004). Also, seasonal or year-long radiotelemetry studies conducted on at least two independent
trapping sites may generate added information on SKR dispersal dynamics, such as dispersal as it
relates sex, age, and population density (e.g. Gillis and Krebs 1999, Loew 1999). Non-traumatic
methods for transmitter attachment may need to first be explored on a similar species.
Demography
Demographic models for SKR have been problematic due to high spatial and temporal
variability in abundance and capture probability. We support participation in a long-term demographic
study over the extent of SKR habitat in San Diego and Riverside Counties (Diffendorfer and
Deutschman 2002). Because SKR densities are typically low, this effort requires the use of large
trapping grids. In addition, because of the spatial and temporal variability, this effort also will require a
large number of grids to be trapped at frequent intervals for an estimated ten to twenty years. The
relationship between dispersal and demographic parameters is also largely unknown (Price et al. 1994b).
Therefore, co-implementation of a dispersal study (above) is recommended.
34

Acknowledgements
We would like to thank all of the workshop participants for their valuable insight, comments,
and recommendations. Their input was very useful in the production of this protocol. Andrea Atkinson
was instrumental in laying the groundwork for this process and giving advice on preparation for the
workshop and study plan. In addition, Julie Yee, Mark Pavelka, William Miller, and Wayne Spencer
thoroughly reviewed and provided useful comments for this protocol. We greatly appreciate Randy
Nagel of the USFWS for working with us to produce the SKR habitat suitability GIS layers. We would
also like to thank Wayne Spencer for providing SKR suitability values for all soil types. Finally, we are
grateful to the Wildlife Management Branch, MCB Camp Pendleton, and in particular William H.
Berry, Robert Lovich, and James Asmus for supporting and funding this project.
35

References
AMEC Earth and Environmental. 2004. DRAFT: Central Camp Pendleton artillery firing areas Stephens’ kangaroo rat survey: Marine Corps Base Camp Pendleton, California. Prepared for AC/S Environmental Security, Marine Corps Base, Camp Pendleton.
Berger, J. 1990. Persistence of different-sized populations: an empirical assessment of rapid extinctions in bighorn sheep. Conservation Biology 4:91-98.
Best, T. L., and G. D. Schnell. 1974. Bacular variation in kangaroo rats (genus Dipodomys).
American Midland Naturalist 91:257-270.Bleich, V.C. 1973. Ecology of rodents at the United States Naval Weapons Station Seal Beach, Fallbrook Naval Weapons Annex, San Diego County, California. M.A. Thesis, California State University, Long Beach.
Bleich, V.C. 1977. Dipodomys stephensi. Mammalian Species 73:1-3.
Boulanger, J., White, G. C., McLellan, B.N., Woods, J., Proctor, M., and Himmer, S. 2002. A meta-analysis of grizzly bear DNA mark-recapture projects in British Columbia, Canada. Ursus 13: 137-152
Brock, R.E, and D. A. Kelt. 2004a. Conservation and social structure of Stephens’ kangaroo rat: Implications from burrow-use behavior. Journal of Mammalogy 85(1): 51-57.
Brock, R.E, and D. A. Kelt. 2004b. Influence of roads on the endangered Stephens’ kangaroo rat: are dirt and gravel roads different? Biological Conservation 118: 633-640.
Brock, R.E, and D. A. Kelt. 2004c. Keystone effects of the endangered Stephens’ kangaroo rat (Dipodomys stephensi). Biological conservation 116: 131-139.
Brown , J.H. and E.J. Heske. 1990. Control of a desert-grassland transition by a keystone rodent guild. Science 250: 1705-7.
Burke, R.L., Tasse, J., Badgley, C., Jones, S.R., Fishbein, N., Phillips, S., and M.E. Soulé. 1991. Conservation of the Stephens’ kangaroo rat (Dipodomys stephensi): planning for persistence. Bull. Southern California Academy of Science 90(1):10-40.
Burnham, K.P. and D.R. Anderson. 2002. Model Selection and Inference. A Practical Information-Theoretical Approach (2nd Edition). Springer-Verlag, New York.
Callaway, R.M. and F.W. Davis. 1993. Vegetation dynamics, fire, and the physical environment in coastal central California. Ecology 74(5):1567-1578.
Cochran, W.G. 1977. Sampling Techniques (3rd ed.), Wiley, New York.
Dickman, C.R. 1986. A method for censusing small mammals in urban habitats. Journal of Zoology. 210(4):631-636.
Diffendorfer, J. and D. Deutschman. 2002. Monitoring the Stephens’ kangaroo rat: An analysis of monitoring methods and recommendations for future monitoring. Report for the U.S. Fish and Wildlife Service.
Elzinga, C. L., D. W. Salzer, and J. W. Willoughby. 1998. Measuring and Monitoring Plant Populations. BLM Tech. Ref. 1730-1.
36

Ernest, H.B., Boyce, W.M., Bleich, V.C., May, B., Stiver, S. J., and S G. Torres. 2003. Genetic structure of mountain lion (Puma concolor) populations in California. Conservation Genetics 4(3): 353-366.
Fahrig, L. 1992. Relative importance of spatial and temporal scales in a patchy environment. Theoretical Population Biology 41:300-314.
Foran, D.R., Crooks, K.R., and S.C. Minta. 1997. Species identification from scat: an unambiguous genetic method. Wildlife Society Bulletin 25(4):835-839.
French, A.R. 1993. Physiological ecology of the Heteromyidae: economics of energy and water utilization. In H.H. Genoways and J.H. Brown (eds.) Biology of the Heteromyidae, Special Publication No, 10 of the American Society of Mammalogists, pages 509-538.
Geissler, P.H. and T.L. McDonald. 2005. Systematic and Stratified Sampling Designs In Long-Term Ecological Monitoring Studies, unpublished. http://www.pwrc.usgs.gov/brd/SampleDesigns.doc
Gillis, E.A. and C.J. Krebs. 1999. Natal Dispersal of Snowshoe Hares during a Cyclic Population Increase. Journal of Mammalogy 80(3):933-939.
Girman, D J., Vilà, C. ,Geffen, E., Creel, S., Mills, M. G. L., McNutt, J. W., Ginsberg, J., Kat, P. W. , Mamiya, K. H. and R. K. Wayne. 2001. Patterns of population subdivision, gene flow and genetic variability in the African wild dog (Lycaon pictus). Molecular Ecology 10:1703-1723.
Goldingay, R.L., Kelly, P.A. and D.F. Williams. 1997. The kangaroo rats of California: endemism and conservation of keystone species. Pacific Conservation Biology 3:47-60.
Goldingay, R.L. and M.V. Price. 1997. Influence of season and a sympatric cogener on habitat use by Stephens’ kangaroo rat. Conservation Biology 11:708-717.
Hanski, I., and D. Simberloff. 1997. The metapopulation approach, its history, conceptual domain, and application to conservation. Pages 5-26 in I. A. Hanski and M. E. Gilpin, editors. Metapopulation biology: Ecology, genetics, and evolution. Academic Press, San Diego, CA
Jones, C., McShea, W.J., Conroy M.J., and T.J.Kunz. 1996. Capturing mammals. In D.E. Wilson, F.R. Cole, J.D. Nichols, R. Rudran, and M. Foster (eds) Measuring and Monitoring Biological Diversity: Standard Methods for Mammals. Smithsonian Institution Press, Washington, pages 115-122.
Jones, L. and J. Diamond. 1976. Short-term base studies of turnover in breeding bird populations on the California Channel Islands. Condor 78:526-549.
Kaufman, D.W. and G.L. Kaufman. 1982. Effects of moonlight on activity and microhabitat use of Ord’s kangaroo rat. Journal of Mammalogy 63:309-312.
Keeley, J.E. 2002. Fire management of California shrubland landscapes. Environmental Management 29(3):395-408.
Keitt, T.H., D.L. Urban, and B.T. Milne. 1997. Detecting critical scales in fragmented landscapes. Conservation Ecol. 1(1):4.
Kelt, D.A., Konno, E.S., and J.A. Wilson. 2005. Habitat management for the endangered Stephens’ kangaroo rat: The effect of mowing and grazing. Journal of Wildlife Management 69(1):424-429.
37

Kendall, W.L. 1999. Robustness of closed capture-recapture methods to violations of the closure assumption. Ecology 80: 2517-2525.
Krebs, C.J. 1989. Ecological Methodology. Harper Collins Publishers, Inc. New York. 654pp.
Lackey, J.A. 1967a. Biosystematics of the heermani group kangaroo rats in southern California. Transactions of the San Diego Society of Natural History 14:313-344.
Lackey, J.A. 1967b. Growth and development of Dipodomys stephensi. Journal of Mammalogy 48:624-632.
Lande, R. 1988. Genetics and demography in biological conservation. Science 241:1455-1460.
Loew, S.S. 1999. Sex-biased dispersal in eastern chipmunks, Tamias striatus. Evolutionary Ecology 13(6):557-577.
Lowe M. 1997. Diet of Stephens’ kangaroo rat, Dipodomys stephensi. Southwestern Naturalist 42(3): 358-361.
MacKenzie, D. I and L.L. Bailey. 2004. Assessing the fit of site-occupancy models. Journal of Agricultural, Biological, and Environmental Statistics 9(3):300-318.
MacKenzie, D.I., Bailey, L.L. and J.D. Nichols. 2004. Investigating species co-occurrence patterns when species are detected imperfectly. Journal of Animal Ecology 73(3):546.
MacKenzie, D. I., Nichols, J.D., Hines, J.E., Knutson, M.G., and A.B. Franklin. 2003. Estimating site occupancy, colonization, and local extinction when a species is detected imperfectly. Ecology 84(8): 2200-2207.
MacKenzie, D. I., Nichols, J.D., Lachman, G.B., Droege, S., Royle, J.A., and Ca.A. Langtimm. 2002. Estimating site occupancy rates when detection probabilities are less than one. Ecology 83(8): 2248-2255.
Marine Corps Base Camp Pendleton. 2001. Integrated Natural Resources Management Plan. http://www.cpp.usmc.mil/base/environmental/inrmp.htm
McClenaghan, Jr., L.R and E. Taylor. 1993. Temporal and spatial demographic patterns in Dipodomys stephensi from Riverside County, California. Journal of Mammalogy 74(3):636-645.
Merriam, G. 1993. Movement in spatially divided populations: Responses to landscape structure. In W.Z. Lidicker (ed) Landscape Approaches in Mammalian Ecology and Conservation. University of Minnesota Press, Minneapolis.
Mills, L.S., Pilgrim, K.L., Schwartz, M.K. and K. McKelvey. 2000. Identifying lynx and other North American felids based on MtDNA analysis. Conservation Genetics 1(3):285-288.
Montgomery, S.J. 2002. Results of a 1998 Field monitoring study of the Stephens’ kangaroo rat at Marine Corps Base, Camp Pendleton, CA. Prepared for AC/S Environmental Security, Marine Corps Base, Camp Pendleton.
Montgomery, S.J. 2003. Final report of 2002 erosion control activities in the Juliett training area of Marine Corps Base, Camp Pendleton, CA. Prepared for AC/SEnvironmental Security, Marine Corps Base, Camp Pendleton.
38

Montgomery, S.J. 2004. Results of a 2000 Field monitoring study of the Stephens’ kangaroo rat at Marine Corps Base, Camp Pendleton, CA. Draft Report to AC/S Environmental Security, Marine Corps Base, Camp Pendleton.
Montgomery, S.J., D.J. Grout, A. Davenport, R.N. Knight, and SJM Biological Consultants. 2005. Stephens' Kangaroo Rat Monitoring Program, and Results of the 2001-2002 Monitoring Session, at Naval Weapons Station Seal Beach, Detachment Fallbrook, Fallbrook, California. Prepared for Conservation Program Manager, Naval Weapons Station Seal Beach, Detachment Fallbrook, Fallbrook, California.
Montgomery, S.J., Sawaski, J, and D. Mitchell. 1997. Survey report and addendum for Stephens’ kangaroo rat on Marine Corps Base Camp Pendleton, California. Prepared for AC/S Environmental Security, Marine Corps Base, Camp Pendleton.
Naval Energy and Environmental Support Activity (NEESA). 1984. Initial Assessment Study of Marine Corps Base, Camp Pendleton, California. NEESA 13-057.
O’Farrell, M. 1974. Seasonal activity patterns of rodents in a sagebrush community. Journal of Mammaology 55:809-823.
O’Farrell, M. 1992. Establishment of a population monitoring program for the endangered Stephens’ kangaroo rat. Transactions of the western section of the Wildlife Society 28:112-119.
O’Farrell, M.J. and C.E. Uptain. 1987. Distribution and aspects of the natural history of Stephens’ kangaroo rat (Dipodomys stephensi) on the Warner Ranch, San Diego County, California. Wassman Journal of Biology 45:34-48.
O’Farrell, M.J. and C.E. Uptain. 1989. Assessment of population and habitat status of the Stephens’ kangaroo rat (Dipodomys stephensi). California Department of Fish and Game Nongame Bird and Mammal Section, Report 72.
Price, M.V. and 1993 Field ecology class. 1993. The potential value of fire for managing Stephens’ kangaroo rat habitat at Lake Perris State Recreation Area. Supplement for California Dept of Parks and Recreation.
Price, M.V. and P.R. Endo. 1989. Estimating the distribution and abundance of a cryptic species, Dipodomys stephensi (Rodentia: Heteromyidae), and implications for management. Conservation Biology 3:293-301.
Price, M. V. and M. Gilpin. 1996. Modellers, mammalogists, and metapopulations: designing Stephens' kangaroo rat reserves. In: D. R. McCullough (ed.) Metapopulations and Wildlife Conservation and Management. Island Press, Washington DC, pp. 217-240.
Price, M.V., Goldingay, R. L., Szychowski, S, and N.M. Waser. 1994b. Managing habitat for the endangered Stephens’ kangaroo rat (Dipodomys stephensi): Effects of shrub removal. Am. Midl. Nat. 131:9-16.
Price, M.V. and P.A. Kelly. 1994. An age-structured demographic model for the endangered Stephens’ kangaroo rat. Conservation Biology 8:810-821.
Price, M.V., P.A. Kelly, and R.L. Goldingay. 1992. Distinguishing the endangered Stephens' kangaroo rat (Dipodomys stephensi) from the Pacific kangaroo rat (Dipodomys agilis). Bull. Southern California Acad. Sci. 91(3):126-136.
39
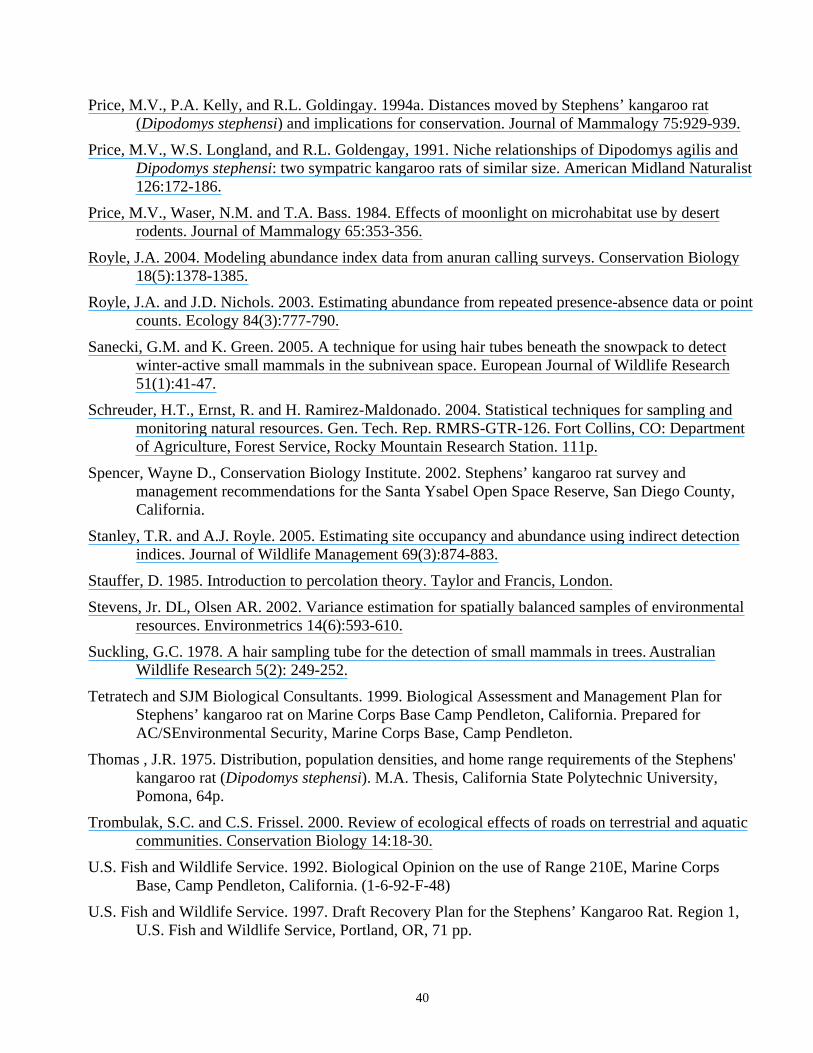
Price, M.V., P.A. Kelly, and R.L. Goldingay. 1994a. Distances moved by Stephens’ kangaroo rat (Dipodomys stephensi) and implications for conservation. Journal of Mammalogy 75:929-939.
Price, M.V., W.S. Longland, and R.L. Goldengay, 1991. Niche relationships of Dipodomys agilis and Dipodomys stephensi: two sympatric kangaroo rats of similar size. American Midland Naturalist 126:172-186.
Price, M.V., Waser, N.M. and T.A. Bass. 1984. Effects of moonlight on microhabitat use by desert rodents. Journal of Mammalogy 65:353-356.
Royle, J.A. 2004. Modeling abundance index data from anuran calling surveys. Conservation Biology 18(5):1378-1385.
Royle, J.A. and J.D. Nichols. 2003. Estimating abundance from repeated presence-absence data or point counts. Ecology 84(3):777-790.
Sanecki, G.M. and K. Green. 2005. A technique for using hair tubes beneath the snowpack to detect winter-active small mammals in the subnivean space. European Journal of Wildlife Research 51(1):41-47.
Schreuder, H.T., Ernst, R. and H. Ramirez-Maldonado. 2004. Statistical techniques for sampling and monitoring natural resources. Gen. Tech. Rep. RMRS-GTR-126. Fort Collins, CO: Department of Agriculture, Forest Service, Rocky Mountain Research Station. 111p.
Spencer, Wayne D., Conservation Biology Institute. 2002. Stephens’ kangaroo rat survey and management recommendations for the Santa Ysabel Open Space Reserve, San Diego County, California.
Stanley, T.R. and A.J. Royle. 2005. Estimating site occupancy and abundance using indirect detection indices. Journal of Wildlife Management 69(3):874-883.
Stauffer, D. 1985. Introduction to percolation theory. Taylor and Francis, London.
Stevens, Jr. DL, Olsen AR. 2002. Variance estimation for spatially balanced samples of environmental resources. Environmetrics 14(6):593-610.
Suckling, G.C. 1978. A hair sampling tube for the detection of small mammals in trees. Australian Wildlife Research 5(2): 249-252.
Tetratech and SJM Biological Consultants. 1999. Biological Assessment and Management Plan for Stephens’ kangaroo rat on Marine Corps Base Camp Pendleton, California. Prepared for AC/SEnvironmental Security, Marine Corps Base, Camp Pendleton.
Thomas , J.R. 1975. Distribution, population densities, and home range requirements of the Stephens' kangaroo rat (Dipodomys stephensi). M.A. Thesis, California State Polytechnic University, Pomona, 64p.
Trombulak, S.C. and C.S. Frissel. 2000. Review of ecological effects of roads on terrestrial and aquatic communities. Conservation Biology 14:18-30.
U.S. Fish and Wildlife Service. 1992. Biological Opinion on the use of Range 210E, Marine Corps Base, Camp Pendleton, California. (1-6-92-F-48)
U.S. Fish and Wildlife Service. 1997. Draft Recovery Plan for the Stephens’ Kangaroo Rat. Region 1, U.S. Fish and Wildlife Service, Portland, OR, 71 pp.
40

Valero, Shea J. 2004. Estimates of genetic variation, gene flow and dispersal of the southern mule deer, Odocoileus hemionus hemionus, using a non-invasive method. Thesis (M.S.) San Diego State University, 2004.
White, G.C. and K. P. Burnham. 1999. Program MARK: Survival estimation from populations of marked animals. Bird Study 46 Supplement, 120-138.
Zedler, P.H., Gautier, C.R., and G.S. McCaster. 1983. Vegetation change in response to extreme events: the effect of a short interval between fires in California chaparral and coastal scrub. Ecology 64(4):809-818.
Zielinski, W.J. and T.E. Kucera. 1995. American Marten, Fisher, Lynx, and Wolverine: Survey Methods for Their Detection. USDA Forest Service General Technical Report PSW GTR-157.
41

42
Appendix 1. Scientific Panel and SKR Workshop members
Workshop Organizers: Cheryl Brehme, US Geological Survey Robert Fisher, US Geological Survey Email: [email protected] Email: [email protected] Telephone: 858-637-6897 Telephone: 858-637-6882 Bill Berry, MCB Camp Pendleton Stacie Hathaway, US Geological Survey Email: [email protected] Email: [email protected] Telephone: (760) 725-9729 Telephone: 858-637-6891
Scientific Panel: Kenneth Burnham. Statistician, USGS/ Colorado State University – Peer Review Panel Douglas Kelt, Associate Professor of Wildlife Ecology, UC Davis – Peer Review Panel Anthony Olsen, Environmental Statistician. US Environmental Protection Agency. Peer Review Panel Stephen Montgomery, Biologist, SJM Biological Consultants- Subject Matter Expert
Additional Participants: Andrea Atkinson, US Geological Survey Lianne Ball, US Fish and Wildlife Service Maeve Hanley, County of San Diego Robbie Knight, Fallbrook NWS Dave Lawhead, CA Dept. of Fish and Game Robert Lovich, Anteon Associates
Samantha Marcum, US Fish and Wildlife Service William Miller, US Fish and Wildlife Service Yvonne Moore, CA Dept. of Fish and Game Mark Pavelka, US Fish and Wildlife Service Christy Wolf, Anteon Associates/ MCBCP Julie Yee, US Geological Survey
Roles of Workshop Members The Scientific Peer Review Panel (SPRP) consists of scientists with a strong background in wildlife monitoring methodologies and statistics, small mammal ecology and/or SKR natural history. Prior to the workshop, the SPRP will review the relevant background literature provided to them by USGS. At the workshop, the SPRP will evaluate existing monitoring design(s) and decide upon a design to meet the program objectives. After the workshop, USGS will submit a draft of the monitoring protocol to the SPRP. The SPRP will then provide USGS with their review and comments of the draft. USGS is responsible for organizing the panel and workshop, developing a protocol review system, managing of the process, and the completion of the draft and final monitoring protocol. The MCBCP representative and his designee will provide an oversight role to USGS and will be engaged in all meetings and correspondence. Invited representatives from USGS, USFWS, CDFG, SDSU and other agencies and scientists will act in a support capacity to the Scientific Peer Review Panel during the workshop, and are encouraged to join in the discussion. Representatives will be provided a draft of the monitoring protocol but are not required to submit their comments to USGS staff. The SPRP will have the final decision on the monitoring protocol recommendations for implementation on MCB Camp Pendleton

Appendix 2. SKR Conceptual Model
LOW
H
IGH
43

Appendix 3. SKR Model of Seasonal Variability and Abundance
44

Appendix 4. SKR Life History & Stressors
General:
Bipedal locomotion, requires open habitat for movement, collects seeds in external cheek pouches, physiologically adapted to warm and dry climates, nocturnal. Average life span 4-8 months (estimate does not distinguish mortality from emigration). Live up to 18 months (McClenaghan and Taylor 1993). 14-18% live beyond first year. Population densities reported between 7.5-57.5/ha. Population structure is not known, but theorized to act as metapopulation(s) due to dependence upon early successional, disturbed habitat.
Stressors: • Distribution:
o Lack of suitable habitat o Low/no connectivity (dispersal corridors)
• Survivorship/Reproduction: o Low food resources o High predation pressure (owls, snakes, coyotes, foxes, feral cats, invasive ants) o High Competitive pressure (other rodents, ants)
Specific (food habits, home range/dispersal, habitat, behavior):
Food habits: Feeds on relatively large seeds, vegetation, and occasionally insects. In disturbed non-native grasslands, SKR primarily consumed seeds from filaree (Erodium cicutarium) and Schismus grass (Schismus barbatus). In late winter through early spring when seeds were not available, SKR primarily consumed vegetative parts of grasses, buckwheat (Eriogonum fasciculatum), fireweed and California sage (Artemisia californica). Thought to get all or most of water from food.
Stressors: • Low seed production- drought years • Increased vegetation density. High seed production from high rainfall years may also
result in increased plant growth resulting in reduced foraging efficiency. • Invasive brome grasses create thick mat, reduce foraging efficiency • Possible competition for seed from sympatric Dipodomys simulans • Consumption of pesticides from rodent control programs.
Reproduction: Females may reach reproductive age same year of birth. Onset of estrous at start of winter rains and conclusion after plants disperse seeds (McClenaghan 1993). Typically late winter through early summer (Gestation ~30 days, average 2 litters/season, 2.5 young/litter). Young weaned between day 18-22.
Stressors: • Drought. Reproductive output may be reduced or eliminated in drought years. • Affected by timing of rains (possibly due to resource type availability). • Low population densities result in decreased chance of finding mate, lower effective
population size.
45

Home range/ Dispersal: Relatively small home ranges reported (0.06- 0.20 ha). Little known about age, timing, mechanisms of dispersal. Dispersal distances of up to 1 km have been documented, largely by females. Dirt roads may be used as dispersal corridors.
Stressors: • Lack of surrounding open habitat (natural/ unnatural) for dispersal to other habitat
patches.
Habitat: Prefers sparsely vegetated, grassy areas within coastal sage scrub. Previously thought to reside primarily in native grasslands but typically inhabits open scrub/ grassland communities maintained by disturbance (fire, grazing, drought, scouring, discing, fallow agricultural fields). Will rapidly colonize newly disturbed habitat (i.e. post-fire). Prefers friable, loamy soils (requires soil between clay and large sand for burrowing). Average burrow depth is 46 cm. Can readily survive most fires underground.
Stressors: • Any dense vegetation (shrubs, brome grasses). Prefers > 70% open/bare ground. • Invasive non-native grasses (brome) (in high density) • Succession (grassland transition to shrubland) • Steep slopes (impedes efficient locomotion?) • Hardened soils (due to trampling/heavy equipment/drought) affect burrowing ability/
energetics, decrease burrow depth- more susceptible to crushing. • Competition for marginal habitat from sympatric Dipodomys simulans • Nino cycles (too frequent or infrequent) • Troop disturbance or bivouacking in excess • Over grazing or grazing while wet (compacting soils) • Heavy activity
Behaviors: Caches food/seed Possibly avoids foraging in open during full moon. Dust baths to maintain healthy pelage Likely uses foot stomping as means of communication. Some share burrow entrances. Sharing increases with increased pop. densities. Use auditory senses for predator avoidance, communication
Stressors: • No loose soil for bathing (result is unhealthy pelage- parasites/ less effective insulation). • Hardened soil or lack of loose soil may decrease potential cache sites (seed storage). • Loud noises may interfere with communication and predatory response (artillery fire,
bombing, troop movement) • Artificial lights decrease foraging, foraging efficiency
46

Population increase & decline (potential causes)
Increase
Natural: • Habitat gain: Open up previously closed vegetation (natural fires, scouring events,
intense drought) • Increased resource availability: Greater seed output due to normal or high levels of
rainfall. • Decrease of natural predators
Unnatural:
• Habitat gain: Open up previously closed vegetation (unnatural fires-frequent burn intervals, bomb explosions, intense training activities, roads and firebreaks, shallow discing)
• Increased resource availability: Invasive grasses/ herbaceous plants provide greater seed output.
Decline Natural:
• Habitat loss: Successional changes (mid/late seral communities), overgrowth & invasion of non-native grasses
• Decreased resource availability (Decreased fitness, decreased reproductive success, starvation): drought, plant diseases & pests
• Increased predation/ predator abundance (owls, foxes, coyotes, snakes) (Recovery Plan)
• Increased competition for food/habitat: Dipodomys simulans, other rodents.
Unnatural: • Habitat loss: Development, compaction of soils (troop & heavy equipment movements) • Fragmentation by infrastructure: Paved roads, buildings • Decreased resource availability: herbicides, non-native grass removal? (potentially) • Increased predation/ predator abundance (feral cats, dogs, Argentine ants, fire ants) • Increased competition: non-native rodents (Mus musculus?) • Direct mortality: Crushed/injured by trampling/ artillery fire/ development of
land/rodenticides. • Damage to eardrum from artillery fire/ bomb impacts. • Noise/explosions decrease habitat quality by decreasing efficiency of communications,
anti-predator strategies, stress levels • Decreased foraging time and efficiency due to presence of artificial lights. • Disease transmission from exotic mammals. • Ingestion of poisons used to control unwanted rodent infestations (i.e. squirrels- plague)
47

48
Status and Trend
Overall: (USFWS 1997)
• Habitat: 25688 acres occupied habitat • Distribution: San Jacinto Valley and adjacent areas of western Riverside, southwestern San
Bernardino, & northern San Diego counties. • Population numbers and sizes: 11 core "populations" targeted for conservation in San Diego
and Riverside counties. Occupied habitat for each reported to vary from ~320 to 2000 ha. often with larger potential habitat estimates. Most populations small/ low density (<4/ ha).
• Annual variation: Large variations in abundance (10 fold common). Variation in distribution largely unknown although large fluctuations in distribution of density recorded in Lake Matthew & Shipley reserves from 1991 to 1994.
• Long Term Trends: Thought extirpated from San Bernardino county. Overall trends may be largely unknown.
Camp Pendleton:
(Part of SKR Western Conservation Planning Area of San Diego County with Fallbrook population. Designated as “High Priority” Reserve.)
• Existing monitoring programs: Current program involves trapping and burrow counting at 13 grids across known SKR habitat for every other year since 1996 (November trapping).
• Habitat: In 1997, 684 to 800 acres of SKR habitat were occupied (estimate: Tetratech and SJM Biological Consultants 1999, USFWS 1997). Suitable habitat defined in 1999, but has changed somewhat since survey period.
• Distribution: Four general areas where SKR historically/ presently occur. o San Mateo- small population- presumed extirpated. (HOLF, 313B) o San Onofre- small population- presumed extirpated. (Range 210) o South & East of Whiskey Impact Area-(Includes Kilo 1 & 2, Range 407-409, AFA 24 &
30). Largest Area- Low to High Density “populations”. o SE corner abutting Fallbrook NWS (Juliett). Small/Med Area- Low Density o Note: Presence/abundance within Impact Areas unknown. Off limits.
• Population numbers and sizes: See above and Table 1 • Annual variation: Numbers in grids have varied over time up to 10 fold from 1996 to 2002. • Trends: Variable among sites. See Table 1.
Potential Management Actions
• Create artificial disturbance to open up vegetation (fire, discing, grazing, mowing, others) • Create and/or maintain fire breaks/ dirt roads/ open habitat as movement corridors. • Create artificial burrows for SKR habitation. • Reduction of artificial lights at night. • Control of feral pets. • Prevent any disturbance, degradation of habitat (signage).

Appendix 5. Comparison Tables: Monitoring Methods Basic Approaches to Metapopulation vs. Single Population Monitoring Schemes
Program Purpose Methods Frequency Timing Possible Response
Variables Some strengths Some limitations (if
population assumption incorrect)
PAO/ Patch Occupancy (Metapopulation)
Distribution Survey for presence throughout potential habitat. Sampling schemes could vary
Could Vary
Could vary
Prop. Area Occupied, Detection probabilities, Colonization/ Extinction, Relationship of covariates to Presence/Absence (i.e., habitat variables, other spp., stressors)
Powerful for tracking meta-population dynamics: Strong relationships established between target species and habitat/stressor variables can directly relate to mgmt actions
No information on abundance/ densities or demographic variables. Large number of sub-populations could "blink out" due to critically low abundance before management action is recommended.
Abundance Monitoring (Single Population)
Population Abundance / Density
Survey for abundance at fixed locations within species habitat. Sampling schemes could vary
Could Vary
Could vary
Estimate total abundance, Capture probabilities, reproductive success, survivorship, relationship of covariates to abundance (i.e. other spp. (competition), stressors)
Powerful for tracking increases and decreases in population size over predefined area. Potential to learn about fluctuations in abundance and demographic variables over time and perhaps in response to environmental/ climatic variables.
No information on distribution. Assume uniform abundance over predefined habitat boundaries. Could conclude species in trouble due to low numbers when location of high density may have only moved. Low power for analysis of habitat variables. Difficult to model when abundance is low.
49
Features of metapopulations ("population of populations") (Hanski 1996, Weins 1996)
• Many local populations (>2, 10?). • Each local population has a given extinction probability. • Each local population has traditional dynamics • High probability of extinction generates "winking", no probability of extinction generates

• "fixed" populations. • Dispersal is responsible for re-colonization of vacant sites.
Potential and Current Sampling Methods for SKR
Purpose Methods Detection/ capture probability Some strengths Some limitations
Presence Search for sign (active burrows, scat, tracks)
Varies by season & location- Highest in Fall
Low effort, proven method, passive Could mistake for DKR. May need to trap to confirm SKR presence
Presence Live-trapping (requires midnight and morning trap checks)
Varies by season & location- Highest in Fall
Proven method, positive species confirmation.
High effort to establish absence (5 night std)
Presence Infra red cameras* Unknown Relatively low effort, passive Not proven- potential high cost. May need to trap to confirm SKR vs. DKR presence
Presence Search burrow entrances with visual probe/ camera*
Unknown Relatively Passive. Potentially also gain information on reproduction and sociality
Burrows may be to deep. Could be time consuming. May still need to trap to confirm SKR vs. DKR.
Presence Night Vision Goggles Unknown passive Time dependant. May need to trap to confirm SKR vs. DKR presence
Abundance Count burrows Varies by season & location- Highest in Fall
Low effort, passive, positive correlation to density
Could mistake for DKR, slope of the relationship to density not stable
Abundance Live-trapping (requires midnight and morning trap checks)
Varies by season & location- Highest in Fall
Proven. Direct abundance estimates. If frequent, gain information on demography
High effort
50
*Methods not currently known to be in use for regular monitoring. Burrow Counts
• Significant Positive correlation to SKR density • Fluctuate similar to abundance • Variable slope of relationship in time and space (0.021 to 0.045) • Numbers may vary temporally and spatially due to sharing of burrows and/or multiple entrances to same burrow
Copyright © 2022 FDOKUMEN