9. Pakistan Asset Allocation Fund (228-256).cdr - MCB - Arif ...
Upload
khangminh22Category
view
1download
0
MCB Bank Limited and its subsidiary companies
Consolidated Condensed Interim
Financial Statements
for the nine months period ended September 30, 2019

MCB BANK LIMITED & SUBSIDIARY COMPANIES
CONSOLIDATED CONDENSED INTERIM STATEMENT OF FINANCIAL POSITION
AS AT SEPTEMBER 30, 2019
Note
Unaudited
September 30,
2019
Audited
December 31,
2018
ASSETS
Cash and balances with treasury banks 7 114,646,150 110,165,006
Balances with other banks 8 18,385,679 13,338,117
Lendings to financial institutions 9 14,192,852 39,149,890
Investments 10 873,248,599 754,385,775
Advances 11 548,253,680 566,792,265
Fixed assets 12 53,098,861 43,531,396
Intangible assets 13 1,764,703 1,452,462
Deferred tax assets - -
Other assets 14 56,961,420 56,395,096
1,680,551,944 1,585,210,007
LIABILITIES
Bills payable 16 10,414,465 17,003,272
Borrowings 17 208,331,928 223,216,115
Deposits and other accounts 18 1,226,178,901 1,122,306,535
Liabilities against assets subject to finance lease - -
Subordinated debt 19 - 3,891,019
Deferred tax liabilities 20 2,538,060 1,983,145
Other liabilities 21 77,500,092 65,487,042
1,524,963,446 1,433,887,128
NET ASSETS 155,588,498 151,322,879
REPRESENTED BY
Share capital 11,850,600 11,850,600
Reserves 22 77,281,816 74,374,573
Surplus on revaluation of assets 23 11,945,862 10,417,875
Unappropriated profit 53,791,119 53,971,079
154,869,397 150,614,127
Non-controlling interest 719,101 708,752
155,588,498 151,322,879
CONTINGENCIES AND COMMITMENTS 24
The annexed notes 1 to 43 form an integral part of these consolidated condensed interim financial statements.
President/Chief Executive Chief Financial Officer Director Director Director
---------Rupees in '000---------
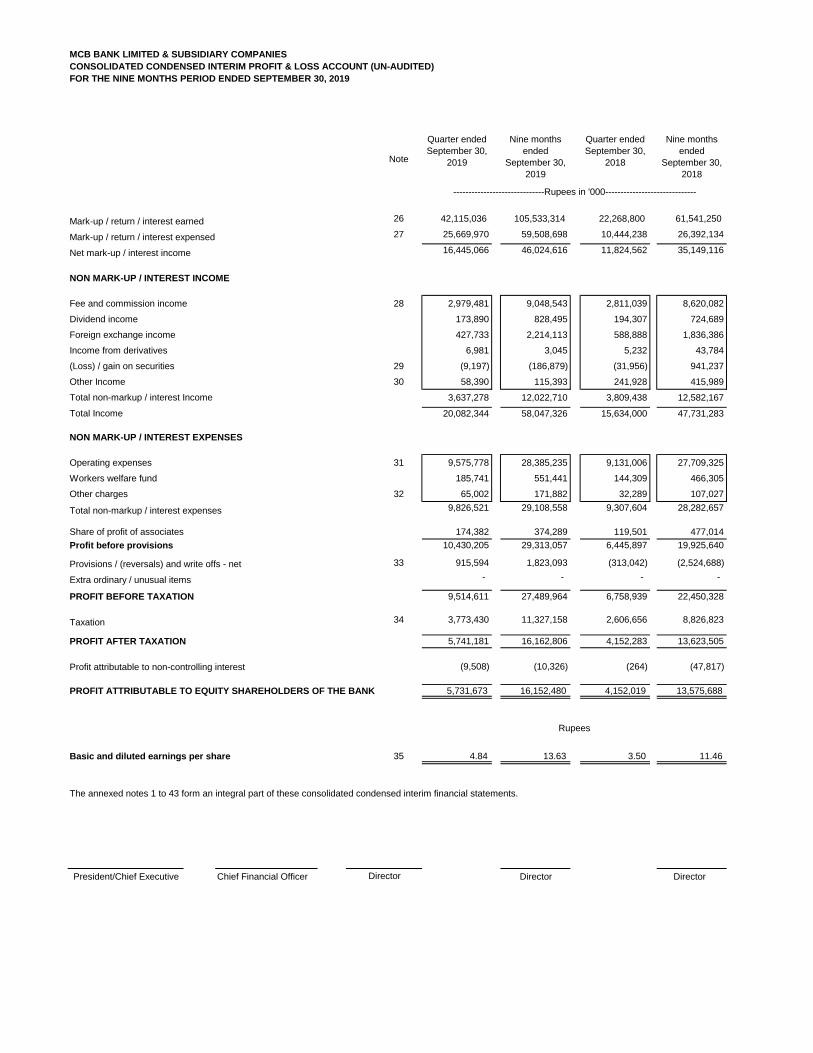
MCB BANK LIMITED & SUBSIDIARY COMPANIES
CONSOLIDATED CONDENSED INTERIM PROFIT & LOSS ACCOUNT (UN-AUDITED)
FOR THE NINE MONTHS PERIOD ENDED SEPTEMBER 30, 2019
Note
Quarter ended
September 30,
2019
Nine months
ended
September 30,
2019
Quarter ended
September 30,
2018
Nine months
ended
September 30,
2018
Mark-up / return / interest earned 26 42,115,036 105,533,314 22,268,800 61,541,250
Mark-up / return / interest expensed 27 25,669,970 59,508,698 10,444,238 26,392,134
Net mark-up / interest income 16,445,066 46,024,616 11,824,562 35,149,116
NON MARK-UP / INTEREST INCOME
Fee and commission income 28 2,979,481 9,048,543 2,811,039 8,620,082
Dividend income 173,890 828,495 194,307 724,689
Foreign exchange income 427,733 2,214,113 588,888 1,836,386
Income from derivatives 6,981 3,045 5,232 43,784
(Loss) / gain on securities 29 (9,197) (186,879) (31,956) 941,237
Other Income 30 58,390 115,393 241,928 415,989
Total non-markup / interest Income 3,637,278 12,022,710 3,809,438 12,582,167
Total Income 20,082,344 58,047,326 15,634,000 47,731,283
NON MARK-UP / INTEREST EXPENSES
Operating expenses 31 9,575,778 28,385,235 9,131,006 27,709,325
Workers welfare fund 185,741 551,441 144,309 466,305
Other charges 32 65,002 171,882 32,289 107,027
Total non-markup / interest expenses 9,826,521 29,108,558 9,307,604 28,282,657
Share of profit of associates 174,382 374,289 119,501 477,014
Profit before provisions 10,430,205 29,313,057 6,445,897 19,925,640
Provisions / (reversals) and write offs - net 33 915,594 1,823,093 (313,042) (2,524,688)
Extra ordinary / unusual items - - - -
PROFIT BEFORE TAXATION 9,514,611 27,489,964 6,758,939 22,450,328
Taxation 34 3,773,430 11,327,158 2,606,656 8,826,823
PROFIT AFTER TAXATION 5,741,181 16,162,806 4,152,283 13,623,505
Profit attributable to non-controlling interest (9,508) (10,326) (264) (47,817)
PROFIT ATTRIBUTABLE TO EQUITY SHAREHOLDERS OF THE BANK 5,731,673 16,152,480 4,152,019 13,575,688
Basic and diluted earnings per share 35 4.84 13.63 3.50 11.46
The annexed notes 1 to 43 form an integral part of these consolidated condensed interim financial statements.
President/Chief Executive Chief Financial Officer Director Director
------------------------------Rupees in '000------------------------------
Rupees
Director

MCB BANK LIMITED & SUBSIDIARY COMPANIES
CONSOLIDATED CONDENSED INTERIM STATEMENT OF COMPREHENSIVE INCOME (UN-AUDITED)
FOR THE NINE MONTHS PERIOD ENDED SEPTEMBER 30, 2019
Quarter ended
September 30,
2019
Nine months
ended
September 30,
2019
Quarter ended
September 30,
2018
Nine months
ended
September 30,
2018
Profit after taxation for the period 5,741,181 16,162,806 4,152,283 13,623,505
Other comprehensive income
Items that may be reclassified to profit and loss account in subsequent periods:
Effect of translation of net investment in foreign branches and subsidiaries
- Equity shareholders of the bank (433,316) 1,228,006 (98,388) 552,156
- Non-controlling interest (4) 23 3 34
(433,320) 1,228,029 (98,385) 552,190
Share of exchange translation reserve of associate 32,857 50,566 5,663 7,237
Movement in surplus/ (deficit) on revaluation of investments - net of tax
- Equity shareholders of the bank 2,913,398 1,683,289 (2,043,869) (5,020,581)
2,913,398 1,683,289 (2,043,869) (5,020,581)
Movement in share of surplus / deficit on revaluation of
associated undertaking- net of tax (77,388) (104,157) (57,860) (177,807)
2,435,547 2,857,727 (2,194,451) (4,638,961)
Items that will not be reclassified to profit and loss account in subsequent periods:
Remeasurement loss on defined benefit obligations - net of tax - (534,194) - (679,241)
- (534,194) - (679,241)
Total comprehensive income 8,176,728 18,486,339 1,957,832 8,305,303
Attributable to:
- Equity shareholders of the bank 8,165,534 18,475,990 1,957,565 8,257,452
- Non-controlling interest 11,194 10,349 267 47,851
8,176,728 18,486,339 1,957,832 8,305,303
The annexed notes 1 to 43 form an integral part of these consolidated condensed interim financial statements.
President/Chief Executive Chief Financial Officer Director Director Director
--------------------------Rupees in ‘000--------------------------

MCB BANK LIMITED & SUBSIDIARY COMPANIES
CONSOLIDATED CONDENSED INTERIM STATEMENT OF CHANGES IN EQUITY (UN-AUDITED)
FOR THE NINE MONTHS PERIOD ENDED SEPTEMBER 30, 2019
Revenue reserve
Investments AssociateFixed / non-
banking assets
Balance as at December 31, 2017 11,850,600 23,973,024 908,317 397,079 27,149,492 18,600,000 4,332,604 443,561 12,959,928 55,221,069 155,835,674 707,407 156,543,081
Total comprehensive income for the nine months period ended September 30, 2018
Profit after taxation for the nine months period ended September 30, 2018 - - - - - - - - - 13,575,688 13,575,688 47,817 13,623,505 Other comprehensive income - net of tax - - - 559,393 - - (5,020,581) (177,807) - (679,241) (5,318,236) 34 (5,318,202)
- - - 559,393 - - (5,020,581) (177,807) - 12,896,447 8,257,452 47,851 8,305,303
Transfer to statutory reserve - - - - 1,431,099 - - - (1,431,099) - - -
Transfer in respect of incremental depreciation from surplus on revaluation of fixed assets to unappropriated profit - net of tax - - - - - - - 40,781 (40,781) - - -
Surplus realized on disposal of revalued fixed assets - net of tax - - - - - - - (99,081) 99,081 - - -
Transactions with owners, recorded directly in equity
Final cash dividend at Rs. 4.0 per share - December 31, 2017 - - - - - - - - - (4,740,240) (4,740,240) - (4,740,240)
Interim cash dividend at Rs. 4.0 per share - March 31, 2018 - - - - - - - - - (4,740,240) (4,740,240) - (4,740,240)
Interim cash dividend at Rs. 4.0 per share - June 30, 2018 - - - - - - - - - (4,740,240) (4,740,240) - (4,740,240) - - - - - - - - - (14,220,720) (14,220,720) - (14,220,720)
Balance as at September 30, 2018 11,850,600 23,973,024 908,317 956,472 28,580,591 18,600,000 (687,977) 265,754 12,901,628 52,523,997 149,872,406 755,258 150,627,664
Change in equity for three months period ended December 31, 2018
Total comprehensive income for the three months period ended December 31, 2018
Profit after taxation for the three months period ended December 31, 2018 - - - - - - - - 6,777,068 6,777,068 14,711 6,791,779 Other comprehensive income - net of tax - - - 651,310 - - (2,124,638) (14,508) 172,774 19,955 (1,295,107) 109 (1,294,998)
- - - 651,310 - - (2,124,638) (14,508) 172,774 6,797,023 5,481,961 14,820 5,496,781
Transfer to statutory reserve - - - - 704,859 - - - (704,859) - - -
Transfer in respect of incremental depreciation from surplus on revaluation of fixed assets to unappropriated profit - net of tax - - - - - - - (95,158) 95,158 - - -
Transactions with owners, recorded directly in equity - Interim cash dividend at Rs. 4.0 per share - September 30, 2018 - - - - - - - - - (4,740,240) (4,740,240) - (4,740,240)
- - - - - - - - - (4,740,240) (4,740,240) - (4,740,240)
Share of dividend attributable to Non-controlling interest - - - - - - - - - - - (61,326) (61,326)
Balance as at December 31, 2018 11,850,600 23,973,024 908,317 1,607,782 29,285,450 18,600,000 (2,812,615) 251,246 12,979,244 53,971,079 150,614,127 708,752 151,322,879
Total comprehensive income for the nine months period ended September 30, 2019
Profit after taxation for the nine months period ended September 30, 2019 - - - - - - - - 16,152,480 16,152,480 10,326 16,162,806 Other comprehensive income - net of tax - - - 1,278,572 - - 1,683,289 (104,157) - (534,194) 2,323,510 23 2,323,533
- - - 1,278,572 - - 1,683,289 (104,157) - 15,618,286 18,475,990 10,349 18,486,339
Transfer to statutory reserve - - - - 1,628,671 - - - - (1,628,671) - - -
Transfer in respect of incremental depreciation from surplus on revaluation of fixed assets to unappropriated profit - net of tax - - - - - - - - (40,582) 40,582 - - -
Surplus realised on disposal of revalued fixed assets - net of tax - - - - - - - - (10,563) 10,563 - - -
Transactions with owners, recorded directly in equity
Final cash dividend at Rs. 4.0 per share - December 31, 2018 - - - - - - - - - (4,740,240) (4,740,240) - (4,740,240)
Interim cash dividend at Rs. 4.0 per share - March 31, 2019 - - - - - - - - - (4,740,240) (4,740,240) - (4,740,240)
Interim cash dividend at Rs. 4.0 per share - June 30, 2019 - - - - - - - - - (4,740,240) (4,740,240) - (4,740,240)
- - - - - - - - - (14,220,720) (14,220,720) - (14,220,720)
Balance as at September 30, 2019 11,850,600 23,973,024 908,317 2,886,354 30,914,121 18,600,000 (1,129,326) 147,089 12,928,099 53,791,119 154,869,397 719,101 155,588,498
For details of dividend declaration and appropriations, please refer note 41 to these consolidated condensed interim financial statements.
For details of reserves, please refer note 22 to these consolidated condensed interim financial statements.
The annexed notes 1 to 43 form an integral part of these consolidated condensed interim financial statements.
President/Chief Executive Director Director Director
Non
controlling
interest
Total
-----------------------------------------------------------------------------------------------Rupees in '000-----------------------------------------------------------------------------------------------
Chief Financial Officer
Capital reserve
Statutory
reserve Share capital
Surplus/(deficit) on revaluation of
Share premium Non- distributable
capital reserve
Exchange
translation reserve General reserve
Unappropriated
profit Sub total

MCB BANK LIMITED & SUBSIDIARY COMPANIES
CONSOLIDATED CONDENSED INTERIM CASH FLOW STATEMENT (UN-AUDITED)
FOR THE NINE MONTHS PERIOD ENDED SEPTEMBER 30, 2019
Note Nine months
ended
September 30,
2019
Nine months
ended
September 30,
2018
----------Rupees in '000--------
CASH FLOW FROM OPERATING ACTIVITIES
Profit before taxation 27,489,964 22,450,328
Less: Dividend income and share of profit of associates (1,202,784) (1,201,703)
26,287,180 21,248,625
Adjustments:
Depreciation on fixed assets 31 1,642,213 1,657,485
Depreciation on right of use assets 31 1,193,657 -
Depreciation on non-banking assets acquired in satisfaction of claims 31 34,815 37,258
Amortization 31 290,609 264,476
Provisions / (reversals) and write offs - net 33 1,823,093 (2,524,688)
Workers welfare fund 551,441 466,305
Gain on sale of fixed assets and non-banking assets acquired-net 30 (76,803) (317,445)
Charge for defined benefit plans 9,825 2,082,336
Unrealized loss on revaluation of investments classified as held for trading 29 41,815 8,236
Gain on sale of shares in an associate - (51,360)
5,510,665 1,622,603
31,797,845 22,871,228
Decrease / (increase) in operating assets
Lendings to financial institutions 24,957,038 (137,998,281)
Held-for-trading securities 3,977,983 (2,461,600)
Advances 19,110,736 (42,445,471)
Others assets (excluding advance taxation) (9,060,999) 1,257,990
38,984,758 (181,647,362)
Increase in operating liabilities
Bills Payable (6,588,807) (9,562,117)
Borrowings from financial institutions (13,451,483) (78,228,878)
Deposits 103,872,366 95,542,843
Other liabilities (excluding current taxation) 2,912,467 760,032
86,744,543 8,511,880
Defined benefits paid (238,381) (251,803)
Income tax paid (2,375,252) (1,557,309)
Net cash flow from operating activities 154,913,513 (152,073,366)
CASH FLOW FROM INVESTING ACTIVITIES
Net investments in available-for-sale securities (122,338,902) 191,719,362
Net investments in held-to-maturity securities (329,608) 3,719,631
Dividends received 840,739 1,006,492
Investments in fixed assets (4,083,725) (3,390,046)
Investments in Intangible assets (578,679) (236,147)
Proceeds from sale of fixed assets 141,417 555,380
Proceeds from sale of non-banking assets acquired in satisfaction of claims 40,000 682,410
Investments in non-banking assets acquired in satisfaction of claims (64,445) (307,500)
Proceeds from divestment in an associate - 295,448
Effect of translation of net investment in foreign branches and subsidiaries 1,228,029 552,190
Net cash flow used in investing activities (125,145,174) 194,597,220
CASH FLOW FROM FINANCING ACTIVITIES
Payments of subordinated debt (3,891,019) (780)
Payment of lease liability against right-of-use-assets (807,025) -
Dividend paid (14,108,885) (15,445,121)
Net cash flow used in financing activities (18,806,929) (15,445,901)
Effects of exchange rate changes on cash and cash equivalents 3,835,293 2,695,627
14,796,703 29,773,580
Increase in cash and cash equivalents
Cash and cash equivalents at beginning of the period 117,721,724 113,049,614
Cash and cash equivalents at end of the period 132,518,427 142,823,194
The annexed notes 1 to 43 form an integral part of these consolidated condensed interim financial statements.
President/Chief Executive Chief Financial Officer Director Director Director

MCB BANK LIMITED & SUBSIDIARY COMPANIES
1. STATUS AND NATURE OF BUSINESS
The Group consists of:
Subsidiary Companies
- MCB Financial Services Limited
- MCB - Arif Habib Savings and Investments Limited
- MCB Islamic Bank Limited
- Financial Management Services (Private) Limited
1.1
1.2
1.3
2. BASIS OF PREPARATION
2.1
a.
b.
c.
2.2
99.94%
100%
95.90%
MCB Bank Limited (the 'Bank') is a banking company incorporated in Pakistan and is engaged in commercial banking and related
services. The Bank's ordinary shares are listed on the Pakistan stock exchange. The Bank's Registered Office and Principal
Office are situated at MCB -15 Main Gulberg, Lahore. The Bank operates 1,382 branches (2018: 1,376 branches) within
Pakistan and 11 branches (2018: 11 branches) outside Pakistan (including the Karachi Export Processing Zone branch).
The board of directors of the Bank has approved the winding up of Financial & Management Services ( Private) Limited. The
Bank holds 95.90% shareholding of the Company.
Pursuant to the scheme of arrangement duly approved by the Board of Directors of Mnet Services (Private) Limited
(Transferor Company) and MCB Bank Limited (Transferee Company), as required under section 284(2) of the Companies
Act, 2017 for the amalgamation of Transferor Company with and into Transferee Company, the Transferor Company stands
merged into Transferee Company with effect from April 30, 2019.
Subsidiaries are all entities over which the Group has the power to govern the financial and operating policies accompanying a
shareholding of more than one half of the voting rights. The existence and effect of potential voting rights that are currently
exercisable are considered when assessing whether the Group controls another entity. Subsidiaries are fully consolidated from
the date on which control is transferred to the Group. They are de-consolidated from the date when control ceases. The assets
and liabilities of subsidiary companies have been consolidated on a line by line basis based in the financial statements for the
nine months ended September 30, 2019 and the carrying value of investments held by the Group is eliminated against the
subsidiaries' shareholders' equity in these consolidated condensed interim financial statements. Material intra-Group balances
and transactions have been eliminated.
Associates are entities over which the Group has significant influence but not control. Investments in associates are accounted
for under the equity method of accounting and are initially recognised at cost, thereafter adjusted for the post-acquisition change
in the Group's share of net assets of the associates. The cumulative post-acquisition movements are adjusted in the carrying
amount of the investment. Accounting policies of the associates have been changed where necessary to ensure consistency with
the policies adopted by the Group. The Group's share in associates have been accounted for based on the financial statements
for the nine months ended September 30, 2019.
Non-controlling interest is that part of the net results of operations and of net assets of subsidiary companies attributable to
interests which are not owned by the Group.
In accordance with the directives of the Federal Government regarding the shifting of the banking system to Islamic modes, the
State Bank of Pakistan has issued various circulars from time to time. Permissible forms of trade-related modes of financing
include purchase of goods by banks from their customers and immediate resale to them at appropriate profit in price on deferred
payment basis. The purchases and sales arising under these arrangements are not reflected in these consolidated condensed
interim financial statements as such but are restricted to the amount of facility actually utilized and the appropriate portion of profit
thereon.
The financial results of the Group's Islamic Banking business have been consolidated in these financial statements for reporting
purposes, after eliminating material inter-group transactions / balances. Key financial figures of the Islamic Banking business are
disclosed in note 40 to these consolidated condensed interim financial statements.
The Bank is in the process of disposal of its wholly owned subsidiary “MCB Financial Services Limited” subject to all
regulatory and shareholders approvals.
-MCB Non-Bank Credit Organization " Closed Joint Stock Company"
(formely MCB Leasing CJSC, Azerbaijan)
- Holding Company - MCB Bank Limited
"Percentage holding of
MCB Bank Limited"
100%
51.33%
NOTES TO THE CONSOLIDATED CONDENSED INTERIM FINANCIAL STATEMENTS (UN-AUDITED) FOR THE NINE MONTHS
PERIOD ENDED SEPTEMBER 30, 2019
These consolidated financial statements include the financial statements of MCB Bank Limited and its subsidiary companies.

2.3
2.4
3. STATEMENT OF COMPLIANCE
3.1
3.2
3.3
3.4
3.5 Amendments to approved accounting standards that are effective in the current period
These consolidated condensed interim financial statements have been prepared under the historical cost convention except that
certain classes of fixed assets and non-banking assets acquired in satisfaction of claims are stated at revalued amounts and
certain investments and derivative financial instruments have been marked to market and are carried at fair value. In addition,
obligations in respect of staff retirement benefits are carried at present value.
The consolidated condensed interim financial statements are presented in Pak Rupees, which is the Group's functional and
presentation currency. The amounts are rounded off to the nearest thousand.
The Group has adopted "IFRS 15 Revenue from Contracts with Customers" and "IFRS 16 Leases" effective 01 January 2019.
IFRS 15 established a comprehensive framework for determining whether, how much and when revenue is recognized. It
replaced IAS 18 Revenue, IAS 11 Construction Contracts and related interpretations. The Bank has adopted IFRS 15 from 01
January 2019. The timing or amount of income from contracts with customers was not impacted by the adoption of IFRS 15,
accordingly, the adoption of this standard has no material impact in these consolidated condensed interim financial statements.
The impact of adoption of IFRS 16 on the Bank's consolidated condensed interim financial statements is disclosed in note 4.1.1.
The disclosures made in these consolidated condensed interim financial statements have been limited based on a format
prescribed by the SBP vide BPRD Circular Letter No. 05 of 2019 dated March 22, 2019 and IAS 34, Interim Financial Reporting.
The consolidated condensed interim financial statements do not include all the information and disclosures required in the
audited annual financial statements, and should be read in conjunction with the audited annual consolidated financial statements
for the financial year ended December 31, 2018.
The State Bank of Pakistan has deferred the applicability of International Accounting Standard (IAS) 39, 'Financial Instruments:
Recognition and Measurement' and IAS 40, 'Investment Property' for Banking Companies through BSD Circular No. 10 dated
August 26, 2002. The Securities and Exchange Commission of Pakistan (SECP) has deferred applicability of IFRS-7 "Financial
Instruments: Disclosures" on banks through S.R.O 411(1) /2008 dated April 28, 2008. Accordingly, the requirements of these
standards have not been considered in the preparation of these consolidated condensed interim financial statements. However,
investments have been classified and valued in accordance with the requirements prescribed by the State Bank of Pakistan
through various circulars.
The SECP vide its notification SRO 633 (I)/2014 dated 10 July 2014, adopted IFRS 10 effective from the periods starting from
June 30, 2014. However, vide its notification SRO 56 (I)/2016 dated January 28, 2016, it has been notified that the requirements
of IFRS 10 and section 228 of the Companies Act, 2017 will not be applicable with respect to the investment in mutual funds
established under trust structure.
In addition, there are certain other new standards and interpretations of and amendments to existing accounting standards that
have become applicable to the Group for accounting periods beginning on or after January 1, 2019. These are considered either
to not be relevant or not to have any significant impact on the Group's consolidated condensed interim financial statements.
The State Bank of Pakistan (SBP) through its BPRD Circular Letter No. 05 of 2019 dated March 22, 2019 has amended the
format of condensed interim financial statements of banks. All banks are directed to prepare their condensed interim financial
statements on the revised format effective from the accounting year starting from January 01, 2019. Accordingly, the Group has
prepared these consolidated condensed interim financial statements on the new format prescribed by the State Bank of Pakistan.
The adoption of new format introduced additional disclosure requirements and required certain reclassification of profit and loss
comparative numbers. Under revised format, cost of foreign currency swaps (note 27) amounting to Rs 2,069.364 million (2018:
Rs 523.382 million) which was previously shown as part of foreign exchange income has now been shown as part of mark-up /
return / interest expense in the consolidated condensed interim statement of profit and loss account.
These consolidated condensed interim financial statements have been prepared in accordance with the accounting and reporting
standards as applicable in Pakistan for interim financial reporting. The accounting and reporting standards as applicable in
Pakistan for interim financial reporting comprise of:
- International Accounting Standard (IAS) 34, Interim Financial Reporting, issued by the International Accounting Standards
Board (IASB) as notified under the Companies Act, 2017;
- Islamic Financial Accounting Standards (IFAS) issued by the Institute of Chartered Accountants of Pakistan as are notified
under the Companies Act, 2017;
- Provisions of and directives issued under the Banking Companies Ordinance, 1962 and the Companies Act, 2017; and
- Directives issued by the State Bank of Pakistan (SBP) and the Securities and Exchange Commission of Pakistan (SECP).
Whenever the requirements of the Banking Companies Ordinance, 1962, the Companies Act, 2017 or the directives issued by
the SBP and the SECP differ with the requirements of IAS 34 or IFAS, the requirements of the Banking Companies Ordinance,
1962, the Companies Act, 2017 and the said directives, shall prevail.

3.6 Standards, interpretations of and amendments to approved accounting standards that are not yet effective
IFRS 3, Business Combinations - (Amendments)
IAS 1, Presentation of Financial Statements (Amendments)
IAS 8, Accounting Policies, Changes in Accounting Estimates and Errors (Amendments)
4. SIGNIFICANT ACCOUNTING POLICIES
4.1
4.1.1 Change in accounting policies
January 1, 2020
January 1, 2020
The SECP, through SRO 229(I)/2019 dated February 14, 2019, has notified that IFRS 9, Financial Instruments, is applicable for
accounting periods ending on or after June 30, 2019. However, based on the guidance received from SBP, the requirements of
IFRS 9 have not been considered for Pakistan operations of the Bank in preparation of these consolidated condensed interim
financial statements.
There are new and amended standards and interpretations that are that are not yet effective. These new and amended standards
and interpretations are considered not to be relevant or do not have any significant effect on the Group's operations and are
therefore not detailed in these consolidated condensed interim financial statements.
The following new standards and amendments to existing accounting standards will be effective from the dates mentioned below
against the respective standard or amendment:
The Group has adopted IFRS 16 from January 1, 2019, and has not restated comparatives for the 2018 reporting period, as
permitted under the specific transitional provisions in the Standard.
On adoption of IFRS 16, the Group has recognised liabilities in respect of leases which had previously been classified as
operating leases under IAS 17. These liabilities were measured as the present value of the remaining lease payments,
discounted using the Bank’s incremental borrowing rate of 12.49% as of January 1, 2019. The associated right-of use assets
were measured at the amount equal to the lease liability, adjusted by the amount of prepaid lease payments recognised in the
consolidated statement of financial position immediately before the date of initial application.
The change in accounting policy affected the following items in the statement of financial position as on January 01, 2019:
- Right-of-Use (RoU) assets recognized as Fixed assets – increased by Rs 7,979.647 million which includes prepayments of Rs.
134.623 million; previously, included in advances, deposits, advance rent and other prepayments at December 31, 2018.
- Lease liabilities recognized as Other liabilities – increased by Rs 7,845.024 million
- The impact on profit and loss account for the period January 1, 2019 to September 30, 2019 was a decrease in profit after tax by
Rs. 465.245 million and earning per share by Rs. 0.393.
Payments associated with short-term leases and leases of low-value assets are recognized on a straight-line basis as an
expense in profit or loss.
The Group expects that adoption of the remaining amendments will not affect its financial statements in the period of initial
application.
The lease liability is subsequently measured at amortized cost using the effective interest rate method. The right of- use assets
are depreciated on a straight line basis over the lease term as this method most closely reflects the expected pattern of
consumption of future economic benefits. The right-of-use assets are reduced by impairment losses, if any, and adjusted for
certain remeasurements of lease liability.
IFRS 9, Financial Instruments: Classification and Measurement, addresses recognition, classification, measurement and
derecognition of financial assets and financial liabilities. The standard has also introduced a new impairment model for financial
assets which requires recognition of impairment charge based on an 'expected credit losses' (ECL) approach rather than the
'incurred credit losses' approach as currently followed. The ECL approach has an impact on all assets of the Group which are
exposed to credit risk. The Group is in the process of assessing the full impact of this standard.
IFRS 16 replaces existing guidance on accounting for leases, including IAS 17, Leases, IFRIC 4, Determining whether an
Arrangement contains a Lease, SIC-15, Operating Leases- Incentive, and SIC-27, Evaluating the Substance of Transactions
Involving the Legal Form of a Lease. IFRS 16 introduces an on balance sheet lease accounting model for long term operating
leases (short-term leases and leases where the underlying assets are of low value continue to be treated as off-balance sheet
operating leases). A lessee recognizes a right-of-use asset representing its right of using the underlying asset and a
corresponding lease liability representing its obligations to make lease payments. Lessor accounting remains similar to the
current standard i.e. lessors continue to classify leases as either finance or operating leases.
The significant accounting policies and methods of computation adopted in the preparation of these consolidated condensed
interim financial statements are consistent with those applied in the preparation of the audited annual consolidated financial
statements of the Group for the year ended December 31, 2018 except for the followings:
Effective date (annual periods
beginning on or after)
January 1, 2020

5. CRITICAL ACCOUNTING ESTIMATES AND JUDGMENTS
6. FINANCIAL RISK MANAGEMENT
Unaudited
September 30,
2019
Audited
December 31,
2018
7. CASH AND BALANCES WITH TREASURY BANKS
In hand
Local currency 25,012,815 18,425,271
Foreign currencies 2,329,261 3,091,560
27,342,076 21,516,831
With State Bank of Pakistan in
Local currency current accounts 39,114,141 43,735,552
Foreign currency current accounts 678,775 571,438
Foreign currency deposit accounts 14,769,665 12,841,393
54,562,581 57,148,383
With other central banks in
Foreign currency current accounts 9,928,815 5,197,681
With National Bank of Pakistan in
Local currency current accounts 22,124,321 26,181,864
Prize bonds 688,357 120,247
114,646,150 110,165,006
8. BALANCES WITH OTHER BANKS
In Pakistan
In current account 1,814 3,812
In deposit account 1,481,867 1,011,404
1,483,681 1,015,216
Outside Pakistan
In current accounts 10,000,826 9,676,073
In deposit accounts 6,901,172 2,646,828
16,901,998 12,322,901
18,385,679 13,338,117
LENDINGS TO FINANCIAL INSTITUTIONS
9. Call / clean money lendings 1,000,000 1,437,978
Repurchase agreement lendings (Reverse Repo) 4,221,188 33,036,912
Musharaka arrangements 5,600,000 4,675,000
Bai Muajjal receivable - with State Bank of Pakistan 3,371,664 -
14,192,852 39,149,890
The basis for accounting estimates adopted in the preparation of these consolidated condensed interim financial statements are
the same as that applied in the preparation of the consolidated financial statements for the year ended December 31, 2018.
The financial risk management objectives and policies adopted by the Group are consistent with those disclosed in the
consolidated financial statements for the year ended December 31, 2018.
----------Rupees in '000--------

10. INVESTMENTS
10.1 Investments by type:
Held-for-trading securities
Federal Government Securities 5,281,289 - (2,545) 5,278,744 9,348,153 - (2,599) 9,345,554
Shares 1,134,703 - (39,270) 1,095,433 1,093,588 - (45,167) 1,048,421
6,415,992 - (41,815) 6,374,177 10,441,741 - (47,766) 10,393,975
Available-for-sale securities
Federal Government Securities 803,300,741 - 86,679 803,387,420 683,373,062 - (4,031,830) 679,341,232
Shares and units 29,241,015 (10,669,995) (1,841,453) 16,729,567 27,929,718 (8,253,849) (279,499) 19,396,370
Non Government Debt Securities 2,569,505 - 2,561 2,572,066 2,523,629 - 4,452 2,528,081
Foreign Securities 3,599,431 - 18,519 3,617,950 2,545,151 - (16,492) 2,528,659
838,710,692 (10,669,995) (1,733,694) 826,307,003 716,371,560 (8,253,849) (4,323,369) 703,794,342
Held-to-maturity securities
Federal Government Securities 22,783,936 (2,280) - 22,781,656 21,859,645 (1,675) - 21,857,970
Provincial Government Securities 118 (118) - - 118 (118) - -
Non Government Debt Securities 10,497,168 (497,374) - 9,999,794 9,001,110 (490,924) - 8,510,186
Foreign Securities 3,719,035 - - 3,719,035 5,809,776 - - 5,809,776
37,000,257 (499,772) - 36,500,485 36,670,649 (492,717) - 36,177,932
Associates 4,066,934 - - 4,066,934 4,019,526 - - 4,019,526
Total Investments 886,193,875 (11,169,767) (1,775,509) 873,248,599 767,503,476 (8,746,566) (4,371,135) 754,385,775
10.1.1 Investments given as collateral
Unaudited
September 30,
2019
Audited
December 31,
2018
- Market Treasury Bills 142,210,159 155,324,815
- Pakistan Investment Bonds 5,296,840 10,489,134
147,506,999 165,813,949
10.2 Provision for diminution in value of investments
10.2.1 Opening balance 8,746,566 5,984,983
Exchange adjustments 230 286
Charge / (reversals)
Charge for the period / year 2,625,108 3,700,485
Reversals for the period / year (29,964) (4,620)
Reversal on disposals (172,173) (835,803)
2,422,971 2,860,062
Amounts written off - (98,765)
Closing Balance 11,169,767 8,746,566
----------Rupees in '000--------
------------------------------------------------------------------------------------------Rupees in '000------------------------------------------------------------------------------------------
Unaudited September 30, 2019 Audited December 31, 2018
Provision for
diminution
Surplus /
(Deficit) Carrying Value
Cost /
Amortised cost
Surplus /
(Deficit) Carrying Value
Cost /
Amortised cost
Provision for
diminution

10.2.2 Particulars of provision against debt securities
Category of classification
NPI Provision NPI Provision
Domestic
Loss 497,492 497,492 491,042 491,042
10.2.3
10.3
10.4
Unaudited
September 30,
2019
Audited
December 31,
2018
Opening balance 3,959,039 4,385,602
Share of profit for the period / year before tax 361,113 446,121
Dividend from associate (105,000) (140,000)
Share of tax (131,469) (208,759)
124,644 97,362
Share of other comprehensive income (82,450) (222,761)
Disposal during the period / year - (301,164)
Closing balance 4,001,233 3,959,039
Share of other comprehensive income
Share of unrealized surplus on assets -net of tax (133,016) (239,821)
Share of exchange translation reserve of associate 50,566 17,060
(82,450) (222,761)
10.5
Unaudited
September 30,
2019
Audited
December 31,
2018
Opening balance 60,487 70,637
Share of profit for the period / year before tax 13,176 136
Share of tax (7,962) (10,286)
Closing balance 5,214 (10,150)
65,701 60,487
Investment in Adamjee Insurance Company Limited under equity method - holding 20.00% (2018: 20.00%)
----------Rupees in '000--------
Investment of the Group in Euronet Pakistan Private Limited has been accounted for under the equity method of
accounting in accordance with the treatment specified in International Accounting Standard 28, (IAS 28) 'Accounting
for Investments in Associates'.
Investment in Euronet Pakistan Private Limited under equity method - holding 30% (2018: 30.00%)
----------Rupees in '000--------
Investment of the Group in Adamjee Insurance Company Limited has been accounted for under the equity method of
accounting in accordance with the treatment specified in International Accounting Standard 28, (IAS 28) 'Accounting
for Investments in Associates'. The market value of the investment in Adamjee Insurance Company Limited as at
September 30, 2019 amounted to Rs. 1,963.500 million (2018: Rs. 2,941.400 million).
Unaudited September 30, 2019 Audited December 31, 2018
----------Rupees in '000--------
In addition to the above, overseas branches hold a general provision of Rs 2.280 million (December 31, 2018: Rs
1.675 million) in accordance with the requirements of IFRS 9.
The market value of securities classified as held-to-maturity as at September 30, 2019 amounted to Rs.32,873.20
million (December 31, 2018: Rs. 34,895.775 million).

11. ADVANCES
Loans, cash credits, running finances, etc. 462,748,882 480,263,372 50,741,050 47,976,277 513,489,932 528,239,649
Islamic financing and related assets 57,259,740 62,911,298 362,835 10,766 57,622,575 62,922,064
Bills discounted and purchased 19,501,360 17,887,661 764,544 979,271 20,265,904 18,866,932
Advances - gross 539,509,982 561,062,331 51,868,429 48,966,314 591,378,411 610,028,645
Provision against advances
- Specific - - (41,759,444) (41,944,267) (41,759,444) (41,944,267)
- General (1,365,287) (1,292,113) - - (1,365,287) (1,292,113)
(1,365,287) (1,292,113) (41,759,444) (41,944,267) (43,124,731) (43,236,380)
Advances - net of provision 538,144,695 559,770,218 10,108,985 7,022,047 548,253,680 566,792,265
Unaudited
September 30,
2019
Audited
December 31, 2018
11.1 Particulars of advances (Gross)
In local currency 542,505,822 565,091,153
In foreign currencies 48,872,589 44,937,492
591,378,411 610,028,645
11.2
\Note
Non Performing
LoansProvision
Non Performing
LoansProvision
Domestic
Other Assets Especially Mentioned 11.2.1 1,660,137 4,817 59,044 2,591
Substandard 2,704,148 675,624 1,141,973 284,372
Doubtful 1,152,887 397,775 1,734,078 866,961
Loss 38,024,551 37,222,390 38,336,785 37,706,704
43,541,723 38,300,606 41,271,880 38,860,628
Overseas
Not past due but impaired 70,463 70,463 62,287 62,287
Overdue by: Unaudited September 30, 2019
Upto 90 days 108,149 98,921 624,403 433,424
91 to 180 days 8,074 4,490 140,323 35,205
181 to 365 days 406,865 406,137 7,473 3,736
˃ 365 days 7,733,155 2,878,827 6,859,948 2,548,987
8,326,706 3,458,838 7,694,434 3,083,639 Total 51,868,429 41,759,444 48,966,314 41,944,267
11.2.1
-----------------------------------------------------------------------Rupees in '000-----------------------------------------------------------------------
Performing Non Performing Total
Audited
December 31, 2018
Unaudited
September 30,
2019
Audited
December 31, 2018
Unaudited
September 30,
2019
Audited
December 31, 2018
Unaudited
September 30,
2019
----------Rupees in '000--------
Advances include Rs. 51,868.429 million (2018: Rs. 48,966.314 million) which have been placed under the non-performing status as detailed below:
Category of Classification
------------------------------------Rupees in '000-----------------------------------
This represents non-performing portfolio of agricultural, small enterprise and Infrastructure Project Financing classified as OAEM as per the requirements of respective Prudential
Regulations issued by the State Bank of Pakistan.
Unaudited September 30, 2019 Audited December 31, 2018

11.3 Particulars of provision against advances
Specific General Total Specific General Total
Opening balance 41,944,267 1,292,113 43,236,380 44,587,644 1,118,256 45,705,900
Exchange adjustments 323,514 25,390 348,904 513,168 19,014 532,182
Charge for the period / year 2,474,013 77,824 2,551,837 1,613,591 158,663 1,772,254
Reversals (2,971,343) (30,040) (3,001,383) (4,618,549) (3,820) (4,622,369)
(497,330) 47,784 (449,546) (3,004,958) 154,843 (2,850,115)
Amounts written off (11,007) - (11,007) (151,587) - (151,587)
Closing balance 41,759,444 1,365,287 43,124,731 41,944,267 1,292,113 43,236,380
11.3.1
11.3.2
Note
Unaudited
September 30,
2019
Audited
December 31,
2018
12. FIXED ASSETS
Capital work-in-progress 12.1 1,881,138 1,501,801
Property and equipment 12.2 51,217,723 42,029,595
53,098,861 43,531,396
12.1 Capital work-in-progress
Civil works 1,208,537 719,229
Equipment 110,601 295,662
Advances to suppliers 476,981 452,188
Others 85,019 34,722
1,881,138 1,501,801
12.2 This includes right-of-use assets amounting to Rs.7,321.534 million due to adoption of IFRS 16 as detailed in note 4.1.1.
Unaudited
September 30,
2019
Unaudited
September 30,
2018
12.3 Additions to fixed assets
The following additions have been made to fixed assets during the period:
Capital work-in-progress 387,467 730,908
Property and equipment
Freehold land 822,582 788,360
Building on freehold land 1,183,982 255,111
Electrical office and computer equipment 945,350 1,224,136
Furniture and fixture 165,863 166,149
Leasehold Improvements 290,095 152,532
Vehicles 79,654 72,850
Right-of-use assets 208,732 -
3,696,258 2,659,138
Total 4,083,725 3,390,046
12.4 Disposal of fixed assets
The net book value of fixed assets disposed off during the period is as follows:
Freehold land 21,000 253,112
Building on freehold land - 52,728
Vehicles 38,762 13,269
Furniture and fixture 792 27,708
Electrical office and computer equipment 3,777 149,621
Leasehold Improvements 283 -
Total 64,614 496,438
Unaudited September 30, 2019
State Bank of Pakistan vide BSD Circular No. 2 dated January 27, 2009, BSD Circular No. 10 dated October 20, 2009, BSD Circular No.
02 of 2010 dated June 03, 2010 and BSD Circular No.1 of 2011 dated October 21, 2011 has allowed benefit of forced sale value (FSV)
of Plant & Machinery under charge, pledged stock and mortgaged residential, commercial & industrial properties (land and building only)
held as collateral against NPLs for five years from the date of classification. The Bank (holding company) has not taken the FSV benefit
in calculation of specific provision. However, one of the subsidiary of the Bank has availed benefit of forced sale values amounting to
Rs.178.77 million (December 31, 2018: Nil) in determining the provisioning against non-performing Islamic financing and related assets
as at September 30, 2019. The additional benefit on the Bank's statement of profit and loss arising from availing the FSV benefit - net of
tax amounts to Rs 115.943 million as at September 30, 2019 (December 31, 2018: Nil). However, the additional impact on profitability
arising from availing the benefit of forced sales value is not available for payment of cash or stock dividends to shareholders.
----------Rupees in '000--------
Audited December 31, 2018
----------Rupees in '000--------
------------------------------------Rupees in '000-----------------------------------
General provision against consumer loans represents provision maintained against fully secured performing portfolio and unsecured
performing portfolio as required by the Prudential Regulations issued by the SBP. General provision against Small Enterprise Finance
represents provision maintained at an amount equal to 1% of unsecured performing portfolio as required by the Prudential Regulations
issued by the SBP. General provisions pertaining to overseas advances are made in accordance with the requirements of the regulatory
authorities of the respective countries in which the overseas branches operate. General provision against all other advances represents
provision maintained at around 0.1% of gross advances.

Note
Unaudited
September 30,
2019
Audited
December 31, 2018
13. INTANGIBLE ASSETS
Capital work-in-progress 13.1 385,982 257,805
Computer software 1,104,594 920,530
Goodwill 82,127 82,127
Management rights 192,000 192,000
1,764,703 1,452,462
Unaudited
September 30,
2019
Unaudited
September 30,
2018
13.1 Additions to intangible assets
The following additions have been made to intangible assets during the period:
Capital work-in-progress 124,497 -
Directly purchased 454,182 236,147
578,679 236,147
Unaudited
September 30,
2019
Audited
December 31, 2018
14. OTHER ASSETS
Income/ mark-up accrued in local currency 19,536,493 12,291,231
Income/ mark-up accrued in foreign currencies 142,052 134,709
Advances, deposits, advance rent and other prepayments 3,658,473 2,737,424
Advance taxation (payments less provisions) - 7,464,966
Compensation for delayed income tax refunds 133,809 133,809
Non-banking assets acquired in satisfaction of claims 3,591,950 3,653,840
Branch adjustment account 175,117 -
Mark to market gain on forward foreign exchange contracts 3,732,584 3,690,505
Unrealized gain on derivative financial instruments 1,433,793 852,465
Acceptances 21 15,961,277 16,256,882
Receivable from the pension fund 3,256,571 3,815,170
Others 7,465,038 7,433,809
59,087,157 58,464,810
Less: Provision held against other assets 14.1 2,606,608 2,550,585
Other Assets (net of provision) 56,480,549 55,914,225
Surplus on revaluation of non-banking assets
acquired in satisfaction of claims 480,871 480,871
Other Assets - total 56,961,420 56,395,096
14.1 Provision held against other assets
Non banking assets acquired in satisfaction of claims 99,597 99,597
Others 2,507,011 2,450,988
2,606,608 2,550,585
14.2.1 Movement in provision held against other assets
Opening balance 2,550,585 3,016,793
Charge for the period / year 1,494 112,529
Reversals (29,409) (721,119)
(27,915) (608,590)
Amounts written off (3,615) (7,180)
Exchange and other adjustments 87,553 149,562
Closing balance 2,606,608 2,550,585
15. CONTINGENT ASSETS
There were no contingent assets of the Group as at September 30, 2019 (2018: NIL).
----------Rupees in '000--------
----------Rupees in '000--------
----------Rupees in '000--------

Unaudited
September 30,
2019
Audited
December 31,
2018
16. BILLS PAYABLE
In Pakistan 10,324,404 16,948,744
Outside Pakistan 90,061 54,528
10,414,465 17,003,272
17. BORROWINGS
Secured
Borrowings from State Bank of Pakistan
Under export refinance scheme 29,892,331 29,430,925
Under long term financing facility 17,666,827 14,628,994
Under renewable energy performance platform 88,114 28,420
Under financing facility for storage of agricultural produce 158,471 165,267
47,805,743 44,253,606
Repurchase agreement borrowings 154,478,588 165,703,249
Total secured 202,284,331 209,956,855
Unsecured
Borrowings from other financial institution 861,214 6,324,169
Call borrowings 4,510,695 4,826,699
Overdrawn nostro accounts 513,402 1,946,106
Others 162,286 162,286
Total unsecured 6,047,597 13,259,260
208,331,928 223,216,115
18. DEPOSITS AND OTHER ACCOUNTS
In Local
Currency
In Foreign
currenciesTotal
In Local
Currency
In Foreign
currenciesTotal
Customers
Current deposits 359,712,936 42,439,898 402,152,834 346,298,054 36,242,971 382,541,025
Savings deposits 592,596,191 50,187,115 642,783,306 532,295,382 41,139,150 573,434,532
Term deposits 99,573,284 14,314,656 113,887,940 78,181,102 13,981,644 92,162,746
Others 26,622,921 2,922,389 29,545,310 30,699,847 4,340,402 35,040,249
1,078,505,332 109,864,058 1,188,369,390 987,474,385 95,704,167 1,083,178,552
Financial Institutions
Current deposits 8,208,894 1,994,096 10,202,990 7,633,474 2,268,698 9,902,172
Savings deposits 15,618,040 14,257 15,632,297 16,647,671 20,548 16,668,219
Term deposits 4,534,500 7,222,504 11,757,004 5,736,081 6,544,203 12,280,284
Others - 217,220 217,220 - 277,308 277,308
28,361,434 9,448,077 37,809,511 30,017,226 9,110,757 39,127,983
1,106,866,766 119,312,135 1,226,178,901 1,017,491,611 104,814,924 1,122,306,535
----------Rupees in '000--------
Unaudited September 30, 2019 Audited December 31, 2018
-----------------------------------------------Rupees in '000-----------------------------------------------

19. SUBORDINATED DEBT
Note
Unaudited
September 30,
2019
Audited
December 31,
2018
Term Finance Certificates - Listed, Unsecured 19.1 - 3,891,019
Issue amount
Issue date June 19, 2014
Maturity date June 19, 2022
Rating AAA (triple A)
Security
Profit payment frequency Semi-Annually
Redemption
Mark-up
Call option
Lock-in-clause
Loss absorbency clause
19.1
Unaudited
September 30,
2019
Audited
December 31,
2018
20. DEFERRED TAX LIABILITIES
Taxable Temporary Differences on
- Surplus on revaluation of fixed assets 996,557 1,018,502
- Surplus on revaluation of Non-banking assets 168,305 168,305
- Accelerated tax depreciation 1,858,371 1,810,834
- Receivable from pension fund 1,139,806 1,335,309
- Business combination 705,218 705,218
- Investments in associated undertaking 1,173,673 1,158,906
6,041,930 6,197,074
Deductible Temporary Differences on
- Provision against advances (1,748,694) (1,791,768)
- Tax losses carried forward (948,633) (818,652)
- Surplus/deficit on revaluation of investments (606,792) (1,510,754)
- Others (199,751) (92,755)
(3,503,870) (4,213,929)
2,538,060 1,983,145
----------Rupees in '000--------
Floating (no floor, no cap) rate of return at Base Rate +1.15% (The Base Rate is defined as
the average “Ask Side” rate of the six month Karachi Interbank Offered Rate (“KIBOR”))
The Bank may call the TFCs, in part or full, on any profit payment date from the 60th month
from the last day of public subscription and on all subsequent profit payment dates, subject to
the SBP approval and not less than forty five days prior notice being given to the Trustee and
the Investors.
Neither profit nor principal can be paid (even at maturity) if such payments will result in a
shortfall in the Banks' Minimum Capital Requirements (MCR) or Capital Adequacy Ratio
(CAR) or increase any existing shortfall in MCR and CAR. In case the lock-in clause goes into
effect, the Bank will be required to comply with the SBP instructions prevalent or issued at the
time.
The TFCs will be subject to loss absorbency clause as stipulated under the "Instructions for
Basel III Implementation in Pakistan".
Fifteen equal semi-annual installments of 0.02% of the Issue Amount for the first ninety
months followed by remaining 99.70% on maturity at the end of the ninety sixth month.
The TFCs are unsecured and subordinated to all other indebtedness of the Bank including
deposits
Rs. 4,198.035 million
----------Rupees in '000--------
During the year, the Group has exercised the call option under the terms of issuance of TFCs after completing the required
regulatory requirements. Accordingly the outstanding balance of the said TFCs have been redeemed on June 19, 2019, being
the option exercise date.

Note
Unaudited
September 30,
2019
Audited
December 31,
2018
21. OTHER LIABILITIES
Mark-up/ return/ interest payable in local currency 15,063,740 13,166,020
Mark-up/ return/ interest payable in foreign currencies 362,128 478,001
Unearned commission and income on bills discounted 261,029 231,516
Accrued expenses 5,771,331 5,415,975
Provision for taxation (provisions less payments) 1,380,112 -
Workers' welfare fund 7,652,897 7,099,086
Acceptances 14 15,961,277 16,256,882
Unclaimed / dividends payable 1,586,651 1,474,816
Mark to market loss on forward foreign exchange contracts 3,500,413 3,495,971
Unrealised loss on derivative financial instruments 1,455,524 863,617
Staff welfare fund 5,631 5,490
Branch adjustment account - 44,770
Provision for employees' compensated absences 1,025,598 1,028,129
Provision for post retirement medical benefits 1,780,254 1,730,409
Provision for employees' contributory benevolent scheme 201,620 214,252
Retention money 20,657 38,437
Insurance payable against consumer assets 725,796 688,107
Unclaimed balances 1,002,847 1,133,843
Duties and taxes payable 1,099,176 1,007,800
Charity fund balance 37,958 25,402
Provision against off-balance sheet obligations 37,430 37,430
Security deposits against lease 1,490,188 1,291,857
Lease liability against right of use assets 7,546,423 -
Others 9,531,412 9,759,232
77,500,092 65,487,042
22. RESERVES
Share premium 23,973,024 23,973,024
Non- distributable capital reserve - gain on bargain purchase option 22.1 908,317 908,317
Exchange translation reserve 2,886,354 1,607,782
Statutory reserve 22.2 30,914,121 29,285,450
General reserve 18,600,000 18,600,000
77,281,816 74,374,573
22.1
22.2
Under IFRS-3 a bargain purchase represents an economic gain which should be immediately recognized by the acquirer
as income. However, the amount of bargain purchase gain was not been taken to the profit and loss account as the SBP,
through its letter BPRD(R&PD)/2017/14330 dated June 13, 2017 recommended that the amount of gain may be routed
directly into equity as a Non-distributable Capital Reserve (NCR). The NCR may become available for distribution
through a stock dividend only with prior approval of the SBP. The Group, before distribution of the gain as a stock
dividend, may adjust any subsequent provisions/deficit, assessed by the Group or recommended by the Banking
Inspection Department of SBP, in the acquired assets and liabilities of NIB Bank Limited against the NCR.
Statutory reserve represents amount set aside as per the requirements of section 21 of the Banking Companies
Ordinance, 1962.
----------Rupees in '000--------

Note
Unaudited
September 30,
2019
Audited
December 31,
2018
23. SURPLUS ON REVALUATION OF ASSETS
Surplus / (deficit) on revaluation of
- Available for sale securities 10.1 (1,733,694) (4,323,369)
- Fixed Assets 13,609,666 13,685,180
- Non-banking assets acquired in satisfaction of claims 480,871 480,871
- Associated undertaking 311,011 444,027
12,667,854 10,286,709
Deferred tax on surplus / (deficit) on revaluation of: - Available for sale securities (606,792) (1,510,754)
- Fixed Assets 996,557 1,018,502
- Non-banking assets acquired in satisfaction of claims 168,305 168,305
- Associated undertaking 163,922 192,781
721,992 (131,166) 11,945,862 10,417,875
24. CONTINGENCIES AND COMMITMENTS
-Guarantees 24.1 177,237,539 173,231,396
-Commitments 24.2 536,218,908 412,067,935
-Other contingent liabilities 24.3 22,788,644 17,038,156
736,245,091 602,337,487
24.1 Guarantees:
Financial guarantees 142,642,746 140,350,012
Performance guarantees 30,823,960 30,103,382
Other guarantees 3,770,833 2,778,002
177,237,539 173,231,396
24.2 Commitments:
Documentary credits and short-term trade-related transactions
- letters of credit 151,434,021 144,579,352
Commitments in respect of:
- forward foreign exchange contracts 24.2.1 367,961,545 217,219,090
- forward government securities transactions 24.2.2 3,218,929 27,935,661
- derivatives 24.2.3 11,209,931 11,285,103
- operating leases 24.2.4 - 7,256,479
- other commitments 1,036,531 2,221,317
Commitments for acquisition of:
- operating fixed assets 1,242,376 1,430,980
- intangible assets 115,575 139,953
536,218,908 412,067,935
24.2.1 Commitments in respect of forward foreign exchange contracts
Purchase 202,076,166 126,872,293
Sale 165,885,379 90,346,797
367,961,545 217,219,090
24.2.2 Commitments in respect of forward government securities transactions
Purchase 3,216,623 13,660,947
Sale 2,306 14,274,714
3,218,929 27,935,661
24.2.3 Commitments in respect of derivatives
FX options (notional)
Purchase 675,887 1,378,370
Sale 675,887 1,378,370
1,351,774 2,756,740
Cross Currency Swaps (notional)
Purchase 4,717,910 4,026,814
Sale 4,823,747 4,185,049
9,541,657 8,211,863
Interest Rate Swaps (notional)
Purchase 316,500 316,500
11,209,931 11,285,103
----------Rupees in '000--------

Unaudited
September 30,
2019
Audited
December 31,
2018
24.2.4 Commitments in respect of operating leases
Not later than one year - 1,219,754
Later than one year and not later than five years - 3,779,911
Later than five years - 2,256,814
- 7,256,479
24.2.5 Other commitments
Commitments to extent credit 1,036,531 2,221,317
Note
Unaudited
September 30,
2019
Audited
December 31,
2018
24.3 Other contingent liabilities
Claims against the Bank not acknowledged as debts 24.3.1 22,788,644 17,038,156
24.3.1
24.4 Taxation
25. DERIVATIVE INSTRUMENTS
Notional Notional Notional
Principal Principal Principal
Total
Hedging 4,717,910 1,409,892 316,500 15,999 675,887 7,902 Market Making 4,823,747 (1,447,622) - - 675,887 (7,902)
Total
Hedging 4,026,814 725,117 316,500 14,771 1,378,370 48,090
Market Making 4,185,049 (751,040) - - 1,378,370 (48,090)
For assessment year 1988-89 through tax year 2018, the tax department disputed Bank's treatment on certain issues, where
the Bank's appeals are pending at various appellate forums, entailing an additional tax liability of Rs. 1,549 million (2018:
Rs. 1,399 million). Such issues inter alia principally include disallowance of expenses for non deduction of withholding tax
and non availability of underlying records, provision for non performing loans, attribution of expenses to heads of income
other than income from business and disallowance of credit for taxes paid in advance / deducted at source.
The Bank has filed appeals which are pending at various appellate forums. In addition, certain decisions made in favour of
the Bank are being contested by the department at higher forums. No provision has been made in the financial statements
regarding the aforesaid additional tax demand and already issued favourable decisions where the department is in appeal,
as the management is of the view that the issues will be decided in the Bank's favour as and when these are taken up by the
Appellate Authorities.
----------Rupees in '000--------
These represent certain claims by third parties against the Bank, which are being contested in the Courts of law. The
management is of the view that these relate to the normal course of business and the possibility of an outflow of economic
resources is remote.
Other than those mentioned above, the group makes commitments to extend credit in the normal course of its business but
these being revocable commitments do not attract any significant penalty or expense if the facility is unilaterally withdrawn.
-------------------------------------------Rupees in '000-------------------------------------------
Audited December 31, 2018
-------------------------------------------Rupees in '000-------------------------------------------
----------Rupees in '000--------
Unaudited September 30, 2019
Interest Rate Swaps FX Options Cross Currency Swaps
Mark to market
gain / loss
Mark to market
gain / loss
Mark to market
gain / loss

Note
Nine months period
ended September
30, 2019
Nine months period
ended September
30, 2018
----------Rupees in '000--------
26. MARK-UP/RETURN/INTEREST EARNED
Loans and advances 47,017,183 28,314,008
Investments 54,078,594 32,309,858
Lendings to financial institutions 3,966,818 715,950
Balances with banks 470,719 201,434
105,533,314 61,541,250
27. MARK-UP/RETURN/INTEREST EXPENSED
Deposits 49,047,775 22,118,703
Borrowings 7,485,997 3,526,912
Subordinated debt 213,604 223,137
Cost of foreign currency swaps against foreign currency deposits / borrowings 2,069,364 523,382
Unwinding cost of liability against right-of-use assets 691,958 -
59,508,698 26,392,134
28. FEE & COMMISSION INCOME
Branch banking customer fees 1,372,760 1,845,481
Consumer finance related fees 255,436 197,626
Card related fees (debit and credit cards) 2,266,082 1,935,707
Credit related fees 166,728 135,137
Investment banking fee 631,867 576,290
Commission on trade 1,123,661 1,111,394
Commission on guarantees 474,953 326,899
Commission on cash management 455,214 446,576
Commission on remittances including home remittances 868,780 731,277
Commission income - Bancassurance 1,049,005 844,653
Rent on lockers 186,711 178,038
Commission on utility bills 75,544 78,519
Commission on investments services 40,314 36,682
Other Commission 81,488 175,803
9,048,543 8,620,082
29. GAIN ON SECURITIES, NET
Realised 29.1 (145,064) 976,041
Unrealised - held for trading 10.1 (41,815) (34,804)
(186,879) 941,237
29.1 Realised (loss) / gain on:
Federal Government Securities (11,684) 120,981
Shares (133,380) 855,060
(145,064) 976,041
30. OTHER INCOME
Rent on property 38,590 11,682
Gain on sale of fixed assets and non-banking assets acquired-net 76,803 317,445
Compensation on delayed tax refunds - 86,862
115,393 415,989

Note
Nine months period
ended September
30, 2019
Nine months period
ended September
30, 2018
31. OPERATING EXPENSES
Total compensation expense 31.1 12,862,709 12,999,179
Property expense
Rent and taxes 434,206 1,808,480
Insurance 42,592 55,687
Utilities cost 943,437 877,092
Fuel expense generators 391,316 376,164
Security (including guards) 1,219,627 1,285,705
Repair and maintenance (including janitorial charges) 772,240 693,774
Depreciation on right-of-use assets 1,193,657 -
Depreciation 463,551 407,587
5,460,626 5,504,489
Information technology expenses
Software maintenance 1,004,683 815,328
Hardware maintenance 315,422 300,965
Depreciation 540,765 623,840
Amortisation 290,609 264,476
Network charges 526,016 500,353
Insurance 3,852 4,706
2,681,347 2,509,668
Other operating expenses
Directors' fees and allowances 37,531 26,919
Remuneration to shariah board members 6,136 7,322
Legal and professional charges 274,976 266,295
Outsourced services costs 625,063 998,842
Travelling and conveyance 292,018 322,159
NIFT clearing charges 121,995 123,231
Depreciation 637,897 626,058
Depreciation on non-banking assets acquired in satisfaction of claims 34,815 37,258
Training and development 41,390 45,546
Postage and courier charges 247,133 240,565
Communication 302,952 262,481
Stationery and printing 557,039 546,682
Marketing, advertisement & publicity 636,017 526,946
Donations 100 696
Auditors' remuneration 33,351 37,761
Cash transportation charges 566,184 555,827
Repair and maintenance 272,685 336,237
Subscription 20,306 29,669
Entertainment 197,530 196,041
Remittance charges 182,462 139,537
Brokerage expenses 32,225 22,942
Card related expenses 694,580 537,876
CNIC verification charges 168,755 96,806
Insurance 1,130,507 485,962
Others 266,906 226,331
7,380,553 6,695,989
28,385,235 27,709,325
31.1 Comparative numbers include pension cost amounting to Rs. 1,903.117 million on account of increase in pension by the
Honourable Supreme Court.
----------Rupees in '000--------

Note
Nine months period
ended September
30, 2019
Nine months period
ended September
30, 2018
32. OTHER CHARGES
Penalties of State Bank of Pakistan 39,998 8,819
VAT & National Building tax & Crop Insurance Levy 131,884 98,208
171,882 107,027
33. PROVISIONS / (REVERSALS) & WRITE OFFS - NET
(Reversals) / provisions against balance with Banks 188 2,684
Provisions / (reversals) for diminution in value of investments 10.2.1 2,422,971 295,800
Reversals against loans & advances 11.3 (449,546) (1,910,064)
Reversals against other assets 14.2.1 (27,915) (714,499)
Recovery of written off / charged off bad debts (122,605) (198,639)
Bad debts written off directly - 30
1,823,093 (2,524,688)
34. TAXATION
Current 10,739,355 8,529,570
Prior years 450,124 -
Deferred (1,752) 103,294
Share of tax of associates 139,431 193,959
11,327,158 8,826,823
35. BASIC AND DILUTED EARNINGS PER SHARE
Profit after tax attributable to Equity Shareholders of the Bank 16,152,480 13,575,688
Weighted average number of ordinary shares 1,185,060,006 1,185,060,006
Basic and diluted earnings per share 13.63 11.46
----------Rupees in '000--------
----------Rupees in '000--------
----------Number--------
----------Rupees-------

36. FAIR VALUE MEASUREMENTS
36.1 Fair value of financial assets
Level 1: Fair value measurements using quoted prices (unadjusted) in active markets for identical assets or liabilities.
Level 2:
Level 3:
Valuation techniques used in determination of fair valuation of financial instruments within level 2
(a) Financial instruments in level 1
(b) Financial instruments in level 2
(c) Financial instruments in level 3
Financial instruments included in level 1 comprise of investments in listed ordinary shares and units of mutual funds.
Financial instruments included in level 2 comprise of Sukuk Bonds, Pakistan Investment Bonds, Market Treasury Bills, Term
Finance certificates, FX options, Cross Currency Swaps, Interest Rate Swaps and Forward Exchange Contracts.
Currently, no financial instruments are classified in level 3.
Foreign exchange
contracts
Derivatives
Operating fixed assets
(land and building) & NBA
Land and buildings are revalued every three years using professional valuers on the panel of
Pakistan Banker's Association. The valuation is based on their assessment of market value of the
properties.
The fair values of derivatives which are not quoted in active markets are determined by using
valuation techniques. The valuation techniques take into account the relevant underlying
parameters including foreign currency involved, interest rates, yield curves, volatilities, contracts
duration etc.
The valuation has been determined by interpolating the mid rates announced by the State Bank of
Pakistan.
The Group's policy is to recognise transfers into and out of the different fair value hierarchy levels at the date the event or
change in circumstances that caused the transfer occurred. There were no transfers between levels 1 and 2 during the year.
The fair value of traded investments is based on quoted market prices, except for tradable securities classified by the Group as
'held to maturity'. Quoted securities classified as held to maturity are carried at amortised cost. Fair value of unquoted equity
investments other than investments in associates is determined on the basis of break up value of these investments as per the
latest available financial statements.
Fair value of fixed term loans, other assets, other liabilities, fixed term deposits and borrowings cannot be calculated with
sufficient reliability due to absence of current and active market for such assets and liabilities and reliable data regarding
market rates for similar instruments.
In the opinion of the management, the fair value of the financial assets and financial liabilities are not significantly different from
their carrying values since assets and liabilities are either short-term in nature or re-priced over short term.
Term Finance and Bonds
Fair value measurements using inputs other than quoted prices included within Level 1 that are observable for the
assets or liability, either directly (i.e. as prices) or indirectly (i.e. derived from prices).
Fair value measurements using input for the asset or liability that are not based on observable market data (i.e.
unobservable inputs).
The Group measures fair values using the following fair value hierarchy that reflects the significance of the inputs used in
making the measurements:
Item
The fair values of Federal Government securities are determined using the PKRV rates.
Valuation approach and input used
Federal Government
securities
Investments in debt securities (comprising term finance certificates, bonds and any other security
issued by a company or a body corporate for the purpose of raising funds in the form of
redeemable capital) are valued on the basis of the rates announced by the Mutual Funds
Association of Pakistan (MUFAP) in accordance with the methodology prescribed by the Securities
and Exchange Commission of Pakistan.

Unaudited September 30, 2019
Carrying value Level 1 Level 2 Level 3 Total
On balance sheet financial instruments
Financial assets - measured at fair value
Investments
Federal Government Securities 808,666,164 - 808,666,164 - 808,666,164
Shares 16,432,975 16,432,975 - - 16,432,975
Non-Government Debt Securities 2,572,066 2,572,066 - 2,572,066
Foreign Securities 3,611,443 - 3,611,443 - 3,611,443
Financial assets - disclosed but not measured at fair value
41,965,951 - - - -
Cash and balances with treasury banks 114,646,150 - - - -
Balances with other banks 18,385,679 - - - -
Lendings to financial institutions 14,192,852 - - - -
Advances 548,253,680 - - - -
Other assets 45,764,226 - - - -
Non - Financial Assets measured at fair value
Operating fixed assets (land and buildings) 35,500,939 - 35,500,939 - 35,500,939
Non-banking assets 4,072,821 - 4,072,821 - 4,072,821
Off-balance sheet financial instruments - measured at fair value
Forward purchase of foreign exchange 202,076,166 - 2,348,690 - 2,348,690
Forward sale of foreign exchange 165,885,379 - 1,097,300 - 1,097,300
Derivatives purchase 5,710,297 - 1,433,793 - 1,433,793
Derivatives sale 5,499,634 - 1,455,524 - 1,455,524
Audited December 31, 2018
Carrying value Level 1 Level 2 Level 3 Total
On balance sheet financial instruments
Financial assets - measured at fair value
Investments
Federal Government Securities 688,686,786 - 688,686,786 - 688,686,786
Shares 19,041,266 19,041,266 - - 19,041,266
Non-Government Debt Securities 2,528,081 2,528,081 - 2,528,081
Foreign Securities 2,522,454 - 2,522,454 - 2,522,454
Financial assets - disclosed but not measured at fair value
41,607,188 - - - -
Cash and balances with treasury banks 110,165,006 - - - -
Balances with other banks 13,338,117 - - - -
Lendings to financial institutions 39,149,890 - - - -
Advances 566,792,265 - - - -
Other assets 38,208,613 - - - -
Non - Financial Assets measured at fair value
Operating fixed assets (land and buildings) 34,894,351 - 34,894,351 - 34,894,351
Non-banking assets 4,035,114 - 4,035,114 - 4,035,114
Off-balance sheet financial instruments - measured at fair value
Forward purchase of foreign exchange 126,872,293 - 3,477,211 - 3,477,211
Forward sale of foreign exchange 90,346,797 - 3,452,374 - 3,452,374
Derivatives purchase 5,721,684 - 787,978 - 787,978
Derivatives sale 5,563,419 - 799,130 - 799,130
The table below analyses the financial and non-financial assets carried at fair values, by valuation methods. For financial assets, the Group
essentially carries its investments in debt and equity securities at fair values. Valuation of investments is carried out as per guidelines specified
by the SBP. In case of non-financial assets, the Bank has adopted revaluation model (as per IAS 16) in respect of land and building.
------------------------------------------Rupees in '000--------------------------------------
Investments (HTM, unlisted ordinary shares and
associates)
Investments (HTM, unlisted ordinary shares and
associates)
------------------------------------------Rupees in '000--------------------------------------

37 SEGMENT INFORMATION
37.1 Segment details with respect to business activities
The segment analysis with respect to business activity is as follows:
Retail BankingConsumer
banking
Corporate
BankingTreasury Islamic Banking
Asset
Managementothers Sub-total Eliminations Total
Profit & Loss
Net mark-up/return/profit (34,490,737) 2,885,940 27,474,071 47,124,717 2,953,895 1,931 74,799 46,024,616 - 46,024,616
Inter segment revenue - net 69,577,999 (1,890,012) (22,984,879) (50,444,377) - - 5,741,269 - - -
Non mark-up / return / interest income 4,660,583 1,493,471 3,102,397 1,682,229 186,009 507,405 764,905 12,396,999 - 12,396,999
Total Income 39,747,845 2,489,399 7,591,589 (1,637,431) 3,139,904 509,336 6,580,973 58,421,615 - 58,421,615
Segment direct expenses 15,915,278 995,574 1,392,277 229,179 3,335,812 438,492 6,801,946 29,108,558 - 29,108,558
Inter segment expense allocation - - - - - - - - - -
Total expenses 15,915,278 995,574 1,392,277 229,179 3,335,812 438,492 6,801,946 29,108,558 - 29,108,558
Provisions (101,780) (24,517) 511,130 2,219,990 212,480 - (994,210) 1,823,093 - 1,823,093
Profit before tax 23,934,347 1,518,342 5,688,182 (4,086,600) (408,388) 70,844 773,237 27,489,964 - 27,489,964
Balance Sheet
Cash & Bank balances 51,191,029 36,138 22,119,861 45,406,858 13,125,783 77,881 1,074,279 133,031,829 - 133,031,829
Investments - - 19,600,841 832,727,876 16,352,916 1,019,950 3,547,016 873,248,599 - 873,248,599
Net inter segment lending 935,440,599 - - - - - 146,730,669 1,082,171,268 (1,082,171,268) -
Lendings to financial institutions - - 236,308 4,984,880 8,971,664 - - 14,192,852 - 14,192,852
Advances - performing 101,097,655 24,549,973 354,859,641 - 57,230,560 - 406,866 538,144,695 - 538,144,695
- non performing 1,307,200 56,284 8,136,521 - 360,938 - 248,042 10,108,985 - 10,108,985
Others 46,277,005 1,700,335 26,143,199 6,974,584 10,833,063 1,012,314 18,884,484 111,824,984 - 111,824,984
Total Assets 1,135,313,488 26,342,730 431,096,371 890,094,198 106,874,924 2,110,145 170,891,356 2,762,723,212 (1,082,171,268) 1,680,551,944
Borrowings 39,995,865 - 9,083,274 150,017,997 8,742,853 - 491,939 208,331,928 - 208,331,928
Subordinated debt - - - - - - - - - -
Deposits & other accounts 1,052,195,653 41,771 92,876,077 - 81,133,637 - (68,237) 1,226,178,901 - 1,226,178,901
Net inter segment borrowing - 24,084,747 308,949,322 737,866,748 9,793,456 1,476,995 - 1,082,171,268 (1,082,171,268) -
Others 43,121,970 2,216,212 20,187,698 2,209,453 7,204,978 633,150 14,879,156 90,452,617 - 90,452,617
Total liabilities 1,135,313,488 26,342,730 431,096,371 890,094,198 106,874,924 2,110,145 15,302,858 2,607,134,714 (1,082,171,268) 1,524,963,446
Equity - - - - - - 155,588,498 155,588,498 - 155,588,498
Total Equity & liabilities 1,135,313,488 26,342,730 431,096,371 890,094,198 106,874,924 2,110,145 170,891,356 2,762,723,212 (1,082,171,268) 1,680,551,944
Contingencies & Commitments 102,948,379 - 221,296,382 373,742,125 - 13,598,955 24,659,250 736,245,091 - 736,245,091
Retail BankingConsumer
banking
Corporate
BankingTreasury Islamic Banking
Asset
Managementothers Sub-total Eliminations Total
Profit & Loss
Net mark-up/return/profit (12,617,572) 1,725,086 15,665,854 29,152,827 1,161,780 1,579 59,562 35,149,116 - 35,149,116
Inter segment revenue - net 34,441,515 (496,713) (11,740,734) (26,299,503) - - 4,095,435 - - -
Non mark-up / return / interest income 5,173,323 1,244,222 2,869,155 2,911,123 260,113 527,110 74,135 13,059,181 - 13,059,181
Total Income 26,997,266 2,472,595 6,794,275 5,764,447 1,421,893 528,689 4,229,132 48,208,297 - 48,208,297
Segment direct expenses 15,627,985 1,017,572 1,184,797 218,110 2,121,294 379,000 7,733,899 28,282,657 - 28,282,657
Inter segment expense allocation - - - - - - - -
Total expenses 15,627,985 1,017,572 1,184,797 218,110 2,121,294 379,000 7,733,899 28,282,657 - 28,282,657
Provisions (503,660) (43,687) (1,166,605) (218,572) 495,201 - (1,087,365) (2,524,688) - (2,524,688)
Profit before tax 11,872,941 1,498,710 6,776,083 5,764,909 (1,194,602) 149,689 (2,417,402) 22,450,328 - 22,450,328
Balance Sheet
Cash & Bank balances 49,001,673 33,515 17,486,827 46,395,674 8,413,070 28,204 2,144,160 123,503,123 - 123,503,123
Investments - - 18,505,331 722,207,238 12,713,954 959,252 - 754,385,775 - 754,385,775
Net inter segment lending 838,293,767 - - - - - 137,396,563 975,690,330 (975,690,330) -
Lendings to financial institutions - - 1,502,544 32,972,346 4,675,000 - - 39,149,890 - 39,149,890
Advances - performing 121,784,772 22,525,967 352,258,545 - 62,897,196 - 303,738 559,770,218 - 559,770,218
- non performing 1,214,697 39,757 5,728,381 - 10,179 - 29,033 7,022,047 - 7,022,047
Others 31,327,269 1,887,934 18,828,346 8,127,064 5,434,142 1,114,256 34,659,943 101,378,954 - 101,378,954
Total Assets 1,041,622,178 24,487,173 414,309,974 809,702,322 94,143,541 2,101,712 174,533,437 2,560,900,337 (975,690,330) 1,585,210,007
Borrowings 35,293,396 - 9,172,202 170,542,175 7,800,628 - 407,714 223,216,115 - 223,216,115
Subordinated debt - - - - - - 3,891,019 3,891,019 - 3,891,019
Deposits & other accounts 969,799,371 16,556 79,196,248 - 73,269,994 - 24,366 1,122,306,535 - 1,122,306,535
Net inter segment borrowing - 22,478,042 307,402,415 634,247,181 10,106,876 1,455,816 - 975,690,330 (975,690,330) -
Others 36,529,411 1,992,575 18,539,109 4,912,966 2,966,043 645,896 18,887,459 84,473,459 - 84,473,459
Total liabilities 1,041,622,178 24,487,173 414,309,974 809,702,322 94,143,541 2,101,712 23,210,558 2,409,577,458 (975,690,330) 1,433,887,128
Equity - - - - 151,322,879 151,322,879 - 151,322,879
Total Equity & liabilities 1,041,622,178 24,487,173 414,309,974 809,702,322 94,143,541 2,101,712 174,533,437 2,560,900,337 (975,690,330) 1,585,210,007
Contingencies & Commitments 111,974,609 - 204,311,803 247,754,264 19,756,379 - 18,540,432 602,337,487 - 602,337,487
37.2 Transactions between reportable segments are based on an appropriate transfer pricing mechanism using agreed rates. Furthermore, segment assets and liabilities include inter segment
balances. Costs which are not allocated to segments are included in the Head office.
Un-audited nine months period ended September 30, 2019
----------------------------------------------------------------------Rupees in '000----------------------------------------------------------------------
Unaudited September 30, 2019
Un-audited nine months period ended September 30, 2018
----------------------------------------------------------------------Rupees in '000----------------------------------------------------------------------
Audited December 31, 2018

38 RELATED PARTY TRANSACTIONS
Directors
Key
Management
Personnel
Associates Other Related
PartiesDirectors
Key
Management
Personnel
Associates Other Related
Parties
Investments
Opening balance - - 4,019,526 254,253 - - 4,456,239 254,253
Share of profit for the period / year before tax - - 374,289 - - - 446,257 -
Dividend from associate - - (105,000) - - - (140,000) -
Share of tax - - (139,431) - - - (219,045) -
Share of other comprehensive income - - (82,450) - - - (222,761) -
Disposal during the period / year - - - - - - (301,164) -
Closing balance - - 4,066,934 254,253 - - 4,019,526 254,253
Provision for diminution in value of investments - - - 5,000 - - - 5,000
Advances
Opening balance 658 141,390 - 1,050,277 946 84,167 - 2,324,608
Addition / exchange adjustment during the period/ year 24,251 71,010 - 1,633,281 14,723 73,571 - 6,640,565
Repaid during the period/ year (22,545) (38,359) - (1,606,267) (15,011) (39,288) - (7,357,817)
Transfer in / (out) - (5,689) - (794,802) - 22,940 - (557,079)
Closing balance 2,363 168,351 - 282,488 658 141,390 - 1,050,277
Provision held against advances - - - - - - - -
------------------------------------------------------------------------------------------------(Rupees in '000)------------------------------------------------------------------------------------------------
The Group has related party relationship with its associates, employee benefit plans, its directors and key management personnel and their close family members.
The Group enters into transactions with related parties in the ordinary course of business and on substantially the same terms as for comparable transactions with person of similar standing. Contributions to
and accruals in respect of staff retirement benefits and other benefit plans are made in accordance with the actuarial valuations / terms of the contribution plan. Remuneration to the executives / officers is
determined in accordance with the terms of their appointment.
Details of transactions with related parties during the period, other than those which have been disclosed elsewhere in these consolidated condensed interim financial statements are as follows:
Un-audited September 30, 2019 Audited December 31, 2018

Directors
Key
Management
Personnel
Associates Other Related
PartiesDirectors
Key
Management
Personnel
Associates Other Related
Parties
Other Assets
Markup receivable - 3,852 - 5,049 - 3,101 - 25,538
Advances, deposits, advance rent and other prepayments - - 35,375 37,221 - - 86,579 30,620
Acceptances - - - 58,661 - - - 25,387
Receivable from Pension Fund - - - 3,256,571 - - - 3,815,170
Provision held against other assets - - - - - - - -
Borrowings
Opening balance - - - - - - - 993,755
Borrowings / exchange adjustment during the period/ year - - - 69,603 - - - -
Settled during the period/ year - - - - - - - (993,755)
Closing balance - - - 69,603 - - - -
Deposits and other accounts
Opening balance 3,745,457 168,528 3,339,847 3,212,620 3,953,730 148,080 2,744,432 3,800,959
Received during the period/ year 6,405,442 820,537 10,095,154 76,576,088 4,259,454 849,270 17,580,902 55,702,326
Withdrawn during the period/ year (9,573,179) (755,759) (10,576,376) (76,955,192) (4,457,255) (851,481) (16,985,487) (56,301,430)
Transfer in / (out) - net (7,324) (53,324) - (21,385) (10,472) 22,659 - 10,765
Closing balance 570,396 179,982 2,858,625 2,812,131 3,745,457 168,528 3,339,847 3,212,620
Other Liabilities
Markup payable 10,225 396 35,593 44,864 32,342 282 15,968 36,943
Accrued expenses and other payable 6,765 - 61,565 30,170 7,299 - 78,922 884
Unrealized (gain) / loss on forward foreign exchange contracts - outstanding - - - (1,783) - - - -
- - - -
Contingencies and Commitments
Commitments and contingent liabilities - outstanding - - 10,465 247,155 - - 10,227 12,679,481
Forward foreign exchange contracts (Notional) - outstanding - - - 3,842,252 - - - -
Un-audited September 30, 2019 Audited December 31, 2018
------------------------------------------------------------------------------------------------(Rupees in '000)------------------------------------------------------------------------------------------------

RELATED PARTY TRANSACTIONS
Directors
Key
Management
Personnel
Associates Other Related
PartiesDirectors
Key
Management
Personnel
Associates Other Related
Parties
Income
Markup / return / interest earned - 9,293 - 15,655 38 6,100 - 61,235
Fee and commission income - - 901,335 9,167 - - 795,831 5,977
Dividend income - - - 6,800 - - - 6,800
Share of profit of associates - - 374,289 - - - 477,014 -
(Loss) /gain on forward foreign exchange contracts matured during the period - - - (75,278) - - - 325,234
Net (loss) / gain on sale of securities - - (57) 10,993 - - 52 44,755
Gain on sale of fixed assets - 141 - - - 71 - -
Rent income and reimbursement of other expenses - - 6,646 3,038 - - 2,736 2,430
Expense
Markup / return / interest expensed 116,992 1,733 146,824 265,221 137,291 1,449 70,110 169,748
Other Operating expenses
Clearing expenses paid to NIFT - - - 109,623 - - - 111,119
Contribution to provident fund - - - 276,302 - - - 263,335
Rent expenses - - - 29,385 - - - 38,212
Cash sorting expenses - - - 115,291 - - - 116,867
Stationery expenses - - - 179,654 - - - 163,951
Security guards expenses - - - 275,539 - - - 301,542
Remuneration to key executives and non-executive directors fee 127,663 367,190 - - 112,995 359,659 - -
Outsourcing service expenses - - 150,885 - - - 154,142 -
E-dividend processing fee and CDC charges - - - 4,658 - - - 4,424
Travelling Expenses - - - 25,160 - - - 30,952
Hotel stay expenses - - - 1,170 - - - 13,882
Repair & Maintenance Charges - - - 1,594 - - - 1,700
Advertisement Expenses - - - 8,352 - - - -
Miscellaneous expenses and payments - - - 1,739 - - - 577
Insurance premium-net of refund - - 616,308 - - - 539,822 -
Insurance claim settled - - 53,178 - - - 199,920 -
Other Transactions
Proceeds from sale of fixed assets - 141 - - 1,999 3,202 - -
Purchase of fixed assets - - 26,373 20,003 - - 9,687 -
Sale of government securities 72,522 72,777 4,603,481 21,693,423 - 20,876 3,418,206 213,941,809
Purchase of government securities - 58,956 5,412,133 13,183,004 - 19,993 4,756,004 214,052,477
Forward exchange contracts matured during the period - - - 19,827,851 - - - 81,111,610
The Chairman has been provided with free use of the Group maintained car. The Chief Executive and certain executives are provided with free use of the Group's maintained cars and household equipment
in accordance with the terms of their employment.
Un-audited nine months period ended September 30, 2019 Un-audited nine months period ended September 30, 2018
------------------------------------------------------------------------------------------------(Rupees in '000)------------------------------------------------------------------------------------------------
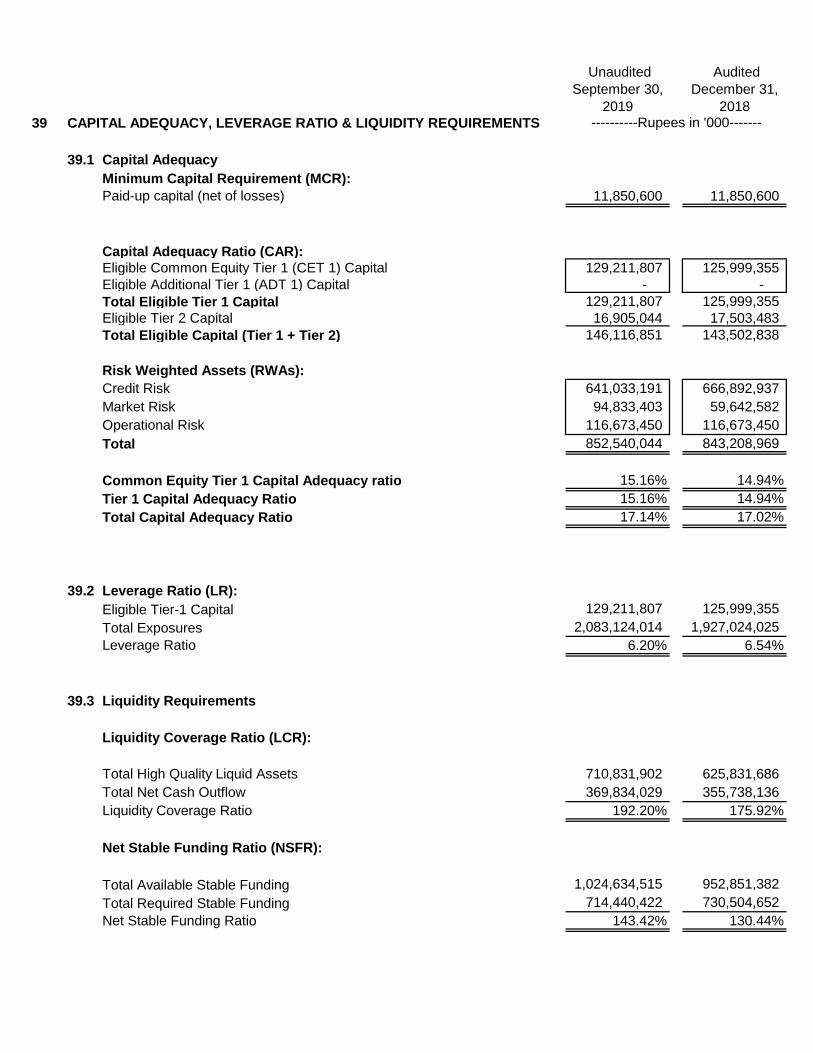
Unaudited
September 30,
2019
Audited
December 31,
2018
39 CAPITAL ADEQUACY, LEVERAGE RATIO & LIQUIDITY REQUIREMENTS
39.1 Capital Adequacy
Minimum Capital Requirement (MCR):
Paid-up capital (net of losses) 11,850,600 11,850,600
Capital Adequacy Ratio (CAR):Eligible Common Equity Tier 1 (CET 1) Capital 129,211,807 125,999,355
Eligible Additional Tier 1 (ADT 1) Capital - -
Total Eligible Tier 1 Capital 129,211,807 125,999,355
Eligible Tier 2 Capital 16,905,044 17,503,483
Total Eligible Capital (Tier 1 + Tier 2) 146,116,851 143,502,838
Risk Weighted Assets (RWAs):
Credit Risk 641,033,191 666,892,937
Market Risk 94,833,403 59,642,582
Operational Risk 116,673,450 116,673,450
Total 852,540,044 843,208,969
Common Equity Tier 1 Capital Adequacy ratio 15.16% 14.94%
Tier 1 Capital Adequacy Ratio 15.16% 14.94%
Total Capital Adequacy Ratio 17.14% 17.02%
39.2 Leverage Ratio (LR):
Eligible Tier-1 Capital 129,211,807 125,999,355
Total Exposures 2,083,124,014 1,927,024,025
Leverage Ratio 6.20% 6.54%
39.3 Liquidity Requirements
Liquidity Coverage Ratio (LCR):
Total High Quality Liquid Assets 710,831,902 625,831,686
Total Net Cash Outflow 369,834,029 355,738,136
Liquidity Coverage Ratio 192.20% 175.92%
Net Stable Funding Ratio (NSFR):
Total Available Stable Funding 1,024,634,515 952,851,382
Total Required Stable Funding 714,440,422 730,504,652
Net Stable Funding Ratio 143.42% 130.44%
----------Rupees in '000-------
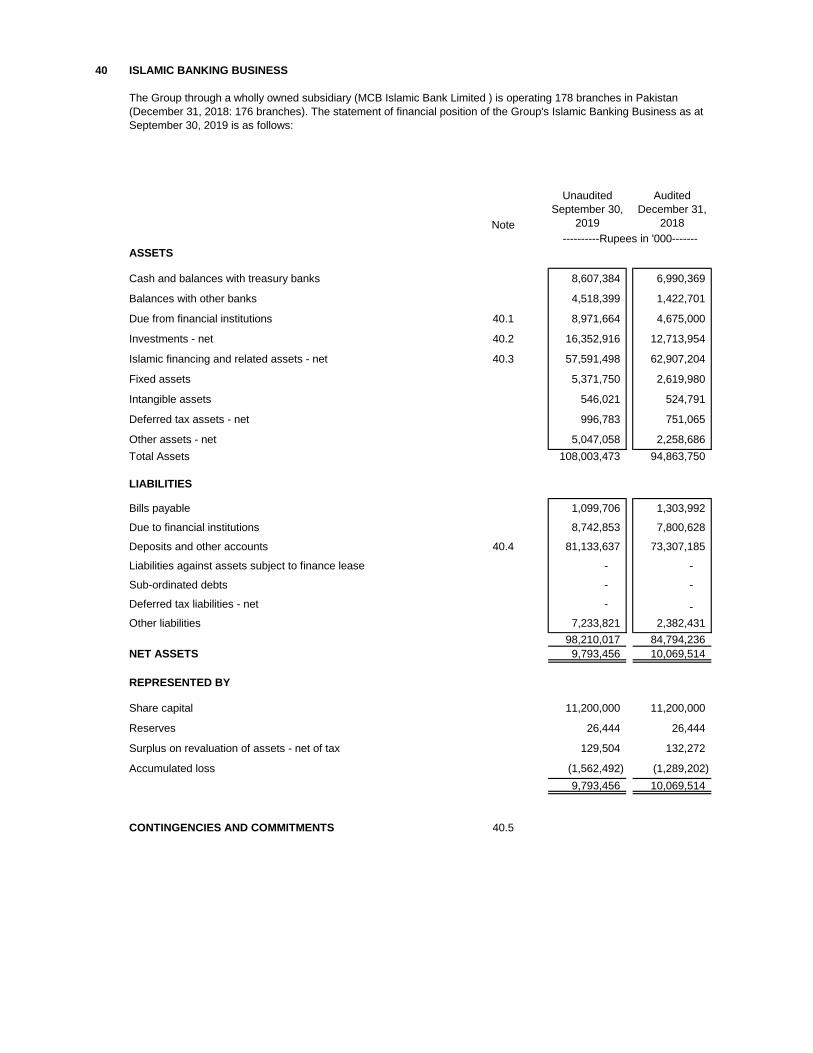
40 ISLAMIC BANKING BUSINESS
Note
Unaudited
September 30,
2019
Audited
December 31,
2018
ASSETS
Cash and balances with treasury banks 8,607,384 6,990,369
Balances with other banks 4,518,399 1,422,701
Due from financial institutions 40.1 8,971,664 4,675,000
Investments - net 40.2 16,352,916 12,713,954
Islamic financing and related assets - net 40.3 57,591,498 62,907,204
Fixed assets 5,371,750 2,619,980
Intangible assets 546,021 524,791
Deferred tax assets - net 996,783 751,065
Other assets - net 5,047,058 2,258,686
Total Assets 108,003,473 94,863,750
LIABILITIES
Bills payable 1,099,706 1,303,992
Due to financial institutions 8,742,853 7,800,628
Deposits and other accounts 40.4 81,133,637 73,307,185
Liabilities against assets subject to finance lease - -
Sub-ordinated debts - -
Deferred tax liabilities - net - -
Other liabilities 7,233,821 2,382,431
98,210,017 84,794,236
NET ASSETS 9,793,456 10,069,514
REPRESENTED BY
Share capital 11,200,000 11,200,000
Reserves 26,444 26,444
Surplus on revaluation of assets - net of tax 129,504 132,272
Accumulated loss (1,562,492) (1,289,202)
9,793,456 10,069,514
CONTINGENCIES AND COMMITMENTS 40.5
The Group through a wholly owned subsidiary (MCB Islamic Bank Limited ) is operating 178 branches in Pakistan
(December 31, 2018: 176 branches). The statement of financial position of the Group's Islamic Banking Business as at
September 30, 2019 is as follows:
----------Rupees in '000-------

Note
Quarter ended
September 30,
2019
Nine months
ended
September 30,
2019
Quarter ended
September 30,
2018
Nine months
ended
September 30,
2018
Profit / return earned 40.6 2,785,490 7,154,107 1,081,745 2,659,902
Profit / return expensed 40.7 1,565,466 4,200,212 587,645 1,498,122
Net Profit / return 1,220,024 2,953,895 494,100 1,161,780
Other income
Fee and Commission Income 64,908 206,060 40,034 93,227
Dividend Income 13,082 57,089 3,326 44,845
Foreign Exchange Income (37,527) 21,562 17,162 95,883
(loss) / Gain on securities (69,986) (113,063) 2,128 17,796
Other Income 4,985 14,361 3,246 8,362
Total other income (24,538) 186,009 65,896 260,113
Total Income 1,195,486 3,139,904 559,996 1,421,893
Other expenses
Operating expenses 1,091,784 3,311,671 942,030 2,118,113
Workers Welfare Fund - - - -
Other charges 24,124 24,141 3,181 3,181
Total other expenses 1,115,908 3,335,812 945,211 2,121,294
Profit / (loss) before provisions 79,578 (195,908) (385,215) (699,401)
Provisions and write offs - net 62,811 212,480 241,895 495,201
Profit / (loss) before taxation 16,767 (408,388) (627,110) (1,194,602)
Taxation 14,322 (134,465) (217,621) (414,756)
Profit / (loss) after taxation 2,445 (273,923) (409,489) (779,846)
Note
Unaudited
September 30,
2019
Audited
December 31,
2018
40.1 DUE FROM FINANCIAL INSTITUTIONS
Secured
Bai Muajjal receivable - with State Bank of Pakistan 40.1.1 3,371,664 -
Unsecured
Musharaka arrangements 40.1.2 5,600,000 4,675,000
8,971,664 4,675,000
40.1.1
40.1.2
------------------------------Rupees in '000------------------------------
The includes average return of 10.35% per annum (December 31, 2018: Nil) having maturity at February 07, 2020 (December 31, 2018: Nil).
This represents Musharaka arrangements with banks carrying profit at expected rates ranging from 11.40% to 12.50% per annum
(December 31, 2018: 9.25% to 9.55% per annum) and having maturity till October 04, 2019.
The profit and loss account of the Group's Islamic banking branches for the nine months period ended September 30, 2019 is as follows:

40.2 Investments by type:
Available-for-sale securities
Federal Government securities 10,913,131 - (23,206) 10,889,925 8,452,080 - (41,163) 8,410,917
Shares 2,053,042 1,078,061 (63,759) 911,222 1,831,580 881,903 (43,325) 906,352
Non Government securities 1,214,834 - 3,608 1,218,442 1,427,333 - 4,416 1,431,749
14,181,007 1,078,061 (83,357) 13,019,589 11,710,993 881,903 (80,072) 10,749,018
Held-to-maturity securities
Federal Government securities 2,700,827 - - 2,700,827 1,159,936 - - 1,159,936
Non Government securities 632,500 - - 632,500 805,000 - - 805,000
3,333,327 - - 3,333,327 1,964,936 - - 1,964,936
Total Investments 17,514,334 1,078,061 (83,357) 16,352,916 13,675,929 881,903 (80,072) 12,713,954
Unaudited
September 30,
2019
Audited
December 31,
2018
40.3 Islamic financing and related assets
Murabaha 9,611,839 17,097,127
Istisna 2,632,139 1,793,878
Salam 45,705 4,118
Ijarah 4,814,554 4,269,903
Running Musharaka 19,979,660 19,441,575
Diminishing Musharaka 19,182,389 19,057,417
Staff finance 1,356,289 1,258,046
Gross Islamic financing and related assets 57,622,575 62,922,064
Less: provision against Islamic financings
- Specific (1,897) (758)
- General (29,180) (14,102)
(31,077) (14,860)
Islamic financing and related assets - net of provision 57,591,498 62,907,204
-------------------------------------------------------------Rupees in '000-------------------------------------------------------------
----------Rupees in '000-------
Unaudited September 30, 2019 Audited December 31, 2018
Cost/
Amortised cost
Provision for
diminution
Surplus /
(Deficit)
Carrying
Value
Cost
/Amortised
cost
Provision for
diminution
Surplus /
(Deficit)
Carrying
Value

40.4 Deposits
Unaudited
September 30,
2019
Audited
December 31,
2018
Customers
Current deposits 22,140,282 22,098,366
Savings deposits 36,572,539 31,340,514
Term deposits 9,115,871 5,144,378
Others 3,011,852 3,690,026
70,840,544 62,273,284
Financial Institutions
Current deposits 67,247 74,372
Savings deposits 6,441,946 5,885,028
Term deposits 3,783,900 5,074,501
10,293,093 11,033,901
81,133,637 73,307,185
40.5 Contingencies and Commitments
5,099,081 3,092,537
8,069,554 16,238,022
430,320 425,820
13,598,955 19,756,379
40.6 Profit/Return Earned of Financing, Investments and Placement
Nine months
ended
September 30,
2019
Nine months
ended
September 30,
2018
Profit earned on:
Financing 5,461,889 2,095,590
Investments 1,266,990 453,541
Musharaka arrangements with financial institutions 350,316 71,247
Deposits with financial institutions 74,912 39,524
7,154,107 2,659,902
40.7 Profit on Deposits and other Dues Expensed
Deposits and other accounts 3,556,997 998,574
Musharaka arrangements with the State Bank of Pakistan under IERS 35,543 16,938
Musharaka arrangements with other financial institutions 369,934 482,610
Musharaka arrangements with other institution 4,853 -
Unwinding of liability against ROU asset 232,885
4,200,212 1,498,122
Unaudited
September 30,
2019
Audited
December 31,
2018
40.8 Islamic Banking Business Unappropriated Profit
Opening Balance (1,289,202) (194,065)
(408,388) (1,680,213)
Less: Taxation (134,465) (584,231)
Add: Reserves 633 845
(273,290) (1,095,137)
Closing Balance (1,562,492) (1,289,202)
Add: Islamic Banking loss for the period / year
----------Rupees in '000-------
-Guarantees
-Commitments
-Other contingent liabilities
----------Rupees in '000-------
----------Rupees in '000-------
Movement during the period / year

41 EVENTS AFTER THE REPORTING DATE
*42 GENERAL
43 DATE OF AUTHORIZATION FOR ISSUE
Chief Financial Officer Director Director Director President/Chief Executive
The Board of Directors in its meeting held on October 17, 2019 has announced a cash dividend in respect of nine
months period ended September 30, 2019 of Rs.4 per share (September 30, 2018: Rs. 4.00 per share). These
consolidated condensed interim financial statements for the period ended September 30, 2019 do not include the
effect of these appropriations which will be accounted for subsequent to the period end.
Figures have been rounded off to the nearest thousand of rupees unless otherwise stated.
These consolidated condensed interim financial statements were authorized for issue by the Board of Directors of
the Group in their meeting held on October 17, 2019.
Copyright © 2022 FDOKUMEN