AUDITED CONSOLIDATED FINANCIAL STATEMENTS
80
AUDITED CONSOLIDATED FINANCIAL STATEMENTS 2012
-
Upload
khangminh22 -
Category
Documents
-
view
1 -
download
0
Transcript of AUDITED CONSOLIDATED FINANCIAL STATEMENTS
AUDITED CONSOLIDATED FINANCIAL STATEMENTS
2012L
ou
is D
re
yf
us
Co
mm
oD
itie
s B
.V.
/
Au
Dit
eD
Co
ns
oL
iDA
te
D f
inA
nC
iAL
st
At
em
en
ts
2
01
2
LOUIS DrEyFUS COMMODITIES B.V.Westblaak 923012 KM rotterdamNetherlands
www.ldcom.com

Design and production by reluctantly Brave (London, UK) All photos Copyright © Louis Dreyfus Commodities unless otherwise indicated. All rights reserved.
Credit for photography that illustrates this report: Photographers: David Hundley / Oliver O’Hanlon / Vicki Stanwycks / © Mark Wilson ©Dreamstime.com / Okea ©Shutterstock.com / Copit / Marcelo Dufflocq W. / Fotogiunta / Inacio Pires / ragnarock
Unless otherwise indicated, “Louis Dreyfus Commodities”, “ Group”, “LDC” and related terms such as “our”, “we”, etc., mean the Louis Dreyfus Commodities B.V. Group as at 31 December 2012, i.e. excluding the Biosev Group which was indirectly upstreamed to Louis Dreyfus Commodities Holdings B.V. on 4 December 2012.
Profile................................................................2
Group.Highlights..............................................4
Management.Discussion.and.Analysis............6
Audited.Consolidated.Financial.Statements.16
CONTENTS
PROFILE
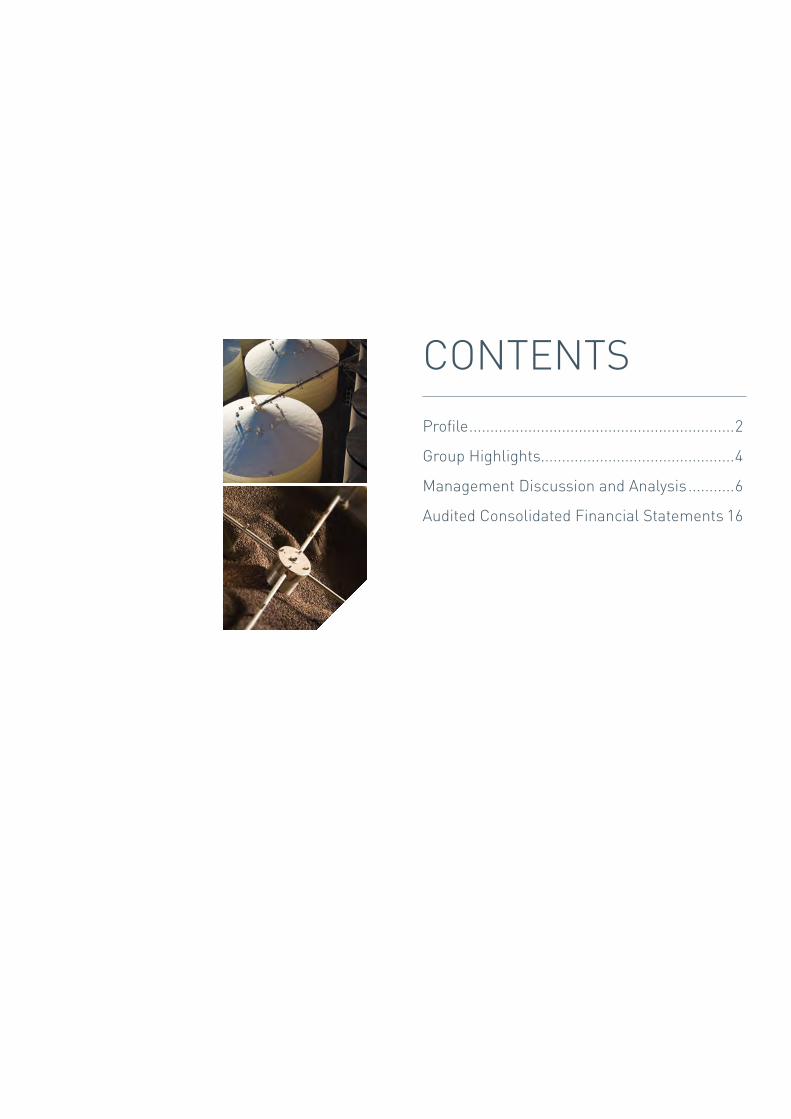
* More than 38 000 people at peak season including Biosev
Approximately20%
employee owned
20 000+ people*
(at peak season)globally
Operations in more than
90 countries162 years
of experience
Matrix organization of 6 regions and 13 platforms
2 LOuIS.DREyFuS.COMMODITIES.B.V. | 2012 Audited ConsolidAted FinAnCiAl stAtements
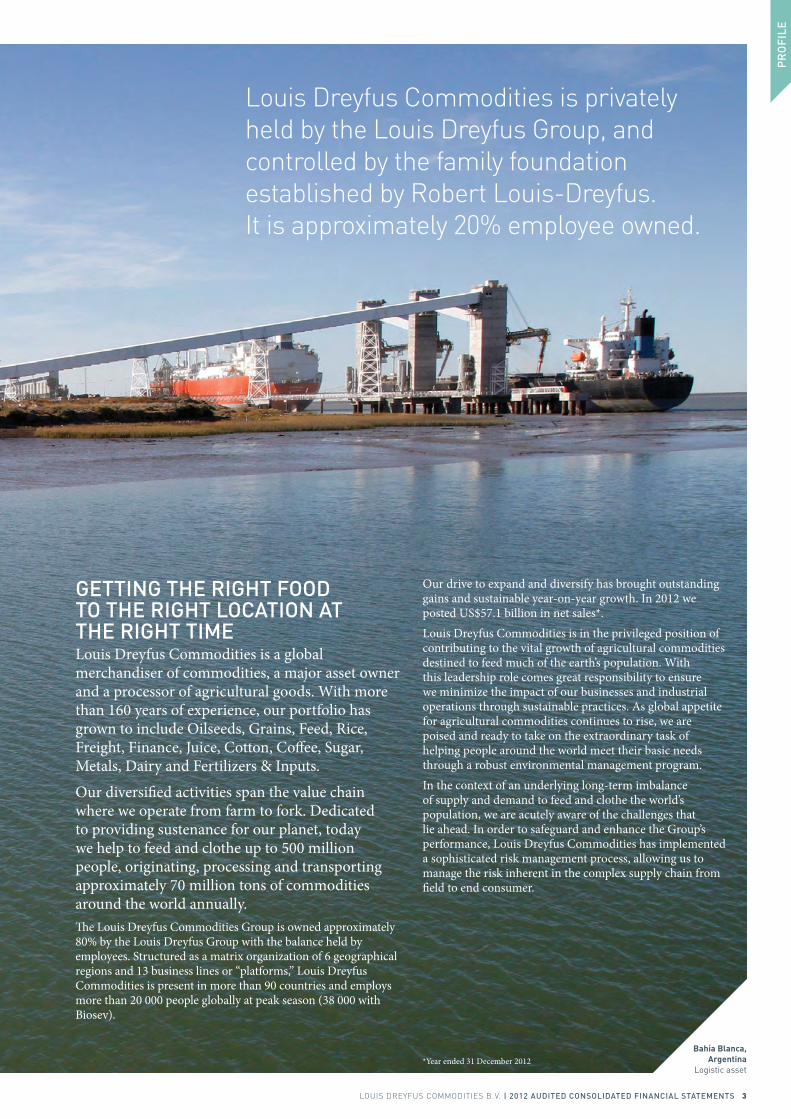
Bahía Blanca, Argentina
Logistic asset
Louis.Dreyfus.Commodities.is.privately.held.by.the.Louis.Dreyfus.Group,.and.controlled.by.the.family.foundation.established.by.Robert.Louis-Dreyfus...It.is.approximately.20%.employee.owned.
GettinG the riGht Food to the riGht loCAtion At the riGht timeLouis Dreyfus Commodities is a global merchandiser of commodities, a major asset owner and a processor of agricultural goods. With more than 160 years of experience, our portfolio has grown to include Oilseeds, Grains, Feed, Rice, Freight, Finance, Juice, Cotton, Coffee, Sugar, Metals, Dairy and Fertilizers & Inputs.
Our diversified activities span the value chain where we operate from farm to fork. Dedicated to providing sustenance for our planet, today we help to feed and clothe up to 500 million people, originating, processing and transporting approximately 70 million tons of commodities around the world annually.The Louis Dreyfus Commodities Group is owned approximately 80% by the Louis Dreyfus Group with the balance held by employees. Structured as a matrix organization of 6 geographical regions and 13 business lines or “platforms,” Louis Dreyfus Commodities is present in more than 90 countries and employs more than 20 000 people globally at peak season (38 000 with Biosev).
Our drive to expand and diversify has brought outstanding gains and sustainable year-on-year growth. In 2012 we posted US$57.1 billion in net sales*.Louis Dreyfus Commodities is in the privileged position of contributing to the vital growth of agricultural commodities destined to feed much of the earth’s population. With this leadership role comes great responsibility to ensure we minimize the impact of our businesses and industrial operations through sustainable practices. As global appetite for agricultural commodities continues to rise, we are poised and ready to take on the extraordinary task of helping people around the world meet their basic needs through a robust environmental management program.In the context of an underlying long-term imbalance of supply and demand to feed and clothe the world’s population, we are acutely aware of the challenges that lie ahead. In order to safeguard and enhance the Group’s performance, Louis Dreyfus Commodities has implemented a sophisticated risk management process, allowing us to manage the risk inherent in the complex supply chain from field to end consumer.
*Year ended 31 December 2012
Pr
oFi
le
LOuIS.DREyFuS.COMMODITIES.B.V. | 2012 Audited ConsolidAted FinAnCiAl stAtements 3
GROuP.HIGHLIGHTS
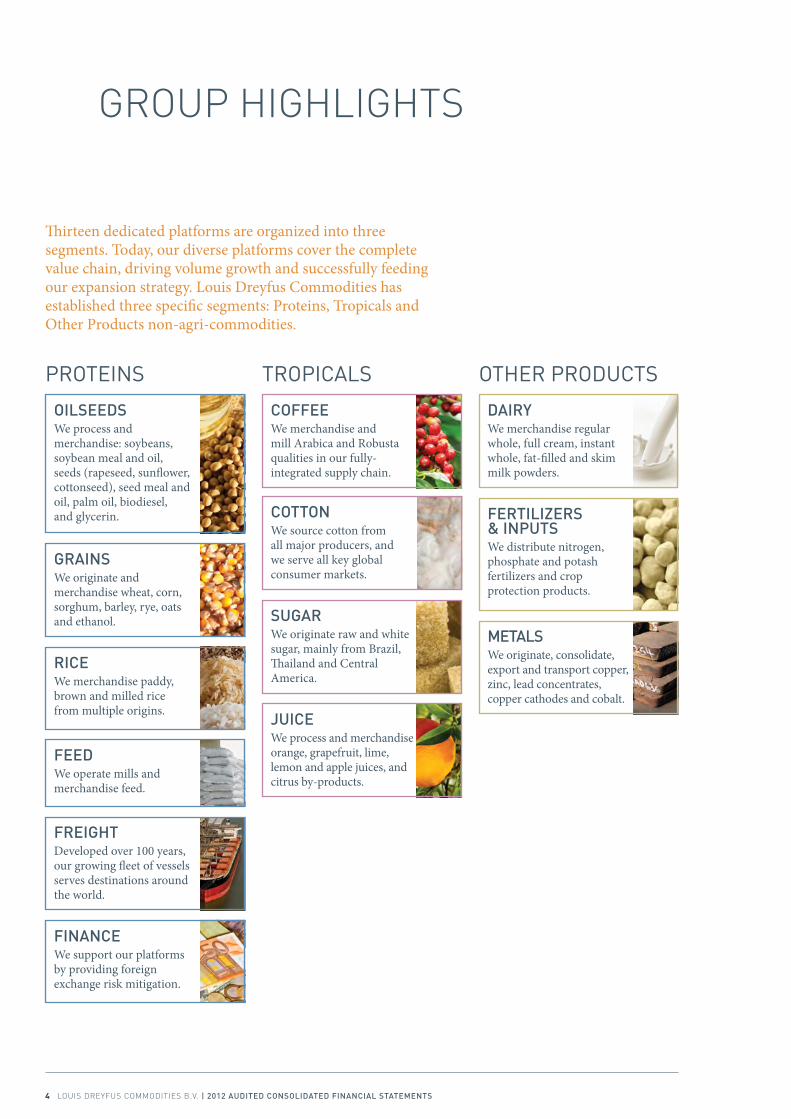
Thirteen dedicated platforms are organized into three segments. Today, our diverse platforms cover the complete value chain, driving volume growth and successfully feeding our expansion strategy. Louis Dreyfus Commodities has established three specific segments: Proteins, Tropicals and Other Products non-agri-commodities.
oilseedsWe process and merchandise: soybeans, soybean meal and oil, seeds (rapeseed, sunflower, cottonseed), seed meal and oil, palm oil, biodiesel, and glycerin.
CoFFeeWe merchandise and mill Arabica and Robusta qualities in our fully-integrated supply chain.
dAirYWe merchandise regular whole, full cream, instant whole, fat-filled and skim milk powders.
metAlsWe originate, consolidate, export and transport copper, zinc, lead concentrates, copper cathodes and cobalt.
FertiliZers & inPutsWe distribute nitrogen, phosphate and potash fertilizers and crop protection products.
CottonWe source cotton from all major producers, and we serve all key global consumer markets.
suGArWe originate raw and white sugar, mainly from Brazil, Thailand and Central America.
JuiCeWe process and merchandise orange, grapefruit, lime, lemon and apple juices, and citrus by-products.
GrAinsWe originate and merchandise wheat, corn, sorghum, barley, rye, oats and ethanol.
FreiGhtDeveloped over 100 years, our growing fleet of vessels serves destinations around the world.
riCeWe merchandise paddy, brown and milled rice from multiple origins.
FinAnCeWe support our platforms by providing foreign exchange risk mitigation.
FeedWe operate mills and merchandise feed.
PROTEINS TROPICALS OTHER PRODUCTS
4 LOuIS.DREyFuS.COMMODITIES.B.V. | 2012 Audited ConsolidAted FinAnCiAl stAtements
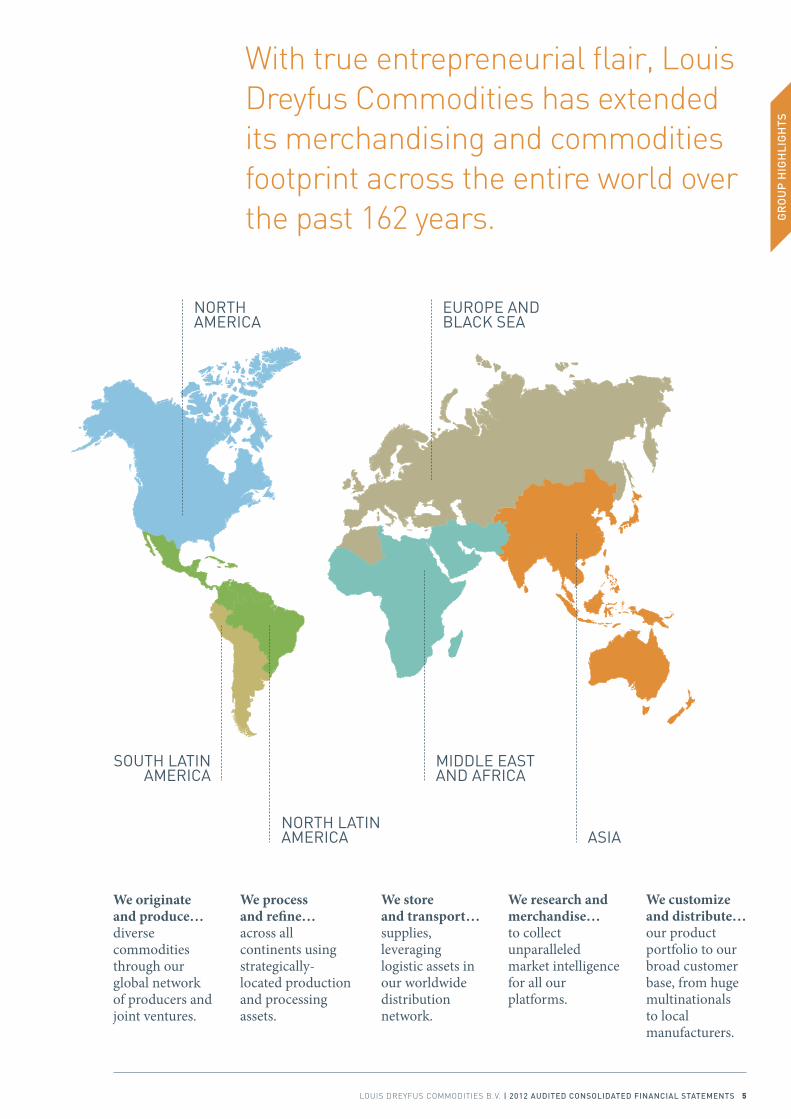
With.true.entrepreneurial.flair,.Louis.Dreyfus.Commodities.has.extended.its.merchandising.and.commodities.footprint.across.the.entire.world.over.the.past.162.years.
NORTH LATIN AMERICA ASIA
SOUTH LATIN AMERICA
MIDDLE EAST AND AFRICA
NORTH AMERICA
We originate and produce… diverse commodities through our global network of producers and joint ventures.
We process and refine… across all continents using strategically-located production and processing assets.
We store and transport… supplies, leveraging logistic assets in our worldwide distribution network.
We research and merchandise… to collect unparalleled market intelligence for all our platforms.
We customize and distribute…our product portfolio to our broad customer base, from huge multinationals to local manufacturers.
EUROPE AND BLACK SEA
Gr
ou
P h
iGh
liG
hts
LOuIS.DREyFuS.COMMODITIES.B.V. | 2012 Audited ConsolidAted FinAnCiAl stAtements 5
Port Cartier, Quebec
MANAGEMENT.DISCuSSION.AND.ANALySIS
Financial.Highlights
Statement.of.Income.Analysis
Statement.of.Financial.Position.Analysis
mA
nA
Ge
me
nt
dis
Cu
ssio
n A
nd
An
AlY
sis

Serge SchoenChief Executive Officer
MANAGEMENT.DISCuSSION.AND.ANALySIS
2012 marked an exceptional year for Louis Dreyfus Commodities B.V. with a consolidated net income, Group Share, of US$1.1 billion compared to US$875 million in 2011 – excluding Biosev’s contribution prior to ring-fencing1. Our enhanced geographic, platform and business diversification strategy fueled this historically high performance and made the difference in a challenging and fragile world economy. Thanks to strong reactivity and expertise, combined with valuable access to various originations, all segments performed profitably in the Group. In 2012, the world economy started to slowly recover from a crisis that has weakened both North America and Europe, and disturbed worldwide commercial trade flows. Exceptional weather events brought uncertainty to supplies and shook the world’s agribusiness, while the highly volatile markets and record breaking prices of 2011 started to calm down. Louis Dreyfus Commodities posted a record result in its continuing activities, benefiting particularly from the performance of our Proteins segment reaching a 57% proportion in the operating results – up from 51% last year, as well as from a strong second semester. Focusing on fundamentals, the Group embraced opportunities to foster growth; volumes rose by 7%, served by a diversification path, robust demand in the world’s agribusiness, plus emerging markets with growing needs linked to demographics. With 13 different platforms in all the regions of the world, Louis Dreyfus Commodities has also always cultivated product and geographical expansion. Our ability to diversify our originations is an increasingly valuable strategy; a strategy which responds perfectly to weather-related hazards, and to customers requiring products that originate from specific regions. In today’s world, the number one challenge for humanity is how to feed the growing population. As a consequence, and requiring massive investment, food production will have to almost double by 2050. Squeezing supplies further, global demand for agricultural commodities rises in pace with the need for animal proteins. In order to answer to these growing needs, we have invested US$652 million in the past twelve months in our continuing Core activities – without Biosev – to strengthen our diversification strategy, among all our platforms. Our robust and continuous investment plan included two major acquisitions in 2012: Imperial Sugar Company, Inc. (ISC) owning a portfolio of renowned brands for our Sugar platform, and Ecoval Holding BV (Ecoval) for our Dairy platform. Both acquisitions enhanced our presence downstream and upstream in the value chain.
1. Due to the upstreaming of LDC’s shareholding in Biosev S.A.’s holding company (“Biosev”) from LDC B.V. to LDCH B.V., FY 2012 LDC B.V. consolidated figures presented compare to FY 2011 LDC B.V. consolidated figures adjusted from the FY 2011 Biosev contribution.
8 LOuIS.DREyFuS.COMMODITIES.B.V. | 2012 Audited ConsolidAted FinAnCiAl stAtements
The result of our fully delivered strategic investment plan is that we have more than doubled in size in the past six years, with total assets reaching US$19.1 billion. We plan to invest US$5 billion over the next five years to master the entire distribution chain, from the farmer to refining as well as connection with final consumers. Capitalizing further on logistics assets is key to enabling Louis Dreyfus Commodities to secure stocks, and to answer growing needs, wherever and whenever they occur.Despite a tense financing environment in 2012, Louis Dreyfus Commodities reinforced in September its capital structure by diversifying funding sources through the inaugural issuance of US$350 million in hybrid perpetual securities, listed in Singapore. The success of the operation, which was oversubscribed by more than three times, marked our sound entry on the capital markets, and supports the Group’s growth strategy. Thanks to our strengths and clear objectives, we have leveraged our global foothold to secure short- and long-term funding at competitive rates, by sourcing optimal funding both in local and global financing markets.Effective from 4 December 2012, we carried out an internal reorganization to upstream the 65.9% owned sugar cane production and processing subsidiary Biosev, from Louis Dreyfus Commodities B.V. to Louis Dreyfus Commodities Holdings B.V. (LDCH B.V.). The move aims to increase and ease readability of LDC B.V.’s financial performance for our stakeholders.Although 2012 proved to be a challenging year for the global economy, once again our Group demonstrated its enviable ability to deliver thriving results thanks to our strategic assets and our long-term business strategy. Our employees – whose commitment, humility and expertise are at the origin of our success – remain Louis Dreyfus Commodities’ foremost resources and I want to thank them here for their contribution to our 2012 record results.
Serge SchoenChief Executive OfficerMember of the Supervisory Board
mA
nA
Ge
me
nt
dis
Cu
ssio
n A
nd
An
AlY
sis
LOuIS.DREyFuS.COMMODITIES.B.V. | 2012 Audited ConsolidAted FinAnCiAl stAtements 9
FINANCIAL.HIGHLIGHTS
Net sales of US$57.1 billion, compared to US$57.7 billion over the same period in 2011
Record Net Income, Group share at US$1.1 billion in our continuing operations versus US$875 million in 2011, a 25% increase
Net Income, Group Share, at US$1.0 billion versus US$735 million in 2011
Volumes2 up by 7% compared to 2011
Total Assets: US$19.1 billion versus US$18 billion at the end of December 2011
Fixed Assets3 and Investments in Associates: US$3.7 billion versus US$3.1 billion in December 2011
Capital expenditure4 of US$652 million in our continuing activities over the period
Working capital usage: US$8.8 billion, up by 12% compared to last year
Adjusted Net Gearing5 at 0.59
Return on equity6 of over 28% in our continuing activities- Group Share and over 21% for LDC
2. Volumes shipped to destination.3. PPE, Biological & Intangible assets.4. Purchase of fixed assets and additional investment, net of cash acquired.5. Net debt net of RMI.6. Annualized, beginning of period.
Due to the upstreaming of LDC’s shareholding in Biosev from LDC B.V. to LDCH B.V., FY 2012 LDC B.V. consolidated figures presented compare to FY 2011 LDC B.V. consolidated figures adjusted from the FY 2011 Biosev contribution.
10 LOuIS.DREyFuS.COMMODITIES.B.V. | 2012 Audited ConsolidAted FinAnCiAl stAtements
STATEMENT.OF.INCOME.ANALySIS7
net sAlesLouis Dreyfus Commodities booked net sales of US$57.1 billion in 2012, compared to US$57.7 billion in 2011. While volumes shipped to destination increased by 7% compared to the same period last year, the reduction of 1% in net sales was mainly due to a globally lower price environment compared to historically high prices in 2011. This context particularly affected our Tropicals segment, whose proportion within the total net sales decreased from 28% to 24%. Group sales were mainly driven by the increase in net sales for the Proteins segment, accounting for 63% of Group sales, compared to 61% over the same period last year. The increasing geographical diversification of Louis Dreyfus Commodities resulted in a high level of net sales. Our enhanced presence in Asia now accounts for 40% of the sales compared to 34% in 2011. Whereas markets such as Europe and Black Sea and North America are historically LDC’s largest regions, sales at destination for the Asia region grew by 14% compared to 2011. The proportion of emerging markets increased significantly and reached two thirds of the destination sales.
Gross mArGinIn 2012 Louis Dreyfus Commodities posted a record gross margin of US$2,321 million, up from US$2,132 million in 2011.
seGment oPerAtinG result8
The Group closed 2012 with a Segment Operating Result of US$2,310 million, compared to US$2,144 million in 2011, a solid increase of 8%. 2012 marked a record year for Louis Dreyfus Commodities in its continuing activities with historically high results. This performance is particularly remarkable given the context of a slow, worldwide economic recovery. Both advanced and emerging markets continue to suffer from a general sense of uncertainty due to the economic crisis largely affecting Europe and North America. Fuelled by demographic-related domestic needs in developing economies, the agribusiness sector enjoyed robust demand. Even after hitting record prices in 2011, agricultural commodity prices continued to reflect weather-related risks in global production volumes, as well as uncertainty over government intervention.
ProteinsIn 2012 the Proteins segment booked US$1,309 million in Operating Result, a 20% increase compared to US$1,091 million in 2011.Despite severe droughts and floods in North America in 2012, our Proteins segment met robust demand by optimizing the diversification of origins. Louis Dreyfus Commodities rapidly responded to the solid pace of demand, and maintained competitive prices for our global customers. During the second and third quarters of 2012, the Oilseeds and Grains platforms benefited from abundant export capacities to North America with import demand rising significantly following poor weather conditions and reduced crops.In a rice market impacted by interventionism throughout the year – and fuelled by heavy importation volumes in Africa in the last quarter of 2012 – Louis Dreyfus Commodities capitalized on its strong relationships with partners to secure volumes and perform well. Sourcing from diverse origins, and strengthening our position in destination countries, ensured success for our Rice platform. Despite the tough economic context, our successful Freight and Finance platforms benefited from their deep knowledge and on-going deployment across the different regions. Ongoing investments, particularly in logistics in both South and North America, enhanced our position along the value chain for our Proteins segment.
7. Due to the upstreaming of LDC’s shareholding in Biosev from LDC B.V. to LDCH B.V., FY 2012 LDC B.V. consolidated figures presented compare to FY 2011 LDC B.V. consolidated figures adjusted from the FY 2011 Biosev contribution.
8. Net sales less cost of sales plus share of income in affiliated companies carried at equity.
mA
nA
Ge
me
nt
dis
Cu
ssio
n A
nd
An
AlY
sis
LOuIS.DREyFuS.COMMODITIES.B.V. | 2012 Audited ConsolidAted FinAnCiAl stAtements 11
STATEMENT.OF.INCOME.ANALySIScontinued…
troPiCAlsIn 2012, the Tropicals segment posted a very solid Operating Result of US$844 million, compared to US$915 million in 2011.After breaking records in 2011, prices calmed down in 2012, particularly for Cotton and Coffee. Thanks to a deep knowledge of the environment, our Tropicals segment responded well to new opportunities. Operating in a highly competitive market, Louis Dreyfus Commodities gained from inherent abilities in logistics, marketing and merchandising to increase volumes within the segment, especially for our Cotton and Sugar platforms. Historically high results posted by the Coffee platform in 2012 testify that capitalizing on origin diversification, market knowledge, and customer proximity, is a successful strategy. Despite a decreased global demand with cotton continuing to lose market share to synthetic fibers, the Cotton platform leveraged its expertise to achieve the second highest results in its history. It was a consolidation year for the Juice platform with significant increase in the fruit production from its own farms as LDC’s past investments come to fruition, as well as the absorption of the purchase of the Paranavai plant in Brazil.In 2012 Louis Dreyfus Commodities continued its ongoing strategy to diversify its Sugar platform by geography and product, building assets in Asia, and acquiring the US firm Imperial Sugar Company (ISC). ISC brings an expanded deeper footprint in the North American region for the Group, and a larger product range on the Sugar market.
other ProduCtsThe Other Products segment posted an Operating Result of US$156 million for 2012, a 13% increase compared to US$138 million in 2011.Volumes rose over last year, driven by the Fertilizers platform which saw demand rise in the Middle-East and Africa region, particularly in the Western African states. In order to leverage its origination structure, the Platform expects to start activities in new markets opened in 2012 and intensify connection with farmers to offer an end-to-end offer.Our investment in GKE, a major metals operator in logistics in Singapore and Shanghai, will accelerate the development of our Metals platform and the expansion of its domestic activities in China, as well as bringing a new variety of products into our Metals portfolio.In 2012, our Dairy platform steadily entered both new origination and destination markets, such as Oceania, Europe, Asia, Middle East and the United States, thanks to the acquisition in October 2012 of Ecoval Dairy trade, a major dairy trading company.
CommerCiAl And AdministrAtiVe eXPensesG&A expenses reached US$755 million in 2012, showing a decrease of 7% compared to US$810 million year-on-year. Despite increasing volumes, the Group succeeded in reducing its Commercial and Administrative expenses through cost optimization in order to enhance on the long term its profitability.
FinAnCe Costs, netFinance costs amount to US$195 million for 2012 compared to US$218 million in 2011, showing a 11% decrease year-on-year. The interest expense has risen in 2012 compared to 2011 due to a higher level of long term debt but was counter-balanced by gains in foreign exchange especially in North and South Latin America. The gain in finance costs was also explained by a level of average debt slightly diminishing following decreasing financing needs linked to commodity prices in 2011.
net inComeLouis Dreyfus Commodities’ solid profitability is the proof of our efficient business model; enhancing reactivity, geographical and product diversification and stakeholder proximity.Net income, Group Share from continuing operations, reached US$1,096 million in 2012 (Net income from continuing operations at US$1,104 million) compared to US$875 million in 2011 (Net income from continuing operations at US$879 million); a 25% rise compared to 2011, and recorded as the best performance in the Group’s history.
12 LOuIS.DREyFuS.COMMODITIES.B.V. | 2012 Audited ConsolidAted FinAnCiAl stAtements
Due to the upstreaming of LDC’s shareholding in Biosev from LDC B.V. to LDCH B.V., FY 2012 LDC B.V. consolidated figures presented compare to FY 2011 LDC B.V. consolidated figures adjusted from the FY 2011 Biosev contribution.
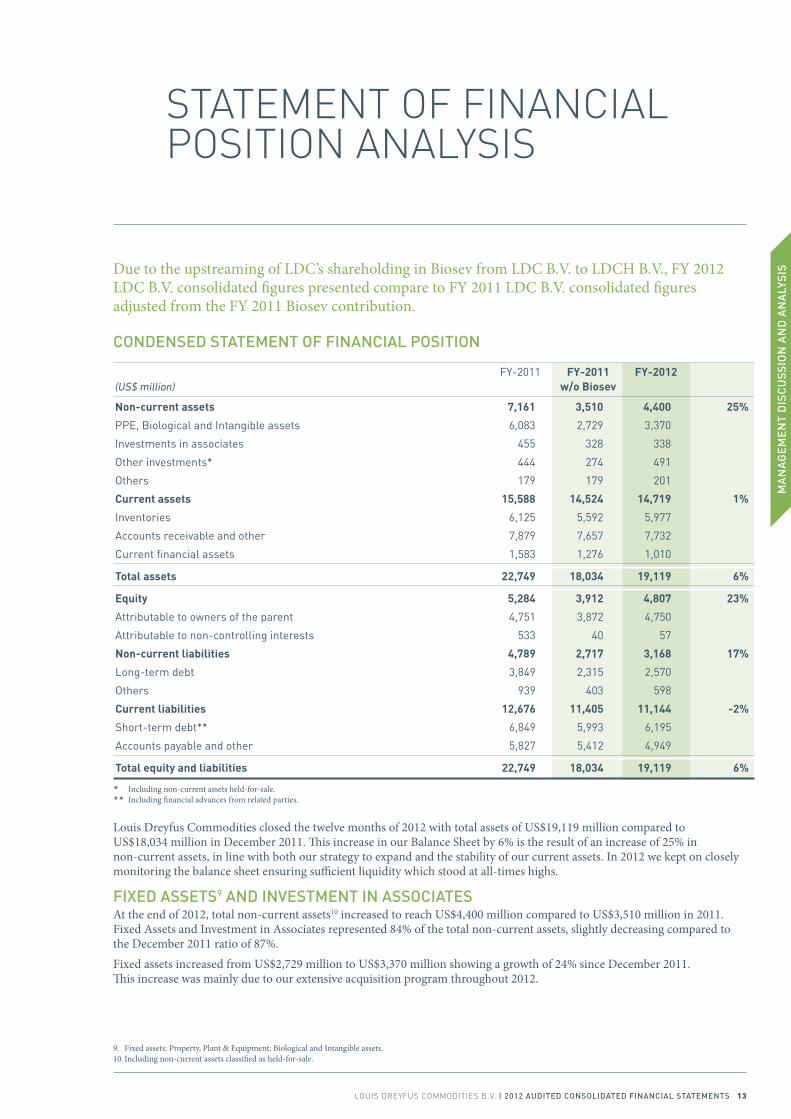
Condensed stAtement oF FinAnCiAl Position
Louis Dreyfus Commodities closed the twelve months of 2012 with total assets of US$19,119 million compared to US$18,034 million in December 2011. This increase in our Balance Sheet by 6% is the result of an increase of 25% in non-current assets, in line with both our strategy to expand and the stability of our current assets. In 2012 we kept on closely monitoring the balance sheet ensuring sufficient liquidity which stood at all-times highs.
FiXed Assets9 And inVestment in AssoCiAtesAt the end of 2012, total non-current assets10 increased to reach US$4,400 million compared to US$3,510 million in 2011. Fixed Assets and Investment in Associates represented 84% of the total non-current assets, slightly decreasing compared to the December 2011 ratio of 87%.Fixed assets increased from US$2,729 million to US$3,370 million showing a growth of 24% since December 2011. This increase was mainly due to our extensive acquisition program throughout 2012.
STATEMENT.OF.FINANCIAL.POSITION.ANALySIS
FY-2011 FY-2011 FY-2012 (US$ million) w/o Biosev
Non-current assets 7,161 3,510 4,400 25%
PPE, Biological and Intangible assets 6,083 2,729 3,370
Investments in associates 455 328 338
Other investments* 444 274 491
Others 179 179 201
Current assets 15,588 14,524 14,719 1%
Inventories 6,125 5,592 5,977
Accounts receivable and other 7,879 7,657 7,732
Current financial assets 1,583 1,276 1,010
Total assets 22,749 18,034 19,119 6%
Equity 5,284 3,912 4,807 23%
Attributable to owners of the parent 4,751 3,872 4,750
Attributable to non-controlling interests 533 40 57
Non-current liabilities 4,789 2,717 3,168 17%
Long-term debt 3,849 2,315 2,570
Others 939 403 598
Current liabilities 12,676 11,405 11,144 -2%
Short-term debt** 6,849 5,993 6,195
Accounts payable and other 5,827 5,412 4,949
Total equity and liabilities 22,749 18,034 19,119 6%
* Including non-current assets held-for-sale.** Including financial advances from related parties.
9. Fixed assets: Property, Plant & Equipment; Biological and Intangible assets.10. Including non-current assets classified as held-for-sale.
mA
nA
Ge
me
nt
dis
Cu
ssio
n A
nd
An
AlY
sis
LOuIS.DREyFuS.COMMODITIES.B.V. | 2012 Audited ConsolidAted FinAnCiAl stAtements 13

STATEMENT.OF.FINANCIAL.POSITION.ANALySIS
11. Purchase of fixed assets and additional investment, net of cash acquired.12. Cash & Cash Equivalent, Other Current Financial Assets net of financial assets held for trading purposes and reverse repurchase agreement, RMI and Undrawn Committed Bank Lines.
CAPitAl eXPenditure11 In 2012, Louis Dreyfus Commodities pursued its Capex plan to focus on industrial and logistical facilities and origination diversification, investing US$652 million in its continuing activities over the period, compared to US$693 million in 2011.
ProteinsIn terms of logistics in 2012 our Proteins segment’ major development strategy included the following investments: building a grain and oilseeds port elevator in Baton Rouge, Louisiana, US, due to start operating in 2013 and the expansion of our storage capacities in Mombasa, Kenya. In parallel, from early 2013 onwards a new high-capacity warehouse in Jatai, south-west Brazil, will serve the Oilseeds platform. On the industrial side, the Proteins segment developed a biodiesel line and increased the drying capacities to enhance the General Lagos complex in Argentina. Expanding our range of assets in Asia, our India-based oil refinery in Krishnaptnam successfully started operations. Our crushing plant in Paraguay, jointly built with partners and due for completion in April 2013, should foster our presence in South America in the coming months. And further developing the European region, Louis Dreyfus Commodities entered an agreement to build a port terminal for agricultural commodities in the Black Sea region.The segment continued its investment program to enhance existing asset capacities, especially in Latin America and North America.
troPiCAlsIn June we acquired the listed US firm Imperial Sugar Company (ISC), an established market leader in sugar refining and distribution. The acquisition of ISC marked a major highlight for the Sugar platform in 2012. Thanks to additional product lines, ISC brings us an enhanced ability to service downstream and upstream business partners. During the year, the Sugar platform also furthered construction of two new refineries in Indonesia and China. In 2012, the Juice platform advanced in Brazil with the integration of our newly purchased processing plant in the Parana region, and the construction of an additional plant in the Sao Paulo region, both of which will be served by the platform’s planting program. Our Coffee and Cotton platforms have enriched their logistical activities with new warehouses in Brazil, Indonesia and in the United States.
other ProduCtsThe successful acquisition in October 2012 of Ecoval, a major player in the dairy industry will massively develop our dairy activities. The addition of the Netherlands-based Ecoval to our existing business opens up promising developments in dairy by enhancing both our product and geographical diversity. After acquiring a 51% participation interest in June in GKE Metal Logistics Private Limited, a London Metal Exchange approved warehouse and logistics company in Singapore and Shanghai, the Metals platform has started construction of a warehouse in Peru to reinforce its presence in South America. The segment has also fostered developments in the Middle-East and Africa region, with our Fertilizers platform investing in logistics.
WorKinG CAPitAl usAGeThe Group’s working capital usage (WCU) has increased by 12% compared to last year, reaching US$8,8 billion. Inventories represent 68% of total WCU at the end of 2012, compared to 71% last year. Inventories reached US$5,977 million in 2012, a 7% increase compared to 2011 and the majority of them are found in the Tropicals segment and especially in our Sugar platform (with the acquisition of ISC). Due to their liquid nature, some agricultural inventories are Readily Marketable Inventories (RMI). RMIs are readily convertible to cash because of widely available markets and international pricing mechanisms. Louis Dreyfus Commodities considers that inventories of less than 3 months can be qualified as RMI. At the end of December 2012, RMI represented 83% of total inventories, stable compared to last year.
FinAnCinGDespite a macroeconomic environment suffering from a fragile recovery, Louis Dreyfus Commodities succeeded in maintaining a very solid liquidity12 in 2012; reaching US$7.6 billion – covering 40% of the Balance Sheet as of 31 December, 2012. At this date, 95% of the Group’s Short Term debt is covered by Current Financial Assets and RMI. We achieved this result thanks to cautious monitoring of cash-flow forecasts and to our regional model for accessing financing around the world. We access over 170 banks, in more than 35 countries across our six regions, to provide coverage in over 90 countries. At the end of 2012, the committed facilities amounted to 34% of the total facilities, according to the Group’s policy to increase commitments.
continued…
14 LOuIS.DREyFuS.COMMODITIES.B.V. | 2012 Audited ConsolidAted FinAnCiAl stAtements
13. Long term debt and Short term debt including financial advances from related parties and adjusted from repurchase agreements and securities short positions.14. Gross debt net from current financial assets.15. Net Debt net of RMI over equity.16. Net debt, net from RMI.
Group Gross Debt13 amounted to US$8,667 million at the end of December 2012, compared to US$8,180 million in 2011 whereas the Group’s consolidated Net Debt14 stood at US$7,783 million at the end of 2012, compared to US$7,052 billion in December 2011, leading to an adjusted net Gearing15 at 0.59 after taking into account the RMIs (compared to 0.61 in December 2011).The Group’s adjusted Net Debt16 reached US$2,846 million compared to US$2,395 million at the end of 2011.
eQuitYThe Louis Dreyfus Commodities Group carried out an internal reorganization, effective 4 December 2012, which led to the upstreaming of our 65.9% owned sugar cane production and processing subsidiary Biosev, from Louis Dreyfus Commodities B.V. to a newly formed intermediary holding, leading to Biosev becoming a sister company of LDC.The reorganization aims to facilitate the readability of LDC B.V.’s financial performance by our main stakeholders, while maintaining a specific growth path for each of the two groups.After this reorganization, Louis Dreyfus Commodities’ Equity reached US$4,807 million, a 23% increase compared to US$3,912 million at 2011 year-end. The change in Equity is principally explained by Louis Dreyfus Commodities’ record 2012 financial performance and to a lesser extent to the issuance of an inaugural US$350 million, 8.25% coupon hybrid capital securities transaction in September 2012. The structure of the perpetual hybrid capital securities qualifies the instrument to be classified as equity under IFRS. The securities – set to diversify Louis Dreyfus Commodities’ sources of funding to support our growth strategy and to increase our financial flexibility – are perpetual, but Louis Dreyfus Commodities has the right to redeem them in certain circumstances. They are not rated, and are listed in the Official List of the Singapore Exchange. Oversubscribed more than three times, the operation was a milestone success for the Group’s first access to capital markets.
suBseQuent eVentsIn January 2013, the Group signed an agreement to establish a joint venture with Namoi Cotton Ltd, an Australian company, whereby the Group will acquire a non-controlling stake (49%) in the cotton marketing and commodities packing assets for $32 million. The implementation of the joint venture is subject to a number of closing conditions.On 31 January 2013, the Group acquired a minority stake (1.13%) for $30 million in Chinalco Mining Corporation International (CMC), subsequent to their successful listing of CMC on the Hong Kong Stock Exchange. CMC is owned by Chinalco, a leading metals and mining conglomerate based in China, and acts as Chinalco’s platform for the acquisition, investment, development and operation of non-ferrous and non-aluminum mineral resources and projects overseas. CMC is currently focusing on developing the “Toromocho” Project which is located in central Peru in the core of the Morococha Mining district. The transaction involves both a strategic cornerstone investment in the Initial Public Offering and an off-take agreement pursuant to which the Group will buy a share of the annual production of copper concentrates of the Toromocho Project for a period of five years.On 28 February 2013, the Group acquired a frozen juice packaging plant and related inventories in Toronto, Canada for $7.1 million. The acquisition complements the Group’s retail strategy in North America by providing access to the Canadian market.
outlooKLouis Dreyfus Commodities posted a record profit in 2012 in its continuing activities with an excellent second semester. Despite weather-related uncertainties in crops, and commodity prices calming down after breaking records in 2011, the Group is confident in its outlook towards 2013. Louis Dreyfus Commodities’ strategy of geographical and portfolio diversification continues to drive our ambitious investment plan, slated to go further next year.
mA
nA
Ge
me
nt
dis
Cu
ssio
n A
nd
An
AlY
sis
LOuIS.DREyFuS.COMMODITIES.B.V. | 2012 Audited ConsolidAted FinAnCiAl stAtements 15
AuDITED.CONSOLIDATED.FINANCIAL.STATEMENTSyear.Ended.31.December.2012
Independent.Auditor’s.Report
Consolidated.Statement..of.Income
Consolidated.Statement..of.Financial.Position
Consolidated.Statement..of.Comprehensive.Income
Consolidated.Statement..of.Cash.Flows
Consolidated.Statement..of.Changes.in.Equity
Notes.to.Consolidated.Financial.Statements
Au
dit
ed
Co
ns
oli
dAt
ed
Fin
An
CiA
l s
tAte
me
nts
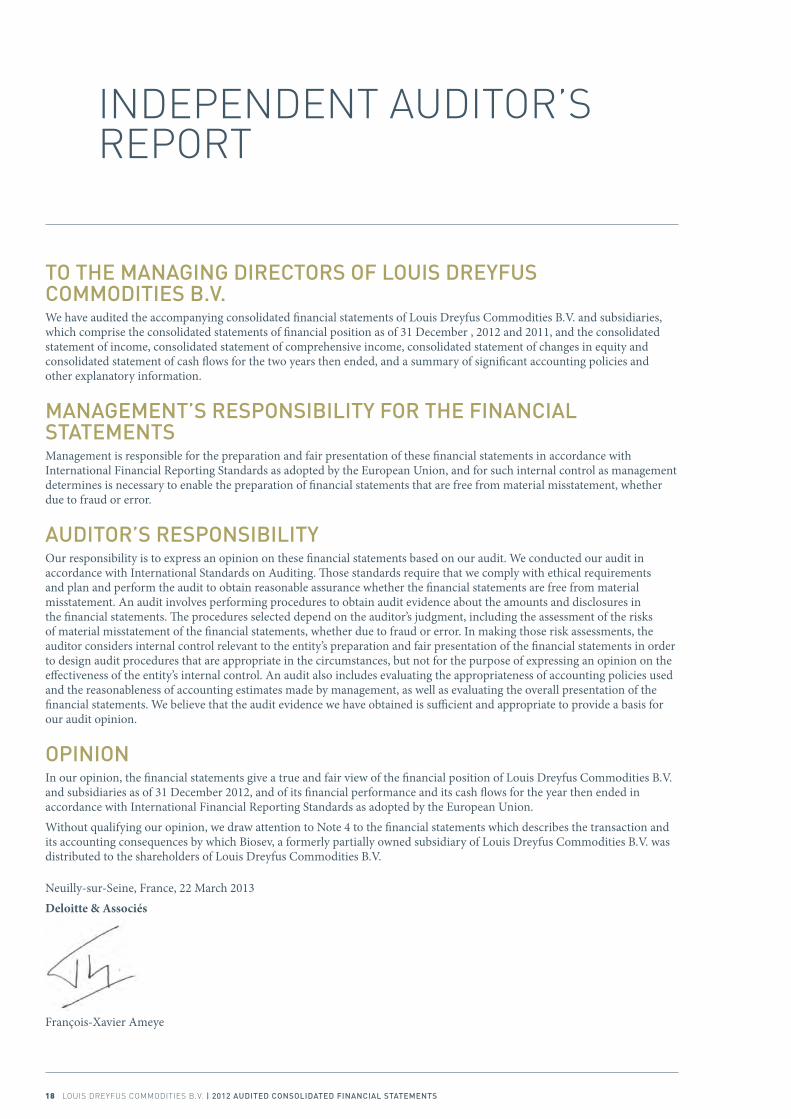
INDEPENDENT.AuDITOR’S.REPORT
to the mAnAGinG direCtors oF louis dreYFus Commodities B.V. We have audited the accompanying consolidated financial statements of Louis Dreyfus Commodities B.V. and subsidiaries, which comprise the consolidated statements of financial position as of 31 December , 2012 and 2011, and the consolidated statement of income, consolidated statement of comprehensive income, consolidated statement of changes in equity and consolidated statement of cash flows for the two years then ended, and a summary of significant accounting policies and other explanatory information.
mAnAGement’s resPonsiBilitY For the FinAnCiAl stAtements Management is responsible for the preparation and fair presentation of these financial statements in accordance with International Financial Reporting Standards as adopted by the European Union, and for such internal control as management determines is necessary to enable the preparation of financial statements that are free from material misstatement, whether due to fraud or error.
Auditor’s resPonsiBilitY Our responsibility is to express an opinion on these financial statements based on our audit. We conducted our audit in accordance with International Standards on Auditing. Those standards require that we comply with ethical requirements and plan and perform the audit to obtain reasonable assurance whether the financial statements are free from material misstatement. An audit involves performing procedures to obtain audit evidence about the amounts and disclosures in the financial statements. The procedures selected depend on the auditor’s judgment, including the assessment of the risks of material misstatement of the financial statements, whether due to fraud or error. In making those risk assessments, the auditor considers internal control relevant to the entity’s preparation and fair presentation of the financial statements in order to design audit procedures that are appropriate in the circumstances, but not for the purpose of expressing an opinion on the effectiveness of the entity’s internal control. An audit also includes evaluating the appropriateness of accounting policies used and the reasonableness of accounting estimates made by management, as well as evaluating the overall presentation of the financial statements. We believe that the audit evidence we have obtained is sufficient and appropriate to provide a basis for our audit opinion.
oPinion In our opinion, the financial statements give a true and fair view of the financial position of Louis Dreyfus Commodities B.V. and subsidiaries as of 31 December 2012, and of its financial performance and its cash flows for the year then ended in accordance with International Financial Reporting Standards as adopted by the European Union. Without qualifying our opinion, we draw attention to Note 4 to the financial statements which describes the transaction and its accounting consequences by which Biosev, a formerly partially owned subsidiary of Louis Dreyfus Commodities B.V. was distributed to the shareholders of Louis Dreyfus Commodities B.V.
Neuilly-sur-Seine, France, 22 March 2013Deloitte & Associés
François-Xavier Ameye
18 LOuIS.DREyFuS.COMMODITIES.B.V. | 2012 Audited ConsolidAted FinAnCiAl stAtements
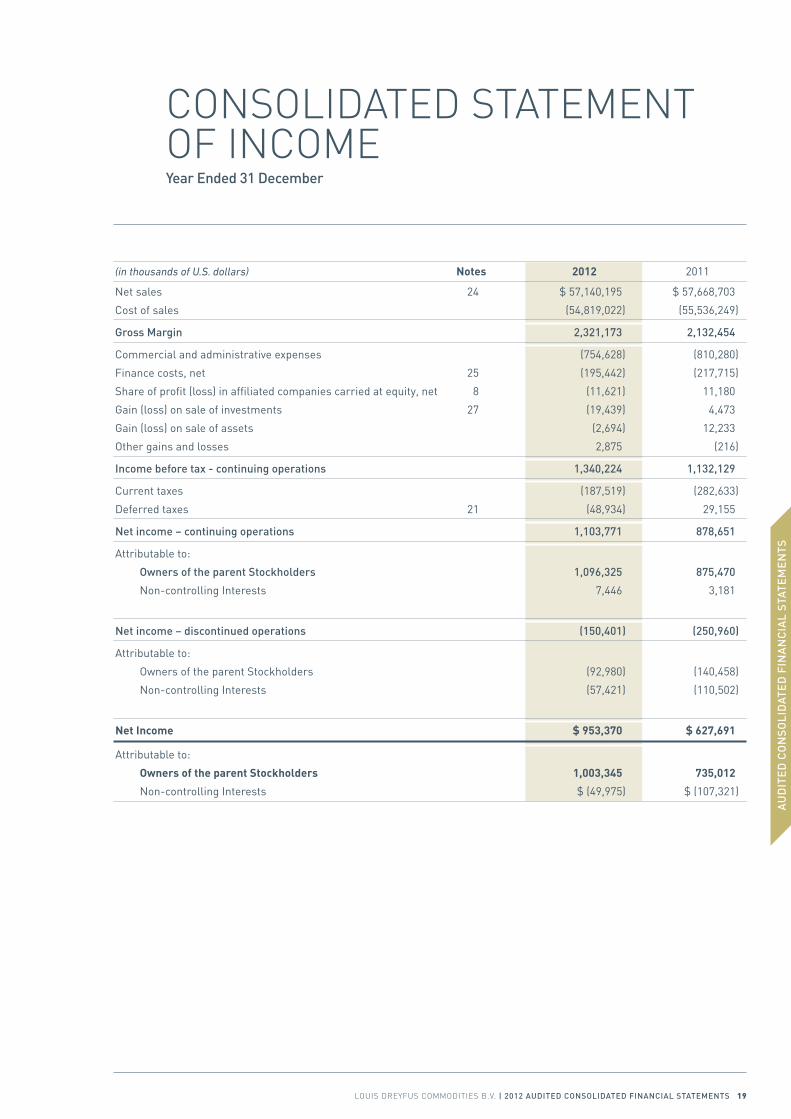
CONSOLIDATED.STATEMENT.OF.INCOMEYear ended 31 december
(in thousands of U.S. dollars) Notes 2012 2011
Net sales 24 $ 57,140,195 $ 57,668,703
Cost of sales (54,819,022) (55,536,249)
Gross margin 2,321,173 2,132,454
Commercial and administrative expenses (754,628) (810,280)
Finance costs, net 25 (195,442) (217,715)
Share of profit (loss) in affiliated companies carried at equity, net 8 (11,621) 11,180
Gain (loss) on sale of investments 27 (19,439) 4,473
Gain (loss) on sale of assets (2,694) 12,233
Other gains and losses 2,875 (216)
income before tax - continuing operations 1,340,224 1,132,129
Current taxes (187,519) (282,633)
Deferred taxes 21 (48,934) 29,155
net income – continuing operations 1,103,771 878,651
Attributable to:
owners of the parent stockholders 1,096,325 875,470
Non-controlling Interests 7,446 3,181
net income – discontinued operations (150,401) (250,960)
Attributable to:
Owners of the parent Stockholders (92,980) (140,458)
Non-controlling Interests (57,421) (110,502)
Net Income $ 953,370 $ 627,691
Attributable to:
Owners of the parent Stockholders 1,003,345 735,012
Non-controlling Interests $ (49,975) $ (107,321)A
UD
ITE
D C
ON
SO
LID
ATE
D F
INA
NC
IAL
STA
TEM
EN
TS
LOuIS.DREyFuS.COMMODITIES.B.V. | 2012 Audited ConsolidAted FinAnCiAl stAtements 19
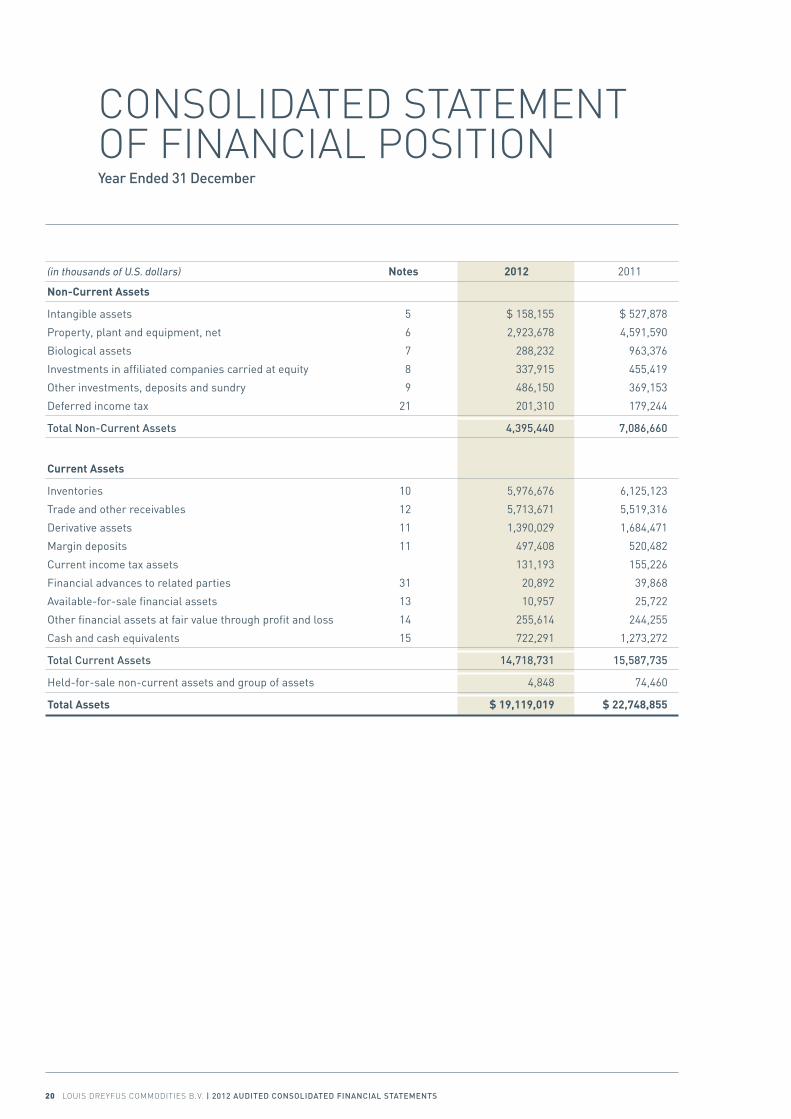
CONSOLIDATED.STATEMENTOF.FINANCIAL.POSITIONYear ended 31 december
(in thousands of U.S. dollars) Notes 2012 2011
Non-Current Assets
Intangible assets 5 $ 158,155 $ 527,878
Property, plant and equipment, net 6 2,923,678 4,591,590
Biological assets 7 288,232 963,376
Investments in affiliated companies carried at equity 8 337,915 455,419
Other investments, deposits and sundry 9 486,150 369,153
Deferred income tax 21 201,310 179,244
total non-Current Assets 4,395,440 7,086,660
Current Assets
Inventories 10 5,976,676 6,125,123
Trade and other receivables 12 5,713,671 5,519,316
Derivative assets 11 1,390,029 1,684,471
Margin deposits 11 497,408 520,482
Current income tax assets 131,193 155,226
Financial advances to related parties 31 20,892 39,868
Available-for-sale financial assets 13 10,957 25,722
Other financial assets at fair value through profit and loss 14 255,614 244,255
Cash and cash equivalents 15 722,291 1,273,272
total Current Assets 14,718,731 15,587,735
Held-for-sale non-current assets and group of assets 4,848 74,460
Total Assets $ 19,119,019 $ 22,748,855
20 LOuIS.DREyFuS.COMMODITIES.B.V. | 2012 Audited ConsolidAted FinAnCiAl stAtements
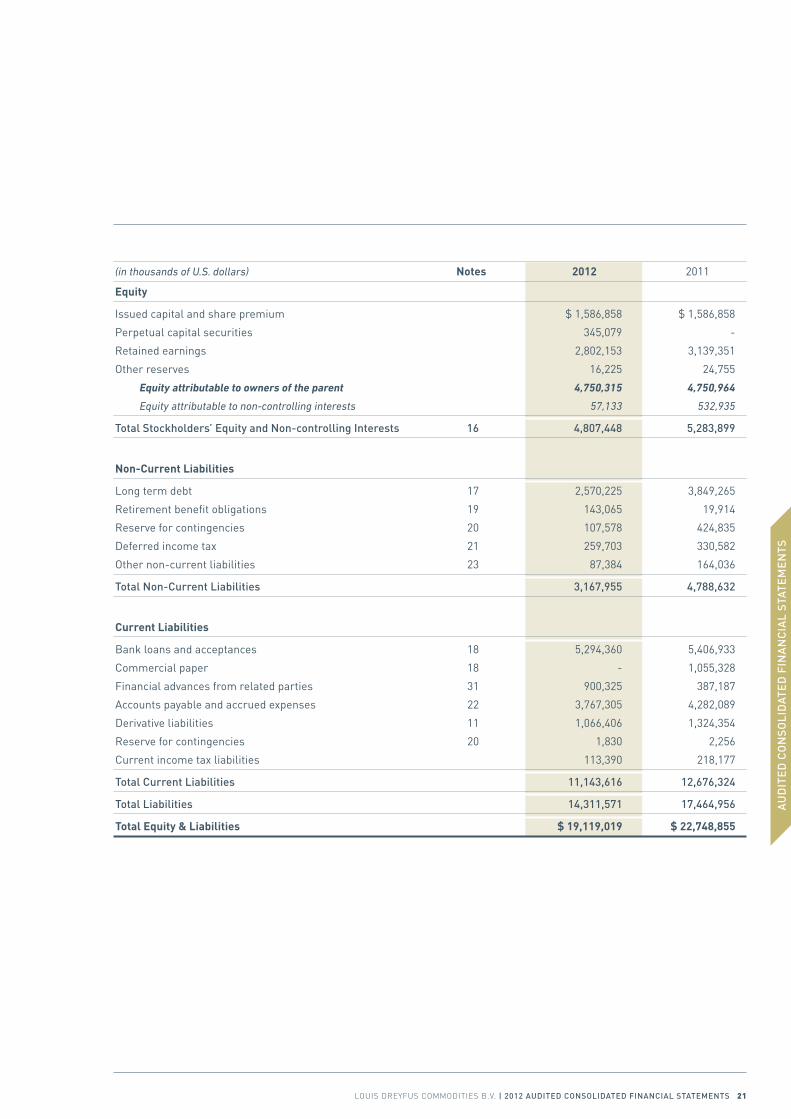
(in thousands of U.S. dollars) Notes 2012 2011
Equity
Issued capital and share premium $ 1,586,858 $ 1,586,858
Perpetual capital securities 345,079 -
Retained earnings 2,802,153 3,139,351
Other reserves 16,225 24,755
Equity attributable to owners of the parent 4,750,315 4,750,964
Equity attributable to non-controlling interests 57,133 532,935
total stockholders’ equity and non-controlling interests 16 4,807,448 5,283,899
Non-Current Liabilities
Long term debt 17 2,570,225 3,849,265
Retirement benefit obligations 19 143,065 19,914
Reserve for contingencies 20 107,578 424,835
Deferred income tax 21 259,703 330,582
Other non-current liabilities 23 87,384 164,036
total non-Current liabilities 3,167,955 4,788,632
Current Liabilities
Bank loans and acceptances 18 5,294,360 5,406,933
Commercial paper 18 - 1,055,328
Financial advances from related parties 31 900,325 387,187
Accounts payable and accrued expenses 22 3,767,305 4,282,089
Derivative liabilities 11 1,066,406 1,324,354
Reserve for contingencies 20 1,830 2,256
Current income tax liabilities 113,390 218,177
total Current liabilities 11,143,616 12,676,324
total liabilities 14,311,571 17,464,956
Total Equity & Liabilities $ 19,119,019 $ 22,748,855
AU
DIT
ED
CO
NS
OLI
DAT
ED
FIN
AN
CIA
L S
TATE
ME
NTS
LOuIS.DREyFuS.COMMODITIES.B.V. | 2012 Audited ConsolidAted FinAnCiAl stAtements 21
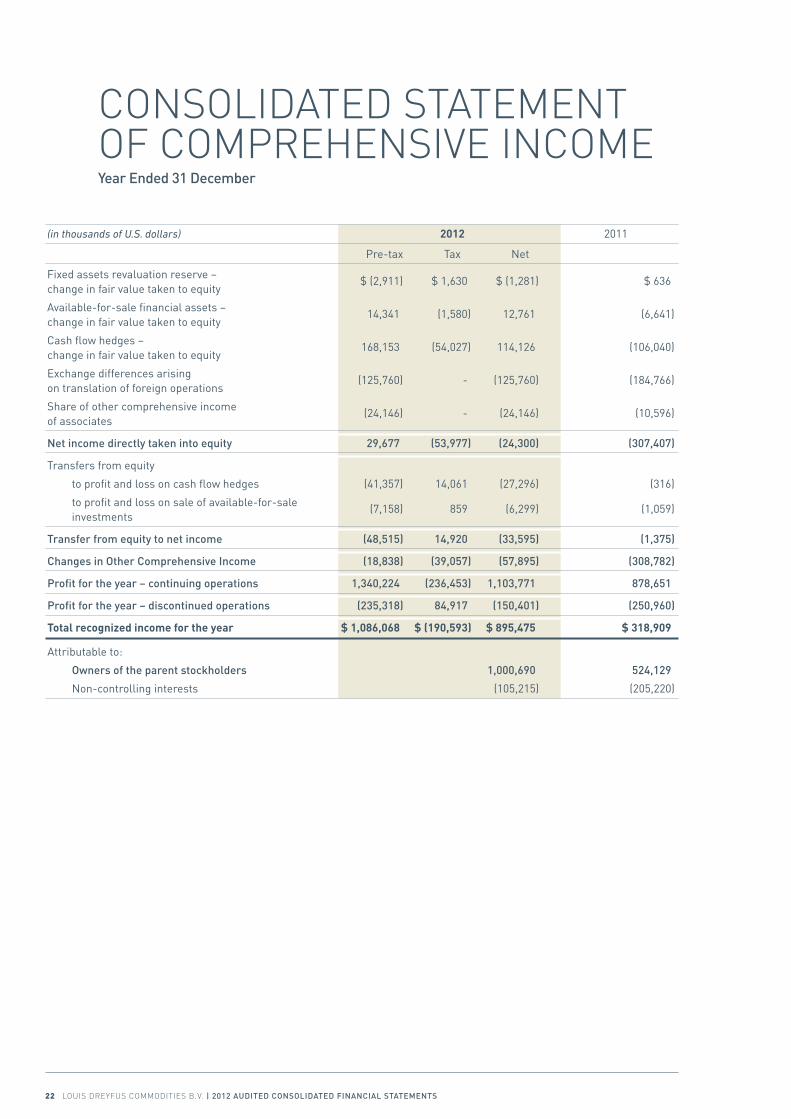
CONSOLIDATED.STATEMENT.OF.COMPREHENSIVE.INCOME.Year ended 31 december
(in thousands of U.S. dollars) 2012 2011
Pre-tax Tax Net
Fixed assets revaluation reserve – $ (2,911) $ 1,630 $ (1,281) $ 636 change in fair value taken to equity
Available-for-sale financial assets – 14,341 (1,580) 12,761 (6,641) change in fair value taken to equity
Cash flow hedges – 168,153 (54,027) 114,126 (106,040) change in fair value taken to equity
Exchange differences arising (125,760) - (125,760) (184,766) on translation of foreign operations
Share of other comprehensive income (24,146) - (24,146) (10,596) of associates
net income directly taken into equity 29,677 (53,977) (24,300) (307,407)
Transfers from equity
to profit and loss on cash flow hedges (41,357) 14,061 (27,296) (316)
to profit and loss on sale of available-for-sale (7,158) 859 (6,299) (1,059) investments
transfer from equity to net income (48,515) 14,920 (33,595) (1,375)
Changes in other Comprehensive income (18,838) (39,057) (57,895) (308,782)
Profit for the year – continuing operations 1,340,224 (236,453) 1,103,771 878,651
Profit for the year – discontinued operations (235,318) 84,917 (150,401) (250,960)
Total recognized income for the year $ 1,086,068 $ (190,593) $ 895,475 $ 318,909
Attributable to:
owners of the parent stockholders 1,000,690 524,129
Non-controlling interests (105,215) (205,220)
22 LOuIS.DREyFuS.COMMODITIES.B.V. | 2012 Audited ConsolidAted FinAnCiAl stAtements
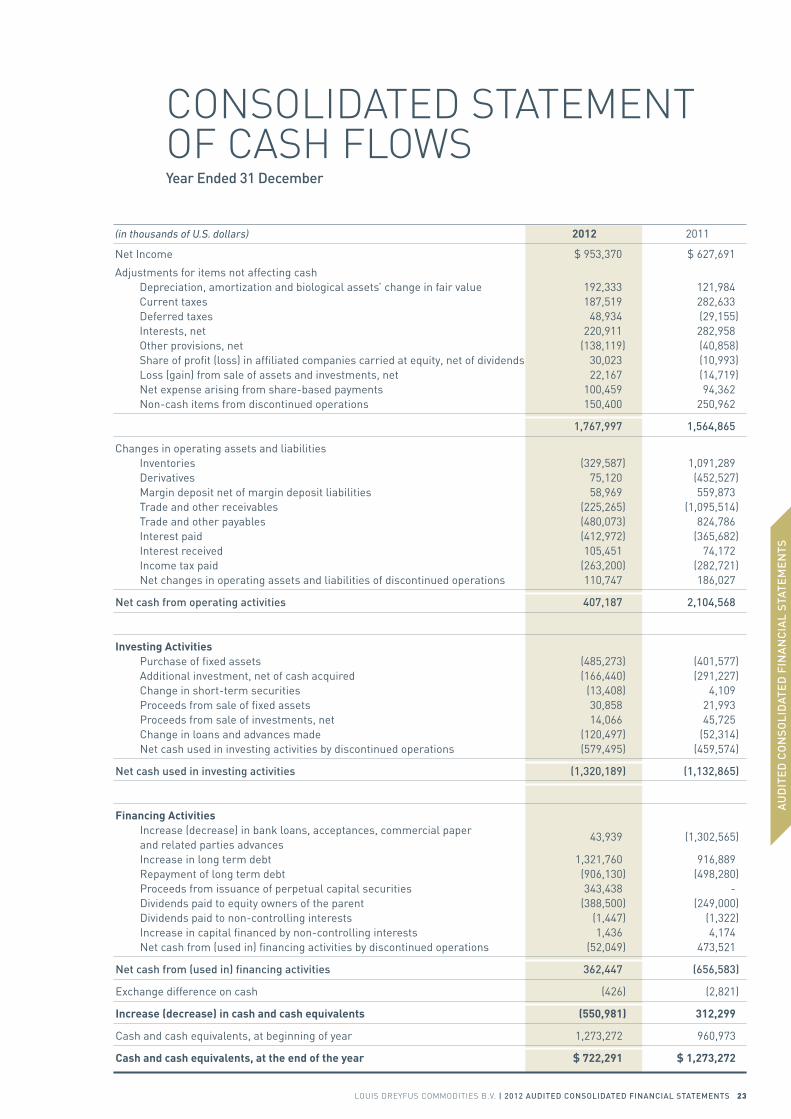
CONSOLIDATED.STATEMENT.OF.CASH.FLOWSYear ended 31 december
(in thousands of U.S. dollars) 2012 2011
Net Income $ 953,370 $ 627,691
Adjustments for items not affecting cash Depreciation, amortization and biological assets’ change in fair value 192,333 121,984 Current taxes 187,519 282,633 Deferred taxes 48,934 (29,155) Interests, net 220,911 282,958 Other provisions, net (138,119) (40,858) Share of profit (loss) in affiliated companies carried at equity, net of dividends 30,023 (10,993) Loss (gain) from sale of assets and investments, net 22,167 (14,719) Net expense arising from share-based payments 100,459 94,362 Non-cash items from discontinued operations 150,400 250,962
1,767,997 1,564,865
Changes in operating assets and liabilities Inventories (329,587) 1,091,289 Derivatives 75,120 (452,527) Margin deposit net of margin deposit liabilities 58,969 559,873 Trade and other receivables (225,265) (1,095,514) Trade and other payables (480,073) 824,786 Interest paid (412,972) (365,682) Interest received 105,451 74,172 Income tax paid (263,200) (282,721) Net changes in operating assets and liabilities of discontinued operations 110,747 186,027
net cash from operating activities 407,187 2,104,568
Investing Activities Purchase of fixed assets (485,273) (401,577) Additional investment, net of cash acquired (166,440) (291,227) Change in short-term securities (13,408) 4,109 Proceeds from sale of fixed assets 30,858 21,993 Proceeds from sale of investments, net 14,066 45,725 Change in loans and advances made (120,497) (52,314) Net cash used in investing activities by discontinued operations (579,495) (459,574)
net cash used in investing activities (1,320,189) (1,132,865)
Financing Activities Increase (decrease) in bank loans, acceptances, commercial paper 43,939 (1,302,565) and related parties advances Increase in long term debt 1,321,760 916,889 Repayment of long term debt (906,130) (498,280) Proceeds from issuance of perpetual capital securities 343,438 - Dividends paid to equity owners of the parent (388,500) (249,000) Dividends paid to non-controlling interests (1,447) (1,322) Increase in capital financed by non-controlling interests 1,436 4,174 Net cash from (used in) financing activities by discontinued operations (52,049) 473,521
net cash from (used in) financing activities 362,447 (656,583)
Exchange difference on cash (426) (2,821)
Increase (decrease) in cash and cash equivalents (550,981) 312,299
Cash and cash equivalents, at beginning of year 1,273,272 960,973
Cash and cash equivalents, at the end of the year $ 722,291 $ 1,273,272
Au
dit
ed
Co
ns
oli
dAt
ed
Fin
An
CiA
l s
tAte
me
nts
LOuIS.DREyFuS.COMMODITIES.B.V. | 2012 Audited ConsolidAted FinAnCiAl stAtements 23
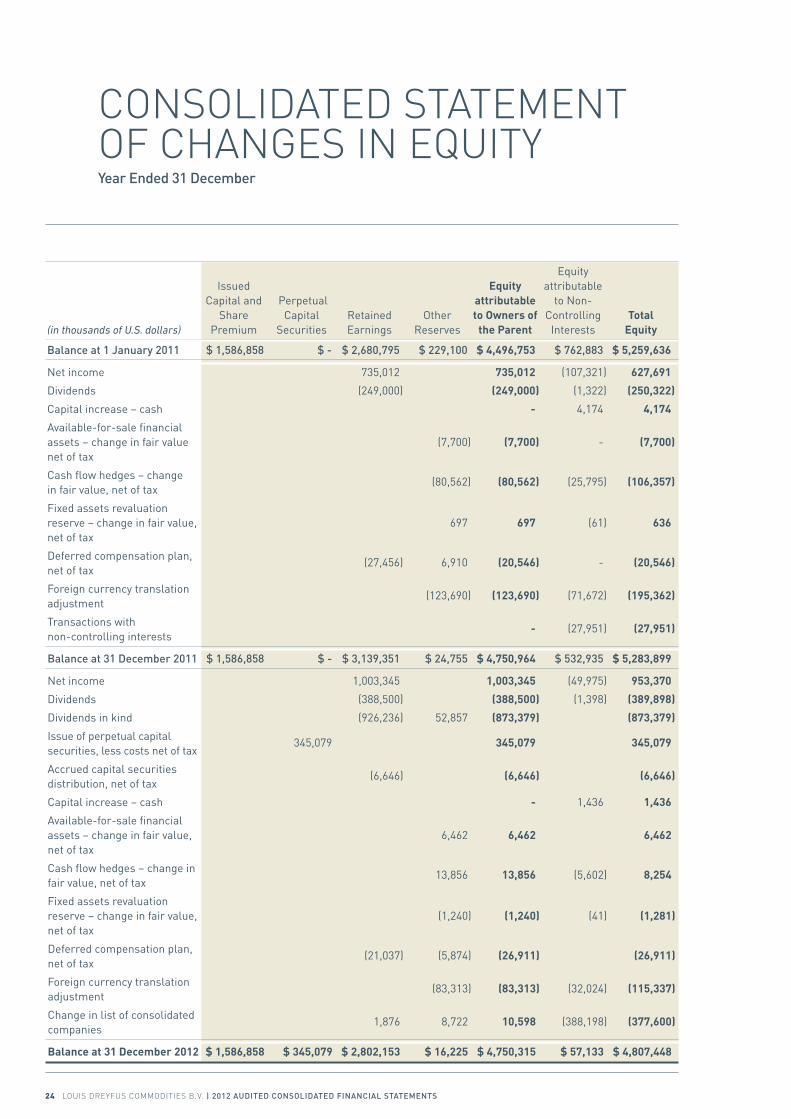
CONSOLIDATED.STATEMENT.OF.CHANGES.IN.EQuITyYear ended 31 december
Equity Issued Equity attributable Capital and Perpetual attributable to Non- Share Capital Retained Other to Owners of Controlling Total (in thousands of U.S. dollars) Premium Securities Earnings Reserves the Parent Interests Equity
Balance at 1 January 2011 $ 1,586,858 $ - $ 2,680,795 $ 229,100 $ 4,496,753 $ 762,883 $ 5,259,636
Net income 735,012 735,012 (107,321) 627,691
Dividends (249,000) (249,000) (1,322) (250,322)
Capital increase – cash - 4,174 4,174
Available-for-sale financial assets – change in fair value (7,700) (7,700) - (7,700) net of tax
Cash flow hedges – change (80,562) (80,562) (25,795) (106,357) in fair value, net of tax
Fixed assets revaluation reserve – change in fair value, 697 697 (61) 636 net of tax
Deferred compensation plan, (27,456) 6,910 (20,546) - (20,546) net of tax
Foreign currency translation (123,690) (123,690) (71,672) (195,362) adjustment
Transactions with - (27,951) (27,951) non-controlling interests
Balance at 31 december 2011 $ 1,586,858 $ - $ 3,139,351 $ 24,755 $ 4,750,964 $ 532,935 $ 5,283,899
Net income 1,003,345 1,003,345 (49,975) 953,370
Dividends (388,500) (388,500) (1,398) (389,898)
Dividends in kind (926,236) 52,857 (873,379) (873,379)
Issue of perpetual capital 345,079 345,079 345,079 securities, less costs net of tax
Accrued capital securities (6,646) (6,646) (6,646) distribution, net of tax
Capital increase – cash - 1,436 1,436
Available-for-sale financial assets – change in fair value, 6,462 6,462 6,462 net of tax
Cash flow hedges – change in 13,856 13,856 (5,602) 8,254 fair value, net of tax
Fixed assets revaluation reserve – change in fair value, (1,240) (1,240) (41) (1,281) net of tax
Deferred compensation plan, (21,037) (5,874) (26,911) (26,911) net of tax
Foreign currency translation (83,313) (83,313) (32,024) (115,337) adjustment
Change in list of consolidated 1,876 8,722 10,598 (388,198) (377,600) companies
Balance at 31 December 2012 $ 1,586,858 $ 345,079 $ 2,802,153 $ 16,225 $ 4,750,315 $ 57,133 $ 4,807,448
24 LOuIS.DREyFuS.COMMODITIES.B.V. | 2012 Audited ConsolidAted FinAnCiAl stAtements
NOTES.TO.CONSOLIDATED.FINANCIAL.STATEMENTS
Louis Dreyfus Commodities B.V. (“LDC”) is a privately owned company incorporated in the Netherlands on 28 December 2004. The address of its registered office is Westblaak 92, 3012 KM Rotterdam – Netherlands. It is an indirect subsidiary of Louis Dreyfus Holding B.V. (“LDH”), a privately owned Dutch company controlled by the family foundation established by Robert Louis-Dreyfus. At 31 December 2011, LDC was a direct subsidiary of Louis Dreyfus Commodities Holdings B.V. (“LDCH”), a company incorporated in the Netherlands. Effective 4 December 2012, LDCH contributed all its shares and voting rights in LDC to the newly formed intermediate holding company Louis Dreyfus Commodities Netherlands Holding B.V. (“LDCNH”) to which LDC distributed by way of a dividend in kind, all its shares and voting rights in Biosev S.A.’s holding company (“Biosev”). In the 31 December 2012 consolidated financial statements of LDC, the Biosev group was presented as a discontinued operation. Subsequent to such internal reorganization, LDCH remains the indirect shareholder of both LDC and Biosev. Since December 2007, a non-controlling share of LDCH was taken by employees in the execution of the equity participation plan described in note 29. In September 2012, LDC priced an inaugural US$350 million, 8.25% coupon hybrid capital securities transaction. The structure of the perpetual hybrid capital securities qualifies the instrument to be classified as equity under IFRS. The securities are perpetual, but LDC has the right to redeem them in certain circumstances. They are not rated, and are listed in the Official List of the Singapore Exchange.LDC and its subsidiaries (the “Group”) trade and market commodities, including grains, oilseeds, rice, sugar, ethanol, coffee and cotton on an international basis. The Group’s involvement in commodities also includes processing of citrus and apple fruits, oilseeds, sugar cane and corn. The Group has become active in the biofuels industry. The Group also trades ocean freight, metals, dairy, fertilizers and financial instruments.
1. ACCountinG PoliCiesThe consolidated financial statements of LDC are prepared in the functional currency of LDC, which is the U.S. Dollar.The consolidated financial statements have been established by the Board of Directors of LDC on 22 March 2013.The 31 December 2012 consolidated financial statements of LDC have been prepared in accordance with International Financial Reporting Standards (“IFRS”) adopted by the European Union at 31 December 2012. The Group has not adopted IAS 33 “Earnings per Share”. This standard is not mandatory for companies whose ordinary shares are not publicly traded.The accounting policies used to prepare these financial statements are the same as those used to prepare the consolidated financial statements at and for the year ended 31 December 2011, except for the application of IFRS 8 “Operating Segments” and the adoption of new amendments, standards and interpretations at 1 January 2012 detailed below.
neW And Amended ACCountinG stAndArds And interPretAtions in eFFeCt stArtinG From 2012
Amendment to IAS 1 “Presentation of Financial Statements”. This amendment improves the consistency and clarity of the presentation of items of other comprehensive income (OCI). It requires to present the items that have to be reclassified to profit and loss separately. When items of OCI are presented before tax, tax effects must be split on the same basis. The Group’s consolidated financial statements at 31 December 2012 reflect these amended disclosure requirements.
Amendment to IFRS 7 “Disclosures-Transfers of Financial Assets”. This amendment increases the required disclosures on the risk exposures relating to transfers of financial assets and the effect of those risks on an entity’s financial position. This amendment which should be applied for annual periods beginning on or after 1 July 2011 had no effect on the financial position nor performance of the Group.
Amendment to IAS 12 “Deferred Tax: Recovery of Underlying Assets”. This amendment introduces a presumption that recovery of the carrying amount will, normally, be through sale when the asset is measured using the fair value model in IAS 40 Investment Property. This amendment which should be applied for annual periods beginning on or after 1 January 2012 is not applicable to the Group and therefore had no effect on the financial position nor performance of the Group.
AU
DIT
ED
CO
NS
OLI
DAT
ED
FIN
AN
CIA
L S
TATE
ME
NTS
LOuIS.DREyFuS.COMMODITIES.B.V. | 2012 Audited ConsolidAted FinAnCiAl stAtements 25
Amendment to IFRS 1 “Severe Hyperinflation and Removal of Fixed Dates for First-time Adopters”. This amendment provides relief for first-time adopters of IFRSs from having to reconstruct transactions that occurred before their date of transition to IFRSs and provides guidance for entities emerging from severe hyperinflation either to resume presenting IFRS financial statements or to present IFRS financial statements for the first time. This amendment which should be applied for annual periods beginning on or after 1 January 2012 is not applicable to the Group and therefore had no effect on the financial position nor performance of the Group.
The other improvements to IFRS and amendments to IFRS effective 1 January 2012 had no effect on the financial position nor performance of the Group.The Group has not early adopted any other standard, interpretation or amendment, which were issued but are not yet effective.
neW And Amended ACCountinG stAndArds And interPretAtions APProVed BY the euroPeAn union With eFFeCt in Future Periods
Amendment to IAS 19 “Employee Benefits”. This amendment eliminates the option to defer the recognition of actuarial gains and losses, known as the “corridor method” and requires their recognition in OCI as they occur, replaces the rate of expected returns on plan assets with the discount rate applied to the net defined benefit liability, requires the immediate recognition of all past service costs, updates the presentation of changes in assets and liabilities arising from defined benefit plans, and increases the disclosure requirements for defined benefit plans. The application of this amendment will be mandatory for annual periods beginning on or after 1 January 2013.
The main impacts on the Group’s consolidated balance sheets at 1 January 2012 and 31 December 2012 correspond to the recognition of actuarial gains and losses and past service costs that were previously not recognised. A preliminary estimation of the impacts on the Group’s consolidated balance sheets at 1 January 2012 and 31 December 2012 is as follows:
– An increase in liabilities related to retirement benefit obligations estimated at $42 million at 1 January 2012 and $55 million at 31 December 2012,
– A decrease in assets recognised in balance sheet estimated at $2 million at 1 January 2012 and $2 million at 31 December 2012,
– A decrease in consolidated equity, net of tax, estimated at $27 million at 1 January 2012 and $37 million at 31 December 2012.
A detailed analysis of the impact of the amended version of IAS 19 on the 2012 consolidated financial statements is underway.
IFRS 10 “Consolidated Financial Statements”. The standard provides a single consolidation model that identifies control as the basis for consolidation for all types of entities. IFRS 10 supersedes IAS 27 “Consolidated and Separate Financial Statements” and SIC-12 “Consolidation-Special Purpose Entities”.
IFRS 11 “Joint Arrangements”. The standard provides for a more realistic reflection of joint arrangements by focusing on the rights and obligations of the arrangement, rather than its legal form. The standard addresses inconsistencies in the reporting of joint arrangements by requiring a single method to account for interests in jointly controlled entities that meet definition of a joint venture. IFRS 11 supersedes IAS 31 “Interests in Joint Ventures” and SIC 13 “Jointly Controlled Entities-Non-Monetary Contributions by Ventures”.
IFRS 12 “Disclosures of Interests in Other Entities”. The standard combines, enhances and replaces the disclosure requirements for all forms of interests in other entities, including subsidiaries, joint arrangements, associates and unconsolidated structured entities.
Following the issuance of IFRS 10, IFRS 11, and IFRS 12, IAS 27 and IAS 28 have been revised:
– IAS 27 “Separate Financial Statements” now only includes requirements for separate financial statements and is thus no longer applicable to LDC, and
– IAS 28 “Investments in Associates and Joint Ventures” prescribes the accounting for investments in associates and sets out the requirements for the application of the equity method when accounting for investments in associates and joint ventures.
26 LOuIS.DREyFuS.COMMODITIES.B.V. | 2012 Audited ConsolidAted FinAnCiAl stAtements
The application of these new standards (IFRS 10, IFRS 11 and IFRS 12) and the amended versions of IAS 27 and IAS 28 will be mandatory for annual periods beginning on or after 1 January 2014. Even if earlier application is permitted, the Group does not intend to apply these new standards and revised standards early.The Group is currently assessing the impact of these standards. The final assessment is not yet complete and may impact the Group’s financial statements.
IFRS 13 “Fair Value Measurement”. The standard aims to improve consistency and reduce complexity by providing a precise definition of fair value and a single source of fair value measurement and disclosure requirements for use across IFRSs. The requirements do not extend the use of fair value accounting but provide guidance on how it should be applied where its use is already required or permitted by other IFRSs. The application of this standard will be mandatory for annual periods beginning on or after 1 January 2013.
Amendment to IFRS 7 “Disclosures-Offsetting Financial Assets and Financial Liabilities”. This amendment increases disclosures requirements to improve comparability with US GAAP with regard to the set-off of financial instruments. The application of this amendment will be mandatory for annual periods beginning on or after 1 January 2013.
Amendment to IAS 32 “Offsetting Financial Assets and Financial Liabilities”. This amendment clarifies the requirement for offsetting financial instruments. The application of this amendment will be mandatory for annual periods beginning on or after 1 January 2014.
Amendment to IFRS 1 “Government Loans for First-time Adopters”. This amendment, dealing with loans received from governments at a below market rate of interest, gives first-time adopters of IFRSs relief from full retrospective application of IFRSs when accounting for these loans on transition. It provides the same relief to first-time adopters as is granted to existing preparers of IFRS financial statements when applying IAS 20 “Accounting for Government Grants and Disclosure of Government Assistance”. The amendment which will be effective for annual periods beginning on or after 1 January 2013 is not applicable to the Group and therefore would not impact the Group’s financial statements.
IFRIC 20 “Stripping Costs in the Production Phase of a Surface Mine”. The Interpretation clarifies when production stripping should lead to the recognition of an asset and how that asset should be measured, both initially and in subsequent periods. The Interpretation which will be effective for annual periods beginning on or after 1 January 2013 is not applicable to the Group and therefore would not impact the Group’s financial statements.
ACCountinG stAndArds And interPretAtions issued BY iAsB But not Yet APProVed BY the euroPeAn union The following standards and interpretations issued by IASB are not yet approved by the European Union. Their potential impact is currently under review by the Group:
IFRS 9 “Financial instruments”. The standard aims at replacing IAS 39 “Financial instruments – Recognition and Measurement”. It is a 3-phase project where only phase 1, “Classification and Measurement” was issued. Phase 2, “Impairment Methodology”, and phase 3 “Hedge Accounting”, have not been issued yet. The endorsement process by the European Union has been placed on hold, pending the completion of the whole project by the IASB.
Amendments to IFRS 9 and IFRS 7 “Mandatory Effective Date and Transition Disclosures”. These amendments postpone the mandatory application date of IFRS to annual periods beginning on or after 1 January 2015 and modify the requirements on transition disclosures.
Amendments to IFRS 10, IFRS 11 and IFRS 12 “Transition Guidance”. These amendments give additional transition relief by limiting the requirement to provide adjusted comparative information to only the preceding comparative period. Furthermore, for disclosures related to unconsolidated structured entities, the amendments will remove the requirement to present comparative information for periods before IFRS 12 is first applied.
Amendments to IFRS 10, IAS 27 and IFRS 12 “investment entities”. These amendments define an investment entity, provide an exception to the consolidation requirement in IFRS 10 “Consolidated Financial Statements” for investment entities and require that an investment entity should not consolidate investments in entities that it controls, but measure those investments at fair value, with changes in fair value recognised in profit or loss. Furthermore, the amendment requires an investment entity to provide additional disclosures for IFRS about entities that it controls when it measures investments in those entities at fair value.
AU
DIT
ED
CO
NS
OLI
DAT
ED
FIN
AN
CIA
L S
TATE
ME
NTS
LOuIS.DREyFuS.COMMODITIES.B.V. | 2012 Audited ConsolidAted FinAnCiAl stAtements 27
In addition, in 2012, IASB issued Annual Improvement to IFRSs (2009-2011 Cycle), applicable for annual periods beginning on or after 1 January 2013, including:
Amendment to IFRS 1, permitting the repeated application of IFRS 1 for entities that stopped applying IFRS and resuming the application of IFRS and clarifying for first-time adopters the accounting for the borrowing costs relating to qualifying assets for which the commencement date for capitalization was before the date of transition to IFRS,
Amendment to IAS 1, clarifying the requirements for comparative information,
Amendment to IAS 16, clarifying the classification of servicing equipment,
Amendment to IAS 32, clarifying the accounting for the tax effect of distributions to holders of equity instruments,
Amendment to IAS 34, clarifying the requirement for segment information on total assets and liabilities in interim financial reporting.
2. summArY oF siGniFiCAnt ACCountinG PoliCies BAsis oF ConsolidAtion The consolidated financial statements of LDC include all the accounts of subsidiaries in which LDC has a percentage of control of more than 50% and entities in which LDC is deemed to have exclusive control. Companies in which LDC has a direct or indirect, non-exclusive, control of 20% to 50%, are included under the equity method. All consolidated subsidiaries and companies carried at equity prepared their accounts at 31 December 2012, in accordance with the accounting policies and methods applied by the Group. Intercompany transactions and balances are eliminated in consolidation. A change to the ownership interest of a subsidiary, without loss of control, is accounted for as an equity transaction. In the event that the Group loses control over a subsidiary, the Group:
Derecognizes the assets (including goodwill) and liabilities of the subsidiary;
Derecognizes the carrying amount of any non-controlling interests;
Derecognizes the foreign currency translation recorded in equity;
Recognizes the fair value of the consideration received;
Recognizes the fair value of any investment retained;
Recognizes any benefit or deficit in profit or loss; and
Reclassifies components previously recognized in other comprehensive income to profit or loss or retained earnings, as appropriate.
use oF estimAtes The preparation of financial statements in accordance with IFRS requires management to make estimates and assumptions that affect the amounts reported in the financial statements and accompanying notes. Actual results could differ from those estimates. The Group engages in price risk management activities, principally for trading purposes. Activities for trading purposes are accounted for using the mark-to-market method. The market prices used to value these transactions reflect management’s best estimate considering various factors including the closing exchange and over-the-counter quotations, parity differentials, time value and price volatility underlying the commitments. The values are adjusted to reflect the potential impact of liquidating the Group’s positions in an orderly manner over a reasonable period of time under present market conditions. Goodwill is tested annually for impairment in accordance with the valuation methodology described below. The recoverable amounts of cash generating units have been determined based on value-in-use calculations. These calculations require the use of estimates.
28 LOuIS.DREyFuS.COMMODITIES.B.V. | 2012 Audited ConsolidAted FinAnCiAl stAtements
Cash generating units are defined at the lowest level of independent cash flows generated by the corresponding assets measured. Applying this methodology, the Group identified thirteen main independent cash generating units corresponding to its commodity platforms. The value-in-use calculations are based on pre-tax cash flow projections set on business plans approved by the management covering a five-year period. Cash flows beyond this five-year period, are extrapolated using a steady 1% per annum growth rate. The management estimates that these growth rates are reasonable, compared with the expected long-term average growth rate for the businesses in which the cash generating units operate. Discount rate used is based on the weighted average cost of capital of the Group before tax, which was established at 9.3% at 31 December 2012. No impairment was consequently recognized at year end. Reasonable changes in any of the above key assumptions would not cause the carrying value of any cash generating unit to exceed its recoverable amount. Biological assets are carried at fair value, estimated using discounted expected future cash flows, less costs to sell. This computation includes estimates of productivity, quality, market price, labour costs, and interest rates evolutions. Market prices are derived from prices available on quoted active markets for products related to the biological assets valued. Biological assets are grouped by location to better integrate significant attributes like maturity, quality, labor costs needs and yield, in the determination of the fair value. Comparisons are made on an ongoing basis to adjust estimates from past harvests and changes in market prices. The projections are made in U.S. Dollars with a finite projection period, based on the remaining useful life of each group of biological assets identified. Deferred tax assets are recognized for all unused tax losses to the extent that it is probable that taxable profit will be available against which the losses can be utilized. Significant management judgment is required to determine the amount of deferred tax assets that can be recognized, based upon the likely timing and level of future taxable profits together with future tax planning strategies.
ForeiGn CurrenCies Financial statements of foreign operations are translated from the functional currency into U.S. Dollar using exchange rates in effect at period end for assets and liabilities, and average exchange rates during the period for results of operations and cash flows. However, for certain material transactions, a specific rate of exchange is used when considered relevant. Related translation adjustments are reported as a separate component of equity. A proportionate share of translation adjustments relating to a foreign investment is recognized in income when this investment is sold fully or partially. When the functional currency is not the local currency, the local statements are first converted using historical exchange rates for inventories, properties, and depreciation, and related translation adjustments are included in current year’s operations. Exchange differences arising on monetary items which form an integral part of the net investment in foreign subsidiaries are recognized in equity, under “Translation adjustments”, for their net-of-tax amount. Exchange differences on receivables and payables denominated in a foreign currency are recorded in the income for the year. On a regular basis, the Group reviews the functional currencies used in measuring foreign operations to assess the impact of recent evolutions of its activities and the environment in which it operates.
stAtement oF inCome Income and expenses are analyzed by function in the consolidated statement of income. Cost of sales includes depreciation and employment costs relating to processing plants. It also includes the net unrealized gain or loss on open contracts of the commodity and freight trading activity as well as the change in fair value of biological assets. Commercial and administrative expenses include the cost of traders and administrative employees, the depreciation of office buildings and equipment, as well as the charge resulting from the fair value of shares and stock options granted to employees.
stAtement oF FinAnCiAl Position Assets and liabilities are presented separately between current and non-current assets, and current and non-current liabilities. This classification is based for each asset and liability on the expected recoverability or settlement, before or after twelve months from the balance sheet date.
AU
DIT
ED
CO
NS
OLI
DAT
ED
FIN
AN
CIA
L S
TATE
ME
NTS
LOuIS.DREyFuS.COMMODITIES.B.V. | 2012 Audited ConsolidAted FinAnCiAl stAtements 29
intAnGiBle Assets Goodwill The acquisition method of accounting is used to account for the acquisition of subsidiaries by the Group. For transactions concluded prior to 31 December 2009 goodwill was determined as the excess cost of acquisition over the fair value of net assets acquired at date of purchase. When the Group acquired an additional interest in a company already controlled, the excess cost of acquisition over the historical value of net assets acquired, was also recorded as goodwill. When non-controlling interests were granted put option agreements exercisable without constraint from the Group, the excess share of equity over the fair value of these agreements was also recorded as goodwill.For transactions concluded since 1 January 2010, goodwill is initially measured at cost being the excess of the aggregate of the consideration transferred, measured at fair value at acquisition date, and the amount recognized for non-controlling interest over the net identifiable assets acquired and liabilities assumed. For each business combination, the Group measures the non-controlling interest in the acquiree either at fair value or at the proportionate share of the acquiree’s identifiable net assets. Non-controlling interests’ put options rights exercisable without constraint for the Group are recorded as liabilities at the present value of their contractual exercise price. The impact of the share of net income attributable to the underlying non-controlling interests as well as the changes in the value of the liabilities are recorded directly through equity (owners of the parent share).Goodwill is not amortized. Goodwill is tested for impairment, when circumstances indicate that the carrying value may be impaired, and at the minimum, annually. Impairment is determined for goodwill by assessing the recoverable amount of the cash-generating units, to which the goodwill relates. Where the recoverable amount of the cash-generating units is less than their carrying amount an impairment loss is recognized. Goodwill relating to the acquisition of shares in an equity investment is presented in investments in affiliated companies carried at equity.
Other Intangible Assets Intangible assets acquired separately are measured on initial recognition at cost. The cost of intangible assets acquired in a business combination is the fair value at the date of acquisition. Following initial recognition, intangible assets are carried at cost less any accumulated amortization and any accumulated impairment losses. Finite lived intangible assets are amortized over periods ranging from one to ten years. The useful life of acquired trademarks is assessed to be qualified as finite or indefinite. Trademarks with an indefinite useful life are not amortized but reviewed for impairment annually by comparing their recoverable amount with their carrying amount.
ProPertY, PlAnt And eQuiPment Property, plant and equipment are recorded at cost less accumulated depreciation and accumulated impairment losses. Borrowing costs that are directly attributable to the acquisition, construction or production of a qualifying asset, incurred during the construction period, are capitalized as part of the cost of that asset. When relevant, property, plant and equipment cost includes initial estimate of decommissioning and site restoration costs. Depreciation is calculated based on the carrying amount, net of residual value, principally using the straight-line method over the estimated useful lives of the assets, as follows: Buildings, 15 to 40 years; Machinery and Equipment, 5 to 25 years; and Other Tangible Assets, 1 to 20 years. Where the carrying amount of an asset exceeds its recoverable amount, the asset is considered impaired and is written down to its recoverable amount. The Group estimates the recoverable amount of the cash-generating unit to which the asset belongs. An impairment is recognized when a decrease in value is noticed. Recoverable amount is the higher of fair value less costs to sell and value in use. In assessing value in use, the estimated future cash flows are discounted to their present value using a pre-tax discount rate that reflects current market assessments of the time value of money and the risks specific to the asset for which the estimates of future cash flows have not been adjusted. Subsequent costs are included in the asset’s carrying amount or recognized as a separate asset, as appropriate, only when it is probable that future economic benefits associated with the item will flow to the group and the cost of the item can be measured reliably. The carrying amount of the replaced part is derecognized. All other repairs and maintenance are charged to the income statement during the financial period in which they are incurred.
30 LOuIS.DREyFuS.COMMODITIES.B.V. | 2012 Audited ConsolidAted FinAnCiAl stAtements
BioloGiCAl Assets At 31 December 2012 biological assets consist of orange groves in Brazil. In application of IAS41 – “Agriculture”, they are carried at fair value less estimated costs to sell, generally based on discounted expected future cash flows from these assets. Changes in fair value are recognized in the statement of income.
inVestments in AFFiliAted ComPAnies CArried At eQuitY Affiliated companies are all entities over which the Group has significant influence but not control, generally accompanying a shareholding from 20% to 50% of the voting rights. Investments in affiliated companies are accounted for using the equity method of accounting and are initially recognized at cost. The Group’s investment in affiliated companies includes goodwill identified on acquisition date, net of any accumulated impairment loss. Jointly-controlled entities are accounted for under the equity method.
inVentories And deriVAtiVes Trading inventories Trading inventories are valued at fair value less costs to sell. The “mark-to-market” valuation policy, which is accepted as a commodity industry practice, presents a fair reflection of the Group’s trading activities.
Other inventories The other inventories are valued at the lower of cost or net realizable value, especially for certain entities for which the trading model is not applicable.
Derivatives The Group invests in futures and option contracts mostly to hedge trading inventories and open commitments in commodities and securities. Futures and option contracts are recognized at fair value, and the resulting unrealized gains and losses are recognized in income. Undelivered commodities purchase and sale commitments and swap / supply arrangements are recognized at fair value, and the resulting unrealized gain or loss is recognized in income. Foreign exchange hedge contracts are recognized at fair value, and the resulting unrealized gains and losses are recognized in the statement of income in “Finance costs, net” for the foreign exchange exposure on funding and in “Cost of sales”, for the foreign exchange gains and losses related to working capital. Expected costs associated to the execution of contracts are accrued.
hedGe ACCountinG For the purpose of hedge accounting, hedges are classified as:
fair value hedges when hedging the exposure to changes in the fair value of a recognized asset or liability or an unrecognized firm commitment; or
cash flow hedges when hedging exposure to variability in cash flows that is either attributable to a particular risk associated with a recognized asset or liability or a highly probable forecast transaction or the foreign currency risk in an unrecognized firm commitment; or
hedges of a net investment in a foreign operation. The Group carries out assessments of hedging operations that qualify for hedge accounting, based on documentation of hedging relationships. This documentation includes the identification of the hedging instrument, hedged item, risk being hedged and effectiveness of the hedge, at inception of the hedge and throughout financial reporting periods for which the hedge was designated.
Fair value hedges The change in the fair value of a hedging derivative is recognized in profit or loss. The change in the fair value of the hedged item attributable to the risk hedged is recorded as a part of the carrying value of the hedged item and is also recognized in profit or loss.
AU
DIT
ED
CO
NS
OLI
DAT
ED
FIN
AN
CIA
L S
TATE
ME
NTS
LOuIS.DREyFuS.COMMODITIES.B.V. | 2012 Audited ConsolidAted FinAnCiAl stAtements 31

Cash flow hedges The effective portion of the gain or loss on the hedging instrument is recognized directly in other reserves, while any ineffective portion is recognized immediately in profit or loss. Amounts taken to equity are transferred to profit or loss when the hedged transaction affects profit or loss, such as when the hedged financial income or financial expense is recognized or when a forecast sale occurs.
trAde reCeiVABles Trade receivables are recognized initially at fair value and subsequently measured at amortized cost using the effective interest method, less provision for impairment. When there is objective evidence that the initial economic benefits will not flow to the Group, a provision for impairment is accounted. Significant financial difficulties of the debtor, default or delinquency in payments (more than three months overdue) are considered indicators that the trade receivable has to be impaired.
AVAilABle-For-sAle FinAnCiAl Assets Available-for-sale financial assets mainly consist of shares of non-consolidated companies for which the Group does not exercise significant influence or control. Listed shares are valued at fair value corresponding to the listed price. Other shares are generally carried at cost, which is deemed to approximate fair value. Any change in fair value of shares after initial recognition is recorded through other comprehensive income and subsequently recognized in income on disposal of the shares or when the investment is deemed to be impaired.
other FinAnCiAl Assets At FAir VAlue throuGh ProFit And loss Other financial assets at fair value through profit and loss include short-term securities with an original maturity greater than three months acquired with the purpose of selling or repurchasing, and bonds relating to the financial trading activity as well as other financial assets designated upon recognition at fair value through profit and loss.
mArGin dePosits Margin deposits consist in cash with brokers and exchanges, to meet initial and variation margin requirements in respect of futures positions on commodities exchanges.
CAsh And CAsh eQuiVAlents Cash and cash equivalents include highly liquid investments with a maturity of three months or less at the time of the purchase. Treasury bills, money market funds, commercial paper, bank certificates of deposit and marketable securities having insignificant risk of change in value, qualify under that definition. Any difference between the carrying amount of the cash equivalents and its fair value is recognized through profit and loss. The statement of cash flows presents the change in cash and cash equivalents. Changes in bank overdrafts that form part of the financing activities are presented in increase (decrease) in bank loans, acceptances and commercial paper.
PerPetuAl CAPitAl seCurities The structure of the perpetual hybrid capital securities qualifies the instrument to be classified as equity under IFRS. The perpetual capital securities instrument is recorded at nominal value less costs net of tax and classified as a component of equity in the consolidated balance sheet. The distribution on the perpetual capital securities is recorded net of tax and classified as a separate allocation of retained earnings within the equity section of the consolidated balance sheet.
reserVe For ContinGenCies Provisions for environmental restoration and decommissioning, restructuring costs and legal claims are recognized when the Group has a present obligation (legal or constructive) as a result of past events, it is probable that an outflow of resources will be required to settle the obligation, and a reliable estimate can be made.
emPloYee BeneFits PlAns Pensions and post-retirement benefits Defined contribution plans are funded by contributions paid by employees and Group companies to the organizations responsible for managing the plans. The Group’s obligations are limited to the payment of such contributions.
32 LOuIS.DREyFuS.COMMODITIES.B.V. | 2012 Audited ConsolidAted FinAnCiAl stAtements

Defined benefit plans consist of either funded or unfunded plans. Obligations under these plans are generally determined by independent actuaries using the projected unit credit method. The Group measures and recognizes post-employment benefits in accordance with IAS 19:
contributions to defined contribution plans are recognized as an expense;
defined benefit plans are measured using actuarial valuations. The Group uses the projected unit credit method as the actuarial method for measuring its post-employment benefit obligations, on the basis of the national or company-wide collective agreements effective within each entity. Factors used in calculating the obligation include length of service, life expectancy, salary inflation, staff turnover, and macro-economic assumptions specific to countries in which the Group operates (such as inflation rate, rate of return on plan assets and discount rate). Cumulative actuarial gains and losses representing more than 10% of the greater of, the gross amount of the obligation or, the fair value of plan assets, are amortized over the average residual working life of active employees (the “corridor” method). The liability recognized in the balance sheet represents the obligation net of externally held plan assets and of items (primarily actuarial gains and losses) that are amortizable and consequently are not recognized. If the value of plan assets exceeds the obligation under the plan, the net amount is recognized as a non-current asset. Overfunded plans are recognized as assets only if they represent future economic benefits that will be available to the Group. Where the calculation of the net obligation results in an asset for the Group, the amount recognized for this asset may not exceed the net total of any unrecognized actuarial losses and past service costs and the present value of any currently available future refunds from the plan or reductions in future contributions to the plan. The expense recognized in the statement of income mainly comprises:
rights vesting during the period;
movements arising from the discounting of vested rights;
the actual return on externally-held plan assets;
the impact of plan amendments in prior periods or new plans;
the amortization of actuarial gains and losses.
Share-based payment transactionsShare plans and stock-option plans are measured at fair value, corresponding to the value of the benefit granted to the employee on the grant date. The transactions are recognized in commercial and administrative expenses in the statement of income on a straight-line basis over the vesting period, with a corresponding increase in other reserves in equity when the plan is deemed as equity plan.
deFerred inCome tAXes Deferred taxes arise from temporary differences between the carrying amounts of certain assets and liabilities and their tax basis. The Group accounts for deferred income taxes in accordance with the balance sheet liability method using the most recent established tax rates at year end. The Group gives recognition to future tax benefits to the extent that the realization of such benefits is probable. The carrying amount of deferred tax assets is reviewed at each balance sheet date. Deferred tax assets and liabilities are offset when the deferred taxes relate to income taxes levied by the same taxation authority.
non-Current Assets held For sAle And disContinued oPerAtionsThe Group classifies non-current assets and disposal groups as held for sale if their carrying amounts will be recovered principally through a sale transaction rather than through continuing use. Non-current assets and disposal groups classified as held for sale are measured at the lower of their carrying amount and fair value less costs to sell. The criteria for held for sale classification is regarded as met only when the sale is highly probable and the asset or disposal group is available for immediate sale in its present condition. Management must be committed to the sale, which should be expected to qualify for recognition as a completed sale within one year from the date of classification.Discontinued operations are excluded from the results of continuing operations and are presented as a single amount as profit or loss after tax from discontinued operations in the income statement for all periods presented.
AU
DIT
ED
CO
NS
OLI
DAT
ED
FIN
AN
CIA
L S
TATE
ME
NTS
LOuIS.DREyFuS.COMMODITIES.B.V. | 2012 Audited ConsolidAted FinAnCiAl stAtements 33
Property, plant and equipment and intangible assets are not depreciated or amortised once classified as held for sale.
FinAnCe leAses Leases that transfer substantially all the risks and rewards incidental to ownership are qualified as finance leases. When a tangible asset is held under a finance lease, it is recorded as an asset at fair value or, if lower, at the present value of the minimum lease payments determined at inception of the lease, and the corresponding lease obligation is recorded as a financial liability. The capital lease assets are depreciated over their expected useful life in accordance with Group policy net of the residual value.
reVenue Revenue comprises the fair value of the consideration received or receivable for the sale of goods and services in the ordinary course of the Group’s activities. Revenue arises from sale of goods, services rendered and use by others of entity assets, yielding interest, royalties and dividends.
Sale of goods The group recognizes revenue when the amount of revenue can be reliably measured, significant risks and rewards of ownership of the goods are transferred to the buyer and it is probable that future economic benefits will flow to the entity. The amount of revenue is not considered to be reliably measurable until all contingencies relating to the sale have been resolved. Physical purchases and sales of products are reflected as cost of goods sold and sales, respectively, in the accompanying consolidated statement of income at the time such products are shipped and title and risk of loss pass to the customer. Costs for shipping of inventories are included in cost of goods sold in the accompanying consolidated statement of income. Revenue is presented net of returns, rebates and discounts and after eliminating sales within the group.
Services rendered When the outcome of services rendered can be estimated reliably, revenue associated is recognized by reference to the stage of completion of the transaction at the balance sheet date.
Financial income Interest income and expenses are recognized on a time-proportion basis using the effective interest method. Dividend income is recognized when the right to receive payment is established.
3. seGment inFormAtionAt 31 December 2012, the Group operates worldwide its business under three segments: Proteins, Tropicals and Other Products, organized around products that have similar economic characteristics. Following the indirect upstreaming of LDC’s shareholding in Biosev from LDC B.V. to LDCH B.V. in December 2012, Biosev is presented as a discontinued business segment.Each reportable segment is responsible for the farming, origination, processing, refining, storage, transport and distribution of the products (where applicable).The Proteins segment includes commodities which feed both humans and animals (soybeans, soymeal, soyoil, palm oil, wheat, feedgrains, rice). Demand is therefore linked to both population growth and food consumption habits. Proteins also include the Freight and Finance platforms, which support the Group’s commodities platforms.The Tropicals segment includes those commodities for which demand is linked to population growth and GDP growth, such as cotton, coffee (including arabica and robusta coffee beans), sugar (including raw, refined sugar and sugar ethanol) and fruit juices (including orange, lime, grapefruit and apple juices and their oils and by-products).The Other Products business segment focuses on the following main platforms: fertilizers, metals, dairy and others.The financial performance of the segments is principally evaluated with reference to the Segment Operating Results, which is the net sales, less cost of sales plus share of profit (loss) in affiliated companies carried at equity. The accounting policies of the operating segments are the same as those described in the summary of significant accounting policies. Inter-segment sales and transfers where applicable are generally valued at market.
34 LOuIS.DREyFuS.COMMODITIES.B.V. | 2012 Audited ConsolidAted FinAnCiAl stAtements
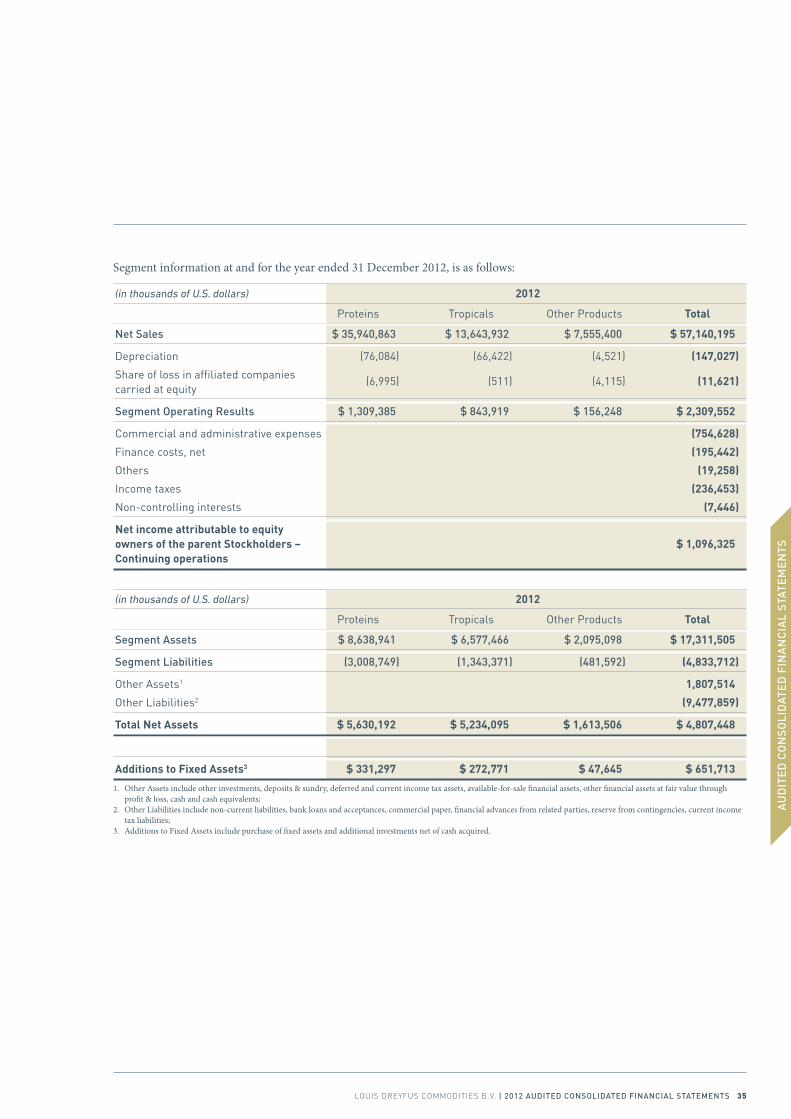
Segment information at and for the year ended 31 December 2012, is as follows:
(in thousands of U.S. dollars) 2012
Proteins Tropicals Other Products Total
net sales $ 35,940,863 $ 13,643,932 $ 7,555,400 $ 57,140,195
Depreciation (76,084) (66,422) (4,521) (147,027)
Share of loss in affiliated companies (6,995) (511) (4,115) (11,621) carried at equity
segment operating results $ 1,309,385 $ 843,919 $ 156,248 $ 2,309,552
Commercial and administrative expenses (754,628)
Finance costs, net (195,442)
Others (19,258)
Income taxes (236,453)
Non-controlling interests (7,446)
Net income attributable to equity owners of the parent Stockholders – $ 1,096,325 Continuing operations
(in thousands of U.S. dollars) 2012
Proteins Tropicals Other Products Total
segment Assets $ 8,638,941 $ 6,577,466 $ 2,095,098 $ 17,311,505
segment liabilities (3,008,749) (1,343,371) (481,592) (4,833,712)
Other Assets1 1,807,514
Other Liabilities2 (9,477,859)
Total Net Assets $ 5,630,192 $ 5,234,095 $ 1,613,506 $ 4,807,448
Additions to Fixed Assets3 $ 331,297 $ 272,771 $ 47,645 $ 651,713
1. Other Assets include other investments, deposits & sundry, deferred and current income tax assets, available-for-sale financial assets, other financial assets at fair value through profit & loss, cash and cash equivalents;
2. Other Liabilities include non-current liabilities, bank loans and acceptances, commercial paper, financial advances from related parties, reserve from contingencies, current income tax liabilities;
3. Additions to Fixed Assets include purchase of fixed assets and additional investments net of cash acquired.
AU
DIT
ED
CO
NS
OLI
DAT
ED
FIN
AN
CIA
L S
TATE
ME
NTS
LOuIS.DREyFuS.COMMODITIES.B.V. | 2012 Audited ConsolidAted FinAnCiAl stAtements 35
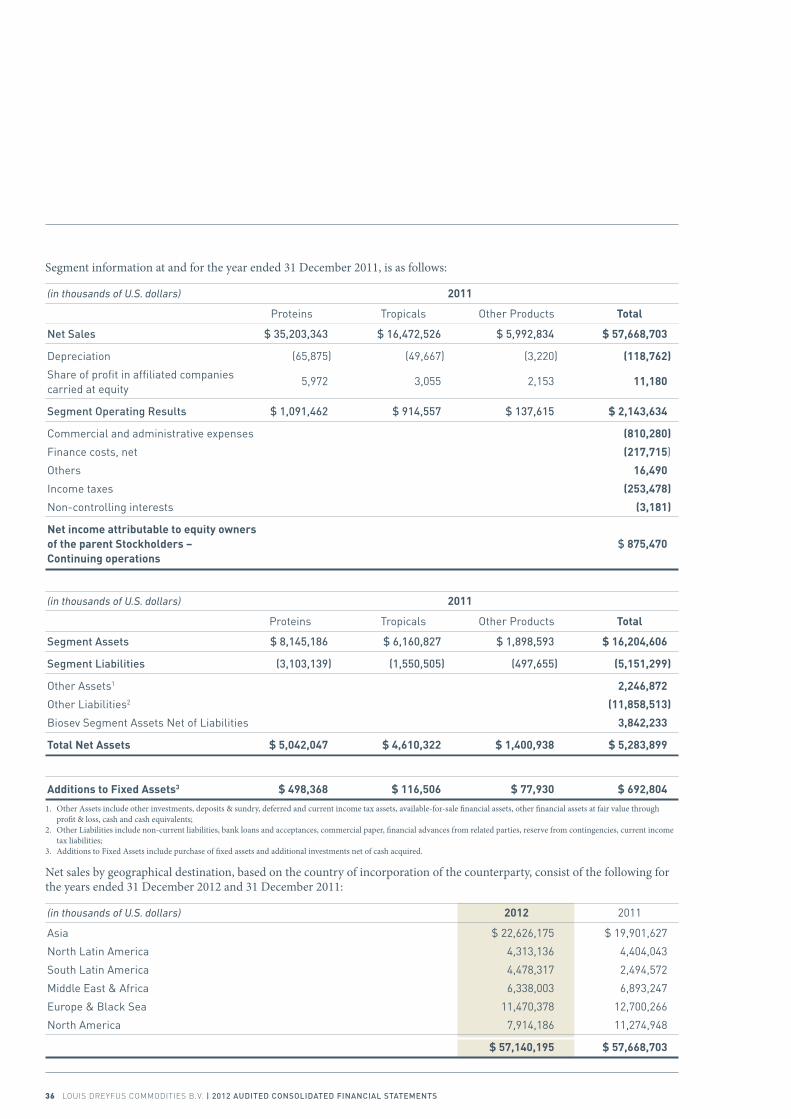
Segment information at and for the year ended 31 December 2011, is as follows:
(in thousands of U.S. dollars) 2011
Proteins Tropicals Other Products Total
net sales $ 35,203,343 $ 16,472,526 $ 5,992,834 $ 57,668,703
Depreciation (65,875) (49,667) (3,220) (118,762)
Share of profit in affiliated companies 5,972 3,055 2,153 11,180 carried at equity
segment operating results $ 1,091,462 $ 914,557 $ 137,615 $ 2,143,634
Commercial and administrative expenses (810,280)
Finance costs, net (217,715)
Others 16,490
Income taxes (253,478)
Non-controlling interests (3,181)
Net income attributable to equity owners of the parent Stockholders – $ 875,470 Continuing operations
(in thousands of U.S. dollars) 2011
Proteins Tropicals Other Products Total
segment Assets $ 8,145,186 $ 6,160,827 $ 1,898,593 $ 16,204,606
segment liabilities (3,103,139) (1,550,505) (497,655) (5,151,299)
Other Assets1 2,246,872
Other Liabilities2 (11,858,513)
Biosev Segment Assets Net of Liabilities 3,842,233
Total Net Assets $ 5,042,047 $ 4,610,322 $ 1,400,938 $ 5,283,899
Additions to Fixed Assets3 $ 498,368 $ 116,506 $ 77,930 $ 692,804
1. Other Assets include other investments, deposits & sundry, deferred and current income tax assets, available-for-sale financial assets, other financial assets at fair value through profit & loss, cash and cash equivalents;
2. Other Liabilities include non-current liabilities, bank loans and acceptances, commercial paper, financial advances from related parties, reserve from contingencies, current income tax liabilities;
3. Additions to Fixed Assets include purchase of fixed assets and additional investments net of cash acquired.
Net sales by geographical destination, based on the country of incorporation of the counterparty, consist of the following for the years ended 31 December 2012 and 31 December 2011:
(in thousands of U.S. dollars) 2012 2011
Asia $ 22,626,175 $ 19,901,627
North Latin America 4,313,136 4,404,043
South Latin America 4,478,317 2,494,572
Middle East & Africa 6,338,003 6,893,247
Europe & Black Sea 11,470,378 12,700,266
North America 7,914,186 11,274,948
$ 57,140,195 $ 57,668,703
36 LOuIS.DREyFuS.COMMODITIES.B.V. | 2012 Audited ConsolidAted FinAnCiAl stAtements
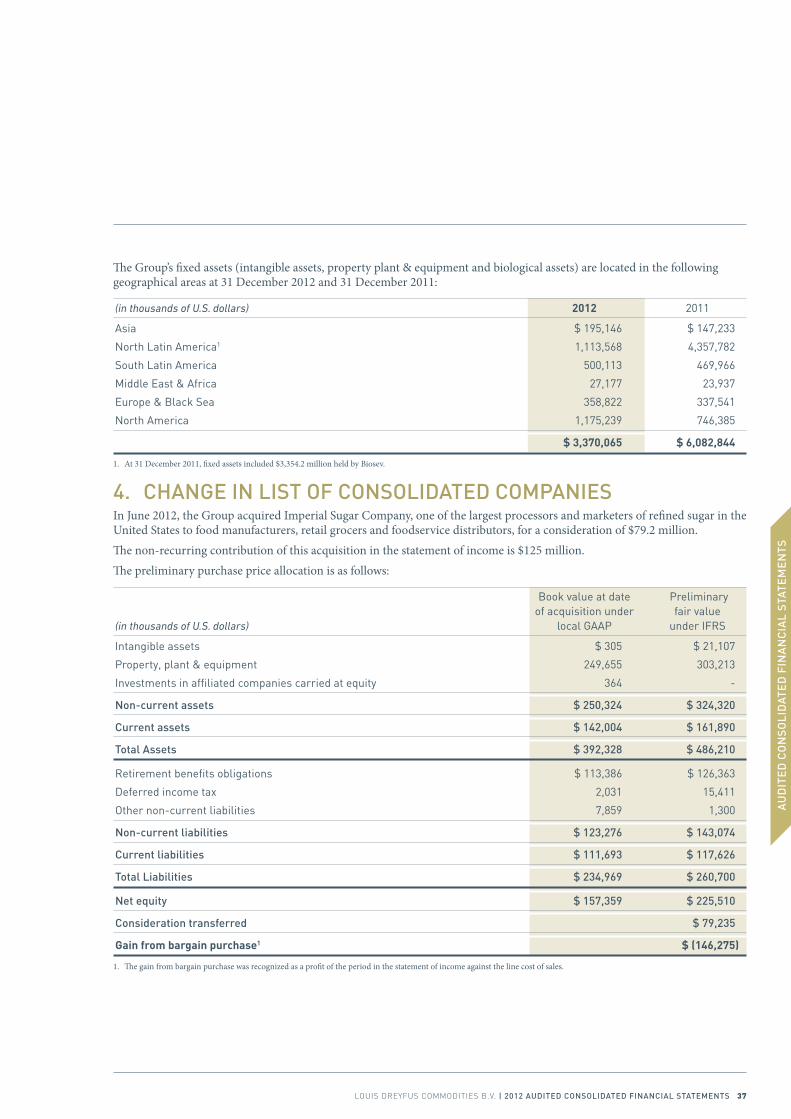
The Group’s fixed assets (intangible assets, property plant & equipment and biological assets) are located in the following geographical areas at 31 December 2012 and 31 December 2011:
(in thousands of U.S. dollars) 2012 2011
Asia $ 195,146 $ 147,233
North Latin America1 1,113,568 4,357,782
South Latin America 500,113 469,966
Middle East & Africa 27,177 23,937
Europe & Black Sea 358,822 337,541
North America 1,175,239 746,385
$ 3,370,065 $ 6,082,844
1. At 31 December 2011, fixed assets included $3,354.2 million held by Biosev.
4. ChAnGe in list oF ConsolidAted ComPAnies In June 2012, the Group acquired Imperial Sugar Company, one of the largest processors and marketers of refined sugar in the United States to food manufacturers, retail grocers and foodservice distributors, for a consideration of $79.2 million. The non-recurring contribution of this acquisition in the statement of income is $125 million.The preliminary purchase price allocation is as follows:
Book value at date Preliminary of acquisition under fair value (in thousands of U.S. dollars) local GAAP under IFRS
Intangible assets $ 305 $ 21,107
Property, plant & equipment 249,655 303,213
Investments in affiliated companies carried at equity 364 -
non-current assets $ 250,324 $ 324,320
Current assets $ 142,004 $ 161,890
total Assets $ 392,328 $ 486,210
Retirement benefits obligations $ 113,386 $ 126,363
Deferred income tax 2,031 15,411
Other non-current liabilities 7,859 1,300
non-current liabilities $ 123,276 $ 143,074
Current liabilities $ 111,693 $ 117,626
total liabilities $ 234,969 $ 260,700
net equity $ 157,359 $ 225,510
Consideration transferred $ 79,235
Gain from bargain purchase1 $ (146,275)
1. The gain from bargain purchase was recognized as a profit of the period in the statement of income against the line cost of sales.
AU
DIT
ED
CO
NS
OLI
DAT
ED
FIN
AN
CIA
L S
TATE
ME
NTS
LOuIS.DREyFuS.COMMODITIES.B.V. | 2012 Audited ConsolidAted FinAnCiAl stAtements 37
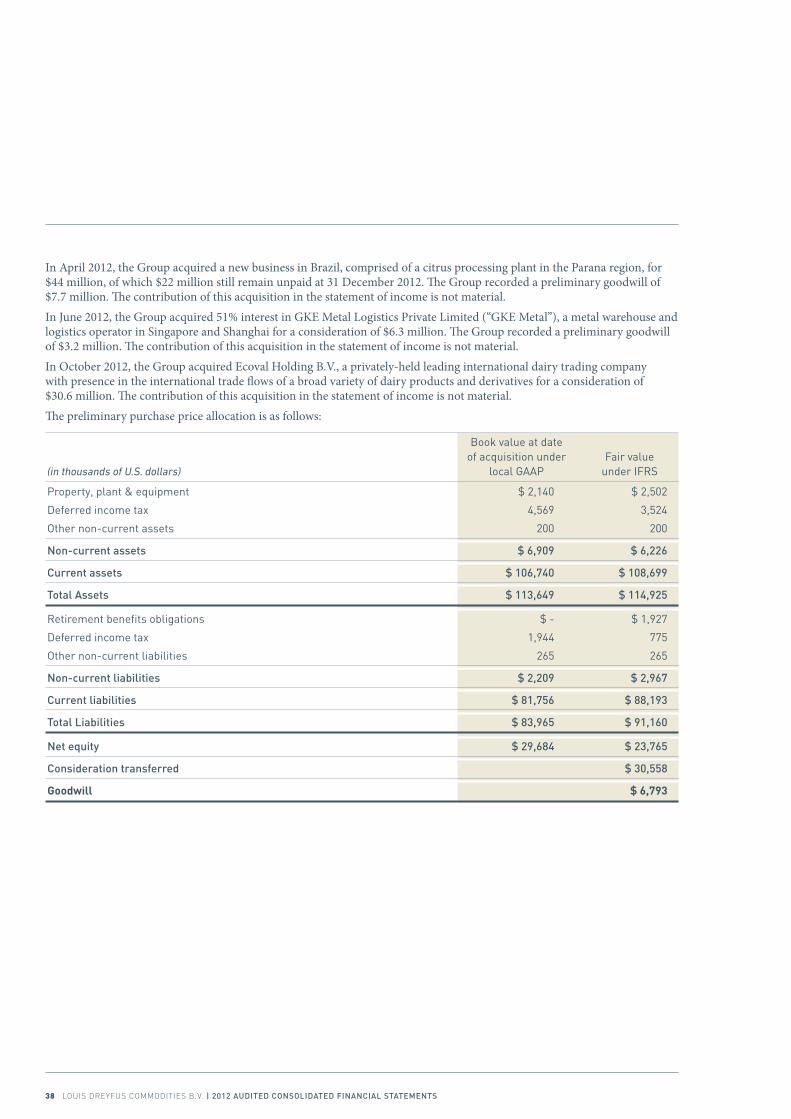
In April 2012, the Group acquired a new business in Brazil, comprised of a citrus processing plant in the Parana region, for $44 million, of which $22 million still remain unpaid at 31 December 2012. The Group recorded a preliminary goodwill of $7.7 million. The contribution of this acquisition in the statement of income is not material.In June 2012, the Group acquired 51% interest in GKE Metal Logistics Private Limited (“GKE Metal”), a metal warehouse and logistics operator in Singapore and Shanghai for a consideration of $6.3 million. The Group recorded a preliminary goodwill of $3.2 million. The contribution of this acquisition in the statement of income is not material.In October 2012, the Group acquired Ecoval Holding B.V., a privately-held leading international dairy trading company with presence in the international trade flows of a broad variety of dairy products and derivatives for a consideration of $30.6 million. The contribution of this acquisition in the statement of income is not material.The preliminary purchase price allocation is as follows:
Book value at date of acquisition under Fair value (in thousands of U.S. dollars) local GAAP under IFRS
Property, plant & equipment $ 2,140 $ 2,502
Deferred income tax 4,569 3,524
Other non-current assets 200 200
non-current assets $ 6,909 $ 6,226
Current assets $ 106,740 $ 108,699
total Assets $ 113,649 $ 114,925
Retirement benefits obligations $ - $ 1,927
Deferred income tax 1,944 775
Other non-current liabilities 265 265
non-current liabilities $ 2,209 $ 2,967
Current liabilities $ 81,756 $ 88,193
total liabilities $ 83,965 $ 91,160
net equity $ 29,684 $ 23,765
Consideration transferred $ 30,558
Goodwill $ 6,793
38 LOuIS.DREyFuS.COMMODITIES.B.V. | 2012 Audited ConsolidAted FinAnCiAl stAtements
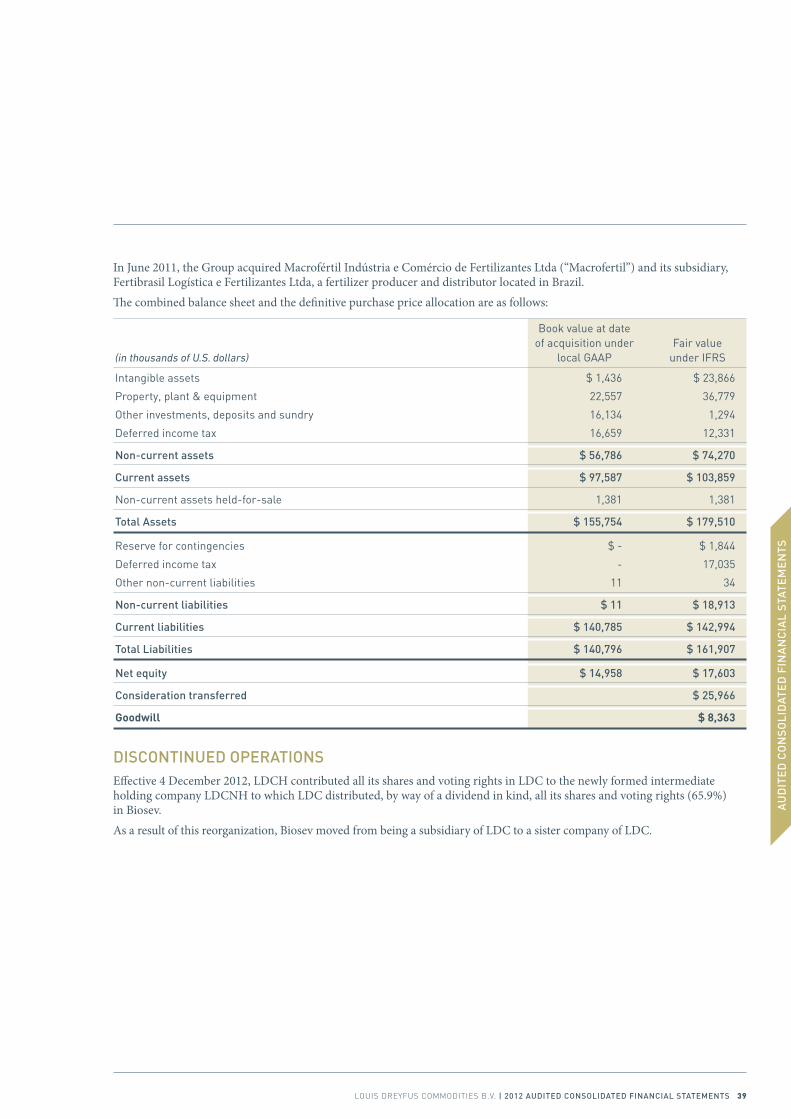
In June 2011, the Group acquired Macrofértil Indústria e Comércio de Fertilizantes Ltda (“Macrofertil”) and its subsidiary, Fertibrasil Logística e Fertilizantes Ltda, a fertilizer producer and distributor located in Brazil.The combined balance sheet and the definitive purchase price allocation are as follows:
Book value at date of acquisition under Fair value (in thousands of U.S. dollars) local GAAP under IFRS
Intangible assets $ 1,436 $ 23,866
Property, plant & equipment 22,557 36,779
Other investments, deposits and sundry 16,134 1,294
Deferred income tax 16,659 12,331
non-current assets $ 56,786 $ 74,270
Current assets $ 97,587 $ 103,859
Non-current assets held-for-sale 1,381 1,381
total Assets $ 155,754 $ 179,510
Reserve for contingencies $ - $ 1,844
Deferred income tax - 17,035
Other non-current liabilities 11 34
non-current liabilities $ 11 $ 18,913
Current liabilities $ 140,785 $ 142,994
total liabilities $ 140,796 $ 161,907
net equity $ 14,958 $ 17,603
Consideration transferred $ 25,966
Goodwill $ 8,363
disContinued oPerAtionsEffective 4 December 2012, LDCH contributed all its shares and voting rights in LDC to the newly formed intermediate holding company LDCNH to which LDC distributed, by way of a dividend in kind, all its shares and voting rights (65.9%) in Biosev.As a result of this reorganization, Biosev moved from being a subsidiary of LDC to a sister company of LDC.
AU
DIT
ED
CO
NS
OLI
DAT
ED
FIN
AN
CIA
L S
TATE
ME
NTS
LOuIS.DREyFuS.COMMODITIES.B.V. | 2012 Audited ConsolidAted FinAnCiAl stAtements 39
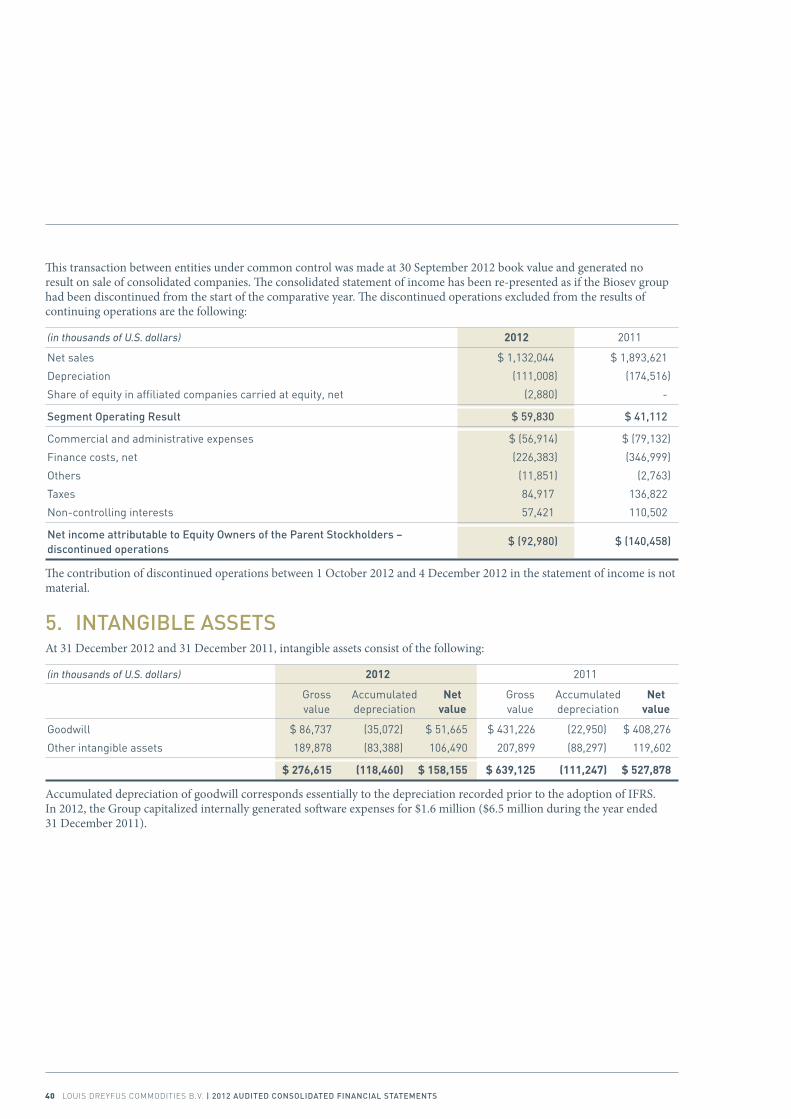
This transaction between entities under common control was made at 30 September 2012 book value and generated no result on sale of consolidated companies. The consolidated statement of income has been re-presented as if the Biosev group had been discontinued from the start of the comparative year. The discontinued operations excluded from the results of continuing operations are the following:
(in thousands of U.S. dollars) 2012 2011
Net sales $ 1,132,044 $ 1,893,621
Depreciation (111,008) (174,516)
Share of equity in affiliated companies carried at equity, net (2,880) -
segment operating result $ 59,830 $ 41,112
Commercial and administrative expenses $ (56,914) $ (79,132)
Finance costs, net (226,383) (346,999)
Others (11,851) (2,763)
Taxes 84,917 136,822
Non-controlling interests 57,421 110,502
net income attributable to equity owners of the Parent stockholders – $ (92,980) $ (140,458) discontinued operations
The contribution of discontinued operations between 1 October 2012 and 4 December 2012 in the statement of income is not material.
5. intAnGiBle AssetsAt 31 December 2012 and 31 December 2011, intangible assets consist of the following:
(in thousands of U.S. dollars) 2012 2011
Gross Accumulated Net Gross Accumulated Net value depreciation value value depreciation value
Goodwill $ 86,737 (35,072) $ 51,665 $ 431,226 (22,950) $ 408,276
Other intangible assets 189,878 (83,388) 106,490 207,899 (88,297) 119,602
$ 276,615 (118,460) $ 158,155 $ 639,125 (111,247) $ 527,878
Accumulated depreciation of goodwill corresponds essentially to the depreciation recorded prior to the adoption of IFRS. In 2012, the Group capitalized internally generated software expenses for $1.6 million ($6.5 million during the year ended 31 December 2011).
40 LOuIS.DREyFuS.COMMODITIES.B.V. | 2012 Audited ConsolidAted FinAnCiAl stAtements
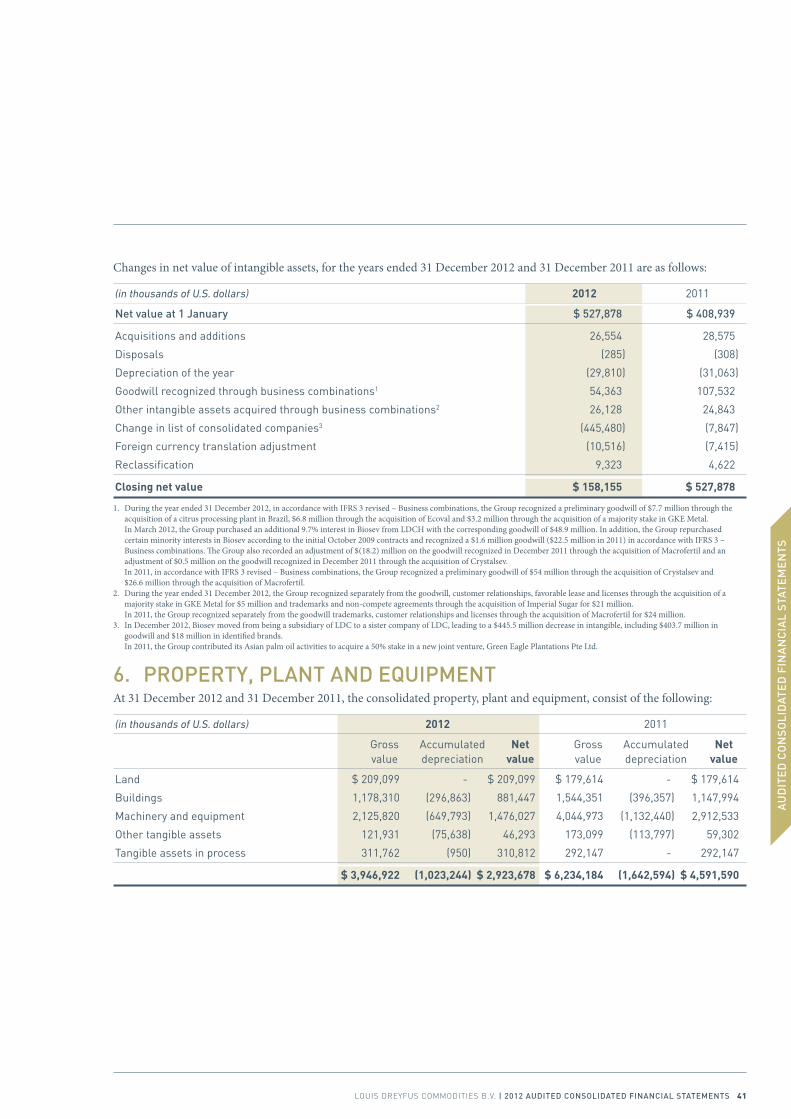
Changes in net value of intangible assets, for the years ended 31 December 2012 and 31 December 2011 are as follows:
(in thousands of U.S. dollars) 2012 2011
net value at 1 January $ 527,878 $ 408,939
Acquisitions and additions 26,554 28,575
Disposals (285) (308)
Depreciation of the year (29,810) (31,063)
Goodwill recognized through business combinations1 54,363 107,532
Other intangible assets acquired through business combinations2 26,128 24,843
Change in list of consolidated companies3 (445,480) (7,847)
Foreign currency translation adjustment (10,516) (7,415)
Reclassification 9,323 4,622
Closing net value $ 158,155 $ 527,878
1. During the year ended 31 December 2012, in accordance with IFRS 3 revised – Business combinations, the Group recognized a preliminary goodwill of $7.7 million through the acquisition of a citrus processing plant in Brazil, $6.8 million through the acquisition of Ecoval and $3.2 million through the acquisition of a majority stake in GKE Metal. In March 2012, the Group purchased an additional 9.7% interest in Biosev from LDCH with the corresponding goodwill of $48.9 million. In addition, the Group repurchased certain minority interests in Biosev according to the initial October 2009 contracts and recognized a $1.6 million goodwill ($22.5 million in 2011) in accordance with IFRS 3 – Business combinations. The Group also recorded an adjustment of $(18.2) million on the goodwill recognized in December 2011 through the acquisition of Macrofertil and an adjustment of $0.5 million on the goodwill recognized in December 2011 through the acquisition of Crystalsev. In 2011, in accordance with IFRS 3 revised – Business combinations, the Group recognized a preliminary goodwill of $54 million through the acquisition of Crystalsev and $26.6 million through the acquisition of Macrofertil.
2. During the year ended 31 December 2012, the Group recognized separately from the goodwill, customer relationships, favorable lease and licenses through the acquisition of a majority stake in GKE Metal for $5 million and trademarks and non-compete agreements through the acquisition of Imperial Sugar for $21 million. In 2011, the Group recognized separately from the goodwill trademarks, customer relationships and licenses through the acquisition of Macrofertil for $24 million.
3. In December 2012, Biosev moved from being a subsidiary of LDC to a sister company of LDC, leading to a $445.5 million decrease in intangible, including $403.7 million in goodwill and $18 million in identified brands. In 2011, the Group contributed its Asian palm oil activities to acquire a 50% stake in a new joint venture, Green Eagle Plantations Pte Ltd.
6. ProPertY, PlAnt And eQuiPmentAt 31 December 2012 and 31 December 2011, the consolidated property, plant and equipment, consist of the following:
(in thousands of U.S. dollars) 2012 2011
Gross Accumulated Net Gross Accumulated Net value depreciation value value depreciation value
Land $ 209,099 - $ 209,099 $ 179,614 - $ 179,614
Buildings 1,178,310 (296,863) 881,447 1,544,351 (396,357) 1,147,994
Machinery and equipment 2,125,820 (649,793) 1,476,027 4,044,973 (1,132,440) 2,912,533
Other tangible assets 121,931 (75,638) 46,293 173,099 (113,797) 59,302
Tangible assets in process 311,762 (950) 310,812 292,147 - 292,147
$ 3,946,922 (1,023,244) $ 2,923,678 $ 6,234,184 (1,642,594) $ 4,591,590
AU
DIT
ED
CO
NS
OLI
DAT
ED
FIN
AN
CIA
L S
TATE
ME
NTS
LOuIS.DREyFuS.COMMODITIES.B.V. | 2012 Audited ConsolidAted FinAnCiAl stAtements 41
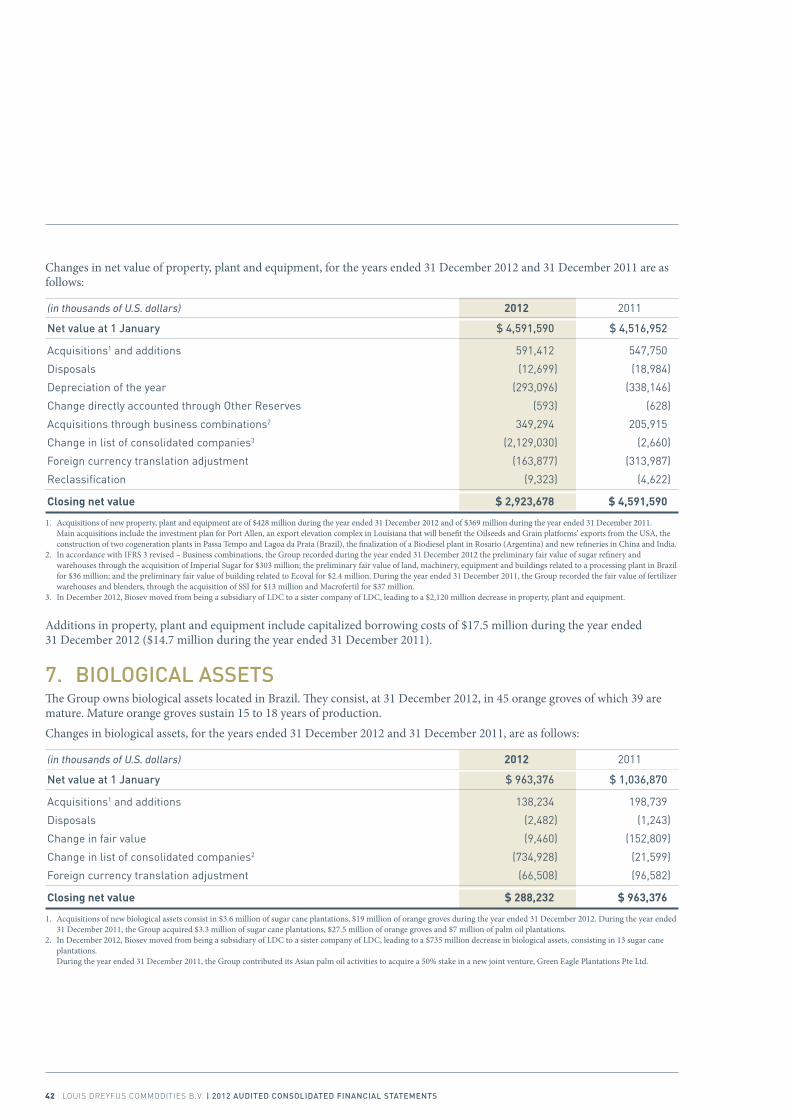
Changes in net value of property, plant and equipment, for the years ended 31 December 2012 and 31 December 2011 are as follows:
(in thousands of U.S. dollars) 2012 2011
net value at 1 January $ 4,591,590 $ 4,516,952
Acquisitions1 and additions 591,412 547,750
Disposals (12,699) (18,984)
Depreciation of the year (293,096) (338,146)
Change directly accounted through Other Reserves (593) (628)
Acquisitions through business combinations2 349,294 205,915
Change in list of consolidated companies3 (2,129,030) (2,660)
Foreign currency translation adjustment (163,877) (313,987)
Reclassification (9,323) (4,622)
Closing net value $ 2,923,678 $ 4,591,590
1. Acquisitions of new property, plant and equipment are of $428 million during the year ended 31 December 2012 and of $369 million during the year ended 31 December 2011. Main acquisitions include the investment plan for Port Allen, an export elevation complex in Louisiana that will benefit the Oilseeds and Grain platforms’ exports from the USA, the construction of two cogeneration plants in Passa Tempo and Lagoa da Prata (Brazil), the finalization of a Biodiesel plant in Rosario (Argentina) and new refineries in China and India.
2. In accordance with IFRS 3 revised – Business combinations, the Group recorded during the year ended 31 December 2012 the preliminary fair value of sugar refinery and warehouses through the acquisition of Imperial Sugar for $303 million; the preliminary fair value of land, machinery, equipment and buildings related to a processing plant in Brazil for $36 million; and the preliminary fair value of building related to Ecoval for $2.4 million. During the year ended 31 December 2011, the Group recorded the fair value of fertilizer warehouses and blenders, through the acquisition of SSI for $13 million and Macrofertil for $37 million.
3. In December 2012, Biosev moved from being a subsidiary of LDC to a sister company of LDC, leading to a $2,120 million decrease in property, plant and equipment.
Additions in property, plant and equipment include capitalized borrowing costs of $17.5 million during the year ended 31 December 2012 ($14.7 million during the year ended 31 December 2011).
7. BioloGiCAl AssetsThe Group owns biological assets located in Brazil. They consist, at 31 December 2012, in 45 orange groves of which 39 are mature. Mature orange groves sustain 15 to 18 years of production.Changes in biological assets, for the years ended 31 December 2012 and 31 December 2011, are as follows:
(in thousands of U.S. dollars) 2012 2011
net value at 1 January $ 963,376 $ 1,036,870
Acquisitions1 and additions 138,234 198,739
Disposals (2,482) (1,243)
Change in fair value (9,460) (152,809)
Change in list of consolidated companies2 (734,928) (21,599)
Foreign currency translation adjustment (66,508) (96,582)
Closing net value $ 288,232 $ 963,376
1. Acquisitions of new biological assets consist in $3.6 million of sugar cane plantations, $19 million of orange groves during the year ended 31 December 2012. During the year ended 31 December 2011, the Group acquired $3.3 million of sugar cane plantations, $27.5 million of orange groves and $7 million of palm oil plantations.
2. In December 2012, Biosev moved from being a subsidiary of LDC to a sister company of LDC, leading to a $735 million decrease in biological assets, consisting in 13 sugar cane plantations. During the year ended 31 December 2011, the Group contributed its Asian palm oil activities to acquire a 50% stake in a new joint venture, Green Eagle Plantations Pte Ltd.
42 LOuIS.DREyFuS.COMMODITIES.B.V. | 2012 Audited ConsolidAted FinAnCiAl stAtements
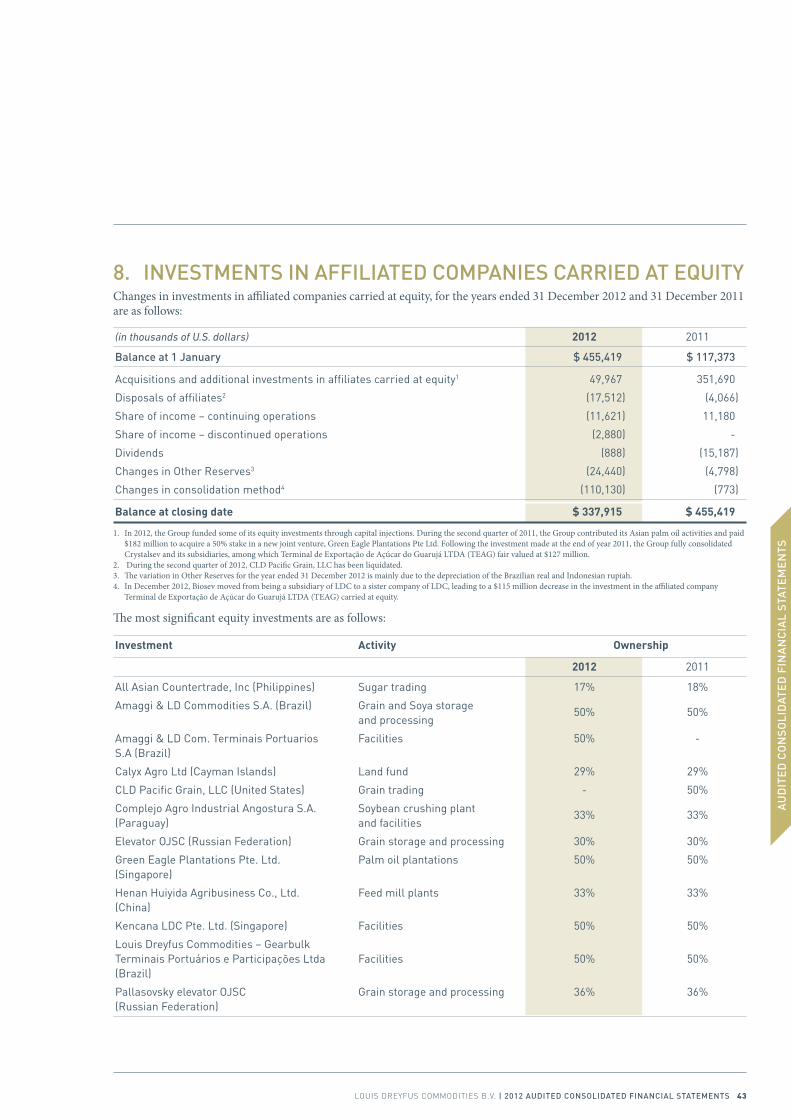
8. inVestments in AFFiliAted ComPAnies CArried At eQuitYChanges in investments in affiliated companies carried at equity, for the years ended 31 December 2012 and 31 December 2011 are as follows:
(in thousands of U.S. dollars) 2012 2011
Balance at 1 January $ 455,419 $ 117,373
Acquisitions and additional investments in affiliates carried at equity1 49,967 351,690
Disposals of affiliates2 (17,512) (4,066)
Share of income – continuing operations (11,621) 11,180
Share of income – discontinued operations (2,880) -
Dividends (888) (15,187)
Changes in Other Reserves3 (24,440) (4,798)
Changes in consolidation method4 (110,130) (773)
Balance at closing date $ 337,915 $ 455,419
1. In 2012, the Group funded some of its equity investments through capital injections. During the second quarter of 2011, the Group contributed its Asian palm oil activities and paid $182 million to acquire a 50% stake in a new joint venture, Green Eagle Plantations Pte Ltd. Following the investment made at the end of year 2011, the Group fully consolidated Crystalsev and its subsidiaries, among which Terminal de Exportação de Açúcar do Guarujá LTDA (TEAG) fair valued at $127 million.
2. During the second quarter of 2012, CLD Pacific Grain, LLC has been liquidated.3. The variation in Other Reserves for the year ended 31 December 2012 is mainly due to the depreciation of the Brazilian real and Indonesian rupiah.4. In December 2012, Biosev moved from being a subsidiary of LDC to a sister company of LDC, leading to a $115 million decrease in the investment in the affiliated company
Terminal de Exportação de Açúcar do Guarujá LTDA (TEAG) carried at equity.
The most significant equity investments are as follows:
Investment Activity Ownership
2012 2011
All Asian Countertrade, Inc (Philippines) Sugar trading 17% 18%
Amaggi & LD Commodities S.A. (Brazil) Grain and Soya storage 50% 50% and processing
Amaggi & LD Com. Terminais Portuarios Facilities 50% - S.A (Brazil)
Calyx Agro Ltd (Cayman Islands) Land fund 29% 29%
CLD Pacific Grain, LLC (United States) Grain trading - 50%
Complejo Agro Industrial Angostura S.A. Soybean crushing plant 33% 33% (Paraguay) and facilities
Elevator OJSC (Russian Federation) Grain storage and processing 30% 30%
Green Eagle Plantations Pte. Ltd. Palm oil plantations 50% 50% (Singapore)
Henan Huiyida Agribusiness Co., Ltd. Feed mill plants 33% 33% (China)
Kencana LDC Pte. Ltd. (Singapore) Facilities 50% 50%
Louis Dreyfus Commodities – Gearbulk Terminais Portuários e Participações Ltda Facilities 50% 50% (Brazil)
Pallasovsky elevator OJSC Grain storage and processing 36% 36% (Russian Federation)
AU
DIT
ED
CO
NS
OLI
DAT
ED
FIN
AN
CIA
L S
TATE
ME
NTS
LOuIS.DREyFuS.COMMODITIES.B.V. | 2012 Audited ConsolidAted FinAnCiAl stAtements 43
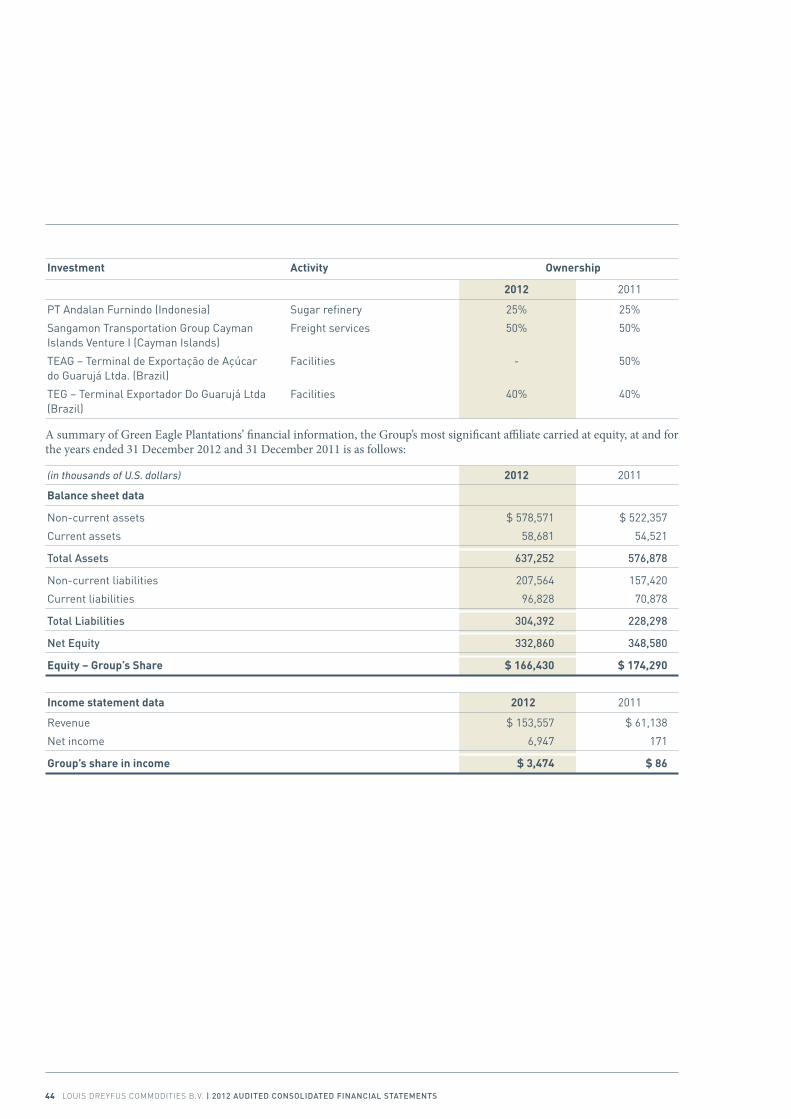
Investment Activity Ownership
2012 2011
PT Andalan Furnindo (Indonesia) Sugar refinery 25% 25%
Sangamon Transportation Group Cayman Freight services 50% 50% Islands Venture I (Cayman Islands)
TEAG – Terminal de Exportação de Açúcar Facilities - 50% do Guarujá Ltda. (Brazil)
TEG – Terminal Exportador Do Guarujá Ltda Facilities 40% 40% (Brazil)
A summary of Green Eagle Plantations’ financial information, the Group’s most significant affiliate carried at equity, at and for the years ended 31 December 2012 and 31 December 2011 is as follows:
(in thousands of U.S. dollars) 2012 2011
Balance sheet data
Non-current assets $ 578,571 $ 522,357
Current assets 58,681 54,521
total Assets 637,252 576,878
Non-current liabilities 207,564 157,420
Current liabilities 96,828 70,878
total liabilities 304,392 228,298
net equity 332,860 348,580
Equity – Group’s Share $ 166,430 $ 174,290
Income statement data 2012 2011
Revenue $ 153,557 $ 61,138
Net income 6,947 171
Group’s share in income $ 3,474 $ 86
44 LOuIS.DREyFuS.COMMODITIES.B.V. | 2012 Audited ConsolidAted FinAnCiAl stAtements

A summary of the financial information of the other companies listed above at and for the years ended 31 December 2012 and 31 December 2011 is as follows:
(in thousands of U.S. dollars) 2012 2011
Balance sheet data
Non-current assets $ 621,978 $ 727,184
Current assets 517,906 456,486
total Assets 1,139,884 1,183,670
Non-current liabilities 205,025 149,485
Current liabilities 518,424 411,230
total liabilities 723,449 560,715
net equity 416,435 622,955
Equity – Group’s Share $ 139,842 $ 252,020
Income statement data 2012 2011
Revenue $ 1,025,297 $ 1,774,674
Net income (38,219) 21,117
Group’s share in income $ (17,555) $ 6,001
At and for the years ended 31 December 2012 and 31 December 2011, investments in affiliated companies carried at equity can be summarized as follows:
(in thousands of U.S. dollars) 2012 2011
Balance sheet data
Entities as listed above $ 306,272 $ 426,310
Other entities 31,643 29,109
Investments in affiliated companies carried at equity1 $ 337,915 $ 455,419
1. The investments in affiliated companies carried at equity include a goodwill of $13.8 million at 31 December 2012.
Income statement data 2012 2011
Entities as listed above $ (14,081) $ 6,087
Others 2,460 5,093
Share of income in affiliated companies carried at equity – $ (11,621) $ 11,180 continuing operations
Share of income in affiliated companies carried at equity – $ (2,880) $ - discontinued operations
AU
DIT
ED
CO
NS
OLI
DAT
ED
FIN
AN
CIA
L S
TATE
ME
NTS
LOuIS.DREyFuS.COMMODITIES.B.V. | 2012 Audited ConsolidAted FinAnCiAl stAtements 45
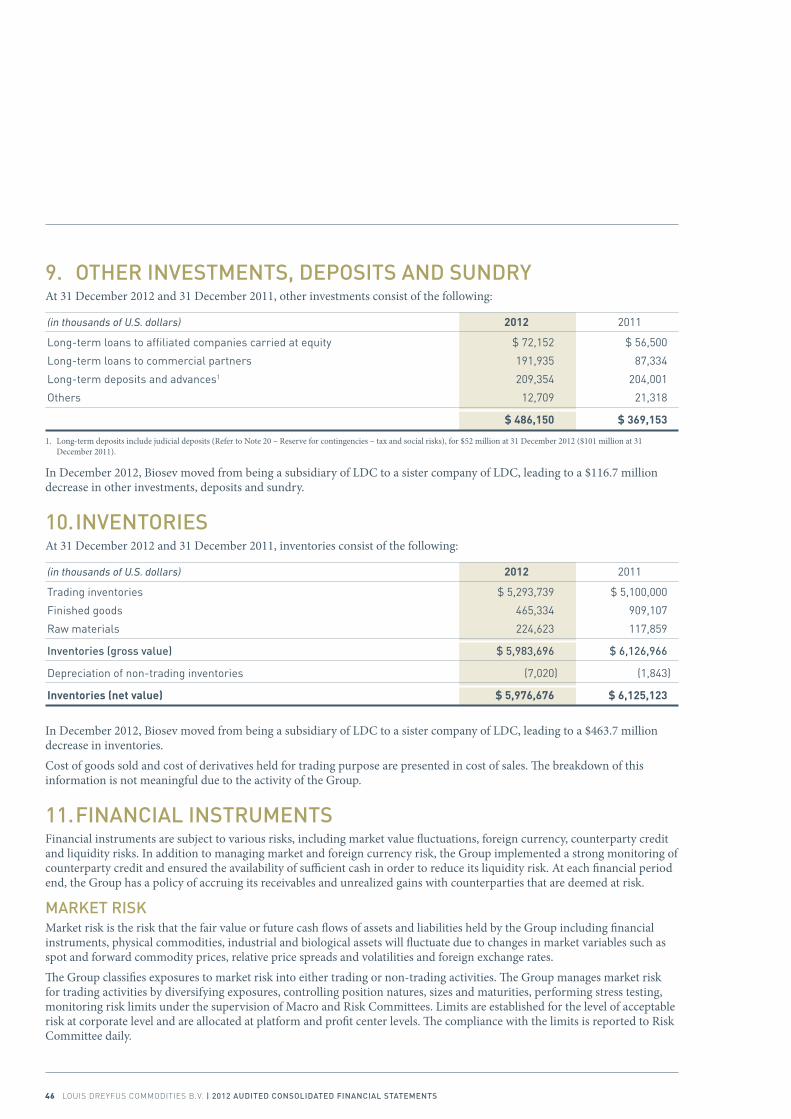
9. other inVestments, dePosits And sundrYAt 31 December 2012 and 31 December 2011, other investments consist of the following:
(in thousands of U.S. dollars) 2012 2011
Long-term loans to affiliated companies carried at equity $ 72,152 $ 56,500
Long-term loans to commercial partners 191,935 87,334
Long-term deposits and advances1 209,354 204,001
Others 12,709 21,318
$ 486,150 $ 369,153
1. Long-term deposits include judicial deposits (Refer to Note 20 – Reserve for contingencies – tax and social risks), for $52 million at 31 December 2012 ($101 million at 31 December 2011).
In December 2012, Biosev moved from being a subsidiary of LDC to a sister company of LDC, leading to a $116.7 million decrease in other investments, deposits and sundry.
10. inVentories At 31 December 2012 and 31 December 2011, inventories consist of the following:
(in thousands of U.S. dollars) 2012 2011
Trading inventories $ 5,293,739 $ 5,100,000
Finished goods 465,334 909,107
Raw materials 224,623 117,859
inventories (gross value) $ 5,983,696 $ 6,126,966
Depreciation of non-trading inventories (7,020) (1,843)
Inventories (net value) $ 5,976,676 $ 6,125,123
In December 2012, Biosev moved from being a subsidiary of LDC to a sister company of LDC, leading to a $463.7 million decrease in inventories.Cost of goods sold and cost of derivatives held for trading purpose are presented in cost of sales. The breakdown of this information is not meaningful due to the activity of the Group.
11. FinAnCiAl instrumentsFinancial instruments are subject to various risks, including market value fluctuations, foreign currency, counterparty credit and liquidity risks. In addition to managing market and foreign currency risk, the Group implemented a strong monitoring of counterparty credit and ensured the availability of sufficient cash in order to reduce its liquidity risk. At each financial period end, the Group has a policy of accruing its receivables and unrealized gains with counterparties that are deemed at risk.
mArKet risKMarket risk is the risk that the fair value or future cash flows of assets and liabilities held by the Group including financial instruments, physical commodities, industrial and biological assets will fluctuate due to changes in market variables such as spot and forward commodity prices, relative price spreads and volatilities and foreign exchange rates.The Group classifies exposures to market risk into either trading or non-trading activities. The Group manages market risk for trading activities by diversifying exposures, controlling position natures, sizes and maturities, performing stress testing, monitoring risk limits under the supervision of Macro and Risk Committees. Limits are established for the level of acceptable risk at corporate level and are allocated at platform and profit center levels. The compliance with the limits is reported to Risk Committee daily.
46 LOuIS.DREyFuS.COMMODITIES.B.V. | 2012 Audited ConsolidAted FinAnCiAl stAtements
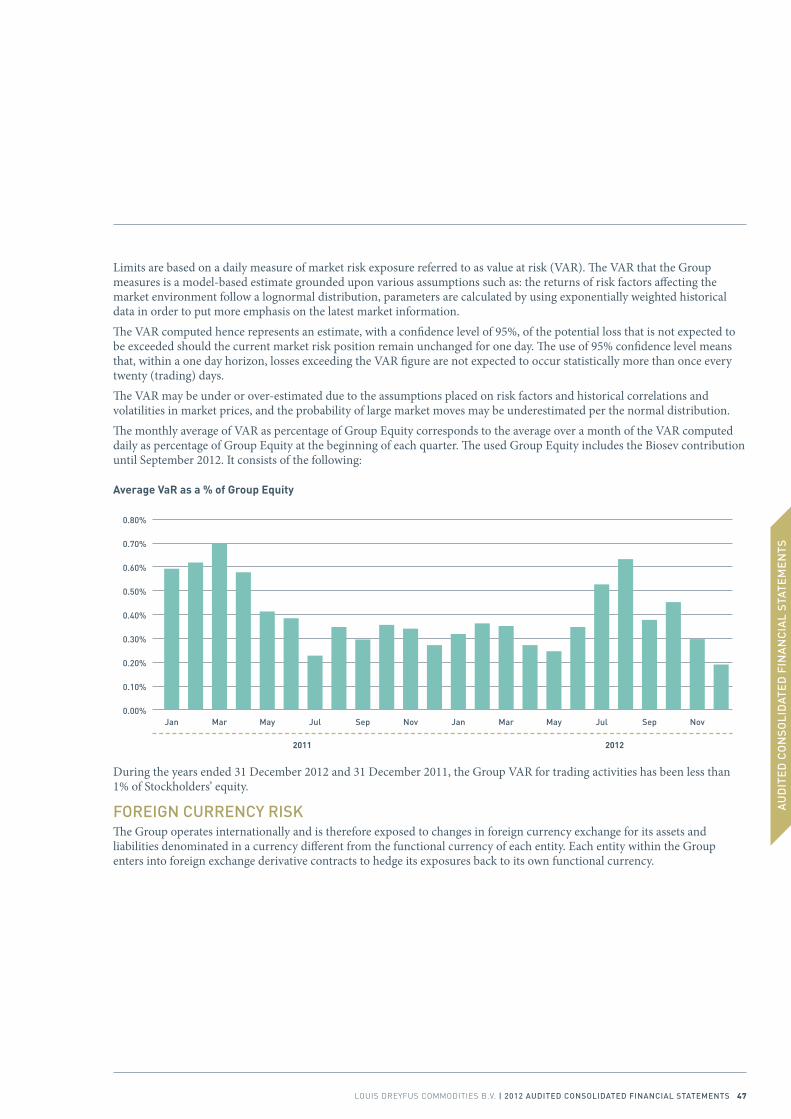
Limits are based on a daily measure of market risk exposure referred to as value at risk (VAR). The VAR that the Group measures is a model-based estimate grounded upon various assumptions such as: the returns of risk factors affecting the market environment follow a lognormal distribution, parameters are calculated by using exponentially weighted historical data in order to put more emphasis on the latest market information.The VAR computed hence represents an estimate, with a confidence level of 95%, of the potential loss that is not expected to be exceeded should the current market risk position remain unchanged for one day. The use of 95% confidence level means that, within a one day horizon, losses exceeding the VAR figure are not expected to occur statistically more than once every twenty (trading) days.The VAR may be under or over-estimated due to the assumptions placed on risk factors and historical correlations and volatilities in market prices, and the probability of large market moves may be underestimated per the normal distribution.The monthly average of VAR as percentage of Group Equity corresponds to the average over a month of the VAR computed daily as percentage of Group Equity at the beginning of each quarter. The used Group Equity includes the Biosev contribution until September 2012. It consists of the following:
Average VaR as a % of Group Equity
0.00%
0.10%
0.20%
0.30%
0.40%
0.50%
0.60%
0.70%
0.80%
Jan mar Janmay marJul may sepsep Jul novnov
2011 2012
During the years ended 31 December 2012 and 31 December 2011, the Group VAR for trading activities has been less than 1% of Stockholders’ equity.
ForeiGn CurrenCY risKThe Group operates internationally and is therefore exposed to changes in foreign currency exchange for its assets and liabilities denominated in a currency different from the functional currency of each entity. Each entity within the Group enters into foreign exchange derivative contracts to hedge its exposures back to its own functional currency.
AU
DIT
ED
CO
NS
OLI
DAT
ED
FIN
AN
CIA
L S
TATE
ME
NTS
LOuIS.DREyFuS.COMMODITIES.B.V. | 2012 Audited ConsolidAted FinAnCiAl stAtements 47
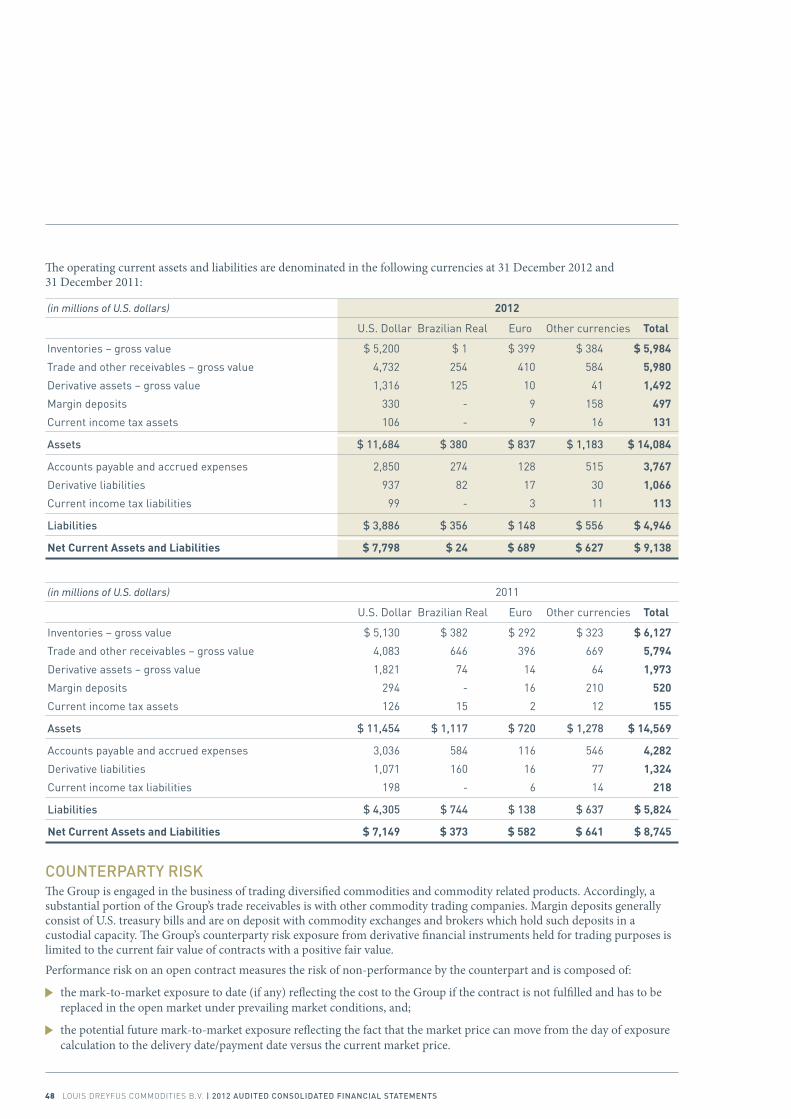
The operating current assets and liabilities are denominated in the following currencies at 31 December 2012 and 31 December 2011:
(in millions of U.S. dollars) 2012
U.S. Dollar Brazilian Real Euro Other currencies Total
Inventories – gross value $ 5,200 $ 1 $ 399 $ 384 $ 5,984
Trade and other receivables – gross value 4,732 254 410 584 5,980
Derivative assets – gross value 1,316 125 10 41 1,492
Margin deposits 330 - 9 158 497
Current income tax assets 106 - 9 16 131
Assets $ 11,684 $ 380 $ 837 $ 1,183 $ 14,084
Accounts payable and accrued expenses 2,850 274 128 515 3,767
Derivative liabilities 937 82 17 30 1,066
Current income tax liabilities 99 - 3 11 113
liabilities $ 3,886 $ 356 $ 148 $ 556 $ 4,946
Net Current Assets and Liabilities $ 7,798 $ 24 $ 689 $ 627 $ 9,138
(in millions of U.S. dollars) 2011
U.S. Dollar Brazilian Real Euro Other currencies Total
Inventories – gross value $ 5,130 $ 382 $ 292 $ 323 $ 6,127
Trade and other receivables – gross value 4,083 646 396 669 5,794
Derivative assets – gross value 1,821 74 14 64 1,973
Margin deposits 294 - 16 210 520
Current income tax assets 126 15 2 12 155
Assets $ 11,454 $ 1,117 $ 720 $ 1,278 $ 14,569
Accounts payable and accrued expenses 3,036 584 116 546 4,282
Derivative liabilities 1,071 160 16 77 1,324
Current income tax liabilities 198 - 6 14 218
liabilities $ 4,305 $ 744 $ 138 $ 637 $ 5,824
Net Current Assets and Liabilities $ 7,149 $ 373 $ 582 $ 641 $ 8,745
CounterPArtY risKThe Group is engaged in the business of trading diversified commodities and commodity related products. Accordingly, a substantial portion of the Group’s trade receivables is with other commodity trading companies. Margin deposits generally consist of U.S. treasury bills and are on deposit with commodity exchanges and brokers which hold such deposits in a custodial capacity. The Group’s counterparty risk exposure from derivative financial instruments held for trading purposes is limited to the current fair value of contracts with a positive fair value. Performance risk on an open contract measures the risk of non-performance by the counterpart and is composed of:
the mark-to-market exposure to date (if any) reflecting the cost to the Group if the contract is not fulfilled and has to be replaced in the open market under prevailing market conditions, and;
the potential future mark-to-market exposure reflecting the fact that the market price can move from the day of exposure calculation to the delivery date/payment date versus the current market price.
48 LOuIS.DREyFuS.COMMODITIES.B.V. | 2012 Audited ConsolidAted FinAnCiAl stAtements
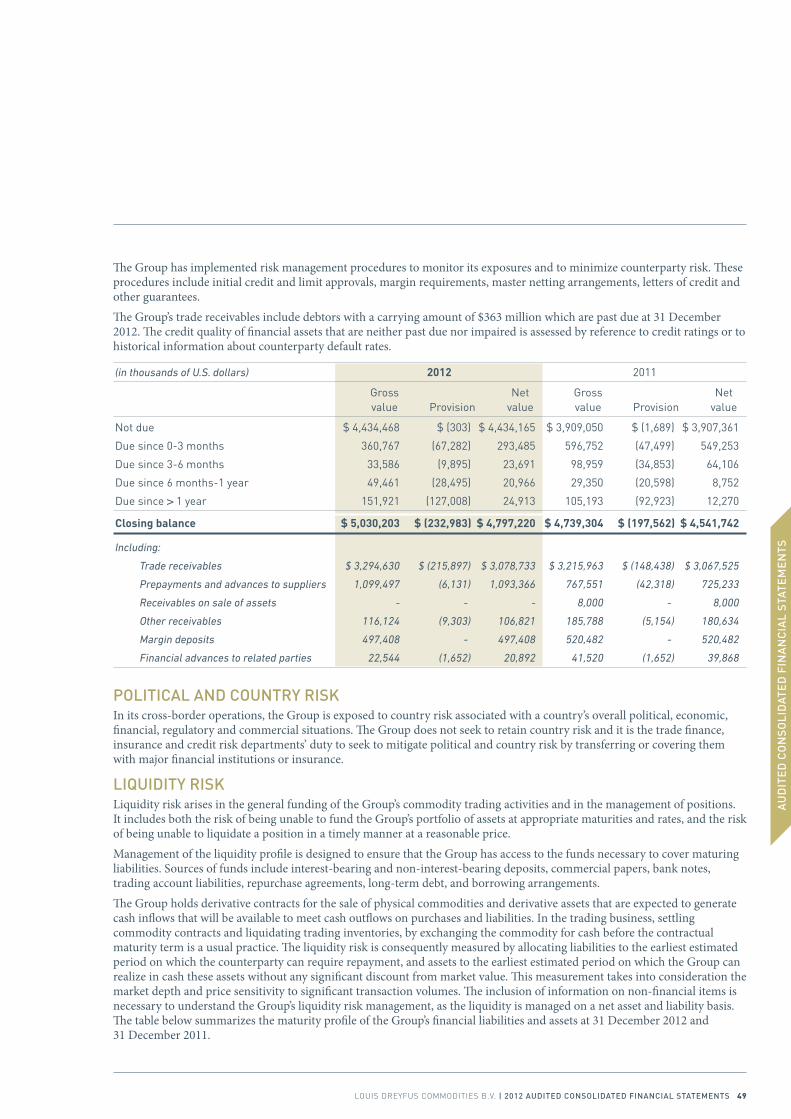
The Group has implemented risk management procedures to monitor its exposures and to minimize counterparty risk. These procedures include initial credit and limit approvals, margin requirements, master netting arrangements, letters of credit and other guarantees.The Group’s trade receivables include debtors with a carrying amount of $363 million which are past due at 31 December 2012. The credit quality of financial assets that are neither past due nor impaired is assessed by reference to credit ratings or to historical information about counterparty default rates.
(in thousands of U.S. dollars) 2012 2011
Gross Net Gross Net value Provision value value Provision value
Not due $ 4,434,468 $ (303) $ 4,434,165 $ 3,909,050 $ (1,689) $ 3,907,361
Due since 0-3 months 360,767 (67,282) 293,485 596,752 (47,499) 549,253
Due since 3-6 months 33,586 (9,895) 23,691 98,959 (34,853) 64,106
Due since 6 months-1 year 49,461 (28,495) 20,966 29,350 (20,598) 8,752
Due since > 1 year 151,921 (127,008) 24,913 105,193 (92,923) 12,270
Closing balance $ 5,030,203 $ (232,983) $ 4,797,220 $ 4,739,304 $ (197,562) $ 4,541,742
Including:
Trade receivables $ 3,294,630 $ (215,897) $ 3,078,733 $ 3,215,963 $ (148,438) $ 3,067,525
Prepayments and advances to suppliers 1,099,497 (6,131) 1,093,366 767,551 (42,318) 725,233
Receivables on sale of assets - - - 8,000 - 8,000
Other receivables 116,124 (9,303) 106,821 185,788 (5,154) 180,634
Margin deposits 497,408 - 497,408 520,482 - 520,482
Financial advances to related parties 22,544 (1,652) 20,892 41,520 (1,652) 39,868
PolitiCAl And CountrY risK In its cross-border operations, the Group is exposed to country risk associated with a country’s overall political, economic, financial, regulatory and commercial situations. The Group does not seek to retain country risk and it is the trade finance, insurance and credit risk departments’ duty to seek to mitigate political and country risk by transferring or covering them with major financial institutions or insurance.
liQuiditY risKLiquidity risk arises in the general funding of the Group’s commodity trading activities and in the management of positions. It includes both the risk of being unable to fund the Group’s portfolio of assets at appropriate maturities and rates, and the risk of being unable to liquidate a position in a timely manner at a reasonable price. Management of the liquidity profile is designed to ensure that the Group has access to the funds necessary to cover maturing liabilities. Sources of funds include interest-bearing and non-interest-bearing deposits, commercial papers, bank notes, trading account liabilities, repurchase agreements, long-term debt, and borrowing arrangements. The Group holds derivative contracts for the sale of physical commodities and derivative assets that are expected to generate cash inflows that will be available to meet cash outflows on purchases and liabilities. In the trading business, settling commodity contracts and liquidating trading inventories, by exchanging the commodity for cash before the contractual maturity term is a usual practice. The liquidity risk is consequently measured by allocating liabilities to the earliest estimated period on which the counterparty can require repayment, and assets to the earliest estimated period on which the Group can realize in cash these assets without any significant discount from market value. This measurement takes into consideration the market depth and price sensitivity to significant transaction volumes. The inclusion of information on non-financial items is necessary to understand the Group’s liquidity risk management, as the liquidity is managed on a net asset and liability basis. The table below summarizes the maturity profile of the Group’s financial liabilities and assets at 31 December 2012 and 31 December 2011.
AU
DIT
ED
CO
NS
OLI
DAT
ED
FIN
AN
CIA
L S
TATE
ME
NTS
LOuIS.DREyFuS.COMMODITIES.B.V. | 2012 Audited ConsolidAted FinAnCiAl stAtements 49
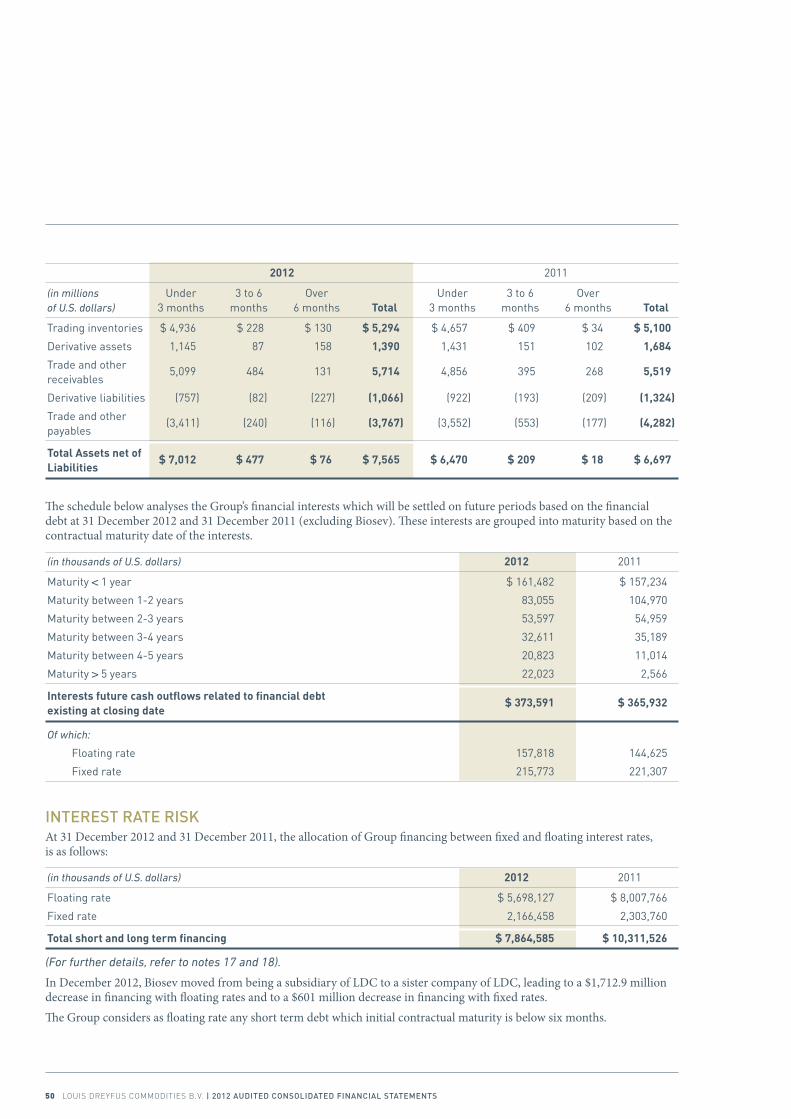
2012 2011
(in millions Under 3 to 6 Over Under 3 to 6 Over of U.S. dollars) 3 months months 6 months Total 3 months months 6 months Total
Trading inventories $ 4,936 $ 228 $ 130 $ 5,294 $ 4,657 $ 409 $ 34 $ 5,100
Derivative assets 1,145 87 158 1,390 1,431 151 102 1,684
Trade and other 5,099 484 131 5,714 4,856 395 268 5,519 receivables
Derivative liabilities (757) (82) (227) (1,066) (922) (193) (209) (1,324)
Trade and other (3,411) (240) (116) (3,767) (3,552) (553) (177) (4,282) payables
Total Assets net of $ 7,012 $ 477 $ 76 $ 7,565 $ 6,470 $ 209 $ 18 $ 6,697 Liabilities
The schedule below analyses the Group’s financial interests which will be settled on future periods based on the financial debt at 31 December 2012 and 31 December 2011 (excluding Biosev). These interests are grouped into maturity based on the contractual maturity date of the interests.
(in thousands of U.S. dollars) 2012 2011
Maturity < 1 year $ 161,482 $ 157,234
Maturity between 1-2 years 83,055 104,970
Maturity between 2-3 years 53,597 54,959
Maturity between 3-4 years 32,611 35,189
Maturity between 4-5 years 20,823 11,014
Maturity > 5 years 22,023 2,566
Interests future cash outflows related to financial debt $ 373,591 $ 365,932 existing at closing date
Of which:
Floating rate 157,818 144,625
Fixed rate 215,773 221,307
interest rAte risKAt 31 December 2012 and 31 December 2011, the allocation of Group financing between fixed and floating interest rates, is as follows:
(in thousands of U.S. dollars) 2012 2011
Floating rate $ 5,698,127 $ 8,007,766
Fixed rate 2,166,458 2,303,760
Total short and long term financing $ 7,864,585 $ 10,311,526
(For further details, refer to notes 17 and 18).
In December 2012, Biosev moved from being a subsidiary of LDC to a sister company of LDC, leading to a $1,712.9 million decrease in financing with floating rates and to a $601 million decrease in financing with fixed rates.The Group considers as floating rate any short term debt which initial contractual maturity is below six months.
50 LOuIS.DREyFuS.COMMODITIES.B.V. | 2012 Audited ConsolidAted FinAnCiAl stAtements
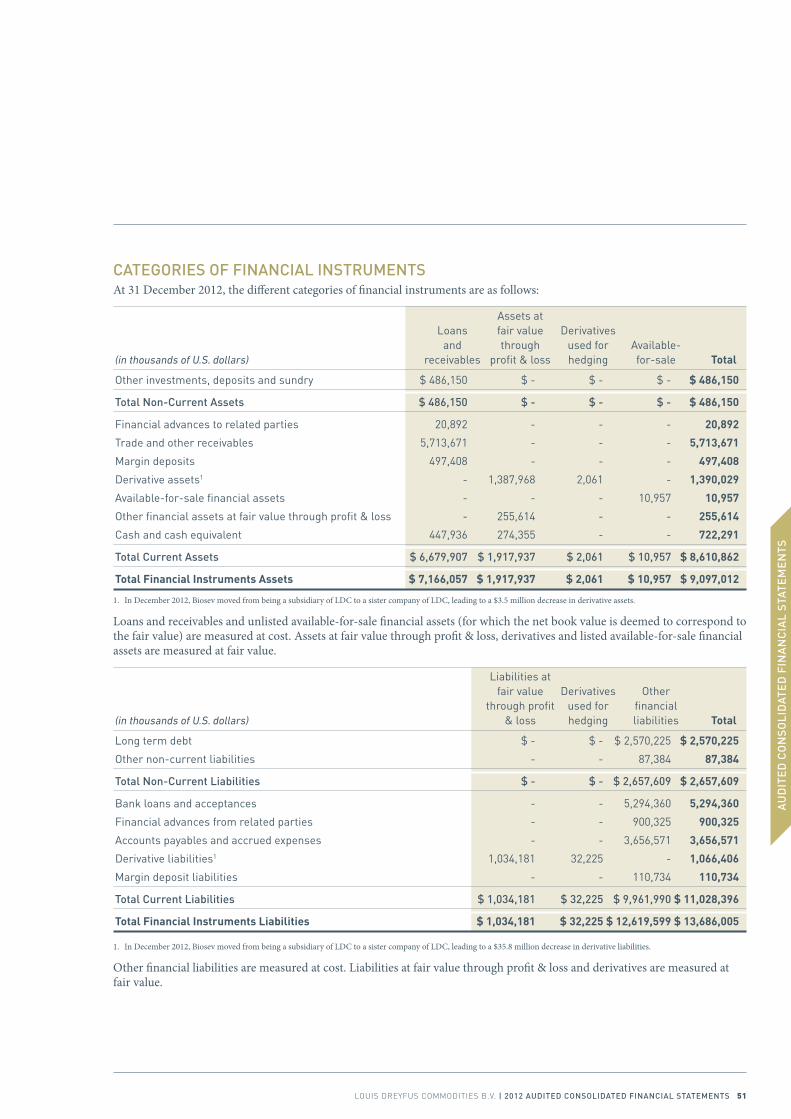
CAteGories oF FinAnCiAl instruments At 31 December 2012, the different categories of financial instruments are as follows:
Assets at Loans fair value Derivatives and through used for Available- (in thousands of U.S. dollars) receivables profit & loss hedging for-sale Total
Other investments, deposits and sundry $ 486,150 $ - $ - $ - $ 486,150
total non-Current Assets $ 486,150 $ - $ - $ - $ 486,150
Financial advances to related parties 20,892 - - - 20,892
Trade and other receivables 5,713,671 - - - 5,713,671
Margin deposits 497,408 - - - 497,408
Derivative assets1 - 1,387,968 2,061 - 1,390,029
Available-for-sale financial assets - - - 10,957 10,957
Other financial assets at fair value through profit & loss - 255,614 - - 255,614
Cash and cash equivalent 447,936 274,355 - - 722,291
total Current Assets $ 6,679,907 $ 1,917,937 $ 2,061 $ 10,957 $ 8,610,862
Total Financial Instruments Assets $ 7,166,057 $ 1,917,937 $ 2,061 $ 10,957 $ 9,097,012
1. In December 2012, Biosev moved from being a subsidiary of LDC to a sister company of LDC, leading to a $3.5 million decrease in derivative assets.
Loans and receivables and unlisted available-for-sale financial assets (for which the net book value is deemed to correspond to the fair value) are measured at cost. Assets at fair value through profit & loss, derivatives and listed available-for-sale financial assets are measured at fair value.
Liabilities at fair value Derivatives Other through profit used for financial (in thousands of U.S. dollars) & loss hedging liabilities Total
Long term debt $ - $ - $ 2,570,225 $ 2,570,225
Other non-current liabilities - - 87,384 87,384
total non-Current liabilities $ - $ - $ 2,657,609 $ 2,657,609
Bank loans and acceptances - - 5,294,360 5,294,360
Financial advances from related parties - - 900,325 900,325
Accounts payables and accrued expenses - - 3,656,571 3,656,571
Derivative liabilities1 1,034,181 32,225 - 1,066,406
Margin deposit liabilities - - 110,734 110,734
total Current liabilities $ 1,034,181 $ 32,225 $ 9,961,990 $ 11,028,396
Total Financial Instruments Liabilities $ 1,034,181 $ 32,225 $ 12,619,599 $ 13,686,005
1. In December 2012, Biosev moved from being a subsidiary of LDC to a sister company of LDC, leading to a $35.8 million decrease in derivative liabilities.
Other financial liabilities are measured at cost. Liabilities at fair value through profit & loss and derivatives are measured at fair value.
AU
DIT
ED
CO
NS
OLI
DAT
ED
FIN
AN
CIA
L S
TATE
ME
NTS
LOuIS.DREyFuS.COMMODITIES.B.V. | 2012 Audited ConsolidAted FinAnCiAl stAtements 51
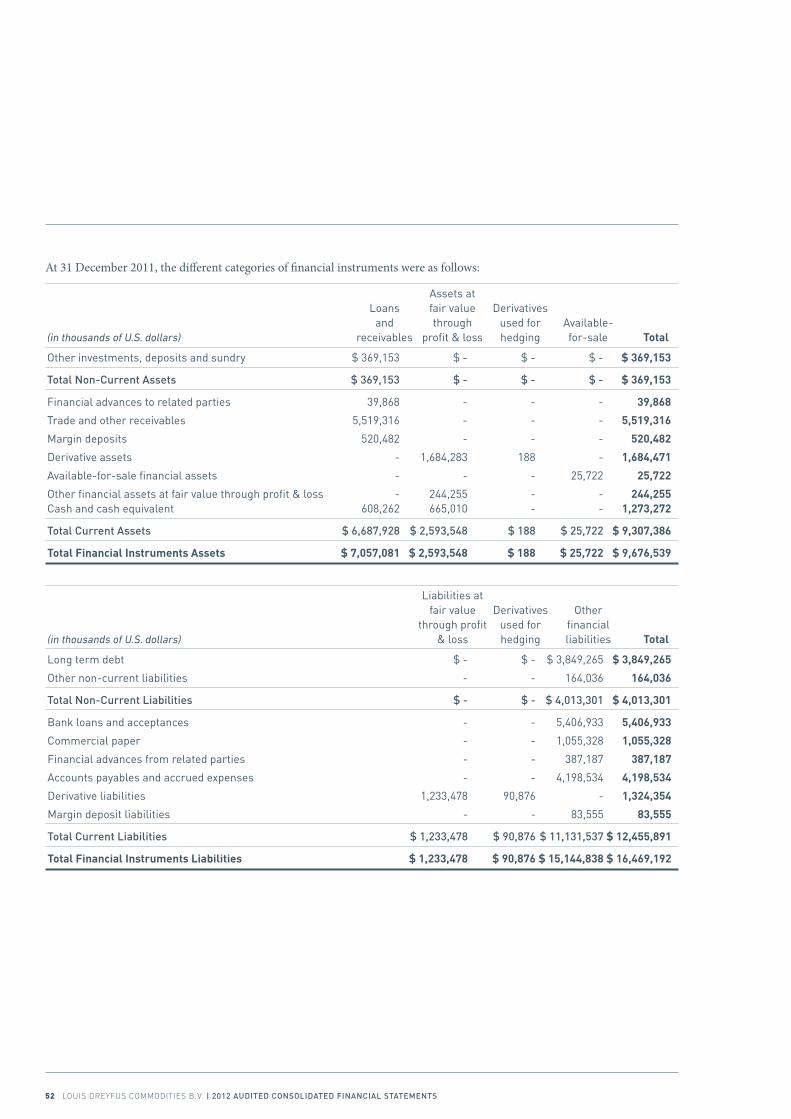
At 31 December 2011, the different categories of financial instruments were as follows:
Assets at Loans fair value Derivatives and through used for Available- (in thousands of U.S. dollars) receivables profit & loss hedging for-sale Total
Other investments, deposits and sundry $ 369,153 $ - $ - $ - $ 369,153
total non-Current Assets $ 369,153 $ - $ - $ - $ 369,153
Financial advances to related parties 39,868 - - - 39,868
Trade and other receivables 5,519,316 - - - 5,519,316
Margin deposits 520,482 - - - 520,482
Derivative assets - 1,684,283 188 - 1,684,471
Available-for-sale financial assets - - - 25,722 25,722
Other financial assets at fair value through profit & loss - 244,255 - - 244,255 Cash and cash equivalent 608,262 665,010 - - 1,273,272
total Current Assets $ 6,687,928 $ 2,593,548 $ 188 $ 25,722 $ 9,307,386
Total Financial Instruments Assets $ 7,057,081 $ 2,593,548 $ 188 $ 25,722 $ 9,676,539
Liabilities at fair value Derivatives Other through profit used for financial (in thousands of U.S. dollars) & loss hedging liabilities Total
Long term debt $ - $ - $ 3,849,265 $ 3,849,265
Other non-current liabilities - - 164,036 164,036
total non-Current liabilities $ - $ - $ 4,013,301 $ 4,013,301
Bank loans and acceptances - - 5,406,933 5,406,933
Commercial paper - - 1,055,328 1,055,328
Financial advances from related parties - - 387,187 387,187
Accounts payables and accrued expenses - - 4,198,534 4,198,534
Derivative liabilities 1,233,478 90,876 - 1,324,354
Margin deposit liabilities - - 83,555 83,555
total Current liabilities $ 1,233,478 $ 90,876 $ 11,131,537 $ 12,455,891
Total Financial Instruments Liabilities $ 1,233,478 $ 90,876 $ 15,144,838 $ 16,469,192
52 LOuIS.DREyFuS.COMMODITIES.B.V. | 2012 Audited ConsolidAted FinAnCiAl stAtements
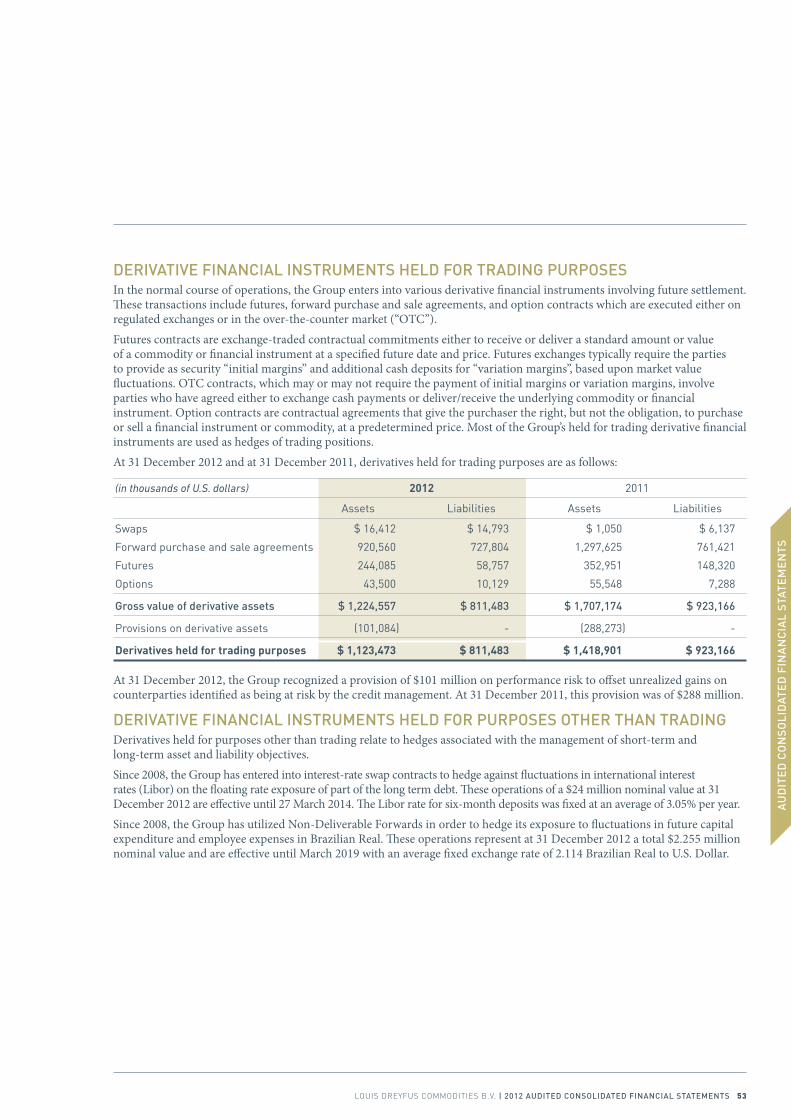
deriVAtiVe FinAnCiAl instruments held For trAdinG PurPosesIn the normal course of operations, the Group enters into various derivative financial instruments involving future settlement. These transactions include futures, forward purchase and sale agreements, and option contracts which are executed either on regulated exchanges or in the over-the-counter market (“OTC”).Futures contracts are exchange-traded contractual commitments either to receive or deliver a standard amount or value of a commodity or financial instrument at a specified future date and price. Futures exchanges typically require the parties to provide as security “initial margins” and additional cash deposits for “variation margins”, based upon market value fluctuations. OTC contracts, which may or may not require the payment of initial margins or variation margins, involve parties who have agreed either to exchange cash payments or deliver/receive the underlying commodity or financial instrument. Option contracts are contractual agreements that give the purchaser the right, but not the obligation, to purchase or sell a financial instrument or commodity, at a predetermined price. Most of the Group’s held for trading derivative financial instruments are used as hedges of trading positions.At 31 December 2012 and at 31 December 2011, derivatives held for trading purposes are as follows:
(in thousands of U.S. dollars) 2012 2011
Assets Liabilities Assets Liabilities
Swaps $ 16,412 $ 14,793 $ 1,050 $ 6,137
Forward purchase and sale agreements 920,560 727,804 1,297,625 761,421
Futures 244,085 58,757 352,951 148,320
Options 43,500 10,129 55,548 7,288
Gross value of derivative assets $ 1,224,557 $ 811,483 $ 1,707,174 $ 923,166
Provisions on derivative assets (101,084) - (288,273) -
Derivatives held for trading purposes $ 1,123,473 $ 811,483 $ 1,418,901 $ 923,166
At 31 December 2012, the Group recognized a provision of $101 million on performance risk to offset unrealized gains on counterparties identified as being at risk by the credit management. At 31 December 2011, this provision was of $288 million.
deriVAtiVe FinAnCiAl instruments held For PurPoses other thAn trAdinGDerivatives held for purposes other than trading relate to hedges associated with the management of short-term and long-term asset and liability objectives.Since 2008, the Group has entered into interest-rate swap contracts to hedge against fluctuations in international interest rates (Libor) on the floating rate exposure of part of the long term debt. These operations of a $24 million nominal value at 31 December 2012 are effective until 27 March 2014. The Libor rate for six-month deposits was fixed at an average of 3.05% per year.Since 2008, the Group has utilized Non-Deliverable Forwards in order to hedge its exposure to fluctuations in future capital expenditure and employee expenses in Brazilian Real. These operations represent at 31 December 2012 a total $2.255 million nominal value and are effective until March 2019 with an average fixed exchange rate of 2.114 Brazilian Real to U.S. Dollar.
AU
DIT
ED
CO
NS
OLI
DAT
ED
FIN
AN
CIA
L S
TATE
ME
NTS
LOuIS.DREyFuS.COMMODITIES.B.V. | 2012 Audited ConsolidAted FinAnCiAl stAtements 53
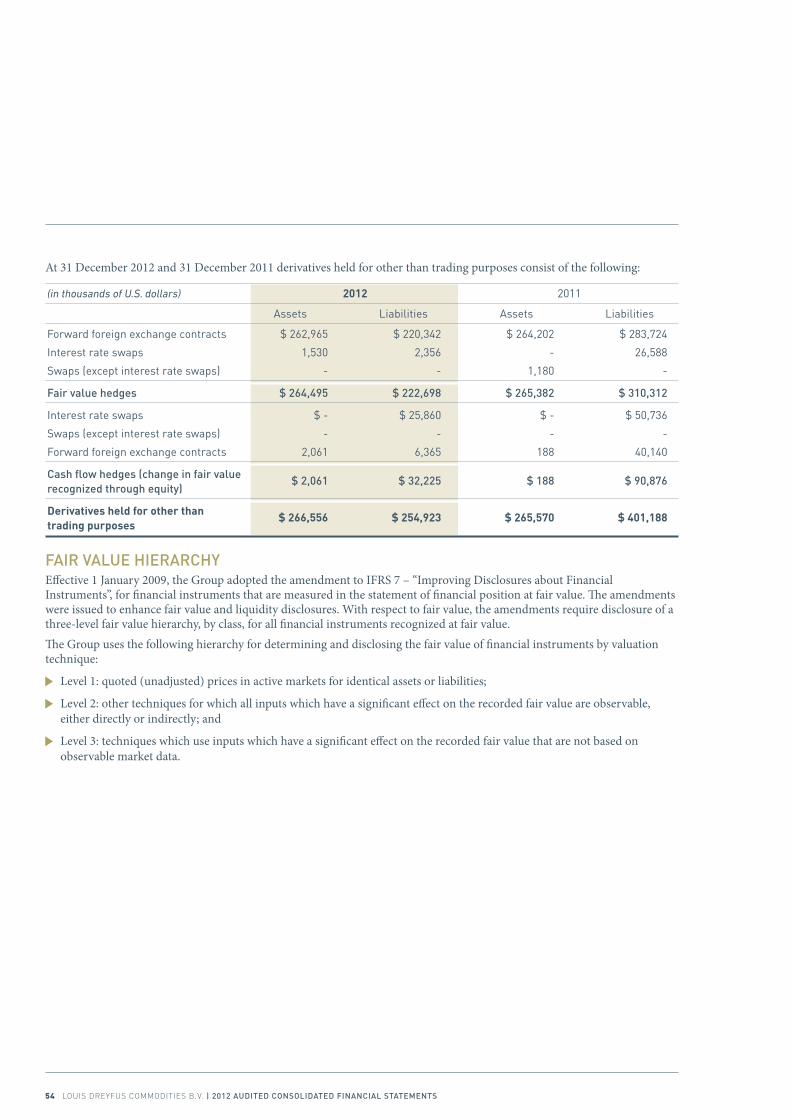
At 31 December 2012 and 31 December 2011 derivatives held for other than trading purposes consist of the following:
(in thousands of U.S. dollars) 2012 2011
Assets Liabilities Assets Liabilities
Forward foreign exchange contracts $ 262,965 $ 220,342 $ 264,202 $ 283,724
Interest rate swaps 1,530 2,356 - 26,588
Swaps (except interest rate swaps) - - 1,180 -
Fair value hedges $ 264,495 $ 222,698 $ 265,382 $ 310,312
Interest rate swaps $ - $ 25,860 $ - $ 50,736
Swaps (except interest rate swaps) - - - -
Forward foreign exchange contracts 2,061 6,365 188 40,140
Cash flow hedges (change in fair value $ 2,061 $ 32,225 $ 188 $ 90,876 recognized through equity)
Derivatives held for other than $ 266,556 $ 254,923 $ 265,570 $ 401,188 trading purposes
FAir VAlue hierArChYEffective 1 January 2009, the Group adopted the amendment to IFRS 7 – “Improving Disclosures about Financial Instruments”, for financial instruments that are measured in the statement of financial position at fair value. The amendments were issued to enhance fair value and liquidity disclosures. With respect to fair value, the amendments require disclosure of a three-level fair value hierarchy, by class, for all financial instruments recognized at fair value.The Group uses the following hierarchy for determining and disclosing the fair value of financial instruments by valuation technique:
Level 1: quoted (unadjusted) prices in active markets for identical assets or liabilities;
Level 2: other techniques for which all inputs which have a significant effect on the recorded fair value are observable, either directly or indirectly; and
Level 3: techniques which use inputs which have a significant effect on the recorded fair value that are not based on observable market data.
54 LOuIS.DREyFuS.COMMODITIES.B.V. | 2012 Audited ConsolidAted FinAnCiAl stAtements
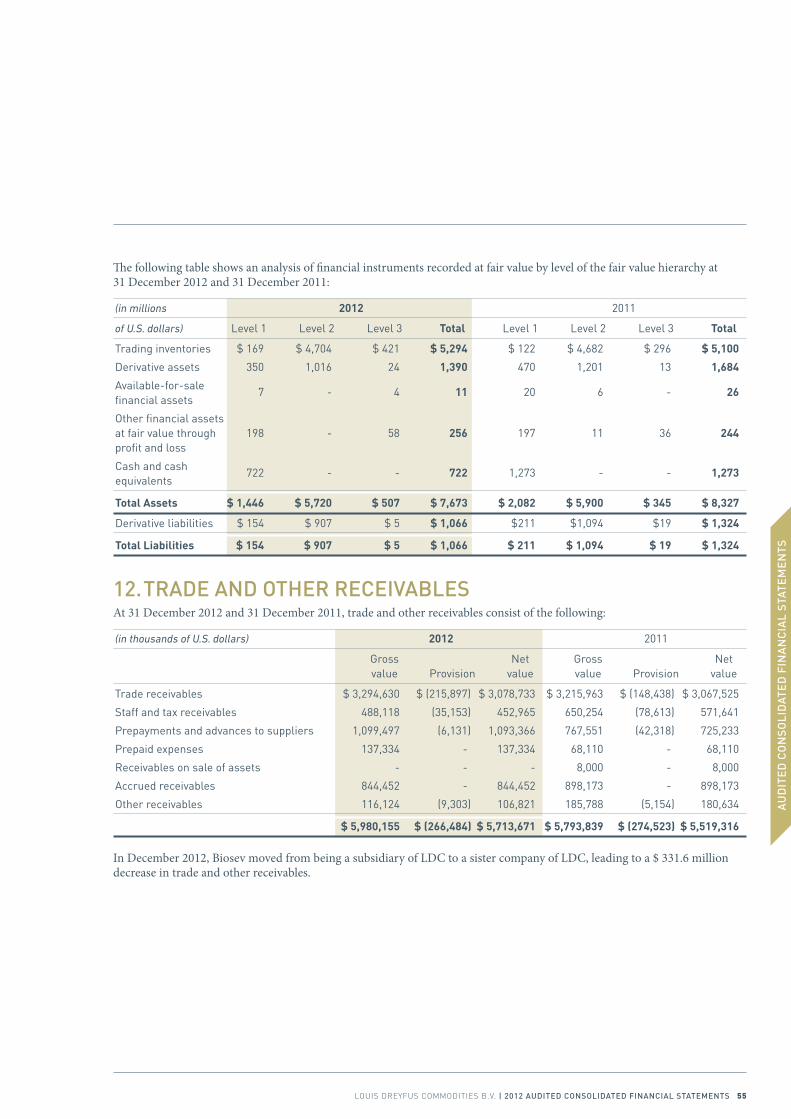
The following table shows an analysis of financial instruments recorded at fair value by level of the fair value hierarchy at 31 December 2012 and 31 December 2011:
(in millions 2012 2011
of U.S. dollars) Level 1 Level 2 Level 3 Total Level 1 Level 2 Level 3 Total
Trading inventories $ 169 $ 4,704 $ 421 $ 5,294 $ 122 $ 4,682 $ 296 $ 5,100
Derivative assets 350 1,016 24 1,390 470 1,201 13 1,684
Available-for-sale 7 - 4 11 20 6 - 26 financial assets
Other financial assets at fair value through 198 - 58 256 197 11 36 244 profit and loss
Cash and cash 722 - - 722 1,273 - - 1,273 equivalents
Total Assets $ 1,446 $ 5,720 $ 507 $ 7,673 $ 2,082 $ 5,900 $ 345 $ 8,327
Derivative liabilities $ 154 $ 907 $ 5 $ 1,066 $211 $1,094 $19 $ 1,324
Total Liabilities $ 154 $ 907 $ 5 $ 1,066 $ 211 $ 1,094 $ 19 $ 1,324
12. trAde And other reCeiVABles At 31 December 2012 and 31 December 2011, trade and other receivables consist of the following:
(in thousands of U.S. dollars) 2012 2011
Gross Net Gross Net value Provision value value Provision value
Trade receivables $ 3,294,630 $ (215,897) $ 3,078,733 $ 3,215,963 $ (148,438) $ 3,067,525
Staff and tax receivables 488,118 (35,153) 452,965 650,254 (78,613) 571,641
Prepayments and advances to suppliers 1,099,497 (6,131) 1,093,366 767,551 (42,318) 725,233
Prepaid expenses 137,334 - 137,334 68,110 - 68,110
Receivables on sale of assets - - - 8,000 - 8,000
Accrued receivables 844,452 - 844,452 898,173 - 898,173
Other receivables 116,124 (9,303) 106,821 185,788 (5,154) 180,634
$ 5,980,155 $ (266,484) $ 5,713,671 $ 5,793,839 $ (274,523) $ 5,519,316
In December 2012, Biosev moved from being a subsidiary of LDC to a sister company of LDC, leading to a $ 331.6 million decrease in trade and other receivables.
AU
DIT
ED
CO
NS
OLI
DAT
ED
FIN
AN
CIA
L S
TATE
ME
NTS
LOuIS.DREyFuS.COMMODITIES.B.V. | 2012 Audited ConsolidAted FinAnCiAl stAtements 55
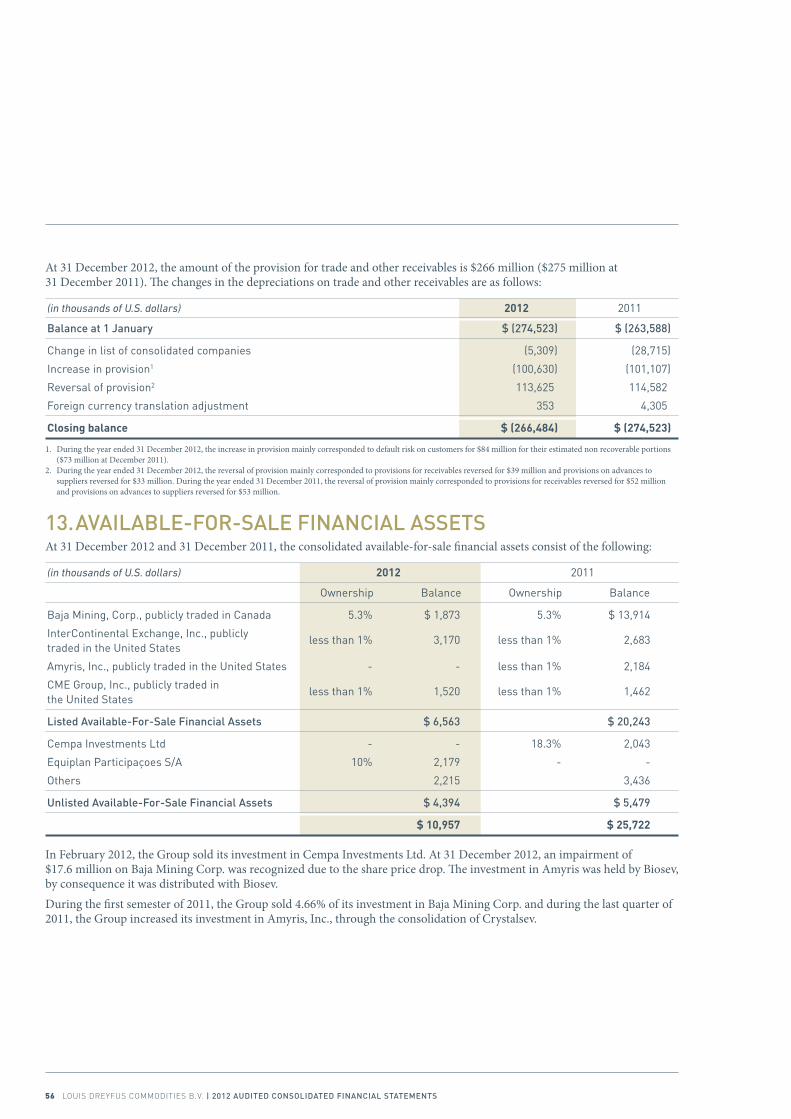
At 31 December 2012, the amount of the provision for trade and other receivables is $266 million ($275 million at 31 December 2011). The changes in the depreciations on trade and other receivables are as follows:
(in thousands of U.S. dollars) 2012 2011
Balance at 1 January $ (274,523) $ (263,588)
Change in list of consolidated companies (5,309) (28,715)
Increase in provision1 (100,630) (101,107)
Reversal of provision2 113,625 114,582
Foreign currency translation adjustment 353 4,305
Closing balance $ (266,484) $ (274,523)
1. During the year ended 31 December 2012, the increase in provision mainly corresponded to default risk on customers for $84 million for their estimated non recoverable portions ($73 million at December 2011).
2. During the year ended 31 December 2012, the reversal of provision mainly corresponded to provisions for receivables reversed for $39 million and provisions on advances to suppliers reversed for $33 million. During the year ended 31 December 2011, the reversal of provision mainly corresponded to provisions for receivables reversed for $52 million and provisions on advances to suppliers reversed for $53 million.
13. AVAilABle-For-sAle FinAnCiAl AssetsAt 31 December 2012 and 31 December 2011, the consolidated available-for-sale financial assets consist of the following:
(in thousands of U.S. dollars) 2012 2011
Ownership Balance Ownership Balance
Baja Mining, Corp., publicly traded in Canada 5.3% $ 1,873 5.3% $ 13,914
InterContinental Exchange, Inc., publicly less than 1% 3,170 less than 1% 2,683 traded in the United States
Amyris, Inc., publicly traded in the United States - - less than 1% 2,184
CME Group, Inc., publicly traded in less than 1% 1,520 less than 1% 1,462 the United States
listed Available-For-sale Financial Assets $ 6,563 $ 20,243
Cempa Investments Ltd - - 18.3% 2,043
Equiplan Participaçoes S/A 10% 2,179 - -
Others 2,215 3,436
unlisted Available-For-sale Financial Assets $ 4,394 $ 5,479
$ 10,957 $ 25,722
In February 2012, the Group sold its investment in Cempa Investments Ltd. At 31 December 2012, an impairment of $17.6 million on Baja Mining Corp. was recognized due to the share price drop. The investment in Amyris was held by Biosev, by consequence it was distributed with Biosev.During the first semester of 2011, the Group sold 4.66% of its investment in Baja Mining Corp. and during the last quarter of 2011, the Group increased its investment in Amyris, Inc., through the consolidation of Crystalsev.
56 LOuIS.DREyFuS.COMMODITIES.B.V. | 2012 Audited ConsolidAted FinAnCiAl stAtements

14. other FinAnCiAl Assets At FAir VAlue throuGh ProFit And loss
At 31 December 2012 and 31 December 2011, other financial assets consist of the following:
(in thousands of U.S. dollars) 2012 2011
Financial assets held for trading purpose $ 124,566 $ 114,795
Short term securities (maturity > 3 months)1 121,993 95,982
Reverse repurchase agreement loan 9,055 33,478
$ 255,614 $ 244,255
1. Including $18 million at 31 December 2012 of securities pledged as collaterals for exchange ($32 million at 31 December 2011).
Short-term securities are instruments with a maturity greater than three months acquired with the purpose of selling or repurchasing.In December 2012, Biosev moved from being a subsidiary of LDC to a sister company of LDC, leading to a $33.6 million decrease in other financial assets at fair value through profit and loss.
15. CAsh And CAsh eQuiVAlentsCash and cash equivalents are as follows at 31 December 2012 and 31 December 2011:
(in thousands of U.S. dollars) 2012 2011
Short term securities (maturity < 3 months)1 $ 274,355 $ 665,010
Cash 447,936 608,262
$ 722,291 $ 1,273,272
1. Including $23 million at 31 December 2012 of securities pledged as collaterals for exchange ($37 million at 31 December 2011).
In December 2012, Biosev moved from being a subsidiary of LDC to a sister company of LDC, leading to a $93.1 million decrease in cash and cash equivalents.At 31 December 2012 and 31 December 2011, there is no material difference between the historical value of cash and cash equivalents and the fair value.
16. eQuitY(in thousands of U.S. dollars) 2012 2011
Issued capital $ 1,438 $ 1,438
Share premium 1,585,420 1,585,420
Perpetual capital securities, less costs net of tax 345,079 -
Retained earnings 2,802,153 3,139,351
Other reserves 16,225 24,755
equity attributable to owners of the Parent $ 4,750,315 $ 4,750,964
Non-Controlling interests 57,133 532,935
Total Equity $ 4,807,448 $ 5,283,899
The stockholder’s equity and non-controlling interests disclosed in the financial statements correspond to the equity used by the management when assessing performance.
AU
DIT
ED
CO
NS
OLI
DAT
ED
FIN
AN
CIA
L S
TATE
ME
NTS
LOuIS.DREyFuS.COMMODITIES.B.V. | 2012 Audited ConsolidAted FinAnCiAl stAtements 57
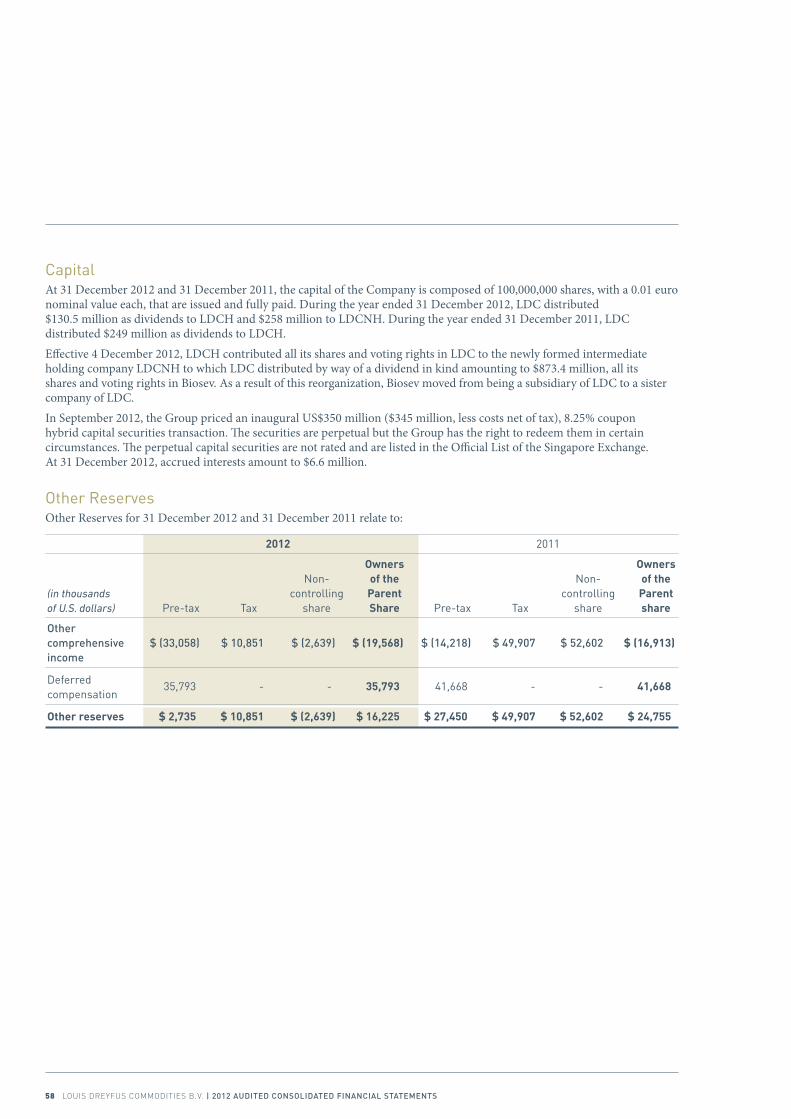
CapitalAt 31 December 2012 and 31 December 2011, the capital of the Company is composed of 100,000,000 shares, with a 0.01 euro nominal value each, that are issued and fully paid. During the year ended 31 December 2012, LDC distributed $130.5 million as dividends to LDCH and $258 million to LDCNH. During the year ended 31 December 2011, LDC distributed $249 million as dividends to LDCH.Effective 4 December 2012, LDCH contributed all its shares and voting rights in LDC to the newly formed intermediate holding company LDCNH to which LDC distributed by way of a dividend in kind amounting to $873.4 million, all its shares and voting rights in Biosev. As a result of this reorganization, Biosev moved from being a subsidiary of LDC to a sister company of LDC.In September 2012, the Group priced an inaugural US$350 million ($345 million, less costs net of tax), 8.25% coupon hybrid capital securities transaction. The securities are perpetual but the Group has the right to redeem them in certain circumstances. The perpetual capital securities are not rated and are listed in the Official List of the Singapore Exchange. At 31 December 2012, accrued interests amount to $6.6 million.
Other ReservesOther Reserves for 31 December 2012 and 31 December 2011 relate to:
2012 2011
Owners Owners Non- of the Non- of the (in thousands controlling Parent controlling Parent of U.S. dollars) Pre-tax Tax share Share Pre-tax Tax share share
other comprehensive $ (33,058) $ 10,851 $ (2,639) $ (19,568) $ (14,218) $ 49,907 $ 52,602 $ (16,913) income
Deferred 35,793 - - 35,793 41,668 - - 41,668 compensation
Other reserves $ 2,735 $ 10,851 $ (2,639) $ 16,225 $ 27,450 $ 49,907 $ 52,602 $ 24,755
58 LOuIS.DREyFuS.COMMODITIES.B.V. | 2012 Audited ConsolidAted FinAnCiAl stAtements
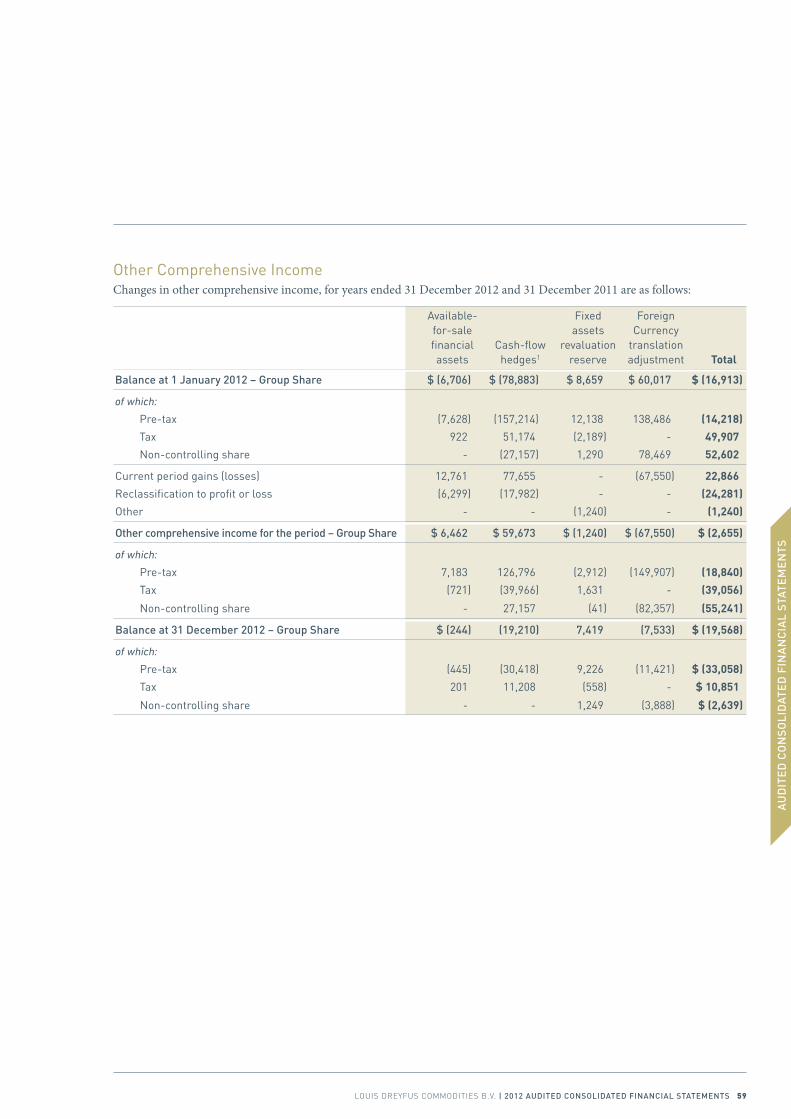
Other Comprehensive IncomeChanges in other comprehensive income, for years ended 31 December 2012 and 31 December 2011 are as follows:
Available- Fixed Foreign for-sale assets Currency financial Cash-flow revaluation translation assets hedges1 reserve adjustment Total
Balance at 1 January 2012 – Group share $ (6,706) $ (78,883) $ 8,659 $ 60,017 $ (16,913)
of which:
Pre-tax (7,628) (157,214) 12,138 138,486 (14,218)
Tax 922 51,174 (2,189) - 49,907
Non-controlling share - (27,157) 1,290 78,469 52,602
Current period gains (losses) 12,761 77,655 - (67,550) 22,866
Reclassification to profit or loss (6,299) (17,982) - - (24,281)
Other - - (1,240) - (1,240)
other comprehensive income for the period – Group share $ 6,462 $ 59,673 $ (1,240) $ (67,550) $ (2,655)
of which:
Pre-tax 7,183 126,796 (2,912) (149,907) (18,840)
Tax (721) (39,966) 1,631 - (39,056)
Non-controlling share - 27,157 (41) (82,357) (55,241)
Balance at 31 december 2012 – Group share $ (244) (19,210) 7,419 (7,533) $ (19,568)
of which:
Pre-tax (445) (30,418) 9,226 (11,421) $ (33,058)
Tax 201 11,208 (558) - $ 10,851
Non-controlling share - - 1,249 (3,888) $ (2,639)
AU
DIT
ED
CO
NS
OLI
DAT
ED
FIN
AN
CIA
L S
TATE
ME
NTS
LOuIS.DREyFuS.COMMODITIES.B.V. | 2012 Audited ConsolidAted FinAnCiAl stAtements 59
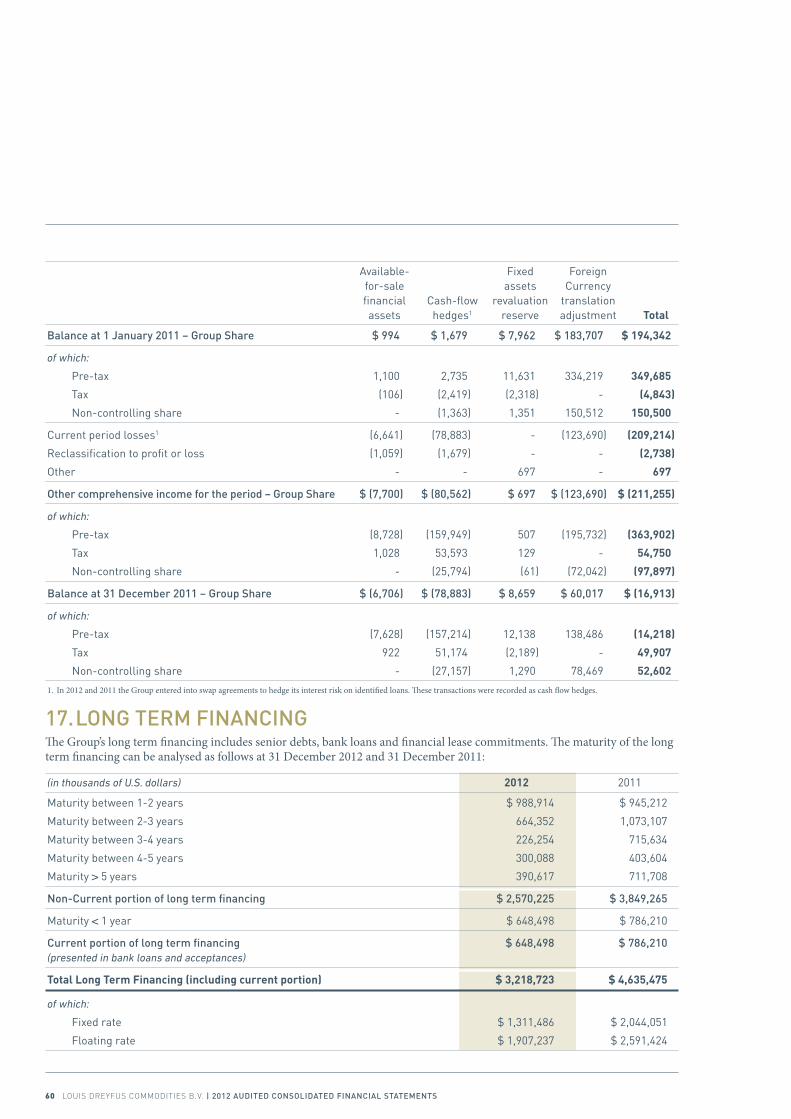
Available- Fixed Foreign for-sale assets Currency financial Cash-flow revaluation translation assets hedges1 reserve adjustment Total
Balance at 1 January 2011 – Group share $ 994 $ 1,679 $ 7,962 $ 183,707 $ 194,342
of which:
Pre-tax 1,100 2,735 11,631 334,219 349,685
Tax (106) (2,419) (2,318) - (4,843)
Non-controlling share - (1,363) 1,351 150,512 150,500
Current period losses1 (6,641) (78,883) - (123,690) (209,214)
Reclassification to profit or loss (1,059) (1,679) - - (2,738)
Other - - 697 - 697
other comprehensive income for the period – Group share $ (7,700) $ (80,562) $ 697 $ (123,690) $ (211,255)
of which:
Pre-tax (8,728) (159,949) 507 (195,732) (363,902)
Tax 1,028 53,593 129 - 54,750
Non-controlling share - (25,794) (61) (72,042) (97,897)
Balance at 31 december 2011 – Group share $ (6,706) $ (78,883) $ 8,659 $ 60,017 $ (16,913)
of which:
Pre-tax (7,628) (157,214) 12,138 138,486 (14,218)
Tax 922 51,174 (2,189) - 49,907
Non-controlling share - (27,157) 1,290 78,469 52,602
1. In 2012 and 2011 the Group entered into swap agreements to hedge its interest risk on identified loans. These transactions were recorded as cash flow hedges.
17. lonG term FinAnCinGThe Group’s long term financing includes senior debts, bank loans and financial lease commitments. The maturity of the long term financing can be analysed as follows at 31 December 2012 and 31 December 2011:
(in thousands of U.S. dollars) 2012 2011
Maturity between 1-2 years $ 988,914 $ 945,212
Maturity between 2-3 years 664,352 1,073,107
Maturity between 3-4 years 226,254 715,634
Maturity between 4-5 years 300,088 403,604
Maturity > 5 years 390,617 711,708
non-Current portion of long term financing $ 2,570,225 $ 3,849,265
Maturity < 1 year $ 648,498 $ 786,210
Current portion of long term financing $ 648,498 $ 786,210 (presented in bank loans and acceptances)
Total Long Term Financing (including current portion) $ 3,218,723 $ 4,635,475
of which:
Fixed rate $ 1,311,486 $ 2,044,051
Floating rate $ 1,907,237 $ 2,591,424
60 LOuIS.DREyFuS.COMMODITIES.B.V. | 2012 Audited ConsolidAted FinAnCiAl stAtements
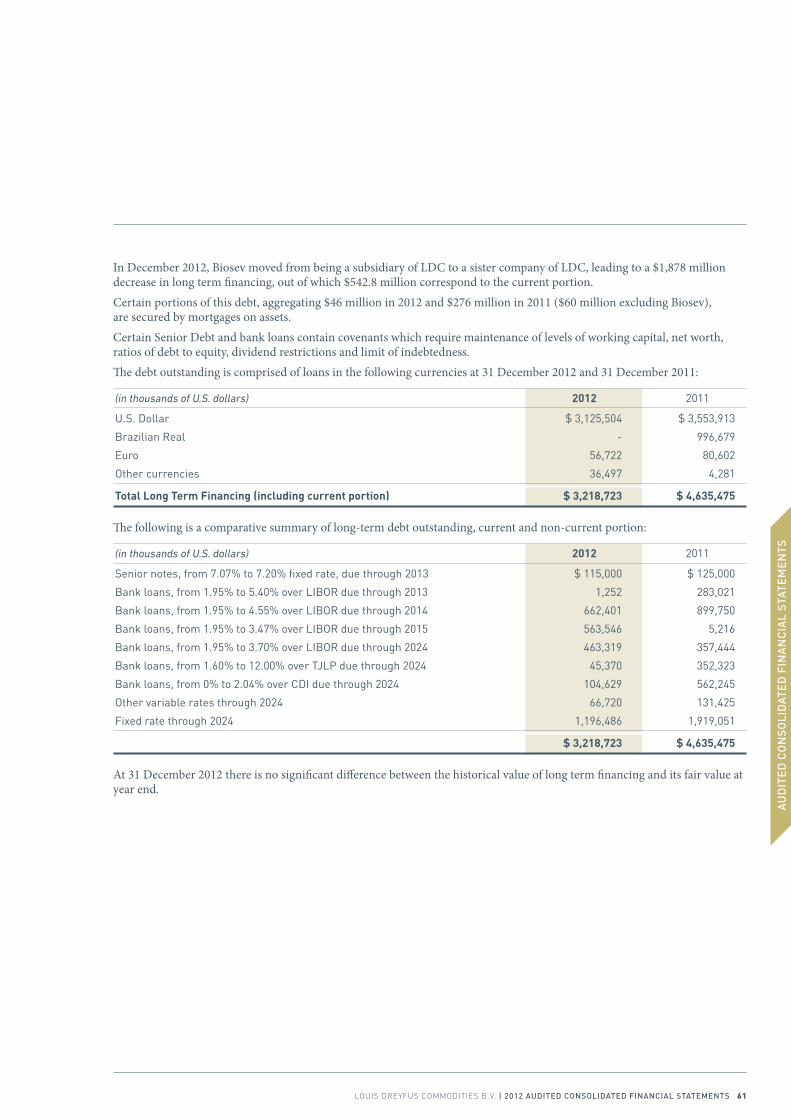
In December 2012, Biosev moved from being a subsidiary of LDC to a sister company of LDC, leading to a $1,878 million decrease in long term financing, out of which $542.8 million correspond to the current portion.Certain portions of this debt, aggregating $46 million in 2012 and $276 million in 2011 ($60 million excluding Biosev), are secured by mortgages on assets.Certain Senior Debt and bank loans contain covenants which require maintenance of levels of working capital, net worth, ratios of debt to equity, dividend restrictions and limit of indebtedness.The debt outstanding is comprised of loans in the following currencies at 31 December 2012 and 31 December 2011:
(in thousands of U.S. dollars) 2012 2011
U.S. Dollar $ 3,125,504 $ 3,553,913
Brazilian Real - 996,679
Euro 56,722 80,602
Other currencies 36,497 4,281
Total Long Term Financing (including current portion) $ 3,218,723 $ 4,635,475
The following is a comparative summary of long-term debt outstanding, current and non-current portion:
(in thousands of U.S. dollars) 2012 2011
Senior notes, from 7.07% to 7.20% fixed rate, due through 2013 $ 115,000 $ 125,000
Bank loans, from 1.95% to 5.40% over LIBOR due through 2013 1,252 283,021
Bank loans, from 1.95% to 4.55% over LIBOR due through 2014 662,401 899,750
Bank loans, from 1.95% to 3.47% over LIBOR due through 2015 563,546 5,216
Bank loans, from 1.95% to 3.70% over LIBOR due through 2024 463,319 357,444
Bank loans, from 1.60% to 12.00% over TJLP due through 2024 45,370 352,323
Bank loans, from 0% to 2.04% over CDI due through 2024 104,629 562,245
Other variable rates through 2024 66,720 131,425
Fixed rate through 2024 1,196,486 1,919,051
$ 3,218,723 $ 4,635,475
At 31 December 2012 there is no significant difference between the historical value of long term financing and its fair value at year end.
AU
DIT
ED
CO
NS
OLI
DAT
ED
FIN
AN
CIA
L S
TATE
ME
NTS
LOuIS.DREyFuS.COMMODITIES.B.V. | 2012 Audited ConsolidAted FinAnCiAl stAtements 61
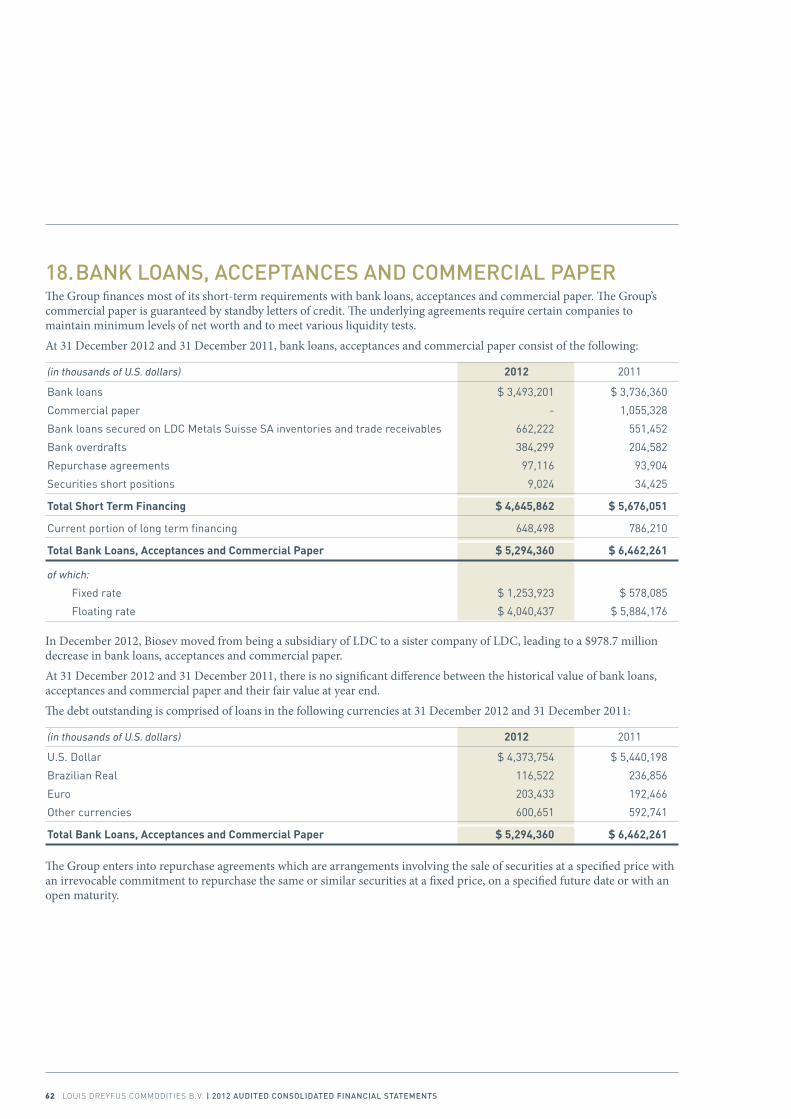
18. BAnK loAns, ACCePtAnCes And CommerCiAl PAPerThe Group finances most of its short-term requirements with bank loans, acceptances and commercial paper. The Group’s commercial paper is guaranteed by standby letters of credit. The underlying agreements require certain companies to maintain minimum levels of net worth and to meet various liquidity tests.At 31 December 2012 and 31 December 2011, bank loans, acceptances and commercial paper consist of the following:
(in thousands of U.S. dollars) 2012 2011
Bank loans $ 3,493,201 $ 3,736,360
Commercial paper - 1,055,328
Bank loans secured on LDC Metals Suisse SA inventories and trade receivables 662,222 551,452
Bank overdrafts 384,299 204,582
Repurchase agreements 97,116 93,904
Securities short positions 9,024 34,425
Total Short Term Financing $ 4,645,862 $ 5,676,051
Current portion of long term financing 648,498 786,210
Total Bank Loans, Acceptances and Commercial Paper $ 5,294,360 $ 6,462,261
of which:
Fixed rate $ 1,253,923 $ 578,085
Floating rate $ 4,040,437 $ 5,884,176
In December 2012, Biosev moved from being a subsidiary of LDC to a sister company of LDC, leading to a $978.7 million decrease in bank loans, acceptances and commercial paper.At 31 December 2012 and 31 December 2011, there is no significant difference between the historical value of bank loans, acceptances and commercial paper and their fair value at year end.The debt outstanding is comprised of loans in the following currencies at 31 December 2012 and 31 December 2011:
(in thousands of U.S. dollars) 2012 2011
U.S. Dollar $ 4,373,754 $ 5,440,198
Brazilian Real 116,522 236,856
Euro 203,433 192,466
Other currencies 600,651 592,741
Total Bank Loans, Acceptances and Commercial Paper $ 5,294,360 $ 6,462,261
The Group enters into repurchase agreements which are arrangements involving the sale of securities at a specified price with an irrevocable commitment to repurchase the same or similar securities at a fixed price, on a specified future date or with an open maturity.
62 LOuIS.DREyFuS.COMMODITIES.B.V. | 2012 Audited ConsolidAted FinAnCiAl stAtements

19. retirement BeneFit oBliGAtionsAt 31 December 2012 and 31 December 2011, retirement benefit obligations consist of the following:
(in thousands of U.S.dollars) 2012 2011
Long-term pension benefit $ 108,502 $ 5,245
Post-retirement benefit 27,342 14,669
Other long-term employee benefits 7,221 -
Retirement benefit obligations $ 143,065 $ 19,914
Current pension benefit2 $ 316 $ 336
Net plan asset1 $ (2,043) $ (1,749)
1. Included in “Trade and other receivables” in the balance sheet. 2. Included in “Accounts payable and accrued expenses”.
The Group maintains pension plans in various countries as prescribed by local laws and customs. The obligations of the Group to pay benefits upon retirement are provided for on an estimated annual basis. The estimates reflect assumptions as to future salary increases, employee turnover and mortality rates. The most significant retirement plans which require funding are in the United States.
2012 2011
(in thousands United United of U.S. dollars) States Canada Netherlands Other Total States Canada Netherlands Other Total
Long-term pension $ 103,050 $ - $ 2,048 $ 3,404 $ 108,502 $ 1,767 $ - $ - $ 3,478 $ 5,245 benefit
Post- retirement 23,122 4,220 - - 27,342 11,191 3,478 - - 14,669 benefit
Other long- term 7,221 - - - 7,221 - - - - - employee benefits
Retirement benefit $ 133,393 $ 4,220 $ 2,048 $ 3,404 $ 143,065 $ 12,958 $ 3,478 $ - $ 3,478 $ 19,914 obligations
Current pension - - - 316 316 - - - 336 336 benefit
Net plan $ - $ (2,043) $ - $ - $ (2,043) $ - $ (1,749) $ - $ - $ (1,749) asset
united stAtesThe Group has various defined benefit pension plans in the United States covering substantially all employees which provide benefits based on years of service and compensation during defined years of employment. The funding policy is to contribute amounts sufficient to meet the minimum funding requirements. The Group had also unfunded post-retirement plans in North America that covered substantially all salaried employees. These plans provided medical, dental and life insurance benefits.
AU
DIT
ED
CO
NS
OLI
DAT
ED
FIN
AN
CIA
L S
TATE
ME
NTS
LOuIS.DREyFuS.COMMODITIES.B.V. | 2012 Audited ConsolidAted FinAnCiAl stAtements 63
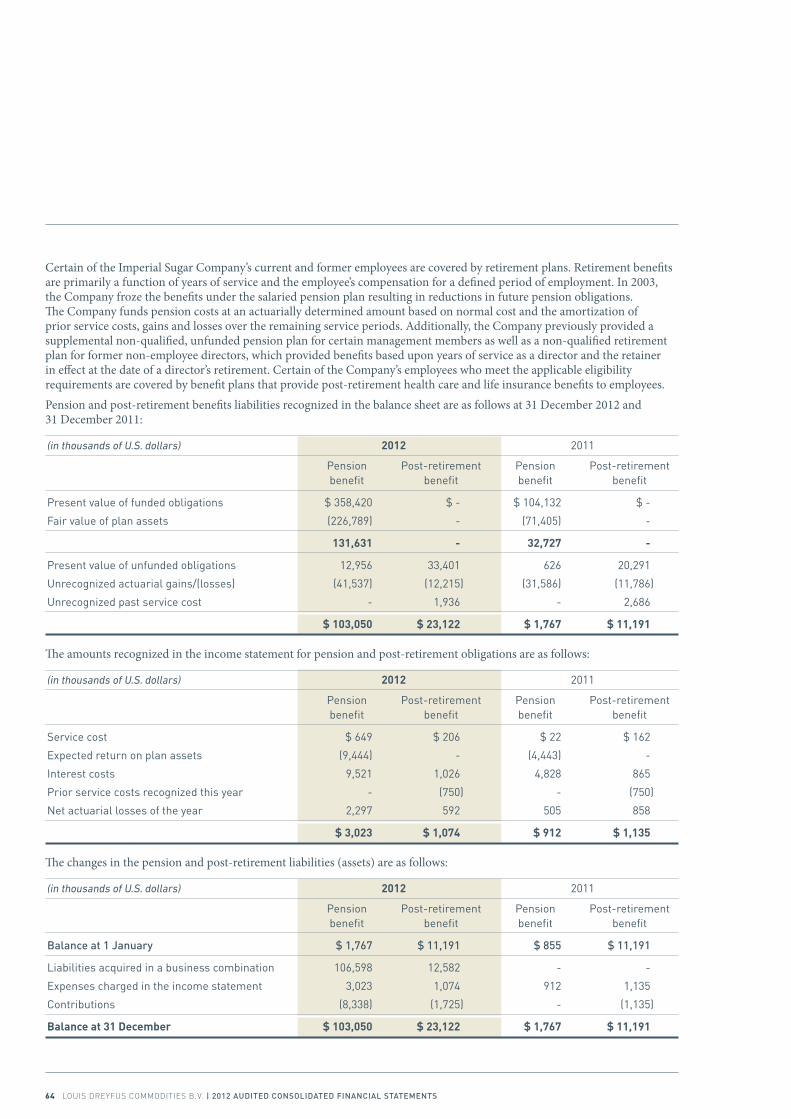
Certain of the Imperial Sugar Company’s current and former employees are covered by retirement plans. Retirement benefits are primarily a function of years of service and the employee’s compensation for a defined period of employment. In 2003, the Company froze the benefits under the salaried pension plan resulting in reductions in future pension obligations. The Company funds pension costs at an actuarially determined amount based on normal cost and the amortization of prior service costs, gains and losses over the remaining service periods. Additionally, the Company previously provided a supplemental non-qualified, unfunded pension plan for certain management members as well as a non-qualified retirement plan for former non-employee directors, which provided benefits based upon years of service as a director and the retainer in effect at the date of a director’s retirement. Certain of the Company’s employees who meet the applicable eligibility requirements are covered by benefit plans that provide post-retirement health care and life insurance benefits to employees.Pension and post-retirement benefits liabilities recognized in the balance sheet are as follows at 31 December 2012 and 31 December 2011:
(in thousands of U.S. dollars) 2012 2011
Pension Post-retirement Pension Post-retirement benefit benefit benefit benefit
Present value of funded obligations $ 358,420 $ - $ 104,132 $ -
Fair value of plan assets (226,789) - (71,405) -
131,631 - 32,727 -
Present value of unfunded obligations 12,956 33,401 626 20,291
Unrecognized actuarial gains/(losses) (41,537) (12,215) (31,586) (11,786)
Unrecognized past service cost - 1,936 - 2,686
$ 103,050 $ 23,122 $ 1,767 $ 11,191
The amounts recognized in the income statement for pension and post-retirement obligations are as follows:
(in thousands of U.S. dollars) 2012 2011
Pension Post-retirement Pension Post-retirement benefit benefit benefit benefit
Service cost $ 649 $ 206 $ 22 $ 162
Expected return on plan assets (9,444) - (4,443) -
Interest costs 9,521 1,026 4,828 865
Prior service costs recognized this year - (750) - (750)
Net actuarial losses of the year 2,297 592 505 858
$ 3,023 $ 1,074 $ 912 $ 1,135
The changes in the pension and post-retirement liabilities (assets) are as follows:
(in thousands of U.S. dollars) 2012 2011
Pension Post-retirement Pension Post-retirement benefit benefit benefit benefit
Balance at 1 January $ 1,767 $ 11,191 $ 855 $ 11,191
Liabilities acquired in a business combination 106,598 12,582 - -
Expenses charged in the income statement 3,023 1,074 912 1,135
Contributions (8,338) (1,725) - (1,135)
Balance at 31 December $ 103,050 $ 23,122 $ 1,767 $ 11,191
64 LOuIS.DREyFuS.COMMODITIES.B.V. | 2012 Audited ConsolidAted FinAnCiAl stAtements
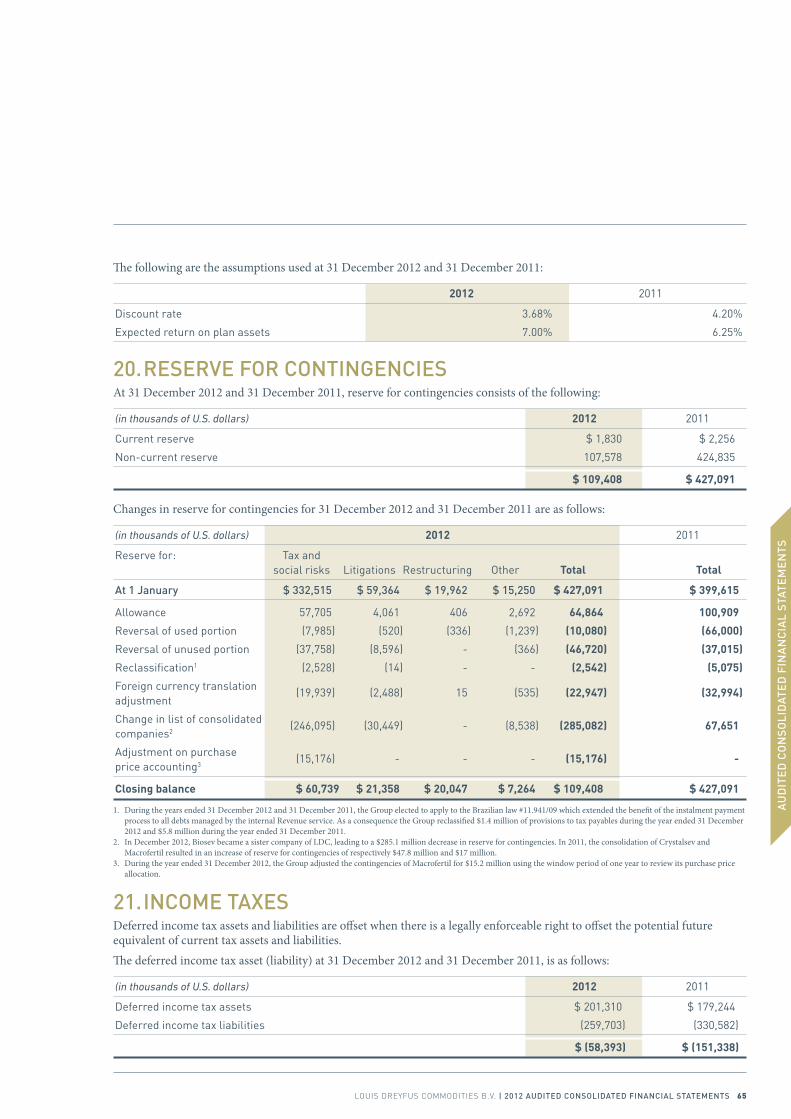
The following are the assumptions used at 31 December 2012 and 31 December 2011:
2012 2011
Discount rate 3.68% 4.20%
Expected return on plan assets 7.00% 6.25%
20. reserVe For ContinGenCiesAt 31 December 2012 and 31 December 2011, reserve for contingencies consists of the following:
(in thousands of U.S. dollars) 2012 2011
Current reserve $ 1,830 $ 2,256
Non-current reserve 107,578 424,835
$ 109,408 $ 427,091
Changes in reserve for contingencies for 31 December 2012 and 31 December 2011 are as follows:
(in thousands of U.S. dollars) 2012 2011
Reserve for: Tax and social risks Litigations Restructuring Other Total Total
At 1 January $ 332,515 $ 59,364 $ 19,962 $ 15,250 $ 427,091 $ 399,615
Allowance 57,705 4,061 406 2,692 64,864 100,909
Reversal of used portion (7,985) (520) (336) (1,239) (10,080) (66,000)
Reversal of unused portion (37,758) (8,596) - (366) (46,720) (37,015)
Reclassification1 (2,528) (14) - - (2,542) (5,075)
Foreign currency translation (19,939) (2,488) 15 (535) (22,947) (32,994) adjustment
Change in list of consolidated (246,095) (30,449) - (8,538) (285,082) 67,651 companies2
Adjustment on purchase (15,176) - - - (15,176) - price accounting3
Closing balance $ 60,739 $ 21,358 $ 20,047 $ 7,264 $ 109,408 $ 427,091
1. During the years ended 31 December 2012 and 31 December 2011, the Group elected to apply to the Brazilian law #11.941/09 which extended the benefit of the instalment payment process to all debts managed by the internal Revenue service. As a consequence the Group reclassified $1.4 million of provisions to tax payables during the year ended 31 December 2012 and $5.8 million during the year ended 31 December 2011.
2. In December 2012, Biosev became a sister company of LDC, leading to a $285.1 million decrease in reserve for contingencies. In 2011, the consolidation of Crystalsev and Macrofertil resulted in an increase of reserve for contingencies of respectively $47.8 million and $17 million.
3. During the year ended 31 December 2012, the Group adjusted the contingencies of Macrofertil for $15.2 million using the window period of one year to review its purchase price allocation.
21. inCome tAXesDeferred income tax assets and liabilities are offset when there is a legally enforceable right to offset the potential future equivalent of current tax assets and liabilities.The deferred income tax asset (liability) at 31 December 2012 and 31 December 2011, is as follows:
(in thousands of U.S. dollars) 2012 2011
Deferred income tax assets $ 201,310 $ 179,244
Deferred income tax liabilities (259,703) (330,582)
$ (58,393) $ (151,338)
AU
DIT
ED
CO
NS
OLI
DAT
ED
FIN
AN
CIA
L S
TATE
ME
NTS
LOuIS.DREyFuS.COMMODITIES.B.V. | 2012 Audited ConsolidAted FinAnCiAl stAtements 65

The consolidated net deferred income tax asset (liability) recorded at 31 December 2012 and 31 December 2011 arises from:
(in thousands of U.S. dollars) 2012 2011
Timing differences $ (124,795) $ (428,879)
Tax benefits from carry forward losses 163,191 451,765
Valuation allowance for deferred tax assets (96,789) (174,224)
$ (58,393) $ (151,338)
The 31 December 2012 valuation allowance is ascribed to available loss carry forwards for approximately $18 million against $95 million in 2011, and $20 million in 2011 excluding Biosev.Changes in net deferred income tax asset (liability) are as follows:
(in thousands of U.S. dollars) 2012 2011
net deferred tax asset (liability) at 1 January $ (151,338) $ (324,850)
Deferred taxes recognized in income – continuing operations (48,934) 29,155
Deferred taxes recognized in income – discontinued operations 86,308 136,361
Change in list of consolidated companies1 42,604 (72,477)
Deferred tax assets used in Brazilian law 11.941/09 - (2,003)
Deferred taxes recognized in equity (1,973) 55,485
Purchase price accounting adjustment (28) -
Exchange differences 14,968 26,991
Net deferred tax asset (liability) at closing date $ (58,393) $ (151,338)
1. In December 2012, Biosev moved from being a subsidiary of LDC to a sister company of LDC, leading to a $56.2 million increase in net deferred taxes.
The provision for income taxes differs from the computed “expected” income tax provision using the Netherlands statutory tax rate of 25% during the years ended 31 December 2012 and 31 December 2011 for the following reasons:
(in thousands of U.S. dollars) 2012 2011
theoretical tax on income from continuing operations $ 335,056 $ 283,032
Differences in income tax rates (76,412) (45,020)
Difference between local currency and functional currency 16,834 17,976
Change in valuation provision on tax assets and net operating losses (11,788) (2,896)
Permanent differences on investments (49,856) (5,917)
Other permanent differences 22,619 6,303
Reported tax expense $ 236,453 $ 253,478
66 LOuIS.DREyFuS.COMMODITIES.B.V. | 2012 Audited ConsolidAted FinAnCiAl stAtements
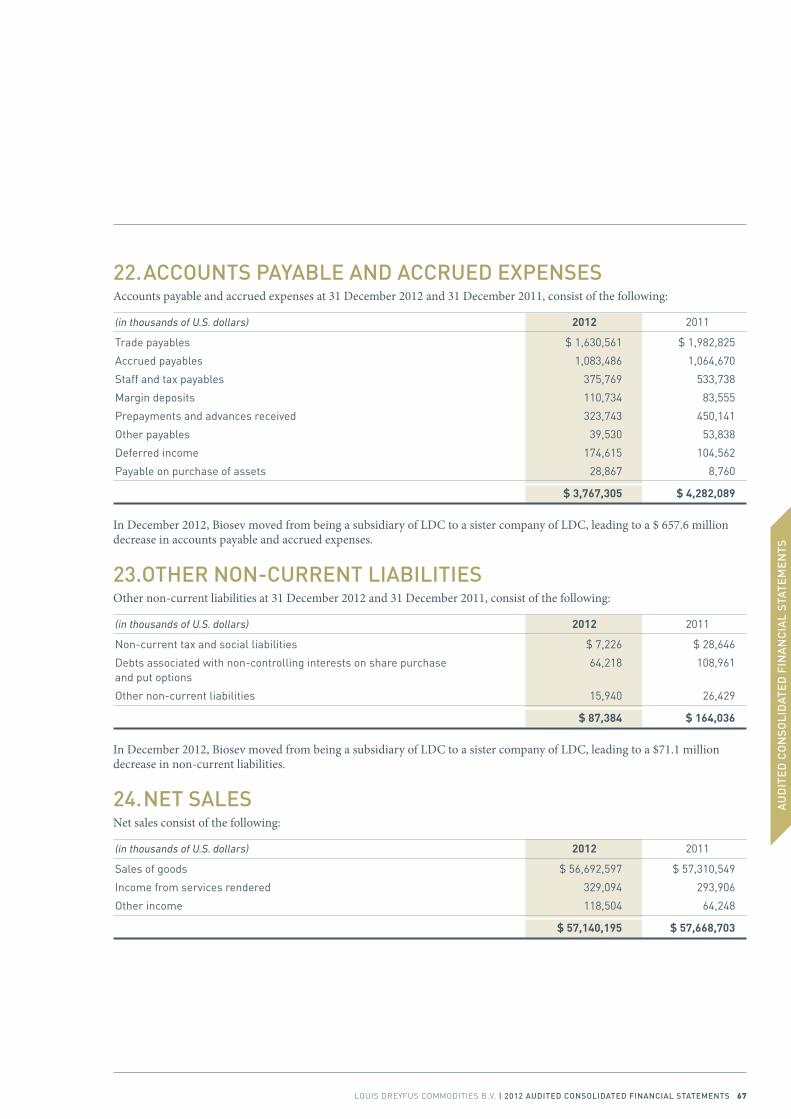
22. ACCounts PAYABle And ACCrued eXPensesAccounts payable and accrued expenses at 31 December 2012 and 31 December 2011, consist of the following:
(in thousands of U.S. dollars) 2012 2011
Trade payables $ 1,630,561 $ 1,982,825
Accrued payables 1,083,486 1,064,670
Staff and tax payables 375,769 533,738
Margin deposits 110,734 83,555
Prepayments and advances received 323,743 450,141
Other payables 39,530 53,838
Deferred income 174,615 104,562
Payable on purchase of assets 28,867 8,760
$ 3,767,305 $ 4,282,089
In December 2012, Biosev moved from being a subsidiary of LDC to a sister company of LDC, leading to a $ 657.6 million decrease in accounts payable and accrued expenses.
23.other non-Current liABilitiesOther non-current liabilities at 31 December 2012 and 31 December 2011, consist of the following:
(in thousands of U.S. dollars) 2012 2011
Non-current tax and social liabilities $ 7,226 $ 28,646
Debts associated with non-controlling interests on share purchase 64,218 108,961 and put options
Other non-current liabilities 15,940 26,429
$ 87,384 $ 164,036
In December 2012, Biosev moved from being a subsidiary of LDC to a sister company of LDC, leading to a $71.1 million decrease in non-current liabilities.
24. net sAlesNet sales consist of the following:
(in thousands of U.S. dollars) 2012 2011
Sales of goods $ 56,692,597 $ 57,310,549
Income from services rendered 329,094 293,906
Other income 118,504 64,248
$ 57,140,195 $ 57,668,703
AU
DIT
ED
CO
NS
OLI
DAT
ED
FIN
AN
CIA
L S
TATE
ME
NTS
LOuIS.DREyFuS.COMMODITIES.B.V. | 2012 Audited ConsolidAted FinAnCiAl stAtements 67
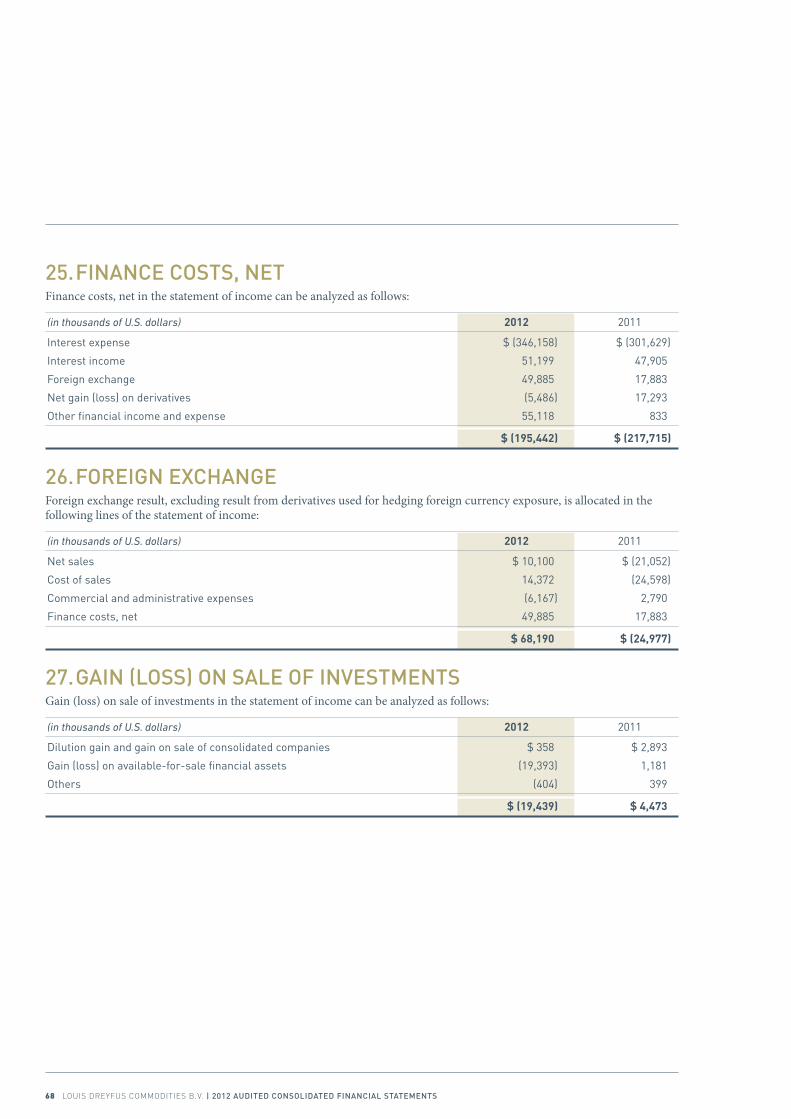
25. FinAnCe Costs, netFinance costs, net in the statement of income can be analyzed as follows:
(in thousands of U.S. dollars) 2012 2011
Interest expense $ (346,158) $ (301,629)
Interest income 51,199 47,905
Foreign exchange 49,885 17,883
Net gain (loss) on derivatives (5,486) 17,293
Other financial income and expense 55,118 833
$ (195,442) $ (217,715)
26. ForeiGn eXChAnGeForeign exchange result, excluding result from derivatives used for hedging foreign currency exposure, is allocated in the following lines of the statement of income:
(in thousands of U.S. dollars) 2012 2011
Net sales $ 10,100 $ (21,052)
Cost of sales 14,372 (24,598)
Commercial and administrative expenses (6,167) 2,790
Finance costs, net 49,885 17,883
$ 68,190 $ (24,977)
27. GAin (loss) on sAle oF inVestmentsGain (loss) on sale of investments in the statement of income can be analyzed as follows:
(in thousands of U.S. dollars) 2012 2011
Dilution gain and gain on sale of consolidated companies $ 358 $ 2,893
Gain (loss) on available-for-sale financial assets (19,393) 1,181
Others (404) 399
$ (19,439) $ 4,473
68 LOuIS.DREyFuS.COMMODITIES.B.V. | 2012 Audited ConsolidAted FinAnCiAl stAtements
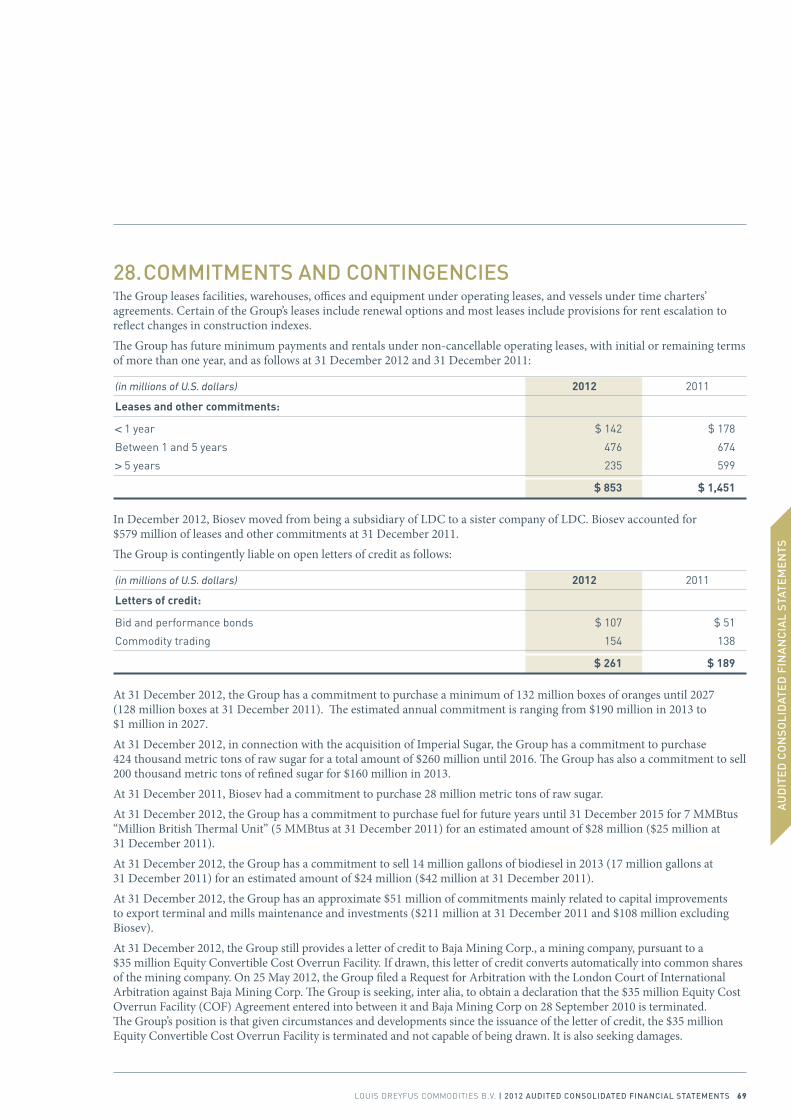
28. Commitments And ContinGenCiesThe Group leases facilities, warehouses, offices and equipment under operating leases, and vessels under time charters’ agreements. Certain of the Group’s leases include renewal options and most leases include provisions for rent escalation to reflect changes in construction indexes.The Group has future minimum payments and rentals under non-cancellable operating leases, with initial or remaining terms of more than one year, and as follows at 31 December 2012 and 31 December 2011:
(in millions of U.S. dollars) 2012 2011
Leases and other commitments:
< 1 year $ 142 $ 178
Between 1 and 5 years 476 674
> 5 years 235 599
$ 853 $ 1,451
In December 2012, Biosev moved from being a subsidiary of LDC to a sister company of LDC. Biosev accounted for $579 million of leases and other commitments at 31 December 2011.The Group is contingently liable on open letters of credit as follows:
(in millions of U.S. dollars) 2012 2011
Letters of credit:
Bid and performance bonds $ 107 $ 51
Commodity trading 154 138
$ 261 $ 189
At 31 December 2012, the Group has a commitment to purchase a minimum of 132 million boxes of oranges until 2027 (128 million boxes at 31 December 2011). The estimated annual commitment is ranging from $190 million in 2013 to $1 million in 2027. At 31 December 2012, in connection with the acquisition of Imperial Sugar, the Group has a commitment to purchase 424 thousand metric tons of raw sugar for a total amount of $260 million until 2016. The Group has also a commitment to sell 200 thousand metric tons of refined sugar for $160 million in 2013. At 31 December 2011, Biosev had a commitment to purchase 28 million metric tons of raw sugar.At 31 December 2012, the Group has a commitment to purchase fuel for future years until 31 December 2015 for 7 MMBtus “Million British Thermal Unit” (5 MMBtus at 31 December 2011) for an estimated amount of $28 million ($25 million at 31 December 2011).At 31 December 2012, the Group has a commitment to sell 14 million gallons of biodiesel in 2013 (17 million gallons at 31 December 2011) for an estimated amount of $24 million ($42 million at 31 December 2011).At 31 December 2012, the Group has an approximate $51 million of commitments mainly related to capital improvements to export terminal and mills maintenance and investments ($211 million at 31 December 2011 and $108 million excluding Biosev).At 31 December 2012, the Group still provides a letter of credit to Baja Mining Corp., a mining company, pursuant to a $35 million Equity Convertible Cost Overrun Facility. If drawn, this letter of credit converts automatically into common shares of the mining company. On 25 May 2012, the Group filed a Request for Arbitration with the London Court of International Arbitration against Baja Mining Corp. The Group is seeking, inter alia, to obtain a declaration that the $35 million Equity Cost Overrun Facility (COF) Agreement entered into between it and Baja Mining Corp on 28 September 2010 is terminated. The Group’s position is that given circumstances and developments since the issuance of the letter of credit, the $35 million Equity Convertible Cost Overrun Facility is terminated and not capable of being drawn. It is also seeking damages.
AU
DIT
ED
CO
NS
OLI
DAT
ED
FIN
AN
CIA
L S
TATE
ME
NTS
LOuIS.DREyFuS.COMMODITIES.B.V. | 2012 Audited ConsolidAted FinAnCiAl stAtements 69
At 31 December 2012, the Group also entered into off-take agreements for 70% of copper and cobalt that will be produced for a period of 10 years from the beginning of commercial production (or until defined amounts of copper (369,200 metric ton) / cobalt (10,780 metric ton) have been delivered if later). Price per metric ton will be based upon London Metal Exchange (“LME”) or Comex for Copper and on London Metal Bulletin (“LMB”) or LME for Cobalt.At 31 December 2012, the Group received $8 million of guarantees and collaterals ($5 million at 31 December 2011).At 31 December 2012, the Group has provided a $7 million loan facility to a mining and exploration company against an off-take agreement. This facility is secured with an irrevocable corporate guarantee from the Group, a pledge over 80% of the shares in the subsidiary which owns the mining assets and a pledge over the moveable assets including the mining fleet purchased.In addition, there are $363 million of other commitments at 31 December 2012 ($267 million at 31 December 2011), including $275 million guarantees at 31 December 2012 ($244 million at 31 December 2011).There are various claims and ongoing regulatory investigations asserted against and by the Group which, in the opinion of counsels, based on a review of the present stages of such claims in the aggregate, should not have a material effect on the Group’s financial position or future operating results.
29. shAre-BAsed PAYment In December 2006, the terms of a stock-based compensation arrangement referred to as the Equity Participation Plan (“EPP”), which is sponsored by LDCH became operational and the arrangement was fully implemented in December 2007 with the issuance of the first shares relating to the awards. The EPP provides for the granting of securities and options to purchase securities in LDCH (collectively “Awards”) to employees of the Group. EPP awards granted to employees of the Group generally vest on a graduated basis over a four year period. Additional awards have been granted to employees during each first semester starting in 2008, with the corresponding securities and options to purchase securities to be issued during the second semester of the same calendar year.The Group accounts for the EPP as an equity-settled plan: the fair value of the awards granted, determined at attribution date, is recorded in the statement of income ratably over the vesting period of the awards. The value of the awards granted is not revalued in subsequent periods.The Group and LDCH have entered into reimbursement agreements under which certain subsidiaries of the Group will reimburse LDCH for the awards attributed to their employees. Depending on the reimbursement agreement, the Group is liable for vested awards at attribution or fair value. Amounts due under these reimbursement agreements are recorded by the Group as a distribution of equity to LDCH. Accordingly, amounts payable under the reimbursement agreements give rise to a reclassification from equity to liabilities up to the amount of stock compensation already recorded. Any excess of the amounts due under the reimbursement agreements over the attribution value of the awards is recorded as an additional debit to retained earnings. Certain reimbursement agreements provide for a payment anticipating the accounting vesting schedule and give rise to a prepaid asset. The Group paid $109 million in 2012 ($98 million in 2011) to LDCH relating to reimbursement agreements, and recorded a prepaid asset of $23 million at 31 December 2012 ($37 million at 31 December 2011). Awards granted to employees during 2012 are of $110 million while awards forfeited by employees represent $5 million. During the 2012 transfer window period, LDCH purchased shares from employees corresponding to $132 million in attribution value bringing the attribution value of outstanding EPP awards granted to employees to $390 million. At 31 December 2011 the attribution value of outstanding EPP awards granted to employees was $417 million, of which $112 million correspond to awards granted in 2011, and $3 million to awards forfeited by employees. During the 2011 transfer window period, LDCH purchased shares from employees corresponding to $33 million in attribution value. At 31 December 2012, EPP awards fully vested represent $129 million and awards vesting ratably over periods ranging from 3 months to four years are of $261 million. At 31 December 2011, they were respectively of $180 million and $237 million vesting ratably over periods ranging from 3 months to four years.Compensation costs recognized in commercial and administrative expenses are of $100 million in 2012, and of $94 million in 2011. Unrecognized compensation costs expected to be recognized from 2013 to 2016 are of $110 million at 31 December 2012 and of $105 million at 31 December 2011.
70 LOuIS.DREyFuS.COMMODITIES.B.V. | 2012 Audited ConsolidAted FinAnCiAl stAtements
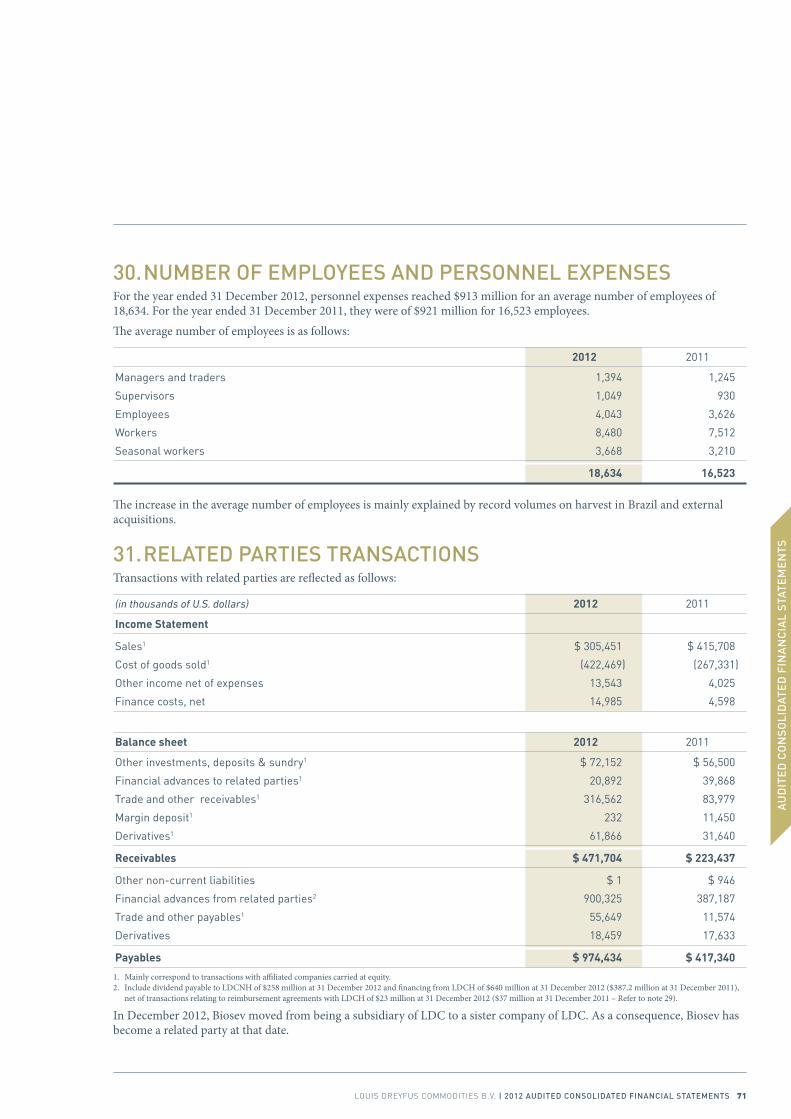
30. numBer oF emPloYees And Personnel eXPensesFor the year ended 31 December 2012, personnel expenses reached $913 million for an average number of employees of 18,634. For the year ended 31 December 2011, they were of $921 million for 16,523 employees.The average number of employees is as follows:
2012 2011
Managers and traders 1,394 1,245
Supervisors 1,049 930
Employees 4,043 3,626
Workers 8,480 7,512
Seasonal workers 3,668 3,210
18,634 16,523
The increase in the average number of employees is mainly explained by record volumes on harvest in Brazil and external acquisitions.
31. relAted PArties trAnsACtionsTransactions with related parties are reflected as follows:
(in thousands of U.S. dollars) 2012 2011
Income Statement
Sales1 $ 305,451 $ 415,708
Cost of goods sold1 (422,469) (267,331)
Other income net of expenses 13,543 4,025
Finance costs, net 14,985 4,598
Balance sheet 2012 2011
Other investments, deposits & sundry1 $ 72,152 $ 56,500
Financial advances to related parties1 20,892 39,868
Trade and other receivables1 316,562 83,979
Margin deposit1 232 11,450
Derivatives1 61,866 31,640
Receivables $ 471,704 $ 223,437
Other non-current liabilities $ 1 $ 946
Financial advances from related parties2 900,325 387,187
Trade and other payables1 55,649 11,574
Derivatives 18,459 17,633
Payables $ 974,434 $ 417,340
1. Mainly correspond to transactions with affiliated companies carried at equity.2. Include dividend payable to LDCNH of $258 million at 31 December 2012 and financing from LDCH of $640 million at 31 December 2012 ($387.2 million at 31 December 2011),
net of transactions relating to reimbursement agreements with LDCH of $23 million at 31 December 2012 ($37 million at 31 December 2011 – Refer to note 29).
In December 2012, Biosev moved from being a subsidiary of LDC to a sister company of LDC. As a consequence, Biosev has become a related party at that date.
AU
DIT
ED
CO
NS
OLI
DAT
ED
FIN
AN
CIA
L S
TATE
ME
NTS
LOuIS.DREyFuS.COMMODITIES.B.V. | 2012 Audited ConsolidAted FinAnCiAl stAtements 71
32. suBseQuent eVentsIn January 2013, the Group signed an agreement to establish a joint venture with Namoi Cotton Ltd, an Australian company, whereby the Group will acquire a non-controlling stake (49%) in the cotton marketing and commodities packing assets for $32 million. The implementation of the joint venture is subject to a number of closing conditions.On 31 January 2013, the Group acquired a minority stake (1.13%) for $30 million in Chinalco Mining Corporation International (CMC), subsequent to their successful listing of CMC on the Hong Kong Stock Exchange. CMC is owned by Chinalco, a leading metals and mining conglomerate based in China, and acts as Chinalco’s platform for the acquisition, investment, development and operation of non-ferrous and non-aluminum mineral resources and projects overseas. CMC is currently focusing on developing the “Toromocho” Project which is located in central Peru in the core of the Morococha Mining district. The transaction involves both a strategic cornerstone investment in the Initial Public Offering and an off-take agreement pursuant to which the Group will buy a share of the annual production of copper concentrates of the Toromocho Project for a period of five years.On 28 February 2013, the Group acquired a frozen juice packaging plant and related inventories in Toronto, Canada for $7.1 million. The acquisition complements the Group’s retail strategy in North America by providing access to the Canadian market.
72 LOuIS.DREyFuS.COMMODITIES.B.V. | 2012 Audited ConsolidAted FinAnCiAl stAtements

33. list oF mAin suBsidiAriesThe main subsidiaries of LDC that are consolidated at 31 December 2012 and 31 December 2011 are the following:
2012 2011
% of % of % of % of Company control ownership control ownership
LDC Argentina S.A. (Argentina) 100.00 100.00 100.00 100.00 LD Commodities Australia Holdings Pty. Ltd. (Australia) 100.00 100.00 100.00 100.00 Louis Dreyfus Commodities Australia Pty. Ltd. (Australia) 100.00 100.00 100.00 100.00 Biosev Bioenergia S.A. (Brazil) * - - 91.15 55.89 Biosev S.A. (Brazil) * - - 57.82 55.89 Biosev Terminais Portuários e Participações, Ltda. (Brazil) * - - 100.00 55.89 Coinbra Frutesp S.A. (Brazil) 100.00 100.00 100.00 100.00 Crystalsev Comercio E Representãçao, Ltda. (Brazil) - - 90.45 50.55 Fertibrasil Logistica E Fertilizantes, Ltda. (Brazil) 100.00 100.00 100.00 100.00 Louis Dreyfus Commodities Agroindustrial S.A. (Brazil) 100.00 100.00 100.00 100.00 Louis Dreyfus Commodities Brasil S.A. (Brazil) 100.00 100.00 100.00 100.00 Macrofertil Industria E Comercio De Fertilizantes, Ltda. (Brazil) 100.00 100.00 100.00 100.00 Sociedade Operadora Portuario de São Paulo, Ltda. (Brazil) - - 100.00 51.35 Louis Dreyfus Commodities Bulgaria Eood. (Bulgaria) 100.00 100.00 100.00 100.00 LDM Yorkton Trading LP (Canada) 60.00 60.00 60.00 60.00 Louis Dreyfus Canada Ltd. (Canada) 100.00 100.00 100.00 100.00 Louis Dreyfus Commodities (Bazhou) Feedstuff Protein Co. Ltd. (China) 100.00 100.00 100.00 100.00 Louis Dreyfus Commodities (Beijing) Trading Company Ltd. (China) 100.00 100.00 100.00 100.00 Louis Dreyfus Commodities (Fujian) Refined Sugar Co. Ltd. (China) 67.00 67.00 67.00 67.00 Shaanxi Sanchuan Juice Co. Ltd. (China) 100.00 100.00 75.00 75.00 Louis Dreyfus Commodities Colombia, Ltda. (Colombia) 100.00 100.00 100.00 100.00Louis Dreyfus Citrus S.A.S. (France) 100.00 100.00 100.00 100.00 Louis Dreyfus Commodities Distribution France S.A.S. (France) 100.00 100.00 100.00 100.00 Louis Dreyfus Commodities France S.A.S. (France) 100.00 100.00 100.00 100.00 Louis Dreyfus Commodities Services S.A.S. (France) 100.00 100.00 - - Louis Dreyfus Commodities Silos S.A.S. (France) 61.12 100.00 61.12 100.00 SCPA Sivex International S.A.S. (France) 100.00 100.00 100.00 100.00 Louis Dreyfus Commodities Wittenberg GmbH (Germany) 100.00 100.00 100.00 100.00 Louis Dreyfus Commodities India PVT Ltd. (India) 100.00 100.00 100.00 100.00 PT. Louis Dreyfus Commodities Indonesia PLC (Indonesia) 100.00 100.00 100.00 100.00 Louis Dreyfus Commodities Italia S.P.A. (Italy) 100.00 100.00 100.00 100.00 Gulf Stream Investments Ltd. (Kenya) 100.00 99.33 100.00 99.33 Louis Dreyfus Commodities Kenya Ltd. (Kenya) 99.33 99.33 99.33 99.33 Comercializadora Profesional Mexicana S.A. (Mexico) 100.00 100.00 100.00 100.00 Ecoval Holding B.V. (Netherlands) 100.00 100.00 - - Louis Dreyfus Commodities Metals B.V. (Netherlands) 100.00 100.00 100.00 100.00 Louis Dreyfus Commodities Participations B.V. (Netherlands) 100.00 100.00 100.00 100.00 Nethgrain B.V. (Netherlands) 100.00 100.00 100.00 100.00 Coinbra International Trading N.V. (Netherlands Antilles) 100.00 100.00 100.00 100.00 LDC Paraguay S.A. (Paraguay) 100.00 100.00 100.00 100.00 Louis Dreyfus Commodities Peru S.R.L (Peru) 100.00 100.00 100.00 100.00 Louis Dreyfus Commodities Polska SP. z.o.o. (Poland) 100.00 100.00 100.00 100.00 Louis Dreyfus Commodities Portugal Lda (Portugal) 100.00 100.00 100.00 100.00 Louis Dreyfus Commodities Vostok LLC (Russian Federation) 100.00 100.00 100.00 100.00 GKE Metal Logistics Pte Ltd (Singapore) 51.00 51.00 - -
AU
DIT
ED
CO
NS
OLI
DAT
ED
FIN
AN
CIA
L S
TATE
ME
NTS
LOuIS.DREyFuS.COMMODITIES.B.V. | 2012 Audited ConsolidAted FinAnCiAl stAtements 73
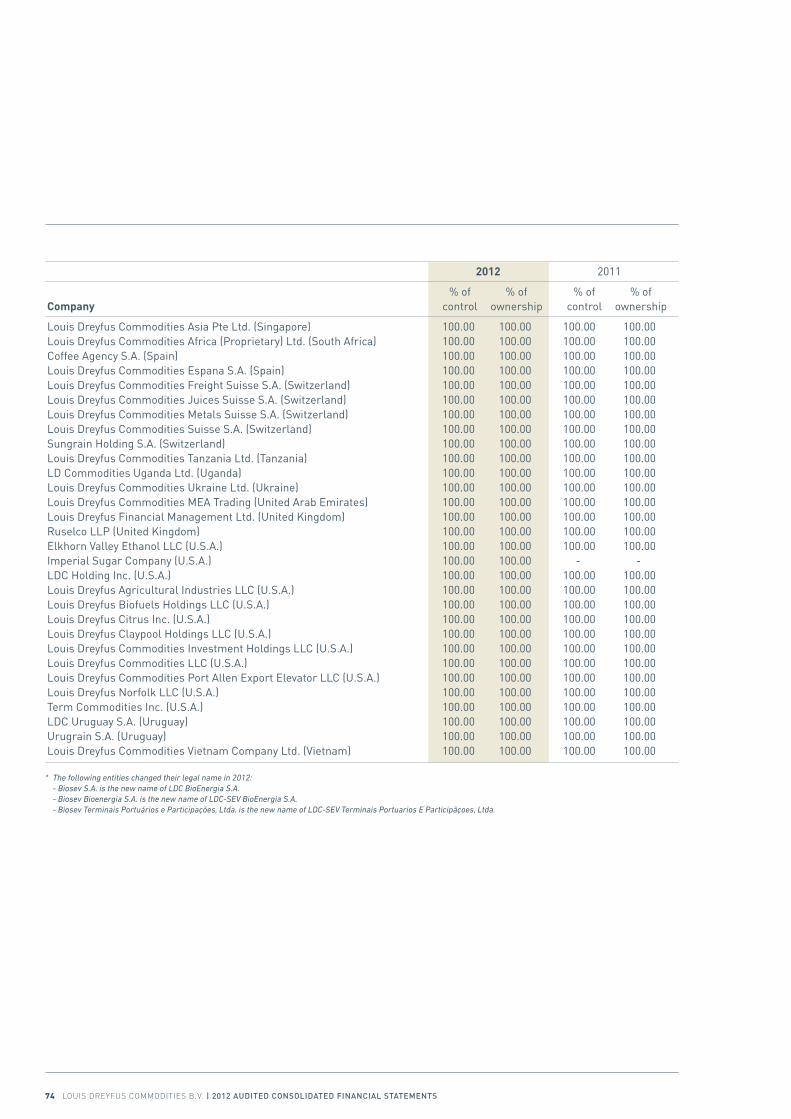
2012 2011
% of % of % of % of Company control ownership control ownership
Louis Dreyfus Commodities Asia Pte Ltd. (Singapore) 100.00 100.00 100.00 100.00 Louis Dreyfus Commodities Africa (Proprietary) Ltd. (South Africa) 100.00 100.00 100.00 100.00 Coffee Agency S.A. (Spain) 100.00 100.00 100.00 100.00 Louis Dreyfus Commodities Espana S.A. (Spain) 100.00 100.00 100.00 100.00 Louis Dreyfus Commodities Freight Suisse S.A. (Switzerland) 100.00 100.00 100.00 100.00 Louis Dreyfus Commodities Juices Suisse S.A. (Switzerland) 100.00 100.00 100.00 100.00 Louis Dreyfus Commodities Metals Suisse S.A. (Switzerland) 100.00 100.00 100.00 100.00 Louis Dreyfus Commodities Suisse S.A. (Switzerland) 100.00 100.00 100.00 100.00 Sungrain Holding S.A. (Switzerland) 100.00 100.00 100.00 100.00 Louis Dreyfus Commodities Tanzania Ltd. (Tanzania) 100.00 100.00 100.00 100.00 LD Commodities Uganda Ltd. (Uganda) 100.00 100.00 100.00 100.00 Louis Dreyfus Commodities Ukraine Ltd. (Ukraine) 100.00 100.00 100.00 100.00 Louis Dreyfus Commodities MEA Trading (United Arab Emirates) 100.00 100.00 100.00 100.00 Louis Dreyfus Financial Management Ltd. (United Kingdom) 100.00 100.00 100.00 100.00 Ruselco LLP (United Kingdom) 100.00 100.00 100.00 100.00 Elkhorn Valley Ethanol LLC (U.S.A.) 100.00 100.00 100.00 100.00 Imperial Sugar Company (U.S.A.) 100.00 100.00 - - LDC Holding Inc. (U.S.A.) 100.00 100.00 100.00 100.00 Louis Dreyfus Agricultural Industries LLC (U.S.A.) 100.00 100.00 100.00 100.00 Louis Dreyfus Biofuels Holdings LLC (U.S.A.) 100.00 100.00 100.00 100.00 Louis Dreyfus Citrus Inc. (U.S.A.) 100.00 100.00 100.00 100.00 Louis Dreyfus Claypool Holdings LLC (U.S.A.) 100.00 100.00 100.00 100.00 Louis Dreyfus Commodities Investment Holdings LLC (U.S.A.) 100.00 100.00 100.00 100.00 Louis Dreyfus Commodities LLC (U.S.A.) 100.00 100.00 100.00 100.00 Louis Dreyfus Commodities Port Allen Export Elevator LLC (U.S.A.) 100.00 100.00 100.00 100.00 Louis Dreyfus Norfolk LLC (U.S.A.) 100.00 100.00 100.00 100.00 Term Commodities Inc. (U.S.A.) 100.00 100.00 100.00 100.00 LDC Uruguay S.A. (Uruguay) 100.00 100.00 100.00 100.00 Urugrain S.A. (Uruguay) 100.00 100.00 100.00 100.00 Louis Dreyfus Commodities Vietnam Company Ltd. (Vietnam) 100.00 100.00 100.00 100.00
* The following entities changed their legal name in 2012: - Biosev S.A. is the new name of LDC BioEnergia S.A. - Biosev Bioenergia S.A. is the new name of LDC-SEV BioEnergia S.A. - Biosev Terminais Portuários e Participações, Ltda. is the new name of LDC-SEV Terminais Portuarios E Participãçoes, Ltda.
74 LOuIS.DREyFuS.COMMODITIES.B.V. | 2012 Audited ConsolidAted FinAnCiAl stAtements
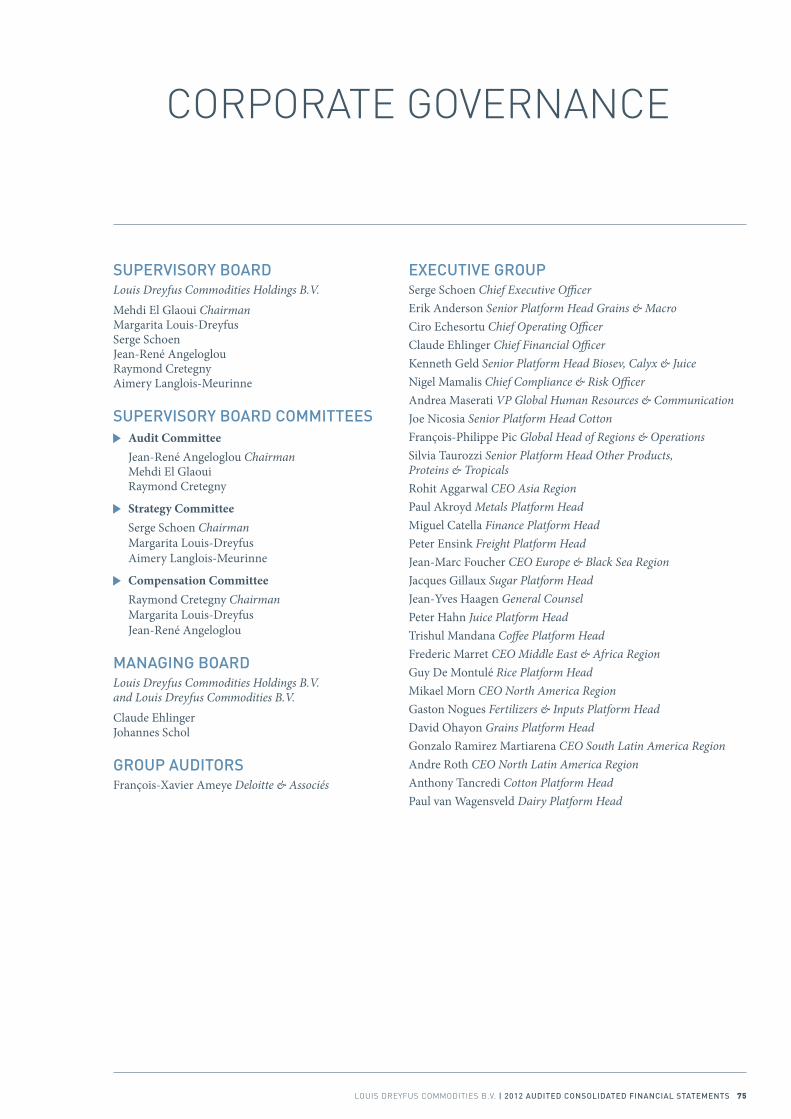
CORPORATE.GOVERNANCE
eXeCutiVe GrouPSerge Schoen Chief Executive OfficerErik Anderson Senior Platform Head Grains & MacroCiro Echesortu Chief Operating OfficerClaude Ehlinger Chief Financial OfficerKenneth Geld Senior Platform Head Biosev, Calyx & JuiceNigel Mamalis Chief Compliance & Risk OfficerAndrea Maserati VP Global Human Resources & CommunicationJoe Nicosia Senior Platform Head CottonFrançois-Philippe Pic Global Head of Regions & OperationsSilvia Taurozzi Senior Platform Head Other Products, Proteins & TropicalsRohit Aggarwal CEO Asia RegionPaul Akroyd Metals Platform HeadMiguel Catella Finance Platform HeadPeter Ensink Freight Platform HeadJean-Marc Foucher CEO Europe & Black Sea RegionJacques Gillaux Sugar Platform HeadJean-Yves Haagen General CounselPeter Hahn Juice Platform HeadTrishul Mandana Coffee Platform HeadFrederic Marret CEO Middle East & Africa RegionGuy De Montulé Rice Platform HeadMikael Morn CEO North America RegionGaston Nogues Fertilizers & Inputs Platform HeadDavid Ohayon Grains Platform HeadGonzalo Ramirez Martiarena CEO South Latin America RegionAndre Roth CEO North Latin America RegionAnthony Tancredi Cotton Platform HeadPaul van Wagensveld Dairy Platform Head
suPerVisorY BoArdLouis Dreyfus Commodities Holdings B.V.Mehdi El Glaoui Chairman Margarita Louis-Dreyfus Serge Schoen Jean-René Angeloglou Raymond Cretegny Aimery Langlois-Meurinne
suPerVisorY BoArd Committees Audit Committee
Jean-René Angeloglou Chairman Mehdi El Glaoui Raymond Cretegny
Strategy Committee Serge Schoen Chairman
Margarita Louis-Dreyfus Aimery Langlois-Meurinne
Compensation Committee Raymond Cretegny Chairman
Margarita Louis-Dreyfus Jean-René Angeloglou
mAnAGinG BoArdLouis Dreyfus Commodities Holdings B.V. and Louis Dreyfus Commodities B.V.Claude Ehlinger Johannes Schol
GrouP AuditorsFrançois-Xavier Ameye Deloitte & Associés
LOuIS.DREyFuS.COMMODITIES.B.V. | 2012 Audited ConsolidAted FinAnCiAl stAtements 75
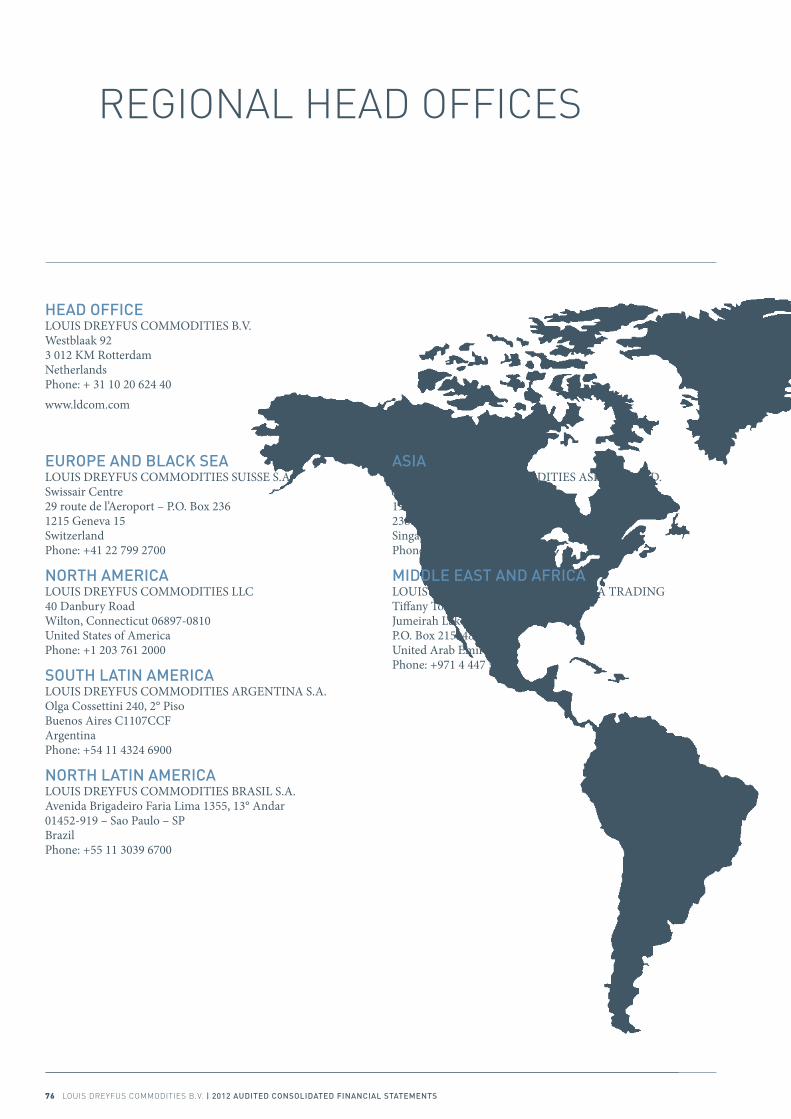
REGIONAL.HEAD.OFFICES
heAd oFFiCeLOUIS DREYFUS COMMODITIES B.V. Westblaak 92 3 012 KM Rotterdam Netherlands Phone: + 31 10 20 624 40www.ldcom.com
euroPe And BlACK seALOUIS DREYFUS COMMODITIES SUISSE S.A. Swissair Centre 29 route de l’Aeroport – P.O. Box 236 1215 Geneva 15 Switzerland Phone: +41 22 799 2700
north AmeriCALOUIS DREYFUS COMMODITIES LLC 40 Danbury Road Wilton, Connecticut 06897-0810 United States of America Phone: +1 203 761 2000
south lAtin AmeriCALOUIS DREYFUS COMMODITIES ARGENTINA S.A. Olga Cossettini 240, 2° Piso Buenos Aires C1107CCF Argentina Phone: +54 11 4324 6900
north lAtin AmeriCALOUIS DREYFUS COMMODITIES BRASIL S.A. Avenida Brigadeiro Faria Lima 1355, 13° Andar 01452-919 – Sao Paulo – SP Brazil Phone: +55 11 3039 6700
AsiALOUIS DREYFUS COMMODITIES ASIA PTE. LTD. 501 Orchard Road 19-01 Wheelock Place 238880 – Singapore Singapore Phone: +65 6735 9700
middle eAst And AFriCALOUIS DREYFUS COMMODITIES MEA TRADING Tiffany Towers 3801, Level 38 Jumeirah Lake Towers P.O. Box 215148 – Dubai United Arab Emirates Phone: +971 4 447 5737
76 LOuIS.DREyFuS.COMMODITIES.B.V. | 2012 Audited ConsolidAted FinAnCiAl stAtements
Design and production by reluctantly Brave (London, UK) All photos Copyright © Louis Dreyfus Commodities unless otherwise indicated. All rights reserved.
Credit for photography that illustrates this report: Photographers: David Hundley / Oliver O’Hanlon / Vicki Stanwycks / © Mark Wilson ©Dreamstime.com / Okea ©Shutterstock.com / Copit / Marcelo Dufflocq W. / Fotogiunta / Inacio Pires / ragnarock
Unless otherwise indicated, “Louis Dreyfus Commodities”, “ Group”, “LDC” and related terms such as “our”, “we”, etc., mean the Louis Dreyfus Commodities B.V. Group as at 31 December 2012, i.e. excluding the Biosev Group which was indirectly upstreamed to Louis Dreyfus Commodities Holdings B.V. on 4 December 2012.

AUDITED CONSOLIDATED FINANCIAL STATEMENTS
2012
Lo
uis
Dr
ey
fu
s C
om
mo
Dit
ies
B.V
. /
A
uD
ite
D C
on
so
LiD
At
eD
fin
An
CiA
L s
tA
te
me
nt
s
20
12
LOUIS DrEyFUS COMMODITIES B.V.Westblaak 923012 KM rotterdamNetherlands
www.ldcom.com