Consolidated Financial Statements - Ferrovial
113
Consolidated Financial Statements
-
Upload
khangminh22 -
Category
Documents
-
view
0 -
download
0
Transcript of Consolidated Financial Statements - Ferrovial

ConsolidatedFinancial Statements
195
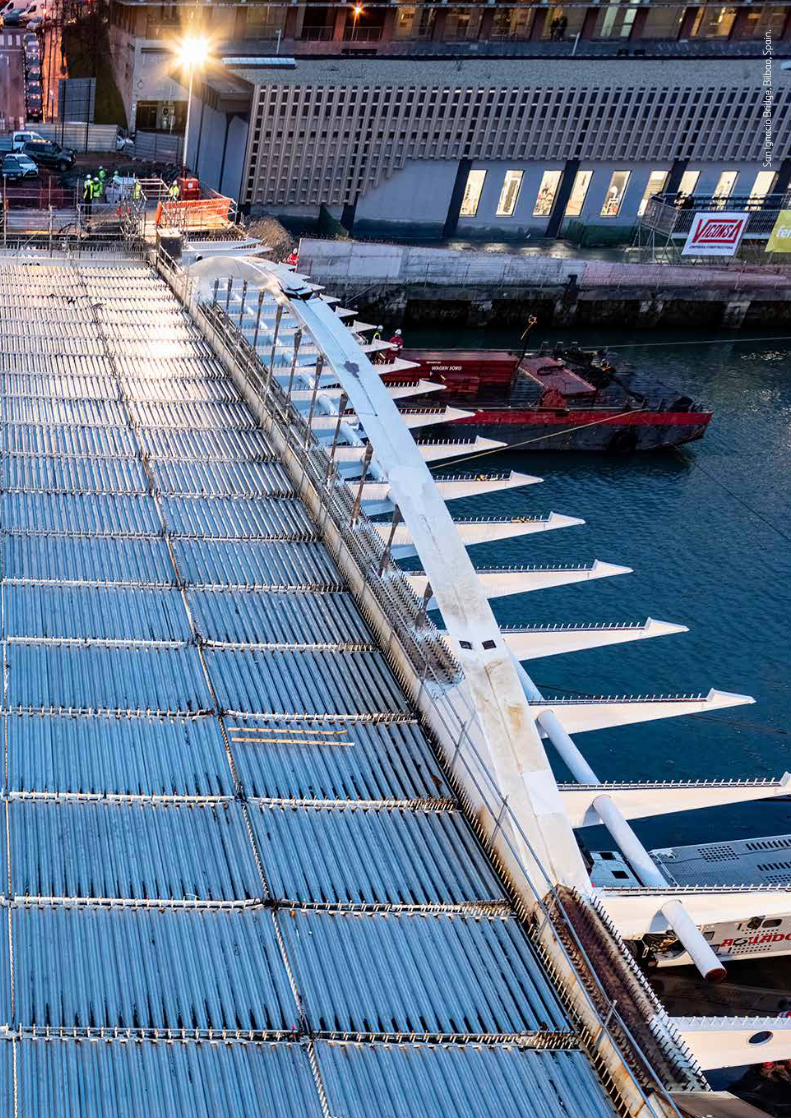
San
Igna
cio B
ridge
, Bilb
ao, S
pain
.

Nort
h Ta
rrant
Exp
ress
Toll
Road
, Tex
as, U
nite
d St
ates
.

CONTENTS
A CONSOLIDATED STATEMENT OF FINANCIAL POSITION FOR 2021 AND 2020 198
B CONSOLIDATED INCOME STATEMENT FOR 2021 AND 2020 199
C CONSOLIDATED STATEMENT OF COMPREHENSIVE INCOME FOR 2021 AND 2020 200
D CONSOLIDATED STATEMENT OF CHANGES IN EQUITY FOR 2021 AND 2020 201
E CONSOLIDATED CASH FLOW STATEMENT FOR 2021 AND 2020 202
F NOTES TO THE CONSOLIDATED ANNUAL ACCOUNTS FOR 2021 203
______
SECTION 1: BASIS OF PRESENTATION AND CONSOLIDATION SCOPE 203
1.1. BASIS OF PRESENTATION, COMPANY ACTIVITIES AND CONSOLIDATION SCOPE 204
1.2. IMPACT OF COVID-19 210
1.3. ACCOUNTING POLICIES 212
1.4. EXCHANGE RATE 220
1.5. INFORMATION BY SEGMENT 220
SECTION 2: PROFIT/(LOSS) FOR THE YEAR 221
2.1. OPERATING INCOME 222
2.2. OTHER OPERATING EXPENSES 222
2.3. STAFF COSTS 222
2.4. EBITDA AND EBIT BEFORE IMPAIRMENTS AND DISPOSALS 223
2.5. IMPAIRMENT AND DISPOSALS 223
2.6. NET FINANCIAL INCOME/(EXPENSE) 224
2.7. SHARE OF PROFITS OF EQUITY-ACCOUNTED COMPANIES 225
2.8. CORPORATE INCOME TAX AND DEFERRED TAXES 225
2.9. PROFIT/(LOSS) FROM DISCONTINUED OPERATIONS 229
2.10. PROFIT/(LOSS) FROM NON-CONTROLLING INTERESTS 230
2.11. NET PROFIT/(LOSS) AND EARNINGS PER SHARE 211
SECTION 3: NON-CURRENT ASSETS 231
3.1. GOODWILL AND ACQUISITIONS 232
3.2. INTANGIBLE ASSETS 232
3.3. INVESTMENTS IN INFRASTRUCTURE PROJECTS 233
3.4. PROPERTY, PLANT AND EQUIPMENT 234
3.5. INVESTMENTS IN ASSOCIATES 235
3.6. NON-CURRENT FINANCIAL ASSETS 239
3.7. RIGHTS OF USE OF LEASED ASSETS AND ASSOCIATED LIABILITIES 240
SECTION 4: WORKING CAPITAL 241
4.1. INVENTORIES 242
4.2. SHORT-TERM TRADE AND OTHER RECEIVABLES 242
4.3. SHORT-TERM TRADE AND OTHER PAYABLES 242
4.4. INFORMATION ON BALANCES FROM CONTRACTS WITH CUSTOMERS AND OTHER DISCLOSURES RELATING TO IFRS 15 243
SECTION 5: CAPITAL STRUCTURE AND FINANCING 245
5.1. EQUITY 246
5.2. NET CONSOLIDATED DEBT 249
5.3. CASH FLOW 256
5.4. MANAGEMENT OF FINANCIAL RISKS AND CAPITAL 258
2505.5. FINANCIAL DERIVATIVES AT FAIR VALUE 260
SECTION 6: OTHER DISCLOSURES 265
6.1. DEFERRED INCOME 265
6.2. PENSION PLAN DEFICIT 265
6.3. PROVISIONS 265
6.4. OTHER LONG-TERM PAYABLES 267
6.5. CONTINGENT LIABILITIES, CONTINGENT ASSETS, OBLIGATIONS AND COMMITMENTS 267
6.6. REMUNERATION OF THE BOARD OF DIRECTORS AND SENIOR EXECUTIVES 272
6.7. SHARE-BASED REMUNERATION SCHEMES 274
6.8. RELATED-PARTY TRANSACTIONS 274
6.9. CONFLICTS OF INTEREST 276
6.10. AUDIT FEES 276
6.11. EVENTS AFTER THE REPORTING DATE 276
6.12. APPENDICES 276
SECTION 7: EXPLANATION ADDED FOR TRANSLATION TO ENGLISH 295
198
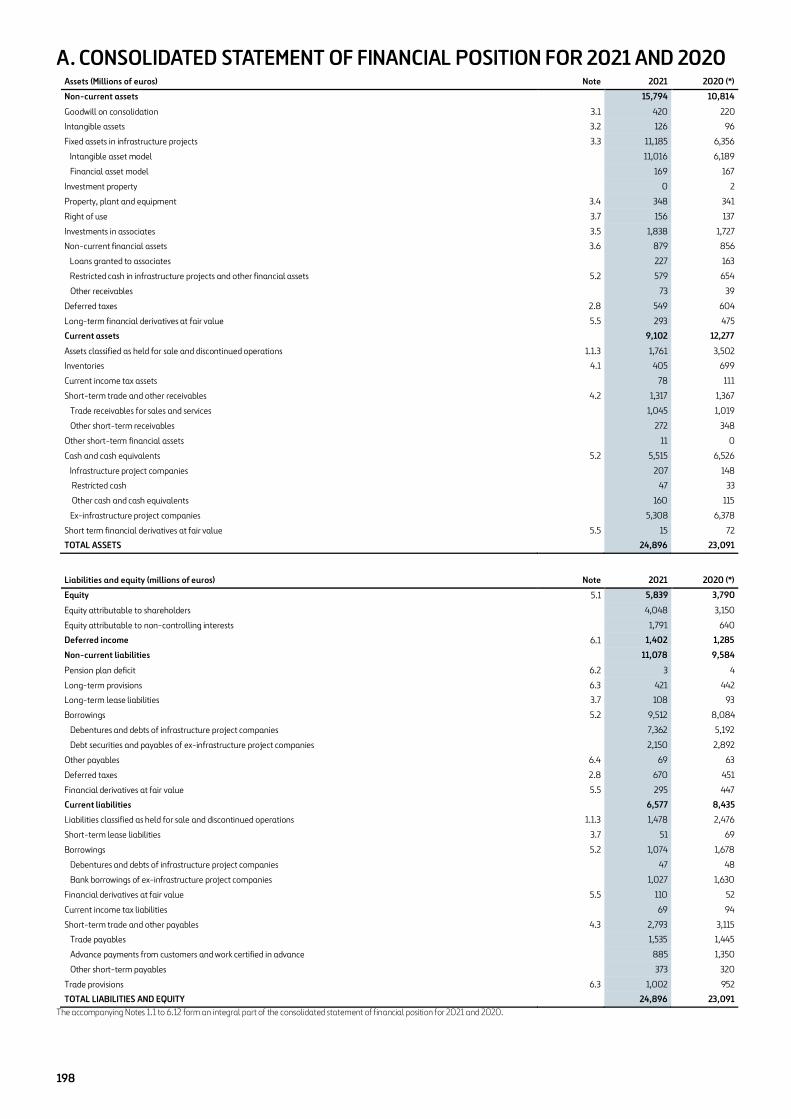
A. CONSOLIDATED STATEMENT OF FINANCIAL POSITION FOR 2021 AND 2020
The accompanying Notes 1.1 to 6.12 form an integral part of the consolidated statement of financial position for 2021 and 2020.
Assets (Millions of euros) Note 2021 2020 (*)
Non-current assets
15,794 10,814
Goodwill on consolidation 3.1 420 220
Intangible assets 3.2 126 96
Fixed assets in infrastructure projects 3.3 11,185 6,356
Intangible asset model
11,016 6,189
Financial asset model
169 167
Investment property
0 2
Property, plant and equipment 3.4 348 341
Right of use 3.7 156 137
Investments in associates 3.5 1,838 1,727
Non-current financial assets 3.6 879 856
Loans granted to associates
227 163
Restricted cash in infrastructure projects and other financial assets 5.2 579 654
Other receivables
73 39
Deferred taxes 2.8 549 604
Long-term financial derivatives at fair value 5.5 293 475
Current assets
9,102 12,277
Assets classified as held for sale and discontinued operations 1.1.3 1,761 3,502
Inventories 4.1 405 699
Current income tax assets
78 111
Short-term trade and other receivables 4.2 1,317 1,367
Trade receivables for sales and services
1,045 1,019
Other short-term receivables
272 348
Other short-term financial assets
11 0
Cash and cash equivalents 5.2 5,515 6,526
Infrastructure project companies
207 148
Restricted cash
47 33
Other cash and cash equivalents
160 115
Ex-infrastructure project companies
5,308 6,378
Short term financial derivatives at fair value 5.5 15 72
TOTAL ASSETS
24,896 23,091
Liabilities and equity (millions of euros) Note 2021 2020 (*)
Equity 5.1 5,839 3,790
Equity attributable to shareholders
4,048 3,150
Equity attributable to non-controlling interests
1,791 640
Deferred income 6.1 1,402 1,285
Non-current liabilities
11,078 9,584
Pension plan deficit 6.2 3 4
Long-term provisions 6.3 421 442
Long-term lease liabilities 3.7 108 93
Borrowings 5.2 9,512 8,084
Debentures and debts of infrastructure project companies
7,362 5,192
Debt securities and payables of ex-infrastructure project companies
2,150 2,892
Other payables 6.4 69 63
Deferred taxes 2.8 670 451
Financial derivatives at fair value 5.5 295 447
Current liabilities
6,577 8,435
Liabilities classified as held for sale and discontinued operations 1.1.3 1,478 2,476
Short-term lease liabilities 3.7 51 69
Borrowings 5.2 1,074 1,678
Debentures and debts of infrastructure project companies
47 48
Bank borrowings of ex-infrastructure project companies
1,027 1,630
Financial derivatives at fair value 5.5 110 52
Current income tax liabilities
69 94
Short-term trade and other payables 4.3 2,793 3,115
Trade payables
1,535 1,445
Advance payments from customers and work certified in advance
885 1,350
Other short-term payables
373 320
Trade provisions 6.3 1,002 952
TOTAL LIABILITIES AND EQUITY
24,896 23,091
199
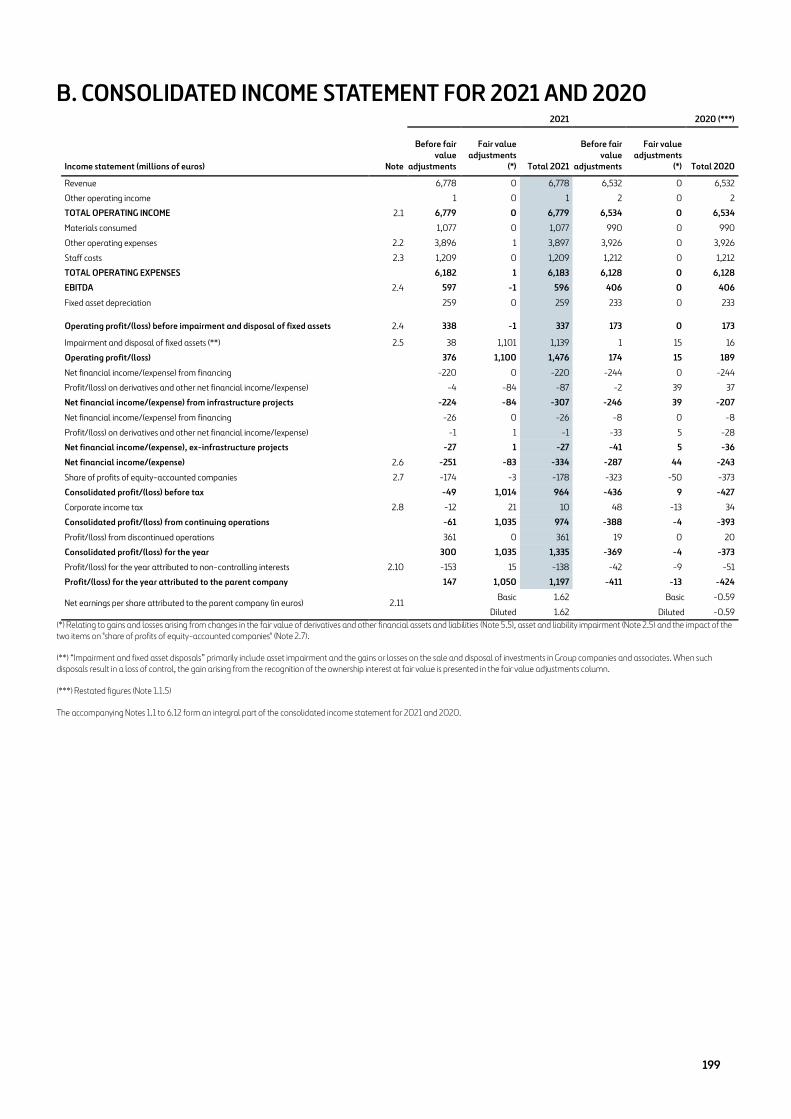
B. CONSOLIDATED INCOME STATEMENT FOR 2021 AND 2020
(*) Relating to gains and losses arising from changes in the fair value of derivatives and other financial assets and liabilities (Note 5.5), asset and liability impairment (Note 2.5) and the impact of the two items on "share of profits of equity-accounted companies" (Note 2.7).
(**) “Impairment and fixed asset disposals” primarily include asset impairment and the gains or losses on the sale and disposal of investments in Group companies and associates. When such disposals result in a loss of control, the gain arising from the recognition of the ownership interest at fair value is presented in the fair value adjustments column.
(***) Restated figures (Note 1.1.5)
The accompanying Notes 1.1 to 6.12 form an integral part of the consolidated income statement for 2021 and 2020.
2021 2020 (***)
Income statement (millions of euros) Note Before fair
value adjustments
Fair value adjustments
(*) Total 2021 Before fair
value adjustments
Fair value adjustments
(*) Total 2020 Revenue 6,778 0 6,778 6,532 0 6,532
Other operating income 1 0 1 2 0 2
TOTAL OPERATING INCOME 2.1 6,779 0 6,779 6,534 0 6,534
Materials consumed 1,077 0 1,077 990 0 990
Other operating expenses 2.2 3,896 1 3,897 3,926 0 3,926
Staff costs 2.3 1,209 0 1,209 1,212 0 1,212
TOTAL OPERATING EXPENSES 6,182 1 6,183 6,128 0 6,128
EBITDA 2.4 597 -1 596 406 0 406
Fixed asset depreciation 259 0 259 233 0 233
Operating profit/(loss) before impairment and disposal of fixed assets 2.4 338 -1 337 173 0 173
Impairment and disposal of fixed assets (**) 2.5 38 1,101 1,139 1 15 16
Operating profit/(loss) 376 1,100 1,476 174 15 189
Net financial income/(expense) from financing -220 0 -220 -244 0 -244
Profit/(loss) on derivatives and other net financial income/(expense) -4 -84 -87 -2 39 37
Net financial income/(expense) from infrastructure projects -224 -84 -307 -246 39 -207
Net financial income/(expense) from financing -26 0 -26 -8 0 -8
Profit/(loss) on derivatives and other net financial income/(expense) -1 1 -1 -33 5 -28
Net financial income/(expense), ex-infrastructure projects -27 1 -27 -41 5 -36
Net financial income/(expense) 2.6 -251 -83 -334 -287 44 -243
Share of profits of equity-accounted companies 2.7 -174 -3 -178 -323 -50 -373
Consolidated profit/(loss) before tax -49 1,014 964 -436 9 -427
Corporate income tax 2.8 -12 21 10 48 -13 34
Consolidated profit/(loss) from continuing operations -61 1,035 974 -388 -4 -393
Profit/(loss) from discontinued operations 361 0 361 19 0 20
Consolidated profit/(loss) for the year 300 1,035 1,335 -369 -4 -373
Profit/(loss) for the year attributed to non-controlling interests 2.10 -153 15 -138 -42 -9 -51
Profit/(loss) for the year attributed to the parent company 147 1,050 1,197 -411 -13 -424
Net earnings per share attributed to the parent company (in euros) 2.11 Basic 1.62 Basic -0.59 Diluted 1.62 Diluted -0.59

200
C. CONSOLIDATED STATEMENT OF COMPREHENSIVE INCOME FOR 2021 AND 2020
(*) The impact on reserves of defined benefit plans is the only item of income and expense recognized directly in equity that cannot subsequently be reclassified to the income statement (Note 5.1).
(**) Restated figures (Note 1.1.5)
The accompanying Notes 1.1 to 6.12 form an integral part of the consolidated statement of comprehensive income for 2021 and 2020.
(Millions of euros) Note 2021 2020 (**) a) Total consolidated profit/(loss) for the year 1,335 -373 Attributed to the parent company 1,197 -424 Attributed to non-controlling interests 138 51
b) Income and expense recognized directly in equity 5.1 180 -399 Fully consolidated companies 132 -225 Impact on hedge reserves 5.5 11 -185 Impact on defined benefit plan reserves (*) 6.2 0 0 Currency translation differences 115 -88 Tax effect 6 48 Companies held for sale 27 10 Impact on hedge reserves 4 0 Impact on defined benefit plan reserves (*) 0 0 Currency translation differences 24 10 Tax effect -1 0 Equity-accounted companies 21 -184 Impact on hedge reserves 45 -28 Impact on defined benefit plan reserves (*) 33 -38 Currency translation differences -32 -132 Tax effect -25 14
c) Transfers to income statement 5.1 1 46 Fully consolidated companies 12 0 Transfers to income statement 16 0 Tax effect -4 0 Companies held for sale 3 43 Transfers to income statement 4 53 Tax effect -1 -10 Equity-accounted companies -14 3 Transfers to income statement -14 4 Tax effect 0 -1
a+b+c TOTAL COMPREHENSIVE INCOME 1,516 -726 Attributed to the parent company 1,394 -725 Attributed to non-controlling interests 122 -1

201
D. CONSOLIDATED STATEMENT OF CHANGES IN EQUITY FOR 2021 AND 2020
The accompanying Notes 1.1 to 6.12 form an integral part of the consolidated statement of changes in equity for 2021 and 2020.
(*) Restated figures (Note 1.1.5).
Share capital
Share/Merger
premium Treasury
shares Other equity instruments
Measurement
adjustments
Retained earnings and
other reserves
Attributed to
shareholders
Attributed to non-
controlling interests Total equity (Millions of euros)
Balance at 31.12.20 (*) 147 647 -13 506 -1,496 3,359 3,150 640 3,790 0 0 Balance at 01.01.21 147 647 -13 506 -1,496 3,359 3,150 640 3,790 Consolidated profit/(loss) for the year 0 0 0 0 0 1,197 1,197 138 1,335 Income and expense recognized directly in equity 0 0 0 0 196 0 196 -16 180 Transfers to income statement 0 0 0 0 1 0 1 0 1 Total recognized income and expenses during the year 0 0 0 0 197 1,197 1,394 121 1,515 Scrip dividend agreement 3 3 0 0 0 -34 -29 0 -29 Other dividends 0 0 0 0 0 0 0 -270 -270 Treasury share transactions -3 -432 -111 0 0 111 -434 0 -434 Shareholder remuneration 0 -429 -111 0 0 77 -463 -270 -733 Share capital increases/reductions 0 0 0 0 0 0 0 28 28 Share-based remuneration schemes 0 0 0 0 0 -22 -22 0 -22 Other movements 0 0 0 0 0 -4 -4 1 -3 Other transactions 0 0 0 0 0 -26 -26 29 3 Perpetual subordinated bond issues 0 0 0 1 0 -8 -7 0 -7 Scope changes 0 0 0 0 0 0 0 1,270 1,270 Balance at 31.12.2021 147 218 -124 507 -1,299 4,599 4,048 1,791 5,839
Share capital
Share/Merger
premium Treasury
shares Other equity instruments
Measurement
adjustments
Retained earnings and
other reserves
Attributed to
shareholders
Attributed to non-
controlling interests Total equity (Millions of euros)
Balance at 31.12.19 147 995 -75 505 -1,195 3,928 4,305 783 5,088 0 0 0 0 0 0 0 0 0 Balance at 01.01.20 147 995 -75 505 -1,195 3,928 4,305 783 5,088 Consolidated profit/(loss) for the year 0 0 0 0 0 -424 -424 51 -373 Income and expense recognized directly in equity 0 0 0 0 -347 0 -347 -52 -399 Transfers to income statement 0 0 0 0 46 0 46 0 46 Total recognized income and expenses during the year 0 0 0 0 -301 -424 -725 -1 -726 Scrip dividend agreement 3 -92 0 0 0 -29 -119 0 -119 Other dividends 0 0 0 0 0 0 0 -134 -134 Treasury share transactions -3 -256 62 0 0 -62 -258 0 -258 Shareholder remuneration 0 -348 62 0 0 -91 -377 -134 -511 Share capital increases/reductions 0 0 0 0 0 0 0 15 15 Share-based remuneration schemes 0 0 0 0 0 -9 -9 0 -9 Other movements 0 0 0 0 0 -19 -19 1 -18 Other transactions 0 0 0 0 0 -28 -28 16 -12 Perpetual subordinated bond issues 0 0 0 1 0 -8 -7 0 -7 Scope changes 0 0 0 0 0 -18 -18 -24 -42 Balance at 31.12.2020 (*) 147 647 -13 506 -1,496 3,359 3,150 640 3,790

202
E. CONSOLIDATED CASH FLOW STATEMENT FOR 2021 AND 2020
The accompanying Notes 1.1 to 6.12 form an integral part of the consolidated cash flow statement for 2021 and 2020.
(*) Restated figures (Note 1.1.5)
(Millions of euros) NOTE 2021 2020 (*)
Net profit/(loss) attributable to parent company 1,197 -424
Adjustments to profit/(loss) -255 1,011
Non-controlling interests 138 -51
Net profit/(loss) from discontinued operations -361 -19
Tax -10 -34
Profit/(loss) from equity-accounted companies 178 373
Net financial income/(expense) 334 243
Impairment and disposal of fixed assets -1,139 -15
Depreciation/amortization 260 233
EBITDA discontinued operations 2.9 345 281
EBITDA including discontinued operations 942 587
Tax payments -155 -101
Change in working capital (receivables, payables and other) 4.0 -249 308
Dividends from infrastructure project companies received 3.5 272 299
Cash flows from operating activities 810 1,093
Investment in property, plant and equipment/intangible assets -124 -116
Investment in infrastructure projects 3 -239 -128
Loans granted to associates/acquisition of companies -923 -152
Interest received 2.6 3 25
Investment of long-term restricted cash 119 253
Divestment of infrastructure projects 0 0
Divestment/sale of companies 1.1.4 1,621 501
Cash flows from investing activities 457 383
Cash flows before financing activities 5.1 1,267 1,476
Capital cash flows from non-controlling interests 57 19
Scrip dividend -31 -122
Treasury share purchases -432 -256
Shareholder remuneration -463 -378
Dividends paid to non-controlling interests of investees -270 -133
Other movements in shareholder’s funds 0 -24
Cash flows from shareholders and non-controlling interests -676 -516
Interest paid 2.6 -295 -274
Lease instalments -131 -89
Increase in borrowings 603 2,209
Decrease in borrowings -1,671 -804
Net change in financial borrowing discontinued operations -51 -96
Cash flows from financing activities -2,221 430
Effect of exchange rate on cash and cash equivalents 99 -133
Change in cash and cash equivalents due to consolidation scope changes -109 -6
Change in cash and cash equivalents from discontinued operations 5.3 -47 24
Change in cash and cash equivalents 5.3 -1,011 1,791
Cash and cash equivalents at beginning of year 6,526 4,735
Cash and cash equivalents at year-end 5,515 6,526
203
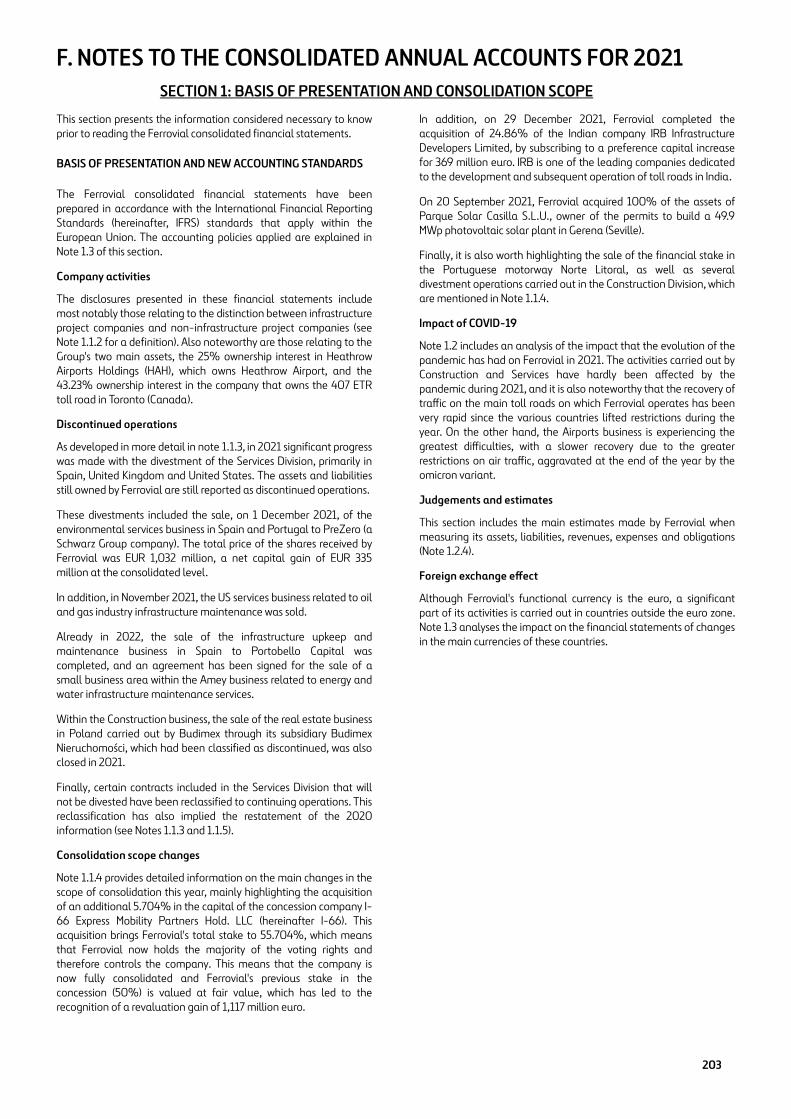
F. NOTES TO THE CONSOLIDATED ANNUAL ACCOUNTS FOR 2021
This section presents the information considered necessary to know prior to reading the Ferrovial consolidated financial statements.
BASIS OF PRESENTATION AND NEW ACCOUNTING STANDARDS
The Ferrovial consolidated financial statements have been prepared in accordance with the International Financial Reporting Standards (hereinafter, IFRS) standards that apply within the European Union. The accounting policies applied are explained in Note 1.3 of this section.
Company activities
The disclosures presented in these financial statements include most notably those relating to the distinction between infrastructure project companies and non-infrastructure project companies (see Note 1.1.2 for a definition). Also noteworthy are those relating to the Group's two main assets, the 25% ownership interest in Heathrow Airports Holdings (HAH), which owns Heathrow Airport, and the 43.23% ownership interest in the company that owns the 407 ETR toll road in Toronto (Canada).
Discontinued operations
As developed in more detail in note 1.1.3, in 2021 significant progress was made with the divestment of the Services Division, primarily in Spain, United Kingdom and United States. The assets and liabilities still owned by Ferrovial are still reported as discontinued operations.
These divestments included the sale, on 1 December 2021, of the environmental services business in Spain and Portugal to PreZero (a Schwarz Group company). The total price of the shares received by Ferrovial was EUR 1,032 million, a net capital gain of EUR 335 million at the consolidated level.
In addition, in November 2021, the US services business related to oil and gas industry infrastructure maintenance was sold.
Already in 2022, the sale of the infrastructure upkeep and maintenance business in Spain to Portobello Capital was completed, and an agreement has been signed for the sale of a small business area within the Amey business related to energy and water infrastructure maintenance services.
Within the Construction business, the sale of the real estate business in Poland carried out by Budimex through its subsidiary Budimex Nieruchomości, which had been classified as discontinued, was also closed in 2021.
Finally, certain contracts included in the Services Division that will not be divested have been reclassified to continuing operations. This reclassification has also implied the restatement of the 2020 information (see Notes 1.1.3 and 1.1.5).
Consolidation scope changes
Note 1.1.4 provides detailed information on the main changes in the scope of consolidation this year, mainly highlighting the acquisition of an additional 5.704% in the capital of the concession company I-66 Express Mobility Partners Hold. LLC (hereinafter I-66). This acquisition brings Ferrovial's total stake to 55.704%, which means that Ferrovial now holds the majority of the voting rights and therefore controls the company. This means that the company is now fully consolidated and Ferrovial's previous stake in the concession (50%) is valued at fair value, which has led to the recognition of a revaluation gain of 1,117 million euro.
In addition, on 29 December 2021, Ferrovial completed the acquisition of 24.86% of the Indian company IRB Infrastructure Developers Limited, by subscribing to a preference capital increase for 369 million euro. IRB is one of the leading companies dedicated to the development and subsequent operation of toll roads in India.
On 20 September 2021, Ferrovial acquired 100% of the assets of Parque Solar Casilla S.L.U., owner of the permits to build a 49.9 MWp photovoltaic solar plant in Gerena (Seville).
Finally, it is also worth highlighting the sale of the financial stake in the Portuguese motorway Norte Litoral, as well as several divestment operations carried out in the Construction Division, which are mentioned in Note 1.1.4.
Impact of COVID-19
Note 1.2 includes an analysis of the impact that the evolution of the pandemic has had on Ferrovial in 2021. The activities carried out by Construction and Services have hardly been affected by the pandemic during 2021, and it is also noteworthy that the recovery of traffic on the main toll roads on which Ferrovial operates has been very rapid since the various countries lifted restrictions during the year. On the other hand, the Airports business is experiencing the greatest difficulties, with a slower recovery due to the greater restrictions on air traffic, aggravated at the end of the year by the omicron variant.
Judgements and estimates
This section includes the main estimates made by Ferrovial when measuring its assets, liabilities, revenues, expenses and obligations (Note 1.2.4).
Foreign exchange effect
Although Ferrovial's functional currency is the euro, a significant part of its activities is carried out in countries outside the euro zone. Note 1.3 analyses the impact on the financial statements of changes in the main currencies of these countries.
SECTION 1: BASIS OF PRESENTATION AND CONSOLIDATION SCOPE

SECTION 2: PROFIT/(LOSS) FOR THE YEAR
INTEGRATED ANNUAL REPORT 2021 CONSOLIDATED ANNUAL ACCOUNTS
204
1.1. BASIS OF PRESENTATION, COMPANY ACTIVITIES AND CONSOLIDATION SCOPE
1.1.1. Basis of presentation
The consolidated annual accounts are presented in compliance with the financial reporting regulatory framework applicable to the Group, to present fairly the Group’s equity, financial position, results and cash flows. The regulatory framework consists of International Financial Reporting Standards (IFRS), as established by Regulation (EC) no. 1606/2002 of the European Parliament and of the Council dated 19 July 2002.
1.1.2 Company activities
Ferrovial comprises the parent company, Ferrovial, S.A., incorporated in Spain and its subsidiaries, which are detailed in Appendix II. Its registered office is in Madrid, at Calle Príncipe de Vergara 135.
Through these companies, Ferrovial engages in the following three lines of business, which are its reporting segments pursuant to IFRS 8:
• Construction: Design and build of all manner of public and private works, including most notably the construction of public infrastructure.
• Toll roads: Development, financing and operating of toll roads.
• Airports: Development, financing and operating of airports, as well as integrated solutions.
Besides these three business lines, Ferrovial has interests in other businesses included in “Other activities” for segment reporting purposes, including the development of Energy Infrastructures (transmission lines and renewable energy generation plants), Mobility (through the ownership interest in Zity), Waste Treatment Plants in the UK Services Division and the other Services businesses that are still being divested, as explained in Note 1.1.3.
For a more detailed description of the various areas of activity in which the consolidated Group conducts its business operations, please consult the Group's website: www.ferrovial.com.
In order to better understand these financial statements, it should be noted that a part of the activity carried out by the Group's business divisions consists of the development of infrastructure projects, primarily in the toll road and airport business lines, but also in the construction and energy fields.
These projects are conducted through long-term arrangements with public authorities under which the concession operator, in which the Group generally has an ownership interest together with other shareholders, finances the construction or upgrade of public infrastructure, mainly with borrowings secured by the cash flows from the project and with the shareholders' capital contributions, and subsequently operates and maintains the infrastructure. The investment is recovered by collecting tolls or regulated charges for the use of the infrastructure, or through amounts paid by the authority awarding the contract based on the availability for use of the related asset. In most cases the construction and subsequent maintenance of the infrastructure is subcontracted by the concession operators to the Group's construction division.
From an accounting standpoint, most of these arrangements are within the scope of application of IFRIC 12.
Accordingly, and in order to aid understanding of the Group’s financial performance, these consolidated financial statements separately detail the impact of projects of this nature in “fixed assets in infrastructure projects” (distinguishing between those to which the intangible asset model is applied and those to which the financial asset model is applied), in long-term financial assets and, mainly, in the net cash position and the cash flow disclosures, in which the cash flows called “ex-infrastructure projects”, which combines the cash flows generated by the construction and services businesses, the dividends from the capital invested in infrastructure projects and investments in or divestments of the share capital of these projects, are presented separately from the cash flows of the infrastructure projects, which include the cash flows generated by the related concession operators. A list of the companies regarded as infrastructure project companies can be consulted in Appendix II.
It is also important to highlight that two of the Group's main assets are its 25% ownership interest in Heathrow Airport Holdings (HAH), the company that owns Heathrow Airport in London (UK), and its 43.23% ownership interest in 407 ETR, the concession operator of the 407 ETR toll road in Toronto (Canada), which are equity-accounted companies since 2011 and 2010, respectively. In order to provide detailed information on the two companies, Note 3.5, Investments in equity-accounted companies includes information relating to the changes in the two companies' balance sheets and income statements, and this is completed with information considered to be of interest in other Notes within the annual accounts.
Lastly, it should be noted that the Services business carried out by Budimex in Poland is included in the Construction segment.
1.1.3. Assets and liabilities held for sale and discontinued operations
Discontinued operations
In 2021 significant progress was made with the divestment of the Services Division, primarily in Spain, United Kingdom and United States.
In November 2021, the agreement to sell the US services business related to oil and gas industry infrastructure maintenance was completed for a price of USD 16 million (EUR 14 million).
On 1 December 2021, the sale agreement reached between Ferrovial and PreZero (company of the Schwarz Group) on 26 July 2021 for the Environment Services business in Spain and Portugal was completed once all the conditions precedent had been fulfilled. The total price of the shares received by Ferrovial was EUR 1,032 million. This transaction generated a profit of EUR 335 million.
On 31 January 2022, the sale agreement between Ferrovial and Portobello Capital for the acquisition of the infrastructure conservation and maintenance business in Spain was completed, once all the conditions precedent to which the transaction was subject had been fulfilled. The total price of the shares received by Ferrovial was EUR 171 million. Pursuant to the provisions of the sale and purchase agreement, a subsidiary of Ferrovial acquired 24.99% of the share capital of the acquiring company for a price of EUR 17.5 million.
In February 2022, an agreement was reached to sell a small business area within the Amey business related to energy and water infrastructure maintenance services.

CONSOLIDATED ANNUAL ACCOUNTS FERROVIAL, S.A. AND SUBSIDIARIES
205
Additionally, as mentioned in Note 1.1.5, in 2021 the UK waste treatment business (reported in “Other activities”), the contract to maintain and operate the section of the A2 toll road and the contract to maintain and operate Madrid Calle 30 (reported in “Toll Roads”), together with the US infrastructure maintenance business and the energy efficiency services business (both reported in “Construction”) were reclassified as continuing operations. This decision was taken following the progress of the divestment processes and considering that certain contracts included in the Services division could fit strategically in other divisions of the Group, facilitating the execution of the divestment processes. Thus, it has been decided to exclude these contracts from the scope of sale, and in accordance with the provisions of the accounting regulations, by including these activities as a continuing activity, the information for 2020 has been restated.
As regards the other activities and as stated in the Annual General Meeting held on 9 April 2021, at the date these financial statements are authorized for issue, the Group remains committed to selling the Services Division.
In this sense, the company is still actively working on its sale, it considers it highly probable that such divestment will take place, and its assets are in conditions for immediate sale, with different advisors' mandates in force and conversations with potential investors, the objective being to sell such assets at a price that is reasonable in accordance with their current market value.
Measurement of assets at fair value
In line with the legislation in force, the assets and liabilities of each of the units included under discontinued operations must be measured at the lower of its carrying amount or fair value.
Fair value has been determined taking account of information on the latest offers received.
With respect to the carrying amount, it is important to consider that results for the year do not include fixed asset depreciation charges, as indicated in the following section.
Impact on the presentation of the financial statements
The reclassification of the Services division to discontinued operations had the following impacts on these financial statements:
• The profit/(loss) after tax generated by the Services business is not reported on each line of the income statement but on a single line named “Profit/(loss) from discontinued operations”, in both 2021 and 2020 (Note 2.9). Pursuant to IFRS 5, this profit/(loss) does not include depreciation/amortization charged on the assets. This heading also includes the potential profit/(loss) of impairments incurred on the fair value adjustment to the assets, as well as the final profit/(loss) created at the moment of sale.
• For the purposes of the balance sheet, all assets and liabilities attributable to the Services business have been reclassified to “Assets/liabilities held for sale and discontinued operations”.
• Note 6.5 on "Contingent assets and liabilities and investment commitments" includes information on discontinued operations.
• The following table details the different types of assets and liabilities that are classified as discontinued operations as of December 2021 and December 2020:
Services Division (millions of euros) DEC. 2021 DEC. 2020 (*) VAR. Non-current assets 1,001 1,965 -964 Goodwill 117 678 -561 Intangible assets 96 115 -19 Fixed assets in infrastructure projects 66 251 -185 Property, plant and equipment 86 315 -230 Right of use 268 273 -4 Deferred taxes 205 254 -49 Other non-current assets 163 80 84 Current assets 732 1,351 -619 Inventories 14 18 -4 Short-term trade and other receivables 537 1,022 -485 Cash and cash equivalents 139 300 -161 Other current assets 42 11 31 TOTAL assets classified as discontinued operations 1,733 3,316 -1,583
Services Division (millions of euros) DEC. 2021 DEC. 2020 (*) VAR. Deferred income 0 2 -2 Non-current liabilities 338 838 -499 Long-term provisions 26 256 -231 Long-term lease liabilities 94 111 -17 Borrowings 52 161 -110 Deferred taxes 148 227 -79 Other non-current liabilities 19 82 -63 Current liabilities 1,140 1,550 -411 Short-term lease liabilities 45 42 3 Borrowings 27 62 -35 Short-term trade and other payables 880 1,153 -273 Trade provisions 101 212 -111 Other current liabilities 86 81 6 TOTAL liabilities classified as discontinued operations 1,478 2,390 -912
(*) Restated figures (Note 1.1.5)
The decrease in the balance sheet items in relation to 2020 is explained mainly by the sale of the Environment Services businesses in Spain and Portugal, and the oil and gas infrastructure maintenance business in the United States, completed at the end of the current financial year.
Assets and liabilities held for sale
The net balance of assets and liabilities classified as held for sale as at December 2021 amount to EUR 28 million. This balance mainly comprises 20% of the equity-accounted Portuguese toll road Via do Infante.
The net balance of assets and liabilities held for sale stood at EUR 101 million at December 2020.
The decrease in relation to 2020 is explained by the 2021 sales of 20% of the Portuguese toll road Norte Litoral and the Group’s shares in Concesionaria de Prisiones Figueras, S.A.U. and in Urbs ludex Et Causidicus, S.A., as explained in Note 1.1.4.
Unlike the discontinued operations, results arising from held-for-sale assets are still reported on the corresponding income statement lines as they are not a business segment or activity.
The following table details the different types of assets and liabilities that are classified as held for sale at December 2021:

SECTION 2: PROFIT/(LOSS) FOR THE YEAR
INTEGRATED ANNUAL REPORT 2021 CONSOLIDATED ANNUAL ACCOUNTS
206
Assets held for sale (Millions
DEC. 2021 DEC. 2020 (*) VAR. Non-current assets 28 170 -142 Fixed assets in infrastructure
0 96 -96
Property, plant and equipment 2 2 Investments in associates 26 68 -42 Deferred taxes 0 5 -5 Current assets 0 16 -16 Short-term trade and other
0 5 -5
Cash and cash equivalents 0 11 -11 TOTAL assets classified as
28 186 -158
(*) Restated figures (Note 1.1.5)
1.1.4. Consolidation scope changes and other disposals in investees
Below is a description of the most significant movements in the consolidation scope in 2021.
Toll roads
I-66 acquisition and takeover
Cintra, a Ferrovial subsidiary and the indirect owner of 50% of the concession operator I-66 Express Mobility Partners Hold. LLC (I-66), acquired an additional 5.704% ownership interest in that company for the sum of USD 182 million (approximately EUR 162 million) on 17 December 2021, by exercising its right of first refusal to the 10% interest put up for sale by one of the shareholders (John Laing), together with a commitment to inject additional capital until construction is finalized (EUR 36 million, approximately). The other two shareholders also exercised rights of first refusal. Payment was made in cash.
As a result, Ferrovial’s total shareholding stands at 55.704% of the concession awarded by the Virginia Transport Department. It is a transformation project to design, build, finance, operate and maintain the 36-km I-66 toll road, construction of which is due for completion in December 2022, when the operating period will begin and run to 2066.
The acquisition of this additional ownership interest means that Ferrovial holds the majority of voting rights on the concession operator’s Board and can therefore direct its relevant activities. Ferrovial now has control of the company pursuant to IFRS 10, paragraph 10. Consequently, the interest in the concession operator, which was equity-accounted based on significant influence, is now fully consolidated.
On taking control of the company and in accordance with IFRS 3.42, the equity-accounted interest (50%) was derecognized and measured at fair value, a capital gain being recorded in the amount of the difference.
Fair value was calculated by extrapolating the price offered by a third party to purchase 10% of the shares, which was accepted by the other shareholders owning shareholdings well below 5%. Therefore, although a 50% shareholding does not in itself give control, it assures an advantageous position justifying the addition of a control premium. The fair value of the prior 50% interest calculated as described amounts to EUR 1,448 million (USD 1,628 million), including the control premium, that represents an increase in value of 2% over the reference price of the transaction.
This valuation entailed recognizing a gain of EUR 1,101 million (USD 1,237 million) in the amount of the difference between the fair value of Ferrovial’s pre-existing 50% ownership interest in the company (EUR 1,448 million) and its carrying amount (EUR 348 million), this gain has been recognized in “impairment and disposals of fixed assets”.
Ferrovial had also recorded (positive) currency translation differences in reserves when this ownership interest was equity-accounted, amounting to EUR 16 million at the acquisition date. Pursuant to IFRS 3 and IAS 28, the gain accumulated in equity has been reclassified to the income statement under the heading non-current asset impairment and disposal, having a positive impact. Therefore, the total result of the operation reaches 1,117 million euros.
Full consolidation of the concession operator and fair value measurement of its assets and liabilities
IFRS 3.18 states that the acquiring company must measure the identifiable assets acquired and liabilities assumed at fair value on the acquisition date. IFRS 3.32 stipulates that the acquiring company must recognize goodwill on the acquisition date, measured as the difference between (a) the sum of (i) the consideration paid, (ii) the amount of the non-controlling interest measured at fair value, and (iii) the amount of the acquiring party’s prior equity interest in the target company, also measured at fair value; and (b) the net amount of identifiable assets acquired and liabilities assumed, also measured at fair value.
The accounting standard establishes a one-year measurement period as from the acquisition date during which time the acquiring company will recognize additional assets and liabilities if new information is obtained on the facts and circumstances concurring at the acquisition date. The measurement made by the company is therefore regarded as provisional.
The following table reflects the consolidated financial statements of the concession operator I-66 Express Mobility Partners Hold. before the acquisition, the fair value adjustments made and the resulting financial statements (for simplicity, the November balance sheet was used, since the effect of 17 days to the transaction date is immaterial, as indicated later on):
Liabilities held for sale
DEC. 2021 DEC. 2020 (*) VAR. Non-current liabilities 0 82 -82 Borrowings 0 56 -56 Other payables 0 8 -8 Financial derivatives at fair
0 18 -18
Current liabilities 0 3 -3 Borrowings 0 2 -2 Current income tax liabilities 0 1 -1 TOTAL liabilities classified as
0 85 -85
CONSOLIDATED ANNUAL ACCOUNTS FERROVIAL, S.A. AND SUBSIDIARIES
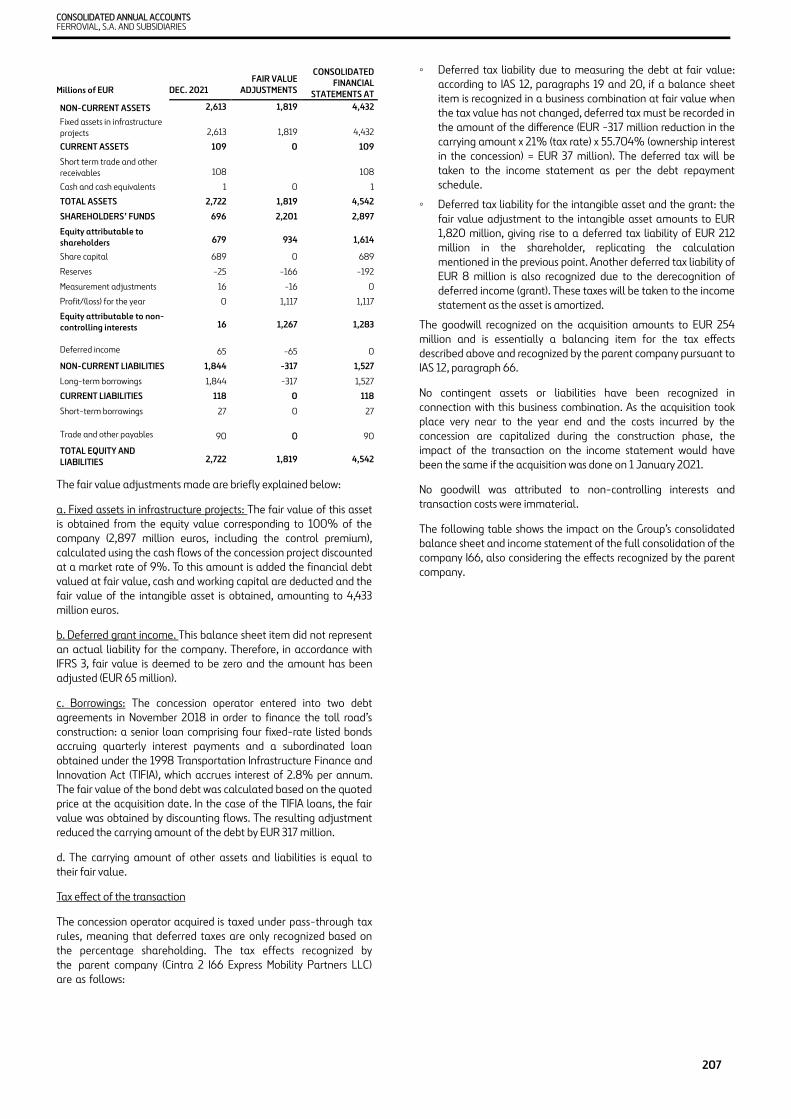
207
Millions of EUR DEC. 2021FAIR VALUE
ADJUSTMENTS
CONSOLIDATED FINANCIAL
STATEMENTS AT NON-CURRENT ASSETS 2,613 1,819 4,432 Fixed assets in infrastructure projects 2,613 1,819 4,432
CURRENT ASSETS 109 0 109
Short term trade and other receivables 108 108
Cash and cash equivalents 1 0 1
TOTAL ASSETS 2,722 1,819 4,542
SHAREHOLDERS’ FUNDS 696 2,201 2,897
Equity attributable to shareholders 679 934 1,614
Share capital 689 0 689
Reserves -25 -166 -192
Measurement adjustments 16 -16 0
Profit/(loss) for the year 0 1,117 1,117
Equity attributable to non-controlling interests 16 1,267 1,283
Deferred income 65 -65 0
NON-CURRENT LIABILITIES 1,844 -317 1,527
Long-term borrowings 1,844 -317 1,527
CURRENT LIABILITIES 118 0 118
Short-term borrowings 27 0 27
Trade and other payables 90 0 90
TOTAL EQUITY AND LIABILITIES 2,722 1,819 4,542
The fair value adjustments made are briefly explained below:
a. Fixed assets in infrastructure projects: The fair value of this assetis obtained from the equity value corresponding to 100% of thecompany (2,897 million euros, including the control premium), calculated using the cash flows of the concession project discounted at a market rate of 9%. To this amount is added the financial debtvalued at fair value, cash and working capital are deducted and thefair value of the intangible asset is obtained, amounting to 4,433million euros.
b. Deferred grant income. This balance sheet item did not represent an actual liability for the company. Therefore, in accordance withIFRS 3, fair value is deemed to be zero and the amount has beenadjusted (EUR 65 million).
c. Borrowings: The concession operator entered into two debtagreements in November 2018 in order to finance the toll road’sconstruction: a senior loan comprising four fixed-rate listed bondsaccruing quarterly interest payments and a subordinated loan obtained under the 1998 Transportation Infrastructure Finance andInnovation Act (TIFIA), which accrues interest of 2.8% per annum.The fair value of the bond debt was calculated based on the quoted price at the acquisition date. In the case of the TIFIA loans, the fairvalue was obtained by discounting flows. The resulting adjustmentreduced the carrying amount of the debt by EUR 317 million.
d. The carrying amount of other assets and liabilities is equal totheir fair value.
Tax effect of the transaction
The concession operator acquired is taxed under pass-through tax rules, meaning that deferred taxes are only recognized based on the percentage shareholding. The tax effects recognized by the parent company (Cintra 2 I66 Express Mobility Partners LLC) are as follows:
◦ Deferred tax liability due to measuring the debt at fair value:according to IAS 12, paragraphs 19 and 20, if a balance sheetitem is recognized in a business combination at fair value whenthe tax value has not changed, deferred tax must be recorded in the amount of the difference (EUR -317 million reduction in thecarrying amount x 21% (tax rate) x 55.704% (ownership interest in the concession) = EUR 37 million). The deferred tax will betaken to the income statement as per the debt repaymentschedule.
◦ Deferred tax liability for the intangible asset and the grant: thefair value adjustment to the intangible asset amounts to EUR1,820 million, giving rise to a deferred tax liability of EUR 212million in the shareholder, replicating the calculationmentioned in the previous point. Another deferred tax liability of EUR 8 million is also recognized due to the derecognition ofdeferred income (grant). These taxes will be taken to the income statement as the asset is amortized.
The goodwill recognized on the acquisition amounts to EUR 254 million and is essentially a balancing item for the tax effects described above and recognized by the parent company pursuant to IAS 12, paragraph 66.
No contingent assets or liabilities have been recognized in connection with this business combination. As the acquisition took place very near to the year end and the costs incurred by the concession are capitalized during the construction phase, the impact of the transaction on the income statement would have been the same if the acquisition was done on 1 January 2021.
No goodwill was attributed to non-controlling interests and transaction costs were immaterial.
The following table shows the impact on the Group’s consolidated balance sheet and income statement of the full consolidation of the company I66, also considering the effects recognized by the parent company.

SECTION 2: PROFIT/(LOSS) FOR THE YEAR
INTEGRATED ANNUAL REPORT 2021 CONSOLIDATED ANNUAL ACCOUNTS
208
DEC. 2021 DEC. 2021
Group total pre-I66 acquisition I66 + Holding Total
NON-CURRENT ASSETS 11,454 4,339 15,794 Goodwill 166 254 420 Fixed assets in infrastructure projects 6,753 4,432 11,185 Investments in associates 2,186 -348 1,838 Other non-current assets 2,350 1 2,350 CURRENT ASSETS 9,155 -53 9,102 Short term trade and other
1,210 108 1,317
Cash and cash equivalents 5,676 -161 5,515 Other current assets 2,269 0 2,269 TOTAL ASSETS 20,609 4,287 24,896 SHAREHOLDERS’ FUNDS 3,455 2,384 5,839 Equity attributable to the parent company 2,947 1,101 4,048 Profit/(loss) for the year 80 1,117 1,197 Reserves and currency translation
2,867 -16 2,851
Equity attributed to non-controlling interests 507 1,283 1,791
Deferred income 1,402 0 1,402 NON-CURRENT LIABILITIES 9,294 1,784 11,078 Long-term borrowings 7,986 1,527 9,512 Deferred tax liabilities 413 258 670 Other non-current liabilities 896 0 896 CURRENT LIABILITIES 6,459 118 6,577 Short-term borrowings 1,047 27 1,074 Trade and other payables 2,702 90 2,793 Other current liabilities 2,710 0 2,710 TOTAL EQUITY AND LIABILITIES 20,609 4,287 24,896
DEC. 2021 DEC. 2021
Group total
pre-I66 acquisition
I66 + Holding Total
TOTAL OPERATING INCOME 6,779 0 6,779 TOTAL OPERATING EXPENSES 6,183 0 6,183 EBITDA 596 0 596 Fixed asset depreciation 260 0 260 Operating profit/(loss) before impairment and disposal of fixed assets 337 0 337 Impairment and disposals of fixed assets 22 1,117 1,139 Operating profit/(loss) 359 1,117 1,476 Net financial income/(expense) -1,451 1,117 -334 Share of profits of equity-accounted companies -178 0 -178 Consolidated profit/(loss) before tax -153 1,117 964 Corporate income tax 10 0 10
Consolidated profit/(loss) from continuing operations -143 1,117 974 Profit/(loss) from discontinued
361 0 361
Consolidated profit/(loss) for the
218 1,117 1,335 Profit/(loss) for the year attributed to non-controlling interests -138 0 -138 Profit/(loss) for the year attributed to the parent company 80 1,117 1,197
Acquisition of 24.86% of the Indian company IRB Infrastructure Developers Limited
Acquisition and significant influence
On 29 December 2021, Ferrovial completed the acquisition, through its Dutch subsidiary Cintra INR Investments BV, of 24.86% of the Indian company IRB Infrastructure Developers Limited by subscribing for a preferred capital increase. The amount paid reached to EUR 369 million. The transaction price has been established in accordance with applicable rules, by considering the average price weighted by the trading volume of the two weeks prior to the closing.
IRB Infrastructure Developers was founded in 1998, is listed on the Bombay Stock Exchange and is one of India’s leading infrastructure companies. It has 23 toll road concessions representing a share of around 20% of the so-called Golden Quadrilateral, the road network that connects the country’s main economic development hubs. The most significant assets include the Mumbai-Pune toll road, regarded as one of India’s most important highways. Revenue in the past year totaled EUR 630 million and EBITDA reached EUR 310 million. The company’s construction division, which currently works exclusively for its own concession projects, has executed a total of 14,000 kilometers of toll roads.
Virendra D. Mhaiskar (his family and his holding company) is the majority shareholder of IRB Infrastructure Developers and will carry on managing the business. The ownership interest acquired does not therefore give Ferrovial control. However, the shareholding acquired, together with Ferrovial’s presence on the Board of Directors, means that Ferrovial has significant influence in IRB (IAS 28.5 and 28.6). Consequently, under AS 28.10, the shareholding is equity accounted.
IRB’s financial statements and subsequent accounting treatment
IRB’s latest available financial statements relate to September 2021, as shown below. No results are included at 31 December 2021 because the acquisition took place on 29 December 2021.
Millones de euros September
2021
NON-CURRENT ASSETS 4.258 Property plant & equipment 14 Intangible assets 3.252 Financial assets 973 Deferred tax assets 12 Other non-current assets 8 CURRENT ASSETS 715 Inventories 37 Financial assets 578 Current tax assets 11 Other current assets 89 TOTAL ASSETS 4,974 SHAREHOLDERS’ FUNDS 839 NON-CURRENT LIABILITES 3.445 Financial liabilities 1.997 Other non-current liabilities 1.448 TOTAL CURRENT LIABILITES 690 Borrowings 322 Trade payables 77 Other current liabilities 278 Current tax liabilities 14 TOTAL EQUITY AND LIABILITIES 4,974

CONSOLIDATED ANNUAL ACCOUNTS FERROVIAL, S.A. AND SUBSIDIARIES
209
TOTAL PATRIMONIO NETO Y PASIVO 4.974
Also, since scarcely two days elapsed from the IRB acquisition date to the financial year-end, no adjustments were made to the investment’s value to reflect IRB’s results generated after the acquisition date, due to being immaterial.
Finally, any differences that may arise between the investment’s value and the corresponding proportion of the company’s net assets measured at fair value will identified and allocated during the 12 months following the acquisition.
The IRB share price on 31/12/21 (Rs 227.4 per share) was higher than the purchase price (Rs 211.8 per share).
Construction
In February 2021, Budimex, Ferrovial’s construction subsidiary in Poland, reached an agreement to sell the real estate business carried on through its subsidiary Budimex Nieruchomości. The sale, which was completed in June for the sum of PLN 1,513 million (EUR 330 million, net of transaction costs), entailed recognizing a capital gain, before non-controlling interests, of EUR 107 million on the discontinued operations line.
In addition, at year-end 2020 an agreement was reached with Aberdeen Infrastructure (Holdco) IV B.V to sell the Group’s ownership interest in Urbs Iudex Et Causidicus, S.A - URBICSA - (22%) for EUR 17 million. This transaction was completed in the second quarter of 2021 and entailed recognizing a capital gain of EUR 17 million on the impairment and disposals line.
Services
As indicated in the notes on results of Discontinued Activities (Note 2.9), during 2021, sale agreements have been reached for the Environmental Services business in Spain and Portugal and for the maintenance of infrastructures of the oil and gas industry business in the United States.
Other businesses: Energy
Acquisition of 100% of the company Parque Solar Casilla
Acquisition and takeover
On 20 September 2021 Ferrovial, through its subsidiary Ferrovial Infraestructura Energéticas, acquired 100% of the assets of Parque Solar Casilla S.L.U., which holds permits to build a 49.9 MWp solar photovoltaic plant in Gerena (Seville). The plant’s energy output matches Ferrovial’s energy consumption in Spain and Portugal and will be destined for the wholesale market in this geographic area. The investment amounted to EUR 10.3 million.
Full consolidation of the concession operator and fair value measurement of its assets and liabilities
In this case, the difference between the price paid (EUR 10.3 million) and the net value of the assets (EUR 1.2 million) is EUR 9.1 million. This amount has been allocated entirely to an intangible asset comprising the permits and licenses obtained by the company to build and operate the plant, which will be amortized over the plant’s lifetime.
1.1.5. Restatement of the comparative financial statements
As indicated in Note 1.1.3, in 2021 the decision was taken to treat the UK waste treatment business as a continuing activity. Although the Group will carry on with the divestment process in the future, it is likely to take more than 12 months.
In addition, the contract to maintain and operate the section of the Autovía A2 toll road and the contract to maintain and operate Madrid Calle 30 (reported in the Toll Roads activity), the US infrastructure maintenance business and the energy efficiency services business (both reported in the Construction activity) have been reclassified as continuing operations.
The 2020 information of all these activities that have been reclassified to continuous activity has been restated.
In the first quarter of 2021, the Group’s real estate business in Poland was reclassified as a discontinued operation. Therefore, under IFRS 5, paragraph 4.1, the income statement for the comparative period has been reclassified. The sale was completed on 5 June, as explained in Note 1.1.4.
This restatement had the following impact on the consolidated financial statements:
DEC. 2020 DEC. 2020 (Millions of euros) Audited Adjusted Restated Non-current assets 10,462 352 10,814 Intangible assets 60 36 96 Fixed assets in infrastructure projects 6,200 156 6,356 Property, plant and equipment 272 69 341 Deferred taxes 586 18 604 Investments in associates 1,710 17 1,727 Other non-current assets 1,634 56 1,690 Current assets 12,666 -389 12,277 Assets classified as held for sale 4,071 -569 3,502 Short-term trade and other receivables 1,292 75 1,367 Cash and cash equivalents 6,432 94 6,526 Other current assets 871 11 882 TOTAL ASSETS 23,128 -37 23,091
DEC. 2020 DEC. 2020 (Millions of euros) Audited Adjusted Restated Equity 3,827 -37 3,790 Deferred income 1,245 37 1,282 Non-current liabilities 9,320 264 9,584 Borrowings 7,970 114 8,084 Other long-term payables 16 47 63 Deferred taxes 428 23 451 Financial derivatives at fair value 419 28 447 Other non-current liabilities 487 52 539 Current liabilities 8,736 -301 8,435 Liabilities classified as held for sale 2,958 -482 2,476 Borrowings 1,657 21 1,678 Short-term trade and other payables 3,029 86 3,115
Trade provisions 892 60 952 Other current liabilities 200 14 214 TOTAL LIABILITIES 23,128 -37 23,091
SECTION 2: PROFIT/(LOSS) FOR THE YEAR
INTEGRATED ANNUAL REPORT 2021 CONSOLIDATED ANNUAL ACCOUNTS
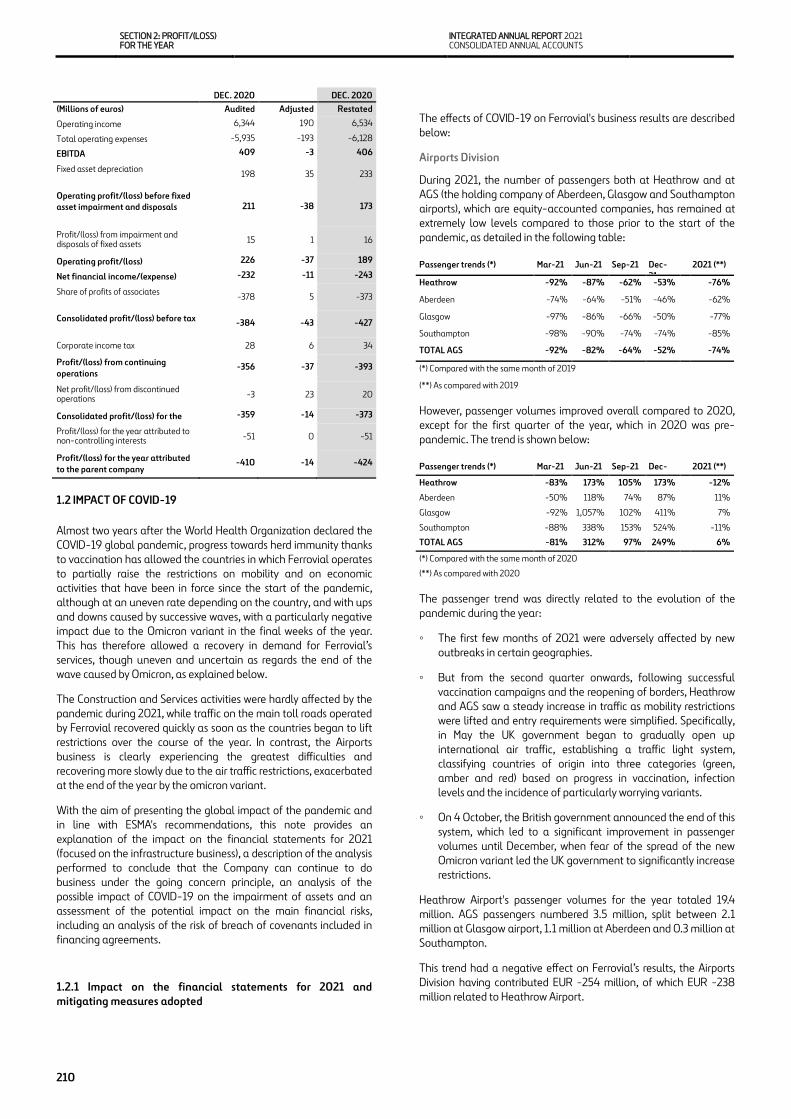
210
DEC. 2020 DEC. 2020 (Millions of euros) Audited Adjusted Restated Operating income 6,344 190 6,534 Total operating expenses -5,935 -193 -6,128 EBITDA 409 -3 406 Fixed asset depreciation 198 35 233 Operating profit/(loss) before fixed asset impairment and disposals 211 -38 173
Profit/(loss) from impairment and disposals of fixed assets 15 1 16 Operating profit/(loss) 226 -37 189 Net financial income/(expense) -232 -11 -243 Share of profits of associates -378 5 -373 Consolidated profit/(loss) before tax -384 -43 -427 Corporate income tax 28 6 34 Profit/(loss) from continuing operations -356 -37 -393 Net profit/(loss) from discontinued operations -3 23 20 Consolidated profit/(loss) for the
-359 -14 -373
Profit/(loss) for the year attributed to non-controlling interests -51 0 -51 Profit/(loss) for the year attributed to the parent company -410 -14 -424
1.2 IMPACT OF COVID-19
Almost two years after the World Health Organization declared the COVID-19 global pandemic, progress towards herd immunity thanks to vaccination has allowed the countries in which Ferrovial operates to partially raise the restrictions on mobility and on economic activities that have been in force since the start of the pandemic, although at an uneven rate depending on the country, and with ups and downs caused by successive waves, with a particularly negative impact due to the Omicron variant in the final weeks of the year. This has therefore allowed a recovery in demand for Ferrovial’s services, though uneven and uncertain as regards the end of the wave caused by Omicron, as explained below.
The Construction and Services activities were hardly affected by the pandemic during 2021, while traffic on the main toll roads operated by Ferrovial recovered quickly as soon as the countries began to lift restrictions over the course of the year. In contrast, the Airports business is clearly experiencing the greatest difficulties and recovering more slowly due to the air traffic restrictions, exacerbated at the end of the year by the omicron variant.
With the aim of presenting the global impact of the pandemic and in line with ESMA's recommendations, this note provides an explanation of the impact on the financial statements for 2021 (focused on the infrastructure business), a description of the analysis performed to conclude that the Company can continue to do business under the going concern principle, an analysis of the possible impact of COVID-19 on the impairment of assets and an assessment of the potential impact on the main financial risks, including an analysis of the risk of breach of covenants included in financing agreements.
1.2.1 Impact on the financial statements for 2021 and mitigating measures adopted
The effects of COVID-19 on Ferrovial's business results are described below:
Airports Division
During 2021, the number of passengers both at Heathrow and at AGS (the holding company of Aberdeen, Glasgow and Southampton airports), which are equity-accounted companies, has remained at extremely low levels compared to those prior to the start of the pandemic, as detailed in the following table:
Passenger trends (*) Mar-21 Jun-21 Sep-21 Dec-21 2021 (**)
Heathrow -92% -87% -62% -53% -76% Aberdeen -74% -64% -51% -46% -62% Glasgow -97% -86% -66% -50% -77% Southampton -98% -90% -74% -74% -85% TOTAL AGS -92% -82% -64% -52% -74% (*) Compared with the same month of 2019 (**) As compared with 2019 However, passenger volumes improved overall compared to 2020, except for the first quarter of the year, which in 2020 was pre-pandemic. The trend is shown below:
Passenger trends (*) Mar-21 Jun-21 Sep-21 Dec-21 2021 (**)
Heathrow -83% 173% 105% 173% -12% Aberdeen -50% 118% 74% 87% 11% Glasgow -92% 1,057% 102% 411% 7% Southampton -88% 338% 153% 524% -11% TOTAL AGS -81% 312% 97% 249% 6% (*) Compared with the same month of 2020 (**) As compared with 2020 The passenger trend was directly related to the evolution of the pandemic during the year:
◦ The first few months of 2021 were adversely affected by new outbreaks in certain geographies.
◦ But from the second quarter onwards, following successful vaccination campaigns and the reopening of borders, Heathrow and AGS saw a steady increase in traffic as mobility restrictions were lifted and entry requirements were simplified. Specifically, in May the UK government began to gradually open up international air traffic, establishing a traffic light system, classifying countries of origin into three categories (green, amber and red) based on progress in vaccination, infection levels and the incidence of particularly worrying variants.
◦ On 4 October, the British government announced the end of this system, which led to a significant improvement in passenger volumes until December, when fear of the spread of the new Omicron variant led the UK government to significantly increase restrictions.
Heathrow Airport's passenger volumes for the year totaled 19.4 million. AGS passengers numbered 3.5 million, split between 2.1 million at Glasgow airport, 1.1 million at Aberdeen and 0.3 million at Southampton.
This trend had a negative effect on Ferrovial’s results, the Airports Division having contributed EUR -254 million, of which EUR -238 million related to Heathrow Airport.

CONSOLIDATED ANNUAL ACCOUNTS FERROVIAL, S.A. AND SUBSIDIARIES
211
Toll Roads Division
Toll road traffic recovered in 2021 as mobility restrictions were lifted, although traffic in the last fortnight of the year suffered following the rapid expansion of the Omicron variant. Generally speaking, trends have been more positive in the US toll roads, particularly in the Dallas area thanks to the swift lifting of restrictions since March. Traffic in December was above 2019 levels (pre-pandemic) at the NTE and NTE 35W toll roads, but LBJ is still below.
The Canadian 407 toll road recovered more slowly in the first half due to the quarantine in Toronto until the end of May and then improved quickly from June onwards, as restrictions were lifted, although the delay in the return to the office in some sectors meant a new setback in the recovery that had begun in August.
Traffic trends on the main toll roads in North America in 2021 (compared with pre-pandemic levels in 2019) are analyzed below:
Traffic trends (*) Mar-21 Jun-21 Sep-21 Dec-21 2021 (**)
407 ETR -47% -42% -21% -23% -38% NTE 1% 6% 8% 5% -1% LBJ -17% -14% -22% -19% -24% NTE 35W 18% 19% 11% 8% 9% (*) Compared with the same month of 2019 (**) As compared with 2019 The trend compared with the previous year is shown below:
Traffic trends (*) Mar-21 Jun-21 Sep-21 Dec-21 2021 (**)
407 ETR -13% 37% 27% 50% 13% NTE 47% 55% 36% 31% 34% LBJ 18% 59% 36% 36% 24% NTE 35W 53% 42% 24% 20% 28% (*) Compared with the same month of 2020 (**) As compared with 2020 Toll Roads Division traffic was irregular. Assets such as NTE 35W or NTE were close to or above 2019 pre-pandemic levels, while LBJ and 407 ETR were still below. However, traffic volumes on all the tolls roads were well above 2020 levels. As a result, Ebitda reached EUR 415 million, having improved considerably in relation to 2020 by EUR 280 million, although without reaching the EUR 436 million recognized for the same period of 2019 (pre-pandemic). Similarly, the contribution by equity-accounted businesses, particularly 407 ETR (EUR 52 million), was above the 2020 figure (EUR 33 million) but below the EUR 153 million reached in 2019.
Impact on cash flows
The impact of the pandemic on cash flows in the infrastructure businesses is quantified in terms of the change in dividends received (mainly due to the 407 ETR and Heathrow assets). Set out below is the trend in dividends since 2019 (pre-pandemic). It may be observed that the overall volume of dividends is above 2020 but below 2019, due primarily to the amounts that were not received from the Airports Division.
2021 vs. Dividends received 2021 2020 2019 2020 2019 407 ETR 164 160 309 4 -145 HAH 0 29 145 -29 -145 LBJ 167 109 0 57 167 NTE 53 25 166 28 -112 M-203 73 0 0 73 73 Other 92 134 109 -42 -16 TOTAL 550 458 729 92 -179
1.2.2 Going concern assessment
Ferrovial is confronting 2022 in a position of very high liquidity. In December 2021, ex-infrastructure projects, liquidity reached EUR 6,421 million, including EUR 132 million relating to the Services Division, as well as lines available at the ex-infrastructures level in the amount of EUR 991 million. The ex-infrastructures net cash position stood at EUR 2,182 million at end-December 2021 (including the Services Division). It should also be noted that the Group’s short-term assets and liabilities, including cash and debt position, show a positive balance at end-December 2021.
As in the prior financial years, in order to conclude as to the Company’s capacity to continue as a going concern, the Group has analyzed future cash needs, focusing on the financial years 2022 and 2023, also including a pessimistic scenario with a series of stress assumptions regarding the Company's cash flow, most notably:
• Assumption that there will be no additional dividends received from infrastructure projects in 2022 or in 2023.
• Construction business cash projections for 2022 and 2023 are calculated as a 50% decline in 2021 working capital (excluding provisions and lease payments), estimated at around EUR -100 million per annum.
• Delay in sale processes currently under way, until after 2023.
The conclusion drawn from the analysis demonstrates that, although the scenario would entail a deterioration of the Company’s cash position, cash resources would continue to be sufficient to meet commitments. Therefore, based on the available information, no material uncertainties have been identified with respect to events or conditions that could raise significant doubts regarding the Group's capacity to continue operating under the going concern principle for 12 months following the date these financial statements were signed.
1.2.3 Impact on asset impairment
As previously mentioned, the Construction and Services businesses were largely unaffected by the pandemic in 2021. The favorable outlook for the Toll Roads business leaves potential impairment risks in the Airports Division.
Nonetheless, it should be noted that, at December 2021, the value of the ownership interest in Heathrow had fallen to zero (the value of the investment in AGS has also been zero since December 2020) due to the absorption of losses (Note 5.4), so no additional impairment is possible.
1.2.4 Impact on financial risks
As mentioned in the previous point, financial risks relate primarily to the Airports Division.

SECTION 2: PROFIT/(LOSS) FOR THE YEAR
INTEGRATED ANNUAL REPORT 2021 CONSOLIDATED ANNUAL ACCOUNTS
212
To bolster its liquidity position, Heathrow has issued GBP 1,600 million in debt since the start of the year. The liquidity position and cost reduction plans have been recognized by Standards and Poor's and Fitch, which confirmed the credit ratings in March 2021, although in January 2022 Moody's issued a credit opinion with a negative outlook on Heathrow Finance as part of its annual review.
On 18 June, AGS entered into an agreement with a syndicate of banks to modify and extend the facility agreement concluded in February 2017 in the amount of GBP 757 million (the entire amount having been drawn). The main terms and conditions of the agreement are explained in Note 5.4.
1.3. ACCOUNTING POLICIES
1.3.1. New accounting standards
1.3.1.a) New standards, amendments and interpretations adopted by the European Union mandatorily applicable for the first time in 2021
The same accounting policies have been applied when preparing these consolidated annual accounts as were applied to the consolidated annual accounts for the financial year ended 31 December 2020, as none of the standards, interpretations or amendments that are applicable for the first time in the current year has had a significant impact on the Group's accounting policies.
The purpose of the interest benchmark rate reform is to replace the indices used as benchmarks for the average interest rate at which a certain number of financial institutions would grant unsecured interbank funding for different periods and currencies, such as the LIBOR. The reform consisted of two phases:
– The phase-one changes in force as from 1 January 2020 allowed entities to continue to apply hedge accounting to hedging relationships affected by the reform.
– The phase-two changes approved in August 2020 and applicable as from 1 January 2021 allow changes made to financial instruments to be recognized by adjusting the effective interest rate on floating-rate instruments, provided this is necessary to adapt them to the reform and the new cash flow calculation bases are economically equivalent to the previous bases. They also allow hedge accounting to continue.
The financial instruments affected by the interest rate benchmark reform are shown below by hedge type:
Derivative financial instruments financial liabilities
Benchmark Notional (M EUR)
Notional (M Local Currency)
Notional (M EUR)
Notional (M Local Currency)
Libor GBP 742 624 742 624 IRS 742 624 742 624
Libor USD 483 549 227 258 IRS 483 549 227 258
1.3.1.b) New standards, amendments and interpretations mandatorily applicable in annual reporting periods subsequent to 31 December 2021:
The new standards, amendments and interpretations approved by the IASB but not yet mandatorily applicable at 31 December 2021 that might have an effect on the Group are as follows:
Although the Group is currently evaluating the impact, the analyses carried out to date indicate that first-time adoption is not expected to have a material impact on the consolidated annual accounts, except for the amendments to IFRS 9, IAS 39, IFRS 7, IFRS 4 and IFRS 16: Interest rate benchmark reform – phase 2.
1.3.2. Basis of consolidation
In 2021 and 2020 the reporting dates of the individual annual accounts of all the companies included in the consolidation scope were either the same as, or were temporarily brought into line with, that of the parent company.
In this regard, to calculate the degree of control, joint control or significant influence existing at each company in the Group, a review has been carried out of the consistency between the stake held and the number of votes controlled in each company under their articles of association and shareholder agreements.
In the case of business activities with companies in which the existence of joint control is identified, the general basis of consolidation is the equity method.
In relation to these jointly controlled businesses, apart from the situations in which there are two venturers, each with a 50% ownership interest, the cases requiring a more in-depth analysis are those relating to infrastructure projects in which Ferrovial is the shareholder with the largest ownership interest (less than or equal to 50%) and has the right to propose the Chief Executive Officer or other executives of the investee, while the other shareholders, mainly infrastructure funds, have a direct participation on the Board of Directors.
Standard, interpretation or amendment Date published in
the EU Official
l
Date applicable
in the EU IASB
applicable date
Amendment to IFRS 4 Insurance contracts - deferral of IFRS 9 16 December
2020 01 January
2021 01 January
2021 IFRS 17 – Insurance contracts Pending Pending 01 January
2023 Amendment to IAS 1 Presentation of financial statements: classification of financial liabilities as current or non-current
Pending Pending 01 January 2024
Amendments to IAS 1 Presentation of Financial Statements and IFRS Practice Statement 2: Disclosures of Accounting Policies
12 February 2021 01 January
2023 01 January 2023
Amendments to IAS 8 Accounting Policies, Changes in Accounting Estimates and Errors: Definition of Accounting Estimates Pending Pending 01 January
2023
Amendments to IAS 12 Income taxes: Deferred taxes related to assets and liabilities arising from a single transaction Pending Pending 01 January
2023 Amendments to: IFRS 3 Business combinations IAS 16 Property, plant and equipment IAS 37 Provisions, contingent liabilities and contingent assets Annual improvements 2018 - 2020
Pending Pending 01 January 2022
Amendments to IFRS 9. IAS 39, IFRS 7, IFRS 4 and IFRS 16: Interest rate benchmark reform – phase 2.
Pending Pending 01 January 2021
CONSOLIDATED ANNUAL ACCOUNTS FERROVIAL, S.A. AND SUBSIDIARIES
213
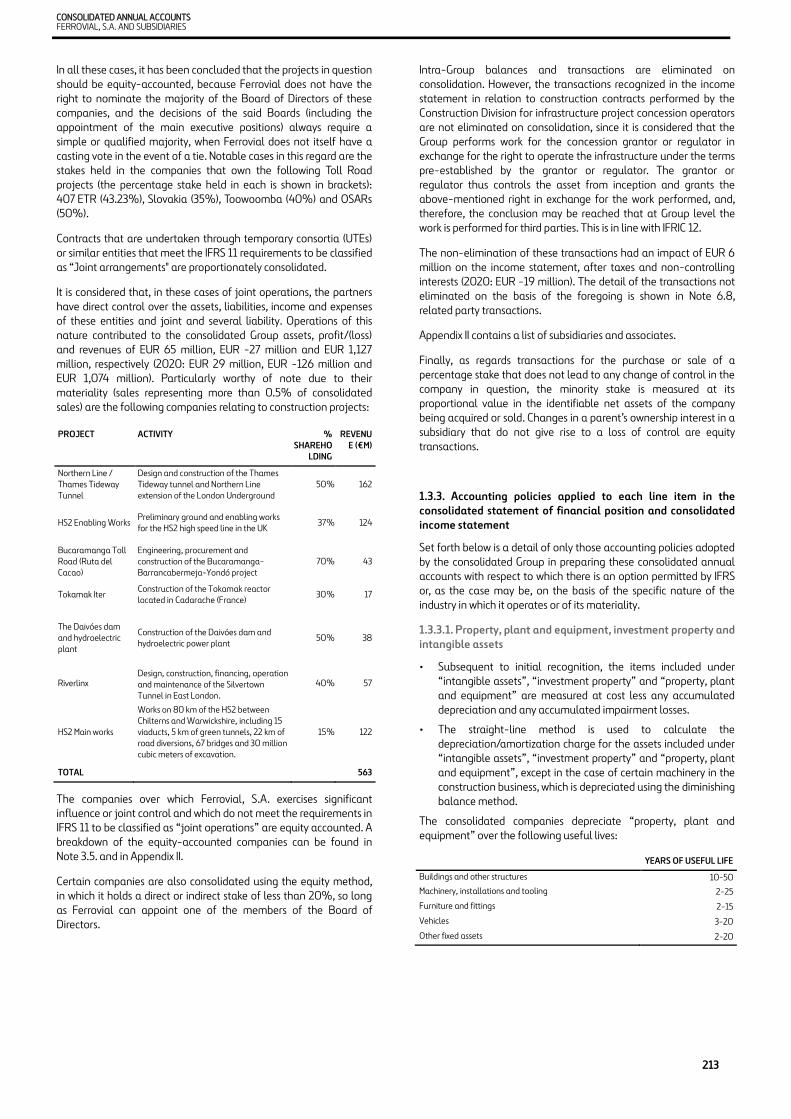
In all these cases, it has been concluded that the projects in question should be equity-accounted, because Ferrovial does not have the right to nominate the majority of the Board of Directors of these companies, and the decisions of the said Boards (including the appointment of the main executive positions) always require a simple or qualified majority, when Ferrovial does not itself have a casting vote in the event of a tie. Notable cases in this regard are the stakes held in the companies that own the following Toll Road projects (the percentage stake held in each is shown in brackets): 407 ETR (43.23%), Slovakia (35%), Toowoomba (40%) and OSARs (50%).
Contracts that are undertaken through temporary consortia (UTEs) or similar entities that meet the IFRS 11 requirements to be classified as “Joint arrangements" are proportionately consolidated.
It is considered that, in these cases of joint operations, the partners have direct control over the assets, liabilities, income and expenses of these entities and joint and several liability. Operations of this nature contributed to the consolidated Group assets, profit/(loss) and revenues of EUR 65 million, EUR -27 million and EUR 1,127 million, respectively (2020: EUR 29 million, EUR -126 million and EUR 1,074 million). Particularly worthy of note due to their materiality (sales representing more than 0.5% of consolidated sales) are the following companies relating to construction projects:
The companies over which Ferrovial, S.A. exercises significant influence or joint control and which do not meet the requirements in IFRS 11 to be classified as “joint operations” are equity accounted. A breakdown of the equity-accounted companies can be found in Note 3.5. and in Appendix II.
Certain companies are also consolidated using the equity method, in which it holds a direct or indirect stake of less than 20%, so long as Ferrovial can appoint one of the members of the Board of Directors.
Intra-Group balances and transactions are eliminated on consolidation. However, the transactions recognized in the income statement in relation to construction contracts performed by the Construction Division for infrastructure project concession operators are not eliminated on consolidation, since it is considered that the Group performs work for the concession grantor or regulator in exchange for the right to operate the infrastructure under the terms pre-established by the grantor or regulator. The grantor or regulator thus controls the asset from inception and grants the above-mentioned right in exchange for the work performed, and, therefore, the conclusion may be reached that at Group level the work is performed for third parties. This is in line with IFRIC 12.
The non-elimination of these transactions had an impact of EUR 6 million on the income statement, after taxes and non-controlling interests (2020: EUR -19 million). The detail of the transactions not eliminated on the basis of the foregoing is shown in Note 6.8, related party transactions.
Appendix II contains a list of subsidiaries and associates.
Finally, as regards transactions for the purchase or sale of a percentage stake that does not lead to any change of control in the company in question, the minority stake is measured at its proportional value in the identifiable net assets of the company being acquired or sold. Changes in a parent’s ownership interest in a subsidiary that do not give rise to a loss of control are equity transactions.
1.3.3. Accounting policies applied to each line item in the consolidated statement of financial position and consolidated income statement
Set forth below is a detail of only those accounting policies adopted by the consolidated Group in preparing these consolidated annual accounts with respect to which there is an option permitted by IFRS or, as the case may be, on the basis of the specific nature of the industry in which it operates or of its materiality.
1.3.3.1. Property, plant and equipment, investment property and intangible assets
• Subsequent to initial recognition, the items included under “intangible assets”, “investment property” and “property, plant and equipment” are measured at cost less any accumulated depreciation and any accumulated impairment losses.
• The straight-line method is used to calculate the depreciation/amortization charge for the assets included under “intangible assets”, “investment property” and “property, plant and equipment”, except in the case of certain machinery in the construction business, which is depreciated using the diminishing balance method.
The consolidated companies depreciate “property, plant and equipment” over the following useful lives:
YEARS OF USEFUL LIFE Buildings and other structures 10-50 Machinery, installations and tooling 2-25 Furniture and fittings 2-15 Vehicles 3-20 Other fixed assets 2-20
PROJECT ACTIVITY % SHAREHO
LDING REVENU
E (€M)
Northern Line / Thames Tideway Tunnel
Design and construction of the Thames Tideway tunnel and Northern Line extension of the London Underground
50 % 162
HS2 Enabling Works Preliminary ground and enabling works for the HS2 high speed line in the UK 37 % 124
Bucaramanga Toll Road (Ruta del Cacao)
Engineering, procurement and construction of the Bucaramanga-Barrancabermeja-Yondó project
70 % 43
Tokamak Iter Construction of the Tokamak reactor located in Cadarache (France) 30 % 17
The Daivóes dam and hydroelectric plant
Construction of the Daivóes dam and hydroelectric power plant 50 % 38
Riverlinx Design, construction, financing, operation and maintenance of the Silvertown Tunnel in East London.
40 % 57
HS2 Main works Works on 80 km of the HS2 between Chilterns and Warwickshire, including 15 viaducts, 5 km of green tunnels, 22 km of road diversions, 67 bridges and 30 million cubic meters of excavation.
15 % 122
TOTAL 563

SECTION 2: PROFIT/(LOSS) FOR THE YEAR
INTEGRATED ANNUAL REPORT 2021 CONSOLIDATED ANNUAL ACCOUNTS
214
1.3.3.2. Investments in infrastructure projects
This line item includes investments in infrastructure made by companies that hold these projects within the scope of IFRIC 12 (mainly toll roads), where remuneration consists of an unconditional right to receive cash or other assets, or a right to charge the corresponding fees based on the degree to which the public service is used.
The assets acquired by the concession operator to provide the concession services but which do not form part of the infrastructure (vehicles, furniture, computer hardware, etc.) are not included in this line item because they are not returned to the concession grantor. Assets of this nature are classified under “property, plant and equipment” and are depreciated over their useful life, using a method that reflects their economic use.
IFRIC 12 Intangible Asset Model
All initial investments relating to the infrastructure that is subsequently returned to the grantor, including compulsory purchase costs and borrowing costs capitalized during construction, are amortized on the basis of the expected pattern of consumption applicable in each case (normally forecast vehicle numbers in the case of toll roads) over the term of the concession.
The investments contractually agreed on at the start of the concession on a final and irrevocable basis for being made at a later date during the term of the concession, and provided they are not investments made to upgrade infrastructure, are considered to be initial investments. For investments of this nature, an asset and an initial provision are recognized for the present value of the future investment, applying a discount rate to calculate the present value that is equal to the borrowing costs associated with the project. The asset is amortized based on the pattern of consumption over the entire term of the concession and the provision is increased by the related interest cost during the period until the investment is made.
Where a payment is made to the grantor to obtain the right to operate the concession, this amount is also amortized based on the pattern of consumption over the concession term.
A provision is recognized systematically for replacement investments over the period in which the related obligations accrue, which must have been set up in full by the time the replacement becomes operational. The provision is recognized on the basis of the pattern of consumption over the period in which the obligation arises and applying financial criteria.
Infrastructure upgrade investments are those that increase the infrastructure's capacity to generate revenue or reduce its costs. In the case of investments that will be recovered over the concession term, since the upgrade investments increase the capacity of the infrastructure, they are treated as an extension of the right granted and, therefore, they are recognized in the consolidated balance sheet when they come into service. They are amortized from the date on which they come into service based on the difference in the pattern of consumption arising from the increase in capacity.
However, if, on the basis of the terms and conditions of the concession, these investments will not be offset by the possibility of obtaining increased revenue from the date on which they are made, a provision is recognized for the best estimate of the present value of the cash outflow required to settle the obligations related to the investment that will not be offset by the possibility of obtaining increased revenue from the date on which the investments are made. The balancing entry is an addition to the acquisition cost of the asset.
In the case of the proportional part of the upgrade or increase in capacity that is expected to be recovered through the generation of increased future revenue, the general accounting treatment used for investments that will be recovered in the concession term will be applied. The main assumptions used in relation to these arrangements correspond to vehicle number and replacement investment estimates, which are updated each year by technical departments.
Set forth below is a detail of the main toll road concessions in force to which the intangible asset model is applied, showing their duration, status and the accounting method applied:
Toll road concessions
COUNTRY STATUS
FIRST YEAR OF
CONCESSI
FINAL YEAR
ACCOUNTING METHOD
NTE Mobility Partners, LLC USA Operational 2014 2061 Full
consolidation
NTE Mobility Partners Seg 3 LLC USA Operational 2018 2061 Full
consolidation
LBJ Infr. Group LLC USA Operational 2014 2061 Full consolidation
I-66 Mobility Partners LLC USA Construction 2016 2066 Full
consolidation
I-77 Mobility Partners LLC USA Operational 2019 2069 Full consolidation
Euroscut Azores Portugal Operational 2011 2036 Full consolidation
Eurolink Motorway Operations (M4-M6) Ireland Operational 2005 2033 Equity-
accounted
Autopista Terrassa Manresa, S.A. Spain Operational 1989 2036 Full
consolidation
Autovía de Aragón, S.A. (**) Spain Operational 2007 2026 Full
consolidation
(*) First year of the concession (if in service) or year of commencement of construction (if at the construction phase).
(**) In 2021, the maintenance and operation contract for the A2 highway section was classified as a continuing operation.
Financial Asset Model IFRIC 12
This line item includes the service concession arrangements related to infrastructure in which the consideration consists of an unconditional contractual right to receive cash or another financial asset, either because the grantor guarantees to pay the operator specified or determinable amounts or because it guarantees to pay the operator the shortfall between amounts received from users of the public service and specified or determinable amounts. Therefore, these are concession arrangements in which demand risk is borne in full by the grantor. In these cases, the amount due from the grantor is accounted for as a loan or receivable under assets in the consolidated balance sheet.
To calculate the amount due from the grantor, the value of the construction, operation and/or maintenance services provided and the financial return in arrangements of this nature are taken into consideration.
Revenue from the services (mainly construction and maintenance) provided in each period increases the amount of the related receivables with a balancing entry in sales. The financial return on the consideration for the services provided also increases the amount of the receivables with a balancing entry in sales. Amounts received from the grantor reduce the total receivable with a balancing entry in cash.
When reporting this financial income in concessions of this type it is classified as ordinary income, since it forms part of the ordinary concession activity and is earned on a regular and periodic basis.
At 31 December 2021 and 2020, the financial income included in sales revenue amounted to EUR 15 million and EUR 18 million, respectively.
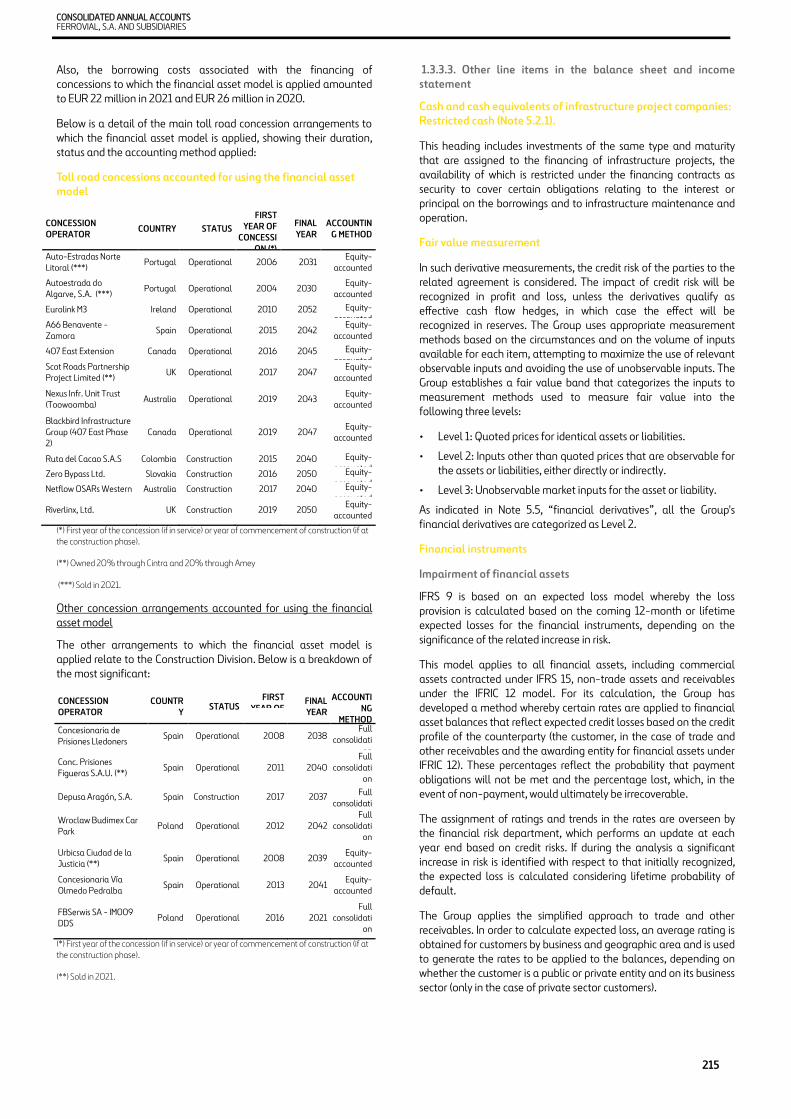
CONSOLIDATED ANNUAL ACCOUNTS FERROVIAL, S.A. AND SUBSIDIARIES
215
Also, the borrowing costs associated with the financing of concessions to which the financial asset model is applied amounted to EUR 22 million in 2021 and EUR 26 million in 2020.
Below is a detail of the main toll road concession arrangements to which the financial asset model is applied, showing their duration, status and the accounting method applied:
Toll road concessions accounted for using the financial asset model
(*) First year of the concession (if in service) or year of commencement of construction (if at the construction phase).
(**) Owned 20% through Cintra and 20% through Amey
(***) Sold in 2021.
Other concession arrangements accounted for using the financial asset model
The other arrangements to which the financial asset model is applied relate to the Construction Division. Below is a breakdown of the most significant:
(*) First year of the concession (if in service) or year of commencement of construction (if at the construction phase).
(**) Sold in 2021.
1.3.3.3. Other line items in the balance sheet and income statement
Cash and cash equivalents of infrastructure project companies: Restricted cash (Note 5.2.1).
This heading includes investments of the same type and maturity that are assigned to the financing of infrastructure projects, the availability of which is restricted under the financing contracts as security to cover certain obligations relating to the interest or principal on the borrowings and to infrastructure maintenance and operation.
Fair value measurement
In such derivative measurements, the credit risk of the parties to the related agreement is considered. The impact of credit risk will be recognized in profit and loss, unless the derivatives qualify as effective cash flow hedges, in which case the effect will be recognized in reserves. The Group uses appropriate measurement methods based on the circumstances and on the volume of inputs available for each item, attempting to maximize the use of relevant observable inputs and avoiding the use of unobservable inputs. The Group establishes a fair value band that categorizes the inputs to measurement methods used to measure fair value into the following three levels:
• Level 1: Quoted prices for identical assets or liabilities.
• Level 2: Inputs other than quoted prices that are observable for the assets or liabilities, either directly or indirectly.
• Level 3: Unobservable market inputs for the asset or liability.
As indicated in Note 5.5, “financial derivatives”, all the Group's financial derivatives are categorized as Level 2.
Financial instruments
Impairment of financial assets
IFRS 9 is based on an expected loss model whereby the loss provision is calculated based on the coming 12-month or lifetime expected losses for the financial instruments, depending on the significance of the related increase in risk.
This model applies to all financial assets, including commercial assets contracted under IFRS 15, non-trade assets and receivables under the IFRIC 12 model. For its calculation, the Group has developed a method whereby certain rates are applied to financial asset balances that reflect expected credit losses based on the credit profile of the counterparty (the customer, in the case of trade and other receivables and the awarding entity for financial assets under IFRIC 12). These percentages reflect the probability that payment obligations will not be met and the percentage lost, which, in the event of non-payment, would ultimately be irrecoverable.
The assignment of ratings and trends in the rates are overseen by the financial risk department, which performs an update at each year end based on credit risks. If during the analysis a significant increase in risk is identified with respect to that initially recognized, the expected loss is calculated considering lifetime probability of default.
The Group applies the simplified approach to trade and other receivables. In order to calculate expected loss, an average rating is obtained for customers by business and geographic area and is used to generate the rates to be applied to the balances, depending on whether the customer is a public or private entity and on its business sector (only in the case of private sector customers).
CONCESSION OPERATOR COUNTRY STATUS
FIRST YEAR OF
CONCESSION (*)
FINAL YEAR
ACCOUNTING METHOD
Auto-Estradas Norte Litoral (***) Portugal Operational 2006 2031 Equity-
accounted Autoestrada do Algarve, S.A. (***) Portugal Operational 2004 2030 Equity-
accounted Eurolink M3 Ireland Operational 2010 2052 Equity-
accounted A66 Benavente - Zamora Spain Operational 2015 2042 Equity-
accounted 407 East Extension Canada Operational 2016 2045 Equity-
accounted Scot Roads Partnership Project Limited (**) UK Operational 2017 2047 Equity-
accounted Nexus Infr. Unit Trust (Toowoomba) Australia Operational 2019 2043 Equity-
accounted Blackbird Infrastructure Group (407 East Phase 2)
Canada Operational 2019 2047 Equity-accounted
Ruta del Cacao S.A.S Colombia Construction 2015 2040 Equity-accounted
Zero Bypass Ltd. Slovakia Construction 2016 2050 Equity-accounted
Netflow OSARs Western Australia Construction 2017 2040 Equity-accounted
Riverlinx, Ltd. UK Construction 2019 2050 Equity-accounted
CONCESSION OPERATOR
COUNTRY STATUS FIRST
YEAR OF
FINAL YEAR
ACCOUNTING
METHOD Concesionaria de Prisiones Lledoners Spain Operational 2008 2038 Full
consolidation
Conc. Prisiones Figueras S.A.U. (**) Spain Operational 2011 2040
Full consolidati
on Depusa Aragón, S.A. Spain Construction 2017 2037 Full
consolidati
Wroclaw Budimex Car Park Poland Operational 2012 2042
Full consolidati
on Urbicsa Ciudad de la Justicia (**) Spain Operational 2008 2039 Equity-
accounted Concesionaria Vía Olmedo Pedralba Spain Operational 2013 2041 Equity-
accounted FBSerwis SA - IM009 DDS Poland Operational 2016 2021
Full consolidati
on
SECTION 2: PROFIT/(LOSS) FOR THE YEAR
INTEGRATED ANNUAL REPORT 2021 CONSOLIDATED ANNUAL ACCOUNTS
216
Moreover, if the customer is declared insolvent, a claim is filed against it or it defaults on payment, a breach is deemed to have occurred and the entire trade receivable will be provisioned. To this end, the Group has defined payment periods per type of customer that trigger a breach and thus the posting of a provision.
In the case of receivables under the IFRIC 12 model (Note 3.3.2), the expected loss provision is calculated individually for each asset based on the awarding entity's credit quality. If the credit risk has not increased significantly, the calculation will be made based on the same amount as the expected credit losses over the next 12 months. The risk is deemed not to have increased significantly if the awarding entity has a rating above investment grade and has maintained this level since initial recognition.
Classification and measurement of financial assets.
According to IFRS 9 the classification and measurement method is based on two aspects, these being the features of the contractual cash flows from the financial asset and the entity's business model. This sets out three potential measurement methods: amortized cost, fair value through other comprehensive income (equity) and fair value through profit or loss. The Group's financial assets are mainly assets held to maturity, the cash flows of which are only payments of principal and interest, so, on this basis, financial assets are carried at amortized cost. We would solely note that for its equity instruments that are measured by default at their fair value with changes reported in profit/(loss), there is an option to report changes in fair value in other comprehensive income from the outset. This decision cannot be revoked and must be taken for each asset individually.
Hedge accounting. IFRS 9 attempts to align hedge accounting more closely with risk management, and the new requirements establish a principle-based approach.
Other equity instruments
These are perpetual bonds with payment at the discretion of the party that issues the coupon in question. They do not meet the conditions to be considered as a financial liability for accounting purposes, because they do not include any contractual obligation to make payment in the form of cash or any other financial asset, nor do they include any obligation to exchange financial assets or liabilities. They are therefore entered as part of the company’s equity, in other equity instruments.
Non-refundable grants related to assets
Non-refundable capital grants are measured at the amount granted under "deferred income" (Note 6.1) in the consolidated statement of financial position. They are taken to profit or loss gradually in proportion to the period of depreciation on the assets financed with these grants, which is recognized under "depreciation and amortization charge”. From the cash flow standpoint, the amount of the grants collected in the year is presented as a reduction of the amount of the investments made.
Trade payables
"Trade payables" include the balances payable to suppliers under reverse factoring arrangements with banks.
These balances are classified as trade payables and the related payments as cash flows from operating activities, since the payments are made to the banks under the same conditions as those agreed with the supplier, the company bound by the obligation to make payment does not agree an extension with the banks beyond the due dates agreed with the supplier, and there are no special guarantees to secure the payments to be made.
1.3.3.4 Revenue recognition
In order to ensure that policy is standardized across all its different lines of business, Ferrovial has prepared a common revenue recognition policy adapted to IFRS 15 "revenue from contracts with customers".
i) General revenue recognition criteria
The first step in the revenue recognition process involves identifying the relevant contracts and the performance obligations that they contain.
Generally speaking, the performance obligations in the Construction and Services activities carried out by Ferrovial are met over time, rather than at a specific moment, since the customer simultaneously receives and consumes the benefits offered by the company’s performance as the service is provided.
As regards the criterion for recognizing revenues over time (the method of measuring the progress of performance of an obligation), Ferrovial has established certain criteria that are consistently applied in respect of similar performance obligations.
In this regard, the Group has chosen the output method as its preferred method for measuring the value of assets or services for which control is transferred to the customer over time, which is applied whenever the progress of the work performed can be measured on the basis and over the course of the contract.
In contracts for the provision of different, highly interrelated goods or services required to produce a combined output, which often occurs in contracts for construction activities, the applicable output method is that of measurement of units produced (“surveys of performance” under “output methods”), in which the revenue recognized relates to the work units completed, based on the price assigned to each unit. In accordance with this method, the units produced under each contract are measured and the output for the month is recognized as revenue. The costs of carrying out works or service projects are recognized on an accrued basis, and the costs actually incurred in producing the units of output are recognized as an expense together with those which, because they might be incurred in the future, have to be allocated to the units produced to date (see Note 1.3.3.4. v) relating to provisions for deferred expenses).
In routine or recurring service contracts (in which the services are substantially the same), such as maintenance and cleaning services, which are transferred with the same pattern of consumption over time and whose remuneration consists of a recurring fixed amount over the term of the contract (e.g. monthly or annual payment), in such a way that the customer receives and consumes the benefits of the services as the entity provides them, the method selected by the Group to recognize revenue is the “time elapsed output method”. Under this method, revenue is recognized on a straight-line basis over the term of the contract and costs are recognized on an accrual basis.
CONSOLIDATED ANNUAL ACCOUNTS FERROVIAL, S.A. AND SUBSIDIARIES
217
Only in those contracts that are not for routine or recurring services and for which the unitary price of the units to be performed cannot be determined, use of the stage of completion measured in terms of the “costs incurred” (input method) is permitted. Under this method, the company recognizes revenues based on the costs as they accrue, as a percentage of the total costs forecast for completion of the works, taking account of the expected profit margins for the whole project, according to the most recently updated budget. This method entails measuring the costs incurred as a result of the work completed to date as a proportion of the total costs forecast and recognizing revenues in proportion to the total revenues expected. As indicated above, this method only applies to those complex, lump-sum construction or services contracts in which it is not possible to break down the price and measure the units to complete.
Finally, as regards determining whether the company acts as a principal or agent, Ferrovial is the principal in both construction and service contracts if it provides goods and services directly to the customer and transfers control of them without involving intermediaries.
In the case of concession agreements in which Ferrovial both builds and operates the toll road, the construction company is the principal if it is ultimately responsible for fulfilling the commitment to execute the work in accordance with the concession agreement specifications and assumes the contractual obligations in the event of a claim or delay.
ii) Recognition of revenue from contract modifications, claims and disputes
Modifications are understood to mean changes to the scope of the work that are not provided for in the original contract and that could result in a change to the revenues attached to the contract in question. Changes to the initial contract require the customer’s technical and financial approval prior to the issue of billings and collection of the amounts relating to additional work.
The criterion applied by the Group is not to recognize any revenue from this additional work until the additional work has been approved by the client. In cases where the work has been approved but its measurement remains pending, the “variable consideration” requirement (as explained below) will apply. This entails recognizing revenue in an amount that will be most likely not to suffer any significant reversal. Any costs associated with the units completed or services rendered will be recognized at the time at which they are incurred, regardless of whether or not the modification has been approved.
A claim is a request seeking payment or compensation from the customer (for example, cases involving compensation, reimbursement of costs, legally mandatory inflation-linked review), subject to the submission of a direct application to the customer. The criterion followed by the Group with regard to claims is to apply the method mentioned above in relation to changes, when such claims are not covered by the contract, or to apply the variable consideration method, when they are covered by the contract but need to be quantified. A dispute is the result of an incident of non-compliance or rejection after a claim has been made to the customer under the terms of the contract, the result of which is pending in a procedure being pursued directly with the customer or in court or arbitration proceedings. In line with the criteria followed by the Group, in the event that the revenues relating to a dispute in which the enforceability of the amount being claimed are in doubt, these revenues will not be recognized and any recognized earlier will be cancelled, since the dispute shows that the customer has not given its approval for the completed work.
In the event that the customer questions the value of the work completed revenues will be recognized on the basis of the criteria applied in cases of “variable consideration”, as explained below.
Only in cases in which a legal report confirms that the rights forming the subject of the dispute are clearly enforceable and, therefore, at least the costs directly associated with the service relating to the dispute are recoverable, revenues may be recognized up to the maximum amount of the costs incurred.
(iii) Determination of the transaction price
The purpose of the entity is to allocate the price to each performance obligation (or distinct good/service) for an amount that represents the consideration to which the entity expects to be entitled in exchange for the transfer of goods or services committed to the customer.
In order to fulfil the allocation purpose, the transaction price of each performance obligation identified in the contract is allocated as a selling price that is separate in relative terms.
The best evidence of a separate selling price is the observable price of a good or service when the entity sells that good or service separately in similar circumstances and to similar customers.
Variable consideration
If the consideration promised in a contract includes a variable amount, this amount is recognized only to the extent that it is highly probable that a significant reversal in the amount recognized will not occur when the uncertainty associated with the variable consideration is subsequently resolved. For example, it is stipulated that a bonus may only be recognized once a high percentage of completion of the contract has been reached.
Financing component
Generally speaking, in order to calculate the price of a performance obligation, an implicit financing component is calculated, in cases in which between the date on which the goods or services are delivered and the date on which the customer is expected to pay for the goods or services is greater than a year. This component is treated as financial income.
Where a performance obligation involves a period of less than one year between the date on which the company transfers goods that have been promised to the customer and the date on which the customer pays, the practical solution permitted under the regulations is applied to avoid adjusting the financial amount of the consideration.
In cases in which there is a contractual or legal right to charge late payment interest for a payment that is delayed with regard to the contractually agreed terms, this late payment interest is only recognized when it is highly probable that it will be effectively paid.
iv) Balance sheet items related to revenue recognition
Works completed pending certification/work certified in advance
Unlike revenue recognition, the amounts billed to the customer are based on achievement of the various milestones established in the contract and on acknowledgement thereof by the customer, through a contractual document referred to as a progress billing certificate. Thus, the amounts recognized as revenue for a given year do not necessarily coincide with the amounts billed to or certified by the customer.

SECTION 2: PROFIT/(LOSS) FOR THE YEAR
INTEGRATED ANNUAL REPORT 2021 CONSOLIDATED ANNUAL ACCOUNTS
218
In contracts in which the revenues recognized exceed the amount billed or certified, the difference is recognized in an asset account “Work completed pending certification” (since it is an asset under the contract) under “Trade receivables for sales and services”, while in contracts in which the revenues recognized are lower than the amount billed or certified, the difference is recognized in a liability account “Work certified in advance” (since it is a liability under the contract) under “Short-term trade and other payables”.
Bidding and mobilization costs
In addition to the balance sheet entries described above, the Group also recognizes assets connected with the cost of obtaining contracts (bidding costs) and the costs incurred in order to comply with contracts, or the start-up costs (mobilization costs) that relate directly to the main contract, provided that they are recoverable during the performance of the contract. These amounts are included in a different account on the assets side of the balance sheet, under “inventories” (Note 4.1).
Bidding costs are only capitalized when they are directly related to a contract, it is probable that they will be recovered in the future, and either the contract has been awarded or the company has been selected as preferred bidder.
The costs incurred, regardless of whether or not the contract is won, are recognized as an expense, unless they are explicitly recoverable from the customer in any case (whether or not the contract is won). They are amortized systematically as the goods and services connected with the asset are transferred to the customer.
Any costs that are necessary in order to implement a contract, mobilization costs, are capitalized whenever it is probable that they will be recoverable in the future and when they do not include costs that would normally be generated for the company if the contract had not been won. They are gradually recognized as an expense on the basis of the proportion of actual output to estimated output under each contract. Otherwise, the expenses are entered directly to profit or loss.
v) Provisions from customer contracts
The main provisions relating to customer contracts are provisions for deferred expenses and for budgeted losses.
• Provisions for deferred expenses. These cover expenses that areexpected to be generated at the end of a contract, such as theremoval of construction machinery or dismantling costs,together with estimates of the repairs that will be requiredduring the warranty period. These provisions are connected with an existing obligation set out in the contract, on the basis thatthe company will probably allocate resources to complying withthe obligation, the amount of which can be reliably estimated.The provisions are allocated on the basis of the best possibleestimates of total costs. They may be calculated as apercentage of the total revenues expected from the contract, ifthere is historical information from similar contracts.
As regards the warranty obligations included in this type ofprovision, these will not be treated as a separate performanceobligation, unless the customer has the option of engaging thewarranty separately, meaning that the obligation will beentered in accordance with IAS 37 on provisions.
• Provisions for budgeted losses. These provisions are recognized as soon as it becomes obvious that the total costs expected tobe incurred in a contract exceed total expected revenues. Forthe purposes of calculating this provision, where necessary, thecriteria set out in paragraph 14 (b) of IAS 37 are applied. In this way, the estimate of the total contract budget will include theforecast revenues that are considered probable.
These criteria are different from those set out in IFRS 15,mentioned above in Note 1.2.3.4 “revenue recognition”, underwhich the revenues are only recognized when considered highlyprobable.
Likewise, in the event that the total profit expected from acontract is lower than the amount recognized according to therules set out above for revenue recognition, the difference isentered as a provision for negative margins.
vi) Specific criteria for revenue recognition by segment
Construction business
For construction contracts, as a general rule, single performance obligation will be identified owing to the high degree of integration and customization of the various goods and services to provide a combined output that is transferred to the customer over time.
As mentioned above, the Group has chosen the “measured work unit” ("output method") as its preferred method. This is applied whenever the progress of the work can be measured as it is being carried out, and a price has been allocated to each work unit.
It is only with regard to contracts in which it is not possible to determine a unit price for the units to be completed that the input method known as “measure of progress based on costs incurred” may be applied.
Services business
In the case of the Services business, there is no single type of contract, given the wide diversity of services offered. In general, contracts include a range of different tasks and unit prices, in which revenues are taken to the income statement when the services are provided, based on time elapsed, i.e. when the customer simultaneously receives and consumes the benefits provided by the performance of the service as it is being provided. This happens, for example, with recurring or routine services such as facility management, street cleaning or waste collection services.
Certain contracts include different types of activities, subject to a scale of fixed unit tariffs for the provision of the services that are provided and that form part of the contract as a whole. In these contracts, the customer requests each service by submitting work orders, which are classified as independent performance obligations, and any associated revenues will be recognized on the basis of the specific requirements set out for approval in each contract.
In the case of complex, long-term contracts that include the provision of various services involving different performance obligations (construction, maintenance, operation, etc.), payment of which is made regularly and for which the price relating to the obligations in question is indicated in the contract or can be calculated, revenues are recognized for the recurring services on an elapsed time basis, using the progress achieved criterion for the more complex performance obligations in which it is not possible to allocate a price to each of the units completed.
Lastly, it should be noted that the revenue from certain contracts that fall within the scope of IFRIC 12 is recognized as described in Note 1.3.3.2.

CONSOLIDATED ANNUAL ACCOUNTS FERROVIAL, S.A. AND SUBSIDIARIES
219
Toll roads business
The contracts included in this line of business are accounted for in accordance with IFRIC 12, which provides for the classification of the contract assets on the basis of the intangible asset model and the financial asset model (mixed models could also be applied) (Note 1.3.3.2).
In the case of concession arrangements accounted for using the intangible asset model, the customer is the user of the infrastructure and, therefore, each use made of the infrastructure by users is considered a performance obligation, and the related revenue is recognized at a point in time. In the case of concession arrangements accounted for using the financial asset model, in which the customer is the concession grantor, revenue recognition depends on the various services provided (e.g. operation or maintenance), which will be accounted for as different performance obligations, to which market prices have to be allocated. In cases in which an isolated sale price cannot be directly identified, it is estimated on the basis of the best possible estimate, applying the margin expected for this business.
Airports business
Generally speaking, these are short-term services rendered to the customer (airlines or airport users), in which regulated revenues will be recognized at a specific moment. It should be noted that the revenue from certain contracts that fall within the scope of IFRIC 12 is recognized as described in Note 1.3.3.2.
Energy distribution business
These are contracts with a series of services that are substantially the same and are transferred using the same standard model. The monthly tariff reflects the value of the services rendered. This type of contract will only have a performance obligation that is transferred over time, and revenues are recognized using the output method.
1.3.3.5 Non-current assets held for sale
Non-current assets are classified as assets held for sale if it is considered that their carrying amount will be recovered when sold, rather than via continued use.
This condition is only met when the sale is highly probable, and they are available for immediate sale in their current condition, and that the sale is likely to be completed in the space of one year from the classification date. The period may be extended if the delay is caused by events and circumstances beyond the company's control and there is sufficient evidence of the commitment to the sales plan. The total of these assets is registered in one line and valued at the lower value of their carrying amount and their fair value, less the costs to sell them, and are not subject to depreciation from the moment they are classified as held for sale. The profit/(loss) contribution of these assets to the Group's profit/(loss) is registered in the income statement, classified by type.
An entity that is committed to a sale plan that entails the loss of control of a subsidiary will classify all that subsidiary's assets and liabilities as held for sale when the requirements indicated in the previous paragraph are met, irrespective of whether or not the entity retains a non-controlling interest in its former subsidiary following the sale.
1.3.3.6 Discontinued operations
Discontinued operations are those that have been sold or otherwise disposed of or have been classified as held for sale and represent a full segment for the consolidated Group, or form part of a single plan or relate to a subsidiary acquired solely for resale. The profit/(loss) generated from discontinued operations, both for the current financial year, as well as those presented alongside it, is presented in a specific line in the income statement after tax, with the total comprising the follow amounts:
• Profit/(loss) after tax of the activities and/or discontinuedoperations.
• Profit/(loss) after tax recognized for the fair valuemeasurement, less sales costs, or for divestment.
1.3.4. Accounting estimates and judgements
Estimates have been made when preparing the 2021 consolidated annual accounts to measure some of the assets, liabilities, income, expenses and commitments recognized. These estimates basically relate to the following:
i. The estimate made to calculate the fair value of the purchaseof an additional 5.704% of I-66 (Note 1.1.4).
ii. The estimates relating to recognizing revenues from customercontracts (Note 1.3.3.4), particularly important being thoserelating to:
• determining whether there are enforceable rights to recognizerevenue;
• determining whether the modification of a contract has beenapproved;
• establishing whether the criteria have been met to recognize revenue as variable consideration;
• recognizing revenues in relation to an amendment, claim ordispute;
• establishing whether there are one or more performanceobligations and the price to be allocated to each of them;
• defining the method applicable to each performance obligation in order to recognize revenues on the basis of time, bearing inmind that, according to the accounting policy established by the company, the preferred method is the output method (analysisof work completed), based on either percentage completed ortime elapsed, while the input method (measure of progressbased on costs) is applied in cases in which the services rendered do not represent recurrent and routine services in which it is notpossible to determine the unit price for the units to becompleted;
• in the case of contracts entered under the criterion ofexamination of work completed, measurement of the unitscompleted and the price to be allocated to them;
• in the case of contracts entered using the input method(measure of progress based on costs), defining the degree towhich costs have been incurred and the margin expected to beobtained from the contract;
• determining capitalization of bidding and mobilization costs;
• assessment of whether to act as principal or agent;
• estimates relating to the calculation of provisions for expectedlosses and deferred expenses.
iii. The judgement regarding meeting the conditions to classify theassets and liabilities of the Services Division as discontinuedoperations in line with IFRS 5, and for the fair value estimationof those assets (Note 1.1.3).
iv. Estimates made for the purposes of the going concernassessment (Note 1.2)

SECTION 2: PROFIT/(LOSS) FOR THE YEAR
INTEGRATED ANNUAL REPORT 2021 CONSOLIDATED ANNUAL ACCOUNTS
220
v. Estimates made in 2021 regarding the impact of COVID-19 (Note 1.2)
vi. Assessment of possible legal and tax contingencies (Note 6.5 on contingent liabilities and Note 6.3 on provisions).
vii. The recognition for accounting purposes of the subordinated guaranteed hybrid bond (Note 5.1.2 equity instruments).
viii. Estimates regarding derivative measurements and the expected cash flows associated with them in order to determine the existence of accounting hedges (Note 5.5, financial derivatives at fair value).
ix. The measurement of possible impairment losses on certain assets, especially in 2021 with relation to the assets in the Airports business (Notes 2.1, Impact of COVID-19, Note 3.1, Goodwill, 3.6. Non-current financial assets and Note 3.5, Investments in associates).
x. Business performance projections that affect the estimates of the activation of tax assets and the possible recoverability of the same (Note 2.8 on tax matters).
xi. Estimates that take account of the future vehicle numbers on toll roads for the purpose of preparing financial information for toll roads pursuant to IFRIC 12 (Note 3.3, investments in infrastructure projects, and Note 6.3, provisions).
xii. The assumptions used in the actuarial calculation of liabilities due to pensions and other commitments to employees (Note 6.2, pension plan deficit).
xiii. The measurement of share award plans (Note 6.7, share-based remuneration schemes).
xiv. Estimation to determine the term of lease agreements when they include cancellation or extension options; or the assessment of whether the exercise of such options, which affect the value of the right-of-use asset and the lease liability, is reasonably certain (Note 1.2.1.a).
These estimates were made using the best information available at 31 December 2021 on the events analyzed. However, it is possible that events that may take place in the future might make it necessary to change these estimates. Changes in accounting estimates would be applied prospectively in accordance with the requirements of IAS 8.
1.3.5. Disclosures
It should also be noted that in preparing these consolidated annual accounts the Group has omitted any information or disclosures which did not require disclosure due to their qualitative importance and were considered to be immaterial under IFRS.
1.4. EXCHANGE RATE
As indicated above, Ferrovial engages in business outside the eurozone through various subsidiaries. The exchange rates used to convert these financial statements for their inclusion in the Group's consolidated financial statements are as follows:
Balance sheet items (exchange rates at 31 December 2021 and at 31 December 2020 for the comparative period):
Closing exchange rate 2021 2020 Change 21/20 (*) Pound sterling 0.8413 0.8956 -6.05 % US dollar 1.1370 1.2225 -6.99 % Canadian dollar 1.4373 1.5609 -7.92 % Australian dollar 1.5647 1.5888 -1.52 % Polish zloty 4.5869 4.5678 0.42 % Chilean peso 968.9800 868.6600 11.55 % (*) A negative change represents an appreciation of the reference currency against the euro and vice versa.
Items in the income statement and cash flow statement (cumulative average rates at December 2021 and at December 2020 for the comparative period):
(*) A negative change represents an appreciation of the reference currency against the euro and vice versa.
As detailed in the previous tables, during 2021 the main currencies in which Ferrovial operates appreciated against the euro.
The impact recorded in this regard on shareholders' funds attributable to the parent company is EUR 106 million (see Note 5.1.1 Changes in equity).
Note 5.4 explains how exchange rate risk is managed.
In addition, the impact caused by exchange rates is also analyzed in the Notes where this is a relevant issue.
1.5. INFORMATION BY SEGMENT
Appendix III contains the statements of financial position and the income statement for each business segment, both for 2021 and for the comparative period.
It also includes a breakdown by segment of the sections in which this information is important or required under accounting legislation.
Average exchange rate 2021 2020 Change 21/20 (*) Pound sterling 0.8590 0.8887 -3.39 % US dollar 1.1796 1.1465 2.89 % Canadian dollar 1.4790 1.5377 -3.82% Australian dollar 1.5785 1.6593 -4.87 % Polish zloty 4.5656 4.4673 2.20 % Chilean peso 901.4610 906.6242 -0.57 %
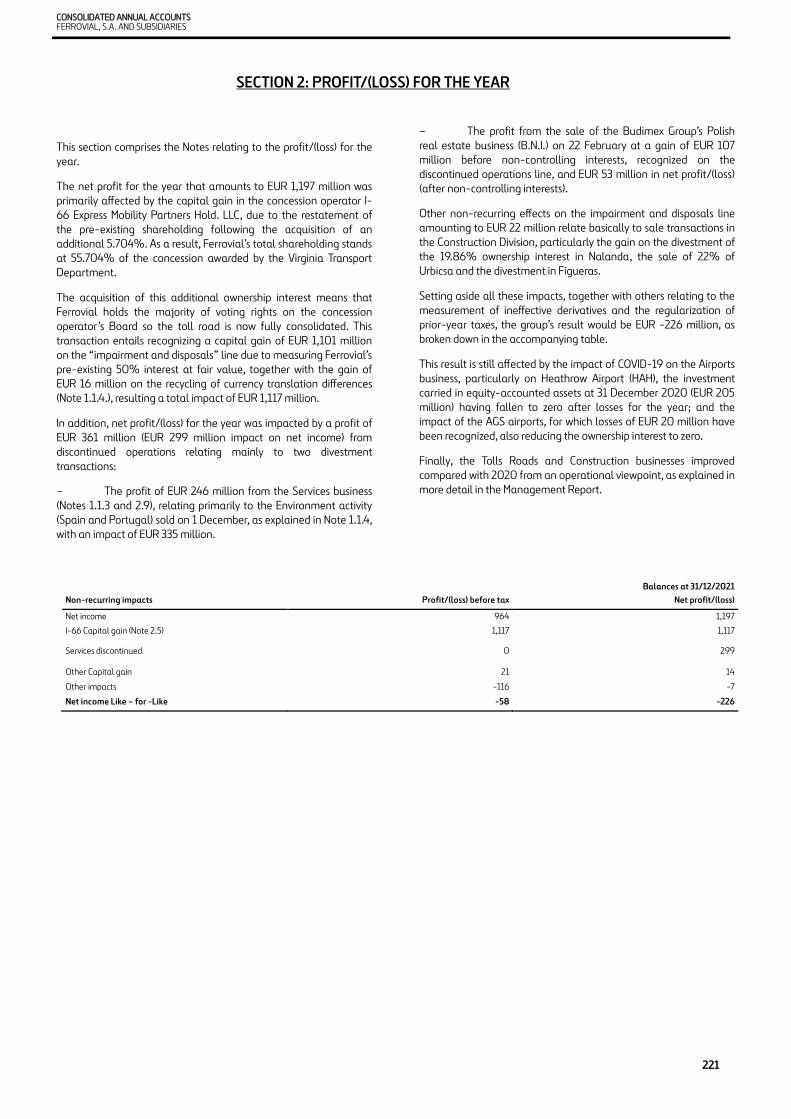
CONSOLIDATED ANNUAL ACCOUNTS FERROVIAL, S.A. AND SUBSIDIARIES
221
This section comprises the Notes relating to the profit/(loss) for the year.
The net profit for the year that amounts to EUR 1,197 million was primarily affected by the capital gain in the concession operator I-66 Express Mobility Partners Hold. LLC, due to the restatement of the pre-existing shareholding following the acquisition of an additional 5.704%. As a result, Ferrovial’s total shareholding stands at 55.704% of the concession awarded by the Virginia Transport Department.
The acquisition of this additional ownership interest means that Ferrovial holds the majority of voting rights on the concession operator’s Board so the toll road is now fully consolidated. This transaction entails recognizing a capital gain of EUR 1,101 million on the “impairment and disposals” line due to measuring Ferrovial’s pre-existing 50% interest at fair value, together with the gain of EUR 16 million on the recycling of currency translation differences (Note 1.1.4.), resulting a total impact of EUR 1,117 million.
In addition, net profit/(loss) for the year was impacted by a profit of EUR 361 million (EUR 299 million impact on net income) from discontinued operations relating mainly to two divestment transactions:
– The profit of EUR 246 million from the Services business (Notes 1.1.3 and 2.9), relating primarily to the Environment activity (Spain and Portugal) sold on 1 December, as explained in Note 1.1.4, with an impact of EUR 335 million.
– The profit from the sale of the Budimex Group’s Polish real estate business (B.N.I.) on 22 February at a gain of EUR 107 million before non-controlling interests, recognized on the discontinued operations line, and EUR 53 million in net profit/(loss) (after non-controlling interests).
Other non-recurring effects on the impairment and disposals line amounting to EUR 22 million relate basically to sale transactions in the Construction Division, particularly the gain on the divestment of the 19.86% ownership interest in Nalanda, the sale of 22% of Urbicsa and the divestment in Figueras.
Setting aside all these impacts, together with others relating to the measurement of ineffective derivatives and the regularization of prior-year taxes, the group’s result would be EUR -226 million, as broken down in the accompanying table.
This result is still affected by the impact of COVID-19 on the Airports business, particularly on Heathrow Airport (HAH), the investment carried in equity-accounted assets at 31 December 2020 (EUR 205 million) having fallen to zero after losses for the year; and the impact of the AGS airports, for which losses of EUR 20 million have been recognized, also reducing the ownership interest to zero.
Finally, the Tolls Roads and Construction businesses improved compared with 2020 from an operational viewpoint, as explained in more detail in the Management Report.
SECTION 2: PROFIT/(LOSS) FOR THE YEAR
Balances at 31/12/2021 Non-recurring impacts Profit/(loss) before tax Net profit/(loss) Net income 964 1,197
I-66 Capital gain (Note 2.5) 1,117 1,117
Services discontinued 0 299
Other Capital gain 21 14 Other impacts -116 -7 Net income Like – for -Like -58 -226

SECTION 2: PROFIT/(LOSS) FOR THE YEAR
INTEGRATED ANNUAL REPORT 2021 CONSOLIDATED ANNUAL ACCOUNTS
222
NOTES ON PROFIT/(LOSS) FOR CONTINUING OPERATIONS
2.1. OPERATING INCOME
The detail of the Group's operating income at 31 December 2021 is as follows:
(*) Restated figures (Note 1.1.5)
The Group's revenue at 31 December 2021 relating to contracts with customers, as interpreted by IFRS 15, amounts to EUR 6,678 million (Note 4.4).
Revenue includes the financial income for the services provided by the concession operators that apply the financial asset model, amounting to EUR 15 million in 2021 (2020: EUR 18 million).
“Other operating income” includes the impact of the grants related to income received in 2021 amounting to EUR 1 million (2020: EUR 3 million).
The breakdown of revenue by segment and the comparison with the prior year is as follows:
The inter-segment sales that are not eliminated in the Group's consolidated financial statements are the sales made by the Construction Division to the infrastructure concession operators, as discussed in Notes 1.2.2 and Note 6.8.
In “Other activities”, sales relate to the Energy Infrastructure, Mobility and Waste Treatment Plants businesses, as mentioned in Note 1.1.2
The breakdown of sales by geographical area is as follows:
(*) Restated figures (Note 1.1.5)
The Ferrovial Group's sales in its five main markets account for 91% of total sales.
2.2. OTHER OPERATING EXPENSES
Operating expenses mainly include work carried out by other companies and changes in provisions for the year:
(*) Restated figures (Note 1.1.5)
2.3. STAFF COSTS
The detail of staff costs is as follows:
(*) Restated figures (Note 1.1.5)
Compared to the previous year, the impact on the income statement in relation to remuneration systems based on the delivery of shares stands out, which has generated an income of 10 million euros (-10 million euros spent in 2020) with a counterpart in net worth. The recognition of this income is due to the partial reversal of the provision endowed in previous years, since both in the plan that expired in 2021 and the one that expires in 2022, the degree of compliance with the conditions entitled to receive remuneration has been lower than that initially considered.
The detail of the number of employees at 31 December 2021 compared to 2020, by professional category and gender, is broken down by continuing and discontinued operations in the following tables:
(Millions of euros) 2021 2020 (*) Revenue 6,778 6,532 Other operating income 1 3
Total operating income 6,779 6,534
2021
(Millions of euros) External sales Intersegment sales Total Var.
% Construction 5,044 1,033 6,077 2% Toll roads 587 1 588 34%
Airports 1 1 2 100%
Other activities 129 148 277 18 %
Adjustments 0 -166 -166 31%
Total 5,761 1,017 6,778 4%
2020 (Millions of euros) External sales Intersegment
sales Total
Construction 4,955 1,029 5,984 Toll roads 438 1 439
Airports 1 0 1
Other activities 115 120 235
Adjustments 0 -127 -127
Total 5,508 1,024 6,532
(Millions of euros) 2021 2020 (*) Var. 21/20
USA 2,639 2,558 81 Poland 1,735 1,726 9
Spain 1,092 981 111
UK 644 524 120
Canada 80 87 -7
Other 589 656 -67
TOTAL 6,778 6,532 246
Millions of euros 2021 2020 (*) Var. Subcontracted work 2,824 2,922 -98
Leases 228 235 -7
Repairs and maintenance 66 68 -2
Independent professional services 323 276 46
Changes in provisions for liabilities (Note 6.3) 51 157 -106
Other operating expenses 404 267 137
Total other operating expenses 3,897 3,926 -30
(Millions of euros) 2,021 2020 (*) VAR. Wages and salaries 1,036 1,025 -11
Social security 142 143 1
Pension plan contributions 10 10 -1
Share-based payments -10 10 20
Other welfare expenses 30 24 -6
TOTAL 1,208 1,212 3

CONSOLIDATED ANNUAL ACCOUNTS FERROVIAL, S.A. AND SUBSIDIARIES
223
(*) Restated figures (Note 1.15)
(*) Restated figures (Note 1.15)
At 31 December 2021, there were 2,963 employees with a disability rating of 33% or more, including continuing and discontinued operations, accounting for 4.7% of the total workforce at year-end.
The average workforce by business division for the two periods being compared is as follows:
BUSINESS 31/12/2020 (*)
MEN WOMEN TOTAL
Construction 14,132 2,722 16,853 Toll roads 328 154 482 Airports 31 18 49 Other 773 254 1,027 TOTAL CONTINUING OPERATIONS 15,264 3,148 18,411 TOTAL DISCONTINUED OPERATIONS 42,298 23,596 65,895 TOTAL 57,562 26,744 84,306 (*) Restated figures (Note 1.15)
2.4. EBITDA AND EBIT BEFORE IMPAIRMENTS AND DISPOSALS
EBITDA at 31 December 2021 amounted to EUR 596 million (31 December 2020: EUR 406 million), representing an increase of 47% compared to the previous year, primarily due to the improvements in the Toll Roads and Construction Divisions.
Fixed asset depreciation charges for 2021 totaled EUR 259 million as compared with EUR 233 million in the previous year.
The Management Report provides a detailed analysis of the way these line items have performed by business.
2.5. IMPAIRMENT AND DISPOSALS
The following section contains a breakdown of the main gains and losses relating to impairment and disposals:
Profit/(loss) recognized in 2021:
The amount recognized in respect of impairment and disposals in 2021 came to a total of EUR 1,139 million and primarily related to the following transactions:
– Acquisition by Cintra of an additional 5.704% of the concession operator I-66 Express Mobility Partners Hold. LLC (Note 1.1.4.). Following this acquisition, the ownership interest stands at 55.704% and the toll road is now fully consolidated since Cintra has control. This transaction entails recognizing a capital gain of EUR 1,101 million due to measuring Ferrovial’s pre-existing 50% interest at fair value. The Total profit the operation is 1,117 million, as it includes 16 million recycling of conversion differences.
– Capital gain of EUR 17 million on the divestment of Ferrovial Construcción S.A.’s 19.86% interest in Nalanda to Nadina Luxco S.A.R.L. (EUR 17 million in Net profit).
– Sale of Ferrovial Construcción S.A.’s 22% interest in Urbicsa at a gain of EUR 16 million (EUR 16 million in Net profit).
– Capital loss of EUR -9 million incurred in September 2021 on the divestment of Figueras. Figueras was classified as held for sale up until August.
31/12/2021 CONTINUING OPERATIONS
MEN WOMEN TOTAL VAR. 21/20 CATEGORY
Executive directors 2 0 2 0 % Senior managers 12 1 13 0 % Executives 99 13 112 17 % Managers/Professionals/Supervisors 6,178 2,386 8,564 129 % Administrative/Support personnel 500 536 1,036 42 % Manual workers 8,623 330 8,953 -88 % TOTAL 15,414 3,266 18,680 -1 %
31/12/2020 (*) CONTINUING OPERATIONS MEN WOMEN TOTAL Executive directors 2 0 2
Senior managers 13 1 14
Executives 143 10 153
Managers/Professionals/Supervisors 6,562 2,319 8,881
Administrative/Support personnel 554 585 1,139
Manual workers 8,459 276 8,735
TOTAL 15,733 3,191 18,924
DISCONTINUED OPERATIONS 31/12/2021 CATEGORY MEN WOMEN TOTAL VAR.
21/20 Executive directors 0 0 0 0 % Senior managers 0 0 0 0 % Executives 18 4 22 -21 % Managers/Professionals/Supervisors 6,598 1,952 8,550 -3 % Administrative/Support personnel 129 551 680 -44 % Manual workers 18,235 16,903 35,138 -31 % TOTAL 24,980 19,410 44,390 -27 %
DISCONTINUED OPERATIONS 31/12/2020 (*) CATEGORY MEN WOMEN TOTAL Executive directors 0 0 0 Senior managers 0 0 0 Executives 23 5 28 Managers/Professionals/Supervisors 6,502 2,353 8,855 Administrative/Support personnel 356 862 1,218 Manual workers 31,549 19,546 51,095 TOTAL 38,430 22,766 61,196
BUSINESS 31/12/2021
MEN WOMEN TOTAL VAR. 21/20
Construction 14,344 2,777 17,121 2 % Toll roads 316 152 469 -3 % Airports 32 14 46 -5 % Other 743 257 1,000 -3 % TOTAL CONTINUING OPERATIONS 15,435 3,200 18,636 1 % TOTAL DISCONTINUED OPERATIONS 37,476 22,424 59,899 -9 % TOTAL 52,911 25,624 78,535 -7 %

SECTION 2: PROFIT/(LOSS) FOR THE YEAR
INTEGRATED ANNUAL REPORT 2021 CONSOLIDATED ANNUAL ACCOUNTS
224
Impact on profit/(loss) before tax Impact on net profit/(loss) (Millions of euros)
Before fair value adjustments
Fair value adjustments
Total 2021
Acquisition of 5.704% of I-66 16 1,101 1,117 1,117 Nalanda sale 17 0 17 17 Urbicsa sale 17 0 17 17 Nevasa sale 1 0 1 1 Figueras sale -9 0 -9 -9 Income from capital gains and disposals 41 1,101 1,141 1,141
Impairment losses FB Serwis -3 0 -3 -3 Impairment gains/(losses) -3 0 -3 -3 TOTAL IMPAIRMENT AND DISPOSALS 38 1,101 1,139 1,139
The gains/(losses) relating to impairment and disposals in 2020 essentially related to the following:
(*) Restated figures (Note 1.1.5)
2.6. NET FINANCIAL INCOME/(EXPENSE)
The following table gives a detailed, item-by-item breakdown of the changes in net financial income/(expense) in 2021 and 2020. The profit/(loss) generated by the infrastructure project companies is presented separately from the result of non-infrastructure project companies (see the definition in Note 1.1.2) and in each of them a further distinction is made between the financial income from financing (which includes the finance costs on credits and loans with credit institutions and bonds, and the returns on financial investments and loans granted) and the net financial income/(expense) from derivatives and other items, which includes the impact of the fair value measurement of ineffective hedges and other income and expenses not directly related to financing.
(*) Included in the fair value column in relation to the net financial income/(expense) in the consolidated income statement for a total amount of EUR -83 million in 2021 and EUR 44 million in 2020.
(*) Restated figures (Note 1.1.5)
The following table provides a breakdown of infrastructure project companies financial expense, breaking down capitalized expenses from toll roads under construction:
(*) Restated figures (Note 1.1.5)
The change in profit/(loss) from financing is explained mainly by the increase in capitalized expenses compared to 2020 (EUR 11 million), of which EUR 7 million relates to the concession company I-66, which was previously equity-accounted method and is now controlled and fully consolidated following the acquisition of an additional 5.704%.
• The main effect recognized under gains/(losses) on derivatives and other fair value adjustments to infrastructure projects relates to the speculative part of the index-linked swap (ILS) associated with the Autema project carried at a fair value of EUR -84 million (EUR -64 million in net profit/(loss)).
• The financial income from ex-infrastructure project companies in 2021 amounted to EUR -26 million (31 December 2020: EUR -8 million), relating to external borrowing costs (EUR -50 million) and financial income primarily obtained from financial investments (EUR 24 million). The change over 2020 is primarily due to the lower return from cash resources in Canada compared to the previous financial year.
Impact on profit/(loss) before tax Impact on net profit/(loss) (Millions of euros)
Before fair value adjustments
Fair value adjustments
Total 2020 (*)
Sale of Zity ownership interest 2 5 7 7 Sale of the stake in the Portuguese toll roads -2 0 -2 -1 Income from capital gains and disposals 0 5 5 6 Autema 0 10 10 6 Impairment gains/(losses) 0 10 10 6 TOTAL IMPAIRMENT AND DISPOSALS 0 15 15 12
Millions of euros 2021 2020 (*)
Change (%)
Financial income from infrastructure project financing 0 8 -100 % Financial expense from infrastructure project financing -220 -252 13 % Net financial income/(expense) from infrastructure project financing -220 -244 10 % Profit/(loss) on derivatives and other fair value adjustments from infrastructure projects (*) -84 39 287 % Other net financial income/(expense) from infrastructure projects -3 -2 -50 % Other net financial income/(expense) from infrastructure projects -87 37 305 % Total net financial income/(expense) from infrastructure projects -307 -207 -43 % Financial income from other company financing 24 43 -44 % Financial expense from other company financing -50 -51 2 % Net financial income/(expense) from other company financing -26 -8 -225 % Profit/(loss) on derivatives and other fair value adjustments from other companies (*) 1 5 -80 % Net financial income/(expense) from other companies -2 -33 -97 % Other net financial income/(expense) from other companies -1 -28 -100 % Total net financial income/(expense) from other companies -27 -36 -28 %
NET FINANCIAL INCOME/(EXPENSE) -334 -243 -33%
Infrastructure project financing expenses 2021 2020 (*)
from infrastructures (Millions of euros) Accrued financial expenses -257 -270 Expenses capitalized during the construction period 37 26 Financial expenses in P&L -220 -244

CONSOLIDATED ANNUAL ACCOUNTS FERROVIAL, S.A. AND SUBSIDIARIES
225
• Other net financial income/(expense) from ex-infrastructure projects include the impact of derivatives and other fair value adjustments primarily relating to the impact of the derivatives not designated as hedges, including most notably, equity swaps arranged by the Group to hedge the impact on equity of variable share-based remuneration schemes (Note 6.7) with an impact of EUR 14 million due to the good performance of the share price in 2021, as well as the negative impact from the exchange rate hedges that the Group has contracted in Canadian dollars, pound sterling and US dollars.
Excluding the effects caused by derivatives, the remaining net financial income/(expense) from ex-infrastructure project companies are shown below:
(*) Restated figures (Note 1.1.5)
The main change in relation to the previous year is explained by foreign exchange differences (EUR 39 million compared to December 2020), due basically to the company’s US dollar cash resources and specifically to the adverse impact of the dollar’s depreciation and trend during 2020. This year, the impact was positive due to the dollar’s appreciation against the euro (Note 1.4). The "Other" sub-caption includes in 2021 the amount of the invoicing of guarantees for projects accounted for using the equity method (EUR 5 million).
Impact on cash flow: as can be observed in the following table, the difference between the net financial income/(expense) on financing and the interest cash flows reported in the cash flow statement is EUR 12 million.
This difference at the project level arose mainly in the US toll roads (NTE, LBJ, NTE Segment 3, I-77 and I-66), whose financing arrangements allow for the compounding of interest in the first years of the concession, as a result of which the interest is added to the principal and does not give rise to a cash outflow during the year, as well as accrued unmatured interest.
2.7. SHARE OF PROFITS OF EQUITY-ACCOUNTED COMPANIES
The share of the net profit of equity-accounted companies in 2021 amounted to EUR -178 million (2020: EUR -373 million). The detail of the most significant companies is as follows:
The loss of EUR -238 million contributed by HAH to Ferrovial, does not reflect 25% of the loss reported by HAH due to the application of IAS 28, which states that if the share of an associate’s losses equals or exceeds the interest in the associate, the investor must not recognize its share of further losses, unless there are legal or constructive obligations justifying the recognition of a liability for additional losses once the investment value is reduced to zero.
The 407 ETR toll road improved in relation to December 2020 (EUR 19 million) due to the effect on traffic of the gradual lifting of Covid-19 mobility restrictions during the year.
EUR -20 million (EUR -51 million in 2020) of the loss contributed for the year by AGS relates to the capital injection of GBP 17.5 million carried out following closure of the agreement to amend and extend the facility agreement on 18 June, whereby the shareholders undertook to make capital contributions and loans in proportion to their shareholdings (50%).
EUR 28 million on the “Other” line relates mainly to the results of the Slovakian toll road Zero-Bypass (EUR 5 million) and the Australian toll road Netflow OSARs (EUR 4 million), as well as the maintenance contract for Madrid Calle 30 (EUR 5 million) and the cleaning and maintenance services at Doha Airport in Qatar (EUR 4 million). The remaining projects had an impact of EUR 10 million.
Note 3.5 provides greater detail on the profit/(loss) of these companies.
2.8. CORPORATE INCOME TAX AND DEFERRED TAXES
2.8.1. Explanation of the corporate income tax expense for the year and the applicable tax rate
In 2021, income tax income was recognized in the amount of EUR 9 million (income of EUR 34 million in 2020).
To explain the reasonableness of this tax revenue is necessary to consider two effects:
• Income tax expense or income that is not related to the result for the year. Eliminating these impacts, we arrive at the adjusted tax expense for the year (EUR 26 million).
• Results that do not generate tax impact. Eliminating these effects, we would arrive at the Fiscal Result for the year (EUR -84 million).
Adjusted tax expense:
• Excluding an expense of EUR 17 million (EUR 44 million in 2020), which corresponds to items not related to the result for the year, and to regularizations of prior years' taxes (including regularization of deferred tax assets and liabilities) and provisions for tax litigation.
Other net financial income/(expense) from ex-infrastructure project companies 2021 2020 (*) Var. 21/20 (Millions of euros) Cost of bank guarantees -29 -27 -2 Financial provision for transition to IFRS 9 -1 0 -1 Late-payment interest 6 9 -3 Foreign exchange differences 12 -27 39 Interest on tax assessments -6 -7 1 Security deposit income, associates 12 19 -7 Other 5 0 5 TOTAL -1 -33 32
NET FINANCIAL INCOME/(EXPENS
E) NOT CAPITALISED
INTEREST CASH FLOW DIFFERENCE
Infrastructure projects -257 -253 -4 Ex-infrastructure project
-26 -42 16
TOTAL -283 -295 12
Profit/(loss) of equity-accounted companies 2021 2020
(Millions of euros) HAH -238 -396 407 ETR 52 33 AGS -20 -51 Other 28 41 TOTAL -178 -373

SECTION 2: PROFIT/(LOSS) FOR THE YEAR
INTEGRATED ANNUAL REPORT 2021 CONSOLIDATED ANNUAL ACCOUNTS
226
Excluding these impacts, the adjusted income tax income in relation to the results for the year would be EUR 26 million.
Tax results
Excluding from profit before tax (EUR 964 million) the result of the companies accounted for using the equity method (net loss of EUR -178 million), the positive result from the fair value revaluation of 50% of I-66 Express Mobility Partners amounting to EUR 1,117 million (see note 1.1.4) which has no tax impact and the remaining permanent differences (EUR -109 million), we would arrive at a tax result of EUR -84 million.
The aforementioned permanent differences mainly correspond to expenses or income for the year which, in accordance with the tax regulations applicable in each country, are not deductible (expenses) or taxable (income) in the year, nor are they expected to be deductible or taxable in future years. The cumulative balance of this item is EUR -109 million, the most significant adjustments being as follows:
◦ Losses primarily generated in international construction projects for which, in accordance with the prudence principle of accounting, no tax credit has been recognized (EUR 28 million).
◦ Non-taxable income due to the use of tax-loss carryforwards amounting to EUR -46 million.
◦ Exempt capital gains on the sale of shareholdings in the Construction Division (Urbicsa, Nalanda, Figueras), the Mobility Division (Car Sharing) and the Services Division (Nevasa) amounting to EUR -39 million (Note 1.1.4).
◦ Profit/(loss) on consolidation with no tax impact. This item relates to profit/(loss) derived from applying accounting consolidation criteria, which do not have any tax implication. The accumulated balance for this concept is an of EUR -38 million that primarily relates to losses in concession project companies in the US and Canada, and which are fully consolidated. However, the associated tax credit is recognized solely at Ferrovial's percentage of ownership as these companies are taxed under pass-through tax rules; the shareholders of these companies are the taxpayers, at the percentage of ownership that they hold.
This tax result of -84 million euro would compare with adjusted income tax income of 26 million euro for the year, resulting in an effective income tax rate of 31%, which is in line with the rate applicable in the main countries in which Ferrovial operates.
(*) The country’s effective tax rate is the result of combining the tax rates and taxes (federal, state and municipal) applicable in each country.
The following table includes the detail of the calculation of the effective tax rate for 2020.
(*) The country’s effective tax rate is the result of combining the tax rates and taxes (federal, state and municipal) applicable in each country.
DECEMBER 2021 SPAIN UNITED
KINGDOM UNITED STATES POLAN
D CANADA REST OF COUNTR
IES TOTAL (Million euros) Profit/(loss) before tax -86 -263 1,144 123 62 -17 964
Profit/(loss) from equity-accounted companies
-8 253 0 0 -54 -14 178
Purchase of 5.704% of I-66 Express Mobility Partners LLC
-1,117 -1,117
Other permanent differences -39 -17 -42 -20 1 6 -109
Taxable income -132 -26 -15 104 10 -25 -84 Taxable expense for the year 57 6 10 -19 -3 -41 9
Other adjustments -23 -1 -6 0 0 47 17
Adjusted tax expense 34 5 4 -20 -3 6 26
Effective rate applicable to taxable income
25 % 20 % 25 % 19 % 26 % 24 % 31 % Effective national tax rate (*) 25 % 19 % 23 % 19 % 26.5 %
2020 SPAIN UK US POLAN
D CANADA OTHER COUNTRI
ES (*) TOTAL (Millions of euros) Profit/(loss) before tax -72 -460 -76 115 45 21 -427
Profit/(loss) from equity-accounted companies
-9 447 0 0 -35 -31 373
Permanent differences -1 18 13 28 4 36 98 Profit/(loss) on consolidation with no tax impact
0 0 20 0 2 8 30
Taxable income -82 5 -44 143 16 35 74 Tax expense for the year 56 0 23 -25 -5 -14 34
Change to the prior-year tax evaluation -37 -1 -11 -2 1 6 -44
Adjusted tax expense 20 -1 11 -27 -4 -9 -10
Effective rate applicable to taxable income
24 % 19 % 26 % 19 % 25 % 25 % 13 %
Effective national tax rate 25 % 19 % 23 % 19 % 27 %
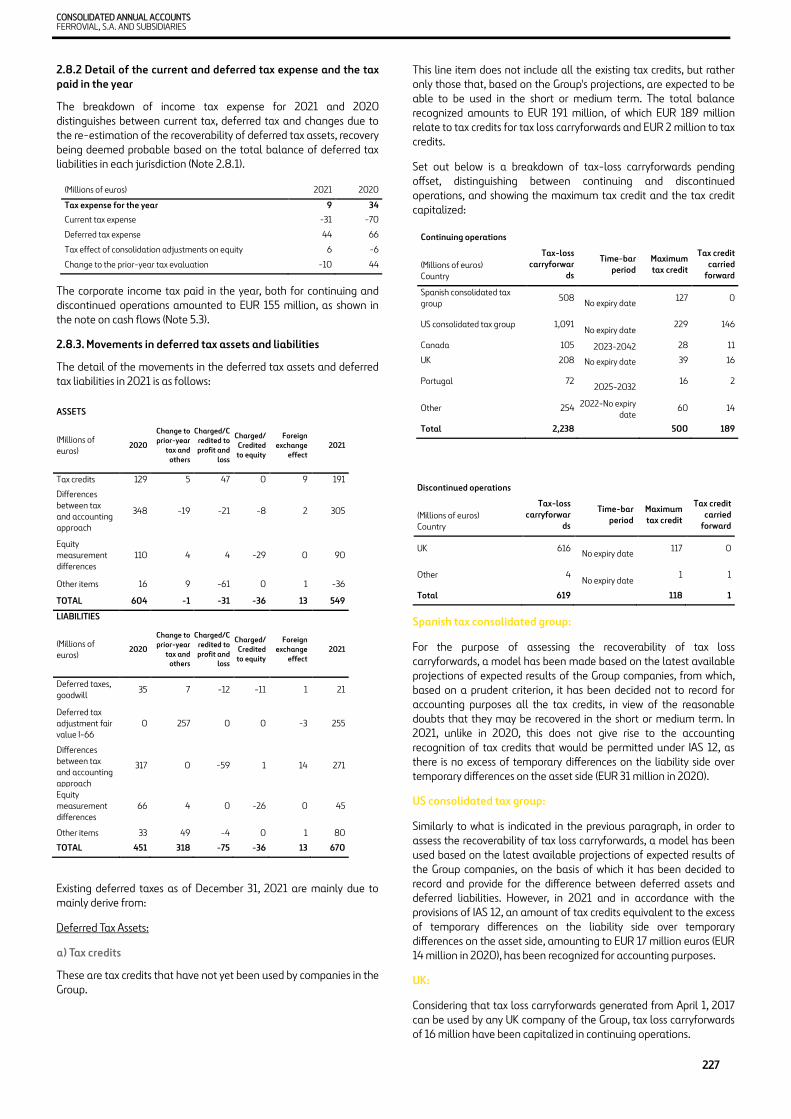
CONSOLIDATED ANNUAL ACCOUNTS FERROVIAL, S.A. AND SUBSIDIARIES
227
2.8.2 Detail of the current and deferred tax expense and the tax paid in the year
The breakdown of income tax expense for 2021 and 2020 distinguishes between current tax, deferred tax and changes due to the re-estimation of the recoverability of deferred tax assets, recovery being deemed probable based on the total balance of deferred tax liabilities in each jurisdiction (Note 2.8.1).
The corporate income tax paid in the year, both for continuing and discontinued operations amounted to EUR 155 million, as shown in the note on cash flows (Note 5.3).
2.8.3. Movements in deferred tax assets and liabilities
The detail of the movements in the deferred tax assets and deferred tax liabilities in 2021 is as follows:
Existing deferred taxes as of December 31, 2021 are mainly due to mainly derive from:
Deferred Tax Assets:
a) Tax credits
These are tax credits that have not yet been used by companies in the Group.
This line item does not include all the existing tax credits, but rather only those that, based on the Group's projections, are expected to be able to be used in the short or medium term. The total balance recognized amounts to EUR 191 million, of which EUR 189 million relate to tax credits for tax loss carryforwards and EUR 2 million to tax credits.
Set out below is a breakdown of tax-loss carryforwards pending offset, distinguishing between continuing and discontinued operations, and showing the maximum tax credit and the tax credit capitalized:
Spanish tax consolidated group:
For the purpose of assessing the recoverability of tax loss carryforwards, a model has been made based on the latest available projections of expected results of the Group companies, from which, based on a prudent criterion, it has been decided not to record for accounting purposes all the tax credits, in view of the reasonable doubts that they may be recovered in the short or medium term. In 2021, unlike in 2020, this does not give rise to the accounting recognition of tax credits that would be permitted under IAS 12, as there is no excess of temporary differences on the liability side over temporary differences on the asset side (EUR 31 million in 2020).
US consolidated tax group:
Similarly to what is indicated in the previous paragraph, in order to assess the recoverability of tax loss carryforwards, a model has been used based on the latest available projections of expected results of the Group companies, on the basis of which it has been decided to record and provide for the difference between deferred assets and deferred liabilities. However, in 2021 and in accordance with the provisions of IAS 12, an amount of tax credits equivalent to the excess of temporary differences on the liability side over temporary differences on the asset side, amounting to EUR 17 million euros (EUR 14 million in 2020), has been recognized for accounting purposes.
UK:
Considering that tax loss carryforwards generated from April 1, 2017 can be used by any UK company of the Group, tax loss carryforwards of 16 million have been capitalized in continuing operations.
(Millions of euros) 2021 2020 Tax expense for the year 9 34 Current tax expense -31 -70 Deferred tax expense 44 66 Tax effect of consolidation adjustments on equity 6 -6 Change to the prior-year tax evaluation -10 44
ASSETS (Millions of euros) 2020
Change to prior-year
tax and others
Charged/Credited to profit and
loss Charged/
Credited to equity
Foreign exchange
effect 2021
Tax credits 129 5 47 0 9 191 Differences between tax and accounting approach
348 -19 -21 -8 2 305
Equity measurement differences
110 4 4 -29 0 90
Other items 16 9 -61 0 1 -36 TOTAL 604 -1 -31 -36 13 549 LIABILITIES (Millions of euros) 2020
Change to prior-year
tax and others
Charged/Credited to profit and
loss Charged/
Credited to equity
Foreign exchange
effect 2021
Deferred taxes, goodwill 35 7 -12 -11 1 21 Deferred tax adjustment fair value I-66
0 257 0 0 -3 255
Differences between tax and accounting approach
317 0 -59 1 14 271
Equity measurement differences
66 4 0 -26 0 45
Other items 33 49 -4 0 1 80 TOTAL 451 318 -75 -36 13 670
Continuing operations (Millions of euros) Country
Tax-loss carryforwar
ds Time-bar
period Maximum tax credit
Tax credit carried
forward Spanish consolidated tax group 508 No expiry date 127 0 US consolidated tax group 1,091
No expiry date 229 146 Canada 105 2023-2042 28 11 UK 208 No expiry date 39 16 Portugal 72
2025-2032 16 2
Other 254 2022-No expiry date 60 14
Total 2,238 500 189
Discontinued operations (Millions of euros) Country
Tax-loss carryforwar
ds Time-bar
period Maximum tax credit
Tax credit carried
forward UK 616 No expiry date 117 0 Other 4
No expiry date 1 1 Total 619 118 1

SECTION 2: PROFIT/(LOSS) FOR THE YEAR
INTEGRATED ANNUAL REPORT 2021 CONSOLIDATED ANNUAL ACCOUNTS
228
b) Assets and liabilities arising from temporary differences between accounting and tax criteria
This item relates to the tax impact resulting from the fact that the timing of recognition of certain expenses or income is different for accounting and tax purposes.
The recognition of an asset means that certain expenses have been recognized for accounting purposes before their recognition for tax purposes and therefore the company will recover the income or expense for tax purposes in future years.
The deferred tax assets include most notably:
• Provisions recognized for accounting purposes which do not have a tax effect until they are materialized (EUR 182 million).
• Deferred tax assets of EUR 134 million arising as a result of differences between the tax and accounting methods used to recognize income, mainly in the Construction Division.
• Accelerated depreciation and amortization for accounting purposes (EUR 4 million).
c) Deferred taxes arising from equity measurement adjustments
This reflects the cumulative tax impact resulting from measurement adjustments recognized in reserves. The impact appears as an asset or liability since there is generally no direct tax effect until the amount in reserves is recognized in profit/(loss).
The asset balance relates to accumulated losses in reserves that will have a tax impact when they are recognized in profit/(loss). Deferred tax assets primarily relate to financial derivatives amounting to EUR 90 million.
Deferred tax liabilities:
a) Deferred taxes on goodwill
Deferred tax liabilities related to the tax deduction of goodwill are included, amounting to EUR 21 million, mainly related to the amortization of the goodwill of Webber, LLC.
b) Deferred tax liabilities due to fair value adjustment I-66 Mobility Partners
Deferred tax liabilities related to differences between tax and book values are included:
• €218 million recognized for the difference between tax and book values following the revaluation on the assets of the I-66 toll road.
• EUR 37 million recognized as a result of valuing the concession debt at fair value.
These EUR 220 million and EUR 37 million have been recorded, as indicated in paragraph 66 of IAS 12, with a balancing entry of goodwill for the same amount (see note 1.1.4).
c) Assets and liabilities arising from temporary differences between accounting and tax criteria
A liability for this concept represents an expense recognized for tax purposes prior to its recognition for accounting purposes, or income recorded for accounting purposes prior to its recognition for tax purposes.
The balance of the liabilities relates mainly to:
• Deferred tax liabilities resulting from differences between tax and accounting amortization (EUR 176 million).
• Deferred tax assets of EUR 54 million arising as a result of differences between the tax and accounting methods used to recognize income in accordance with IFRIC 12, mainly in the Toll Road Division.
d) Deferred taxes arising from equity measurement adjustments
This reflects the cumulative tax impact resulting from measurement adjustments recognized in reserves. The impact appears as an asset or liability since there is generally no direct tax effect until the amount in reserves is recognized in profit/(loss).
The existence of deferred liabilities corresponds to profits pending to be realized for tax purposes. Most of these relate to deferred liabilities for financial derivatives amounting to EUR 45 million.
Deferred taxes on other items
e) Deferred taxes relating to dividends pending payment by investees
The Group has recognized EUR 41 million as a deferred tax liability relating to withholding tax on the repatriation of future dividends from Canada.
The detail of the
(Millions of euros) 2019
Change to prior-year
tax and others
Charged/Credited to
profit and loss
Charged/Credited to equity
Foreign exchange
effect 2020
Tax credits 54 15 67 0 -6 129 Differences between tax and
337 14 15 0 -19 348 Equity measurement differences
115 -4 0 0 -1 110
Other items -3 15 5 3 -1 16 TOTAL 502 39 87 3 -27 604 LIABILITIES (Millions of euros) 2019
Change to prior-year
tax and others
Charged/Credited to
profit and loss
Charged/Credited to equity
Foreign exchange
effect 2020
Deferred taxes, goodwill 38 2 -2 0 -2 35 Differences between tax and
311 -5 26 1 -16 317 Equity measurement differences
115 -1 0 -47 0 66
Other items 12 28 -2 -4 0 33 TOTAL 475 23 21 -50 -18 451
2.8.4. Years subject to tax inspection
In accordance with prevailing legislation, taxes may not be deemed to be finally settled until the returns filed have been inspected by the tax authorities or the limitation period established by law has elapsed.
At present, the consolidated group is not undergoing a tax inspection by the Spanish authorities and has not been notified of the start of any inspection.
The following inspections are in progress internationally:
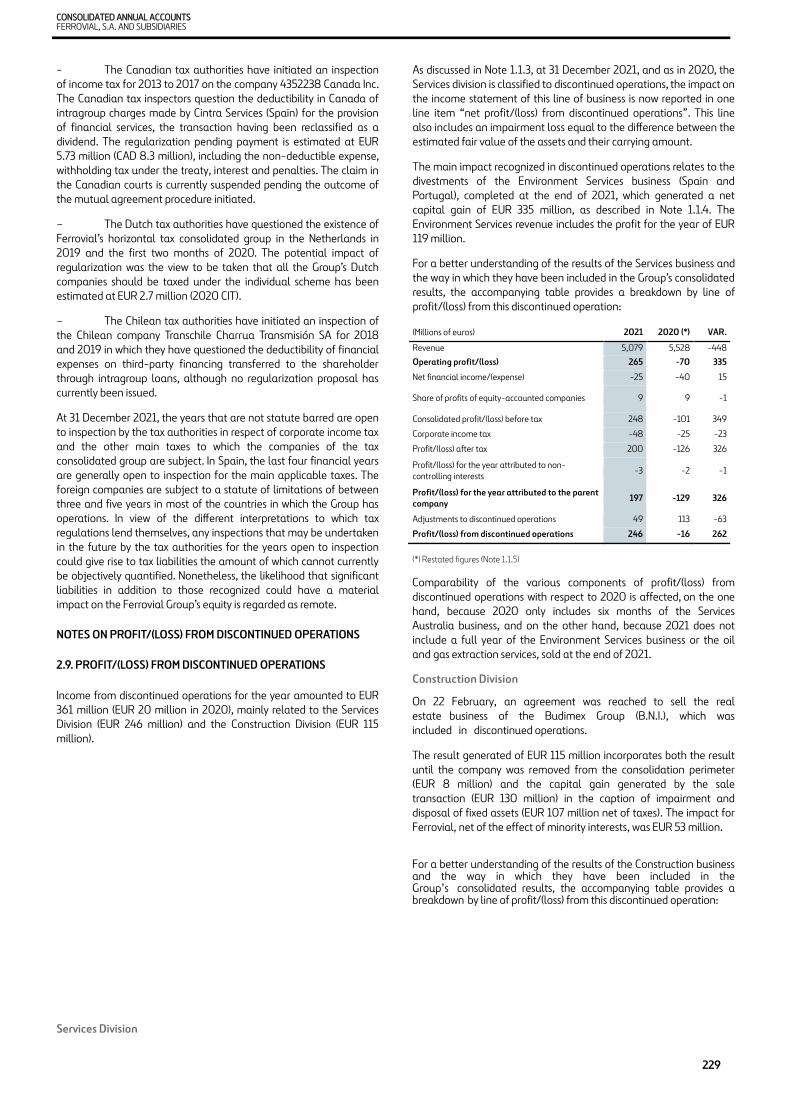
CONSOLIDATED ANNUAL ACCOUNTS FERROVIAL, S.A. AND SUBSIDIARIES
229
- The Canadian tax authorities have initiated an inspectionof income tax for 2013 to 2017 on the company 4352238 Canada Inc. The Canadian tax inspectors question the deductibility in Canada ofintragroup charges made by Cintra Services (Spain) for the provisionof financial services, the transaction having been reclassified as adividend. The regularization pending payment is estimated at EUR5.73 million (CAD 8.3 million), including the non-deductible expense, withholding tax under the treaty, interest and penalties. The claim inthe Canadian courts is currently suspended pending the outcome ofthe mutual agreement procedure initiated.
– The Dutch tax authorities have questioned the existence ofFerrovial’s horizontal tax consolidated group in the Netherlands in2019 and the first two months of 2020. The potential impact ofregularization was the view to be taken that all the Group’s Dutchcompanies should be taxed under the individual scheme has beenestimated at EUR 2.7 million (2020 CIT).
– The Chilean tax authorities have initiated an inspection ofthe Chilean company Transchile Charrua Transmisión SA for 2018 and 2019 in which they have questioned the deductibility of financial expenses on third-party financing transferred to the shareholderthrough intragroup loans, although no regularization proposal hascurrently been issued.
At 31 December 2021, the years that are not statute barred are open to inspection by the tax authorities in respect of corporate income tax and the other main taxes to which the companies of the tax consolidated group are subject. In Spain, the last four financial years are generally open to inspection for the main applicable taxes. The foreign companies are subject to a statute of limitations of between three and five years in most of the countries in which the Group has operations. In view of the different interpretations to which tax regulations lend themselves, any inspections that may be undertaken in the future by the tax authorities for the years open to inspection could give rise to tax liabilities the amount of which cannot currently be objectively quantified. Nonetheless, the likelihood that significant liabilities in addition to those recognized could have a material impact on the Ferrovial Group’s equity is regarded as remote.
NOTES ON PROFIT/(LOSS) FROM DISCONTINUED OPERATIONS
2.9. PROFIT/(LOSS) FROM DISCONTINUED OPERATIONS
Income from discontinued operations for the year amounted to EUR 361 million (EUR 20 million in 2020), mainly related to the Services Division (EUR 246 million) and the Construction Division (EUR 115 million).
Services Division
As discussed in Note 1.1.3, at 31 December 2021, and as in 2020, the Services division is classified to discontinued operations, the impact on the income statement of this line of business is now reported in one line item “net profit/(loss) from discontinued operations”. This line also includes an impairment loss equal to the difference between the estimated fair value of the assets and their carrying amount.
The main impact recognized in discontinued operations relates to the divestments of the Environment Services business (Spain and Portugal), completed at the end of 2021, which generated a net capital gain of EUR 335 million, as described in Note 1.1.4. The Environment Services revenue includes the profit for the year of EUR 119 million.
For a better understanding of the results of the Services business and the way in which they have been included in the Group’s consolidated results, the accompanying table provides a breakdown by line of profit/(loss) from this discontinued operation:
(Millions of euros) 2021 2020 (*) VAR. Revenue 5,079 5,528 -448
Operating profit/(loss) 265 -70 335
Net financial income/(expense) -25 -40 15
Share of profits of equity-accounted companies 9 9 -1
Consolidated profit/(loss) before tax 248 -101 349
Corporate income tax -48 -25 -23
Profit/(loss) after tax 200 -126 326
Profit/(loss) for the year attributed to non-controlling interests -3 -2 -1
Profit/(loss) for the year attributed to the parent company 197 -129 326
Adjustments to discontinued operations 49 113 -63
Profit/(loss) from discontinued operations 246 -16 262
(*) Restated figures (Note 1.1.5)
Comparability of the various components of profit/(loss) from discontinued operations with respect to 2020 is affected, on the one hand, because 2020 only includes six months of the Services Australia business, and on the other hand, because 2021 does not include a full year of the Environment Services business or the oil and gas extraction services, sold at the end of 2021.
Construction Division
On 22 February, an agreement was reached to sell the real estate business of the Budimex Group (B.N.I.), which was included in discontinued operations.
The result generated of EUR 115 million incorporates both the result until the company was removed from the consolidation perimeter (EUR 8 million) and the capital gain generated by the sale transaction (EUR 130 million) in the caption of impairment and disposal of fixed assets (EUR 107 million net of taxes). The impact for Ferrovial, net of the effect of minority interests, was EUR 53 million.
For a better understanding of the results of the Construction business and the way in which they have been included in the Group’s consolidated results, the accompanying table provides a breakdown by line of profit/(loss) from this discontinued operation:
SECTION 2: PROFIT/(LOSS) FOR THE YEAR
INTEGRATED ANNUAL REPORT 2021 CONSOLIDATED ANNUAL ACCOUNTS
230
Construction Division (millions of euros)
DEC. 2021 DEC. 2020 (*)
Revenue 56 151
EBITDA 9 44 Fixed asset depreciation 0 -1
Operating profit/(loss) before impairment and disposal of fixed assets
9 43
Impairment and disposal of fixed assets 130 0
Operating profit/(loss) 139 43 Net financial income/(expense) 0 1 Share of profits of equity-accounted companies 0 0
Consolidated profit/(loss) before tax 139 44 Corporate income tax -24 -9
Profit/(loss) after tax 115 35
Profit/(loss) from discontinued operations 115 35 (*) Restated figures (Note 1.1.5)
These results of EUR 115 million include both the amount recognized up to the company’s exclusion from the consolidation scope (EUR 8 million) and the capital gain (EUR 130 million) generated by the transaction (EUR 107 million net of tax), on the line impairment and disposal of fixed assets. The impact for Ferrovial was EUR 53 million net of non-controlling interests.
NOTES ON PROFIT/(LOSS) FROM NON-CONTROLLING INTERESTS, NET PROFIT/(LOSS) AND EARNINGS PER SHARE
2.10. PROFIT/(LOSS) FROM NON-CONTROLLING INTERESTS
In 2021 the profit/(loss) attributed to non-controlling interests amounted to EUR -138 million (December 2020: EUR -51 million).
This figure relates to the profits obtained by Group companies that may be allocated to other partners with a stake in the said companies. The figures shown as positive numbers refer to loss-making companies, while negative amounts relate to companies that generate profits.
The main change with respect to the previous year is the improvement in the Budimex Group’s results (EUR 56 million) both due to the sale of the real estate business (BNI), as well as the favorable trend in the civil works business. Also of note is that US toll roads are performing positively, after traffic improved as mobility restrictions were lifted. This was all offset by the worsening of results recognized by Autema (down EUR 25 million) due to the fall in value of the inflation derivative when the speculative portion (37%) was taken to the income statement.
2.11. NET PROFIT/(LOSS) AND EARNINGS PER SHARE
The calculation of earnings per share attributed to the parent company is as follows:
(Millions of euros) 2021 2020 (*) Net profit/(loss) attributable to parent company (millions of euros) 1,197 -424
Perpetual subordinated bond, net cost -8 -8
Net adjusted profit/(loss) attributed to the parent company (millions of euros) 1,189 -432
Weighted average number of shares outstanding (thousands of shares) 736,882 739,102
Less average number of treasury shares (thousands of shares)
-5,110 -6,826
Average number of shares to calculate basic earnings per share 731,772 732,277
Basic earnings per share (euros) 1.62 -0.59
Net adjusted profit/(loss) from continuing operations 966 -401
Basic earnings per share, continuing operations (euros) 1.32 -0.55
Net profit/(loss) from discontinued operations 361 20
Basic earnings per share, discontinued operations (euros) 0.49 0.03
(*) Restated figures (Note 1.1.5).
Basic earnings per share have been calculated by dividing profit for the year attributed to the parent company's shareholders, adjusted for the net coupon for the year on the subordinated perpetual bonds issued by the group and taken directly to equity (Note 5.1.2.d), by the weighted average number of ordinary shares outstanding, excluding the average number of treasury shares held during the year.
As regards diluted earnings per share, it should be noted that the Group did not have any dilutive potential ordinary shares, since no convertible debt instruments were issued and the share-based remuneration schemes described in Note 6.7 will not give rise to any share capital increases at the Group. Consequently, no dilutive impact is envisaged when employee rights under the plans are exercised. Hence there is no difference between the basic and diluted earnings per share.
The earnings by business segment are shown in Appendix III.
(Millions of euros) 2021 2020 VAR. 21/20 NON-GROUP%
Budimex Group -109 -54 -56 44.90 % Autop.Terrasa Manresa, S.A. 14 -11 25 23.70 %
LBJ Infrastructure Group 2 20 -18 45.40 %
NTE Mobility Partners -25 -12 -13 37.1 %NTE Mobility Partners Segments 3 LLC
-20 -8 -12 46.3 %
FAM Construction LLC 7 16 -10 30.0 %
Sugar Creek Construction LLC -1 8 -9 30.0 %
Other companies -2 -6 5
TOTAL continuing operations -134 -48 -86
TOTAL discontinued operations -3 -3 0
TOTAL -138 -51 -87
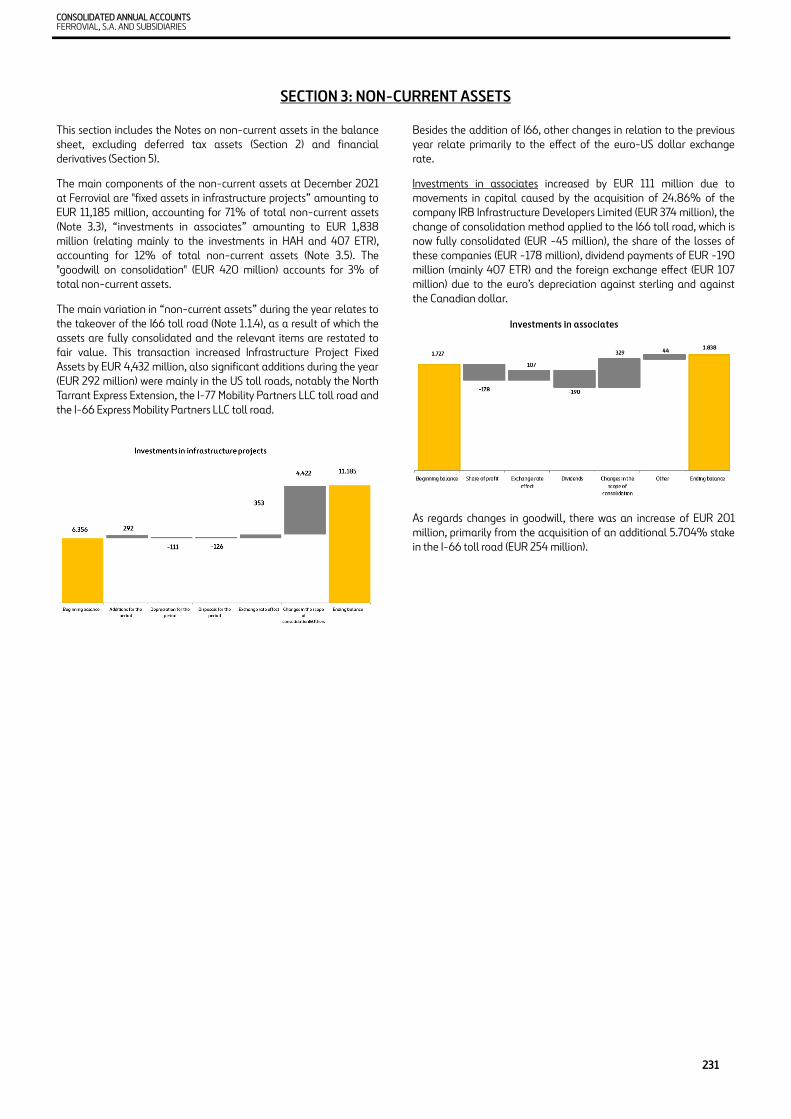
CONSOLIDATED ANNUAL ACCOUNTS FERROVIAL, S.A. AND SUBSIDIARIES
231
SECTION 3: NON-CURRENT ASSETS
This section includes the Notes on non-current assets in the balance sheet, excluding deferred tax assets (Section 2) and financial derivatives (Section 5).
The main components of the non-current assets at December 2021 at Ferrovial are "fixed assets in infrastructure projects” amounting to EUR 11,185 million, accounting for 71% of total non-current assets (Note 3.3), “investments in associates” amounting to EUR 1,838 million (relating mainly to the investments in HAH and 407 ETR), accounting for 12% of total non-current assets (Note 3.5). The "goodwill on consolidation" (EUR 420 million) accounts for 3% of total non-current assets.
The main variation in “non-current assets” during the year relates to the takeover of the I66 toll road (Note 1.1.4), as a result of which the assets are fully consolidated and the relevant items are restated to fair value. This transaction increased Infrastructure Project Fixed Assets by EUR 4,432 million, also significant additions during the year (EUR 292 million) were mainly in the US toll roads, notably the North Tarrant Express Extension, the I-77 Mobility Partners LLC toll road and the I-66 Express Mobility Partners LLC toll road.
Besides the addition of I66, other changes in relation to the previous year relate primarily to the effect of the euro-US dollar exchange rate.
Investments in associates increased by EUR 111 million due to movements in capital caused by the acquisition of 24.86% of the company IRB Infrastructure Developers Limited (EUR 374 million), the change of consolidation method applied to the I66 toll road, which is now fully consolidated (EUR -45 million), the share of the losses of these companies (EUR -178 million), dividend payments of EUR -190 million (mainly 407 ETR) and the foreign exchange effect (EUR 107 million) due to the euro’s depreciation against sterling and against the Canadian dollar.
As regards changes in goodwill, there was an increase of EUR 201 million, primarily from the acquisition of an additional 5.704% stake in the I-66 toll road (EUR 254 million).
SECTION 3: NON-CURRENT ASSETS
INTEGRATED ANNUAL REPORT 2021 CONSOLIDATED ANNUAL ACCOUNTS
232
3.1. GOODWILL AND ACQUISITIONS
The table below details the movements in goodwill in 2021:
(*) Restated figures (Note 1.1.5)
3.1.1. Movements over the year
The following is a description of the main changes by type of movement:
Other
The main impact in the “Other” column relates to the goodwill on the fair value measurement of the concession asset following the acquisition of an additional 5.704% in the concession operator I-66 Express Mobility Partners Hold. LLC on 17 December 2021 (Note 1.1.4). The goodwill recognized on the acquisition, which amounts to EUR 254 million is essentially a balancing item for the tax effects described in Note 1.1.4, and Note 2.8, pursuant to IAS 12, paragraph 66.
In addition, as a result of the sale of the asphalt plant owned by Webber’s company Southern Crushed Concrete, goodwill decreased by EUR 60 million.
Exchange rate
The other changes relate to foreign exchange rates, mainly in the Construction business, due to the appreciation of the dollar against the euro (Note 1.4).
3.1.2. Goodwill impairment test
A. Construction Division goodwill (Webber and Budimex):
The goodwill of Webber (US) and Budimex (Poland) amounted to EUR 50 million and EUR 64 million, respectively, at 31 December 2021 (31 December 2020: EUR 105 million and EUR 64 million, respectively).
In accordance with accounting legislation, the pertinent analyses were conducted and the conclusion was drawn that there are no indications of impairment.
Methodology
In the case of Webber, the impairment test carried out indicates that there have been no significant changes in the operating assumptions of the business or in the determining factors of fair value, so it is estimated a level of slack similar to the one existing in previous years.
In the case of Budimex, since it is listed on the Warsaw Stock Exchange, the goodwill was tested for impairment by ascertaining whether the closing market price at 31 December 2021 of the Budimex share was higher than its carrying amount plus the allocated goodwill. The test did not show the existence of any impairment.
Impairment test results:
The quoted market price of the Budimex share at 31 December 2021 was 445% higher than its carrying amount, which amounts to EUR 122 million (compared to 716% in 2020).
B. Transchile goodwill:
There is also goodwill in Transchile, the company owning the power transmission lines in Chile.
Based on the goodwill impairment test findings, the buffer is 99% with respect to the carrying amount of EUR 60 million (2020: 58%). The flows were discounted at a 6.7% cost of equity (7.4% before taxes), which is in line with the rates used to calculate goodwill impairment in 2020.
C. Ferrovial Services Infraestructure Inc (FSNA) goodwill
Besides the Budimex, Webber and Transchile goodwill, there is goodwill relating to the company Ferrovial Services Infraestructure Inc., which is engaged in the maintenance of US infrastructures and was reclassified to continuing operations during the year, within the Construction segment.
Based on the goodwill impairment test findings, the existing buffer is 196% with respect to the carrying amount of EUR 40 million. The flows have been discounted at a 6.8% discount rate (7.0% before taxes).
D. Toll Roads Division goodwill (I-66):
As the restatement of the shareholding took place on the acquisition date (17 December 2021), there are no signs that the recoverable amount of the goodwill is below the value allocated as a result of the restatement.
3.2. INTANGIBLE ASSETS
At year-end 2021, the balance of intangible assets other than infrastructure projects amounted to EUR 126 million (2020: EUR 96 million).
This heading includes:
• “Rights on concessions” includes the rights to operate the concessions that are not classified as projects (see definition in Note 1.1.2). At 31 December 2021, the carrying amount of EUR 24 million (EUR 25 million at 31 December 2020) relates to the UK Waste Treatment activity.
• “Computer software” with a net value of EUR 16 million (31 December 2020: EUR 6 million), which primarily relates to Ferrovial Corporación S.A.
• “Customer contracts and commercial relations”, relating to the net value of the commercial order book, customer databases and other intangible assets, in the amount of EUR 33 million (31 December 2020: EUR 37 million) essentially derived from the Budimex Services business included in the Construction Division (EUR 25 million).
• “Other intangible assets” consist primarily of licenses for the Parque Solar Casilla photovoltaic plant amounting to EUR 9.1 million, the easements of the Chilean power transmission lines amounting to EUR 33 million (EUR 18 million at 31 December 2020) and an intangible related to the UK waste treatment business (EUR 10 million).
(Millions of euros) BALANCES AT 31/12/2020 (*) OTHER EXCHANGE
RATE BALANCES at
31/12/2021 Construction 169 -60 6 115 Budimex 64 0 0 64 Webber 105 -60 6 50 Toll roads 0 254 -3 251 I-66 Express Mobility Partners Hold. LLC 0 254 -3 251 Energy efficiency 39 0 3 42 Transchile 39 3 42 Services 12 0 1 13 Ferrovial Services Infrastructure, Inc. 12 1 13 TOTAL 220 194 6 420

CONSOLIDATED ANNUAL ACCOUNTS FERROVIAL, S.A. AND SUBSIDIARIES
233
• During the financial year, no significant fully depreciated assets have been written down.
The impact on cash flows (Note 5.3) from additions to intangible assets amounted to EUR -36 million.
3.3. INVESTMENTS IN INFRASTRUCTURE PROJECTS
3.3.1. Intangible asset model
• The most significant changes in 2021 were as follows:
◦ Exchange rate fluctuations resulted in a change of EUR 348 million (2020: EUR -471 million) in the balances of these assets, the full amount of which was attributed to the change in the euro/US dollar exchange rate at the US toll roads (Note 1.4).
◦ In the US Toll Roads activity, and as mentioned previously, there was an increase of EUR 4,432 million in the company I-66 Express Mobility Partners LLC, which was consolidated using the full consolidation method instead of the equity method during the year (Note 1.1.4).
◦ There were gross Toll road additions of EUR 292 million, relating to US toll roads. Of these, the most significant involve the North Tarrant Express Extension for EUR 224 million (2020: EUR 128 million) and the I-77 Mobility Partners LLC toll road for EUR 18 million (2020: EUR 7 million) and the I-66 Express Mobility Partners LLC toll road for EUR 48 million.
In the case of the infrastructure project companies, all their concession assets have been pledged as security for the existing borrowings (Note 5.2). The borrowing costs capitalized in this connection in 2021 are detailed in Note 2.6.
The movements to these assets in 2020 were as follows:
(Millions of euros) BALANCE AT 01/01 TOTAL
ADDITIONS TOTAL DISPOSALS
FOREIGN EXCHANGE
EFFECT
CONSOLIDATION SCOPE
CHANGES AND
TRANSFERS
BALANCES AT 31/12
(*)
Spanish toll roads 0 0 0 0 715 715 US toll roads 5,905 141 -4 -490 0 5,553 Other toll roads 391 0 -0 -0 0 391 Toll road investment 6,296 141 -4 -490 715 6,658 Accumulated depreciation/amortization -305 -66 1 20 -135 -484 Net investment in toll
d 5,991 76 -2 -469 580 6,174 Investment in other infrastructure projects 5 12 0 -2 0 15 Depreciation/amortization of other infrastructure projects
0 0 0 0 0 0 Total net investment in other infrastructure projects
5 12 0 -2 0 15 TOTAL INVESTMENT 6,301 153 -4 -492 715 6,674 TOTAL DEPRECIATION/AMORTISATION AND PROVISION
-305 -66 1 20 -135 -484
TOTAL NET INVESTMENT 5,996 88 -2 -471 580 6,190
(*) Restated figures (Note 1.1.5).
3.3.2. Financial asset model
The assets accounted for using the financial asset model pursuant to IFRIC 12, mainly relate to long-term receivables (more than twelve months) from governments in return for services rendered or investments made under a concession arrangement. The movements in the years ended 31 December 2021 and 2020 were as follows:
Note: balances shown net of provisions
(*) Restated figures (Note 1.1.5).
The 2020 comparative figures were restated due to the reclassification from discontinued to continuing operations of the UK Waste Treatment business in a net amount of EUR 76 million.
(Millions of euros) BALANCE AT 01/01 TOTAL
ADDITIONS TOTAL
DISPOSALS
FOREIGN EXCHAN
GE EFFECT
CONSOLIDATION
SCOPE CHANGES
AND TRANSFE
RS
OTHER BALANCE AT 31/12
Spanish toll roads 715 0 -5 0 3 0 713 US toll roads 5,553 292 -118 369 4,432 0 10,527 Other toll roads 391 0 0 0 0 0 391 Toll road investment 6,658 292 -123 369 4,435 0 11,632 Accumulated depreciation/amortization
-484 -111 0 -21 -2 0 -617 Net investment in toll roads 6,174 181 -123 348 4,433 0 11,014 Investment in other infrastructure projects
15 0 0 0 -12 -3 0
Depreciation/amortization of other infrastructure projects
0 0 0 0 0 0 0
Total net investment in other infrastructure projects
15 0 0 0 -12 -3 0
TOTAL INVESTMENT 6,674 292 -123 369 4,421 -3 11,632 TOTAL DEPRECIATION/AMORTISATION AND PROVISION
-484 -111 0 -21 -2 0 -617
TOTAL NET INVESTMENT 6,190 181 -123 348 4,419 -3 11,014
MOVEMENTS RECEIVABLES RECEIVABLES (Millions of euros) INFRASTRUCTURE
PROJECTS 2021 INFRASTRUCTURE
PROJECTS 2020 (*) OPENING BALANCE 166 883 Additions 0 6 Disposals -4 -9 Transfers and other 0 -689 Foreign exchange effect 5 -5 Other 1 0 Reclass. to held for sale 1 -19 YEAR-END BALANCE 169 166
BALANCES AT 31/12/2021
CONCESSION OPERATOR LONG-TERM RECEIVABLES
SHORT-TERM RECEIVABLES
TOTAL (Millions of euros) (Note 4.2) 2021 Concesionaria de Prisiones Lledoners 56 1 57 Depusa Aragón 24 1 24 Budimex Parking Wroclaw 10 0 10 CONSTRUCTION 91 2 92 AmeyCespa WM (East) Ltd 80 0 80 WASTE UK 80 0 80 TOTAL GROUP 170 2 172
SECTION 3: NON-CURRENT ASSETS
INTEGRATED ANNUAL REPORT 2021 CONSOLIDATED ANNUAL ACCOUNTS
234
BALANCES AT 31/12/2020 (*)
CONCESSION OPERATOR LONG-TERM RECEIVABLES
SHORT-TERM RECEIVABLES
TOTAL (Millions of euros) (Note 4.2) 2020 Concesionaria de Prisiones Lledoners 57 2 59 Depusa Aragón 24 1 25 Budimex Parking Wroclaw 10 0 10 CONSTRUCTION 92 3 95 AmeyCespa WM (East) Ltd 76 0 76 WASTE UK 76 0 76 TOTAL GROUP 168 3 171 (*) Restated figures (Note 1.1.5)
3.3.3 Impact on cash flows
The cash flow impact of the additions to projects, primarily accounted for using the intangible asset model amounted to EUR -239 million (Note 5.3), which differs from the additions recognized in the balance sheet, primarily due to the following reasons:
• In projects in which the intangible asset model is applied, due to differences between the accrual basis and cash basis of accounting, as well as the capitalization of the borrowing costs attributable to projects under construction, which do not generate cash outflows.
• In projects in which the financial asset model is applied, due to the increases in receivables as a balancing entry to income for services rendered, which do not generate cash inflows either.
• The impact on cash flows reflects movements associated with the discontinued operation, which are not recognized in the balance sheet due to being reclassified to held for sale.
3.4. PROPERTY, PLANT AND EQUIPMENT
The movements in “property, plant and equipment” in the statement of consolidated financial position were as follows:
(*) Restated figures (Note 1.1.5)
The most significant changes in 2021 were as follows:
Additions:
Of the total additions, amounting to EUR 108 million, the most significant arose at the Construction Division amounting to EUR 73 million in relation to specific construction machinery acquisitions and other installations, tooling and furniture.
The detail, by business segment, of the additions to property, plant and equipment is as follows:
(Millions of euros) 2,021 2,020 2021 2020
Construction 73 63 Toll roads 2 3 Other 33 3 TOTAL 108 69
Impact on cash flow: The impact on cash flows arising from additions to property, plant and equipment amounted to EUR -121 million, of which EUR -50 million relates to the Construction Division and EUR -66 million arose from the Services Division. As outlined in Note 5.3, the cash flow reported includes cash flows from operating activities, investment and financing for discontinued operations and assets held for sale.
Disposals and withdrawals:
Disposals or retirements amounted to -168 million euro; of this amount, approximately 83 million euro relates to sales of property, plant and equipment at Webber, which reached an agreement for the sale of a substantial part of the assets of its subsidiary Southern South Concrete (SCC) for 43 million euro, and the sale of a tunnel boring machine at Ferrovial Construcción S.A. for 43 million euro. The remaining amount relates mainly to the disposal or retirement of fully depreciated or obsolete assets, with no significant impact on the consolidated income statement.
Other disclosures relating to property, plant and equipment:
The property, plant and equipment not used in operations are not material with respect to the final consolidated balances. Impairment losses on other items of property, plant and equipment total EUR 6 million (2020: EUR 15 million), associated with the Construction Division.
The Group has taken out insurance policies to cover the possible risks to which its property, plant and equipment are subject and the claims that might be filed against it for carrying on its business activities. These policies are considered to adequately cover the related risks.
The property, plant and equipment in the course of construction amount to EUR 55 million (2020: EUR 14 million).
At 31 December 2021, no significant property, plant or equipment items were subject to ownership restrictions or pledged as collateral for liabilities.
The following table shows the movements that occurred during 2020:
Movements during 2021 (millions of euros)
Land and buildings
Plant and machinery
Other installations,
tooling and furniture
Total
Investment: Balance at 01.01.2021 (*) 104 479 255 838 Additions 4 43 61 108 Disposals -12 -114 -42 -168 Consolidation scope changes d f
-2 -7 -7 -16 Foreign exchange effect 4 10 12 26 Balances at 31.12.2021 98 411 279 788 Accumulated depreciation and impairment losses at 01.01.2021 (*) -22 -313 -162 -497 Depreciation charge -6 -28 -25 -59 Disposals 0 70 49 119 Consolidation scope
0 6 4 10
Foreign exchange effect -1 -4 2 -3 Impairments - - -10 -10
Balances at 31.12.2021 -29 -269 -142 -440 Carrying amount 31.12.2021 69 142 137 348

CONSOLIDATED ANNUAL ACCOUNTS FERROVIAL, S.A. AND SUBSIDIARIES
235
Movements during2020 (millions of euros)
Land and buildings
Plant and machinery
Other installations,
tooling and furniture
Total
Investment: Balance at 01.01.2020 84 485 204 773
Additions 2 37 30 69
Disposals -17 -73 -26 -116
Consolidation scope changes
d f39 54 49 142
Foreign exchange effect -5 -21 -7 -33
Balances at 31/12/2020 103 482 250 835
Accumulated depreciation and impairment losses at 01.01.20 -20 -316 -137 -473
Depreciation charge -3 -24 -20 -47
Disposals 9 56 22 87
Consolidation scope changes
d f-8 -41 -25 -74
Foreign exchange effect 1 9 4 14
Balances at 31/12/2020 -22 -316 -156 -493
Carrying amount 31.12.2020 82 166 94 341
3.5. INVESTMENTS IN ASSOCIATES
The breakdown of investment in equity-accounted companies at 2021 year-end and of the movements therein are shown in the table below. Due to their significance, the investments in 407 ETR (43.23%), Heathrow Airport Holdings (HAH -25%), AGS (50%) and IRB (24.86%) are presented separately.
(*) Restated figures (Note 1.1.5)
The heading Scope changes reflects an impact of EUR 324 million due to the purchase of a 24.86% ownership interest in the Indian company IRB Infrastructure Developers for EUR 369 million, minus the effect of the change of consolidation method applied to I-66 (EUR -45 million) following the purchase of an additional 5.704% of the company, resulting in full consolidation.
Movements for the year also include the consolidated HAH losses, as indicated in Note 2.7. In 2021, the investment in that project was reduced to zero as losses for the year exceeded the carrying amount of the investment.
Impact on cash flow: The difference between the dividends of EUR 190 million in the foregoing table and the dividends of EUR 272 million disclosed in the cash flow statement (Note 5.3) relates mainly to interest received on loans granted to equity-accounted companies, recognized under non-current financial assets in the balance sheet (Note 3.6), to the effect of certain exchange rate hedges related to dividends received, as well as dividends received from Services projects.
The movements in this heading in the balance sheet in 2020 were as follows:
2020 (millions of euros)
HAH (25%) 407 ETR (43.23%) AGS (50%) OTHER TOTAL
Balance at 31.12.19 690 1,422 57 405 2,575 Share of profit/(loss) -396 33 -51 42 -373
Dividends -29 -158 0 -17 -205Foreign exchange differences
-33 -92 -3 -5 -133
Pensions -30 0 -1 0 -31
Scope changes 0 0 0 -160 -160
Other 3 0 -2 52 53Balance at 31.12.20 (*)
205 1,205 0 317 1,727
(*) Restated figures (Note 1.1.5)
3.5.1. Disclosures relating to HAH
b. Movements in the balance sheet and income statement 2021-2020
In view of the importance of this investment, the following is a summary of the balance sheet and income statement for this Group of companies, adjusted to bring them into line with Ferrovial's accounting policies, together with comments on the changes therein over the course of 2021.
The balance sheet figures shown relate to the full balances of HAH and are presented in pound sterling. The exchange rates used in 2021 are EUR 1=GBP 0.841330 (2020: GBP 0.895550) for the balance sheet figures and EUR 1=GBP 0.858575 (2020: GBP 0.888733) for the income statement figures.
Balance sheet Dec. 2021 2020.12 Var. Non-current assets 16,373 16,823 -450
Goodwill 2,753 2,753 0
Fixed assets in infrastructure projects 12,542 13,076 -534
Rights of use of leased assets 270 285 -15
Non-current financial assets 44 42 2
Pension plan surplus 343 12 332
Deferred taxes 0 0 0
Financial derivatives 421 656 -235
Other non-current assets 0 0 0
Current assets 3,144 4,572 -1,427
Trade and other receivables 186 462 -276
Financial derivatives 24 146 -122
Cash and cash equivalents 2,920 3,949 -1,029
Other current assets 13 14 -1
TOTAL ASSETS 19,517 21,395 -1,877
HAH (100%) Millions of GBP Dec. 2021 Dec. 2020 Var. Equity -2,914 -1,586 -1,328
Non-current liabilities 21,057 20,637 420
Pension provisions 30 31 -1
Borrowings 18,031 18,461 -430
Deferred taxes 434 652 -218
Financial derivatives 2,226 1,134 1,092
Other non-current liabilities 337 359 -22
Current liabilities 1,374 2,344 -970
Borrowings 1,000 1,921 -921
Trade payables 352 386 -35
Financial derivatives 19 21 -2
Other current liabilities 4 16 -12
TOTAL LIABILITIES 19,517 21,395 -1,877
2021 (millions of euros)
HAH (25%)
407 ETR (43.23%)
AGS (50%)
IRB (24.86%) OTHER TOTAL
Balance at 31.12.20 (*)
205 1,205 0 0 317 1,727
Share of profit/(loss) -238 52 -20 0 28 -178
Dividends 0 -175 0 0 -15 -190
Foreign exchange differences 5 100 0 4 -2 107
Pensions 23 0 0 0 0 23
Scope changes 0 0 0 369 -45 324
Other 5 0 20 5 -4 26
Balance at 31.12.21 0 1,181 0 378 280 1,838

SECTION 3: NON-CURRENT ASSETS
INTEGRATED ANNUAL REPORT 2021 CONSOLIDATED ANNUAL ACCOUNTS
236
Equity
As indicated previously, the investment in this company was reduced to zero since the losses for the year exceeded the carrying amount and there is no commitment to inject additional funds (pursuant to IAS 28).
The following table shows movements in the 25% equity interest in the company, including both results for the year and results not consolidated because losses for the year exceeded the investment’s value, relating mainly to pensions and derivatives.
2021 (millions of euros) HAH (25%) Balance at 31.12.20 205 Share of profit/(loss) -238 Pensions 23 Foreign exchange differences 5 Other 5 Balance at 31.12.21 under IAS 28 0 Result not consolidated under IAS 28 -246 Other equity effects not consolidated under IAS 28 70 Balance at 31.12.21 without IAS 28 -176
Borrowings
The borrowings of HAH (short and long-term) amounted to GBP 19,031 million at 31 December 2021, an decrease of GBP 1,351 million with respect to the prior year (31 December 2020: GBP 20,382 million). This change is explained mainly by the following impacts:
◦ The GBP 1,600 million funding plan for 2021 was completed in early October, with a CAD 325 million drawdown on the 12-year Class A bond issued at the start of the year and a GBP 50 million Class B private placement. These successful transactions reflect continued investor confidence in the airport’s strength and resilience. The additional funding means that forecast commitments to February 2023 in the extreme no-revenue stress scenario, or well into 2025 based on traffic levels currently forecast. This includes forecast operating costs and capital investments, debt servicing, debt maturities and reimbursements. This liquidity position takes into account GBP 2,625 million in cash resources, undrawn debt and Heathrow Finance plc’s liquidity at 31 December 2021.
◦ Amortization and a bond issue in the amount of GBP -1,119 million and GBP 1,582 million respectively, as well as a net variation of GBP -1,526 million in bank borrowings.
◦ Decrease of GBP -351 million as a result of fair value adjustments to and the exchange rate of foreign currency bonds issued.
◦ Other movements amounting to GBP 62 million (mainly accrued unmatured interest and fees).
Financial derivatives at fair value
The notional principal amount of HAH's derivatives portfolio at 31 December 2021 totaled GBP -18,634 million, including interest rate derivatives (IRSs) with a notional amount of GBP 7,500 million (hedging floating-rate borrowings), cross-currency swaps (hedging bonds issued in foreign currencies) with a notional amount of GBP 5,427 million and index-linked swaps (ILSs) with a notional amount of GBP 5,707 million. The purpose of inflation derivatives is to convert fixed-rate debt into debt that has a variable rate based on inflation, for the purpose of hedging variations in the regulatory asset base (RAB) caused by changes to the inflation rate.
Income statement 2021-2020
The following table shows HAH's income statement movements in 2021 and 2020.
Note 2.7 and the Management Report describe in detail the various items explaining HAH’s results. The amount of EUR -484 million corresponds to Ferrovial before applying IAS 28.
3.5.2. Disclosures relating to 407 ETR
As with HAH, given that Ferrovial’s stake in the 407 ETR was remeasured when control was lost, and the implicit existence of goodwill was considered, pursuant to the contents of page 40 et seq. of IAS 28, the possible existence of indications of impairment is assessed on an annual basis.
a. Impairment analysis
This asset performed well in 2021, with revenue growing by 13%, and EBITDA growing by 16%. In 2021, vehicle traffic has continued to be affected by COVID-19 (Note 1.2), although the trend was positive as restrictions were lifted and the situation improved, despite the new variants. December 2021 was +49.7% up on December 2020, but still well below 2019 (-23.0%)
The measurement that Ferrovial made of this concession, which includes estimated pandemic effects, shows a very large buffer over its book value. Sensitivity to increased revenues and the discount rate has been measured, and a broad buffer is maintained.
The recoverable amount of a concession operator with an independent financial structure and limited duration was calculated by discounting the cash flows to be received by shareholders until the end of the concession term, 2098 in the case of 407 ETR. The Group considers that value in use must be obtained using models that cover the entire concession term, as the asset is in different phases of investment and growth and there is sufficient visibility to use a specific economic and financial plan during the concession term.
HAH (100%) Millions of GBP 2021 2020 Var. Operating income 1,214 1,175 39 Operating expenses -858 -1,087 229 EBITDA 357 89 268 Fixed asset depreciation -828 -848 20 Operating profit/(loss) before impairment and disposals -472 -759 288 Impairment and disposal of fixed assets 0 0 0 OPERATING PROFIT/(LOSS) -472 -759 288 Net financial income/(expense) -1,509 -855 -654 Profit/(loss) before tax -1,981 -1,614 -367 Corporate income tax 319 206 113 Profit/(loss) from continuing operations -1,662 -1,408 -254 Profit/(loss) from discontinued operations 0 0 0 Net profit/(loss) -1,662 -1,408 -254 25% Profit/(loss) attributable to Ferrovial (millions of euros) -484 -396 -88
Profit/(loss) attributable to Ferrovial under IAS 28 (millions of euros)
-238 -396 158

CONSOLIDATED ANNUAL ACCOUNTS FERROVIAL, S.A. AND SUBSIDIARIES
237
The cost of own resources (or equity cost) was calculated in accordance with the CAPM model. To calculate the discount rate, a risk-free rate was used, which referenced the 30-year bond in Canada, a beta coefficient reflecting the asset's leverage and risk, and a market premium of 6.0% (same as last year) are used. The result is a discount rate after tax (equity cost, or Ke) of 6.0% (7.4% before taxes).
Based on the evaluation performed, as well as the sensitivity analyses (primarily focusing on revenue growth and an increase in the discount rate), no signs of impairment were identified.
b. Movements in the balance sheet and income statement 2021-2020
These figures relate to the full balances of the Company and are presented in millions of Canadian dollars. The exchange rates used in 2021 are EUR 1=CAD 1.43726 (2020: CAD 1.56087) for the balance sheet figures and EUR 1=CAD 1.47898 (2020: CAD 1.53765) for the income statement figures.
Balance Sheet 2021-2020
Below is a description of the main changes in the balance sheet of 407 ETR at 31 December 2021 compared to the previous year:
Equity
Equity fell by CAD 388 million with respect to 2020, as a result of the inclusion of the profit for the year of CAD 212 million and the reduction of CAD 600 million due to the payment of dividends to shareholders.
43.23% of the shareholders’ funds of the subsidiary does not relate to the consolidated carrying amount of the holding, since the latter also includes the amount of the gain arising from the remeasurement at fair value of the investment retained following the sale of a 10% ownership interest in this company in 2010, recognized as an addition to the value of the investment, and the goodwill that arose in 2009 as a result of the merger of Grupo Ferrovial, S.A. and Cintra Concesiones de Infraestructuras de Transportes, S.A. Therefore, in order to obtain the consolidated carrying amount at Ferrovial, it is necessary to increase the 43.23% of shareholders’ funds presented above (CAD -2,201 million) by the amounts of the aforementioned gain and of the goodwill (CAD 2,579 million and CAD 1,319 million, respectively), giving a total of CAD 1,697 million which, translated at the year-end exchange rate (EUR 1 = CAD 1.43726), is equivalent to the investment of EUR 1,181 million.
Borrowings
Overall financial debt (short and long term) increased in relation to December 2020 by USD 54 million due to the effect of rising inflation on index-linked debt instruments.
Income statement 2021-2020
The following table shows the income statement movements of 407 ETR in the years ended December 2021 and December 2020:
The main change in the income statement relates to operating income (CAD 115 million) as a result of the growth in traffic during the year as restrictions were lifted, despite the new variants.
It should be noted that the profit/(loss) attributable to Ferrovial also includes the depreciation and amortization over the concession term of the remeasurement recognized following the loss of control of the company as a result of the sale in 2010 mentioned above.
Therefore, CAD -15 million of amortization would have to be deducted from the 43.23% of the local profit (CAD 92 million). Translating the resulting CAD 77 million at the average exchange rate (USD 1 = CAD 1.47898) gives the EUR 52 million allocable to Ferrovial in 2021 (Note 2.7). In 2020 (EUR 1 = CAD 1.53765) gives the EUR 33 million attributed to Ferrovial the year before (Note 2.7).
407 ETR (100%) (Millions of CAD) 2021 2020 Var. Non-current assets 4,574 4,598 -24 Fixed assets in infrastructure projects 3,995 4,016 -20 Non-current financial assets 522 580 -59 Deferred taxes 57 2 55 Current assets 767 1,054 -288 Short-term trade and other receivables 229 173 56 Cash and cash equivalents 537 881 -344 Total assets 5,341 5,652 -312 Equity -5,092 -4,703 -388 Non-current liabilities 9,918 10,154 -236 Borrowings 9,354 9,603 -249 Deferred taxes 564 551 12 Current liabilities 514 201 313 Borrowings 427 124 302 Short-term trade and other payables 87 77 11 Total liabilities 5,341 5,652 -312
407 ETR (100%) (Millions of CAD 2021 2020 Var. Operating income 1,023 909 115 Operating expenses -164 -169 5 EBITDA 859 740 119 Fixed asset depreciation -102 -97 -5 Operating profit/(loss) 757 642 114 Net financial income/(expense) -465 -441 -24 Profit/(loss) before tax 291 201 90 Corporate income tax -79 -53 -26 Net profit/(loss) 212 148 65 Profit/(loss) attributable to Ferrovial (millions of CAD) 92 64 28 Adjustment to depreciation/amortization following loss of control (Millions of CAD) -15 -13 -1 Adjusted net profit/(loss) attributable to Ferrovial (43.23% in millions of CAD) 77 51 26 Adjusted net profit/(loss) attributable to Ferrovial (43.23% in millions of EUR) 52 33 19
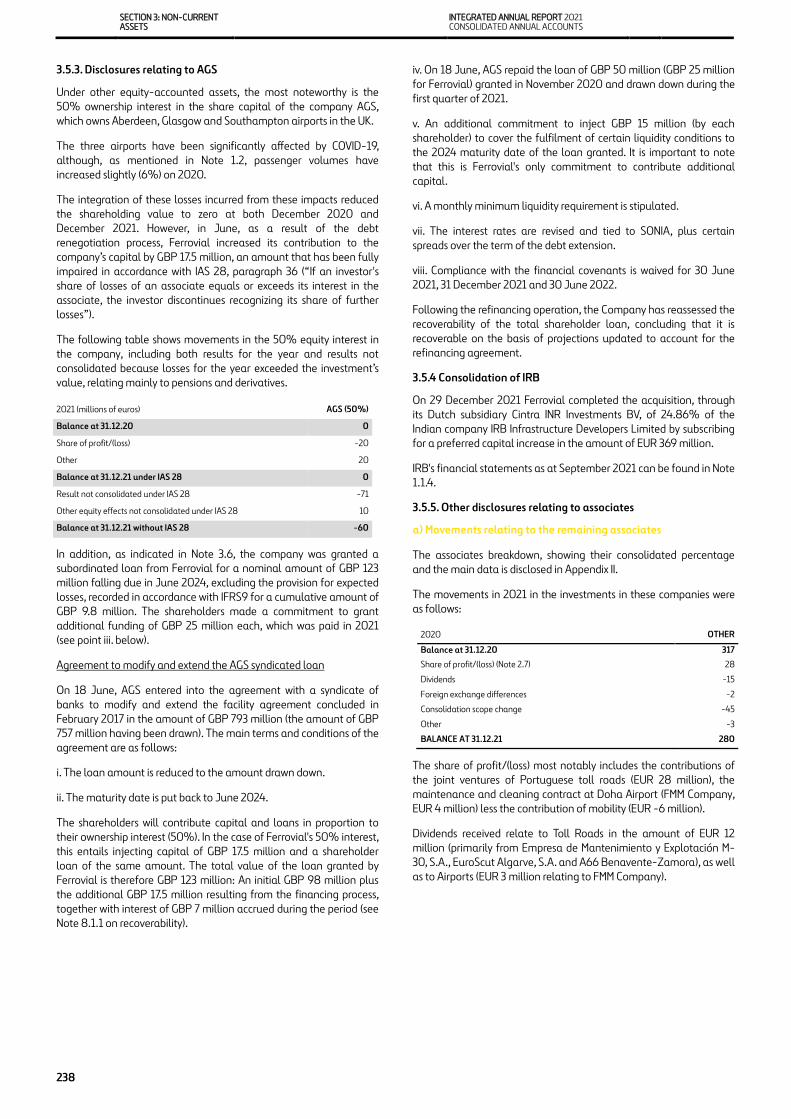
SECTION 3: NON-CURRENT ASSETS
INTEGRATED ANNUAL REPORT 2021 CONSOLIDATED ANNUAL ACCOUNTS
238
3.5.3. Disclosures relating to AGS
Under other equity-accounted assets, the most noteworthy is the 50% ownership interest in the share capital of the company AGS, which owns Aberdeen, Glasgow and Southampton airports in the UK.
The three airports have been significantly affected by COVID-19, although, as mentioned in Note 1.2, passenger volumes have increased slightly (6%) on 2020.
The integration of these losses incurred from these impacts reduced the shareholding value to zero at both December 2020 and December 2021. However, in June, as a result of the debt renegotiation process, Ferrovial increased its contribution to the company’s capital by GBP 17.5 million, an amount that has been fully impaired in accordance with IAS 28, paragraph 36 (“If an investor's share of losses of an associate equals or exceeds its interest in the associate, the investor discontinues recognizing its share of further losses”).
The following table shows movements in the 50% equity interest in the company, including both results for the year and results not consolidated because losses for the year exceeded the investment’s value, relating mainly to pensions and derivatives.
2021 (millions of euros) AGS (50%) Balance at 31.12.20 0 Share of profit/(loss) -20 Other 20 Balance at 31.12.21 under IAS 28 0 Result not consolidated under IAS 28 -71 Other equity effects not consolidated under IAS 28 10 Balance at 31.12.21 without IAS 28 -60
In addition, as indicated in Note 3.6, the company was granted a subordinated loan from Ferrovial for a nominal amount of GBP 123 million falling due in June 2024, excluding the provision for expected losses, recorded in accordance with IFRS9 for a cumulative amount of GBP 9.8 million. The shareholders made a commitment to grant additional funding of GBP 25 million each, which was paid in 2021 (see point iii. below).
Agreement to modify and extend the AGS syndicated loan
On 18 June, AGS entered into the agreement with a syndicate of banks to modify and extend the facility agreement concluded in February 2017 in the amount of GBP 793 million (the amount of GBP 757 million having been drawn). The main terms and conditions of the agreement are as follows:
i. The loan amount is reduced to the amount drawn down.
ii. The maturity date is put back to June 2024.
The shareholders will contribute capital and loans in proportion to their ownership interest (50%). In the case of Ferrovial's 50% interest, this entails injecting capital of GBP 17.5 million and a shareholder loan of the same amount. The total value of the loan granted by Ferrovial is therefore GBP 123 million: An initial GBP 98 million plus the additional GBP 17.5 million resulting from the financing process, together with interest of GBP 7 million accrued during the period (see Note 8.1.1 on recoverability).
iv. On 18 June, AGS repaid the loan of GBP 50 million (GBP 25 million for Ferrovial) granted in November 2020 and drawn down during the first quarter of 2021.
v. An additional commitment to inject GBP 15 million (by each shareholder) to cover the fulfilment of certain liquidity conditions to the 2024 maturity date of the loan granted. It is important to note that this is Ferrovial's only commitment to contribute additional capital.
vi. A monthly minimum liquidity requirement is stipulated.
vii. The interest rates are revised and tied to SONIA, plus certain spreads over the term of the debt extension.
viii. Compliance with the financial covenants is waived for 30 June 2021, 31 December 2021 and 30 June 2022.
Following the refinancing operation, the Company has reassessed the recoverability of the total shareholder loan, concluding that it is recoverable on the basis of projections updated to account for the refinancing agreement.
3.5.4 Consolidation of IRB
On 29 December 2021 Ferrovial completed the acquisition, through its Dutch subsidiary Cintra INR Investments BV, of 24.86% of the Indian company IRB Infrastructure Developers Limited by subscribing for a preferred capital increase in the amount of EUR 369 million.
IRB's financial statements as at September 2021 can be found in Note 1.1.4.
3.5.5. Other disclosures relating to associates
a) Movements relating to the remaining associates
The associates breakdown, showing their consolidated percentage and the main data is disclosed in Appendix II.
The movements in 2021 in the investments in these companies were as follows:
The share of profit/(loss) most notably includes the contributions of the joint ventures of Portuguese toll roads (EUR 28 million), the maintenance and cleaning contract at Doha Airport (FMM Company, EUR 4 million) less the contribution of mobility (EUR -6 million).
Dividends received relate to Toll Roads in the amount of EUR 12 million (primarily from Empresa de Mantenimiento y Explotación M-30, S.A., EuroScut Algarve, S.A. and A66 Benavente-Zamora), as well as to Airports (EUR 3 million relating to FMM Company).
2020 OTHER Balance at 31.12.20 317 Share of profit/(loss) (Note 2.7) 28 Dividends -15 Foreign exchange differences -2 Consolidation scope change -45 Other -3 BALANCE AT 31.12.21 280

CONSOLIDATED ANNUAL ACCOUNTS FERROVIAL, S.A. AND SUBSIDIARIES
239
b) Other information
There are no significant restrictions on the capacity of associates to transfer funds to the parent company in the form of dividends, debt repayments or advances, other than such restrictions as might arise from the financing agreements of those associates or from their own financial position, and there are no contingent liabilities relating to associates that might ultimately be assumed by the Group.
There are no significant companies in which the ownership interest exceeds 20% that are not equity accounted.
The guarantees provided by Group companies to equity-accounted companies are detailed in Note 6.5.
3.6. NON-CURRENT FINANCIAL ASSETS
The movements at 31 December 2021 were as follows.
Note: balances shown net of provisions
(*) Restated figures (Note 1.1.5)
• The item “Long-term loans to associates” relates essentially to the loans of GBP 123 million granted to AGS (EUR 146 million) (Note 3.6.1.), and to other ordinary loans to associates totaling EUR 93 million (EUR 64 million in 2020); the variation relates to the loan granted to Zero Bypass by Cintra Slovakia.
• “Restricted cash relating to infrastructure projects and other financial assets” relates primarily to deposits made at toll road concession operators, the use of which is limited to certain purposes established in the concession arrangement, such as payment of future investments or operating expenses and debt servicing. Specifically, the net reduction of EUR -75 million primarily relates to NTE Mobility Partners Segments 3 LLC (EUR -64 million, due essentially to payments on segment 3C investments) and to LBJ Infrastructure Group (a net amount of EUR -27 million due to project dividend payments of USD 360 million, once the contractual deadlines were net allowing pay-out).
• The Note on the net cash position provides details of the main balances and changes recognized in relation to this line item.
• The main movement under “Financial investments carried at fair value” is mainly due to cash disbursement of EUR 18.5 million and fair value adjustments of EUR 4.3 million. Cash disbursement included the acquisition of a 0.5% interest in the institutional tranche of Lilium’s US flotation for EUR 12.6 million. Fair value adjustments are due to the positive valuation of funds related to technology and innovation sectors in which the Group has invested (EUR 7.8 million), less the value of Lilium (EUR -3.5 million).
• Lastly, “Other receivables” includes:
◦ Other trade receivables, mainly from various public authorities in connection with long-term contracts.
◦ Interests in investment funds amounting to EUR 14 million, particularly the Credit Suisse (Lux) Supply Chain Finance Fund, which invested in supplier invoices insured by companies with an investment grade rating (average of AA-). This fund is currently in liquidation. The amount invested is regarded as recoverable, EUR 14 million having been reclassified to the long term, representing the portion of the fund that is expected to be recovered after more than one year. The item “Other short-term financial assets” includes an additional EUR 6 million that is expected to be recovered in less than one year, so the total investment in the fund pending recovery is EUR 20 million.
◦ Long-term deposits and guarantees amounting to EUR 5 million (December 2020: EUR 15 million).
3.6.1. Loan granted to AGS
As indicated in Note 3.5.3, Ferrovial has granted a subordinated loan of GBP 123 million (EUR 146 million) to the company AGS, not including the provision for expected losses recognized under IFRS 9 in a cumulative amount of GBP 9.8 million (EUR 11.6 million). The company’s other shareholder has granted a loan on the same terms.
Given the impact of the COVID-19 crisis on the Company, a recoverability analysis of the loan was carried out, including expectations of the asset’s future performance, the company’s liquidity forecasts for the next twelve months, and the status of the bank borrowings following the agreement on the above-mentioned loan:
• Future asset trends: The company owns the assets, so operations are not subject to a concession period. Accordingly, a model was prepared in which traffic is assumed to progressively recover as the vaccination process takes effect. The assumptions in this model are consistent with forecasts of air traffic trends obtained from different sources. The model shows a total value for AGS that is above the carrying amount of the current investment.
• Liquidity: The contingency plans adopted during 2020 and 2021 have allowed the Company to end the year with a positive position of liquidity. Projections show that the available liquidity would be sufficient to keep running the business based on estimated traffic levels.
• Bank borrowing situation: Following the agreement of 18 June to amend and extend the loan granted by a syndicate of banks, AGS will have until June 2024 to repay it.
MOVEMENTS IN 2021 (Millions of euros)
LONG-TERM LOANS IN
ASSOCIATES
RESTRICTED CASH
FROM INFRASTR
UCTURE PROJECTS
AND OTHER
FINANCIAL ASSETS
FINANCIAL INVESTMENT
S CARRIED AT FAIR
VALUE
OTHER LONG-
TERM RECEIVAB
LES TOTAL
BALANCE AT 01.01.2020 (*) 164 654 15 25 857 Additions 63 17 24 14 117 Disposals -3 -136 0 -12 -151 Transfers and other 0 0 0 0 0 Foreign exchange effect 4 45 2 6 56
Scope changes 0 0 0 0 0 BALANCE AT 31/12/2021 228 579 40 32 879
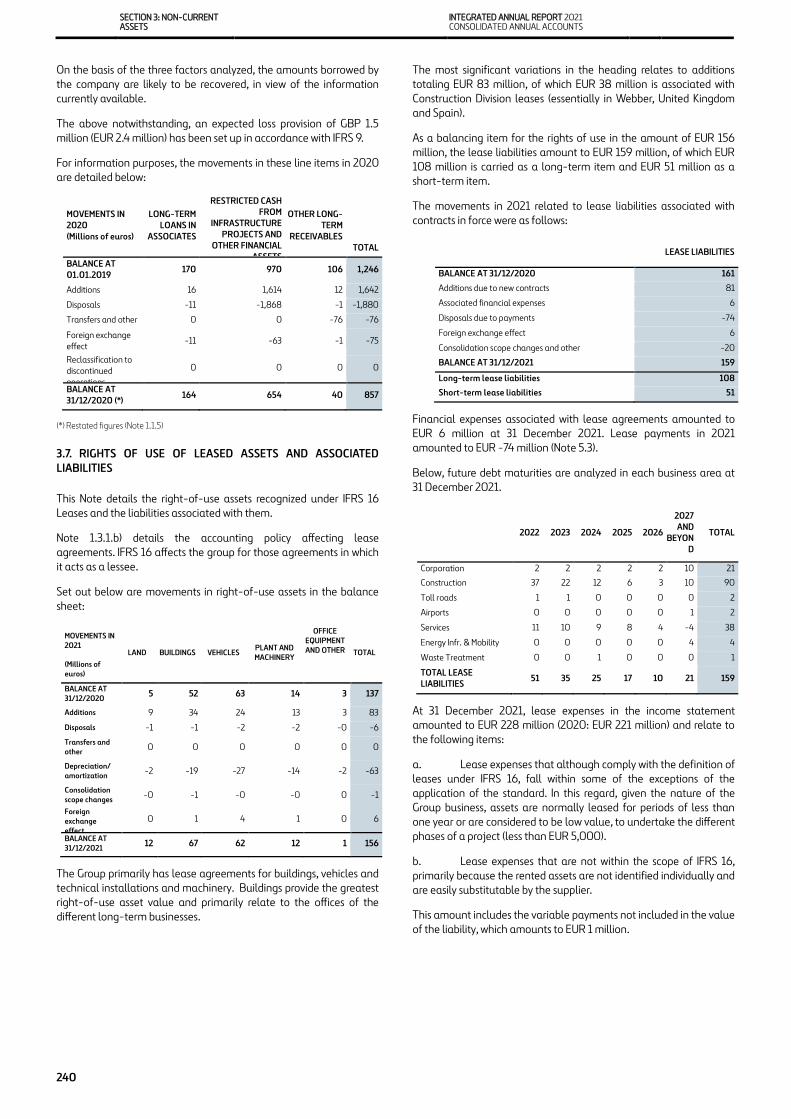
SECTION 3: NON-CURRENT ASSETS
INTEGRATED ANNUAL REPORT 2021 CONSOLIDATED ANNUAL ACCOUNTS
240
On the basis of the three factors analyzed, the amounts borrowed by the company are likely to be recovered, in view of the information currently available.
The above notwithstanding, an expected loss provision of GBP 1.5 million (EUR 2.4 million) has been set up in accordance with IFRS 9.
For information purposes, the movements in these line items in 2020 are detailed below:
(*) Restated figures (Note 1.1.5)
3.7. RIGHTS OF USE OF LEASED ASSETS AND ASSOCIATED LIABILITIES
This Note details the right-of-use assets recognized under IFRS 16 Leases and the liabilities associated with them.
Note 1.3.1.b) details the accounting policy affecting lease agreements. IFRS 16 affects the group for those agreements in which it acts as a lessee.
Set out below are movements in right-of-use assets in the balance sheet:
The Group primarily has lease agreements for buildings, vehicles and technical installations and machinery. Buildings provide the greatest right-of-use asset value and primarily relate to the offices of the different long-term businesses.
The most significant variations in the heading relates to additions totaling EUR 83 million, of which EUR 38 million is associated with Construction Division leases (essentially in Webber, United Kingdom and Spain).
As a balancing item for the rights of use in the amount of EUR 156 million, the lease liabilities amount to EUR 159 million, of which EUR 108 million is carried as a long-term item and EUR 51 million as a short-term item.
The movements in 2021 related to lease liabilities associated with contracts in force were as follows:
Financial expenses associated with lease agreements amounted to EUR 6 million at 31 December 2021. Lease payments in 2021 amounted to EUR -74 million (Note 5.3).
Below, future debt maturities are analyzed in each business area at 31 December 2021.
At 31 December 2021, lease expenses in the income statement amounted to EUR 228 million (2020: EUR 221 million) and relate to the following items:
a. Lease expenses that although comply with the definition of leases under IFRS 16, fall within some of the exceptions of the application of the standard. In this regard, given the nature of the Group business, assets are normally leased for periods of less than one year or are considered to be low value, to undertake the different phases of a project (less than EUR 5,000).
b. Lease expenses that are not within the scope of IFRS 16, primarily because the rented assets are not identified individually and are easily substitutable by the supplier.
This amount includes the variable payments not included in the value of the liability, which amounts to EUR 1 million.
MOVEMENTS IN 2020 (Millions of euros)
LONG-TERM LOANS IN
ASSOCIATES
RESTRICTED CASH FROM
INFRASTRUCTURE PROJECTS AND
OTHER FINANCIAL ASSETS
OTHER LONG-TERM
RECEIVABLES TOTAL
BALANCE AT 01.01.2019 170 970 106 1,246 Additions 16 1,614 12 1,642 Disposals -11 -1,868 -1 -1,880 Transfers and other 0 0 -76 -76 Foreign exchange effect -11 -63 -1 -75 Reclassification to discontinued operations
0 0 0 0 BALANCE AT 31/12/2020 (*) 164 654 40 857
MOVEMENTS IN 2021
LAND BUILDINGS VEHICLES PLANT AND MACHINERY
OFFICE EQUIPMENT AND OTHER TOTAL
(Millions of euros) BALANCE AT 31/12/2020 5 52 63 14 3 137 Additions 9 34 24 13 3 83 Disposals -1 -1 -2 -2 -0 -6 Transfers and other 0 0 0 0 0 0 Depreciation/ amortization -2 -19 -27 -14 -2 -63 Consolidation scope changes -0 -1 -0 -0 0 -1 Foreign exchange effect
0 1 4 1 0 6 BALANCE AT 31/12/2021 12 67 62 12 1 156
LEASE LIABILITIES BALANCE AT 31/12/2020 161 Additions due to new contracts 81 Associated financial expenses 6 Disposals due to payments -74 Foreign exchange effect 6 Consolidation scope changes and other -20 BALANCE AT 31/12/2021 159 Long-term lease liabilities 108 Short-term lease liabilities 51
2022 2023 2024 2025 2026 2027 AND
BEYOND
TOTAL
Corporation 2 2 2 2 2 10 21 Construction 37 22 12 6 3 10 90 Toll roads 1 1 0 0 0 0 2 Airports 0 0 0 0 0 1 2 Services 11 10 9 8 4 -4 38
Energy Infr. & Mobility 0 0 0 0 0 4 4
Waste Treatment 0 0 1 0 0 0 1
TOTAL LEASE LIABILITIES 51 35 25 17 10 21 159
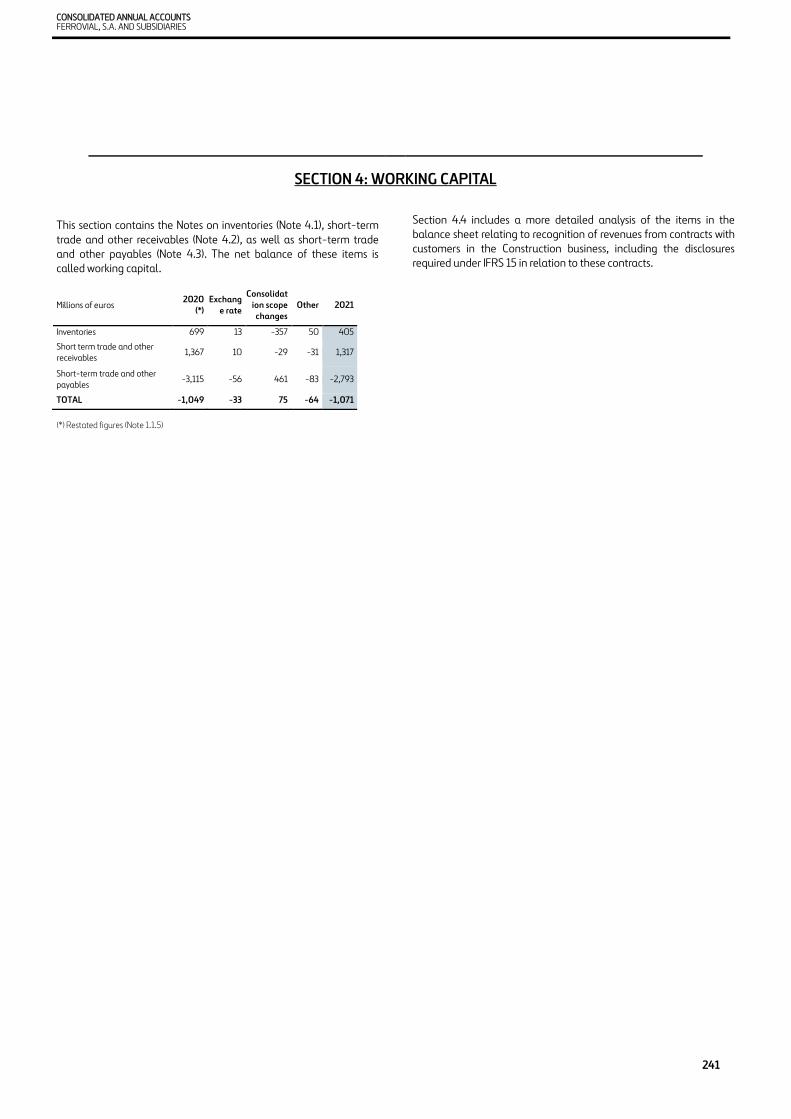
CONSOLIDATED ANNUAL ACCOUNTS FERROVIAL, S.A. AND SUBSIDIARIES
241
SECTION 4: WORKING CAPITAL
This section contains the Notes on inventories (Note 4.1), short-term trade and other receivables (Note 4.2), as well as short-term trade and other payables (Note 4.3). The net balance of these items is called working capital.
Millions of euros 2020 (*)
Exchange rate
Consolidation scope
changes Other 2021
Inventories 699 13 -357 50 405 Short term trade and other receivables 1,367 10 -29 -31 1,317 Short-term trade and other payables -3,115 -56 461 -83 -2,793 TOTAL -1,049 -33 75 -64 -1,071 (*) Restated figures (Note 1.1.5)
Section 4.4 includes a more detailed analysis of the items in the balance sheet relating to recognition of revenues from contracts with customers in the Construction business, including the disclosures required under IFRS 15 in relation to these contracts.
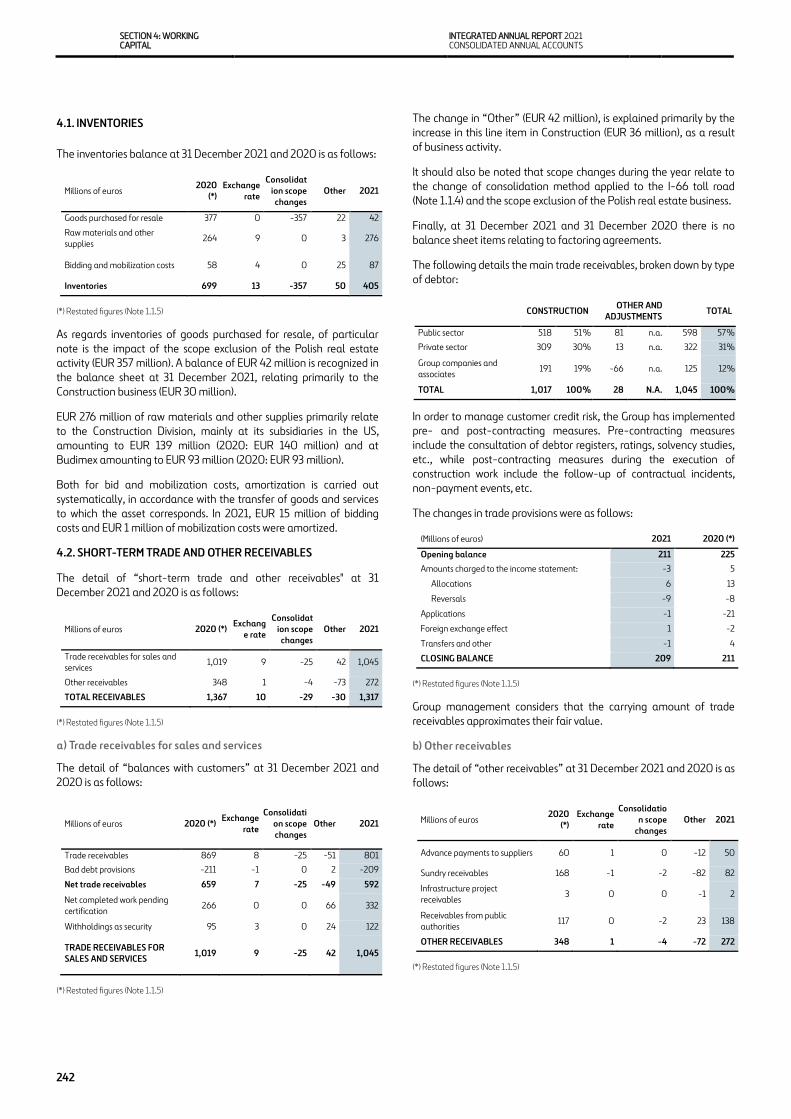
SECTION 4: WORKING CAPITAL
INTEGRATED ANNUAL REPORT 2021 CONSOLIDATED ANNUAL ACCOUNTS
242
4.1. INVENTORIES
The inventories balance at 31 December 2021 and 2020 is as follows:
(*) Restated figures (Note 1.1.5)
As regards inventories of goods purchased for resale, of particular note is the impact of the scope exclusion of the Polish real estate activity (EUR 357 million). A balance of EUR 42 million is recognized in the balance sheet at 31 December 2021, relating primarily to the Construction business (EUR 30 million).
EUR 276 million of raw materials and other supplies primarily relate to the Construction Division, mainly at its subsidiaries in the US, amounting to EUR 139 million (2020: EUR 140 million) and at Budimex amounting to EUR 93 million (2020: EUR 93 million).
Both for bid and mobilization costs, amortization is carried out systematically, in accordance with the transfer of goods and services to which the asset corresponds. In 2021, EUR 15 million of bidding costs and EUR 1 million of mobilization costs were amortized.
4.2. SHORT-TERM TRADE AND OTHER RECEIVABLES
The detail of “short-term trade and other receivables" at 31 December 2021 and 2020 is as follows:
(*) Restated figures (Note 1.1.5)
a) Trade receivables for sales and services
The detail of “balances with customers” at 31 December 2021 and 2020 is as follows:
(*) Restated figures (Note 1.1.5)
The change in “Other” (EUR 42 million), is explained primarily by the increase in this line item in Construction (EUR 36 million), as a result of business activity.
It should also be noted that scope changes during the year relate to the change of consolidation method applied to the I-66 toll road (Note 1.1.4) and the scope exclusion of the Polish real estate business.
Finally, at 31 December 2021 and 31 December 2020 there is no balance sheet items relating to factoring agreements.
The following details the main trade receivables, broken down by type of debtor:
In order to manage customer credit risk, the Group has implemented pre- and post-contracting measures. Pre-contracting measures include the consultation of debtor registers, ratings, solvency studies, etc., while post-contracting measures during the execution of construction work include the follow-up of contractual incidents, non-payment events, etc.
The changes in trade provisions were as follows:
(*) Restated figures (Note 1.1.5)
Group management considers that the carrying amount of trade receivables approximates their fair value.
b) Other receivables
The detail of “other receivables” at 31 December 2021 and 2020 is as follows:
(*) Restated figures (Note 1.1.5)
Millions of euros 2020 (*)
Exchange rate
Consolidation scope
changes Other 2021
Goods purchased for resale 377 0 -357 22 42 Raw materials and other supplies 264 9 0 3 276
Bidding and mobilization costs 58 4 0 25 87 Inventories 699 13 -357 50 405
Millions of euros 2020 (*) Exchange rate
Consolidation scope
changes Other 2021
Trade receivables for sales and services 1,019 9 -25 42 1,045 Other receivables 348 1 -4 -73 272 TOTAL RECEIVABLES 1,367 10 -29 -30 1,317
Millions of euros 2020 (*) Exchange rate
Consolidation scope changes
Other 2021
Trade receivables 869 8 -25 -51 801 Bad debt provisions -211 -1 0 2 -209 Net trade receivables 659 7 -25 -49 592 Net completed work pending certification 266 0 0 66 332 Withholdings as security 95 3 0 24 122 TRADE RECEIVABLES FOR SALES AND SERVICES 1,019 9 -25 42 1,045
CONSTRUCTION OTHER AND ADJUSTMENTS TOTAL
Public sector 518 51 % 81 n.a. 598 57 % Private sector 309 30% 13 n.a. 322 31% Group companies and associates 191 19% -66 n.a. 125 12% TOTAL 1,017 100 % 28 N.A. 1,045 100 %
(Millions of euros) 2021 2020 (*) Opening balance 211 225 Amounts charged to the income statement: -3 5 Allocations 6 13 Reversals -9 -8 Applications -1 -21 Foreign exchange effect 1 -2 Transfers and other -1 4 CLOSING BALANCE 209 211
Millions of euros 2020 (*)
Exchange rate
Consolidation scope
changes Other 2021
Advance payments to suppliers 60 1 0 -12 50 Sundry receivables 168 -1 -2 -82 82 Infrastructure project receivables 3 0 0 -1 2 Receivables from public authorities 117 0 -2 23 138 OTHER RECEIVABLES 348 1 -4 -72 272
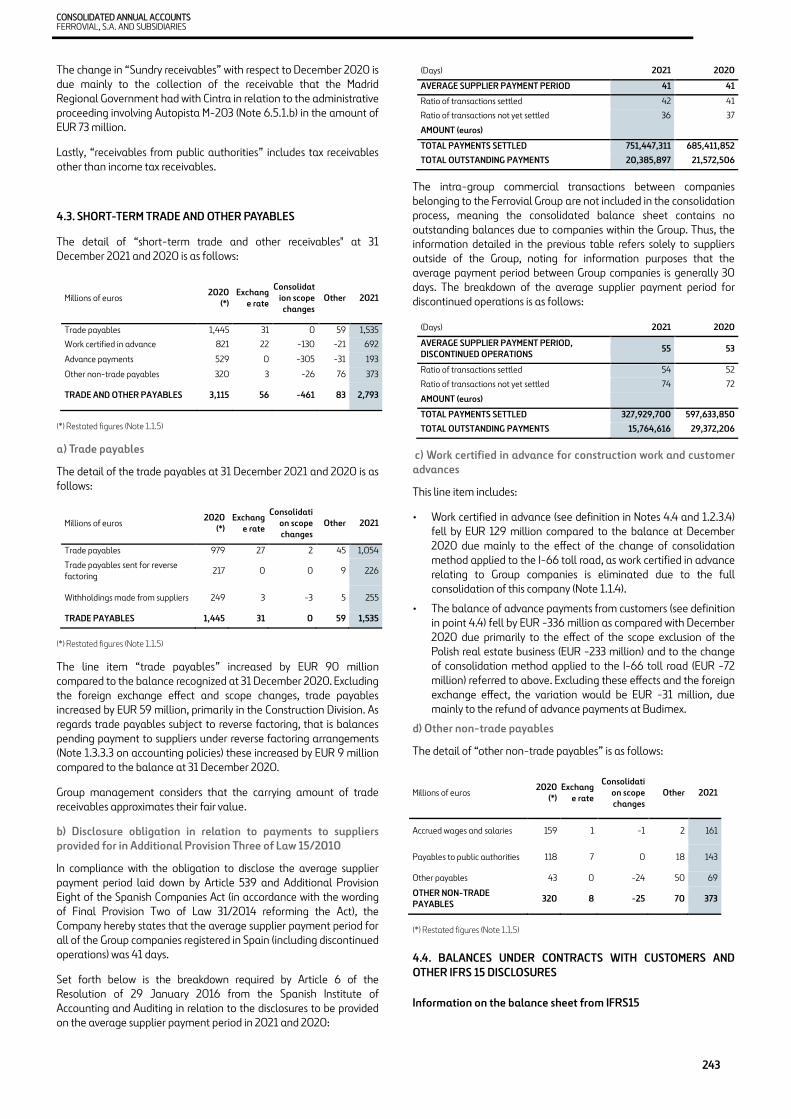
CONSOLIDATED ANNUAL ACCOUNTS FERROVIAL, S.A. AND SUBSIDIARIES
243
The change in “Sundry receivables” with respect to December 2020 is due mainly to the collection of the receivable that the Madrid Regional Government had with Cintra in relation to the administrative proceeding involving Autopista M-203 (Note 6.5.1.b) in the amount of EUR 73 million.
Lastly, “receivables from public authorities” includes tax receivables other than income tax receivables.
4.3. SHORT-TERM TRADE AND OTHER PAYABLES
The detail of “short-term trade and other receivables" at 31 December 2021 and 2020 is as follows:
(*) Restated figures (Note 1.1.5)
a) Trade payables
The detail of the trade payables at 31 December 2021 and 2020 is as follows:
(*) Restated figures (Note 1.1.5)
The line item “trade payables” increased by EUR 90 million compared to the balance recognized at 31 December 2020. Excluding the foreign exchange effect and scope changes, trade payables increased by EUR 59 million, primarily in the Construction Division. As regards trade payables subject to reverse factoring, that is balances pending payment to suppliers under reverse factoring arrangements (Note 1.3.3.3 on accounting policies) these increased by EUR 9 million compared to the balance at 31 December 2020.
Group management considers that the carrying amount of trade receivables approximates their fair value.
b) Disclosure obligation in relation to payments to suppliers provided for in Additional Provision Three of Law 15/2010
In compliance with the obligation to disclose the average supplier payment period laid down by Article 539 and Additional Provision Eight of the Spanish Companies Act (in accordance with the wording of Final Provision Two of Law 31/2014 reforming the Act), the Company hereby states that the average supplier payment period for all of the Group companies registered in Spain (including discontinued operations) was 41 days.
Set forth below is the breakdown required by Article 6 of the Resolution of 29 January 2016 from the Spanish Institute of Accounting and Auditing in relation to the disclosures to be provided on the average supplier payment period in 2021 and 2020:
The intra-group commercial transactions between companies belonging to the Ferrovial Group are not included in the consolidation process, meaning the consolidated balance sheet contains no outstanding balances due to companies within the Group. Thus, the information detailed in the previous table refers solely to suppliers outside of the Group, noting for information purposes that the average payment period between Group companies is generally 30 days. The breakdown of the average supplier payment period for discontinued operations is as follows:
c) Work certified in advance for construction work and customer advances
This line item includes:
• Work certified in advance (see definition in Notes 4.4 and 1.2.3.4) fell by EUR 129 million compared to the balance at December 2020 due mainly to the effect of the change of consolidation method applied to the I-66 toll road, as work certified in advance relating to Group companies is eliminated due to the full consolidation of this company (Note 1.1.4).
• The balance of advance payments from customers (see definition in point 4.4) fell by EUR -336 million as compared with December 2020 due primarily to the effect of the scope exclusion of the Polish real estate business (EUR -233 million) and to the change of consolidation method applied to the I-66 toll road (EUR -72 million) referred to above. Excluding these effects and the foreign exchange effect, the variation would be EUR -31 million, due mainly to the refund of advance payments at Budimex.
d) Other non-trade payables
The detail of “other non-trade payables” is as follows:
Millions of euros 2020 (*)
Exchange rate
Consolidation scope changes
Other 2021
Accrued wages and salaries 159 1 -1 2 161 Payables to public authorities 118 7 0 18 143 Other payables 43 0 -24 50 69 OTHER NON-TRADE PAYABLES 320 8 -25 70 373
(*) Restated figures (Note 1.1.5)
4.4. BALANCES UNDER CONTRACTS WITH CUSTOMERS AND OTHER IFRS 15 DISCLOSURES
Information on the balance sheet from IFRS15
Millions of euros 2020 (*)
Exchange rate
Consolidation scope
changes Other 2021
Trade payables 1,445 31 0 59 1,535 Work certified in advance 821 22 -130 -21 692 Advance payments 529 0 -305 -31 193 Other non-trade payables 320 3 -26 76 373 TRADE AND OTHER PAYABLES 3,115 56 -461 83 2,793
Millions of euros 2020 (*)
Exchange rate
Consolidation scope changes
Other 2021
Trade payables 979 27 2 45 1,054 Trade payables sent for reverse factoring 217 0 0 9 226
Withholdings made from suppliers 249 3 -3 5 255 TRADE PAYABLES 1,445 31 0 59 1,535
(Days) 2021 2020 AVERAGE SUPPLIER PAYMENT PERIOD 41 41 Ratio of transactions settled 42 41 Ratio of transactions not yet settled 36 37 AMOUNT (euros) TOTAL PAYMENTS SETTLED 751,447,311 685,411,852 TOTAL OUTSTANDING PAYMENTS 20,385,897 21,572,506
(Days) 2021 2020 AVERAGE SUPPLIER PAYMENT PERIOD, DISCONTINUED OPERATIONS 55 53 Ratio of transactions settled 54 52 Ratio of transactions not yet settled 74 72 AMOUNT (euros) TOTAL PAYMENTS SETTLED 327,929,700 597,633,850 TOTAL OUTSTANDING PAYMENTS 15,764,616 29,372,206

SECTION 4: WORKING CAPITAL
INTEGRATED ANNUAL REPORT 2021 CONSOLIDATED ANNUAL ACCOUNTS
244
As mentioned in Note 1.2.3.4, relating to the policy with regard to recognizing revenues from contracts (IFRS 15), in contracts in which the performance obligations are measured over time, the difference between the revenues recognized for services rendered and the amounts actually billed to the customer are systematically analyzed on a contract-by-contract basis.
If the amount billed is lower than the revenue recognized, the difference is recognized as an asset under “trade receivables for sales and services - completed work pending certification” (Note 4.2.a.), whereas if the revenue recognized is lower than the amount billed, a liability is recognized under “short-term trade and other payables - Progress billing for construction work” (Note 4.3).
Also, in certain construction contracts, advances are agreed upon that are paid by the customer when work is commenced on the contract, the balance of which is offset against the various progress billings as the contract work is performed.
These amounts are included on the liabilities side of the balance sheet, under “trade payables” (Note 4.3.a).
In contrast to the advance payments, in some contracts the customer retains a portion of each progress billing to guarantee certain contractual obligations are met. These "retentions" are not reimbursed until the contract is definitively settled. These amounts are included on the assets side of the balance sheet, under “trade receivables for sales and services” (Note 4.2.a).
Unlike completed work pending certification and work certified in advance, the advances and retentions are balances that will have an impact on future cash flows, since in the case of the advances a lower amount will be collected in the future as the advances are discounted from the progress billings, whereas the retentions will give rise to higher collections in the future, since the customer will reimburse the related amounts as and when the contract work is settled.
The detail of the amounts recognized in this connection at 31 December 2021 and 2020 is as follows:
(*) Restated figures (Note 1.1.5)
The balance at 31 December 2021 of work completed and pending certification relates almost entirely to amounts relating to revenues from the main contract signed with the customer, since, in line with the general policy established by the Group, only works that are due and payable may be recognized, i.e. amounts that have been approved by the customer. The balance shown under claims includes only the cases in which it is deemed highly probable that there will be no reversal of revenues in the future.
In general, performance obligations in the construction business are fulfilled over time. Therefore, as the amounts relating to changes and claims are immaterial under the completed work pending certification heading, the balance relates basically to differences between work completed and work certified due to timing differences in the customer certification and review process, billing milestones, certification schedule, etc.
Other disclosures relating to IFRS 15:
Revenue from contracts with customers:
EUR 6,678 million of total revenue recognized in 2021 (Note 2.1, operating income) relate to revenue from contracts with customers, which represents 98.5% of revenue recognized.
With regard to income pending recognition in relation to uncompleted performance obligations at year-end, this line item corresponds to what is generally referred to as the order book (see the definition in the section Alternative performance measures in the Management report).
The table below is a breakdown of this figure by business area and includes an estimate of the years in which it is expected that it will appear in income.
There are a total of 788 contracts in progress in the Construction businesses, as well as 4 Waste treatment contracts.
Millions of euros 2020 (*)
Exchange rate
Consolidation scope
changes Other 2021
Completed work pending certification 266 0 0 66 332 Withholdings 93 3 0 24 119 Total assets from customer contracts 359 2 0 91 451 Work certified in advance 821 22 -130 -21 692 Advance payments 530 0 -305 -31 193 Total liabilities from customer contracts 1,350 22 -434 -52 885
(Millions of euros) 2021 Construction 5,799 Toll roads 531 Airports 2 Other segments 347 Revenue from contracts with customers 6,678
INCOME 2022 2023 2024 2025 2026+ TOTAL Construction 5,351 3,491 1,711 719 944 12,216 Waste Treatment 58 69 68 72 720 987 Total 5,409 3,560 1,779 791 1,664 13,204

CONSOLIDATED ANNUAL ACCOUNTS FERROVIAL, S.A. AND SUBSIDIARIES
245
SECTION 5: CAPITAL STRUCTURE AND FINANCING
The notes in this section describe the changes in Ferrovial's financial structure, addressing both changes in equity (Note 5.1) and consolidated net debt (Note 5.2) (taken to be the balance of cash and cash equivalents net of financial debt, bank borrowings and debt securities), broken down by project companies and ex-project companies. They also describe the Group's exposure to the main financial risks and the policies for managing them (Note 5.4), as well as the derivatives arranged in connection with those policies (Note 5.5).
Equity (Note 5.1) attributed to shareholders increased in relation to the previous year due essentially to results for the year less shareholder returns.
(*) Restated figures (Note 1.1.5)
The net consolidated cash (Note 5.2) of Ferrovial ex-infrastructure projects, including discontinued operations, amounted to EUR 2,182 million (2020: EUR 1,991 million).
The improvement during the year is explained by cash flows (Note 5.3), which do include movements in discontinued operations. The positive flow from operating activities before tax of EUR 1,116 million is worthy of note, due primarily to divestments during the financial year (EUR 1,621 million) and dividends received from projects (EUR 550 million), offset by investments totaling EUR 1,112 million.
This positive net figure continues to make it possible to amply achieve the objective of maintaining an investment grade rating, where the Company considers a relevant metric the ratio, for ex-infrastructure projects, of Net Debt (gross debt less cash) to gross operating profit (EBITDA) plus dividends from projects of no more than 2:1. Ferrovial’s current rating stands at BBB.
As regards gross project debt, the variation on the previous year (EUR 7,409 million in December 2021 versus EUR 5,240 million in December 2020) is due primarily to the effect of scope changes relating to the change of consolidation method applied to the I-66 toll road (EUR 1,554 million) and to the foreign exchange effect of EUR 303 million.
5.240312
3031.554
7.409
Begining
balance at
31/12/2020
Net drawdowns Exchange rate
effect
Changes in the
scope of
consolidation
Ending balance
at 31/12/2021
BORROWINGS OF INFRAESTRUCTURE PROJECTS
1.991
550 57
-121
1.621
-1.112
-463
-256-85
2.182
NCP Dec. 2020 Dividends from projects Operating cash flow ex
Tax÷nds
Tax Payment Divestments Investments Shareholder
remuneration
Changes in the scope of
consolidation
Others financing cash
flow
NCP Dec.2021
NET CASH POSITION EX INFRAESTRUCTURES PROJECT:
EQUITY ATTRIBUTED TO SHAREHOLDERS
(Millions of euros)
CLOSING BALANCE AT 31/12/2020 (*) 3,150
Net profit/(loss) 1,197
Income and expense recognized directly in equity 196
Amounts transferred to the income statement 1
Shareholder remuneration -463
Share-based remuneration scheme -22
Other -11
Closing balance at 31/12/2021 4,048
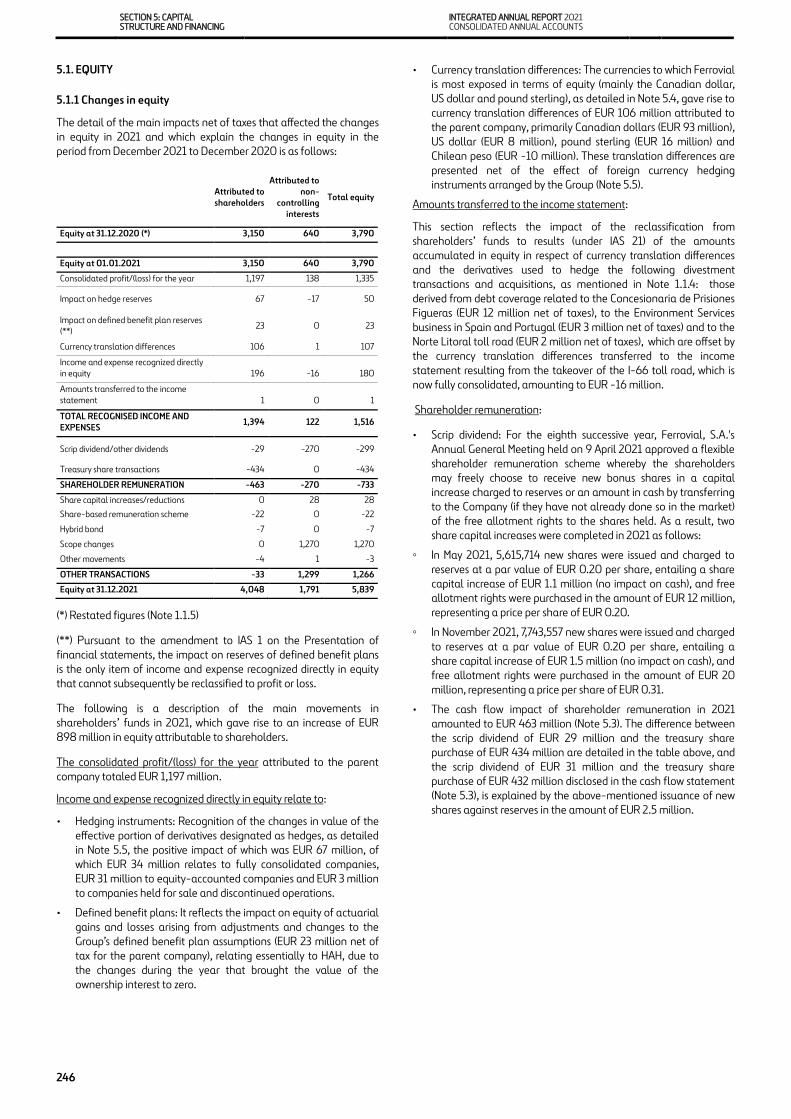
SECTION 5: CAPITAL STRUCTURE AND FINANCING
INTEGRATED ANNUAL REPORT 2021 CONSOLIDATED ANNUAL ACCOUNTS
246
5.1. EQUITY
5.1.1 Changes in equity
The detail of the main impacts net of taxes that affected the changes in equity in 2021 and which explain the changes in equity in the period from December 2021 to December 2020 is as follows:
Attributed to shareholders
Attributed to non-
controlling interests
Total equity Equity at 31.12.2020 (*) 3,150 640 3,790 Equity at 01.01.2021 3,150 640 3,790 Consolidated profit/(loss) for the year 1,197 138 1,335 Impact on hedge reserves 67 -17 50 Impact on defined benefit plan reserves (**) 23 0 23 Currency translation differences 106 1 107 Income and expense recognized directly in equity 196 -16 180 Amounts transferred to the income statement 1 0 1 TOTAL RECOGNISED INCOME AND EXPENSES 1,394 122 1,516
Scrip dividend/other dividends -29 -270 -299 Treasury share transactions -434 0 -434 SHAREHOLDER REMUNERATION -463 -270 -733 Share capital increases/reductions 0 28 28 Share-based remuneration scheme -22 0 -22 Hybrid bond -7 0 -7 Scope changes 0 1,270 1,270 Other movements -4 1 -3 OTHER TRANSACTIONS -33 1,299 1,266 Equity at 31.12.2021 4,048 1,791 5,839
(*) Restated figures (Note 1.1.5)
(**) Pursuant to the amendment to IAS 1 on the Presentation of financial statements, the impact on reserves of defined benefit plans is the only item of income and expense recognized directly in equity that cannot subsequently be reclassified to profit or loss.
The following is a description of the main movements in shareholders’ funds in 2021, which gave rise to an increase of EUR 898 million in equity attributable to shareholders.
The consolidated profit/(loss) for the year attributed to the parent company totaled EUR 1,197 million.
Income and expense recognized directly in equity relate to:
• Hedging instruments: Recognition of the changes in value of the effective portion of derivatives designated as hedges, as detailed in Note 5.5, the positive impact of which was EUR 67 million, of which EUR 34 million relates to fully consolidated companies, EUR 31 million to equity-accounted companies and EUR 3 million to companies held for sale and discontinued operations.
• Defined benefit plans: It reflects the impact on equity of actuarial gains and losses arising from adjustments and changes to the Group’s defined benefit plan assumptions (EUR 23 million net of tax for the parent company), relating essentially to HAH, due to the changes during the year that brought the value of the ownership interest to zero.
• Currency translation differences: The currencies to which Ferrovial is most exposed in terms of equity (mainly the Canadian dollar, US dollar and pound sterling), as detailed in Note 5.4, gave rise to currency translation differences of EUR 106 million attributed to the parent company, primarily Canadian dollars (EUR 93 million), US dollar (EUR 8 million), pound sterling (EUR 16 million) and Chilean peso (EUR -10 million). These translation differences are presented net of the effect of foreign currency hedging instruments arranged by the Group (Note 5.5).
Amounts transferred to the income statement:
This section reflects the impact of the reclassification from shareholders’ funds to results (under IAS 21) of the amounts accumulated in equity in respect of currency translation differences and the derivatives used to hedge the following divestment transactions and acquisitions, as mentioned in Note 1.1.4: those derived from debt coverage related to the Concesionaria de Prisiones Figueras (EUR 12 million net of taxes), to the Environment Services business in Spain and Portugal (EUR 3 million net of taxes) and to the Norte Litoral toll road (EUR 2 million net of taxes), which are offset by the currency translation differences transferred to the income statement resulting from the takeover of the I-66 toll road, which is now fully consolidated, amounting to EUR -16 million.
Shareholder remuneration:
• Scrip dividend: For the eighth successive year, Ferrovial, S.A.'s Annual General Meeting held on 9 April 2021 approved a flexible shareholder remuneration scheme whereby the shareholders may freely choose to receive new bonus shares in a capital increase charged to reserves or an amount in cash by transferring to the Company (if they have not already done so in the market) of the free allotment rights to the shares held. As a result, two share capital increases were completed in 2021 as follows:
◦ In May 2021, 5,615,714 new shares were issued and charged to reserves at a par value of EUR 0.20 per share, entailing a share capital increase of EUR 1.1 million (no impact on cash), and free allotment rights were purchased in the amount of EUR 12 million, representing a price per share of EUR 0.20.
◦ In November 2021, 7,743,557 new shares were issued and charged to reserves at a par value of EUR 0.20 per share, entailing a share capital increase of EUR 1.5 million (no impact on cash), and free allotment rights were purchased in the amount of EUR 20 million, representing a price per share of EUR 0.31.
• The cash flow impact of shareholder remuneration in 2021 amounted to EUR 463 million (Note 5.3). The difference between the scrip dividend of EUR 29 million and the treasury share purchase of EUR 434 million are detailed in the table above, and the scrip dividend of EUR 31 million and the treasury share purchase of EUR 432 million disclosed in the cash flow statement (Note 5.3), is explained by the above-mentioned issuance of new shares against reserves in the amount of EUR 2.5 million.
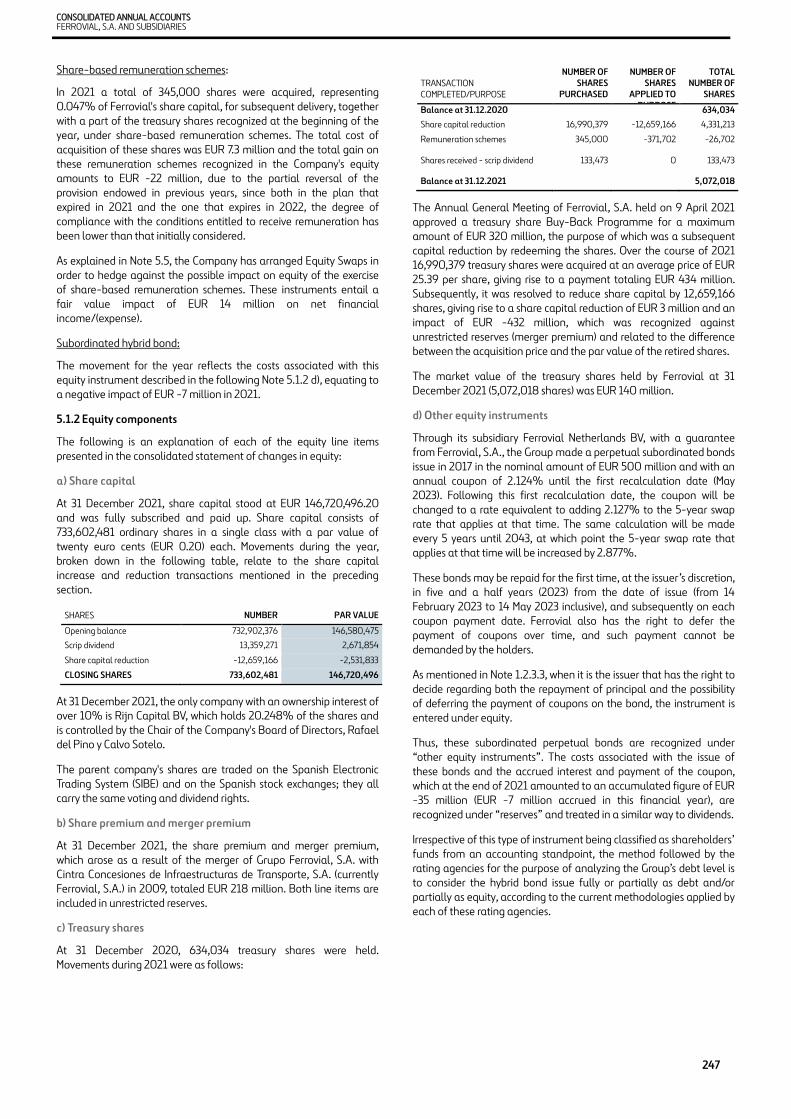
CONSOLIDATED ANNUAL ACCOUNTS FERROVIAL, S.A. AND SUBSIDIARIES
247
Share-based remuneration schemes:
In 2021 a total of 345,000 shares were acquired, representing 0.047% of Ferrovial's share capital, for subsequent delivery, together with a part of the treasury shares recognized at the beginning of the year, under share-based remuneration schemes. The total cost of acquisition of these shares was EUR 7.3 million and the total gain on these remuneration schemes recognized in the Company's equity amounts to EUR -22 million, due to the partial reversal of the provision endowed in previous years, since both in the plan that expired in 2021 and the one that expires in 2022, the degree of compliance with the conditions entitled to receive remuneration has been lower than that initially considered.
As explained in Note 5.5, the Company has arranged Equity Swaps in order to hedge against the possible impact on equity of the exercise of share-based remuneration schemes. These instruments entail a fair value impact of EUR 14 million on net financial income/(expense).
Subordinated hybrid bond:
The movement for the year reflects the costs associated with this equity instrument described in the following Note 5.1.2 d), equating to a negative impact of EUR -7 million in 2021.
5.1.2 Equity components
The following is an explanation of each of the equity line items presented in the consolidated statement of changes in equity:
a) Share capital
At 31 December 2021, share capital stood at EUR 146,720,496.20 and was fully subscribed and paid up. Share capital consists of 733,602,481 ordinary shares in a single class with a par value of twenty euro cents (EUR 0.20) each. Movements during the year, broken down in the following table, relate to the share capital increase and reduction transactions mentioned in the preceding section.
At 31 December 2021, the only company with an ownership interest of over 10% is Rijn Capital BV, which holds 20.248% of the shares and is controlled by the Chair of the Company's Board of Directors, Rafael del Pino y Calvo Sotelo.
The parent company's shares are traded on the Spanish Electronic Trading System (SIBE) and on the Spanish stock exchanges; they all carry the same voting and dividend rights.
b) Share premium and merger premium
At 31 December 2021, the share premium and merger premium, which arose as a result of the merger of Grupo Ferrovial, S.A. with Cintra Concesiones de Infraestructuras de Transporte, S.A. (currently Ferrovial, S.A.) in 2009, totaled EUR 218 million. Both line items are included in unrestricted reserves.
c) Treasury shares
At 31 December 2020, 634,034 treasury shares were held. Movements during 2021 were as follows:
The Annual General Meeting of Ferrovial, S.A. held on 9 April 2021 approved a treasury share Buy-Back Programme for a maximum amount of EUR 320 million, the purpose of which was a subsequent capital reduction by redeeming the shares. Over the course of 2021 16,990,379 treasury shares were acquired at an average price of EUR 25.39 per share, giving rise to a payment totaling EUR 434 million. Subsequently, it was resolved to reduce share capital by 12,659,166 shares, giving rise to a share capital reduction of EUR 3 million and an impact of EUR -432 million, which was recognized against unrestricted reserves (merger premium) and related to the difference between the acquisition price and the par value of the retired shares.
The market value of the treasury shares held by Ferrovial at 31 December 2021 (5,072,018 shares) was EUR 140 million.
d) Other equity instruments
Through its subsidiary Ferrovial Netherlands BV, with a guarantee from Ferrovial, S.A., the Group made a perpetual subordinated bonds issue in 2017 in the nominal amount of EUR 500 million and with an annual coupon of 2.124% until the first recalculation date (May 2023). Following this first recalculation date, the coupon will be changed to a rate equivalent to adding 2.127% to the 5-year swap rate that applies at that time. The same calculation will be made every 5 years until 2043, at which point the 5-year swap rate that applies at that time will be increased by 2.877%.
These bonds may be repaid for the first time, at the issuer’s discretion, in five and a half years (2023) from the date of issue (from 14 February 2023 to 14 May 2023 inclusive), and subsequently on each coupon payment date. Ferrovial also has the right to defer the payment of coupons over time, and such payment cannot be demanded by the holders.
As mentioned in Note 1.2.3.3, when it is the issuer that has the right to decide regarding both the repayment of principal and the possibility of deferring the payment of coupons on the bond, the instrument is entered under equity.
Thus, these subordinated perpetual bonds are recognized under “other equity instruments”. The costs associated with the issue of these bonds and the accrued interest and payment of the coupon, which at the end of 2021 amounted to an accumulated figure of EUR -35 million (EUR -7 million accrued in this financial year), are recognized under “reserves” and treated in a similar way to dividends.
Irrespective of this type of instrument being classified as shareholders’ funds from an accounting standpoint, the method followed by the rating agencies for the purpose of analyzing the Group’s debt level is to consider the hybrid bond issue fully or partially as debt and/or partially as equity, according to the current methodologies applied by each of these rating agencies.
SHARES NUMBER PAR VALUE Opening balance 732,902,376 146,580,475 Scrip dividend 13,359,271 2,671,854 Share capital reduction -12,659,166 -2,531,833 CLOSING SHARES 733,602,481 146,720,496
TRANSACTION COMPLETED/PURPOSE
NUMBER OF SHARES
PURCHASED NUMBER OF
SHARES APPLIED TO
PURPOSE
TOTAL NUMBER OF
SHARES Balance at 31.12.2020 634,034 Share capital reduction 16,990,379 -12,659,166 4,331,213 Remuneration schemes 345,000 -371,702 -26,702 Shares received - scrip dividend 133,473 0 133,473 Balance at 31.12.2021 5,072,018

SECTION 5: CAPITAL STRUCTURE AND FINANCING
INTEGRATED ANNUAL REPORT 2021 CONSOLIDATED ANNUAL ACCOUNTS
248
e) measurement adjustments
“Measurement adjustments” in the consolidated statement of changes in equity, the balance of which at 31 December 2021 was EUR -1,299 million, includes the accumulated amount in reserves of the measurement adjustments made to translation differences (EUR -519 million), pension plans (EUR -455 million) and measurement adjustments made to derivatives (EUR -325 million).
As regards the requirements of IAS 1 in relation to the disclosure of “income and expenses recognized directly in equity”, it is important to note that the only items that under the related accounting legislation may not be transferred in a future period to the income statement are the items relating to pension plans.
f) Retained earnings and other reserves
This line item includes prior years’ retained earnings and other reserves totaling EUR 4,599 million (2020: EUR 3,359 million). The other reserves include restricted reserves of the parent company, relating mainly to the legal reserve of EUR 30 million.
Adjustments relating to share-based remuneration schemes and the impact of the subordinated perpetual bond’s coupons and associated costs are also recognized under this heading.
g) Proposed distribution of profit for 2021
The Company posted a loss for the year of EUR -31,614,831.01.
The Board of Directors will propose to the Company’s Annual General Meeting the following distribution of FERROVIAL, S.A.'s individual profit:
The legal reserve is fully funded.
h) Non-group companies with significant ownership interests in subsidiaries
At 31 December 2021, the non-controlling interests in the share capital of the most significant fully consolidated Group companies were as follows:
The main financial statement aggregates of the most significant Group companies in which other shareholders own interests are as follows (data on 100% terms):
The main movements in "equity attributable to non-controlling interests" in 2021 were as follows:
(*) Restated figures (Note 1.1.5)
2021 Profit of FERROVIAL, S.A. (individual company) (euros) -31,614,831.01 Distribution (euros): To prior year losses -31,614,831.01
FERROVIAL GROUP SUBSIDIARY NON-GROUP % NON-GROUP SHAREHOLDER TOLL ROADS Autopista Terrassa-Manresa, S.A. 23.72 % Acesa (Autopista Concesionaria
Española, S.A.) LBJ Infrastructure Group Holding LLC
28.3272%-17.0689%
LBJ Blocker (APG)- Meridiam Infr. S.a.r.l. (MI LBJ)
NTE Mobility Partners Holding LLC 37.03 % Meridiam Infrastructure S.a.r.l.
NTE Mobility Partners SEG 3 Holding LLC
28.8399%-17.4949%
NTE Segments 3 Blocker, Inc. (APG) - Meridiam Infraestructure NTE
3A/3B LLC I-77 Mobility Partners, LLC 17.45%-17.45% Aberdeen Infr. Invest./John Laing I-
77 Holco Corp. I-66 Mobility Partners, LLC 29.746% -
14.55% Meridiam Infrastructure S.a.r.l. - I-
66 Blocker (APG) CONSTRUCTION Budimex S.A. 9.8%-6.3%-
33.8% AVIVA OFE Aviva BZ WBK-
Nationale Nederlanden OFE (listed on the stock exchange)
2021 ASSETS LIABILITIES SHAREHOLDERS’
FUNDS NCP NET PROFIT/(LOSS) (Millions of euros) Terrassa Manresa toll road: 829 209 620 14 -45 LBJ Infraestructure Group 2,087 2,236 -149 -1,757 -2 NTE Mobility Partners 1,643 1,614 29 -1,075 42 NTE Mobility Partners Segments 3 LLC 2,104 1,681 424 -928 23 I-77 Mobility Partners LLC 704 503 201 -231 1 I-66 Mobility Partners LLC 4,321 1,414 2,907 -1,511 16 Budimex 1,557 1,212 344 561 108
Company Balance at 31/12/2020 (*) Profit/(loss) Derivatives Currency
translation differences
Dividends Share capital increase Other Balance at
31.12.2021 Terrassa Manresa toll road: 192 -14 -19 0 -12 0 0 147 LBJ Infraestructure Group 73 -2 0 0 -139 0 0 -68 NTE Mobility Partners 17 25 0 1 -31 0 -1 11 NTE Mobility Partners Segments 3 LLC 163 20 0 13 0 0 0 196 I-77 Mobility Partners LLC 65 1 0 5 0 0 -1 70 I-66 Mobility Partners LLC 0 0 0 -14 0 18 1,284 1,288 FAM Construction LLC (I-66) -48 -7 0 -4 0 0 0 -59 Budimex 183 109 0 -1 -88 0 -1 202 Environmental Services 10 3 0 0 0 0 -13 0 Other -15 3 2 1 0 10 3 4 TOTAL 640 138 -17 1 -270 28 1,271 1,791

CONSOLIDATED ANNUAL ACCOUNTS FERROVIAL, S.A. AND SUBSIDIARIES
249
“Capital increases” reflects the impact of the increase in funds attributable to non-controlling interests of the toll road I-66 Mobility Partners LLC and D4R7 Construction S.R.O. amounting to EUR 18 million and EUR 10 million respectively.
The heading “Other movements” mainly reflects an impact of EUR 1,284 million associated with the full consolidation of the I-66 toll road (Note 1.1.4) due to the fact that the amount attributable to non-controlling interests is recognized at fair value in the same way as all the company’s assets and liabilities following the acquisition of control.
5.2. NET CONSOLIDATED DEBT
In order to present an analysis of the Group's net debt position, the following table contains a breakdown of the Net Cash Position, distinguishing between infrastructure project companies and the other companies. The net cash position is understood to be the balance of the items included under "cash and cash equivalents", together with the long-term restricted cash of infrastructure projects and other short-term financial assets, less financial borrowings (short-term and long-term bank borrowings and debt securities).
The net cash position also includes forwards totaling EUR -22 million that hedge the cash held by the Group in Australian and Canadian dollars, as well as cross-currency swaps, valued at EUR -9 million and associated with the borrowings and cash denominated in US dollars. The derivatives are accounted for in this way because they are associated in full with the aforementioned borrowings/cash and the related exchange rate effect is netted off therefrom.
Continuing and discontinued operations (millions of euros)
31/12/2021
Bank borrowing
s/bonds
Cross-currency swaps
Cash and
cash equival
ents
Forwards
Long-term
restricted cash
Net borrowin
g position
Intragroup
positionTotal
Ex-infrastructur -3,202 -9 5,452 -22 0 2,219 -37 2,182
Infrastructure project -7,463 0 214 0 579 -6,671 37 -6,633
Total net cash position -10,665 -9 5,666 -22 579 -4,451 0 -4,451
31/12/2020
Bank borrowing
s/bonds
Cross-currency swaps
Cash and
cash equival
ents
Forwards
Long-term
restricted cash
Net borrowin
g position
Intragroup
positionTotal
Ex-infrastructur -4,598 -2 6,614 14 3 2,030 -39 1,991
Infrastructure project -5,445 0 224 0 650 -4,571 39 -4,532
Total net cash position -10,043 -2 6,837 14 654 -2,541 0 -2,541
The net cash position ex-infrastructure projects including discontinued operations amounted to EUR 2,182 million at December 2021 compared to EUR 1,991 at December 2020, a change of EUR 191 million. The net cash position of infrastructure projects, including discontinued operations, varied by EUR -2,102 million, from EUR -4,532 million in December 2020 to EUR -6,633 million in December 2021, due primarily to the change of consolidation method applied to the I-66 toll road (Note 1.1.4). It is now fully consolidated so 100% of the company’s net cash position is recognized in the amount of EUR 1,511 million at December 2021. A more detailed analysis of this position, both for continuing and discontinued operations is included in Note 5.3 on cash flow and in the management report that has been formally prepared together with these consolidated financial statements.
(*) Restated figures (Note 1.1.5)
A breakdown of discontinued operations of both periods is also included below:
31/12/2021
Continuing operations (millions of euros)
Bank borrowing
s/bonds
Cross-currency swaps
Cash and
cash equival
ents
Forwards
Long-term
restricted cash
Net borrowin
g position
Intragroup
positionTotal
Ex-infrastructure -3,178 -9 5,319 -22 0 2,111 -37 2,074
Infrastructure project -7,409 0 207 0 579 -6,623 37 -6,586
Total net cash position -10,587 -9 5,526 -22 579 -4,512 0 -4,512
31/12/2020 (*)
Continuing operations (millions of euros)
Bank borrowings/bonds
Cross-currency swaps
Cash and
cash equival
ents
Forwards
Long-term
restricted cash
Net borrowin
g position
Intragroup
positionTotal
Ex-infrastructure -4,522 -2 6,378 14 3 1,871 -39 1,832
Infrastructure project -5,240 0 148 0 650 -4,442 39 -4,402
Total net cash position -9,762 -2 6,526 14 654 -2,571 0 -2,571
Change
Continuing operations (millions of euros)
Bank borrowing
s/bonds
Cross-currency
swaps
Cash and cash equivale
nts
Forwards
Long-term
restricted cash
Net borrowin
g position
Intragroup
position
Total
Ex-infrastructur 1,344 -6 -1,059 -36 -3 240 2 242
Infrastructure project -2,169 0 59 0 -72 -2,181 -2 -2,183
Total net cash position -825 -6 -999 -36 -75 -1,941 0 -1,941
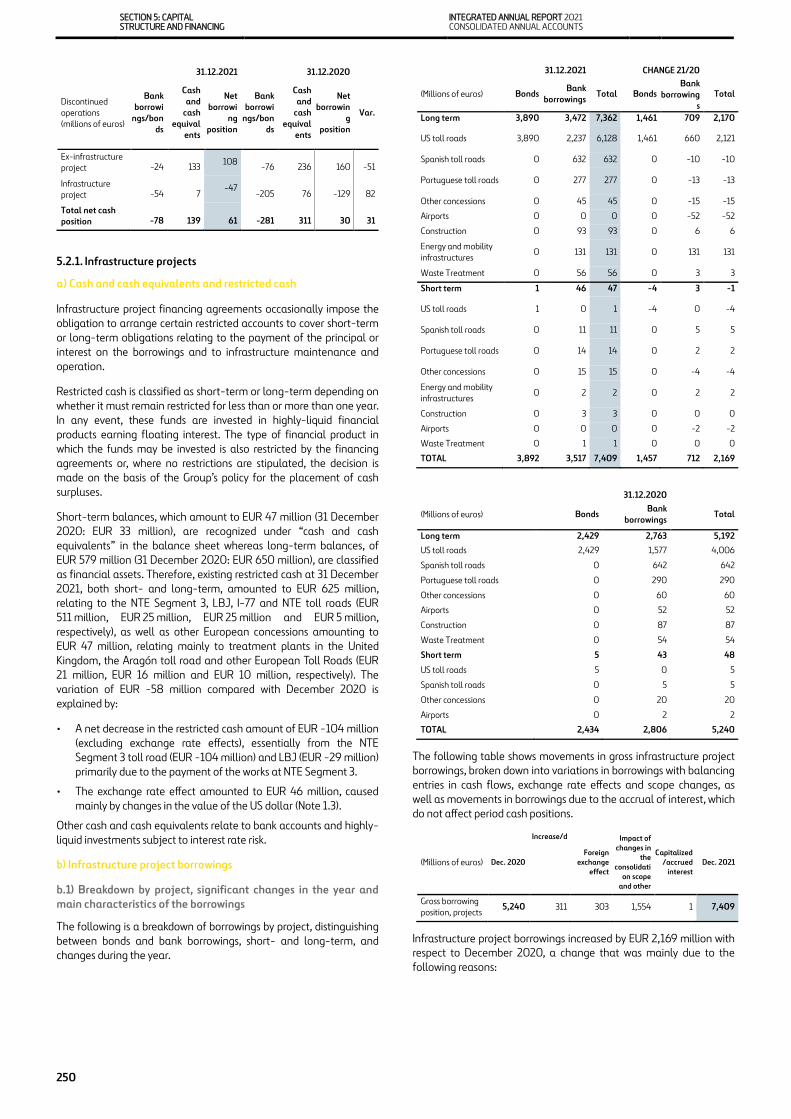
SECTION 5: CAPITAL STRUCTURE AND FINANCING
INTEGRATED ANNUAL REPORT 2021 CONSOLIDATED ANNUAL ACCOUNTS
250
5.2.1. Infrastructure projects
a) Cash and cash equivalents and restricted cash
Infrastructure project financing agreements occasionally impose the obligation to arrange certain restricted accounts to cover short-term or long-term obligations relating to the payment of the principal or interest on the borrowings and to infrastructure maintenance and operation.
Restricted cash is classified as short-term or long-term depending on whether it must remain restricted for less than or more than one year. In any event, these funds are invested in highly-liquid financial products earning floating interest. The type of financial product in which the funds may be invested is also restricted by the financing agreements or, where no restrictions are stipulated, the decision is made on the basis of the Group’s policy for the placement of cash surpluses.
Short-term balances, which amount to EUR 47 million (31 December 2020: EUR 33 million), are recognized under “cash and cash equivalents” in the balance sheet whereas long-term balances, of EUR 579 million (31 December 2020: EUR 650 million), are classified as financial assets. Therefore, existing restricted cash at 31 December 2021, both short- and long-term, amounted to EUR 625 million, relating to the NTE Segment 3, LBJ, I-77 and NTE toll roads (EUR 511 million, EUR 25 million, EUR 25 million and EUR 5 million, respectively), as well as other European concessions amounting to EUR 47 million, relating mainly to treatment plants in the United Kingdom, the Aragón toll road and other European Toll Roads (EUR 21 million, EUR 16 million and EUR 10 million, respectively). The variation of EUR -58 million compared with December 2020 is explained by:
• A net decrease in the restricted cash amount of EUR -104 million (excluding exchange rate effects), essentially from the NTE Segment 3 toll road (EUR -104 million) and LBJ (EUR -29 million) primarily due to the payment of the works at NTE Segment 3.
• The exchange rate effect amounted to EUR 46 million, caused mainly by changes in the value of the US dollar (Note 1.3).
Other cash and cash equivalents relate to bank accounts and highly-liquid investments subject to interest rate risk.
b) Infrastructure project borrowings
b.1) Breakdown by project, significant changes in the year and main characteristics of the borrowings
The following is a breakdown of borrowings by project, distinguishing between bonds and bank borrowings, short- and long-term, and changes during the year.
The following table shows movements in gross infrastructure project borrowings, broken down into variations in borrowings with balancing entries in cash flows, exchange rate effects and scope changes, as well as movements in borrowings due to the accrual of interest, which do not affect period cash positions.
Infrastructure project borrowings increased by EUR 2,169 million with respect to December 2020, a change that was mainly due to the following reasons:
31.12.2021 31.12.2020
Discontinued operations (millions of euros)
Bank borrowi
ngs/bonds
Cash and
cash equival
ents
Net borrowi
ng position
Bank borrowi
ngs/bonds
Cash and
cash equival
ents
Net borrowin
g position
Var.
Ex-infrastructure project
-24 133 108 -76 236 160 -51
Infrastructure project
-54 7 -47
-205 76 -129 82 Total net cash position -78 139 61 -281 311 30 31
31.12.2021 CHANGE 21/20 (Millions of euros) Bonds Bank
borrowings Total Bonds Bank borrowing
s Total
Long term 3,890 3,472 7,362 1,461 709 2,170 US toll roads 3,890 2,237 6,128 1,461 660 2,121 Spanish toll roads 0 632 632 0 -10 -10 Portuguese toll roads 0 277 277 0 -13 -13 Other concessions 0 45 45 0 -15 -15 Airports 0 0 0 0 -52 -52 Construction 0 93 93 0 6 6 Energy and mobility infrastructures 0 131 131 0 131 131 Waste Treatment 0 56 56 0 3 3 Short term 1 46 47 -4 3 -1 US toll roads 1 0 1 -4 0 -4 Spanish toll roads 0 11 11 0 5 5 Portuguese toll roads 0 14 14 0 2 2 Other concessions 0 15 15 0 -4 -4 Energy and mobility infrastructures 0 2 2 0 2 2 Construction 0 3 3 0 0 0 Airports 0 0 0 0 -2 -2 Waste Treatment 0 1 1 0 0 0 TOTAL 3,892 3,517 7,409 1,457 712 2,169
31.12.2020 (Millions of euros) Bonds Bank
borrowings Total Long term 2,429 2,763 5,192 US toll roads 2,429 1,577 4,006 Spanish toll roads 0 642 642 Portuguese toll roads 0 290 290 Other concessions 0 60 60 Airports 0 52 52 Construction 0 87 87 Waste Treatment 0 54 54 Short term 5 43 48 US toll roads 5 0 5 Spanish toll roads 0 5 5 Other concessions 0 20 20 Airports 0 2 2 TOTAL 2,434 2,806 5,240
(Millions of euros) Dec. 2020 Increase/d
Foreign exchange
effect
Impact of changes in
the consolidati
on scope and other
Capitalized/accrued
interest Dec. 2021
Gross borrowing position, projects 5,240 311 303 1,554 1 7,409
CONSOLIDATED ANNUAL ACCOUNTS FERROVIAL, S.A. AND SUBSIDIARIES
251
• Effect of scope changes related to the consolidation of 100% of the Net Cash Position of Autopista I-66 following the change of method due to the purchase of an additional 5.704% of the company, impacting debt in the amount of EUR 1,554 million (Note 1.1.4).
• Exchange rate effect amounting to EUR 303 million, mainly due to the depreciation of the euro against the US dollar.
• Increase in borrowings already arranged at the end of 2020 and capitalization and accrual of interest for a net amount of EUR 311 million. This increase primarily relates to projects in the US:
• LBJ (EUR 257 million), due mainly to the USD 609 million bond issue and offset by the repayment of USD 301 of the TIFIA loan. This debt structure is described below in this Note.
• NTE Mobility Partners Seg 3 LLC, NTE Mobility Partner and I-66 and I-77 (EUR 12 million), mainly due to interest capitalization and unpaid accrued interest.
US toll roads:
NTE Mobility Partners, LLC
The debt comprises a USD 871.1 million taxable bond issue maturing in 2049 at a fixed interest rate of 3.92% and a USD 331.8 million issue of PABs (Private Activity Bonds) (total of USD 400 million including the premium) at a fixed interest rate of 4.00% and 5.00% (weighted average interest rate of 4.63%), repayable from 2030 to 2039.
NTE Mobility Partners Seg 3 LLC
The borrowings for the 3A-3B segments are structured with the issue of USD 274 million of Private Activity Bonds (PABs), maturing at 25 and 30 years (7.00% fixed interest on USD 128 million and 6.75% fixed interest on USD 146 million), and a TIFIA loan of USD 531 million bearing a fixed rate of 3.84%, against which USD 641.6 million had been drawn down at 31 December 2021 (USD 531.0 million of principal and USD 110.6 million of interest added to the principal), with final maturity in 2053.
The 3C segment debt comprises a USD 653.9 million issue of PABs (Private Activity Bonds) (total of USD 750 million with the premium) repayable from 2047 to 2058, at a fixed interest rate of 5.00%.
LBJ Infr. Group LLC
The debt structure comprises a USD 537.5 million issue of PABs (Private Activity Bonds) (total of USD 615 million including the premium) at a fixed interest rate of 4.00%, repayable from 2030 to 2040; and a USD 615.5 million taxable bond issue, of which USD 7 million accrues a fixed interest rate of 2.75% and falls due in 2026, and USD 608.5 million accrues fixed interest of 3.80% and falls due in 2057.
There is also a TIFIA loan granted by the US Federal Government. After having repaid USD 300.6 million, the value of the loan at 31 December 2021 is USD 835.6 million, repayable from 2035 to 2050 and accruing interest at a fixed rate of 4.22%.
I-77 Mobility Partners, LLC
This concession operator is financed through a USD 100 million issue of PABs (5.00% fixed interest), of which USD 7 million have final maturity between 2026 and 2030, USD 13 million have final maturity in 2037 and EUR 80 million have final maturity in 2054.
It also has a TIFIA loan of USD 189 million against which USD 217.6 million had been drawn down at 31 December 2021 (USD 189.0 million of principal and USD 28.6 million of capitalized interest). This loan bears interest at a fixed rate of 3.04% and has final maturity in 2053.
I-66 Mobility Partners, LLC
The concession operator is funded by a USD 737 million PAB (Private Activity Bonds) issue (total of USD 800.4 million including the premium) at a fixed rate of 5.00%, of which USD 30.9 million falls due in 2047, USD 130.9 million in 2049, USD 222.4 million in 2052 and USD 352.8 million in 2056.
It also has a TIFIA loan of USD 1,229 million against which USD 1,312.4 million had been drawn down at 31 December 2021 (USD 1,229.1 million of principal and USD 83.3 million of capitalized interest). This loan bears interest at a fixed rate of 2.80% and has final maturity in 2057.
The difference between the total nominal debt (EUR 1,802 million) and the book balance at December 31 2021 (EUR 1,525 million) is mainly due to the fair value adjustment following the purchase of the additional percentage in the amount of €317 million (see Note 1.1.1.4), as well as capitalized interest and unpaid accrued interest in the amount of EUR 40 million.
Spanish toll roads:
Cintra Inversora Autopistas de Cataluña (A. Terrasa Manresa)
The company is funded by a loan consisting of tranche A and tranche B with limits of EUR 300 million and EUR 316 million, respectively, both of which accrue interest at the 6-month EURIBOR rate -0.544% +1.50% at the year-end. Both tranches were fully utilized and fall due in 2035. The respective balances at 31 December 2021 are EUR 294.3 million and EUR 310.0 million. The debt also includes a liquidity tranche (tranche C) with a balance of EUR 42.1 million at 31 December 2021, drawable up to a maximum of EUR 25.0 million (the year-end interest rate is the 6-month EURIBOR -0.544% +1.50%). It should also be noted that this company has a derivative with a notional amount of EUR 590.5 million, a guaranteed interest rate of 5.288% and maturity in 2035. The fair value of the derivative arranged (recognized under “derivative financial instruments”, Note 5.5) was EUR -219.4 million at year-end.
Portuguese toll roads:
Euroscut Azores
Syndicated bank financing with final maturity in 2033, against which EUR 293.1 million had been drawn down at 31 December 2021 (bearing interest at the 6-month EURIBOR of -0.513% +0.85%). In relation to these borrowings, the concession operator has arranged a derivative with a notional amount of EUR 251.0 million, a guaranteed fixed interest rate of 4.115% and maturity in 2033. The fair value of the derivative arranged (recognized under “derivative financial instruments”, Note 5.5) was EUR -52.6 million at year-end.

SECTION 5: CAPITAL STRUCTURE AND FINANCING
INTEGRATED ANNUAL REPORT 2021 CONSOLIDATED ANNUAL ACCOUNTS
252
Breakdown of other projects:
Other project borrowings increased by EUR 65 million as compared with December 2020. This increase is due mainly to the debt drawdowns for the Chilean Energy Infrastructure projects.
b.2) Maturities by currency and fair value of infrastructure project borrowings
LONG TERM
SHORT TERM 2021 CHANGE
21/20 Transchile Charrúa Transmisión, S.A. 99 2 101 47 Centella Transmisión, S.A. 32 0 32 32 Conc. Prisiones Lledoners, S.A. 67 2 69 -2 Depusa Aragón, S.A. 26 1 27 8 Autovía de Aragón, Sociedad Concesionaria, S.A. 46 11 56 -11 Pilum, S.A. 0 5 5 -8 TOTAL Other infrastructure project borrowings 269 20 289 65
LONG TERM SHORT TERM 2019 Transchile Charrúa Transmisión, S.A. 52 2 54 Centella Transmisión, S.A. 0 0 0 Conc. Prisiones Lledoners, S.A. 69 2 71 Depusa Aragón, S.A. 18 1 19 Autovía de Aragón, Sociedad Concesionaria, S.A. 56 12 67 Pilum, S.A. 4 8 12 TOTAL Other infrastructure project borrowings 200 24 224
Currency
Fair value 2021
Carrying amount 2021 2022 2023 2024 2025 2026 2027+ Total
maturities Infrastructure project obligations 3,659 3,892 0 0 0 1 7 2,558 2,566 TOLL ROADS 3,659 3,892 0 0 0 1 7 2,558 2,566 USD 3,659 3,892 0 0 0 1 7 2,558 2,566 EUR 0 0 0 0 0 0 0 0 0 AIRPORTS 0 0 0 0 0 0 0 0 0 USD 0 0 0 0 0 0 0 0 0 EUR 0 0 0 0 0 0 0 0 0 ENERGY AND MOBILITY INFRASTRUCTURES 0 0 0 0 0 0 0 0 0 USD 0 0 0 0 0 0 0 0 0 Bank borrowings of infrastructure project companies 2,556 3,517 44 91 56 65 192 4,541 4,989
TOLL ROADS 2,461 3,232 39 86 49 59 56 4,408 4,698 USD 1,466 2,237 0 45 0 0 0 3,652 3,697 EUR 995 995 39 41 49 59 56 756 1,001 AIRPORTS 0 0 0 0 0 0 0 0 0 USD 0 0 0 0 0 0 0 0 0 CONSTRUCTION 96 96 1 1 1 2 2 91 98 EUR 96 96 1 1 1 2 2 91 98 SERVICES 0 0 0 0 0 0 0 0 0 GBP 0 0 0 0 0 0 0 0 0 EUR 0 0 0 0 0 0 0 0 0 ENERGY AND MOBILITY INFRASTRUCTURES 133 133 1 1 2 2 131 0 137 USD 133 133 1 1 2 2 131 0 137 EUR 0 0 0 0 0 0 0 0 0 WASTE TREATMENT 57 57 3 3 3 3 3 42 57
GBP 57 57 3 3 3 3 3 42 57 EUR 0 0 0 0 0 0 0 0 0
TOTAL INFRASTRUCTURE PROJECT BORROWINGS 6,215 7,409 44 91 56 66 199 7,099 7,555

CONSOLIDATED ANNUAL ACCOUNTS FERROVIAL, S.A. AND SUBSIDIARIES
253
The differences between the total maturities of bank borrowings (EUR 7,555 million) and the carrying amounts recognized at 31 December 2021 (EUR 7,409 million) are explained mainly by the difference between the nominal values and carrying amounts of the borrowings, as certain adjustments are made in accordance with applicable accounting legislation. Thus, the accrued interest payable and the application of the amortized cost method represent an impact of EUR 171 million, considering that the maturities of the borrowings do not include interest. In addition, a fair value adjustment of EUR -317 million was made to the I-66 toll road’s debt described in Note 1.1.4.
The fair value reflected in the table above is calculated as follows:
• For fixed-rate bonds, subject to changes in value due to fluctuations in market interest rates: since they are quoted in an active market, the related market value is used.
• For fixed-interest bank borrowings, also subject to changes in value due to fluctuations in rates: future cash flows are discounted using a market interest rate, calculated using an internal valuation model.
• Lastly, for floating-rate bank borrowings: no significant differences are deemed to exist between the fair value of the borrowings and their carrying amount and, therefore, the carrying amount is used.
b.3) Information on credit limits and credit drawable for infrastructure projects
Below is a comparative analysis of borrowings not drawn down at year-end:
The entire drawable amount of EUR 115 million (EUR 25 million at 31 December 2020) relates to borrowings not utilized in the Chilean energy projects (EUR 90 million) and in Spanish toll roads. It should be noted that this drawable amount is associated exclusively with the projects, based on the nature and performance thereof, as discussed below.
b.4) Guarantees and covenants for project borrowings
The borrowings classified as project borrowings are without recourse to the shareholders of the projects or with recourse limited to the guarantees provided. The guarantees provided by subsidiaries of Ferrovial in relation with the borrowings of these projects are described in Note 6.5, Contingent liabilities.
At 31 December 2021, all the fully-consolidated project companies were achieving the significant covenants in force.
5.2.2. Net cash position excluding infrastructure projects
a) Borrowings excluding infrastructure projects
a.1) Breakdown between short and long-term balances, changes during the year and main characteristics
The following table shows changes to ex-infrastructure project gross borrowings, broken down into variations in borrowings with balancing entries in cash flows, exchange rate effects and scope changes, as well as changes in borrowings due to the accrual of interest, which do not affect period cash positions:
a.1.1) Corporate debt
The corporate debt comprises the following debt instruments:
Corporate bonds:
2021
Borrowing limit Drawn down Drawable
Debt recognized
in the accounts
(Millions of euros)
Toll roads 7,289 7,264 25 7,124 US toll roads 6,263 6,263 0 6,129 Spanish toll roads 671 646 25 643 Other concessions 354 354 0 352 Energy and mobility infrastructures 227 137 90 133 Construction 98 98 0 96 Waste Treatment 57 57 0 57
TOTAL BORROWINGS 7,670 7,555 115 7,409
2020 Borrowing
limit Drawn
down Drawable Debt
recognized in the
accounts (Millions of euros) Toll roads 4,940 4,915 25 5,042 US toll roads 3,878 3,878 0 4,011 Spanish toll roads 677 652 25 648 Other concessions 385 385 0 383 Airports 54 54 0 54 Construction 90 90 0 90 Waste Treatment 54 54 0 54
TOTAL BORROWINGS 5,137 5,112 25 5,240
2021 CHANGE 21/20 (Millions of euros) Long
term Short term Total Long
term Short term Total
Corporate bonds and debentures 2,069 517 2,586 -497 -7 -504 Euro Commercial Paper 0 250 250 0 -841 -841 Corporate liquidity lines 60 241 301 -224 241 17 Other borrowings 21 20 41 -21 5 -16 TOTAL FINANCIAL BORROWINGS EXCLUDING INFRASTRUCTURE PROJECT COMPANIES
2,150 1,027 3,178 -742 -602 -1,344
2020 (Millions of euros) Long term Short term Total Corporate bonds 2,566 524 3,090 Euro Commercial Paper 0 1,091 1,091 Corporate liquidity lines 284 0 284 Other borrowings 42 15 57 TOTAL FINANCIAL BORROWINGS EXCLUDING INFRASTRUCTURE PROJECT COMPANIES 2,892 1,630 4,522
(Millions of euros)
Dec. 2020
Increase/decrease
with impact on cash flow
Foreign exchange
effect
Impact of changes
in the consolida
tion scope and other
Capitalized/accrued
interest Dec. 2021 Bank borrowings/Project bonds 4,522 -1,379 18 0 17 3,178 Cross-currency swaps 2 0 6 0 0 9 Gross borrowing position, ex-projects 4,524 -1,379 24 0 17 3,186

SECTION 5: CAPITAL STRUCTURE AND FINANCING
INTEGRATED ANNUAL REPORT 2021 CONSOLIDATED ANNUAL ACCOUNTS
254
The carrying amount of which totals EUR 2,586 million at 31 December 2021 (31 December 2020: EUR 3,090 million). These are broken down in the following table:
All issues completed as from 2014 are traded on the AIAF Fixed Income Market (Spain). All these issues are guaranteed by Ferrovial S.A., the parent company of the Group.
In 2021, the bond issued in June 2013 for a notional amount of EUR 500 million and at an annual coupon of 2.557% was repaid as well as the associated Interest Rate Swap (Note 5.5)
Euro Commercial Paper:
In the first quarter of 2018, the company formally completed a Euro Commercial Paper (ECP) programme for a maximum amount of EUR 1,000 million, with maturities between 1 and 364 days from the issue date, allowing for greater capital markets finance sourcing diversification and more efficiency when managing available liquidity. Towards the end of 2019 this limit was increased up to EUR 1,500 million, with the carrying amount standing at EUR 250 million at 31 December 2021.
This ECP programme has been renewed annually since 2018.
Liquidity facility:
In July 2018, Ferrovial refinanced the liquidity facility, incorporating sustainability criteria. Of the current maximum limit on the facility (EUR 900 million and potential to draw down the balance in EUR, USD, CAD and GBP), USD 284 million has been drawn down at 31 December 2021.
In order to cover possible interest rate and foreign exchange fluctuations affecting the amount drawn, Ferrovial has arranged cross-currency swaps for USD 274 million, maturing in 2022, for an agreed equivalent value of EUR 250 million, the fair value of which amounts to EUR -8 million.
The variation in corporate debt compared to December 2020 (EUR -1,328 million) is explained mainly by the lower volume of ECPs issued (EUR -841 million, at an average rate of -0.29%) and by the repayment of the bond issued in 2013 for the amount of EUR 500 million referred to previously.
The Group’s liquidity, including discontinued operations, amounts to EUR 6,421 million (Note 5.4.d).
Information on the credit limits and credit drawable of the corporate debt.
The detail of the limits and the amounts drawable of the corporate debt at 31 December 2021 and at 31 December 2020 is as follows:
(*) The balance drawn on the syndicated facility includes the fair value of cross-currency swaps (EUR -8 million).
(*) The balance drawn on the syndicated facilities includes the fair value of cross-currency swaps (EUR -26 million).
Company's credit rating
The credit rating agencies Standard & Poor’s and Fitch maintained their opinion regarding the financial rating of Ferrovial’s corporate debt in December 2021, respectively rating it at BBB and BBB with stable outlook and therefore, within the “Investment Grade” category.
a.1.2) Other borrowings
“Other borrowings” of EUR 41 million (31 December 2020: EUR 57 million) primarily include other bank borrowing balances, mainly in the Construction Division.
Information on credit limits and available credit:
As regards information on the limits and amounts available for drawdown under other borrowings, the following table shows the position at 31 December 2021 and 31 December 2020:
The differences between total bank borrowings and the carrying amount thereof at 31 December 2021 are explained mainly by the difference between the nominal values and carrying amounts of the debts, as certain adjustments are made in accordance with applicable accounting legislation.
Issue date(Par) value
(Millions of euros) Maturity Annual coupon
14/9/2016 500 14/9/2022 0.375%
15/7/2014 300 15/7/2024 2.500 %
29/3/2017 500 31/3/2025 1.375 %
14/5/2020 650 14/5/2026 1.382 %
24/6/2020 131 14/5/2026 1.382 %
12/11/2020 500 12/11/2028 0.540 %
2021
(Millions of euros)Borrowing
limitDrawn down
(*) Drawable Corporate debt
Bonds 2,581 2,581 0 2,586 Syndicated facility 900 250 650 241
ECPs 250 250 0 250
Other 60 60 0 60
TOTAL CORPORATE DEBT 3,791 3,141 650 3,136
2020
(Millions of euros)Borrowing
limitDrawn down
(*) Drawable Corporate debt
Bonds 3,081 3,081 0 3,090 Syndicated facility 900 250 650 224
ECPs 1,091 1,091 0 1,091
Other 340 60 280 60
TOTAL CORPORATE DEBT 5,412 4,482 930 4,464
2021
(Millions of euros)Borrowing
limit Drawn down DrawableConsolidated
debt
Construction 190 57 132 40 OTHER BORROWINGS 190 57 132 40
2020
(Millions of euros)Borrowing
limit Drawn down DrawableCorporate
debt
Construction 259 84 175 58 OTHER BORROWINGS 259 84 175 58

CONSOLIDATED ANNUAL ACCOUNTS FERROVIAL, S.A. AND SUBSIDIARIES
255
a.2) Maturities by currency and fair value of borrowings excluding infrastructure projects
The differences between the total maturities of financial borrowings and the carrying amounts of the debt at 31 December 2021 are primarily explained by the difference between the nominal values and carrying amounts of the borrowings, as certain adjustments are made in accordance with applicable accounting legislation (basically accrued interest payable and the application of the amortized cost method).
The fair value of bank borrowings excluding infrastructure project companies coincides with the related carrying amount because the borrowings are tied to floating market interest rates and, therefore, changes in the benchmark interest rates do not affect their fair value.
As regards corporate bonds: since they are quoted in an active market, the related market value is used.
In line with the aforementioned criteria, the estimated total fair value of bank borrowings and bonds excluding infrastructure project companies at 31 December 2021 is estimated at EUR 3,254 million.
The 2022 maturities amount to EUR 751 million and primarily relate to the maturity of the ECPs and corporate bonds. The borrowing maturities do not include interest.
b) Cash and cash equivalents of other companies
The general method used to classify the cash and cash equivalents at short- and long-term coincides with that used in the preparation of the Consolidated Annual Accounts for 2020.
Also, at 31 December 2021 there were certain restricted accounts totaling EUR 72 million (31 December 2020: EUR 108 million) primarily relating to Construction, for operating motives in construction projects in the US.
Borrowings (millions of euros) Currency Fair value 2021
Carrying amount
2021 2022 2023 2024 2025 2026 2027+ Total maturities
Corporate debt 3,213 3,136 750 0 300 750 781 560 3,141 EUR 3,213 3,136 750 0 300 750 781 560 3,141 Other borrowings 41 41 1 5 2 7 25 16 57 EUR 12 12 0 0 1 0 0 1 2 PLN 28 28 1 5 2 7 7 7 28 Other 1 1 0 0 0 0 18 9 27
TOTAL FINANCIAL BORROWING EXCLUDING INFRASTRUCTURE PROJECT COMPANIES 3,254 3,178 751 5 302 757 806 576 3,198

SECTION 5: CAPITAL STRUCTURE AND FINANCING
INTEGRATED ANNUAL REPORT 2021 CONSOLIDATED ANNUAL ACCOUNTS
256
5.3. CASH FLOW
The consolidated cash flow statement has been prepared in accordance with IAS 7. This note provides an additional breakdown, based on internal criteria established by the Company for business purposes, which in certain cases differ from the provisions of IAS 7. The main criteria applied are as follows:
• In order to provide a clearer explanation of the cash generated, the Group separates cash flows into “Cash flows excluding infrastructure projects”, where infrastructure project concession operators are treated as financial assets and the investments in the capital of these companies are therefore included in cash flows from investing activities and the yields from the investments (dividends and capital reimbursements) are included in operations cash flow, and “cash flows from infrastructure projects”, consisting of cash flows from the operating and financing activities of infrastructure project concession operators.
• The treatment given to interest received on cash and cash equivalents differs from that in the cash flow statement prepared in accordance with IAS 7, since this interest is included in cash flows from financing activities, as a reduction of the amount of interest paid, under “interest cash flow”.
• This cash flow endeavors to present the changes in the net cash position as the net amount of financial borrowings, cash and cash equivalents and restricted cash. This method also departs from that established in IAS 7, which explains the change in cash and cash equivalents.
• In addition, with regard to the treatment of leases, as the nature of the payment is tied to business operations, the related cash flow is included in changes in working capital in cash flows from operating activities, which differs from the treatment afforded in the cash flow statement, where it is included in cash flows from financing activities. The total amount of lease instalments reported in the cash flow statement amounts to EUR -131 million at December 2021, of which EUR -74 million related to continuing operations (Note 3.7) and EUR -57 million related to discontinued operations.
• It should finally be noted that dividends received derive mainly from infrastructure projects and equity-consolidated companies. This includes both dividends and other similar items, mainly interest on subordinated borrowings and participating loans, and repayments of capital, debt and loans.
• As outlined in Note 1.1.3, the cash flow reported in this note includes flows from operating, investing and financing activities related to discontinued operations and held-for-sale assets, reflecting the main line items, thus explaining the net cash position including discontinued operations.
The change in Cash flow is also discussed in the management report that was formally prepared together with these Consolidated financial statements.
December 2021 (Millions of euros)
December 2021 Note Cash flow excluding
infrastructure project
companies
Cash flow of infrastructure
project companies
Removals Consolidated
cash flow EBITDA including discontinued operations 2 442 499 0 942 IFRS-16 impact -131 0 0 -131 EBITDA including discontinued operations and IFRS 16 311 499 0 810 Dividends receipts and other flows from equity-accounted companies 3.5 550 -2 -276 272 Change in working capital (receivables, payables and other) -254 5 0 -249 Operating cash flow before tax 607 503 -276 834 Taxes paid in the year 2.8.1 -121 -34 0 -155 Cash flows from operating activities 486 469 -276 679 Investment 3.2, 3.3 and
3.4 -1,112 -239 65 -1,285 Divestment 1.1.3 1,621 0 0 1,621 Cash flows from investing activities 509 -239 65 336 Cash flows from operating activities 995 230 -210 1,015 Interest cash flows 2.6 -39 -253 0 -292 Capital cash flows from non-controlling interests 12 111 -65 57 Scrip dividend -31 0 0 -31 Treasury share purchases -432 0 0 -432 Shareholder remuneration 5 -463 0 0 -463 Dividends paid to non-controlling interests of investees -88 -458 276 -271 Other movements in shareholder’s funds -5 5 0 0 Exchange rate effect 49 -252 0 -202 Consolidation scope changes 1.1.3 -256 -1,482 0 -1,738 Other movements in borrowings (no cash flows) -13 -4 0 -17 Cash flows from financing activities -804 -2,332 210 -2,926 Change in net cash position 5 191 -2,102 0 -1,911 Opening position 1,991 -4,532 0 -2,541 Closing position 2,182 -6,633 0 -4,451
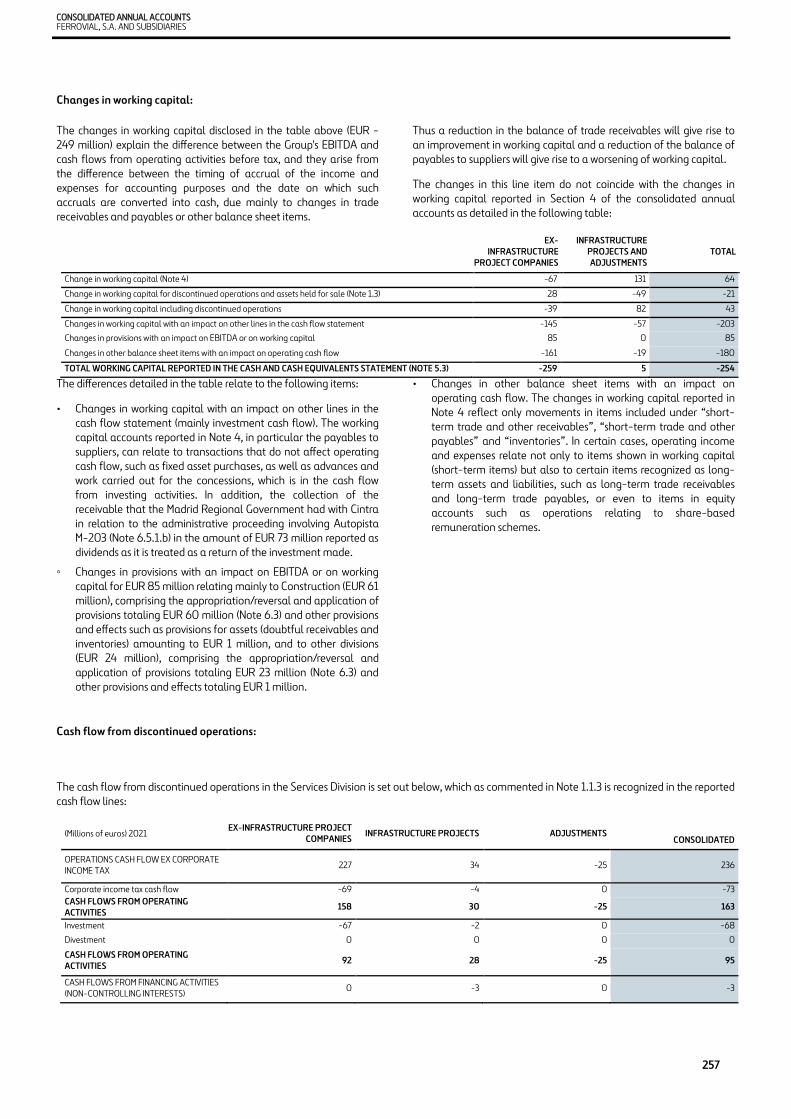
CONSOLIDATED ANNUAL ACCOUNTS FERROVIAL, S.A. AND SUBSIDIARIES
257
Changes in working capital:
The changes in working capital disclosed in the table above (EUR -249 million) explain the difference between the Group's EBITDA and cash flows from operating activities before tax, and they arise from the difference between the timing of accrual of the income and expenses for accounting purposes and the date on which such accruals are converted into cash, due mainly to changes in trade receivables and payables or other balance sheet items.
Thus a reduction in the balance of trade receivables will give rise to an improvement in working capital and a reduction of the balance of payables to suppliers will give rise to a worsening of working capital.
The changes in this line item do not coincide with the changes in working capital reported in Section 4 of the consolidated annual accounts as detailed in the following table:
The differences detailed in the table relate to the following items:
• Changes in working capital with an impact on other lines in the cash flow statement (mainly investment cash flow). The working capital accounts reported in Note 4, in particular the payables to suppliers, can relate to transactions that do not affect operating cash flow, such as fixed asset purchases, as well as advances and work carried out for the concessions, which is in the cash flow from investing activities. In addition, the collection of the receivable that the Madrid Regional Government had with Cintra in relation to the administrative proceeding involving Autopista M-203 (Note 6.5.1.b) in the amount of EUR 73 million reported as dividends as it is treated as a return of the investment made.
◦ Changes in provisions with an impact on EBITDA or on working capital for EUR 85 million relating mainly to Construction (EUR 61 million), comprising the appropriation/reversal and application of provisions totaling EUR 60 million (Note 6.3) and other provisions and effects such as provisions for assets (doubtful receivables and inventories) amounting to EUR 1 million, and to other divisions (EUR 24 million), comprising the appropriation/reversal and application of provisions totaling EUR 23 million (Note 6.3) and other provisions and effects totaling EUR 1 million.
• Changes in other balance sheet items with an impact on operating cash flow. The changes in working capital reported in Note 4 reflect only movements in items included under “short-term trade and other receivables”, “short-term trade and other payables” and “inventories”. In certain cases, operating income and expenses relate not only to items shown in working capital (short-term items) but also to certain items recognized as long-term assets and liabilities, such as long-term trade receivables and long-term trade payables, or even to items in equity accounts such as operations relating to share-based remuneration schemes.
Cash flow from discontinued operations:
The cash flow from discontinued operations in the Services Division is set out below, which as commented in Note 1.1.3 is recognized in the reported cash flow lines:
EX-
INFRASTRUCTURE PROJECT COMPANIES
INFRASTRUCTURE PROJECTS AND ADJUSTMENTS
TOTAL
Change in working capital (Note 4) -67 131 64 Change in working capital for discontinued operations and assets held for sale (Note 1.3) 28 -49 -21 Change in working capital including discontinued operations -39 82 43 Changes in working capital with an impact on other lines in the cash flow statement -145 -57 -203 Changes in provisions with an impact on EBITDA or on working capital 85 0 85 Changes in other balance sheet items with an impact on operating cash flow -161 -19 -180 TOTAL WORKING CAPITAL REPORTED IN THE CASH AND CASH EQUIVALENTS STATEMENT (NOTE 5.3) -259 5 -254
(Millions of euros) 2021 EX-INFRASTRUCTURE PROJECT COMPANIES INFRASTRUCTURE PROJECTS ADJUSTMENTS
CONSOLIDATED OPERATIONS CASH FLOW EX CORPORATE INCOME TAX 227 34 -25 236 Corporate income tax cash flow -69 -4 0 -73 CASH FLOWS FROM OPERATING ACTIVITIES 158 30 -25 163 Investment -67 -2 0 -68 Divestment 0 0 0 0 CASH FLOWS FROM OPERATING ACTIVITIES 92 28 -25 95 CASH FLOWS FROM FINANCING ACTIVITIES (NON-CONTROLLING INTERESTS) 0 -3 0 -3
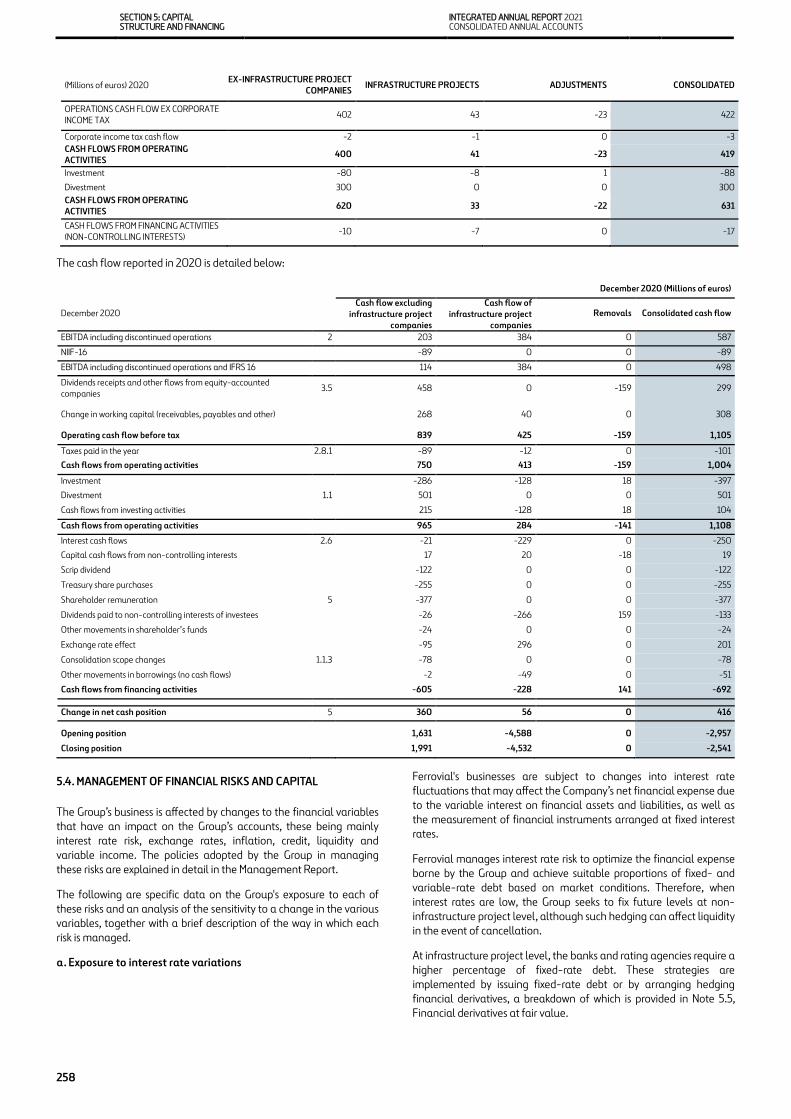
SECTION 5: CAPITAL STRUCTURE AND FINANCING
INTEGRATED ANNUAL REPORT 2021 CONSOLIDATED ANNUAL ACCOUNTS
258
The cash flow reported in 2020 is detailed below:
5.4. MANAGEMENT OF FINANCIAL RISKS AND CAPITAL
The Group’s business is affected by changes to the financial variables that have an impact on the Group’s accounts, these being mainly interest rate risk, exchange rates, inflation, credit, liquidity and variable income. The policies adopted by the Group in managing these risks are explained in detail in the Management Report.
The following are specific data on the Group's exposure to each of these risks and an analysis of the sensitivity to a change in the various variables, together with a brief description of the way in which each risk is managed.
a. Exposure to interest rate variations
Ferrovial's businesses are subject to changes into interest rate fluctuations that may affect the Company’s net financial expense due to the variable interest on financial assets and liabilities, as well as the measurement of financial instruments arranged at fixed interest rates.
Ferrovial manages interest rate risk to optimize the financial expense borne by the Group and achieve suitable proportions of fixed- and variable-rate debt based on market conditions. Therefore, when interest rates are low, the Group seeks to fix future levels at non-infrastructure project level, although such hedging can affect liquidity in the event of cancellation.
At infrastructure project level, the banks and rating agencies require a higher percentage of fixed-rate debt. These strategies are implemented by issuing fixed-rate debt or by arranging hedging financial derivatives, a breakdown of which is provided in Note 5.5, Financial derivatives at fair value.
(Millions of euros) 2020 EX-INFRASTRUCTURE PROJECT COMPANIES INFRASTRUCTURE PROJECTS ADJUSTMENTS CONSOLIDATED
OPERATIONS CASH FLOW EX CORPORATE INCOME TAX 402 43 -23 422 Corporate income tax cash flow -2 -1 0 -3 CASH FLOWS FROM OPERATING ACTIVITIES 400 41 -23 419 Investment -80 -8 1 -88 Divestment 300 0 0 300 CASH FLOWS FROM OPERATING ACTIVITIES 620 33 -22 631 CASH FLOWS FROM FINANCING ACTIVITIES (NON-CONTROLLING INTERESTS) -10 -7 0 -17
December 2020 (Millions of euros) December 2020
Cash flow excluding infrastructure project
companies Cash flow of
infrastructure project companies
Removals Consolidated cash flow EBITDA including discontinued operations 2 203 384 0 587 NIIF-16 -89 0 0 -89 EBITDA including discontinued operations and IFRS 16 114 384 0 498 Dividends receipts and other flows from equity-accounted companies 3.5 458 0 -159 299 Change in working capital (receivables, payables and other) 268 40 0 308 Operating cash flow before tax 839 425 -159 1,105 Taxes paid in the year 2.8.1 -89 -12 0 -101 Cash flows from operating activities 750 413 -159 1,004 Investment -286 -128 18 -397 Divestment 1.1 501 0 0 501 Cash flows from investing activities 215 -128 18 104 Cash flows from operating activities 965 284 -141 1,108 Interest cash flows 2.6 -21 -229 0 -250 Capital cash flows from non-controlling interests 17 20 -18 19 Scrip dividend -122 0 0 -122 Treasury share purchases -255 0 0 -255 Shareholder remuneration 5 -377 0 0 -377 Dividends paid to non-controlling interests of investees -26 -266 159 -133 Other movements in shareholder’s funds -24 0 0 -24 Exchange rate effect -95 296 0 201 Consolidation scope changes 1.1.3 -78 0 0 -78 Other movements in borrowings (no cash flows) -2 -49 0 -51 Cash flows from financing activities -605 -228 141 -692 Change in net cash position 5 360 56 0 416 Opening position 1,631 -4,588 0 -2,957 Closing position 1,991 -4,532 0 -2,541
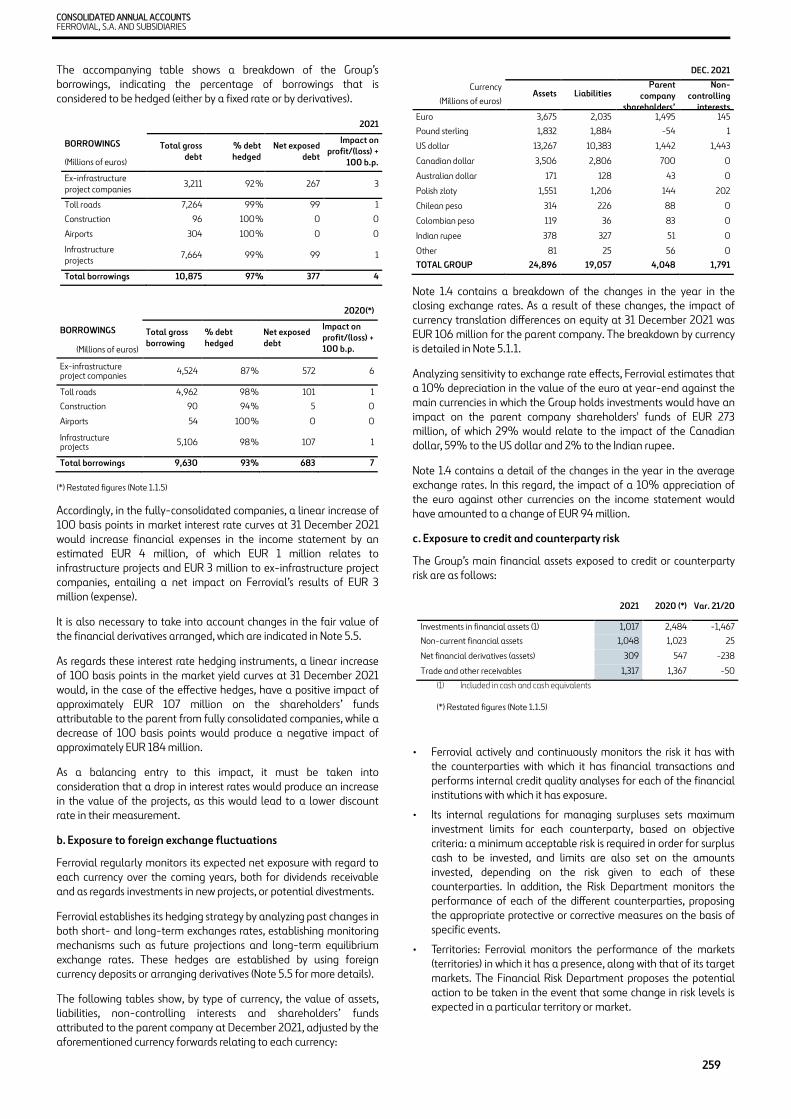
CONSOLIDATED ANNUAL ACCOUNTS FERROVIAL, S.A. AND SUBSIDIARIES
259
The accompanying table shows a breakdown of the Group’s borrowings, indicating the percentage of borrowings that is considered to be hedged (either by a fixed rate or by derivatives).
2020(*) BORROWINGS Total gross
borrowing % debt hedged
Net exposed debt
Impact on profit/(loss) + 100 b.p. (Millions of euros)
Ex-infrastructure project companies 4,524 87 % 572 6 Toll roads 4,962 98 % 101 1 Construction 90 94 % 5 0 Airports 54 100 % 0 0 Infrastructure projects 5,106 98 % 107 1 Total borrowings 9,630 93 % 683 7
(*) Restated figures (Note 1.1.5)
Accordingly, in the fully-consolidated companies, a linear increase of 100 basis points in market interest rate curves at 31 December 2021 would increase financial expenses in the income statement by an estimated EUR 4 million, of which EUR 1 million relates to infrastructure projects and EUR 3 million to ex-infrastructure project companies, entailing a net impact on Ferrovial’s results of EUR 3 million (expense).
It is also necessary to take into account changes in the fair value of the financial derivatives arranged, which are indicated in Note 5.5.
As regards these interest rate hedging instruments, a linear increase of 100 basis points in the market yield curves at 31 December 2021 would, in the case of the effective hedges, have a positive impact of approximately EUR 107 million on the shareholders’ funds attributable to the parent from fully consolidated companies, while a decrease of 100 basis points would produce a negative impact of approximately EUR 184 million.
As a balancing entry to this impact, it must be taken into consideration that a drop in interest rates would produce an increase in the value of the projects, as this would lead to a lower discount rate in their measurement.
b. Exposure to foreign exchange fluctuations
Ferrovial regularly monitors its expected net exposure with regard to each currency over the coming years, both for dividends receivable and as regards investments in new projects, or potential divestments.
Ferrovial establishes its hedging strategy by analyzing past changes in both short- and long-term exchanges rates, establishing monitoring mechanisms such as future projections and long-term equilibrium exchange rates. These hedges are established by using foreign currency deposits or arranging derivatives (Note 5.5 for more details).
The following tables show, by type of currency, the value of assets, liabilities, non-controlling interests and shareholders’ funds attributed to the parent company at December 2021, adjusted by the aforementioned currency forwards relating to each currency:
DEC. 2021 Currency
Assets Liabilities Parent company
shareholders’
Non-controlling
interests (Millions of euros) Euro 3,675 2,035 1,495 145 Pound sterling 1,832 1,884 -54 1 US dollar 13,267 10,383 1,442 1,443 Canadian dollar 3,506 2,806 700 0 Australian dollar 171 128 43 0 Polish zloty 1,551 1,206 144 202 Chilean peso 314 226 88 0 Colombian peso 119 36 83 0 Indian rupee 378 327 51 0 Other 81 25 56 0 TOTAL GROUP 24,896 19,057 4,048 1,791
Note 1.4 contains a breakdown of the changes in the year in the closing exchange rates. As a result of these changes, the impact of currency translation differences on equity at 31 December 2021 was EUR 106 million for the parent company. The breakdown by currency is detailed in Note 5.1.1.
Analyzing sensitivity to exchange rate effects, Ferrovial estimates that a 10% depreciation in the value of the euro at year-end against the main currencies in which the Group holds investments would have an impact on the parent company shareholders' funds of EUR 273 million, of which 29% would relate to the impact of the Canadian dollar, 59% to the US dollar and 2% to the Indian rupee.
Note 1.4 contains a detail of the changes in the year in the average exchange rates. In this regard, the impact of a 10% appreciation of the euro against other currencies on the income statement would have amounted to a change of EUR 94 million.
c. Exposure to credit and counterparty risk
The Group’s main financial assets exposed to credit or counterparty risk are as follows:
(1) Included in cash and cash equivalents
(*) Restated figures (Note 1.1.5)
• Ferrovial actively and continuously monitors the risk it has with the counterparties with which it has financial transactions and performs internal credit quality analyses for each of the financial institutions with which it has exposure.
• Its internal regulations for managing surpluses sets maximum investment limits for each counterparty, based on objective criteria: a minimum acceptable risk is required in order for surplus cash to be invested, and limits are also set on the amounts invested, depending on the risk given to each of these counterparties. In addition, the Risk Department monitors the performance of each of the different counterparties, proposing the appropriate protective or corrective measures on the basis of specific events.
• Territories: Ferrovial monitors the performance of the markets (territories) in which it has a presence, along with that of its target markets. The Financial Risk Department proposes the potential action to be taken in the event that some change in risk levels is expected in a particular territory or market.
2021 BORROWINGS Total gross
debt % debt hedged
Net exposed debt
Impact on profit/(loss) +
100 b.p. (Millions of euros) Ex-infrastructure project companies 3,211 92 % 267 3 Toll roads 7,264 99 % 99 1 Construction 96 100 % 0 0 Airports 304 100 % 0 0 Infrastructure projects 7,664 99 % 99 1 Total borrowings 10,875 97 % 377 4
2021 2020 (*) Var. 21/20 Investments in financial assets (1) 1,017 2,484 -1,467 Non-current financial assets 1,048 1,023 25 Net financial derivatives (assets) 309 547 -238 Trade and other receivables 1,317 1,367 -50
SECTION 5: CAPITAL STRUCTURE AND FINANCING
INTEGRATED ANNUAL REPORT 2021 CONSOLIDATED ANNUAL ACCOUNTS
260
• Customers: Ferrovial analyses and monitors its customers’ credit risk, using an internal methodology for the rating of Ferrovial customers that is standardized for the whole Group.
d. Exposure to liquidity risk
The Group has established the mechanisms necessary to preserve the level of liquidity that reflect the cash generation and need projections, in relation to both short-term collections and payments and obligations to be met at long term.
Ex-infrastructure project companies
At 31 December 2021, cash and cash equivalents amounted to EUR 5,319 million (2020: EUR 6,378 million). Also, at that date undrawn credit lines totaled EUR 782 million (2020: EUR 1,105 million) and forwards hedging cash denominated in currencies other than the euro in the amount of EUR -22 million (EUR 14 million in 2020).
Total liquidity therefore reached EUR 6,080 million (EUR 7,500 million in December 2020). Including discontinued operations, liquidity would total EUR 6,421 million (EUR 7,964 million in December 2020).
Infrastructure projects
At 31 December 2021, cash and cash equivalents (including short-term restricted cash) amounted to EUR 207 million (2020: EUR 148 million). Also, at that date undrawn credit lines amounted to EUR 115 million (2020: EUR 25 million), which were primarily arranged to cover committed investment needs.
Total liquidity (including long-term restricted cash) reached EUR 901 million (EUR 823 million in December 2020). Including discontinued operations, liquidity would total EUR 945 million (EUR 938 million in December 2020).
e. Exposure to variable income risk
Ferrovial is also exposed to the risk relating to the fluctuation of its share price. This exposure arises specifically in equity swaps used to hedge against risks of appreciation of share-based remuneration schemes, the detail of which is shown in Note 5.5 to these consolidated financial statements.
The market value of equity swaps, which are not considered accounting hedges, has an impact on the income statement. In this sense, an increase or decrease of 1 euro in the value of the Ferrovial share would have an impact of approximately EUR 10.9 million positive/negative on Ferrovial's net income.
f. Exposure to inflation risk
Much of the revenue from infrastructure projects is linked to tariffs that vary directly with inflation. This applies both to highway contract tariffs and HAH. Thus, a scenario of rising inflation such as the current one will have an impact on an increase in cash flow from this type of asset.
In construction contracts, the recent increase in inflation may have a negative impact on operating margins. This risk is partially mitigated in certain jurisdictions by the existence of inflation-adjustment clauses in the contracts, as is the case in Poland or in certain contracts in Spain. In the absence of such clauses, the risk is hedged by closing the main direct costs at the time of bidding. In certain cases, derivatives have also been contracted to hedge the impact of inflation, as was the case during the year in the United States. These derivatives have been considered speculative and, therefore, the variation in fair value has been recorded against the profit and loss account, with a positive impact of EUR 7 million, and they were also settled in the same year, which has generated a positive impact on cash of EUR 7 million.
In the case of the toll road concessionaire Autema, there is a derivative linked to Spanish inflation. At the end of 2020, 37% was discontinued as a result of the change in the financial model to intangible. The remainder (63%) is still considered as an accounting hedging instrument. A 100 b.p. increase in the entire inflation curve would have a negative impact on reserves of EUR -95 million and a EUR -56 million euro impact on results.
g. Capital management
The Group aims to achieve a debt-equity ratio that makes it possible to optimize costs while safeguarding its capacity to continue managing its recurring activities and the capacity to continue to grow through new projects in order to create shareholder value.
With regard to financial borrowings, Ferrovial Group's objective is to maintain a level of indebtedness, excluding infrastructure projects, in a way that will allow it to retain its “investment grade credit rating”. In order to achieve this target it has established a clear and consistent financial policy in which a relevant metric refers to the maintenance of an ex-projects net debt (gross debt less cash) to EBITDA ratio, plus dividends from projects, of no more than 2:1.
At 31 December 2021, the net cash position is positive (assets exceeded liabilities) and, therefore, the difference with respect to the maximum debt-equity ratio established is very significant. For the purpose of calculating this ratio, "net debt excluding infrastructure project companies" is defined in Note 5.2 and "gross operating profit/(loss) from operations plus dividends" is the profit from operations before impairment losses, disposals and depreciation and amortization of the Group Companies other than infrastructure concession operators, plus the dividends received from infrastructure project companies.
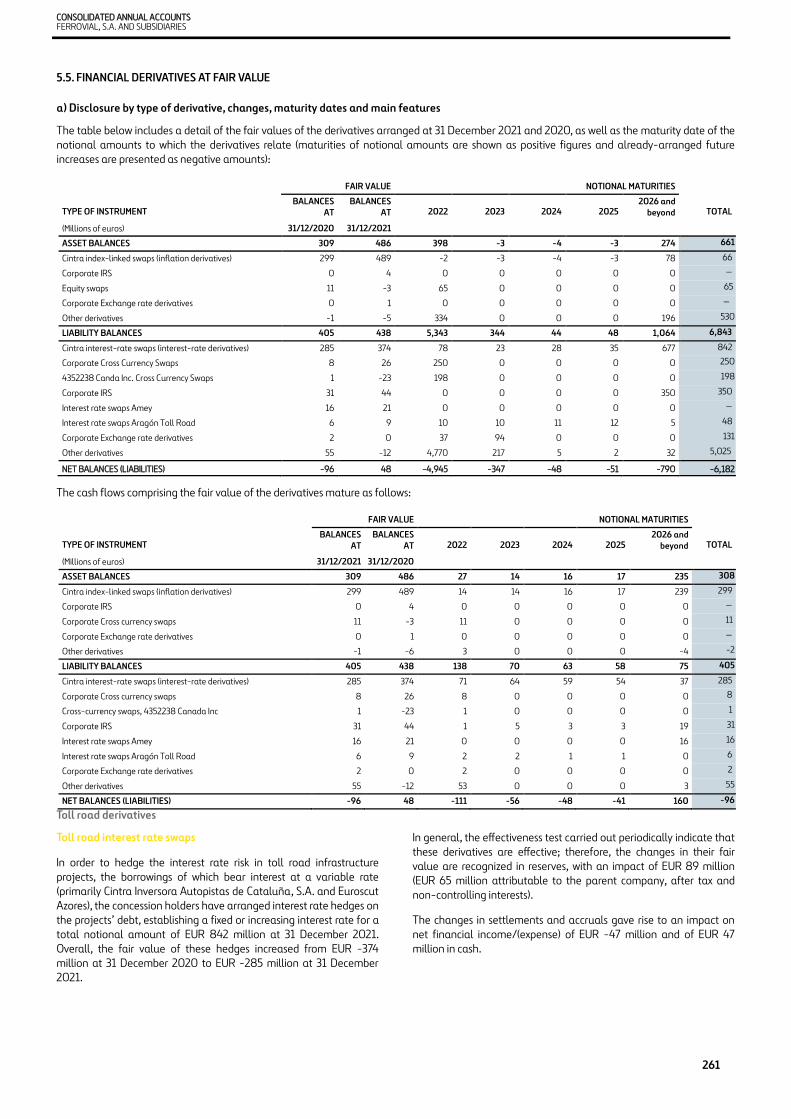
CONSOLIDATED ANNUAL ACCOUNTS FERROVIAL, S.A. AND SUBSIDIARIES
261
5.5. FINANCIAL DERIVATIVES AT FAIR VALUE
a) Disclosure by type of derivative, changes, maturity dates and main features
The table below includes a detail of the fair values of the derivatives arranged at 31 December 2021 and 2020, as well as the maturity date of the notional amounts to which the derivatives relate (maturities of notional amounts are shown as positive figures and already-arranged future increases are presented as negative amounts):
The cash flows comprising the fair value of the derivatives mature as follows:
Toll road derivatives
Toll road interest rate swaps
In order to hedge the interest rate risk in toll road infrastructure projects, the borrowings of which bear interest at a variable rate (primarily Cintra Inversora Autopistas de Cataluña, S.A. and Euroscut Azores), the concession holders have arranged interest rate hedges on the projects’ debt, establishing a fixed or increasing interest rate for a total notional amount of EUR 842 million at 31 December 2021. Overall, the fair value of these hedges increased from EUR -374 million at 31 December 2020 to EUR -285 million at 31 December 2021.
In general, the effectiveness test carried out periodically indicate that these derivatives are effective; therefore, the changes in their fair value are recognized in reserves, with an impact of EUR 89 million (EUR 65 million attributable to the parent company, after tax and non-controlling interests).
The changes in settlements and accruals gave rise to an impact on net financial income/(expense) of EUR -47 million and of EUR 47 million in cash.
FAIR VALUE NOTIONAL MATURITIES TYPE OF INSTRUMENT BALANCES
AT BALANCES
AT 2022 2023 2024 2025 2026 and beyond TOTAL
(Millions of euros) 31/12/2020 31/12/2021 ASSET BALANCES 309 486 398 -3 -4 -3 274 661 Cintra index-linked swaps (inflation derivatives) 299 489 -2 -3 -4 -3 78 66 Corporate IRS 0 4 0 0 0 0 0 — Equity swaps 11 -3 65 0 0 0 0 65 Corporate Exchange rate derivatives 0 1 0 0 0 0 0 — Other derivatives -1 -5 334 0 0 0 196 530 LIABILITY BALANCES 405 438 5,343 344 44 48 1,064 6,843 Cintra interest-rate swaps (interest-rate derivatives) 285 374 78 23 28 35 677 842 Corporate Cross Currency Swaps 8 26 250 0 0 0 0 250
4352238 Canda Inc. Cross Currency Swaps 1 -23 198 0 0 0 0 198
Corporate IRS 31 44 0 0 0 0 350 350 Interest rate swaps Amey 16 21 0 0 0 0 0 — Interest rate swaps Aragón Toll Road 6 9 10 10 11 12 5 48 Corporate Exchange rate derivatives 2 0 37 94 0 0 0 131
Other derivatives 55 -12 4,770 217 5 2 32 5,025
NET BALANCES (LIABILITIES) -96 48 -4,945 -347 -48 -51 -790 -6,182
FAIR VALUE NOTIONAL MATURITIES TYPE OF INSTRUMENT BALANCES
AT BALANCES
AT 2022 2023 2024 2025 2026 and beyond TOTAL
(Millions of euros) 31/12/2021 31/12/2020 ASSET BALANCES 309 486 27 14 16 17 235 308 Cintra index-linked swaps (inflation derivatives) 299 489 14 14 16 17 239 299 Corporate IRS 0 4 0 0 0 0 0 —
Corporate Cross currency swaps 11 -3 11 0 0 0 0 11 Corporate Exchange rate derivatives 0 1 0 0 0 0 0 — Other derivatives -1 -6 3 0 0 0 -4 -2 LIABILITY BALANCES 405 438 138 70 63 58 75 405 Cintra interest-rate swaps (interest-rate derivatives) 285 374 71 64 59 54 37 285 Corporate Cross currency swaps 8 26 8 0 0 0 0 8 Cross-currency swaps, 4352238 Canada Inc 1 -23 1 0 0 0 0 1 Corporate IRS 31 44 1 5 3 3 19 31
Interest rate swaps Amey 16 21 0 0 0 0 16 16
Interest rate swaps Aragón Toll Road 6 9 2 2 1 1 0 6 Corporate Exchange rate derivatives 2 0 2 0 0 0 0 2 Other derivatives 55 -12 53 0 0 0 3 55 NET BALANCES (LIABILITIES) -96 48 -111 -56 -48 -41 160 -96
SECTION 5: CAPITAL STRUCTURE AND FINANCING
INTEGRATED ANNUAL REPORT 2021 CONSOLIDATED ANNUAL ACCOUNTS
262
Index linked swaps, Toll roads
This item relates exclusively to Autema, which in 2008 arranged an index linked swap to hedge income variability, by means of which an annual CPI of 2.50% was fixed. The hedged underlying is the toll flows and the price compensation flows received from the Generalitat de Catalunya, which are adjusted for inflation. The decrease in the underlying generated by the change in the concession regime has led to the partial discontinuation of hedging, such that 63% of the derivative is currently considered as hedging and the remaining percentage is considered speculative. The increase in inflation in 2021 had an impact on reserves during the year of EUR -107 million and an impact on results of EUR -84 million.
Toll road cross-currency swaps
In 2019, the company 4352238 Canada Inc arranged cross-currency swaps to hedge a financial investment in Canadian dollars. These instruments have a notional value of EUR 198 million (CAD 225 million), expire in 2022 and have a fair value of EUR 1 million.
Corporate business derivatives
Interest rate swaps, Corporate business
In relation to the bond issues launched in 2014, the Group arranged interest rate derivatives for a notional amount of EUR 350 million expiring in 2030. Since these derivatives, with a fair value of EUR -31 million, convert a portion of the fixed interest rate on the bonds into a floating interest rate, these derivatives constitute a partial fair value economic hedge of the aforementioned bond issues and they all qualify for hedge accounting.
This means that the fair value changes in both the derivative and the hedged item (in this case, a part of the bond) are carried at fair value through reserves. The fair value impact of these bonds amounted to EUR 13 million (2020: EUR 4 million).
Cross currency swaps, Corporate business
At 31 December 2021, the Group recorded cross-currency swaps to hedge a drawdown on the US dollar corporate liquidity line (Note 5.2.2). These instruments have a notional value of USD 274 million (with an agreed counter value of EUR 250 million), maturities in 2022 and a fair value of EUR -8 million.
Equity swaps
The Company has arranged equity swaps hedging the potential financial impact of the exercise of share-based remuneration schemes granted to employees.
These equity swap contracts are described below:
• The calculation base comprises a given number of Ferrovial shares and a reference price, which is usually the market share price on the execution date.
• During the swap term, Ferrovial pays interest at a given interest rate (EURIBOR plus a spread to be applied to the result of multiplying the number of shares by the strike price) and receives compensation equal to the dividends on those shares.
•
•
•
• When the swap expires, if the share price has risen, Ferrovial will receive the difference between the market share price and the reference price. If the share price has fallen, Ferrovial will pay the difference to the bank.
At the 2021 year-end, these derivatives had a notional value equivalent to 2.7 thousand shares which, based on the strike price of the equity swaps (price at which they must be settled with the banks), represented a total notional amount of EUR 65 million.
Exchange rate derivatives, Corporate
These derivatives relate to Corporate hedges of foreign currency risk, the main aim of which is to protect against the volatility of future cash flows in foreign currencies (primarily the pound sterling, the US dollar, and the Canadian dollar). Their notional value amounted to EUR 131 million at 31 December 2021, of which EUR 77 million relate to pound sterling, EUR 49 million to the US dollar, EUR 5 million to the Canadian dollar. They expire in the short-term.
The changes in their value are recognized as translation differences and amounted to EUR -10 million in 2021 (for effective derivatives). Options, which are not classified as accounting hedges, are recognized in financial results at fair value and in 2021 represented an expense of EUR 6 million.
Other derivatives
This item includes the other derivatives contracted by the Group for a fair value of EUR -54 million, of which EUR -44 million relates to foreign exchange derivatives in the toll roads business, of which EUR -23 million hedge volatility in future Canadian dollar flows, with a notional amount of EUR 2,698 million (CAD 3,752 million) (see note 1.3). The remaining EUR -10 million essentially relates to interest rate swaps, hedging certain project borrowings in the Construction and Airports Divisions.
This heading also includes the inflation-linked derivatives for the Construction Division in the United States. These derivatives were classed as speculative and therefore the fair value change was taken to the income statement in the amount of EUR 7 million.

CONSOLIDATED ANNUAL ACCOUNTS FERROVIAL, S.A. AND SUBSIDIARIES
263
B) MAIN IMPACTS ON PROFIT & LOSS AND EQUITY
The movements for accounting purposes in the main derivatives arranged by fully consolidated companies, detailing the fair values thereof at 31 December 2021 and 2020, and the impact on reserves, profit/(loss) and other balance sheet items are as follows:
Derivatives are recognized at market value at the arrangement date and at fair value at subsequent dates. Changes in the value of these derivatives are recognized for accounting purposes as follows:
• The changes in the year in the fair value of the derivatives that qualify for cash flow hedge accounting are recognized with a balancing entry in reserves (column I).
• The changes in fair value of the derivatives that do not qualify for hedge accounting or that are considered to be held for speculative purposes are recognized as a fair value adjustment in the Group income statement (column II) and are reflected separately in the income statement.
• “Impact on net financial income/(expense)” (column III) reflects the impacts on net financial income/(expense) from financing arising from the interest flows accrued during the year.
• “Impact on cash” (column IV) indicates net payments and collections during the year.
• The impact of the difference between closing currency translation differences at December 2021 and 2020 is also presented separately (column V).
• The “other impacts” column shows the impacts on operating profit/(loss), net financial income/(expense) (exchange rate) or other impacts not considered in the other columns (column VI).
C) DERIVATIVE VALUATION METHODS
All the Group’s financial derivatives and other financial instruments carried at fair value are included in LEVEL 2 of the fair value measurement band, since although they are not quoted on regulated markets, the inputs on which their fair values are based are observable, either directly or indirectly.
The fair value measurements are performed by the Company using an internally developed measurement tool based on market best practices. However, they are in any event compared with the measurements received from the counterparty banks on a monthly basis.
Equity swaps are measured as the difference between the market price of the share on the calculation date and the unit settlement (strike) price agreed at inception, multiplied by the number of shares under the contract.
The other instruments are measured by quantifying the net future cash inflows and outflows, discounted to present value, with the following specific features:
• Interest rate swaps: the future cash flows with floating reference rates are estimated by using current market projections at the measurement date for each currency and settlement frequency; and each cash flow is discounted using the market zero-coupon rate that is appropriate for the settlement period and currency in question at the measurement date.
• Index-linked swaps: the future cash flows are estimated by projecting the implicit future behavior in the market curves on the valuation date for each currency and settlement frequency, for both reference interest rates and reference inflation rates. As in the cases described above, the flows are discounted using the discount rates obtained at the measurement date for each flow settlement period and currency.
• Cross-currency swaps: the future cash flows with floating reference rates are estimated by using current market projections at the measurement date for each currency and settlement frequency; and each cash flow is discounted using the market zero-coupon rate that is appropriate for the settlement period and currency in question at the measurement date, including the cross-currency basis spreads. The present value of the flows in a currency other than the measurement currency is translated at the spot exchange rate prevailing at the measurement date.
• Foreign currency derivatives: as a general rule, the future cash flows are estimated by using the exchange rates and market curves associated with each currency pair (forward points curve), and each flow is updated using the market zero-coupon rate that is appropriate for the settlement period and currency in question at the valuation date. For other more complex instruments (options, etc.), appropriate valuation methods are used for each instrument, taking into consideration the necessary market data (volatilities, etc.).
FAIR VALUE IMPACTS
TYPE OF INSTRUMENT (Millions of euros)
Balance at 31/12/2021
Balance at 31/12/2020 Var.
IMPACT ON RESERVES (I)
FAIR VALUE IMPACT ON
PROFIT/(LOSS) (II)
IMPACT ON NET FINANC. INCOME/(EX
PENSE) (III) CASH (IV) EXCHANGE
RATE (V)
OTHER IMPACTS ON
BALANCE SHEET OR
INCOME (VI)
TOTAL Index-linked derivatives 299 489 -190 -107 -77 6 -22 0 10 -190 Cash flow hedges 299 489 -190 -107 -77 6 -22 0 10 -190 Interest rate derivatives -343 -455 113 126 1 -63 50 -1 -1 113 Cash flow hedges -343 -460 117 118 1 -55 54 -1 -1 117 Fair value hedges 0 4 -4 8 0 -8 -4 0 0 -4 Cross-currency swaps -9 -2 -6 0 0 -24 -2 1 18 -6 Cash flow hedges -8 -26 18 0 0 2 -2 0 18 18 Fair value hedges -1 23 -24 0 0 -26 0 1 0 -24 Foreign exchange derivatives -54 19 -73 1 -28 0 194 -233 -7 -73 Fair value hedges -35 10 -45 1 -13 0 150 -182 0 -45 Net foreign investment hedges -19 8 -27 0 -9 0 39 -51 -7 -27 Speculative 0 1 -1 0 -6 0 5 0 0 -1 Equity swaps 11 -3 14 0 14 1 -1 0 0 14 Speculative 11 -3 14 0 14 1 -1 0 0 14 TOTAL -95 48 -143 19 -90 -80 219 -232 20 -143
SECTION 5: CAPITAL STRUCTURE AND FINANCING
INTEGRATED ANNUAL REPORT 2021 CONSOLIDATED ANNUAL ACCOUNTS
264
Lastly, credit risk, which pursuant to IFRS 9 was included in derivative measurements, is estimated as follows:
• In order to calculate the adjustments associated with own and counterparty credit risk (CVAs/DVAs), Ferrovial applies a methodology based on calculating the future exposure of the various financial products using Monte Carlo simulations. To this potential exposure, a probability of default and a loss given default based on the parties’ business and credit quality are applied, as well as a discount factor based on the currency and applicable maturity at the valuation date.
• In order to calculate the probabilities of default of the Ferrovial Group companies, the credit risk management department assesses the rating of the counterparty (company, project, etc.) using a proprietary, rating agency-based methodology. This rating is used to obtain market spread curves according to the currency and term in question (generic curves by rating level).
• In order to calculate the probabilities of default of the balancing entries, the CDS curves of those companies are used, if available. Otherwise, the CDS curves of a similar entity (proxy) or a generic spread curve (by rating level) are used.
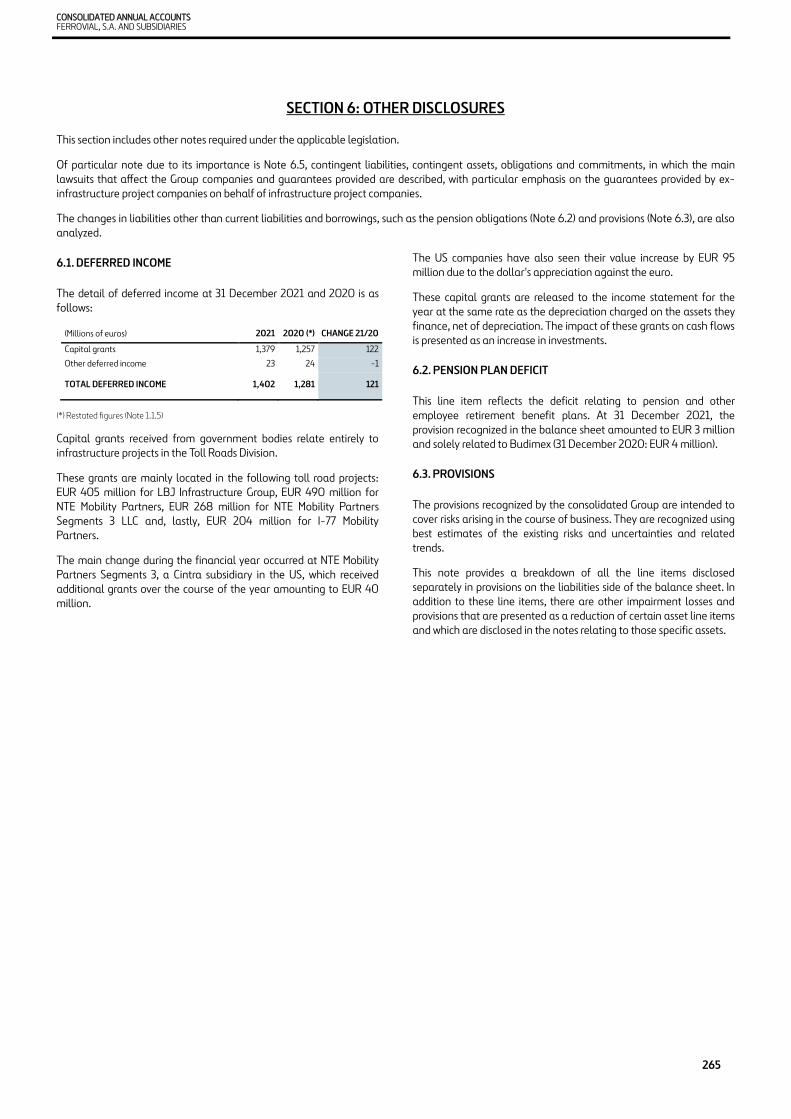
CONSOLIDATED ANNUAL ACCOUNTS FERROVIAL, S.A. AND SUBSIDIARIES
265
SECTION 6: OTHER DISCLOSURES
This section includes other notes required under the applicable legislation.
Of particular note due to its importance is Note 6.5, contingent liabilities, contingent assets, obligations and commitments, in which the main lawsuits that affect the Group companies and guarantees provided are described, with particular emphasis on the guarantees provided by ex-infrastructure project companies on behalf of infrastructure project companies.
The changes in liabilities other than current liabilities and borrowings, such as the pension obligations (Note 6.2) and provisions (Note 6.3), are also analyzed.
6.1. DEFERRED INCOME
The detail of deferred income at 31 December 2021 and 2020 is as follows:
(*) Restated figures (Note 1.1.5)
Capital grants received from government bodies relate entirely to infrastructure projects in the Toll Roads Division.
These grants are mainly located in the following toll road projects: EUR 405 million for LBJ Infrastructure Group, EUR 490 million for NTE Mobility Partners, EUR 268 million for NTE Mobility Partners Segments 3 LLC and, lastly, EUR 204 million for I-77 Mobility Partners.
The main change during the financial year occurred at NTE Mobility Partners Segments 3, a Cintra subsidiary in the US, which received additional grants over the course of the year amounting to EUR 40 million.
The US companies have also seen their value increase by EUR 95 million due to the dollar's appreciation against the euro.
These capital grants are released to the income statement for the year at the same rate as the depreciation charged on the assets they finance, net of depreciation. The impact of these grants on cash flows is presented as an increase in investments.
6.2. PENSION PLAN DEFICIT
This line item reflects the deficit relating to pension and other employee retirement benefit plans. At 31 December 2021, the provision recognized in the balance sheet amounted to EUR 3 million and solely related to Budimex (31 December 2020: EUR 4 million).
6.3. PROVISIONS
The provisions recognized by the consolidated Group are intended to cover risks arising in the course of business. They are recognized using best estimates of the existing risks and uncertainties and related trends.
This note provides a breakdown of all the line items disclosed separately in provisions on the liabilities side of the balance sheet. In addition to these line items, there are other impairment losses and provisions that are presented as a reduction of certain asset line items and which are disclosed in the notes relating to those specific assets.
(Millions of euros) 2021 2020 (*) CHANGE 21/20 Capital grants 1,379 1,257 122 Other deferred income 23 24 -1 TOTAL DEFERRED INCOME 1,402 1,281 121

SECTION 6: OTHER DISCLOSURES
INTEGRATED ANNUAL REPORT 2021 CONSOLIDATED ANNUAL ACCOUNTS
266
The movements in the long-term and short-term provisions presented separately in liabilities in the consolidated balance sheet were as follows:
(*) Restated figures (Note 1.1.5)
The table above shows the changes in the year by detailing, on the one hand, the consolidation scope changes and transfers, the charges for the year and reversals that had an impact on the various lines in the income statement and, on the other, other changes which did not have an impact thereon, such as amounts used recognized under various headings in the balance sheet and the exchange rate effect.
Litigation provisions
At 31 December 2021, the total litigation provisions for the group amounted to EUR 276 million. This item includes the following items:
• Provisions to cover the possible risks resulting from lawsuits and litigation in progress, amounting to EUR 67 million (December 2020: EUR 104 million), largely relate to the Construction business. This provision is recognized and reversed against changes to provisions in EBITDA.
• Provisions for tax claims, amounting to EUR 209 million (31 December 2020: EUR 185 million), arising in relation to local or central government duties, income taxes and other taxes, as a result of the varying interpretations that can be made of the tax legislation in the various countries in which the Group operates (Note 6.5.1.e). These provisions are recognized and reversed against EBITDA, against net financial income/(expense) and/or against corporate income tax, depending on the nature of the tax for which the provision has been recognized (penalties, related interest, and/or contested tax assessments). During the year, EUR 41 million of the existing provision for the lawsuit related to the tax deductibility of international goodwill has been reversed (see note 6.5.1). The impact of the Services business is recognized in the net profit/(loss) from discontinued operations (see Notes 1.1.3 y 2.9).
Provision for replacements pursuant to IFRIC 12
This line item includes the provisions for investments in replacements established by IFRIC 12 (see Note 1.3.3.2), the total amount of which amounted to EUR 88 million. This provision is recognized and reversed with a charge/credit, respectively, to the depreciation and amortization charge over the period in which the obligations accrue, until the replacement becomes operational. The impact of this depreciation and amortization amounts to EUR 28 million.
Provisions for other long-term risks
This heading includes the provisions recognized to cover certain long-term risks other than those attributable to litigation or tax claims, such as third-party liability resulting from the performance of contracts, guarantees provided with enforcement risk and other similar items, which amounted to EUR 57 million at 31 December 2021 (31 December 2020: EUR 93 million).
The heading additionally contains the estimated cost of landfill closure and post-closure activities relating to the landfills operated in the Services business in Poland. The provision is calculated based on a technical estimate of the consumption to date of the total capacity of the respective landfills. This provision is reversed with a charge/credit, respectively, to changes in provisions within EBITDA, as the costs required for closure of the landfill are incurred. The balance of EUR 13 million for this heading at 31 December relates to the services business in Poland.
Finally, this total includes provision for the compulsory purchases for the Azores toll road.
Short-term provisions
At 31 December 2021, the short-term provisions balance amounted to EUR 1,002 million (31 December 2020: EUR 952 million).
(Millions of euros) LITIGATION AND TAXES
REPLACEMENT AND UPGRADES
IFRIC 12 OTHER LONG-
TERM RISKS TOTAL NON-
CURRENT PROVISIONS
SHORT-TERM PROVISIONS TOTAL
Balance at 31 December 2020 (*) 291 58 93 442 952 1,394 Consolidation scope changes and transfers 35 -2 -42 -9 13 4 Allocations 32 32 10 74 433 507 EBITDA 19 0 10 29 433 462 Net financial income/(expense) 4 3 0 7 0 7 Impairments and disposals 0 0 0 0 0 0 Corporate income tax 9 0 0 9 0 9 Fixed asset depreciation 0 28 0 28 1 29 Reversals: -56 0 -3 -60 -280 -339 EBITDA -13 0 -3 -16 -201 -217 Net financial income/(expense) 0 0 0 0 0 0 Impairments and disposals 0 0 0 0 0 0 Corporate income tax -44 0 0 -44 -78 -122 Fixed asset depreciation 0 0 0 0 -1 -1 Applications with balancing items in working capital accounts -28 0 0 -28 -134 -162
Applications with balancing items in other assets 0 -5 0 -5 0 -5 Foreign exchange differences 1 5 1 7 17 23 Balance at 31 December 2021 276 88 57 421 1,002 1,423
CONSOLIDATED ANNUAL ACCOUNTS FERROVIAL, S.A. AND SUBSIDIARIES
267
This entry primarily covers provisions relating to customer contracts, such as provisions for deferred expenses (relating to the completion of works and the removal of site equipment, pursuant to the contract) and provisions for budgeted losses. In this regard, these types of provisions are mainly focused on the Construction Division for EUR 855 million (2020: EUR 733 million).
This provision is recognized and reversed against changes to provisions in EBITDA.
The change in the year was mainly due to net provisions in the Construction Division EUR 221 million, mainly in the polish business, and the application of provisions (EUR -161 million), notably the application of budgeted losses in the US business. Also noteworthy was the reversal of the provision for corporate income tax assessments for 2003-2005, due to the non-deductibility of the portfolio of 407 Toronto Highway BV (see note 6.5.1.e).
Reconciliation with information reported in the cash flow statement
Analyzing the total effect on the income statement, of note is the net provision (expense) of EUR 245 million, which impacts gross operating profit, mainly corresponding to the Construction division (EUR 427 million of provision and EUR -206 million of reversal), mainly in the Polish activity.
In addition, provisions of EUR -162 million were recognized in working capital accounts during the year, mainly in the Construction division (EUR -161 million). The sum of provisions/reversal (EUR 245 million) and application (EUR -162 million) and other similar effects such as provisions for doubtful debts, which are not included in the detail of provisions for liabilities (EUR 2 million), are explained for working capital purposes in the cash flow, totaling EUR 85 million (see Note 5.3).
6.4. OTHER LONG-TERM PAYABLES
This heading includes:
• Participating loans granted by Spain’s Central Government to various infrastructure project concession operators for an amount of EUR 49 million at 31 December 2021 (31 December 2020: EUR 47 million) in the Toll Roads Division for the Aragón toll road.
• Long-term loans with associates of the Toll Roads Division, amounted to EUR 22 million (31 December 2020: EUR 11 million).
6.5. CONTINGENT LIABILITIES, CONTINGENT ASSETS, OBLIGATIONS AND COMMITMENTS
6.5.1. Litigation and other contingent liabilities
The Group is exposed to risks derived from the resolution of lawsuits or litigation of different kinds arising in the course of business. When such risks are deemed to be probable, accounting provisions must be recorded for the lawsuits and litigation using the best estimate of the disbursements that are expected to be necessary to settle the obligation. These provisions are set out in Note 6.3. When such risks are less likely to materialize, contingent liabilities are recognized and must be disclosed in the financial statements in accordance with accounting legislation. It is not expected that any significant liabilities will arise that might represent a material adverse effect, other than those for which provisions have already been recognized
The detail of the most significant litigation, in terms of amount, in the Group's various business divisions is as follows:
s) SH-130 legal proceedings: Toll roads and construction
As indicated in the Group’s six-monthly accounts, the two claims filed by the current shareholders of the project Concession Company (a lawsuit before the courts of Texas against companies owned by Ferrovial, Cintra and Ferrovial Construcción; and an arbitration proceeding before the International Chamber of Commerce against companies owned by Ferrovial Construcción) had been suspended, since the claimant and defendants had reached an initial agreement.
This initial arrangement led to the signing of an agreement on the 3rd September, putting an end to the two lawsuits. Ferrovial’s contribution had been fully provisioned (USD 25 million in 2020 and an additional USD 17.4 million in 2021).
b) Other litigation relating to the toll road business
Terrassa Manresa toll road (Autema):
As indicated in the half-yearly accounts, on 19 October 2020 Autema was notified that the cassation appeal had not been given leave to proceed at the Supreme Court. As a result of this Supreme Court decision, the judgement issued by the High Court of Justice of Catalonia became final and fully applicable.
Following the non-admission of the cassation appeal, Autema changed the concession’s accounting approach from the financial asset model to the intangible asset model.
Autema lodged an appeal for annulment against the non-admission of the cassation appeal, which was rejected as well. Then, Autema lodged an appeal for legal protection at the Constitutional Court, which was also not admitted on 15 June 2021.
Court proceedings instigated by the financial institutions of the radial 4 project:
In June 2013 a group of financial institutions from the banking syndicate that was financing the project filed court proceedings with Madrid Court of First Instance No. 61 against the shareholders of the concession company that had guaranteed the contribution of contingent capital in certain circumstances, namely Cintra Infrastructures, SE – and Sacyr Concesiones, S.L.
In that lawsuit, they sought the enforcement of a guarantee that had been put in place by the shareholders, on the grounds of an alleged breach of certain ratios. This corporate guarantee amounts to a total of EUR 23 million, of which Cintra’s share amounts to EUR 14.95 million.
The appeal lodged by the banking syndicate was upheld by the Provincial Court of Madrid after going into the details of the merits of the case. The defendant shareholders lodged a cassation appeal before the Supreme Court which was pending to be admitted on December 2020. There were no changes to the status of this litigation in 2021.
At year-end 2021 both the EUR 14.95 million of the guarantees given and the EUR 4.85 million in default interest accruing since the proceeding began are fully provisioned.
M-203 toll road
Legal proceedings initiated by the concession company M203 seeking compensation for the investments made (NIV) and for damages suffered due to the termination of the concession agreement due to the breach of contract by the Madrid Regional Government (CAM).
In October 2020, M203 was notified that the High Court of Justice of Madrid (TSJM) had ruled in favor of M203, ordering that the CAM shall issue the relevant NIV liquidation immediately.

SECTION 6: OTHER DISCLOSURES
INTEGRATED ANNUAL REPORT 2021 CONSOLIDATED ANNUAL ACCOUNTS
268
At 31 December 2020, the final judgement issued by the TSJM was pending enforcement.
On 3 February 2021, M203 submitted a request to the TSJM for the enforcement of the judgement without delay.
As the CAM was still not complying with the judgement, on 2 June 2021 and then on 6 July 2021, M203 filed petitions to expedite proceedings so that the CAM fulfils the terms of the October 2020 judgement.
In 2021, M203 submitted several documents petitioning the court to take steps to sanction the CAM in order to enforce the 2020 judgement ordering the CAM to calculate and make payment of the NIV.
Finally, on 23 December 2021, the CAM notified M203 of a NIV calculation order (“NIV”) stating the amounts that it agreed to pay, totaling EUR 73,388,672.44, of which EUR 68,062,634.52 relates to the principal (tax base of EUR 56,250,111.17; recognizing VAT payable of EUR 11,812,523.35) and EUR 5,326,037.92 relates to late-payment interest to 31 December 2021. On the same date, 23 December 2021, M203 cancelled the invoices issued in May 2018 (recognized as receivables) in the amount initially claimed when the CAM took possession of the works. New invoices were issued to the CAM (one for the principal plus VAT and the other for the late-payment interest recognized by the CAM). Finally, on 29 December 2021, M203 received full payment of the NIV from the CAM in the amount of EUR 73,388,672.44. M203 recognized a loss of EUR 3.8 million in the amount of the difference between the principal received (EUR 56.2 million) and the receivable recognized (EUR 60 million), which had already been provisioned.
The NIV Order can be appealed to the TSJM, so M203 will instigate a new contentious-administrative appeal to claim the difference between the amounts not recognized by the CAM in the sum paid on 29 December 2021 and those considered by M203 (initially valued at approximately EUR 4 million in principal and EUR 1 million in interest).
c) Litigation relating to the Construction business
The Construction Division is involved in a number of ongoing legal actions, relating principally to potential construction defects in the completed building work and claims for civil liability.
The main lawsuit relates to the penalty proceeding initiated by the Spanish National Market and Competition Commission (CNMC), as described below.
Construction business Spain:
In 2019, the Spanish National Markets and Competition Commission (CNMC) initiated penalty proceedings against Ferrovial Construcción, S.A. and other construction firms for alleged anti-competitive behavior.
As outlined by the CD, this behavior ostensibly consists of the exchange of certain information between companies for the purposes and/or with the effect of restricting competition during the course of the competitive tendering processes organized by Public Authorities in Spain for the construction and refurbishment of infrastructure and buildings.
In March 2020, the Competition Directorate (CD) gave notice of a proposed penalty of EUR 48 million and, in July 2020, the CNMC's Competition Court declared the proceedings to have expired and ordered the raising of new proceedings relating to the same events. Ferrovial Construcción appealed the decision at the National High Court. In January 2022, the National High Court gave the appeal leave to proceed and it is currently being processed.
In parallel to the previous appeal, in April 2021, a new list of charges drawn up by the Competition Directorate was received containing the investigation findings and a description of the facts that could constitute an infringement of competition law. In May 2021, a writ of defense allegations was presented stating that the infringements claimed by the Directorate had not taken place. In June, notification of the proposed penalty of EUR 48 million was received, for which does not end the penalty proceeding, the CNMC’s board having competence to take the final decision. This proceeding had not been resolved at year-end 2021.
The Group considers that the outcome of this lawsuit is unlikely to be unfavorable and therefore no amount has been provisioned in this respect.
d) Litigation and other contingent liabilities relating to the Services business (discontinued operations)
Services business in the UK
WBHO lawsuit
On 22 December 2020, WBHO, a subcontractor to Amey Consulting Australia Pty Limited filed a lawsuit against the company in the New South Wales Supreme Court. The lawsuit seeks the payment of approximately AUD 54 million for the following items: i) ordinary damages; ii) damages relating to alleged misleading or improper conduct under the terms of Australian Consumer Law during the tendering phase; iii) compensation for alleged breaches of contract and additional expenses incurred by WBHO originating from two other subcontractors; iv) interest; and v) costs.
The basis for the legal action is that Amey failed to meet the milestones for finalization of the design, so the project took longer and WBHO incurred additional construction costs that had not been considered on the date of the contract.
There are no details of the claim and, in fact, Amey has submitted several requests to the court for additional details and the court has ordered WBHO to further specify its claim on three occasions. The revised claim is expected by 1 April 2022. The company’s insurers have been notified of the claim. Amey set aside a provision of AUD 2 million exclusively to settle any amounts that might not be covered by the insurance companies (policy excess).
Services business in Spain:
Litigation relating to the penalty proceedings opened by the Spanish National Markets and Competition Commission (CNMC) in relation to the road maintenance sector:
In July 2019, the CNMC initiated penalty proceedings against Ferroser Infraestructuras, S.A. and its Parent Ferrovial, S.A., as well as against other companies in the sector, due to alleged anti-trust practices during tendering for providing maintenance and operations services for the State Road Network, arranged by the Ministry of Public Works.
Following a procedural process, on 31 December 2020, the CNMC gave notice of its List of Established Facts, in which Ferrovial Servicios S.A.U. was also included. The corresponding allegations were submitted in February 2021.

CONSOLIDATED ANNUAL ACCOUNTS FERROVIAL, S.A. AND SUBSIDIARIES
269
In August 2021, notice was received of a Resolution by the CNMC’s Board declaring a very serious infringement of Article 1 of the Spanish Competition Law (LDC) and Article 101 of the Treaty on the Functioning of the European Union (TFUE), although Ferrovial, S.A. is not held liable. It merely refers to FERROSER INFRAESTRUCTURAS, S.A. and, jointly and severally, its parent company FERROVIAL SERVICIOS, S.A. as the liable parties. As regards Ferrovial Servicios, the Board concludes that its involvement as a perpetrator has not been proven, but only as a party jointly and severally liable for Ferroser’s conduct. The Board has imposed a fine of EUR 5.7 million on Ferroser. As regards the executives that took part in the conduct, the Board has requested that the Competition Directorate investigate their possible liability in a subsequent proceeding. Finally, the resolution declares that a prohibition on contracting may be imposed on the perpetrators but does not stipulate the duration or scope. These matters will be determined in a different proceeding before the Consultative Board on Administrative Procurement.
The Resolution was appealed in a contentious-administrative proceeding at the National High Court requesting precautionary measures consisting of the stay of enforcement of the appealed Resolution (suspension of payment of the penalty and of the prohibition on contracting with the government).
In December 2021, notification was received of the admission of the appeal and request for the CNMC to submit the administrative case file and summon the interested parties to appear as co-defendants. A separate decision is to be made regarding the petition for precautionary measures. On February 22, 2022 a notification has been received communicating the suspension of the sanctioning resolution, both in relation to the fine and the prohibition to enter into contract. The order conditions the suspension of the payment of the fine to the deposit of a guarantee within the usual period of two months.
Ferroser Infraestructuras, S.A. is one of the companies sold as a result of the divestment of the infrastructure maintenance business in Spain completed on 31 January 2022 (see Note 1.1.3). Ferrovial’s sale and purchase agreement grants a guarantee to the buyer relating to this lawsuit, the amount of which has been included in the fair value estimate for the assets sold.
Empresa de Mantenimiento y Explotación M-30, S.A. (EMESA).
The Group, through the company Empresa de Mantenimiento y Explotación M-30, S.A. (EMESA), in which it holds a 50% stake, operates the M-30 infrastructure maintenance contract and holds a 20% interest in the public-private financial holding company Madrid Calle 30 (MC30), which is the holder of the concession agreement for this infrastructure.
During 2017, Madrid City Council, which also holds a stake in MC30, formed a municipal Investigation Commission that (i) recommended the reversal of the MC30 management model to 100% municipal ownership and (ii) asked the City Council to determine liability for power supply payments made by MC30 until then.
In 2018, EMESA filed an appeal against the City Council’s decision to approve the Report by the Investigation Commission. The appeal was disallowed on the grounds of the absence of legal standing of the appellant (EMESA), although it was stated that the Investigation Committee's rulings are mere recommendations and are not binding on EMESA, which may only be affected by any final resolutions that may be issued by the City Council.
As regards liability for power supply payments, in 2020 MC30 claimed payment of this cost by EMESA. EMESA objected to paying. MC30 sent another letter to EMESA to the effect that (i) it considered the limitation period for the claim to have been interrupted; (ii) it conditions the instigation of legal actions by MC30 on the final decisions that may be taken by Madrid City Council. EMESA decided not to set aside any provision for this matter, as the Company’s legal advisors believe that the arguments are robust and consider that, for now, no amounts are likely to be payable.
e) Tax-related litigation
As indicated in Note 6.3, Ferrovial recognizes tax provisions totaling EUR 209 million (of which EUR 2 million is recognized by the companies of the former Services Division now classified as discontinued operations). These provisions relate essentially to ongoing tax litigation arising from tax assessments raised following tax inspections in Spain for a disputed sum of EUR 333 million, the most significant being corporate income tax and VAT for the periods 2002 to 2017.
The most noteworthy lawsuits are as follows:
a) The proceedings relating to the amortization for tax purposes of financial goodwill on the acquisitions of Amey and Swissport. Ferrovial has filed an appeal against the European Commission’s 2014 Decision (“Third Decision”) in which this tax measure is declared to be state aid. Although we feel there are sound grounds supporting the Group's procedural stance, if a favorable court judgement is not issued the amount of EUR 84.5 million will be payable to the Spanish Treasury, of which EUR 36.8 million was already settled in 2017 and EUR 3.8 million was paid in 2021. In this unfavorable scenario, there would be a negative impact of EUR 84.5 million on Ferrovial’s income statement.
b) The cassation appeal filed at the Supreme Court against the settlement resolution arising from the tax assessment raised on Ferrovial, S.A. for 2006 corporate income tax. The main matter in dispute is the application of the deduction for export activities relating to the 2006 investment made to acquire the ownership interest in the former BAA (Heathrow). This contingency amounts to EUR 116 million (fully provisioned).
c) As regards Ferrovial’s lawsuit relating to corporate income tax for the financial years 2003 to 2005, in which the main point of law concerns the different interpretation given to the recognition of the provision for the portfolio of shares in Toronto Highway BV, an application for legal protection was filed at the Constitutional Court against the Supreme Court’s judgement dismissing the case. This contingency of EUR 77.3 million (fully provisioned) was settled in 2021 (see Note 6.3).
6.5.2. Guarantees
a) Bank guarantees and other guarantees issued by insurance companies
In carrying on its activities the Group is subject to possible contingent liabilities – uncertain by nature – relating to the liability arising from the performance of the various contracts that constitute the activity of its business divisions.
In order to cover the aforementioned liability, the Group has bank guarantees and other guarantees issued by insurance companies. At 31 December 2021, the balance amounted to EUR 7,099 million (EUR 6,728 million at 31 December 2020).
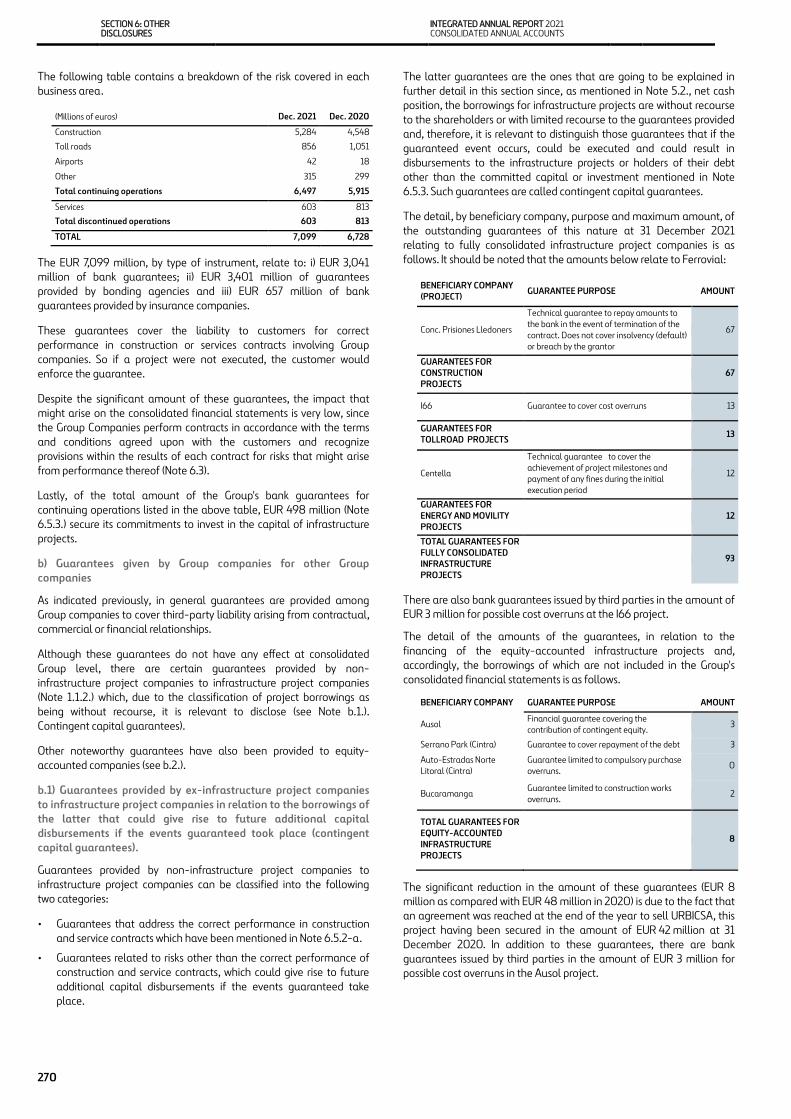
SECTION 6: OTHER DISCLOSURES
INTEGRATED ANNUAL REPORT 2021 CONSOLIDATED ANNUAL ACCOUNTS
270
The following table contains a breakdown of the risk covered in each business area.
The EUR 7,099 million, by type of instrument, relate to: i) EUR 3,041 million of bank guarantees; ii) EUR 3,401 million of guarantees provided by bonding agencies and iii) EUR 657 million of bank guarantees provided by insurance companies.
These guarantees cover the liability to customers for correct performance in construction or services contracts involving Group companies. So if a project were not executed, the customer would enforce the guarantee.
Despite the significant amount of these guarantees, the impact that might arise on the consolidated financial statements is very low, since the Group Companies perform contracts in accordance with the terms and conditions agreed upon with the customers and recognize provisions within the results of each contract for risks that might arise from performance thereof (Note 6.3).
Lastly, of the total amount of the Group's bank guarantees for continuing operations listed in the above table, EUR 498 million (Note 6.5.3.) secure its commitments to invest in the capital of infrastructure projects.
b) Guarantees given by Group companies for other Group companies
As indicated previously, in general guarantees are provided among Group companies to cover third-party liability arising from contractual, commercial or financial relationships.
Although these guarantees do not have any effect at consolidated Group level, there are certain guarantees provided by non-infrastructure project companies to infrastructure project companies (Note 1.1.2.) which, due to the classification of project borrowings as being without recourse, it is relevant to disclose (see Note b.1.). Contingent capital guarantees).
Other noteworthy guarantees have also been provided to equity-accounted companies (see b.2.).
b.1) Guarantees provided by ex-infrastructure project companies to infrastructure project companies in relation to the borrowings of the latter that could give rise to future additional capital disbursements if the events guaranteed took place (contingent capital guarantees).
Guarantees provided by non-infrastructure project companies to infrastructure project companies can be classified into the following two categories:
• Guarantees that address the correct performance in construction and service contracts which have been mentioned in Note 6.5.2-a.
• Guarantees related to risks other than the correct performance of construction and service contracts, which could give rise to future additional capital disbursements if the events guaranteed take place.
The latter guarantees are the ones that are going to be explained in further detail in this section since, as mentioned in Note 5.2., net cash position, the borrowings for infrastructure projects are without recourse to the shareholders or with limited recourse to the guarantees provided and, therefore, it is relevant to distinguish those guarantees that if the guaranteed event occurs, could be executed and could result in disbursements to the infrastructure projects or holders of their debt other than the committed capital or investment mentioned in Note 6.5.3. Such guarantees are called contingent capital guarantees.
The detail, by beneficiary company, purpose and maximum amount, of the outstanding guarantees of this nature at 31 December 2021 relating to fully consolidated infrastructure project companies is as follows. It should be noted that the amounts below relate to Ferrovial:
There are also bank guarantees issued by third parties in the amount of EUR 3 million for possible cost overruns at the I66 project.
The detail of the amounts of the guarantees, in relation to the financing of the equity-accounted infrastructure projects and, accordingly, the borrowings of which are not included in the Group's consolidated financial statements is as follows.
The significant reduction in the amount of these guarantees (EUR 8 million as compared with EUR 48 million in 2020) is due to the fact that an agreement was reached at the end of the year to sell URBICSA, this project having been secured in the amount of EUR 42 million at 31 December 2020. In addition to these guarantees, there are bank guarantees issued by third parties in the amount of EUR 3 million for possible cost overruns in the Ausol project.
(Millions of euros) Dec. 2021 Dec. 2020 Construction 5,284 4,548 Toll roads 856 1,051 Airports 42 18 Other 315 299 Total continuing operations 6,497 5,915 Services 603 813 Total discontinued operations 603 813 TOTAL 7,099 6,728
BENEFICIARY COMPANY (PROJECT) GUARANTEE PURPOSE AMOUNT
Conc. Prisiones Lledoners
Technical guarantee to repay amounts to the bank in the event of termination of the contract. Does not cover insolvency (default) or breach by the grantor
67
GUARANTEES FOR CONSTRUCTION PROJECTS
67
I66 Guarantee to cover cost overruns 13
GUARANTEES FOR TOLLROAD PROJECTS 13
Centella Technical guarantee to cover the achievement of project milestones and payment of any fines during the initial execution period
12
GUARANTEES FOR ENERGY AND MOVILITY PROJECTS 12 TOTAL GUARANTEES FOR FULLY CONSOLIDATED INFRASTRUCTURE PROJECTS
93
BENEFICIARY COMPANY GUARANTEE PURPOSE AMOUNT Ausol Financial guarantee covering the
contribution of contingent equity. 3 Serrano Park (Cintra) Guarantee to cover repayment of the debt 3 Auto-Estradas Norte Litoral (Cintra)
Guarantee limited to compulsory purchase overruns. 0
Bucaramanga Guarantee limited to construction works overruns. 2
TOTAL GUARANTEES FOR EQUITY-ACCOUNTED INFRASTRUCTURE PROJECTS
8

CONSOLIDATED ANNUAL ACCOUNTS FERROVIAL, S.A. AND SUBSIDIARIES
271
In addition, the Company has provided a guarantee amounting to EUR 19 million in relation to the Radial 4 toll road, which was excluded from the consolidation scope in 2015. This amount is fully provisioned at 31 December 2021 and a related cassation appeal is currently in progress (Note 6.5.1.a)).
b.2) Other guarantees provided to equity-accounted companies other than infrastructure project companies.
Certain construction and services contracts are performed by equity-accounted companies often created specifically to execute contracts previously awarded to their shareholders. In these cases, the shareholders provide performance bonds relating to those contracts. The liability secured is similar to that indicated in Note 6.5.2.a.
They include guarantees provided in the Services Division by Amey UK PLC in favor of various equity-accounted companies that it has an ownership interest in. These guarantees total EUR 369 million, the most significant of which related to the contracts with the British Ministry of Justice and the Manchester tram network. It should be noted that the aforementioned amount relates to the annual amount of contracts not yet performed in proportion to Ferrovial’s percentage of ownership.
c) Security interests in assets
The security interests in assets are described in the following Notes:
• Guarantees given for fixed assets (Note 3.4)
• Security interests in deposits or restricted cash (Note 5.2).
d) Guarantees received from third parties
At 31 December 2021, Ferrovial had received guarantees from third parties totaling EUR 1,149 million (31 December 2020: EUR 1,601 million), mainly in the Construction Division in the Ferrovial Construcción companies in the United States (EUR 645 million), the Budimex Group (EUR 153 million) and other construction companies (EUR 352 million), particularly noteworthy were the companies in the UK (EUR 126 million) and Australia (EUR 161 million).
These third-party guarantees are technical guarantees that are offered by certain subcontractors or suppliers in the construction business in order to guarantee complete compliance with their contractual obligations with regard to the work they are engaged to complete, and may not be sold or pledged.
6.5.3. Commitments
As described in Note 1.1, the infrastructure projects carried out by the Group are performed through long-term contracts where the concession operator is a company in which the Group has interests, either alone or together with other partners, and the borrowings necessary for financing the project are allocated to the project itself, without recourse to the shareholders or with recourse limited to the guarantees provided, under the terms set forth in Note 5.2. From a management viewpoint, Ferrovial therefore takes into account only the investment commitments relating to the capital of the projects, since the investment in the assets is financed by the borrowings of the projects themselves.
a) Investment commitments
The investment commitments of the Group in relation to the capital of its infrastructure projects are as follows:
At 31 December 2021, the investment commitments amounted to EUR 517 million (2020: EUR 851 million). The Toll Roads Division includes EUR 349 million in relation to the I-66 project (2020: EUR 590 million). The energy and mobility investment commitments relate to a solar plant in Seville. The curtailment in investment commitments is primarily due to investments made in toll road projects in the US and Slovakia in 2021, as well as due to reaching financial closure at transmission line projects in Chile.
Under the AGS refinancing agreement described in Note 5.4.c.v, Ferrovial also committed to inject up to GBP 15 million into AGS (50% equity - 50% debt) subject to the fulfilment of certain liquidity conditions to the maturity date of the loan in 2024.
As indicated in 6.5.2.a), a part of these infrastructure project commitments, amounting to EUR 517 million, are secured by bank guarantees amounting to EUR 498 million.
There are also property, plant and equipment purchase commitments in the Services Division totaling EUR 1 million (2020: EUR 112 million). Such a large reduction in the amount of the commitments is due to the fact that they mostly related to the Environment Services business in Spain and Portugal, in respect of which a sale agreement was reached in December 2021.
In addition, there are investment commitments amounted to EUR 16 million in investments made in companies in which Ferrovial has a minority stake, and which develop innovation projects mainly related to energy and mobility.
b) Environmental commitments
Any operation designed mainly to prevent, reduce or repair damage to the environment is treated as an environmental activity.
Costs incurred to protect and improve the environment are taken to profit or loss in the year in which they are incurred, irrespective of when the resulting monetary or financial flow takes place.
(Millions of euros) 2022 2023 2024 2025 2026 2027+ TOTAL
Toll roads 407 18 6 0 0 0 431 Energy and mobility 26 2 0 0 0 0 27
INVESTMENTS IN FULLY CONSOLIDATED INFRASTRUCTURE PROJECTS
432 20 6 0 0 0 458
Toll roads 25 0 0 27 0 0 52 Energy and mobility 6 0 0 0 0 0 6 Construction 1 0 0 0 0 0 1 INVESTMENTS IN EQUITY-ACCOUNTED INFRASTRUCTURE PROJECTS
31 0 0 27 0 0 58
TOTAL INVESTMENTS INFRASTRUCTURE PROJECTS
455 20 6 27 0 0 517
(Millions of euros) 2022 2023 2024 2025 2026 2027+ TOTAL Acquisition of property, plant and equipment 0 1 0 0 0 0 1 TOTAL SERVICES 0 1 0 0 0 0 1 TOTAL 0 1 0 0 0 0 1
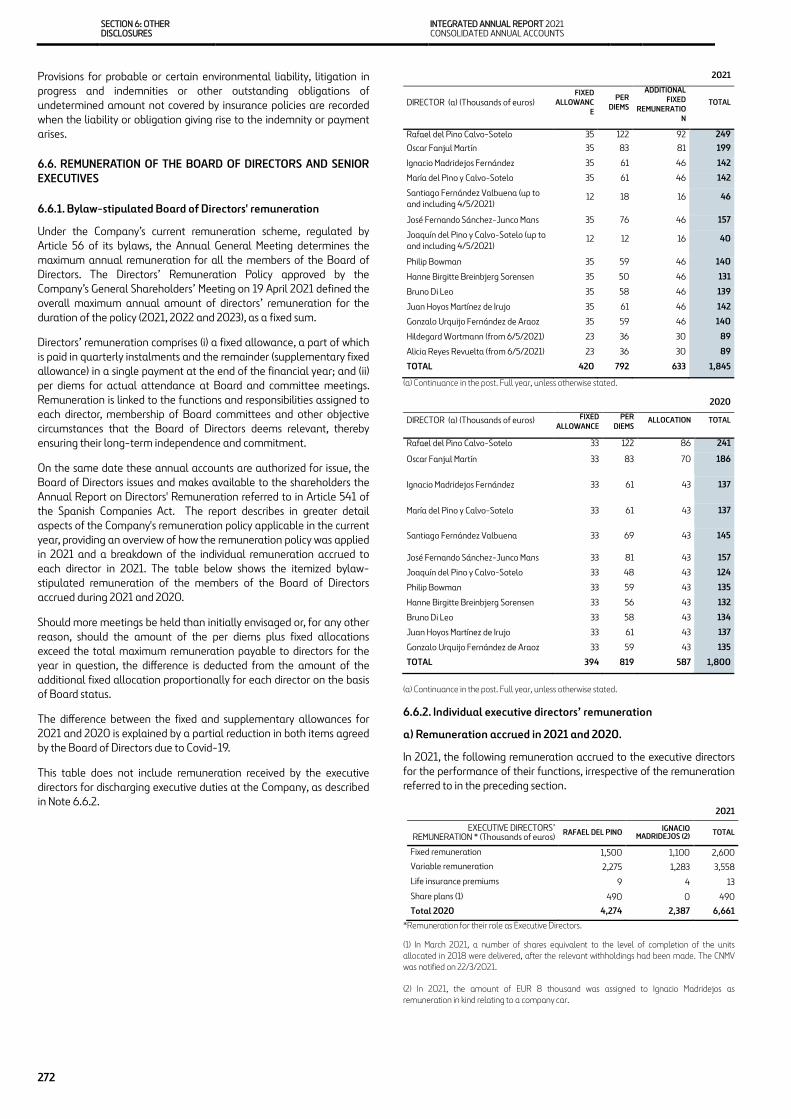
SECTION 6: OTHER DISCLOSURES
INTEGRATED ANNUAL REPORT 2021 CONSOLIDATED ANNUAL ACCOUNTS
272
Provisions for probable or certain environmental liability, litigation in progress and indemnities or other outstanding obligations of undetermined amount not covered by insurance policies are recorded when the liability or obligation giving rise to the indemnity or payment arises.
6.6. REMUNERATION OF THE BOARD OF DIRECTORS AND SENIOR EXECUTIVES
6.6.1. Bylaw-stipulated Board of Directors' remuneration
Under the Company’s current remuneration scheme, regulated by Article 56 of its bylaws, the Annual General Meeting determines the maximum annual remuneration for all the members of the Board of Directors. The Directors’ Remuneration Policy approved by the Company’s General Shareholders’ Meeting on 19 April 2021 defined the overall maximum annual amount of directors’ remuneration for the duration of the policy (2021, 2022 and 2023), as a fixed sum.
Directors’ remuneration comprises (i) a fixed allowance, a part of which is paid in quarterly instalments and the remainder (supplementary fixed allowance) in a single payment at the end of the financial year; and (ii) per diems for actual attendance at Board and committee meetings. Remuneration is linked to the functions and responsibilities assigned to each director, membership of Board committees and other objective circumstances that the Board of Directors deems relevant, thereby ensuring their long-term independence and commitment.
On the same date these annual accounts are authorized for issue, the Board of Directors issues and makes available to the shareholders the Annual Report on Directors' Remuneration referred to in Article 541 of the Spanish Companies Act. The report describes in greater detail aspects of the Company's remuneration policy applicable in the current year, providing an overview of how the remuneration policy was applied in 2021 and a breakdown of the individual remuneration accrued to each director in 2021. The table below shows the itemized bylaw-stipulated remuneration of the members of the Board of Directors accrued during 2021 and 2020.
Should more meetings be held than initially envisaged or, for any other reason, should the amount of the per diems plus fixed allocations exceed the total maximum remuneration payable to directors for the year in question, the difference is deducted from the amount of the additional fixed allocation proportionally for each director on the basis of Board status.
The difference between the fixed and supplementary allowances for 2021 and 2020 is explained by a partial reduction in both items agreed by the Board of Directors due to Covid-19.
This table does not include remuneration received by the executive directors for discharging executive duties at the Company, as described in Note 6.6.2.
2021
DIRECTOR (a) (Thousands of euros) FIXED ALLOWANC
E PER
DIEMS ADDITIONAL
FIXED REMUNERATIO
N TOTAL
Rafael del Pino Calvo-Sotelo 35 122 92 249 Oscar Fanjul Martín 35 83 81 199 Ignacio Madridejos Fernández 35 61 46 142 María del Pino y Calvo-Sotelo 35 61 46 142 Santiago Fernández Valbuena (up to and including 4/5/2021) 12 18 16 46 José Fernando Sánchez-Junco Mans 35 76 46 157 Joaquín del Pino y Calvo-Sotelo (up to and including 4/5/2021) 12 12 16 40 Philip Bowman 35 59 46 140 Hanne Birgitte Breinbjerg Sorensen 35 50 46 131 Bruno Di Leo 35 58 46 139 Juan Hoyos Martínez de Irujo 35 61 46 142 Gonzalo Urquijo Fernández de Araoz 35 59 46 140 Hildegard Wortmann (from 6/5/2021) 23 36 30 89 Alicia Reyes Revuelta (from 6/5/2021) 23 36 30 89 TOTAL 420 792 633 1,845
(a) Continuance in the post. Full year, unless otherwise stated.
2020 DIRECTOR (a) (Thousands of euros) FIXED
ALLOWANCE PER DIEMS ALLOCATION TOTAL
Rafael del Pino Calvo-Sotelo 33 122 86 241 Oscar Fanjul Martín 33 83 70 186 Ignacio Madridejos Fernández 33 61 43 137 María del Pino y Calvo-Sotelo 33 61 43 137 Santiago Fernández Valbuena 33 69 43 145 José Fernando Sánchez-Junco Mans 33 81 43 157 Joaquín del Pino y Calvo-Sotelo 33 48 43 124 Philip Bowman 33 59 43 135 Hanne Birgitte Breinbjerg Sorensen 33 56 43 132 Bruno Di Leo 33 58 43 134 Juan Hoyos Martínez de Irujo 33 61 43 137 Gonzalo Urquijo Fernández de Araoz 33 59 43 135 TOTAL 394 819 587 1,800
(a) Continuance in the post. Full year, unless otherwise stated.
6.6.2. Individual executive directors’ remuneration
a) Remuneration accrued in 2021 and 2020.
In 2021, the following remuneration accrued to the executive directors for the performance of their functions, irrespective of the remuneration referred to in the preceding section.
*Remuneration for their role as Executive Directors.
(1) In March 2021, a number of shares equivalent to the level of completion of the units allocated in 2018 were delivered, after the relevant withholdings had been made. The CNMV was notified on 22/3/2021.
(2) In 2021, the amount of EUR 8 thousand was assigned to Ignacio Madridejos as remuneration in kind relating to a company car.
2021 EXECUTIVE DIRECTORS’
REMUNERATION * (Thousands of euros) RAFAEL DEL PINO IGNACIO MADRIDEJOS (2) TOTAL
Fixed remuneration 1,500 1,100 2,600 Variable remuneration 2,275 1,283 3,558 Life insurance premiums 9 4 13 Share plans (1) 490 0 490 Total 2020 4,274 2,387 6,661

CONSOLIDATED ANNUAL ACCOUNTS FERROVIAL, S.A. AND SUBSIDIARIES
273
The 2020 information is shown in the following table:
2020 EXECUTIVE DIRECTORS’ REMUNERATION * (Thousands of euros)
RAFAEL DEL PINO IGNACIO
MADRIDEJOS TOTAL
Fixed remuneration 1,405 937 2,342 Variable remuneration 1,620 810 2,430 Life insurance premiums 8 4 12 Share plans (1) 1,602 0 1,602 Total 2020 4,635 1,751 6,386
* Remuneration as executive directors
(1) In March 2020, a number of shares equivalent to the level of completion of the units allocated in 2017 were delivered, after the relevant withholdings had been made. The CNMV was notified on [*]
(2) In 2020, the amount of EUR 8 thousand was assigned to Ignacio Madridejos as remuneration in kind relating to a company car.
b) Share-based remuneration schemes
There follows a breakdown of the share-based remuneration schemes linked to objectives, entitlement to which has not yet vested:
EXECUTIVE DIRECTORS’ PLAN AT 31.12.2021 UNITS NO. OF
VOTING RIGHTS
NO. OF VOTING RIGHTS
Rafael del Pino y Calvo-Sotelo
2019 allocation 70,000 70,000 0.01% 2020 allocation 46,500 46,500 0.00 % 2021 allocation 67,500 67,500 [*]
Ignacio Madridejos Fernández
2019 allocation 14,468 14,468 0.00 % 2020 allocation 46,500 46,500 0.00 % 2021 allocation 67,500 67,500 [*]
6.6.3. Pension funds and plans or life insurance premiums
As in 2020, no contributions were made in 2021 to pension plans or funds for former or current members of the Company’s Board of Directors or for directors of the Company who are members of other Boards of Directors and/or senior managers of Group companies and associates. No such obligations were acquired during the year.
As regards life insurance premiums, the Company has insurance policies covering death (for which premiums totaling EUR 13 thousand were paid in 2021; EUR 12 thousand in 2020) under which the executive directors are beneficiaries. No life insurance premiums were paid for Company directors who are members of other Boards of Directors and/or senior managers of Group companies or associates.
Lastly, the Company has arranged a third-party liability insurance policy covering the directors and managers of the Group companies, the parent company of which is the Company. Those insureds include the Company’s Directors. The premium paid in 2021 under the aforementioned insurance policy amounted to EUR 1,300 thousand.
6.6.4. Advances and loans
At 31 December 2021, no advances or loans had been granted by the Company to the directors in their capacity as such or as members of other Boards of Directors or senior managers of Group companies or associates.
6.6.5 . Senior management remuneration
The overall remuneration accrued to the Company’s senior managers in 2021 is analyzed below:
(1) Three senior managers leaving (figure subject to personal income tax) and an appointment bonus.
The remuneration indicated relates to the following posts: General Secretary, Chief Financial Officer, HR General Manager, Construction General Manager, Services General Manager, Airports General Manager, Toll Roads General Manager, Energy Infrastructure and Mobility General Manager, Information Systems and Innovation General Manager, Internal Audit Director, Communications and Corporate Responsibility Director, Chief Strategy Officer, Risk and Compliance Director, Mobility Director and Sustainability Director. This does not include remuneration for senior managers who were also executive directors, which was addressed in Note 6.6.2.
The Company has also implemented a "Flexible Remuneration Scheme", which allows employees to voluntarily change their remuneration package based on personal needs, replacing a portion with certain benefits in kind. These products include a life and retirement savings group insurance scheme. Participants may request that a portion of their gross annual remuneration be paid by the Company in the form of a premium under a life and retirement savings group insurance policy. The senior managers requested contributions totaling EUR 131 thousand from the Company, replacing the remuneration shown in the table above (EUR 48 thousand in 2020).
6.6.6. Other disclosures on remuneration
The agreements between the Company and the senior managers, specifically provide for the right to receive the indemnities referred to in Article 56 of the Spanish Labor Statute in the event of unfair dismissal.
In order to encourage loyalty and continuity, a deferred remuneration scheme was granted to thirteen senior managers, including one executive director. The scheme consists of extraordinary remuneration that will only be paid in any of the following circumstances:
• Exit of the senior manager by mutual agreement upon reaching a certain age.
• Unfair dismissal or exit at the Company’s discretion without cause for dismissal, before the senior manager reaches the age initially agreed, if the amount exceeds the figure stipulated in the Labor Statute.
• Death or disability of the senior manager.
SENIOR MANAGEMENT REMUNERATION (Thousands of euros) 2021 2020 Fixed remuneration 5,636 5,317 Variable remuneration 5,033 3,657 Performance-based share plan 1,494 4,528 Exercise of stock option plans and/or other financial instruments (see description) 0 0 Remuneration as members of administrative bodies of other Group companies, jointly-controlled entities or associates 31 30 Insurance premiums 17 17 Other (1) 6,990 2,291 Total 19,201 15,840

SECTION 6: OTHER DISCLOSURES
INTEGRATED ANNUAL REPORT 2021 CONSOLIDATED ANNUAL ACCOUNTS
274
•
• To cover this incentive, each year the Company makes contributions to a group savings insurance policy under which the Company is both policyholder and beneficiary. The contributions are quantified on the basis of a certain percentage of each senior manager’s total monetary remuneration. Contributions made in 2021 amounted to EUR 2,187 thousand (EUR 2,006 thousand at 31 December 2020), of which EUR 441 thousand relate to the executive director. EUR 6,912 million in “Other” in table 6.6.5 relates mainly to the amounts received by three senior managers who left the Company in 2021. This amount does not affect the income statement for the year, as the Company expenses the amounts contributed annually to the group savings insurance policy, regardless of when the amounts are received.
6.7. SHARE-BASED REMUNERATION SCHEMES
Performance-based share plan
At year-end 2021, Ferrovial has two remuneration schemes in place for the Group's executive directors, senior managers and managers, consisting of a performance-based share plan.
Long-term incentive plan approved by the Board of Directors on 28 February 2019. This plan will have a one-year term and the annual cost of the plan may not exceed EUR 22 million. The plan is tied to employees remaining at the Company for at least three years as from the grant date (barring special circumstances) and upon the achievement during the vesting period of ratios calculated on the basis of the relation between operating profit/(loss) and net productive assets and total shareholder return in relation to a comparable group.
The plan is intended for executive directors, senior managers and managers. The application of this plan to Executive Directors was authorized at the Company's Annual General Meeting held on 5 April 2019, as communicated to the CNMV on the same day.
Units were allocated for 2019 to the executive directors for the purposes of calculating plan duration and terms on 15 February 2019.
On 19 December 2019 the Board of Directors approved a new long-term incentive plan. The plan will be in force for three years (from 2020 to 2022) and consists of awarding Ferrovial, S.A. shares. The annual cost of the plan may not exceed EUR 22 million and it is conditional upon employees remaining at the Company for three years as from the date it is granted (barring special circumstances) and upon the achievement during the vesting period of ratios calculated on the basis of business cash flow and total shareholder return with respect to a comparable group.
The plan is intended for Executive Directors, Senior Executives and Executives. The plan is intended for executive directors, senior managers and managers. The application of this form of remuneration to executive directors was submitted for approval by the Company’s Annual General Meeting.
There were 2,054,531 shares outstanding at 31 December 2021 relating to these plans.
Changes to the share-based remuneration schemes in 2021 and 2020 are summarized below:
This share award plan includes the plans described above in Note 6.6 on remuneration of executive directors and senior managers.
The impact on the consolidated income statement of the Group in relation to these remuneration schemes in 2021 was an income of EUR 10 million (EUR -10 million of expenses in 2020) with a balancing entry in equity. The recognition of this income is due to the partial reversal of the provision recorded in previous years, since in both the plan that expired in 2021 and the one that expires in 2022, the degree of compliance with the conditions entitling to receive the remuneration has been lower than initially considered.
Measurement of performance-based share plan.
These plans were accounted for as futures and, therefore, the value of the foreseeable dividends up to the delivery date is discounted to the value of the shares at the grant date, using a rate of return equal to the average cost of borrowings over the share award period, and they are equity settled and, therefore, they are measured when granted and the initially calculated value thereof is not re-estimated. The related amounts are recognized under “staff expenses” with a balancing entry in reserves.
6.8. RELATED-PARTY TRANSACTIONS
As regards information on related-party transactions, the following disclosures relate to transactions performed both by Ferrovial, S.A. and all of its subsidiaries.
Legislation
With regard to information on transactions that the Company (or its group companies) carries out with its related parties, International Accounting Standard 24 (the "IAS 24") must be taken into account.
Section 3 of IAS 24 establishes the requirement to include information on related party transactions, transactions, and outstanding balances (including commitments) in the consolidated and separate financial statements of a parent company, as well as in the individual financial statements. Its Section 9 defines related party transactions as any transfer of resources, services or obligations between a reporting entity and a related party, whether a price is charged.
Related-party transactions
The commercial transactions between the Company (or its Group Companies) and related parties carried out in 2021 are disclosed below, in three separate categories: a) transactions between Ferrovial, S.A and its directors and senior executives; b) transactions between subsidiaries of Ferrovial, S.A and its directors and senior executives, and c) Transactions between Group Companies.
Where the profit or loss from a transaction cannot be disclosed, as it pertains to the provider entity or individual, the transaction is marked with an asterisk (*).
2021 2020 Number of shares at beginning of year 2,468,724 3,125,747 Plans granted 909,578 622,004 Plans settled -292,413 -930,106 Shares surrendered and other -954,346 -307,068 Shares exercised -77,012 -41,853 Number of shares at year-end 2,054,531 2,468,724
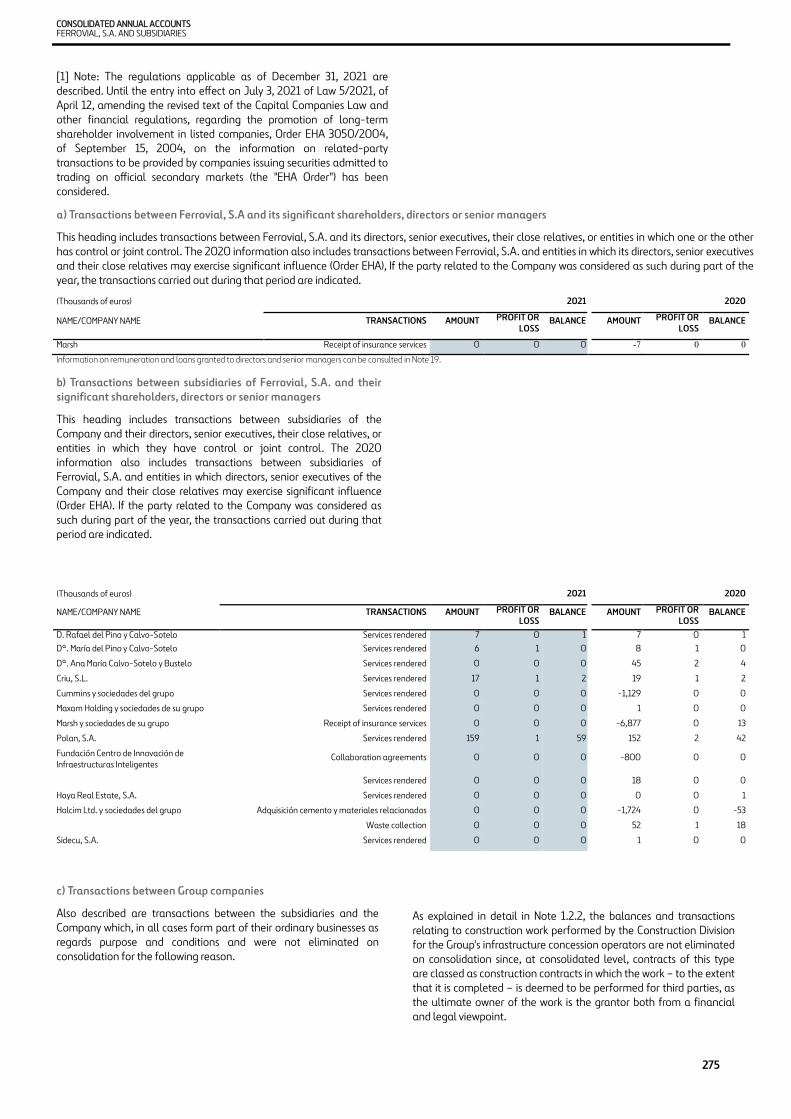
CONSOLIDATED ANNUAL ACCOUNTS FERROVIAL, S.A. AND SUBSIDIARIES
275
[1] Note: The regulations applicable as of December 31, 2021 are described. Until the entry into effect on July 3, 2021 of Law 5/2021, of April 12, amending the revised text of the Capital Companies Law and other financial regulations, regarding the promotion of long-term shareholder involvement in listed companies, Order EHA 3050/2004, of September 15, 2004, on the information on related-party transactions to be provided by companies issuing securities admitted to trading on official secondary markets (the "EHA Order") has been considered.
a) Transactions between Ferrovial, S.A and its significant shareholders, directors or senior managers
This heading includes transactions between Ferrovial, S.A. and its directors, senior executives, their close relatives, or entities in which one or the other has control or joint control. The 2020 information also includes transactions between Ferrovial, S.A. and entities in which its directors, senior executives and their close relatives may exercise significant influence (Order EHA), If the party related to the Company was considered as such during part of the year, the transactions carried out during that period are indicated.
(Thousands of euros) 2021 2020 NAME/COMPANY NAME TRANSACTIONS AMOUNT PROFIT OR
LOSS BALANCE AMOUNT PROFIT OR LOSS BALANCE
Marsh Receipt of insurance services 0 0 0 -7 0 0 Information on remuneration and loans granted to directors and senior managers can be consulted in Note 19.
b) Transactions between subsidiaries of Ferrovial, S.A. and their significant shareholders, directors or senior managers
This heading includes transactions between subsidiaries of the Company and their directors, senior executives, their close relatives, or entities in which they have control or joint control. The 2020 information also includes transactions between subsidiaries of Ferrovial, S.A. and entities in which directors, senior executives of the Company and their close relatives may exercise significant influence (Order EHA). If the party related to the Company was considered as such during part of the year, the transactions carried out during that period are indicated.
(Thousands of euros) 2021 2020 NAME/COMPANY NAME TRANSACTIONS AMOUNT PROFIT OR
LOSS BALANCE AMOUNT PROFIT OR LOSS BALANCE
D. Rafael del Pino y Calvo-Sotelo Services rendered 7 0
1 7 0 1 Dª. María del Pino y Calvo-Sotelo Services rendered 6 1 0 8 1 0
Dª. Ana María Calvo-Sotelo y Bustelo Services rendered 0 0 0 45 2 4
Criu, S.L. Services rendered 17 1 2 19 1 2
Cummins y sociedades del grupo Services rendered 0 0 0 -1,129 0 0
Maxam Holding y sociedades de su grupo Services rendered 0 0 0 1 0 0
Marsh y sociedades de su grupo Receipt of insurance services 0 0 0 -6,877 0 13
Polan, S.A. Services rendered 159 1 59 152 2 42
Fundación Centro de Innovación de Infraestructuras Inteligentes
Collaboration agreements 0 0 0 -800 0 0
Services rendered 0 0 0 18 0 0
Haya Real Estate, S.A. Services rendered 0 0 0 0 0 1
Holcim Ltd. y sociedades del grupo Adquisición cemento y materiales relacionados 0 0 0 -1,724 0 -53
Waste collection 0 0 0 52 1 18
Sidecu, S.A. Services rendered 0 0 0 1 0 0
c) Transactions between Group companies
Also described are transactions between the subsidiaries and the Company which, in all cases form part of their ordinary businesses as regards purpose and conditions and were not eliminated on consolidation for the following reason.
As explained in detail in Note 1.2.2, the balances and transactions relating to construction work performed by the Construction Division for the Group's infrastructure concession operators are not eliminated on consolidation since, at consolidated level, contracts of this type are classed as construction contracts in which the work – to the extent that it is completed – is deemed to be performed for third parties, as the ultimate owner of the work is the grantor both from a financial and legal viewpoint.

SECTION 6: OTHER DISCLOSURES
INTEGRATED ANNUAL REPORT 2021 CONSOLIDATED ANNUAL ACCOUNTS
276
In 2021 Ferrovial's Construction Division billed these companies for the work performed and related advances amounting to EUR 955,920 thousand (2020: EUR 974,587 thousand), recognizing sales of EUR 1,016,628 thousand (2020: EUR 1,025,252 thousand).
The result not eliminated in the consolidation process derived from these operations, which is attributable to the percentage that the Company holds in the concession companies receiving the works and net of taxes and minority interests, amounted to EUR 5,748 thousand in 2021. In 2020 it amounted to EUR -18,702 thousand.
6.9. CONFLICTS OF INTEREST
I In accordance with legislation in force (Article 229 of the Spanish Companies Act), there were no direct or indirect conflicts of interest with the Company, notwithstanding the Company's transactions (or those of the Group companies) with related parties disclosed in the notes to the accounts or, where applicable, resolutions relating to remuneration or appointments.
6.10. AUDIT FEES
Pursuant to Royal Decree 1514 of 16 November 2007, approving the Spanish National Chart of Accounts, following is a disclosure of the total fees relating to the “audit services” and “other consultancy services” provided by the auditors of the 2021 and 2020 financial statements of the Group Companies, including both the lead auditor of Ferrovial S.A. and the other auditors of all its subsidiaries.
“Fees for audit services” just include strictly statutory audit services.
The "Other services whose provision by the auditors is required by the applicable regulations" only include, as the name of the heading indicates, those whose provision by the auditor is mandatory, for example, the limited review of the company's interim financial statements or the issuance of "comfort letters" in debt issues.
The total of "Other non-audit services" provided by the lead auditor represented 2.74% of the total fees for audit services in 2021.
(*) Includes final fees related to 2020 financial statements
(**) Most of this figure corresponds to invoices received in 2020 for 2019 expat personnel services.
6.11. EVENTS AFTER THE REPORTING DATE
On 1 February 2022, the sale agreement between Ferrovial and an entity controlled by funds managed by Portobello Capital for the infrastructure upkeep and maintenance business in Spain was completed once all the conditions precedent had been fulfilled, as explained in Note 1.1.3. Assets and liabilities held for sale and discontinued operations.
The same note explains that, also in February 2022, an agreement was reached to sell two small business areas within the Amey business related to energy and water infrastructure maintenance services and to infrastructure project company administration services.
In addition, Ferrovial through its Airports division, has reached an agreement with Turkish infrastructure company YDA Group, to acquire a 60% share of the company that manages the concession of the International Airport of Dalman, in Turkey, for EUR 140 million. YDA Group that has been operating the asset since 2006 and will retain the remain 40% share of the society, has made significant improvements to its facilities.
6.12. APPENDICES
Millions of euros 2021 2020 (*) Fees for audit services 7 7 CONTINUING OPERATIONS 4 4 Lead auditor 4 3
Other auditors 0 1
DISCONTINUED OPERATIONS 3 2 Lead auditor 0 0
Other auditors 2 2
Other services required to be provided by statutory auditors under applicable regulations. 0 0
CONTINUING OPERATIONS 0 0 Lead auditor 0 0
Other auditors 0 0
DISCONTINUED OPERATIONS 0 0 Lead auditor 0 0
Other auditors 0
Other audit services 0 1 Lead auditor (**) 0 1
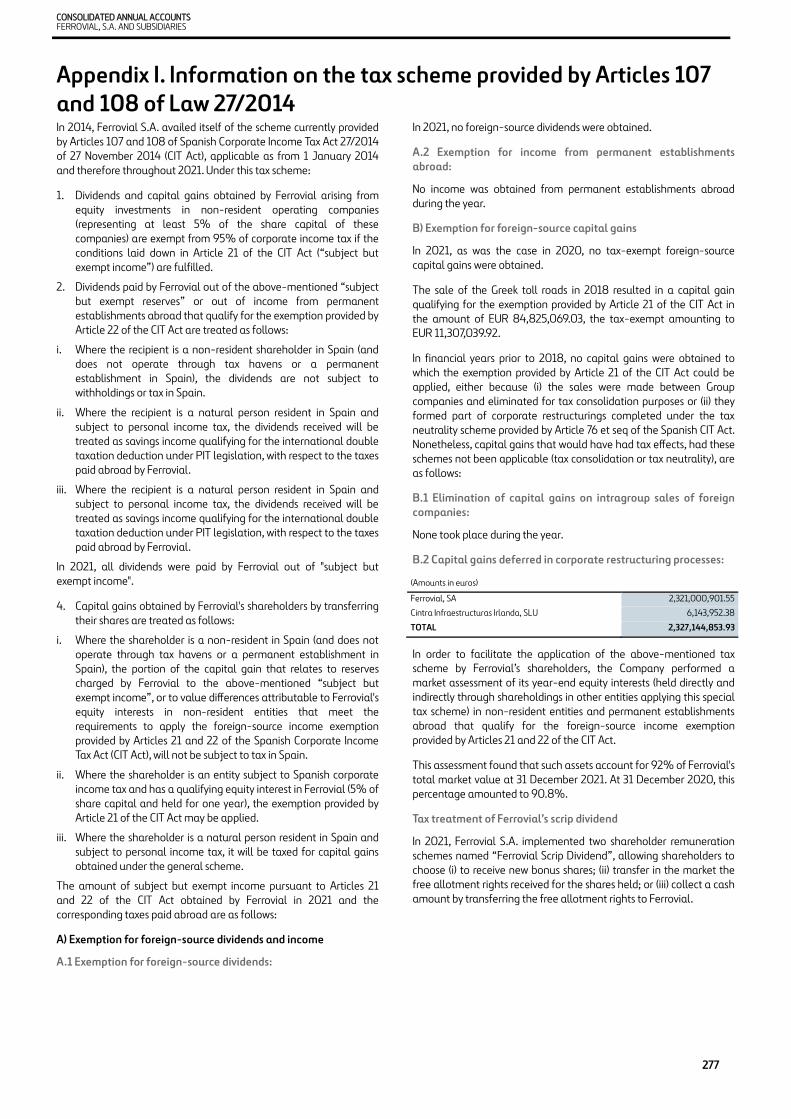
CONSOLIDATED ANNUAL ACCOUNTS FERROVIAL, S.A. AND SUBSIDIARIES
277
Appendix I. Information on the tax scheme provided by Articles 107 and 108 of Law 27/2014 In 2014, Ferrovial S.A. availed itself of the scheme currently provided by Articles 107 and 108 of Spanish Corporate Income Tax Act 27/2014 of 27 November 2014 (CIT Act), applicable as from 1 January 2014 and therefore throughout 2021. Under this tax scheme:
1. Dividends and capital gains obtained by Ferrovial arising from equity investments in non-resident operating companies (representing at least 5% of the share capital of these companies) are exempt from 95% of corporate income tax if the conditions laid down in Article 21 of the CIT Act (“subject but exempt income”) are fulfilled.
2. Dividends paid by Ferrovial out of the above-mentioned “subject but exempt reserves” or out of income from permanent establishments abroad that qualify for the exemption provided by Article 22 of the CIT Act are treated as follows:
i. Where the recipient is a non-resident shareholder in Spain (and does not operate through tax havens or a permanent establishment in Spain), the dividends are not subject to withholdings or tax in Spain.
ii. Where the recipient is a natural person resident in Spain and subject to personal income tax, the dividends received will be treated as savings income qualifying for the international double taxation deduction under PIT legislation, with respect to the taxes paid abroad by Ferrovial.
iii. Where the recipient is a natural person resident in Spain and subject to personal income tax, the dividends received will be treated as savings income qualifying for the international double taxation deduction under PIT legislation, with respect to the taxes paid abroad by Ferrovial.
In 2021, all dividends were paid by Ferrovial out of "subject but exempt income".
4. Capital gains obtained by Ferrovial's shareholders by transferring their shares are treated as follows:
i. Where the shareholder is a non-resident in Spain (and does not operate through tax havens or a permanent establishment in Spain), the portion of the capital gain that relates to reserves charged by Ferrovial to the above-mentioned “subject but exempt income”, or to value differences attributable to Ferrovial's equity interests in non-resident entities that meet the requirements to apply the foreign-source income exemption provided by Articles 21 and 22 of the Spanish Corporate Income Tax Act (CIT Act), will not be subject to tax in Spain.
ii. Where the shareholder is an entity subject to Spanish corporate income tax and has a qualifying equity interest in Ferrovial (5% of share capital and held for one year), the exemption provided by Article 21 of the CIT Act may be applied.
iii. Where the shareholder is a natural person resident in Spain and subject to personal income tax, it will be taxed for capital gains obtained under the general scheme.
The amount of subject but exempt income pursuant to Articles 21 and 22 of the CIT Act obtained by Ferrovial in 2021 and the corresponding taxes paid abroad are as follows:
A) Exemption for foreign-source dividends and income
A.1 Exemption for foreign-source dividends:
In 2021, no foreign-source dividends were obtained.
A.2 Exemption for income from permanent establishments abroad:
No income was obtained from permanent establishments abroad during the year.
B) Exemption for foreign-source capital gains
In 2021, as was the case in 2020, no tax-exempt foreign-source capital gains were obtained.
The sale of the Greek toll roads in 2018 resulted in a capital gain qualifying for the exemption provided by Article 21 of the CIT Act in the amount of EUR 84,825,069.03, the tax-exempt amounting to EUR 11,307,039.92.
In financial years prior to 2018, no capital gains were obtained to which the exemption provided by Article 21 of the CIT Act could be applied, either because (i) the sales were made between Group companies and eliminated for tax consolidation purposes or (ii) they formed part of corporate restructurings completed under the tax neutrality scheme provided by Article 76 et seq of the Spanish CIT Act. Nonetheless, capital gains that would have had tax effects, had these schemes not been applicable (tax consolidation or tax neutrality), are as follows:
B.1 Elimination of capital gains on intragroup sales of foreign companies:
None took place during the year.
B.2 Capital gains deferred in corporate restructuring processes:
In order to facilitate the application of the above-mentioned tax scheme by Ferrovial’s shareholders, the Company performed a market assessment of its year-end equity interests (held directly and indirectly through shareholdings in other entities applying this special tax scheme) in non-resident entities and permanent establishments abroad that qualify for the foreign-source income exemption provided by Articles 21 and 22 of the CIT Act.
This assessment found that such assets account for 92% of Ferrovial's total market value at 31 December 2021. At 31 December 2020, this percentage amounted to 90.8%.
Tax treatment of Ferrovial’s scrip dividend
In 2021, Ferrovial S.A. implemented two shareholder remuneration schemes named “Ferrovial Scrip Dividend”, allowing shareholders to choose (i) to receive new bonus shares; (ii) transfer in the market the free allotment rights received for the shares held; or (iii) collect a cash amount by transferring the free allotment rights to Ferrovial.
(Amounts in euros) Ferrovial, SA 2,321,000,901.55 Cintra Infraestructuras Irlanda, SLU 6,143,952.38 TOTAL 2,327,144,853.93

SECTION 6: OTHER DISCLOSURES
INTEGRATED ANNUAL REPORT 2021 CONSOLIDATED ANNUAL ACCOUNTS
278
Set out below are the main tax implications of these schemes, based on tax legislation in force in Spain (excluding Navarre and the Basque Country) and on the interpretation made by the Spanish Directorate General for Taxation in responses to several binding ruling requests.
General considerations
In general, although the tax scheme applicable to shareholders residing in the historical territories, Ceuta or Melilla is similar to the national tax system, there may be some differences in the treatment afforded.
It should be noted that the tax treatment of the various options explained in relation to the capital increase set out above does not cover all possible tax consequences regarding the options in connection with the “Ferrovial Scrip Dividend” remuneration scheme. Therefore, the shareholders should consult their tax advisers on the specific tax effect of the proposed scheme and pay attention to any changes that may arise under legislation in force at the date of this transaction, related interpretations and the personal circumstances of each shareholder or holder of free allotment rights.
In particular, shareholders not resident in Spain must consult their tax advisors regarding the effects of the different capital increase alternatives, including the analysis of exemptions provided by non-resident income tax legislation, the right to apply the provisions of double taxation treaties entered into by Spain and the way the income must be declared.
Specific considerations
a) Delivery of new shares.
If the shareholders opt for the delivery of new shares, they will come under the tax scheme indicated below:
1. Shareholders subject to personal income tax and non-resident income tax without a permanent establishment in Spain.
For tax purposes, the delivery of new shares will be considered a delivery of bonus shares and therefore does not constitute income for the purposes of personal income tax (PIT), or non-resident income tax (NRIT), on the assumption that the latter (non-resident taxpayer) does not act in Spain through a permanent establishment. As indicated, the delivery of new shares is not subject to withholdings or prepayments.
The acquisition cost per share for tax purposes, of both the bonus shares and the shares from which they arise will be the result of dividing the portfolio's total acquisition cost by the number of shares, including both the original shares and the corresponding bonus shares. The age of the bonus shares will be that of the original shares.
Consequently, in the event of a subsequent transfer, the income obtained will be calculated by reference to this new value.
2. Shareholders subject to corporate income tax and non-resident income tax with a permanent establishment in Spain.
For corporate income tax (“CIT”) purposes, and for non-resident income tax (“NRIT) purposes in the case of non-resident taxpayers with a permanent establishment in Spain (where a full business cycle is completed), the delivery of new shares under this alternative will be afforded the treatment stipulated in accounting legislation, taking into account the applicable specific provisions brought in by the Resolution of the Spanish Institute of Accounting and Auditing (ICAC) of 5 March 2019 (“ICAC Resolution”) for financial years beginning on or after 1 January 2020, which develops the approach to the presentation of financial instruments and other aspects governed by accounting legislation, and pursuant to the responses to ruling requests issued by the Directorate General for Taxation on the tax impacts of the ICAC Resolution, reference numbers V1358-2020, V1357-2020, V1809/2020, V2468-2020 and V2469-2020 (“Ruling Request Responses”). All the above is notwithstanding any rules for calculating the tax base which may be applicable, particularly the possibility of applying the exemption in the terms and limits stipulated in the current wording of Article 21 of the CIT Law.
According to the Ruling Request Responses, the delivery of fully-paid shares is not classed as income subject to withholdings or payments on account of CIT or NRIT for taxpayers with a permanent establishment in Spain.
b) Sale of free allotment rights in the market.
If the shareholders sell their free allotment rights in the market, the amount obtained will come under the tax scheme indicated below:
1. Shareholders who pay personal income tax (individuals with tax residence in Spain).
The amount obtained on the sale of the free allotment rights in the market will subject to the same scheme provided by tax legislation for pre-emptive subscription rights. As a result, the transferring shareholder will have been deemed to have made a capital gain in the tax period that the sale occurs. The amount obtained will be subject to personal income tax withholdings, at the applicable rate at that time (currently 19%).
This withholding tax will be applied by the relevant custodian (and, failing this, by the financial intermediary or public notary involved in the transfer), Ferrovial not being required to make the withholdings or supply related tax information to its shareholders. Shareholders are therefore advised to contact the relevant custodians in this regard.
2. Shareholders who pay personal income tax, without a permanent establishment in Spain.
In the case of non-resident shareholders, the amount obtained on the sale to the market of the bonus issue rights is also subject to the same rules established in tax legislation for pre-emption rights, therefore the transferring shareholder will be considered to have made a capital gain in the tax period that the sale occurs, subject to non-resident income tax at a general rate of 19%. At present, this payment is not subject to non-resident income tax withholdings and the shareholders must self-assess this income in their tax returns.
CONSOLIDATED ANNUAL ACCOUNTS FERROVIAL, S.A. AND SUBSIDIARIES
279
However, this income will be exempt from non-resident income tax in certain cases, such as non-resident shareholders that transfer their rights in official secondary securities markets in Spain, are residents of a State that has a double taxation treaty (DTT) with Spain containing an information exchange clause and do not operate or reside in a tax haven for Spanish purposes, notwithstanding the exemptions provided by NRIT legislation.
3. Shareholders who pay Spanish corporate income tax, or personal income tax with a permanent establishment in Spain.
Provided that a full business cycle is completed, tax will be paid in accordance with applicable accounting legislation, including the provisions of the ICAC Resolution, the Ruling Request Responses and, if appropriate, the adjustments applicable under CIT legislation and any applicable special CIT schemes.
c) Sale to Ferrovial of the free allotment rights.
Lastly, if the holders of bonus issue rights decide to avail themselves of the Ferrovial Purchase Commitment, the tax regime applicable to the amount obtained on the sale to Ferrovial of the bonus issue rights received in their capacity as shareholders will be equivalent to the regime applied to the distribution of a cash dividend and will therefore be subject to the corresponding withholding tax and taxation.
Where shareholders provide evidence of non-resident income taxpayer status, no permanent establishment in Spain and non-residence in Spain or in a territory classed as a tax haven, the dividends paid by Ferrovial and therefore the amounts received from the sale of free allotment rights to Ferrovial will not be subject to tax or tax withholdings in Spain, since for tax purposes they are paid out of the exempt income from non-resident entities envisaged in Articles 21 and 22 of CIT Law 27/2014 of 27 November.

SECTION 6: OTHER DISCLOSURES
INTEGRATED ANNUAL REPORT 2021 CONSOLIDATED ANNUAL ACCOUNTS
280
Appendix II. Subsidiaries (fully-consolidated companies) (millions of euros)
ENTITY TYPE PARENT % OWNERSHIP
NET COST OWNERSHIP
AUDIT.
CONTINUED OPERATIONS CORPORATION SPAIN (Registered Office: Madrid, Spain) Ferrovial Inversiones, S.A. (a) Ferrovial, S.A.
(a) 100,0 % 67 Can-Am, S.A. (a) Ferrovial, S.A.
(a) 100,0 % 0 Ferrovial Emisiones, S.A. (a) Ferrovial, S.A.
(a) 99,0 % 0 1
Ferrovial Corporación, S.A. (a) Ferrovial, S.A. (a) 100,0 % 5 1
Ferrofin, S.L. (a) Ferrovial Construcción, S.A. (a) 52,0 % 165
Ferrofin, S.L. (a) Ferrovial, S.A. (a) 48,0 % 152
Temauri, S.L. (a) Ferrovial, S.A. (a) 100,0 % 9
Ferrovial 001, S.A. (a) Ferrovial, S.A. (a) 100,0 % 0
Ferrovial 004, S.L. (a) Ferrovial, S.A. (a) 100,0 % 0
Ferrovial 005, S.L. (a) Ferrovial, S.A. (a) 100,0 % 0
Ferrovial 006, S.A. (a) Ferrovial, S.A. (a) 100,0 % 0
Ferrovial Ventures, S.A. (a) Ferrovial, S.A. (a) 100,0 % 0
Acadia Servicios de Medioambiente, S.L. (a)
Ferrovial Internacional, S.E. 100,0 % 204
Autovía de Aragón, Sociedad Concesionaria, S.A. P Ferrovial, S.A.
(a) 15,0 % 3 2
Pilum, S.A. (a) P Ferrovial, S.A. (a) 15,0 % 1 2
Ferrovial Aravia, S.A. (a) P Ferrovial, S.A. (a) 15,0 % 0 2
Sitkol, S.A.U. (a) Ferrovial 001, S.A. (a) 100,0 % 5
UNITED KINGDOM (Registered Office: Oxford, United Kingdom) Ferrocorp UK Ltd. Ferrovial, S.A.
(a) 100,0 % 1 1 UNITED KINGDOM (Registered Office: London, United Kingdom)
Ferrovial Ventures, Ltd. Ferrovial Internacional, S.E. 100,0 % 7 1
IRELAND (Registered Office: Dublin, Ireland) Landmille Ireland DAC Ferrovial, S.A.
(a) 100,0 % 187 3 LUXEMBOURG (Registered Office: Luxembourg) Krypton RE, S.A. Ferrovial, S.A.
(a) 100,0 % 8 1 NETHERLANDS (Registered Office: Amsterdam, Netherlands) Ferrovial International, S.E. Ferrovial, S.A.
(a) 100,0 % 7.120 1
Ferrovial Netherlands B.V. Ferrovial Internacional, S.E. 100,0 % 2 1
Ferrovial Ventures NL B.V. Ferrovial Internacional, S.E. 100,0 % 9
ENTITY TYPE PARENT % OWNERSHIP
NET COST OWNERSHIP
AUDIT.
UNITED STATES (Registered Office: Austin, United States)
Ferrovial Holding US Corp Cintra Infraestructures, S.E. 100,0 % 2.314
Landmille US LLC Ferrovial Holding US Corp 100,0 % 0 3
UNITED STATES (Registered Office: Wilmington, United States) Ferrovial IT US, LLC Ferrovial
Holding US Corp 100,0 % 0 CONSTRUCTION GERMANY (Registered Office: Cologne)
Budimex Bau GmbH Budimex SA 100,0 % 0 ARABIA (Registered Office: Riyadh) Ferrovial Agroman Company
Ferrovial Construcción, S.A. (a) 97,5 % 5 7
AUSTRALIA (Registered Office: Sidney) Ferrovial Construction (Australia) PTY LTD
Ferrovial Construction Holdings Ltd 100,0 % 4 1
BRAZIL (Registered Office: Bela Vista, Sao Paulo)
Constructora Ferrovial Ltd. (Brasil) Ferrovial Construction International S.E.
99,0 % 0
CANADÁ (Registered Office: Markham - Ontario)
Ferrovial Construction Canadá Inc. Ferrovial Construction International S.E.
100,0 % 1
CANADÁ (Registered Office: Toronto, Canada)
Ferrovial Services Canada (Holdings) Limited
Ferrovial Services International, S.E.
100,0 % 12 5
Ferrovial Services Ontario Limited Ferrovial Services Canada (Holdings) Limited
100,0 % 0
Ferrovial Services Canada Limited Ferrovial Services Canada (Holdings) Limited
100,0 % 0
Ferrovial Services Alberta Limited Ferrovial Services Canada (Holdings) Limited
100,0 % 0
CHILE (Registered Office: Santiago de Chile)
Constructora Ferrovial Ltda. Ferrovial ENTITY Constructora Ltda.
97,2 % 0 1
Ferrovial Construcción Chile S.A. Ferrovial ENTITY Constructora Ltda.
100,0 % 33 1
Ferrovial ENTITY Constructora Ltda.
Ferrovial Construction International S.E.
100,0 % 24 1
Siemsa Chile, SPA Siemsa Industria S.A. (a) 100,0 % 0 1
SLOVAKIA (Registered Office: Bratislava)

CONSOLIDATED ANNUAL ACCOUNTS FERROVIAL, S.A. AND SUBSIDIARIES
281
ENTITY TYPE PARENT % OWNERSHIP
NET COST OWNERSHIP
AUDIT.
D4R7 Construction S.R.O. Ferrovial Construction Slovakia S.R.O. 65,0 % 4 3
Ferrovial Construction Slovakia S.R.O.
Ferrovial Construction Holdings Ltd 99,0 % 25 3
SPAIN (Registered Office: Barcelona)
Conc. Prisiones Lledoners,S.A. (a) P Ferrovial Construcción, S.A. (a) 100,0 % 16 1
SPAIN (Registered Office: Bilbao) Cadagua, S.A. (a)
Ferrovial Construcción, S.A. (a) 100,0 % 73 1
SPAIN (Registered Office: Madrid) Cocsa, S.A.
Ferrovial Construcción, S.A. (a) 100,0 % 8 1
Ditecpesa, S.A. (a) Ferrovial Construcción, S.A. (a) 100,0 % 1 1
Tecpresa Structural Solutions, S.A. (a)
Ferrovial Construcción, S.A. (a) 99,1 % 2
Ferroconservación, S.A. Ferrovial Construcción, S.A. (a) 99,0 % 20 1
Ferrovial Construcción, S.A. (a) Ferrovial, S.A. (a) 100,0 % 711 1
Ferrovial Medio Ambiente y Energía, S.A. (a)
Ferrovial Construcción, S.A. (a) 100,0 % 1
Ferrovial Railway S.A. (a) Ferrovial Construcción, S.A. (a) 98,8 % 0
Siemsa Control y Sistemas S.A.U. (a) Siemsa Industria
S.A. (a) 99,0 % 1 2
Siemsa Industria S.A. (a) Ferrovial Construcción, S.A. (a) 99,0 % 16 2
Arena Recursos Naturales, S.A.U. (a)
Ferrovial Construcción, S.A. (a) 100,0 % 0
Urbaoeste, S.A. (a) Ferrovial Construcción, S.A. (a) 99,0 % 0
Autovía de Aragón, Sociedad Concesionaria, S.A. P
Ferrovial Construcción, S.A. (a) 25,0 % 5 2
Pilum, S.A. (a) P Ferrovial Construcción, S.A. (a) 25,0 % 0 2
Ferrovial Aravia, S.A. (a) P Ferrovial Construcción, S.A. (a) 25,0 % 0 2
Ferrovial Soluciones Energéticas, S.L.U. (a)
Ferrovial Construccion, S.A. 100,0 % 12
Ferrovial Servicios Energéticos S.L.U. (a)
Ferrovial Construccion, S.A. 100,0 % 14
SPAIN (Registered Office: Zaragoza)
Depusa Aragón S.A. (a) Ferrovial Construcción, S.A. (a) 42,3 % 2 1
Depusa Aragón S.A. (a) Cadagua, S.A. (a) 51,7 % 2 1
UNITED STATES (Registered Office: Atlanta)
ENTITY TYPE PARENT % OWNERSHIP
NET COST OWNERSHIP
AUDIT.
Ferrovial Construction East, LLC Ferrovial Construction US Corp. 100,0 % 301
UNITED STATES (Registered Office: Austin)
Cadagua US LLC Ferrovial Construction US Holding Corp. 100,0 % 14
Cintra ITR LLC Cintra Holding US Corp 44,0 % 46 1
Ferrovial Agroman 56, LLC Ferrovial Construction Texas, LLC 100,0 % 35
Ferrovial Agroman Indiana, LLC Ferrovial Construction US Corp. 100,0 % 0
Ferrovial Construction Texas, LLC Ferrovial Construction US Corp. 100,0 % 178
Ferrovial Construction US Corp. Ferrovial Construction US Holding Corp. 100,0 % 574 1
Ferrovial Construction US Holding Corp.
Ferrovial Holding US Corp. 100,0 % 930 1
Grand Parkway Infrastructure LLC DBW Construction LLC 30,0 % 0 1
Grand Parkway Infrastructure LLC Ferrovial Construction Texas, LLC 40,0 % 0 1
Ferrovial Energy Solutions, LLC Ferrovial Construction US Holding Corp. 100,0 % 0
Servicios (Delaware) Inc.
Ferrovial Services International, S.E.
100,0% 0
Ferrovial Services U.S., Inc. Servicios (Delaware) Inc. 100,0 % 236
Ferrovial Services Infrastructure, Inc.
Ferrovial Services U.S., Inc. 100,0 % 35 1
Ferrovial Services Holding US Corp Ferrovial Holding US Corp 100,0 % 31
UNITED STATES (Registered Office: Charlotte)
Sugar Creek Construction LLC Ferrovial Construction East, LLC 70,0 % 67
UNITED STATES (Registered Office: Dallas)
Trinity Infrastructure LLC DBW Construction LLC 40,0 % 0
Trinity Infrastructure LLC Ferrovial Construction Texas, LLC 60,0 % 0
UNITED STATES (Registered Office: Fort Worth)
North Tarrant Infrastructures DBW Construction LLC 25,0 % 0 1
North Tarrant Infrastructures Ferrovial Construction Texas, LLC 75,0 % 0 1
UNITED STATES (Registered Office: Georgia)
North Perimeter Constractors LLC Ferrovial Construction East, LLC 100,0 % 216 1
UNITED STATES (Registered Office: Katy)

SECTION 6: OTHER DISCLOSURES
INTEGRATED ANNUAL REPORT 2021 CONSOLIDATED ANNUAL ACCOUNTS
282
ENTITY TYPE PARENT % OWNERSHIP
NET COST OWNERSHIP
AUDIT.
52 Block Builders Webber Commercial Construction, LLC
100,0 % 0 1
UNITED STATES (Registered Office: Los Angeles)
California Rail Builders Ferrovial Construction West, LLC 80,0 % 0 1
Ferrovial Construction West, LLC Ferrovial Construction US Corp. 100,0 % 0
Great Hall Builders LLC Ferrovial Construction West, LLC 70,0 % 0
UNITED STATES (Registered Office: North Richland Hills)
Bluebonnet Constractor, LLC DBW Construction LLC 40,0 % 0
Bluebonnet Constractor, LLC Ferrovial Construction Texas, LLC 60,0 % 0
UNITED STATES (Registered Office: Suffolk)
US 460 Mobility Partners LLC Ferrovial Construction East, LLC 70,0 % 0
UNITED STATES (Registered Office: The Woodlands) DBW Construction LLC. Webber, LLC 100,0 % 46 1 PLW Waterworks LLC Cadagua US,
LLC 50,0 % 3 1 PLW Waterworks LLC Webber, LLC 50,0 % 3 1
Southern Crushed Concrete LLC Webber Equipment & Materials LLC - Sucursal en España
100,0 % 88 1
W.W. Webber, LLC Ferrovial Construction US Holding Corp. 100,0 % 584 1
Webber Barrier Services Webber, LLC 100,0 % 6 1 Webber Commercial Construction LLC Webber, LLC 99,0 % 7 Webber Equipment & Materials LLC Webber, LLC 100,0 % 240 1
Webber Holdings, LLC Ferrovial Construction US Holding Corp. 100,0 % 0
Webber Management Group LLC Webber Equipment & Materials LLC - Sucursal en España
100,0 % 41 1
UNITED STATES (Registered Office: Virginia)
FAM Construction LLC (I-66) Ferrovial Construction US Corp. 70,0 % 0 1
FRANCE (Registered Office: Paris)
Ferrovial Construction France, S.A. Ferrovial Construction International S.E.
100,0 % 13
NETHERLANDS (Registered Office: Amsterdam) Ferrovial Construction International S.E.
Ferrovial Internacional, S.E. 100,0 % 237 1
INDIA (Registered Office: New Delhi) Cadagua Ferrovial India Pr Ltd Cadagua, S.A.
(a) 95,0 % 0 IRELAND (Registered Office: Dublin)
ENTITY TYPE PARENT % OWNERSHIP
NET COST OWNERSHIP
AUDIT.
Ferrovial Construction Ireland Ltd Ferrovial Construction Holdings Ltd 100,0 % 7 2
MÉXICO (Registered Office: Mexico DF) Cadagua Ferr. Industrial México Cadagua, S.A.
(a) 75,1 % 0
Cadagua Ferr. Industrial México Ferrovial Medio Ambiente y Energía, S.A. (a) 25,0 % 0
Ferrovial Agroman México, S.A. de C.V.
Ferrovial Construction International S.E.
100,0 % 0
NEW ZEALAND (Registered Office: Wellington)
Ferrovial Construction (New Zeeland) Limited
Ferrovial Construcción Australia PTY LTD
100,0 % 1
POLAND (Registered Office: Cracow) Mostostal Kraków S.A. Budimex SA 100,0 % 2 1 Mostostal Kraków Energetyka sp. z o.o. Mostostal
Kraków SA 100,0 % 0 POLAND (Registered Office: Kamieńsk) FBSerwis Kamieńsk Sp. z o.o. FBSerwis SA 80,0 % 0 1 POLAND (Registered Office: Kąty Wrocławskie) FBSerwis Wrocław Sp. z o.o. FBSerwis SA 100,0 % 0 1 POLAND (Registered Office: Ścinawka Dolna) FBSerwis Dolny Sląsk Sp. z o.o. FBSerwis SA 100,0 % 0 1 POLAND (Registered Office: Tarnów) FBSerwis Karpatia Sp. z o.o. FBSerwis SA 100,0 % 0 1 POLAND (Registered Office: Warsaw)
Autostrada, S.A. Ferrovial Construcción, S.A. (a) 1,3 % 0 2
POLAND (Registered Office: Warsaw)
Budimex, S.A. Ferrovial Construction International S.E.
50,1 % 83 1
Bx Budownictwo Sp. z o.o. Budimex SA 100,0 % 0 1 Bx Kolejnictwo SA Budimex SA 100,0 % 13 1 Bx Parking Wrocław Sp. z o.o. Budimex SA 51,0 % 1 1 FBSerwis SA Budimex SA 100,0 % 65 1 FBSerwis A Sp. z o.o. FBSerwis SA 100,0 % 0 FBSerwis B Sp. z o.o. FBSerwis SA 100,0 % 0 FBSerwis Odbiór Sp. z o.o. FBSerwis SA 100,0 % 0 FBSerwis Paliwa Alternatywne Sp. z o.o. FBSerwis SA 100,0 % 0 JZE Sp. z o.o. FBSerwis SA 100,0 % 0 UNITED KINGDOM (Registered Office: London) Ferrovial Construction (UK) Limited
Ferrovial Construction Holdings Ltd 100,0 % 32 1
Ferrovial Construction Holdings Limited
Ferrovial Construction International S.E.
100,0 % 53 1
TOLL ROADS SPAIN (Registered Office: Madrid, Spain) Cintra Infraestructuras España, S.L. (a) Ferrovial, S.A.
(a) 99,0 % 657 1 Cintra Infraestructuras Irlanda, S.L.U. (a) Cintra Global SE 100,0 % 3 1
Cintra Inversora Autopistas de Cataluña, S.L. (a)(a) P
Cintra Infraestructuras España, S.L. (a) 100,0 % 0 1
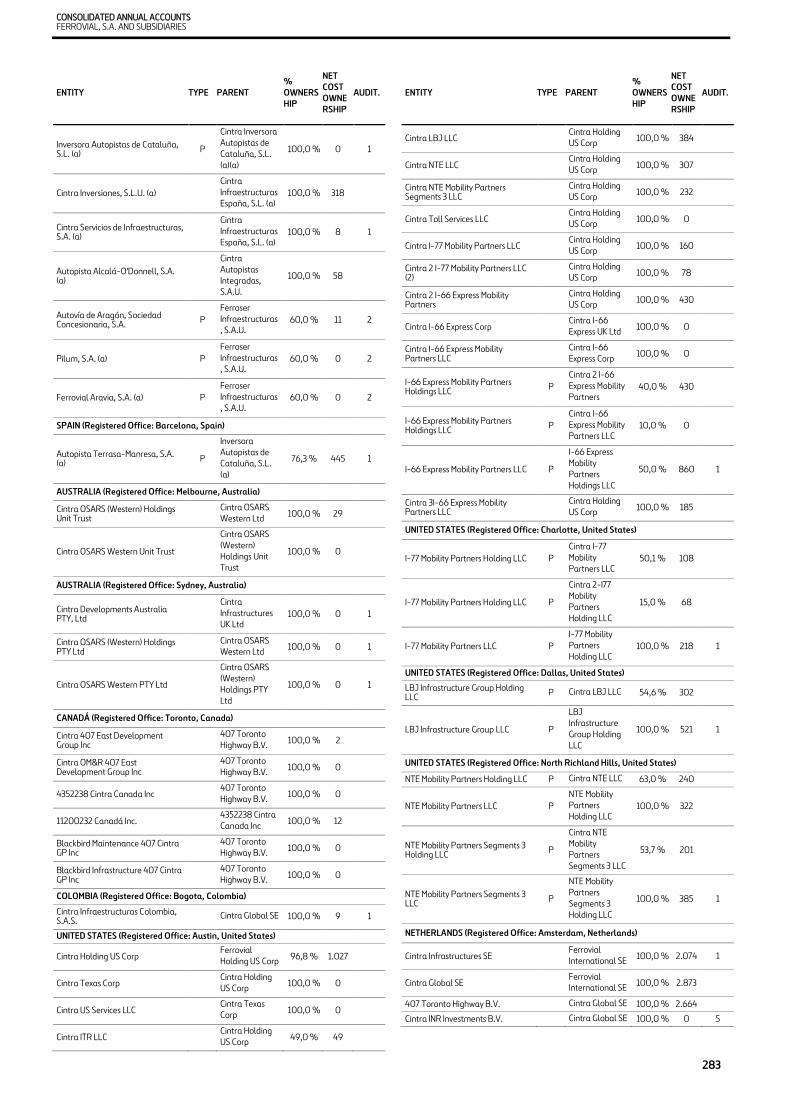
CONSOLIDATED ANNUAL ACCOUNTS FERROVIAL, S.A. AND SUBSIDIARIES
283
ENTITY TYPE PARENT % OWNERSHIP
NET COST OWNERSHIP
AUDIT.
Inversora Autopistas de Cataluña, S.L. (a) P
Cintra Inversora Autopistas de Cataluña, S.L. (a)(a)
100,0 % 0 1
Cintra Inversiones, S.L.U. (a) Cintra Infraestructuras España, S.L. (a) 100,0 % 318
Cintra Servicios de Infraestructuras, S.A. (a)
Cintra Infraestructuras España, S.L. (a) 100,0 % 8 1
Autopista Alcalá-O'Donnell, S.A. (a)
Cintra Autopistas Integradas, S.A.U.
100,0 % 58
Autovía de Aragón, Sociedad Concesionaria, S.A. P
Ferroser Infraestructuras, S.A.U. 60,0 % 11 2
Pilum, S.A. (a) P Ferroser Infraestructuras, S.A.U. 60,0 % 0 2
Ferrovial Aravia, S.A. (a) P Ferroser Infraestructuras, S.A.U. 60,0 % 0 2
SPAIN (Registered Office: Barcelona, Spain)
Autopista Terrasa-Manresa, S.A. (a) P
Inversora Autopistas de Cataluña, S.L. (a)
76,3 % 445 1
AUSTRALIA (Registered Office: Melbourne, Australia) Cintra OSARS (Western) Holdings Unit Trust Cintra OSARS
Western Ltd 100,0 % 29
Cintra OSARS Western Unit Trust Cintra OSARS (Western) Holdings Unit Trust
100,0 % 0
AUSTRALIA (Registered Office: Sydney, Australia) Cintra Developments Australia PTY, Ltd
Cintra Infrastructures UK Ltd 100,0 % 0 1
Cintra OSARS (Western) Holdings PTY Ltd Cintra OSARS
Western Ltd 100,0 % 0 1
Cintra OSARS Western PTY Ltd Cintra OSARS (Western) Holdings PTY Ltd
100,0 % 0 1
CANADÁ (Registered Office: Toronto, Canada) Cintra 407 East Development Group Inc 407 Toronto
Highway B.V. 100,0 % 2 Cintra OM&R 407 East Development Group Inc 407 Toronto
Highway B.V. 100,0 % 0 4352238 Cintra Canada Inc 407 Toronto
Highway B.V. 100,0 % 0 11200232 Canadá Inc. 4352238 Cintra
Canada Inc 100,0 % 12 Blackbird Maintenance 407 Cintra GP Inc 407 Toronto
Highway B.V. 100,0 % 0 Blackbird Infrastructure 407 Cintra GP Inc 407 Toronto
Highway B.V. 100,0 % 0 COLOMBIA (Registered Office: Bogota, Colombia) Cintra Infraestructuras Colombia, S.A.S. Cintra Global SE 100,0 % 9 1 UNITED STATES (Registered Office: Austin, United States) Cintra Holding US Corp Ferrovial
Holding US Corp 96,8 % 1.027 Cintra Texas Corp Cintra Holding
US Corp 100,0 % 0 Cintra US Services LLC Cintra Texas
Corp 100,0 % 0 Cintra ITR LLC Cintra Holding
US Corp 49,0 % 49
ENTITY TYPE PARENT % OWNERSHIP
NET COST OWNERSHIP
AUDIT.
Cintra LBJ LLC Cintra Holding US Corp 100,0 % 384
Cintra NTE LLC Cintra Holding US Corp 100,0 % 307
Cintra NTE Mobility Partners Segments 3 LLC Cintra Holding
US Corp 100,0 % 232 Cintra Toll Services LLC Cintra Holding
US Corp 100,0 % 0 Cintra I-77 Mobility Partners LLC Cintra Holding
US Corp 100,0 % 160 Cintra 2 I-77 Mobility Partners LLC (2) Cintra Holding
US Corp 100,0 % 78 Cintra 2 I-66 Express Mobility Partners Cintra Holding
US Corp 100,0 % 430 Cintra I-66 Express Corp Cintra I-66
Express UK Ltd 100,0 % 0 Cintra I-66 Express Mobility Partners LLC Cintra I-66
Express Corp 100,0 % 0 I-66 Express Mobility Partners Holdings LLC P
Cintra 2 I-66 Express Mobility Partners 40,0 % 430
I-66 Express Mobility Partners Holdings LLC P
Cintra I-66 Express Mobility Partners LLC 10,0 % 0
I-66 Express Mobility Partners LLC P I-66 Express Mobility Partners Holdings LLC
50,0 % 860 1
Cintra 3I-66 Express Mobility Partners LLC Cintra Holding
US Corp 100,0 % 185 UNITED STATES (Registered Office: Charlotte, United States)
I-77 Mobility Partners Holding LLC P Cintra I-77 Mobility Partners LLC 50,1 % 108
I-77 Mobility Partners Holding LLC P Cintra 2-I77 Mobility Partners Holding LLC
15,0 % 68
I-77 Mobility Partners LLC P I-77 Mobility Partners Holding LLC 100,0 % 218 1
UNITED STATES (Registered Office: Dallas, United States) LBJ Infrastructure Group Holding LLC P Cintra LBJ LLC 54,6 % 302
LBJ Infrastructure Group LLC P LBJ Infrastructure Group Holding LLC
100,0 % 521 1
UNITED STATES (Registered Office: North Richland Hills, United States) NTE Mobility Partners Holding LLC P Cintra NTE LLC 63,0 % 240 NTE Mobility Partners LLC P
NTE Mobility Partners Holding LLC 100,0 % 322
NTE Mobility Partners Segments 3 Holding LLC P
Cintra NTE Mobility Partners Segments 3 LLC
53,7 % 201
NTE Mobility Partners Segments 3 LLC P
NTE Mobility Partners Segments 3 Holding LLC
100,0 % 385 1
NETHERLANDS (Registered Office: Amsterdam, Netherlands) Cintra Infrastructures SE Ferrovial
International SE 100,0 % 2.074 1
Cintra Global SE Ferrovial International SE 100,0 % 2.873
407 Toronto Highway B.V. Cintra Global SE 100,0 % 2.664 Cintra INR Investments B.V. Cintra Global SE 100,0 % 0 5

SECTION 6: OTHER DISCLOSURES
INTEGRATED ANNUAL REPORT 2021 CONSOLIDATED ANNUAL ACCOUNTS
284
ENTITY TYPE PARENT % OWNERSHIP
NET COST OWNERSHIP
AUDIT.
Cintra Latam Highways B.V. Cintra Infrastructures SE 100,0 % 0
IRELAND (Registered Office: Dublin, Ireland) Financinfrastructures, Ltd Cintra Global SE 100,0 % 32 1
Cinsac, Ltd Cintra Infraestructuras Irlanda, S.L.U. (a)
100,0 % 0 1
POLAND (Registered Office: Warsaw, Poland) Autostrada Poludnie, S.A.
Cintra Infrastructures SE 93,6 % 13 2
PORTUGAL (Registered Office: Lisboa, Portugal)
Vialivre, S.A. P Cintra Infrastructures SE 84,0 % 0 1
PORTUGAL (Registered Office: Ribeira Grande, Portugal)
Euroscut Açores, S.A. P Cintra Infrastructures SE 89,2 % 13 1
UNITED KINGDOM (Registered Office: London, United Kingdom)
Cintra Silvertown Ltd Cintra Infrastructures UK Ltd 100,0 % 0 1
UNITED KINGDOM (Registered Office: Oxford, United Kingdom) Cintra Infrastructures UK Ltd Cintra Global SE 100,0 % 44 1
Cintra Toowoomba Ltd Cintra Infrastructures UK Ltd 100,0 % 7 1
Cintra UK I-77 Ltd Ferrovial Holding US Corp 100,0 % 0 1
Cintra Slovakia Ltd Cintra Global SE 100,0 % 1 1 Cintra I-66 Express UK Ltd Ferrovial
Holding US Corp 100,0 % 0 1
Cintra OSARS Western Ltd Cintra Infrastructures UK Ltd 100,0 % 29 1
AIRPORTS SPAIN (Registered Office: Madrid, Spain) Ferrovial Aeropuertos España, S.A. (a) Ferrovial, S.A.
(a) 100,0 % 0 BRASIL (Registered Office: São Paulo, Brasil)
Ferrovial Aeroportos Brasil Ltda. Ferrovial Airports International, S.E.
100,0 % 0
UNITED STATES (Registered Office: Austin, United States) Ferrovial Airports Holding US Corp Ferrovial
Holding US Corp 100,0 % 0
Ferrovial Vertiports US LLC Ferrovial Airports Holding US Corp 100,0 % 0
Ferrovial Vertiports Florida LLC P Ferrovial Vertiports US LLC 100,0 % 0
UNITED STATES (Registered Office: Denver, United States)
Ferrovial Airports Denver Corp P Ferrovial Airports Denver UK Ltd. 100,0 % 0
Ferrovial Airports Great Hall Partners LLC P
Ferrovial Airports Denver Corp 100,0 % 0
NETHERLANDS (Registered Office: Amsterdam, Netherlands)
ENTITY TYPE PARENT % OWNERSHIP
NET COST OWNERSHIP
AUDIT.
Hubco Netherlands B.V. Ferrovial International, S.E. 100,0 % 734
FERROVIAL AIRPORTS FMM BV Ferrovial Airports International, S.E.
100,0 % 0
UNITED KINGDOM (Registered Office: Oxford, United Kingdom)
Faero UK Holding Limited Hubco Netherlands B.V. 100,0 % 233 1
Ferrovial Airports International, S.E.
Ferrovial International, S.E. 100,0 % 1.219 1
Ferrovial Airports Denver UK Ltd. Ferrovial Airports International, S.E.
100,0 % 1 1
OTHER ACTIVITIES ENERGY INFRAESTRUCTURES AND MOBILITY SPAIN (Registered Office: Madrid, Spain)
Ferrovial Transco España , S.A.U. (a) P
Ferrovial Transco International B.V.
100,0 % 18
Ferrovial Infraestructuras Energéticas, S.A.U. (a) Ferrovial, S.A.
(a) 100,0 % 11
Parque Solar Casilla, S.L.U. P Ferrovial Infraestructuras Energéticas, S.A.U. (a)
100,0 % 9
Ferrovial Mobility, S.L. (a) Ferrovial, S.A. (a) 100,0 % 15
CHILE (Registered Office: Santiago, Chile)
Ferrovial Power Infrastructure Chile, SpA P
Ferrovial Transco España , S.A.U. (a) 34,1 % 18 1
Ferrovial Power Infrastructure Chile, SpA P
Ferrovial Transco International B.V.
65,9 % 65 1
Ferrovial Transco Chile II SpA P Ferrovial Power Infraestructure Chile, SpA 100,0 % 0
Transchile Charrúa Transmisión, S.A. P
Ferrovial Power Infraestructure Chile, SpA 99,9 % 59 1
Ferrovial Transco Chile III SPA P Ferrovial Transco International, B.V.
100,0 % 0
Ferrovial Transco Chile IV SpA P Ferrovial Power Infraestructure Chile, SpA 100,0 % 0
Centella Transmisión, S.A. P Ferrovial Transco Chile III SPA 49,9 % 0 1
Centella Transmisión, S.A. P Ferrovial Power Infrastructure Chile, SpA 50,1 % 0 1
UNITED STATES (Registered Office: Austin, United States) Ferrovial Mobility U.S., LLC Ferrovial
Holding US Corp 100,0 % 2 NETHERLANDS (Registered Office: Amsterdam, Netherlands)
Ferrovial Transco International B.V. Ferrovial International, S.E. 100,0 % 81 1
WASTE TREATMENT

CONSOLIDATED ANNUAL ACCOUNTS FERROVIAL, S.A. AND SUBSIDIARIES
285
ENTITY TYPE PARENT % OWNERSHIP
NET COST OWNERSHIP
AUDIT.
UNITED KINGDOM (Registered Office: London, United Kingdom) Thalia Waste Management Limited (*)
Amey LG Ltd / Thalia Holdco Ltd
50% / 50% 0 1
Thalia MK ODC Limited (*) Waste Management Limited 100,0 % 0 1
Thalia AWRP ODC Limited (*) Waste Management Limited 100,0 % 0 1
Thalia WB HoldCo Limited (*) Waste Management Limited 100,0 % 21 1
Thalia WB ODC Limited (*) WB HoldCo Limited 100,0 % 1
Thalia WB Services Limited (*) WB ODC Limited 100,0 % 84 1
Thalia WB SPV Limited (*) WB Services Limited 100,0 % 84 1
Thalia IOW SPV Limited (*) Amey Ventures Asset Holdings Ltd 100,0 % 8 1
Thalia MK HoldCo Limited (*) Amey Ventures Asset Holdings Ltd / Thalia Ventures Ltd
50% / 50% 42 1
Thalia MK SPV Limited (*) MK HoldCo Limited 100,0 % 42 1
Thalia Ventures Limited (*) Holdco Ltd 100,0 % 24 1
Thalia IOW ODC Ltd (*) Waste Management Limited 100,0 % 84 1
Thalia Holdco Ltd (*) Waste Treatment BV 100,0 % 7.962 1
DISCONTINUED OPERATIONS SERVICES AUSTRALIA (Registered Office: Melbourne, Australia) Amey Consulting Australia Pty Ltd Amey OW Ltd 100,0 % 0 SPAIN (Registered Office: Madrid, Spain) Ferrovial Servicios, S.A. (a)
Ferrovial International, S.E. 100,0 % 265 2
Ferrovial Servicios Logistica, S.A. Ferrovial Servicios, S.A. (a) 99,0 % 0
Ferrovial Servicios Participadas, S.L. (a)
Ferrovial Servicios, S.A. (a) 100,0 % 2
Ferroser Servicios Auxiliares, S.A. (a)
Ferrovial Servicios, S.A. (a) 99,5 % 10 2
Ferroser Infraestructuras, S.A. (a) Ferrovial Servicios, S.A. (a) 100,0 % 10 2
Ferrovial Servicios Transporte Asistencial, S.A. (a)
Ferrovial Servicios, S.A. (a) 99,0 % 1
SPAIN (Registered Office: Málaga, Spain)
Andaluza de Señalizaciones, S.A. Ferroser Infraestructuras, S.A.U. 99,0 % 0
SPAIN (Registered Office: Santander, Spain)
Smart Hospital Cantabria, S.A. (a) P Ferrovial Servicios, S.A. (a) 85,0 % 8 2
SPAIN (Registered Office: Valladolid, Spain)
ENTITY TYPE PARENT % OWNERSHIP
NET COST OWNERSHIP
AUDIT.
Maviva Valladolid, S.L. (a) Ferrovial Servicios Logistica, S.A. 99,7 % 0
SPAIN (Registered Office: Vigo, Spain)
Maviva, S.A. (a) Ferrovial Servicios Logistica, S.A. 100,0 % 9 2
Maviva Servicios Globales, S.L. (a) Ferrovial Servicios Logistica, S.A. 99,4 % 0
Almacenes Servicios y Recuperaciones, S.L.
Ferrovial Servicios Logistica, S.A. 99,7 % 1 2
NETHERLANDS (Registered Office: Amsterdam, Netherlands) Ferrovial Services Netherlands B.V. Ferrovial, S.A.
(a) 100,0 % 1 2
Ferrovial Services International, S.E.
Ferrovial International, S.E. 100,0 % 59 2
AUSTRALIA (Registered Office: Melbourne, Australia) Amey Consulting Australia Pty Ltd Amey OW Ltd 100,0 % 0 CHILE (Registered Office: Antofagasta, Chile)
Berliam S.p.A. Ferrovial Servicios Chile, SpA 65,1 % 21 2
Berliam S.p.A. Inversiones Chile Ltda 34,9 % 11 2
CHILE (Registered Office: Los Andes, Chile)
Steel Ingenieria, S.A. Ferrovial Servicios Chile SPA 99,9 % 25 2
Ferrovial Servicios Chile SPA Ferrovial Services International S.E
100,0 % 12
CHILE (Registered Office: Santiago, Chile) Ferrovial Servicios Ambientales Berliam S.p.A. 99,7 % 3 2 Inversiones (Chile) Holdings Limitada
Ferrovial Servicios Chile SpA 100,0 % 3 2
Inversiones (Chile) Limitada Inversiones (Chile) Holding Limitada 100,0 % 1
Ferrovial Servicios Salud, SpA Ferrovial Servicios Chile SPA 100,0 % 0
UNITED STATES (Registered Office: Houston, United States) Amey Consulting USA, Inc. Amey OW Ltd 100,0 % 0 PORTUGAL (Registered Office: Porto, Portugal) Maviva Portugalia S.R.L.
Ferrovial Servicios Logistica, S.A. 100,0 % 1
QATAR (Registered Office: Doha, Qatar) Amey Consulting LLC Amey OW Ltd 49,0 % 0 UNITED KINGDOM (Registered Office: Glasgow, United Kingdom) Byzak Contractors (Scotland) Ltd Byzak Ltd 100,0 % 0 C.F.M Building Services Ltd
Enterprise Managed Services Ltd 100,0 % 4 2
UNITED KINGDOM (Registered Office: London, United Kingdom)
Amey UK plc (a) Ferrovial Services Netherlands B.V.i.o
100,0 % 76 2
Amey Holdings Ltd Amey UK plc 100,0 % 426 2 Amey plc Amey Holdings
Ltd 100,0 % 426 2
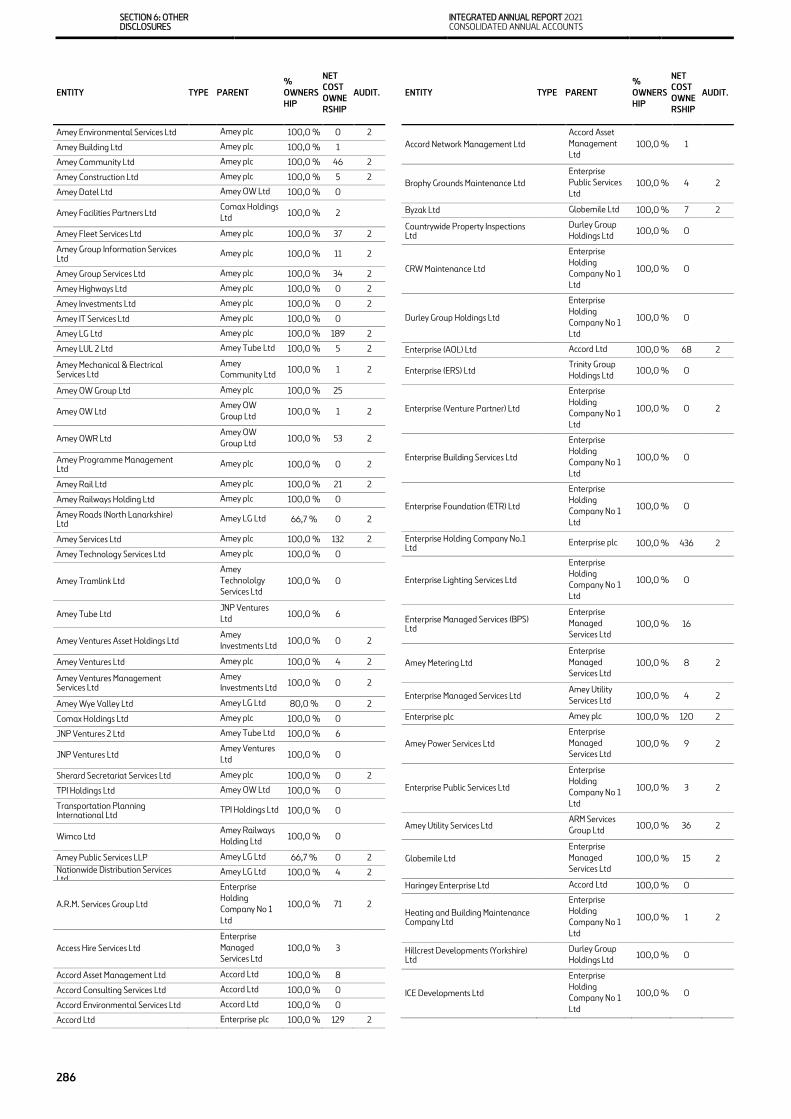
SECTION 6: OTHER DISCLOSURES
INTEGRATED ANNUAL REPORT 2021 CONSOLIDATED ANNUAL ACCOUNTS
286
ENTITY TYPE PARENT % OWNERSHIP
NET COST OWNERSHIP
AUDIT.
Amey Environmental Services Ltd Amey plc 100,0 % 0 2 Amey Building Ltd Amey plc 100,0 % 1 Amey Community Ltd Amey plc 100,0 % 46 2 Amey Construction Ltd Amey plc 100,0 % 5 2 Amey Datel Ltd Amey OW Ltd 100,0 % 0 Amey Facilities Partners Ltd Comax Holdings
Ltd 100,0 % 2 Amey Fleet Services Ltd Amey plc 100,0 % 37 2 Amey Group Information Services Ltd Amey plc 100,0 % 11 2 Amey Group Services Ltd Amey plc 100,0 % 34 2 Amey Highways Ltd Amey plc 100,0 % 0 2 Amey Investments Ltd Amey plc 100,0 % 0 2 Amey IT Services Ltd Amey plc 100,0 % 0 Amey LG Ltd Amey plc 100,0 % 189 2 Amey LUL 2 Ltd Amey Tube Ltd 100,0 % 5 2 Amey Mechanical & Electrical Services Ltd Amey
Community Ltd 100,0 % 1 2 Amey OW Group Ltd Amey plc 100,0 % 25 Amey OW Ltd Amey OW
Group Ltd 100,0 % 1 2
Amey OWR Ltd Amey OW Group Ltd 100,0 % 53 2
Amey Programme Management Ltd Amey plc 100,0 % 0 2 Amey Rail Ltd Amey plc 100,0 % 21 2 Amey Railways Holding Ltd Amey plc 100,0 % 0 Amey Roads (North Lanarkshire) Ltd Amey LG Ltd 66,7 % 0 2 Amey Services Ltd Amey plc 100,0 % 132 2 Amey Technology Services Ltd Amey plc 100,0 % 0 Amey Tramlink Ltd
Amey Technololgy Services Ltd 100,0 % 0
Amey Tube Ltd JNP Ventures Ltd 100,0 % 6
Amey Ventures Asset Holdings Ltd Amey Investments Ltd 100,0 % 0 2
Amey Ventures Ltd Amey plc 100,0 % 4 2 Amey Ventures Management Services Ltd Amey
Investments Ltd 100,0 % 0 2 Amey Wye Valley Ltd Amey LG Ltd 80,0 % 0 2 Comax Holdings Ltd Amey plc 100,0 % 0 JNP Ventures 2 Ltd Amey Tube Ltd 100,0 % 6 JNP Ventures Ltd Amey Ventures
Ltd 100,0 % 0 Sherard Secretariat Services Ltd Amey plc 100,0 % 0 2 TPI Holdings Ltd Amey OW Ltd 100,0 % 0 Transportation Planning International Ltd TPI Holdings Ltd 100,0 % 0 Wimco Ltd Amey Railways
Holding Ltd 100,0 % 0 Amey Public Services LLP Amey LG Ltd 66,7 % 0 2 Nationwide Distribution Services Ltd Amey LG Ltd 100,0 % 4 2
A.R.M. Services Group Ltd Enterprise Holding Company No 1 Ltd
100,0 % 71 2
Access Hire Services Ltd Enterprise Managed Services Ltd 100,0 % 3
Accord Asset Management Ltd Accord Ltd 100,0 % 8 Accord Consulting Services Ltd Accord Ltd 100,0 % 0 Accord Environmental Services Ltd Accord Ltd 100,0 % 0 Accord Ltd Enterprise plc 100,0 % 129 2
ENTITY TYPE PARENT % OWNERSHIP
NET COST OWNERSHIP
AUDIT.
Accord Network Management Ltd Accord Asset Management Ltd 100,0 % 1
Brophy Grounds Maintenance Ltd Enterprise Public Services Ltd 100,0 % 4 2
Byzak Ltd Globemile Ltd 100,0 % 7 2 Countrywide Property Inspections Ltd Durley Group
Holdings Ltd 100,0 % 0
CRW Maintenance Ltd Enterprise Holding Company No 1 Ltd
100,0 % 0
Durley Group Holdings Ltd Enterprise Holding Company No 1 Ltd
100,0 % 0
Enterprise (AOL) Ltd Accord Ltd 100,0 % 68 2 Enterprise (ERS) Ltd Trinity Group
Holdings Ltd 100,0 % 0
Enterprise (Venture Partner) Ltd Enterprise Holding Company No 1 Ltd
100,0 % 0 2
Enterprise Building Services Ltd Enterprise Holding Company No 1 Ltd
100,0 % 0
Enterprise Foundation (ETR) Ltd Enterprise Holding Company No 1 Ltd
100,0 % 0
Enterprise Holding Company No.1 Ltd Enterprise plc 100,0 % 436 2
Enterprise Lighting Services Ltd Enterprise Holding Company No 1 Ltd
100,0 % 0
Enterprise Managed Services (BPS) Ltd
Enterprise Managed Services Ltd 100,0 % 16
Amey Metering Ltd Enterprise Managed Services Ltd 100,0 % 8 2
Enterprise Managed Services Ltd Amey Utility Services Ltd 100,0 % 4 2
Enterprise plc Amey plc 100,0 % 120 2
Amey Power Services Ltd Enterprise Managed Services Ltd 100,0 % 9 2
Enterprise Public Services Ltd Enterprise Holding Company No 1 Ltd
100,0 % 3 2
Amey Utility Services Ltd ARM Services Group Ltd 100,0 % 36 2
Globemile Ltd Enterprise Managed Services Ltd 100,0 % 15 2
Haringey Enterprise Ltd Accord Ltd 100,0 % 0 Heating and Building Maintenance Company Ltd
Enterprise Holding Company No 1 Ltd
100,0 % 1 2
Hillcrest Developments (Yorkshire) Ltd Durley Group
Holdings Ltd 100,0 % 0
ICE Developments Ltd Enterprise Holding Company No 1 Ltd
100,0 % 0
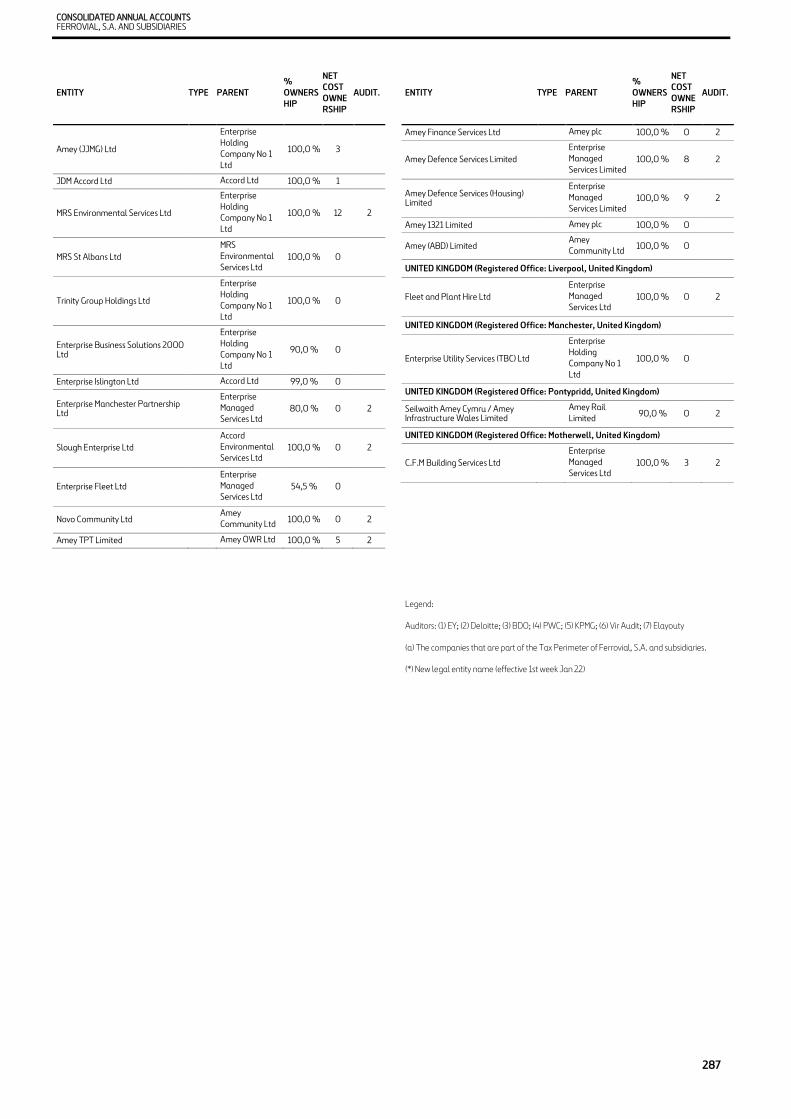
CONSOLIDATED ANNUAL ACCOUNTS FERROVIAL, S.A. AND SUBSIDIARIES
287
ENTITY TYPE PARENT % OWNERSHIP
NET COST OWNERSHIP
AUDIT.
Amey (JJMG) Ltd Enterprise Holding Company No 1 Ltd
100,0 % 3
JDM Accord Ltd Accord Ltd 100,0 % 1
MRS Environmental Services Ltd Enterprise Holding Company No 1 Ltd
100,0 % 12 2
MRS St Albans Ltd MRS Environmental Services Ltd 100,0 % 0
Trinity Group Holdings Ltd Enterprise Holding Company No 1 Ltd
100,0 % 0
Enterprise Business Solutions 2000 Ltd
Enterprise Holding Company No 1 Ltd
90,0 % 0
Enterprise Islington Ltd Accord Ltd 99,0 % 0 Enterprise Manchester Partnership Ltd
Enterprise Managed Services Ltd 80,0 % 0 2
Slough Enterprise Ltd Accord Environmental Services Ltd 100,0 % 0 2
Enterprise Fleet Ltd Enterprise Managed Services Ltd 54,5 % 0
Novo Community Ltd Amey Community Ltd 100,0 % 0 2
Amey TPT Limited Amey OWR Ltd 100,0 % 5 2
ENTITY TYPE PARENT % OWNERSHIP
NET COST OWNERSHIP
AUDIT.
Amey Finance Services Ltd Amey plc 100,0 % 0 2
Amey Defence Services Limited Enterprise Managed Services Limited 100,0 % 8 2
Amey Defence Services (Housing) Limited
Enterprise Managed Services Limited 100,0 % 9 2
Amey 1321 Limited Amey plc 100,0 % 0 Amey (ABD) Limited Amey
Community Ltd 100,0 % 0 UNITED KINGDOM (Registered Office: Liverpool, United Kingdom)
Fleet and Plant Hire Ltd Enterprise Managed Services Ltd 100,0 % 0 2
UNITED KINGDOM (Registered Office: Manchester, United Kingdom)
Enterprise Utility Services (TBC) Ltd Enterprise Holding Company No 1 Ltd
100,0 % 0
UNITED KINGDOM (Registered Office: Pontypridd, United Kingdom) Seilwaith Amey Cymru / Amey Infrastructure Wales Limited Amey Rail
Limited 90,0 % 0 2 UNITED KINGDOM (Registered Office: Motherwell, United Kingdom)
C.F.M Building Services Ltd Enterprise Managed Services Ltd 100,0 % 3 2
Legend:
Auditors: (1) EY; (2) Deloitte; (3) BDO; (4) PWC; (5) KPMG; (6) Vir Audit; (7) Elayouty
(a) The companies that are part of the Tax Perimeter of Ferrovial, S.A. and subsidiaries.
(*) New legal entity name (effective 1st week Jan 22)

SECTION 6: OTHER DISCLOSURES
INTEGRATED ANNUAL REPORT 2021 CONSOLIDATED ANNUAL ACCOUNTS
288
Appendix II. Associates (companies accounted for using the equity method) (millions of euros) ENTITY TYPE PARENT %
OWNERSHIP VALUE
EQUITY METHOD
ASSETS
LIABILITIE
S REVEN
UES RESUL
TS AUDIT. MOBILITY SPAIN Car Sharing Mobility Services, S.L. P Ferrovial Mobility,
S.L.U. 50,0 % 5 17 5 6 -6 FRANCE Car Sharing & Mobility Services France, S.A.S P Car Sharing Mobility
Services, S.L. 50,0 % 1 4 3 2 -4 CONSTRUCTION SPAIN Via Olmedo Pedralba, S.A. P Ferrovial
Construccion, S.A. 25,2 % 1 6 3 4 0 3 Boremer, S.A. Cadagua, S.A. 50,0 % 1 2 1 0 1 2 UNITED STATES Pepper Lawson Horizon Intl. Group Webber Commercial
Construction LLC 70,0 % 0 2 2 0 0 OMAN International Water Treatment LLC Cadagua, S.A. 37,5 % 0 0 5 0 0 4 POLAND PPHU Promos Sp. z o.o. Budimex SA 26,3 % 0 3 2 3 0 AIRPORTS UNITED KINGDOM FGP Topco Limited P Hubco Netherlands
B.V. 25,0 % 0 23.216 26.934 1.414 1.651 4
AGS Airports Holdings Limited P Faero UK Holding Limited 50,0 % 0 1.512 1.484 101 -141 2
QATAR FMM Company LLC P Ferrovial Servicios
S.A.U. 49,0 % 17 62 21 64 9 TOLL ROADS AUSTRALIA Nexus Infrastructure Holdings Unit Trust P Cintra Toowoomba
Ltd 40,0 % 3 1 0 0 0 Nexus Infrastructure Unit Trust P Nexus Infrastructure
Holdings Unit Trust 40,0 % 10 42 17 33 6 Nexus Infrastructure Holdings PTY Ltd P Cintra Toowoomba
Ltd 40,0 % 0 0 0 0 0 Nexus Infrastructure PTY Ltd P Nexus Infrastructure
Holdings PTY Ltd 40,0 % 0 0 0 0 0 Netflow Osars (Western) GP P Cintra Osars
(Western) Unit Trust 50,0 % 36 139 72 66 5
ENTITY TYPE PARENT % OWNERSHIP
VALUE EQUITY
METHOD ASSET
S LIABILITIE
S REVEN
UES RESUL
TS AUDIT. SPAIN Serranopark, S.A. P
Cintra Infraestructuras España, S.L.
50,0 % 0 76 59 6 5 2
Sociedad Concesionaria Autovía de la Plata, S.A. P Cintra
Infrastructures SE 25,0 % 16 231 168 25 12 2
Bip & Drive, S.A. P Cintra Infraestructuras España, S.L.
20,0 % 3 25 11 223 2
Autopista del Sol, C.E.S.A. P Cintra Infraestructuras España, S.L.
15,0 % 0 0 0 0 0 Empresa Mant. y Explotación M30, S.A. Ferrovial Servicios,
S.A. 50,0 % -34 222 222 30 12 5
Madrid Calle 30, S.A. P Empresa Mant. y Explotación M30, S A
20,0 % 51 627 126 123 54 8 CANADÁ 407 International Inc P 4352238 Cintra
Canada Inc 43,2 % 1.205 3.716 7.258 692 144 407 East Development Group General Partnership P
Cintra 407 East Development Group Inc
50,0 % 14 159 102 10 3
OM&R 407 East Development Group General Partnership P
Cintra OM&R 407 East Development Group Inc
50,0 % 1 6 4 5 1
Blackbird Maintenance 407 GP P Blackbird Maintenance 407 Cintra GP Inc
50,0 % 0 5 4 4 0 3
Blackbird Infrastructures 407 GP P Blackbird Infrastructures 407 Cintra GP Inc
50,0 % 14 100 73 7 1 3
COLOMBIA Concesionaria Ruta del Cacao S.A.S. P
Cintra Infraestructuras Colombia S.A.S.
30,0 % 11 625 587 143 4 2
SLOVAKIA Zero Bypass Limited, Organizacna Zloska P Zero Bypass Ltd 35,0 % 0 0 0 0 0 NETHERLANDS Algarve International B.V. (1) P Cintra
Infrastructures SE 20,0 % 0 105 104 0 0 INDIA
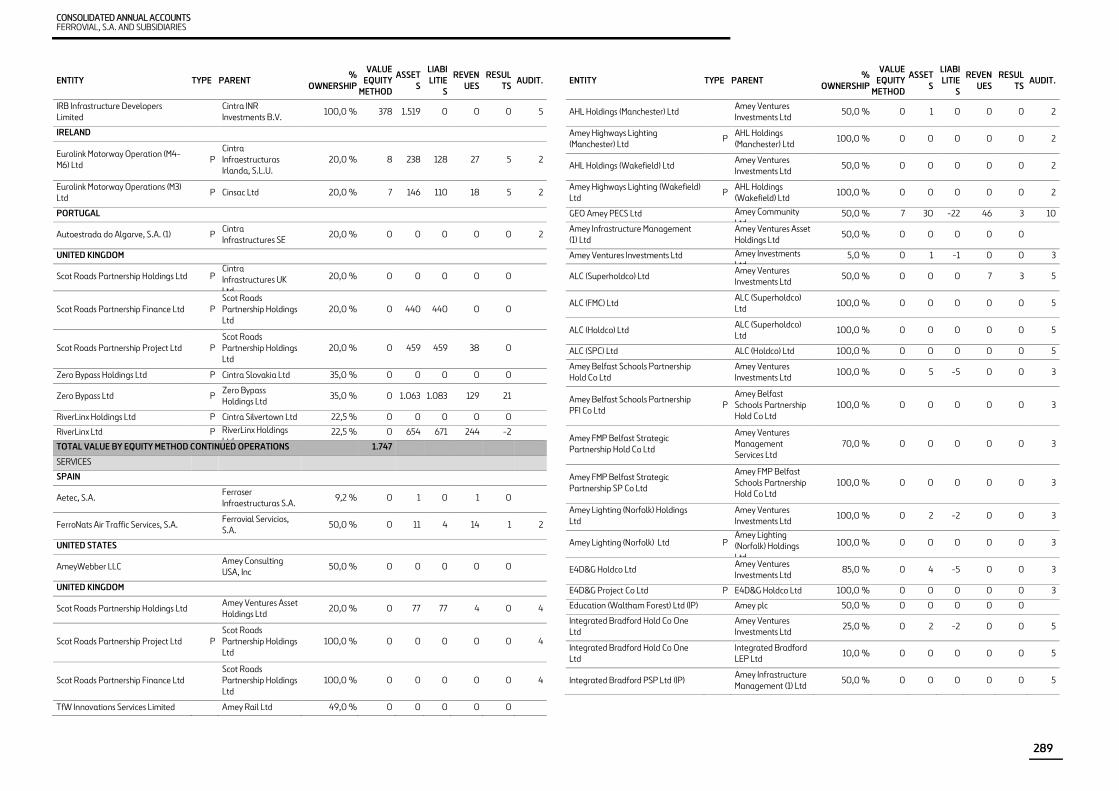
CONSOLIDATED ANNUAL ACCOUNTS FERROVIAL, S.A. AND SUBSIDIARIES
289
ENTITY TYPE PARENT % OWNERSHIP
VALUE EQUITY
METHOD ASSET
S LIABILITIE
S REVEN
UES RESUL
TS AUDIT. IRB Infrastructure Developers Limited Cintra INR
Investments B.V. 100,0 % 378 1.519 0 0 0 5 IRELAND Eurolink Motorway Operation (M4-M6) Ltd P
Cintra Infraestructuras Irlanda, S.L.U.
20,0 % 8 238 128 27 5 2
Eurolink Motorway Operations (M3) Ltd P Cinsac Ltd 20,0 % 7 146 110 18 5 2 PORTUGAL Autoestrada do Algarve, S.A. (1) P Cintra
Infrastructures SE 20,0 % 0 0 0 0 0 2 UNITED KINGDOM Scot Roads Partnership Holdings Ltd P Cintra
Infrastructures UK Ltd
20,0 % 0 0 0 0 0
Scot Roads Partnership Finance Ltd P Scot Roads Partnership Holdings Ltd
20,0 % 0 440 440 0 0
Scot Roads Partnership Project Ltd P Scot Roads Partnership Holdings Ltd
20,0 % 0 459 459 38 0 Zero Bypass Holdings Ltd P Cintra Slovakia Ltd 35,0 % 0 0 0 0 0 Zero Bypass Ltd P Zero Bypass
Holdings Ltd 35,0 % 0 1.063 1.083 129 21 RiverLinx Holdings Ltd P Cintra Silvertown Ltd 22,5 % 0 0 0 0 0 RiverLinx Ltd P RiverLinx Holdings
Ltd 22,5 % 0 654 671 244 -2 TOTAL VALUE BY EQUITY METHOD CONTINUED OPERATIONS 1.747 SERVICES SPAIN Aetec, S.A. Ferroser
Infraestructuras S.A. 9,2 % 0 1 0 1 0 FerroNats Air Traffic Services, S.A. Ferrovial Servicios,
S.A. 50,0 % 0 11 4 14 1 2 UNITED STATES AmeyWebber LLC Amey Consulting
USA, Inc 50,0 % 0 0 0 0 0 UNITED KINGDOM Scot Roads Partnership Holdings Ltd Amey Ventures Asset
Holdings Ltd 20,0 % 0 77 77 4 0 4
Scot Roads Partnership Project Ltd P Scot Roads Partnership Holdings Ltd
100,0 % 0 0 0 0 0 4
Scot Roads Partnership Finance Ltd Scot Roads Partnership Holdings Ltd
100,0 % 0 0 0 0 0 4
TfW Innovations Services Limited Amey Rail Ltd 49,0 % 0 0 0 0 0
ENTITY TYPE PARENT % OWNERSHIP
VALUE EQUITY
METHOD ASSET
S LIABILITIE
S REVEN
UES RESUL
TS AUDIT.
AHL Holdings (Manchester) Ltd Amey Ventures Investments Ltd 50,0 % 0 1 0 0 0 2
Amey Highways Lighting (Manchester) Ltd P AHL Holdings
(Manchester) Ltd 100,0 % 0 0 0 0 0 2
AHL Holdings (Wakefield) Ltd Amey Ventures Investments Ltd 50,0 % 0 0 0 0 0 2
Amey Highways Lighting (Wakefield) Ltd P AHL Holdings
(Wakefield) Ltd 100,0 % 0 0 0 0 0 2 GEO Amey PECS Ltd Amey Community
Ltd 50,0 % 7 30 -22 46 3 10 Amey Infrastructure Management (1) Ltd Amey Ventures Asset
Holdings Ltd 50,0 % 0 0 0 0 0 Amey Ventures Investments Ltd Amey Investments
Ltd 5,0 % 0 1 -1 0 0 3 ALC (Superholdco) Ltd Amey Ventures
Investments Ltd 50,0 % 0 0 0 7 3 5
ALC (FMC) Ltd ALC (Superholdco) Ltd 100,0 % 0 0 0 0 0 5
ALC (Holdco) Ltd ALC (Superholdco) Ltd 100,0 % 0 0 0 0 0 5
ALC (SPC) Ltd ALC (Holdco) Ltd 100,0 % 0 0 0 0 0 5 Amey Belfast Schools Partnership Hold Co Ltd Amey Ventures
Investments Ltd 100,0 % 0 5 -5 0 0 3
Amey Belfast Schools Partnership PFI Co Ltd P
Amey Belfast Schools Partnership Hold Co Ltd
100,0 % 0 0 0 0 0 3
Amey FMP Belfast Strategic Partnership Hold Co Ltd
Amey Ventures Management Services Ltd
70,0 % 0 0 0 0 0 3
Amey FMP Belfast Strategic Partnership SP Co Ltd
Amey FMP Belfast Schools Partnership Hold Co Ltd
100,0 % 0 0 0 0 0 3
Amey Lighting (Norfolk) Holdings Ltd Amey Ventures
Investments Ltd 100,0 % 0 2 -2 0 0 3
Amey Lighting (Norfolk) Ltd P Amey Lighting (Norfolk) Holdings Ltd
100,0 % 0 0 0 0 0 3
E4D&G Holdco Ltd Amey Ventures Investments Ltd 85,0 % 0 4 -5 0 0 3
E4D&G Project Co Ltd P E4D&G Holdco Ltd 100,0 % 0 0 0 0 0 3 Education (Waltham Forest) Ltd (IP) Amey plc 50,0 % 0 0 0 0 0 Integrated Bradford Hold Co One Ltd Amey Ventures
Investments Ltd 25,0 % 0 2 -2 0 0 5 Integrated Bradford Hold Co One Ltd Integrated Bradford
LEP Ltd 10,0 % 0 0 0 0 0 5
Integrated Bradford PSP Ltd (IP) Amey Infrastructure Management (1) Ltd 50,0 % 0 0 0 0 0 5

SECTION 6: OTHER DISCLOSURES
INTEGRATED ANNUAL REPORT 2021 CONSOLIDATED ANNUAL ACCOUNTS
290
ENTITY TYPE PARENT % OWNERSHIP
VALUE EQUITY
METHOD ASSET
S LIABILITIE
S REVEN
UES RESUL
TS AUDIT. Integrated Bradford Hold Co Two Ltd Amey Infrastructure
Management (1) Ltd 2,0 % 0 4 -4 0 0 5 Integrated Bradford Hold Co Two Ltd Integrated Bradford
LEP Ltd 10,0 % 0 0 0 0 0 5
Integrated Bradford LEP Ltd Integrated Bradford PSP Ltd 80,0 % 0 1 0 0 0 5
Integrated Bradford LEP Fin Co One Ltd Integrated Bradford
LEP Ltd 100,0 % 0 0 0 0 0 5
Integrated Bradford SPV One Ltd P Integrated Bradford Hold Co One Ltd 100,0 % 0 0 0 0 0 5
Integrated Bradford SPV Two Ltd P Integrated Bradford Hold Co Two Ltd 100,0 % 0 0 0 0 0 5
AmeyVTOL Ltd Amey OWR Ltd 60,0 % 0 0 0 0 0 Amey Infrastructure Management (3) Ltd Amey Ventures Asset
Holdings Ltd 10% economic 0 3 -3 0 0 Amey Hallam Highways Holdings Ltd P Amey Infrastructure
Management (3) Ltd 33,0 % 0 8 -9 1 0 3
Amey Hallam Highways Ltd P Amey Hallam Highways Holdings Ltd
100,0 % 0 0 0 0 0 3
AmeyBreathe Limited Amey Community Limited 50,0 % 0 0 0 0 0
Amey Briggs Asset Holdings Limited Amey Ventures Asset Holdings Ltd 50,0 % 0 0 0 0 0
Amey Briggs Assets Limited Amey Ventures Asset Holdings Ltd 100,0 % 0 30 -30 3 0
Amey Briggs Services Holdings Limited Amey Community
Limited 50,0 % 0 2 -2 0 0 Amey Briggs Services Limited Amey Briggs Services
Holdings Limited 100,0 % 0 3 -3 14 0 Keolis Amey Docklands Ltd Amey Rail Ltd 30,0 % 0 23 -19 26 1 2
ENTITY TYPE PARENT % OWNERSHIP
VALUE EQUITY
METHOD ASSET
S LIABILITIE
S REVEN
UES RESUL
TS AUDIT. Keolis Amey Metrolink Ltd Amey Rail Ltd 40,0 % 0 5 -2 27 0 Keolis Amey Rail Ltd Amey Rail Ltd 40,0 % 0 0 0 0 0 Keolis Amey Operations/Gweithrediadau Keolis Amey Ltd
Amey Rail Ltd 36,0 % 0 2 -3 15 0 Keolis Amey Consulting Ltd Amey Rail Ltd 38,0 % 0 0 0 0 0 Amey Roads NI Holdings Ltd Amey Ventures
Investments Ltd 50,0 % 0 6 -6 0 0 3 Amey Roads NI Financial plc Amey Roads NI Ltd 100,0 % 0 0 0 0 0 3 Amey Roads NI Ltd P Amey Roads NI
Holdings Ltd 100,0 % 0 0 0 0 0 3
RSP (Holdings) Ltd Amey Ventures Investments Ltd 35,0 % 0 2 -2 0 0 3
The Renfrewshire Schools Partnership Ltd P RSP (Holdings) Ltd 100,0 % 0 0 0 0 0 3 Services Support (Avon & Somerset) Holdings Ltd Amey Ventures
Investments Ltd 20,0 % 0 1 -1 0 0 3
Services Support (Avon & Somerset) Ltd P
Services Support (Avon & Somerset) Holdings Ltd
100,0 % 0 0 0 0 0 3
WASTE TREATMENT Amey Infrastructure Management (2) Ltd N Amey Ventures Asset
Holdings Ltd 50,0 % 0 28 28 0 -2 1
AWRP Holding Co Limited N Amey Infrastructure Management (2) Ltd 33,3 % 0 0 0 0 0 1
AWRP SPV Limited N AWRP Holding Co Limited 100,0 % 0 228 -223 26 5 1
TOTAL VALUE BY EQUITY METHOD DISCONTINUED OPERATIONS 8 Auditors key:
(1) EY; (2) Deloitte; (3) BDO; (4) PWC; (5) KPMG; (6) Vir Audit; (7) Mazars; (8) PKF; (9) Martins Pereira, Joao Careca & Associados, Sroc.; (10) Grant Thornton UK LLP; (11) 3 Auditores SLP

CONSOLIDATED ANNUAL ACCOUNTS FERROVIAL, S.A. AND SUBSIDIARIES
291
Appendix III. Information by segment The Board of Directors analyses the performance of the Group mainly from a business perspective. From this perspective, the Board assesses the performance of the Construction, Toll roads, Airports and Services segments. Set forth below are the consolidated balance sheet and consolidated income statement for 2021 and 2020, broken down by business segment. The “Other” column includes the assets and/or liabilities and income and/or expenses of the companies not assigned to any of the business segments, including most notably the parent company, Ferrovial, S.A., and its other smaller subsidiaries. The "Adjustments" column reflects inter-segment consolidation eliminations.
Balance sheet by business segment: 2021 (millions of euros).
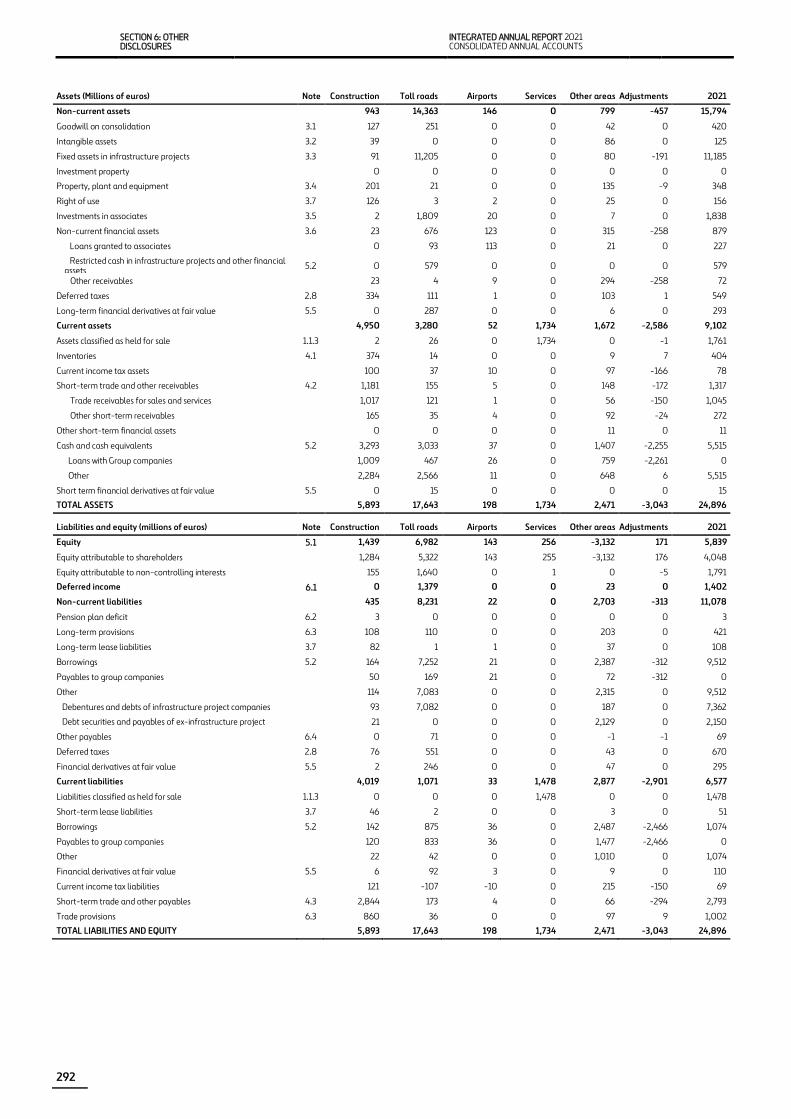
SECTION 6: OTHER DISCLOSURES
INTEGRATED ANNUAL REPORT 2021 CONSOLIDATED ANNUAL ACCOUNTS
292
Assets (Millions of euros) Note Construction Toll roads Airports Services Other areas Adjustments 2021
Non-current assets
943 14,363 146 0 799 -457 15,794
Goodwill on consolidation 3.1 127 251 0 0 42 0 420
Intangible assets 3.2 39 0 0 0 86 0 125
Fixed assets in infrastructure projects 3.3 91 11,205 0 0 80 -191 11,185
Investment property 0 0 0 0 0 0 0
Property, plant and equipment 3.4 201 21 0 0 135 -9 348
Right of use 3.7 126 3 2 0 25 0 156
Investments in associates 3.5 2 1,809 20 0 7 0 1,838
Non-current financial assets 3.6 23 676 123 0 315 -258 879
Loans granted to associates
0 93 113 0 21 0 227
Restricted cash in infrastructure projects and other financial assets 5.2 0 579 0 0 0 0 579
Other receivables
23 4 9 0 294 -258 72
Deferred taxes 2.8 334 111 1 0 103 1 549
Long-term financial derivatives at fair value 5.5 0 287 0 0 6 0 293
Current assets
4,950 3,280 52 1,734 1,672 -2,586 9,102
Assets classified as held for sale 1.1.3 2 26 0 1,734 0 -1 1,761
Inventories 4.1 374 14 0 0 9 7 404
Current income tax assets 100 37 10 0 97 -166 78
Short-term trade and other receivables 4.2 1,181 155 5 0 148 -172 1,317
Trade receivables for sales and services
1,017 121 1 0 56 -150 1,045
Other short-term receivables
165 35 4 0 92 -24 272
Other short-term financial assets
0 0 0 0 11 0 11
Cash and cash equivalents 5.2 3,293 3,033 37 0 1,407 -2,255 5,515
Loans with Group companies 1,009 467 26 0 759 -2,261 0
Other 2,284 2,566 11 0 648 6 5,515
Short term financial derivatives at fair value 5.5 0 15 0 0 0 0 15
TOTAL ASSETS
5,893 17,643 198 1,734 2,471 -3,043 24,896
Liabilities and equity (millions of euros) Note Construction Toll roads Airports Services Other areas Adjustments 2021
Equity 5.1 1,439 6,982 143 256 -3,132 171 5,839
Equity attributable to shareholders
1,284 5,322 143 255 -3,132 176 4,048
Equity attributable to non-controlling interests 155 1,640 0 1 0 -5 1,791
Deferred income 6.1 0 1,379 0 0 23 0 1,402
Non-current liabilities
435 8,231 22 0 2,703 -313 11,078
Pension plan deficit 6.2 3 0 0 0 0 0 3
Long-term provisions 6.3 108 110 0 0 203 0 421
Long-term lease liabilities 3.7 82 1 1 0 37 0 108
Borrowings 5.2 164 7,252 21 0 2,387 -312 9,512
Payables to group companies
50 169 21 0 72 -312 0
Other 114 7,083 0 0 2,315 0 9,512
Debentures and debts of infrastructure project companies 93 7,082 0 0 187 0 7,362
Debt securities and payables of ex-infrastructure project companies 21 0 0 0 2,129 0 2,150
Other payables 6.4 0 71 0 0 -1 -1 69
Deferred taxes 2.8 76 551 0 0 43 0 670
Financial derivatives at fair value 5.5 2 246 0 0 47 0 295
Current liabilities
4,019 1,071 33 1,478 2,877 -2,901 6,577
Liabilities classified as held for sale 1.1.3 0 0 0 1,478 0 0 1,478
Short-term lease liabilities 3.7 46 2 0 0 3 0 51
Borrowings 5.2 142 875 36 0 2,487 -2,466 1,074
Payables to group companies 120 833 36 0 1,477 -2,466 0
Other
22 42 0 0 1,010 0 1,074
Financial derivatives at fair value 5.5 6 92 3 0 9 0 110
Current income tax liabilities
121 -107 -10 0 215 -150 69
Short-term trade and other payables 4.3 2,844 173 4 0 66 -294 2,793
Trade provisions 6.3 860 36 0 0 97 9 1,002
TOTAL LIABILITIES AND EQUITY
5,893 17,643 198 1,734 2,471 -3,043 24,896

CONSOLIDATED ANNUAL ACCOUNTS FERROVIAL, S.A. AND SUBSIDIARIES
293
Balance sheet by business segment: 2020 (millions of euros).
(*) Restated figures (Note 1.1.5)
The detail of total assets by geographical area is as follows:
Assets (Millions of euros) Note Construction Toll roads Airports Services Other areas Adjustments 2020 (*) Non-current assets 1,030 9,268 324 0 617 -425 10,814 Goodwill on consolidation 3.1 180 0 0 0 40 0 220 Intangible assets 3.2 43 1 0 0 52 0 96 Fixed assets in infrastructure projects 3.3 93 6,224 0 0 100 -61 6,356 Investment property 2 0 0 0 0 0 2 Property, plant and equipment 3.4 222 21 0 0 94 4 341 Right of use 3.7 120 3 0 0 14 0 137 Investments in associates 3.5 2 1,492 222 0 11 0 1,727 Non-current financial assets 3.6 22 912 100 0 190 -368 856 Loans granted to associates 3 61 100 0 -1 0 163 Restricted cash in infrastructure projects and other financial assets 5.2 3 650 0 0 1 0 654 Other receivables 16 201 0 0 191 -368 40 Deferred taxes 2.8 346 140 2 0 116 0 604 Long-term financial derivatives at fair value 5.5 0 475 0 0 0 0 475 Current assets 4,994 2,917 73 3,316 3,010 -2,033 12,277 Assets classified as held for sale 1.1.3 117 69 0 3,316 0 0 3,502 Inventories 4.1 675 11 0 0 6 7 699 Current income tax assets 49 18 8 0 32 4 111 Short-term trade and other receivables 4.2 1,142 186 4 0 178 -143 1,367 Trade receivables for sales and services 974 86 1 0 74 -116 1,019 Other short-term receivables 168 100 3 0 105 -29 347 Other short-term financial assets 0 0 0 0 0 0 0 Cash and cash equivalents 5.2 3,010 2,569 60 0 2,788 -1,901 6,526 Loans with Group companies 959 535 52 0 358 -1,904 0 Other 2,050 2,034 7 0 2,430 5 6,526 Short term financial derivatives at fair value 5.5 1 64 1 0 6 0 72 TOTAL ASSETS 6,024 12,185 397 3,316 3,627 -2,458 23,091 Liabilities and equity (millions of euros) Note Construction Toll roads Airports Services Other areas Adjustments 2020 (*) Equity 5.1 1,222 4,698 388 926 -3,667 223 3,790 Equity attributable to shareholders 1,090 4,195 388 916 -3,667 228 3,150 Equity attributable to non-controlling interests 132 503 0 10 0 -5 640 Deferred income 6.1 0 1,257 0 0 24 0 1,281 Non-current liabilities 525 5,824 0 0 3,627 -392 9,584 Pension plan deficit 6.2 4 0 0 0 0 0 4 Long-term provisions 6.3 144 111 0 0 187 0 442 Long-term lease liabilities 3.7 80 2 0 0 11 0 93 Borrowings 5.2 185 5,114 0 0 3,206 -421 8,084 Payables to group companies 55 114 0 0 250 -419 0 Other 130 5,000 0 0 2,956 -2 8,084 Debentures and debts of infrastructure project companies 87 4,999 0 0 106 0 5,192 Debt securities and payables of ex-infrastructure project
42 0 0 0 2,850 0 2,892 Other payables 6.4 4 30 0 0 0 29 63 Deferred taxes 2.8 103 225 0 0 123 0 451 Financial derivatives at fair value 5.5 5 342 0 0 100 0 447 Current liabilities 4,277 406 9 2,390 3,643 -2,289 8,435 Liabilities classified as held for sale 1.1.3 86 0 0 2,390 0 0 2,476 Short-term lease liabilities 3.7 63 1 0 0 4 0 68 Borrowings 5.2 217 196 7 0 3,363 -2,105 1,678 Payables to group companies 199 154 7 0 1,746 -2,106 0 Other 18 42 0 0 1,617 1 1,678 Financial derivatives at fair value 5.5 5 41 4 0 2 0 52 Current income tax liabilities 55 -72 -5 0 108 8 94 Short-term trade and other payables 4.3 3,083 122 3 0 112 -204 3,116 Trade provisions 6.3 768 118 0 0 54 12 952 TOTAL LIABILITIES AND EQUITY 6,024 12,185 397 3,316 3,627 -2,458 23,091
(Millions of euros) 2021 2020 (*) CHANGE Spain 2,995 6,640 -3,646
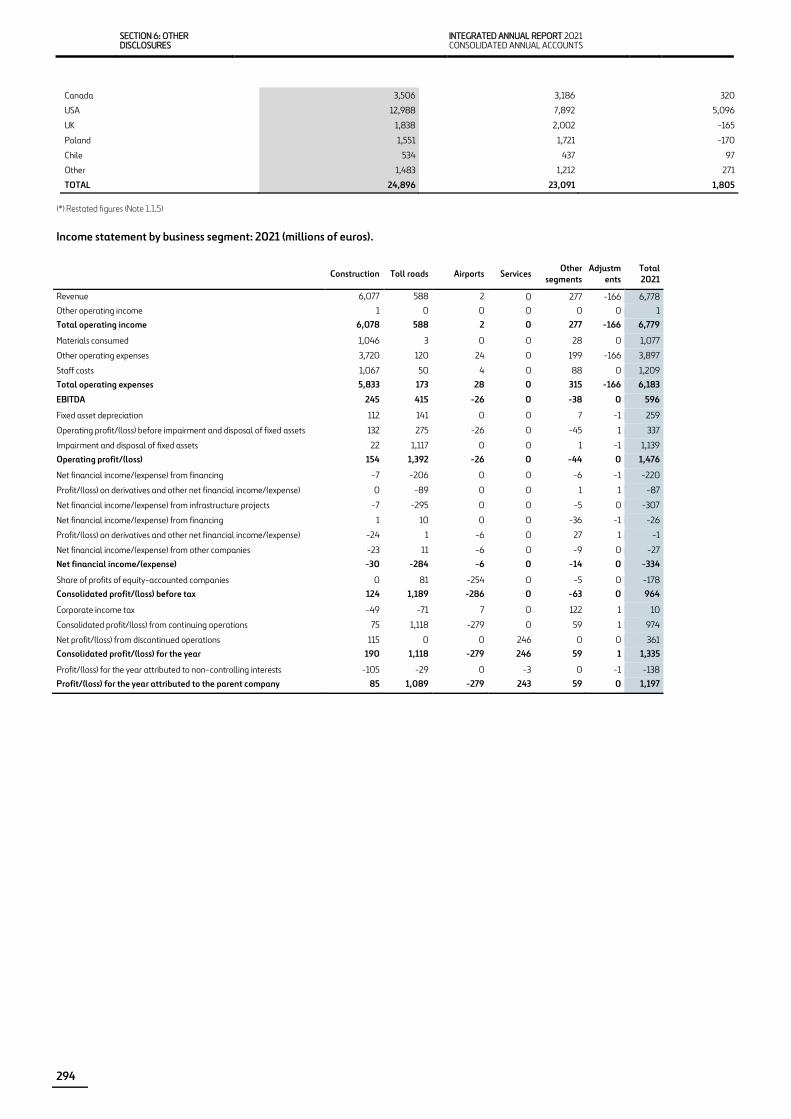
SECTION 6: OTHER DISCLOSURES
INTEGRATED ANNUAL REPORT 2021 CONSOLIDATED ANNUAL ACCOUNTS
294
(*) Restated figures (Note 1.1.5)
Income statement by business segment: 2021 (millions of euros).
Construction Toll roads Airports Services Other segments
Adjustments
Total 2021
Revenue 6,077 588 2 0 277 -166 6,778 Other operating income 1 0 0 0 0 0 1 Total operating income 6,078 588 2 0 277 -166 6,779 Materials consumed 1,046 3 0 0 28 0 1,077 Other operating expenses 3,720 120 24 0 199 -166 3,897 Staff costs 1,067 50 4 0 88 0 1,209 Total operating expenses 5,833 173 28 0 315 -166 6,183 EBITDA 245 415 -26 0 -38 0 596 Fixed asset depreciation 112 141 0 0 7 -1 259 Operating profit/(loss) before impairment and disposal of fixed assets 132 275 -26 0 -45 1 337 Impairment and disposal of fixed assets 22 1,117 0 0 1 -1 1,139 Operating profit/(loss) 154 1,392 -26 0 -44 0 1,476 Net financial income/(expense) from financing -7 -206 0 0 -6 -1 -220 Profit/(loss) on derivatives and other net financial income/(expense) 0 -89 0 0 1 1 -87 Net financial income/(expense) from infrastructure projects -7 -295 0 0 -5 0 -307 Net financial income/(expense) from financing 1 10 0 0 -36 -1 -26 Profit/(loss) on derivatives and other net financial income/(expense) -24 1 -6 0 27 1 -1 Net financial income/(expense) from other companies -23 11 -6 0 -9 0 -27 Net financial income/(expense) -30 -284 -6 0 -14 0 -334 Share of profits of equity-accounted companies 0 81 -254 0 -5 0 -178 Consolidated profit/(loss) before tax 124 1,189 -286 0 -63 0 964 Corporate income tax -49 -71 7 0 122 1 10 Consolidated profit/(loss) from continuing operations 75 1,118 -279 0 59 1 974 Net profit/(loss) from discontinued operations 115 0 0 246 0 0 361 Consolidated profit/(loss) for the year 190 1,118 -279 246 59 1 1,335 Profit/(loss) for the year attributed to non-controlling interests -105 -29 0 -3 0 -1 -138 Profit/(loss) for the year attributed to the parent company 85 1,089 -279 243 59 0 1,197
Canada 3,506 3,186 320 USA 12,988 7,892 5,096 UK 1,838 2,002 -165 Poland 1,551 1,721 -170 Chile 534 437 97 Other 1,483 1,212 271 TOTAL 24,896 23,091 1,805
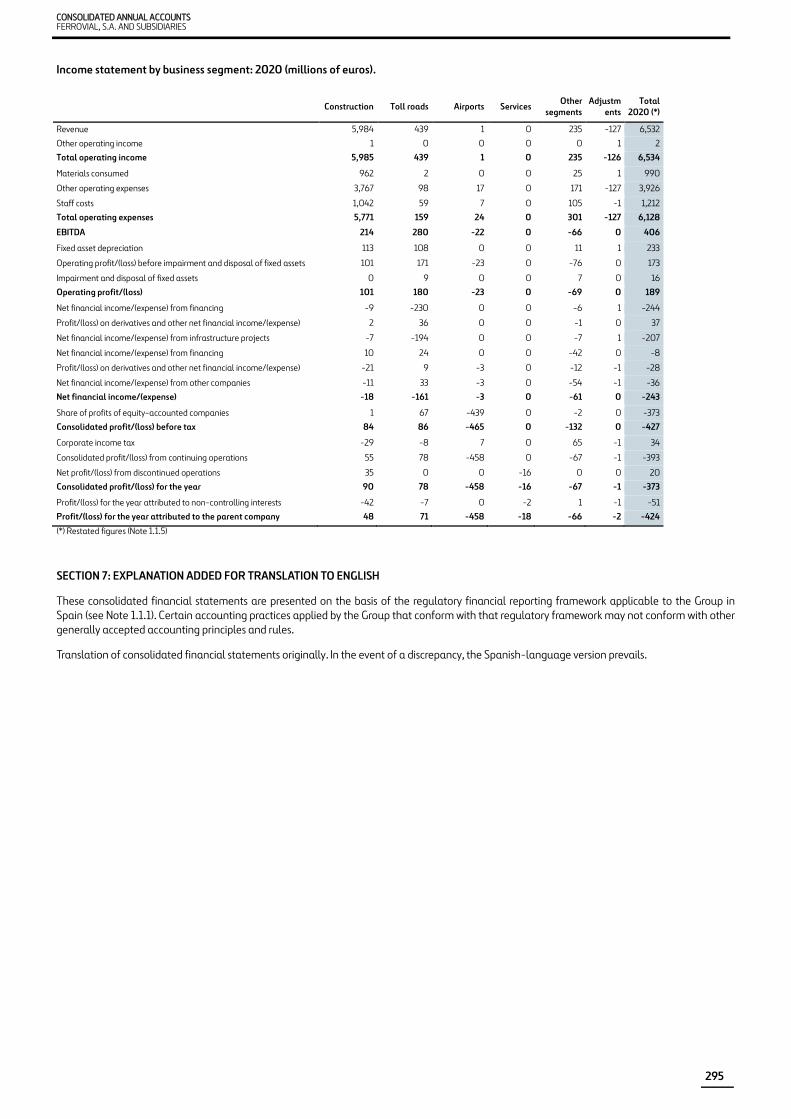
CONSOLIDATED ANNUAL ACCOUNTS FERROVIAL, S.A. AND SUBSIDIARIES
295
Income statement by business segment: 2020 (millions of euros).
Construction Toll roads Airports Services Other segments
Adjustments
Total 2020 (*)
Revenue 5,984 439 1 0 235 -127 6,532 Other operating income 1 0 0 0 0 1 2 Total operating income 5,985 439 1 0 235 -126 6,534 Materials consumed 962 2 0 0 25 1 990 Other operating expenses 3,767 98 17 0 171 -127 3,926 Staff costs 1,042 59 7 0 105 -1 1,212 Total operating expenses 5,771 159 24 0 301 -127 6,128 EBITDA 214 280 -22 0 -66 0 406 Fixed asset depreciation 113 108 0 0 11 1 233 Operating profit/(loss) before impairment and disposal of fixed assets 101 171 -23 0 -76 0 173 Impairment and disposal of fixed assets 0 9 0 0 7 0 16 Operating profit/(loss) 101 180 -23 0 -69 0 189 Net financial income/(expense) from financing -9 -230 0 0 -6 1 -244 Profit/(loss) on derivatives and other net financial income/(expense) 2 36 0 0 -1 0 37 Net financial income/(expense) from infrastructure projects -7 -194 0 0 -7 1 -207 Net financial income/(expense) from financing 10 24 0 0 -42 0 -8 Profit/(loss) on derivatives and other net financial income/(expense) -21 9 -3 0 -12 -1 -28 Net financial income/(expense) from other companies -11 33 -3 0 -54 -1 -36 Net financial income/(expense) -18 -161 -3 0 -61 0 -243 Share of profits of equity-accounted companies 1 67 -439 0 -2 0 -373 Consolidated profit/(loss) before tax 84 86 -465 0 -132 0 -427 Corporate income tax -29 -8 7 0 65 -1 34 Consolidated profit/(loss) from continuing operations 55 78 -458 0 -67 -1 -393 Net profit/(loss) from discontinued operations 35 0 0 -16 0 0 20 Consolidated profit/(loss) for the year 90 78 -458 -16 -67 -1 -373 Profit/(loss) for the year attributed to non-controlling interests -42 -7 0 -2 1 -1 -51 Profit/(loss) for the year attributed to the parent company 48 71 -458 -18 -66 -2 -424 (*) Restated figures (Note 1.1.5)
SECTION 7: EXPLANATION ADDED FOR TRANSLATION TO ENGLISH
These consolidated financial statements are presented on the basis of the regulatory financial reporting framework applicable to the Group in Spain (see Note 1.1.1). Certain accounting practices applied by the Group that conform with that regulatory framework may not conform with other generally accepted accounting principles and rules.
Translation of consolidated financial statements originally. In the event of a discrepancy, the Spanish-language version prevails.

Audit Report on the Consolidated Financial Statementsissued by an Independent Auditor
FERROVIAL, S.A. AND SUBSIDIARIESConsolidated Financial Statements andConsolidated Management Reportfor the year endedDecember 31, 2021
Domicilio Social: C/ Raimundo Fernández Villaverde, 65. 28003 Madrid - Inscrita en el Registro Mercantil de Madrid, tomo 9.364 general, 8.130 de la sección 3ª del Libro de Sociedades, folio 68, hoja nº 87.690-1,inscripción 1ª. Madrid 9 de Marzo de 1.989. A member firm of Ernst & Young Global Limited.
Ernst & Young, S.L.Calle de Raimundo Fernández Villaverde, 6528003 Madrid
Tel: 902 365 456Fax: 915 727 238ey.com
AUDIT REPORT ON CONSOLIDATED FINANCIAL STATEMENTS ISSUED BY AN INDEPENDENTAUDITOR
Translation of a report and financial statements originally issued in Spanish. In the event of discrepancy, theSpanish-language version prevails
To the shareholders of FERROVIAL, S.A.:
Audit report on the consolidated financial statements
Opinion
We have audited the consolidated financial statements of FERROVIAL, S.A. (the parent) and itssubsidiaries (the Group), which comprise the consolidated statement of financial position atDecember 31, 2021, the consolidated income statement, the consolidated statement ofcomprehensive income, the consolidated statement of changes in equity, the consolidated of cashflow statement, and the notes thereto, for the year then ended.
In our opinion, the accompanying consolidated financial statements give a true and fair view, in allmaterial respects, of consolidated equity and the consolidated financial position of the Group atDecember 31, 2021 and of its financial performance and its consolidated cash flows, for the yearthen ended in accordance with International Financial Reporting Standards, as adopted by theEuropean Union (IFRS-EU), and other provisions in the regulatory framework applicable in Spain.
Basis for opinion
We conducted our audit in accordance with prevailing audit regulations in Spain. Our responsibilitiesunder those standards are further described in the Auditor’s responsibilities for the audit of theconsolidated financial statements section of our report.
We are independent of the Group in accordance with the ethical requirements, including those relatedto independence, that are relevant to our audit of the consolidated financial statements in Spain asrequired by prevailing audit regulations. In this regard, we have not provided non-audit services norhave any situations or circumstances arisen that might have compromised our mandatoryindependence in a manner prohibited by the aforementioned requirements.
We believe that the audit evidence we have obtained is sufficient and appropriate to provide a basisfor our opinion.
A member firm of Ernst & Young Global Limited
2
.
Key audit matters
Key audit matters are those matters that, in our professional judgment, were of most significance inour audit of the consolidated financial statements of the current period. These matters wereaddressed in the context of our audit of the consolidated financial statements as a whole, and informing our audit opinion thereon, and we do not provide a separate opinion on these matters.
Recognition of revenue from long-term contracts
Description A considerable amount of the Ferrovial Group's revenue relates to long-termconstruction contracts, in which revenue is recognized over time in accordance withthe stage of completion method. Revenue recognition for these contracts requiresthat management make significant estimates, among others, of the costs to beincurred and, where applicable, the amount of any modifications, claims or disputesarising in connection with the initial contract that will ultimately be accepted by thecustomer. The disclosures pertaining to this revenue can be found in Notes 1.3.3.4,2.1 and 4.4 to the accompanying consolidated financial statements.
Due to the complexity of making the aforementioned estimates, which requires thatFerrovial Group management make judgments when determining the assumptionsconsidered and the fact that changes in these assumptions could give rise to materialdifferences in the revenue recognized, we determined this to be a key audit matter.
Ourresponse In relation to this matter, our Audit procedures included:
�Understanding the policies and procedures the Group applies to revenuerecognition, including an evaluation of the design and implementation of keycontrols related to revenue recognition using the stage-of-completion methodand to budget planning, assessing methodology and monitoring theassumptions used in the preparation of contract budgets.
Selecting a sample of contracts to assess the most significant estimatesaffecting revenue recognition, obtaining supporting documentation for theseestimates as well as evidence of the judgments made; identifying relevantcontractual clauses such as penalties or discounts, and assessing whether suchclauses have been adequately reflected in the amounts recognized in theconsolidated financial statements.
Conducting a comparative analysis of budgeted vs actual revenue fromcontracts completed during the year, and analyzing Ferrovial Groupmanagement’s monitoring of contract risks.
Evaluating the reasonableness of the estimate of completed constructionpending certification recognized as revenue at year-end, checking the status ofnegotiations with customers for the main contracts and reviewing thereasonableness of the documentation substantiating the probability ofrecovery, taking into account our own expectations based on our knowledge ofthe client and our experience in the sector as well as in the countries where theFerrovial Group operates.
Determining whether the provisions recognized at year-end reasonably reflectthe main obligations and the level of risk of the contracts in question.
Checking that the disclosures made in the notes to the consolidated financialstatement comply with the applicable financial reporting framework.

A member firm of Ernst & Young Global Limited
3
.
Recognition and recoverability of investments in infrastructure projects operated underconcession arrangements
Description As explained in Note 1.3.3.2 to the accompanying consolidated financial statements,concession arrangements for which the resulting consideration consists of anunconditional contractual right to receive cash or other financial assets from thegrantor (or on the grantor’s behalf) as compensation for construction and operatingservices and for which the grantor has little or no discretion to avoid payment, areclassified as a financial asset. In addition, concession agreements in which theconsideration received consists of the right to charge the corresponding tariffs basedon the degree of use of the public service are classified as intangible assets. Bothmodels are recorded in accordance with IFRIC12 "Service ConcessionArrangements." "Fixed assets in infrastructure projects" in the consolidatedstatement of financial position at December 31, 2021 includes 11,185 million eurosfor this item, of which 11,016 million euros correspond to concessions considered asfinancial assets and 169 million euros to concessions considered as intangible assets.The disclosures pertaining to these assets can be found in Note 3.3 to theaccompanying consolidated financial statements.
Ferrovial Group management makes estimates regarding concession models whichinclude forecasts of operating expenses, investments, and the internal rate of return.In addition, Ferrovial Group management tests its most significant operatingconcession assets annually when there are indications of impairment.
Given the complexity associated with making the aforementioned estimates anddetermining the related assumptions considered, as well as the material impact thatchanges in these assumptions could have on the accompanying consolidated financialstatements, and given the significance of the amounts of investments ininfrastructure projects carried out under concession, we determined the recognitionand recoverability of these assets to be a key audit matter.
Ourresponse In this regard, our audit procedures included:
Understanding the policies and procedures applied to concession assets,including evaluation of the design and implementation of key controls related tothe process.
Reviewing the terms and conditions of concession arrangements to determinewhether they have been correctly recorded.
Reviewing and assessing, for a sample of concession assets, the reasonablenessof the methodologies used by the Group to estimate payments and collectionsand their effect on the internal rate of return.
Performing substantive tests based on financial economic models ofinfrastructure projects, verifying the arithmetical accuracy of the calculationsmade, and assessing the reasonableness of the main projected operatingassumptions (mainly related to traffic, tariffs, operating costs, and investmentdisbursements) and their consistency with the terms and conditions of theconcession.
Reviewing, in collaboration with valuation specialists, the reasonableness of themethodology used by the Group, and the construction of discounted cash flows,focusing on the discount rate and long-term growth rate applied, as well as therelated sensitivity analyses carried out.
Checking that the disclosures made in the notes to the consolidated financialstatement comply with the applicable financial reporting framework.
A member firm of Ernst & Young Global Limited
4
.
Classification and valuation of assets and liabilities held for sale and income and expenses fromdiscontinued operations
Description As explained in Notes 1.1.3, 1.3.3.5, 1.3.3.6 and 2.9 to the accompanyingconsolidated financial statements, the Group records as non-current assets andliabilities as held for sale and as discontinued operations the main assets andliabilities and income and expenses, respectively, linked to the services business linesince the conditions set forth in IFRS 5 "Non-current assets held for sale anddiscontinued operations" are met. Accordingly, net assets corresponding todiscontinued operations are measured at the lower of carrying amount and fair valueless costs to sell and are not subject to amortization/depreciation.
The Group has recorded as of December 31, 2021, under "Assets classified as heldfor sale and from discontinued activities" and "Liabilities classified as held for saleand from discontinued activities" of the consolidated statement of financial position1,761 and 1,478 million euros, respectively, relating to assets and liabilities linked tothe services business line and under "Results from discontinued operations" in theconsolidated profit and loss account 361 million euros in profits corresponding tosaid business line.
We have considered this area as a key audit matter in our audit due to the fact thatthe determination of the short-term probability of disposal of the services division inthe different geographical areas, as well as the estimation of the fair value less coststo sell of the affected net assets require using valuation techniques that includemaking assumptions and that the Group make judgments to determine them.
Ourresponse In this regard, our audit procedures included:
Understanding of the process established by the Group Management for theclassification of assets and liabilities as held for sale and income and expensesas results of discontinued operations and their valuation, and evaluation of thedesign and implementation of the relevant controls established in theaforementioned process.
Reviewing the documentation supporting the Group's decision to continueclassifying the assets and liabilities of the services line as discontinuedoperations.
Evaluating the methodology and valuation hypotheses used by Group´sManagement and review, where appropriate, of the acquisition offers receivedfrom third parties.
Reviewing the results of the comparison made by Ferrovial Group managementof the carrying amounts and fair values less costs to sell of discontinuedoperations, ensuring that they were correctly recorded.
Reviewing the correct accounting of the disposal operations of the Servicesdivision carried out in the year 2021.
Checking that the disclosures made in the notes to the consolidated financialstatement comply with the applicable financial reporting framework.
A member firm of Ernst & Young Global Limited
5
.
Recoverability of the investment held in 407 International Inc. and goodwill
Description As explained in Note 3.5 to the accompanying consolidated financial statements, atDecember 31, 2021, the Group had an investment in the associate 407 InternationalInc. amounting to 1,181 million euros, respectively.
Moreover, as explained in Note 3.1, the Group has goodwill on consolidationamounting to 208 million euros at December 31, 2021 related to certaininvestments, associated primarily with cash generating units of the Construction andToll roads Divisions.
Where required, the Group tests these assets for impairment at least annually. Thedisclosures pertaining to these assets can be found in Notes 3.1.2 and 3.5 to theaccompanying consolidated financial statements.
The assessment of possible impairment is a key audit matter as it requires estimatesthat involve the application of judgments both when determining the valuationmethod used and when evaluating key assumptions related to the future results ofthe cash generating units to which the goodwill belongs, as well as determining therecoverable amount of equity method investments in which discount rates, businessplans, and tariffs are also involved.
Ourresponse In this regard, our audit procedures included:
Understanding the policies and procedures the Group applies to assessinggoodwill and investments in associates for impairment to determine therecoverable amount of its non-current assets, including evaluation of the designand implementation of related key controls.
Analyzing internal and external factors taken into account by Ferrovial Groupmanagement to conclude on the existence or non-existence of objectiveindicators of impairment.
Assessing the reasonableness of the methodology used by Group managementto determine the recoverable amount of the assets, involving our valuationspecialists in the review of the valuation method used and the uniformity withwhich it is applied, verifying arithmetical calculations and evaluating thediscount rates and long-term growth rates used.
Reviewing projected financial information, analyzing the congruency among thevarious assumptions and their reasonableness.
Verifying that the financial projections used to calculate value in use agree withthe latest financial information available to management.
Analyzing the sensitivity of profit and loss to certain key assumptions.
Checking that the disclosures made in the notes to the consolidated financialstatement comply with the applicable financial reporting framework.
A member firm of Ernst & Young Global Limited
6
.
Recognition and valuation of the business combination related to I66 Express Mobility PartnersHoldings, LLC.
Description As explained in Note 1.1.4 to the consolidated financial statements, Cintra, asubsidiary of Ferrovial Group that indirectly owner of 50% of the share capital of theconcessionaire I-66 Express Mobility Partners Holdings, LLC acquired on December17, 2021 an additional 5.704% of the share capital of said company for 182 milliondollars (approximately 162 million euros). As a result, Ferrovial’s Group total share inthe concessionaire company is 55.704%, giving Ferrovial control of the company.Consequently, the share in the concessionaire, which was formally accounted forusing the equity method, is currently accounted for using the full consolidationmethod.
This transaction has led the Group to the recognition of an income in the consolidatedincome statement amounting to 1,101 million euros since it valued the pre-existinginterest at fair value in accordance with IFRS 3 "Business combinations”.
The determination of the fair values of the identifiable assets acquired and theliabilities assumed in this business combination requires making complex estimates,which entails the application of judgments in the establishment of the assumptionsconsidered by the Group's Management in relation to said estimates, which include,among others, the allocation of the price paid to the concession assets and thevaluation of the financial debt assumed.
We have considered this area as a key audit matter in our audit due to the complexityinherent in the estimation process, as well as the significant impact that changes inthe assumptions made could have on the accompanying consolidated financialstatements, together with the relevance of the amounts involved.
The disclosures related to the valuation standards of this transaction, as well as itsrelated impacts, are included in Note 1.1.4 in the accompanying consolidatedfinancial statements.
Ourresponse In this regard, our audit procedures included:
Understanding of the process followed by the Group's Management for theregistration and valuation of the business combination.
Reviewing the purchase-sale contract as well as the related documentationsupporting the amount paid.
Reviewing the acquired concessionaire company’s financial informationsubstantiating the main consolidated balance sheet headings.
Reviewing the valuation method used by Group management to determine thefair values of the assets and liabilities assumed, involving our valuationspecialists in the review of the mathematical uniformity and the evaluation ofthe reasonableness of the discount and long-term growth rates used, as well asinvolving our financial instruments experts in calculating the fair value of thedebt.
Review, in collaboration with our valuation specialists, of the calculation of thefair value of the 50% stake that the Ferrovial Group holds in I-66 ExpressMobility Partners Holding, LLC prior to the business combination.
Reviewing the accounting and tax impacts derived from the businesscombination and verification of its proper registration in the consolidatedfinancial statements.
Checking that the disclosures made in the notes to the consolidated financialstatement comply with the applicable financial reporting framework.

A member firm of Ernst & Young Global Limited
7
.
Other information: consolidated management report
Other information refers exclusively to the 2021 consolidated management report, the preparationof which is the responsibility of the parent company’s directors and is not an integral part of theconsolidated financial statements.
Our audit opinion on the consolidated financial statements does not cover the consolidatedmanagement report. Our responsibility for the consolidated management report, in conformity withprevailing audit regulations in Spain, entails:
a. Checking only that the consolidated non-financial statement and certain information includedin the Annual Corporate Governance Report and the Annual Report on Remuneration ofDirectors, to which the Audit Law refers, was provided as stipulated by applicable regulationsand, if not, disclose this fact.
b. Assessing and reporting on the consistency of the remaining information included in theconsolidated management report with the consolidated financial statements, based on theknowledge of the Group obtained during the audit, in addition to evaluating and reporting onwhether the content and presentation of this part of the consolidated management report arein conformity with applicable regulations. If, based on the work we have performed, weconclude that there are material misstatements, we are required to disclose this fact.
Based on the work performed, as described above, we have verified that the information referred toin paragraph a) above is provided as stipulated by applicable regulations and that the remaininginformation contained in the consolidated management report is consistent with that provided in the2021 consolidated financial statements and its content and presentation are in conformity withapplicable regulations.
Responsibilities of the parent company´s directors and the audit and control committee for theconsolidated financial statements
The directors of the parent company are responsible for the preparation of the accompanyingconsolidated financial statements so that they give a true and fair view of the equity, financialposition and results of the Group, in accordance with IFRS-EU, and other provisions in the regulatoryframework applicable to the Group in Spain, and for such internal control as they determine isnecessary to enable the preparation of consolidated financial statements that are free from materialmisstatement, whether due to fraud or error.
In preparing the consolidated financial statements, the directors of the parent company areresponsible for assessing the Group’s ability to continue as a going concern, disclosing, as applicable,matters related to going concern and using the going concern basis of accounting unless thedirectors either intend to liquidate the Group or to cease operations, or has no realistic alternativebut to do so.
The audit and control committee is responsible for overseeing the Group’s financial reportingprocess.

A member firm of Ernst & Young Global Limited
8
.
Auditor’s responsibilities for the audit of the consolidated financial statements
Our objectives are to obtain reasonable assurance about whether the consolidated financialstatements as a whole are free from material misstatement, whether due to fraud or error, and toissue an auditor’s report that includes our opinion.
Reasonable assurance is a high level of assurance, but is not a guarantee that an audit conducted inaccordance with prevailing audit regulations in Spain will always detect a material misstatementwhen it exists. Misstatements can arise from fraud or error and are considered material if,individually or in the aggregate, they could reasonably be expected to influence the economicdecisions of users taken on the basis of these consolidated financial statements.
As part of an audit in accordance with prevailing audit regulations in Spain, we exercise professionaljudgement and maintain professional skepticism throughout the audit. We also:
Identify and assess the risks of material misstatement of the consolidated financialstatements, whether due to fraud or error, design and perform audit procedures responsiveto those risks, and obtain audit evidence that is sufficient and appropriate to provide a basisfor our opinion. The risk of not detecting a material misstatement resulting from fraud ishigher than for one resulting from error, as fraud may involve collusion, forgery, intentionalomissions, misrepresentations, or the override of internal control.
Obtain an understanding of internal control relevant to the audit in order to design auditprocedures that are appropriate in the circumstances, but not for the purpose of expressingan opinion on the effectiveness of the Group’s internal control.
Evaluate the appropriateness of accounting policies used and the reasonableness ofaccounting estimates and related disclosures made by management.
Conclude on the appropriateness of the directors’ use of the going concern basis ofaccounting and, based on the audit evidence obtained, whether a material uncertainty existsrelated to events or conditions that may cast significant doubt on the Group’s ability tocontinue as a going concern. If we conclude that a material uncertainty exists, we arerequired to draw attention in our auditor’s report to the related disclosures in theconsolidated financial statements or, if such disclosures are inadequate, to modify ouropinion. Our conclusions are based on the audit evidence obtained up to the date of ourauditor’s report. However, future events or conditions may cause the Group to cease tocontinue as a going concern.
Evaluate the overall presentation, structure and content of the consolidated financialstatements, including the disclosures, and whether the consolidated financial statementsrepresent the underlying transactions and events in a manner that achieves fair presentation.
Obtain sufficient appropriate audit evidence regarding the financial information of theentities or business activities within the Group to express an opinion on the consolidatedfinancial statements. We are responsible for the direction, supervision and performance ofthe group audit. We remain solely responsible for our audit opinion.
We communicate with the audit and control committee of the parent company regarding, amongother matters, the planned scope and timing of the audit and significant audit findings, including anysignificant deficiencies in internal control that we identify during our audit.

A member firm of Ernst & Young Global Limited
9
.
We also provide the audit and control committee of the parent company with a statement that wehave complied with relevant ethical requirements, including those related to independence, and tocommunicate with them all matters that may reasonably be thought to bear on our independence,and where applicable, related safeguards.
From the matters communicated with the audit and control committee, we determine those mattersthat were of most significance in the audit of the consolidated financial statements of the currentperiod and are therefore the key audit matters.
We describe these matters in our auditor’s report unless law or regulation precludes public disclosureabout the matter.
Report on other legal and regulatory requirements
European single electronic format
We have examined the digital files of the European single electronic format (ESEF) of FERROVIAL,S.A. and subsidiaries for the 2021 financial year, which include the XHTML file containing theconsolidated financial statements for the year, and the XBRL files as labeled by the entity, which willform part of the annual financial report.
The directors of FERROVIAL S.A. are responsible for submitting the annual financial report for the2021 financial year, in accordance with the formatting and mark-up requirements set out inDelegated Regulation EU 2019/815 of 17 December 2018 of the European Commission (hereinafterreferred to as the ESEF Regulation). In this regard, the Annual Corporate Governance Report and theAnnual Report on Remuneration of Directors have been incorporated by reference in theconsolidated management report.
Our responsibility consists of examining the digital files prepared by the directors of the parentcompany, in accordance with prevailing audit regulations in Spain. These standards require that weplan and perform our audit procedures to obtain reasonable assurance about whether the contents ofthe consolidated financial statements included in the aforementioned digital files correspond in theirentirety to those of the consolidated financial statements that we have audited, and whether theconsolidated financial statements and the aforementioned files have been formatted and marked up,in all material respects, in accordance with the ESEF Regulation.
In our opinion, the digital files examined correspond in their entirety to the audited consolidatedfinancial statements, which are presented and have been marked up, in all material respects, inaccordance with the ESEF Regulation.
Additional report to the audit and control committee
The opinion expressed in this audit report is consistent with the additional report we issued to theaudit and control committee on February 23, 2022.

A member firm of Ernst & Young Global Limited
10
.
Term of engagement
The ordinary general shareholders’ meeting held on April 17, 2020 appointed us as auditors for 3years, commencing on December 31, 2020.
ERNST & YOUNG, S.L.(Registered in the Official Register ofAuditors under No. S0530)
(Signed on the original version In Spanish)
_______________________________Francisco Rahola Carral(Registered in the Official Register ofAuditors under No. 20597)
February 24, 2022