Financial Statements
24
Financial statements Edwin C. Mbwambo
Transcript of Financial Statements
Financial statements
Edwin C. Mbwambo
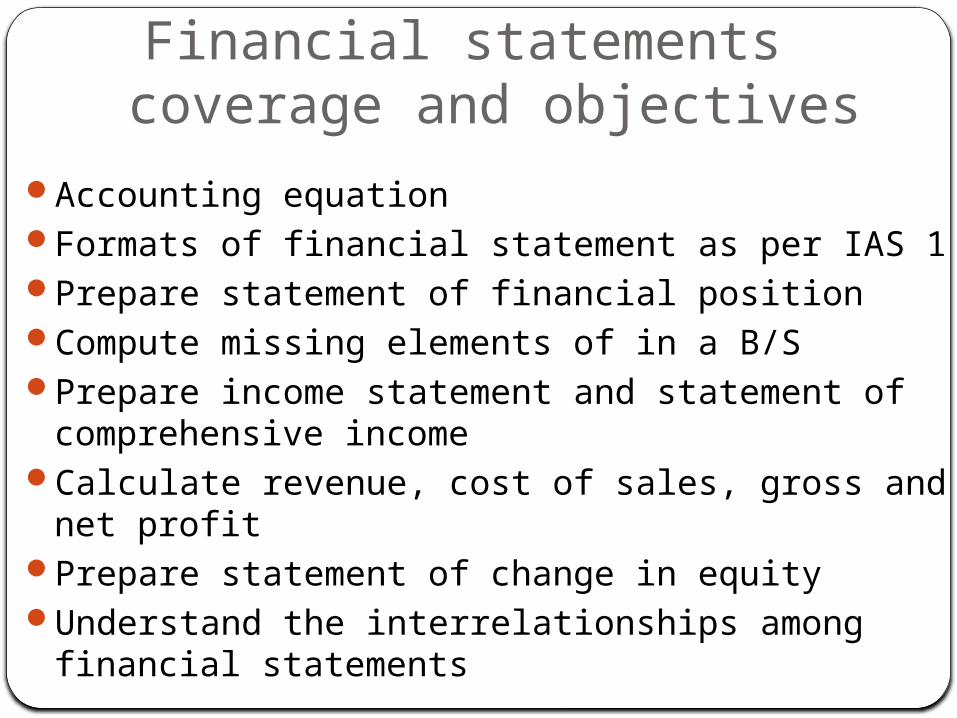
Financial statements coverage and objectives
Accounting equationFormats of financial statement as per IAS 1Prepare statement of financial positionCompute missing elements of in a B/S Prepare income statement and statement of comprehensive income
Calculate revenue, cost of sales, gross and net profit
Prepare statement of change in equityUnderstand the interrelationships among financial statements
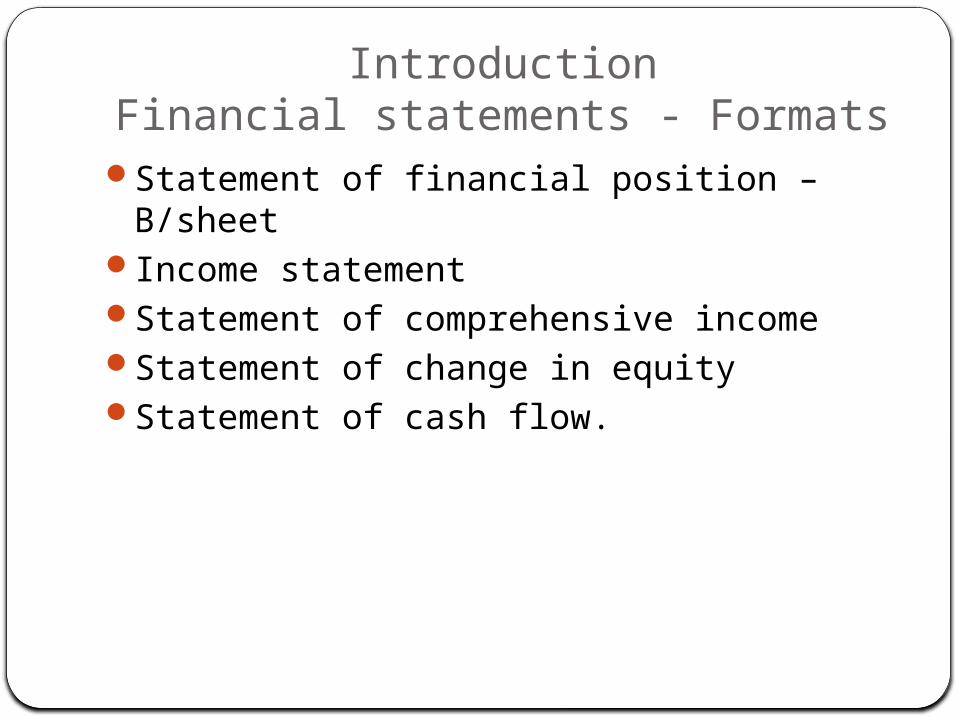
IntroductionFinancial statements - FormatsStatement of financial position – B/sheet
Income statementStatement of comprehensive incomeStatement of change in equityStatement of cash flow.

Financial position ABC Group - Statement of financial position as at
30th June 20132013 2012
Assets
Non-current Assets
Property, plant and equipment (PPE) -Building, land, machine&equipment etc
350,700 360,020
Goodwill 80,800 91,200Other intangible assets 227,470 227,470Investments in associates 100,150 110,770Available-for-sale financial assets 142,500 156,000
901,620 945,460Current Assets
Inventories 135,230 132,500Trade receivables 91,600 110,800Other current assets 25,650 12,540Cash and cash equivalents 312,400
322,900564,880
578,740Total Assets 1,466,500 1,524,200
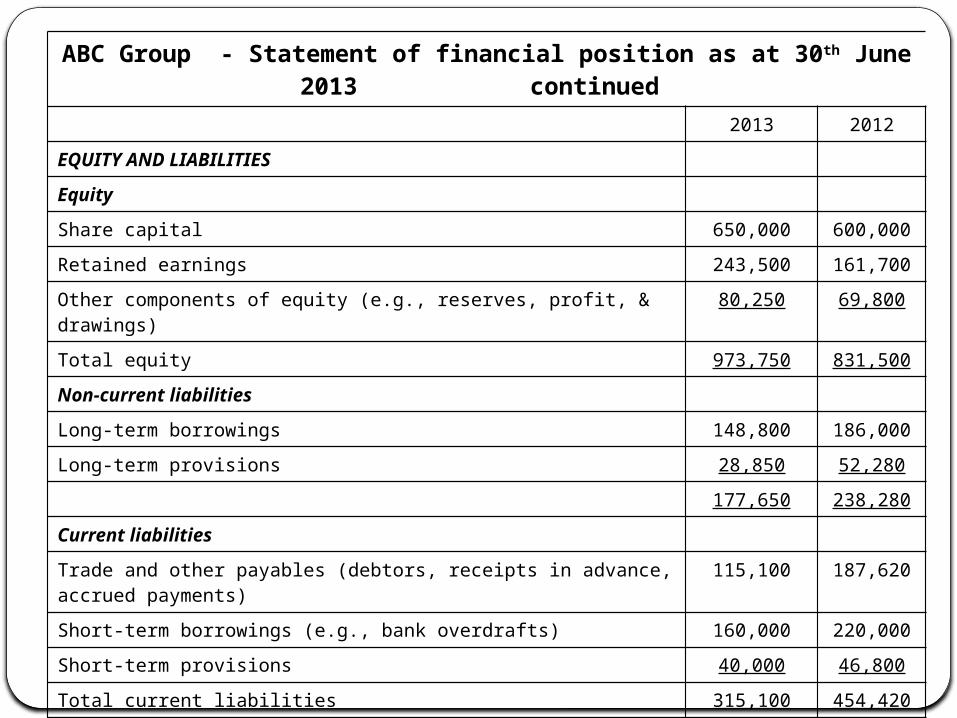
ABC Group - Statement of financial position as at 30th June 2013 continued
2013 2012EQUITY AND LIABILITIES
Equity
Share capital 650,000 600,000Retained earnings 243,500 161,700Other components of equity (e.g., reserves, profit, & drawings)
80,250 69,800
Total equity 973,750 831,500Non-current liabilities
Long-term borrowings 148,800 186,000Long-term provisions 28,850 52,280
177,650 238,280Current liabilities
Trade and other payables (debtors, receipts in advance, accrued payments)
115,100 187,620
Short-term borrowings (e.g., bank overdrafts) 160,000 220,000Short-term provisions 40,000 46,800Total current liabilities 315,100 454,420Total liabilities 492,750 692,700
Total equity and liabilities 1,466,500 1,524,200
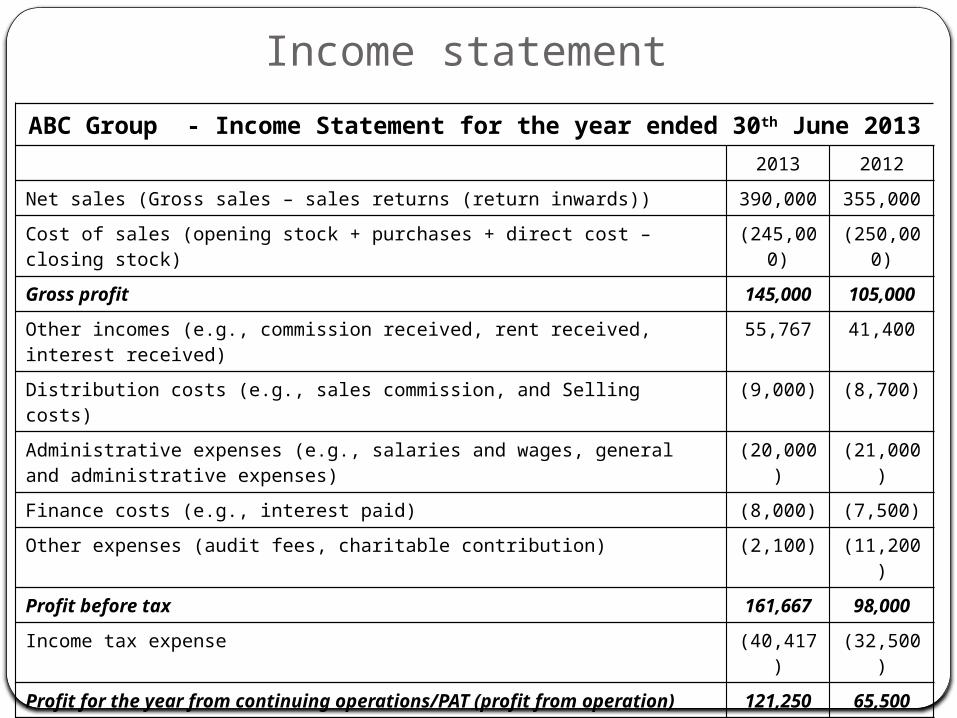
Income statement ABC Group - Income Statement for the year ended 30th June 2013
2013 2012Net sales (Gross sales – sales returns (return inwards)) 390,000 355,000Cost of sales (opening stock + purchases + direct cost – closing stock)
(245,000)
(250,000)
Gross profit 145,000 105,000
Other incomes (e.g., commission received, rent received, interest received)
55,767 41,400
Distribution costs (e.g., sales commission, and Selling costs)
(9,000) (8,700)
Administrative expenses (e.g., salaries and wages, general and administrative expenses)
(20,000)
(21,000)
Finance costs (e.g., interest paid) (8,000) (7,500)Other expenses (audit fees, charitable contribution) (2,100) (11,200
)Profit before tax 161,667 98,000
Income tax expense (40,417)
(32,500)
Profit for the year from continuing operations/PAT (profit from operation) 121,250 65,500

Statement of comprehensive incomeABC Group - Statement of comprehensive income for the year
ended 30th June 20132013 2012
Operating profit 121,250 65,500Exchange differences on translating foreign operations 8,000 10,667Available-for-sale financial assets (24,000
)10,667
Cash flow hedges 1,067 3,300Gains on property revaluation 933 3,366Other comprehensive income for the year, net of tax (14,000
)28,000
TOTAL COMPREHENSIVE INCOME FOR THE YEAR 107,250
93,500
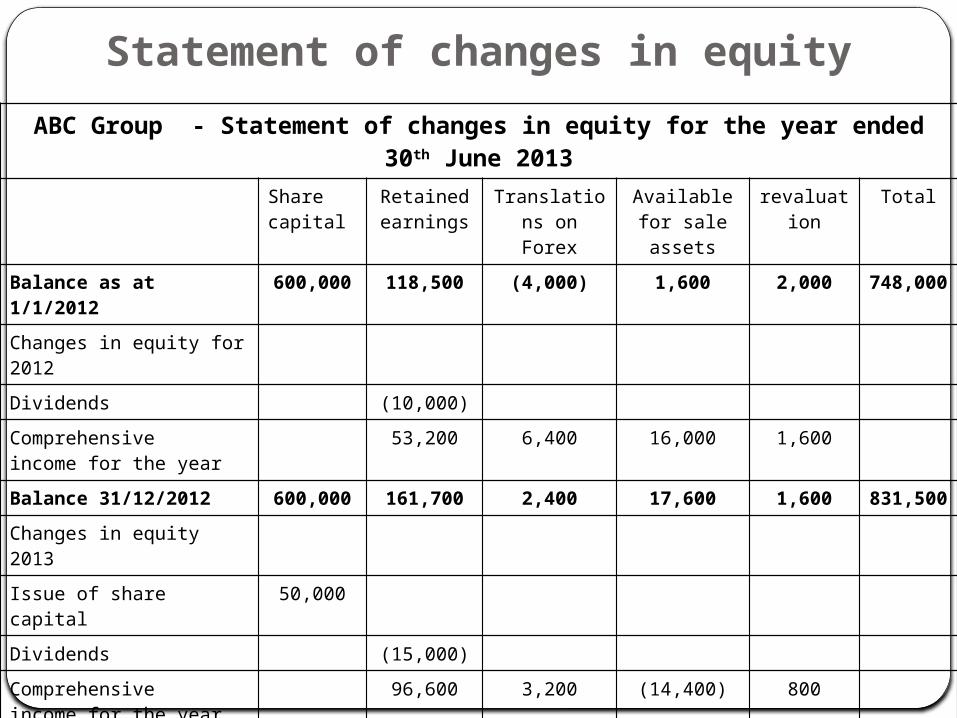
Statement of changes in equityABC Group - Statement of changes in equity for the year ended
30th June 2013Sharecapital
Retained earnings
Translations on Forex
Available for sale assets
revaluation
Total
Balance as at 1/1/2012
600,000 118,500 (4,000) 1,600 2,000 748,000
Changes in equity for 2012Dividends (10,000)Comprehensiveincome for the year
53,200 6,400 16,000 1,600
Balance 31/12/2012 600,000 161,700 2,400 17,600 1,600 831,500Changes in equity 2013Issue of share capital
50,000
Dividends (15,000)Comprehensiveincome for the year
96,600 3,200 (14,400) 800
Transfer to retainedearnings
200 200
Balance 31/12/2013 650,000 243,500 5,600 3,200 2,200 973,750
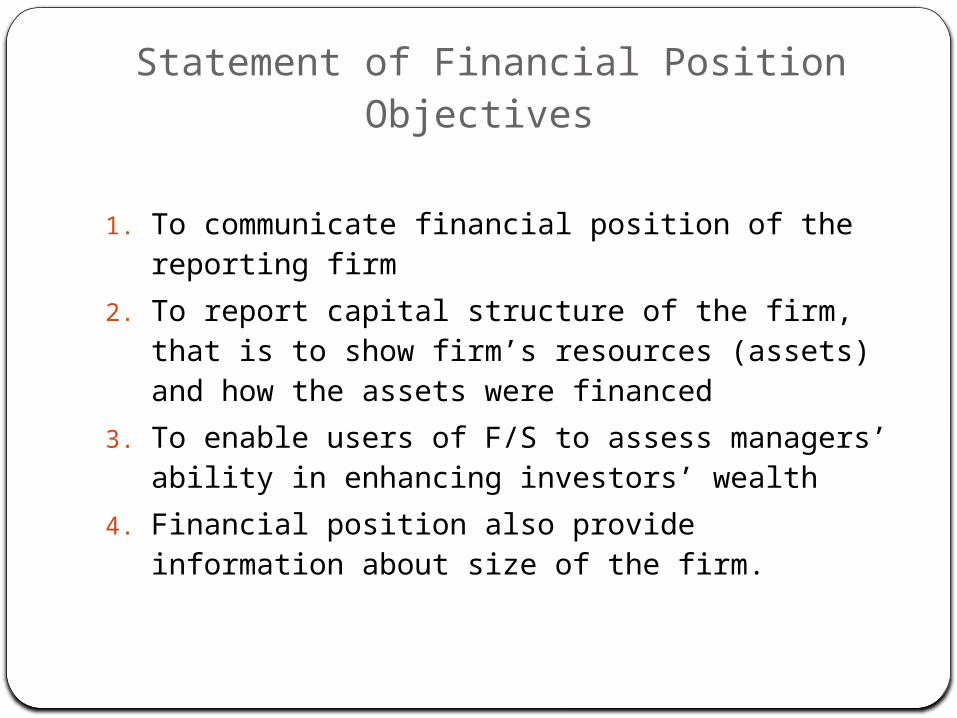
Statement of Financial Position Objectives
1. To communicate financial position of the reporting firm
2. To report capital structure of the firm, that is to show firm’s resources (assets) and how the assets were financed
3. To enable users of F/S to assess managers’ ability in enhancing investors’ wealth
4. Financial position also provide information about size of the firm.
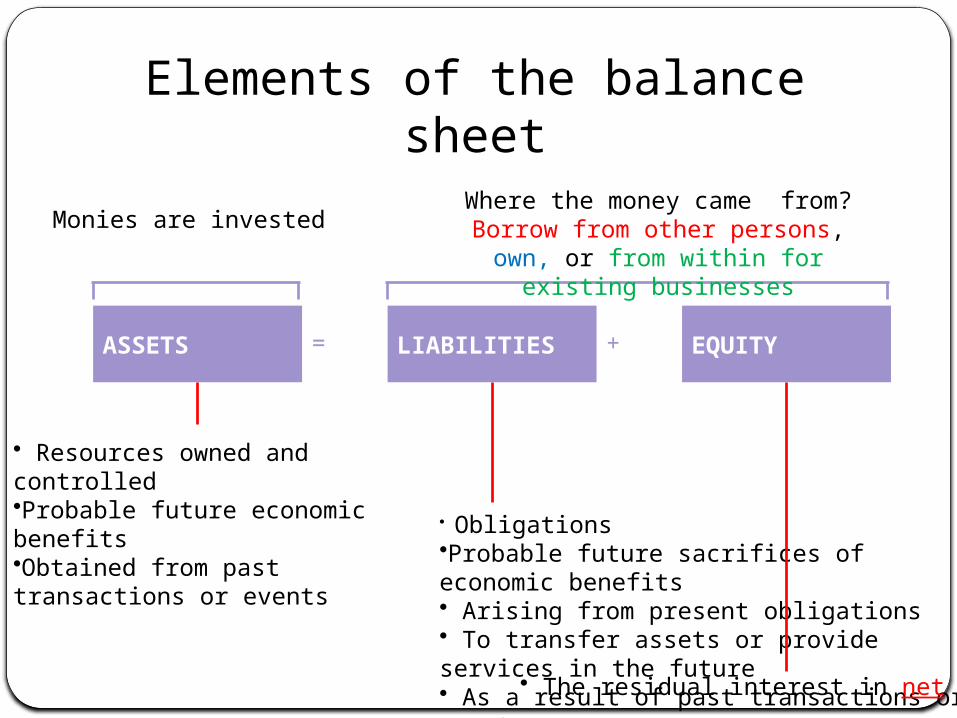
• Resources owned and controlled •Probable future economic benefits•Obtained from past transactions or events
• Obligations•Probable future sacrifices of economic benefits• Arising from present obligations• To transfer assets or provide services in the future• As a result of past transactions or events
• The residual interest in net assets.
ASSETS LIABILITIES EQUITY= +
Monies are invested Where the money came from? Borrow from other persons, own, or from within for
existing businesses
Elements of the balance sheet
LIABILITIES+EQUITY
ASSETS
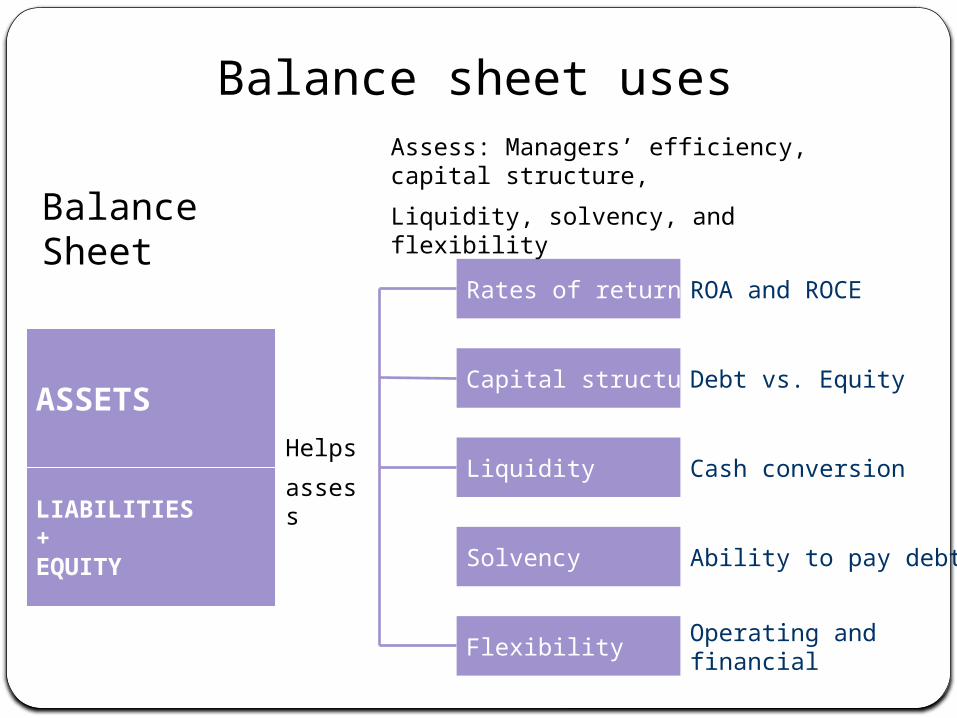
Rates of return
Capital structure
Liquidity
Solvency
Flexibility
ROA and ROCE
Debt vs. Equity
Cash conversion
Ability to pay debt
Operating and financial
Helpsassess
Balance sheet uses
Balance Sheet
Assess: Managers’ efficiency, capital structure,Liquidity, solvency, and flexibility
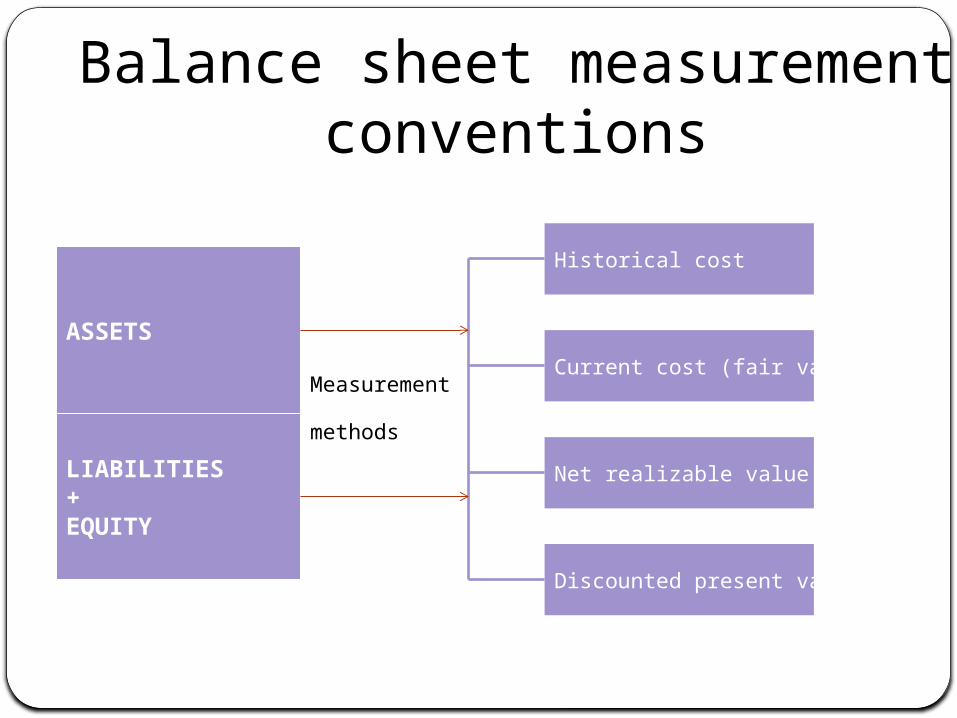
LIABILITIES+EQUITY
ASSETS
Historical cost
Current cost (fair value)
Net realizable value
Discounted present value
Measurement
methods
Balance sheet measurement conventions
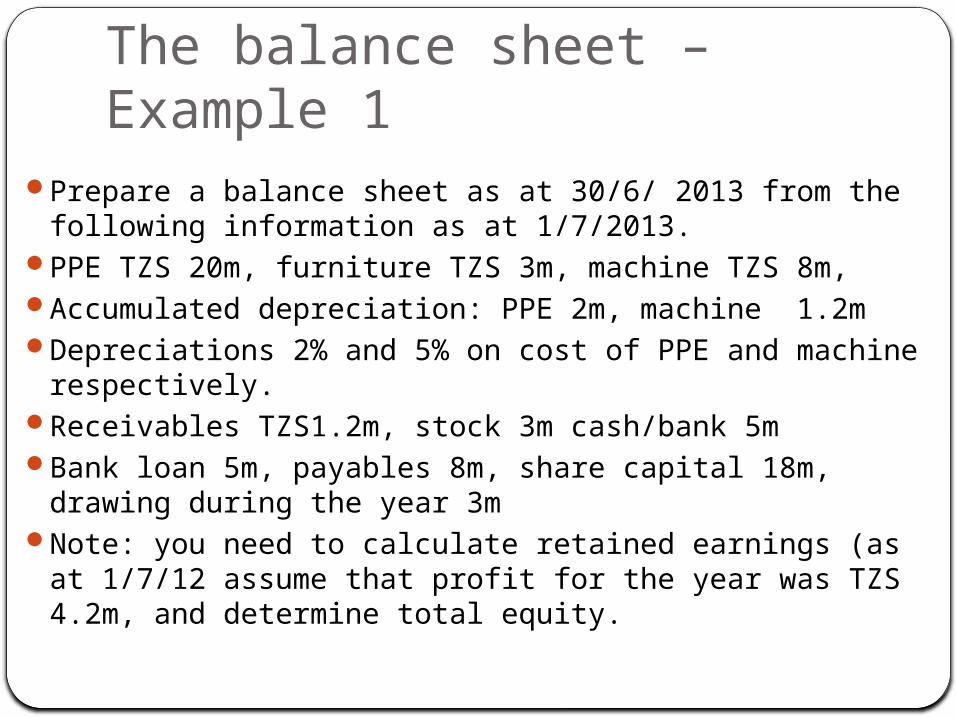
The balance sheet – Example 1
Prepare a balance sheet as at 30/6/ 2013 from the following information as at 1/7/2013.
PPE TZS 20m, furniture TZS 3m, machine TZS 8m,Accumulated depreciation: PPE 2m, machine 1.2mDepreciations 2% and 5% on cost of PPE and machine respectively.
Receivables TZS1.2m, stock 3m cash/bank 5mBank loan 5m, payables 8m, share capital 18m, drawing during the year 3m
Note: you need to calculate retained earnings (as at 1/7/12 assume that profit for the year was TZS 4.2m, and determine total equity.
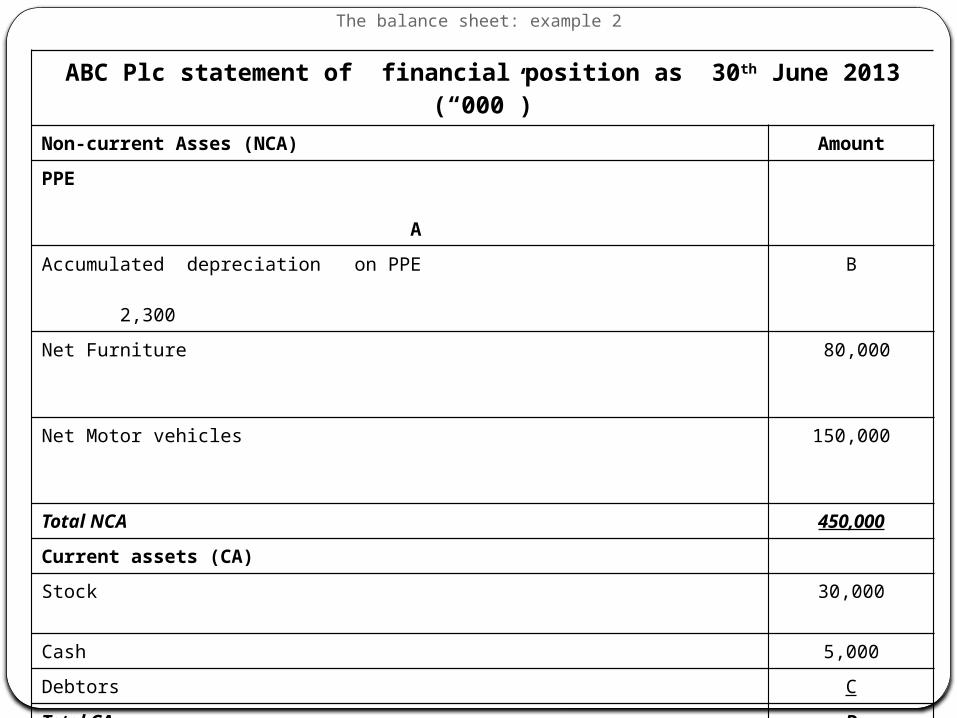
The balance sheet: example 2
ABC Plc statement of financial position as 30th June 2013 (“000”)
Non-current Asses (NCA) AmountPPE AAccumulated depreciation on PPE 2,300
B
Net Furniture
80,000
Net Motor vehicles
150,000
Total NCA 450,000
Current assets (CA)Stock
30,000
Cash 5,000Debtors CTotal CA D
TOTAL ASSESTS E
EQUITY 180,000Long-term liabilities (LTL)Bank Loans 170,000Current liabilities (CL)Creditors 15,000Other payables FTotal equity and liabilities 500,000
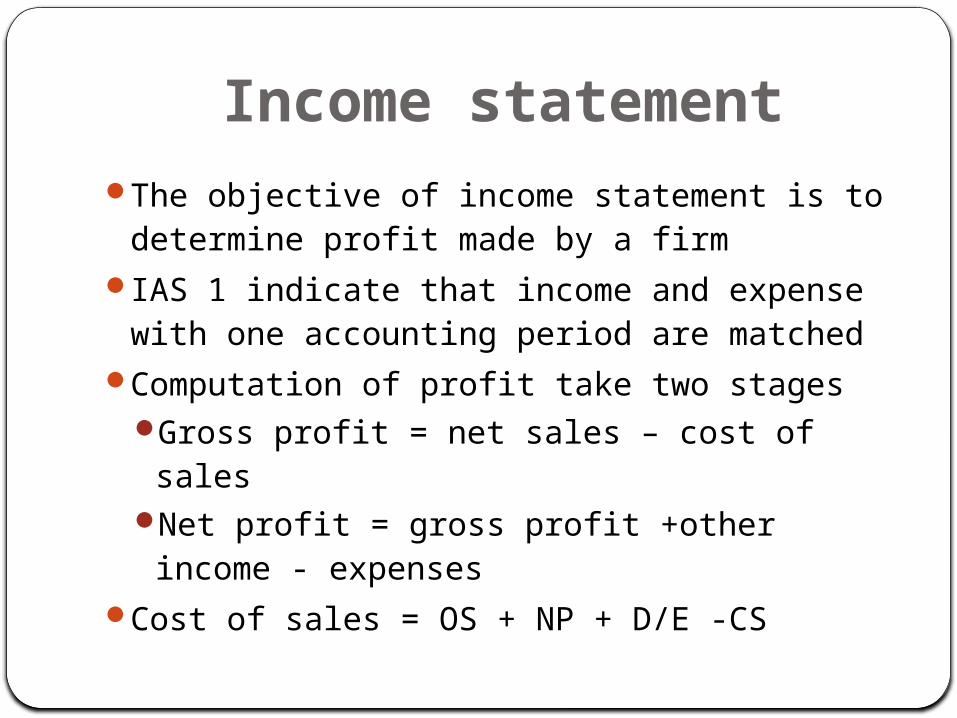
Income statementThe objective of income statement is to determine profit made by a firm
IAS 1 indicate that income and expense with one accounting period are matched
Computation of profit take two stagesGross profit = net sales – cost of sales
Net profit = gross profit +other income - expenses
Cost of sales = OS + NP + D/E -CS
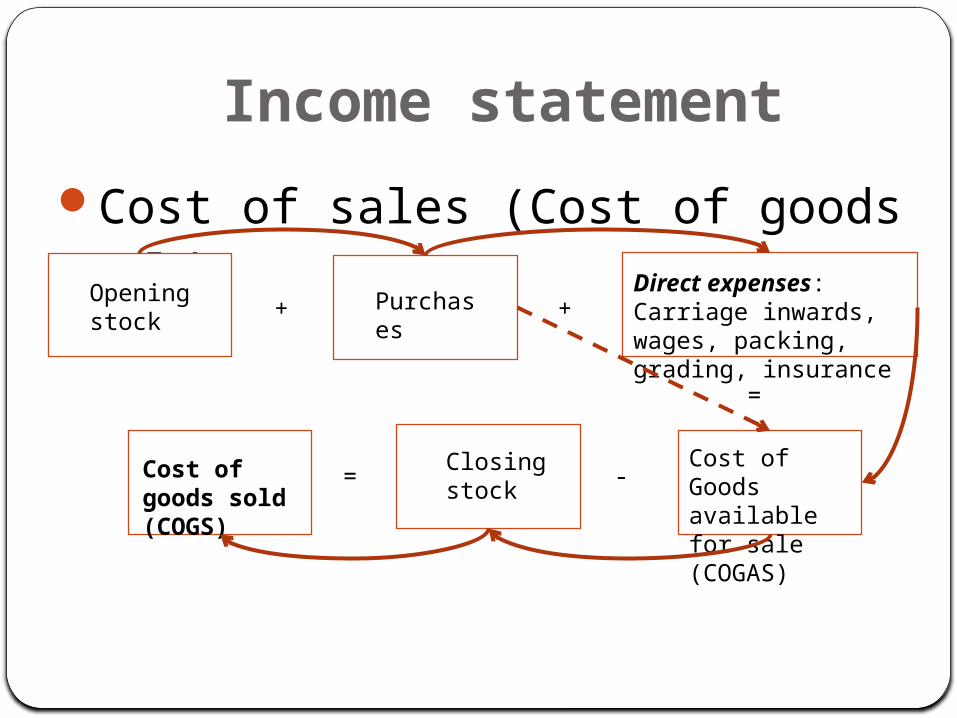
Income statementCost of sales (Cost of goods sold)Opening stock
Cost of Goods available for sale (COGAS)
Purchases
Cost of goods sold (COGS)
Direct expenses: Carriage inwards, wages, packing, grading, insurance
Closing stock
+ +
=
-=
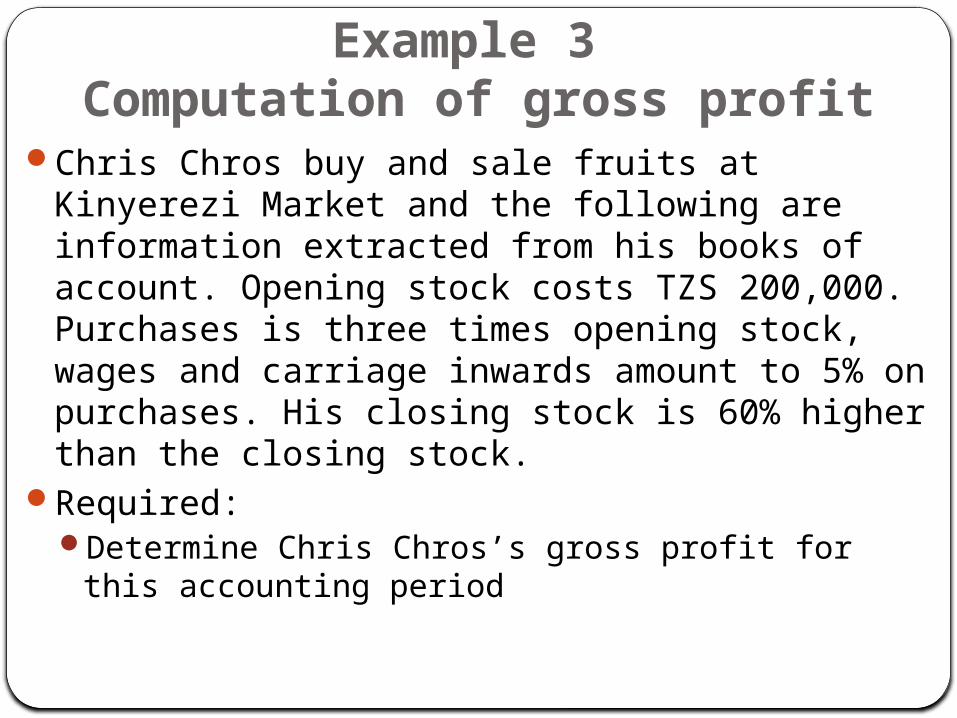
Example 3 Computation of gross profit
Chris Chros buy and sale fruits at Kinyerezi Market and the following are information extracted from his books of account. Opening stock costs TZS 200,000. Purchases is three times opening stock, wages and carriage inwards amount to 5% on purchases. His closing stock is 60% higher than the closing stock.
Required: Determine Chris Chros’s gross profit for this accounting period
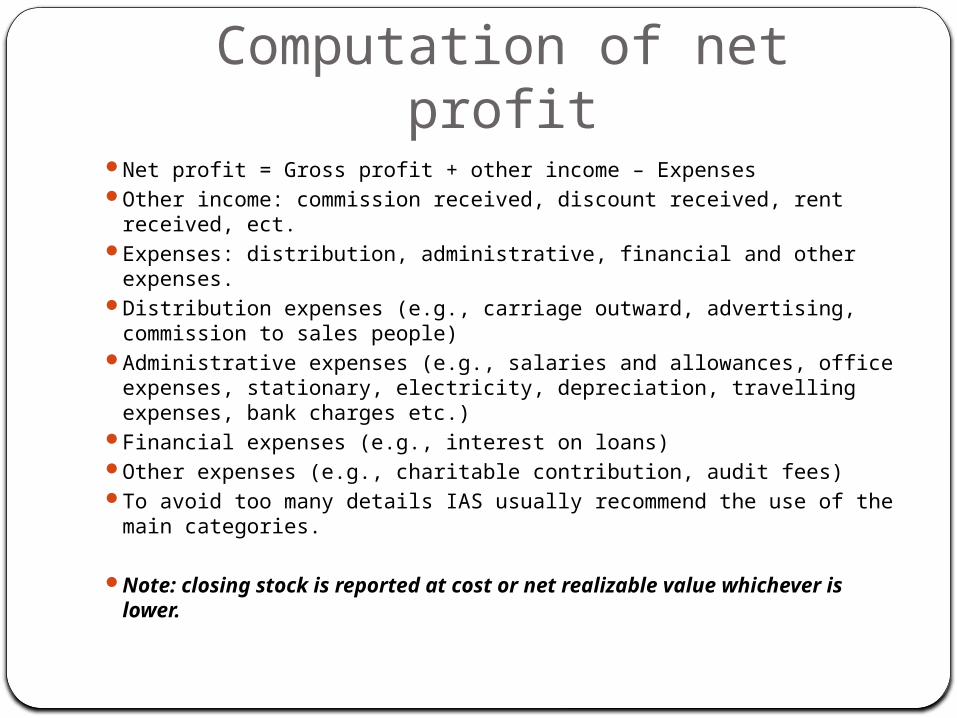
Computation of net profit
Net profit = Gross profit + other income – ExpensesOther income: commission received, discount received, rent received, ect.
Expenses: distribution, administrative, financial and other expenses.
Distribution expenses (e.g., carriage outward, advertising, commission to sales people)
Administrative expenses (e.g., salaries and allowances, office expenses, stationary, electricity, depreciation, travelling expenses, bank charges etc.)
Financial expenses (e.g., interest on loans)Other expenses (e.g., charitable contribution, audit fees)To avoid too many details IAS usually recommend the use of the main categories.
Note: closing stock is reported at cost or net realizable value whichever is lower.
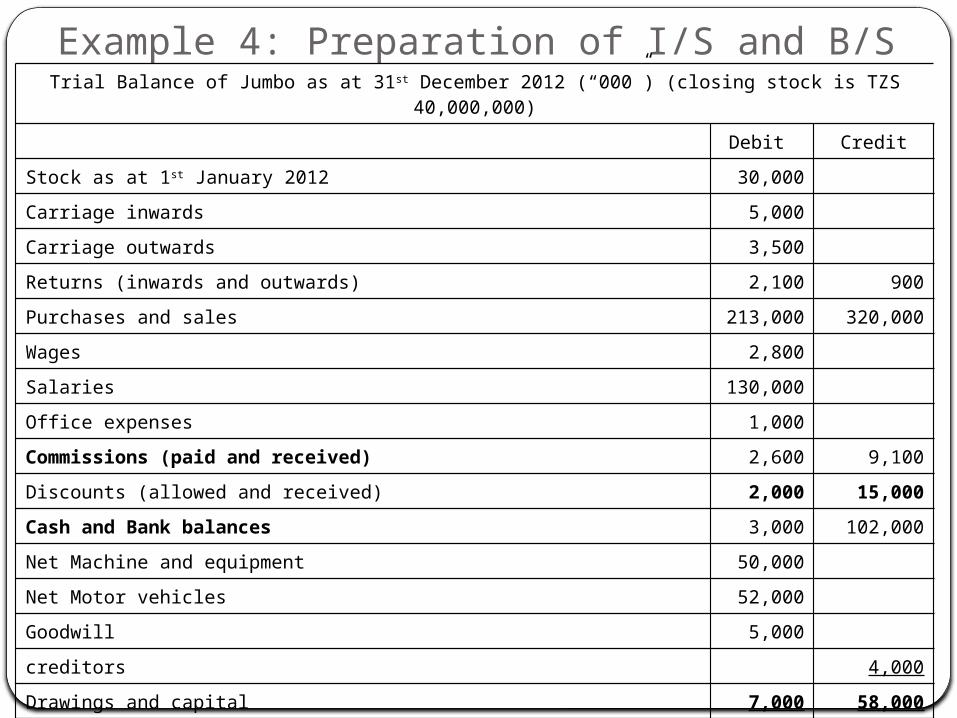
Example 4: Preparation of I/S and B/STrial Balance of Jumbo as at 31st December 2012 (“000”) (closing stock is TZS
40,000,000)Debit Credit
Stock as at 1st January 2012 30,000Carriage inwards 5,000Carriage outwards 3,500Returns (inwards and outwards) 2,100 900Purchases and sales 213,000 320,000Wages 2,800Salaries 130,000Office expenses 1,000Commissions (paid and received) 2,600 9,100Discounts (allowed and received) 2,000 15,000Cash and Bank balances 3,000 102,000Net Machine and equipment 50,000Net Motor vehicles 52,000Goodwill 5,000creditors 4,000Drawings and capital 7,000 58,000Total 509,000 509,000
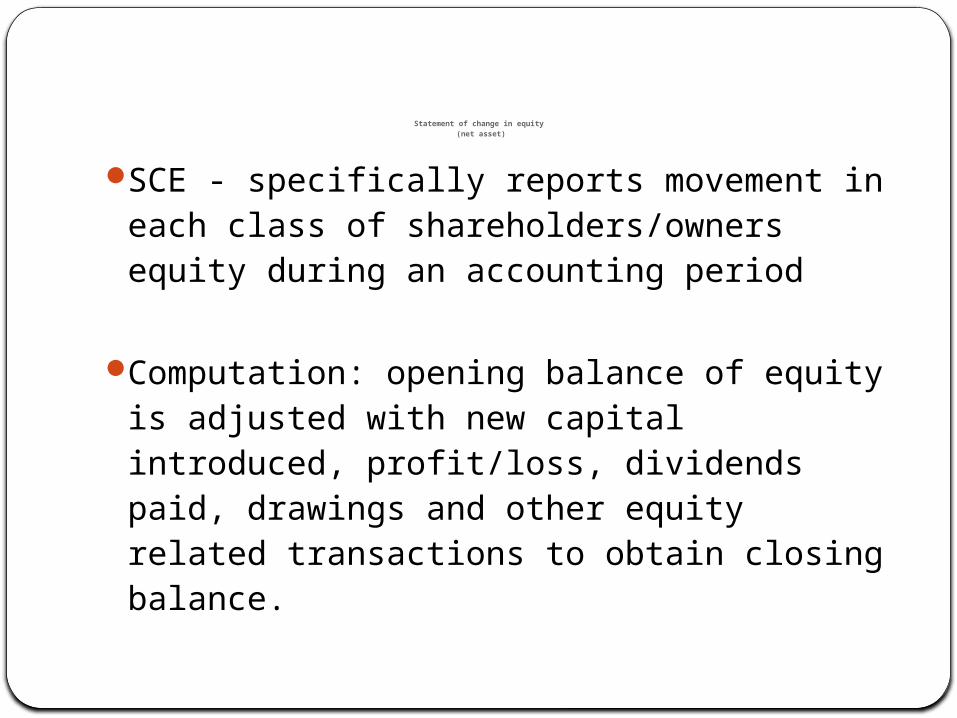
Statement of change in equity (net asset)
SCE - specifically reports movement in each class of shareholders/owners equity during an accounting period
Computation: opening balance of equity is adjusted with new capital introduced, profit/loss, dividends paid, drawings and other equity related transactions to obtain closing balance.
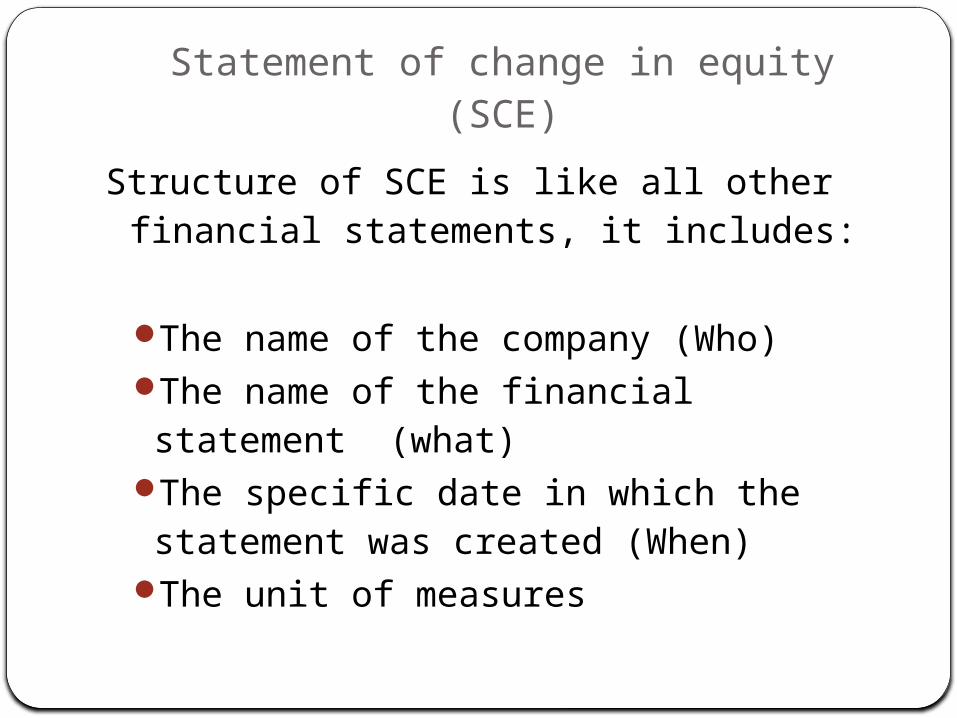
Statement of change in equity (SCE)
Structure of SCE is like all other financial statements, it includes:
The name of the company (Who)The name of the financial statement (what)
The specific date in which the statement was created (When)
The unit of measures
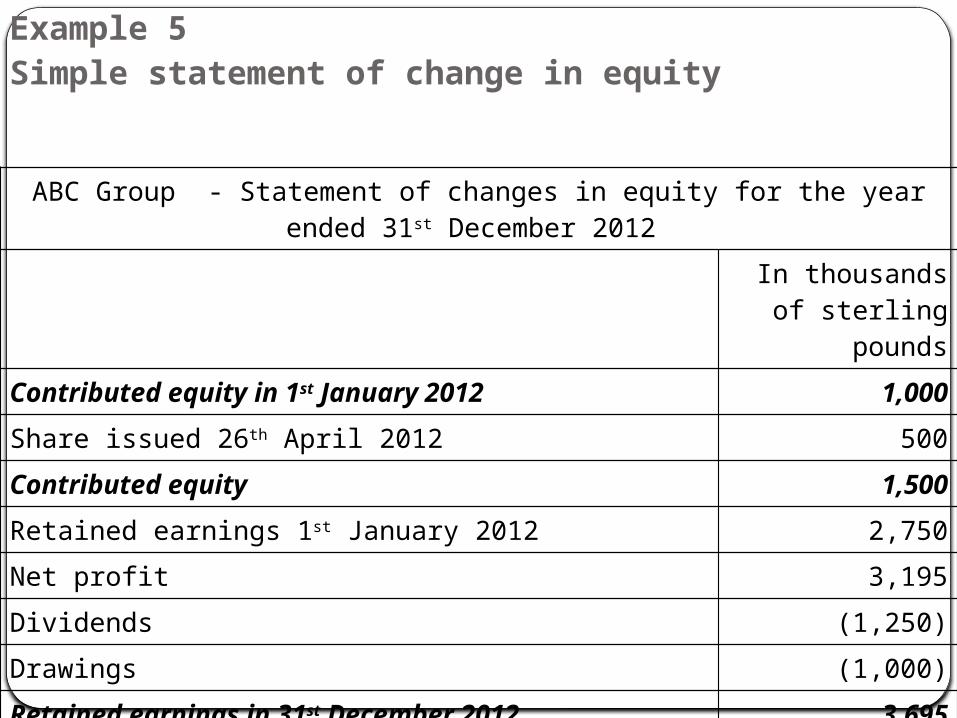
Example 5 Simple statement of change in equity
ABC Group - Statement of changes in equity for the year ended 31st December 2012
In thousands of sterling
poundsContributed equity in 1st January 2012 1,000Share issued 26th April 2012 500Contributed equity 1,500Retained earnings 1st January 2012 2,750Net profit 3,195Dividends (1,250)Drawings (1,000)Retained earnings in 31st December 2012 3,695Total equity in 31st December 2012 5,195
Relationships among financial statements
The income statement reports a company's financial performance while the balance sheet reports its financial health. One proceeds from the other. A company's financial performance regulates its financial health. Performance and health are linked through the net income account on the income statement and the equity account on the balance sheet
The bottom line of I/S represents profit or loss. The company can either distribute the profit directly to the owner as dividend, or it can reinvest the profit in the business. In either case, the profit is reflected in the owner's equity section of the balance sheet. The expanded accounting equation is an affirmation of the interrelationship between the income statement and the balance sheet
The expanded accounting equation incorporates income statement accounts into the basic accounting equation as follows: Assets = Liabilities + [Owner’s Equity + Revenues – Expenses (profit) – Drawings]. The expanded accounting equation is implicit in all financial statements

THANK YOUYou are advised to read IAS
1 for detail about this topic