
Financial statements - QinetiQ
58
Financial statements 126 QinetiQ Group plc
-
Upload
khangminh22 -
Category
Documents
-
view
2 -
download
0
Transcript of Financial statements - QinetiQ

Financial statements
126 QinetiQ Group plc

Consolidated income statement 128
Consolidated comprehensive income statement 129
Consolidated statement of changes in equity 129
Consolidated balance sheet 130
Consolidated cash flow statement 131
Reconciliation of movements in net cash 131
Notes to the financial statements 132
Company balance sheet 176
Company statement of changes in equity 177
Notes to the Company financial statements 178
127Annual Report & Accounts 2021
Financial Statements

Consolidated income statement For the year ended 31 March
QinetiQ Group plc Annual Report and Accounts 2021 128
* Alternative performance measures are used to supplement the statutory figures. These are additional financial indicators used by management internally to assess the underlying performance of the Group. Definitions can be found on page 183. Also refer to notes 4 and 36 for details of ‘specific adjusting items’.
2021 2020
All figures in £ million Note Underlying*
Specific adjusting
Items* Total Underlying*
Specific adjusting
Items* Total
Revenue 2, 3 1,278.2 – 1,278.2 1,072.9 – 1,072.9
Other operating costs excluding depreciation and amortisation (1,086.0) (2.8) (1,088.8) (903.6) (8.0) (911.6)
Other income 2 9.9 0.1 10.0 9.2 14.0 23.2
EBITDA (earnings before interest, tax, depreciation
and amortisation) 202.1 ((22..77)) 199.4 178.5 66..00 184.5
Depreciation and impairment of property, plant and equipment 3, 4, 16 (45.6) (0.5) (46.1) (41.0) – (41.0)
Impairment of goodwill 4, 14 – (25.4) (25.4) – (14.1) (14.1)
Amortisation and impairment of intangible assets 3, 4, 15 (4.7) (10.9) (15.6) (4.3) (7.5) (11.8)
Operating profit 3 151.8 ((3399..55)) 112.3 133.2 (15.6) 117.6
Gain on business divestments 13 – 28.4 28.4 – – –
Gain on sale of investments – 0.3 0.3 – – –
Finance income 7 0.3 7.1 7.4 1.1 6.5 7.6
Finance expense 7 (2.2) – (2.2) (2.1) – (2.1)
Profit/(loss) before tax 8 149.9 (3.7) 146.2 132.2 (9.1) 123.1
Taxation (charge)/income 9 (23.8) 2.3 (21.5) (18.5) 1.9 (16.6)
Profit for the year 126.1 (1.4) 124.7 113.7 (7.2) 106.5
Profit is attributable to Owners of the parent company 125.9 (1.4) 124.5 113.5 (7.2) 106.3
Non-controlling interests 0.2 – 0.2 0.2 – 0.2
Profit for the year 126.1 (1.4) 124.7 113.7 (7.2) 106.5
Earnings per share for profit attributable to
the owners of the parent company 2021 2020
All figures in pence Note Underlying* Total Underlying* Total
Basic 10 22.1p 21.9p 20.0p 18.7p
Diluted 10 21.9p 21.6p 19.8p 18.6p
128 QinetiQ Group plc

Consolidated comprehensive income statement For the year ended 31 March
QinetiQ Group plc Annual Report and Accounts 2021 129
Financial Statements
Consolidated statement of changes in equity For the year ended 31 March
All figures in £ million Share
capital
Capital redemption
reserve Share
premium Hedge
reserve Translation
reserve Retained earnings Total
Non-controlling
interest Total
equity
At 1 April 2020 5.7 40.8 147.6 0.4 8.3 681.9 884.7 2.4 887.1
Profit for the year – – – – – 124.5 124.5 0.2 124.7
Other comprehensive expense for the year, net of tax – – – (0.8) (11.2) (84.3) (96.3) – (96.3)
Purchase of own shares – – – – – (9.0) (9.0) – (9.0)
Share settled liabilities – – – – – 13.7 13.7 – 13.7
Share-based payments – – – – – 10.6 10.6 – 10.6
Deferred tax on share options – – – – – 0.5 0.5 – 0.5
Transactions with NCI (note 12) – – – – – (1.6) (1.6) (2.3) (3.9)
Dividends – – – – – (37.7) (37.7) – (37.7)
At 31 March 2021 5.7 40.8 147.6 (0.4) (2.9) 698.6 889.4 0.3 889.7
At 31 March 2019 – previously reported 5.7 40.8 147.6 (0.2) 3.8 581.1 778.8 2.2 781.0
Restatement in respect of IFRS 16 – – – – – (2.0) (2.0) – (2.0)
At 31 March 2019 – restated 5.7 40.8 147.6 (0.2) 3.8 579.1 776.8 2.2 779.0
Change in accounting policy – IFRIC 23 – – – – – 2.1 2.1 – 2.1
At 1 April 2019 5.7 40.8 147.6 (0.2) 3.8 581.2 778.9 2.2 781.1
Profit for the year – – – – – 106.3 106.3 0.2 106.5
Other comprehensive income for the year, net of tax – – – 0.6 4.5 27.1 32.2 – 32.2
Purchase of own shares – – – – – (0.7) (0.7) – (0.7)
Share-based payments – – – – – 6.8 6.8 – 6.8
Deferred tax on share options – – – – – (0.8) (0.8) – (0.8)
Dividends – – – – – (38.0) (38.0) – (38.0)
At 31 March 2020 5.7 40.8 147.6 0.4 8.3 681.9 884.7 2.4 887.1 .
All figures in £ million 2021 2020
Profit for the year 124.7 106.5
Items that will not be reclassified to profit or loss:
Actuarial (loss)/gain recognised in defined benefit pension schemes (104.1) 39.8
Tax on items that will not be reclassified to profit and loss 19.8 (12.7)
Total items that will not be reclassified to profit or loss (84.3) 27.1
Items that may be reclassified to profit or loss:
Foreign currency translation (losses)/gains on foreign operations (12.0) 5.1
Movement in deferred tax on foreign currency translation 0.8 (0.6)
(Decrease)/Increase in the fair value of hedging derivatives (1.0) 0.8
Movement in deferred tax on hedging derivatives 0.2 (0.2)
Total items that may be reclassified to profit or loss (12.0) 5.1
Other comprehensive (expense)/income for the year, net of tax (96.3) 32.2
Total comprehensive income for the year 28.4 138.7
Total comprehensive income is attributable to:
Owners of the parent company 28.2 138.5
Non-controlling interests 0.2 0.2
Total comprehensive income for the year 28.4 138.7
129Annual Report & Accounts 2021
Financial Statements

Consolidated balance sheet As at 31 March
QinetiQ Group plc Annual Report and Accounts 2021 130
The financial statements on pages 132 to 179 were approved by the Board of Directors and authorised for issue on 20 May 2021 and were signed on its behalf by:
Steve Wadey David Smith
Chief Executive Officer Chief Financial Officer
All figures in £ million Note 2021 2020
Non-current assets
Goodwill 14 145.5 180.8
Intangible assets 15 139.2 138.9
Property, plant and equipment 16 397.2 375.6
Other financial assets 24 0.8 1.0
Financial assets at fair value through profit and loss 13 0.9 –
Equity accounted investments 17 4.2 3.6
Retirement benefit surplus 28 214.3 309.7
Deferred tax asset 18 11.7 13.3
913.8 1,022.9
Current assets
Inventories 20 54.4 52.3
Other financial assets 24 0.9 6.7
Trade and other receivables 21 326.7 250.0
Current tax asset 19 0.7 0.2
Cash and cash equivalents 24 190.1 105.8
572.8 415.0
Total assets 1,486.6 1,437.9
Current liabilities
Trade and other payables 22 (411.7) (379.8)
Current tax payable 19 (3.8) (4.1)
Provisions 23 (4.2) (1.8)
Other financial liabilities 24 (7.0) (8.9)
(426.7) (394.6)
Non-current liabilities
Deferred tax liability 18 (89.7) (101.3)
Provisions 23 (7.8) (9.7)
Other financial liabilities 24 (20.7) (19.9)
Other payables 22 (52.0) (25.3)
(170.2) (156.2)
Total liabilities (596.9) (550.8)
Net assets 889.7 887.1
Equity
Ordinary shares 29 5.7 5.7
Capital redemption reserve 40.8 40.8
Share premium account 147.6 147.6
Hedging reserve (0.4) 0.4
Translation reserve (2.9) 8.3
Retained earnings 698.6 681.9
Capital and reserves attributable to shareholders of the parent company 889.4 884.7
Non-controlling interest 0.3 2.4
Total equity 889.7 887.1
130 QinetiQ Group plc
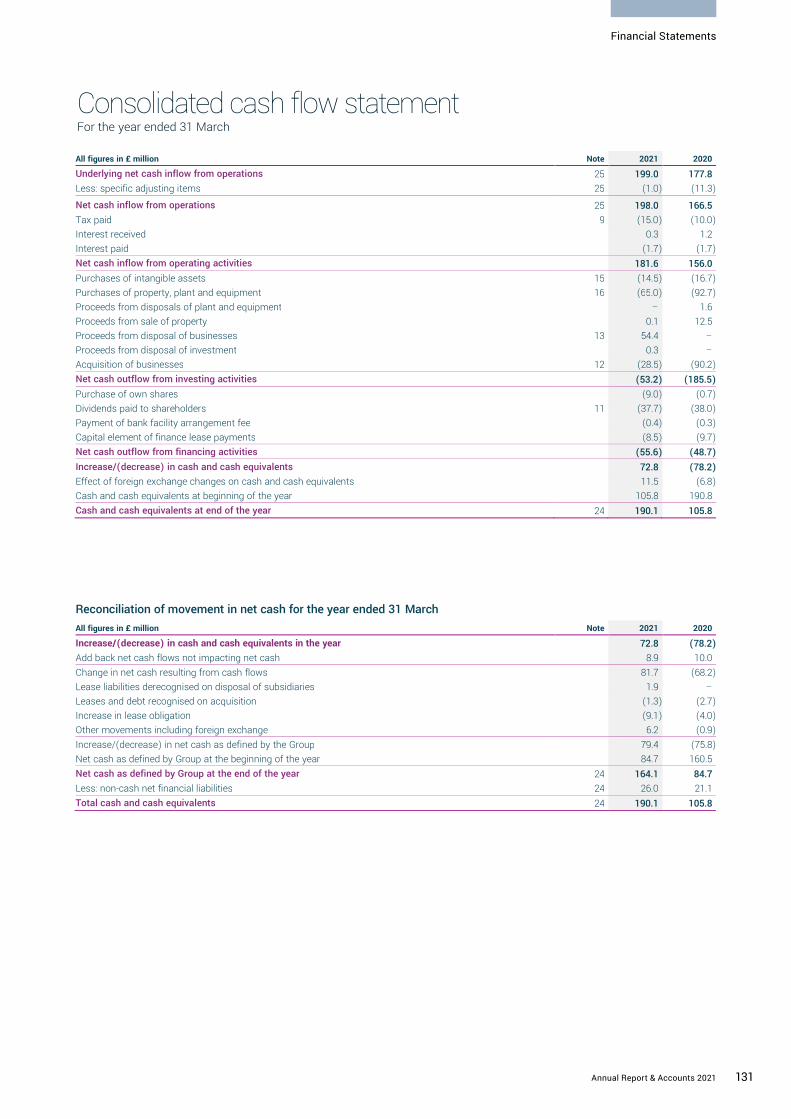
Consolidated cash flow statement For the year ended 31 March
QinetiQ Group plc Annual Report and Accounts 2021 131
Financial Statements
Reconciliation of movement in net cash for the year ended 31 March
All figures in £ million Note 2021 2020
Underlying net cash inflow from operations 25 199.0 177.8
Less: specific adjusting items 25 (1.0) (11.3)
Net cash inflow from operations 25 198.0 166.5
Tax paid 9 (15.0) (10.0)
Interest received 0.3 1.2
Interest paid (1.7) (1.7)
Net cash inflow from operating activities 181.6 156.0
Purchases of intangible assets 15 (14.5) (16.7)
Purchases of property, plant and equipment 16 (65.0) (92.7)
Proceeds from disposals of plant and equipment – 1.6
Proceeds from sale of property 0.1 12.5
Proceeds from disposal of businesses 13 54.4 –
Proceeds from disposal of investment 0.3 –
Acquisition of businesses 12 (28.5) (90.2)
Net cash outflow from investing activities (53.2) (185.5)
Purchase of own shares (9.0) (0.7)
Dividends paid to shareholders 11 (37.7) (38.0)
Payment of bank facility arrangement fee (0.4) (0.3)
Capital element of finance lease payments (8.5) (9.7)
Net cash outflow from financing activities (55.6) (48.7)
Increase/(decrease) in cash and cash equivalents 72.8 (78.2)
Effect of foreign exchange changes on cash and cash equivalents 11.5 (6.8)
Cash and cash equivalents at beginning of the year 105.8 190.8
Cash and cash equivalents at end of the year 24 190.1 105.8
All figures in £ million Note 2021 2020
Increase/(decrease) in cash and cash equivalents in the year 72.8 (78.2)
Add back net cash flows not impacting net cash 8.9 10.0
Change in net cash resulting from cash flows 81.7 (68.2)
Lease liabilities derecognised on disposal of subsidiaries 1.9 –
Leases and debt recognised on acquisition (1.3) (2.7)
Increase in lease obligation (9.1) (4.0)
Other movements including foreign exchange 6.2 (0.9)
Increase/(decrease) in net cash as defined by the Group 79.4 (75.8)
Net cash as defined by Group at the beginning of the year 84.7 160.5
Net cash as defined by Group at the end of the year 24 164.1 84.7
Less: non-cash net financial liabilities 24 26.0 21.1
Total cash and cash equivalents 24 190.1 105.8
131Annual Report & Accounts 2021
Financial Statements

Notes to the Financial Statements For the year ended 31 March
QinetiQ Group plc Annual Report and Accounts 2021 132
1. Significant changes in the current reporting period
The financial position and performance of the Group was particularly affected by the following events and transactions during the reporting period:
1) The acquisition of Naimuri Limited (see note 12) which resulted in an increase in goodwill (note 14) and other intangible assets (note 15);
2) The divestment of the Boldon James, Commerce Decisions and OptaSense businesses (see note 13); 3) An impairment of goodwill in respect of the Germany business (see note 14).
For a detailed discussion of the Group’s performance and financial position refer to the Strategic Report on pages 2 to 51.
2. Revenue from contracts with customers and other income
Revenue and other income is analysed as follows:
Revenue by category and other income For the year ended 31 March
1 For the period of which there was no contribution in the equivalent period in the comparator year which was pre-ownership (for acquisitions) or post-ownership (for disposals) by the Group
2 Alternative performance measures are used to supplement the statutory figures. See page 183.
Other income
Revenue and profit after tax of associates and joint ventures was £12.6m and £1.1m respectively (2020: revenue of £18.1m and loss after tax of £1.5m). The figures in the table above represent the Group share of this profit after tax.
Other income is in respect of property rentals and the recovery of other related property costs.
Revenue by customer geographic location For the year ended 31 March
All figures in £ million 2021 2020
Services contracts with customers 1,189.4 945.6
Sale of goods contracts with customers 83.0 116.8
Royalties and licences 5.8 10.5
Total revenue 1,278.2 1,072.9
Less: adjust current year for acquired businesses1 (117.2) –
Less: adjust prior year for disposed businesses1 – (17.2)
Adjust to constant prior year exchange rates 2.2 –
Total revenue on an organic, constant currency basis2 1,163.2 1,055.7
Organic revenue growth at constant currency2 10% 10%
All figures in £ million 2021 2020
Share of associates’ and joint ventures’ profit/(loss) after tax 0.7 (0.7)
Other income 9.2 9.9
Other income – underlying 9.9 9.2
Specific adjusting item: gain on sale of property (note 4) 0.1 14.0
Total other income 10.0 23.2
All figures in £ million 2021 2020
US 215.6 136.0
Australia 77.9 60.7
Europe 88.2 75.9
Middle east 9.8 16.3
Rest of world 28.9 44.5
International 420.4 333.4
United Kingdom 857.8 739.5
Total revenue 1,278.2 1,072.9
International revenue % 33% 31%
Revenue from ‘home countries’ (UK, US and Australia) 1,151.3 936.2
Home countries revenue % 90% 87%
132 QinetiQ Group plc

Notes to the Financial Statements continued
QinetiQ Group plc Annual Report and Accounts 2021 133
Financial Statements
Revenue by major customer type For the year ended 31 March
‘Other’ does not contain any customers with revenue in excess of 10% of total Group revenue.
The following table shows the aggregate amount of revenue allocated to performance obligations that are unsatisfied (or partially satisfied) as at the end of the reporting period:
Management expects that 27% (£800.5m) of revenue allocated to unsatisfied contracts as of 31 March 2021 will be recognised as revenue during the next reporting period.
The following table shows the aggregate amount of revenue allocated to performance obligations that were unsatisfied (or partially satisfied) as at the end of the prior reporting period:
Revenue of £144m was recognised during the year that was previously unrecognised as at the previous year end and reported as a contract liability.
3. Segmental analysis
The analysis by business segment is presented in accordance with IFRS 8 Operating Segments, on the basis of those reportable segments whose operating results are regularly reviewed by the Board (the Chief Operating Decision Maker as defined by IFRS 8) and are aligned with the Group’s strategic direction, determined with reference to the products and services they provide, as follows:
EMEA Services provides technical assurance, test and evaluation and training services, underpinned by long-term contracts. EMEA Services comprises the following business units which are not considered reportable segments as defined by IFRS 8: Maritime & Land; Air & Space, Cyber & Information and the International business.
Global Products combines all other business units not aggregated within EMEA Services, including the QinetiQ US business, Space Products and EMEA Products (which includes QinetiQ Target Systems). Generally these business units (which are not considered reportable segments as defined by IFRS 8) deliver innovative solutions and products which includes contract-funded research and development and developing intellectual property in partnership with key customers and through internal funding with potential for new revenue streams.
Operating segments
1 The measure of profit presented to the Chief Operating Decision Maker is operating profit stated before specific adjusting items (‘underlying operating profit’). The specific adjusting items are detailed in note 4.
2 Definitions of the Group’s ‘Alternative performance measures’ can be found in the glossary on page 183.
No measure of segmental assets and liabilities is reported as this information is not regularly provided to the Chief Operating Decision Maker.
All figures in £ million 2021 2020
UK government 794.6 667.2
US government 140.8 116.2
Other 342.8 289.5
Total revenue 1,278.2 1,072.9
All figures in £ million 2022 2023 2024 2025+ Total
Total forecast revenue allocated to unsatisfied performance obligations 800.5 523.9 395.9 1,223.8 2,944.1
All figures in £ million 2021 2022 2023 2024+ Total
Total forecast revenue allocated to unsatisfied performance obligations 849.3 484.9 375.5 1,395.2 3,104.9
2021 2020
All figures in £ million
Revenue from
external customers
Underlying operating
profit1
Revenue from
external customers
Underlying operating
profit1
EMEA Services 939.9 118.6 797.4 100.6
Global Products 338.3 33.2 275.5 32.6
Total operating segments 1,278.2 151.8 1,072.9 133.2
Underlying operating margin2 11.9% 12.4%
133Annual Report & Accounts 2021
Financial Statements

Notes to the Financial Statements For the year ended 31 March
QinetiQ Group plc Annual Report and Accounts 2021 132
1. Significant changes in the current reporting period
The financial position and performance of the Group was particularly affected by the following events and transactions during the reporting period:
1) The acquisition of Naimuri Limited (see note 12) which resulted in an increase in goodwill (note 14) and other intangible assets (note 15);
2) The divestment of the Boldon James, Commerce Decisions and OptaSense businesses (see note 13); 3) An impairment of goodwill in respect of the Germany business (see note 14).
For a detailed discussion of the Group’s performance and financial position refer to the Strategic Report on pages 2 to 51.
2. Revenue from contracts with customers and other income
Revenue and other income is analysed as follows:
Revenue by category and other income For the year ended 31 March
1 For the period of which there was no contribution in the equivalent period in the comparator year which was pre-ownership (for acquisitions) or post-ownership (for disposals) by the Group
2 Alternative performance measures are used to supplement the statutory figures. See page 183.
Other income
Revenue and profit after tax of associates and joint ventures was £12.6m and £1.1m respectively (2020: revenue of £18.1m and loss after tax of £1.5m). The figures in the table above represent the Group share of this profit after tax.
Other income is in respect of property rentals and the recovery of other related property costs.
Revenue by customer geographic location For the year ended 31 March
All figures in £ million 2021 2020
Services contracts with customers 1,189.4 945.6
Sale of goods contracts with customers 83.0 116.8
Royalties and licences 5.8 10.5
Total revenue 1,278.2 1,072.9
Less: adjust current year for acquired businesses1 (117.2) –
Less: adjust prior year for disposed businesses1 – (17.2)
Adjust to constant prior year exchange rates 2.2 –
Total revenue on an organic, constant currency basis2 1,163.2 1,055.7
Organic revenue growth at constant currency2 10% 10%
All figures in £ million 2021 2020
Share of associates’ and joint ventures’ profit/(loss) after tax 0.7 (0.7)
Other income 9.2 9.9
Other income – underlying 9.9 9.2
Specific adjusting item: gain on sale of property (note 4) 0.1 14.0
Total other income 10.0 23.2
All figures in £ million 2021 2020
US 215.6 136.0
Australia 77.9 60.7
Europe 88.2 75.9
Middle east 9.8 16.3
Rest of world 28.9 44.5
International 420.4 333.4
United Kingdom 857.8 739.5
Total revenue 1,278.2 1,072.9
International revenue % 33% 31%
Revenue from ‘home countries’ (UK, US and Australia) 1,151.3 936.2
Home countries revenue % 90% 87%
Notes to the Financial Statements For the year ended 31 March
QinetiQ Group plc Annual Report and Accounts 2021 134
3. Segmental analysis (continued)
Reconciliation of segmental results to total profit
Non-current assets* by geographic location
*Excluding deferred tax, financial instruments and retirement benefit surplus.
Depreciation, impairment and amortisation by business segment – excluding specific adjusting items For the year ended 31 March 2021
For the year ended 31 March 2020
All figures in £ million Note 2021 2020
Underlying operating profit 151.8 133.2
Specific adjusting items operating loss 4 (39.5) (15.6)
Operating profit 112.3 117.6
Gain on business divestments 13 28.4 –
Gain on sale of investments 0.3 –
Net finance income 7 5.2 5.5
Profit before tax 146.2 123.1
Taxation expense 9 (21.5) (16.6)
Profit for the year 124.7 106.5
All figures in £ million UK USA Germany Rest of
world Total
Year ended 31 March 2021 468.6 132.2 41.6 39.5 681.9
Year ended 31 March 2020 442.3 144.1 67.7 41.2 695.3
All figures in £ million EMEA
Services Global
Products Total
Depreciation and impairment of property, plant and equipment 38.7 6.9 45.6
Amortisation of purchased or internally developed intangible assets 3.3 1.4 4.7
42.0 8.3 50.3
All figures in £ million EMEA
Services Global
Products Total
Depreciation and impairment of property, plant and equipment 35.5 5.5 41.0
Amortisation of purchased or internally developed intangible assets 3.4 0.9 4.3
38.9 6.4 45.3
134 QinetiQ Group plc

Notes to the Financial Statements continued
QinetiQ Group plc Annual Report and Accounts 2021 133
Financial Statements
Revenue by major customer type For the year ended 31 March
‘Other’ does not contain any customers with revenue in excess of 10% of total Group revenue.
The following table shows the aggregate amount of revenue allocated to performance obligations that are unsatisfied (or partially satisfied) as at the end of the reporting period:
Management expects that 27% (£800.5m) of revenue allocated to unsatisfied contracts as of 31 March 2021 will be recognised as revenue during the next reporting period.
The following table shows the aggregate amount of revenue allocated to performance obligations that were unsatisfied (or partially satisfied) as at the end of the prior reporting period:
Revenue of £144m was recognised during the year that was previously unrecognised as at the previous year end and reported as a contract liability.
3. Segmental analysis
The analysis by business segment is presented in accordance with IFRS 8 Operating Segments, on the basis of those reportable segments whose operating results are regularly reviewed by the Board (the Chief Operating Decision Maker as defined by IFRS 8) and are aligned with the Group’s strategic direction, determined with reference to the products and services they provide, as follows:
EMEA Services provides technical assurance, test and evaluation and training services, underpinned by long-term contracts. EMEA Services comprises the following business units which are not considered reportable segments as defined by IFRS 8: Maritime & Land; Air & Space, Cyber & Information and the International business.
Global Products combines all other business units not aggregated within EMEA Services, including the QinetiQ US business, Space Products and EMEA Products (which includes QinetiQ Target Systems). Generally these business units (which are not considered reportable segments as defined by IFRS 8) deliver innovative solutions and products which includes contract-funded research and development and developing intellectual property in partnership with key customers and through internal funding with potential for new revenue streams.
Operating segments
1 The measure of profit presented to the Chief Operating Decision Maker is operating profit stated before specific adjusting items (‘underlying operating profit’). The specific adjusting items are detailed in note 4.
2 Definitions of the Group’s ‘Alternative performance measures’ can be found in the glossary on page 183.
No measure of segmental assets and liabilities is reported as this information is not regularly provided to the Chief Operating Decision Maker.
All figures in £ million 2021 2020
UK government 794.6 667.2
US government 140.8 116.2
Other 342.8 289.5
Total revenue 1,278.2 1,072.9
All figures in £ million 2022 2023 2024 2025+ Total
Total forecast revenue allocated to unsatisfied performance obligations 800.5 523.9 395.9 1,223.8 2,944.1
All figures in £ million 2021 2022 2023 2024+ Total
Total forecast revenue allocated to unsatisfied performance obligations 849.3 484.9 375.5 1,395.2 3,104.9
2021 2020
All figures in £ million
Revenue from
external customers
Underlying operating
profit1
Revenue from
external customers
Underlying operating
profit1
EMEA Services 939.9 118.6 797.4 100.6
Global Products 338.3 33.2 275.5 32.6
Total operating segments 1,278.2 151.8 1,072.9 133.2
Underlying operating margin2 11.9% 12.4%
Notes to the Financial Statements continued
QinetiQ Group plc Annual Report and Accounts 2021 135
Financial Statements
4. Specific adjusting items
In the income statement, the Group presents specific adjusting items separately. In the judgement of the Directors, for the reader to obtain a proper understanding of the financial information, specific adjusting items need to be disclosed separately because of their size and nature. Further explanation of this rationale is provided in note 36 (Accounting Policies). Underlying measures of performance exclude specific adjusting items. The following specific adjusting items have been (charged)/credited in the consolidated income statement:
Reconciliation of underlying profit for the year to total profit for the year
* Bonuses awarded, on acquisition, to key employees within the MTEQ business acquired in December 2019 are charged to the income statement over a 24-month
retention period.
5. Analysis of employee costs and numbers
The largest component of operating expenses is employee costs. The year-end and average monthly number of persons employed by the Group, including Executive Directors, analysed by business segment, were:
The aggregate payroll costs of these persons were as follows:
All figures in £ million Note 2021 2020
Gain on sale of property 0.1 14.0
Acquisition transaction costs 12 (1.0) (7.4)
Acquisition integration costs – (0.1)
Acquisition related remuneration costs* (1.8) (0.5)
Specific adjusting items (loss)/profit before interest, tax, depreciation and amortisation (2.7) 6.0
Impairment of property (0.5) –
Impairment of goodwill 14 (25.4) (14.1)
Amortisation of intangible assets arising from acquisitions (10.9) (7.5)
Specific adjusting items operating loss (39.5) (15.6)
Gain on disposal of businesses 13 28.4 –
Gain on disposal of investment 17 0.3 –
Defined benefit pension scheme net finance income 28 7.1 6.5
Specific adjusting items loss before tax (3.7) (9.1)
Specific adjusting items – tax 9 2.3 1.9
Total specific adjusting items loss after tax (1.4) (7.2)
All figures in £ million 2021 2020
Underlying profit after tax – total Group 126.1 113.7
Total specific adjusting items loss after tax (1.4) (7.2)
Total profit for the year 124.7 106.5
As at 31 March Monthly average
2021 Number
2020 Number
2021 Number
2020 Number
EMEA Services 5,867 5,456 5,673 5,335
Global Products 1,023 1,331 1,201 932
Total employees 6,890 6,787 6,874 6,267
All figures in £ million Note 2021 2020
Wages and salaries 381.7 335.9
Social security costs 35.1 33.5
Pension costs 45.5 42.9
Share-based payments costs 30 11.2 7.5
Total employee costs 473.5 419.8
135Annual Report & Accounts 2021
Financial Statements
Notes to the Financial Statements For the year ended 31 March
QinetiQ Group plc Annual Report and Accounts 2021 132
1. Significant changes in the current reporting period
The financial position and performance of the Group was particularly affected by the following events and transactions during the reporting period:
1) The acquisition of Naimuri Limited (see note 12) which resulted in an increase in goodwill (note 14) and other intangible assets (note 15);
2) The divestment of the Boldon James, Commerce Decisions and OptaSense businesses (see note 13); 3) An impairment of goodwill in respect of the Germany business (see note 14).
For a detailed discussion of the Group’s performance and financial position refer to the Strategic Report on pages 2 to 51.
2. Revenue from contracts with customers and other income
Revenue and other income is analysed as follows:
Revenue by category and other income For the year ended 31 March
1 For the period of which there was no contribution in the equivalent period in the comparator year which was pre-ownership (for acquisitions) or post-ownership (for disposals) by the Group
2 Alternative performance measures are used to supplement the statutory figures. See page 183.
Other income
Revenue and profit after tax of associates and joint ventures was £12.6m and £1.1m respectively (2020: revenue of £18.1m and loss after tax of £1.5m). The figures in the table above represent the Group share of this profit after tax.
Other income is in respect of property rentals and the recovery of other related property costs.
Revenue by customer geographic location For the year ended 31 March
All figures in £ million 2021 2020
Services contracts with customers 1,189.4 945.6
Sale of goods contracts with customers 83.0 116.8
Royalties and licences 5.8 10.5
Total revenue 1,278.2 1,072.9
Less: adjust current year for acquired businesses1 (117.2) –
Less: adjust prior year for disposed businesses1 – (17.2)
Adjust to constant prior year exchange rates 2.2 –
Total revenue on an organic, constant currency basis2 1,163.2 1,055.7
Organic revenue growth at constant currency2 10% 10%
All figures in £ million 2021 2020
Share of associates’ and joint ventures’ profit/(loss) after tax 0.7 (0.7)
Other income 9.2 9.9
Other income – underlying 9.9 9.2
Specific adjusting item: gain on sale of property (note 4) 0.1 14.0
Total other income 10.0 23.2
All figures in £ million 2021 2020
US 215.6 136.0
Australia 77.9 60.7
Europe 88.2 75.9
Middle east 9.8 16.3
Rest of world 28.9 44.5
International 420.4 333.4
United Kingdom 857.8 739.5
Total revenue 1,278.2 1,072.9
International revenue % 33% 31%
Revenue from ‘home countries’ (UK, US and Australia) 1,151.3 936.2
Home countries revenue % 90% 87%
Notes to the Financial Statements For the year ended 31 March
QinetiQ Group plc Annual Report and Accounts 2021 136
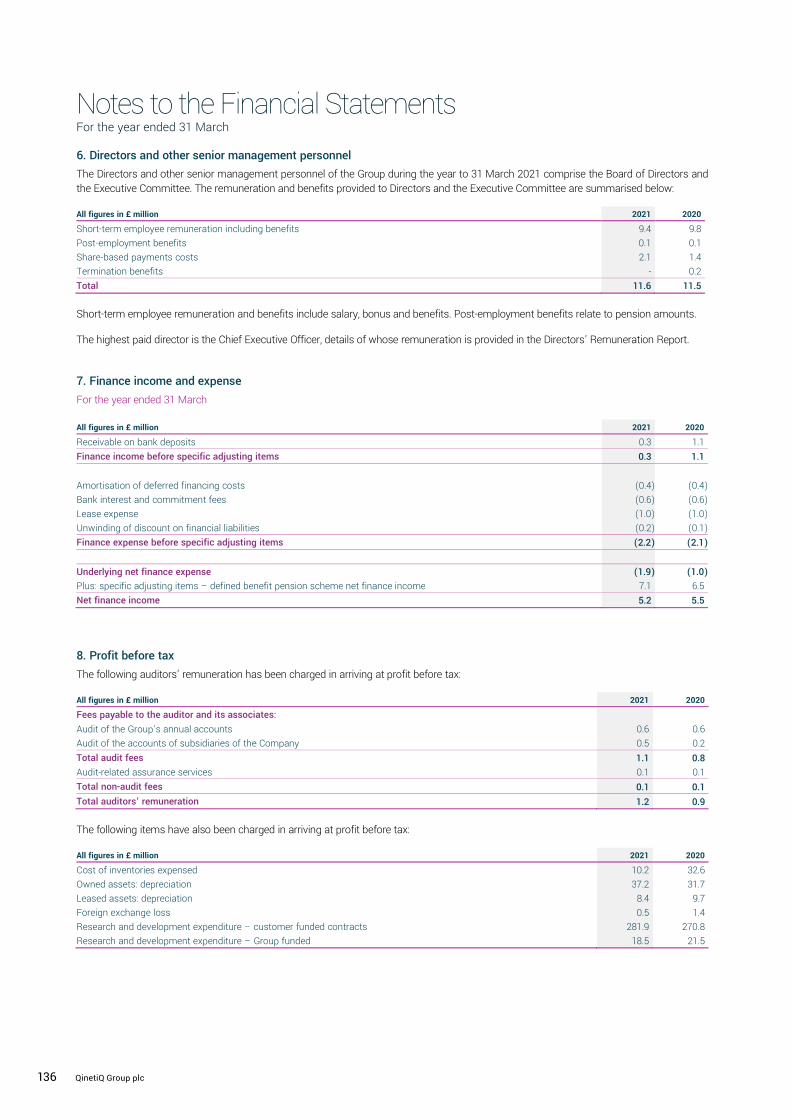
6. Directors and other senior management personnel
The Directors and other senior management personnel of the Group during the year to 31 March 2021 comprise the Board of Directors and the Executive Committee. The remuneration and benefits provided to Directors and the Executive Committee are summarised below:
Short-term employee remuneration and benefits include salary, bonus and benefits. Post-employment benefits relate to pension amounts.
The highest paid director is the Chief Executive Officer, details of whose remuneration is provided in the Directors’ Remuneration Report.
7. Finance income and expense
For the year ended 31 March
8. Profit before tax
The following auditors’ remuneration has been charged in arriving at profit before tax:
The following items have also been charged in arriving at profit before tax:
All figures in £ million 2021 2020
Cost of inventories expensed 10.2 32.6
Owned assets: depreciation 37.2 31.7
Leased assets: depreciation 8.4 9.7
Foreign exchange loss 0.5 1.4
Research and development expenditure – customer funded contracts 281.9 270.8
Research and development expenditure – Group funded 18.5 21.5
All figures in £ million 2021 2020
Short-term employee remuneration including benefits 9.4 9.8
Post-employment benefits 0.1 0.1
Share-based payments costs 2.1 1.4
Termination benefits - 0.2
Total 11.6 11.5
All figures in £ million 2021 2020
Receivable on bank deposits 0.3 1.1
Finance income before specific adjusting items 0.3 1.1
Amortisation of deferred financing costs (0.4) (0.4)
Bank interest and commitment fees (0.6) (0.6)
Lease expense (1.0) (1.0)
Unwinding of discount on financial liabilities (0.2) (0.1)
Finance expense before specific adjusting items (2.2) (2.1)
Underlying net finance expense (1.9) (1.0)
Plus: specific adjusting items – defined benefit pension scheme net finance income 7.1 6.5
Net finance income 5.2 5.5
All figures in £ million 2021 2020
Fees payable to the auditor and its associates:
Audit of the Group’s annual accounts 0.6 0.6
Audit of the accounts of subsidiaries of the Company 0.5 0.2
Total audit fees 1.1 0.8
Audit-related assurance services 0.1 0.1
Total non-audit fees 0.1 0.1
Total auditors’ remuneration 1.2 0.9
136 QinetiQ Group plc
Notes to the Financial Statements continued
QinetiQ Group plc Annual Report and Accounts 2021 133
Financial Statements
Revenue by major customer type For the year ended 31 March
‘Other’ does not contain any customers with revenue in excess of 10% of total Group revenue.
The following table shows the aggregate amount of revenue allocated to performance obligations that are unsatisfied (or partially satisfied) as at the end of the reporting period:
Management expects that 27% (£800.5m) of revenue allocated to unsatisfied contracts as of 31 March 2021 will be recognised as revenue during the next reporting period.
The following table shows the aggregate amount of revenue allocated to performance obligations that were unsatisfied (or partially satisfied) as at the end of the prior reporting period:
Revenue of £144m was recognised during the year that was previously unrecognised as at the previous year end and reported as a contract liability.
3. Segmental analysis
The analysis by business segment is presented in accordance with IFRS 8 Operating Segments, on the basis of those reportable segments whose operating results are regularly reviewed by the Board (the Chief Operating Decision Maker as defined by IFRS 8) and are aligned with the Group’s strategic direction, determined with reference to the products and services they provide, as follows:
EMEA Services provides technical assurance, test and evaluation and training services, underpinned by long-term contracts. EMEA Services comprises the following business units which are not considered reportable segments as defined by IFRS 8: Maritime & Land; Air & Space, Cyber & Information and the International business.
Global Products combines all other business units not aggregated within EMEA Services, including the QinetiQ US business, Space Products and EMEA Products (which includes QinetiQ Target Systems). Generally these business units (which are not considered reportable segments as defined by IFRS 8) deliver innovative solutions and products which includes contract-funded research and development and developing intellectual property in partnership with key customers and through internal funding with potential for new revenue streams.
Operating segments
1 The measure of profit presented to the Chief Operating Decision Maker is operating profit stated before specific adjusting items (‘underlying operating profit’). The specific adjusting items are detailed in note 4.
2 Definitions of the Group’s ‘Alternative performance measures’ can be found in the glossary on page 183.
No measure of segmental assets and liabilities is reported as this information is not regularly provided to the Chief Operating Decision Maker.
All figures in £ million 2021 2020
UK government 794.6 667.2
US government 140.8 116.2
Other 342.8 289.5
Total revenue 1,278.2 1,072.9
All figures in £ million 2022 2023 2024 2025+ Total
Total forecast revenue allocated to unsatisfied performance obligations 800.5 523.9 395.9 1,223.8 2,944.1
All figures in £ million 2021 2022 2023 2024+ Total
Total forecast revenue allocated to unsatisfied performance obligations 849.3 484.9 375.5 1,395.2 3,104.9
2021 2020
All figures in £ million
Revenue from
external customers
Underlying operating
profit1
Revenue from
external customers
Underlying operating
profit1
EMEA Services 939.9 118.6 797.4 100.6
Global Products 338.3 33.2 275.5 32.6
Total operating segments 1,278.2 151.8 1,072.9 133.2
Underlying operating margin2 11.9% 12.4%
Notes to the Financial Statements continued
QinetiQ Group plc Annual Report and Accounts 2021 137
Financial Statements
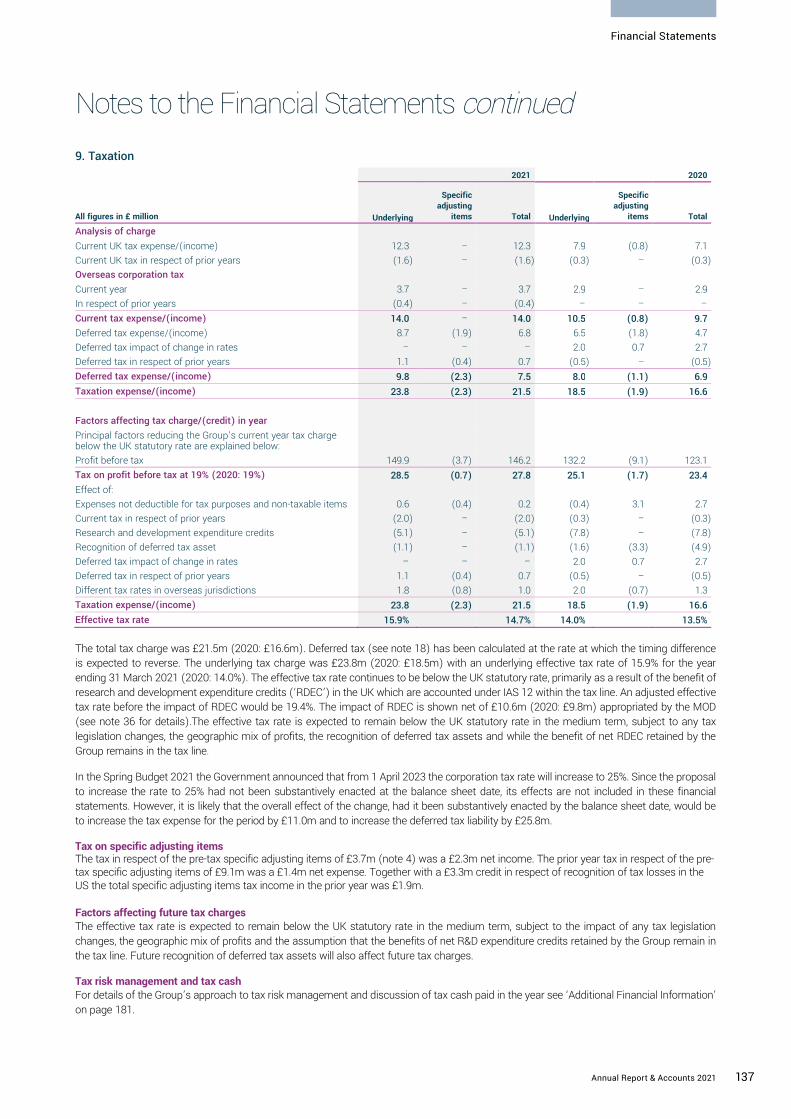
9. Taxation
The total tax charge was £21.5m (2020: £16.6m). Deferred tax (see note 18) has been calculated at the rate at which the timing difference is expected to reverse. The underlying tax charge was £23.8m (2020: £18.5m) with an underlying effective tax rate of 15.9% for the year ending 31 March 2021 (2020: 14.0%). The effective tax rate continues to be below the UK statutory rate, primarily as a result of the benefit of research and development expenditure credits (‘RDEC’) in the UK which are accounted under IAS 12 within the tax line. An adjusted effective tax rate before the impact of RDEC would be 19.4%. The impact of RDEC is shown net of £10.6m (2020: £9.8m) appropriated by the MOD (see note 36 for details).The effective tax rate is expected to remain below the UK statutory rate in the medium term, subject to any tax legislation changes, the geographic mix of profits, the recognition of deferred tax assets and while the benefit of net RDEC retained by the Group remains in the tax line.
In the Spring Budget 2021 the Government announced that from 1 April 2023 the corporation tax rate will increase to 25%. Since the proposal to increase the rate to 25% had not been substantively enacted at the balance sheet date, its effects are not included in these financial statements. However, it is likely that the overall effect of the change, had it been substantively enacted by the balance sheet date, would be to increase the tax expense for the period by £11.0m and to increase the deferred tax liability by £25.8m.
Tax on specific adjusting items The tax in respect of the pre-tax specific adjusting items of £3.7m (note 4) was a £2.3m net income. The prior year tax in respect of the pre-tax specific adjusting items of £9.1m was a £1.4m net expense. Together with a £3.3m credit in respect of recognition of tax losses in the US the total specific adjusting items tax income in the prior year was £1.9m. Factors affecting future tax charges The effective tax rate is expected to remain below the UK statutory rate in the medium term, subject to the impact of any tax legislation changes, the geographic mix of profits and the assumption that the benefits of net R&D expenditure credits retained by the Group remain in the tax line. Future recognition of deferred tax assets will also affect future tax charges.
Tax risk management and tax cash For details of the Group’s approach to tax risk management and discussion of tax cash paid in the year see ‘Additional Financial Information’ on page 181.
2021 2020
All figures in £ million Underlying
Specific adjusting
items Total Underlying
Specific adjusting
items Total
Analysis of charge
Current UK tax expense/(income) 12.3 – 12.3 7.9 (0.8) 7.1
Current UK tax in respect of prior years (1.6) – (1.6) (0.3) – (0.3)
Overseas corporation tax
Current year 3.7 – 3.7 2.9 – 2.9
In respect of prior years (0.4) – (0.4) – – –
Current tax expense/(income) 14.0 – 14.0 10.5 (0.8) 9.7
Deferred tax expense/(income) 8.7 (1.9) 6.8 6.5 (1.8) 4.7
Deferred tax impact of change in rates – – – 2.0 0.7 2.7
Deferred tax in respect of prior years 1.1 (0.4) 0.7 (0.5) – (0.5)
Deferred tax expense/(income) 9.8 (2.3) 7.5 8.0 (1.1) 6.9
Taxation expense/(income) 23.8 (2.3) 21.5 18.5 (1.9) 16.6
Factors affecting tax charge/(credit) in year
Principal factors reducing the Group’s current year tax charge below the UK statutory rate are explained below:
Profit before tax 149.9 (3.7) 146.2 132.2 (9.1) 123.1
Tax on profit before tax at 19% (2020: 19%) 28.5 (0.7) 27.8 25.1 (1.7) 23.4
Effect of:
Expenses not deductible for tax purposes and non-taxable items 0.6 (0.4) 0.2 (0.4) 3.1 2.7
Current tax in respect of prior years (2.0) – (2.0) (0.3) – (0.3)
Research and development expenditure credits (5.1) – (5.1) (7.8) – (7.8)
Recognition of deferred tax asset (1.1) – (1.1) (1.6) (3.3) (4.9)
Deferred tax impact of change in rates – – – 2.0 0.7 2.7
Deferred tax in respect of prior years 1.1 (0.4) 0.7 (0.5) – (0.5)
Different tax rates in overseas jurisdictions 1.8 (0.8) 1.0 2.0 (0.7) 1.3
Taxation expense/(income) 23.8 (2.3) 21.5 18.5 (1.9) 16.6
Effective tax rate 15.9% 14.7% 14.0% 13.5%
137Annual Report & Accounts 2021
Financial Statements
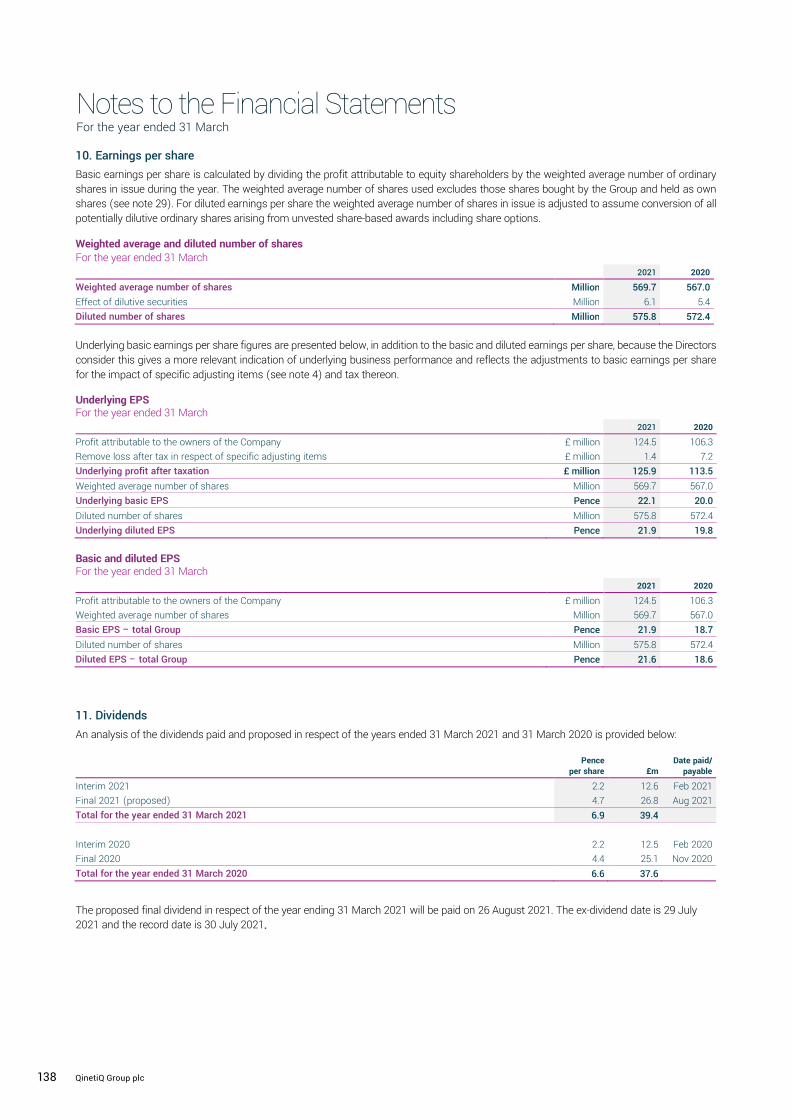
Notes to the Financial Statements For the year ended 31 March
QinetiQ Group plc Annual Report and Accounts 2021 132
1. Significant changes in the current reporting period
The financial position and performance of the Group was particularly affected by the following events and transactions during the reporting period:
1) The acquisition of Naimuri Limited (see note 12) which resulted in an increase in goodwill (note 14) and other intangible assets (note 15);
2) The divestment of the Boldon James, Commerce Decisions and OptaSense businesses (see note 13); 3) An impairment of goodwill in respect of the Germany business (see note 14).
For a detailed discussion of the Group’s performance and financial position refer to the Strategic Report on pages 2 to 51.
2. Revenue from contracts with customers and other income
Revenue and other income is analysed as follows:
Revenue by category and other income For the year ended 31 March
1 For the period of which there was no contribution in the equivalent period in the comparator year which was pre-ownership (for acquisitions) or post-ownership (for disposals) by the Group
2 Alternative performance measures are used to supplement the statutory figures. See page 183.
Other income
Revenue and profit after tax of associates and joint ventures was £12.6m and £1.1m respectively (2020: revenue of £18.1m and loss after tax of £1.5m). The figures in the table above represent the Group share of this profit after tax.
Other income is in respect of property rentals and the recovery of other related property costs.
Revenue by customer geographic location For the year ended 31 March
All figures in £ million 2021 2020
Services contracts with customers 1,189.4 945.6
Sale of goods contracts with customers 83.0 116.8
Royalties and licences 5.8 10.5
Total revenue 1,278.2 1,072.9
Less: adjust current year for acquired businesses1 (117.2) –
Less: adjust prior year for disposed businesses1 – (17.2)
Adjust to constant prior year exchange rates 2.2 –
Total revenue on an organic, constant currency basis2 1,163.2 1,055.7
Organic revenue growth at constant currency2 10% 10%
All figures in £ million 2021 2020
Share of associates’ and joint ventures’ profit/(loss) after tax 0.7 (0.7)
Other income 9.2 9.9
Other income – underlying 9.9 9.2
Specific adjusting item: gain on sale of property (note 4) 0.1 14.0
Total other income 10.0 23.2
All figures in £ million 2021 2020
US 215.6 136.0
Australia 77.9 60.7
Europe 88.2 75.9
Middle east 9.8 16.3
Rest of world 28.9 44.5
International 420.4 333.4
United Kingdom 857.8 739.5
Total revenue 1,278.2 1,072.9
International revenue % 33% 31%
Revenue from ‘home countries’ (UK, US and Australia) 1,151.3 936.2
Home countries revenue % 90% 87%
Notes to the Financial Statements For the year ended 31 March
QinetiQ Group plc Annual Report and Accounts 2021 138
10. Earnings per share
Basic earnings per share is calculated by dividing the profit attributable to equity shareholders by the weighted average number of ordinary shares in issue during the year. The weighted average number of shares used excludes those shares bought by the Group and held as own shares (see note 29). For diluted earnings per share the weighted average number of shares in issue is adjusted to assume conversion of all potentially dilutive ordinary shares arising from unvested share-based awards including share options.
Weighted average and diluted number of shares For the year ended 31 March
Underlying basic earnings per share figures are presented below, in addition to the basic and diluted earnings per share, because the Directors consider this gives a more relevant indication of underlying business performance and reflects the adjustments to basic earnings per share for the impact of specific adjusting items (see note 4) and tax thereon.
Underlying EPS For the year ended 31 March
Basic and diluted EPS For the year ended 31 March
11. Dividends
An analysis of the dividends paid and proposed in respect of the years ended 31 March 2021 and 31 March 2020 is provided below:
The proposed final dividend in respect of the year ending 31 March 2021 will be paid on 26 August 2021. The ex-dividend date is 29 July 2021 and the record date is 30 July 2021.
2021 2020
Weighted average number of shares Million 569.7 567.0
Effect of dilutive securities Million 6.1 5.4
Diluted number of shares Million 575.8 572.4
2021 2020
Profit attributable to the owners of the Company £ million 124.5 106.3
Remove loss after tax in respect of specific adjusting items £ million 1.4 7.2
Underlying profit after taxation £ million 125.9 113.5
Weighted average number of shares Million 569.7 567.0
Underlying basic EPS Pence 22.1 20.0
Diluted number of shares Million 575.8 572.4
Underlying diluted EPS Pence 21.9 19.8
2021 2020
Profit attributable to the owners of the Company £ million 124.5 106.3
Weighted average number of shares Million 569.7 567.0
Basic EPS – total Group Pence 21.9 18.7
Diluted number of shares Million 575.8 572.4
Diluted EPS – total Group Pence 21.6 18.6
Pence
per share £m Date paid/
payable
Interim 2021 2.2 12.6 Feb 2021
Final 2021 (proposed) 4.7 26.8 Aug 2021
Total for the year ended 31 March 2021 6.9 39.4
Interim 2020 2.2 12.5 Feb 2020
Final 2020 4.4 25.1 Nov 2020
Total for the year ended 31 March 2020 6.6 37.6
138 QinetiQ Group plc

Notes to the Financial Statements continued
QinetiQ Group plc Annual Report and Accounts 2021 133
Financial Statements
Revenue by major customer type For the year ended 31 March
‘Other’ does not contain any customers with revenue in excess of 10% of total Group revenue.
The following table shows the aggregate amount of revenue allocated to performance obligations that are unsatisfied (or partially satisfied) as at the end of the reporting period:
Management expects that 27% (£800.5m) of revenue allocated to unsatisfied contracts as of 31 March 2021 will be recognised as revenue during the next reporting period.
The following table shows the aggregate amount of revenue allocated to performance obligations that were unsatisfied (or partially satisfied) as at the end of the prior reporting period:
Revenue of £144m was recognised during the year that was previously unrecognised as at the previous year end and reported as a contract liability.
3. Segmental analysis
The analysis by business segment is presented in accordance with IFRS 8 Operating Segments, on the basis of those reportable segments whose operating results are regularly reviewed by the Board (the Chief Operating Decision Maker as defined by IFRS 8) and are aligned with the Group’s strategic direction, determined with reference to the products and services they provide, as follows:
EMEA Services provides technical assurance, test and evaluation and training services, underpinned by long-term contracts. EMEA Services comprises the following business units which are not considered reportable segments as defined by IFRS 8: Maritime & Land; Air & Space, Cyber & Information and the International business.
Global Products combines all other business units not aggregated within EMEA Services, including the QinetiQ US business, Space Products and EMEA Products (which includes QinetiQ Target Systems). Generally these business units (which are not considered reportable segments as defined by IFRS 8) deliver innovative solutions and products which includes contract-funded research and development and developing intellectual property in partnership with key customers and through internal funding with potential for new revenue streams.
Operating segments
1 The measure of profit presented to the Chief Operating Decision Maker is operating profit stated before specific adjusting items (‘underlying operating profit’). The specific adjusting items are detailed in note 4.
2 Definitions of the Group’s ‘Alternative performance measures’ can be found in the glossary on page 183.
No measure of segmental assets and liabilities is reported as this information is not regularly provided to the Chief Operating Decision Maker.
All figures in £ million 2021 2020
UK government 794.6 667.2
US government 140.8 116.2
Other 342.8 289.5
Total revenue 1,278.2 1,072.9
All figures in £ million 2022 2023 2024 2025+ Total
Total forecast revenue allocated to unsatisfied performance obligations 800.5 523.9 395.9 1,223.8 2,944.1
All figures in £ million 2021 2022 2023 2024+ Total
Total forecast revenue allocated to unsatisfied performance obligations 849.3 484.9 375.5 1,395.2 3,104.9
2021 2020
All figures in £ million
Revenue from
external customers
Underlying operating
profit1
Revenue from
external customers
Underlying operating
profit1
EMEA Services 939.9 118.6 797.4 100.6
Global Products 338.3 33.2 275.5 32.6
Total operating segments 1,278.2 151.8 1,072.9 133.2
Underlying operating margin2 11.9% 12.4%
Notes to the Financial Statements continued
QinetiQ Group plc Annual Report and Accounts 2021 139
Financial Statements
12. Business combinations
Acquisitions in the year to 31 March 2021
1 Acquisition of remaining 15% of Inzpire Group Limited. An 85% shareholding was obtained in a prior year. 2 Additional consideration paid, due to final working capital adjustments, in respect of the prior year acquisition of Newman & Spurr Consultancy Limited. 3 Acquisition-related costs of £1.0m that were not directly attributable to the issue of shares are included as part of the specific adjusting items in other operating costs excluding depreciation and amortisation in the statement of comprehensive income and in operating cash flows in the statement of cash flows (note 4).
Naimuri Limited (‘Naimuri’) On 13 July 2020 the Group acquired 100% of the issued share capital of Naimuri for £28.4m (£24.4m net of cash acquired). Naimuri is a leading software development and data analytics company, providing agile cloud-based services and technology to the UK Intelligence and Law Enforcement communities. QinetiQ partners with Naimuri on several critical programmes and delivering mission-led innovation around data-intensive challenges and will invest and build upon Naimuri’s strong capabilities in data analytics, data intelligence and agile software development to meet customer needs and drive growth in both the security and defence sectors. Naimuri is reported in EMEA Services, within the Cyber & Information business. If the acquisition had occurred on the first day of the financial year, Group revenue for the period would have been £1,281.1m and the Group profit before tax would have been £146.8m.
Identifiable assets acquired and liabilities assumed The following table summarises the recognised amounts of assets acquired and liabilities assumed at the date of acquisition and the adjustments required to the book values of the assets and liabilities in order to present the net assets of these businesses at fair value and in accordance with Group accounting policies. The fair values remain provisional, but will be finalised within 12 months of acquisition.
The consideration of £28.4m was satisfied entirely in cash in the financial period, with no deferred consideration. The fair value adjustments include £11.2m in relation to the recognition of acquired intangible assets of which £9.3m relates to customer relationships and £1.9m relates to existing technology. The goodwill is attributable mainly to the skills and technical talent of the Naimuri work force and the synergies expected to be achieved from integrating the company into the Group’s existing business.
13. Gain on business divestments
The gain on business divestments relates to the sale of the Boldon James, Commerce Decisions and OptaSense businesses for an aggregate consideration of £60.5m. Proceeds received in the period, net of transaction costs and £14.7m of cash divested, were £54.4m. Deferred consideration of £1.5m, contingent on performance of the disposed business in the year to 31 March 2022, is receivable as at 31 March 2021 in respect of the Commerce Decisions disposal, the fair value of which has been estimated at £0.9m. All consideration is settled in cash.
Contribution post-acquisition
All figures in £ million Date
acquired Cash
consideration Goodwill
Fair value of net assets
acquired Revenue Operating
profit
Naimuri Limited 13 July 2020 28.4 (14.8) 13.6 7.6 1.8
Inzpire Group Limited1 3.9
Less: cash acquired within Naimuri Limited (4.0)
Total current year acquisitions 28.3 (14.8) 13.6 7.6 1.8
Prior year acquisitions
Newman & Spurr Consultancy Limited2 0.2
Net cash outflow in the year3 28.5
All figures in £ million Note
Book
value Fair value
adjustment Fair value at
acquisition
Intangible assets 15 – 11.2 11.2
Property, plant and equipment 16 1.6 – 1.6
Trade and other receivables 2.0 – 2.0
Cash and cash equivalents 4.0 – 4.0
Trade and other payables (1.3) – (1.3)
Lease liabilities (1.3) – (1.3)
Corporation tax (0.5) – (0.5)
Deferred tax liabilities 18 – (2.1) (2.1)
Net assets acquired 4.5 9.1 13.6
Goodwill 14 14.8
Total consideration 28.4
All figures in £ million 2021 2020
Boldon James business (comprising Boldon James Limited) 19.3 –
Commerce Decisions business (comprising Commerce Decisions Limited and Commerce Decisions Pty Ltd) 1.6 –
OptaSense business (comprising OptaSense Holdings Limited and subsidiary companies) 7.5 –
Gain on business divestments 28.4 ––
139Annual Report & Accounts 2021
Financial Statements

Notes to the Financial Statements For the year ended 31 March
QinetiQ Group plc Annual Report and Accounts 2021 132
1. Significant changes in the current reporting period
The financial position and performance of the Group was particularly affected by the following events and transactions during the reporting period:
1) The acquisition of Naimuri Limited (see note 12) which resulted in an increase in goodwill (note 14) and other intangible assets (note 15);
2) The divestment of the Boldon James, Commerce Decisions and OptaSense businesses (see note 13); 3) An impairment of goodwill in respect of the Germany business (see note 14).
For a detailed discussion of the Group’s performance and financial position refer to the Strategic Report on pages 2 to 51.
2. Revenue from contracts with customers and other income
Revenue and other income is analysed as follows:
Revenue by category and other income For the year ended 31 March
1 For the period of which there was no contribution in the equivalent period in the comparator year which was pre-ownership (for acquisitions) or post-ownership (for disposals) by the Group
2 Alternative performance measures are used to supplement the statutory figures. See page 183.
Other income
Revenue and profit after tax of associates and joint ventures was £12.6m and £1.1m respectively (2020: revenue of £18.1m and loss after tax of £1.5m). The figures in the table above represent the Group share of this profit after tax.
Other income is in respect of property rentals and the recovery of other related property costs.
Revenue by customer geographic location For the year ended 31 March
All figures in £ million 2021 2020
Services contracts with customers 1,189.4 945.6
Sale of goods contracts with customers 83.0 116.8
Royalties and licences 5.8 10.5
Total revenue 1,278.2 1,072.9
Less: adjust current year for acquired businesses1 (117.2) –
Less: adjust prior year for disposed businesses1 – (17.2)
Adjust to constant prior year exchange rates 2.2 –
Total revenue on an organic, constant currency basis2 1,163.2 1,055.7
Organic revenue growth at constant currency2 10% 10%
All figures in £ million 2021 2020
Share of associates’ and joint ventures’ profit/(loss) after tax 0.7 (0.7)
Other income 9.2 9.9
Other income – underlying 9.9 9.2
Specific adjusting item: gain on sale of property (note 4) 0.1 14.0
Total other income 10.0 23.2
All figures in £ million 2021 2020
US 215.6 136.0
Australia 77.9 60.7
Europe 88.2 75.9
Middle east 9.8 16.3
Rest of world 28.9 44.5
International 420.4 333.4
United Kingdom 857.8 739.5
Total revenue 1,278.2 1,072.9
International revenue % 33% 31%
Revenue from ‘home countries’ (UK, US and Australia) 1,151.3 936.2
Home countries revenue % 90% 87%
Notes to the Financial Statements For the year ended 31 March
QinetiQ Group plc Annual Report and Accounts 2021 132
1. Significant changes in the current reporting period
The financial position and performance of the Group was particularly affected by the following events and transactions during the reporting period:
1) The acquisition of Naimuri Limited (see note 12) which resulted in an increase in goodwill (note 14) and other intangible assets (note 15);
2) The divestment of the Boldon James, Commerce Decisions and OptaSense businesses (see note 13); 3) An impairment of goodwill in respect of the Germany business (see note 14).
For a detailed discussion of the Group’s performance and financial position refer to the Strategic Report on pages 2 to 51.
2. Revenue from contracts with customers and other income
Revenue and other income is analysed as follows:
Revenue by category and other income For the year ended 31 March
1 For the period of which there was no contribution in the equivalent period in the comparator year which was pre-ownership (for acquisitions) or post-ownership (for disposals) by the Group
2 Alternative performance measures are used to supplement the statutory figures. See page 183.
Other income
Revenue and profit after tax of associates and joint ventures was £12.6m and £1.1m respectively (2020: revenue of £18.1m and loss after tax of £1.5m). The figures in the table above represent the Group share of this profit after tax.
Other income is in respect of property rentals and the recovery of other related property costs.
Revenue by customer geographic location For the year ended 31 March
All figures in £ million 2021 2020
Services contracts with customers 1,189.4 945.6
Sale of goods contracts with customers 83.0 116.8
Royalties and licences 5.8 10.5
Total revenue 1,278.2 1,072.9
Less: adjust current year for acquired businesses1 (117.2) –
Less: adjust prior year for disposed businesses1 – (17.2)
Adjust to constant prior year exchange rates 2.2 –
Total revenue on an organic, constant currency basis2 1,163.2 1,055.7
Organic revenue growth at constant currency2 10% 10%
All figures in £ million 2021 2020
Share of associates’ and joint ventures’ profit/(loss) after tax 0.7 (0.7)
Other income 9.2 9.9
Other income – underlying 9.9 9.2
Specific adjusting item: gain on sale of property (note 4) 0.1 14.0
Total other income 10.0 23.2
All figures in £ million 2021 2020
US 215.6 136.0
Australia 77.9 60.7
Europe 88.2 75.9
Middle east 9.8 16.3
Rest of world 28.9 44.5
International 420.4 333.4
United Kingdom 857.8 739.5
Total revenue 1,278.2 1,072.9
International revenue % 33% 31%
Revenue from ‘home countries’ (UK, US and Australia) 1,151.3 936.2
Home countries revenue % 90% 87%
140 QinetiQ Group plc

Notes to the Financial Statements continued
QinetiQ Group plc Annual Report and Accounts 2021 133
Financial Statements
Revenue by major customer type For the year ended 31 March
‘Other’ does not contain any customers with revenue in excess of 10% of total Group revenue.
The following table shows the aggregate amount of revenue allocated to performance obligations that are unsatisfied (or partially satisfied) as at the end of the reporting period:
Management expects that 27% (£800.5m) of revenue allocated to unsatisfied contracts as of 31 March 2021 will be recognised as revenue during the next reporting period.
The following table shows the aggregate amount of revenue allocated to performance obligations that were unsatisfied (or partially satisfied) as at the end of the prior reporting period:
Revenue of £144m was recognised during the year that was previously unrecognised as at the previous year end and reported as a contract liability.
3. Segmental analysis
The analysis by business segment is presented in accordance with IFRS 8 Operating Segments, on the basis of those reportable segments whose operating results are regularly reviewed by the Board (the Chief Operating Decision Maker as defined by IFRS 8) and are aligned with the Group’s strategic direction, determined with reference to the products and services they provide, as follows:
EMEA Services provides technical assurance, test and evaluation and training services, underpinned by long-term contracts. EMEA Services comprises the following business units which are not considered reportable segments as defined by IFRS 8: Maritime & Land; Air & Space, Cyber & Information and the International business.
Global Products combines all other business units not aggregated within EMEA Services, including the QinetiQ US business, Space Products and EMEA Products (which includes QinetiQ Target Systems). Generally these business units (which are not considered reportable segments as defined by IFRS 8) deliver innovative solutions and products which includes contract-funded research and development and developing intellectual property in partnership with key customers and through internal funding with potential for new revenue streams.
Operating segments
1 The measure of profit presented to the Chief Operating Decision Maker is operating profit stated before specific adjusting items (‘underlying operating profit’). The specific adjusting items are detailed in note 4.
2 Definitions of the Group’s ‘Alternative performance measures’ can be found in the glossary on page 183.
No measure of segmental assets and liabilities is reported as this information is not regularly provided to the Chief Operating Decision Maker.
All figures in £ million 2021 2020
UK government 794.6 667.2
US government 140.8 116.2
Other 342.8 289.5
Total revenue 1,278.2 1,072.9
All figures in £ million 2022 2023 2024 2025+ Total
Total forecast revenue allocated to unsatisfied performance obligations 800.5 523.9 395.9 1,223.8 2,944.1
All figures in £ million 2021 2022 2023 2024+ Total
Total forecast revenue allocated to unsatisfied performance obligations 849.3 484.9 375.5 1,395.2 3,104.9
2021 2020
All figures in £ million
Revenue from
external customers
Underlying operating
profit1
Revenue from
external customers
Underlying operating
profit1
EMEA Services 939.9 118.6 797.4 100.6
Global Products 338.3 33.2 275.5 32.6
Total operating segments 1,278.2 151.8 1,072.9 133.2
Underlying operating margin2 11.9% 12.4%
Notes to the Financial Statements continued
QinetiQ Group plc Annual Report and Accounts 2021 141
Financial Statements
Terminal growth rates and discount rates The specific plans for each of the CGUs have been extrapolated using the terminal growth rates as detailed below. Growth rates are based on management’s estimates which take into consideration the long-term nature of the industry in which the CGUs operate and external forecasts as to the likely growth of the industry in the longer term. The Group’s weighted average cost of capital was used as a basis in determining the discount rate to be applied, adjusted for risks specific to the market characteristics of CGUs, as appropriate on a pre-tax basis. This is considered an appropriate estimate of a market participant discount rate.
The value of the terminal year cash flow, the discount rate and the terminal growth rates have a significant impact on the value of the discounted cash flow. Sensitivities are provided below for each of the significant CGUs.
Significant CGUs QinetiQ North America (QNA) The carrying value of the goodwill for the QNA CGU was £39.6m as at 31 March 2021 (2020: £43.9m). The recoverable amount of this CGU as at 31 March 2021, based on value in use and calculated using the assumptions noted above, is higher than the carrying value of net operating assets (of £94.3m). The key sensitivity impacting on the value in use calculations is the terminal year cash flows. These cash flows include certain assumptions around growth of new product lines and the success of winning certain government contracts. An increase in the discount rate by 1%, a decrease in the terminal growth rate by 1% or a decrease in the terminal year cash flows of £2.0m would not cause the net operating assets to exceed their recoverable amount.
MTEQ The carrying value of the goodwill for the MTEQ CGU as at 31 March 2021 was £33.0m (2020: £36.6m). The recoverable amount of this CGU as at 31 March 2021, based on value in use and calculated using the assumptions noted above, is higher than the carrying value of net operating assets (of £92.7m). The key sensitivity impacting on the value in use calculations is the terminal year cash flows. An increase in the discount rate by 1%, a decrease in the terminal growth rate by 1% or a decrease in the terminal year cash flows of £2.0m would not cause the net operating assets to exceed their recoverable amount. Target Systems The carrying value of the goodwill for the Target Systems CGU as at 31 March 2021 was £24.3m (2020: £24.2m). The recoverable amount of this CGU as at 31 March 2021, based on value in use and calculated using the assumptions noted above, is higher than the carrying value of net operating assets (of £100.2m). The key sensitivity impacting on the value in use calculations is the terminal year cash flows. An increase in the discount rate by 1%, a decrease in the terminal growth rate by 1% or a decrease in the terminal year cash flows of £2.0m would not cause the net operating assets to exceed their recoverable amount. COVID-19 had resulted in temporary closure of this businesses’ manufacturing site. This short-term impact on trading is not considered to have a significant impact on the long-term cash flows of this CGU.
Germany The carrying value of the goodwill for the Germany CGU as at 31 March 2021 was £2.7m (2020: £28.7m). The reduction results from an impairment of £25.4m in the year following a reduction in the value in use, calculated using the assumptions noted above. Our German operations performed below expectations for orders, revenue, profit and cash flow in the year with some key contract losses during the year. These contract losses have a knock-on impact for future years’ profitability and cash flow and hence a further impairment (following on from a £4.3m impairment in the prior year) was required. Following a detailed review of the business’s current pipeline and assessing numerous other variables, an impairment of £25.4m has been recognised in the current year. The key sensitivity impacting on the value in use calculations is the terminal year cash flows. An increase in the discount rate by 1%, a decrease in the terminal growth rate by 1% or a decrease in the terminal year cash flows of £2.0m would have increased the impairment charge by £5.1m, £3.9m and £20.4m respectively. Such a level of incremental impairment would fully erode the residual carrying value of goodwill and require impairment of an element of the Germany CGU’s £29.5m carrying value of acquisition-related intangible assets. Inzpire The carrying value of the goodwill for the Inzpire CGU as at 31 March 2021 was £11.7m (2020: £11.7m). The key sensitivity impacting on the value in use calculations is the terminal year cash flows. An increase in the discount rate by 1%, a decrease in the terminal growth rate by 1% or a decrease in the terminal year cash flows of £1.0m would not cause the net operating assets to exceed their recoverable amount. Naimuri The carrying value of the goodwill for the Naimuri CGU as at 31 March 2021 was £14.8m (2020: nil). The key sensitivity impacting on the
value in use calculations is the terminal year cash flows. An increase in the discount rate by 1%, a decrease in the terminal growth rate by
1% or a decrease in the terminal year cash flows of £2.0m would not cause the net operating assets to exceed their recoverable amount.
All figures %
2021: (2020)
QNA Target Systems
Space NV MTEQ Inzpire Australia QinetiQ Germany
NSC Naimuri
Terminal growth rate 2.1 (2.1) 1.7 (1.8) 1.7 (1.8) 2.1 (2.1) 1.7 (1.8) 2.3 (2.3) 1.5 (1.5) 1.7 (1.8) 1.7 (N/A)
Pre-tax discount rate 11.3 (11.3) 12.2 (10.2) 11.9 (9.8) 11.3 (11.3) 12.8 (11.3) 10.0 (10.0) 9.3 (8.7) 12.3 (10.3) 12.2 (N/A)
141Annual Report & Accounts 2021
Financial Statements

Notes to the Financial Statements For the year ended 31 March
QinetiQ Group plc Annual Report and Accounts 2021 132
1. Significant changes in the current reporting period
The financial position and performance of the Group was particularly affected by the following events and transactions during the reporting period:
1) The acquisition of Naimuri Limited (see note 12) which resulted in an increase in goodwill (note 14) and other intangible assets (note 15);
2) The divestment of the Boldon James, Commerce Decisions and OptaSense businesses (see note 13); 3) An impairment of goodwill in respect of the Germany business (see note 14).
For a detailed discussion of the Group’s performance and financial position refer to the Strategic Report on pages 2 to 51.
2. Revenue from contracts with customers and other income
Revenue and other income is analysed as follows:
Revenue by category and other income For the year ended 31 March
1 For the period of which there was no contribution in the equivalent period in the comparator year which was pre-ownership (for acquisitions) or post-ownership (for disposals) by the Group
2 Alternative performance measures are used to supplement the statutory figures. See page 183.
Other income
Revenue and profit after tax of associates and joint ventures was £12.6m and £1.1m respectively (2020: revenue of £18.1m and loss after tax of £1.5m). The figures in the table above represent the Group share of this profit after tax.
Other income is in respect of property rentals and the recovery of other related property costs.
Revenue by customer geographic location For the year ended 31 March
All figures in £ million 2021 2020
Services contracts with customers 1,189.4 945.6
Sale of goods contracts with customers 83.0 116.8
Royalties and licences 5.8 10.5
Total revenue 1,278.2 1,072.9
Less: adjust current year for acquired businesses1 (117.2) –
Less: adjust prior year for disposed businesses1 – (17.2)
Adjust to constant prior year exchange rates 2.2 –
Total revenue on an organic, constant currency basis2 1,163.2 1,055.7
Organic revenue growth at constant currency2 10% 10%
All figures in £ million 2021 2020
Share of associates’ and joint ventures’ profit/(loss) after tax 0.7 (0.7)
Other income 9.2 9.9
Other income – underlying 9.9 9.2
Specific adjusting item: gain on sale of property (note 4) 0.1 14.0
Total other income 10.0 23.2
All figures in £ million 2021 2020
US 215.6 136.0
Australia 77.9 60.7
Europe 88.2 75.9
Middle east 9.8 16.3
Rest of world 28.9 44.5
International 420.4 333.4
United Kingdom 857.8 739.5
Total revenue 1,278.2 1,072.9
International revenue % 33% 31%
Revenue from ‘home countries’ (UK, US and Australia) 1,151.3 936.2
Home countries revenue % 90% 87%
Notes to the Financial Statements For the year ended 31 March
QinetiQ Group plc Annual Report and Accounts 2021 142
15. Intangible assets
For the year ended 31 March 2021
^ Includes Assets In Course Of Construction of closing net book value of £12.1m (2020: £14.4m) * Additions per the table above are lower than the capital expenditure included in the cash flow statement due to the relative timing of cash payments compared to the
recognition of balance sheet assets
‘Other’ consists primarily of intellectual property and existing technology arising on acquisition of businesses. Significant individual assets include: customer relationships associated with MTEQ, Germany and NSC (£16.6m; £25.5m; £3.7m respectively) with remaining amortisation period of approximately 8.8 years, 11.2 years, 9.8 years respectively and acquired technology associated with MTEQ, Germany, and NSC (£14.3m; £4.3m; £2.3m respectively) with remaining amortisation period of approximately 8.8 years, 8.5 years and 8.8 years respectively.
For the year ended 31 March 2020
^ Includes Assets In Course Of Construction with net book value at 31 March 2020 of £14.4m.
Acquired intangibles
All figures in £ million Customer
relationships Other Development
costs Other
intangibles^ Total
Cost
At 1 April 2020 117.5 98.7 27.4 68.2 311.8
Reclassifications from PPE – – – 0.1 0.1
Reclassifications – (2.5) 8.5 (6.0) –
Additions – internally developed* – – 2.5 5.3 7.8
Additions – purchased* – – 0.1 6.4 6.5
Additions – recognised on acquisition 9.3 1.9 – – 11.2
Business divestments (8.9) (9.0) (10.3) (12.1) (40.3)
Foreign exchange (5.4) (6.3) – (0.9) (12.6)
At 31 March 2021 112.5 82.8 28.2 61.0 284.5
Accumulated amortisation and impairment
At 1 April 2020 (44.4) (63.8) (21.6) (43.1) (172.9)
Amortisation charge for year (7.7) (3.2) (2.4) (2.3) (15.6)
Reclassifications – 0.7 (0.9) 0.2 –
Business divestments 8.9 7.7 8.1 10.9 35.6
Foreign exchange 3.1 4.2 – 0.3 7.6
At 31 March 2021 (40.1) (54.4) (16.8) (34.0) (145.3)
Net book value at 31 March 2021 72.4 28.4 11.4 27.0 139.2
Acquired intangibles
All figures in £ million Customer
relationships Other Development
costs Other
intangibles^ Total
Cost
At 1 April 2019 90.2 76.0 25.8 52.3 244.3
Reclassifications from PPE – – 0.1 0.2 0.3
Reclassifications – – 0.4 (0.4) –
Additions – internally developed – – 0.7 8.0 8.7
Additions – purchased – – 0.2 5.2 5.4
Additions – recognised on acquisition 24.5 20.3 0.7 – 45.5
Foreign exchange 2.8 2.4 (0.5) 2.9 7.6
At 31 March 2020 117.5 98.7 27.4 68.2 311.8
Accumulated amortisation and impairment
At 1 April 2019 (38.4) (59.5) (20.6) (37.3) (155.8)
Amortisation charge for year (5.3) (2.2) (1.4) (2.9) (11.8)
Foreign exchange (0.7) (2.1) 0.4 (2.9) (5.3)
At 31 March 2020 (44.4) (63.8) (21.6) (43.1) (172.9)
Net book value at 31 March 2020 73.1 34.9 5.8 25.1 138.9
142 QinetiQ Group plc

Notes to the Financial Statements continued
QinetiQ Group plc Annual Report and Accounts 2021 133
Financial Statements
Revenue by major customer type For the year ended 31 March
‘Other’ does not contain any customers with revenue in excess of 10% of total Group revenue.
The following table shows the aggregate amount of revenue allocated to performance obligations that are unsatisfied (or partially satisfied) as at the end of the reporting period:
Management expects that 27% (£800.5m) of revenue allocated to unsatisfied contracts as of 31 March 2021 will be recognised as revenue during the next reporting period.
The following table shows the aggregate amount of revenue allocated to performance obligations that were unsatisfied (or partially satisfied) as at the end of the prior reporting period:
Revenue of £144m was recognised during the year that was previously unrecognised as at the previous year end and reported as a contract liability.
3. Segmental analysis
The analysis by business segment is presented in accordance with IFRS 8 Operating Segments, on the basis of those reportable segments whose operating results are regularly reviewed by the Board (the Chief Operating Decision Maker as defined by IFRS 8) and are aligned with the Group’s strategic direction, determined with reference to the products and services they provide, as follows:
EMEA Services provides technical assurance, test and evaluation and training services, underpinned by long-term contracts. EMEA Services comprises the following business units which are not considered reportable segments as defined by IFRS 8: Maritime & Land; Air & Space, Cyber & Information and the International business.
Global Products combines all other business units not aggregated within EMEA Services, including the QinetiQ US business, Space Products and EMEA Products (which includes QinetiQ Target Systems). Generally these business units (which are not considered reportable segments as defined by IFRS 8) deliver innovative solutions and products which includes contract-funded research and development and developing intellectual property in partnership with key customers and through internal funding with potential for new revenue streams.
Operating segments
1 The measure of profit presented to the Chief Operating Decision Maker is operating profit stated before specific adjusting items (‘underlying operating profit’). The specific adjusting items are detailed in note 4.
2 Definitions of the Group’s ‘Alternative performance measures’ can be found in the glossary on page 183.
No measure of segmental assets and liabilities is reported as this information is not regularly provided to the Chief Operating Decision Maker.
All figures in £ million 2021 2020
UK government 794.6 667.2
US government 140.8 116.2
Other 342.8 289.5
Total revenue 1,278.2 1,072.9
All figures in £ million 2022 2023 2024 2025+ Total
Total forecast revenue allocated to unsatisfied performance obligations 800.5 523.9 395.9 1,223.8 2,944.1
All figures in £ million 2021 2022 2023 2024+ Total
Total forecast revenue allocated to unsatisfied performance obligations 849.3 484.9 375.5 1,395.2 3,104.9
2021 2020
All figures in £ million
Revenue from
external customers
Underlying operating
profit1
Revenue from
external customers
Underlying operating
profit1
EMEA Services 939.9 118.6 797.4 100.6
Global Products 338.3 33.2 275.5 32.6
Total operating segments 1,278.2 151.8 1,072.9 133.2
Underlying operating margin2 11.9% 12.4%
QinetiQ Group plc Annual Report and Accounts 2021 143
Financial Statements
Notes to the Financial Statements continued
16. Property, plant and equipmentFor the year ended 31 March 2021
* Additions per the table above are higher than the capital expenditure included in the cash flow statement due to the relative timing of cash payments compared to therecognition of balance sheet assets
For the year ended 31 March 2020 Owned assets Right of use assets
All figures in £ million Land and buildings
Plant, machinery
and vehicles
Computers and office equipment
Assets under construction
Land and buildings
Plant, machinery
and vehicles
Computers and office equipment Total
Cost At 1 April 2019 306.9 237.2 62.9 53.4 56.6 15.7 0.4 733.1 Additions – purchased 8.1 16.6 2.1 58.6 1.0 3.0 – 89.4 Additions – recognised on acquisition 0.8 0.7 – – 2.5 – – 4.0 Reclassifications to intangibles – – – (0.3) – – – (0.3) Reclassifications/transfers 9.6 10.3 7.2 (27.1) – – – – Disposals – (1.4) (1.8) – (4.2) (1.2) – (8.6) Foreign exchange 0.2 0.8 0.1 – 0.2 0.1 – 1.4 At 31 March 2020 325.6 264.2 70.5 84.6 56.1 17.6 0.4 819.0
Accumulated depreciation and impairment At 1 April 2019 (174.0) (155.6) (35.3) – (35.7) (9.1) (0.2) (409.9) Charge for year (9.7) (13.2) (8.8) – (5.1) (4.5) (0.1) (41.4) Impairment reversal – 0.4 – – – – – 0.4 Disposals – 1.4 1.8 – 4.2 1.2 – 8.6 Foreign exchange (0.2) (0.8) (0.1) – – – – (1.1) At 31 March 2020 (183.9) (167.8) (42.4) – (36.6) (12.4) (0.3) (443.4)
Net book value at 31 March 2020 141.7 96.4 28.1 84.6 19.5 5.2 0.1 375.6
Owned assets Right of use assets
All figures in £ million Land and buildings
Plant, machinery
and vehicles
Computers and office equipment
Assets under construction
Land and buildings
Plant, machinery
and vehicles
Computers and office equipment Total
Cost At 1 April 2020 325.6 264.2 70.5 84.6 56.1 17.6 0.4 819.0 Reclassifications to intangibles – – – (0.1) – – – (0.1) Reclassifications/transfers 19.8 10.0 13.9 (43.7) – – – – Additions – purchased* 11.0 8.9 5.8 36.7 11.1 – – 73.5 Additions - recognised on acquisition 0.1 0.2 0.1 – 1.2 – – 1.6 Disposals (1.7) (26.7) (5.0) (0.3) (5.5) (0.3) – (39.5) Business divestments (0.3) (5.6) (3.1) – (4.8) – – (13.8) Foreign exchange (0.7) (2.1) (0.3) (0.3) (3.3) (0.4) – (7.1) At 31 March 2021 353.8 248.9 81.9 76.9 54.8 16.9 0.4 833.6
Accumulated depreciation and impairment At 1 April 2020 (183.9) (167.8) (42.4) – (36.6) (12.4) (0.3) (443.4) Charge (12.0) (15.5) (9.7) – (5.6) (2.7) (0.1) (45.6) Disposals 1.7 26.2 4.9 – 4.1 0.2 – 37.1 Business divestments 0.3 4.7 2.9 – 3.1 – – 11.0 Impairment (0.5) – – – – – – (0.5) Foreign exchange 0.6 1.6 0.3 – 2.0 0.5 – 5.0 At 31 March 2021 (193.8) (150.8) (44.0) – (33.0) (14.4) (0.4) (436.4)
Opening net book value 141.7 96.4 28.1 84.6 19.5 5.2 0.1 375.6
Closing Net Book value 160.0 98.1 37.9 76.9 21.8 2.5 –– 397.2
143Annual Report & Accounts 2021
Financial Statements

Notes to the Financial Statements For the year ended 31 March
QinetiQ Group plc Annual Report and Accounts 2021 132
1. Significant changes in the current reporting period
The financial position and performance of the Group was particularly affected by the following events and transactions during the reporting period:
1) The acquisition of Naimuri Limited (see note 12) which resulted in an increase in goodwill (note 14) and other intangible assets (note 15);
2) The divestment of the Boldon James, Commerce Decisions and OptaSense businesses (see note 13); 3) An impairment of goodwill in respect of the Germany business (see note 14).
For a detailed discussion of the Group’s performance and financial position refer to the Strategic Report on pages 2 to 51.
2. Revenue from contracts with customers and other income
Revenue and other income is analysed as follows:
Revenue by category and other income For the year ended 31 March
1 For the period of which there was no contribution in the equivalent period in the comparator year which was pre-ownership (for acquisitions) or post-ownership (for disposals) by the Group
2 Alternative performance measures are used to supplement the statutory figures. See page 183.
Other income
Revenue and profit after tax of associates and joint ventures was £12.6m and £1.1m respectively (2020: revenue of £18.1m and loss after tax of £1.5m). The figures in the table above represent the Group share of this profit after tax.
Other income is in respect of property rentals and the recovery of other related property costs.
Revenue by customer geographic location For the year ended 31 March
All figures in £ million 2021 2020
Services contracts with customers 1,189.4 945.6
Sale of goods contracts with customers 83.0 116.8
Royalties and licences 5.8 10.5
Total revenue 1,278.2 1,072.9
Less: adjust current year for acquired businesses1 (117.2) –
Less: adjust prior year for disposed businesses1 – (17.2)
Adjust to constant prior year exchange rates 2.2 –
Total revenue on an organic, constant currency basis2 1,163.2 1,055.7
Organic revenue growth at constant currency2 10% 10%
All figures in £ million 2021 2020
Share of associates’ and joint ventures’ profit/(loss) after tax 0.7 (0.7)
Other income 9.2 9.9
Other income – underlying 9.9 9.2
Specific adjusting item: gain on sale of property (note 4) 0.1 14.0
Total other income 10.0 23.2
All figures in £ million 2021 2020
US 215.6 136.0
Australia 77.9 60.7
Europe 88.2 75.9
Middle east 9.8 16.3
Rest of world 28.9 44.5
International 420.4 333.4
United Kingdom 857.8 739.5
Total revenue 1,278.2 1,072.9
International revenue % 33% 31%
Revenue from ‘home countries’ (UK, US and Australia) 1,151.3 936.2
Home countries revenue % 90% 87%
Notes to the Financial Statements For the year ended 31 March
QinetiQ Group plc Annual Report and Accounts 2021 144
17. Equity accounted investments
As at 31 March
During the year the Group sold a share of an investment in a middle-east joint venture for a gain of £0.3m.
18. Deferred tax
For the year ended 31 March 2021 Deferred tax asset
Deferred tax liability
Deferred tax has been calculated at the rate at which the timing difference is expected to reverse using the enacted future statutory rates.
Deferred tax assets and liabilities are offset where there is a legally enforceable right to offset current tax assets and liabilities and where the deferred tax balances relate to the same taxation authority. Deferred tax has been calculated using the enacted future statutory tax rates. To provide additional information at the end of the period, various items have been reclassified out of short term timing differences as shown above. At 31 March 2021 the Group had unused tax losses and US carried forward interest expense of £73.2m (2020: £90.3m) which are available for offset against future taxable profits. Deferred tax assets are recognised on the balance sheet of £8.4m (2020: £7.8m) in respect of £35.9m (2020: £37.3m) of US net operating losses, £0.1m in respect of £0.5m of Canadian net operating losses and £1.4m (2020: £1.5m) in respect
2021 2020
All figures in £ million
JV’s and associates
financial results
Group net share of
JV’s and associates
JV’s and associates
financial results
Group net share of
JV’s and associates
Non-current assets 0.7 0.3 1.4 0.7
Current assets 12.9 6.5 23.3 11.3
13.6 6.8 24.7 12.0
Current liabilities (4.1) (2.0) (15.9) (7.4)
Non-current liabilities (1.3) (0.6) (2.0) (1.0)
(5.4) (2.6) (17.9) (8.4)
Net assets of joint ventures and associates 8.2 4.2 6.8 3.6
Net assets of joint ventures 1.0 0.8
Net assets of associate 3.2 2.8
Net assets of joint ventures and associates 4.2 3.6
All figures in £ million Intellectual
property
Short-term timing
differences
Carried forward interest
expense Lease
liabilities
Tax
losses Total
At 1 April 2020 0.3 15.6 – – 7.8 23.7
(Charged)/credited to income statement (0.1) (1.2) – – 1.3 –
Credited to other comprehensive income – 1.0 – – – 1.0
Credited to equity – 0.5 – – – 0.5
Transferred to current tax – (0.3) – – – (0.3)
Eliminated on disposal of businesses (0.2) – – – – (0.2)
Reclassification – (1.8) 1.4 5.1 – 4.7
Foreign exchange – (1.1) – – (0.6) (1.7)
Gross deferred tax asset at 31 March 2021 – 12.7 1.4 5.1 8.5 27.7
Less: liability available for offset (16.0)
Net deferred tax asset at 31 March 2021 11.7
All figures in £ million Pension surplus
Owned property,
plant & equipment
Right of use assets
Acquisition intangibles Total
At 1 April 2020 (63.8) (26.8) – (21.1) (111.7)
(Charged)/credited to income statement (1.5) (6.8) – 0.8 (7.5)
Credited to other comprehensive income 19.8 – – – 19.8
Acquired in business combination – – – (2.1) (2.1)
Reclassification – – (4.7) – (4.7)
Foreign exchange – 0.1 – 0.4 0.5
Gross deferred tax liability at 31 March 2021 (45.5) (33.5) (4.7) (22.0) (105.7)
Less: asset available for offset 16.0
Net deferred tax liability at 31 March 2021 (89.7)
144 QinetiQ Group plc
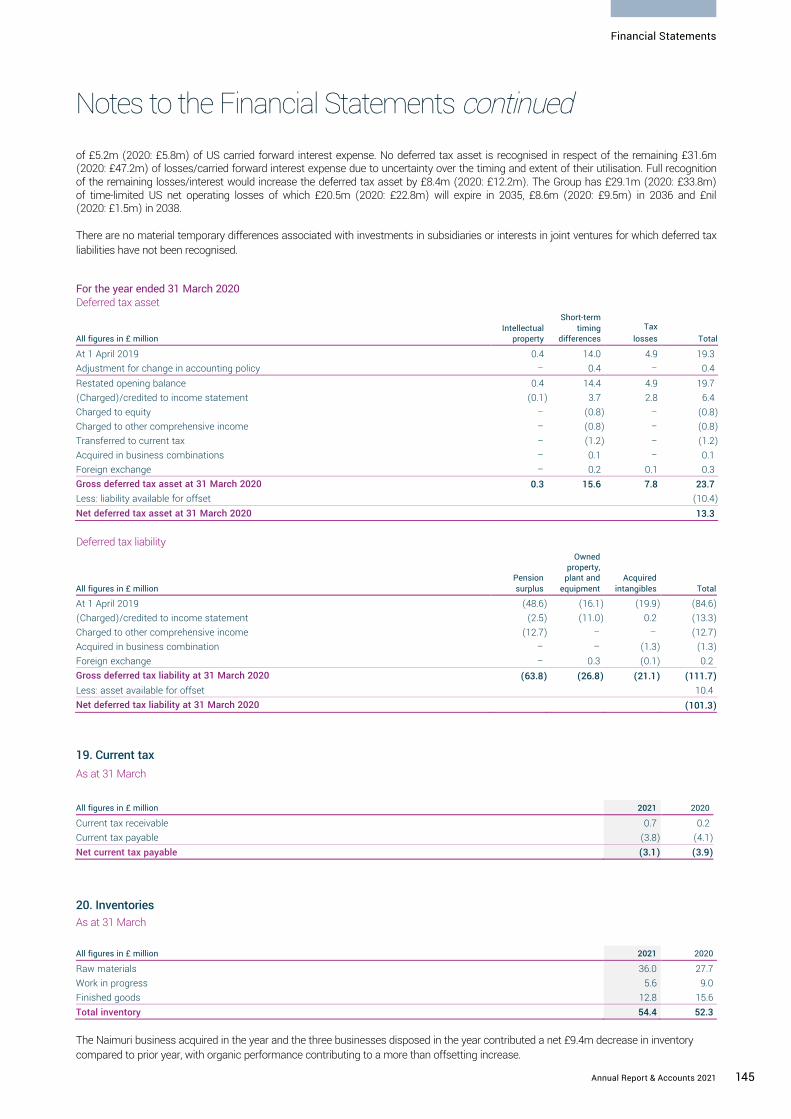
Notes to the Financial Statements continued
QinetiQ Group plc Annual Report and Accounts 2021 133
Financial Statements
Revenue by major customer type For the year ended 31 March
‘Other’ does not contain any customers with revenue in excess of 10% of total Group revenue.
The following table shows the aggregate amount of revenue allocated to performance obligations that are unsatisfied (or partially satisfied) as at the end of the reporting period:
Management expects that 27% (£800.5m) of revenue allocated to unsatisfied contracts as of 31 March 2021 will be recognised as revenue during the next reporting period.
The following table shows the aggregate amount of revenue allocated to performance obligations that were unsatisfied (or partially satisfied) as at the end of the prior reporting period:
Revenue of £144m was recognised during the year that was previously unrecognised as at the previous year end and reported as a contract liability.
3. Segmental analysis
The analysis by business segment is presented in accordance with IFRS 8 Operating Segments, on the basis of those reportable segments whose operating results are regularly reviewed by the Board (the Chief Operating Decision Maker as defined by IFRS 8) and are aligned with the Group’s strategic direction, determined with reference to the products and services they provide, as follows:
EMEA Services provides technical assurance, test and evaluation and training services, underpinned by long-term contracts. EMEA Services comprises the following business units which are not considered reportable segments as defined by IFRS 8: Maritime & Land; Air & Space, Cyber & Information and the International business.
Global Products combines all other business units not aggregated within EMEA Services, including the QinetiQ US business, Space Products and EMEA Products (which includes QinetiQ Target Systems). Generally these business units (which are not considered reportable segments as defined by IFRS 8) deliver innovative solutions and products which includes contract-funded research and development and developing intellectual property in partnership with key customers and through internal funding with potential for new revenue streams.
Operating segments
1 The measure of profit presented to the Chief Operating Decision Maker is operating profit stated before specific adjusting items (‘underlying operating profit’). The specific adjusting items are detailed in note 4.
2 Definitions of the Group’s ‘Alternative performance measures’ can be found in the glossary on page 183.
No measure of segmental assets and liabilities is reported as this information is not regularly provided to the Chief Operating Decision Maker.
All figures in £ million 2021 2020
UK government 794.6 667.2
US government 140.8 116.2
Other 342.8 289.5
Total revenue 1,278.2 1,072.9
All figures in £ million 2022 2023 2024 2025+ Total
Total forecast revenue allocated to unsatisfied performance obligations 800.5 523.9 395.9 1,223.8 2,944.1
All figures in £ million 2021 2022 2023 2024+ Total
Total forecast revenue allocated to unsatisfied performance obligations 849.3 484.9 375.5 1,395.2 3,104.9
2021 2020
All figures in £ million
Revenue from
external customers
Underlying operating
profit1
Revenue from
external customers
Underlying operating
profit1
EMEA Services 939.9 118.6 797.4 100.6
Global Products 338.3 33.2 275.5 32.6
Total operating segments 1,278.2 151.8 1,072.9 133.2
Underlying operating margin2 11.9% 12.4%
Notes to the Financial Statements continued
QinetiQ Group plc Annual Report and Accounts 2021 145
Financial Statements
of £5.2m (2020: £5.8m) of US carried forward interest expense. No deferred tax asset is recognised in respect of the remaining £31.6m (2020: £47.2m) of losses/carried forward interest expense due to uncertainty over the timing and extent of their utilisation. Full recognition of the remaining losses/interest would increase the deferred tax asset by £8.4m (2020: £12.2m). The Group has £29.1m (2020: £33.8m) of time-limited US net operating losses of which £20.5m (2020: £22.8m) will expire in 2035, £8.6m (2020: £9.5m) in 2036 and £nil (2020: £1.5m) in 2038.
There are no material temporary differences associated with investments in subsidiaries or interests in joint ventures for which deferred tax liabilities have not been recognised.
For the year ended 31 March 2020 Deferred tax asset
Deferred tax liability
19. Current tax As at 31 March
20. Inventories As at 31 March
The Naimuri business acquired in the year and the three businesses disposed in the year contributed a net £9.4m decrease in inventory compared to prior year, with organic performance contributing to a more than offsetting increase.
All figures in £ million Intellectual
property
Short-term timing
differences Tax
losses Total
At 1 April 2019 0.4 14.0 4.9 19.3 Adjustment for change in accounting policy – 0.4 – 0.4 Restated opening balance 0.4 14.4 4.9 19.7 (Charged)/credited to income statement (0.1) 3.7 2.8 6.4 Charged to equity – (0.8) – (0.8) Charged to other comprehensive income – (0.8) – (0.8) Transferred to current tax – (1.2) – (1.2) Acquired in business combinations – 0.1 – 0.1 Foreign exchange – 0.2 0.1 0.3 Gross deferred tax asset at 31 March 2020 0.3 15.6 7.8 23.7 Less: liability available for offset (10.4) Net deferred tax asset at 31 March 2020 13.3
All figures in £ million Pension surplus
Owned property,
plant and equipment
Acquired intangibles Total
At 1 April 2019 (48.6) (16.1) (19.9) (84.6) (Charged)/credited to income statement (2.5) (11.0) 0.2 (13.3) Charged to other comprehensive income (12.7) – – (12.7) Acquired in business combination – – (1.3) (1.3) Foreign exchange – 0.3 (0.1) 0.2 Gross deferred tax liability at 31 March 2020 (63.8) (26.8) (21.1) (111.7) Less: asset available for offset 10.4 Net deferred tax liability at 31 March 2020 (101.3)
All figures in £ million 2021 2020
Current tax receivable 0.7 0.2 Current tax payable (3.8) (4.1) Net current tax payable (3.1) (3.9)
All figures in £ million 2021 2020
Raw materials 36.0 27.7 Work in progress 5.6 9.0 Finished goods 12.8 15.6 Total inventory 54.4 52.3
145Annual Report & Accounts 2021
Financial Statements

Notes to the Financial Statements For the year ended 31 March
QinetiQ Group plc Annual Report and Accounts 2021 132
1. Significant changes in the current reporting period
The financial position and performance of the Group was particularly affected by the following events and transactions during the reporting period:
1) The acquisition of Naimuri Limited (see note 12) which resulted in an increase in goodwill (note 14) and other intangible assets (note 15);
2) The divestment of the Boldon James, Commerce Decisions and OptaSense businesses (see note 13); 3) An impairment of goodwill in respect of the Germany business (see note 14).
For a detailed discussion of the Group’s performance and financial position refer to the Strategic Report on pages 2 to 51.
2. Revenue from contracts with customers and other income
Revenue and other income is analysed as follows:
Revenue by category and other income For the year ended 31 March
1 For the period of which there was no contribution in the equivalent period in the comparator year which was pre-ownership (for acquisitions) or post-ownership (for disposals) by the Group
2 Alternative performance measures are used to supplement the statutory figures. See page 183.
Other income
Revenue and profit after tax of associates and joint ventures was £12.6m and £1.1m respectively (2020: revenue of £18.1m and loss after tax of £1.5m). The figures in the table above represent the Group share of this profit after tax.
Other income is in respect of property rentals and the recovery of other related property costs.
Revenue by customer geographic location For the year ended 31 March
All figures in £ million 2021 2020
Services contracts with customers 1,189.4 945.6
Sale of goods contracts with customers 83.0 116.8
Royalties and licences 5.8 10.5
Total revenue 1,278.2 1,072.9
Less: adjust current year for acquired businesses1 (117.2) –
Less: adjust prior year for disposed businesses1 – (17.2)
Adjust to constant prior year exchange rates 2.2 –
Total revenue on an organic, constant currency basis2 1,163.2 1,055.7
Organic revenue growth at constant currency2 10% 10%
All figures in £ million 2021 2020
Share of associates’ and joint ventures’ profit/(loss) after tax 0.7 (0.7)
Other income 9.2 9.9
Other income – underlying 9.9 9.2
Specific adjusting item: gain on sale of property (note 4) 0.1 14.0
Total other income 10.0 23.2
All figures in £ million 2021 2020
US 215.6 136.0
Australia 77.9 60.7
Europe 88.2 75.9
Middle east 9.8 16.3
Rest of world 28.9 44.5
International 420.4 333.4
United Kingdom 857.8 739.5
Total revenue 1,278.2 1,072.9
International revenue % 33% 31%
Revenue from ‘home countries’ (UK, US and Australia) 1,151.3 936.2
Home countries revenue % 90% 87%
Notes to the Financial Statements For the year ended 31 March
QinetiQ Group plc Annual Report and Accounts 2021 132
1. Significant changes in the current reporting period
The financial position and performance of the Group was particularly affected by the following events and transactions during the reporting period:
1) The acquisition of Naimuri Limited (see note 12) which resulted in an increase in goodwill (note 14) and other intangible assets (note 15);
2) The divestment of the Boldon James, Commerce Decisions and OptaSense businesses (see note 13); 3) An impairment of goodwill in respect of the Germany business (see note 14).
For a detailed discussion of the Group’s performance and financial position refer to the Strategic Report on pages 2 to 51.
2. Revenue from contracts with customers and other income
Revenue and other income is analysed as follows:
Revenue by category and other income For the year ended 31 March
1 For the period of which there was no contribution in the equivalent period in the comparator year which was pre-ownership (for acquisitions) or post-ownership (for disposals) by the Group
2 Alternative performance measures are used to supplement the statutory figures. See page 183.
Other income
Revenue and profit after tax of associates and joint ventures was £12.6m and £1.1m respectively (2020: revenue of £18.1m and loss after tax of £1.5m). The figures in the table above represent the Group share of this profit after tax.
Other income is in respect of property rentals and the recovery of other related property costs.
Revenue by customer geographic location For the year ended 31 March
All figures in £ million 2021 2020
Services contracts with customers 1,189.4 945.6
Sale of goods contracts with customers 83.0 116.8
Royalties and licences 5.8 10.5
Total revenue 1,278.2 1,072.9
Less: adjust current year for acquired businesses1 (117.2) –
Less: adjust prior year for disposed businesses1 – (17.2)
Adjust to constant prior year exchange rates 2.2 –
Total revenue on an organic, constant currency basis2 1,163.2 1,055.7
Organic revenue growth at constant currency2 10% 10%
All figures in £ million 2021 2020
Share of associates’ and joint ventures’ profit/(loss) after tax 0.7 (0.7)
Other income 9.2 9.9
Other income – underlying 9.9 9.2
Specific adjusting item: gain on sale of property (note 4) 0.1 14.0
Total other income 10.0 23.2
All figures in £ million 2021 2020
US 215.6 136.0
Australia 77.9 60.7
Europe 88.2 75.9
Middle east 9.8 16.3
Rest of world 28.9 44.5
International 420.4 333.4
United Kingdom 857.8 739.5
Total revenue 1,278.2 1,072.9
International revenue % 33% 31%
Revenue from ‘home countries’ (UK, US and Australia) 1,151.3 936.2
Home countries revenue % 90% 87%
QinetiQ Group plc Annual Report and Accounts 2021 146
Trade and other receivables includes assets that are realised as part of the business’s normal operating cycle, including amounts of £11.2m that are not expected to be realised within 12 months of the year end. In determining the recoverability of trade receivables, the Group considers any change in the credit quality of the trade receivable from the date credit was granted to the reporting date. Credit risk is limited as a result of the high percentage of revenue derived from UK and US government agencies. Accordingly, the Directors believe that no credit provision in excess of the allowance for doubtful debts is required. As at 31 March 2021 the Group carried a loss allowance in respect of expected credit risk of £3.6m (2020: £3.1m).
Contract assets represents unbilled amounts recoverable under customer contracts (refer to accounting policies note 36). The Naimuri business acquired in the year and the three businesses disposed in the year contributed a net £8.1m decrease in trade and other receivables compared to prior year, with organic performance contributing to a more than offsetting increase.
Ageing of receivables and associated loss allowance for expected credit risk
As at 31 March 2021
Movements in the provision for expected credit loss
The maximum exposure to credit risk in relation to trade and other receivables at the reporting date is the fair value of trade and other receivables. The Group does not hold any collateral as security.
22. Trade and other payablesAs at 31 March
Notes to the Financial Statements For the year ended 31 March
21. Trade and other receivablesAs at 31 March
All figures in £ million 2021 2020
Trade receivables 120.5 105.0 Contract assets 161.1 103.8 Other receivables 7.8 11.3 Prepayments 37.3 29.9 Total trade and other receivables 326.7 250.0
Current Up to 30 days past due
30-120 days past due
>120 days past due
Total
Gross carrying amount - trade receivables (£m) 98.5 10.7 11.9 3.0 124.1 Gross carrying amount - contract assets (£m) 161.1 – – – 161.1 Expected loss rate (%) 0.7% – 0.8% 53.3% 1.3% Loss allowance (£m) 1.9 – 0.1 1.6 3.6
All figures in £ million 2021 2020
Trade receivables
Contract assets
Trade receivables
Contract assets
At 1 April 3.1 – 1.2 – Increase in loss allowance recognised in income statement 1.4 1.8 2.2 – Unutilised amount reversed through income statement (2.3) – (0.3) – Utilised (receivables written off) (0.1) – – – Divestments (0.2) – – – Foreign exchange (0.1) – – – At 31 March 1.8 1.8 3.1 –
All figures in £ million 2021 2020
Trade payables 77.3 65.0 Other tax and social security 43.7 37.6 Contract liabilities 157.3 143.9 Accrued expenses and other payables 133.4 133.3 Total current trade and other payables 411.7 379.8 Contract liabilities 36.3 2.7 Other payables 15.7 22.6 Total non-current trade and other payables 52.0 25.3 Total trade and other payables 463.7 405.1
146 QinetiQ Group plc
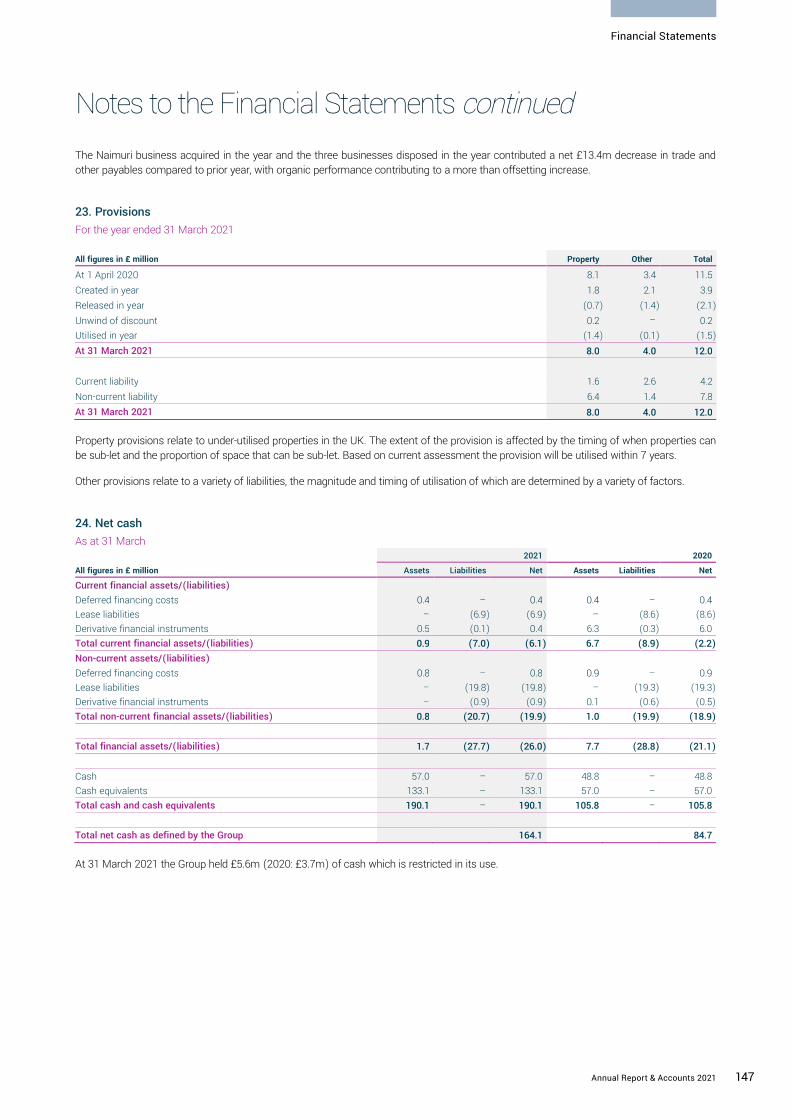
Notes to the Financial Statements continued
QinetiQ Group plc Annual Report and Accounts 2021 133
Financial Statements
Revenue by major customer type For the year ended 31 March
‘Other’ does not contain any customers with revenue in excess of 10% of total Group revenue.
The following table shows the aggregate amount of revenue allocated to performance obligations that are unsatisfied (or partially satisfied) as at the end of the reporting period:
Management expects that 27% (£800.5m) of revenue allocated to unsatisfied contracts as of 31 March 2021 will be recognised as revenue during the next reporting period.
The following table shows the aggregate amount of revenue allocated to performance obligations that were unsatisfied (or partially satisfied) as at the end of the prior reporting period:
Revenue of £144m was recognised during the year that was previously unrecognised as at the previous year end and reported as a contract liability.
3. Segmental analysis
The analysis by business segment is presented in accordance with IFRS 8 Operating Segments, on the basis of those reportable segments whose operating results are regularly reviewed by the Board (the Chief Operating Decision Maker as defined by IFRS 8) and are aligned with the Group’s strategic direction, determined with reference to the products and services they provide, as follows:
EMEA Services provides technical assurance, test and evaluation and training services, underpinned by long-term contracts. EMEA Services comprises the following business units which are not considered reportable segments as defined by IFRS 8: Maritime & Land; Air & Space, Cyber & Information and the International business.
Global Products combines all other business units not aggregated within EMEA Services, including the QinetiQ US business, Space Products and EMEA Products (which includes QinetiQ Target Systems). Generally these business units (which are not considered reportable segments as defined by IFRS 8) deliver innovative solutions and products which includes contract-funded research and development and developing intellectual property in partnership with key customers and through internal funding with potential for new revenue streams.
Operating segments
1 The measure of profit presented to the Chief Operating Decision Maker is operating profit stated before specific adjusting items (‘underlying operating profit’). The specific adjusting items are detailed in note 4.
2 Definitions of the Group’s ‘Alternative performance measures’ can be found in the glossary on page 183.
No measure of segmental assets and liabilities is reported as this information is not regularly provided to the Chief Operating Decision Maker.
All figures in £ million 2021 2020
UK government 794.6 667.2
US government 140.8 116.2
Other 342.8 289.5
Total revenue 1,278.2 1,072.9
All figures in £ million 2022 2023 2024 2025+ Total
Total forecast revenue allocated to unsatisfied performance obligations 800.5 523.9 395.9 1,223.8 2,944.1
All figures in £ million 2021 2022 2023 2024+ Total
Total forecast revenue allocated to unsatisfied performance obligations 849.3 484.9 375.5 1,395.2 3,104.9
2021 2020
All figures in £ million
Revenue from
external customers
Underlying operating
profit1
Revenue from
external customers
Underlying operating
profit1
EMEA Services 939.9 118.6 797.4 100.6
Global Products 338.3 33.2 275.5 32.6
Total operating segments 1,278.2 151.8 1,072.9 133.2
Underlying operating margin2 11.9% 12.4%
Notes to the Financial Statements continued
QinetiQ Group plc Annual Report and Accounts 2021 147
Financial Statements
The Naimuri business acquired in the year and the three businesses disposed in the year contributed a net £13.4m decrease in trade and other payables compared to prior year, with organic performance contributing to a more than offsetting increase.
23. Provisions
For the year ended 31 March 2021
Property provisions relate to under-utilised properties in the UK. The extent of the provision is affected by the timing of when properties can be sub-let and the proportion of space that can be sub-let. Based on current assessment the provision will be utilised within 7 years.
Other provisions relate to a variety of liabilities, the magnitude and timing of utilisation of which are determined by a variety of factors.
24. Net cash
As at 31 March
At 31 March 2021 the Group held £5.6m (2020: £3.7m) of cash which is restricted in its use.
All figures in £ million Property Other Total
At 1 April 2020 8.1 3.4 11.5
Created in year 1.8 2.1 3.9
Released in year (0.7) (1.4) (2.1)
Unwind of discount 0.2 – 0.2
Utilised in year (1.4) (0.1) (1.5)
At 31 March 2021 8.0 4.0 12.0
Current liability 1.6 2.6 4.2
Non-current liability 6.4 1.4 7.8
At 31 March 2021 8.0 4.0 12.0
2021 2020
All figures in £ million Assets Liabilities Net Assets Liabilities Net
Current financial assets/(liabilities)
Deferred financing costs 0.4 – 0.4 0.4 – 0.4
Lease liabilities – (6.9) (6.9) – (8.6) (8.6)
Derivative financial instruments 0.5 (0.1) 0.4 6.3 (0.3) 6.0
Total current financial assets/(liabilities) 0.9 (7.0) (6.1) 6.7 (8.9) (2.2)
Non-current assets/(liabilities)
Deferred financing costs 0.8 – 0.8 0.9 – 0.9
Lease liabilities – (19.8) (19.8) – (19.3) (19.3)
Derivative financial instruments – (0.9) (0.9) 0.1 (0.6) (0.5)
Total non-current financial assets/(liabilities) 0.8 (20.7) (19.9) 1.0 (19.9) (18.9)
Total financial assets/(liabilities) 1.7 (27.7) (26.0) 7.7 (28.8) (21.1)
Cash 57.0 – 57.0 48.8 – 48.8
Cash equivalents 133.1 – 133.1 57.0 – 57.0
Total cash and cash equivalents 190.1 – 190.1 105.8 – 105.8
Total net cash as defined by the Group 164.1 84.7
147Annual Report & Accounts 2021
Financial Statements
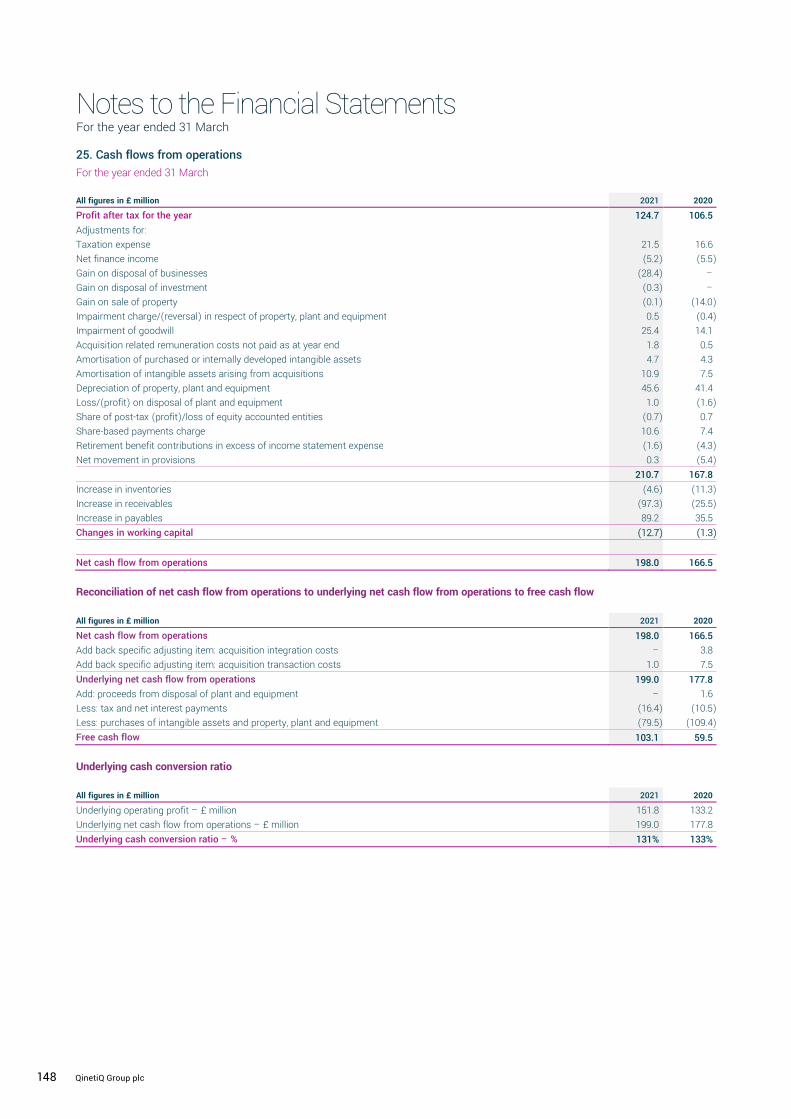
Notes to the Financial Statements For the year ended 31 March
QinetiQ Group plc Annual Report and Accounts 2021 132
1. Significant changes in the current reporting period
The financial position and performance of the Group was particularly affected by the following events and transactions during the reporting period:
1) The acquisition of Naimuri Limited (see note 12) which resulted in an increase in goodwill (note 14) and other intangible assets (note 15);
2) The divestment of the Boldon James, Commerce Decisions and OptaSense businesses (see note 13); 3) An impairment of goodwill in respect of the Germany business (see note 14).
For a detailed discussion of the Group’s performance and financial position refer to the Strategic Report on pages 2 to 51.
2. Revenue from contracts with customers and other income
Revenue and other income is analysed as follows:
Revenue by category and other income For the year ended 31 March
1 For the period of which there was no contribution in the equivalent period in the comparator year which was pre-ownership (for acquisitions) or post-ownership (for disposals) by the Group
2 Alternative performance measures are used to supplement the statutory figures. See page 183.
Other income
Revenue and profit after tax of associates and joint ventures was £12.6m and £1.1m respectively (2020: revenue of £18.1m and loss after tax of £1.5m). The figures in the table above represent the Group share of this profit after tax.
Other income is in respect of property rentals and the recovery of other related property costs.
Revenue by customer geographic location For the year ended 31 March
All figures in £ million 2021 2020
Services contracts with customers 1,189.4 945.6
Sale of goods contracts with customers 83.0 116.8
Royalties and licences 5.8 10.5
Total revenue 1,278.2 1,072.9
Less: adjust current year for acquired businesses1 (117.2) –
Less: adjust prior year for disposed businesses1 – (17.2)
Adjust to constant prior year exchange rates 2.2 –
Total revenue on an organic, constant currency basis2 1,163.2 1,055.7
Organic revenue growth at constant currency2 10% 10%
All figures in £ million 2021 2020
Share of associates’ and joint ventures’ profit/(loss) after tax 0.7 (0.7)
Other income 9.2 9.9
Other income – underlying 9.9 9.2
Specific adjusting item: gain on sale of property (note 4) 0.1 14.0
Total other income 10.0 23.2
All figures in £ million 2021 2020
US 215.6 136.0
Australia 77.9 60.7
Europe 88.2 75.9
Middle east 9.8 16.3
Rest of world 28.9 44.5
International 420.4 333.4
United Kingdom 857.8 739.5
Total revenue 1,278.2 1,072.9
International revenue % 33% 31%
Revenue from ‘home countries’ (UK, US and Australia) 1,151.3 936.2
Home countries revenue % 90% 87%
Notes to the Financial Statements For the year ended 31 March
QinetiQ Group plc Annual Report and Accounts 2021 148
25. Cash flows from operations
For the year ended 31 March
Reconciliation of net cash flow from operations to underlying net cash flow from operations to free cash flow
Underlying cash conversion ratio All figures in £ million 2021 2020
Underlying operating profit – £ million 151.8 133.2
Underlying net cash flow from operations – £ million 199.0 177.8
Underlying cash conversion ratio – % 131% 133%
All figures in £ million 2021 2020
Profit after tax for the year 124.7 106.5
Adjustments for:
Taxation expense 21.5 16.6
Net finance income (5.2) (5.5)
Gain on disposal of businesses (28.4) –
Gain on disposal of investment (0.3) –
Gain on sale of property (0.1) (14.0)
Impairment charge/(reversal) in respect of property, plant and equipment 0.5 (0.4)
Impairment of goodwill 25.4 14.1
Acquisition related remuneration costs not paid as at year end 1.8 0.5
Amortisation of purchased or internally developed intangible assets 4.7 4.3
Amortisation of intangible assets arising from acquisitions 10.9 7.5
Depreciation of property, plant and equipment 45.6 41.4
Loss/(profit) on disposal of plant and equipment 1.0 (1.6)
Share of post-tax (profit)/loss of equity accounted entities (0.7) 0.7
Share-based payments charge 10.6 7.4
Retirement benefit contributions in excess of income statement expense (1.6) (4.3)
Net movement in provisions 0.3 (5.4)
210.7 167.8
Increase in inventories (4.6) (11.3)
Increase in receivables (97.3) (25.5)
Increase in payables 89.2 35.5
Changes in working capital ((1122..77)) ((11..33))
Net cash flow from operations 198.0 166.5
All figures in £ million 2021 2020
Net cash flow from operations 198.0 166.5
Add back specific adjusting item: acquisition integration costs – 3.8
Add back specific adjusting item: acquisition transaction costs 1.0 7.5
Underlying net cash flow from operations 199.0 177.8
Add: proceeds from disposal of plant and equipment – 1.6
Less: tax and net interest payments (16.4) (10.5)
Less: purchases of intangible assets and property, plant and equipment (79.5) (109.4)
Free cash flow 103.1 59.5
148 QinetiQ Group plc

Notes to the Financial Statements continued
QinetiQ Group plc Annual Report and Accounts 2021 133
Financial Statements
Revenue by major customer type For the year ended 31 March
‘Other’ does not contain any customers with revenue in excess of 10% of total Group revenue.
The following table shows the aggregate amount of revenue allocated to performance obligations that are unsatisfied (or partially satisfied) as at the end of the reporting period:
Management expects that 27% (£800.5m) of revenue allocated to unsatisfied contracts as of 31 March 2021 will be recognised as revenue during the next reporting period.
The following table shows the aggregate amount of revenue allocated to performance obligations that were unsatisfied (or partially satisfied) as at the end of the prior reporting period:
Revenue of £144m was recognised during the year that was previously unrecognised as at the previous year end and reported as a contract liability.
3. Segmental analysis
The analysis by business segment is presented in accordance with IFRS 8 Operating Segments, on the basis of those reportable segments whose operating results are regularly reviewed by the Board (the Chief Operating Decision Maker as defined by IFRS 8) and are aligned with the Group’s strategic direction, determined with reference to the products and services they provide, as follows:
EMEA Services provides technical assurance, test and evaluation and training services, underpinned by long-term contracts. EMEA Services comprises the following business units which are not considered reportable segments as defined by IFRS 8: Maritime & Land; Air & Space, Cyber & Information and the International business.
Global Products combines all other business units not aggregated within EMEA Services, including the QinetiQ US business, Space Products and EMEA Products (which includes QinetiQ Target Systems). Generally these business units (which are not considered reportable segments as defined by IFRS 8) deliver innovative solutions and products which includes contract-funded research and development and developing intellectual property in partnership with key customers and through internal funding with potential for new revenue streams.
Operating segments
1 The measure of profit presented to the Chief Operating Decision Maker is operating profit stated before specific adjusting items (‘underlying operating profit’). The specific adjusting items are detailed in note 4.
2 Definitions of the Group’s ‘Alternative performance measures’ can be found in the glossary on page 183.
No measure of segmental assets and liabilities is reported as this information is not regularly provided to the Chief Operating Decision Maker.
All figures in £ million 2021 2020
UK government 794.6 667.2
US government 140.8 116.2
Other 342.8 289.5
Total revenue 1,278.2 1,072.9
All figures in £ million 2022 2023 2024 2025+ Total
Total forecast revenue allocated to unsatisfied performance obligations 800.5 523.9 395.9 1,223.8 2,944.1
All figures in £ million 2021 2022 2023 2024+ Total
Total forecast revenue allocated to unsatisfied performance obligations 849.3 484.9 375.5 1,395.2 3,104.9
2021 2020
All figures in £ million
Revenue from
external customers
Underlying operating
profit1
Revenue from
external customers
Underlying operating
profit1
EMEA Services 939.9 118.6 797.4 100.6
Global Products 338.3 33.2 275.5 32.6
Total operating segments 1,278.2 151.8 1,072.9 133.2
Underlying operating margin2 11.9% 12.4%
Notes to the Financial Statements continued
QinetiQ Group plc Annual Report and Accounts 2021 149
Financial Statements
26. Leases
Group as a lessor The Group receives rental income on certain properties. Primarily these are properties partially occupied by Group companies, with vacant space sub-let to third-party tenants. The Group had contracted with tenants for the following future minimum lease payments:
Group as a lessee Amounts recognised in the balance sheet The balance sheet shows the following amounts relating to leases:
Right-of-use assets (included within Property, Plant & Equipment – see note 16)
Lease liabilities (included within Net cash – see note 24)
Additions to the right-of-use assets during the 2021 financial year were £12.3m, including assets recognised on acquisition of £1.2m. The total cash outflow for leases in 2021 was £9.5m.
Amounts recognised in the consolidated income statement The consolidated income statement includes the following amounts relating to leases:
Minimum lease payment commitments The Group has the following total future minimum lease payment commitments:
Lease payments represent capital and interest payable by the Group on certain property, plant and equipment. Principal leases are negotiated for a term of approximately 10 years.
All figures in £ million 2021 2020
Within one year 5.7 5.2
In the second to fifth years inclusive 9.3 10.2
Greater than five years 2.4 2.7
Total future minimum lease payments 17.4 18.1
All figures in £ million 2021 2020
Land and buildings 21.8 19.5
Plant, machinery and vehicles 2.5 5.2
Computers and office equipment – 0.1
Total right of use assets net book value 24.3 24.8
All figures in £ million 2021 2020
Current 6.9 8.6
Non-current 19.8 19.3
Total lease liabilities 2266..77 27.9
All figures in £ million 2021 2020
Depreciation charge
Land and buildings 5.6 5.1
Plant, machinery and vehicles 2.7 4.5
Computers and office equipment 0.1 0.1
Total depreciation charge 8.4 9.7
Interest expense (included in finance cost) 1.0 1.0
Expense relating to short-term leases (included in operating costs) 1.1 1.6
Expense relating to low value leases (included in operating costs) 0.2 –
Total lease and sub-lease expense charged to profit before tax 10.7 12.3
All figures in £ million 2021 2020
Within one year 6.9 8.6
In the second to fifth years inclusive 15.6 17.8
Greater than five years 4.2 1.5
Total future minimum lease payment commitments 26.7 27.9
149Annual Report & Accounts 2021
Financial Statements
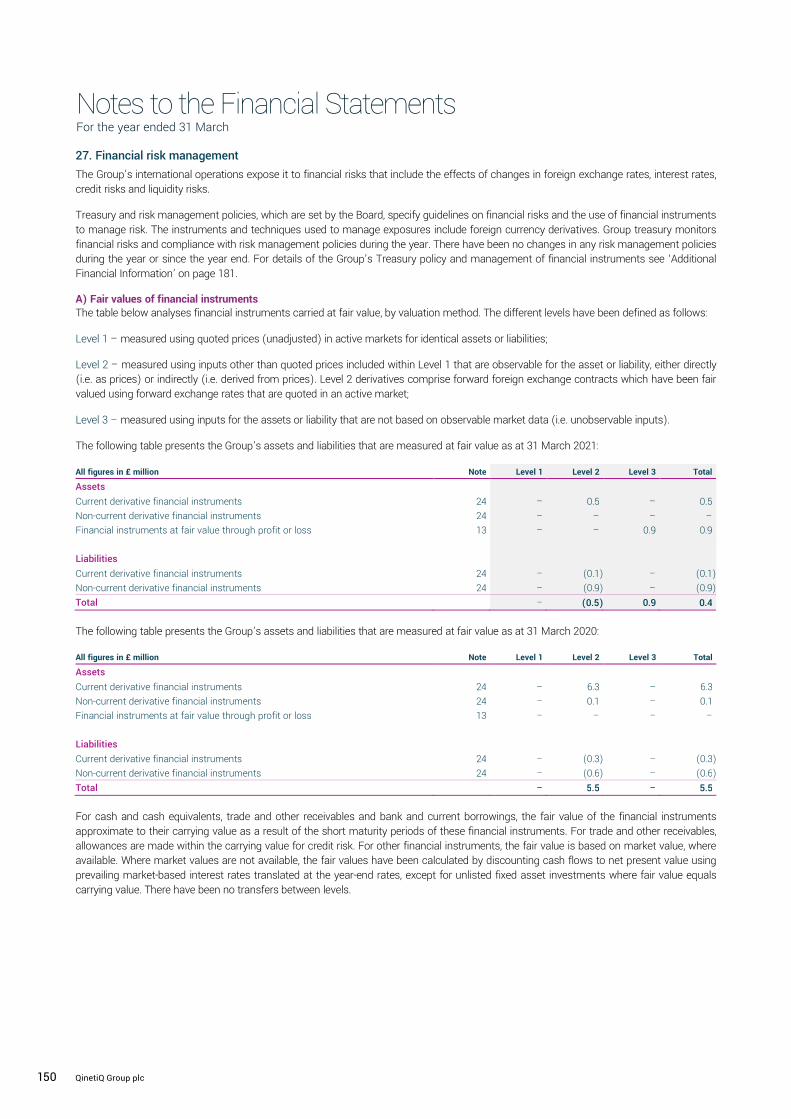
Notes to the Financial Statements For the year ended 31 March
QinetiQ Group plc Annual Report and Accounts 2021 132
1. Significant changes in the current reporting period
The financial position and performance of the Group was particularly affected by the following events and transactions during the reporting period:
1) The acquisition of Naimuri Limited (see note 12) which resulted in an increase in goodwill (note 14) and other intangible assets (note 15);
2) The divestment of the Boldon James, Commerce Decisions and OptaSense businesses (see note 13); 3) An impairment of goodwill in respect of the Germany business (see note 14).
For a detailed discussion of the Group’s performance and financial position refer to the Strategic Report on pages 2 to 51.
2. Revenue from contracts with customers and other income
Revenue and other income is analysed as follows:
Revenue by category and other income For the year ended 31 March
1 For the period of which there was no contribution in the equivalent period in the comparator year which was pre-ownership (for acquisitions) or post-ownership (for disposals) by the Group
2 Alternative performance measures are used to supplement the statutory figures. See page 183.
Other income
Revenue and profit after tax of associates and joint ventures was £12.6m and £1.1m respectively (2020: revenue of £18.1m and loss after tax of £1.5m). The figures in the table above represent the Group share of this profit after tax.
Other income is in respect of property rentals and the recovery of other related property costs.
Revenue by customer geographic location For the year ended 31 March
All figures in £ million 2021 2020
Services contracts with customers 1,189.4 945.6
Sale of goods contracts with customers 83.0 116.8
Royalties and licences 5.8 10.5
Total revenue 1,278.2 1,072.9
Less: adjust current year for acquired businesses1 (117.2) –
Less: adjust prior year for disposed businesses1 – (17.2)
Adjust to constant prior year exchange rates 2.2 –
Total revenue on an organic, constant currency basis2 1,163.2 1,055.7
Organic revenue growth at constant currency2 10% 10%
All figures in £ million 2021 2020
Share of associates’ and joint ventures’ profit/(loss) after tax 0.7 (0.7)
Other income 9.2 9.9
Other income – underlying 9.9 9.2
Specific adjusting item: gain on sale of property (note 4) 0.1 14.0
Total other income 10.0 23.2
All figures in £ million 2021 2020
US 215.6 136.0
Australia 77.9 60.7
Europe 88.2 75.9
Middle east 9.8 16.3
Rest of world 28.9 44.5
International 420.4 333.4
United Kingdom 857.8 739.5
Total revenue 1,278.2 1,072.9
International revenue % 33% 31%
Revenue from ‘home countries’ (UK, US and Australia) 1,151.3 936.2
Home countries revenue % 90% 87%
Notes to the Financial Statements For the year ended 31 March
QinetiQ Group plc Annual Report and Accounts 2021 150
27. Financial risk management
The Group’s international operations expose it to financial risks that include the effects of changes in foreign exchange rates, interest rates, credit risks and liquidity risks.
Treasury and risk management policies, which are set by the Board, specify guidelines on financial risks and the use of financial instruments to manage risk. The instruments and techniques used to manage exposures include foreign currency derivatives. Group treasury monitors financial risks and compliance with risk management policies during the year. There have been no changes in any risk management policies during the year or since the year end. For details of the Group’s Treasury policy and management of financial instruments see ‘Additional Financial Information’ on page 181.
A) Fair values of financial instruments The table below analyses financial instruments carried at fair value, by valuation method. The different levels have been defined as follows:
Level 1 – measured using quoted prices (unadjusted) in active markets for identical assets or liabilities;
Level 2 – measured using inputs other than quoted prices included within Level 1 that are observable for the asset or liability, either directly (i.e. as prices) or indirectly (i.e. derived from prices). Level 2 derivatives comprise forward foreign exchange contracts which have been fair valued using forward exchange rates that are quoted in an active market;
Level 3 – measured using inputs for the assets or liability that are not based on observable market data (i.e. unobservable inputs).
The following table presents the Group’s assets and liabilities that are measured at fair value as at 31 March 2021:
The following table presents the Group’s assets and liabilities that are measured at fair value as at 31 March 2020:
For cash and cash equivalents, trade and other receivables and bank and current borrowings, the fair value of the financial instruments approximate to their carrying value as a result of the short maturity periods of these financial instruments. For trade and other receivables, allowances are made within the carrying value for credit risk. For other financial instruments, the fair value is based on market value, where available. Where market values are not available, the fair values have been calculated by discounting cash flows to net present value using prevailing market-based interest rates translated at the year-end rates, except for unlisted fixed asset investments where fair value equals carrying value. There have been no transfers between levels.
All figures in £ million Note Level 1 Level 2 Level 3 Total
Assets
Current derivative financial instruments 24 – 0.5 – 0.5
Non-current derivative financial instruments 24 – – – –
Financial instruments at fair value through profit or loss 13 – – 0.9 0.9
Liabilities
Current derivative financial instruments 24 – (0.1) – (0.1)
Non-current derivative financial instruments 24 – (0.9) – (0.9)
Total – (0.5) 0.9 0.4
All figures in £ million Note Level 1 Level 2 Level 3 Total
Assets
Current derivative financial instruments 24 – 6.3 – 6.3
Non-current derivative financial instruments 24 – 0.1 – 0.1
Financial instruments at fair value through profit or loss 13 – – – –
Liabilities
Current derivative financial instruments 24 – (0.3) – (0.3)
Non-current derivative financial instruments 24 – (0.6) – (0.6)
Total – 5.5 – 5.5
150 QinetiQ Group plc

Notes to the Financial Statements continued
QinetiQ Group plc Annual Report and Accounts 2021 133
Financial Statements
Revenue by major customer type For the year ended 31 March
‘Other’ does not contain any customers with revenue in excess of 10% of total Group revenue.
The following table shows the aggregate amount of revenue allocated to performance obligations that are unsatisfied (or partially satisfied) as at the end of the reporting period:
Management expects that 27% (£800.5m) of revenue allocated to unsatisfied contracts as of 31 March 2021 will be recognised as revenue during the next reporting period.
The following table shows the aggregate amount of revenue allocated to performance obligations that were unsatisfied (or partially satisfied) as at the end of the prior reporting period:
Revenue of £144m was recognised during the year that was previously unrecognised as at the previous year end and reported as a contract liability.
3. Segmental analysis
The analysis by business segment is presented in accordance with IFRS 8 Operating Segments, on the basis of those reportable segments whose operating results are regularly reviewed by the Board (the Chief Operating Decision Maker as defined by IFRS 8) and are aligned with the Group’s strategic direction, determined with reference to the products and services they provide, as follows:
EMEA Services provides technical assurance, test and evaluation and training services, underpinned by long-term contracts. EMEA Services comprises the following business units which are not considered reportable segments as defined by IFRS 8: Maritime & Land; Air & Space, Cyber & Information and the International business.
Global Products combines all other business units not aggregated within EMEA Services, including the QinetiQ US business, Space Products and EMEA Products (which includes QinetiQ Target Systems). Generally these business units (which are not considered reportable segments as defined by IFRS 8) deliver innovative solutions and products which includes contract-funded research and development and developing intellectual property in partnership with key customers and through internal funding with potential for new revenue streams.
Operating segments
1 The measure of profit presented to the Chief Operating Decision Maker is operating profit stated before specific adjusting items (‘underlying operating profit’). The specific adjusting items are detailed in note 4.
2 Definitions of the Group’s ‘Alternative performance measures’ can be found in the glossary on page 183.
No measure of segmental assets and liabilities is reported as this information is not regularly provided to the Chief Operating Decision Maker.
All figures in £ million 2021 2020
UK government 794.6 667.2
US government 140.8 116.2
Other 342.8 289.5
Total revenue 1,278.2 1,072.9
All figures in £ million 2022 2023 2024 2025+ Total
Total forecast revenue allocated to unsatisfied performance obligations 800.5 523.9 395.9 1,223.8 2,944.1
All figures in £ million 2021 2022 2023 2024+ Total
Total forecast revenue allocated to unsatisfied performance obligations 849.3 484.9 375.5 1,395.2 3,104.9
2021 2020
All figures in £ million
Revenue from
external customers
Underlying operating
profit1
Revenue from
external customers
Underlying operating
profit1
EMEA Services 939.9 118.6 797.4 100.6
Global Products 338.3 33.2 275.5 32.6
Total operating segments 1,278.2 151.8 1,072.9 133.2
Underlying operating margin2 11.9% 12.4%
Notes to the Financial Statements continued
QinetiQ Group plc Annual Report and Accounts 2021 151
Financial Statements
All financial assets and liabilities had a fair value that is identical to book value at 31 March 2021 and 31 March 2020. Detailed analysis is provided in the following tables:
As at 31 March 2021
As at 31 March 2020
All figures in £ million Note
Financial assets at fair
value profit and loss
Financial assets at
amortised cost
Financial liabilities at
amortised cost
Derivatives used as hedges
Total carrying
value Total fair
value
Financial assets
Non-current
Derivative financial instruments 24 – – – 0.1 0.1 0.1
Deferred financing costs 24 – 0.9 – – 0.9 0.9
Current
Trade and other receivables (excluding prepayments) 21 – 220.1 – – 220.1 220.1
Derivative financial instruments 24 – – – 6.3 6.3 6.3
Deferred financing costs 24 – 0.4 – – 0.4 0.4
Cash and cash equivalents 24 105.8 – – – 105.8 105.8
Total financial assets 105.8 221.4 – 6.4 333.6 333.6
Financial liabilities
Non-current
Trade and other payables (excluding contract liabilities) 22 – – (22.6) – (22.6) (22.6)
Derivative financial instruments 24 – – – (0.6) (0.6) (0.6)
Lease liabilities – – (19.3) – (19.3) (19.3)
Current
Trade and other payables (excluding contract liabilities) 22 – – (235.9) – (235.9) (235.9)
Derivative financial instruments 24 – – – (0.3) (0.3) (0.3)
Lease liabilities – – (8.6) – (8.6) (8.6)
Total financial liabilities – – (286.4) (0.9) (287.3) (287.3)
Total 105.8 221.4 (286.4) 5.5 46.3 46.3
All figures in £ million Note
Financial assets at fair
value profit and loss
Financial assets at
amortised cost
Financial liabilities at
amortised cost
Derivatives used as hedges
Total carrying
value Total fair
value
Financial assets
Non-current
Derivative financial instruments 24 – – – – – –
Deferred financing costs 24 – 0.8 – – 0.8 0.8
Current
Trade and other receivables (excluding prepayments) 21 – 289.4 – – 289.4 289.4
Derivative financial instruments 24 – – – 0.5 0.5 0.5
Deferred financing costs 24 – 0.4 – – 0.4 0.4
Cash and cash equivalents 24 190.1 – – – 190.1 190.1
Total financial assets 190.1 290.6 –– 0.5 481.2 481.2
Financial liabilities
Non-current
Trade and other payables (excluding contract liabilities) 22 – – (15.7) – (15.7) (15.7)
Derivative financial instruments 24 – – – (0.9) (0.9) (0.9)
Lease liabilities – – (19.8) – (19.8) (19.8)
Current
Trade and other payables (excluding contract liabilities) 22 – – (254.4) – (254.4) (254.4)
Derivative financial instruments 24 – – – (0.1) (0.1) (0.1)
Lease liabilities – – (6.9) – (6.9) (6.9)
Total financial liabilities – – (296.8) (1.0) (297.8) (297.8)
Total 190.1 290.6 (296.8) (0.5) 183.4 183.4
151Annual Report & Accounts 2021
Financial Statements

Notes to the Financial Statements For the year ended 31 March
QinetiQ Group plc Annual Report and Accounts 2021 132
1. Significant changes in the current reporting period
The financial position and performance of the Group was particularly affected by the following events and transactions during the reporting period:
1) The acquisition of Naimuri Limited (see note 12) which resulted in an increase in goodwill (note 14) and other intangible assets (note 15);
2) The divestment of the Boldon James, Commerce Decisions and OptaSense businesses (see note 13); 3) An impairment of goodwill in respect of the Germany business (see note 14).
For a detailed discussion of the Group’s performance and financial position refer to the Strategic Report on pages 2 to 51.
2. Revenue from contracts with customers and other income
Revenue and other income is analysed as follows:
Revenue by category and other income For the year ended 31 March
1 For the period of which there was no contribution in the equivalent period in the comparator year which was pre-ownership (for acquisitions) or post-ownership (for disposals) by the Group
2 Alternative performance measures are used to supplement the statutory figures. See page 183.
Other income
Revenue and profit after tax of associates and joint ventures was £12.6m and £1.1m respectively (2020: revenue of £18.1m and loss after tax of £1.5m). The figures in the table above represent the Group share of this profit after tax.
Other income is in respect of property rentals and the recovery of other related property costs.
Revenue by customer geographic location For the year ended 31 March
All figures in £ million 2021 2020
Services contracts with customers 1,189.4 945.6
Sale of goods contracts with customers 83.0 116.8
Royalties and licences 5.8 10.5
Total revenue 1,278.2 1,072.9
Less: adjust current year for acquired businesses1 (117.2) –
Less: adjust prior year for disposed businesses1 – (17.2)
Adjust to constant prior year exchange rates 2.2 –
Total revenue on an organic, constant currency basis2 1,163.2 1,055.7
Organic revenue growth at constant currency2 10% 10%
All figures in £ million 2021 2020
Share of associates’ and joint ventures’ profit/(loss) after tax 0.7 (0.7)
Other income 9.2 9.9
Other income – underlying 9.9 9.2
Specific adjusting item: gain on sale of property (note 4) 0.1 14.0
Total other income 10.0 23.2
All figures in £ million 2021 2020
US 215.6 136.0
Australia 77.9 60.7
Europe 88.2 75.9
Middle east 9.8 16.3
Rest of world 28.9 44.5
International 420.4 333.4
United Kingdom 857.8 739.5
Total revenue 1,278.2 1,072.9
International revenue % 33% 31%
Revenue from ‘home countries’ (UK, US and Australia) 1,151.3 936.2
Home countries revenue % 90% 87%
Notes to the Financial Statements For the year ended 31 March
QinetiQ Group plc Annual Report and Accounts 2021 152
27. Financial risk management (continued)
B) Interest rate risk The Group operates an interest rate policy designed to optimise interest costs and to reduce volatility in reported earnings. The Group’s current policy is to require rates to be fixed for 30%–80% of the level of borrowings, which is achieved primarily through fixed-rate borrowings. Where there are significant changes in the level and/or structure of debt, policy permits borrowings to be 100% fixed, with regular Board reviews of the appropriateness of this fixed percentage. At 31 March 2021 and 31 March 2020 the Group had no borrowings.
Financial assets/(liabilities)
As at 31 March 2021
As at 31 March 2020
* Amounts categorised under fixed or capped financial liabilities as Euro only has been restated to show a revised split across the currencies.
Floating-rate financial assets attract interest based on the relevant national LIBID equivalent. Floating-rate financial liabilities bear interest at the relevant national LIBOR equivalent. Trade and other receivables/payables and deferred finance costs are excluded from this analysis.
Interest rate risk management The revolving credit facility (note 27E) is floating-rate and undrawn as at 31 March 2021.
C) Currency risk Transactional currency exposure The Group is exposed to foreign currency risks arising from sales or purchases by businesses in currencies other than their functional currency. It is Group policy that when such a sale or purchase is certain, the net foreign exchange exposure is hedged using forward foreign exchange contracts. Hedge accounting documentation and effectiveness testing are undertaken for all the Group’s transactional hedge contracts.
The table below shows the Group’s currency exposures, being exposures on currency transactions that give rise to net currency gains and losses recognised in the income statement. Such exposures comprise the monetary assets and liabilities of the Group that are not denominated in the functional currency of the operating company involved.
Functional currency of the operating company
The amounts shown in the table take into account the effect of the forward contracts entered into to manage these currency exposures. The Group enters into forward foreign currency contracts to hedge the currency exposures that arise on sales and purchases denominated in foreign currencies, as the transaction occurs. The principal contract amounts of the outstanding forward currency contracts as at 31 March 2021 against Sterling are net US dollars sold of £67.3m (US$92.2m), net Euros bought £4.5m (€4.2m), net Canadian dollars sold £21.3m (C$36.6m), net United Arab Emirate dirhams sold £3.4m (AED 17.0m), net Swiss Francs bought of £1.4m (CHF 1.7m), net Swedish Krona bought of £6.0m (SEK 68.9m), net Norwegian Krona bought £0.2m (NOK 2.8m) and net Australian dollars bought £1.0m (A$ 1.8m).
Financial assets Financial liabilities
All figures in £ million Floating Non-interest
bearing Fixed or capped
Non-interest bearing
Sterling 155.4 0.5 (7.8) (1.0)
US dollar 14.7 – (15.2) –
Euro 6.6 – (2.1) –
Australian dollar 9.3 – (1.3) –
Other 4.1 – (0.3) –
Total 190.1 0.5 (26.7) (1.0)
Financial assets Financial liabilities
All figures in £ million Floating Non-interest
bearing
Fixed or capped
(restated)* Non-interest
bearing
Sterling 70.5 6.4 (9.6) (0.8)
US dollar 21.4 – (12.3) –
Euro 4.0 – (3.7) –
Australian dollar 4.6 – (1.7) –
Other 5.3 – (0.6) –
Total 105.8 6.4 (27.9) (0.8)
Net foreign currency monetary assets/(liabilities)
All figures in £ millions US$ Euro A$ Other Total
31 March 2021 – Sterling 7.1 3.3 00..88 23.8 35.0
31 March 2020– Sterling (52.8) (8.3) 00..33 (58.5) (119.3)
152 QinetiQ Group plc

Notes to the Financial Statements continued
QinetiQ Group plc Annual Report and Accounts 2021 133
Financial Statements
Revenue by major customer type For the year ended 31 March
‘Other’ does not contain any customers with revenue in excess of 10% of total Group revenue.
The following table shows the aggregate amount of revenue allocated to performance obligations that are unsatisfied (or partially satisfied) as at the end of the reporting period:
Management expects that 27% (£800.5m) of revenue allocated to unsatisfied contracts as of 31 March 2021 will be recognised as revenue during the next reporting period.
The following table shows the aggregate amount of revenue allocated to performance obligations that were unsatisfied (or partially satisfied) as at the end of the prior reporting period:
Revenue of £144m was recognised during the year that was previously unrecognised as at the previous year end and reported as a contract liability.
3. Segmental analysis
The analysis by business segment is presented in accordance with IFRS 8 Operating Segments, on the basis of those reportable segments whose operating results are regularly reviewed by the Board (the Chief Operating Decision Maker as defined by IFRS 8) and are aligned with the Group’s strategic direction, determined with reference to the products and services they provide, as follows:
EMEA Services provides technical assurance, test and evaluation and training services, underpinned by long-term contracts. EMEA Services comprises the following business units which are not considered reportable segments as defined by IFRS 8: Maritime & Land; Air & Space, Cyber & Information and the International business.
Global Products combines all other business units not aggregated within EMEA Services, including the QinetiQ US business, Space Products and EMEA Products (which includes QinetiQ Target Systems). Generally these business units (which are not considered reportable segments as defined by IFRS 8) deliver innovative solutions and products which includes contract-funded research and development and developing intellectual property in partnership with key customers and through internal funding with potential for new revenue streams.
Operating segments
1 The measure of profit presented to the Chief Operating Decision Maker is operating profit stated before specific adjusting items (‘underlying operating profit’). The specific adjusting items are detailed in note 4.
2 Definitions of the Group’s ‘Alternative performance measures’ can be found in the glossary on page 183.
No measure of segmental assets and liabilities is reported as this information is not regularly provided to the Chief Operating Decision Maker.
All figures in £ million 2021 2020
UK government 794.6 667.2
US government 140.8 116.2
Other 342.8 289.5
Total revenue 1,278.2 1,072.9
All figures in £ million 2022 2023 2024 2025+ Total
Total forecast revenue allocated to unsatisfied performance obligations 800.5 523.9 395.9 1,223.8 2,944.1
All figures in £ million 2021 2022 2023 2024+ Total
Total forecast revenue allocated to unsatisfied performance obligations 849.3 484.9 375.5 1,395.2 3,104.9
2021 2020
All figures in £ million
Revenue from
external customers
Underlying operating
profit1
Revenue from
external customers
Underlying operating
profit1
EMEA Services 939.9 118.6 797.4 100.6
Global Products 338.3 33.2 275.5 32.6
Total operating segments 1,278.2 151.8 1,072.9 133.2
Underlying operating margin2 11.9% 12.4%
Notes to the Financial Statements continued
QinetiQ Group plc Annual Report and Accounts 2021 153
Financial Statements
Translational currency exposure The Group has significant investments in overseas operations, particularly in the US. As a result, the Sterling value of the Group’s balance sheet can be affected by movement in exchange rates. The Group does not hedge against translational currency exposure to overseas net assets.
D) Financial credit risk The Group is exposed to credit-related losses in the event of non-performance by counterparties to financial instruments, but does not currently expect any counterparties to fail to meet their obligations. Credit risk is mitigated by a Board-approved policy of only selecting counterparties with a strong investment grade long-term credit rating for cash deposits. In the normal course of business the Group operates notional cash pooling systems, where a legal right of set-off applies.
The maximum credit-risk exposure in the event of other parties failing to perform their obligations under financial assets, excluding trade and other receivables, totals £163.9m (2020: £112.2m). The Group held cash and cash equivalents of £190.1m at 31 March 2021 (2020: £105.8m), which represents the maximum credit exposure on these assets. The cash and cash equivalents were held with different financial institutions which were rated single A or better. Cash equivalents comprise £133.1m (2020: £56.9m) invested in AAA-rated money market funds.
E) Liquidity risk Borrowing facilities As at 31 March 2021 the Group had a revolving credit facility (RCF) of £275.0m (2020: £275.0m). This facility, which is unutilised, has an initial term of five years of which £65.0m will mature on 27 September 2024 and £210.0m will mature on 27 September 2025. Total available funds, comprising the RCF and the Group’s freely available cash and cash equivalents, are shown in the table below:
Gross contractual cash flows for borrowings and other financial liabilities The following are the contractual maturities of financial liabilities, including interest payments. The cash flows associated with derivatives that are cash flow hedges are expected to have an impact on profit or loss in the periods shown.
As at 31 March 2021
As at 31 March 2020
All figures in £ million Book value Contractual cash flows
1 year or less 1–2 years 2–5 years
More than 5 years
Non-derivative financial liabilities
Trade and other payables (excluding contract liabilities) (258.5) (258.5) (235.9) (22.6) – –
Leases (27.9) (29.9) (9.2) (7.2) (11.7) (1.8)
Derivative financial liabilities
Forward foreign currency contracts – cash flow hedges (0.9) (0.9) (0.3) (0.3) (0.3) –
Total (287.3) (289.3) (245.4) (30.1) (12.0) (1.8)
Interest rate:
LIBOR plus Total
£m Drawn
£m Undrawn
£m
As at 31 March 2021
Committed facilities 0.53% 275.0 – 275.0
Freely available cash and cash equivalents 184.5
Available funds 31 March 2021 459.5
As at 31 March 2020
Committed facilities 0.53% 275.0 – 275.0
Freely available cash and cash equivalents 102.1
Available funds 31 March 2020 377.1
All figures in £ million Book value Contractual cash flows
1 year or less 1–2 years 2–5 years
More than 5 years
Non-derivative financial liabilities
Trade and other payables (excluding contract liabilities) (270.1) (270.1) (254.4) (15.7) – –
Leases (26.7) (30.7) (7.9) (6.1) (11.5) (5.2)
Derivative financial liabilities
Forward foreign currency contracts – cash flow hedges (1.0) (1.0) (0.1) (0.3) (0.6) –
Total (297.8) (301.8) (262.4) (22.1) (12.1) (5.2)
153Annual Report & Accounts 2021
Financial Statements

Notes to the Financial Statements For the year ended 31 March
QinetiQ Group plc Annual Report and Accounts 2021 132
1. Significant changes in the current reporting period
The financial position and performance of the Group was particularly affected by the following events and transactions during the reporting period:
1) The acquisition of Naimuri Limited (see note 12) which resulted in an increase in goodwill (note 14) and other intangible assets (note 15);
2) The divestment of the Boldon James, Commerce Decisions and OptaSense businesses (see note 13); 3) An impairment of goodwill in respect of the Germany business (see note 14).
For a detailed discussion of the Group’s performance and financial position refer to the Strategic Report on pages 2 to 51.
2. Revenue from contracts with customers and other income
Revenue and other income is analysed as follows:
Revenue by category and other income For the year ended 31 March
1 For the period of which there was no contribution in the equivalent period in the comparator year which was pre-ownership (for acquisitions) or post-ownership (for disposals) by the Group
2 Alternative performance measures are used to supplement the statutory figures. See page 183.
Other income
Revenue and profit after tax of associates and joint ventures was £12.6m and £1.1m respectively (2020: revenue of £18.1m and loss after tax of £1.5m). The figures in the table above represent the Group share of this profit after tax.
Other income is in respect of property rentals and the recovery of other related property costs.
Revenue by customer geographic location For the year ended 31 March
All figures in £ million 2021 2020
Services contracts with customers 1,189.4 945.6
Sale of goods contracts with customers 83.0 116.8
Royalties and licences 5.8 10.5
Total revenue 1,278.2 1,072.9
Less: adjust current year for acquired businesses1 (117.2) –
Less: adjust prior year for disposed businesses1 – (17.2)
Adjust to constant prior year exchange rates 2.2 –
Total revenue on an organic, constant currency basis2 1,163.2 1,055.7
Organic revenue growth at constant currency2 10% 10%
All figures in £ million 2021 2020
Share of associates’ and joint ventures’ profit/(loss) after tax 0.7 (0.7)
Other income 9.2 9.9
Other income – underlying 9.9 9.2
Specific adjusting item: gain on sale of property (note 4) 0.1 14.0
Total other income 10.0 23.2
All figures in £ million 2021 2020
US 215.6 136.0
Australia 77.9 60.7
Europe 88.2 75.9
Middle east 9.8 16.3
Rest of world 28.9 44.5
International 420.4 333.4
United Kingdom 857.8 739.5
Total revenue 1,278.2 1,072.9
International revenue % 33% 31%
Revenue from ‘home countries’ (UK, US and Australia) 1,151.3 936.2
Home countries revenue % 90% 87%
Notes to the Financial Statements For the year ended 31 March
QinetiQ Group plc Annual Report and Accounts 2021 154
27. Financial risk management (continued) F) Derivative financial instruments The Group has the following derivative financial instruments on the balance sheet, reported within the ‘Other financial assets’ line items. As at 31 March
The maturity of these derivative financial instruments is as follows:
As at 31 March
G) Maturity of financial liabilities The contractual maturity of the Group’s financial liabilities is shown below:
As at 31 March 2021
1 Excluding contract liabilities
As at 31 March 2020
1 Excluding contract liabilities ^ The lease liabilities have been restated to reflect an amended maturity split whereby £11.0m has been reclassified from the 1-2yrs category into the 2-5yrs category and
>5yrs category.
2021 2020
All figures in £ million Asset gains
Liability losses Net
Asset gains
Liability losses Net
Forward foreign currency contracts – cash flow hedges 0.5 (1.0) (0.5) 6.4 (0.9) 5.5 Derivative assets/(liabilities) at the end of the year 0.5 (1.0) (0.5) 6.4 (0.9) 5.5
2021 2020
All figures in £ million Asset gains
Liability losses Net
Asset gains
Liability losses Net
Expected to be recognised: In one year or less 0.5 (0.1) 0.4 6.3 (0.3) 6.0 Between one and two years – (0.3) (0.3) 0.1 (0.3) (0.2) More than two years – (0.6) (0.6) – (0.3) (0.3) Derivative assets/(liabilities) at the end of the year 0.5 (1.0) (0.5) 6.4 (0.9) 5.5
All figures in £ million
Trade and other
payables1
Derivative financial
instruments and lease liabilities Total
Due in one year or less 254.4 7.0 261.4 Due in more than one year but not more than two years 15.7 5.7 21.4 Due in more than two years but not more than five years – 10.8 10.8 Due in five years or more – 4.1 4.1 Total 270.1 27.6 297.7
All figures in £ million
Trade and other
payables1
Derivative financial
instruments and lease liabilities
(restated)^ Total
(restated)^
Due in one year or less 235.9 8.9 244.8 Due in more than one year but not more than two years 22.6 7.0 29.6 Due in more than two years but not more than five years – 11.3 11.3 Due in five years or more – 1.5 1.5 Total 258.5 28.7 287.2
154 QinetiQ Group plc
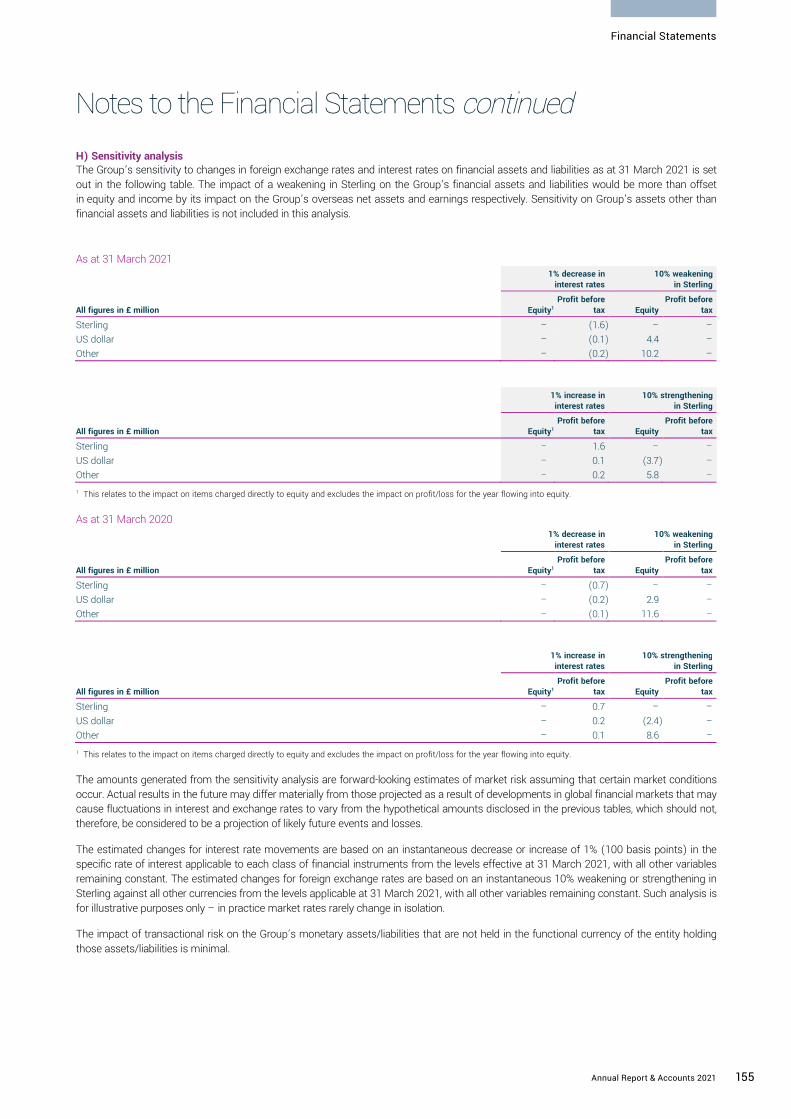
Notes to the Financial Statements continued
QinetiQ Group plc Annual Report and Accounts 2021 133
Financial Statements
Revenue by major customer type For the year ended 31 March
‘Other’ does not contain any customers with revenue in excess of 10% of total Group revenue.
The following table shows the aggregate amount of revenue allocated to performance obligations that are unsatisfied (or partially satisfied) as at the end of the reporting period:
Management expects that 27% (£800.5m) of revenue allocated to unsatisfied contracts as of 31 March 2021 will be recognised as revenue during the next reporting period.
The following table shows the aggregate amount of revenue allocated to performance obligations that were unsatisfied (or partially satisfied) as at the end of the prior reporting period:
Revenue of £144m was recognised during the year that was previously unrecognised as at the previous year end and reported as a contract liability.
3. Segmental analysis
The analysis by business segment is presented in accordance with IFRS 8 Operating Segments, on the basis of those reportable segments whose operating results are regularly reviewed by the Board (the Chief Operating Decision Maker as defined by IFRS 8) and are aligned with the Group’s strategic direction, determined with reference to the products and services they provide, as follows:
EMEA Services provides technical assurance, test and evaluation and training services, underpinned by long-term contracts. EMEA Services comprises the following business units which are not considered reportable segments as defined by IFRS 8: Maritime & Land; Air & Space, Cyber & Information and the International business.
Global Products combines all other business units not aggregated within EMEA Services, including the QinetiQ US business, Space Products and EMEA Products (which includes QinetiQ Target Systems). Generally these business units (which are not considered reportable segments as defined by IFRS 8) deliver innovative solutions and products which includes contract-funded research and development and developing intellectual property in partnership with key customers and through internal funding with potential for new revenue streams.
Operating segments
1 The measure of profit presented to the Chief Operating Decision Maker is operating profit stated before specific adjusting items (‘underlying operating profit’). The specific adjusting items are detailed in note 4.
2 Definitions of the Group’s ‘Alternative performance measures’ can be found in the glossary on page 183.
No measure of segmental assets and liabilities is reported as this information is not regularly provided to the Chief Operating Decision Maker.
All figures in £ million 2021 2020
UK government 794.6 667.2
US government 140.8 116.2
Other 342.8 289.5
Total revenue 1,278.2 1,072.9
All figures in £ million 2022 2023 2024 2025+ Total
Total forecast revenue allocated to unsatisfied performance obligations 800.5 523.9 395.9 1,223.8 2,944.1
All figures in £ million 2021 2022 2023 2024+ Total
Total forecast revenue allocated to unsatisfied performance obligations 849.3 484.9 375.5 1,395.2 3,104.9
2021 2020
All figures in £ million
Revenue from
external customers
Underlying operating
profit1
Revenue from
external customers
Underlying operating
profit1
EMEA Services 939.9 118.6 797.4 100.6
Global Products 338.3 33.2 275.5 32.6
Total operating segments 1,278.2 151.8 1,072.9 133.2
Underlying operating margin2 11.9% 12.4%
Notes to the Financial Statements continued
QinetiQ Group plc Annual Report and Accounts 2021 155
Financial Statements
H) Sensitivity analysis The Group’s sensitivity to changes in foreign exchange rates and interest rates on financial assets and liabilities as at 31 March 2021 is set out in the following table. The impact of a weakening in Sterling on the Group’s financial assets and liabilities would be more than offset in equity and income by its impact on the Group’s overseas net assets and earnings respectively. Sensitivity on Group’s assets other than financial assets and liabilities is not included in this analysis.
As at 31 March 2021
1 This relates to the impact on items charged directly to equity and excludes the impact on profit/loss for the year flowing into equity.
As at 31 March 2020
1 This relates to the impact on items charged directly to equity and excludes the impact on profit/loss for the year flowing into equity.
The amounts generated from the sensitivity analysis are forward-looking estimates of market risk assuming that certain market conditions occur. Actual results in the future may differ materially from those projected as a result of developments in global financial markets that may cause fluctuations in interest and exchange rates to vary from the hypothetical amounts disclosed in the previous tables, which should not, therefore, be considered to be a projection of likely future events and losses.
The estimated changes for interest rate movements are based on an instantaneous decrease or increase of 1% (100 basis points) in the specific rate of interest applicable to each class of financial instruments from the levels effective at 31 March 2021, with all other variables remaining constant. The estimated changes for foreign exchange rates are based on an instantaneous 10% weakening or strengthening in Sterling against all other currencies from the levels applicable at 31 March 2021, with all other variables remaining constant. Such analysis is for illustrative purposes only – in practice market rates rarely change in isolation.
The impact of transactional risk on the Group’s monetary assets/liabilities that are not held in the functional currency of the entity holding those assets/liabilities is minimal.
1% decrease in
interest rates 10% weakening
in Sterling
All figures in £ million Equity1 Profit before
tax Equity Profit before
tax
Sterling – (1.6) – –
US dollar – (0.1) 4.4 –
Other – (0.2) 10.2 –
1% increase in interest rates
10% strengthening in Sterling
All figures in £ million Equity1 Profit before
tax Equity Profit before
tax
Sterling – 1.6 – –
US dollar – 0.1 (3.7) –
Other – 0.2 5.8 –
1% decrease in
interest rates 10% weakening
in Sterling
All figures in £ million Equity1 Profit before
tax Equity Profit before
tax
Sterling – (0.7) – –
US dollar – (0.2) 2.9 –
Other – (0.1) 11.6 –
1% increase in interest rates
10% strengthening in Sterling
All figures in £ million Equity1 Profit before
tax Equity Profit before
tax
Sterling – 0.7 – –
US dollar – 0.2 (2.4) –
Other – 0.1 8.6 –
155Annual Report & Accounts 2021
Financial Statements

Notes to the Financial Statements For the year ended 31 March
QinetiQ Group plc Annual Report and Accounts 2021 132
1. Significant changes in the current reporting period
The financial position and performance of the Group was particularly affected by the following events and transactions during the reporting period:
1) The acquisition of Naimuri Limited (see note 12) which resulted in an increase in goodwill (note 14) and other intangible assets (note 15);
2) The divestment of the Boldon James, Commerce Decisions and OptaSense businesses (see note 13); 3) An impairment of goodwill in respect of the Germany business (see note 14).
For a detailed discussion of the Group’s performance and financial position refer to the Strategic Report on pages 2 to 51.
2. Revenue from contracts with customers and other income
Revenue and other income is analysed as follows:
Revenue by category and other income For the year ended 31 March
1 For the period of which there was no contribution in the equivalent period in the comparator year which was pre-ownership (for acquisitions) or post-ownership (for disposals) by the Group
2 Alternative performance measures are used to supplement the statutory figures. See page 183.
Other income
Revenue and profit after tax of associates and joint ventures was £12.6m and £1.1m respectively (2020: revenue of £18.1m and loss after tax of £1.5m). The figures in the table above represent the Group share of this profit after tax.
Other income is in respect of property rentals and the recovery of other related property costs.
Revenue by customer geographic location For the year ended 31 March
All figures in £ million 2021 2020
Services contracts with customers 1,189.4 945.6
Sale of goods contracts with customers 83.0 116.8
Royalties and licences 5.8 10.5
Total revenue 1,278.2 1,072.9
Less: adjust current year for acquired businesses1 (117.2) –
Less: adjust prior year for disposed businesses1 – (17.2)
Adjust to constant prior year exchange rates 2.2 –
Total revenue on an organic, constant currency basis2 1,163.2 1,055.7
Organic revenue growth at constant currency2 10% 10%
All figures in £ million 2021 2020
Share of associates’ and joint ventures’ profit/(loss) after tax 0.7 (0.7)
Other income 9.2 9.9
Other income – underlying 9.9 9.2
Specific adjusting item: gain on sale of property (note 4) 0.1 14.0
Total other income 10.0 23.2
All figures in £ million 2021 2020
US 215.6 136.0
Australia 77.9 60.7
Europe 88.2 75.9
Middle east 9.8 16.3
Rest of world 28.9 44.5
International 420.4 333.4
United Kingdom 857.8 739.5
Total revenue 1,278.2 1,072.9
International revenue % 33% 31%
Revenue from ‘home countries’ (UK, US and Australia) 1,151.3 936.2
Home countries revenue % 90% 87%
Notes to the Financial Statements For the year ended 31 March
QinetiQ Group plc Annual Report and Accounts 2021 156
28. Post-retirement benefits
Defined contribution plans In the UK the Group operates two defined contribution pension plans for the majority of its UK employees: a Group Personal Pension Plan (GPP) and a defined contribution section of the QinetiQ Pension Scheme in accordance with auto-enrolment regulations. These are both defined contribution schemes managed by Scottish Widows. With effect from 1st March 2021 contributions for both plans have been directed to a new DC arrangement provided by the Mercer Master Trust. A defined contribution plan is a pension plan under which the Group and employees pay fixed contributions to a third-party financial provider. The Group has no legal or constructive obligations to pay further contributions if the fund does not hold sufficient assets to pay all employees the benefits relating to employee service in the current and prior periods. The contributions are recognised as an employee benefit expense when they are due. The expense incurred during the year was £45.5m (2020: £42.9m). Prepaid contributions are recognised as an asset to the extent that a cash refund or a reduction in the future payments is available.
Defined benefit pension plan In the UK the Group operates the QinetiQ Pension Scheme (the Scheme) for approximately one quarter of its UK employees. The Scheme closed to future accrual on 31 October 2013 and there is no on-going service cost. After this date, defined benefit members transferred to a defined contribution section of the Scheme. The Scheme is a final salary plan, which provides benefits to members in the form of a guaranteed level of pension payable for life.
The level of benefits provided depends on the members’ length of service and their final pensionable earnings at closure to future accrual. In the Scheme, pensions in payment are generally updated in line with the Consumer Price Index (CPI). The benefit payments are made from Trustee-administered funds.
Plan assets held in trusts are governed by UK regulations as is the nature of the relationship between the Group and the Trustees and their composition. Responsibility for the governance of the Scheme – including investment decisions and contribution schedules – lies jointly with the Company and the Board of Trustees. The Board of Trustees must be composed of representatives of the Company and plan participants in accordance with the Scheme’s rules.
The asset recognised in the balance sheet in respect of the defined benefit pension plan is the fair value of plan assets less the present value of the defined benefit obligation at the end of the reporting period. The defined benefit obligation is calculated bi-annually by independent actuaries using the projected unit credit method. Future cash flows of the Scheme which are subject to inflation are calculated using a CPI inflation assumption for the majority of the cash flows, with a small proportion of cash flows linked to RPI. IAS 19 requires the inflation assumptions to be market-based assumptions, as opposed to being based on economic forecasts. A logical approach to setting the CPI inflation assumption would be to simply use the Bank of England long-term CPI inflation target of 2.0%. However, this is not acceptable under accounting standards and the current market data suggests that long-term CPI is significantly in excess of the Bank of England long-term target. Hence, the liability calculated for recording on the balance sheet at year end is based on a higher market expectation of CPI. Additional disclosure is provided (see following pages) to highlight the value of the liability (and the net surplus) if calculated using the Bank of England long term target rate of inflation.
The present value of the defined benefit obligation is determined by discounting the estimated, inflated future cash outflows using interest rates of high quality corporate bonds and that have terms to maturity approximating to the terms of the related pension obligation.
Actuarial gains and losses arising from experience adjustments and changes in actuarial assumptions are charged or credited to equity in other comprehensive income in the period in which they arise.
The Group has no further payment obligations once the agreed contributions have been paid. The expected employer cash contribution to the Scheme for the year ending 31 March 2022 is £2.9m.
Triennial funding valuation The most recent completed full actuarial valuation of the Scheme was undertaken as at 30 June 2020 and resulted in an actuarially assessed surplus of £176.5m (relative to the technical provisions i.e. the level of assets agreed by the Trustee and the Company as being appropriate to meet member benefits, assuming the Scheme continues as a going concern). The next triennial valuation will be performed as at 30 June 2023. The agreed recovery plan requires £2.8m per annum (at 2021 prices) distributions to the Scheme until 31 March 2032, indexed by reference to CPI. Such distributions are from the Group’s Pension Funding Limited Partnership.
QinetiQ’s Pension Funding Partnership (PFP) structure On 26 March 2012 QinetiQ established the QinetiQ PFP Limited Partnership (the ‘Partnership’) with the Scheme. Under this arrangement, properties to the capitalised value of £32.3m were transferred to the Partnership. The transfers were effected through a 20-year sale and leaseback agreement. The Scheme’s interest in the Partnership entitles it to an annual distribution of approximately £2.5m (from 2012) for 20 years, indexed with reference to CPI. The Scheme’s interest in the Partnership will revert back to QinetiQ Limited in 2032.
The Partnership is controlled by QinetiQ and its results are consolidated by the Group. Under IAS 19, the interest held by the Scheme in the Partnership does not qualify as a plan asset for the purposes of the Group’s consolidated financial statements and is, therefore, not included within the fair value of plan assets. As a result, the Group’s consolidated financial statements are unchanged by the Partnership. In addition, the value of the property transferred to the Partnership and leased back to QinetiQ remains on the balance sheet. QinetiQ retains the operational
156 QinetiQ Group plc

Notes to the Financial Statements continued
QinetiQ Group plc Annual Report and Accounts 2021 133
Financial Statements
Revenue by major customer type For the year ended 31 March
‘Other’ does not contain any customers with revenue in excess of 10% of total Group revenue.
The following table shows the aggregate amount of revenue allocated to performance obligations that are unsatisfied (or partially satisfied) as at the end of the reporting period:
Management expects that 27% (£800.5m) of revenue allocated to unsatisfied contracts as of 31 March 2021 will be recognised as revenue during the next reporting period.
The following table shows the aggregate amount of revenue allocated to performance obligations that were unsatisfied (or partially satisfied) as at the end of the prior reporting period:
Revenue of £144m was recognised during the year that was previously unrecognised as at the previous year end and reported as a contract liability.
3. Segmental analysis
The analysis by business segment is presented in accordance with IFRS 8 Operating Segments, on the basis of those reportable segments whose operating results are regularly reviewed by the Board (the Chief Operating Decision Maker as defined by IFRS 8) and are aligned with the Group’s strategic direction, determined with reference to the products and services they provide, as follows:
EMEA Services provides technical assurance, test and evaluation and training services, underpinned by long-term contracts. EMEA Services comprises the following business units which are not considered reportable segments as defined by IFRS 8: Maritime & Land; Air & Space, Cyber & Information and the International business.
Global Products combines all other business units not aggregated within EMEA Services, including the QinetiQ US business, Space Products and EMEA Products (which includes QinetiQ Target Systems). Generally these business units (which are not considered reportable segments as defined by IFRS 8) deliver innovative solutions and products which includes contract-funded research and development and developing intellectual property in partnership with key customers and through internal funding with potential for new revenue streams.
Operating segments
1 The measure of profit presented to the Chief Operating Decision Maker is operating profit stated before specific adjusting items (‘underlying operating profit’). The specific adjusting items are detailed in note 4.
2 Definitions of the Group’s ‘Alternative performance measures’ can be found in the glossary on page 183.
No measure of segmental assets and liabilities is reported as this information is not regularly provided to the Chief Operating Decision Maker.
All figures in £ million 2021 2020
UK government 794.6 667.2
US government 140.8 116.2
Other 342.8 289.5
Total revenue 1,278.2 1,072.9
All figures in £ million 2022 2023 2024 2025+ Total
Total forecast revenue allocated to unsatisfied performance obligations 800.5 523.9 395.9 1,223.8 2,944.1
All figures in £ million 2021 2022 2023 2024+ Total
Total forecast revenue allocated to unsatisfied performance obligations 849.3 484.9 375.5 1,395.2 3,104.9
2021 2020
All figures in £ million
Revenue from
external customers
Underlying operating
profit1
Revenue from
external customers
Underlying operating
profit1
EMEA Services 939.9 118.6 797.4 100.6
Global Products 338.3 33.2 275.5 32.6
Total operating segments 1,278.2 151.8 1,072.9 133.2
Underlying operating margin2 11.9% 12.4%
Notes to the Financial Statements continued
QinetiQ Group plc Annual Report and Accounts 2021 157
Financial Statements
flexibility to substitute properties of equivalent value within the Partnership and has the option to settle outstanding amounts due under the interest before 2032 if it so chooses.
Other UK schemes In the UK the Group has a small number of employees for whom benefits are secured through the Prudential Platinum Scheme (‘PPS’). The PPS scheme is always fully funded and has a very small surplus at year end. QinetiQ also offers employees access to a Group Self Invested Personal Pension Plan, but no Company contributions are paid to this arrangement.
Defined benefit pension plan (‘Scheme’) net pension asset The Scheme is in a net asset position with the market value of assets in excess of the present value of Scheme liabilities. These have the values set out below as at 31 March of each year end.
The balance sheet net pension asset is a snapshot view which can be significantly influenced by short-term market factors. The calculation of the net asset depends on factors which are beyond the control of the Group – principally the value at the balance sheet date of the various categories of assets in which the Scheme has invested and long-term interest rates and inflation rates used to value the Scheme’s liabilities. This is particularly pertinent during the COVID-19 pandemic whilst markets are extremely volatile. Sensitivities and risks are described on pages 159 and 160.
Post year end pension buy-in transaction Post year end (effective 30 April) the Scheme completed a bulk annuity insurance buy-in at a cost of £132.3m. This transaction has removed longevity risk, interest rate risk, and inflation risk for approximately 8% of the Scheme and is in line with the Group's strategy of de-risking the pension liabilities. This buy-in follows the Scheme’s first buy-in in 2019 which had already removed risk for approximately one-third of the Scheme. As a result of the transaction, the accounting pension surplus recorded on the Group's balance sheet will reduce by an estimated £25m with no related cash impact.
Total expense recognised in the income statement
Movement in the net pension asset The movement in the net pension asset (before deferred tax) is set out below:
All figures in £ million 2021 2020
Total market value of assets – see table below for analysis by category of asset 2,071.8 1,912.3
Present value of Scheme liabilities (1,857.5) (1,602.6)
Net pension asset before deferred tax 214.3 309.7
Deferred tax liability (45.5) (63.8)
Net pension asset after deferred tax 168.8 245.9
All figures in £ million 2021 2020
Net finance income 7.1 6.5
Administrative expenses (1.3) (1.2)
Total net income recognised in the income statement (gross of deferred tax) 5.8 5.3
All figures in £ million 2021 2020
Opening net pension asset 309.7 259.1
Net finance income 7.1 6.5
Net actuarial (loss)/gain (104.1) 39.8
Administrative expenses (1.3) (1.2)
Contributions by the employer 2.9 5.5
Closing net pension asset 214.3 309.7
157Annual Report & Accounts 2021
Financial Statements

Notes to the Financial Statements For the year ended 31 March
QinetiQ Group plc Annual Report and Accounts 2021 132
1. Significant changes in the current reporting period
The financial position and performance of the Group was particularly affected by the following events and transactions during the reporting period:
1) The acquisition of Naimuri Limited (see note 12) which resulted in an increase in goodwill (note 14) and other intangible assets (note 15);
2) The divestment of the Boldon James, Commerce Decisions and OptaSense businesses (see note 13); 3) An impairment of goodwill in respect of the Germany business (see note 14).
For a detailed discussion of the Group’s performance and financial position refer to the Strategic Report on pages 2 to 51.
2. Revenue from contracts with customers and other income
Revenue and other income is analysed as follows:
Revenue by category and other income For the year ended 31 March
1 For the period of which there was no contribution in the equivalent period in the comparator year which was pre-ownership (for acquisitions) or post-ownership (for disposals) by the Group
2 Alternative performance measures are used to supplement the statutory figures. See page 183.
Other income
Revenue and profit after tax of associates and joint ventures was £12.6m and £1.1m respectively (2020: revenue of £18.1m and loss after tax of £1.5m). The figures in the table above represent the Group share of this profit after tax.
Other income is in respect of property rentals and the recovery of other related property costs.
Revenue by customer geographic location For the year ended 31 March
All figures in £ million 2021 2020
Services contracts with customers 1,189.4 945.6
Sale of goods contracts with customers 83.0 116.8
Royalties and licences 5.8 10.5
Total revenue 1,278.2 1,072.9
Less: adjust current year for acquired businesses1 (117.2) –
Less: adjust prior year for disposed businesses1 – (17.2)
Adjust to constant prior year exchange rates 2.2 –
Total revenue on an organic, constant currency basis2 1,163.2 1,055.7
Organic revenue growth at constant currency2 10% 10%
All figures in £ million 2021 2020
Share of associates’ and joint ventures’ profit/(loss) after tax 0.7 (0.7)
Other income 9.2 9.9
Other income – underlying 9.9 9.2
Specific adjusting item: gain on sale of property (note 4) 0.1 14.0
Total other income 10.0 23.2
All figures in £ million 2021 2020
US 215.6 136.0
Australia 77.9 60.7
Europe 88.2 75.9
Middle east 9.8 16.3
Rest of world 28.9 44.5
International 420.4 333.4
United Kingdom 857.8 739.5
Total revenue 1,278.2 1,072.9
International revenue % 33% 31%
Revenue from ‘home countries’ (UK, US and Australia) 1,151.3 936.2
Home countries revenue % 90% 87%
Notes to the Financial Statements For the year ended 31 March
QinetiQ Group plc Annual Report and Accounts 2021 132
1. Significant changes in the current reporting period
The financial position and performance of the Group was particularly affected by the following events and transactions during the reporting period:
1) The acquisition of Naimuri Limited (see note 12) which resulted in an increase in goodwill (note 14) and other intangible assets (note 15);
2) The divestment of the Boldon James, Commerce Decisions and OptaSense businesses (see note 13); 3) An impairment of goodwill in respect of the Germany business (see note 14).
For a detailed discussion of the Group’s performance and financial position refer to the Strategic Report on pages 2 to 51.
2. Revenue from contracts with customers and other income
Revenue and other income is analysed as follows:
Revenue by category and other income For the year ended 31 March
1 For the period of which there was no contribution in the equivalent period in the comparator year which was pre-ownership (for acquisitions) or post-ownership (for disposals) by the Group
2 Alternative performance measures are used to supplement the statutory figures. See page 183.
Other income
Revenue and profit after tax of associates and joint ventures was £12.6m and £1.1m respectively (2020: revenue of £18.1m and loss after tax of £1.5m). The figures in the table above represent the Group share of this profit after tax.
Other income is in respect of property rentals and the recovery of other related property costs.
Revenue by customer geographic location For the year ended 31 March
All figures in £ million 2021 2020
Services contracts with customers 1,189.4 945.6
Sale of goods contracts with customers 83.0 116.8
Royalties and licences 5.8 10.5
Total revenue 1,278.2 1,072.9
Less: adjust current year for acquired businesses1 (117.2) –
Less: adjust prior year for disposed businesses1 – (17.2)
Adjust to constant prior year exchange rates 2.2 –
Total revenue on an organic, constant currency basis2 1,163.2 1,055.7
Organic revenue growth at constant currency2 10% 10%
All figures in £ million 2021 2020
Share of associates’ and joint ventures’ profit/(loss) after tax 0.7 (0.7)
Other income 9.2 9.9
Other income – underlying 9.9 9.2
Specific adjusting item: gain on sale of property (note 4) 0.1 14.0
Total other income 10.0 23.2
All figures in £ million 2021 2020
US 215.6 136.0
Australia 77.9 60.7
Europe 88.2 75.9
Middle east 9.8 16.3
Rest of world 28.9 44.5
International 420.4 333.4
United Kingdom 857.8 739.5
Total revenue 1,278.2 1,072.9
International revenue % 33% 31%
Revenue from ‘home countries’ (UK, US and Australia) 1,151.3 936.2
Home countries revenue % 90% 87%
QinetiQ Group plc Annual Report and Accounts 2021 158
Notes to the Financial Statements For the year ended 31 March
28. Post-retirement benefits (continued)Fair value of Scheme assets by type of asset The fair value of the QinetiQ Pension Scheme assets, which are not intended to be realised in the short term and may be subject to significant changes before they are realised, were:
1 Primarily private market debt investments 2 Unlisted corporate bonds with commercial property held as security 3 Valued by comparing with equivalent properties that have recently been transacted in the market
The Scheme’s assets do not include any of the Group’s own transferable financial instruments, property occupied by, or other assets used by the Group.
The insurance policy obtained by the pension scheme can only be used to pay or fund employee benefits under the Company’s defined benefit plan. It is not available to the Company’s own creditors and cannot be paid to another entity. These are the requirements of IAS 19 paragraph 7 and hence our determination is that the insurance policy is a qualifying insurance policy and requires classification as a plan asset. The policy was issued by an insurer that is not a related party.
Per the Scheme rules the Company has an unconditional right to a refund of any surplus, assuming gradual settlement of all liabilities over time. Such surplus may arise on cessation of the Scheme in the context of IFRIC 14 paragraphs 11(b) and 12 and therefore the full net pension asset can be recognised on the Group’s balance sheet and the Group’s minimum funding commitments to the Scheme do not give rise to an additional balance sheet liability.
Changes to the fair value of Scheme assets
Changes to the present value of Scheme liabilities The present value of the Scheme’s liabilities, which are derived from cash flow projections over long periods, and thus inherently uncertain, were:
All figures in £ million 2021 2020
Opening present value of Scheme liabilities (1,602.6) (1,704.5) Interest cost (36.4) (41.2) Actuarial gain/(loss) on Scheme liabilities based on:
Change in demographic assumptions 30.0 (2.3) Change in financial assumptions (269.6) 97.2 Experience (losses)/gains (23.3) 6.1
Net benefits paid out and transfers 44.4 42.1 Closing present value of Scheme liabilities (1,857.5) (1,602.6)
The net actuarial losses are primarily due to an increase in value of the financial assumption for inflation (see Assumptions section on the following page).
2021 2020
All figures in £ million Quoted
Not quoted in an active
market Total Quoted
Not quoted in an active
market Total
Equities 140.2 47.4 187.6 113.5 47.3 160.8 LDI investment 362.3 – 362.3 347.5 – 347.5 Asset backed security investments 455.6 – 455.6 465.0 – 465.0 Alternative bonds1 254.8 – 254.8 215.3 – 215.3 Corporate bonds2 – 98.0 98.0 – 40.5 40.5 Property funds3 – 76.6 76.6 – 126.5 126.5 Cash and cash equivalents – 49.3 49.3 – 15.8 15.8 Insurance buy-in policy – 588.0 588.0 – 546.0 546.0 Derivatives – (0.4) (0.4) – (5.1) (5.1) Total market value of assets 1,212.9 858.9 2,071.8 1,141.3 771.0 1,912.3
All figures in £ million 2021 2020
Opening fair value of Scheme assets 1,912.3 1,963.6 Interest income on Scheme assets 43.5 47.7 Re-measurement gain/(loss) on Scheme assets 158.8 (61.2) Contributions by the employer 2.9 5.5 Net benefits paid out and transfers (44.4) (42.1) Administrative expenses (1.3) (1.2) Closing fair value of Scheme assets 2,071.8 1,912.3
158 QinetiQ Group plc

Notes to the Financial Statements continued
QinetiQ Group plc Annual Report and Accounts 2021 133
Financial Statements
Revenue by major customer type For the year ended 31 March
‘Other’ does not contain any customers with revenue in excess of 10% of total Group revenue.
The following table shows the aggregate amount of revenue allocated to performance obligations that are unsatisfied (or partially satisfied) as at the end of the reporting period:
Management expects that 27% (£800.5m) of revenue allocated to unsatisfied contracts as of 31 March 2021 will be recognised as revenue during the next reporting period.
The following table shows the aggregate amount of revenue allocated to performance obligations that were unsatisfied (or partially satisfied) as at the end of the prior reporting period:
Revenue of £144m was recognised during the year that was previously unrecognised as at the previous year end and reported as a contract liability.
3. Segmental analysis
The analysis by business segment is presented in accordance with IFRS 8 Operating Segments, on the basis of those reportable segments whose operating results are regularly reviewed by the Board (the Chief Operating Decision Maker as defined by IFRS 8) and are aligned with the Group’s strategic direction, determined with reference to the products and services they provide, as follows:
EMEA Services provides technical assurance, test and evaluation and training services, underpinned by long-term contracts. EMEA Services comprises the following business units which are not considered reportable segments as defined by IFRS 8: Maritime & Land; Air & Space, Cyber & Information and the International business.
Global Products combines all other business units not aggregated within EMEA Services, including the QinetiQ US business, Space Products and EMEA Products (which includes QinetiQ Target Systems). Generally these business units (which are not considered reportable segments as defined by IFRS 8) deliver innovative solutions and products which includes contract-funded research and development and developing intellectual property in partnership with key customers and through internal funding with potential for new revenue streams.
Operating segments
1 The measure of profit presented to the Chief Operating Decision Maker is operating profit stated before specific adjusting items (‘underlying operating profit’). The specific adjusting items are detailed in note 4.
2 Definitions of the Group’s ‘Alternative performance measures’ can be found in the glossary on page 183.
No measure of segmental assets and liabilities is reported as this information is not regularly provided to the Chief Operating Decision Maker.
All figures in £ million 2021 2020
UK government 794.6 667.2
US government 140.8 116.2
Other 342.8 289.5
Total revenue 1,278.2 1,072.9
All figures in £ million 2022 2023 2024 2025+ Total
Total forecast revenue allocated to unsatisfied performance obligations 800.5 523.9 395.9 1,223.8 2,944.1
All figures in £ million 2021 2022 2023 2024+ Total
Total forecast revenue allocated to unsatisfied performance obligations 849.3 484.9 375.5 1,395.2 3,104.9
2021 2020
All figures in £ million
Revenue from
external customers
Underlying operating
profit1
Revenue from
external customers
Underlying operating
profit1
EMEA Services 939.9 118.6 797.4 100.6
Global Products 338.3 33.2 275.5 32.6
Total operating segments 1,278.2 151.8 1,072.9 133.2
Underlying operating margin2 11.9% 12.4%
Notes to the Financial Statements continued
QinetiQ Group plc Annual Report and Accounts 2021 159
Financial Statements
Assumptions The major assumptions used in the IAS 19 valuation of the Scheme’s liabilities were:
The assumptions used by the actuary are the best estimates chosen from a range of possible actuarial assumptions which, because of the timescale covered, may not necessarily be borne out in practice. It is important to note that these assumptions are long term and, in the case of the discount rate and the inflation rate, are measured by reference to external market indicators. The discount rate is based on observable yields on corporate bonds but there is no direct, observable market rate for CPI. A ‘market approach’ to deriving CPI involves adjusting a market-based RPI rate downward by an ‘inflation risk premium’ and an RPI-CPI adjustment factor (determined from relevant market yield curves). This market-based approach is required by IAS 19 and results in a CPI inflation rate significantly in excess of the Bank of England long term target and also in excess of a consensus view of CPI (based on surveys of economists). However, adopting an economic consensus approach to setting CPI inflation is not acceptable under accounting standards. Noting that an economic consensus view may be a more likely outcome than a market-based approach (which is currently impacted by significant uncertainty in respect of the UK Government’s RPI reform) the table below sets out what the Scheme liability and net surplus would be if calculated using CPI inflation rates of 2.0% and 2.2%.
Present value of Scheme liabilities and net pension asset if calculated using different CPI inflation assumptions
The sensitivity of the Scheme liabilities to higher or lower inflation rate assumptions, along with sensitivities to the discount rate and life expectancy assumptions is shown below.
The mortality assumptions as at 31 March 2021 were based on the S3 Normal Lives base tables, with various scaling factors based on sex and status. Allowance was made for improvements in mortality in line with CMI_2020 Core Projections and a long-term rate of improvement of 1.25% per annum.
The mortality assumptions as at 31 March 2020 were 90% of S2PMA for males and 90% of S2PFA for females, based on year of birth making allowance for improvements in mortality in line with CMI_2019 Core Projections and a long-term rate of improvement of 1.5% per annum.
The funding of the Scheme is based on long-term trends and assumptions relating to market growth, as advised by qualified actuaries and investment advisors. The weighted average duration of the defined benefit obligation is approximately 20 years.
Sensitivity analysis of the principal assumptions
The impact of movements in Scheme liabilities will, to an extent, be offset by movements in the value of Scheme assets as the Scheme has assets invested in a Liability Driven Investment portfolio. As at 31 March 2021 this hedges against approximately 90% of the interest rate risk and also 90% of the inflation rate risk, as measured on the Trustees’ gilt-funded basis.
The above sensitivity analyses are based on a change in an assumption while holding all other assumptions constant. In practice, this is unlikely to occur, and changes in some of the assumptions may be correlated. When calculating the sensitivity of the defined benefit obligation to significant actuarial assumptions the same method (projected unit credit method) has been applied as when calculating the pension liability recognised within the statement of financial position. The methods and types of assumption did not change.
All figures in £ million 2021 2020
Discount rate applied to Scheme liabilities 2.10% 2.30%
CPI inflation assumption 2.60% 1.90%
Assumed life expectancies in years:
Future male pensioners (currently aged 60) 86.7 87.4
Future female pensioners (currently aged 60) 88.6 89.5
Future male pensioners (currently aged 40) 88.4 88.9
Future female pensioners (currently aged 40) 90.7 91.0
All figures in £ million CPI of 2.0% CPI of 2.2%
Total market value of assets 2,071.8 2,071.8
Present value of Scheme liabilities (1,662.6) (1,726.6)
Net pension asset (before deferred tax) 409.2 345.2
Assumption Change in assumption Indicative impact on Scheme
liabilities (before deferred tax) Indicative impact on
net pension asset
Discount rate Increase/decrease by 0.1% Decrease/increase by £33m Decrease/increase by £11m
Rate of inflation Increase/decrease by 0.1% Increase/decrease by £32m Increase/decrease by £8m
Life expectancy Increase by 1 year Increase by £62m Decrease by £42m
159Annual Report & Accounts 2021
Financial Statements

Notes to the Financial Statements For the year ended 31 March
QinetiQ Group plc Annual Report and Accounts 2021 132
1. Significant changes in the current reporting period
The financial position and performance of the Group was particularly affected by the following events and transactions during the reporting period:
1) The acquisition of Naimuri Limited (see note 12) which resulted in an increase in goodwill (note 14) and other intangible assets (note 15);
2) The divestment of the Boldon James, Commerce Decisions and OptaSense businesses (see note 13); 3) An impairment of goodwill in respect of the Germany business (see note 14).
For a detailed discussion of the Group’s performance and financial position refer to the Strategic Report on pages 2 to 51.
2. Revenue from contracts with customers and other income
Revenue and other income is analysed as follows:
Revenue by category and other income For the year ended 31 March
1 For the period of which there was no contribution in the equivalent period in the comparator year which was pre-ownership (for acquisitions) or post-ownership (for disposals) by the Group
2 Alternative performance measures are used to supplement the statutory figures. See page 183.
Other income
Revenue and profit after tax of associates and joint ventures was £12.6m and £1.1m respectively (2020: revenue of £18.1m and loss after tax of £1.5m). The figures in the table above represent the Group share of this profit after tax.
Other income is in respect of property rentals and the recovery of other related property costs.
Revenue by customer geographic location For the year ended 31 March
All figures in £ million 2021 2020
Services contracts with customers 1,189.4 945.6
Sale of goods contracts with customers 83.0 116.8
Royalties and licences 5.8 10.5
Total revenue 1,278.2 1,072.9
Less: adjust current year for acquired businesses1 (117.2) –
Less: adjust prior year for disposed businesses1 – (17.2)
Adjust to constant prior year exchange rates 2.2 –
Total revenue on an organic, constant currency basis2 1,163.2 1,055.7
Organic revenue growth at constant currency2 10% 10%
All figures in £ million 2021 2020
Share of associates’ and joint ventures’ profit/(loss) after tax 0.7 (0.7)
Other income 9.2 9.9
Other income – underlying 9.9 9.2
Specific adjusting item: gain on sale of property (note 4) 0.1 14.0
Total other income 10.0 23.2
All figures in £ million 2021 2020
US 215.6 136.0
Australia 77.9 60.7
Europe 88.2 75.9
Middle east 9.8 16.3
Rest of world 28.9 44.5
International 420.4 333.4
United Kingdom 857.8 739.5
Total revenue 1,278.2 1,072.9
International revenue % 33% 31%
Revenue from ‘home countries’ (UK, US and Australia) 1,151.3 936.2
Home countries revenue % 90% 87%
Notes to the Financial Statements For the year ended 31 March
QinetiQ Group plc Annual Report and Accounts 2021 160
28. Post-retirement benefits (continued)
In addition to the sensitivity of the liability side of the net pension asset (which will impact the value of the net pension asset) the net pension asset is also exposed to significant variation due to changes in the fair value of Scheme assets. A specific sensitivity on assets has not been included in the above table but any change in valuation of assets flows straight through to the value of the net pension asset e.g. if equities fall by £10m then the net pension asset falls by £10m. The values of unquoted assets assume that an available buyer is willing to purchase those assets at that value. For the Group’s portfolio of assets, the property portfolio of £76.6m, the unquoted corporate bonds of £98.0m and the unquoted equities of £47.4m are the assets with most uncertainty as to valuation as at 31 March 2021.
Risks Through its defined benefit pension plan, the Group is exposed to a number of risks, the most significant of which are detailed below:
The accounting assumptions noted above are used to calculate the year end net pension asset in accordance with the relevant accounting standard, IAS 19 (revised) ‘Employee Benefits’. Changes in these assumptions have no impact on the Group’s cash payments into the Scheme. The payments into the Scheme are reassessed after every triennial valuation. The triennial valuations are calculated on a funding basis and use a different set of assumptions, as agreed with the pension Trustees. The key assumption that varies between the two methods of valuation is the discount rate. The funding basis valuation uses the risk-free rate from UK gilts as the base for calculating the discount rate, whilst the IAS 19 accounting basis valuation uses corporate bond yields as the base.
29. Share capital and other reserves
Shares allotted, called up and fully paid:
Except as noted below all shares in issue at 31 March 2021 rank pari-passu in all respects.
Rights attaching to the Special Share QinetiQ carries out activities which are important to UK defence and security interests. To protect these interests in the context of the ongoing commercial relationship between the MOD and QinetiQ, and to promote and reinforce the Compliance Principles, the MOD holds a Special Share in QinetiQ. QinetiQ obtained MOD consent to changes in its Special Shareholder rights, which were approved by shareholders at the 2012 AGM. The changes to the Special Share were disclosed in the 2012 Annual Report. Subsequent to the changes approved at the 2012 AGM the Special Share confers certain rights on the holder:
a) to require the Group to implement and maintain the Compliance System (as defined in the Articles of Association) so as to make at all times effective its and each member of QinetiQ Controlled Group’s application of the Compliance Principles, in a manner acceptable to the Special Shareholder
b) to refer matters to the Board for its consideration in relation to the application of the Compliance Principles c) to require the Board to obtain Special Shareholder’s consent: i) if at any time when the chairman is not a British citizen, it is proposed to appoint any person to the office of chief executive, who is
not a British citizen ii) if at any time when the chief executive is not a British citizen, it is proposed to appoint any person to the office of chairman, who is
not a British citizen d) to require the Board to take action to rectify any omission in the application of the Compliance Principles, if the Special Shareholder is of
the opinion that such steps are necessary to protect the defence or security interests of the United Kingdom e) to demand a poll at any of QinetiQ’s meetings (even though it may have no voting rights except those specifically set out in the Articles).
The Special Shareholder has an option to purchase defined Strategic Assets of the Group in certain circumstances. The Special Shareholder has, inter alia, the right to purchase any Strategic Assets which the Group wishes to sell. Strategic Assets are normally testing and research facilities (see note 31 for further details).
Volatility in market conditions Results under IAS 19 can change dramatically depending on market conditions. The present value of Scheme liabilities is linked to yields on AA-rated corporate bonds, while many of the assets of the Scheme are invested in various forms of assets subject to fluctuating valuations. Changing markets in conjunction with discount rate volatility will lead to volatility in the net pension asset on the Group’s balance sheet and in other comprehensive income. To a lesser extent this will also lead to volatility in the IAS 19 pension net finance income in the Group’s income statement.
Choice of accounting assumptions
The calculation of the present value of Scheme liabilities involves projecting future cash flows from the Scheme many years into the future. This means that the assumptions used can have a material impact on the balance sheet position and profit and loss charge. In practice future experience within the Scheme may not be in line with the assumptions adopted. For example, members could live longer than foreseen or inflation could be higher or lower than allowed for in the calculation of the liabilities.
Ordinary shares
of 1p each (equity) Special Share
of £1 (non-equity) Total
£ Number £ Number £ Number
As at 1 April 2020 5,717,571 571,757,121 1 1 5,717,572 571,757,122
Issue of new shares 25,000 2,500,000 – – 25,000 2,500,000
At 31 March 2021 5,742,571 574,257,121 1 1 5,742,572 574,257,122
160 QinetiQ Group plc

Notes to the Financial Statements continued
QinetiQ Group plc Annual Report and Accounts 2021 133
Financial Statements
Revenue by major customer type For the year ended 31 March
‘Other’ does not contain any customers with revenue in excess of 10% of total Group revenue.
The following table shows the aggregate amount of revenue allocated to performance obligations that are unsatisfied (or partially satisfied) as at the end of the reporting period:
Management expects that 27% (£800.5m) of revenue allocated to unsatisfied contracts as of 31 March 2021 will be recognised as revenue during the next reporting period.
The following table shows the aggregate amount of revenue allocated to performance obligations that were unsatisfied (or partially satisfied) as at the end of the prior reporting period:
Revenue of £144m was recognised during the year that was previously unrecognised as at the previous year end and reported as a contract liability.
3. Segmental analysis
The analysis by business segment is presented in accordance with IFRS 8 Operating Segments, on the basis of those reportable segments whose operating results are regularly reviewed by the Board (the Chief Operating Decision Maker as defined by IFRS 8) and are aligned with the Group’s strategic direction, determined with reference to the products and services they provide, as follows:
EMEA Services provides technical assurance, test and evaluation and training services, underpinned by long-term contracts. EMEA Services comprises the following business units which are not considered reportable segments as defined by IFRS 8: Maritime & Land; Air & Space, Cyber & Information and the International business.
Global Products combines all other business units not aggregated within EMEA Services, including the QinetiQ US business, Space Products and EMEA Products (which includes QinetiQ Target Systems). Generally these business units (which are not considered reportable segments as defined by IFRS 8) deliver innovative solutions and products which includes contract-funded research and development and developing intellectual property in partnership with key customers and through internal funding with potential for new revenue streams.
Operating segments
1 The measure of profit presented to the Chief Operating Decision Maker is operating profit stated before specific adjusting items (‘underlying operating profit’). The specific adjusting items are detailed in note 4.
2 Definitions of the Group’s ‘Alternative performance measures’ can be found in the glossary on page 183.
No measure of segmental assets and liabilities is reported as this information is not regularly provided to the Chief Operating Decision Maker.
All figures in £ million 2021 2020
UK government 794.6 667.2
US government 140.8 116.2
Other 342.8 289.5
Total revenue 1,278.2 1,072.9
All figures in £ million 2022 2023 2024 2025+ Total
Total forecast revenue allocated to unsatisfied performance obligations 800.5 523.9 395.9 1,223.8 2,944.1
All figures in £ million 2021 2022 2023 2024+ Total
Total forecast revenue allocated to unsatisfied performance obligations 849.3 484.9 375.5 1,395.2 3,104.9
2021 2020
All figures in £ million
Revenue from
external customers
Underlying operating
profit1
Revenue from
external customers
Underlying operating
profit1
EMEA Services 939.9 118.6 797.4 100.6
Global Products 338.3 33.2 275.5 32.6
Total operating segments 1,278.2 151.8 1,072.9 133.2
Underlying operating margin2 11.9% 12.4%
Notes to the Financial Statements continued
QinetiQ Group plc Annual Report and Accounts 2021 161
Financial Statements
The Special Share may only be issued to, held by and transferred to HM Government (or as it directs). At any time the Special Shareholder may require QinetiQ to redeem the Special Share at par. If QinetiQ is wound up the Special Shareholder will be entitled to be repaid the capital paid up on the Special Share before other shareholders receive any payment. The Special Shareholder has no other right to share in the capital or profits of QinetiQ.
The Special Shareholder must give consent to a general meeting held on short notice.
The Special Share entitles the Special Shareholder to require certain persons who hold (together with any person acting in concert with them) a material interest in QinetiQ to dispose of some or all of their ordinary shares in certain prescribed circumstances on the grounds of national security or conflict of interest.
The Directors must register any transfer of the Special Share within seven days.
Other reserves The translation reserve includes the cumulative foreign exchange difference arising on translation since the Group transitioned to IFRS. Movements on hedge instruments, where the hedge is effective, are recorded in the hedge reserve until the hedge ceases.
The capital redemption reserve, which was created following the redemption of preference share capital and the bonus issue of shares, cannot be distributed.
Own shares Own shares represent shares in the Company that are held by independent trusts and include treasury shares and shares held by the employee share ownership plan. Included in retained earnings at 31 March 2021 are 5,020,832 shares (2020: 6,123,406 shares).
30. Share-based payments
The Group operates a number of share-based payment plans for employees. The total share-based payment expense in the year was £11.2m, of which £11.2m related to equity-settled schemes and nil related to cash-settled schemes (2020: £7.5m, of which £7.5m related to equity-settled schemes and nil to cash-settled schemes). The share-based payment charged to equity is £10.6m consisting of the £11.2m charge to the income statement offset by a £0.4m charge to equity in respect of dividends accruing on unvested awards and £0.2m in respect of cash payment of the Bonus Banking Plan (BBP).
Performance Share Plan (PSP) During the year there were no further grants of PSP awards to employees as this scheme has been phased out. The awards vest after three years with 50% of the awards subject to TSR conditions and 50% subject to EPS conditions as detailed in the Report from the Remuneration Committee.
PSP awards are equity-settled awards and have vested on 22 June 2020. There is no exercise price for these PSP awards. Monte Carlo modelling was used to fair value the TSR element of the awards at grant date.
Group Share Incentive Plan (SIP) Under the QinetiQ SIP the Group offers UK employees the opportunity of purchasing up to £150 worth of shares a month at the prevailing market rate. The Group will make a matching share award of a third of the employee’s payment. The Group’s matching shares may be forfeited if the employee ceases to be employed by QinetiQ within three years of the award of the shares. There is no exercise price for these SIP awards.
SIP matching shares are equity-settled awards; those outstanding at 31 March 2021 had an average remaining life of 1.5 years (2020: 1.5 years). There is no exercise price for these SIP awards. Of the shares outstanding at the end of the year nil were exercisable (2020: nil).
2021 Number
of shares
2020 Number
of shares
Outstanding at start of the year 103,314 2,915,111
Exercised during the year (40,347) (800,356)
Forfeited/lapsed during the year (62,967) (2,011,441)
Outstanding at end of the year – 103,314
2021 Number of matching
shares
2020 Number of matching
shares
Outstanding at start of the year 746,645 782,362
Awarded during the year 300,420 259,317
Exercised during the year (291,851) (251,278)
Forfeited during the year (20,812) (43,756)
Outstanding at end of the year 734,402 746,645
161Annual Report & Accounts 2021
Financial Statements
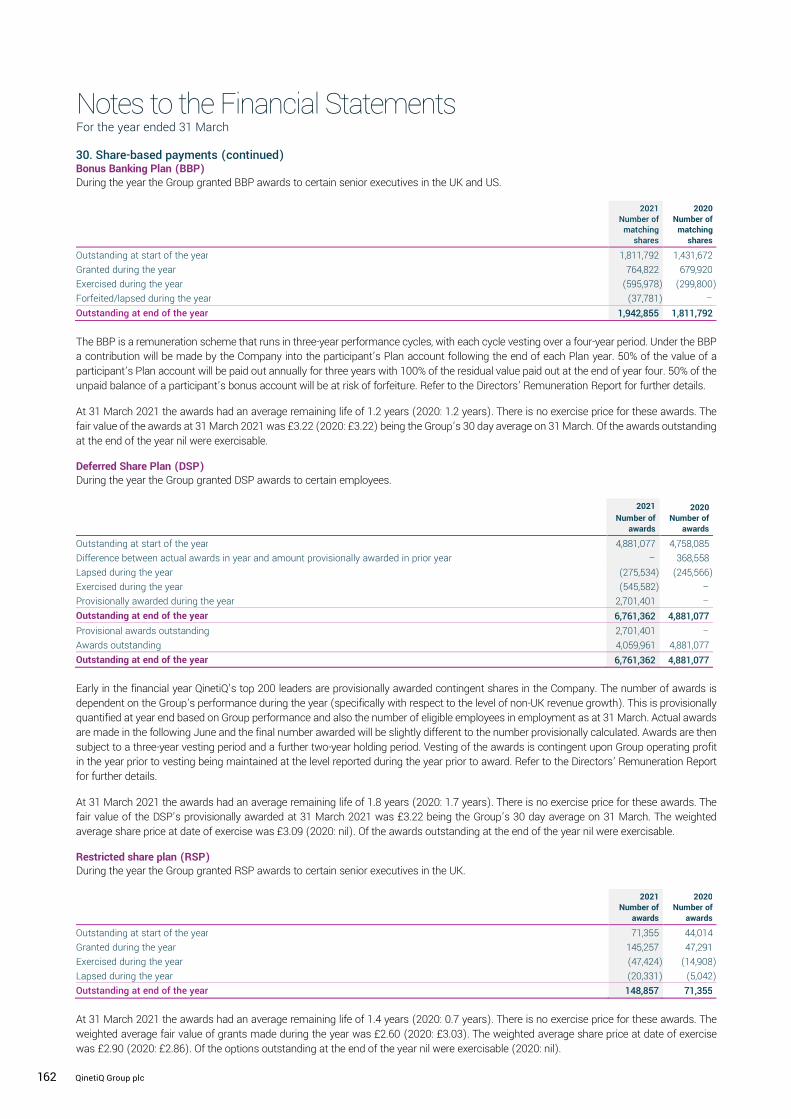
Notes to the Financial Statements For the year ended 31 March
QinetiQ Group plc Annual Report and Accounts 2021 132
1. Significant changes in the current reporting period
The financial position and performance of the Group was particularly affected by the following events and transactions during the reporting period:
1) The acquisition of Naimuri Limited (see note 12) which resulted in an increase in goodwill (note 14) and other intangible assets (note 15);
2) The divestment of the Boldon James, Commerce Decisions and OptaSense businesses (see note 13); 3) An impairment of goodwill in respect of the Germany business (see note 14).
For a detailed discussion of the Group’s performance and financial position refer to the Strategic Report on pages 2 to 51.
2. Revenue from contracts with customers and other income
Revenue and other income is analysed as follows:
Revenue by category and other income For the year ended 31 March
1 For the period of which there was no contribution in the equivalent period in the comparator year which was pre-ownership (for acquisitions) or post-ownership (for disposals) by the Group
2 Alternative performance measures are used to supplement the statutory figures. See page 183.
Other income
Revenue and profit after tax of associates and joint ventures was £12.6m and £1.1m respectively (2020: revenue of £18.1m and loss after tax of £1.5m). The figures in the table above represent the Group share of this profit after tax.
Other income is in respect of property rentals and the recovery of other related property costs.
Revenue by customer geographic location For the year ended 31 March
All figures in £ million 2021 2020
Services contracts with customers 1,189.4 945.6
Sale of goods contracts with customers 83.0 116.8
Royalties and licences 5.8 10.5
Total revenue 1,278.2 1,072.9
Less: adjust current year for acquired businesses1 (117.2) –
Less: adjust prior year for disposed businesses1 – (17.2)
Adjust to constant prior year exchange rates 2.2 –
Total revenue on an organic, constant currency basis2 1,163.2 1,055.7
Organic revenue growth at constant currency2 10% 10%
All figures in £ million 2021 2020
Share of associates’ and joint ventures’ profit/(loss) after tax 0.7 (0.7)
Other income 9.2 9.9
Other income – underlying 9.9 9.2
Specific adjusting item: gain on sale of property (note 4) 0.1 14.0
Total other income 10.0 23.2
All figures in £ million 2021 2020
US 215.6 136.0
Australia 77.9 60.7
Europe 88.2 75.9
Middle east 9.8 16.3
Rest of world 28.9 44.5
International 420.4 333.4
United Kingdom 857.8 739.5
Total revenue 1,278.2 1,072.9
International revenue % 33% 31%
Revenue from ‘home countries’ (UK, US and Australia) 1,151.3 936.2
Home countries revenue % 90% 87%
Notes to the Financial Statements For the year ended 31 March
QinetiQ Group plc Annual Report and Accounts 2021 162
30. Share-based payments (continued) Bonus Banking Plan (BBP) During the year the Group granted BBP awards to certain senior executives in the UK and US.
The BBP is a remuneration scheme that runs in three-year performance cycles, with each cycle vesting over a four-year period. Under the BBP a contribution will be made by the Company into the participant’s Plan account following the end of each Plan year. 50% of the value of a participant’s Plan account will be paid out annually for three years with 100% of the residual value paid out at the end of year four. 50% of the unpaid balance of a participant’s bonus account will be at risk of forfeiture. Refer to the Directors’ Remuneration Report for further details.
At 31 March 2021 the awards had an average remaining life of 1.2 years (2020: 1.2 years). There is no exercise price for these awards. The fair value of the awards at 31 March 2021 was £3.22 (2020: £3.22) being the Group’s 30 day average on 31 March. Of the awards outstanding at the end of the year nil were exercisable.
Deferred Share Plan (DSP) During the year the Group granted DSP awards to certain employees.
Early in the financial year QinetiQ’s top 200 leaders are provisionally awarded contingent shares in the Company. The number of awards is dependent on the Group’s performance during the year (specifically with respect to the level of non-UK revenue growth). This is provisionally quantified at year end based on Group performance and also the number of eligible employees in employment as at 31 March. Actual awards are made in the following June and the final number awarded will be slightly different to the number provisionally calculated. Awards are then subject to a three-year vesting period and a further two-year holding period. Vesting of the awards is contingent upon Group operating profit in the year prior to vesting being maintained at the level reported during the year prior to award. Refer to the Directors’ Remuneration Report for further details.
At 31 March 2021 the awards had an average remaining life of 1.8 years (2020: 1.7 years). There is no exercise price for these awards. The fair value of the DSP’s provisionally awarded at 31 March 2021 was £3.22 being the Group’s 30 day average on 31 March. The weighted average share price at date of exercise was £3.09 (2020: nil). Of the awards outstanding at the end of the year nil were exercisable.
Restricted share plan (RSP) During the year the Group granted RSP awards to certain senior executives in the UK.
At 31 March 2021 the awards had an average remaining life of 1.4 years (2020: 0.7 years). There is no exercise price for these awards. The weighted average fair value of grants made during the year was £2.60 (2020: £3.03). The weighted average share price at date of exercise was £2.90 (2020: £2.86). Of the options outstanding at the end of the year nil were exercisable (2020: nil).
2021 Number of matching
shares
2020 Number of matching
shares
Outstanding at start of the year 1,811,792 1,431,672
Granted during the year 764,822 679,920
Exercised during the year (595,978) (299,800)
Forfeited/lapsed during the year (37,781) –
Outstanding at end of the year 1,942,855 1,811,792
2021
Number of awards
2020 Number of
awards
Outstanding at start of the year 4,881,077 4,758,085
Difference between actual awards in year and amount provisionally awarded in prior year – 368,558
Lapsed during the year (275,534) (245,566)
Exercised during the year (545,582) –
Provisionally awarded during the year 2,701,401 –
Outstanding at end of the year 6,761,362 4,881,077
Provisional awards outstanding 2,701,401 –
Awards outstanding 4,059,961 4,881,077
Outstanding at end of the year 6,761,362 4,881,077
2021 Number of
awards
2020 Number of
awards
Outstanding at start of the year 71,355 44,014
Granted during the year 145,257 47,291
Exercised during the year (47,424) (14,908)
Lapsed during the year (20,331) (5,042)
Outstanding at end of the year 148,857 71,355
162 QinetiQ Group plc
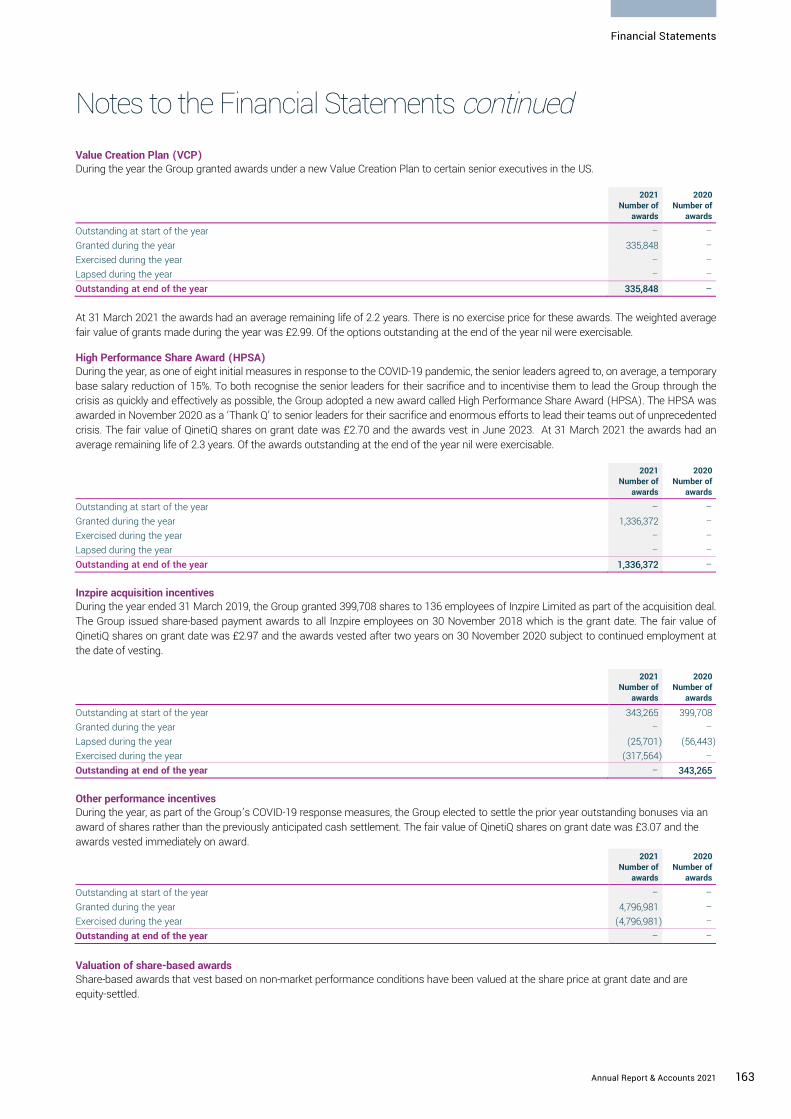
Notes to the Financial Statements continued
QinetiQ Group plc Annual Report and Accounts 2021 133
Financial Statements
Revenue by major customer type For the year ended 31 March
‘Other’ does not contain any customers with revenue in excess of 10% of total Group revenue.
The following table shows the aggregate amount of revenue allocated to performance obligations that are unsatisfied (or partially satisfied) as at the end of the reporting period:
Management expects that 27% (£800.5m) of revenue allocated to unsatisfied contracts as of 31 March 2021 will be recognised as revenue during the next reporting period.
The following table shows the aggregate amount of revenue allocated to performance obligations that were unsatisfied (or partially satisfied) as at the end of the prior reporting period:
Revenue of £144m was recognised during the year that was previously unrecognised as at the previous year end and reported as a contract liability.
3. Segmental analysis
The analysis by business segment is presented in accordance with IFRS 8 Operating Segments, on the basis of those reportable segments whose operating results are regularly reviewed by the Board (the Chief Operating Decision Maker as defined by IFRS 8) and are aligned with the Group’s strategic direction, determined with reference to the products and services they provide, as follows:
EMEA Services provides technical assurance, test and evaluation and training services, underpinned by long-term contracts. EMEA Services comprises the following business units which are not considered reportable segments as defined by IFRS 8: Maritime & Land; Air & Space, Cyber & Information and the International business.
Global Products combines all other business units not aggregated within EMEA Services, including the QinetiQ US business, Space Products and EMEA Products (which includes QinetiQ Target Systems). Generally these business units (which are not considered reportable segments as defined by IFRS 8) deliver innovative solutions and products which includes contract-funded research and development and developing intellectual property in partnership with key customers and through internal funding with potential for new revenue streams.
Operating segments
1 The measure of profit presented to the Chief Operating Decision Maker is operating profit stated before specific adjusting items (‘underlying operating profit’). The specific adjusting items are detailed in note 4.
2 Definitions of the Group’s ‘Alternative performance measures’ can be found in the glossary on page 183.
No measure of segmental assets and liabilities is reported as this information is not regularly provided to the Chief Operating Decision Maker.
All figures in £ million 2021 2020
UK government 794.6 667.2
US government 140.8 116.2
Other 342.8 289.5
Total revenue 1,278.2 1,072.9
All figures in £ million 2022 2023 2024 2025+ Total
Total forecast revenue allocated to unsatisfied performance obligations 800.5 523.9 395.9 1,223.8 2,944.1
All figures in £ million 2021 2022 2023 2024+ Total
Total forecast revenue allocated to unsatisfied performance obligations 849.3 484.9 375.5 1,395.2 3,104.9
2021 2020
All figures in £ million
Revenue from
external customers
Underlying operating
profit1
Revenue from
external customers
Underlying operating
profit1
EMEA Services 939.9 118.6 797.4 100.6
Global Products 338.3 33.2 275.5 32.6
Total operating segments 1,278.2 151.8 1,072.9 133.2
Underlying operating margin2 11.9% 12.4%
Notes to the Financial Statements continued
QinetiQ Group plc Annual Report and Accounts 2021 163
Financial Statements
Value Creation Plan (VCP) During the year the Group granted awards under a new Value Creation Plan to certain senior executives in the US.
At 31 March 2021 the awards had an average remaining life of 2.2 years. There is no exercise price for these awards. The weighted average fair value of grants made during the year was £2.99. Of the options outstanding at the end of the year nil were exercisable.
High Performance Share Award (HPSA) During the year, as one of eight initial measures in response to the COVID-19 pandemic, the senior leaders agreed to, on average, a temporary base salary reduction of 15%. To both recognise the senior leaders for their sacrifice and to incentivise them to lead the Group through the crisis as quickly and effectively as possible, the Group adopted a new award called High Performance Share Award (HPSA). The HPSA was awarded in November 2020 as a ‘Thank Q’ to senior leaders for their sacrifice and enormous efforts to lead their teams out of unprecedented crisis. The fair value of QinetiQ shares on grant date was £2.70 and the awards vest in June 2023. At 31 March 2021 the awards had an average remaining life of 2.3 years. Of the awards outstanding at the end of the year nil were exercisable.
Inzpire acquisition incentives During the year ended 31 March 2019, the Group granted 399,708 shares to 136 employees of Inzpire Limited as part of the acquisition deal. The Group issued share-based payment awards to all Inzpire employees on 30 November 2018 which is the grant date. The fair value of QinetiQ shares on grant date was £2.97 and the awards vested after two years on 30 November 2020 subject to continued employment at the date of vesting.
Other performance incentives During the year, as part of the Group’s COVID-19 response measures, the Group elected to settle the prior year outstanding bonuses via an award of shares rather than the previously anticipated cash settlement. The fair value of QinetiQ shares on grant date was £3.07 and the awards vested immediately on award.
Valuation of share-based awards Share-based awards that vest based on non-market performance conditions have been valued at the share price at grant date and are equity-settled.
2021 Number of
awards
2020 Number of
awards
Outstanding at start of the year – –
Granted during the year 335,848 –
Exercised during the year – –
Lapsed during the year – –
Outstanding at end of the year 335,848 ––
2021 Number of
awards
2020 Number of
awards
Outstanding at start of the year – –
Granted during the year 1,336,372 –
Exercised during the year – –
Lapsed during the year – –
Outstanding at end of the year 1,336,372 –
2021 Number of
awards
2020 Number of
awards
Outstanding at start of the year 343,265 399,708
Granted during the year – –
Lapsed during the year (25,701) (56,443)
Exercised during the year (317,564) –
Outstanding at end of the year – 343,265
2021 Number of
awards
2020 Number of
awards
Outstanding at start of the year – –
Granted during the year 4,796,981 –
Exercised during the year (4,796,981) –
Outstanding at end of the year – –
163Annual Report & Accounts 2021
Financial Statements
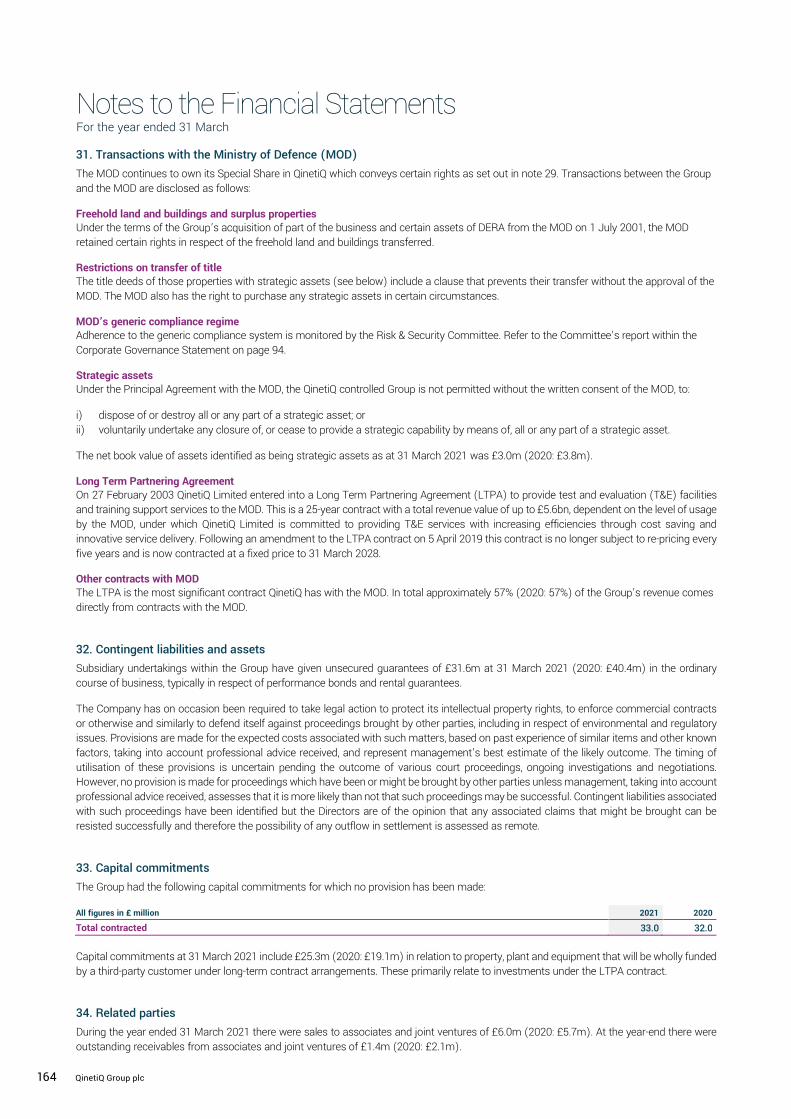
Notes to the Financial Statements For the year ended 31 March
QinetiQ Group plc Annual Report and Accounts 2021 132
1. Significant changes in the current reporting period
The financial position and performance of the Group was particularly affected by the following events and transactions during the reporting period:
1) The acquisition of Naimuri Limited (see note 12) which resulted in an increase in goodwill (note 14) and other intangible assets (note 15);
2) The divestment of the Boldon James, Commerce Decisions and OptaSense businesses (see note 13); 3) An impairment of goodwill in respect of the Germany business (see note 14).
For a detailed discussion of the Group’s performance and financial position refer to the Strategic Report on pages 2 to 51.
2. Revenue from contracts with customers and other income
Revenue and other income is analysed as follows:
Revenue by category and other income For the year ended 31 March
1 For the period of which there was no contribution in the equivalent period in the comparator year which was pre-ownership (for acquisitions) or post-ownership (for disposals) by the Group
2 Alternative performance measures are used to supplement the statutory figures. See page 183.
Other income
Revenue and profit after tax of associates and joint ventures was £12.6m and £1.1m respectively (2020: revenue of £18.1m and loss after tax of £1.5m). The figures in the table above represent the Group share of this profit after tax.
Other income is in respect of property rentals and the recovery of other related property costs.
Revenue by customer geographic location For the year ended 31 March
All figures in £ million 2021 2020
Services contracts with customers 1,189.4 945.6
Sale of goods contracts with customers 83.0 116.8
Royalties and licences 5.8 10.5
Total revenue 1,278.2 1,072.9
Less: adjust current year for acquired businesses1 (117.2) –
Less: adjust prior year for disposed businesses1 – (17.2)
Adjust to constant prior year exchange rates 2.2 –
Total revenue on an organic, constant currency basis2 1,163.2 1,055.7
Organic revenue growth at constant currency2 10% 10%
All figures in £ million 2021 2020
Share of associates’ and joint ventures’ profit/(loss) after tax 0.7 (0.7)
Other income 9.2 9.9
Other income – underlying 9.9 9.2
Specific adjusting item: gain on sale of property (note 4) 0.1 14.0
Total other income 10.0 23.2
All figures in £ million 2021 2020
US 215.6 136.0
Australia 77.9 60.7
Europe 88.2 75.9
Middle east 9.8 16.3
Rest of world 28.9 44.5
International 420.4 333.4
United Kingdom 857.8 739.5
Total revenue 1,278.2 1,072.9
International revenue % 33% 31%
Revenue from ‘home countries’ (UK, US and Australia) 1,151.3 936.2
Home countries revenue % 90% 87%
Notes to the Financial Statements For the year ended 31 March
QinetiQ Group plc Annual Report and Accounts 2021 164
31. Transactions with the Ministry of Defence (MOD)
The MOD continues to own its Special Share in QinetiQ which conveys certain rights as set out in note 29. Transactions between the Group and the MOD are disclosed as follows:
Freehold land and buildings and surplus properties Under the terms of the Group’s acquisition of part of the business and certain assets of DERA from the MOD on 1 July 2001, the MOD retained certain rights in respect of the freehold land and buildings transferred.
Restrictions on transfer of title The title deeds of those properties with strategic assets (see below) include a clause that prevents their transfer without the approval of the MOD. The MOD also has the right to purchase any strategic assets in certain circumstances.
MOD’s generic compliance regime Adherence to the generic compliance system is monitored by the Risk & Security Committee. Refer to the Committee’s report within the Corporate Governance Statement on page 94.
Strategic assets Under the Principal Agreement with the MOD, the QinetiQ controlled Group is not permitted without the written consent of the MOD, to:
i) dispose of or destroy all or any part of a strategic asset; or ii) voluntarily undertake any closure of, or cease to provide a strategic capability by means of, all or any part of a strategic asset.
The net book value of assets identified as being strategic assets as at 31 March 2021 was £3.0m (2020: £3.8m).
Long Term Partnering Agreement On 27 February 2003 QinetiQ Limited entered into a Long Term Partnering Agreement (LTPA) to provide test and evaluation (T&E) facilities and training support services to the MOD. This is a 25-year contract with a total revenue value of up to £5.6bn, dependent on the level of usage by the MOD, under which QinetiQ Limited is committed to providing T&E services with increasing efficiencies through cost saving and innovative service delivery. Following an amendment to the LTPA contract on 5 April 2019 this contract is no longer subject to re-pricing every five years and is now contracted at a fixed price to 31 March 2028.
Other contracts with MOD The LTPA is the most significant contract QinetiQ has with the MOD. In total approximately 57% (2020: 57%) of the Group’s revenue comes directly from contracts with the MOD.
32. Contingent liabilities and assets
Subsidiary undertakings within the Group have given unsecured guarantees of £31.6m at 31 March 2021 (2020: £40.4m) in the ordinary course of business, typically in respect of performance bonds and rental guarantees.
The Company has on occasion been required to take legal action to protect its intellectual property rights, to enforce commercial contracts or otherwise and similarly to defend itself against proceedings brought by other parties, including in respect of environmental and regulatory issues. Provisions are made for the expected costs associated with such matters, based on past experience of similar items and other known factors, taking into account professional advice received, and represent management’s best estimate of the likely outcome. The timing of utilisation of these provisions is uncertain pending the outcome of various court proceedings, ongoing investigations and negotiations. However, no provision is made for proceedings which have been or might be brought by other parties unless management, taking into account professional advice received, assesses that it is more likely than not that such proceedings may be successful. Contingent liabilities associated with such proceedings have been identified but the Directors are of the opinion that any associated claims that might be brought can be resisted successfully and therefore the possibility of any outflow in settlement is assessed as remote.
33. Capital commitments
The Group had the following capital commitments for which no provision has been made:
Capital commitments at 31 March 2021 include £25.3m (2020: £19.1m) in relation to property, plant and equipment that will be wholly funded by a third-party customer under long-term contract arrangements. These primarily relate to investments under the LTPA contract.
34. Related parties
During the year ended 31 March 2021 there were sales to associates and joint ventures of £6.0m (2020: £5.7m). At the year-end there were outstanding receivables from associates and joint ventures of £1.4m (2020: £2.1m).
All figures in £ million 2021 2020
Total contracted 33.0 32.0
164 QinetiQ Group plc

Notes to the Financial Statements continued
QinetiQ Group plc Annual Report and Accounts 2021 133
Financial Statements
Revenue by major customer type For the year ended 31 March
‘Other’ does not contain any customers with revenue in excess of 10% of total Group revenue.
The following table shows the aggregate amount of revenue allocated to performance obligations that are unsatisfied (or partially satisfied) as at the end of the reporting period:
Management expects that 27% (£800.5m) of revenue allocated to unsatisfied contracts as of 31 March 2021 will be recognised as revenue during the next reporting period.
The following table shows the aggregate amount of revenue allocated to performance obligations that were unsatisfied (or partially satisfied) as at the end of the prior reporting period:
Revenue of £144m was recognised during the year that was previously unrecognised as at the previous year end and reported as a contract liability.
3. Segmental analysis
The analysis by business segment is presented in accordance with IFRS 8 Operating Segments, on the basis of those reportable segments whose operating results are regularly reviewed by the Board (the Chief Operating Decision Maker as defined by IFRS 8) and are aligned with the Group’s strategic direction, determined with reference to the products and services they provide, as follows:
EMEA Services provides technical assurance, test and evaluation and training services, underpinned by long-term contracts. EMEA Services comprises the following business units which are not considered reportable segments as defined by IFRS 8: Maritime & Land; Air & Space, Cyber & Information and the International business.
Global Products combines all other business units not aggregated within EMEA Services, including the QinetiQ US business, Space Products and EMEA Products (which includes QinetiQ Target Systems). Generally these business units (which are not considered reportable segments as defined by IFRS 8) deliver innovative solutions and products which includes contract-funded research and development and developing intellectual property in partnership with key customers and through internal funding with potential for new revenue streams.
Operating segments
1 The measure of profit presented to the Chief Operating Decision Maker is operating profit stated before specific adjusting items (‘underlying operating profit’). The specific adjusting items are detailed in note 4.
2 Definitions of the Group’s ‘Alternative performance measures’ can be found in the glossary on page 183.
No measure of segmental assets and liabilities is reported as this information is not regularly provided to the Chief Operating Decision Maker.
All figures in £ million 2021 2020
UK government 794.6 667.2
US government 140.8 116.2
Other 342.8 289.5
Total revenue 1,278.2 1,072.9
All figures in £ million 2022 2023 2024 2025+ Total
Total forecast revenue allocated to unsatisfied performance obligations 800.5 523.9 395.9 1,223.8 2,944.1
All figures in £ million 2021 2022 2023 2024+ Total
Total forecast revenue allocated to unsatisfied performance obligations 849.3 484.9 375.5 1,395.2 3,104.9
2021 2020
All figures in £ million
Revenue from
external customers
Underlying operating
profit1
Revenue from
external customers
Underlying operating
profit1
EMEA Services 939.9 118.6 797.4 100.6
Global Products 338.3 33.2 275.5 32.6
Total operating segments 1,278.2 151.8 1,072.9 133.2
Underlying operating margin2 11.9% 12.4%
Notes to the Financial Statements continued
QinetiQ Group plc Annual Report and Accounts 2021 165
Financial Statements
35. Subsidiaries and other related undertakings
In accordance with section 409 of the Companies Act 2006, a full list of subsidiaries and other related undertakings as at 31 March 2021 is detailed below. Unless stated otherwise, the Group’s holding comprises ordinary shares which are held indirectly by QinetiQ Group plc, with the exception of QinetiQ Group Holdings Limited which is held directly by QinetiQ Group plc.
Name of company Country of incorporation Registered office
Subsidiaries1
BJ Trustee Limited England & Wales Farnborough4
cueSim Limited England & Wales Farnborough4
Foster-Miller Canada Limited Canada 318 Roxton Drive, Waterloo, Ontario, N2T 1R6, Canada
Foster-Miller Inc2 US 350 2nd Avenue, Waltham, Massachusetts, MA 02451, USA
Graphics Research Corporation Limited England & Wales Farnborough4
Gyldan 11 Limited England & Wales Farnborough4
Inzpire Group Limited1 England & Wales Farnborough4
Inzpire Holdings Limited1 England & Wales Landmark House West, Unit 1b, Alpha Court, Kingsley Road, Lincoln, Lincolnshire, LN6 3TA
Inzpire Limited1 England & Wales Landmark House West, Unit 1b, Alpha Court, Kingsley Road, Lincoln, Lincolnshire, LN6 3TA
Leading Technology Limited England & Wales Farnborough4
Metrix UK Limited England & Wales Farnborough4
Naimuri Limited England & Wales Farnborough4
Newman & Spurr Consultancy Ltd England & Wales 2 Meadows Business Park, Station Approach, Blackwater, Camberley, Surrey GU17 9AB
Precis (2187) Limited England & Wales Farnborough4
Precis (2188) Limited England & Wales Farnborough4
Qinetic Limited England & Wales Farnborough4
QinetiQ Aerostructures Pty Ltd Australia Level 3, 210 Kings Way, South Melbourne, VIC 3205, Australia
QinetiQ Australia Pty Ltd Australia Level 3, 210 Kings Way, South Melbourne, VIC 3205, Australia
QinetiQ Consulting Pty Ltd Australia Level 3, 12 Brindabella Court, Brindabella Business Park, Majura ACT 2609.
QinetiQ Estates Limited England & Wales Farnborough4
QinetiQ GmbH Germany Flughafenstraße 65, 41066, Mönchengladbach, Germany
QinetiQ GP Limited Scotland 50 Lothian Road, Festival Square, Edinburgh, EH3 9WJ, Scotland
QinetiQ Group Canada Inc.2 Canada 5300 Commerce Court West, 199 Bay Street, Toronto ON M5L 1A9, Canada
QinetiQ Group Holdings Limited England & Wales Farnborough4
QinetiQ Holdings Limited England & Wales Farnborough4
QinetiQ Inc2, US 10440 Furnace Road, Suite 204, Lorton, VA 22079,, USA
QinetiQ Insurance PCC Limited Guernsey Mill Court, La Charroterie, St Peter Port, GY1 4ET Guernsey
QinetiQ Limited England & Wales Farnborough4
QinetiQ Novare Pty Ltd Australia Petrie House, level 6, 80 Petrie Terrace, Brisbane QLD 400, Australia
QinetiQ Overseas Holdings Limited England & Wales Farnborough4
QinetiQ Overseas Trading Limited England & Wales Farnborough4
QinetiQ Pension Scheme Trustee Limited England & Wales Farnborough4
QinetiQ PFP Limited Partnership5 Scotland 50 Lothian Road, Festival Square, Edinburgh, EH3 9WJ, Scotland
QinetiQ Philippines Company, Inc Philippines 22nd Floor Corporate Centre, 139 Valero Street, Salcedo Village, Makati City, Philippines
QinetiQ Pty Ltd Australia Level 33, 101 Collins Street, Melbourne, VIC 3000, Australia
QinetiQ Services Holdings Pty Ltd Australia Level 33, 101 Collins Street, Melbourne, Victoria 3000, Australia
QinetiQ Solutions Sdn. Bhd. Malaysia Suite 6.01, 6th Floor, Plaza See Hoy Chan, Jalan Raja Chulan 50200, Kuala Lumpur, W.P. Kuala Lumpur, Malaysia
QinetiQ Space N.V. Belgium Hogenakkerhoekstraat, 9, 9150 Kruibeke, Belgium
QinetiQ Special Projects Inc US 5885 Trinity Parkway, Suite 130, Centreville, Virginia 20120-1969, USA
QinetiQ Sweden AB Sweden Advokatfirman Delphi, Box 1432, Stockholm, Sweden
QinetiQ Target Services Limited England & Wales Farnborough4
QinetiQ Target Systems Limited England & Wales Farnborough4
QinetiQ US Holdings, Inc. US 5885 Trinity Parkway, Suite 130, Centreville, Virginia 20120-1969, USA
Redu Operational Services S.A1 Belgium Rue Devant les Hetres, 2B, 6890 Transinne, Belgium
RubiKon Group Pty Limited Australia Level 33, 101 Collins Street, Melbourne, Victoria 3000, Australia
Sensoptics Limited England & Wales Farnborough4
TSG International LLC US 350 2nd Avenue, Waltham, Massachusetts 02451, USA
Associates3
Redu Space Services S.A Belgium Rue Devant les Hetres, 2B, 6890 Transinne, Belgium
165Annual Report & Accounts 2021
Financial Statements

Notes to the Financial Statements For the year ended 31 March
QinetiQ Group plc Annual Report and Accounts 2021 132
1. Significant changes in the current reporting period
The financial position and performance of the Group was particularly affected by the following events and transactions during the reporting period:
1) The acquisition of Naimuri Limited (see note 12) which resulted in an increase in goodwill (note 14) and other intangible assets (note 15);
2) The divestment of the Boldon James, Commerce Decisions and OptaSense businesses (see note 13); 3) An impairment of goodwill in respect of the Germany business (see note 14).
For a detailed discussion of the Group’s performance and financial position refer to the Strategic Report on pages 2 to 51.
2. Revenue from contracts with customers and other income
Revenue and other income is analysed as follows:
Revenue by category and other income For the year ended 31 March
1 For the period of which there was no contribution in the equivalent period in the comparator year which was pre-ownership (for acquisitions) or post-ownership (for disposals) by the Group
2 Alternative performance measures are used to supplement the statutory figures. See page 183.
Other income
Revenue and profit after tax of associates and joint ventures was £12.6m and £1.1m respectively (2020: revenue of £18.1m and loss after tax of £1.5m). The figures in the table above represent the Group share of this profit after tax.
Other income is in respect of property rentals and the recovery of other related property costs.
Revenue by customer geographic location For the year ended 31 March
All figures in £ million 2021 2020
Services contracts with customers 1,189.4 945.6
Sale of goods contracts with customers 83.0 116.8
Royalties and licences 5.8 10.5
Total revenue 1,278.2 1,072.9
Less: adjust current year for acquired businesses1 (117.2) –
Less: adjust prior year for disposed businesses1 – (17.2)
Adjust to constant prior year exchange rates 2.2 –
Total revenue on an organic, constant currency basis2 1,163.2 1,055.7
Organic revenue growth at constant currency2 10% 10%
All figures in £ million 2021 2020
Share of associates’ and joint ventures’ profit/(loss) after tax 0.7 (0.7)
Other income 9.2 9.9
Other income – underlying 9.9 9.2
Specific adjusting item: gain on sale of property (note 4) 0.1 14.0
Total other income 10.0 23.2
All figures in £ million 2021 2020
US 215.6 136.0
Australia 77.9 60.7
Europe 88.2 75.9
Middle east 9.8 16.3
Rest of world 28.9 44.5
International 420.4 333.4
United Kingdom 857.8 739.5
Total revenue 1,278.2 1,072.9
International revenue % 33% 31%
Revenue from ‘home countries’ (UK, US and Australia) 1,151.3 936.2
Home countries revenue % 90% 87%
Notes to the Financial Statements For the year ended 31 March
QinetiQ Group plc Annual Report and Accounts 2021 166
35. Subsidiaries and other related undertakings (continued)
1 As at 31 March 2021 the Group owned 100% of the ordinary shares of these subsidiary undertakings except for Redu Operational Services S.A. (52%) 2 The class of shares is ‘common share’ 3 As at 31 March 2021 the Group owned 48% of Redu Space Services S.A. 4 Cody Technology Park, Ively Road, Farnborough, Hampshire, GU14 OLX 5 Limited partnership. The partners are all wholly-owned Group companies 6 As at 31 March 2021 the Group owned 49% of Houbara Defence & Security LLC and 49% of QinetiQ Dar Massader QDM Limited. 7 The financial year end of each undertaking is 31 March other than Houbara Defence & Security LLC (31 December) and QinetiQ Dar Massader QDM Limited
(31 December)
36. Basis of preparation and significant accounting policies QinetiQ Group plc (‘the Company’) is a public limited company, which is listed on the London Stock Exchange and is incorporated and domiciled in United Kingdom. The consolidated financial statements of the Group comprise statements for the Company and its subsidiaries, together referred to as ‘the Group’.
Accounting policies The following accounting policies have been applied consistently to all periods presented in dealing with items that are considered material in relation to the Group’s financial statements. In the income statement, the Group presents ‘specific adjusting items’ separately. In the judgement of the Directors, for the reader to obtain a proper understanding of business performance, specific adjusting items need to be disclosed separately. Underlying measures of performance exclude specific adjusting items.
Specific adjusting items Specific adjusting items include the following:
The financial impact of each item is reported in note 4 to these financial statements.
These ‘specific adjusting items’ are of a ‘non-operational’ nature and do not include all significant, irregular items that are of an operational nature, for example contract risk provisions, cost of redundancy exercises and gains/losses on disposal of plant and equipment.
Basis of preparation The Group’s financial statements, approved by the Directors, have been prepared on a going concern basis as discussed in the Directors’ report on page 113. In accordance with the Companies Act 2006 and European Union (EU) regulations, the Consolidated Financial Statements have been prepared in accordance with International Accounting Standards in conformity with the requirements of the Companies Act 2006 and International Financial Reporting Standards adopted pursuant to Regulation (EC) No 1606/2002 as it applies in the EU. The Company has elected to prepare its parent company financial statements in accordance with UK GAAP (FRS 101); these are presented on page 176. The financial statements have been prepared under the historical cost convention, as modified by the revaluation of relevant financial assets and liabilities. The Group’s reporting currency is Sterling and unless otherwise stated the financial statements are rounded to the nearest £100,000.
Basis of consolidation The consolidated financial statements comprise the financial statements of the Company and its subsidiary undertakings to 31 March 2021. The purchase method of accounting has been adopted. Those subsidiary undertakings acquired or disposed of in the period are included in the consolidated income statement from the date control is obtained to the date that control is lost (usually on acquisition and disposal respectively). An investor controls an investee when it is exposed, or has rights, to variable returns from its involvement with the investee and has the ability to affect those returns through its power over the investee. This is the IFRS 10 definition of ‘control’.
Name of company Country of incorporation Registered office
Joint ventures6 Houbara Defence & Security LLC6 United Arab Emirates Unit 3, Zone 4, Tawazun Industrial Park, Abu Dhabi, United Arab
Emirates, PO Box 128220 QinetiQ Dar Massader QDM Limited6 Saudi Arabia Al Nakhla Tower, 3026-Prince Saud Bin Mohamed Bin Muqin Road, PO
Box 2985, Riyadh 13321, Kingdom of Saudi Arabia
Item
Distorting due to irregular nature
year on year
Distorting due to fluctuating nature
(size and sign)
Does not reflect in-year operational performance
of continuing business
Amortisation of intangible assets arising from acquisitions P
Pension net finance income P P
Gains/losses on disposal of property and investments P P P
Transaction & integration costs in respect of business acquisitions P P
Impairment of property and goodwill P The tax impact of the above P P P
Other significant non-recurring deferred tax movements P P P
166 QinetiQ Group plc

Notes to the Financial Statements continued
QinetiQ Group plc Annual Report and Accounts 2021 133
Financial Statements
Revenue by major customer type For the year ended 31 March
‘Other’ does not contain any customers with revenue in excess of 10% of total Group revenue.
The following table shows the aggregate amount of revenue allocated to performance obligations that are unsatisfied (or partially satisfied) as at the end of the reporting period:
Management expects that 27% (£800.5m) of revenue allocated to unsatisfied contracts as of 31 March 2021 will be recognised as revenue during the next reporting period.
The following table shows the aggregate amount of revenue allocated to performance obligations that were unsatisfied (or partially satisfied) as at the end of the prior reporting period:
Revenue of £144m was recognised during the year that was previously unrecognised as at the previous year end and reported as a contract liability.
3. Segmental analysis
The analysis by business segment is presented in accordance with IFRS 8 Operating Segments, on the basis of those reportable segments whose operating results are regularly reviewed by the Board (the Chief Operating Decision Maker as defined by IFRS 8) and are aligned with the Group’s strategic direction, determined with reference to the products and services they provide, as follows:
EMEA Services provides technical assurance, test and evaluation and training services, underpinned by long-term contracts. EMEA Services comprises the following business units which are not considered reportable segments as defined by IFRS 8: Maritime & Land; Air & Space, Cyber & Information and the International business.
Global Products combines all other business units not aggregated within EMEA Services, including the QinetiQ US business, Space Products and EMEA Products (which includes QinetiQ Target Systems). Generally these business units (which are not considered reportable segments as defined by IFRS 8) deliver innovative solutions and products which includes contract-funded research and development and developing intellectual property in partnership with key customers and through internal funding with potential for new revenue streams.
Operating segments
1 The measure of profit presented to the Chief Operating Decision Maker is operating profit stated before specific adjusting items (‘underlying operating profit’). The specific adjusting items are detailed in note 4.
2 Definitions of the Group’s ‘Alternative performance measures’ can be found in the glossary on page 183.
No measure of segmental assets and liabilities is reported as this information is not regularly provided to the Chief Operating Decision Maker.
All figures in £ million 2021 2020
UK government 794.6 667.2
US government 140.8 116.2
Other 342.8 289.5
Total revenue 1,278.2 1,072.9
All figures in £ million 2022 2023 2024 2025+ Total
Total forecast revenue allocated to unsatisfied performance obligations 800.5 523.9 395.9 1,223.8 2,944.1
All figures in £ million 2021 2022 2023 2024+ Total
Total forecast revenue allocated to unsatisfied performance obligations 849.3 484.9 375.5 1,395.2 3,104.9
2021 2020
All figures in £ million
Revenue from
external customers
Underlying operating
profit1
Revenue from
external customers
Underlying operating
profit1
EMEA Services 939.9 118.6 797.4 100.6
Global Products 338.3 33.2 275.5 32.6
Total operating segments 1,278.2 151.8 1,072.9 133.2
Underlying operating margin2 11.9% 12.4%
Notes to the Financial Statements continued
QinetiQ Group plc Annual Report and Accounts 2021 167
Financial Statements
The Group comprises certain entities that are operated within the terms of a Special Security Arrangement (‘SSA’). Details of the SSA and QinetiQ’s management of US subsidiaries are set out in the Corporate Governance section of this Annual Report. IFRS 10 is the accounting standard applicable in respect of consolidation of entities. This does not specifically deal with SSA’s. However, having considered the terms of the SSA, the Directors consider that the Group meets the requirements of IFRS 10 in respect of control over such affected entities and, therefore, consolidates these entities in the consolidated accounts. The impact of this specific judgement is full consolidation as opposed to treatment as a 100% associated undertaking.
An associate is an undertaking over which the Group exercises significant influence, usually from 20%–50% of the equity voting rights, in respect of financial and operating policy. A joint venture is an undertaking over which the Group exercises joint control. Associates and joint ventures are accounted for using the equity method from the date of acquisition to the date of disposal. The Group’s investments in associates and joint ventures are held at cost including goodwill on acquisition and any post-acquisition changes in the Group’s share of the net assets of the associate less any impairment to the recoverable amount. Where an associate or joint venture has net liabilities, full provision is made for the Group’s share of liabilities where there is a constructive or legal obligation to provide additional funding to the associate or joint venture.
The financial statements of subsidiaries, joint ventures and associates are adjusted where necessary to ensure compliance with Group accounting policies.
Recent accounting developments Developments adopted by the Group in 2021 with no material impact on the Group’s financial statements The following IFRS and endorsed standards and amendments, improvements and interpretations of published standards are effective for accounting periods beginning on or after 1 January 2020 and have been adopted with no material impact on the Group’s financial statements:
– Amendment to IFRS 3 ‘Business combinations’ (definition of a business): The amendment will help improve the definition of a business and help companies determine whether an acquisition made is of a business or a group of assets. The amended definition emphasises that the output of a business is to provide goods and services to customers, whereas the previous definition focused on returns in form of dividends, lower costs or other economic benefits to investors and others.
– Amendments to IFRS 9, IAS 39 and IFRS 7 ‘Interest rate benchmark reform phase 1’: These amendments considers reliefs to hedge accounting in the period before the reform. The reliefs have the effect that IBOR reform should not generally cause hedge accounting to terminate. The relief provided by the amendments requires an entity to assume that the interest rate on which the hedge cash flows are based does not change as a result of the reform.
– Amendments to IFRS 16 ‘Leases’ COVID-19 related rent concessions: The amendment will make it easier for lessees to account for COVID-19 related rent concessions such as rent holidays and temporary rent reductions. The amendment exempts lessees from having to consider individual lease contracts to determine whether rent concessions occurring as a direct consequence of the COVID-19 related rent concessions that reduce lease payments due on or before 30 June 2021.
Developments expected in future periods of which the impact on the Group’s financial statements is still being assessed The Directors anticipate that the adoption of the following new, revised, amended and improved published standards and interpretations, which were in issue at the date of authorisation of these financial statements, will have no material impact on the financial statements of the Group when they become applicable in future periods:
– Amendments to IFRS 3 ‘Business combinations’, on clarifying whether an acquisition is that of a business or a group of assets; – Amendments to IFRS 9, IAS 39 and IFRS 7, all in respect of interest rate benchmark reform.
Significant accounting policies Revenue from contracts with customers The Group recognises revenue primarily from the following major sources:
– Through combining world-leading expertise with unique facilities to provide technical assurance, test and evaluation and training services underpinned by long-term contracts;
– Through delivering innovative solutions and products to meet customer requirements by undertaking contract-funded research and development, developing intellectual property and by internal funding with potential for new revenue streams.
Revenue is measured based on the consideration specified in a contract with a customer and excludes amounts collected on behalf of third parties. The Group recognises revenue when it transfers control of a product or service to a customer. The Group’s revenue contracts are accounted for under IFRS 15 ‘Revenue from Contracts with Customers’ taking into account the requirement to distinguish between the various performance obligations within a contract and treating these separately. The Group’s methodology applies IFRS 15 on a contract-by-contract basis which includes considerations for contract modifications, variable consideration, the determination of distinct performance obligations, determination of agency and principal relationships and licences.
167Annual Report & Accounts 2021
Financial Statements

Notes to the Financial Statements For the year ended 31 March
QinetiQ Group plc Annual Report and Accounts 2021 132
1. Significant changes in the current reporting period
The financial position and performance of the Group was particularly affected by the following events and transactions during the reporting period:
1) The acquisition of Naimuri Limited (see note 12) which resulted in an increase in goodwill (note 14) and other intangible assets (note 15);
2) The divestment of the Boldon James, Commerce Decisions and OptaSense businesses (see note 13); 3) An impairment of goodwill in respect of the Germany business (see note 14).
For a detailed discussion of the Group’s performance and financial position refer to the Strategic Report on pages 2 to 51.
2. Revenue from contracts with customers and other income
Revenue and other income is analysed as follows:
Revenue by category and other income For the year ended 31 March
1 For the period of which there was no contribution in the equivalent period in the comparator year which was pre-ownership (for acquisitions) or post-ownership (for disposals) by the Group
2 Alternative performance measures are used to supplement the statutory figures. See page 183.
Other income
Revenue and profit after tax of associates and joint ventures was £12.6m and £1.1m respectively (2020: revenue of £18.1m and loss after tax of £1.5m). The figures in the table above represent the Group share of this profit after tax.
Other income is in respect of property rentals and the recovery of other related property costs.
Revenue by customer geographic location For the year ended 31 March
All figures in £ million 2021 2020
Services contracts with customers 1,189.4 945.6
Sale of goods contracts with customers 83.0 116.8
Royalties and licences 5.8 10.5
Total revenue 1,278.2 1,072.9
Less: adjust current year for acquired businesses1 (117.2) –
Less: adjust prior year for disposed businesses1 – (17.2)
Adjust to constant prior year exchange rates 2.2 –
Total revenue on an organic, constant currency basis2 1,163.2 1,055.7
Organic revenue growth at constant currency2 10% 10%
All figures in £ million 2021 2020
Share of associates’ and joint ventures’ profit/(loss) after tax 0.7 (0.7)
Other income 9.2 9.9
Other income – underlying 9.9 9.2
Specific adjusting item: gain on sale of property (note 4) 0.1 14.0
Total other income 10.0 23.2
All figures in £ million 2021 2020
US 215.6 136.0
Australia 77.9 60.7
Europe 88.2 75.9
Middle east 9.8 16.3
Rest of world 28.9 44.5
International 420.4 333.4
United Kingdom 857.8 739.5
Total revenue 1,278.2 1,072.9
International revenue % 33% 31%
Revenue from ‘home countries’ (UK, US and Australia) 1,151.3 936.2
Home countries revenue % 90% 87%
Notes to the Financial Statements For the year ended 31 March
QinetiQ Group plc Annual Report and Accounts 2021 168
36. Basis of preparation and significant accounting policies (continued)
Service contracts The Group’s long-term service contracts are generally ‘test and evaluation’ or advice-based contracts where control of the service is transferred over a period of time as the Group performs. At contract inception the Group undertakes an assessment to determine how many distinct performance obligations exists within a contract. As part of the assessment the Group obtains an understanding of the overall deliverable to the customer through discussions with business units and project leads. Each individual deliverable in the contract is then assessed to determine if it is an input into the overall deliverable, and therefore part of a single performance obligation, or if it is a stand-alone separable deliverable with its own transaction price and therefore a distinct performance obligation in its own right. Each distinct performance obligation identified within a contract is accounted for separately.
Certain service contracts have a similar pattern of transfer of control to the customer where each year is effectively the same from a performance obligation perspective. The Group has applied the series guidance as permitted within the Standard to these contracts and accounts for these as a series of distinct service performance obligations satisfied annually over the contract term. The transaction price for a contract is determined at contract inception based on a fixed-margin applied to the total forecast costs to complete the deliverable. Some long-term contracts include an excess profit clause which is a variable consideration factor that could impact the transaction price. Excess profits are estimated at contract inception and at the end of each reporting period to ensure that the transaction price is not under or over stated. Any required adjustment will be made against the transaction price in the period in which it occurred. The Group does not offer any right of return or refunds which could impact transaction price at inception. Certain contracts attract bonuses and/or penalties which are variable and will have an impact on transaction price at contract inception. The Group assesses variable consideration in relation to bonuses and penalties at contract inception using the most-likely method and this forms part of the transaction price and recognised over time as costs are incurred. The Group only includes bonuses and penalties into the transaction price to the extent that it is highly probable that a significant reversal of revenue will not occur in future periods. Historical evidence and experience shows that even where a reduction has been required, that reduction has been immaterial to the Group.
The transaction price is allocated between each distinct performance obligation identified in a contract based on the stand-alone selling price of each performance obligation. Each performance obligation will be costed and the transaction price will be cost plus margin. This amount would be the stand-alone selling price of each performance obligation if contracted with a customer separately.
Long-term service contracts allow for modifications to the original order. If a contract modification is determined to be distinct and the price of the contract increases by an amount of consideration that reflects the entity's stand-alone selling prices for the additional promised goods or services, the Group accounts for this as a separate contract. If a contract modification is not distinct, the Group accounts for this as if it were part of the existing contract. A cumulative catch-up adjustment to revenue is then recognised to disclose the effect that the contract modification has on the transaction price and the Group’s measure of progress towards complete satisfaction of the performance obligation.
Long-term service contracts also sometimes allow for extensions to the original order. A contract extension is determined to include either additional goods or services or no additional goods or service. If a contract extension with additional goods or services is determined to be distinct and the price of the contract increases by an amount of consideration that reflects the entity’s stand-alone selling prices for the additional promised goods or services, the Group accounts for this as a separate performance obligation.
If a contract extension with additional goods or services is not distinct, the Group accounts for this as if it were part of the existing contract. A cumulative catch-up adjustment to revenue is then recognised to disclose the effect that the contract extension has on the transaction price and the Group’s measure of progress towards complete satisfaction of the performance obligation.
When the outcome of a distinct performance obligation in delivering services can be reliably estimated, revenue associated with the performance obligation is recognised over time using the input method. The input method recognises revenue over time on the basis of costs incurred to date to the satisfaction of a performance obligation relative to the total forecast costs to complete the performance obligation. The Group has determined the input method to be appropriate as it best depicts the Group’s performance in transferring control of the service to the customer as it incurs costs on a particular contract.
No profit is recognised on contracts until the outcome of the contract can be reliably estimated. When it is probable that total contract costs will exceed total contract revenue, the expected loss is recognised immediately as an expense.
Goods sold The Group recognises revenue on the sale of products at a point in time once control has been transferred to the customer. Control is generally transferred to customers on delivery of products or when the customer has the significant risks and rewards of ownership of the product. Payment is typically due within 30 days of invoice (within the UK) and customers typically do not have a right of return or refund. The transaction price for sale of products is agreed at contract inception. When the Group develops a bespoke product for a customer with no alternative use to the Group, revenue is recognised over time using the input method.
Licence revenue Licence revenue is attributed to either ‘right to use’ or ‘right to access’ licences. ‘Right to use’ licence revenue is recognised at a point in time when the Group sells a licence to a customer and does not undertake significant further activities or involvement in developing the licence after the sale. ‘Right to access’ licence revenue is recognised over time when the Group maintains a significant level of involvement in
168 QinetiQ Group plc

Notes to the Financial Statements continued
QinetiQ Group plc Annual Report and Accounts 2021 133
Financial Statements
Revenue by major customer type For the year ended 31 March
‘Other’ does not contain any customers with revenue in excess of 10% of total Group revenue.
The following table shows the aggregate amount of revenue allocated to performance obligations that are unsatisfied (or partially satisfied) as at the end of the reporting period:
Management expects that 27% (£800.5m) of revenue allocated to unsatisfied contracts as of 31 March 2021 will be recognised as revenue during the next reporting period.
The following table shows the aggregate amount of revenue allocated to performance obligations that were unsatisfied (or partially satisfied) as at the end of the prior reporting period:
Revenue of £144m was recognised during the year that was previously unrecognised as at the previous year end and reported as a contract liability.
3. Segmental analysis
The analysis by business segment is presented in accordance with IFRS 8 Operating Segments, on the basis of those reportable segments whose operating results are regularly reviewed by the Board (the Chief Operating Decision Maker as defined by IFRS 8) and are aligned with the Group’s strategic direction, determined with reference to the products and services they provide, as follows:
EMEA Services provides technical assurance, test and evaluation and training services, underpinned by long-term contracts. EMEA Services comprises the following business units which are not considered reportable segments as defined by IFRS 8: Maritime & Land; Air & Space, Cyber & Information and the International business.
Global Products combines all other business units not aggregated within EMEA Services, including the QinetiQ US business, Space Products and EMEA Products (which includes QinetiQ Target Systems). Generally these business units (which are not considered reportable segments as defined by IFRS 8) deliver innovative solutions and products which includes contract-funded research and development and developing intellectual property in partnership with key customers and through internal funding with potential for new revenue streams.
Operating segments
1 The measure of profit presented to the Chief Operating Decision Maker is operating profit stated before specific adjusting items (‘underlying operating profit’). The specific adjusting items are detailed in note 4.
2 Definitions of the Group’s ‘Alternative performance measures’ can be found in the glossary on page 183.
No measure of segmental assets and liabilities is reported as this information is not regularly provided to the Chief Operating Decision Maker.
All figures in £ million 2021 2020
UK government 794.6 667.2
US government 140.8 116.2
Other 342.8 289.5
Total revenue 1,278.2 1,072.9
All figures in £ million 2022 2023 2024 2025+ Total
Total forecast revenue allocated to unsatisfied performance obligations 800.5 523.9 395.9 1,223.8 2,944.1
All figures in £ million 2021 2022 2023 2024+ Total
Total forecast revenue allocated to unsatisfied performance obligations 849.3 484.9 375.5 1,395.2 3,104.9
2021 2020
All figures in £ million
Revenue from
external customers
Underlying operating
profit1
Revenue from
external customers
Underlying operating
profit1
EMEA Services 939.9 118.6 797.4 100.6
Global Products 338.3 33.2 275.5 32.6
Total operating segments 1,278.2 151.8 1,072.9 133.2
Underlying operating margin2 11.9% 12.4%
Notes to the Financial Statements continued
QinetiQ Group plc Annual Report and Accounts 2021 169
Financial Statements
developing and enhancing the licence after the sale. The level of involvement goes beyond general support, bug-fixing and upgrades which generally only maintain the current operating level. The transaction price for intellectual property is agreed at contract inception. The Group does not offer any right of return or refunds which could impact transaction price at inception.
The Group recognises licence revenue through the supply of a range of security, messaging and connectivity software products. A licence fee is paid for each computer that uses the software and the customer can also purchase a support service contract for a fixed period. The sale of these types of licences is recognised at a point in time as a distinct performance obligation because the Group does not undertake any further activities in developing the licence after the sale. The support service contract is recognised over time as a separate performance obligation as this is an optional extra and is not integral into the functionality of the licence. The support service contract offers general support and maintenance of the licence to the customer over a fixed period.
Contract assets Contract assets is a term used in adopting IFRS 15 and effectively represents amounts recoverable under contracts as previously reported. Contract assets represent revenue recognised in excess of amounts invoiced. Revenue is recognised on service contracts by using a ‘percentage complete’ method, applying the proportion of contract costs incurred for work performed to date relative to the estimated total contract cost, after making suitable allowances for technical and other risks related to performance milestones yet to be achieved, and applying that proportion to total contract price. Payment for service contracts are not always due from the customer until certain milestones have been reached and, therefore, a contract asset is recognised over the period in which the services are performed representing the Group’s right to consideration for services performed to date, to the extent that the customer has not yet been invoiced for those services.
Contract liabilities Contract liabilities is a term used in adopting IFRS 15 and effectively represents deferred income as previously reported. The Group, on occasion, bills customers in advance of performing certain types of work which results in the Group recognising contract liabilities. Once the work has been performed these amounts will be reduced and recognised as revenue. For sale of goods, revenue is recognised in the income statement when control of the goods has been transferred to the customer; being at the point when the goods are delivered. Any transaction price received by the Group prior to that point is recognised as a contract liability.
Principal-agent arrangements The Group enters into certain arrangements which involve a consortium of service providers. The Group acts as a ‘Prime’ contractor in certain contracts with customers and utilises sub-contractors to undertake the work. Under these contracts the Group is considered to be primarily responsible for fulfilling the service to the customer. The Group performs a technical assessment of the work before it is delivered to the customer and is responsible for quality and performance of the sub-contractor. As such the Group is considered to be the principal to the arrangement with the customer and includes sub-contractor costs within revenue. However, where the Group is merely acting as an agent of a sub-contractor then no revenue is recognised in respect of sub-contractor costs.
All consortium arrangements are assessed by the Group to determine if it is the principal or agent.
Contract bidding costs The Group recognises the ‘incremental costs of obtaining a contract’ with a customer as an asset if the Group expects to recover those costs. The ‘incremental costs of obtaining a contract’ are those costs that the Group incurs to obtain a contract with a customer that it would not have incurred if the contract had not been won. Costs to obtain a contract that would have been incurred regardless of whether the contract was won or lost shall be recognised as an expense when incurred, unless those costs are explicitly chargeable to the customer.
Segmental information Segmental information is presented according to the Group’s internal management reporting structure and the markets in which it operates. Segmental results represent the contribution of the different segments to the profit of the Group. Corporate expenses are allocated to the corresponding segments. Unallocated items mainly comprise specific adjusting items. Specific adjusting items are referred to in note 4. Segmental assets and liabilities information is not regularly provided to the Chief Operating Decision Maker.
Research and development expenditure R&D costs incurred in respect of specific contracts placed by customers are recognised within operating costs and revenue is recognised in respect of the R&D services performed. Internally funded development expenditure is capitalised in the balance sheet where there is a clearly defined project, the expenditures are separately identifiable, the project is technically and commercially feasible, all costs are recoverable by future revenue and the resources are committed to complete the project. Such capitalised costs are amortised over the forecast period of sales resulting from the development. All other R&D costs are expensed to the income statement in the period in which they are incurred. If the research phase cannot be clearly distinguished from the development phase, the respective project-related costs are treated as if they were incurred in the research phase only and expensed.
169Annual Report & Accounts 2021
Financial Statements

Notes to the Financial Statements For the year ended 31 March
QinetiQ Group plc Annual Report and Accounts 2021 132
1. Significant changes in the current reporting period
The financial position and performance of the Group was particularly affected by the following events and transactions during the reporting period:
1) The acquisition of Naimuri Limited (see note 12) which resulted in an increase in goodwill (note 14) and other intangible assets (note 15);
2) The divestment of the Boldon James, Commerce Decisions and OptaSense businesses (see note 13); 3) An impairment of goodwill in respect of the Germany business (see note 14).
For a detailed discussion of the Group’s performance and financial position refer to the Strategic Report on pages 2 to 51.
2. Revenue from contracts with customers and other income
Revenue and other income is analysed as follows:
Revenue by category and other income For the year ended 31 March
1 For the period of which there was no contribution in the equivalent period in the comparator year which was pre-ownership (for acquisitions) or post-ownership (for disposals) by the Group
2 Alternative performance measures are used to supplement the statutory figures. See page 183.
Other income
Revenue and profit after tax of associates and joint ventures was £12.6m and £1.1m respectively (2020: revenue of £18.1m and loss after tax of £1.5m). The figures in the table above represent the Group share of this profit after tax.
Other income is in respect of property rentals and the recovery of other related property costs.
Revenue by customer geographic location For the year ended 31 March
All figures in £ million 2021 2020
Services contracts with customers 1,189.4 945.6
Sale of goods contracts with customers 83.0 116.8
Royalties and licences 5.8 10.5
Total revenue 1,278.2 1,072.9
Less: adjust current year for acquired businesses1 (117.2) –
Less: adjust prior year for disposed businesses1 – (17.2)
Adjust to constant prior year exchange rates 2.2 –
Total revenue on an organic, constant currency basis2 1,163.2 1,055.7
Organic revenue growth at constant currency2 10% 10%
All figures in £ million 2021 2020
Share of associates’ and joint ventures’ profit/(loss) after tax 0.7 (0.7)
Other income 9.2 9.9
Other income – underlying 9.9 9.2
Specific adjusting item: gain on sale of property (note 4) 0.1 14.0
Total other income 10.0 23.2
All figures in £ million 2021 2020
US 215.6 136.0
Australia 77.9 60.7
Europe 88.2 75.9
Middle east 9.8 16.3
Rest of world 28.9 44.5
International 420.4 333.4
United Kingdom 857.8 739.5
Total revenue 1,278.2 1,072.9
International revenue % 33% 31%
Revenue from ‘home countries’ (UK, US and Australia) 1,151.3 936.2
Home countries revenue % 90% 87%
Notes to the Financial Statements For the year ended 31 March
QinetiQ Group plc Annual Report and Accounts 2021 170
36. Basis of preparation and significant accounting policies (continued)
Financing The Group holds no external borrowings but does have access to a revolving credit facility, fees for which are reported within finance costs. Costs of letters of credit are also charged to finance expense. Income earned on funds invested is reported within finance income. Exchange differences on financial assets and liabilities and the income or expense from interest hedging instruments that are recognised in the income statement are included within finance income and finance expense. Financing also includes the net finance income or expense in respect of defined benefit pension schemes. The Group pays in advance finance costs in relation to the multi-currency facility which are recognised as a deferred finance cost asset.
Taxation The income tax expense or credit for the period is the tax payable on the current period’s taxable income, based on the applicable income tax rate for each jurisdiction, adjusted by changes in deferred tax assets and liabilities attributable to temporary differences and to unused tax losses. The current income tax charge is calculated on the basis of the tax laws enacted or substantively enacted at the end of the reporting period in the countries where the company and its subsidiaries and associates operate and generate taxable income.
Management periodically evaluates positions taken in tax returns with respect to situations in which applicable tax regulation is subject to interpretation and considers whether it is probable that a taxation authority will accept an uncertain tax treatment. The Group measures its tax balances either based on the most likely amount or the expected value, depending on which method provides a better prediction of the resolution of the uncertainty.
The Group’s accounting policy is to include the impact of research and development expenditure credits (‘RDEC’) within the tax charge. An element of the Group’s RDEC claim relates to activities on MOD contracts. Commercial negotiations with the MOD do not take RDEC into consideration; instead both parties have agreed that the amount collected by QinetiQ on certain contracts will be passed through as a lump sum to the MOD, akin to QinetiQ collecting the RDEC on behalf of the MOD. As such, the MOD-appropriated element of the RDEC receivable from HMRC is netted off against the gross receivable within the tax line, as opposed to being recognised as a reduction to revenue or as an expense above the tax line.
Deferred income tax is provided in full, using the liability method, on temporary differences arising between the tax bases of assets and liabilities and their carrying amounts in the consolidated financial statements. However, deferred tax liabilities are not recognised if they arise from the initial recognition of goodwill. Deferred income tax is also not accounted for if it arises from initial recognition of an asset or liability in a transaction other than a business combination that, at the time of the transaction, affects neither accounting nor taxable profit or loss. Deferred income tax is determined using tax rates (and laws) that have been enacted or substantively enacted by the end of the reporting period and are expected to apply when the related deferred income tax asset is realised or the deferred income tax liability is settled.
Deferred tax assets are recognised only if it is probable that future taxable amounts will be available to utilise those temporary differences and losses. Deferred tax liabilities and assets are not recognised for temporary differences between the carrying amount and tax bases of investments in foreign operations where the company is able to control the timing of the reversal of the temporary differences and it is probable that the differences will not reverse in the foreseeable future. Deferred tax assets and liabilities are offset where there is a legally enforceable right to offset current tax assets and liabilities and where the deferred tax balances relate to the same taxation authority. Current tax assets and tax liabilities are offset where the entity has a legally enforceable right to offset and intends either to settle on a net basis, or to realise the asset and settle the liability simultaneously.
Current and deferred tax is recognised in profit or loss, except to the extent that it relates to items recognised in other comprehensive income or directly in equity. In this case, the tax is also recognised in other comprehensive income or directly in equity, respectively.
Non-current assets held for sale Non-current assets are classified as held for sale if their carrying amount will be recovered primarily through a sales transaction rather than through continuing use. This condition is regarded as met only when the sale is highly probable and expected to be completed within a year of the balance sheet date. The assets should be available for immediate sale in their present condition and actively marketed at a price that is reasonable in relation to their current fair value.
Non-current assets classified as held for sale are measured at the lower of carrying amount and fair value less costs to sell. Any write-down to fair value less costs to sell shall be recognised directly through profit and loss as an impairment loss. No further depreciation is charged in respect of assets classified as held for sale.
Goodwill Goodwill on acquisitions of subsidiaries is included in non-current assets. Goodwill on acquisitions of joint ventures and associates is included in the carrying value of equity accounted investments. Goodwill is tested annually for impairment and carried at cost less accumulated impairment losses. Gains and losses on the disposal of an entity include the carrying amount of goodwill related to the entity sold.
Intangible assets Intangible assets arising from business combinations are recognised at fair value and are amortised over their expected useful lives, typically between 1 and 16 years. Internally generated intangible assets are recorded at cost, including labour, directly attributable costs and any third-party expenses.
170 QinetiQ Group plc

Notes to the Financial Statements continued
QinetiQ Group plc Annual Report and Accounts 2021 133
Financial Statements
Revenue by major customer type For the year ended 31 March
‘Other’ does not contain any customers with revenue in excess of 10% of total Group revenue.
The following table shows the aggregate amount of revenue allocated to performance obligations that are unsatisfied (or partially satisfied) as at the end of the reporting period:
Management expects that 27% (£800.5m) of revenue allocated to unsatisfied contracts as of 31 March 2021 will be recognised as revenue during the next reporting period.
The following table shows the aggregate amount of revenue allocated to performance obligations that were unsatisfied (or partially satisfied) as at the end of the prior reporting period:
Revenue of £144m was recognised during the year that was previously unrecognised as at the previous year end and reported as a contract liability.
3. Segmental analysis
The analysis by business segment is presented in accordance with IFRS 8 Operating Segments, on the basis of those reportable segments whose operating results are regularly reviewed by the Board (the Chief Operating Decision Maker as defined by IFRS 8) and are aligned with the Group’s strategic direction, determined with reference to the products and services they provide, as follows:
EMEA Services provides technical assurance, test and evaluation and training services, underpinned by long-term contracts. EMEA Services comprises the following business units which are not considered reportable segments as defined by IFRS 8: Maritime & Land; Air & Space, Cyber & Information and the International business.
Global Products combines all other business units not aggregated within EMEA Services, including the QinetiQ US business, Space Products and EMEA Products (which includes QinetiQ Target Systems). Generally these business units (which are not considered reportable segments as defined by IFRS 8) deliver innovative solutions and products which includes contract-funded research and development and developing intellectual property in partnership with key customers and through internal funding with potential for new revenue streams.
Operating segments
1 The measure of profit presented to the Chief Operating Decision Maker is operating profit stated before specific adjusting items (‘underlying operating profit’). The specific adjusting items are detailed in note 4.
2 Definitions of the Group’s ‘Alternative performance measures’ can be found in the glossary on page 183.
No measure of segmental assets and liabilities is reported as this information is not regularly provided to the Chief Operating Decision Maker.
All figures in £ million 2021 2020
UK government 794.6 667.2
US government 140.8 116.2
Other 342.8 289.5
Total revenue 1,278.2 1,072.9
All figures in £ million 2022 2023 2024 2025+ Total
Total forecast revenue allocated to unsatisfied performance obligations 800.5 523.9 395.9 1,223.8 2,944.1
All figures in £ million 2021 2022 2023 2024+ Total
Total forecast revenue allocated to unsatisfied performance obligations 849.3 484.9 375.5 1,395.2 3,104.9
2021 2020
All figures in £ million
Revenue from
external customers
Underlying operating
profit1
Revenue from
external customers
Underlying operating
profit1
EMEA Services 939.9 118.6 797.4 100.6
Global Products 338.3 33.2 275.5 32.6
Total operating segments 1,278.2 151.8 1,072.9 133.2
Underlying operating margin2 11.9% 12.4%
Notes to the Financial Statements continued
QinetiQ Group plc Annual Report and Accounts 2021 171
Financial Statements
The ‘multi-period excess earnings’ method and the ‘relief-from-royalty’ method are both used for fair valuing intangible assets arising from acquisitions. The multi-period excess earnings method considers the present value of net cash flows expected to be generated by customer relationships, by excluding any cash flows related to contributory assets. The relief-from-royalty method considers the discounted estimated royalty payments that are expected to be avoided as a result of the patents or trademarks being owned.
Purchased intangible assets are recognised at cost less amortisation. Intangible assets are amortised over their respective useful lives on a straight-line basis as follows:
Intellectual property rights 2–10 years Customer relationships 1–16 years Development costs 1–4 years Other 1–14 years
Property, plant and equipment Property, plant and equipment are stated at cost less depreciation. Freehold land is not depreciated. Other tangible non-current assets are depreciated on a straight-line basis over their useful economic lives to their estimated residual value as follows:
Freehold buildings 20–25 years Leasehold land and buildings Shorter of useful economic life and the period of the lease Plant and machinery 3–15 years Fixtures and fittings / office equipment 5–10 years Computers 3–5 years Motor vehicles 3–5 years
Assets under construction are included in property, plant and equipment on the basis of expenditure incurred at the balance sheet date. In the case of assets constructed by the Group, the value includes the cost of own work completed, including directly attributable costs and interest.
The useful lives, depreciation methods and residual values applied to property, plant and equipment are reviewed annually and, if appropriate, adjusted accordingly.
Impairment of goodwill and tangible, intangible and held for sale assets At each reporting date the Group assesses whether there is an indication that an asset may be impaired. If the carrying amount of any asset exceeds its recoverable amount an impairment loss is recognised immediately in the income statement. In addition, goodwill is tested for impairment annually irrespective of any indication of impairment. If the carrying amount exceeds the recoverable amount, the respective asset or the assets in the cash-generating unit (CGU) are written down to their recoverable amounts. The recoverable amount of an asset or CGU is the higher of its fair value less costs to sell and its value in use. The value in use is the present value of the future cash flows expected to be derived from an asset or CGU calculated using an appropriate pre-tax discount rate. Impairment losses are expensed to the income statement.
Leases Leases – as a lessor Lease income from operating leases where the Group is a lessor is recognised in income on a straight-line basis over the lease term (note 26). Initial direct costs incurred in obtaining an operating leases are added to the carrying amount of the underlying asset and recognised as expense over the lease term on the same basis as lease income. The respective leased assets are included in the balance sheet based on their nature. The Group did not need to make any adjustments to the accounting for assets held as lessor as a result of adopting the new leasing standard.
Leases – as a lessee The Group leases various offices, aircrafts, forklifts, equipment and vehicles. Rental contracts are typically made for fixed periods of 6 months to 25 years, but may have extension options as described below.
Contracts may contain both lease and non-lease components. The Group allocates the consideration in the contract to the lease and non-lease components based on their relative stand-alone process. Lease terms are negotiated on an individual basis and contain a wide range of different terms and conditions. The lease agreements do not impose any covenants other than the security interests in the leases assets that are held by the lessor. Leased assets may not be used as security for borrowing purposes.
Leases are recognised as a right-of-use asset and corresponding liability at the date at which the leases asset is available for use by the Group.
Assets and liabilities arising from a lease are initially measured on a present value basis. Lease liabilities include the net present value of the following lease payments:
fixed payments (including in-substance fixed payments), less any lease incentives receivable; variable lease payments based on an index or a rate, initially measured using the index or rate as at the commencement date; amounts expected to be payable by the Group under residual value guarantees; the exercise price of a purchase option if the Group is reasonably certain to exercise that option, and payments of penalties for terminating the lease, if the lease term reflects the Group exercising that option.
171Annual Report & Accounts 2021
Financial Statements

Notes to the Financial Statements For the year ended 31 March
QinetiQ Group plc Annual Report and Accounts 2021 132
1. Significant changes in the current reporting period
The financial position and performance of the Group was particularly affected by the following events and transactions during the reporting period:
1) The acquisition of Naimuri Limited (see note 12) which resulted in an increase in goodwill (note 14) and other intangible assets (note 15);
2) The divestment of the Boldon James, Commerce Decisions and OptaSense businesses (see note 13); 3) An impairment of goodwill in respect of the Germany business (see note 14).
For a detailed discussion of the Group’s performance and financial position refer to the Strategic Report on pages 2 to 51.
2. Revenue from contracts with customers and other income
Revenue and other income is analysed as follows:
Revenue by category and other income For the year ended 31 March
1 For the period of which there was no contribution in the equivalent period in the comparator year which was pre-ownership (for acquisitions) or post-ownership (for disposals) by the Group
2 Alternative performance measures are used to supplement the statutory figures. See page 183.
Other income
Revenue and profit after tax of associates and joint ventures was £12.6m and £1.1m respectively (2020: revenue of £18.1m and loss after tax of £1.5m). The figures in the table above represent the Group share of this profit after tax.
Other income is in respect of property rentals and the recovery of other related property costs.
Revenue by customer geographic location For the year ended 31 March
All figures in £ million 2021 2020
Services contracts with customers 1,189.4 945.6
Sale of goods contracts with customers 83.0 116.8
Royalties and licences 5.8 10.5
Total revenue 1,278.2 1,072.9
Less: adjust current year for acquired businesses1 (117.2) –
Less: adjust prior year for disposed businesses1 – (17.2)
Adjust to constant prior year exchange rates 2.2 –
Total revenue on an organic, constant currency basis2 1,163.2 1,055.7
Organic revenue growth at constant currency2 10% 10%
All figures in £ million 2021 2020
Share of associates’ and joint ventures’ profit/(loss) after tax 0.7 (0.7)
Other income 9.2 9.9
Other income – underlying 9.9 9.2
Specific adjusting item: gain on sale of property (note 4) 0.1 14.0
Total other income 10.0 23.2
All figures in £ million 2021 2020
US 215.6 136.0
Australia 77.9 60.7
Europe 88.2 75.9
Middle east 9.8 16.3
Rest of world 28.9 44.5
International 420.4 333.4
United Kingdom 857.8 739.5
Total revenue 1,278.2 1,072.9
International revenue % 33% 31%
Revenue from ‘home countries’ (UK, US and Australia) 1,151.3 936.2
Home countries revenue % 90% 87%
Notes to the Financial Statements For the year ended 31 March
QinetiQ Group plc Annual Report and Accounts 2021 172
36. Basis of preparation and significant accounting policies (continued)
Lease payments to be made under reasonably certain options are also included in the measurement of the liability.
The lease payments are discounted using the interest rate implicit in the lease. If the rate cannot be readily determined, which is generally the case for leases in the Group, the lessee’s incremental borrowing rate is used, being the rate the individual lessee would have to pay to borrow the funds necessary to obtain an asset of similar value to the right-of-use asset in a similar economic environment with similar terms, security and conditions.
To determine the incremental borrowing rate, the Group:
where possible, uses recent third-party financing received by the individual lessee as a starting point, adjusted to reflect changes in financing conditions since third party financing was received;
uses a build-up approach that starts with a risk-free interest rate adjusted for credit risk for leases held by QinetiQ Plc, which does not have recent third party financing, and
makes adjustments specific to the lease, example, term country, currency and security.
The Group is not exposed to potential future increases in variable lease payments based on an index or rate, which are not included in the lease liability until they take effect. When adjustments to lease payments based on an index or rate take effect, the lease liability is reassessed and adjusted against the right-of-use asset. Lease payments are allocated between principal and finance cost. The finance cost is charged to profit or loss over the lease period so as to produce a constant periodic rate of interest on the remaining balance of the liability for each period.
Right-of-use assets are measured at cost comprising the following:
the amount of the initial measurement of lease liability; any lease payments made at or before the commencement date less any lease incentives received; any initial direct costs, and restoration costs.
Right-of-use assets are generally depreciated over the shorter of the asset’s useful life and lease term on a straight-line basis. If the Group is reasonably certain to exercise a purchase option, the right-of-use asset is depreciated over the underlying asset’s useful life. The Group does not revalue its land and buildings that are presented within property, plant and equipment and has chosen to do same for right-of-use buildings by the Group. Payments associated with short-term leases of offices, equipment and vehicles and all leases of low-value assets are recognised on a straight-line basis as an expense in profit or loss. Short-term leases are leases with a lease term of 12 months or less. Low-value assets comprise lease assets under £5,000.
Lease extension and termination options Extension and termination options are included in a number of property and equipment leases across the Group. These are used to maximise operational flexibility in terms of managing the assets used in the Group’s operations. The majority of extension and termination options held are exercisable only by the Group and not by the respective lessor.
Judgements in determining the lease term In determining the lease term, management considers all facts and circumstances that create an economic incentive to exercise an extension option or not exercise a termination option. Extension options (or periods after termination options) are only included in the lease term if the lease is reasonably certain to be extended (or not terminated).
For leases of offices and equipment, the following factors are normally the most relevant:
if there are significant penalties to terminate (or extend), the group is typically reasonably certain to end (or not to terminate); if any leasehold improvements are expected to have a significant remaining value, the Group is typically reasonably certain to extend
(or not terminate); Otherwise, the Group considers other factors including historical lease durations and the costs and business disruptions required
to replace the leased asset.
Most extension options in office and vehicles leases have not been included in the lease liability, because the Group could replace the assets without significant cost or business disruption.
As at 31 March 2021 no (undiscounted) potential future cash outflows have been included in the lease liability for extension or termination.
The lease term is reassessed if an option is actually exercised (or not exercised) or the Group becomes obliged to exercise (or not exercise) it. The assessment of reasonable certainty is only revised if a significant event of significant change in circumstance occurs, which affects this assessment, and that is within the control of the lessee. During the current financial year, the financial effect of revising lease terms to reflect the effect of exercising extension or termination options was nil (2020: £0.1m increase) in recognised lease liabilities and right-of-use assets.
172 QinetiQ Group plc

Notes to the Financial Statements continued
QinetiQ Group plc Annual Report and Accounts 2021 133
Financial Statements
Revenue by major customer type For the year ended 31 March
‘Other’ does not contain any customers with revenue in excess of 10% of total Group revenue.
The following table shows the aggregate amount of revenue allocated to performance obligations that are unsatisfied (or partially satisfied) as at the end of the reporting period:
Management expects that 27% (£800.5m) of revenue allocated to unsatisfied contracts as of 31 March 2021 will be recognised as revenue during the next reporting period.
The following table shows the aggregate amount of revenue allocated to performance obligations that were unsatisfied (or partially satisfied) as at the end of the prior reporting period:
Revenue of £144m was recognised during the year that was previously unrecognised as at the previous year end and reported as a contract liability.
3. Segmental analysis
The analysis by business segment is presented in accordance with IFRS 8 Operating Segments, on the basis of those reportable segments whose operating results are regularly reviewed by the Board (the Chief Operating Decision Maker as defined by IFRS 8) and are aligned with the Group’s strategic direction, determined with reference to the products and services they provide, as follows:
EMEA Services provides technical assurance, test and evaluation and training services, underpinned by long-term contracts. EMEA Services comprises the following business units which are not considered reportable segments as defined by IFRS 8: Maritime & Land; Air & Space, Cyber & Information and the International business.
Global Products combines all other business units not aggregated within EMEA Services, including the QinetiQ US business, Space Products and EMEA Products (which includes QinetiQ Target Systems). Generally these business units (which are not considered reportable segments as defined by IFRS 8) deliver innovative solutions and products which includes contract-funded research and development and developing intellectual property in partnership with key customers and through internal funding with potential for new revenue streams.
Operating segments
1 The measure of profit presented to the Chief Operating Decision Maker is operating profit stated before specific adjusting items (‘underlying operating profit’). The specific adjusting items are detailed in note 4.
2 Definitions of the Group’s ‘Alternative performance measures’ can be found in the glossary on page 183.
No measure of segmental assets and liabilities is reported as this information is not regularly provided to the Chief Operating Decision Maker.
All figures in £ million 2021 2020
UK government 794.6 667.2
US government 140.8 116.2
Other 342.8 289.5
Total revenue 1,278.2 1,072.9
All figures in £ million 2022 2023 2024 2025+ Total
Total forecast revenue allocated to unsatisfied performance obligations 800.5 523.9 395.9 1,223.8 2,944.1
All figures in £ million 2021 2022 2023 2024+ Total
Total forecast revenue allocated to unsatisfied performance obligations 849.3 484.9 375.5 1,395.2 3,104.9
2021 2020
All figures in £ million
Revenue from
external customers
Underlying operating
profit1
Revenue from
external customers
Underlying operating
profit1
EMEA Services 939.9 118.6 797.4 100.6
Global Products 338.3 33.2 275.5 32.6
Total operating segments 1,278.2 151.8 1,072.9 133.2
Underlying operating margin2 11.9% 12.4%
Notes to the Financial Statements continued
QinetiQ Group plc Annual Report and Accounts 2021 173
Financial Statements
Investments in debt and equity securities Investments held by the Group are classified as either a current asset or as a non-current asset. These are investments in debt and equity instruments that are classified as at fair value through other comprehensive income. When these investments are derecognised, the cumulative gain or loss previously recognised directly in equity is recognised in the income statement.
The fair value of quoted financial instruments is their bid price at the balance sheet date. The fair value of unquoted equity investments is based on the price of the most recent investment by the Group or a third party, if available, or derived from the present value of forecast future cash flows.
Inventories Inventory and work-in-progress are stated at the lower of cost and net realisable value. Work-in-progress and manufactured finished goods are valued at production cost. Production cost includes direct production costs and an appropriate proportion of production overheads. A provision is established when the net realisable value of any inventory item is lower than its cost. A ‘market comparison’ technique is used to fair value inventories acquired through a business combination. The fair value is determined based on the estimated selling price in the ordinary course of business less the estimated costs of completion and sale, and a reasonable profit margin based on the effort required to complete and sell the inventories.
Trade and other receivables Trade and other receivables are measured at amortised cost less any impairment losses. Amounts recoverable on contracts are included in trade and other receivables and represent revenue recognised in excess of amounts invoiced. Other receivables will also include insurance recoveries where we are virtually certain of recovery.
Impairment of trade and other receivables The Group applies the simplified approach when using the expected credit loss (ECL) impairment model for trade and other receivables. Under the simplified approach the Group always measures the loss allowance at an amount equal to the lifetime expected credit losses for trade receivables. The Group measures the expected credit losses of trade and other receivables in a way that reflects a probability-weighted amount that is determined by evaluating a range of possible outcomes, the time value of money and supportable information that is readily available at each reporting date about past events, current condition and forecasts of future economic conditions. The ECL’s are updated each reporting period to reflect changes in credit risk since initial recognition.
Cash and cash equivalents Cash and cash equivalents comprise cash at bank and short-term, highly liquid investments that are readily convertible into a known amount of cash and which are subject to an insignificant risk of changes in value. The Group holds various short-maturity money market funds (see note 24) across numerous financial institutions which meet the IAS 7 criteria to be classified as cash equivalents. In the cash flow statement overdraft balances are included in cash and equivalents. Cash and cash equivalents includes an element that is restricted in use (note 24).
Current and non-current liabilities Current liabilities include amounts due within the normal operating cycle of the Group. Deferred income, or ‘contract liabilities’, is included in trade and other payables and represents amounts invoiced in excess of revenue recognised. Interest-bearing current and non-current liabilities are initially recognised at fair value and then stated at amortised cost with any difference between the cost and redemption value being recognised in the income statement over the period of the borrowings on an effective interest rate basis. Costs associated with the arrangement of bank facilities or the issue of loans are held net of the associated liability presented in the balance sheet. Capitalised issue costs are released over the estimated life of the facility or instrument to which they relate using the effective interest rate method. If it becomes clear that the facility or instrument will be redeemed early, the amortisation of the issue costs will be accelerated.
Provisions A provision is recognised in the balance sheet when the Group has a present legal or constructive obligation as a result of a past event which can be reliably estimated, and it is probable that an outflow of economic benefits will be required to settle the obligation. Where appropriate, provisions are determined by discounting the expected cash flows at an appropriate discount rate reflecting the level of risk and the time value of money. Where an exposure is highly likely to be covered by insurance no provision is recorded.
Financial instruments Financial assets and financial liabilities are recognised on the Group’s balance sheet when the Group becomes a party to the contractual provisions of the instrument. The de-recognition of a financial instrument takes place when the Group no longer controls the contractual right that comprise the financial instrument, when the instrument expires, or when the instrument is sold, terminated or exercised.
Financial assets Financial assets are classified on the Group’s balance sheet as subsequently measured at amortised cost, fair value through other comprehensive income or fair value through profit or loss. This classification is made on the basis of both the Group’s business model for managing the financial assets and the contractual cash flow characteristics of the financial asset.
Financial liabilities Financial liabilities are classified on the Group’s balance sheet as subsequently measured at amortised cost except for financial liabilities at fair value through profit and loss. The Group may at initial recognition irrevocably designate a financial liability as measured at fair value through profit or loss if a contract contains one or more embedded derivatives and the host is not an asset within the scope of IFRS 9, or when doing so results in more relevant information.
173Annual Report & Accounts 2021
Financial Statements

Notes to the Financial Statements For the year ended 31 March
QinetiQ Group plc Annual Report and Accounts 2021 132
1. Significant changes in the current reporting period
The financial position and performance of the Group was particularly affected by the following events and transactions during the reporting period:
1) The acquisition of Naimuri Limited (see note 12) which resulted in an increase in goodwill (note 14) and other intangible assets (note 15);
2) The divestment of the Boldon James, Commerce Decisions and OptaSense businesses (see note 13); 3) An impairment of goodwill in respect of the Germany business (see note 14).
For a detailed discussion of the Group’s performance and financial position refer to the Strategic Report on pages 2 to 51.
2. Revenue from contracts with customers and other income
Revenue and other income is analysed as follows:
Revenue by category and other income For the year ended 31 March
1 For the period of which there was no contribution in the equivalent period in the comparator year which was pre-ownership (for acquisitions) or post-ownership (for disposals) by the Group
2 Alternative performance measures are used to supplement the statutory figures. See page 183.
Other income
Revenue and profit after tax of associates and joint ventures was £12.6m and £1.1m respectively (2020: revenue of £18.1m and loss after tax of £1.5m). The figures in the table above represent the Group share of this profit after tax.
Other income is in respect of property rentals and the recovery of other related property costs.
Revenue by customer geographic location For the year ended 31 March
All figures in £ million 2021 2020
Services contracts with customers 1,189.4 945.6
Sale of goods contracts with customers 83.0 116.8
Royalties and licences 5.8 10.5
Total revenue 1,278.2 1,072.9
Less: adjust current year for acquired businesses1 (117.2) –
Less: adjust prior year for disposed businesses1 – (17.2)
Adjust to constant prior year exchange rates 2.2 –
Total revenue on an organic, constant currency basis2 1,163.2 1,055.7
Organic revenue growth at constant currency2 10% 10%
All figures in £ million 2021 2020
Share of associates’ and joint ventures’ profit/(loss) after tax 0.7 (0.7)
Other income 9.2 9.9
Other income – underlying 9.9 9.2
Specific adjusting item: gain on sale of property (note 4) 0.1 14.0
Total other income 10.0 23.2
All figures in £ million 2021 2020
US 215.6 136.0
Australia 77.9 60.7
Europe 88.2 75.9
Middle east 9.8 16.3
Rest of world 28.9 44.5
International 420.4 333.4
United Kingdom 857.8 739.5
Total revenue 1,278.2 1,072.9
International revenue % 33% 31%
Revenue from ‘home countries’ (UK, US and Australia) 1,151.3 936.2
Home countries revenue % 90% 87%
Notes to the Financial Statements For the year ended 31 March
QinetiQ Group plc Annual Report and Accounts 2021 174
36. Basis of preparation and significant accounting policies (continued)
Derivative financial instruments Derivative financial instruments are initially recognised and thereafter held at fair value, being the market value for quoted instruments or valuation based on models and discounted cash flow calculations for unlisted instruments.
Fair value hedging Changes in the fair value of derivatives designated as fair value hedges of currency risk or interest rate risk are recognised in the income statement. The hedged item is held at fair value with respect to the hedged risk with any gain or loss recognised in the income statement.
Cash flow hedging Changes in the fair value of derivatives designated as a cash flow hedge that are regarded as highly effective are recognised in equity. The ineffective portion is recognised immediately in the income statement. Where a hedged item results in an asset or a liability, gains and losses previously recognised in equity are included in the cost of the asset or liability. Gains and losses previously recognised in equity are removed and recognised in the income statement at the same time as the hedged transaction.
Foreign currencies Transactions in foreign currencies are recorded using the rate of exchange ruling at the date of the transaction. Monetary assets and liabilities in foreign currencies are translated at period-end rates. Any resulting exchange differences are taken to the income statement. Gains and losses on designated forward foreign exchange hedging contracts are matched against the foreign exchange movements on the underlying transaction.
The individual financial statements of each Group company are presented in its functional currency. On consolidation, assets and liabilities of overseas subsidiaries, associated undertakings and joint ventures, including any related goodwill, are translated to Sterling at the rate of exchange at the balance sheet date. The results and cash flows of overseas subsidiaries, associated undertakings and joint ventures are translated to Sterling using the average rates of exchange during the period. Exchange adjustments arising from the re-translation of the opening net investment and the results for the period to the period-end rate are taken directly to equity and reported in the statement of comprehensive income.
Post-retirement benefits The Group provides both defined contribution and defined benefit pension arrangements. The liabilities of the Group arising from defined benefit obligations are determined using the projected unit credit method. Valuations for accounting purposes are carried out bi-annually. Actuarial advice is provided by external consultants. For the funded defined benefit plans, the excess or deficit of the fair value of plan assets less the present value of the defined benefit obligation are recognised as an asset or a liability respectively.
Per the Scheme rules, the Company has an unconditional right to a refund of any surplus that may arise on cessation of the Scheme in the context of IFRIC 14 paragraphs 11(b) and 12 and therefore the full net pension asset can be recognised on the Group’s balance sheet and the Group’s minimum funding commitments to the Scheme do not give rise to an additional balance sheet liability.
For defined benefit plans, the cost charged to the income statement consists of administrative expenses and the net interest income. There is no service cost due to the fact the plans are closed to future accrual. The net interest income is reported within finance income and the administration cost element is charged as a component of operating costs in the income statement. Actuarial gains and losses and re-measurement gains and losses are recognised immediately in full through the statement of comprehensive income. Contributions to defined contribution plans are charged to the income statement as incurred.
Share-based payments The Group operates share-based payment arrangements with employees. The fair value of equity-settled awards for share-based payments is determined on grant and expensed straight line over the period from grant to the date of earliest unconditional exercise. The valuation methodology for TSR awards is based on Monte Carlo model to allow for the impact of market related performance criteria and taking into account all non-vesting conditions. The value is expensed straight line over the period from grant to the date of earliest unconditional exercise. The charges for equity settled share-based payments are updated annually for non-market-based vesting conditions.
Share capital Ordinary share capital of the Company is recorded as the proceeds received, less issue costs. Company shares held by the employee benefit trusts are held at the consideration paid. They are classified as own shares within equity. Any gain or loss on the purchase, sale or issue of Company shares is recorded in equity.
Non-controlling interests The Group recognises non-controlling interest in an acquired entity either at fair value or at the non-controlling interest’s proportionate share of the acquired entity’s net identifiable assets. This decision is made on an acquisition-by-acquisition basis. For non-controlling interests that the Group holds, the Group elected to recognise the non-controlling interests at its proportionate share of the acquired net identifiable assets.
174 QinetiQ Group plc
Notes to the Financial Statements continued
QinetiQ Group plc Annual Report and Accounts 2021 133
Financial Statements
Revenue by major customer type For the year ended 31 March
‘Other’ does not contain any customers with revenue in excess of 10% of total Group revenue.
The following table shows the aggregate amount of revenue allocated to performance obligations that are unsatisfied (or partially satisfied) as at the end of the reporting period:
Management expects that 27% (£800.5m) of revenue allocated to unsatisfied contracts as of 31 March 2021 will be recognised as revenue during the next reporting period.
The following table shows the aggregate amount of revenue allocated to performance obligations that were unsatisfied (or partially satisfied) as at the end of the prior reporting period:
Revenue of £144m was recognised during the year that was previously unrecognised as at the previous year end and reported as a contract liability.
3. Segmental analysis
The analysis by business segment is presented in accordance with IFRS 8 Operating Segments, on the basis of those reportable segments whose operating results are regularly reviewed by the Board (the Chief Operating Decision Maker as defined by IFRS 8) and are aligned with the Group’s strategic direction, determined with reference to the products and services they provide, as follows:
EMEA Services provides technical assurance, test and evaluation and training services, underpinned by long-term contracts. EMEA Services comprises the following business units which are not considered reportable segments as defined by IFRS 8: Maritime & Land; Air & Space, Cyber & Information and the International business.
Global Products combines all other business units not aggregated within EMEA Services, including the QinetiQ US business, Space Products and EMEA Products (which includes QinetiQ Target Systems). Generally these business units (which are not considered reportable segments as defined by IFRS 8) deliver innovative solutions and products which includes contract-funded research and development and developing intellectual property in partnership with key customers and through internal funding with potential for new revenue streams.
Operating segments
1 The measure of profit presented to the Chief Operating Decision Maker is operating profit stated before specific adjusting items (‘underlying operating profit’). The specific adjusting items are detailed in note 4.
2 Definitions of the Group’s ‘Alternative performance measures’ can be found in the glossary on page 183.
No measure of segmental assets and liabilities is reported as this information is not regularly provided to the Chief Operating Decision Maker.
All figures in £ million 2021 2020
UK government 794.6 667.2
US government 140.8 116.2
Other 342.8 289.5
Total revenue 1,278.2 1,072.9
All figures in £ million 2022 2023 2024 2025+ Total
Total forecast revenue allocated to unsatisfied performance obligations 800.5 523.9 395.9 1,223.8 2,944.1
All figures in £ million 2021 2022 2023 2024+ Total
Total forecast revenue allocated to unsatisfied performance obligations 849.3 484.9 375.5 1,395.2 3,104.9
2021 2020
All figures in £ million
Revenue from
external customers
Underlying operating
profit1
Revenue from
external customers
Underlying operating
profit1
EMEA Services 939.9 118.6 797.4 100.6
Global Products 338.3 33.2 275.5 32.6
Total operating segments 1,278.2 151.8 1,072.9 133.2
Underlying operating margin2 11.9% 12.4%
Notes to the Financial Statements continued
QinetiQ Group plc Annual Report and Accounts 2021 175
Financial Statements
37. Critical accounting estimates and judgements in applying accounting policies
Critical accounting estimates The following commentary is intended to highlight key sources of estimation uncertainty that have a significant risk of resulting in a material adjustment to the financial statements in the next financial year.
Estimated goodwill impairment The Group tests annually whether goodwill has suffered any impairment. This process relies on the use of estimates of the future profitability and cash flows of its cash generating units which may differ from the actual results delivered. In addition, the Group reviews whether identified intangible assets have suffered any impairment. Further details on the sensitivity of the carrying value of goodwill to changes in the key assumptions are set out in note 14.
Estimation of the Group’s defined benefit pension net surplus The Group’s defined benefit pension obligations (and hence the net surplus) are based on key assumptions, including discount rates, mortality and inflation. Management exercises its best judgement, in consultation with actuarial advisors, in selecting the values for these assumptions that are the most appropriate to the Group. Small changes in these assumptions at the balance sheet date, individually or collectively, may result in significant changes in the size of the net surplus/deficit. Further details of these assumptions and the sensitivity of the net pension surplus to changes in these assumptions are set out in note 28.
In addition to the sensitivity of the liability side of the net pension surplus (which will impact the value of the net pension surplus) the net pension surplus is also exposed to significant variation due to changes in the fair value of Scheme assets. A specific sensitivity on assets has not been included in note 28 but any change in valuation of assets flows straight through to the value of the net pension surplus e.g. if equities fall by £10m then the net pension surplus falls by £10m. The values of unquoted assets assume that an available buyer is willing to purchase those assets at that value. For the Group’s portfolio of assets, the property portfolio of £76.6m, the unquoted corporate bonds of £98.0m and the unquoted equities of £47.4m are the assets with most uncertainty as to valuation as at 31 March 2021 as a consequence of the economic uncertainty caused by the COVID-19 pandemic.
Estimated value of tax assets and liabilities The Group has significant levels of unused tax losses and US carried forward interest expense, of which £1.4m has been recognised as a deferred tax asset at 31 March 2021, as set out in note 18. When estimating the appropriate amount that should be recognised, management consider sources of taxable profits including the reversal of deferred tax liabilities and forecast future profits. This estimate is sensitive to similar factors as goodwill, as set out in note 14. Within the current tax payable of £3.8m as at 31 March 2021, management include an estimate of the impact of technical uncertainties associated with tax positions. To the extent that the outcome of a tax audit differs from the tax that has been provided, a material adjustment could arise in a future period. Considering reasonably possible changes in forecast taxable profits and developments with tax authorities, management consider the potential impact of changes in these tax estimates over the next 12 months could range between a £9m increase to a £1m decrease in net assets.
Critical accounting judgements Specific, material judgements made by the Directors in applying the Group’s accounting policies are set out below:
Basis of consolidation The Group comprises certain entities that are operated within the terms of a Special Security Arrangement (‘SSA’). Details of the SSA and QinetiQ’s management of US subsidiaries are set out in the Corporate Governance section of this Annual Report. IFRS 10 is the accounting standard applicable in respect of consolidation of entities. This does not specifically deal with SSA’s. However, having considered the terms of the SSA, the Directors consider that the Group meets the requirements of IFRS 10 in respect of control over such affected entities and, therefore, consolidates these entities in the consolidated accounts. The impact of this specific judgement is full consolidation as opposed to treatment as a 100% associated undertaking. This would reduce Group revenue by a material amount (~£100m per annum) but would have no impact on reported profit, which would include an equivalent amount of profit reported within Other Income as ‘Share of profits of joint ventures and associates’.
Service delivery on a long-term contract The Group is currently party to a specific contract with a customer that required certain activities to be performed within a specified duration. Due to technical issues such activities can no longer reasonably be expected to complete within the currently contracted duration and QinetiQ management have made the judgement that an extra period of one year will be granted by the customer to enable delivery of the currently estimated volume of operations. Should such extension not be granted (and there are no indications that it won’t) and/or the expected level of services not be delivered then a reduction in contract value would be expected. This could have a material revenue impact although the profit impact would be partly mitigated by recourse to insurers and suppliers.
175Annual Report & Accounts 2021
Financial Statements

Company balance sheet As at 31 March
QinetiQ Group plc Annual Report and Accounts 2021 176
The profit for the year ended 31 March 2021 was £45.0m (2020: profit of £47.4m).
The financial statements of QinetiQ Group plc (company number 4586941) were approved by the Board of Directors and authorised for issue on 20 May 2021 and were signed on its behalf by:
Steve Wadey David Smith
Chief Executive Officer Chief Financial Officer
All figures in £ million Note 2021 2020
Fixed assets
Investments in subsidiary undertaking 2 507.4 482.5
507.4 482.5
Current liabilities
Creditors: amounts falling due within one year 3 (72.9) (70.6)
Net current liabilities (72.9) (70.6)
Total assets less current liabilities 434.5 411.9
Net assets 434.5 411.9
Equity
Share capital 4 5.7 5.7
Capital redemption reserve 40.8 40.8
Share premium 147.6 147.6
Retained earnings 240.4 217.8
Total equity 434.5 411.9
176 QinetiQ Group plc

Company statement of changes in equity For the year ended 31 March
QinetiQ Group plc Annual Report and Accounts 2020 177
Financial Statements
The capital redemption reserve is not distributable and was created following redemption of preference share capital.
All figures in £ million Share
capital
Capital redemption
reserve Share
premium Retained earnings
Total equity
At 1 April 2020 5.7 40.8 147.6 217.8 411.9
Profit for the year – – – 45.0 45.0
Purchase of own shares – – – (9.0) (9.0)
Shares settled liabilities – – – 13.7 13.7
Dividend paid – – – (37.7) (37.7)
Share-based payments – – – 10.6 10.6
At 31 March 2021 55..77 4400..88 114477..66 240.4 434.5
At 1 April 2019 5.7 40.8 147.6 202.3 396.4
Profit for the year – – – 47.4 47.4
Purchase of own shares – – – (0.7) (0.7)
Dividend paid – – – (38.0) (38.0)
Share-based payments – – – 6.8 6.8
At 31 March 2020 5.7 40.8 147.6 217.8 411.9
177Annual Report & Accounts 2021
Financial Statements
Notes to the Company Financial Statements
QinetiQ Group plc Annual Report and Accounts 2021 178
1. Accounting policies
The Company is a public limited company and is incorporated and domiciled in United Kingdom.
The following accounting policies have been applied consistently in dealing with items which are considered material in relation to the Company’s financial statements.
Basis of preparation The financial statements have been prepared on a going concern basis under the historical cost convention and in accordance with applicable UK Accounting Standards. As permitted by section 408(4) of the Companies Act 2006, a separate profit and loss account dealing with the results of the Company has not been presented.
These financial statements were prepared in accordance with Financial Reporting Standard 101 Reduced Disclosure Framework. In preparing these financial statements, the Company is in accordance with International Accounting Standards in conformity with the requirements of the Companies Ace 2006 and the International Financial Reporting Standards adopted pursuant to Regulation (EC) No 1606/2002 as it applies in the EU but makes amendments where necessary in order to comply with Companies Act 2006 and has set out below where advantage of the FRS 101 disclosure exemptions has been taken.
– A cash flow statement and related notes – Disclosures in respect of capital management – The effects of new but not yet effective IFRSs – Disclosures in respect of the compensation of key management personnel – IAS 24 in respect of related party transactions entered into between two or more members of a group – IFRS 2 Share Based Payments in respect of Group-settled share-based payments – Certain disclosures required by IFRS 13 Fair Value Measurement and the disclosures required by IFRS 7.
Investments In the Company’s financial statements, investments in subsidiary undertakings are stated at cost less any impairment in value.
Share-based payments The cost of share-based payments in respect of employees of Group subsidiaries is charged to those subsidiary undertakings. In the Company financial statements the recoverable from subsidiaries is credited directly to equity as a capital contribution. The fair value of equity-settled awards for share-based payments is determined on grant and expensed in subsidiary undertakings (and credited to equity in the Company) on a straight line basis over the period from grant to the date of earliest unconditional exercise. The charges for equity-settled share-based payments are updated annually for non-market-based vesting conditions. Further details of the Group’s share-based payment charge are disclosed in note 30 to the Group financial statements.
2. Investments in subsidiary undertakings
As at 31 March
The increase in investments in subsidiary undertakings in 2021 relates to £11.2m of equity-settled schemes during the year and share settled liabilities of £13.7m in relation to 2020 settlement of bonus incentives in shares.
A list of all subsidiary undertakings of QinetiQ Group plc is disclosed in note 35 to the Group financial statements.
3. Creditors: amounts falling due within one year
As at 31 March
Amounts owed to Group undertakings are unsecured, repayable on demand and bear no interest.
All figures in £ million 2021 2020
Subsidiary undertaking – 100% of ordinary share capital of QinetiQ Group Holdings Limited 424.3 424.3
Capital contributions arising from share-based payments to employees of subsidiaries 69.4 58.2
Capital contributions arising from share-settled liabilities 13.7 –
Total investment in subsidiary undertakings 507.4 482.5
All figures in £ million 2021 2020
Amounts owed to Group undertakings 72.9 70.6
178 QinetiQ Group plc

Notes to the Company Financial Statements
QinetiQ Group plc Annual Report and Accounts 2020 179
Financial Statements
4. Share capital
The Company’s share capital is disclosed in note 29 to the Group financial statements.
5. Share-based payments
The Company’s share-based payment arrangements are set out in note 30 to the Group financial statements.
6. Parent company guarantees
The Company has provided guarantees to various customers of subsidiaries to the value of £21.0m (2020: £21.0m) in the ordinary course of business.
7. Other information
Directors’ emoluments, excluding Company pension contributions, were £5.9m (2020: £4.4m). These emoluments were all in relation to services provided on behalf of the QinetiQ Group with no amount specifically relating to their work for the Company. Details of the Directors’ emoluments, share schemes and entitlements under money purchase pension schemes are disclosed on page 99 in the Remuneration Report.
The remuneration of the Company’s auditor for the year to 31 March 2021 was £0.4m (2020: £0.4m), which was for audit of the Group financial statements and Company financial statements and audit related assurance services. No other services were provided by the auditors to the Company.
The monthly average number of employees for the year to 31 March 2021 was nil (2020: nil).
179Annual Report & Accounts 2021
Financial Statements

Five Year Record
QinetiQ Group plc Annual Report and Accounts 2021 180
1 Underlying measures are stated before specific adjusting items. Definitions of underlying measures of performance are provided on page 183. Underlying financial measures are presented because the Board believes these provide a better representation of the Group’s long-term performance trend. For details of specific adjusting items refer to note 4 and note 36 of the financial statements.
For the years ended 31 March (unaudited) 2021 2020 2019 2018 2017
EMEA Services £m 939.9 797.4 687.7 651.4 613.5
Global Products £m 338.3 275.5 223.4 181.6 169.6
Revenue £m 1,278.2 1,072.9 911.1 833.0 783.1
EMEA Services £m 118.6 100.6 96.8 94.3 92.7
Global Products £m 33.2 32.6 28.1 28.2 23.6
Underlying operating profit1 £m 151.8 133.2 124.9 122.5 116.3
Underlying operating margin1 % 11.9 12.4 13.7 14.7 14.9
Operating profit £m 112.3 117.6 114.8 141.0 132.7
Underlying profit before tax1 £m 149.9 132.2 124.0 122.1 116.1
Profit before tax £m 146.2 123.1 123.2 144.8 131.5
Profit attributable to owners of the Company £m 124.5 106.3 113.9 138.1 123.3
Underlying basic EPS1 attributable to owners of the Company Pence 22.1 20.0 19.7 19.3 18.1
Basic EPS attributable to owners of the Company Pence 21.9 18.7 20.1 24.4 21.5
Diluted EPS attributable to owners of the Company Pence 21.6 18.6 20.0 24.3 21.3
Dividend per share Pence 6.9 6.6 6.6 6.3 6.0
Underlying net cash flow from operations 1 £m 199.0 177.8 135.3 126.5 111.9
Net cash as defined by the Group £m 164.1 84.7 160.5 266.8 221.9
Average number of employees 6,874 6,267 5,994 6,143 6,114
Orders excluding LTPA amendments £m 1,151.0 972.1 776.4 587.2 675.3
180 QinetiQ Group plc

Foreign exchangeThe principal exchange rates affecting the Group were the Sterling to US Dollar exchange rate and the Sterling to Australian Dollar rate.
12 months to
31 March 202112 months to
31 March 2020
£/US$ – opening 1.24 1.30
£/US$ – average 1.31 1.27
£/US$ – closing 1.38 1.24
£/A$ – opening 2.03 1.83
£/A$ – average 1.84 1.86
£/A$ – closing 1.81 2.03
Treasury policyThe Group treasury department works within a framework of policies and procedures approved by the Audit Committee. There is a structured approach to financial risk management, mitigating exposures to currency, liquidity, counterparty and credit risks as outlined in note 27. The policy supports the use of financial instruments to manage and hedge business operations risks that arise on movements in financial, credit or money markets. As part of these policies and procedures, there is strict control on the use of financial instruments. Speculative trading in financial instruments is not permitted.
• Currency risk – The Group’s income and expenditure is largely settled in the functional currency of the relevant Group entity. However, where cash flows are denominated in currencies other than the functional currency of the relevant trading entity, the Group has a policy in place to hedge all material transaction exposure at the point of commitment to the underlying transaction. Uncommitted future transactions are not routinely hedged. Where the timing of cash flows differ from the original expectation, the Group will enter into currency swaps to realign the hedge maturity. The maximum permitted hedge period is 5 years. The Group does not hedge translation exposures arising from the consolidation of overseas subsidiaries in foreign currencies.
• Financial credit and liquidity risk – The Group manages liquidity risk to ensure funds are available to meet business needs and maximise return while managing counterparty and credit risks. Investments are permitted with institutions on an Approved Counterparty list and not to exceed the counterparty credit limit. Investments must be held in the currency of the reporting entity except currency deposits or borrowings specifically placed to hedge assets or liabilities with related hedge documentation. Group funding is established to meet the Group’s medium and long-term financing requirements. Facilities are agreed with a number of financial institutions such that no single institution exerts undue influence on the Group. At the year end the Group had an undrawn revolving credit facility of £275m of which £65m matures on 27 September 2024 and £210m matures on 27 September 2025.
The policies are established to manage and control risk in the treasury environment and to align the treasury goals, objectives and philosophy of the Group.
Tax risk managementQinetiQ’s tax strategy, as published on its corporate website, is to
ensure compliance with all relevant tax legislation, wherever we do business, whilst managing our effective tax rates and tax cash flows. Tax is managed in alignment with our corporate responsibility strategy in that we strive to be responsible in all our business dealings with a zero tolerance of tax evasion. These principles are applied in a consistent and transparent manner in pursuing the tax strategy and in all dealings with tax authorities around the world.
• Tax planning – QinetiQ manages both effective tax rate (ETR) and cash tax impacts in line with the Board-endorsed tax strategy. External advice and consultation are sought on potential changes in tax legislation in the UK, the US and elsewhere as necessary, enabling the Group to plan for and mitigate potential changes. QinetiQ does not make use of ‘off-shore’ entities or tax structures to focus taxable profits in jurisdictions that legislate for low tax rates.
• Relationships with tax authorities – QinetiQ is committed to building constructive working relationships with tax authorities based on a policy of full disclosure in order to remove uncertainty in its business transactions and allow the authorities to review possible risks. In the UK, QinetiQ seeks to be open and transparent in its engagement with the tax authorities by sharing with HMRC the methodologies adopted in its tax returns.
• Transfer pricing – QinetiQ does not have a significant level of cross-border activity but this will increase as it pursues its policy of expanding around the globe. Where there is cross-border activity, controls are in place to ensure pricing reflects ‘arm’s length’ principles in compliance with the OECD Transfer Pricing Guidelines and the laws of the relevant jurisdictions. The Group does not, therefore, have a significant exposure to transfer pricing legislation. QinetiQ submits its ‘Country by Country’ report to the UK tax authorities in line with the OECD rules providing insight for tax authorities into its global tax affairs.
• Governance – The Board has approved this approach. The Audit Committee oversees the tax affairs and risks through periodic reviews. The governance framework is used to manage tax risks, establish controls and monitor their effectiveness. The Head of Tax is responsible for ensuring that appropriate policies, processes and systems are in place and that the tax team has the required skills and support to implement this approach.
QinetiQ’s corporate tax contribution – QinetiQ is liable to pay tax in the countries in which it operates, principally the UK, the US, Australia, Canada, Germany and Belgium. Changes in tax legislation in these countries could have an adverse impact on the level of tax paid on profits generated by the Group. A significant majority of the Group’s profit before tax is generated in the UK. This reflects the fact that the majority of the Group’s business is undertaken, and employees are based, in the UK. Total corporation tax payments in the year to 31 March 2021 were £15.0m (2020: £10.0m).
The differential between the taxation expense and the tax paid in the year relates primarily to the timing of the recovery of research and development expenditure credits for which the cash is recovered in the year following the year of account. There is also an impact of deferred tax movements, whereby the income statement bears charges and credits (e.g. in respect of property, plant and equipment) but for which there is no corporation tax paid in the year. Together, these result in the cash paid being £6.5m less than the total expense charged to the income statement.
Additional Financial Information
181Annual Report & Accounts 2021
Other Information

AGM Annual General Meeting
BBP Bonus Banking Plan
CAGR Compound Annual Growth Rate
C4ISR Command, control, communications, computers, intelligence, surveillance and reconnaissance
COTS Commercial off the shelf
CPI Consumer Price Index
CR Corporate Responsibility
CRC Carbon Reduction Commitment
CSR Corporate Social Responsibility
DE&S MOD’s Defence, Equipment and Support organisation
DHS US Department of Homeland Security
DSP Deferred Share Plan
DoD US Department of Defense
EBITDA Earnings before interest, tax, depreciation and amortisation
ED&I Equality, diversity and inclusion
EDP Engineering Delivery Partner
EMEA Europe, Middle East and Australasia
EPS Earnings per share
ESA European Space Agency
ESOS Energy Savings Opportunity Scheme
EST Engineering, Science and Technical
FAR Federal Acquisition Regulations
FCA Financial Conduct Authority
FMI Foster-Miller, Inc. – the legal entity through which the QNA business operates
Funded order backlog The expected future value of revenue from
contractually committed and funded customer orders
GEV Global Employee Voice
GHG Greenhouse gas
IAS International Accounting Standards
IBDM International Berthing and Docking Mechanism
IFRS International Financial Reporting Standards
IRAD Internal research and development
KPI Key Performance Indicator
LDP Leadership development programme
LIBID London inter-bank bid rate
LIBOR London inter-bank offered rate
LTI Lost time incident
LTPA Long Term Partnering Agreement – 25-year contract established in 2003 to manage the MOD’s Test and Evaluation ranges
MDP Modernising Defence Programme
MOD UK Ministry of Defence
MSCA Maritime Strategic Capability Agreement
NCSISS Naval Combat System Integration Support Services
OHSAS Occupational Health and Safety Advisory Services
PDR Performance development review
PBT Profit before tax
PSP Performance Share Plan
QNA QinetiQ North America
QSOS QinetiQ Share Option Scheme
QTS QinetiQ Target Systems
R&D Research and development
RDEC Research and development expenditure credit
SE Strategic Enterprise
SPA Special protection area
SSRO Single Source Regulations Office
SSSI Site of Special Scientific Interest
STEM Science, Technology, Engineering and Maths
T&E Test and Evaluation
T&R Training and Rehearsal
TSR Total shareholder return
UAV Unmanned aerial vehicle
UK Corporate Governance Code Guidelines of the Financial Reporting Council to
address the principal aspects of corporate governance in the UK
UK GAAP UK Generally Accepted Accounting Practice
Glossary
182 QinetiQ Group plc

Alternative performance measures (APMs)The Group uses various non-statutory measures of performance, or APMs. Such APMs are used by management internally to monitor and manage the Group’s performance and also allow the reader to obtain a proper understanding of performance (in conjunction with statutory financial measures of performance). The APMs used by QinetiQ are set out below:
Measure Explanation Note
Organic growth The level of year-on-year growth, expressed as a percentage, calculated at constant prior year foreign exchange rates, adjusting for business acquisitions and disposals to reflect equivalent composition of the Group
Note 2
Underlying operating profit
Operating profit as adjusted to exclude ‘specific adjusting items’ Note 3
Underlying operating margin
Underlying operating profit expressed as a percentage of revenue Note 3
Underlying net finance income/expense
Net finance income/expense as adjusted to exclude ‘specific adjusting items’ Note 7
Underlying profit before/after tax
Profit before/after tax as adjusted to exclude ‘specific adjusting items’ Note 4
Underlying effective tax rate
The tax charge for the year excluding the tax impact of ‘specific adjusting items’ expressed as a percentage of underlying profit before tax
Note 9
Underlying basic and diluted EPS
Basic and diluted earnings per share as adjusted to exclude ‘specific adjusting items’ Note 10
Orders The level of new orders (and amendments to existing orders) booked in the year. Includes share of orders won by joint ventures.
N/A
Backlog, funded backlog or order book
The expected future value of revenue from contractually committed and funded customer orders N/A
Book to bill ratio Ratio of funded orders received in the year to revenue for the year, adjusted to exclude revenue from the 25-year LTPA contract due to significant size and timing differences of LTPA order and revenue recognition which may distort the ratio calculation
N/A
Underlying net cash flow from operations
Net cash flow from operations before cash flows of specific adjusting items. Note 25
Underlying operating cash conversion or cash conversion ratio
The ratio of underlying net cash from operations to underlying operating profit Note 25
Free cash flow Underlying net cash flow from operations less net tax and interest payments less purchases of intangible assets and property, plant and equipment. Plus proceeds from disposal of plant and equipment.
Note 25
Net cash Net cash as defined by the Group combines cash and cash equivalents with other financial assets and liabilities, primarily available for sale investments, derivative financial instruments and finance lease assets/liabilities.
Note 24
Specific adjusting items Amortisation of intangible assets arising from acquisitions; impairment of property; gains/losses on disposal of property and investments; net pension finance income; transaction and integration costs in respect of business acquisitions; tax impact of the preceding items and significant non-recurring deferred tax movements.
Note 4
183Annual Report & Accounts 2021
Other Information