BASIC FINANCIAL STATEMENTS - Yakima County
59
BASIC FINANCIAL STATEMENTS
-
Upload
khangminh22 -
Category
Documents
-
view
1 -
download
0
Transcript of BASIC FINANCIAL STATEMENTS - Yakima County

BASIC FINANCIAL
STATEMENTS

Basic Financial Statements
The basic financial statements and note disclosure comprise the minimum acceptable fair presentation in conformity with Generally Accepted Accounting Principles (GAAP). Basic financial statements are designed to be " liftable" from the Financial Section of the Comprehensive Annual Financial Report (CAFR) for widespread distribution to users requiring less detailed information than is contained to the full CAFR. Basic Financial Statements include:
Government-wide Financial Statements (I) Government-wide Statement of Net Position - present information on all
County governmental and business-type assets and liabilities, with the difference reported as net position.
(2) Government -wide Statement of Activities - presents information on all County governmental and business-type revenues and expenses, with the difference reported as change in net position.
Fund Financial Statements (3) Balance Sheet - Governmental Funds - presents the balance sheets for major
funds and aggregated amounts for all other governmental funds.
(4) Reconciliation of the Balance Sheet to the Government-wide Statement of Net Position
(5) Statement of Revenues, Expenditures, and Changes in Fund BalancesGovernmental Funds - presents information for each major fund and aggregated information for all other governmental funds.
(6) Reconciliation of the Statement of Revenues, Expenditures, and Changes in Fund Balances to the Government-wide Statement of Activities
(7) Statement of Net Position - Proprietary Funds - presents information on all assets and liabilities, with the difference reported as change in net position for the major enterprise fund and aggregated amounts for all other enterprise funds , as well as a separate column of information for internal service funds .
(8) Statement of Revenues, Expenses, and Changes in Fund Net PositionProprietary Funds - present information for each major fund and aggregated information for all other governmental funds. Major and non-major enterprise funds and internal service funds .
(9) Statement of Cash Flows- presents information on the sources and uses of cash for the major fund and aggregated information for all other enterprise funds and for internal service funds.
22

(10) Statement of Fiduciary Net Position - presents information on investment trust fund, the private-purpose trust fund, and agency fund assets and liabilities, with the difference reported as net position.
(11) Statement of Changes in Fiduciary Net Position - presents information on additions to and deductions from investment trust funds, the private-purpose trust fund, and agency funds, with the difference reported as change in net position.
(12) Notes to Financial Statements - presents disclosure and further detail information to assist the reader in a better understanding of the financial statements and the data presented within them.
23

YAKIMA COUNTY, WASHINGTON Statement of Net Position December 3 1, 2013 amounts presented in 1000's
Governmental Business-Type ASSETS Activities Activities Total Cash/Cash Equivalents $ 28,955 $ 842 $ 29,796
Investments 4 1,053 23,526 64,579 Receivables 16,068 582 16,650
Due From Other Governments 15,5 14 258 15,772
Internal Balances (9) 9 ° I n ven toriesfPrepaymen ts 2,078 2,078
Restricted Assets: Restricted for Debt Service:
Cash/Cash Equivalents 34 34
Investments 540 540 Receivables 84 84
Restricted for Capital Projects: Cash/Cash Equivalents 2,0 15 2,0 15 Investments 6,328 6,328 Receivables 5 5
Capital Assets: Land and Construction in Progress 10 1,228 10,795 11 2,023
Other Capital Assets, Net of Depreciation 187,093 18,343 205,436
Total Assets $ 400,988 $ 54,354 $ 455,34 1
DEFERRED OUTFLOWS OF RESOURCES
LIABILITIES Liabilities Accounts Payable and Other Current Liabilities $ 4,379 $ 742 $ 5, 12 1 Accrued Liabi lit ies 8,722 535 9,256 Due to Other Governments 2,734 2,734
Other Liabilites 120 120 Long Tenn Liabilities:
Landfi ll Closure and Postclosure Care: Due Within One Year 13 13
Due In More Than One Year 9,978 9,978 Special Assessment Debt with Governmenta l Commitment:
Due Within One Year 22 22 Due In More Than One Year 49 49
Other Due Within One Year 3,9 16 364 4,280
Other Due In More 111an One Year 4 1,97 1 3,3 14 45,285
Total Liabilities 6 1,792 15,065 76,857
DEFERRED INFLOWS OF RESOURCES 780 780
Net Position Net Investment in Cap ital Assets 257,968 25,634 283,602 Restricted For: Debt Service 639 639 Securi ty of Persons 1,449 1,449
Transportat ion 3,479 3,479 Economic Development 16,423 16,423 Health and Human Services 6,942 6,942 Capital Projects & Rep lacements 8,930 8,930 Judicial & Special Revenue 10,403 10,403
Unrestricted 32, 184 13,654 45,838 Total Net Position $ 338,4 16 $ 39,288 $ 377,705
See accompanying notes to the financial statements 24

YA KIMA COUNTY, WASHINGTON Statement of Activ it ies
Year Ended December 3 1,20 13
amounts presented in 1000', Program Revenues Nel (Expense) Revenue and Changes in Net Assets
Operating
Charges for Grants and Capital Grants Governmental Business-Type
FunctionsIProg rams ~nses Services Contributions and Contributions Activities Activities Total Primary Government:
Governmental Activities:
General Government $ 19,594 $ 7,928 $ 568 $ 177 $ ( 10,921) $ $ (10,921)
Judicial 8,790 3,541 2,483 (2,766) (2,766)
Public Safety 42,529 9,431 3,197 11 (29,890) (29,890)
Physical Environment 2,093 41 929 ( 1,122) ( 1,122)
Transportation 30,136 6,158 4,357 ( 19,62 1) (19,621)
Economic Environment 4,932 2,380 1,711 (840) (840)
Health and Human Services 18,856 567 15,552 48 (2,689) (2,689)
Culture and Recreation 1,069 24 4 ( 1,041) (1,041)
Interest on Long Term Debt 1,468 (1,468) (1 ,468)
Total Governmental Activities 129,467 30,072 28 ,798 240 (70,357) 0 (70,357)
Business-Type Activities
Solid Waste 6,993 8,581 378 1,966 1,966
IV Public Services Utilities 1,748 1,283 (464) (464) V-
Building and Fire Safety 1,600 1,681 38 120 120
Total Business-Type Activities 10,341 11 ,546 416 0 0 1,621 1,621
Total Primary Government $ 139,807 $ 41 ,6 17 $ 29,2 14 $ 240 $ (70,357) $ 1,621 $ (68,736)
Genera l Revenues Taxes:
Property 37,386 37,386
Sales 19,381 19,381
Private Harvest 56 56
ExciseJ Leasehold 61 1 611
Gambling 160 160
MotellHotel 573 573
91 1 2,064 2,064
Grants and Contributions Not Restricted for Specific Programs 6,209 148 6,357
Interest and Investment Earnings 1,954 68 2,02 1
Gain on Sales of Capital Assets 291 126 416
Transfers (111 ) 11 1 0
Total General Revenues and Transfers 68 ,572 452 69,024
Change in Net Position (1,785) 2,074 288
Net Position of January I 340,199 37,278 377,477
Prior Period Adjustment (63) (63)
Net Position of December 31 $ 338,416 $ 39,288 $ 377 ,705
See accompanying notes to the financial statements

YAKIMA COUNTY, WASHINGTON Page I of2
Balance Sheet Governmental Funds December 3 I, 2013
Aging & Support Invest General County Long-Tem In Economic
ASSETS Fund Road Care Diversification Cash/Cash Equivalents $ 9,071,200 $ 963,452 $ 3,870,874 $ 573,508 Investments 37,17 1 3,463,871 12,057,664 Taxes Receivable 1,090,85 1 553,263 Accounts Receivable Net 2,604,378 16,462 29,655 Assessments Receivable 109 12,560 Interest Receivable 20,976 3,379 2,8 16 8,680 Interfund Loan Receivable 23,000 Dllc From Other Funds 39,593 85,702 Due From Other Governmental Units 4, 112,592 566,142 2,061 ,364 539,300 Long-Tenn Notes Receivable 3,632,781
Total Assets $ 16,999,870 $ 5,664,83 1 $ 5,964,709 $ 16,8 11 ,933
LIABILITIES AND FUND BALANCES Liabi li ties AccountsIVouchers Payable $ 460,270 $ 535,206 $ 326,994 $ 8,928 Contracts Payable 81, 19 1 Due To Other Funds 25,798 14,626 85,702 Due To Other Governmental Units 1,864,429 Accrued Wages Payable 3, 144,5 17 878,945 671,848 Accru ed Employee Benefits 252,756 102,466 41,728 Custodial Accounts 23,575 Customer Deposits 8,906 1,200 Unearned Revenue 229, 190 Intcrfund Loans Payable
Total Liabilities $ 4,12 1,437 $ 1,637,209 $ 2,904,999 $ 94,630
De/erred Inflows of Resources Unavai lable revenue- taxes 4,375,339 548,434 294,802 Unavai lab le revenue-special assessments Unavai lable revenue-other fees
Total deferred inflows of resources $ 4,375,339 $ 548,434 $ $ 294,802
Fund Balance Nonspendable 47,885 390 10,650 3,632,781 Restricted 286,23 1 3,478,798 12,789,720 Committed 762,485 Assigned 925,690 3,049,060 Unass igned 6,480,803 Total Fund Balance $ 8,503,094 $ 3,479, 188 $ 3,059,710 $ 16,422,50 I
Total liabili ties, deferred inflows of resources and fund balances $ 16,999,870 $ 5,664,83 1 $ 5,964,709 $ 16,8 11 ,933
See accompanying notes to the financial statements 26

YAKIMA COUNTY, WASHINGTON Page 2 of2
Balance Sheet Governmen ta l Funds December 31,2013
Department Community District Other of Services Court Governmental
ASSETS Correct ions Prosram Probation Funds Total Cash/Cash Equivalents $ 135,516 $ 2,034,307 $ 324,407 $ 6,7 14,536 $ 23,687,800 In vestments 2,151,272 2,054,372 13,24 1,807 33,006,157 Taxes Receivable 14,305 96,638 1,755,057 Accounts Receivab le Net 11 ,513,785 2 1,708 14,185,988 Assessments Receivable 125,075 137,744 Interest Receivable 1,5 19 2,6 10 11 ,975 5 1,955 Intcrfund Loan Receivable 23,000 Due From Other Funds 624,782 750,077 Due From Other Governmental Un its 1,082,278 564,776 2,923,438 11 ,849,890 Long-Term Notes Receivable 3,632,78 1
Total Assets $ 3,370,585 $ 4,670,370 $ 11 ,838,192 $ 23,759,959 $ 89,080,449
LIABILITIES AND FUND BALANCES Liabili ties AccountsIVouchers Payable $ 169,385 $ 321 ,806 $ 3,527 $ 1,350,349 $ 3, 176,465 Contracts Payable 79, 153 160,344 Due To Other funds 229,606 413,577 769,309 Due To Other Governmental Units 384,760 484,898 2,734,087 Accrued Wages Payable 1,425,54 1 58, 144 127,729 899,851 7,206,575 Accrued Employee Benefits 97,443 6,748 7,683 59,683 568,507 Custodial Accounts 23 ,575 Customer Deposi ts 10,106 Unearn ed Revenue 457 472,324 70 1,97 1 Intcrfund Loans Payable 45,500 45,500
Total Liabili ties $ 1,921,975 $ 77 1,915 $ 138,939 $ 3,805,335 $ 15,396,439
Deferred Inflows of Resources Unavailable revenue- taxes 16,249 859,399 6,094,223 Unavailable revenue-special assessments 125,339 125,339 Unavailable revenue-other fees 11 ,507,480 11,507,480
TOlal deferred innows of resources $ $ 16,249 $ 11 ,507,480 $ 984,738 $ 17,727,042
Fund Balance Nonspendable 175 3,000 3,694,881 Restricted 194,527 2,898,737 191 ,598 9,336, 146 29,175,757 Committed 953,797 1,7 16,282 Assigned 1,254,083 983,469 8,676,943 14,889,245 Unassigned 6,480,803
Total Fund Balance $ 1,448,6 10 $ 3,882,206 $ 191,773 $ 18,969,886 $ 55,956,968
TOlalliabilities, deferred innows of resources and fund balances $ 3,370,585 $ 4,670,370 $ 11 ,838, 192 $ 23,759,959 $ 89,080,449
See accompanying notes to the financial sta tements 27
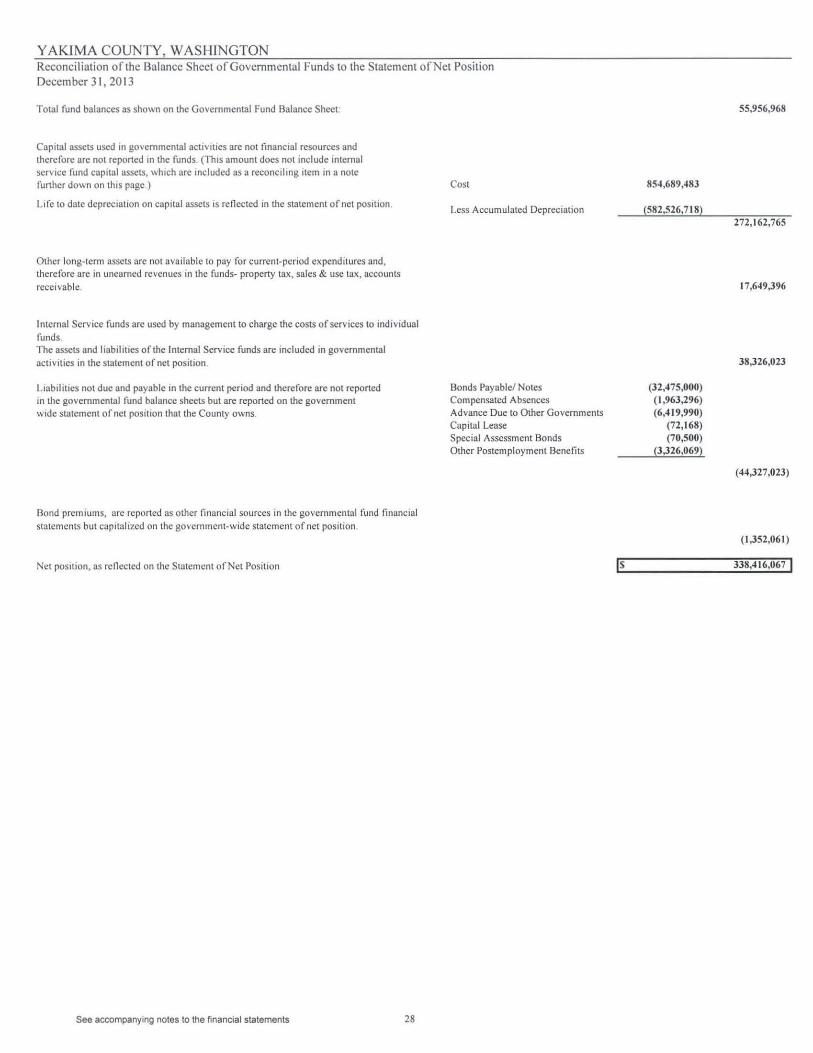
YAKJMA COUNTY, WASHINGTON Reconciliat ion of the Balance Sheet ofGovemmcntal Funds to the Statement orNet Position December 31, 2013
TOlal fund balances as shown on the Governmental Fund Balance Sheet:
Capital assets used in governmental activities are nol financial resources and therefore arc not reported In the funds . (This amount does not include internal servIce fund capital assets, which are mcluded as a reconcIling Item in a notc further down on this page)
Life to date deprccllltion on capital assets is reflected in the statement of net position.
Other long-tcnn assets arc not avai lable to pay for current-period expenditures and, therefore are in unearned revenues in the funds- property lax, sales & use tux, accounts receivable.
Intemal Service funds are used by management to charge the costs of services to individual funds . The assets and liabilities of the Internal Service funds are included in governmental activities in the statement of net position.
Liabi lities not due and payable in the current period and therefore arc not reponed In the governmental fund balance sheets but are reported on the government wide statement ofnel position that the County owns.
Bond premiums, arc reported as olher linancial sources in the governmen tal fund linancial statements but capitalized on the government-wide statement of net position.
Net paslIion, as rcOccted on the Statement of Net Position
See accompanying notes to the financial statements 28
Cost
Less Accumulated Depreciation
Bonds Payable! Notes Compensated Absences Advance Due to Other Governments Capital Lease Special Assessment Bonds Other Postemployment Benefits
Is
854,689,483
(582,526,7 18)
(32,475,000) ( 1,963,296) (6,4 19,990)
(72 ,168) (70,500)
(3,326,069)
55,956,968
272 ,162,765
17,649,396
38,326,023
(44,327.023)
(1,352.061 )
338,416,067 I

Y AKlMA COUNTY, WASHINGTON Page I of2
Statement of Revenues, Expenditures, and Changes in Fund Balance
Governmental Funds
For the Year Ended December 31,2013 Major Funds
Aging and
General County Long-Term
Revenues Fund Roads Care
Property Taxes $ 25,319,390 $ 10,308,929 $
Sales and Use Taxes 10,758,448
Other Taxes 164,688 49,268
Licenses and Permits 340,357 39,073
Intergovernmental 8, II 0,550 10,000,448 10,408,637
Charges for Services 7,584,387 351,573 271,589
Fines and Forfeits 2,735,757
Interest Earnings 1,318,145 17,050 28,626
Special Assessments 1,320 1,333
Donations 17,115 41,030
Other Revenues 118,663 38,616 19, 151
Total Revenues 56,468,820 20,806,290 10,769,033
Expenditures
Current:
General Governmental Services $ 15 ,009,355 $ 200,669 $
Judicial 7,237,019
Public Safety 13 ,543,628
Physical Environment 191 ,170
Transportation 14,408 12,527,667
Economic Environment 1,497,661
Health and Human Services 125,000 10,243,375
Culture and Recreation 236,493
Debt Service:
Principal 891,227
Interest 62,163
Capital Outlay 149,161 5,707,515 10,254
Total Expenditures 38,003,895 19,389,24 1 10,253,629
Excess (Deficit) Revenues Over Expenditures 18,464,925 1,4 17,049 515,404
Other Financing Sources LUsesl
Transfers In 530,691 242,935
Transfers Out (18,830,430) (14,667)
Intergovernmental Payments (80,086)
Capital Lease 33,283
Comp Loss on Capital Assets 50
Total Other Financing Source (Uses) (18,266,406) 148,182 ° Net Change in Fund Balance 198,5 19 1,565,23 1 515,404
Fund Balances-Beginning 8,304,575 1,913,957 2,544,306
Fund Balances-Ending $ 8,503,094 $ 3,479,188 $ 3,059,710
Sec accompanying notes to the financial statements 29

Page 2of2
Major Funds Support Invest Department Community District Other
In Economic of Services Court Governmental Diversification Corrections Program Probation Funds Total
$ $ $ 3 17,64 1 $ $ 1,880,661 $ 37,826,62 1
3,069,646 2,527,083 6,085,463 22,440,640
398 2,676,551 2,890,905
3 1,970 4 11 ,400
172,863 2,164,075 6,308,207 37,164,780
7,090,367 33 ,500 1,576,856 2,0 10,483 18,9 18,755
33,876 2,769,633
176,147 6,818 20,878 2 14,008 1,78 1,672
995, 13 1 997,784
15,826 73,971
325 ,000 613,360 11 ,479 157, 189 1,283,458
3,570,793 7,883,408 5,063,575 1,588,335 20,409,365 126,559,6 19
$ $ $ $ $ 4,494,575 $ 19,704,599
1,434,872 8,67 1,89 1
20,352,050 1,524,897 4,660,426 40,08 1,00 1
2,343,246 2,534,4 16
808 12,542,883
700,896 2,698,499 4,897,056
5,447,847 3,037,816 18,854,038
160,67 1 397,164
2,778,495 3,669,722
1,160,466 1,222,629
28, 195 3,283 ,568 9,178,693
700,896 20,3 80,245 5,447,847 1,524,897 26,053,442 12 1,754,092
2,869,897 ( 12,496,837) (384,272) 63,438 (5,644,077) 4,805,527
16,476,646 7,3 16,880 24,567, 152
(334,794) (2,708, 129) (2 10,755) ( 1,548,086) (23 ,646,86 1 )
(80,086)
4 1,560 74,843
50
(334,794) 13 ,8 10,077 (2 10,755) 0 5,768,794 915,098
2,535, 103 1,3 13,240 (595,027) 63,438 124,717 5,720,625
13,887,398 135,370 4,477,233 128,335 18,845, 169 50,236,343
$ 16,422,501 $ 1,448,6 10 $ 3,882,206 $ 19 1,773 $ 18,969,886 $ 55 ,956,968
See accompanying notes to the financial statements 30

YAKIMA COUNTY, WASHINGTON Reconciliation oflhe Statement of Rcvcnues, Expenditures and Changes in Fund Balances of
Governmental Funds to the Statement of Activities
For the Year Ended December 31 . 2013
presented in 10000J
Nel change in fund balances as shown on Governmental Funds Statement of Revenues,
Expenditures. and Changes in Fund Balance:
Governmental funds report capital outlays as expenditures However, in the statement
of activities, the cost oflhcse assets is allocated over their estimated useful lives and reported as depreciation expense. This is the amount by which capital outlays
exceeded depreciation expense in the current period,
Internal service fund expenses are allocated to other funds . The net expense is
reponed in the governmental activities Statement of Activities.
Revenues in the statement ofaclivilies Ihal do not provide current financial resources are not reported as revenues in the funds .
Repayment oflong term debt principal is an expenditure in the governmental funds,
but the repayment includes long lerm liabilities in the statement ofnci assets on nel assets. This entry is the nCI effect of these differences in Ihe treatment oflong.tcrm debt issuance and payments.
The issuance of new debt is reported as an other financing sources on the governmental fund's operating statements but reported as a liability on the government
-wide statement of ncl posi tion.
Special Assessment rcvenues in tnc government wide statement of activi ties do not
provide currentlinancial resources and are not reponed as revenues in tne governmental fund operating statement.
Otner postemployment cxpenses are reponed in tne governmenHNide statement of activities, but do not require tne use of current financ ial resources and thcrefore are
not reponed as expenditures in governmental funds.
Accrued Interest is reponed in tnc government-wide statement of activities, but do not require the use of current linancial resources and therefore arc not reponed as
expenditures in governmental funds.
Compensated absences are reponed in the government-wide statement of activities,
but do not require the usc of current fi nancial resources and therefore are not reponcd
as expenditures in governmental funds.
Deferred Revenues in the government wide statements of activities do not provide
current financial resources. Government-wide statements record revenues at Inc time tney arc earned.
Change in net position. as reflected on the Statement of Activi ties.
Depreciation Expense
Capital Outlay
Disposal & Deletions to Capital Assets
Special Assessment Payments
31
(17,407)
9, 179
(',06')
s 5,721
(13,294)
(1,451)
1,012
3,649
(75)
1I
(262)
( 132)
(461)
3,488
( I ,785) J

YAKIMA COUNTY, WASHINGTON Statement of Net Position Proprietary Funds December 31, 20 13 Governmental
Activities Internal
Solid Public Services Building and Service ASSETS Waste Utilities Fire Safc~ Total Funds Current Assets
Cash/Cash Equivalents $ 205,643 $ 287,417 $ 348,639 $ 84 1,699 $ 7,3 16,274 Investments 2 1,465, 139 1,850,442 210,031 23,525,6 12 14,916,070 Accounts Receivable 411 ,8 16 139,745 12,7 14 564,275 14,409 Intcrest Receivable 15,441 1,558 377 17,376 12,048 Interfund Loans Receivable 22,500 Due From Olher Funds 1,709 6,894 8,603 244,232 Due fro l11 Other Governmental Un its 257,987 257,987 31,278 In ven toriesiPrepaym cots 2,078,270
TOlal Cu rrent Assets 22,357,735 2,286,056 571,76 1 25,215,552 24,635,08 1
Noncurrent Assets Long-Term Intcrfund Loans Receivable 592,543 Capital Assets
Land 3,703,68 1 97,528 3,80 1,209 452,306 Buildings 9,548,954 996, 128 10,545,082 5,538,204 Improvements Other Than Buildings 6,354,236 13,918,467 20,272,703 404,457 Machinery and Equipment 7 17,488 31,606 25,276 774,370 25,964, 150
Less Accumulated Depreciation (6,7 13,963) (6,5 10,156) (25,276) ( 13,249,395) (16,576,623) Construction In Progress 6,907,462 86,750 6,994,2 12 375,309
Total Noncurrent Assets 20,517,858 8,620,323 ° 29,138,181 16,750,346
Total Assets $ 42,875,593 $ 10,906,379 $ 571 ,761 $ 54,353,733 $ 41 ,385,427
LIABILITIES AND FUND EQUITY Current Liabilities
AccountsIVouchcrs Payable $ 431,633 $ 45,036 $ 1,992 $ 478,66 1 $ 994,880 Contracts Payable 263,403 263,403 47,229 Due To Other Funds 233,603 Accrued Wages Payable 258,874 66, 161 168,725 493,760 838,726
Accrued Employee Benefits 18,037 3,974 18,474 40,485 74,255
Accrued Taxes Payable 439 439
Customer Depos its Current Portion of Closure Post Closure Care 12,8 12 12,8 12
Current Portion of Long Tcnn Obligat ions 351 ,419 4,758 7,708 363,885 33,380 Total Current Liabilities 1,336,617 119,929 196,899 1,653,445 2,222,073
Noncurrent Liabilities Compensated Absences 83,740 12,945 56,524 153,209 244,788 Notes and Loans Payable 85,847 85,847 592,543 Other Liabiltics 120,040 120,040 G.O. Bonds Payab le 3,075,000 3,075,000 Landfill Closure and Postclosure Care 9,977,704 9,977,704 Total Noncurrent Liabilities 13, 136,444 218,832 56,524 13,41 1,800 837,33 1
Total Liabi lities 14,473,06 1 338,76 1 253,423 15,065,245 3,059,404 Net Pos it ion
Net In vestment in Capital Assets 17,102,858 8,531 ,483 25,634,34 1 15,565,260 Unrestricted 11 ,299,674 2,036,135 3 18,338 13,654, 147 22,760,763 Total Net Posit ion $ 28,402,532 $ 10,567,6 18 $ 3 18,338 $ 39,288,488 $ 38,326,023
See accompanying notes to the financial statements 32
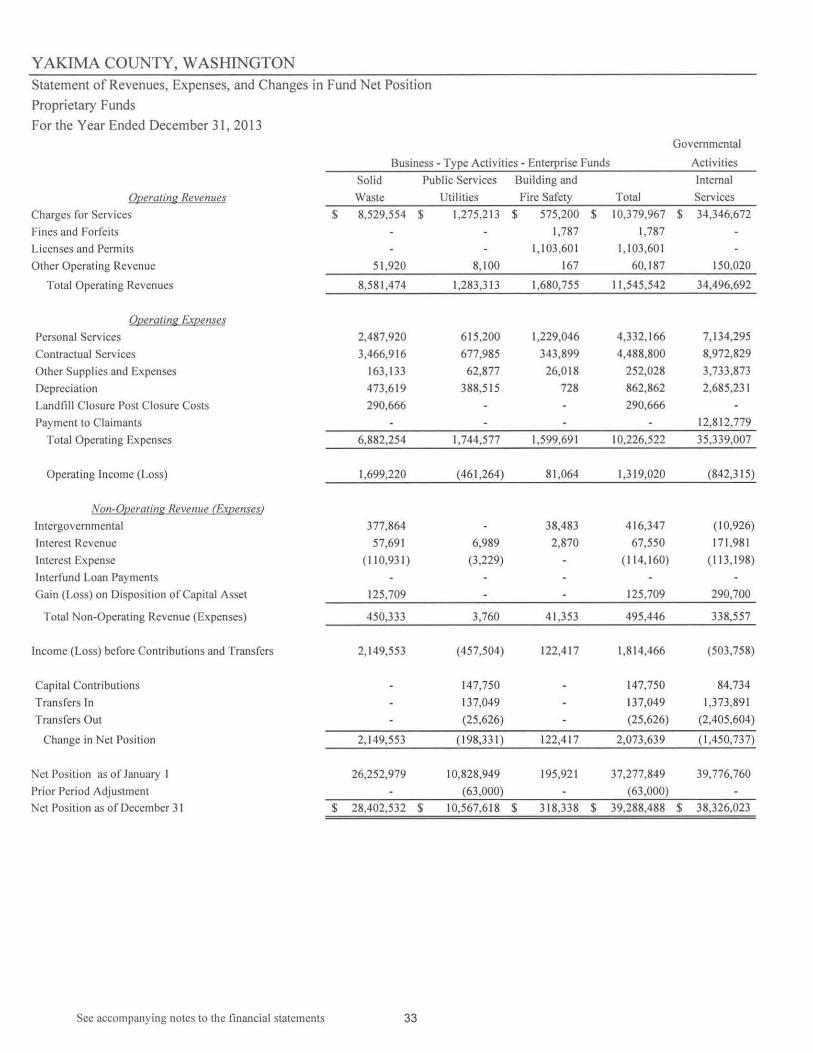
YAKIMA COUNTY, WASHINGTON Statement of Revenues, Expenses, and Changes in Fund Net Position
Proprietary Funds
For the Year Ended December 31 , 2013 Governmental
Business - Type Activities - Enterprise Funds Activities
Solid Public Services Building and Internal Of2era(in~ Revenues Waste Utilities Fire Sarety Total Services
Charges for Services $ 8,529,554 $ 1,275,21 3 $ 575,200 $ 10,379,967 $ 34,346,672
Fines and Forfeits 1,787 1,787
Licenses and Permits 1, 103 ,60 1 1, 103,60 1
Other Operating Revenue 5 1,920 8,100 167 60,187 150,020
Total Operating Revenues 8,581 ,474 1,283,313 1,680,755 11 ,545,542 34,496,692
Oeerating E.xeenses
Personal Services 2,487,920 6 15,200 1,229,046 4,332, 166 7,134,295
Contractual Services 3,466,916 677,985 343,899 4,488,800 8,972,829
Other Supplies and Expenses 163,133 62,877 26,0 18 252,028 3,733,873
Depreciation 473,6 19 388,515 728 862,862 2,685,23 1
Landfill Closure Post Closure Costs 290,666 290,666
Payment to Claimants 12,812,779
Total Operating Expenses 6,882,254 1,744,577 1,599,691 10,226,522 35,339,007
Operating Income (Loss) 1,699,220 (461,264) 81 ,064 1,319,020 (842,3 15)
NOIl-Oeerating Neve/me (Expenses)
In tergovernmental 377,864 38,483 4 16,347 (10,926)
Interest Revenue 57,69 1 6,989 2,870 67,550 171,981
Interest Expense ( 110,931) (3,229) ( 11 4,160) (11 3,198)
Interfund Loan Payments Gain (Loss) on Disposition of Capital Asset 125,709 125,709 290,700
Total Non·Operating Revenue (Expenses) 450,333 3,760 41 ,353 495,446 338,557
Income (Loss) before Contributions and Transfers 2, 149,553 (457,504) 122,4 17 1,8 14,466 (503,758)
Capital Contr ibut ions 147,750 147,750 84,734
Transfers In 137,049 137,049 1,373,891
Transfers Out (25,626) (25,626) (2,405,604)
Change in Net Position 2,149,553 ( 198,33 1) 122,417 2,073,639 (1,450,737)
Net Pos ition as of January I 26,252,979 10,828,949 195,921 37,277,849 39,776,760
Prior Period Adjustment (63,000) (63,000)
Net Pos ition as of December 31 $ 28,402,532 $ 10,567,6 18 $ 3 18,338 $ 39,288,488 $ 38,326,023
See accompanying notes to the financial statements 33

Y AKlMA COUNTY, WASHINGTON Page I of2
Statement of Cash Flows
Proprietary Funds
For the Year Ended December 3 I , 2013 Governmental
Business - Type Activ ities - Enterprise Funds Activ ities
Solid Public Services Building and Internal
Waste Util ities Fire Safety Total Services
Cash Flows Froll! Op~ralit/!:. Activities:
Recei pts from Customers $ 8,463,640 $ 1,246,3 12 $ 1,686,4 10 $ 11 ,396,362 $ 696,480
Receipts from Inteffuod Services Provided 27,895 9,054 36,949 33,567,879
Payments \0 Employees (2,448, 178) (606,776) ( 1, 195,258) (4,250,212) (7,237,3 17)
Payments 10 Suppliers (558,065) (474,649) (55,799) (1,088,5 13) (24,595,997)
Payments for Intcrfund Services Used (2,758,150) (263,896) (3 13,3 17) (3,335,363) ( 1,552,270)
Net cash provided (used) by operating activities 2,727, 142 (99,009) 13 1,090 2,759,223 878,775
Cash Fls!.I1'~ UQftI t:!..fl!1f1B2.ilal FI"a"cin~ Activities:
Opel"'"dting Grants Received 377,864 377,864
MiscellaneOus Non Operating 38,483 38,483
Transfers from Other Funds 137,049 137,049 1,373,891
Transfers to Other Funds (25,626) (25,626) (2,405,604)
Disbursement for loans 2 12,8 19
Payments of Intcrfund Loan Interest! Principal 23,725 23,725
Nel cash provided (used) by noncapital fi nancing activities 377,864 135, 148 38,483 55 1,495 (8 18,894)
C.ash Flows FrQfII 'apila/ dud Related Financj,l~ Aflivities
Purchases of capital assets (4,4 11 ,807) (33,832) (4,445,639) (2,267,843)
Proceeds from Sale ofCapilal Assets 1,000,000 1,000,000 462,223
Capital Contributions- Private 147,750 147,750
Principal Paid on Capital Debt (330,000) (23,220) (353,220) 2 11 ,758
Interest Paid on Capital Debt (110,93 1) (2,954) ( 113,885) ( 11 3, 198)
Net cash provided (used) by capilal and relaled financing activities (3,852,738) 87,744 0 (3,764,994) (1,707,060)
Cgsh FIQw~ FrQfII Inv~~(in~ Ac(i\'i(ie~:
Interest Received 56,807 6,696 2,7 10 66,2 13 171,643
Proceeds rrom Loan Principal Recei ved 222,922
Net Cash Provided by Investing Activi ties 56,807 6,696 2,710 66,2 13 394,565
Net Increase in Cash & Cash Equivalents (690,925) 130,579 172,283 (388,063) (1,252,6 14)
22,36 1,707 2,007,279 386,387 24,755,373 23,484,957 Balances as or January I
Balances as or December 31 S 21,670,782 $ 2,137,858 $ 558,670 S 24,367,3 10 $ 22,232,343
See accompanying notes to the financial statements 34

YAKIMA COUNTY, WASHINGTON Statement of Cash Flows
Proprietary Funds
For the Year Ended December 31,2013
Business - Type Activities - Enterprise Funds
Sol id Public Services Building and
Page2of2
Governmental Activities
Waste Utilities Fire Safety Total
Internal
Services Reconciliation o(Qperating Income O~QssJ 10 Net Cash Provided bv O()erating ActiYjres
Operating Income/( Loss)
Adjustments 10 Reconcile Operating Income 10
Net Cash Provided by Operating Activities:
Deprec iation Expense
Landfill Closure Postclosure Costs Changes in assels and liabilities:
Receivables, net
Inventories
Accrued Expenses
AccounlS and Other Payables
Net Cash Provided by Operating Activities
$
$
Noncash Invest ing Capital and Financing Acti vit ies
Gain (Loss) on disposal of capital assets
Capital Contributions
$
1,699,220 $
473,6 19
290,666
(89,939)
39,742
3 13,834
2,727,142 $
$
(46 1,264) $
388,5 15
(37,00 1)
8,424
2,317
(99,009) $
$
81 ,064 $
728
14,709
33,788
80 1
131 ,090 $
$
Cash Balances on the Statement of Cash Flows is Comprised of the Following:
Business - Type Acti vities - Enterprise Funds
Solid Public Services Bui lding and
Waste Utilities Fire Safety
Cash/Cash Equ ivalents, per Statement of Net Assets $ 205,643 $ 287,417 $ 348,639 $
In vestments, per Statement of Net Assets 21,465,139 1,850,442 210,031
Balances as of December 3 1 $ 21 ,670,782 $ 2,137,859 $ 558,670 $
See accompanying notes to the financial statements 35
1,3 19,020 $
862,862
290,666
( 11 2,231)
81 ,954
316,952
2,759,223 $
$
(842,3 15)
2,685,231
(232,333)
(4 14,684)
(306, 199)
889,700
290,700
84,734
Governmental
Activities
Internal
Total Services
841 ,699 $ 7,3 16,274
23,525,612 14,9 16,070
24,367,3 11 $ 22,232,343

Y AKlMA COUNTY, WASHINGTON Statement of Fiduciary Net Position Fiduciary Funds December 31 , 2013 (amounts presented in 1,000's)
ASSETS Cash, Cash Equivalents and Pooled Investments Individual Non-Pooled Investments
Receivables: Taxes Receivable Accounts Receivable Special Assessments Receivable Due from Other Governments
Investments, at Fair Value: US treasury state and local government
Total Pooled Investments Total Assets
DEFERRED OUTFLOWS of RESOURCES
LIABILITIES Warrants Payable AccountsNouchers Payable Due to Other Goverments Accrued Liabilities
Total liabilities
DEFERRED INFLOWS of RESOURCES
NET POSITION Held in Trust for Pool and Non-Pool participants
$
$ $
$
$
The notes to financial statements are an integral part of this statement.
36
Investment Trust Funds
2,300
175,537 175,537 177,837
$
$
o $
177,837 $
Agency Funds
34,717
6,375 20
397 6,576
0 48,085
24,254 496
17,899 5,436
48,085
0

YAKIMA COUNTY, WASHINGTON Statement of Changes in Fiduciary Net Position Fiduciary Funds Year Ended December 31 , 2013 (amounts presented in 1,000's)
ADDITIONS Contributions
Additons by Pool participants Additons by Non-Pool participants
Total Contributions
Investment Earnings Net change in Fair Value of Investments Pooled Net change in Fair Value of Investments Non- Pooled
Total Investment Earnings Total Additions
DEDUCTIONS Payments in accordance with trust agreements Distributions to Pool participants Distributions to Non-Pool participants
Total Deductions
CHANGE in NET POSITION
Net Position-Beginning of the Year Net Position-End of the Year
The notes to financial statements are an integral part of this statement.
37
$
Investment Trust Funds
247,417 1,218
248,635
(1 ,220) ( 174)
(1 ,394)
$ ===2;,,4;,;,7~,2~4 I;,.,
310,041
310,041
(62,800)
240,637
$ ==.,.;,;17,;.7~,8;,;3 7=

YAKIMA COUNTY, WASHINGTON Notes to the Financial Statements
Index
NOTE I - SUMMARY OF SIGNIFICANT ACCOUNTING POLICIES ............................... 39
A. Reporting Entity ...................................................••.•...•.••.••....•..•..•.....•.••.••..•.......••..•.......... 39 B. Government-Wide and Fund Financial Statements ............................................................ 39 C. Measurement Focus, Basis of Accounting, and Financial Statement Presentation ............ 40 D. Assets, Liabilities and Net Position or Equity ...............•................................................... 42
NOTE D - STEWARDSHIP, COMPLIANCE AND ACCOUNTABILITY ..........•......•....•• .45
A. Budgetary Information .•.••.............•.•.................................................................................. 45
NOTE ill - DETAILED NOTES ON ALL FUNDS ................................................................ 45
A. Deposits and Investments ..................................................................•...•.....•.....•..•..•..•....... 45 B. Property Taxes ............................................................••.•.....•.....•..............•..•.....•..•.•••......... 49 C. Receivables ......................................................................................................................... 50 D. Interfund Receivables, Payables and Transfers .................................................................. 51 E. Capital Assets ............................•........................................................................................ 53 F. Fund Balance .......•....................•..•..•.................................................................................. 55
NOTE IV -DEBT ........................................................................................................................ 55
A. Advance Due to Other Governments .........................•...•............................•....................... 56 B. Special Assessment Bonds .................................................................................................. 57 C. General Obligation Bonds .......................................•.........•......................•..•....................... 58 D. General Obligation Note ..................................................................................................... 59 E. Capital Leases ................................................................................................•.....••............. 59 F. Changes in Long-Term Liabilities ................................................................................•..•.. 60
NOTE V - PENSION PLANS ........................................•........•........•..•..•........•..•...........•........... 60
A. Public Employees' Retirement System (pERS & IBM) Planl. 2 and 3 ............................. 61 B. Law Enforcement Officers' & Fire Fighters' Retirement System (LEOFF) Plans I & 2 .. 64 C. Public Safety Employees' Retirement System (PSERS) Plan 2 .............•...•........•.............. 67 D. Other Post Retirement Plans (OPEB) ........................•...•.•..•.••.................•..•....................... 69
NOTE VI - RISK MANAGEMENT ...................................•..................................................... 71
A. Liability Insurance ..••..••.••..•......•...........•............................................................................. 71 B. Other Insurance .................................•..........•..................................................................... 73
NOTE VD - CONTINGENT LIABILITIES ............................................................................ 74
NOTE vm - JOINT VENTURE ................•............................................................................. 74
NOTE IX - OTHER DISCLOSURES ......•................................................................................ 74
A. Prior Period Adjustments ..............................................................................•..................... 74 B. Related Parties ..............................................................................•............•........•............... 74 C. Solid Waste Landfill Closure and Post-Closure Costs ........................................................ 75 D. Subsequent Events ......•..•......•............•.........................................................................•..•... 75
38

YAKIMA COUNTY, WASHINGTON Notes to the Financial Statements
For the Year Ended December 31, 2013
I. SUMMARY OF SIGNIFICANT ACCOUNTING POLICIES
The fInancial statements of Yakima County have been prepared in confonnity with generally accepted accounting principles (GAAP), as applied to government units. The Governmental Accounting Standards Board (GASB) is the accepted standard setting body for establishing governmental accounting and fInancial reporting principles. The chart of accounts conforms to the Budgeting, Accounting, and Reporting Systems (BARS) prescribed by the offIce of the State Auditor, to promote unifonnity among the cities and counties of Washington resulting in better comparability. The signifIcant accounting policies are described below.
A. Reporting Entitv
Yakima County, a fust-class county, was incorporated on January 21 , 1865, under the authority of the Revised Code of Washington 36.04.390. The County operates under a commissioner form of government and provides the following services to its constituents: police, road maintenance, solid waste management, planning and zoning, parks and recreation, judicial administration, health, social services, and general administrative services. As required by GAAP, the fmancial statements present Yakima County, the primary government.
B. Government-Wide and Fund Financial Statements
Government-wide fmancial statements consist of the statement of net position and the statement of activities. These statements report information on all of the non-fIduciary activities of the primary government. For the most part, the effect of interfund activity has been removed from these statements. However, internal activity in the government-wide statement of activities for interfund services provided is not eliminated in the process of consolidation. Governmental activities, which normally are supported by taxes and intergovernmental revenues, are reported separate from businesstype activities, which rely to a signifIcant extent on fees and charges for support.
The statement of activities demonstrates the degree to which the expenses of a given function or segment are offset by program revenues. Direct expenses are those that are clearly identifIable with a specifIc function or segment. Additionally, the County's accounting system automatically allocates a portion of its indirect costs to individual functions. These indirect costs have been included as part of the program expenses reported for the various functional activities.
Program revenue includes: • Charges to customers for applicants who purchase, use, or directly benefIt from goods, se[Vlces or
privileges provided by a given function or segment. • Grants and contributions restricted to meeting the operation or capital requirements of a particular
function or segment.
Taxes and other items not properly included among program revenues are reported instead as general revenues.
Fund fmancial statements are used to report additional and more detailed information about the primary government. Separate fInancial statements are provided for governmental funds, proprietary funds even though the latter are excluded from the government-wide fInancial statements. The fIduciary funds are omitted from the government-wide fInancial statements. Major individual governmental funds and major individual enterprise funds are reported as separate columns in the fund fInancial statements.
39

C. Measurement Focus, Basis of Accounting, and Financial Statement Presentation
The government-wide financial statements are prepared using the economic resources measurement focus and the accrual basis of accounting, as are the proprietary fund and fiduciary fund fmancial statements. Fiduciary Funds are not presented in the government wide financial statements. Under the economic resources measurement focus, revenues are recorded when earned and expenses are recorded at the time habilities are incurred, regardless of the timing of related cash flows. Property taxes are recognized as revenues in the year for which they are levied. Grants and similar items are recognized as revenue as soon as all ehgibility requirements imposed by the provider have been met.
All governmental funds are presented using the flow of "current fmancial resources" measurement focus and the modified accrual basis of accounting. Revenues are recognized as soon as they are both measurable and available. Revenues are considered to be available when they are collectible within the current period or as soon thereafter to pay liabilities of the current period. For this purpose, the government considers revenues to be available if they are collected within 60 days of the end of the fiscal period. Revenues susceptible to accrual are earned interest, certain charges for services, and intergovernmental revenues, such as grants, where program expenditures are the prime factor for determining reimbursement. Other revenues such as sales based taxes, licenses, fines and fees are not considered susceptible for accrual since they are not generally measurable until received. Expenditures are generally recorded when the related fund liability is incurred, as under accrual accounting. However, debt service expenditures, as well as expenditures related to compensated absences and claims and judgments, are recorded only when payment is due.
Property taxes, license and interest associated within the current period are all considered to be susceptible to accrual and so have been recognized as revenue of the current fiscal period. Only the portion of special assessment receivable due within the current fiscal period is considered to be susceptible to accrual as revenue of the current period. All other revenue items are considered to be measurable and available only when cash is received by the County.
Yakima County reports the following major governmental funds: o The General Fund is the County's primary operating fund. It is used to account for all activities of the general
government that are not accounted for in another fund. o The County Road Fund accounts for the design, construction, and maintenance of County roads. Revenue is from
property taxes, and intergovernmental gas tax allocations. The County Road also receives grants from the Federal Highway Administration Board.
o The Aging and Long-Term Care Fund accounts for the administration and direct programs of State and Federal grants intended to provide assistance to the elderly.
o The Support Investment in Economic Diversification Fund (SlED) accounts for the .08% sales tax collected as a credit against the State of Washington's sales tax to assist local government infrastructure and economic development.
o The Department of Corrections is responsible for the custody, security and management of pretrial and convicted persons. Revenue source is from jurisdictions that house prisoners at the County.
o The Community Services is responsible for the administrative functions of planning, program development, funding, and coordination of services in the areas of mental health, developmental disabilities, chemical dependency and prevention activities, and administers the Veteran's Relief Fund, as provided in RCW 73.08. Revenue source is from Mental Health allocation from the Regional State Network and numerous state and federal grants.
o The District Court Probation provides District Court and Superior Courts with sentencing investigation, client supervision and community service placement for defendants with misdemeanor and gross misdemeanor cases. Revenue source is from fees generated by defendants in the program.
The County reports three major proprietary funds: o The Solid Waste Fund accounts for the provision of solid waste and landfill services to the residents of the
County. o The Public Services Utility Fund accounts for the provision of water and sewer services to residents of
unincorporated areas of the County. o The Building and Fire Safety Fund accounts for the building and plumbing permits and fire life safety program to
residents in the unincorporated areas of the County.
40

Additionally, the County reports the following fund types: • Internal Service Funds account for equipment rental and fleet services, purchasing services, liability insurance,
building maintenance, retirement benefits reserves, technology services support, and an in-house print shop provided to other departments or agencies of the government, or to other governments on a cost reimbursement basis.
• Debt Service Funds account for resources set aside to meet current and future payment requirements on general long-term debt.
• Capital Project Funds accounts for financial resources to be used for acquisition or construction of capital facilities or improvements. The separate accounting enhances an understanding of government' s capital activities and avoids the distortions in financial trend analysis. Investment/Fiduciary Funds account for external pooled and non-pooled investments held by the County Treasurer on behalf of external pool participants in the County' s investment program. Pooled money is invested in a monitored account by the County and external participants are generally governmental entities that do not have their own treasurer, such as fire and school districts.
• Agency Funds are custodial in nature and do not present results of operations. These funds account for assets that the County holds in a fiduciary capacity for other entities including school districts, fire districts, irrigation districts, port districts, diking and drainage districts, health district, sewer districts, soil conservation and mosquito districts, Emergency Management, Conference of Governments, Clean Air Authority, court and jail trust funds, cities, and the State of Washington.
As a general rule, the effect of interfund activity has been eliminated from the government-wide financial statements. Exceptions to this general rule are payments-in-lieu of taxes and other charges between the various other functions of the government. Elimination of these charges would distort the direct costs and program revenues reported for the various functions concerned.
Amounts reported as program revenues include a) charges to customers or applicants for goods, services or privileges provided, b) operating grants and contributions, and c) capital grants and contributions, including special assessments. Internally, dedicated resources are reported as general revenues rather than program revenues. Likewise, general revenues include all taxes.
Proprietary funds distinguish operating revenues and expenses from non-operating items. Operating revenues and expenses generally result from providing services and producing and delivering goods in connection with a proprietary fund's principal ongoing operations. The principal operating revenues of the solid waste, sanitary sewer, clean water system and permit center are charges to customers for sales and services. Operating expenses for enterprise funds and internal service funds include the cost of personal services, contractual services, other supplies and expenses, and depreciation on capital assets. All revenue and expenses not meeting this definition are reported as nonoperating revenues and expenses.
When both restricted and unrestricted resources are available for use, it is the government's policy to use restricted resources first, and then unrestricted resources, as they are needed.
41

D. Assets, Liabilities and Net Position or Equity
1. Cash and Cash Equivalents Only small amounts of cash in checking accounts and impressed accounts such as postage are recorded as cash on the financial statements. All demand deposits are recorded as investments. In the preparation of the statement of cash flows, cash and cash equivalents include not only "cash on hand," but cash with fiscal agent and cash in demand deposits with a maturity of three months or less. All deposits are stated at cost.
It is the County's policy to invest all cash surpluses. As of December 31 , 2013, the Treasurer was holding $42,689,962 in investments of surplus cash. This amount is classified on the balance sheet as cash and cash equivalents in various funds. The interest on these investments is credited to the General Fund, except where prohibited by statute or bond covenant.
2. Deposits and Investments - See Note III.
3. Receivables and Payables Activities between funds that are representative of lendinglborrowing arrangements at the end of the fiscal year are referred to as either "due to/from other funds" (i.e., the current portion of interfund loans). Any residual balances outstanding between the governmental activities and business-type activities are reported in the government-wide frnancial statements as "internal balances". Interfund balances between governmental funds and proprietary funds have been eliminated and were not included in the government-wide statement of net position.
Taxes Receivable consists of property taxes and related interest and penalties accumulated the previous four years. All real property taxes are secured by liens on the corresponding property.
Accounts Receivable consists of amounts owed from private individuals for goods or services. The significant sources are time payments on the courts and probation assessments. All receivables have been recorded net of estimated uncollectible amounts. Uncollectible court-related receivables are provided by the Administrator of the Courts in Olympia for Superior and District Court. Historically Superior Court collections are less than I % and District Court collections are 10% of total receivables. District Court Probation has recently been added to our fmancial data.
The County Public Services Department bills for all services that are provided by December 31. Therefore, there are no unbilled services at year-end for Enterprise Funds.
Assessments are recorded when levied with Assessments Receivable consist of current and delinquent assessments and related interest and penalties. Deferred assessments consist of unbilled special assessments that are liens against the property benefited.
Interest Receivable consists of amounts earned on investments at the end of the year and fair value changes.
4. Inventories and Prepavrnents
Inventory in the Governmental Funds consists of expendable supplies held for consumption. The cost is recorded as expenditure when consumed rather than when items are purchased. All inventories are valued by the first-in first-out method.
Inventories in the Equipment Rental and Revolving Fund are valued at average purchase price, while all other Proprietary Funds are valued at cost. Inventories are valued by the first-in first-out method.
Prepayments made for services that will benefit future periods are recorded as prepaid items in both governmentwide and fund fmancial statements.
5. Capital Assets
42

Capital assets include land, improvements to land, easements, buildings, building improvements, vehicles, machinery, equipment, infrastructure, and all other tangible or intangible assets that are used in operations and that have initial useful lives extending beyond a single reporting period. The County defines capital assets as assets with an initial, individual cost of more than $5,000 and an estimated useful life in excess of one year.
Infrastructure assets are long-lived assets that normally are stationary in nature and normally can be preserved for a significantly greater number of years than most capital assets. Examples of infrastructure include roads, bridges, drainage systems, water and sewer systems, and lighting systems.
When capital assets are purchased, they are capitalized and depreciated in the government-wide financial statements and the proprietary fund statements. Capital assets are recorded as expenditures of the current period in the government fund financial statements.
Capital assets are valued at cost where historical records are available and at an estimated historical cost where no records exist. Donated capital assets are valued at their estimated fair value on the date received.
Improvements to capital assets that materially add to the value or extend the life of the asset are capitalized. Other repairs and normal maintenance are not capitalized. Major outlays for capital assets and improvements are capitalized as projects are constructed. Interest incurred during the construction phase of capital assets of business-type activities is included as part of the capitalized value of the assets constructed.
Depreciation of buildings, equipment, vehicles, and improvements is computed using the straight-line method. Estimated useful lives are the lesser of the projects ' estimated lives or the following:
Buildings - 25 years Furniture & Equip - 10 years Information Systems & Intangibles- 7 years Data Handling Equip - 5 years Infrastructure - 10 to 50 years
Autos, Light Trucks - 90,000 miles Heavy Trucks - 6,000 to 14,000 hours
Land Improvements - 10 to 15 Years Fences - 10 Years
Machinery and equipment purchased on capital leases are treated as capital assets, indicating a constructive or actual transfer of the benefits and risks of ownership to the County, and are valued at the lesser of the fair value of the leased property or the net present value of the minimum lease payments required by the contract.
6. Compensated Absences The County has transitioned to a paid time off system (PTO) for combined sick and vacation time.
It is the County's policy to permit employees to accumulate earned but unused vacation, paid time off and sick leave benefits. All vacation pay and paid time off is accrued when incurred in the government-wide and proprietary fund financial statements. A liability for these amounts is reported in governmental funds only if they have matured, for example, as a result of employee resignations and retirements. The non-current portion for governmental funds is not reported in the governmental fund statements and represents a reconciling item between the fund and government-wide presentations.
At termination of employment, employees receive a cash payment for all accumulated paid time off and unused vacation time. Sick leave is payable to employees with required length of service and retirement age 25% of remaining sick leave at current wages, to a maximum of 120 days upon retirement or death.
7. Long-Term Obligations (See Note III and IV) - General Obligation bonds and other long term liabilities directly related to and fmanced from proprietary funds are accounted for in the respective proprietary funds . All other County long-term debt is reported in the governmental column of the government -wide statement of net position. Bond premiums are deferred and amortized over the life of the bonds using the straight line interest method. Bonds payable are reported net of the premium. Bond issuance costs are expensed as incurred. In the fund financial statements, governmental fund types recognize bond premiums, discounts, and issuance costs during the current period. The face amount of debt is reported as other financing sources. Premiums received on debt
43

issuance are reported as other fmancing sources while discounts on debt issuance are reported as other fmancing uses. Issuance cost is reported as debt service expenditures.
8. Accounting Change GASB 62 is the Codification of Accounting and Financial Reporting Guidance Contained in Pre-November 30, 1989 F ASB and AICP A Pronouncements. The Statement is intended to enhance the usefulness of its Codification by incorporating guidance that previously could only be found in certain Financial Accounting Standards Board (F ASB) and American Institute of Certified Public Accountants (AICPA) pronouncements. The Statement incorporates into the GASB's authoritative literature the applicable guidance previously presented in the following pronouncements issued before November 30, 1989:
I. F ASB Statements and Interpretations 2. Accounting Principles Board Opinions 3. Accounting Research Bulletins of the AICPA's Committee on Accounting Procedure.
By incorporating and maintaining this guidance in a single source, the Statement reduces the complexity of locating and using authoritative literature needed to prepare state and local govermnent financial reports. It improves financial reporting by eliminating the need for fmancial statement preparers and auditors to determine which F ASB and AICP A pronouncement provisions apply to state and local govermnents, thereby resulting in a more consistent application of relevant guidance in financial statements of state and local govermnents.
GASB 63 Financial Reporting of Deferred Outflows of Resources, Deferred Inflows of Resources, and Net Position.
This Statement changes the title and presentation of the "Statement of Assets" to the "Statement of Net Position" and provides (I) that deferred outflows should be reported in a separate section following assets, and (2) deferred inflows should be reported in a separate section following liabilities. The statement then arrives at net position which includes the net effects of assets, deferred outflows of resources, liabilities, and deferred inflows of resources.
In addition, the title of the "Statement of Activities" changes to the "Statement of Revenues, Expenses, and Changes in Net Position." By presenting deferrals separately from assets and liabilities, the statement of net position will provide users of goverrunental financial statements with information about transactions that have already occurred but should be recognized as revenues or expenses in future periods. In other words, it will provide users with information about how past transactions that are not assets or liabilities will continue to impact a government's financial statements in the future periods. The County 's Financial Statements reflect these changes.
GASB 65 Items Previously Reported as Assets and Liabilities (GASB 65), amends or supersedes the accounting and financial reporting guidance for certain items previously required to be reported as assets or liabilities. The objective is to either properly classifY certain items that were previously reported as assets and liabilities as deferred outflows of resources or deferred inflows of resources or recognize certain items that were previously reported as assets and liabilities as outflows of resources (expenses) or inflows of resources (revenues). The implementation of GASB 65 resulted in the write off of bond issuance costs and a restatement of 2012 Statement of Net Position, Long Term Debt liability and Statement of Revenues, Expenses, and Changes in Net Position
9. Fund Balance (See Note III) GASB 54 statement objective is to enhance the usefulness of fund balance information by providing clearer fund balance classifications that can be more consistently applied and by clarifYing the existing govermnental fund type definitions. This Statement establishes fund balance classifications that comprise a hierarchy based primarily on the extent to which a govermnent is bound to observe constraints imposed upon the use of the resources reported in govermnental funds. The classifications are nonspendable, restricted, committed, assigned, and unassigned.
44

II. STEWARDSHIP, COMPLIANCE AND ACCOUNT ABILITY
A. Budgetary Information
I. Scope of Budget The annual budget for Yakima COWIty is adopted in accordance with the provisions of the Revised Code of Washington (RCW), as interpreted by the Budgeting, Accounting, and Reporting System (BARS) of the State of Washington, and on a basis consistent with generally accepted accoWiting principles.
Annual appropriated budgets are adopted at the level of the fund, except in the General Fund, where expenditures may not exceed appropriations at the department level and the budgets constitute the legal authority for expenditures at that level. Subsidiary revenue and expenditure ledgers are used to compare the budgeted amounts with actual revenues and expenditures. As a management control device, the subsidiary ledgers monitor expenditures for individual functions and activities by object class. Appropriations for Governmental Funds lapse at year-end.
All governmental funds have legally adopted annual budgets except the CRID Guaranty Fund and the LID Guaranty Debt Service FWids.
2. Procedures for Adopting the Original Budget The COWlty 'S budget procedures are mandated by RCW 36.40. The steps in the budget process are as follows:
a. Prior to the first Tuesday in September, the elected officials and department managers submit to the Board of COWIty Commissioners a proposed operating budget for the following calendar year. The operating budget includes proposed revenues and expenditures.
b. The Commission conducts public hearings during November at the County courthouse to obtain taxpayer comments.
c. The Commission makes adjustments to the proposed budget and adopts, by resolution, a final budget no later than December 31.
d. The final budget is available to the public February I.
3. Amending the Budget The Budget Director is authorized to transfer budgeted amounts between object classes within departments or funds; however, the County Commissioners must approve any revisions that alter the total expenditures of a fund or department of the General Fund. Also, the Commissioners must approve any changes that affect the number of authorized employee positions, salary ranges, hours, or other conditions of employment.
After holding one public hearing, the Commissioners determine whether it is in the best interest of the County to increase or decrease the appropriation for a particular fund or department. Approval is made by a resolution adopted by a majority of the Board.
ill. DETAILED NOTES ON ALL FUNDS
A. Deposits and Investments
As required by state law, all deposits and investments of the County' s funds (except as noted below) are obligations of the U.S. Government, bankers' acceptances or deposits with Washington State banks and savings and loan institutions. Investments of trust funds are not subject to the preceding limitations. The Clerk's Trust has passbook and market rate savings of $519,270 as of December 31,2013. These funds are fully insured and belong to the individuals who deposit their money with the court. Yakima County's responsibility is only custodial.
Deposits The County maintains deposit relationships with several Washington State commercial banks and savings and loan institutions.
The Public Deposit Protection Commission of the State of Washington (PDPC) covers all deposits not covered by the Federal Depository Insurance Corporation (FDIC). The PDPC is a statutory authority established under RCW 39.58. It
45

constitutes a multiple fmancial institution collateral pool that insures public deposits. In such a pool, a group of financial institutions, holding public funds, pledge collateral to a common pool. The PDPC provides protection by maintaining strict standards as to the amount of public deposits financial institutions can accept, by monitoring the financial condition of all public depositaries, and by optimizing collateralization requirements. All deposits are held by the County's agent, in the name of the County.
Custodial credit risk - deposits. The custodial credit risk for deposits is the risk that, in the event of a depository fmancial institution failure, the County's deposits may not be recovered. The Primary Government is a participant of the Yakima County Treasurer' s Investment Pool (TIP) and at year-end represented 25% of the total Pool's face investment valuation. The carrying amount of deposits for the Pool as of December 31 , 2013, was $25,000,000. The total bank balance for the Pool was $25,000,000. No amount was exposed to custodial credit risk as uninsured or uncollateralized.
Certificates of deposit
Total deposits
Carrying Amount $25,000,000
$25,000,000
Uninsured and Bank Balance Uncollateralized
$25,000,000 $
$25,000,000 $
Forei!!ll currency risk - deoosits. Foreign currency risk is the risk that changes in exchange rates will adversely affect the fair value of an investment or a deposit. Yakima County does not participate in making deposits or investments that are exposed to this type of risk.
Investments For investment purposes, the County pools the cash balances of County funds and allows for participation by other legally separate entities such as special districts and public agencies, for which the County is ex officio treasurer. Yakima County established the Treasurer's Investment Pool (TIP) effective April 1,2005. The philosophy in developing the Pool was to create a locally managed diversified investment option that would take advantage of economies of scale, simplify administration and achieve a potentially higher yield than other available programs. The Yakima County Treasurer's Investment Pool, administered by the Yakima County Treasurer's Office, is an external investment pool. Participation in the Pool by County departments, districts and agencies is voluntary with an authorizing resolution by the participant submitted in writing to the County Treasurer. A 30-day written notice must be given to the County Treasurer to effectively withdraw from the Pool once participation has begun. No funds have chosen to withdraw since the Pool's inception.
Tvoes of Investments. Through the office of the County Treasurer, Yakima County collects taxes, licenses, fees, and other revenues. It collects not only for the County but also for special purpose districts located within the County. In its custodial role, the Treasurer is empowered to deposit any public funds available for investment and to secure those funds by appropriate collateral. Cash is deposited and invested on behalf of the County and local districts as legally prescribed in the form of certificates of savings or time accounts, in designated qualified public depositories, or in municipal bonds of the State of Washington, or in certificates, notes, or bonds of the United States, or other obligations of the United States or its agencies, or at any corporation wholly owned by the government of the United States; in bankers' acceptances purchased on the secondary market; in federal home loan bank notes and bonds, federal land bank bonds and federal national mortgage association notes, debentures or guaranteed certificates of participation, or the obligations of any other government sponsored corporation whose obligations are or may become eligible as collateral for advances to member banks as determined by the board or governors of the Federal Reserve System; or deposit such funds or any portion thereof in investment deposits.
The County is authorized to enter into repurchase agreements. County investment policies require that securities underlying repurchase agreements must have a market value of principal and accrued interest of at least 102 percent of the cost of the repurchase agreement. The market value of the securities used as collateral shall be monitored daily by the Treasurer's staff and by a third-party custodian. Any deficiencies are to be corrected within one day or the repurchase agreement will be cancelled as defmed in the repurchase agreement contract. The County did not purchase any of these securities during 2013.
46

The County voluntarily invests in the Washington State Treasurer's Local Government Investment Pool (LGIP). The amount is carried at cost, which approximates fair value. The fair value of Yakima County's position in the State Treasurer's Investment Pool is the same as the value of our pool shares. The LGIP is a 2a7-like pool that is overseen by the Office of the State Treasurer, the State Finance Committee, the Local Government Investment Pool Advisory Committee, and the Washington State Auditor's Office. The LGIP also contracts for an annual outside independent audit. The State Treasurer's Office maintained a third-party custodial arrangement with Citibank N.A. during 2013, in order to provide a high level of safety. The LGIP also publishes monthly, quarterly and annual reports that allow participants to stay abreast ofLGIP issues and activity.
External Investment Pool. The Yakima County Treasurer's Investment Pool is not registered with the SEC as an investment company. Oversight is provided by the Yakima County Finance Committee pursuant to RCW 36.29.020. The County Finance Committee consists of the County Treasurer as Chair, the County Auditor as Secretary and the Chair of the Board of County Commissioners. All investments are subject to written policies and procedures adopted by the Finance Committee. The investment policy has been certified by the Washington Municipal Treasurer's Association and is in compliance with state law. The committee meets not less than quarterly to review the investment portfolio and performance.
Pool participants manage their own cash and direct the County Treasurer by written request to deposit or withdraw monies from their funds for investment purposes. The collective pool earnings, net of administrative fees, are distributed monthly to participants based on tbeir average pooled balances for the period.
Money from districts not participating in the Pool and who have not directed the County Treasurer by written request to place individual investments, as well as County departments that cannot invest their own money, is invested by the Treasurer as surplus cash. The interest on these investments is credited to the General Fund, except where prohibited by statute or bond covenant.
The Yakima County Treasurer's Investment Pool (TIP) records its investments at face value, which amounted to $290,679,797 at December 31,2013. Premiums and discounts are distributed in earnings on an amortized cost basis as described below. Management intends to hold all time deposits and securities until maturity. During 2013, the County did not realize any gains or losses from the sale of investments because management held all securities until maturity.
All securities are reported at fair value in accordance with GASB No. 31, Accounting and Financial Reportingfor Certain Investments and External Investment Pools. Fair value pricing is provided monthly by the safekeeping custodian under contract with the County Treasurer and is based on quoted market prices as of the last day of the period. Changes in fair value are reflected as unrealized income in the financial statements. Other gains or losses on investments sold or exchanged are recognized at the time transactions are completed.
Fair value reports are prepared monthly and participants' shares of the Pool for the financial statements are calculated annually based on the participant's cash invested in the Pool on December 31, 2013, and the net asset value of each share in the Pool. Yakima County experienced a net decrease in the fair value of investments during 2013 . The County has not provided or obtained any legally binding guarantees to support the value of the Investment Pool's holdings.
The participants' shares in the Pool are purchased and redeemed at face value. The aggregate value of all participants' investments equal the total face value of the Pool at all times. The distribution of earnings is based on an amortized cost method. Monthly income is distributed to participants based on their relative participation during the period. Income is calculated based on: (1) realized investment gains and losses, if applicable, calculated on an amortized cost basis; (2) interest income on an accrual basis; and (3) the amortization of discounts and premiums on a straight-line basis. Income is then reduced by an administrative fee. This method differs from the fair value method used to value investments in the fmancial statements because the amortized cost method is not designed to distribute the unrealized gains and losses in fair value to participants.
The following schedule shows the types of investments, the fair value, the average interest rates and the weighted average maturity in years of the Yakima County Treasurer's Investment Pool as of December 31,2013. The Primary Government has a fair value balance in the investment pool of $71,447,835. The change in fair value of the total investments for the reporting entity during 2013, after considering purchases, sales and maturities, resulted in a decrease of $2,073,106. Of
47

this amount, the Primary Government's change in fair value was a decrease of $390,511 . There were no losses incurred during the period as a result of default by counterparties to deposit or investment transactions.
Yakima County Treasurer's Investment Pool Weighted
Average Average Interest Maturity
Investment T:!'I~e Fair Value PrinciQal Rate (Years) Certificates of Deposit 25,000,000 25,000,000 2.8 0% 1.005 Municipal Bonds and Notes 7,472,070 7,385,000 4.00% 5.826 U.S . Agencies 175 ,197, 106 176,3 00,000 0.91 % 2.786 State Treasurer's Investment Pool 81,994,797 81,994,797 0.13 % 0.003 Totals for Portfolio 289 ,663,973 290,679,797 0.93% 1.925
Interest rate risk- Investments. Interest rate risk is the risk that changes in interest rates will adversely affect the fair value of an investment. Through its investment policy, the County manages its exposure to the risk that the market value of securities in the portfolio will fall due to changes in market interest rates by structuring the investment portfolio so that securities mature to meet cash requirements for ongoing operations, thereby avoiding the need to sell securities on the open market prior to maturity, and by investing operating funds primarily in shorter-term securities. The policy also states that no single security will be purchased with a maturity date of more than five years from the date of purchase, except when compatible with specific needs and only by approval of the Finance Committee.
Credit risk - Investments. Credit risk is the risk that an issuer or other counterparty to an investment will not fulfill its obligations. The County investment policy minimizes its credit risk by limiting investments to selected types of securities and pre-qualifying the financial institutions, broker/dealers and intermediaries with which the County will do business. The credentials of these business partners are reviewed at least annually. Presented below is the minimum rating required by the state statute and the actual rating, as of December 31,2013, for each type of investment in which the Primary Government participates.
Investment TWe Agency Securities Municipal Bonds & Notes Certificates of Deposit
Washington State LGIP
Amount $ 176,300,000 $ 7,385,000 $ 25,000,000 $ 81,994,797
Minimum Rating AA+ NIR NIR NIR
AA+ NIR N/R NIR
YearEnd Rating
Concentration of credit risk - Investments. Concentration of credit risk is the risk of loss attributed to the magnitude of a government's investment in a single issuer. The County's investment policy minimizes concentration risk by diversifying the investment portfolio so that the impact of potential losses from anyone type of security or from anyone individual issuer will be minimized. The investment policy sets forth maximum concentration guidelines whereby agency securities (combined) may comprise up to 80% of the portfolio, 50% for certificates of deposit, 40% for repurchase agreements, 30% for savings or time accounts, 20% for bonds of the State or local governments in Washington, and 15% for bankers' acceptances (AI or PI) or bonds of other states. Treasury securities may comprise up to 100% of the portfolio, as well as participation in the Washington State Treasurer's Local Government Investment Pool. Presented below are investments in anyone issuer that represent 5% or more of securities in which the Primary Government participates.
Issuer Investment TWe Amount Percentage Federal Farm Credit Bank Agency Security $27,000,000 9% Federal Home Loan Bank Agency Security $30,000,000 10% Federal Home Loan Mortgage Corp. Agency Security $58,750,000 20% Federal National Mortgage Assoc. Agency Security $60,550,000 21 %
Custodial credit risk - Investments. Custodial credit risk for investments is the risk that, in the event of the failure of the counterparty to a transaction, a government will not be able to recover the value of investment or collateral securities that
48

are in the possession of an outside party. County policy dictates that all investment instruments other than non-negotiable certificates of deposit and monies placed with the Washington State Local Government Investment Pool are transacted on a delivery versus payment basis. This means that payment is made simultaneously with the receipt of the security. Securities are held in safekeeping in the County' s name by an institution (custodian) under contract with the County Treasurer.
Condensed statements for Yakima County's Treasurer's Investment Pool are presented below:
Assets Less: Liabilities
Net position held in trust
Condensed Statement of Net Position Year Ended December 31,2013
Equity of internal pool participants Equity of external pool participants Equity of Treasurer' s Cash
External Individual non-pool participants Less: Unamortized PremiurniDiscount
Total equity
Condensed Statement of Changes in Net Position Year Ended December 31, 2013
Net position at January I, 2013
Net change in investments Net position at December 31 , 2013
Individnal Investment Acconnts
$291,225,859 (214,266)
$291,011 ,593
$71,447,835 175,536,918 42,689,962
2,299,779 (962,901)
$291,011,593
$352,277,795
(61,266,202) $291,011,593
The Yakima County Treasurer also purchases individual investments for other legally separate entities, such as special districts and agencies that are not participating in the Pool (non-pool) and that are not part of the Primary Government 's frnancial reporting entity. In addition, purchases of individual investments may also be made for eligible Pool participants if certain specific criteria apply. Written request notices specifying fixed maturity dates and amounts must be submitted to the County Treasurer. Purchases are made under the same guidelines as Pool purchases and in accordance with the County's investment policy and governing statutes.
Investments purchased by External Individual non-pool participants are reported at fair value and amounted to $2,299,779 as of December 31, 2013.
B. Property Taxes The County Treasurer acts as an agent to collect property taxes levied in the County for all taxing authorities. Collections are distributed following the close of each month.
Property taxes are levied and become an enforceable lien against properties on January I . They may be paid in two installments- <me half by April 30 and the second half by October 31 . Interest is charged at the rate of 12% per annum, computed on a monthly basis from date of delinquency, until paid. A penalty of 3% of total delinquent tax is added on June I and an additional penalty of 8% is added December I. On January I, the assessed value of property is established for the next year's levy at 100% of market value.
Property taxes are recorded as a receivable when levied, offset by unearned revenue. During the year, property tax revenues are recognized when cash is collected. At year-end, property tax revenues are recognized for collections that
49

occur in January. No allowance for uncollectible taxes is established because delinquent taxes are considered fully collectible.
The County may levy up to $1.80 per $1,000 of assessed valuation for general governmental services, subject to three limitations:
Washington State law in RCW 84.55.010 limits the growth of regular property taxes to the lesser rate of the implicit price deflator per year or I %, excluding new construction.
• RCW Chapter 84.52 establishes a limitation on the levies for ports, public utilities, state schools, emergency medical services, counties, roads, cities and towns. All other regular levies are proportionately reduced if a composite rate of $5.90 per thousand is exceeded.
• The Washington State Constitution limits the total regular property taxes to I % of assessed valuation or $10 per $1,000 of value. If the taxes of all districts exceed this amount, each is proportionately reduced until the total is at or below the I % limit. Exceptions include port districts and public utility districts.
The maximum amounts that may be levied and the actual 2012 and 2013 levies for the General Fund and the County Road fund were (per $1,000 of assessed value):
Maximum L ev v
General Fund $ I .80
Co u n ty R 0 a d $ 2.25
C. Receivables
$
$
2013 A c tu a I L ev v
I .76
I .70
$
$
2012 A c tu a I L evv
I .75
I .69
Receivables as of year-end for the County's individual major funds, non-major, internal service and Fiduciary funds in the aggregate, including the applicable allowance for uncollectible accounts are as follows: Amounts presented in 1,000's Due From
Special Other Fund Taxes Accounts Assessments Governments Interest Total
Genera I Fu nd $ I ,0 I 0 $ 2,604 $ - $ 4, I I I $ 21 $ 7,746 County Roads 553 16 13 566 3 I , I 5 I Aging & Long-Term Care - 29 - 2,061 3 2,093 SlED - - - 4,172 9 4, 18 I Department of Corrections - - - 1,082 2 1,084 Community Services Program 14 - - 565 3 582 Dist Court Probation - I I ,5 I 3 - - - I 1 ,5 13 NonMajor Governmental 96 17 125 2,923 12 3,173 Solid Waste - 41 I - 258 15 684 Public Services Utilities - 140 - - 2 142 Building and Fire Safety - 12 - - - 12 Internal Services - 14 - 3 I 12 57 Agency 6,375 20 397 6,576 - 13,368 Total Receivables $ 8,048 $14,776 $ 535 $ 22,345 $ 82 $ 45,786
District Court Probation has the largest balance for receivables. The Court system bills customers for their probation balances for the tenm specified by the judge, usually 3 to 7 years. The amount listed is expected revenue over the future terms of probation. Bad debt expense was estimated based on the prior 10 year revenue stream. Additional quantifying data to age those receivables was not available because the courts improved and enhanced the billing systems. The receivables are also subject to a variety of influences, client behavior, the economy and the nature of nonexchange transactions . The County continues to pursue collections up to the statutory period of 10 years.
50

Governmental funds report unearned revenue in connection with receivables for revenues that are not considered available to liquidate liabilities of the current period. Governmental funds also defer revenue recognition in connection with resources that have been received, but not yet earned. At the end of the year, the various components of unavailable revenue and unearned revenue reported in the governmental funds were as follows: Amounts presented in 1,000's
Property Taxes Receivable (General Fund) Property Taxes Receivab le (Road Fund) Property Taxes Receivable (Other Governmental Funds) Sa les Tax Receivab le Other Taxes Receivable Revenue Received But Not Yet Due Spec ial Assessmen ts Receivable Reven ue Earned But Not Available G ran ts Received Prior to Meeting A II Eligibility Requirements
Total Deferred /Unearned Reve nue fo r Governme ntal Fund s
D. Interfund Receivables. Payables and Transfers
$
$
Unavailable Unearned
948 $ 536 128
1,555 508
229 140
13 ,912 473
17,727 $ 702 $ 18 ,429
Interfund loans receivable and payable are created as a result of a cash or property transfer resulting in a subsequent promise of repayment. These interfund transactions, as outstanding balances between funds involve the exchange of goods and services in a normal business relationship.
These outstanding balances between funds are reported as due to/due from other f unds on the financial statements. O th er
Due From Gene ral C o unty Debt Specia l Capital Pro p rietary In terna l
Due T o Fund Roa d Service Revenues p ,.ojects Funds Serv ic es To tal
G eneral Fund $ - $ - $ - $ 25,798 $ - $ . $ . $ 25 ,798 Dept o f Co ,.,.ect'io ns - - - . . 229 ,606 229,606 Sl ED - 85,702 - - - - . 85,702 Co unty Ro ad . - - - - - 14,626 14,626 Other Sp ecia l Re venu es 39,593 . . 310,984 - - - 350,577 C apital Projects . . 63 ,000 - - - - 63,000 Intern al Services - - . - 225,000 8,603 - 233,603 Total $ 39,593 $ 85702 $ 63000 $ 336,782 $ 225,000 $ 8,603 $ 244,232 $ 1,0029 12
51

Interfund Loans Begin Bal New Ending Bal
Amounts presented in 1,000's Lending Fund 111/2013 Loans Repayments 12/31/2013
Motell Hotel Tax Fairgrounds Cap Proj $ 50 $ - $ 50 $ -Technology Services Eq ui p Rent & Rev 680 - 88 592 General Capital Project Technology Services 670 23 670 23 Parker Water General Fund 24 23 24 23 Gala Estates Water Terrace Heights Water Fund - 3 I 2 Bittner Water System Terrace Heights Water Fund 5 5 I 9 Total $ 1,429 $ 54 $ 834 $ 649
Interfund transfers represent subsidies and contributions provided to funds and capital project funds with no corresponding debt or promise to repay. The purpose of the general fund transfers is to subsidize capital project activities and debt service. Transfers out in non-major goverrunental funds generally represent debt service and capital project funding. Interfund transfers occwring between individual major funds, non-major goverrunental, non-major enterprise, and internal service funds of the County during the year ended December 31, 2013, are as follows:
Transfer In NonMajor Armunts presented in 1,000'5 General Dept of Special County Debt Capital Proprietary Internal Transfer Out Fund Corrections Revenue Road Service Projects Fund<i Services Total General Fund $ 250 $ 16,379 $ 30 $ - $ 47 $ 689 $ 62 $ 1,374 $ 18,831 Department of Corrections - - 2,708 - - - 2,708 Comm.mity Services 113 98 - - - - - - 211 NonMajor Special Revenue - - 70 - 542 24 15 - 651 County Roads - - - - 15 - - - 15 Support Invest in Economic Diversification 92 - - 243 - - - - 335 Capital Projects - - - 323 514 60 - 897 Proprietary Funds - - - - - 26 - - 26 Internal Services 76 - - - 175 2155 - - 2406 Total $ 531 $ 16477 $ 100 $ 243 $ 3810 $ 3408 $ 137 $ 1,374 $ 26,080
The general fund transfers $1.1 million a month to the Department of Corrections for the custody of local County inmates; Department of Corrections receives other revenues from outside jurisdictions on a contract basis. The General Fund also transfers an annual amount of $750,000 to the LEOFF I fund to pay for health benefits on designated retirees. LEOFF 1 benefits are explained in Note VI.
52

E. Capital Assets
Capital asset activity for the year ended December 31 , 2013, was as follows:
Govel11llElltal Adivities & Internal Service Capital assets, rot ~de;nriattrl
llm:I $
OJrstro::tioo in rcoge;s
Total captal assets, not being depreciated $
Capital assets, ~de;nriated: BJildirg; $
hqrovermis
Mtchimy am equirmrt Infrastn.x:ture
Total captal assets being depreciated $
Less accurrulattrl de;nriatioo for: BJildirg; $
hqrovermis
Mtchimy am equirmrt Infrastn.x:ture
Total accmwIated deJreciation $
Total capital assets, ~ de;nriated, rrt GJvelllll.tai activities capital assets, rrt $
Depreciation expense was charged to J'uoctions as follows: General Goverrnnental Services Security of Persons and Property Physical Envirornnent Transportation Economic Envirornnent Mental and Physical Health Culture and Recreation
In addition, depreciation on capital assets held by the County's internal service funds is charged to the
various functions based upon their usage of the
assets.
Total goverrnnental activities depreciation expense.
Beginning Balance
81 ,866,440 $
29,212,602 lll,079,042 $
78,147,619 $ 15,237,815 29,380,696
648,626,533 771 ,392,663 $
36,345,464 $ 6,387,385
15,705,307 523,617,168
582,055,324 $
189,337,339
300,416,381 $
53
564,057 $
7,517,602 17,rl32,974 8,001,659 $17,932,974
122,300 $
2,298,179 1,582,721
16,182,700 2,216,939 18,603,179 $ 3,799,660
2,702,510 $ 683,509
2,888,977 1,376,667 13,817,430 1,667,742
20,092,426 $ 3,044,409
{1,489,24:z2 755,251
6,592,412 $18,688,225
$ 148,336 2,639,857
16,993 13,830,542
23,020 21 ,030
727,417
$ 17,407,195
$ 2,685,231
$ 20,092,426
Fn.iing
BaIance
$ 82,430,497
18,797,230 $ 101,227,727
$ 78,269,919 15,237,815 30,006,154
662,592,294 $ 786,196,182
$ 39,047,rJ74 7,070,894
17,217,617 535,766,856
$ 599,103,341
187,092,841
$ 288,320,568

Capital Assets Business Beginning Ending Balance Increases Decreases Balance
Business Type Activities Capital assets . not being depreciated
Land $ 3,801 ,209 $ $ $ 3 ,8 01 ,209 Construction in progress 2 ,562 ,900 4 ,431 ,312 6,994 ,212
Total capital assets, not being 6,364,109 4 ,431 ,312 0 10 ,795,421
Capital assets , being depreciated: Buildings $ 11 ,759 ,375 $ $ 1,214 ,293 $ 10 ,545 ,082 Improvements 20 ,272 ,703 20 ,272 ,703 Machinery and equipment 779 ,075 14,326 19,030 774 ,371
Total capital assets being depreciated $ 32,811 ,153 $ 14,326 $ 1,233 ,323 $ 31 ,592 ,156
Less accumulated depreciation for: Buildings $ 4,048,099 $ 413 ,246 $ 340,002 $ 4 ,121 ,343 Improvements 8,203 ,716 409,796 711 8,612 ,801 Machinery and equipment 493 ,750 40 ,531 19,030 515 ,251
Total accumulated depreciation $ 12,745 ,565 $ 863 ,573 $ 359,743 $ 13,249,395
Total capital assets, being depreciated , ne t 20 ,065 ,588 (849 ,247) 873,580 18 ,342 ,761 Business Type activities capital assets, net $ 26 ,429 ,697 $ 3,582 ,065 $ 873,580 $ 29,138 , 182
Depreciation expense was charged to functions as follows :
Solid Waste $ 473 ,619 Public Services Utilities 389,227
Building and Fire Safety 727 otal Business Type act ivities depreciation expense. $ 863,573
Capital Assets Net of Related Debt
Government Proprietary Funds Funds
Capital Assets
Land & ~onstructio~ in Progress $ 101,227,727 $ 10,795,421
Depreciation 187,092,841 18,342,761
Sub Total $ 288,320,568 $29,138,182
Less Debt
Bond Debt $ (32,475,000) $ (3,415,000)
Intergovernmental (6,419,990) (88,840)
Lease (72,168)
Assessment (70,500) Less Premiums (1 ,352,061 )
Plus Cash from Refunding 6,281,737 Plus Non Capital Debt 3,754,988 Invested In Capital Assets, Net Of Related Debt $ 257,967,574 $ 25,634,343
54
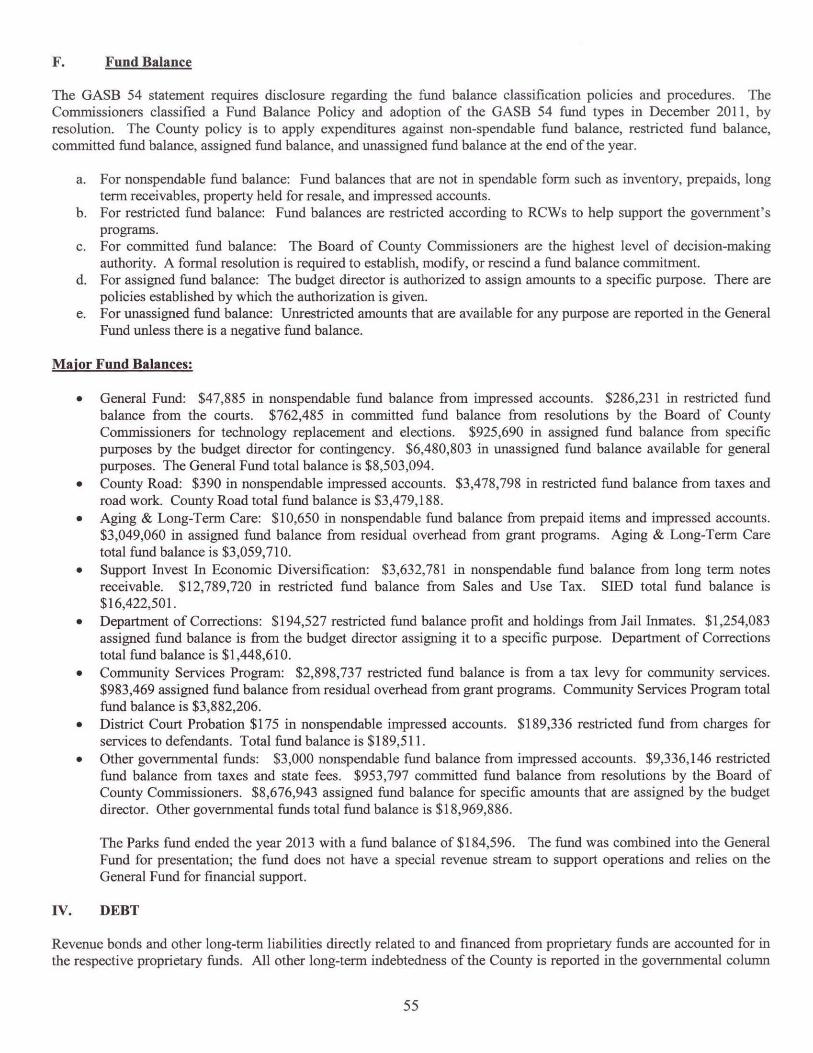
F. Fund Balance
The GASB 54 statement requires disclosure regarding the fund balance classification policies and procedures. The Commissioners classified a Fund Balance Policy and adoption of the GASB 54 fund types in December 20 II, by resolution. The County policy is to apply expenditures against non-spendable fund balance, restricted fund balance, committed fund balance, assigned fund balance, and unassigned fund balance at the end of the year.
a. For nonspendable fund balance: Fund balances that are not in spendable form such as inventory, prepaids, long term receivables, property held for resale, and impressed accounts.
b. For restricted fund balance: Fund balances are restricted according to RCWs to help support the government's programs.
c. For committed fund balance: The Board of County Commissioners are the highest level of decision-making authority. A formal resolution is required to establish, modify, or rescind a fund balance commitment.
d. For assigned fund balance: The budget director is authorized to assign amounts to a specific purpose. There are policies estabbshed by which the authorization is given.
e. For unassigned fund balance: Unrestricted amounts that are available for any purpose are reported in the General Fund unless there is a negative fund balance.
Major Fund Balances:
• General Fund: $47,885 in nonspendable fund balance from impressed accounts. $286,231 in restricted fund balance from the courts. $762,485 in committed fund balance from resolutions by the Board of County Commissioners for technology replacement and elections. $925,690 in assigned fund balance from specific purposes by the budget director for contingency. $6,480,803 in unassigned fund balance available for general purposes. The General Fund total balance is $8,503,094.
• County Road: $390 in nonspendable impressed accounts. $3,478,798 in restricted fund balance from taxes and road work. County Road total fund balance is $3,479,188.
• Aging & Long-Term Care: $10,650 in nonspendable fund balance from prepaid items and impressed accounts. $3,049,060 in assigned fund balance from residual overhead from grant programs. Aging & Long-Term Care total fund balance is $3,059,710.
• Support Invest In Economic Diversification: $3,632,781 in nonspendable fund balance from long term notes receivable. $12,789,720 in restricted fund balance from Sales and Use Tax. SIED total fund balance is $16,422,501.
• Department of Corrections: $194,527 restricted fund balance profit and holdings from Jail Inmates. $1,254,083 assigned fund balance is from the budget director assigning it to a specific purpose. Department of Corrections total fund balance is $1,448,610.
• Community Services Program: $2,898,737 restricted fund balance is from a tax levy for community services. $983,469 assigned fund balance from residual overhead from grant programs. Community Services Program total fund balance is $3,882,206.
• District Court Probation $175 in nonspendable impressed accounts. $189,336 restricted fund from charges for services to defendants. Total fund balance is $189,511.
• Other governmental funds: $3,000 nonspendable fund balance from impressed accounts. $9,336,146 restricted fund balance from taxes and state fees. $953,797 committed fund balance from resolutions by the Board of County Commissioners. $8,676,943 assigned fund balance for specific amounts that are assigned by the budget director. Other governmental funds total fund balance is $18,969,886.
The Parks fund ended the year 2013 with a fund balance of $184,596. The fund was combined into the General Fund for presentation; the fund does not have a special revenue stream to support operations and relies on the General Fund for financial support.
IV. DEBT
Revenue bonds and other long-term liabilities directly related to and fmanced from proprietary funds are accounted for in the respective proprietary funds. All other long-term indebtedness of the County is reported in the governmental colunm
55

of the government-wide statement of net position. Bond premiums are deferred and amortized over the life of the bonds using the effective interest method. Bonds payable are reported net of the applicable bond premium.
In the fund financial statements, governmental fund types recognize bond premiums, discounts, and issuance costs during the current period. The face amount of the debt is reported as other financing sources. Premiums received on debt issuance are reported as other financing sources while discounts on debt issuance are reported as other financing uses. Issuance costs, whether or not withheld from the actual debt proceeds, are reported as debt service expenditures in the year incurred.
State law provides that debt cannot be incurred in excess of the following percentages of the value of the taxable property of the County:
1.5% - Without a vote of the people 2.5% - With a vote of the people 5.0% - With a vote of the people, provided the indebtedness not in excess of 2.5% is for utilities, parks, or open space development.
As of December 31, 2013, the debt limits for the County were as follows :
Assessed Value $14,843,676,188 Without a Vote
With a Vote 2.50% 5.00%
Legal Limit Net Outstanding Indebtedness
$ 222,655,143 33,811,561
$ 371 ,091 ,905 33,882,061
$ 742,183,809 33,882,061
Margin Available $ 188,843,582 $ 337,209,844 $ 708,301,748
A. Advance Due to Other Governments
Description Amount
Outstanding
The Flood Control Zone District was the recipient of a new Department of Community Development loan $ 289,294 with proceeds as of December 31, 2013, totaling $323,328. The proceeds of this loan were used to improve roadway access on SR410 due to a landslide in 2009. Draws on the loan were received as follows: $150,000 in 2010 and the fmal draw for $173,328 in 2011. Principal payments made by the Flood Control Fund totaling $17,017 and interest payments of$9,189 were made in 2013.
In 2004, Yakima County received loan proceeds of $110,000 from the United States Department of $ 88,840 Agriculture for the repair and replacement of the Crewport Water System. Repayment will be made from customer service fees out of the Public Services Utilities Fund. Principal payments of $3,028 and interest payments of $2,954 were made in 2013.
The County Road Fund was the recipient of a Department of Community Development loan with proceeds as $ 1,292,308 of December 31, 2011, totaling $3,000,000. The proceeds of this loan were used to improve surface conditions of county roads. Draws on the loan were received as follows: $150,000 in 2009, $2,400,000 in 2002 and $450,000 in 2001. Principal payments by the County Road Fund totaling $161,538 and interest payments of $7,269 were made in 2013.
56

The County Road Fund was the recipient of two Department of Community Development loans with $ 3,314,473 proceeds as of December 31, 2011 totaling $9,000,000. The proceeds of these loans were used for improvements to gravel roads throughout Yakima County. Draws on the loans were received as follows: $700,000 in 2007; $200,000 in 2004; $7,800,000 in 2000; and $300,000 in 1999. Principal payments by the County Road Fund totaling $488,816 and interest payments of$38,033 were made in 2013.
The County Road Fund was the recipient of a Department of Community Development loan with proceeds as $ 1,445,240 of December 31, 2011 totaling $4,548,374. The proceeds of this loan were used for bridge and culvert replacement. Draws on the loan were received as follows: $48,374 in 2007 and $4,500,000 in 1999. Principal payments by the County Road Fund totaling $240,873 and interest payments of $16,861 were made in 2013.
The County Road Fund was the recipient of two Department of Community Development loans with $ 78,674 proceeds as of December 31,2011 totaling $2,220,963. The proceeds of these loans were used to implement the Terrace Heights Water system. Draws on the loans were received as follows: $72,800 in 2000; $142,963 in 1996; $655,200 in 1995; and $1,350,000 in 1994. Repayment will be made from customer service fees and the Real Estate Excise Tax Capital Project Fund. Principal payments of $145,979 and interest payments of $4,493 were made in 2013.
Total Advance Due to Other Governments $6,508,829
The annual debt service requirements to maturity for Advance Due to Other Governments are as follows: Inter-Gov
Year Ending 3 I-Dec
2014 2015 2016
2017 2018
2019-2023 2024-2028 2029-2033
2034
B. Special Assessment Bonds
$
$
Principal 950 ,576 950,673 911 ,442
911,548 911,659
1,699,836 107,331 60,272
5,492
6,508,829
$
$
Interest 67,300 57,798 48,292
39,570 30,845 56,346
20,428 5,204
194
325,977
Debt service requirements for special assessment bonds will be met by the collection of assessments receivable that have been levied against property owners. Delinquent assessment debt including penalties and interest as of December 31, 2013 was $293. Yakima County has established a CRID Guaranty fund and an LID Guaranty fund whereby the County will cover expenses if the property owners do not pay the assessments necessary to finance the debt. Total reserves including cash and investment at fair value in the CRID Guaranty fund and the LID Guaranty fund as of December 31 , 2013 were $127,730 and $27,010 respectively. The County will recover all funds spent in this manner, as the assessments are liens against the property and subject to foreclosure.
Amount Description Outstanding
$125,000 CLID #2008-1 Special Assessment Bonds due in 2020, interest at 3.85%, payable annually. $56,000 These bonds are serviced by CLID #2008-1 Debt Service Fund from special assessments levied. Principal payments of$12,000 were made in 2013.
57

$153,788 RID #99 Special Assessment Bonds due in 20 15, interest at 4.35%, payable annually. These $ bonds are serviced by RID #99 Debt Service Fund from special assessments levied. Principal payments of $8,500 were made in 2013.
Total Special Assessment Bonds $
14,500
70,500
The amount of bonds to be retired each year can only be estimated. The bonds may be called earlier or later than the year shown depending on the actual timing of receipt of special assessment payments. At the option of the property owner, assessment payments may be settled at any time by paying the remaining assessment balance, with interest thereon to the next installment due date.
The estimated annual debt service requirements to maturity for Special Assessment Bonds are as follows: Special Assessment
Year Ending 3 I-Dec
C. General Obligation Bonds
2014 2015 2016 2017 2018
$
$
Principal
20,000 17,500 11,000 11 ,000 11,000 70,500
$
$
Interest 2,787 1,977 1,270
847 424
7,305
General obligation bonds are direct obligations that pledge the full faith and credit of the government. These bonds are subject to Federal arbitrage regulations. General obligation bonds currently outstanding are as follows:
Description Amount
Outstanding
In September 2010, Yakima County issued $30,000,000 of Limited Tax General Obligation and $ 28,010,000 Refunding Bonds. The County allocated $1,990,000 for capital improvements to the County Courthouse $7,075,000 for capital improvements to the Department of Corrections' main jail and $485,000 for information system upgrades. In addition, $20,450,000 was used for a partial advance refunding of the $25,135,000 outstanding 2002 Limited Tax General Obligation Bonds. The refunding bonds were allocated as follows: $3,815,000 to Terrace Heights Landfill Transfer Station; $15,120,000 to new jail facility; $235,000 to Sheriff Precinct Building; and $1,280,000 to County Capital Improvements. Interest rates range from 2.0% in 2010 to 4.0% in 2030. Principal is paid annually on December I with interest payments made semi-annually on June 1 and December I through 2030. Principal payment of $985,000 and interest payments of $91 9,775 were made in 2013.
Also in September 2010, Yakima County was authorized to issue "Taxable Qualified Energy $ 2,430,000 Conservation Bonds," pursuant to Section54D of the Internal Revenue Code of 1986, for the purpose of financing certain qualified energy conservation projects and to elect to receive a subsidy payment from the federal government equal to 70 percent of the amount of each interest payment on such taxable bonds (the "Federal Credit Payment"). Beginning 2013 and possibly through 2023, the federal government has implemented the sequestration of direct pay municipal bond subsidies. The current sequestration level amounts to a 7.2% reduction of the federal subsidy. The 201 OB Bonds are being issued as Taxable Qualified Energy Conservation Bonds. The available subsidy for the 20 lOB Bonds will be paid to the County; no holders of the 2010B Bonds will be entitled to a tax credit. The bond interest rate is 5.00%. The principal payment is due at maturity, June I, 2027, with interest payments paid semi-annually on June I and December 1. Interest payment of $121,500 was made in 2013.
58

Yakima County issued $7,850,000 of Limited Tax General Obligation Refunding Bonds in October 2009. $ 5,280,000 A portion of the bond issue was used to refund $2,775,000 of general obligation bonds issued in 1999 to construct the Restitution Center for low risk inmates. The County allocated $5,006,650 to various capital projects for public improvements of tourist promotions facilities. Interest rates range from 2.0% in 2010 to 3.2% in 2020. Principal is paid annually on December I with interest payments made semi-annually on June 1 and December 1 through 2020. Principal payment of $675,000 and an interest payment of $173,930 were made in 2013.
In 2008, Yakima Couoty received loan proceeds of $210,000 from the Washington State Treasurer's $ 170,000 LOCAL program for the acquisition & remodel of the Noxious Weed building. Principal payments being paid annually on December 1. Interest payments are paid semi-annually on June I and December 1 with a fixed rate at 4.465%. Principal payment of $10,000 and an interest payment of $7,092 were made in 2013.
Total General Obligation Bonds $35,890,000
The annual debt service requirements to maturity for General Obligation Bonds are as follows:
Genera l Obligation Debt Year Ending
31-Dec 2014 2015 2016 2017 2018
2019-2023 2024-2028 2029-2030
D. General Obligation Note
$ PrinciQal
3 ,025,000 3,105,000 3,185,000 3,305,000 3,440,000
13,115,000 5,200,000 1,515,000
35,890,000
Interest $ 1,188,777
1,121,145 1,051 ,550
931,840 807,618
2,513,103 1,081,962
91,400 8,787,395
In December 2012, Yakima Couoty issued a $1,255,000 Limited Tax General Obligation Note. This Note was used for the refunding of $1 ,255,000 outstanding 2002 Limited Tax General Obligation Bonds. The refunding note was allocated as follows: $1,235,000 to new jail facility and $20,000 to Sheriff Precinct Building. Interest rate is 2.44%. Principal and interest is paid annually on December 1. The obligation has been fulfilled by a principal payment of $1,255,000 and an interest payment of $30,622 in 2013 .
E. Capital Leases
Yakima County entered into a sixty month lease agreement with Xerox in 2013 through the Department of Corrections and the Sheriff. Lease expenditures for year ended December 31,2013 amouoted to $74,843. The future minimum lease payments are:
Lease Payments Year Ending
31-Dec 2014 2015 2016 2017 2018
59
Paytnents $ 10,957
10,957 10,957 10,957 28,340
$ 72,168

F. Changes in Long-Term
The following is a swnmary of the long-term debt transactions of Yakima County for the year ended December 31,20 13: Beginn ing Ne w Endin g D ue Wi thin Balan ce Iss ue Reti rements Balance O ne Year
Gove rnmenta l Ac ti v ities Bond s Payab le
G c oe Tal O bliga ti on Bond s $ 33,8 15,000 $ $ 1,340,000 $ 32,475,000 $ 2 ,685 ,000 Spec ia l A ssess men t Bo nd s 9 1,000 20,500 70,500 2 1,500
Unearn ed Am ou nts: For Premium s 1,4 37.9 83 85.922 1.352.06 1
T o tal Bond s Paya bl e $35,3 4 3,9 83 $0 $ 1,44 6,422 ' $ 33.897,56 1 $ 2,706,50 0 G eneral O bl iga ti o n N ote 1,2 55,000 0 1,255,00 0 0 0 Adv ances Due to O ther Go vernm e 7,4 74 ,2 13 1,054 ,223 6,41 9 ,99 0 94 7,583 C apital Lea se Obli ga tio ns 74 ,8 4 3 2 ,6 75 72, 168 14 , 17 1 C ompen sate d Ab sen c e s 1,4 34,7 4 3 9 3 1,344 124 .62 1 2 ,241 .46 6 268.976 OPEB Benefit for LEOH 2 ,9 3 1,65 3 394 .416 3.326 ,0 6 9
Long T e rm Liabilitie s $ 48 ,4 39 ,592 $ 1,400 ,60 3 $ 3 ,88 2,941 $ 4 5,95 7,2 54 $ 3,937,23 0
Bu s ine ss -T y pe Activitie s G enera! Obligation Bond s $ 3,745 ,000 $ $ 33 0,000 $ 3,41 5,000 $ 340 ,00 0
To tal Bond s Pay able $ 3,7 4 5.000 $0 $ 33 0,000 $ 3,415 ,00 0 $ 340,000
Ad v ance s Due to Other G overnme 91 ,8 6 8 3,028 88,840 2,9 93 C ompen sated Ab s en c e s 115 ,9 05 68, 197 10 ,000 174 , 10 2 20,892 Land fill C lo s ure/Po s tc lo s ure 9 ,699 ,8 51 290,665 9 ,99 0 ,5 16 12 ,8 12
Long Term Liabilities $ 13,652,624 $ 35 8,8 62 $ 34 3,02 8 $ 13,668,4 58 $ 37 6 ,697
Beginning Balan ce for 2012 Premium s res tated for G A S 8 65
Internal service funds predominantly serve the governmental funds. Accordingly, long-term liabilities for them are included as part of the above totals for governmental activities. At year end $ 200,946 of internal service funds are included in compensated absences. For governmental activities, the General Fund or the applicable Special Revenue fund generally liquidates compensated absences.
The OPEB plan obligation is based on a long-term perspective. The Obligation is based on actnarial valuations and estimated health care costs, inflation and life expectancy. The assumptions are calculated on probability and these estimates are subject to continual revision compared to past expectations and new estimates made about the future.
Claims and judgments payable are liquidated by the Liability Insurance fund. In the previous table, additions and reductions have been estimated for compensated absences due to the time and effort needed to determine these balances.
V. PENSION PLANS
Substantially all County full-time and qualifying part-time employees participate in one of the following statewide retirement systems administered by the Washington State Department of Retirement Systems, under cost-sharing multiple-employer public employee defined benefit retirement plans. The Department of Retirement Systems (DRS), a department within the primary government of the State of Washington, issues a publicly available comprehensive annual fmancial report (CAFR) that includes financial statements and required supplementary information for each plan. The DRS CAFR may be obtained by writing to: Department of Retirement Systems, Communications Unit, P.O. Box 48380, Olympia, WA 98504-8380; or it may be downloaded from the DRS website at www.drs.wa.gov. The following disclosures are made pursuant to the GASB Statement 27, Accounting f or Pensions by State and Local Government Employers and the GASB Statement 50, Pension Disclosures, an Amendment ofGASB Statements No. 25 and No. 27.
60

A. Public Employees' Retirement System (PERS & JBM) Plans 1. 2 and 3
Plan Description
The Legislature established PERS in 1947. Membership in the system includes: elected officials; state employees; employees of the Supreme, Appeals, and Superior courts; employees of legislative committees; employees of district and municipal courts; and employees of local governments. Membership also includes higher education employees not participating in higher education retirement programs. PERS retirement benefit provisions are established in Chapters 41.34 and 41 .40 RCW and may be amended only by the State Legislature.
PERS is a cost-sharing multiple-employer retirement system comprised of three separate plans for membership purposes: Plans I and 2 are defined benefit plans and Plan 3 is a defmed benefit plan with a defmed contribution component.
PERS members who joined the system by September 30, 1977 are Plan I members. Those who joined on or after October I, 1977 and by August 31, 2002 for local government employees are Plan 2 members, unless they exercised an option to transfer their membership to Plan 3. PERS members joining the system on or after September 1, 2002 for local government employees have the irrevocable option of choosing membership in either PERS Plan 2 or Plan 3. The option must be exercised within 90 days of employment. An employee is reported in Plan 2 until a choice is made. Employees who fail to choose within 90 days default to Plan 3.
PERS is comprised of and reported as three separate plans for accounting purposes: Plan 1, Plan 213, and Plan 3. Plan I accounts for the defined benefits of Plan I members. Plan 2/3 account for the defined benefits of Plan 2 members and the defmed benefit portion of benefits for Plan 3 members. Plan 3 accounts for the defined contribution portion of benefits for Plan 3 members. Although members can only be a member of either Plan 2 or Plan 3, the defined benefit portions of Plan 2 and Plan 3 are accounted for in the same pension trust fund. All assets of this Plan 2/3 may legally be used to pay the defined benefits of any of the Plan 2 or Plan 3 members or beneficiaries, as defined by the terms of the plan. Therefore, Plan 213 is considered to be a single plan for accounting purposes.
PERS Plan I and Plan 2 retirement benefits are financed from a combination of investment earnings and employer and employee contributions. Employee contributions to the PERS Plan I and Plan 2 defmed benefit plans accrue interest at a rate specified by the Director of DRS. During DRS' Fiscal Year 2013, the rate was five and one-half percent compounded quarterly. Members in PERS Plan I and Plan 2 can elect to withdraw total employee contributions and interest thereon, in lieu of any retirement benefit, upon separation from PERS-covered employment.
PERS Plan I members are vested after the completion of five years of eligible service.
PERS Plan I members are eligible for retirement from active status at any age with at least 30 years of service, at age 55 with 25 years of service, or at age 60 with at least five years of service. Plan 1 members retiring from inactive status prior to the age of 65 may receive actuarially reduced benefits.
The monthly benefit is 2 percent of the average final compensation (AFC) per year of service, but the benefit may not exceed 60 percent of the AFe. The AFC is the monthly average of the 24 consecutive highest-paid service credit months.
PERS Plan I retirement benefits are actuarially reduced to reflect the choice, if made, of a survivor option.
Plan 1 members may elect to receive an optional COLA that provides an automatic annual adjustment based on the Consumer Price Index. The adjustment is capped at 3 percent annually. To offset the cost of this annual adjustment, the benefit is reduced.
PERS Plan I provides duty and on-duty disability benefits. Duty disability retirement benefits for disablement prior to the age of 60 consist of temporary life annuity. The benefit amount is $350 a month or two-thirds of the monthly AFC whichever is less. The benefit is reduced by any worker's compensation benefit and is payable as long as the member remains disabled or until the member attains the age of 60, at which time the benefit is converted to the member's service retirement amount.
61

A member with five years of covered employment is eligible for non-duty disability retirement. Prior to the age of 55, the benefit amount is 2 percent of the AFC for each year of service reduced by 2 percent for each year that the member's age is less than 55. The total benefit is limited to 60 percent of the AFC and is actuarially reduced to reflect the choice of a survivor option. Plan I members may elect to receive an optional COLA amount (based on the Consumer Price Index) capped at 3 percent annually. To offset the cost of this annual adjustment, the benefit is reduced.
PERS Plan 2 members are vested after the completion of five years of eligible service. Plan 2 members are eligible for normal retirement at the age of 65 with five years of service. The monthly benefit is 2 percent of the AFC per year of service. The AFC is the monthly average of the 60 consecutive highest-paid service months. There is no cap on years of service credit and a cost of living allowance is granted (based on Consumer Price Index) capped at 3 percent annually.
PERS Plan 2 members, who have at least 20 years of service credit, are 55 years of age or older are eligible for early retirement with a reduced benefit. The benefit is reduced by an early retirement factor (ERF) that varies according to age, for each year before age 65.
PERS Plan 2 members who have 30 or more years of service credit and are at least 55 years old can retire under one of two provisions, if hired prior to May 1, 2013 :
• With a benefit that is reduced by 3 percent for each year before age 65; or
• With a benefit that has a smaller (or no) reduction (depending on age) that imposes stricter return-to-work rules.
PERS Plan 2 members hired on or after May 1, 2013 have the option to retire early by accepting a reduction of 5 percent for each year of retirement before age 65. This option is available only to those who are age 55 or older and have at least 30 years of service.
PERS Plan 2 retirement benefits are also actuarially reduced to reflect the choice, if made, of a survivor option.
PERS Plan 3 has a dual benefit structure. Employer contributions finance a defined benefit component and member contributions finance a defined contribution component. As established by Chapter 41 .34 RCW, employee contribution rates to the defmed contribution component range from 5 percent to 15 percent of salaries, based on member choice. Members who do not choose a contribution rate default to a 5 percent rate. There are currently no requirements for employer contributions to the defined contribution component ofPERS Plan 3.
PERS Plan 3 defmed contribution retirement benefits are dependent upon the results of investment activities. Members may elect to self-direct the investment of their contributions. Any expenses incurred in conjunction with self-directed investments are paid by members. Absent a member's self-direction, PERS Plan 3 contributions are invested in the Retirement Strategy Fund that assumes the member will retire at age 65.
For DRS' fiscal year 2013, PERS Plan 3 employee contributions were $99.0 million, and plan refunds paid out were $69.4 million.
The defined benefit portion of PERS Plan 3 provides members a monthly benefit that is 1 percent of the AFC per year of service. The AFC is the monthly average of the 60 consecutive highest-paid service months. There is no cap on years of service credit, and Plan 3 provides the same cost-of-living allowance as Plan 2.
Effective June 7, 2006, PERS Plan 3 members are vested in the defmed benefit portion of their plan after ten years of service; or after five years of service, if twelve months of that service are earned after age 44; or after five service credit years earned in PERS Plan 2 by June 1, 2003. Plan 3 members are immediately vested in the defmed contribution portion of their plan.
Vested Plan 3 members are eligible for normal retirement at age 65, or they may retire early with the following conditions and benefits:
62

• If they have at least ten service credit years and are 55 years old, the benefit is reduced by an ERF that varies with age, for each year before age 65.
• If they have 30 service credit years and are at least 55 years old, and were hired before May 1, 2013, they have the choice of a benefit that is reduced by 3 percent for each year before age 65; or a benefit with a smaller (or no) reduction factor (depending on age) that imposes stricter return-to-work rules.
• If they have 30 service credit years, are at least 55 years old, and were hired before May I , 2013, they have the option to retire early by accepting a reduction of 5 percent for each year before age 65.
PERS Plan 3 benefits are also actuarially reduced to reflect the choice, if made, of a survivor option. PERS Plan 2 and Plan 3 provide disability benefits. There is no minimum amount of service credit required for eligibility. The Plan 2 monthly benefit amount is 2 percent of the AFC per year of service. For Plan 3, the monthly benefit amount is I percent of the AFC per year of service. These disability benefit amounts are actuarially reduced for each year that the member's age is less than 65 and to reflect the choice of a survivor option. There is no cap on years of service credit, and a cost-of-living allowance is granted (based on the Consumer Price lndex) capped at 3 percent annually.
PERS members meeting specific eligibility requirements have options available to enhance their retirement benefits. Some of these options are available to their survivors.
A one-time duty-related death benefit is provided to the beneficiary or the estate of a PERS member who dies as a result of injuries sustained in the course of employment, or if the death resulted from an occupational disease or infection that arose naturally and proximately out of the member's covered employment, if found eligible by the Department of Labor and lndustries.
Judicial Benefit Multiplier From January 1, 2007, through December 31 , 2007, judicial members ofPERS were given the choice to elect participation in the Judicial Benefit Multiplier (ruM) Program enacted in 2006. Justices and judges in PERS Plan 1 and Plan 2 were able to make an irrevocable election to pay increased contributions that would fund a retirement benefit with a 3.5 percent multiplier. The benefit would be capped at 75 percent of AFC. Judges in PERS Plan 3 could elect a 1.6 percent of pay per year of service benefit, capped at 37.5 percent of AFC.
Newly elected or appointed justices and judges who chose to become PERS members on or after January 1, 2007, or who had not previously opted into PERS membership, were required to participate in the ruM Program.
There are 1,176 participating employers in PERS. Membership in PERS consisted of the following as of the latest actuarial valuation date for the plans of June 30, 2012:
Retirees and Beneficiaries Receiving Benefits 82,242
Terminated Plan Members Entitled to But Not Yet Received Benefits 30,515
Active Plan Members Vested 106,317
Active Plan Members Non-vested 44,273
Total 263,347
Funding Policy Each biennium, the State Pension Funding Council adopts PERS Plan 1 employer contribution rates, PERS Plan 2 employer and employee contribution rates, and PERS Plan 3 employer contribution rates. Employee contribution rates for Plan 1 are established by legislative statute at 6 percent for local government unit employees. The employer and employee contribution rates for Plan 2 and the employer contribution rate for Plan 3 are developed by the Office of the State Actuary to fully fund Plan 2 and the defined benefit portion of Plan 3. Under PERS Plan 3, employer contributions finance the defined benefit portion of the plan and member contributions finance the defined contribution portion. The Plan 3 employee contribution rates range from 5 percent to 15 percent.
As a result of the implementation of the Judicial Benefit Multiplier Program in January 2007, a second tier of employer and employee rates was developed to fund, along with investment earnings, the increased retirement benefits of those justices and judges that participate in the program.
63

The methods used to determine the contribution requirements are established under state statute in accordance with Chapters 41.40 and 41.45 RCW.
The required contribution rates expressed as a percentage of current year covered payroll, as of December 31, 2013, are as follows:
Members Not Participating in JBM: PERSPlan 1
Employer" Employee
9.21% 6.00%
PERS Plan 2 9.21% 4.92%
PERSPlan3 9.21 %""
"""
" The employer rates include the employer administrative expense fee currently set at 0.18%. ·"Plan 3 defmed benefit portion only . • "" Variable from 5.0% minimum to 15.0% maximum based on rate selected by the PERS 3 member.
Members Participating in JBM:
Employer" Employee
PERSPlan 1 9.21% 12.26%
PERS Plan 2 9.21% 12.30%
PERS Plan 3 9.21 %." 7.50% .**
" The employer rates include the employer administrative expense fee currently set at 0.18%. "·Plan 3 defmed benefit portion only. """Minimum rate
Both County and the employees made the required contributions. The County's required contributions for the years ended December 31 were as follows:
2013 2012 2011
PERSPlan 1 $ 191,500 $174,769 $ 183,206
PERS Plan 2 $ 2,553,121 $ 2,245,522 $ 1,522,466
PERS Plan 3 $ 816,264 $ 698,619 $ 514,931
B. Law Enforcement Officers' and Fire Fighters' Retirement System CLEOFF) Plans 1 and 2
Plan DeSCription LEOFF was established in 1970 by the Legislature. Membership includes all full-time, fully compensated, local law enforcement commissioned officers, firefighters and, as of July 24, 2005, emergency medical technicians. LEOFF membership is comprised primarily of non-state employees, with Department of Fish and Wildlife enforcement officers, who were first included effective July 27, 2003, being an exception. LEOFF retirement benefit provisions are established in chapter 41.26 RCW and may be amended only by the State Legislature.
LEOFF is a cost-sharing multiple-employer retirement system comprised of two separate defmed benefit plans. LEOFF members who joined the system by September 30, 1977 are Plan 1 members. Those who joined on or after October 1, 1977, are Plan 2 members.
Effective July I , 2003, the LEOFF Plan 2 Retirement Board was established by Initiative 790 to provide governance of LEOFF Plan 2. The Board's duties include adopting contribution rates and recommending policy changes to the Legislature.
LEOFF retirement benefits are financed from a combination of investment earnings, employer and employee contributions, and a special funding situation in which the State pays through legislative appropriations. Employee contributions to the LEOFF Plan 1 and Plan 2 defined benefit plans accrue interest at a rate specified by the Director of DRS. During DRS ' Fiscal Year 2013, the rate was five and one-half percent compounded quarterly. Members in LEOFF
64

Plan 1 and Plan 2 can elect to withdraw total employee contributions and interest earnings, in lieu of any retirement benefit, upon separation from LEOFF -covered employment.
LEOFF Plan I members are vested after the completion of five years of eligible service. Plan 1 members are eligible for retirement with five years of service at the age 50.
The benefit per year of service calculated as a percent of final average salary (F AS) is as follows:
Term of Service Percent of Final Average Salary
20 or more years 2.0% 10 but less than 20 1.5%
years 5 but less than 10 years 1.0%
The F AS is the basic monthly salary received at the time of retirement, provided a member has held the same position or rank for 12 months preceding the date of retirement. Otherwise, it is the average of the highest consecutive 24 months ' salary within the last 10 years of service. A cost-of-living allowance is granted (based on the Consumer Price Index).
LEOFF Plan I provides death and disability benefits. Death benefits for survivors of Plan I members on active duty consist of the following: (1) If there is an eligible spouse, 50 percent of the FAS, plus 5 percent of FAS for each eligible surviving child, with a limitation on the combined benefit of 60 percent of the FAS; or (2) If there is no eligible spouse, eligible children receive 30 percent of FAS for the first child plus 10 percent for each additional child, subject to a 60 percent limitation ofFAS, divided equally.
A one-time duty-related death benefit is provided to the beneficiary or the estate of a LEOFF Plan I member who dies as a result of injuries or illness sustained in the course of employment, or if the death resulted from an occupational disease or infection that arose naturally and proximately out of the member's covered employment, if found eligible by the Department of Labor and Industries.
The LEOFF Plan I disability allowance is 50 percent of the FAS plus 5 percent for each child up to a maximum of 60 percent. Upon recovery from disability before the age of 50, a member is restored to service with full credit for service while disabled. Upon recovery after the age of 50, the benefit continues as the greater of the member' s disability benefit or service retirement benefit.
LEOFF Plan 2 members are vested after the completion of five years of eligible service.
Plan 2 members are eligible for retirement at the age of 53 with five years of service, or at age 50 with 20 years of service. Plan 2 members receive a benefit of2 percent of the FAS per year of service (the FAS is based on the highest consecutive 60 months), actuarially reduced to reflect the choice of a survivor option. Members who retire prior to the age of 53 receive reduced benefits. If the member has at least 20 years of service and is age 50, the reduction is 3 percent for each year prior to age 53. Otherwise, the benefits are actuarially reduced for each year prior to age 53. A cost-of-living allowance is granted (based on the Consumer Price Index), capped at 3 percent annually.
LEOFF Plan 2 provides disability benefits. There is no minimum amount of service credit required for eligibility. The Plan 2 benefit amount is 2 percent of the F AS for each year of service. Benefits are reduced to reflect the choice of survivor option and for each year that the member's age is less than 53, unless the disability is duty-related. If the member has at least 20 years of service and is age 50, the reduction is 3 percent for each year prior to age 53.
A disability benefit equal to 70 percent of their F AS, subj ect to offsets for workers' compensation and Social Security disability benefits received, is also available to those LEOFF Plan 2 members who are catastrophically disabled in the line of duty and incapable of future substantial gainful employment in any capacity. Effective June 2010, benefits to LEOFF Plan 2 members who are catastrophically disabled include payment of e1 igible health care insurance premiums.
65

Members of LEOFF Plan 2 who leave service because of a line of duty disability are allowed to withdraw 150 percent of accumulated member contributions. This withdrawal benefit is not subject to federal income tax. Alternatively, members ofLEOFF Plan 2 who leave service because of a line of duty disability may be eligible to receive a retirement benefit of at least 10 percent of F AS and 2 percent per year of service beyond five years. The first 10 percent of the F AS is not subject to federal income tax.
LEOFF Plan 2 retirees may return to work in an eligible position covered by another retirement system, choose membership in that system and suspend their pension benefits, or not choose membership and continue receiving pension benefits without interruption.
A one-time duty-related death benefit is provided to the beneficiary or the estate of a LEOFF Plan 2 member who dies as a result of injuries or illness sustained in the course of employment, or if the death resulted from an occupational disease or infection that arose naturally and proximately out of the member's covered employment, if found eligible by the Department of Labor and Industries.
Benefits to eligible surviving spouses and dependent children of LEOFF Plan 2 members killed in the course of employment include the payment of eligible health care insurance premiums.
Legislation passed in 2009 provides to the Washington-state-registered domestic partners of LEOFF Plan 2 members the same treatment as married spouses, to the extent that the treatment is not in conflict with federal laws.
LEOFF members meeting specific eligibility requirements have options available to enhance their retirement benefits. Some of these options are available to their survivors.
There are 374 participating employers in LEOFF. Membership in LEOFF consisted of the following as of the latest actuarial valuation date for the plans as of June 30, 2012:
Retirees and Beneficiaries Receiving Benefits Terminated Plan Members Entitled to But Not Yet Received Benefits Active Plan Members Vested Active Plan Members Nonvested Total
Funding Policy
10,189 689
14,273 2,633
27,784
Employer and employee contribution rates are developed by the Office of the State Actuary to fully fund the plans. Starting on July I, 2000, Plan 1 employers and employees contribute zero percent as long as the plan remains fully funded. Plan 2 employers and employees are required to pay at the level adopted by the LEOFF Plan 2 Retirement Board.
The Legislature, by means of a special funding arrangement, appropriated money from the state General Fund to supplement the current service liability and fund the prior service costs of Plan 2 in accordance with the recommendations of the Pension Funding Council and the LEOFF Plan 2 Retirement Board. This special funding situation is not mandated by the state constitution and could be changed by statue. For DRS' fiscal year 2013, the state contributed $54.2 million to LEOFF Plan 2.
The methods used to determine the contribution requirements are established under state statute in accordance with Chapters 41.26 and 41.45 RCW.
The required contribution rates expressed as a percentage of current year covered payroll as of December 31, 2013, are as follows:
Employer' Employee
LEOFF Plan 1 LEOFF Plan 2 0.18% 0.00%
5.23% 8.41%
• The employer rates include the employer administrative expense fee currently set at 0.18%.
66

Both County and the employees made the required contributions. The County' s required contributions for the years ended December 31 were as follows:
2013 2012 2011
LEOFF Plan 1 LEOFF Plan 2 $ 143 $ 213,373 $ 172 $ 222,002 $ 163 $225,561
C. Public Safety Employees' Retirement System IPSERS) Plan 2
Plan Description PSERS was created by the 2004 legislature and became effective July 1, 2006. PSERS is a cost-sharing multiple-employer retirement system comprised of a single defined benefit plan, PSERS Plan 2. PSERS retirement benefit provisions have been established by Chapter 41.37 RCW and may be amended only by the State Legislature.
PSERS membership includes: • PERS 2 or 3 employees hired by a covered employer before July I, 2006, who met at least one of the PSERS
eligibility criteria and elected membership during the election period of July I, 2006 to September 30,2006; and • Employees, hired on or after July I, 2006 by a covered employer, that meet at least one of the PSERS eligibility
criteria.
Covered employers include: • State of Washington agencies: Department of Corrections, Department of Natural Resources, Gambling
Commission, Liquor Control Board, Parks and Recreation Commission, and Washington State Patrol; • Washington State counties; • Washington State cities except for Seattle, Tacoma and Spokane and • Correctional entities formed by PSERS employers under the Interlocal Cooperation Act.
To be eligible for PSERS, an employee must work on a full-time basis and:
• Have completed a certified criminal justice training course with authority to arrest, conduct criminal investigations, enforce the criminal laws of Washington, and carry a firearm as part of the job; or
• Have primary responsibility to ensure the custody and security of incarcerated or probationary individuals; or • Function as a limited authority Washington peace officer, as defmed in RCW 10.93.020; or • Have primary responsibility to supervise eligible members who meet the above criteria.
PSERS retirement benefits are financed from a combination of investment earnings and employer and employee contributions. Employee contributions to the plan accrue interest at a rate specified by the Director of DRS. During DRS' Fiscal Year 2013, the rate was five and one-half percent compounded quarterly. Members in PSERS Plan 2 can elect to withdraw total employee contributions and interest thereon, in lieu of any retirement benefit, upon separation from PSERS-covered employment.
PSERS Plan 2 members are vested after completing five years of eligible service.
PSERS members may retire with a monthly benefit of 2 percent of the average fmal compensation (AFe) at the age of 65 with five years of service, or at the age of 60 with at least 10 years ofPSERS service credit, or at age 53 with 20 years of service. The AFC is the monthly average of the member's 60 consecutive highest-paid service credit months. There is no cap on years of service credit; and a cost-of-living allowance is granted (based on the Consumer Price Index), capped at 3 percent annually.
PSERS members who retire prior to the age of 60 receive reduced benefits. If retirement is at age 53 or older with at least 20 years of service, a 3 percent per year reduction for each year between the age at retirement and age 60 applies.
PSERS Plan 2 provides disability benefits. There is no minimum amount of service credit required for eligibility. The monthly benefit is 2 percent of the AFC for each year of service. The AFC is based on the member's 60 consecutive
67

highest creditable months of service. Benefits are actuarially reduced for each year that the member's age is less than 60 (with ten or more service credit years in PSERS), or less than 65 (with fewer than ten service credit years). There is no cap on years of service credit, and a cost-of-living allowance is granted (based on the Consumer Price Index), capped at 3 percent annuall y.
PSERS members meeting specific eligibility requirements have options available to enhance their retirement benefits. Some of these options are available to their survivors.
A one-time duty-related death benefit is provided to the beneficiary or the estate of a PSERS member who dies as a result of injuries or illness sustained in the course of employment, or if the death resulted from an occupational disease or infection that arose naturally and proximately out of the member's covered employment, if found eligible by the Department of Labor and Industries.
There are 75 participating employers in PSERS. Membership in PSERS consisted of the following as of the latest actuarial valuation date for the plan as of June 30, 2012:
Retirees and Beneficiaries Receiving Benefits Terminated Plan Members Entitled to But Not Yet Received Benefits Active Plan Members Vested Active Plan Members Nonvested
Total
Funding Policy
27 60
2,083 2,167 4,337
Each biennium, the state Pension Funding Council adopts Plan 2 employer and employee contribution rates. The employer and employee contribution rates for Plan 2 are developed by the Office of the State Actuary to fully fund Plan 2. The methods used to determine the contribution requirements are established under state statute in accordance with chapters 41.37 and 41.45 RCW.
The required contribution rates expressed as a percentage of current-year covered payrolls, as of December 31, 2013, are as follows:
Employer' Employee
PSERS Plan 2 10.54% 6.36%
, The employer rate includes the employer administrative expense fee currently set at 0.18%.
Both the County and the employees made the required contributions. The County's required contributions for the year ended December 31 were as follows:
2013 2012 2011
PSERS Plan 2 $ 335,976 $ 352,595 $ 380,233
68

D. OTHER POST Employment Benefit (OPEB) Plans Plan Description As required by the Revised Code of Washington (RCW) Chapter 41.26. Yakima County provides direct cost funding for benefits (other than pensions) promised to the Law Enforcement Officers Fire Figbters Plan I(LEOFFI). This is a single employer benefit plan. The benefit provides medical and long term care expense not payable by worker ' s compensation, social security, insurance provided by another employer or other pension plan. There are currently 42 enrolled members. There is one LEOFF member employed at the County who have not yet retired and do not currently receive LEOFF medical benefits. The benefits are 100 percent provided by the County in order to meet State Statutory requirements under the LEOFF I system, where by the County pays their medical and dental premiums and out of pocket medical costs for life.
Funding Policy The County has the authority to establish and amend contribution requirements. The fund detail is in the intemal service funds under LEOFF Benefit. For the fiscal year ended December 31 , 2013, the County's combined plan contribution was $750,000 from the General Fund. Detail for the LEOFF Benefit fund can be found in the internal service funds.
The required plan contribution is based on the projected pay-as-you-go fmancing requirements. The amortization method is open and is calculated using the mean estimated life of all 42 members. Financial reporting for the LEOFF retiree healthcare plan is included in the County's Comprehensive Annual Financial Report under the internal service funds. The calculations are based on the OPEB benefits provided under the terms the LEOFF I system and each the valuation as of December 31,2013.
AnnualOPEB Cost and Net OPEB Obligation The County's annual other post employment benefit cost is calculated based on the annual required contribution (ARC) of the employer, an amount determined in accordance within the parameters of GASB 45 using the alternative method. The ARC is the amount that would need to be contributed to "fully fund" the liability.
The following are the components of the County's annual OPEB cost and the amount actually contributed to the plan. This actuarial valuation represents the best estimate as of December 31, 2013.
Annual Required Contribution (ARC)
Interest On Net OPEB Obligation
Amortization
Total Annual OPEB Cost
Contributions Made
Increase In The Net OPEB Obligation
Net OPEB Obligation beginning of year 2013
plus Increase in Net OPEB Obligation
Net OPEB Obligation end of year 2013 (NOO)
69
$
$
$
$
1,079,356
131,924 (272,977)
938,303
(543,887)
394,416
2,931,653
394,416
3,326,069

The County's annual OPEB cost, the contribution, the percentage of annual OPEB cost contributed to the plan, and the net OPEB obligation for 2013 were as follows:
PerceJ1a1;l: Qf ~ (WR Arnlll (WR00il
Year errle.d Arru!lllit Cortribttion ObJi~on CunihUed 2008 $ 1,136,096 $ 543,590 $ 592,506 47.85% 2009 1,149,496 511,902 637,594 44.53% 2010 988,298 513,839 474,459 51.99"10 2011 1,032,173 691,123 341,050 66.96% 2012 977,326 606,563 370,763 62.06% 2013 938,303 543,887 394,416 57.96%
Funding Status As of December 31, 2013, the most recent actuarial valuation date, the plan was 0% funded. The accrued liability for benefits was $13,301,208 and the actuarial value of the assets was $0 resulting in a UAAL of $13,301 ,208. Historically, Yakima County has used a pay-as-you-go approach to funding. If Yakima County were to contribute the ARC to the plan every year, a liability would not be recorded. If the ARC is not fully funded in a given year, a liability is reported for the unpaid portion of the ARC.
Actuarial Methods and Assumptions Yakima County used the alternative measurement method permitted under GASB Statement No. 45 to determine the retiree medical liability and how much Yak:ima County should be setting aside each year to fund that liability. A single retirement age of 56.24 was assumed for all active members for the purpose of determining the AAL and normal costs. Termination and mortality rates were assumed to follow the LEOFF 1 termination and mortality rates used in the June 30, 2009, actuarial valuation report issued by the Office of the State Actuary (OSA). Healthcare costs and trends were determined by Milliman and used by OSA in the state-wide LEOFF 1 medical study performed in 2011 . The results were based on grouped data with 4 active groupings and 4 inactive groupings. The actuarial cost method used to determine the AAL was Projected Unit Credit. The AAL and NOO are amortized on an open basis as a level dollar over 10 years. These assumptions are individually and collectively reasonable for the purposes of this valuation.
The actuarial valuation for OPEB plans involve estimates of the value of reported amounts and assumptions about the probability of events far into the future, and actuarially determined amounts are subject to continual revision as results are compared to past expectations and new estimates are made about the future. The actuarial cost method used to determine the actuarial accrued liability was under a single group retirement age. These assumptions are individually and collectively reasonable for the purposes of this valuation. Measurements for medical inflation were computed at 5%, Interest at 4.5%, and an amortization period of 10 years. A copy of the report is available from Office of State Actuary in Olympia or the website http: //osa.leg.wa.gov/ActuariaIServicesiOPEB/OPEB.htm.
SCHEDULE OF FUNDING PROGRESS AChmrjaJ llnfilDded Accmed Al::baadal Bcc[IIcd
year ended Yall..le of ASSC1S I jabjlity !.iabilillilLAAI) 2007 0 $ 13,301,208 $ 13,301,208 2008 0 11 ,806,2 16 11,806,216 2009 0 12,102,260 12,102,260 2010 0 11 ,488,469 11 ,488,469
2011 0 12,094,336 12,094,336 2012 0 11 ,681,523 11 ,681,523 2013 0 11 ,485,916 11,485,9 16
70
CQ~'m~d AAI. as o,{q of ~ coycred :ea):lD11
$ 161 ,30 1 8246.20% 169,667 6958.46% 20,001 60508.27%
101 ,836 11281.34% 103,134 11726.82% 108,860 10730.78% 111,225 10326.74%

VI. RISK MANAGEMENT
A. Liability Insurance
The County is exposed to various risks of losses related to torts: theft of, damage to, and destruction of assets, error and omissions; injuries to employees; and natural disasters. The County maintains certain comprehensive general liability and property insurance, public official and law enforcement liability insurance, and excessive auto liability insurance for claims. It is the opinion of management and legal counsel that such claims and lawsuits are either covered by the County's insurance policies, if they should exceed the County's retained risk, or are recorded in the government-wide financial statements. During the past three years, the amount of settlements in cases covered by insurance has not exceeded the insurance coverage. The County is substantially self insured for its vehicles and all other perils including worker's compensation and general liability below $500,000. Claims over $500,000 are covered by the Washington Counties Risk Pool.
Yakima County is a member of the Washington Counties Risk Risk Pool ("Risk Pool"). Other Washington counties that are Risk Pool members include: Adams, Benton, Chelan and Clallam, Clark, Columbia, Cowlitz and Douglas, Franklin, Garfield, Grays Harbor and Island, Jefferson, Kittitas, Lewis and Mason, Okanogan, Pacific, Pend Oreille and San Juan, Skagit, Skamania, Spokane and Thurston, Walla Walla and Whatcom Counties. Kitsap, Klickitat and Whitman Counties are former Risk Pool members, having voluntarily terminated their memberships beginning October I st of 20 I 0, 2002 and 2003 respectively.
Contingent Liability: The Risk Pool is a cooperative program with joint liability among its participating members. Contingent liabilities occur when assets are not sufficient to cover liabilities. Deficits resulting from any of the Risk Pool 's fiscal years are fmanced by proportional reassessments (aka retroactive assessments) among the deficient year's membership. The Risk Pool's reassessments receivable balance at December 31 , 2013 was ZERO ($0) as no contingent liabilities were known to exist at that time.
Joint Self-Insurance Liability Program ("JSILP"): The Risk Pool, which recently celebrated its Silver Anniversary, has been providing its membership with occurrence-based, jointly purchased and/or jointly self-insured 3'" -party liability coverage since October I, 1988 for bodily injury, personal injury, property damage, errors and omissions, and advertising injury caused by an occurrence during the policy period and occurring anywhere in the world. Total coverage limits have grown from the $1 million limit that existed during the Risk Pool's initial two insuring months to $5 million, then to $10 million and $15 million before reaching the $20 million occurrence limit that has existed since October 1, 2003. (Note: Additional occurrence limits of $5 million have been available for many years for member counties to choose as an individual county-by-county option.) There are no aggregate limits to the payments the WCRP makes for anyone member county or all member counties combined.
The initial $10 million in coverage is jointly self-insured. The remaining JSILP coverage, up to $15 million, is acquired as "following form" excess insurance from higher rated commercial carriers. Member counties annually select a deductible amount applicable to each occurrence from these options: $10,000, $25,000, $50,000, $100,000, $250,000 or $500,000.
Reinsurance is acquired from higher rated carriers as well to protect the Risk Pool directly and its member counties indirectly from larger-valued losses. The reinsuring program is written with a self-insured retention ("SIR") equal to the greater of the applicable member' s deductible or $100,000. The reinsuring agreements also include first and second layer corridor elements - to $1 million and from $1 to $2 million - with cumulative (WCRP) retentions of $2.95 and $0.65 million and annual aggregate limits of $40 and $20 million respectively. 616 third-party liability claims (and lawsuits) were reported to the Pool by its member counties during Py2013, and added to the Risk Pool's administrative database. This represented a 3% reduction in year-over-year filings and a continuation of recent years' decline in annual filings. The new filings raised the to-date total (Oct 1988 - Sep 2013) to 19,232. Total incurred losses (payments made plus reserve estimates for open claims) increased $8.1 million during Py2013 to $250.9 million. The annual amount is 50% more than the corresponding Py2012 amount of $5.4M, but it represents just 51 % of the Py2011 increase of $16.0M, 46% of the $17.8M in Py2010, and only 39% of the $20.8M annual average for Py2007 through Py2009. Only 327 claims remained classified as 'open ' at year-end. With 307 additional claims projected by the actuary from all years as incurred but not yet reported (" IBNR"), the Risk Pool's estimated ultimate claims totaled 19,539 as of September 30, 2013.
71

The independent actuary's projection of total reserves for claims that are expected to be the Risk Pool' s responsibility decreased slightly (-I %) from Py2012 to $14.6 million. This amount includes $3.4 million (-21 % from Py2012) for losses within the Risk Pool ' s self-insured retention, $10.0 million (+7%) for losses subject to the "corridor" programs with the Risk Pool's reinsurers, $0.2 million for losses within the Py2013 quota-shared (10%) upper reinsured layer, and $1.0 million (+3%) for estimated unallocated loss adjustment expenses.
Washington Counties Property Program ("WCPP"): Beginning with Py2006 (October I, 2005), WCRP added property insurance as a county-by-county option that is jointly-purchased from a consortium of higher rated commercial carriers. Since the initial offering, both participation and the total values of covered properties have nearly doubled. Twenty six WCRP counties with covered properties totaling over $2.7 billion participated in the optional insuring program during Py20 13 .
The WCPP includes All Other Peril coverage limits of $500 million per occurrence for losses to buildings and contents, vehicles, mobi le/contractors equipment, EDP and communication equipment, etc., as well as Flood and Earthquake (catastrophe) coverages with separate occurrence limits, each being $200 million. All Other Perils coverage limits apply to any occurrence, even those affecting more than one participating county, and there are no annual (AOP) aggregate limitations. Flood and Earthquake coverages each include annual aggregate limits of $200 million. The WCPP coverage also includes sublimited items, e.g. Equipment BreakdownIBoiler & Machinery ($100 million), Special Flood Hazard Areas ($25 million) . There are also endorsements for Green Construction Upgrades, Reproduction Coverage for Historic Structures, and Terrorism ($20 million). AOP occurrence deductibles, which the participating counties select annually and which the counties are solely responsible for paying, range between $5,000 and $50,000. Higher deductibles are applicable to losses resulting from catastrophe relevant losses.
There were 15 claims filed during Py2013 by participating counties with loss estimates totaling $2.6 million and losses paid by fiscal year-end of $1.5 million. During its initial eight years as a WCRP optional insuring program, there have been 103 WCPP claims filed with to-date incurred losses totaling $15.5 million and losses paid through fiscal 2013 of $8.9 million. Considering the fact that to-date WCPP premiums have totaled $22.2 million, the WCPP's cumulative loss ratio is below 0.7.
Other Insurances: Several member counties also use the Risk Pool 's contracted producer (broker) to secure other (specialty) insurances. Examples include public officials bonds and crime (and fidelity), cyber risks/security, special events/concessionaires, underground storage tank and other enviromnental hazards insurance coverages.
Governance / Oversight: The Risk Pool is governed by a board of directors consisting of one director (and at least one alternate director) appointed by each member county. The Board, which is made up ofhoth elected and appointed county officials, meets three times each year with the summer meeting being the Pool's Annual Meeting. The board of directors is responsible for a) determining the extent of the 3"' -party self-insured liability coverage to be offered (approving the insuring document or coverage form), b) selecting the reinsurance program(s) to acquire and the excess insurance(s) to be jointly purchased or offered for optional purchase by the member counties, c) approving the Risk Pool's annual operating budget(s) and work program(s), and d) approving the members' deposit assessment and reassessment formulas for the policy year ensuing and for any deficient prior period(s).
Regular oversight of the Risk Pool 's operations is provided by an II -person executive committee selected from and by the WCRP Board. Committee members are elected to staggered 3-year terms. The Committee meets several times throughout each policy year to: a) approve all WCRP disbursements and review the Risk Pool 's financial health; b) approve case settlements exceeding the applicable member' s deductible by at least $50,000; c) review all claims with incurred loss estimates exceeding $100,000; and d) evaluate the Risk Pool ' s operations and program deliverables as well as the Executive Director' s performance. Committee members are expected to participate in the Board's standing committees (fmance, personnel, risk management, and underwriting) for development or review/revision of the organization 's policies and coverage documents . Financial Summary: During fiscal 2013, Risk Pool assets grew 11 % (+$4.8 million) and liabilities by 3% (+$1.0 million). Its net (financial) position, which is commonly referred to as "net assets" and sometimes as "owners' equity", improved 30% (+$3 .9 million) during the Risk Pool 's Silver Anniversary year to $16.7 million as of September 30, 2013. Much of the net position is ' restricted ' ($12.5 million) to address the Board of Directors' recently revised requirements in section D of its Underwriting Policy. NOTE: This policy revision resulted in the Risk Pool 's own restriction increasing
72
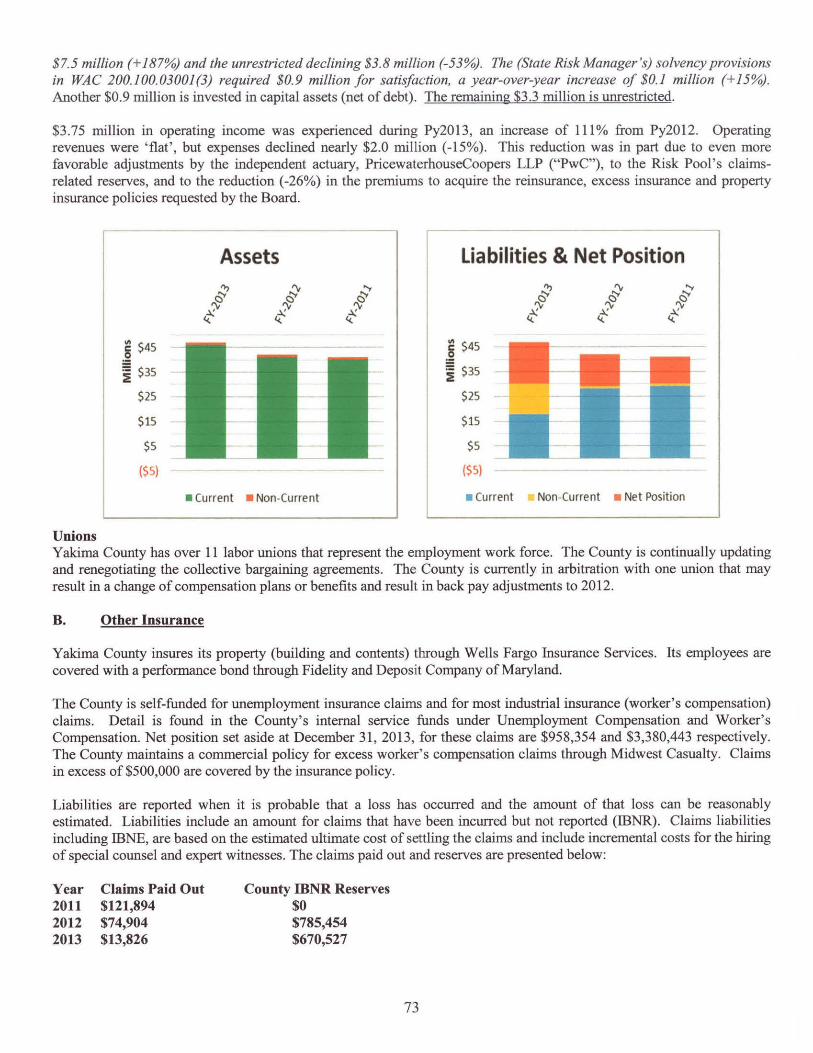
$7.5 million (+ 187%) and the unrestricted declining $3.8 million (-53%). The (State Risk Manager's) solvency provisions in WAC 200.100.03001(3} required $0.9 million for satisfaction, a year-over-year increase of $0.1 million (+15%). Another $0.9 million is invested in capital assets (net of debt). The remaining $3.3 million is unrestricted.
$3.75 million in operating income was experienced during Py2013, an increase of III % from Py2012. Operating revenues were 'flat', but expenses declined nearly $2.0 million (-15%). This reduction was in part due to even more favorable adjustments by the independent actuary, PricewaterhouseCoopers LLP ("PwC"), to the Risk Pool's claimsrelated reserves, and to the reduction (-26%) in the premiums to acquire the reinsurance, excess insurance and property insurance policies requested by the Board.
Unions
~ $45 .~
~ $35
$25
$15
$5
($5)
Assets
- Current _ Non-Current
liabilities & Net Position
~ $45 .~
~ $35
$25 -
$15
$5
($5)
_ Current Non-Current _ Net Position
Yakima County has over II labor unions that represent the employment work force. The County is continually updating and renegotiating the collective bargaining agreements. The County is currently in arbitration with one union that may result in a change of compensation plans or benefits and result in back pay adjustments to 2012.
B. Other Insurance
Yakima County insures its property (building and contents) through Wells Fargo Insurance Services. Its employees are covered with a performance bond through Fidelity and Deposit Company of Maryland.
The County is self-funded for unemployment insurance claims and for most industrial insurance (worker'S compensation) claims. Detail is found in the County's internal service funds under Unemployment Compensation and Worker' s Compensation. Net position set aside at December 31, 2013 , for these claims are $958 ,354 and $3,380,443 respectively. The County maintains a commercial policy for excess worker 's compensation claims through Midwest Casualty. Claims in excess of $500,000 are covered by the insurance policy.
Liabilities are reported when it is probable that a loss has occurred and the amount of that loss can be reasonably estimated. Liabilities include an amount for claims that have been incurred but not reported (IBNR). Claims liabilities including IBNE, are based on the estimated ultimate cost of settling the claims and include incremental costs for the hiring of special counsel and expert witnesses. The claims paid out and reserves are presented below:
Year 2011 2012 2013
Claims Paid Out $121,894 $74,904 $13,826
County mNR Reserves $0 $785,454 $670,527
73

VTI. CONTINGENT LIABILITIES
Amounts received or receivables from grantor agencies are subject to audit and adjustment by grantor agencies, principally the federal government. Any disallowed claims, including amounts already collected, may constitute a liability of the applicable funds . The amount, if any, of expenditures which may be disallowed by the grantor cannot be determined at this time, although the County expects such amounts, if any, to be immaterial.
Yakima County is named as the defendant in various lawsuits. Although the outcome of these legal actions is not presently determinable, the County is of the opinion that present reserves are available to adequately cover potential settlements without adversely affecting the financial condition of the County.
Yakima County has settled several matters in litigation in 2013. The final expenditure for resolved litigation was $923,699 found in the Liability Insurance Fund, listed as an Internal Service Fund.
VTII. JOINT VENTURE
The County had entered into a joint venture agreement with the City of Yakima to operate the Yakima Air Terminal. The joint venture agreement terminated effective February 12, 2013.
During the remaining 2013 year, the Yakima Air Terminal (YAT) was considered a component of the City of Yakima. Residual litigation matters concerning prior years operations are still covered under the joint operating agreement between the City and County. If and when litigation is resolved, any court fees and settlements would be split under the originally 50/50 arrangement.
IX. OTHER DISCLOSURES
A. Prior Period Adjustments In September 2012, Public Services Accounting initiated staffing changes that facilitated the hiring of a new accountant with the oversight of the Public Services Utility funds . With the change, a very thorough review was completed on the liabilities of the utility funds . It was discovered that there was an error in booking a liability for an amendment to a contract for developer constructed infrastructure contributions associated with a latecomer's agreement. The liability needed to reflect an increase of $63,000 to properly reflect the correct balance.
B. Related Parties In 1982, Yakima County authorized the creation of the Industrial Revenue Bond Public Corporation of Yakima County. This is a public corporation whose purpose is to issue tax-exempt nonrecourse revenue bonds to fmance industrial development within the County.
Revenue bonds issued by the corporation are payable solely from revenues of the industrial development facility funded by the revenue bonds. It is neither a liability, nor a contingent liability of Yakima County, nor a lien on any of its properties or revenues. The cumulative total of outstanding bonds issued by the Corporation as of December 31, 2013, was $5,600,000. The December 31, 2013, ending cash and investments at fair value balance was $44,723.
The County has reviewed the Public Corporation as a potential component unit. Although the Board of County Commissioners comprises the Board of Directors for the Public Corporation, the County receives no financial benefit from and assumes no fmancial responsibility whatsoever for the debt of the Corporation.
In November 2009, Yakima County entered into an interlocal agreement with the City of Yakima. The City of Yakima now provides purchasing services for the County. The combining of the purchasing functions was designed to reduce costs and streamline the purchase order systems for the County. The County paid City of Yakima for the purchasing services for the following years:
74
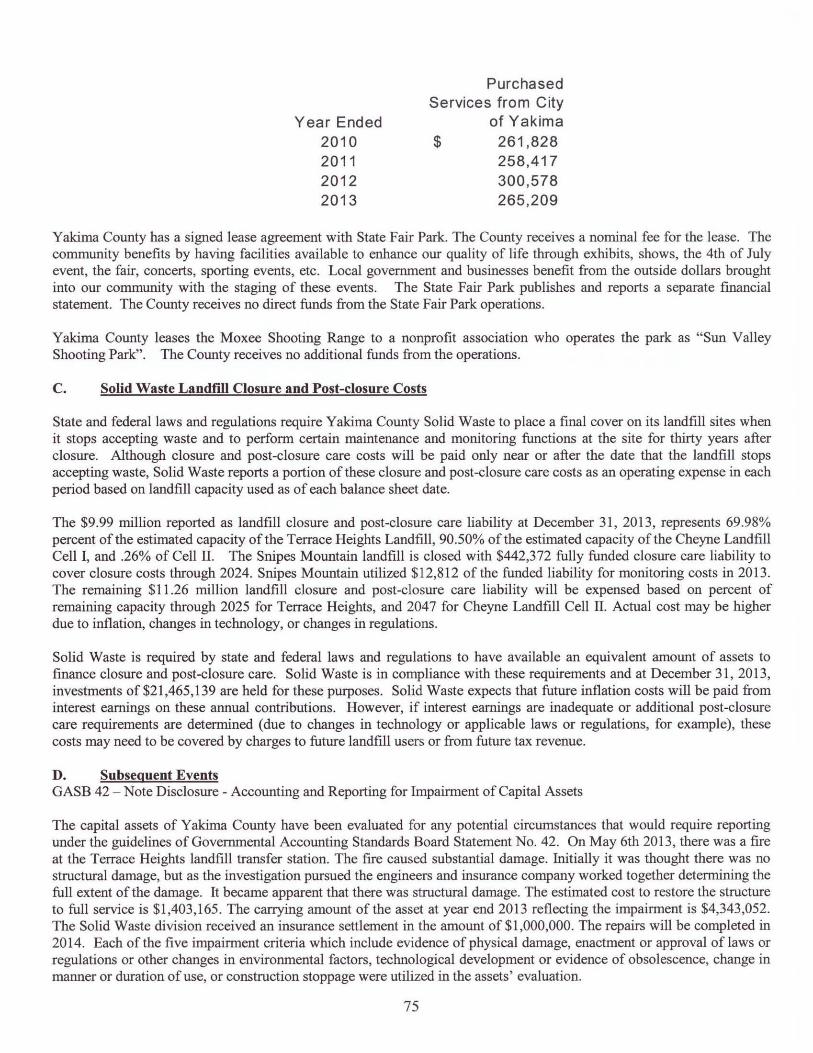
Year Ended 2010 2011 2012 2013
Purchased Services from City
of Yakima $ 261,828
258,417 300,578 265,209
Yakima County has a signed lease agreement with State Fair Park. The County receives a nominal fee for the lease. The community benefits by having facilities available to enhance our quality of life through exhibits, shows, the 4th of July event, the fair, concerts, sporting events, etc. Local govemment and businesses benefit from the outside dollars brought into our community with the staging of these events. The State Fair Park publishes and reports a separate fmancial statement. The County receives no direct funds from the State Fair Park operations.
Yakima County leases the Moxee Shooting Range to a nonprofit association who operates the park as "Sun Valley Shooting Park". The County receives no additional funds from the operations.
C. Solid Waste LandfIll Closure and Post-closure Costs
State and federal laws and regulations require Yakima County Solid Waste to place a fmal cover on its landfill sites when it stops accepting waste and to perfonn certain maintenance and monitoring functions at the site for thirty years after closure. Although closure and post-closure care costs will be paid only near or after the date that the landfill stops accepting waste, Solid Waste reports a portion of these closure and post-closure care costs as an operating expense in each period based on landfill capacity used as of each balance sheet date.
The $9.99 million reported as landfill closure and post-closure care liability at December 31, 2013, represents 69.98% percent of the estimated capacity of the Terrace Heights Landfill, 90.50% of the estimated capacity of the Cheyne Landfill Cell I, and .26% of Cell ll. The Snipes Mountain landfill is closed with $442,372 fully funded closure care liability to cover closure costs through 2024. Snipes Mountain utilized $12,812 of the funded liability for monitoring costs in 2013. The remaining $11.26 million landfill closure and post -closure care liability will be expensed based on percent of remaining capacity through 2025 for Terrace Heights, and 2047 for Cheyne Landftll Cell ll. Actual cost may be higher due to inflation, changes in technology, or changes in regulations.
Solid Waste is required by state and federal laws and regulations to have available an equivalent amount of assets to fmance closure and post-closure care. Solid Waste is in compliance with these requirements and at December 31,2013, investments of $21 ,465,139 are held for these purposes. Solid Waste expects that future inflation costs will be paid from interest earnings on these annual contributions. However, if interest earnings are inadequate or additional post-closure care requirements are determined (due to changes in technology or applicable laws or regulations, for example), these costs may need to be covered by charges to future landfill users or from future tax revenue.
D. Subsequent Events GASB 42 - Note Disclosure - Accounting and Reporting for Impairment of Capital Assets
The capital assets of Yakima County have been evaluated for any potential circumstances that would require reporting under the guidelines of Governmental Accounting Standards Board Statement No. 42. On May 6th 2013, there was a fire at the Terrace Heights landfill transfer station. The fire caused substantial damage. Initially it was thought there was no structural damage, but as the investigation pursued the engineers and insurance company worked together determining the full extent of the damage. It became apparent that there was structural damage. The estimated cost to restore the structure to full service is $1,403,165 . The carrying amount of the asset at year end 2013 reflecting the impainnent is $4,343,052. The Solid Waste division received an insurance settlement in the amount of $1 ,000,000. The repairs will be completed in 2014. Each of the five impairment criteria which include evidence of physical damage, enactment or approval of laws or regulations or other changes in environmental factors, technological development or evidence of obsolescence, change in manner or duration of use, or construction stoppage were utilized in the assets' evaluation.
75
Last year's federal court decision in Thurston County made property taxation unifonn on the trust lands, regardless of who owns buildings. The decision exempted property taxes on land and property owned by Indians. A 1955 federal law established that sovereign Indian nations are exempt from paying local or state taxes on federal lands held in trust for tribes. As a result, the land itself was exempt from county property taxes. Buildings and other improvements on that land also were considered exempt, if owned by Indians. The court decision is retroactive to the second half of2011. It covers any 2014 property taxes already paid to the county. The impact to Yakima County is less than $500,000, the majority of property affected is small crop land use within the Yakama Nation.
April 15,2014 the County Commissioners approved a SIED contract with the City of Yakima for Cascade Mill District Development Project. The approval was for a $900,000 grant and a $900,000 loan. The contract is to provide for the construction of infrastructure improvements, with a goal of promoting businesses and providing jobs in the rural distressed areas. Repayment of the loan is due to the County by June 1, 2017 at 2.44 % interest.
June 17, 2014 the County Commissioners passed an ordinance prohibiting the production, processing and retail sale of recreational marijuana in all districts within Yakima County. On November 6,2012 the voters of the State of Washington approved Initiative Measure 1-502 which provides decriminalized possession and use of certain amounts of marijuana and marijuana paraphernalia. Under the Growth Management Act Counties are empowered and authorized to adopt land use controls to provide for the regulation of land uses within the county. Furthermore, Washington State Attorney General's office has concluded that local jurisdictions may exercise appropriate constitutional powers over commerce and enterprise.
At the end of2014, Aging and Long Term Care, a major fund, will leave the County and start operations as a separate entity. Aging & Long Tenn care will operate as a council of governments for the eight counties it represents in South Central Washington. This fonnat is similar to the operations in Western Washington. Operations for older and disabled citizens will continue to all 13,000 square miles encompassing: Kittitas, Yakima, Benton, Franklin, Walla Walla, Columbia, Grant and Asotin counties.
76

This page left blank intentionally.
77

This page left blank intentionally.
78

This page left blank intentionally.
79