FINANCIAL STATEMENTS - Cision
64
FINANCIAL STATEMENTS 2008
-
Upload
khangminh22 -
Category
Documents
-
view
0 -
download
0
Transcript of FINANCIAL STATEMENTS - Cision

FINANCIAL STATEMENTS
2008


Report of the Board of Directors 2
Consolidated income statement 10
Consolidated balance sheet 11
Changes in shareholders’ equity in the financial period ended 31 December 2008 12
Consolidated cash flow statement 13
Accounting principles for consolidated financial statements 14
Notes to the consolidated income statement 22
Notes to the consolidated balance sheet 27
Financial indicators 41
Share indicators 42
Calculation of indicators 43
Shares and shareholders 44
Parent company income statement 49
Parent company balance sheet 50
Parent company cash flow statement 51
Parent company accounting principles 52
Notes to the parent company income statement 53
Notes to the parent company balance sheet 55
Other notes to the parent company accounts 59
Board’s proposal for the disposal of profit 60
Auditors’ report 60
Statement of the Supervisory Board 60
ontents

In 2008, Raisio succeeded in reaching its target to improve profitability, although the overall situation clearly weakened for many food chain players. Thanks to the measures taken, Raisio is now in good shape both financially and operationally. A skilled, competent and motivated personnel has been vital to the turnaround carried out in the company.
This change, carried out in two years, has ensured a good level for Raisio’s operations, operational efficiency and profitability. The turnaround was carried out faster than was generally believed to be possible. Raisio has good opportunities to develop as a company whose operations lie on an ecologically, ethically and economically sustainable foundation.
To further develop the company, Raisio is now examining its businesses to determine which of them promise future growth and a positive cash flow and what sort of measures are needed in order to achieve them in the changes taking place in the food chain. Shifts in the business environment are more of an opportunity than a threat to Raisio. Raisio’s future success is based on continuous improvement, concentration and a pioneering approach.
The global recession affects different sectors in very dif-ferent ways. Raisio’s businesses are defensive, since basic consumption is stable by nature. At the end of 2008, Raisio’s financial and operational performance was in a class of its own compared to many other players, thanks to the company’s strong balance sheet. The food industry will face consolida-tion, which strong companies can take advantage of. Raisio is capable of playing an active role in the consolidation process of the food industry if it opens up interesting opportunities for Raisio’s shareholders.
RESULT FROM CONTINUING OPER ATIONS
In 2008, Raisio’s net sales increased by 19.5 per cent to EUR 504.0 million (EUR 421.9 million in 2007). The Food Division reported net sales of EUR 201.8 million (EUR 197.1 million), the Feed & Malt Division EUR 282.7 million (EUR 206.7 mil-lion) and the Ingredients Division EUR 44.3 million (EUR 44.9 million).
The growth in net sales was mainly driven by the rise in raw material prices and the increased volumes in all businesses. The biggest growth was seen in the feed and malt businesses. Net sales from outside Finland represented 40.3 per cent (37.5%) of the total, amounting to EUR 203.1 million (EUR 158.0 million).
The Group’s operating result in 2008 was EUR 28.3 million (EUR 10.6 million) and, excluding one-off items, EUR 24.1 million (EUR 9.9 million). The Food Division’s operating result was EUR 9.7 million (EUR -11.1 million) and, excluding one-off items, EUR 5.5 million (EUR -5.8 million). The operating result of the Feed & Malt Division was EUR 12.3 million (EUR 14.2 million) and, excluding one-off items, EUR 12.3 million (EUR 8.2 million), while that of Ingredients was EUR 10.0 mil-lion (EUR 9.5 million) and that of other operations EUR -3.4
million (EUR -2.1 million). Depreciation, allocated to opera-tions in the income statement, totalled EUR 18.1 million (EUR 18.3 million).
In the first quarter of 2008, Raisio recognised a one-off income item of EUR 4.2 million in the Food Division from the dissolu-tion of joint ventures with Lantmännen, a Swedish corporation. The year before, Raisio recognised impairments in the Food Division and a reversal of impairment in the fixed assets of the Feed & Malt Division. The impact of one-off items on the Group’s operating result in 2007 was EUR 0.7 million.
Raisio’s pre-tax result was EUR 27.5 million (EUR 9.5 million) and, excluding one-off items, EUR 23.3 million (EUR 8.8 mil-lion). The Group’s net financial expenses totalled EUR -0.8 mil-lion (EUR -0.7 million). Raisio’s result after tax was EUR 22.2 million (EUR 8.3 million) and, excluding one-off items, EUR 18.0 million (EUR 8.3 million). Tax for the period was EUR -5.3 million (EUR -1.2 million) and, excluding one-off items, EUR -5.3 million (EUR -0.6 million). Earnings per share were EUR 0.14 (EUR 0.05) and, excluding one-off items, EUR 0.12 (EUR 0.05). Return on investment was 9.8 per cent (3.5%).
INVESTMENTS
The Group’s gross investments in 2008 totalled EUR 29.1 million (EUR 31.4 million), or 5.8 per cent (7.5%) of net sales. The Food Division made gross investments of EUR 16.6 million (EUR 7.2 million), Feed & Malt EUR 9.3 million (EUR 16.7 mil-lion), Ingredients EUR 1.3 million (EUR 7.5 million) and other operations EUR 1.9 million (EUR 1.6 million).
The biggest single investment was the acquisition of a 25% holding in Melia Ltd from Lantmännen. The most significant investments in production were the ones made in the highly efficient Ylivieska feed factory completed in summer 2008 and in the container loading station for malts.
BALANCE SHEET AND FINANCIAL POSIT ION
Raisio’s balance sheet total was EUR 364.0 million (EUR 360.3 million) and shareholders’ equity amounted to EUR 279.4 million (EUR 278.8 million). Equity per share was EUR 1.79 (EUR 1.70) at the end of December.
The Group’s interest-bearing financial debt at the end of the review period was EUR 19.7 million (EUR 7.2 million). The net interest-bearing financial debt totalled EUR -58.2 million (EUR -36.5 million). The equity ratio at the end of the year was 77.9 per cent (77.9%), and the gearing ratio was -20.8 per cent (13.1%). Cash flow from operations before investments was EUR 52.7 million (EUR 15.6 million). At the end of the year, working capital totalled EUR 88.9 million (EUR 100.5 million on 31 December 2007). It was reduced by the decrease in inventories and other non-interest-bearing receivables.
Raisio plc paid EUR 6.3 million in dividends in 2008 and used EUR 1.6 million for share repurchases.
EPORT OF THE BOARD OF DIRECTORS
RAISIO’S FINANCIAL STATEMENTS 20082

CONTINUING OPER ATIONS
Raisio’s turnaround took full effect in 2008. The measures were successful, leading to improvements under difficult conditions. This resulted in a notable improvement in prof-itability, as well as in bigger volumes, enhanced operations and successful launches of new products. As a forerunner in plant-based, ecological nutrition, Raisio is well positioned to meet the new challenges facing the food chain.
Food
The Food Division changed direction quickly and according to plan at a time when the food industry is facing great diffi-culties. By renewing its product portfolio and offering in line with consumer needs, by enhancing production and the supply chain and by developing flexible pricing systems, the Food Division increased its net sales and considerably improved profitability compared to the previous year.
The net sales of Raisio’s Food Division were EUR 201.8 million (EUR 197.1 million). Finland accounted for over 50 per cent of the Division’s net sales, while Poland, the second big-gest market area, accounted for over 20 per cent. The sales volumes of the main brands increased in Northern Europe and Poland, and operating result was positive. Operations in Russia, the only market area to record losses, were ration-alised to improve profitability.
In 2008, the changes in Raisio’s brand strategy were carried out in retail products. In Northern European operations, the total number of products dropped by 20 per cent from the previous year despite Raisio launching several new products in its market area. In Finland, the company moved from six-teen brands to four strategic brands: Elovena, Keiju, Sunnuntai and Benecol. The company has strong and trusted brands in the fields of breakfasts and snacks, baking and spreads. The product range was renewed in all market areas in accordance with consumer needs.
The Food Division achieved organic growth through the launch of Elovena products in Poland, Estonia and Sweden. The main marketing and sales input in Finland was the introduction of Elovena snack drinks. The drinks have found their way to con-sumers, and the sales have stabilised at a good level.
One of the main events in 2008 was the introduction of a label indicating the carbon dioxide emissions of products. The label was first added to Elovena oat flakes. Raisio will expand the use of CO2 emissions labelling in its retail products.
In the Swedish market, Keiju products were replaced with margarines re-launched under the Carlshamn Mejeri com-pany brand. In Finland, Raisio took sole responsibility for the sales of Benecol products. Sales of Benecol products con-tinued to grow in Poland, where Raisio is the market leader in cholesterol-lowering functional margarines with a market share of more than 70 per cent. In Russia, the focus of opera-tions moved to grain products.
The Food Division’s operating result was EUR 9.7 million (EUR -11.1 million) and, excluding one-off items, EUR 5.5 mil-lion (EUR -5.8 million), which represents 2.7 per cent of net sales. Operating result benefited especially from the good
30
20
10
0
–10
–20
–30
Operating result
ExCLudINg ONE-OFF ITEMS <
–2.4
–28.
1
2006 2007
9.9
10.6
2008
24.1
28.3
EuR MILLION
30
20
10
0
–10
–20
–30
–40
ExCLudINg ONE-OFF ITEMS <
–1.0
–33.
2
2006 2007
9.5
8.8
2008
27.5
23.3
Result before taxes
EuR MILLION
500
400
300
200
100
0
Net sales
402.
6
421.9
2006 2007 2008
EuR MILLION
504.
0
FOOd 39%
FEEd & MALT 54%
INgREdIENTS 7%
Distribution of turnover
RAISIO’S FINANCIAL STATEMENTS 2008 3

performance of Polish operations in the second half of the year. The Food Division posted a profitable operating result in every quarter. Factors contributing to the improvement in profitability included the product range renewal in accord-ance with consumer needs, the enhancement of processes and the consistent development of supply chain management, which improved the reliability of deliveries and reduced waste. The Food Division’s operating result includes a one-off item of EUR 4.2 million from the dissolution of joint ventures with Lantmännen. The operating result reported for 2007 includes impairment totalling EUR 5.3 million.
In 2009, Raisio’s Food Division’s targets are profitable growth and increasingly deep, consumer-oriented co-operation with customers. The Division offers innovative products based on consumer needs, which emphasise the promotion of well-being and safety without compromising on flavour. Plant-based, nationally produced nutrition is inexpensive and healthy and less harmful to the environment.
Feed & Malt
The net sales of the Feed & Malt Division grew considerably in 2008 as a result of the increase in raw material prices. Higher pressing margins in vegetable oils and the good performance development in malt were the main contributors to the Divi-sion’s improved profitability. In feeds, Raisio strengthened its market position in Finland.
The Feed & Malt Division’s net sales were up on the previous year by nearly 37 per cent to EUR 282.7 million (EUR 206.7 million). The increase was mainly based on the price increases in feed raw materials and energy, as well as on the growth in feed volumes. Exports to Russia increased by five per cent in terms of volume. Nearly 70 per cent of feed exports consist of fish feeds, while farm feeds account for the rest.
The sales volumes of feeds increased and the market position strengthened. Raisio’s market share of the feed mixes sold in Finland is some 40 per cent. Competition remained challenging in the market. In Finland, livestock production remained at the same level as the previous year. Raisio boosted co-operation especially with Finnish dairy co-operatives. Direct invoicing rose to more than 50 per cent of all feed invoicing.
Key figures for the food division
10–12/2008 7–9/2008 4–6/2008 1–3/2008 2008 2007
net sales, eur million 51.3 51.7 49.7 49.0 201.8 197.1
NORThERN EuROpE, EuR MILLION 38.2 36.6 34.9 35.2 144.8 148.1
EASTERN EuROpE, EuR MILLION 14.7 16.5 16.0 15.5 62.7 53.9
operating result, eur million 2.6 1.4 0.9 4.8 9.7 –11.1
one-off items, eur million 0.0 0.0 0.0 4.2 4.2 –5.3
operating result excluding one-off items, eur million 2.6 1.4 0.9 0.6 5.5 –5.8
% of net sales 5.1 2.7 1.8 1.2 2.7 –2.9
investments, eur million 0.4 1.0 1.4 13.8 16.6 7.2
net assets, eur million 81.6 81.0 83.6 86.0 81.6 85.8
80
60
40
20
0
Equity ratio
%
2006
75.0
2007
77.9
2008
77.9
50
40
30
20
10
0
–10
–20
Cash flow15
.1–1
8.2
2006
EuR MILLION
CASh FLOw FROM buSINESS OpERATIONSCASh FLOw AFTER INvESTMENTS
2007
–6.2
15.6
2008
28.8
52.7
RAISIO’S FINANCIAL STATEMENTS 20084

Key figures for the feed & malt division
10–12/2008 7–9/2008 4–6/2008 1–3/2008 2008 2007
net sales, eur million 70.8 78.7 68.9 64.3 282.7 206.7
FEEd, EuR MILLION 61.4 65.4 56.2 53.0 235.9 175.5
MALT, EuR MILLION 9.5 12.8 11.9 9.3 43.5 30.1
OThER, EuR MILLION 0.2 0.7 1.0 2.3 4.1 1.7
operating result, eur million 2.0 4.3 4.2 1.7 12.3 14.2
one-off items, eur million 0.0 0.0 0.0 0.0 0.0 6.0
operating result excluding one-off items, eur million 2.0 4.3 4.2 1.7 12.3 8.2
% of net sales 2.8 5.5 6.1 2.6 4.3 4.0
investments, eur million 2.8 1.7 2.6 2.3 9.3 16.7
net assets, eur million 81.7 100.9 122.9 104.0 81.7 86.0
The highly efficient feed factory in Ylivieska was inaugurated in summer 2008, and production at the Oulu factory was closed down at the end of September. The pelletisation line transferred from Oulu to Ylivieska is up and running. The EUR 20 million factory investment enables around one-tenth of feeds needed in Finland to be produced in Ylivieska, at the heart of Finland’s milk-producing region. Raisio’s three feed factories are located close to customers and raw material suppliers, which enhances the cost-effectiveness of the logistical chain.
Raisio’s malting capacity was in full use in 2008. The price of malt reached record figures in early 2008, but quickly turned downward after a good crop. The overall malt market grew slightly, but growth in Europe stabilised. Most of the growth in beer consumption took place in the Far East, Latin America and Africa. In Russia, growth levelled off after rising steeply for several years. The new container loading station enables beer and whisky malt deliveries to the Far East.
The Feed & Malt Division’s operating result was EUR 12.3 million (EUR 14.2 million) and, excluding one-off items, EUR 12.3 million (EUR 8.2 million). It improved from the previous year thanks to the enhanced pressing margins in oil milling and the good profit development in malt. The operating result reported for 2007 includes a EUR 6.0 million reversal of fixed asset impairment in malt.
The target of Raisio’s feed business is to be the most cost-effective and highly valued specialist in the field in Finland, as well as a significant player in north-western Russia. Growth in feeds is sought in Finland and partnerships will be deepened with livestock farms and fish farms. The targets in the malt business are to boost partnerships, maintain reaction speed in the changing markets and secure the supply of Finnish malt barley.
Grain market
The events seen on the grain market in 2008 proved how quickly things can change. Last year’s crop was of a record size world-wide and the grain supply grew steeply. The demand for grain decreased in the autumn due to the global economic crisis, and grain prices took a downward turn. The drop levelled off toward the end of the year. Annual volatility in grain supply will be big and prices will continue to fluctuate.
20
10
0
–10
–20
–30
Net gearing
–18.
9
2006 2007
%
–13.
1
2008
–20.
8
0.2
0.1
0
–0.1
–0.2
Earnings and dividend per share
2006 2007 2008
0.14
0.12 0.0
7*
0.05
0.05
0.04
–0.0
2
–0.2
2
0.03
€
EARNINgS/ShAREEARNINgS/ShARE ExCLudINg ONE-OFF ITEMSdIvIdENd/ShARE
*bOARd’S pROpOSAL
RAISIO’S FINANCIAL STATEMENTS 2008 5

Key figures for the ingredients division
10–12/2008 7–9/2008 4–6/2008 1–3/2008 2008 2007
net sales, eur million 10.5 11.0 10.1 12.7 44.3 44.9
operating result, eur million 1.8 3.1 1.7 3.3 10.0 9.5
one-off items, eur million 0.0 0.0 0.0 0.0 0.0 0.0
operating result excluding one-off items, eur million 1.8 3.1 1.7 3.3 10.0 9.5
% of net sales 17.1 28.5 17.4 25.9 22.5 21.2
investments, eur million 0.3 0.1 0.2 0.7 1.3 7.5
net assets, eur million 38.3 42.1 40.1 43.9 38.3 46.0
The strength of Raisio’s grain purchase is that the company is able to use grain in the most suitable way depending on its quality and availability. To ensure the availability and suf-ficiency of Finnish grain raw material, Raisio actively partici-pates in developing the whole grain chain. The company will continue to develop the fixed-price system it implemented two years ago. Raisio will continue to offer farmers pricing mechanisms and alternatives so that both parties can spread the price risk carried by the crop.
To improve the competitiveness of the Finnish food chain, Raisio offers its contract farmers value-added services and sells production inputs. In addition to seeds and crop protec-tion products, the company provides its contract farmers with field fertilizers as a part of its range of production inputs.
Ingredients
The operating result of the Ingredients Division improved, and profitability remained strong. Sales volumes increased, and the market area expanded into Asia, where the demand for cholesterol-lowering functional foods is on the rise. The solid and substantial scientific evidence of the benefits of plant stanol ester was of vital importance in the strict regu-lation processes.
The net sales of the Ingredients Division were EUR 44.3 mil-lion (EUR 44.9 million). In 2008, the market for ingredients based on plant stanol ester developed moderately. Sales in the main European markets, the UK and Poland, increased thanks to the strong brand and efficient marketing activities. Sales decreased in France and Germany. Turkey’s long-lasting restriction on advertising had a negative impact on sales devel-opment. Raisio took sole responsibility for the sales of Benecol products in Finland and will now concentrate on strengthening its position in the home market. Raisio offers Finland’s widest range of cholesterol-lowering functional foods.
Asia became an increasingly important market area in 2008. Product launches in Asia gave a further boost to the Benecol brand and to the status of plant stanol ester. Benecol products were introduced in India, Indonesia and Thailand. Obtaining the permits and approvals required for entry into new market areas is a time-consuming process, as is the introduction of Benecol products containing plant stanol ester to consumers and the scientific community. Benecol products are sold in almost 30 countries.
The panel on dietetic foods, nutrition and allergies (NDA) of the European Food Safety Authority (EFSA) issued a positive
scientific opinion on the health claims of plant stanol ester concerning the reduced risk of disease. In the panel’s opinion, the following health claim can be used for Benecol foods: “Plant stanol esters have been shown to lower blood choles-terol. Lowering the blood cholesterol may reduce the risk of coronary heart disease.” The use of the statement is subject to final approval from the EU Commission.
In December, the Ministry of Health of the People’s Republic of China gave Raisio a New Resource Food approval to add plant stanol ester to foodstuffs marketed in the country. The approval is one of the first issued by the People’s Republic of China after the implementation of the New Resource Food statute at the beginning of 2008.
The operating result of the Ingredients Division was EUR 10.0 million (EUR 9.5 million). It was affected by operational efficiency and volume growth. In view of the nature of the Division, the operating result percentage of 22.5 per cent was on target.
Raisio is preparing for expansion into new market areas, especially in Asia and North and South America. It will also extend its partner network and develop new, innovative prod-uct applications. Raisio’s strength in different market areas lies in its adaptability: it works with local partners to intro-duce Benecol products suitable for local consumer habits. As new markets open up, the global market is also expected to grow in the long-run.
RESEARCH AND DEVELOPMENT
Raisio engages in consumer- and customer-oriented research and development based on the idea of promoting health and well-being through nutritional measures. High-quality research and development ensure that the products meet customer and consumer needs, are safe and offer the right quality.
Raisio’s Food Division offers products based on consumer needs, which emphasise health, the promotion of well-being and safety without compromising on flavour. The development of new ingredients emphasises solid scientific evidence and safety. Research and development in feeds aims to develop feed mixes and feeding solutions that increase the efficiency and profitability of livestock production and ensure the well-being and health of animals. Customers also expect that the properties of feed mixes are environmentally friendly.
The Group’s research and development expenses in 2008 totalled EUR 5.8 million (EUR 6.4 million), or 1.2 per cent
RAISIO’S FINANCIAL STATEMENTS 20086

(1.5%) of net sales. In line with its strategy, Raisio focused on research and product development based on the needs of con-sumers, customers and farm animal products. Research and development expenses in the Food Division totalled EUR 2.4 million (EUR 2.4 million), Feed & Malt EUR 1.0 million (EUR 1.0 million) and Ingredients EUR 2.3 million (EUR 3.0 million).
CORPOR ATE RESPONSIB I L ITY
Raisio is committed to taking responsibility for its operating environment. The target is for the company’s operations to stand on an ecologically, ethically and financially solid basis now and in the future. Raisio’s corporate responsibility report is included in the annual report.
Raisio is not aware of any significant financial environmen-tal risks.
GOVERNANCE, MANAGEMENT AND PERSONNEL
Raisio’s Board of Directors had five members in 2008: Simo Palokangas (Chairman), Michael Ramm-Schmidt (Deputy Chairman), Anssi Aapola, Erkki Haavisto and Satu Lähteen-mäki. The Board members are independent of the company and of significant shareholders.
The Chairman of Raisio’s Supervisory Board is Juha Saura and its Vice Chairman is Holger Falck.
On 31 December 2008, Raisio’s continuing operations employed 960 people (1,072 in 2007 and 1,200 in 2006). Employees working abroad accounted for 32.3 per cent (31.9%) of the personnel at the end of 2008. The headcount was mainly reduced by the outsourcing of the laboratory and mainte-nance operations. At the end of the year, the Food Division had 572 employees, the Feed & Malt Division 258 employees, the Ingredients Division 63 employees and Group adminis-tration 67 employees.
Markku Krutsin, Vice President of the Food Division, North-ern Europe, and Jacek Dziekonski, Vice President of the Food Division, Eastern Europe, were appointed to the Management Team in May 2008. Kirsi Swanljung-von Wehrt, Vice President, Legal Affairs, and a member of the Group’s management team, resigned from the company in October 2008.
In 2008, the wages and fees paid by Raisio totalled EUR 41.8 million (EUR 43.8 million in 2007 and EUR 48.2 million in 2006) excluding other personnel expenses.
Personnel-related matters are reported in greater detail in the corporate responsibility report published in conjunction with the annual report.
CHANGES IN GROUP STRUCTURE
The mill company Melia Ltd became a fully owned subsidiary of Raisio Nutrition Ltd in January 2008, when the Swedish company Lantmännen handed over its 25% holding in Melia. In turn, Raisio handed over its 50% holding in the companies’ joint venture GoGreen AB and its holding of approximately 27% in the mill company AS Rigas Dzirnavnieks in Latvia.
R&D expenses
10
5
0
EuR MILLION
9.8
2.5
2.0
1.5
1.0
0.5
0
%
2006 20075.
82008
% OF TuRNOvERR&d ExpENSES
6.4
2
1.5
1
0.5
0
Equity per share
1.79
€
1.73
2006
1.70
2007 2008
Investments
40
30
20
10
0
EuR MILLION
27.6
8
6
4
2
0
%
2006 2007 2008
% OF TuRNOvERACquISITION OF MELIA LTd’S ShARESgROSS INvESTMENTS
31.4
29.1
12.7
RAISIO’S FINANCIAL STATEMENTS 2008 7

10
8
6
4
0
–4
–8
–102006 2007 2008
%–9
.2
9.8
3.5
Return on investment
FINLANd 68%
pOLANd 22%
RuSSIA ANd ukRAINE 6%
REST OF EuROpE 2%
REST OF ThE wORLd 2%
Personnel by geographical area on 31 December 2008
Melia Ltd’s business was transferred to Raisio Nutrition Ltd, while Melia Ltd’s machinery, equipment, land and buildings in both Raisio and Nokia were transferred to Raisionkaari Industrial Park Ltd on 31 December 2008. Melia Ltd’s per-sonnel transferred to the employment of Raisio Nutrition Ltd under the prevailing terms and benefits of employment. This completed the reorganisation initiated in autumn 2007, leading to Raisio’s commercial and production operations in Finland being separated also at company-level.
The malting business run by Raisio Nutrition was incorporated into a limited company, Raisio Malt Ltd, through a partial demerger, which took effect on 31 December 2008. Raisio Malt Ltd started operations on 1 January 2009.
Raisio Group Holding Oy merged with the parent company, Raisio plc, in November. Following the merger, Raisio Feed Ltd came to be fully and directly owned by Raisio plc.
COMPANY SHARES
At the end of the review period, Raisio plc held 9,158,500 free shares and 197,808 restricted shares, which were acquired from 2005 to 2008 based on the authorisations given by the Annual General Meetings. The number of free shares accounts for 7.0 per cent of all free shares and the votes they represent, while the corresponding figure for restricted shares is 0.6 per cent. In all, the company shares held by the Group represent 5.7 per cent of the company’s share capital and 1.6 per cent of overall votes. The company does not have any shares as col-lateral and did not have any in the review period. Since all of the shares were purchased in public trading, the company does not know what proportion of them may have been purchased from close associates of the company.
Of the shares held by the company, 19,503 restricted shares were repurchased from January to March 2008 on the basis of the authorisation given by the Annual General Meeting in 2007. Based on the authorisation given by the Annual General Meeting in 2008, the company repurchased 1,000,000 free shares and 20,005 restricted shares from September to December 2008. The shares were purchased in public trad-ing at the going price at the time of acquisition. A total of EUR 1,549,541 was paid for free shares and EUR 63,680 for re-stricted shares repurchased in the review period. The number of free shares repurchased in the review period accounts for 0.8 per cent of all free shares and the votes they represent, while the corresponding percentage for restricted shares is 0.1 per cent. The shares repurchased in the review period account for 0.63 per cent of the share capital and 0.2 per cent of the votes it represents.
By two consecutive decisions made by the Board of Direc-tors, a total of 72,000 free shares were assigned in the review period, based on the authorisation given by the Annual General Meeting in 2007. The shares were assigned to recognise and reward good performance in 2007 without payment. Matti Rihko, Raisio’s CEO, was assigned 40,000 free shares, and a total of 32,000 free shares were assigned to 16 other individuals. Of these, Markku Krutsin, Leif Liedes, Merja Lumme and Jyrki Paappa belonged to the close associates of the company. The number of assigned shares equals 0.04 per cent of the share capital and 0.01 per cent of the votes it represents.
1,000
800
600
400
200
0
Average personnel
FINLANdAbROAdTOTAL
73086
2
401
1,263
2006
789
368
1,157
2007
717
331
1,048
2008
RAISIO’S FINANCIAL STATEMENTS 20088

The Board of Directors was authorised by the Annual General Meeting in 2008 to dispose of all company shares. According to the Companies Act, the Board of Directors is also entitled to annul them. None of the shares held by the company were disposed of or annulled in the review period based on the authorisation of the year 2008.
Subsidiaries do not and did not hold parent company shares, and they do not and did not hold them as collateral. The Raisio Group Research Foundation holds 150,510 restricted shares, which is 0.44 per cent of the restricted shares and the votes they represent and, correspondingly, 0.09 per cent of the whole share capital and 0.37 per cent of the votes it represents. The Foundation does not and did not hold Raisio plc shares as col-lateral. A share in Raisio or its subsidiary does not entitle the holder to participate in the Annual General Meeting.
BOARD OF D IRECTORS’ PROPOSAL FOR THE D ISPOSAL OF PROFITS
The parent company’s distributable equity was EUR 199,648,743.48 on 31 December 2008. The Board of Directors will propose a dividend of EUR 0.07 per share at the Annual General Meeting on 26 March 2009.
The ex-dividend date is 27 March 2009 and the record date is 31 March 2009. The payable date is 7 April 2009.
RISKS AND SOURCES OF UNCERTAINTY IN THE NEAR FUTURE
Raw material and energy prices will continue to be highly volatile. Volatility management will be essential for Raisio’s profitability even in the future. A decrease in the profitability of field cultivation and a reduction in the demand of bioenergy may affect cultivation and lead to changes in inputs. Changes in the extent of cultivated areas affect total crop volumes as well as emphasis between cultivated plants.
The long-lasting economic difficulties in the meat chain, especially in pork, and dissatisfaction with future decisions on agricultural subsidies may make the livestock producers less willing to continue production in an uncertain business climate. This, in turn, may reduce the potential demand for feeds.
Worldwide centralisation in the brewery business affects the malt markets in Finland and Russia. Global consolidation has only started in the malt business, and the sector is growing narrower for individual companies.
As a result of the economic crisis and its rapid impact on biodiesel demand, the price of rapeseed oil has plunged, and oil milling has become unprofitable in the short term. The entire food chain is likely to experience other indirect impacts of this kind.
Raisio has considerably reduced the risks in its Russian opera-tions and will continue to enhance risk management. Russian operations, which consist of the feed, malt and food businesses, account for less than ten per cent of Raisio’s net sales.
The economic crisis has weakened especially the Russian currency, but also the currencies of other East European coun-tries and Sweden, eroding the competitiveness of companies in the Euro zone. A devaluation of neighbouring currencies
would change the field in both exports and imports. It is yet too early to predict the size, permanence and effects of the change.
Any negative publicity related to plant sterols might also be linked plant stanols, although numerous clinical trials have proved the safety and efficiency of the plant stanols ester patented by Raisio. Raisio’s plant stanol ester has received a positive opinion from the European Food Safety Authority (EFSA) concerning the health claims of Benecol products. However, during the transition period for the EU’s nutritional and health claim regulations, lasting until 2010, products offered by other manufacturers may feature health claims that even exceed their clinical evidence. This might harm the credibility of all functional foods in the consumers’ eyes.
The taxation on the sales profit from the divestment of Raisio’s chemicals business in 2004, totalling EUR 220 million, con-tinues to be handled in court. Ever since the divestment, Raisio has considered the sales profit to be free of tax and has handled it accordingly in its accounting. Expert statements obtained by Raisio support this stance. Most recently, the Helsinki Administrative Court made a resolution, in August 2008, stating that the sales profit was free of tax. However, the Tax Administration’s Tax Recipients’ Legal Services Unit filed for leave to appeal and lodged an appeal with the Supreme Administrative Court in October 2008.
Some Group companies stand as defendants in trials related to the termination of employment. One Group company has pledged to assume liability for any compensation imposed in a trial related to a discontinued operation. The outcomes of these trials are not expected to have any major impact on the Group’s financial standing.
None of the Group companies are involved in arbitration proceedings.
OUTLOOK FOR 2009
Volatility in quarterly results and between divisions will become more pronounced, but they will balance out at Group-level over the year 2009. Even if the food consumption and demand remain steady, the unpredictable outcome of an economic crisis may reduce volumes in the short run either directly or indirectly through the food chain infrastructure. Nevertheless, the negative impact on result can be neutralised within a few months, and in the long run the reallocation of capacity will open up new opportunities for Raisio.
Raisio’s main target in 2009 is to maintain its stabilised position under difficult circumstances. Raisio’s volumes are expected to develop moderately in annual terms. The trend in net sales will depend on the price level of crop in 2009. The company’s profitability will also develop moderately, and operating result is predicted to account for 4–5% of net sales. Cash flow from operations in the review period is expected to be clearly positive but below the 2008 level.
Raisio, 12 February 2009
Raisio plc
Board of Directors
RAISIO’S FINANCIAL STATEMENTS 2008 9

CONSOLIDATED INCOME STATEMENT
(eur million) note 1.1.–31.12.2008 1.1.–31.12.2007
conti n u i ng operations:
n et sales 1 504.0 421.9
Cost of sales –421.7 –352.0
Gross profit 82.4 69.9
Sales and marketing expenses –38.8 –34.7Administration expenses –14.6 –16.8Research and development expenses –5.8 –6.4Other income and expenses from business operations 2 5.1 –1.3
operati ng resu lt 3, 4, 19 28.3 10.6
Financial income 5 2.4 2.5Financial expenses 5 –3.2 –3.2Share of the result of associates and joint ventures 0.1 –0.3
resu lt Before taxes 27.5 9.5Income taxes 6 –5.3 –1.2
resu lt for th e fi nancial period for conti n u i ng operations 22.2 8.3
disconti n u ed operations: 7Result for the financial period for discontinued operations 0.0 –7.3
resu lt for th e fi nancial period 22.2 1.1
attri ButaBle to:Parent company shareholders 22.1 1.4Minority interest 0.1 –0.4
22.2 1.1
earn i ngs per share calcu lated from th e resu ltof parent company shareholders 8Earnings per share from continuing operations
Undiluted earnings per share 0.14 0.05 Diluted earnings per share 0.14 0.05
RAISIO’S FINANCIAL STATEMENTS 200810

(eur million) note 31.12.2008 31.12.2007
assets
non-cu rrent assetsIntangible assets 9 10.0 10.9Goodwill 9, 10 1.2 1.3Tangible assets 9 124.2 127.9Shares in associated companies and joint ventures 11 0.7 1.4Financial assets available for sale 12 0.6 0.6Long-term receivables 13 0.6 1.3Deferred tax assets 20 7.9 11.3
145.2 154.7
cu rrent assetsInventories 14 73.3 91.7Accounts receivables and other receivables 15 66.0 70.1Financial assets through profit or loss at fair value 16 66.8 27.9Cash in hand and at banks 17 12.8 15.9
218.9 205.6
total assets 364.0 360.3
shareholders’ eQu ity an d liaBi liti es
shareholders’ eQu ity 18, 19Equity of parent company shareholdersShare capital 27.8 27.8Premium fund 2.9 2.9Reserve fund 88.6 88.6Company shares –19.3 –17.9Translation differences –3.2 –2.3Retained earnings 182.7 167.0
279.4 266.1
Minority interest 0.0 12.7
total shareholders’ eQu ity 279.4 278.8
liaBi liti esNon-current liabilitiesDeferred tax liability 20 7.4 9.1Pension contributions 21 0.2 0.2Non-current financial liabilities 24 14.3 0.4Other non-current liabilities 25 0.1 0.0
22.0 9.7Current liabilitiesAccounts payable and other liabilities 25 54.9 61.8Tax liability based on the taxable income for the period 0.7 0.0Reserves 22 1.1 1.9Financial liabilities at fair value through profit or loss 23 0.4 1.5Current financial liabilities 24 5.5 6.8
62.6 71.9
total l iaBi liti es 84.6 81.5
total shareholders’ eQu ity an d liaBi liti es 364.0 360.3
CONSOLIDATED BALANCE SHEET
RAISIO’S FINANCIAL STATEMENTS 2008 11

CHANGES IN SHAREHOLDERS’ EqUITY IN THE F INANCIAL PER IOD ENDED 31 DECEMBER 2008
shareholders’ eQu ity on 31 .12.2006 27.8 2.9 88.6 –11.4 –1.2 170.4 277.1 13.3 290.4
Translation differences, transferred to the income statement on disposal of subsidiaries 0.4 0.4 0.0 0.4
Translation differences, generated in the financial period –1.5 –1.5 0.0 –1.5
Other changes 0.0 0.0 0.0
Net income recorded directly in shareholders’ equity 0.0 0.0 0.0 0.0 –1.1 0.0 –1.1 0.0 –1.1
Result for the financial period 1.4 1.4 –0.4 1.1
Net profit for the financial period 0.0 0.0 0.0 0.0 –1.1 1.4 0.4 –0.4 0.0Dividends –4.8 –4.8 –0.3 –5.1
Repurchase of own shares –6.5 –6.5 –6.5Total other changes 0.0 0.0 0.0 –6.5 0.0 –4.8 –11.3 –0.3 –11.6
shareholders’ eQu ity on 31 .12.2007 27.8 2.9 88.6 –17.9 –2.3 167.0 266.1 12.7 278.8
Translation differences, transferred to the income statement on disposal of associated companies and joint ventures 0.0 0.1 0.1 0.1
Translation differences, generated in the financial period –1.0 –1.0 –1.0
Other changes 0.1 –0.1 0.0 0.0 0.0
Net income recorded directly in shareholders’ equity 0.0 0.0 0.0 0.0 –0.9 –0.1 –0.9 0.0 –0.9Result for the financial period 22.1 22.1 0.1 22.2
Net profit for the financial period 0.0 0.0 0.0 0.0 –0.9 22.1 21.2 0.1 21.3Dividends –6.3 –6.3 –6.3Repurchase of own shares –1.6 –1.6 –1.6Share-based payment 0.2 0.1 0.2 0.2Squeeze-out –0.2 –0.2 –12.8 –13.0
Total other changes 0.0 0.0 0.0 –1.5 0.0 –6.5 –7.9 –12.8 –20.7
shareholders’ eQu ity on 31 .12.2008 27.8 2.9 88.6 –19.3 –3.2 182.7 279.4 0.0 279.4
(eur million)
equity of parent
company shareholders
minority interest
share capital
premium fund
reserve fund
company shares
translation differences
retained earnings
total share-holders’
equity
RAISIO’S FINANCIAL STATEMENTS 200812

CONSOLIDATED CASH FLOw STATEMENT
(eur million) 2008 2007
cash floW from Busi n ess operationsOperating result 28.3 3.3Adjustments to operating result:
Depreciation and impairment 19.4 19.5 Other income and expenses not involving disbursement 1.1 0.3 Other adjustments 1) –3.9 2.5
Cash flow before change in working capital 44.8 25.6
Change in current receivables –0.7 1.9Change in inventories 18.1 –12.1Change in current non-interest-bearing liabilities –5.0 3.5Change in reserves –0.8 –3.3Change in working capital 11.7 –9.9
Cash flow from business operations before financial items and taxes 56.5 15.6
Interest paid –1.6 –1.3Dividends received 0.2 0.2Interest received 1.8 1.8Other financial items, net –3.7 0.2Income taxes paid –0.5 –0.9
cash floW from Busi n ess operations 52.7 15.6
cash floW from i nvestmentsAcquisition of subsidiaries, minus liquid assets on the date of acquisition –8.0 –0.2Acquisition of associated companies and joint ventures 0.0 0.0Investments in tangible and intangible assets –17.1 –30.6Divestment of subsidiaries less liquid assets at the time of divestment 0.1 4.1Income from divestment of associated companies and joint ventures 0.0 0.7Income from investments available for sale 0.0 0.0Income from tangible and intangible assets 1.2 2.8Loans granted –1.9 –0.1Repayment of loan receivables 1.8 1.3
cash floW from i nvestments –23.8 –21.9
Cash flow after investments 28.8 –6.2
cash floW from fi nancial operationsNon-current loans taken out 17.0 0.0Repayment of non-current loans –1.3 –11.7Change in current loans –3.2 –5.3Dividends paid –6.3 –5.1Repurchase of own shares –1.6 –6.5
cash floW from fi nancial operations 4.5 –28.6
Change in liquid funds according to statement 33.4 –34.8
Adjustment to translation difference 0.5 –0.5
Change in liquid funds 33.9 –35.3
Liquid funds at the beginning of the period 43.6 78.8Impact of change in market value on liquid funds 0.4 0.1Liquid funds at period-end 77.9 43.6
1) Adjustments resulting from divestment of working capital and investments.
RAISIO’S FINANCIAL STATEMENTS 2008 13

CCOUNTING PRINCIPLES FOR CONSOLIDATED FINANCIAL STATEMENTSBASIC INFORMATION
Raisio develops, produces and markets foods, functional food ingredients, feeds and malts. The Group operates in 9 countries. Raisio’s organisation consists of three divisions – Food, Feed & Malt and Ingredients – and service functions that support the Group’s business areas.
The Group’s parent company is Raisio plc. The parent company is domiciled in Raisio, Finland, and its registered address is Raisionkaari 55, FI-21200 Raisio.
Raisio’s shares are listed on NASDAQ OMX Helsinki Ltd.
Copies of the financial statements are available on the com-pany’s website at www.raisio.com or from the parent com-pany’s headquarters in Raisio.
These consolidated financial statements were authorised for issue by Raisio plc’s Board of Directors on 12 February 2009. Under the Finnish Companies Act, shareholders are entitled to adopt or reject the financial statements at the Annual General Meeting held after the publication of the financial statements. The Annual General Meeting may also decide to amend the financial statements.
BASIS OF PRESENTATION
Raisio’s consolidated financial statements have been prepared according to the International Financial Reporting Standards (IFRS) and following the IAS and IFRS standards and SIC and IFRIC interpretations valid on 31 December 2008. In the Finnish Accounting Act and related rules and regulations, the International Accounting Standards refer to the standards and their interpretations approved for application within the EU according to the procedure governed by EU Regulation (EC) No. 1606/2002. Notes to the consolidated financial statements also comply with the Finnish Accounting and Community legislation that supplements the IFRS provisions. The currency used in the financial statements is the euro, and the statements are shown in EUR millions.
The consolidated financial statements have been prepared based on original purchase costs with the exception of available-for-sale financial assets, financial assets and liabilities entered at fair value through profit and loss, as well as derivative
contracts measured at fair value. Non-current assets held for sale have been valued at the lower of the following: fair value less costs to sell or book value.
The Group has adopted the following amended standards and interpretations as of 1 January 2008:
Amendments (Reclassification of Financial Assets) to IAS <39 Financial Instruments: Recognition and Measurement and to IFRS 7 Financial Instruments: Disclosures (effective 1 July 2008). The amendments concern the reclassifica-tion of some financial instruments under special circum-stances, as well as the financial statement disclosures following such reclassification. The amendments do not affect Raisio’s financial statements for 2008, as the Group does not have the kind of financial instruments referred to in the amendments that would require reclassification in the Group’s opinion.
IFRIC 11 < IFRS 2 – Group and Treasury Share Transactions. The interpretation clarifies the scope of regulations con-cerning equity-settled transactions (IFRS 2). The inter-pretation requires such transactions to be reassessed in the financial statements of the parent group and group companies. The interpretation has not affected the Group’s financial statements.
IFRIC 14 < IAS 19 – The Limit on a Defined Benefit Asset, Minimum Funding Requirements and their Interaction. The interpretation is applied to post-employment defined benefit arrangements and certain long-term defined ben-efit arrangements in compliance with IAS 19 when the arrangement involves minimum funding requirements. The interpretation has not affected the Group’s financial statements, as the Group does not have the type of ar-rangements referred to in the interpretation.
When preparing the financial statements in accordance with the IFRS, Group management must make certain estimates and judgments concerning the application of accounting principles. Information about the estimates and judgments that the management has made when applying the Group’s accounting principles and that have the biggest impact on the figures presented in the financial statements are presented in conjunction with the accounting principles under “Account-ing policies calling for management’s judgement and main uncertainties related to the assessments”.
SCOPE AND ACCOUNTING PRINCIPLES OF THE CONSOLIDATED F INANCIAL STATEMENTS
Subsidiaries
Raisio’s consolidated financial statements include the parent company, Raisio plc, and such directly- or indirectly-owned subsidiaries over which it has control. Control is acquired when the Group owns more than half of the voting rights or possesses other rights to determine the financial and business principles of a company in order to benefit from its business operations.
In the consolidated financial statements, mutual shareholding is eliminated using the acquisition cost method. Acquisition cost is determined on the basis of the fair value of acquired
RAISIO’S FINANCIAL STATEMENTS 200814

assets valid on the purchase date plus direct costs related to the purchase. Goodwill consists of the portion of acquisi-tion cost over the fair value of the net assets of the acquired company. Goodwill is not depreciated; its value is assessed at least once annually with an impairment test. Impairment losses are entered in the income statement.
Subsidiaries acquired during the financial period are included in the consolidated financial statements from the moment the Group acquires control; assigned subsidiaries are included in the statements until such control ends.
Business transactions between Group companies, internal receivables and liabilities, as well as internal distribution of profits and unrealised profits from internal deliveries are eliminated when preparing the consolidated financial state-ments. Unrealised losses are not eliminated if the loss is due to impairment.
Minority interest
Allocation of profit for the financial period between parent company shareholders and the minority interest is shown in the income statement, and the minority interest is included in the balance sheet under shareholders’ equity as a sepa-rate item from the equity attributable to parent company equity holders. The minority interest of the losses accrued is entered in the consolidated financial statements up to the amount invested.
Associated companies and joint ventures
Associated companies are companies in which the Group owns 20–50% of the voting rights or over which it has considerable influence but no control. Joint ventures are companies where, according to an agreement-based arrangement, the Group is committed to sharing the control of financial and business principles with one or more parties. Associated companies and joint ventures are consolidated using the equity method. A holding equivalent to the Group ownership is eliminated from the unrealised profits between the Group and its associated companies or joint ventures. The Group investment in associ-ated companies and joint ventures includes goodwill gener-ated by the acquisition. The application of the equity method is discontinued when the book value of the investment has decreased to zero, unless the Group has acquired liabilities related to its associated companies or joint ventures or has guaranteed their liabilities. The Group’s share of the associated companies’ and joint ventures’ profit for the period, calculated on the basis of its ownership, is presented as a separate item in the income statement after operating result.
SEGMENT REPORTING
Segment information is presented according to the business and geographical segmentation of the Group. The Group’s primary reporting format is by business segment. Business segments produce products and services, the related risks and productivity of which are different from those of other business segments. The risks and productivity related to the products and services of geographical segments are differ-ent from those related to products and services of segments operating in different financial environments.
FORE IGN CURRENCY TR ANSLATION
Figures representing the Group entities’ performance and financial position are measured in the currency used in the main operating environment of each entity (’functional cur-rency’). The functional and presentation currency of the par-ent company is the euro.
Business transactions in foreign currency
Business transactions in foreign currency are entered in the functional currency by using the transaction date exchange rate. Monetary items in foreign currency are converted into the functional currency using the closing date exchange rate. Non-monetary items are valued at the transaction date ex-change rate. Profits and losses from transactions in foreign currency and the conversion of monetary items are entered in the income statement. Exchange rate profits and losses related to the main business are included in the items above the operating profit. Financial exchange rate profits and losses are entered under financial income and expenses.
Conversion of financial statements in foreign currency
The income statements for foreign Group companies, where the valuation or closing currency is not the euro, are converted to the euro using the average exchange rates of the reporting period, and balance sheets using the closing date exchange rates. Converting earnings from the financial period by using different exchange rates in the income statement and the bal-ance sheet causes a translation difference, which is entered under shareholders’ equity. Translation differences generated from the elimination of the purchase cost of foreign entities and the conversion of shareholders’ equity items accrued post-acquisition are entered under shareholders’ equity. When disposing of a foreign Group company during the period, the accumulated translation differences are entered in the income statement as part of the sales profit or loss when recording the corresponding disposal result.
According to the exemption allowed by the IFRS 1, any cumula-tive translation differences accrued prior to the IFRS adoption date, 1 January 2004, have been entered under accrued profits and will not be entered in the income statement later when the subsidiary is sold. From the adoption date, the translation difference for foreign entities due to exchange rate changes is entered as a separate item under the translation differences of the Group shareholders’ equity. The same process applies to non-current, intra-Group loans which, for their actual con-tents, are comparable with shareholders’ equity.
Goodwill generated by the acquisition of a foreign entity and adjustments related to fair values are treated as assets and liabilities in the local currency of the unit in question and converted to the closing date exchange rate.
TANGIBLE F IXED ASSETS
Tangible fixed assets are valued at the original purchase cost minus accrued depreciations and value impairment.
When part of a fixed asset is treated as a separate commodity, costs related to the replacement of the part are activated.
RAISIO’S FINANCIAL STATEMENTS 2008 15

Otherwise, any costs generated later are included in the book value of the tangible fixed asset only if it is likely that any future financial benefit related to the commodity will benefit the Group and that the purchase cost of the commodity can be determined reliably. Other repair and maintenance costs are entered in the income statement when they are realised.
Straight-line depreciations are made from tangible assets within the estimated financial effect period. No deprecia-tions are made from land. The estimated economic useful lives are as follows:
buildings and structures 10–25 years <
machinery and equipment 4–15 years <
Estimated economic useful lifetimes are reviewed every closing date, and corresponding adjustments are made to the depreciation periods if they differ significantly from the previous figures. If the book value of a commodity is greater than the recoverable amount, the book value is immediately reduced to the recoverable level of the amount. Impairment is discussed in greater detail under “Impairment of tangible and intangible assets”.
Sales profits and losses are determined by comparing the sales profit to the book value. Sales profits and losses are included in the income statement under other operating income and expenses.
Tangible fixed asset depreciations are discontinued when the tangible fixed asset is classified as available for sale according to standard IFRS 5, Non-current Assets Held for Sale and Discontinued Operations. Fixed assets available for sale are valued at their book value or a lower fair value less costs to sell.
BORROwING COSTS
Borrowing costs are entered as costs for the financial period during which they are generated.
GOVERNMENT ASS ISTANCE
Government grants related to the purchase of tangible fixed assets are entered as deductions from the assets’ book values when the Group has reasonable assurance of receiving the grants. In the case of grants, revenue recognition takes place through lower depreciations within the asset’s useful life. Other public subsidies are entered in the income statement under returns for the financial periods in which the costs corresponding to the subsidies are generated.
INTANGIBLE ASSETS
Goodwill
Goodwill generated from business acquisitions represents the part of the purchase cost on the acquisition date that exceeds the Group’s share of the fair value of net assets, debts and conditional debts of the companies acquired after 1 January 2004 (IFRS transition date). Other expenses directly resulting from the acquisition are also included in the acquisition cost. The goodwill of associated companies and joint ventures is
included in the value of investment in associated companies and joint ventures. The goodwill of business combinations carried out prior to 1 January 2004 corresponds to the book value according to the previous accounting standards, which has been used as the deemed cost for IFRS.
Goodwill is valued at the original purchase cost with impair-ment deducted. Goodwill and fair value measurement at the time of acquisition are treated as assets and liabilities of the acquired company. Goodwill is not depreciated in a regular manner; instead of depreciations, goodwill is tested annually for possible impairment. Impairment losses are entered in the income statement. For this purpose, goodwill is allocated to the entities that generate cash flow.
Research and development costs
Research costs are entered in the income statement as expenses for the year in which they were generated. Research costs are activated in the balance sheet as intangible assets from the date after which the product can be technically implemented and commercially utilised and after which it is expected to generate financial benefit. Research costs pre-viously entered as expenses cannot be recognised as assets in later reporting periods.
Costs related to the development of new products and processes at Raisio have not been activated, because any future returns to be derived from these are only ensured when the products are launched. Therefore, the Group has no activated develop-ment costs on the balance sheet on the closing date.
Other intangible assets
An intangible asset is entered on the balance sheet at original purchase cost if it can be reliably measured and it is prob-able that the economic benefits attributable to the asset will flow to the entity.
Intangible assets are entered in the income statement as an expense based on the straight-line depreciation method over their known or estimated economic useful life. The Group is not considered to have any assets with an unlimited financial effect period. The depreciation of intangible assets is based on the following anticipated economic useful lives:
intangible rights 5–10 years <
other intangible assets 5–20 years <
INVENTORIES
Inventories are valued at the purchase cost or at a lower net realisation value. The purchase cost is determined by using the FIFO method or alternatively by the equivalent weighted average cost. The purchase cost of finished products and work in progress consists of raw materials, direct work-related costs, other direct costs and the appropriate part of the variable manufacturing costs, as well as fixed general costs based on the normal utilised capacity. The purchase cost does not include borrowing costs. A net realisation value is the estimated sales price in normal business operations, with the estimated product completion costs and sales-related costs deducted.
RAISIO’S FINANCIAL STATEMENTS 200816

ASSETS HELD FOR SALE AND DISCONTINUED OPER ATIONS
Assets held for sale and assets related to discontinued opera-tions, classified as available for sale, are valued at the lower of the following: the book value or the fair value less costs to sell. Depreciations from these assets are discontinued at the time of classification. The result from discontinued operations is presented in the income statement as a separate item.
RENTAL AGREEMENTS
Group as lessee
Rental agreements on tangible and intangible assets, where the Group has an essential share of the risks and benefits characteristic of ownership, are classified as financial leasing agreements. Assets acquired by a financial leasing agreement are entered on the balance sheet at the fair value of the leased asset at the commencement date of the rental agreement or at a lower current value of minimum rents. Payable leas-ing rents are divided into leasing costs and debt deductions. Financing interest is entered in the income statement during the leasing agreement in such a manner that the remaining debt will carry equal interest in each financial period. Depre-ciations from goods acquired via a financial leasing agreement are made within the economic useful lifetime of the goods or a lower rental period. Rental obligations are included in financial liabilities.
Rental agreements that leave the risks and rewards incident to ownership to the lessor are treated as other rental agree-ments. Rents determined by any other rental agreement are entered in the income statement costs as fixed charge items within the rental period.
Group as lessor
All rental agreements with the Group as a lessor constitute other rental agreements, and the goods are included in the tangible fixed assets of the Group.
IMPAIRMENT OF TANGIBLE AND INTANGIBLE ASSETS
On each closing date, the Group assesses whether there are any indications of impairment in any asset. If there are indi-cations, the amount of recoverable currency from the asset is estimated. For the assessment of impairment, assets are divided into units at the lowest level, which is mostly independ-ent of other units and with a cash flow that can be differenti-ated. Irrespective of whether or not there are indications of impairment, impairment tests are always carried out annually for goodwill and unfinished intangible assets.
The recoverable amount of currency from tangible and intan-gible assets is the fair value of the assets less costs to sell, or a higher value in use. When determining the fair value of cash-generating units, the Group uses value factors collected from listed companies corresponding closely to the entity being valued. Instead of listed companies, realised business sales may also be used where similar companies have had a change of ownership. When determining the value in use,
estimated future cash flows approved by the management are discounted to their present value at the average cost of the capital, which reflects the time value of the currency and the risk for the entity in question.
Impairment losses are entered when the book value of assets is higher than the recoverable amount. Impairment losses are entered in the income statement. The impairment loss of an entity that produces a cash flow is first allocated to reduce the goodwill of an entity that produces the cash flow and then, symmetrically, the values of other assets of the entity. In conjunction with the recognition of impairment losses, the economic useful life of the asset subjected to depreciation is re-evaluated. The impairment of fixed tangible assets and intangible assets, apart from impairment loss of goodwill, is cancelled if conditions have changed and the recoverable amount of assets has changed since the time the impair-ment loss was entered. However, the impairment loss will not be cancelled to a greater extent than the book value of the assets would amount to without entering the impairment loss. Impairments losses recognised for goodwill are not reversed under any circumstances.
EMPLOYEE BENEFITS
Pension obligations
Post-employment benefits are classified as defined contribution or defined benefit plans. Under a defined contribution plan, the Group makes payments for separate units. The Group has no legal or constructive obligation to make further payments if the payment recipient does not have sufficient assets to pay the post-employment benefits. All arrangements that do not meet these conditions are defined benefit plans.
The Group’s pension schemes comply with the local regula-tions of each country. Pension schemes are usually managed by separate pension insurance companies. Most of the foreign schemes, as well as the Finnish TyEL scheme, are defined contribution-based systems. Payments made to defined contribution pension schemes are entered into the income statement for the financial period the charge applies to. The Group has no material defined benefit schemes.
Share-based payments
The Group has set up a three-year share-based incentive scheme as a part of its incentive and reward system offered to key personnel. In the scheme, the rewards are paid as a combination of company shares, previously acquired for the parent company, and cash. The shares issued under the scheme are measured at fair value at grant date and recognised in the income statement as employee benefit expenses on a straight line over the vesting period. Cash-settled transactions are estimated using the share price on each reporting date and amortised in the income statement as employee benefit expenses from the grant date to the date on which the trans-action is made to the recipient. Equity-settled transactions are recognised under shareholders’ equity and cash-settled transactions under liabilities.
RAISIO’S FINANCIAL STATEMENTS 2008 17

PROVIS IONS
Provisions are entered when the Group has a legal or actual liability due to a previous transaction, the realisation of the payment liability is likely and the amount of the liability can be reliably estimated. If part of the liability can be compensated by a third party, the compensation is entered as a separate asset, but only when, in practical terms, it is certain that the compensation will be received. Provisions are valued at the present value of expenditure required to settle the liability. The present value is calculated using a discount factor that has been selected to reflect the markets’ view of the time value of money at the time of calculation and the risk related to the liability.
A rearrangement provision is entered when the Group has prepared a detailed rearrangement plan and implementation of the plan has begun or a notification of the matter has been issued. The rearrangement plan should include at least the following: arrangement-related business operations, main offices possibly affected by the arrangement, the workplace location, tasks and the estimated number of employees to whom compensations will be made for redundancy, expenses to be realised and the implementation period of the plan.
A provision is entered for loss-making agreements when the necessary expenses required to fulfil the liabilities exceed the benefits to be obtained from the agreement.
A provision is entered for liabilities related to write-offs and restoration to an original state when, according to environ-mental legislation and the Group environmental responsibility principles, the Group has a liability related to the writing off of a production unit, rectification of environmental damage or the transportation of equipment from one place to another.
DIVIDENDS TO BE PAID
The dividends paid by the Group are entered for the financial period during which the shareholders have approved the dividends for payment.
INCOME TA XES
The tax costs of an income statement consist of the change based on the taxable income of the financial period and the deferred tax. The tax effect related to items directly recog-nised under shareholders’ equity is recognised, correspond-ingly, under shareholders’ equity. The tax based on the taxable income of the financial period is calculated from the taxable income according to the valid tax rate of each country. The tax is adjusted by possible taxes related to previous finan-cial periods.
Deferred taxes are calculated using the liability method from all temporary differences between the book value and the tax base. The most significant provisional differences arise from the depreciation of tangible and intangible assets, impairment of shares, unused taxable losses and valuations to fair value of derivative financial instruments. No deferred tax is entered for non-deductible goodwill. No deferred tax is entered for the undistributed earnings of subsidiaries, associated com-panies or joint ventures if the difference is not expected to be dissolved in the foreseeable future.
Deferred taxes have been calculated using the tax rates set by the closing date or tax rates whose approved content has been announced by the closing date.
A deferred tax asset has been recognised to the extent that it is probable that taxable income will be generated in the future, against which the temporary difference can be used.
REVENUE RECOGNIT ION PRINCIPLES
Revenues from the sale of goods are entered when any significant risks and benefits related to the ownership of the goods have been transferred to the purchaser and the Group no longer has proprietary rights or any real control over the products. Revenues from services are entered when the service has been performed. Revenues from licences and royalties are entered in accordance with the substance of the relevant agreement. Interest income is entered using the effective interest method and dividend income when the right to receive payment is established.
INCOME STATEMENT BY FUNCTION OF EXPENSE
The Group’s income statement is presented using the func-tion of expense method. Separate functions include sales and marketing expenses, administrative expenses and R&D expenses. Costs of goods sold include the wage, material, acquisition and other expenses incurred from the production and acquisition of products. Administrative expenses include general administrative costs and Group management costs. Administrative expenses have been allocated to functions according to the matching principle.
OTHER OPER ATING INCOME AND EXPENSES
Asset sales profits and losses, returns unrelated to actual sales of deliverables, such as rental income, and impairments of goodwill and other miscellaneous assets, are presented as other operating income and expenses.
FINANCIAL ASSETS AND L IABIL IT I ES
Financial assets
For the purpose of measurement following recognition, the Group’s financial assets have been classified into the following categories in accordance with IAS 39, Financial Instruments: Recognition and Measurement: financial assets entered at fair value through profit or loss, loans and other receivables, financial assets held for sale. The classification is based on the purpose of acquisition of the financial assets, and it is carried out in connection with the original purchase. Trans-action costs are included in the original book value of the financial assets when treating an item not measured at fair value through profit or loss. Purchases and sales of financial assets, except derivatives, recognised at fair value through profit or loss are recognised on the settlement day. Purchases and sales of other financial assets and liabilities are recog-nised on the trade date.
RAISIO’S FINANCIAL STATEMENTS 200818

Financial assets are derecognised in the balance sheet when the Group has lost its contractual right to cash flows or when it has transferred a significant share of risks and revenues outside the Group.
Financial assets recognised at fair value through profit or loss are financial assets held for trading. This group includes bonds, certificates of deposit and commercial papers, as well as fixed-income fund units. Derivatives which do not fulfil the terms of hedge accounting have been classified as held for trading. Assets held for trading are all current assets. Financial assets held for trading have been acquired to generate short-term profit from changes in market prices. Items in this group are valued at fair value, and the fair value of all deposits in this group is determined on the basis of quotations published in the active market, which is the closing date bid quotation. Unrealised profits and losses due to changes in the fair value are entered in the income statement in the period in which they were generated.
Loans and other receivables are non-derivative assets with fixed or determinable payments, which are not quoted in the active market and are not held for trading by the Group. This group includes the Group’s financial assets, sales and loan receivables and financial instruments included in deferred liabilities. They are measured at amortised cost and are included in current and non-current financial assets; in the latter, if they fall due after 12 months.
Financial assets available for sale are non-derivative assets that have been specifically allocated to this group. The group consists almost exclusively of shares in unquoted companies. Unquoted shares are measured at purchase price, because reliable fair values are not available for them. The value of quoted shares is determined on the basis of prices quoted on active markets, which equal the quotes on the closing date. Changes in the fair value of financial assets available for sale are recognised in the fair value reserve in shareholders’ equity, including the tax effect. Changes in fair value are transferred from shareholders’ equity to the income statement when the investment is sold or it has been impaired to the extent that an impairment loss must be recognised.
Liquid funds
Liquid funds consist of cash, bank deposits to be paid on demand and other current, liquid investments. Items clas-sified as liquid funds have a maturity of up to three months from the purchase date.
Financial liabilities
Financial liabilities are classified as financial liabilities recog-nised at fair value through profit or loss or as other financial liabilities. Financial liabilities are recognised at fair value on the basis of the compensation originally received. Transaction costs have been included in the original book value of financial liabilities. Financial liabilities recognised at fair value through profit or loss are liabilities from derivative contracts which do not fulfil the terms of hedge accounting. Other financial liabilities are measured at amortised cost using the effective
interest method. Financial debts are included in current and non-current debts and may be either interest-bearing or non-interesting-bearing.
Impairment of financial assets
At each closing date, the Group assesses whether there is objective evidence of impairment of a financial asset or a group of financial assets. The impairment loss for liabilities and other receivables entered at amortised cost in the bal-ance sheet is measured as the difference between the book value of the item and the present value of estimated future cash flows discounted at the initial effective interest rate The impairment of available-for-sale financial assets is entered through profit or loss if there is objective evidence of impair-ment. These impairment losses are not reversed through the income statement.
The Group recognises impairment loss for accounts receiva-bles if there is objective evidence that the receivable can-not be recovered in full. Considerable financial difficulties of a debtor, probability of bankruptcy and payment default are evidence of impairment of accounts receivables. Credit losses are entered as an expense in the income statement. If an impairment loss decreases in a subsequent period, the entered loss is reversed through profit or loss.
DERIVATIVE F INANCIAL INSTRUMENTS AND HEDGE ACCOUNTING
Derivative contracts are originally entered in the books under purchase costs representing their fair value. Following the acquisition, derivative contracts are measured at fair value. Profits and losses generated from the measurement at fair value are treated according to the purpose of use of the derivative contract.
According to its financial risk management policy, the Group uses various derivatives to hedge against interest rate, cur-rency and commodity price risks. Interest rate swaps are used to hedge against changes in market rates of interest. Currency forward contracts are used to hedge receivables and debts in foreign currencies, as well as future commercial cash flows. Quoted rapeseed forward contracts are used to hedge against the price risk caused by temporal differences of the fixed-price raw material purchases and product sales of the so-called vegetable oil chain.
Although the hedges meet the requirements for efficient hedging determined in the Group’s risk management policy, the Group does not currently comply with the hedging poli-cies of IAS 39. The changes in the fair values of interest rate swaps are recognised under financial income and expenses. The changes in the fair value of forward contracts are entered under other operating income and expenses, and the effects of the contracts’ interest rate element are entered under financial income and expenses. The changes in the fair value of rapeseed forward contracts are recognised under financial income and expenses.
The fair values of derivatives are presented in notes 27.
RAISIO’S FINANCIAL STATEMENTS 2008 19

ACCOUNTING POLIC IES CALL ING FOR MANAGEMENT’S jUDGEMENT AND MAIN UNCERTAINTIES RELATED TO THE ASSESSMENTS
When preparing the consolidated financial statements, esti-mates and assumptions must be made concerning the future. These may affect the assets and liabilities at the time of the balance sheet preparation, as well as income and expenses in the reporting period. Actual figures may differ from those used in the financial statements. The estimates are based on the management’s best judgment on the closing date. Any changes to estimates are entered in the period in which the estimates are adjusted.
Most of the Group’s estimates are related to goodwill impair-ment testing, valuation and the useful life of assets, amount of obsolete inventories and the use of deferred tax assets against future taxable income.
The estimates made in conjunction with the preparation of financial statements are based on the management’s best judgment on the closing date. They are based on previous experience and future expectations considered to be most likely on the closing date. These include, in particular, the factors related to the Group’s financial operating environment, which affect sales and the cost level. The Group monitors the realisation of these estimates and assumptions. Any changes in estimates and assumptions are entered in the period in which they have been detected.
Impairment testing
The Group performs regular annual tests on goodwill and unfinished intangible assets for possible impairment. The value of identifiable tangible and intangible assets and goodwill is also assessed if any event or change in conditions indicates that the book value no longer corresponds to the recover-able amount. The recoverable amount of cash-generating units is estimated using calculations based on value in use. Estimates are needed in the preparation of such calculations. The main variables in cash flow calculations are the discount rate, end value and number of years that cash flow estimates are based on, as well as the assumptions and estimates used to determine cash flows. The estimated income and expenses may differ considerably from actual figures.
Deferred tax assets
The management is required to make estimates when cal-culating the amount of deferred tax assets and the extent to which tax assets can be recognised in the balance sheet. If the estimates differ from actual figures, the deviations are entered in the profit or loss and deferred tax assets of the period in which the deviation was determined.
Amount of obsolete inventories
The Group regularly assesses the amount of obsolete inven-tories and possible decrease of fair values below original pur-chase cost. An obsolescence provision is entered if required. These assessments call for estimates of future demand for the company’s products. Possible changes in these estimates may result in adjustments to the value of inventories in sub-sequent periods.
APPL ICATION OF NEw AND AMENDED IFRS NORMS
IASB has published the following new or amended standards and interpretations, which have not yet taken effect or which the Group has not yet applied. The Group plans to adopt each standard and interpretation when it enters into effect, or, if the standard or interpretation takes effect during the review period, in the financial period following the entry into effect.
IFRS 8 Operating Segments < (effective in periods start-ing on or after 1 January 2009). IFRS 8 replaces IAS 14 Segment Reporting. According to the new standard, seg-ment information is presented according to the “man-agement approach”, meaning that the data is presented in the same way as in internal reporting. The standard requires that data be presented on the Group’s products, services, geographical areas and significant customers. In the opinion of the Group’s management, the standard will not affect the reported segments or the accounting principles used for segment information. The standard has been endorsed in the EU.
Amendment to IAS 23 < Borrowing Costs (effective in periods starting on or after 1 January 2009). The amended standard requires that the acquisition cost of an asset, such as a production plant, that meets the conditions, shall directly include borrowing costs incurred from the acquisition, construction or production of the asset in question. The Group has entered borrowing costs as expenses in the period in which they were incurred, as was allowed in the standard prior to the amendment. The Group estimates that the amendment will not have a material impact on future consolidated financial statements. The amendment has been endorsed in the EU.
Amendment to IAS 1 < Presentation of Financial Statements (effective in periods starting on or after 1 January 2009). The amendment changes the presentation of financial statements by separating changes in equity related to capital transactions with owners from non-owner changes in equity. The changes are mainly related to the presenta-tion of the income statement and the statement of changes in equity. The method used to calculate earnings per share will remain unchanged. The amendment has been endorsed in the EU.
Amendment to IFRS 3 < Business Combinations (effective in periods starting on or after 1 July 2009). The scope of the amended standard is broader than before. Several of the changes brought about by the amendments are signifi-cant to the Group. The amendments affect the amount of goodwill recognised for acquisitions, as well as business disposals. They also have an impact on the items recognised in the income statement in the period of acquisition and
RAISIO’S FINANCIAL STATEMENTS 200820

in the periods in which additional consideration is paid or additional acquisitions are carried out. According to the transition requirements, business combinations with an acquisition date prior to the date of obligatory adoption of the standard need not be restated. The amended standard has not yet been endorsed in the EU.
Amendment to IAS 27 < Consolidated and Separate Financial Statements (effective in periods starting on or after 1 July 2009). The amended standard requires that the impact of changes in the ownership of subsidiaries is recognised in shareholders’ equity if the changes do not result in loss of control. In other words, minority transactions no longer result in goodwill entries or entries of gain or loss through profit and loss. If the parent loses control of a subsidiary, the retained interest is recognised at fair value through profit or loss. This accounting method will also be applied to investments in associates (IAS 28) and in joint ven-tures (IAS 31). As a result of the amendment, the losses of a subsidiary can be allocated to a minority even if they exceed the amount of the minority interest. The amended standard has not yet been endorsed in the EU.
Amendment to < IFRS 2 Share-Based Payment (Vesting Conditions and Cancellations) (effective in periods be-ginning on or after 1 January 2009). According to the amendment, all features that are not vesting conditions must be taken into account when measuring the fair value of equity instruments. The amendment also clarifies the treatment of cancellations. The Group estimates that the amendment will not have a material impact on future con-solidated financial statements. The amended standard has been endorsed in the EU.
Amendments to IAS 1 < Presentation of Financial Statements and IAS 32 Financial Instruments: Presentation concerning puttable financial instruments and obligations arising on liquidation (effective in periods starting on or after 1 Janu-ary 2009). According to the amendments, some puttable instruments and financial instruments that impose on the issuer an obligation to deliver a pro-rata share of the entity’s net assets only on liquidation shall be treated as equity. The adoption of the amended standards will not affect the consolidated financial statements. The amendments have been endorsed in the EU.
Improvements to IFRSs (Annual Improvements 2007) <(mostly effective in periods beginning on or after 1 Janu-ary 2009). In the Annual Improvements process, minor and less urgent amendments to standards are compiled and implemented once a year. The process includes amend-ments to a total of 34 standards. The impacts of the amend-ments vary depending on the standard, but the Group does not expect the changes to have a significant effect on the consolidated financial statements. The amendments have been endorsed in the EU.
Amendments to < IFRS 1 First-time Adoption of International Financial Reporting Standards and IAS 27 Consolidated and Separate Financial Statements (Cost of Investment in a Subsidiary, Jointly Controlled Entity or Associate) (effec-tive in periods beginning on or after 1 January 2009). Since the amendments apply to first-time adopters, they will not have an impact on future consolidated financial statements. The amendments have been endorsed in the EU.
Amendment to IAS 39 < Financial Instruments: Recognition and Measurement for eligible hedged items (effective in periods beginning on or after 1 July 2009). The amendments clarify two hedge accounting issues: a one-sided risk in a hedged item and inflation in a financial hedged item. The Group estimates that the interpretation will not have a ma-terial impact on future consolidated financial statements. The interpretation has not yet been endorsed in the EU.
IFRIC 12 < Service Concession Arrangements. The interpre-tation provides guidance on how an operator shall recog-nise certain contractual items in arrangements involving the provision of public service. The Group has not entered into agreements with the public sector as referred to in the interpretation in the now concluded reporting period or the period prior to that. The interpretation has not yet been endorsed in the EU.
IFRIC 13 < Customer Loyalty Programmes (effective in peri-ods beginning on or after 1 July 2008). The interpretation addresses loyalty award credits. The Group estimates that the interpretation will not affect its future consolidated financial statements, since it has not adopted any customer loyalty programmes referred to in the interpretation. The interpretation has been endorsed in the EU.
IFRIC 15 < Agreements for the Construction of Real Estate (effective in periods beginning on or after 1 January 2009). The interpretation provides guidance on how to determine what standard to apply when recognising revenue from real estate construction and when revenue from a construc-tion project can be recognised. The interpretation will not affect the Group’s financial statements. The interpretation has not yet been endorsed in the EU.
IFRIC 16 < Hedges of a Net Investment in a Foreign Opera-tion (effective in periods beginning on or after 1 October 2008). The interpretation clarifies the treatment of hedge accounting of a net investment in a foreign operation in the consolidated financial statements. The conclusion is that the hedging of a net investment in a foreign operation applies to differences in functional currencies, not in the presentation currency. Moreover, the hedging instrument may be held by any entity in the group. The provisions of IAS 21 The Effects of Changes in Foreign Exchange Rates apply to the hedged item. The Group estimates that the interpretation will not have a material impact on future consolidated financial statements. The interpretation has not yet been endorsed in the EU.
IFRIC 17 < Distributions of Non-cash Assets to Owners (effective in periods beginning on or after 1 July 2009). The interpretation provides guidance on the recognition and measurement of non-cash-settled dividends. The Group estimates that the interpretation will not affect future consolidated financial statements. The interpreta-tion has not yet been endorsed in the EU.
IFRIC 18 < Transfer of Assets from Customers. The interpreta-tion clarifies the requirements of IFRSs for agreements in which an entity receives from a customer a tangible asset that the entity must use to connect the customer to a network or to supply the customer with certain goods or services. The Group management is examining the impact of the amendments on the consolidated financial statements. The interpretation has not yet been endorsed in the EU.
RAISIO’S FINANCIAL STATEMENTS 2008 21

(eur million)
2008 2007 2008 2007 2008 2007 2008 2007 2008 2007 2008 2007 2008 2007
External salesServices 0.9 0.3 0.9 0.3Goods 197.2 190.4 271.2 194.7 33.6 35.4 0.1 0.1 502.1 420.6Royalties 0.0 0.0 1.0 1.0 1.0 1.0
Total external sales 197.2 190.4 271.2 194.7 34.6 36.4 1.0 0.4 504.0 421.9
Internal sales 4.6 6.7 11.4 12.0 9.7 8.4 –25.7 –27.1 0.0 0.0
Net sales 201.8 197.1 282.7 206.7 44.3 44.9 1.0 0.4 –25.7 –27.1 504.0 421.9
Segment operating result 9.7 –11.1 12.3 14.2 10.0 9.5 –3.4 –2.1 –0.3 0.1 28.3 10.6
Share of associated companies’ results 0.0 –0.4 0.1 0.0 0.1 –0.3
Unallocated items –6.1 –1.9
Result for the financial period from continuing operations 22.2 8.3
Result for the financial period from discontinued operations 0.0 –7.3
Result for the financial period 22.2 1.1
Segment’s assets 98.5 109.6 113.1 123.6 41.4 48.1 17.4 18.8 –3.0 –6.3 267.4 293.7
Holdings in associated companies and joint ventures 0.1 0.8 0.6 0.6 0.7 1.4
Unallocated assets 95.9 65.2
Total assets 364.0 360.3
Segment’s liabilities 16.9 24.6 32.1 38.1 3.1 2.1 5.5 4.4 –2.5 –6.1 55.1 63.1Unallocated liabilities 29.5 18.5
Total liabilities 84.6 81.5
Investments 16.6 7.2 9.3 16.7 1.3 7.5 1.9 1.6 0.9 0.0 –1.6 29.1 32.3Depreciation 7.0 8.3 4.2 3.5 3.7 3.2 3.1 3.0 18.1 18.0
Goodwill impairment 0.0 1.3 0.0 0.0 1.3
Other impairment and their retuns 1.3 2.4 –6.0 1.3 –3.5
Other expenses that do not involve payment:Withdrawal from the investment project 1.5 0.0 1.5
NOTES TO THE CONSOLIDATED INCOME STATEMENT
1 . segment i n formation
Segment information is presented according to the business and geographic segments used by the Group. The Group’s primary reporting model follows business segments. The business segments are based on the Group’s internal financial reporting and organisation structure.
Pricing between segments is according to the fair market value.
Assets and liabilities of segments include items that are used in the segment’s business operations or can, with good reason, be allocated to the segment. Unallocated items include tax and financial items, as well as items pertaining to the entire Group. Investments consist of tangible fixed assets and intangible asset additions, which are used over more than one financial period.
Primary reporting format – business segment
The Group is divided into four business segments: Food, Feed & Malt, Ingredients, and other operations. The Food segment processes and markets food for consumers, the catering business and others in food industry. Its home market covers Finland and the Baltic Sea region. Feed & Malt produces feed mixes for farm animals, special feeds for fish, as well as malt for the brewery industry; the main market area being Finland, Russia and the Baltic countries. The Ingredients segment develops, produces and markets functional ingredients for food businesses worldwide. In 2007, Raisio sold its Diagnostics segment in its entirety, its food potato production reported within its Food segment, as well as its special feeds manufacturing company, Monäs Feed Oy Ab, part of its Feed & Malt segment. These three business operations have been reported as discontinued operations in the 2007 income statement.
foodgroup totaleliminations
discontinued operations
other operationsingredients
feed & malt
RAISIO’S FINANCIAL STATEMENTS 200822

Secondary reporting model – geographic segment
The Group’s operations are divided into the following geographic regions: Finland, Poland, Russia, rest of Europe and rest of the world.
Net sales from the continued operations of geographical segments are presented by customer location. Assets and investments from continued operations are presented by asset location.
(eur million)
2008 2007 2008 2007 2008 2007 2008 2007 2008 2007 2008 2007 2008 2007
Net sales 301.0 263.9 45.9 38.5 44.1 39.5 106.7 74.8 6.3 5.2 504.0 421.9
Segment’s assets 338.5 326.5 16.4 18.4 8.6 10.7 4.3 5.9 11.6 11.7 –15.4 –12.9 364.0 360.3
Investments 27.8 29.6 1.2 1.1 0.1 0.7 0.0 0.0 0.0 0.0 0.0 0.0 29.1 31.4
F INL AND polandrest of
the worldrussia eliminationsrest ofeurope
grouptotal
(eur million) 2008 2007
2. oth er i ncome an d expenses from Busi n ess operations
Sales profit from tangible assets 0.1 1.1Gain on dissolution of joint venture 4.2 0.0Goodwill impairment 0.0 –1.3Other income and expenses from business operations 0.8 –1.1Total 5.1 –1.3
Auditors’ remunerationAudit 0.1 0.2Certificates and reports 0.0 0.0Tax guidance 0.0 0.0Other services 0.2 0.1Total 0.3 0.4
3. depreciation an d impai rment
Depreciation by asset group
Depreciation on intangible assetsIntangible rights 1.1 0.9Other intangible assets 2.0 1.9Total 3.1 2.8
Depreciation on tangible assetsBuildings 5.1 4.6Machinery and equipment 9.8 10.2Other tangible assets 0.1 0.5Total 15.0 15.3
Impairment by asset groupGoodwill 1.5Intangible rights 0.2Other intangible assets 0.0Buildings –4.3Machinery and equipment 0.6Prepayments and uncompleted acquisitions 1.3 0.0Total 1.3 –2.0
Total depreciation and impairment 19.3 16.0
Depreciation by activity
Cost of sales 13.1 12.7Sales and marketing 0.2 0.3Administration 4.0 4.2Research and development 0.7 0.8Total 18.1 18.0
RAISIO’S FINANCIAL STATEMENTS 2008 23

(eur million) 2008 2007
Impairment and their retuns
Expenses corresponding to products sold 1.3 –3.7Administration 0.0 0.2Other income and expenses from business operations 0.0 1.5Total 1.3 –2.0
4. expenses from employment Ben efits
Salaries 41.8 40.6Pension expenses – defined contribution plans 5.9 6.0Pension expenses – defined benefit plans 0.0 0.0Other indirect personnel costs 3.5 4.0Total 51.2 50.7
Details about the management’s employee benefits are provided in Notes 30 Related party transactions. Details about assigned company shares are provided in Notes 19 Share-based payments.
average n umBer of people employed By th e grou p i n th e fi nancial period
Food 642 749Feed & Malt 275 278Ingredients 65 73Joint operations 66 57Total 1,048 1,157
5. f i nancial i ncome an d expenses
Dividend income from available-for-sale financial assets 0.2 0.2Sales profits of financial assets at fair value through profit or loss 0.0 0.9Fair value change in financial assets at fair value through profit or loss 0.2 0.0Interest income from financial assets at fair value through profit or loss 1.3 0.7Interest income from loan receivables 0.1 0.1Other interest income 0.6 0.6Exchange rate differences, net 0.0 0.0Other financial income 0.0 0.0Total financial income 2.4 2.5
Fair value change in financial assets at fair value through profit or loss 0.0 0.0Interest expenses from loans –0.6 –0.5Other interest expenses –1.2 –0.5Changes in value of commodity derivatives –1.2 –2.0Exchange rate differences, net 0.0 –0.1Other financial expenses –0.2 –0.1Total financial expenses –3.2 –3.2
Items comprising the operating result include exchange rate gains and losses amountingto EUR –0.0 million in 2008 (EUR –0.3 million).
6. i ncome taxes
Tax based on the taxable income for the financial period –3.1 –0.5Taxes paid in previous financial periods –0.5 0.0Deferred taxes –1.7 –0.7Total –5.3 –1.2
RAISIO’S FINANCIAL STATEMENTS 200824

(eur million) 2008 2007
Reconciliation statement for the tax expenses in the income statement and the taxes calculated on the basis of the Group’s domestic tax rate (26%).
Taxes calculated on the basis of the domestic tax rate –7.2 –2.5Impact of a deviating tax rate used in foreign subsidiaries 0.3 –0.3Impairment of goodwill 0.0 –0.4Returns exempt from tax 1.2 0.1Non-deductible expenses –0.4 –0.1Unused losses in the financial period –0.8 –0.9Use of previously unrecognised fiscal losses 0.2 0.5Recognition of deferred tax assets for depreciation not deducted previously in taxation 2.2 2.5Depreciation not deducted in taxation 0.0 0.0Tax from previous years –0.5 0.0Other items –0.4 –0.1Total –5.3 –1.2
7. non-cu rrent assets avai laBle for sale an d disconti n u ed operations
The Group had no assets held for sale or discontinued operations in 2008. In February 2007, the Group signed a preliminary agreement on the divestment of its food potato business. According to the agreement signed in March, the business transferred to the new owner at the beginning of June 2007.
In January 2007, the Group announced its intention to divest its diagnostics business. The agreement was signed and the transaction concluded at the beginning of September 2007.
In November 2007, the Group classified Monäs Feed Oy Ab, a producer of special feeds, as held for sale. The company was divested on 31 December 2007, at which time the company transferred to the new owner.
The food potato business, diagnostics business and Monäs Feed Oy Ab are reported under discontinued operations in the income statement for 2007.
Result for discontinued operations:
Income from ordinary operations 19.3Expenses –23.7Result before taxes –4.5Taxes –0.1Result after taxes –4.6
Earnings due to discontinuation –2.9Taxes 0.1Result after taxes –2.7
Result for the financial period from discontinued operations –7.3
Cash flows for discontinued operations:
Cash flows from business operations 0.0 1.3Cash flows from investments 0.9 5.8Cash flows from financial operations 0.0 –0.1Total cash flows 0.9 7.0
Impact of divested operations on the Group’s financial position:Non-current assets 5.8Inventories 5.0Current receivables 5.4Liquid funds 0.4
16.5
RAISIO’S FINANCIAL STATEMENTS 2008 25

(eur million) 2008 2007
Short-term creditors 3.2Accumulated translation differences –0.5
Loss on sale of business operations –2.9Costs allocated to sales 1.3
Sales price 12.3
Available from the sales price on the closing date 1.1Cash flow from sales 9.4
In the cash flow statement:Divestment of subsidiaries less liquid assets at the time of divestment 4.1Disposal income from tangible and intangible assets 2.6Cash flow from business operations 2.7
9.4
8. earn i ngs per share
Undiluted earnings per share have been calculated by dividing the profit for the period for parent company shareholders with the weighted average number of outstanding shares over the financial period.
Profit for the period for parent company shareholders, continuing operations (EUR million) 22.1 8.7Profit for the period for parent company shareholders, discontinued operations (EUR million) 0.0 –7.3
Undiluted weighted average of shares in the financial period 156,604,834 159,014,892Dilution resulting from share-based compensation 64,846 –Diluted weighted average of shares in the financial period 156,669,680 159,014,892
Undiluted earnings per share, continuing operations (EUR/share) 0.14 0.05Earnings per share adjusted by the dilution effect, continuing operations (EUR/share) 0.14 0.05
Undiluted earnings per share, discontinued operations (EUR/share) 0.00 –0.05
Earnings per share adjusted by the dilution effect, discontinued operations (EUR/share) 0.00 –0.05
RAISIO’S FINANCIAL STATEMENTS 200826

NOTES TO THE CONSOLIDATED BALANCE SHEET
9. consoli dated i ntangi Ble assets 2008
(eur million)
intangible rights goodwill
other long-term
expenditure
advances paid and
incomplete acquisitions
intangible assets total
Acquisition cost 1.1. 32.0 27.1 19.5 0.8 79.4Exchange rate differences –1.2 –2.9 0.0 0.0 –4.1Increase 1.1 0.3 1.0 0.1 2.5Divestments and other decreases 0.4 0.3 4.2 0.0 4.9Reclassifications between items 0.0 0.0 0.8 –0.8 –0.0
Acquisition cost 31.12. 31.5 24.2 17.1 0.1 73.0
Accumulated depreciation and write-downs 1.1. 28.3 25.8 13.1 0.0 67.2Exchange rate differences –1.2 –2.7 0.0 0.0 3.9Accumulated depreciation of decrease and transfers 0.4 0.3 4.2 0.0 4.9Depreciation for the financial period 1.1 0.3 2.0 0.0 3.3Write-downs and their returns 0.0 0.0 0.0 0.0 0.0
Accumulated depreciation 31.12. 27.8 23.1 10.9 0.0 61.8
Book value 31.12. 2008 3.7 1.2 6.2 0.1 11.1
9. consoli dated tangi Ble assets 2008
The book value of intangible and tangible assets includes machinery and equipment purchased via financial leasing to the value of EUR 1.1 million.
(eur million)land
and water areas
buildings and
construc-tions
machinery and
equipment
other tangible
assets
advances paid and
incomplete acquisitions
tangible assets total
Acquisition cost 1.1. 4.9 129.2 274.3 1.4 20.4 430.2Exchange rate differences 0.0 –1.1 –0.5 –0.1 –0.1 –1.8Increase 0.2 3.1 7.6 0.0 3.4 14.2Divestments and other decreases 0.0 3.7 21.7 0.2 0.0 25.6Reclassifications between items 0.0 10.4 7.0 0.1 –17.5 0.0
Acquisition cost 31.12. 5.1 137.8 266.8 1.2 6.2 417.1 Accumulated depreciation and write-downs 1.1. 0.0 75.5 225.9 0.9 0.0 302.3
Exchange rate differences 0.0 –0.3 –0.5 –0.1 0.0 –1.03.7 20.9 0.1 0.0 24.7
Depreciation for the financial period 0.0 5.1 9.7 0.1 0.0 14.9Write-downs and their returns 0.0 0.0 0.0 0.0 1.2 1.3
Accumulated depreciation 31.12. 0.0 76.6 214.2 0.8 1.2 292.8
Book value 31.12.2008 5.1 61.2 52.5 0.4 5.0 124.2
Book value of the machinery and equipment 31.12. 49.6
Accumulated depreciation of decrease and transfers
RAISIO’S FINANCIAL STATEMENTS 2008 27

9. consoli dated i ntangi Ble assets 2007
9. consoli dated tangi Ble assets 2007
The book value of intangible and tangible assets includes machinery and equipment purchased via financial leasing to the value of EUR 0.7 million.
Raisio reduced the overcapacity of its milling business by closing down its wheat and rye mills in Nokia, for which reason a value adjustment of EUR 2.0 million was entered under machinery, and a total of EUR 1.3 million was written down. A weakened profitability outlook for the special feed factory resulted in the reassessment of assets. A EUR 1.8 million value adjustment was entered in assets. At the end of the year, the business was sold in its entirety. The value adjustment entered in the assets of the malt business in 2005 was reassessed due to the improved market situation and changed pricing structure. On the basis of this reassessment, there were no longer any grounds for the value adjustment, and therefore, a EUR 6.0 million cancellation of value adjustments was booked.
(eur million)
intangible rights goodwill
other long-term
expenditure
advances paid and
incomplete acquisitions
intangible assets total
Acquisition cost 1.1. 34.3 43.8 19.4 0.1 97.6Exchange rate differences –0.2 –1.1 0.0 0.0 –1.4Increase 1.3 0.2 0.6 0.8 2.9Divestments and other decreases 3.3 15.8 0.6 0.0 19.7Reclassifications between items 0.0 0.0 0.1 –0.1 0.0
Acquisition cost 31.12. 32.0 27.1 19.5 0.8 79.4
Accumulated depreciation and write-downs 1.1. 29.3 41.2 11.5 0.0 82.0Exchange rate differences –0.2 –1.5 0.0 0.0 –1.7Accumulated depreciation of decrease and transfers 1.8 15.5 0.3 0.0 17.6Depreciation for the financial period 0.9 0.0 1.9 0.0 2.8Write-downs and their returns 0.2 1.5 0.0 0.0 1.7
Accumulated depreciation 31.12. 28.3 25.8 13.1 0.0 67.2
Book value 31.12.2007 3.7 1.3 6.4 0.8 12.2
(eur million)land
and water areas
buildings and
construc-tions
machinery and
equipment
other tangible
assets
advances paid and
incomplete acquisitions
tangible assets total
Acquisition cost 1.1. 5.1 137.1 294.7 1.7 11.9 450.5Exchange rate differences –0.1 –0.3 –1.3 0.1 0.1 –1.4Increase 0.2 4.2 8.2 0.2 16.6 29.4Divestments and other decreases 0.3 16.3 29.6 0.5 1.6 48.3Reclassifications between items 0.0 4.4 2.3 0.0 –6.6 0.0
Acquisition cost 31.12. 4.9 129.2 274.3 1.4 20.4 430.2
Accumulated depreciation and write-downs 1.1. 0.0 89.9 241.8 1.1 0.0 332.8Exchange rate differences 0.0 0.0 –1.0 0.0 0.0 –1.0Accumulated depreciation of decrease and transfers 0.0 15.8 26.6 0.4 0.0 42.8Depreciation for the financial period 0.0 4.7 10.4 0.1 0.0 15.1Write-downs and their returns 0.0 –3.1 1.3 0.0 0.0 –1.9
Accumulated depreciation 31.12. 0.0 75.5 225.9 0.9 0.0 302.3
Book value 31.12.2007 4.9 53.6 48.4 0.5 20.4 127.9
Book value of the machinery and equipment 31.12. 45.9
RAISIO’S FINANCIAL STATEMENTS 200828

(eur million) 2008 2007
10. goodWi ll testi ng
The Group’s remaining goodwill is related to the Food Division’s Polish margarine business. The goodwill totalled EUR 1.2 million on 31 December 2008 (EUR 1.3 million in 2007).
Goodwill has been allocated to cash-flow-generating units for the purpose of impairment testing. In impairment tests, recoverable amounts are determined on the basis of the replacement cost. Cash flow estimates are based on estimates approved by the management, covering the following five years. Cash flows after the forecast period approved by the management have been extrapolated using a steady growth factor.
The following fundamental assumptions are used to determine the replacement cost:
Budgeted operating margin percentage *) 7.3 8.0Growth percentage **) 3.0 1.9Discount rate 10.6 10.6
*) Budgeted average operating margin percentage used in the statements.**) In cash flows after the forecast period.
Owing to the small amounts of goodwill, a separate sensitivity analysis is not presented.
Recognised impairment:
In 2007, the Group reduced the overcapacity of its milling business, which was part of the food segment, and therefore, also the goodwill related to this business was tested. As a result of this testing, the entire goodwill of EUR 1.3 million was derecognised.
11 . holdi ngs i n associated compan i es an d Joi nt ventu res
Joi nt ventu res
Book value 1.1. 0.1 0.5Exchange rate differences 0.1 0.0Decrease –0.1 –0.1Share of result for the financial period 0.0 –0.3Book value 31.12. 0.1 0.1
The book value of joint ventures does not include goodwill. At the beginning of the 2008 financial period, the Group sold its share in the GoGreen AB joint venture. During the financial period 2007, the joint venture ZAO Skandinavskij Korm, in Russia, was terminated.
associated compan i es
Book value 1.1. 1.4 1.8Exchange rate differences 0.0 –0.2Increase 0.0 0.0Decrase –0.8 –0.3Share of result for the financial period 0.1 0.0Book value 31.12. 0.6 1.4
The book value of associated companies on 31 December 2008 does not include goodwill (EUR 0.2 million in 2007). At the beginning of the 2008 financial period, the Group sold its share in the Latvian associated company, AS Rigas Dzirnavnieks. In the 2007 financial period, the Group sold Vihannin Vedenpuhdistamo Oy and the Polish associate, Obory w Kozienicach Sp. Z o.o.
The amounts of the assets and liabilities, net sales and result of joint ventures, corresponding to the Group’s holdings:
Assets and liabilities related to investments in joint ventures:Non-current assets 0.0 0.2Current assets 1.7 2.6Non-current liabilities 0.0 0.0Current liabilities 1.6 3.0Assets, net 0.1 –0.1
RAISIO’S FINANCIAL STATEMENTS 2008 29

(eur million) 2008 2007
Income and expenses related to investments in joint ventures:Net sales 16.0 18.5Expenses 16.0 19.0Profit/loss 0.0 –0.5
Total assets, liabilities, net sales and profit/loss of associated companies:
Assets 2.0 29.6Liabilities 0.4 26.1Net sales 0.9 22.0Profit/loss 0.1 –0.3
12. f i nancial assets avai laBle for sale
Unquoted investments in shares 0.6 0.6Total investments available for sale 0.6 0.6
Unquoted investments in shares are presented at their purchase price, because their reliable fair values are not available.
13. long-term receivaBles
Loan receivables from associated companies 0.6 0.9Other long-term receivables 0.0 0.4Total long-term receivables 0.6 1.3
The non-current loan receivable presented above mainly consists of a variable-rate receivable in USD. The fair values of non-current receivables are presented in Note 27.
The balance sheet values correspond best to the amount equal to the maximum credit risk, excluding the fair value of collateral, in case other contracting parties cannot meet their obligations related to financial instruments. Loan receivables form a credit risk concentration because they are mostly granted by a single company.
14. i nventori es
Materials and supplies 47.9 64.4Production in progress 8.7 8.3Finished products and goods 16.6 18.8Advances paid 0.1 0.2Total inventories 73.3 91.7
The book value of inventories does not include essential entries, with which the value of inventories would have been reduced to correspond to their net realisation value.
15. accou nts receivaBles an d oth er receivaBles
Accounts receivables 51.6 45.0Receivables from Group companies 1.4 2.3Prepaid expenses and accrued income 2.5 4.1Advance payment receivables 0.1 0.0Amortisation instalment for long-term loan receivables 0.3 0.4Current loan receivables 0.7 0.0Avoir fiscal tax credit receivables 6.7 7.3Other receivables 2.7 11.0Total accounts receivable and other receivables 66.0 70.1
At the reporting date, three-quarters of the Group’s accounts receivables were denominated in euro, one-tenth in Polish zloty, nearly one-tenth in rouble and the rest in other currencies.
At the reporting date, the Group had accounts receivables that had matured over 60 days earlier and whose value had not decreased: EUR 1.2 million (EUR 2.2 million in 2007). The overdue receivables have the following age distribution:
Overdue 61–180 days 1.0 2.0Overdue more than 180 days 0.2 0.2
1.2 2.2
RAISIO’S FINANCIAL STATEMENTS 200830

(eur million) 2008 2007
The following items have been deducted from accounts receivables:
Value on 1.1. 0.6 0.9Increase 1.0 0.2Decrease –0.3 –0.4Value on 31.12. 1.2 0.6
The Group recognised a total of EUR 1.0 million (EUR 0.3 million in reporting period 2007) in credit losses from accounts receivables in the reporting period.
Substantial items included in prepaid expenses and accrued income consist of accrued business income and expenses, financial items and taxes. In compliance with IAS 39, the fair values of receivables included in financial assets are presented in Note 27.
The balance sheet values correspond best to the amount equal to the maximum credit risk, excluding the fair value of collateral, in case other contracting parties cannot meet their obligations related to financial instruments. The receivables involve no significant credit risk concentrations.
16. f i nancial assets at fai r valu e th rough profit or loss
Securities under financial assets 65.2 27.7Derivative contracts 1.6 0.2Total financial assets recognised at fair value in the income statement 66.8 27.9
Financial assets recognised at fair value in the income statement include bonds held for trading purposes, fund units, certificates of deposit and commercial papers issued by banks and companies and falling due within 12 months, as well as derivatives held for trading purposes. Financial assets at fair value through profit or loss are denominated in euro. The balance sheet values correspond best to the amount equal to the maximum credit risk in the event that other contracting parties are unable to meet their obligations related to financial instruments. Investments in items belonging to financial assets recognised at fair value through profit or loss are carefully diversified and involve no significant credit risk concentrations.
Changes in the fair value of financial assets held for trading purposes are presented in the incomestatement under financial income and expenses.
17. l iQu i d fu n ds
Cash in hand and at bank accounts 12.8 15.9
Current bank deposits are mainly denominated in euro and withdrawable on demand.
(milj. euroa) 2007 200 6
Series K (20 votes/share) 34,474 34,474 5.8 5.8Repurchase of company shares, series K –198 –158 –0.4 –0.3Series V (1 vote/share) 130,675 130,675 22.0 22.0Disposal of company shares, series V 72 0.2Repurchase of company shares, series V –9,231 –8,231 –19.1 –17.6Total 155,793 156,760 27.8 27.8 –19.3 –17.9
muumaailmavenäjä eliminoinnit
konserniyhteensä
2008 2007 2008 2007 2008 2007share capital1,000 shares company shares
18. shareholders’ eQu ity
Translation differences: The translation differences fund includes the translation differences arising from the conversion of financial statements of independent foreign units. Profits and losses arising from the hedging of net investments in independent foreign units are also included in the translation differences when the requirements for hedge accounting is met.
The parent company’s share capital is divided by share types as follows:
(eur million)
RAISIO’S FINANCIAL STATEMENTS 2008 31

(eur million) 2008 2007
Company shares:Company shares include the acquisition cost of shares held by the Group. In 2005–2007, a total of 8,388,800 company shares were acquired on the stock exchange. Of these, 8,230,500 were free shares and 158,300 were restricted shares. In 2008, the Group acquired 1,039,508 additional shares: 1,000,000 free shares and 39,508 restricted shares. In 2008, a total of 72,000 free shares held by the company were assigned to management and key employees as remuneration for good performance in 2007. At the end of the 2008 financial period, the Group held 9,356,308 company shares, of which 9,158,500 were free shares and 197,808 restricted shares. The remaining acquisition cost of company shares totals EUR 19.3 million and is presented as a deduction from shareholders’ equity.
Dividends:After the closing date, the parent company Board has proposed that EUR 0.07 per share be paid as dividends.
Accumulated translation differences:
Translation differences 1.1.Group companies –2.2 –1.3Associated companies –0.1 0.0
–2.3 –1.2Change in translation difference
Group companies –1.0 –0.9Associated companies 0.1 –0.2
–0.9 –1.1Translation differences 31.12.
Group companies –3.2 –2.2Associated companies 0.0 –0.1
–3.2 –2.3
19. share-Based payments
Raisio plc’s Board of Directors decided on 28 May 2008 to set up a three-year share-based incentive scheme as a part of the incentive and reward system offered to Raisio’s key personnel. The scheme gives authorisation to distribute a maximum of 1,600,000 free shares already in the company’s possession. Rewards are paid as a combination of shares and cash. The cash payment is to cover the taxes and fiscal fees arising from share-based rewards.
The 2008 reporting period is the first earnings period in the scheme, which uses net sales growth (with a weight of 30%) and profit before taxes excluding one-off items (70%) as earnings criteria. The maximum number of free shares to be distributed is 400,000. The amount earned in rewards will be determined on the basis of the achievement of targets after the financial statements have been prepared in spring 2009. Rewards will be paid to those covered by the scheme in August 2009. Shares distributed as part of the scheme are subject to a disposal restriction and return obligation, which last until 1 September 2011 and will be applied if the employee’s employment or job contract end prior to the expiration of the disposal restriction. The return obligation also applies to the cash payment to the extent that the amount of taxes and fiscal fees decreases as a result of the return of shares. In the first earnings period, the scheme covers 15 people.
As a part of rewards to the management and key personnel, the Group distributed a total of 72,000 Raisio plc free shares in spring 2008 for good performance in 2007.
Expenses from employee benefits include equity-settled and cash-settled cash-based payments:
Equity-settled 0.1Settled in equity in future 0.1Cash-settled 0.0Settled in cash in future 0.3
Liabilities from cash-settled share-based schemes 0.3
RAISIO’S FINANCIAL STATEMENTS 200832
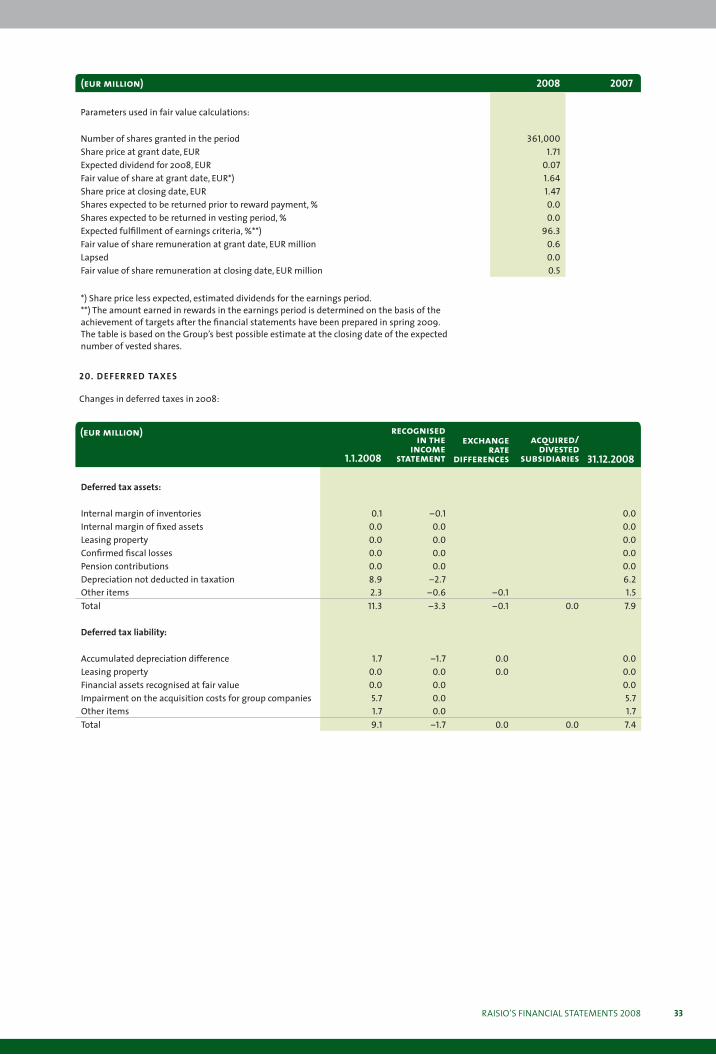
(eur million) 2008 2007
Parameters used in fair value calculations:
Number of shares granted in the period 361,000Share price at grant date, EUR 1.71Expected dividend for 2008, EUR 0.07Fair value of share at grant date, EUR*) 1.64Share price at closing date, EUR 1.47Shares expected to be returned prior to reward payment, % 0.0Shares expected to be returned in vesting period, % 0.0Expected fulfillment of earnings criteria, %**) 96.3Fair value of share remuneration at grant date, EUR million 0.6Lapsed 0.0Fair value of share remuneration at closing date, EUR million 0.5
*) Share price less expected, estimated dividends for the earnings period.**) The amount earned in rewards in the earnings period is determined on the basis of the achievement of targets after the financial statements have been prepared in spring 2009. The table is based on the Group’s best possible estimate at the closing date of the expected number of vested shares.
(milj. euroa) 2007 200 6
Deferred tax assets:
Internal margin of inventories 0.1 –0.1 0.0Internal margin of fixed assets 0.0 0.0 0.0Leasing property 0.0 0.0 0.0Confirmed fiscal losses 0.0 0.0 0.0Pension contributions 0.0 0.0 0.0Depreciation not deducted in taxation 8.9 –2.7 6.2Other items 2.3 –0.6 –0.1 1.5Total 11.3 –3.3 –0.1 0.0 7.9
Deferred tax liability:
Accumulated depreciation difference 1.7 –1.7 0.0 0.0Leasing property 0.0 0.0 0.0 0.0Financial assets recognised at fair value 0.0 0.0 0.0Impairment on the acquisition costs for group companies 5.7 0.0 5.7Other items 1.7 0.0 1.7Total 9.1 –1.7 0.0 0.0 7.4
20. deferred taxes
Changes in deferred taxes in 2008:
1.1.2008
exchange rate
differences
recognised in the
income statement
(eur million)acquired/
divested subsidiaries 31.12.2008
RAISIO’S FINANCIAL STATEMENTS 2008 33

Changes in deferred taxes in 2007:
Deferred tax assets corresponding to fiscal losses to be used at a later time have been recognised to the extent that it is probable that a tax benefit will be realised in the future. The Group’s accumulated losses totalled EUR 47.0 million (31 December 2007: EUR 49.5 million). Most of the losses will be discounted over a period in excess of five years.
(milj. euroa) 2007 200 6
Deferred tax assets:
Internal margin of inventories 0.1 0.0 –0.1 0.1Internal margin of fixed assets 0.0 0.0 0.0Leasing property 0.0 0.0 0.0Confirmed fiscal losses 2.5 –2.4 0.0Pension contributions 0.0 0.0 0.0Depreciation not deducted in taxation 6.7 2.2 8.9Other items 1.4 0.9 0.0 0.0 2.3Total 10.7 0.7 0.0 –0.1 11.3
Deferred tax liability:
Accumulated depreciation difference 0.0 1.7 0.0 1.7Leasing property 0.1 –0.1 0.0 0.0Financial assets recognised at fair value 0.0 0.0 0.0Impairment on the acquisition costs for group companies 5.7 0.0 5.7Other items 2.1 –0.3 1.7Total 7.9 1.3 0.0 0.0 9.1
1.1.2007exchange
rate differences
recognised in the income
statement
(eur million)acquired/
divested subsidiaries 31.12.2007
Deferred tax assets and liabilities are mutually deducted when legal off-setting rights exist and when the deferred taxes are related to one and the same individual. Sums netted in the consolidated balance sheet:
(eur million) 2008 2007
Deferred tax assets 7.9 11.3Deferred tax liability 7.4 9.1Deferred net tax assets 0.5 2.2
Since the undistributed profits of foreign subsidiaries are negative, no tax liability has recorded for them.
21. pension contri Butions
Changes in the liabilities recorded in the balance sheet:
Beginning of financial period 0.2 0.2Paid benefits 0.0 0.0Pension expenses in the income statement 0.0 0.0End of financial period 0.2 0.2
22. reserves
Provision for withdrawal from investment project:
Reserves 1.1. 1.9 5.1Increase in provisionsProvisions used –0.8 –3.3Reserves 31.12. 1.1 1.9
In the 2006 income statement, the Group booked a provision for negotiations on the construction of a flake mill in Russia. The decision was based on a considerable increase in investment costs, which were expected to result in the project no longer meeting the original revenue requirements. EUR 0.8 million of the provision has been used in 2008 and EUR 3.3 million in 2007.
RAISIO’S FINANCIAL STATEMENTS 200834

(eur million) 2008 2007
23. f i nancial l iaBi liti es at fai r valu e th rough profit or loss
Derivative contracts 0.4 1.5
Derivative contracts are interest rate, currency and raw material derivatives held for trading.
24. f i nancial l iaBi liti es
Non-currentBank loans 7.8 0.0Pension loans 5.8 0.0Financial leasing liabilities 0.7 0.3Total 14.3 0.4
Bank and pension loans are denominated in euro.
Of non-current liabilities (incl. finance leases), EUR 4.7 million will mature in 2009 (EUR 1.2 million in the comparison period), total EUR 13.1 million in 2010–2013 (EUR 0.1 million) and EUR 1.2 million in 2014 (EUR 0.0 million).
CurrentOverdraft facilities 0.7 4.6Amortisation of long-term loans 3.4 0.8Financial leasing liabilities 0.5 0.4Other interest-bearing liabilities 0.8 1.0Total 5.5 6.8
The fair values of interest-bearing liabilities are presented in Notes 27.
Financial liabilities are mainly variable-rate and euro-denominated. The interest rates of bank loans are mainly tied to 3–12-month Euribor rates. The interest rate period for pension loans liabilities is 3 years.
Maturity of financial leasing liabilities:
Financial leasing liabilities – total of minimum leasesWithin 12 months 0.5 0.4After 12 months but before five years 0.7 0.3Gross overall investment 1.2 0.8
Financial leasing liabilities – present value of minimum leases Within 12 months 0.4 0.3After 12 months but before five years 0.6 0.3Gross overall investment 1.0 0.7
Financial expenses accumulated in the future 0.2 0.1
Total financial liabilities 1.2 0.8
25. accou nts payaBle an d oth er liaBi liti es
Non-currentOther liabilities 0.1 0.0
CurrentAccounts payable 29.8 37.8Liabilities to associated companies 0.2 0.5Accrued liabilities and deferred income 14.1 13.3Advances paid 5.2 2.3Other liabilities 5.7 7.9Total 54.9 61.8Accrued liabilities include accrued business expenses and financial items. The most significant of these are accrued salaries and fees and other personnel expenses, which totalled EUR 8.5 million in 2008 (EUR 7.3 million in 2007).
RAISIO’S FINANCIAL STATEMENTS 2008 35

26. f i nancial risK management
overvi eW
Financial risk management aims to protect the Group against unfa-vourable developments in the financial markets and thus contribute to safeguarding and ensuring the Group’s performance. Financing and financial risk management have been assigned to the Group Finance department, operating under the Chief Financial Officer, in order to ensure sufficient expertise, as well as comprehensive and cost-effective operations. The divisions report their key risks to the Finance department. It, in turn, collects all of the Group’s risks and reports the risk exposures to finance and business manage-ment on a monthly and quarterly basis. The Finance department’s operations are governed by the financial risk management policy approved by the Board of Directors. All major borrowing decisions are taken by the Board of Directors based on proposals made by the Finance department.
fi nancial risKs an d th ei r management
Credit risks
Counterparty risk
Counterparty risk refers to a situation in which a contracting party is unable or unwilling to fulfil its obligations. Raisio exposes itself to counterparty risk when the Finance department makes invest-ments in the financial market and uses derivatives. The Finance de-partment is responsible for the counterparty risk related to invest-ments, loan assets and derivative contracts. The main approaches to managing counterparty risk include a careful selection of coun-terparties with a good credit rating, the use of counterparty-specif-ic limits, as well as diversification.
Investment activities
The financial risk management policy regulates the sum, maturity and counterparties of invested assets. In addition to direct long- or short-term interest-bearing investments, assets can be invested in fixed-income funds, shares and equity funds. The CFO has the right to decide on the counterparties for Raisio’s investments as defined in the policy. In principle, counterparties may be member states of the European Monetary Union, large Finnish municipalities and al-liances formed by them, financial institutions engaged in corporate banking in Finland and companies with a good credit rating, regis-tered in a member state of the European Monetary Union.
Credit risk in sales
Following the guidelines issued by the Group, divisions make inde-pendent decisions on counterparty risk, such as the criteria used to approve customers, the applicable terms and conditions for sales and the required collateral. They also assume responsibility for the credit risk related to accounts receivable. Accounts receivable can also be secured with credit insurance policies.
Liquidity risk
Liquidity risk refers to a situation in which the Group’s financial assets and additional financing options do not cover the future needs of business operations. In line with the policy, the Finance department strives to maintain good liquidity in all circumstances, keeping it at a level that guarantees strategic operating freedom to the management. The Group’s liquid assets consist of invested financial assets, as well as remaining credits and overdraft facilities agreed with investors. The liquidity reserve also includes the agreed 90-million-euro commercial paper programme. Funding risks are diversified by acquiring funding from various sources.
Market risks
Interest rate risk
Interest rate risk refers to the impact of interest rate fluctuations on the Group’s net financial income and expenses, as well as on the market values of interest-bearing investments and derivatives, over the following 12 months. Interest rate risk is managed by control-ling the structure and duration of the loan portfolio and interest-bearing investments within the limits allowed by the policy. The goal is to keep financial expenses as low and financial income as high as possible. The interest rate profile can be modified using interest rate swaps, forward rate agreements and interest rate op-tions. At the date of the financial statements, the Group had an open euro-denominated interest rate swap with a nominal value of EUR 10 million. The Group’s interest rate risk is monitored by cal-culating the impact that a one-percentage-point change in market rates has on the interest income and expenses of interest-bearing investments and debt over the following 12 months. The maximum interest rate risk is determined in the financial risk management policy.
interest rate risk, eur million
Impact of 1-ppt increase in market rates:
Interest income 0.6 0.3Interest expenses 0.0 0.0Change in market values 0.0 0.0
Net impact on interest income and expenses 0.6 0.3
31.12.2008 31.12.2007
Raisio’s sensitivity to interest rate fluctuations is determined by calculating how much a change of one percentage point, constant over the entire interest rate curve, affects net interest rate expenses and income. The examination takes into account Raisio’s interest-bearing investments and liabilities. Owing to the Group’s balance sheet structure, the management of interest rate risks focuses on those related to investments. In the review period, Raisio’s interest-bearing investments have focused on investments with a short term to maturity. At the date of the financial statements, 31 December 2008, Raisio’s sensitivity to a one-percentage-point rise in interest rates was approximately EUR +0.6 million (EUR +0.3 million) and to an interest rate decrease of the same size approximately EUR –0.6 million (EUR –0.3 million). Had the interest rate been 1 percentage point higher on the closing date, 31 December 2008, Raisio’s result after taxes would have been EUR +0.5 million (EUR +0.2 million) higher. Had the interest rate been 1 percentage point lower on the closing date, 31 December 2008, Raisio’s result after taxes would have been EUR –0.5 million (EUR –0.2 million) lower. Changes in the duration of the investment portfolio or the Group’s balance sheet position also result in changes in interest rate sensitivity.
RAISIO’S FINANCIAL STATEMENTS 200836

Commodity price risk
Raisio hedges against the uncertainty resulting from temporal differences in raw material purchases and product sales by acting risk-neutrally so that binding, physical purchase and sales com-mitments are kept in balance in terms of volume. The Group uses commodity derivatives allowed by the financial risk policy to hedge against earnings risk if physical commitments cannot be balanced fast enough otherwise. The hedging instruments used are short-term rapeseed futures.
Commodity risks are reported on a monthly basis to finance and business management. The report analyses the Group’s risk posi-tion by risk unit and within the limits allowed by the risk policy. On 31 December 2008, the risk position was 24.4 million kg (3.8 mil-lion kg). Commodity risk is also analysed using the VaR (Value- at- Risk) technique. When examining the VaR of a position, attention is given to the commercial commodity position and the derivative financial instruments hedging it. (VaR is calculated over one week, using a confidence level of 95%.)
If realised, the VaR risk of the commodity position on the closing date, 31 December 2008, would affect Raisio’s result after taxes by EUR ± 0.3 million (EUR ±0.0 million).
capital management
The target of the Group’s capital management is to use a strong equity structure to safeguard the Group’s ability to do business and to increase owner value by aiming at the highest possible return.
The development of the equity structure is monitored using the equity ratio. At the end of 2008, the Group’s equity was EUR 279.4 million (EUR 278.8 million) and its equity ratio was 77.9% (77.9%). The equity ratio is calculated by dividing shareholders’ equity with the balance sheet total less advances received. The equity ratios were as follows:
Currency risk
Raisio hedges against currency exposure arising from foreign currency receivables and liabilities, off-balance-sheet purchase and sales agreements and, partly, from budgeted cash flows. Currency risk is managed using currency forwards, which are rarely continu-ously open for more than 12 months.
The Group’s currency risk policy defines the maximum amount for a net position, mainly consisting of the domestic Group companies’ commercial and financial items and the derivatives hedging them. Exposure to currency risk arises mainly from items denominated in the Russian ruble, Swedish crown and US dollar.
The Group’s currency risk on 31 December 2008 would be EUR 0.1 million (EUR 0.1 million) if other currencies had weakened by 5% against the euro. The impact on Raisio’s result after taxes would be EUR 0.1 million (EUR 0.0 million). On the closing date, the Group’s 1–12-month currency forward contracts in RUB, SEK and USD had a nominal value of EUR 28.9 million. The Group companies’ currency positions against functional currencies other than the euro are not significant.
RUB SEK USD RUB SEK USD0.3 –0.2 1.4 0.0 0.5 –0.6
RUB SEK USD RUB SEK USD0.0 0.0 0.1 0.0 0.0 0.0
currency risk 31.12.2008 currency risk 31.12.2007
5% weakening in currency against the euro:
Currency risk, net position Currency risk, net position
(eur million)
VaR 0.4 0.1
Interest rate derivatives 10.0 0.0Currency derivatives 28.9 18.6Commodity derivatives 0.0 11.2
Equity, EUR million 279.4 278.8Balance sheet total, EUR million 364.0 360.3Equity ratio 77.9% 77.9%
31.12.2008 31.12.2007
Depending on Raisio’s commodity position at the time, the scope and size of impact on the income statement and balance sheet may differ from the VaR figure presented here.
31.12.2008 31.12.2007value-at risk of commodity position
(eur million)
(eur million)
31.12.2008 31.12.2007nominal values of derivatives
RAISIO’S FINANCIAL STATEMENTS 2008 37

The above price quotations, assumptions and valuation models have been used to determine the fair values of the financial assets and liabilities presented in the table:
Investments in shares and securities under financial assets:Publicly quoted shares available for sale are valued at the NASDAQ OMX Helsinki Ltd’s purchase price of the closing date. Unquoted investments in shares are recorded at the cost of acquisition because it has not been possible to use valuation methods to appraise them at fair value or to reliably determine their fair value. Financial assets recognised at fair value in the income statement are negotiable and they are valued using the market price prevailing on the closing date or the market rates corresponding to the duration of the contract. Derivatives:The fair values of interest rate, currency and commodity derivatives are determined using publicly quoted market prices at the closing date. Loan receivables, bank and pension loans and financial leasing liabilities:The fair values of loan receivables and bank and pension loans are based on discounted cash flows. The discount rate corresponds to the market rates that correspond to the rates determined in the said contracts. The fair value of financial leasing liabilities has been estimated by discounting future cash flows by the rate that corresponds to the rate of similar leasing contracts.
Accounts payable and other liabilities or sales receivables and other receivables:The original book value of accounts payable and other liabilities or sales receivables and other receivables corresponds to their fair value, because the impact of discounting is not significant taking into consideration the maturity of liabilities or receivables.
The following table presents the book values and fair values for each item. The book values correspond to the consolidated balance sheet values. The principles used to calculate the consolidated fair values of all financial instruments are presented below.
Financial assetsFinancial assets available for sale 12 0.6 0.6 0.6 0.6Loan receivables 13 1.7 1.7 1.2 1.2Sales receivables and other receivables 15 53.1 53.1 47.2 47.2Investments recognised at fair value in the income statement 16 65.2 65.2 27.7 27.7Liquid assets 17 12.8 12.8 15.9 15.9Derivatives 16 1.6 1.6 0.2 0.2
Financial liabilities Bank loans 24 10.0 10.0 0.8 0.8Pension loans 24 7.0 6.9Other loans 24 0.8 0.8 1.0 1.0Overdraft facilities 24 0.7 0.7 4.6 4.6Financial leasing liabilities 24 1.2 1.0 0.8 0.7Accounts payable and other liabilities 25 53.0 53.0 57.5 57.5Derivatives 23 0.4 0.4 1.5 1.5
note
book value 2008
fair value 2008
book value 2007
fair value2007
(eur million)
27. fai r valu es of fi nancial assets an d liaBi liti es
RAISIO’S FINANCIAL STATEMENTS 200838

(eur million) 2008 2007
28. oth er leases
Group as lessee:Minimum leases paid on the basis of other non-cancellable leasing contracts:
Within 12 months 0.8 1.1After 12 months but before five years 0.5 0.9After five years 0.5 0.5Total 1.8 2.5
The Group has leased cars, production facilities and land areas.
Based on other leases, Raisio’s 2008 income statement includes paid leasesworth EUR 3.6 million (EUR 5.2 million).
29. conti ngent an d oth er liaBi liti es
Pledged assets:
For the companyMortgages on real estate 0.0 0.7
Contingent off-balance sheet liabilities:
Contingent liabilities for the company 0.0 1.5
Contingent liabilities for others Guarantees 0.0 0.1
Other liabilities Other financial liabilities 1.7 2.0
Commitment to investment paymentsCommitments to investment payments effective at the reporting date 0.8 2.7
RAISIO’S FINANCIAL STATEMENTS 2008 39

(eur million) 2008 2007
Business activities involving insiders:
Sales to associated companies and joint ventures 13.6 12.8Purchases from associated companies and joint ventures 0.1 3.1Sales to key employees in management 1.1 0.0Purchases from key employees in management 0.9 0.6Short-term receivables from associated companies and joint ventures 1.4 2.3Liabilities to associated companies and joint ventures 0.2 0.5
Sales to associated companies and joint ventures are carried out at fair market value.
Management’s employee benefits:
Wages and fees 2.0 1.7Compensation paid in conjunction with termination of employment 0.1 0.3Total 2.1 2.0
su Bsi diary compan i es
Food DivisionCarlshamn Mejeri Produktion AB, Sweden 100.00OOO Ecomilk, Russia 100.00OOO Raisio, Russia 100.00Raisio Eesti AS, Estonia 100.00SIA Raisio Latvija, Latvia 100.00UAB Raisio Lietuva, Lithuania 100.00OOO Raisio Nutrition, Russia 100.00Raisio Polska Foods Sp. z o.o., Poland 100.00Raisio Sverige Ab, Sweden 100.00TOV Raisio Ukraina, Ukraine 100.00Raisio Nutrition Ltd / Margarine, Mill and Non Dairy, Raisio 100.00 100.00ZAO Zolotaya Melnitsa, Russia 74.90
Feed & Malt DivisionRaisio Malt Ltd, Raisio 100.00 100.00Raisio Nutrition Ltd / Oil Milling, Raisio 100.00 100.00Raisio Feed Ltd, Raisio 100.00 100.00
Ingredients DivisionRaisio Staest US Inc., USA 100.00Raisio Nutrition Ltd / Ingredients, Raisio 100.00 100.00
OthersRaision Konsernipalvelut Oy, Raisio 100.00 100.00Raisionkaari Industrial Park Ltd., Raisio 100.00 50.00
Joi nt ventu res
Food DivisionAteriamestarit Oy, Turku 50.00
associated compan i es
Feed & MaltVihervakka Oy, Pöytyä 38.50 38.50
30. related party transactions
Consolidated subsidiaries, joint ventures and associated companies
groupholding, %
parent company holding, %
RAISIO’S FINANCIAL STATEMENTS 200840

2008 2007 2006
Result and profitability
Net sales, EURm1) 504.0 421.9 402.6change, % 19.5 4.8 1.2
International net sales, EURm1) 203.0 158.0 158.7% of net sales 40.3 37.5 39.4
Operating result, EURm1) 28.3 10.6 –28.1% of net sales 5.6 2.5 –7.0
Result before taxes, EURm1) 27.5 9.5 –33.2% of net sales 5.5 2.3 –8.3
Return on equity, ROE, %1) 8.0 2.9 –10.7Return on investment, ROI, %1) 9.8 3.5 –9.1
Financial and economical position
Shareholders’ equity, EURm 279.4 278.8 290.4Interest-bearing financial liabilities, EURm 19.7 7.2 23.2Net interest-bearing financial liabilities, EURm –58.2 –36.5 –55.6Balance sheet total, EURm 364.0 360.3 387.4Equity ratio, % 77.9 77.9 75.0Net gearing, % –20.8 –13.1 –19.1Cash flow from business operations, EURm 52.7 15.6 15.1
Other indicators
Gross investments, EURm1) 29.1 31.4 27.6% of net sales 5.8 7.5 6.9
R&D expenses, EURm1) 5.8 6.4 9.8% of net sales 1.2 1.5 2.4
Average personnel1) 1,048 1,157 1,263
1) Key figures presented for continuing operations
FINANCIAL INDICATORS
(eur million) 2008 2007
Fees paid to Supervisory Board: 0.0 0.0
Fees paid to Board of Directors: 0.3 0.3
Wages and fees paid to Managing Director and members of Management Team: Matti Rihko 0.5 0.4Other members of Management Team 1.2 1.0Total 1.7 1.4
Pension and other benefits:
Members of the management have the right and obligation to retire at the age of 62.
The Managing Director’s contract may be terminated by both sides with six months notice.If the contract is terminated by the company, the Managing Director is entitled to compensation corresponding to 12 months’ pay in addition to the pay for the period of notice.
RAISIO’S FINANCIAL STATEMENTS 2008 41

2008 2007 2006
Earnings/share, continuing operations (EPS), EUR1) 0.14 0.05 –0.22Cash flow from business operations/share, EUR1) 0.34 0.10 0.09Equity/share, EUR1) 1.79 1.70 1.73Dividend/share, EUR 0.07 0.04 0.03Dividend/earnings, % 50.0 73.2 –13.7
Effective dividend yield, %Free shares 4.8 2.7 1.7Restricted shares 4.3 2.6 1.7
P/E ratioFree shares 10.5 27.5 –8.2Restricted shares 11.7 27.8 –8.2
Adjusted average quotation, EURFree shares 1.56 1.95 1.88Restricted shares 1.66 1.96 1.91
Adjusted lowest quotation, EURFree shares 1.35 1.39 1.35Restricted shares 1.38 1.50 1.42
Adjusted highest quotation, EURFree shares 1.87 2.33 2.44Restricted shares 1.85 2.25 2.44
Adjusted quotation 31.12., EURFree shares 1.47 1.50 1.79Restricted shares 1.64 1.52 1.80
Market capitalization 31.12., EUR million1) Free shares 178.6 183.7 224.9Restricted shares 56.2 52.2 62.1Total 234.8 235.8 287.1
Trading, EURmFree shares 44.2 100.0 121.1Restricted shares 1.3 2.6 2.8Total 45.5 102.6 124.0
Number of shares tradedFree shares, 1,000 shares 28,365 51,309 64,308% of total 21.7 39.3 49.3
Restricted shares, 1,000 shares 808 1,323 1,479% of total 2.3 3.8 4.3
Average adjusted number of shares, 1,000 shares1)
Free shares 122,310 124,553 125,843Restricted shares 34,294 34,462 34,524Total 156,605 159,015 160,367
Adjusted number of shares 31.12., 1.000 shares1)
Free shares 121,516 122,444 125,655Restricted shares 34,276 34,316 34,522Total 155,793 156,760 160,177
1) Number of shares, excluding company shares held by the Group2) According to Board’s proposal EUR 0.07 per share
SHARE INDICATORS
2)
RAISIO’S FINANCIAL STATEMENTS 200842

CALCULATION OF KEY F INANCIAL DEVELOPMENT INDICATORS
return on eQuity (roe), %* RESuLT bEFORE TAxES – INCOME TAxES ---------------------------------------------------------------------------------- x 100 ShAREhOLdERS’ EquITy (AvERAgE OvER ThE pERIOd)
return on investment (roi), %* RESuLT bEFORE TAxES + FINANCIAL ExpENSES --------------------------------------------------------------------------------- x 100 ShAREhOLdERS’ EquITy + INTEREST-bEARINg LIAbILITIES (AvERAgE OvER ThE pERIOd)
eQuity ratio, % ShAREhOLdERS’ EquITy ---------------------------------------------------------------------------------- x 100 bALANCE ShEET TOTAL – AdvANCES RECEIvEd
net interest-Bearing liaBilities INTEREST-bEARINg LIAbILITIES – LIquId ASSETS ANd FINANCIAL ASSETS RECORdEd AT FAIR vALuE IN ThE INCOME STATEMENT
net gearing, % NET INTEREST-bEARINg FINANCIAL LIAbILITIES ---------------------------------------------------------------------------------- x 100 ShAREhOLdERS’ EquITy
CALCULATION OF KEY SHARE INDICATORS
earnings per share* RESuLT FOR ThE yEAR OF pARENT COMpANy ShAREhOLdERS ----------- AvERAgE NuMbER OF ShARES FOR ThE yEAR, AdjuSTEd FOR ShARE ISSuE
cash floW from Business operations per share CASh FLOw FROM buSINESS OpERATIONS ---------------------------------------------------------------------- AvERAgE NuMbER OF ShARES FOR ThE yEAR, AdjuSTEd FOR ShARE ISSuE
shareholders’ eQuity per share EquITy OF pARENT COMpANy ShAREhOLdERS
NuMbER OF ShARES 31.12., AdjuSTEd FOR ShARE ISSuE
dividend per share dIvIdENd dISTRIbuTEd IN ThE pERIOd
NuMbER OF ShARES AT ENd OF pERIOd
dividend per earnings, %* dIvIdENd pER ShARE
pROFIT pER ShARE
effective dividend yield, % dIvIdENd pER ShARE, AdjuSTEd FOR ShARE ISSuE
CLOSINg pRICE, AdjuSTEd FOR ShARE ISSuE
price per earnings (p/e ratio)* CLOSINg pRICE, AdjuSTEd FOR ShARE ISSuE
pROFIT pER ShARE
marKet capitalisation CLOSINg pRICE, AdjuSTEd FOR ISSuE x NuMbER OF ShARES 31.12. wIThOuT OwN ShARES
--------------------------------------------------------------------------------
* ThE CALCuLATION OF kEy INdICATORS uSES CONTINuINg OpERATIONS RESuLT.
x 100
x 100
RAISIO’S FINANCIAL STATEMENTS 2008 43

In the book-entry system, restricted shares for which the approval procedure is in progress, or for which approval has not been sought, will be retained on the waiting list until they are entered as restricted shares in the share register following approval, assigned to another shareholder or converted into free shares. The waiting list had 5.6 million restricted shares on 31 December 2008.
TR ADING IN R AIS IO’S SHARES
The highest price of the series V share was EUR 1.87 and the lowest EUR 1.35. The average price was EUR 1.56. The year-end price of the V share was EUR 1.47. The number of Raisio V shares traded in 2008 totalled 28.4 million (2007: 51.3 million), which equals some 22% of the total volume. The value of share trading was EUR 44.2 million (EUR 100.0 million).
The highest price of the series K share was EUR 1.85 and the lowest EUR 1.38. The average price was EUR 1.66. The year-end price of the K share was EUR 1.64. The number of Raisio’s K shares traded in 2008 totalled 0.8 million (1.3 million), and the value of share trading was EUR 1.3 million (EUR 2.6 million).
The share capital had a market value of EUR 248.6 million at the end of 2008 (EUR 248.4 million), and EUR 234.8 million (235.8 million) excluding the shares held by the company.
OwNERSHIP STRUCTURE
At the end of 2008, Raisio plc had 37,269 registered share-holders (37,873). With a share of 58.0%, households made up the largest owner group (58.8%).
Raisio plc owned 9,158,500 free shares and 197,808 restricted shares on 31 December 2008. Other Group companies do not have holdings in Raisio plc. Shares in the company or its subsidiaries do not entitle the holder to participate in the Annual General Meeting.
At its highest, foreign ownership in Raisio amounted to 15.1%, at its lowest to 14.4% and at the end of the year to 14.8% (15.4%). Of the company’s shares, 0.5% remain outside the book-entry system.
No disclosures of ownership changes, required from share-holders under Chapter 2, section 9, of the Securities Market Act, were made in the review period.
DIVIDEND POLICY AND DIV IDEND
It is Raisio’s target to generate added value to all its share-holders by developing its business operations and improving business profitability, and by following a long-range dividend policy. The target is to annually distribute half of the per-share earnings generated by continuing operations, provided the dividend payment does not compromise the company’s abil-ity to meet its strategic objectives.
Raisio plc’s Annual General Meeting, held on 27 March 2008, decided on a dividend of EUR 0.04 per share. The dividend was paid on 8 April 2008. No dividend was paid on the shares held by the company. The Board of Directors will propose a per-share dividend of EUR 0.07 at the Annual General Meeting
HARES AND SHAREHOLDERS Raisio plc’s shares are listed on NASDAQ OMX Helsinki Ltd. Raisio’s market value at the end of 2008 was EUR 248.6 million. Overall trading totalled nearly EUR 45.5 million. The closing price of free shares on 30 December 2008 was EUR 1.47, and that of restricted shares was EUR 1.64. The Board of Directors will propose a divi-dend of EUR 0.07 at the Annual General Meeting in spring 2009.
SHARE CAPITAL AND SHARE CLASSES
The fully paid-up share capital of Raisio plc is EUR 27,776,072.91, which on 31 December 2008 was divided into 34,474,150 restricted shares (series K) and 130,674,880 free shares (se-ries V). No nominal value is quoted for the shares. Restricted shares accounted for 20.9% of the share capital and 84.1% of the votes, while the corresponding figures for free shares were 79.1% and 15.9% (31 December 2008). The company’s minimum share capital is EUR 25,000,000 and maximum share capital EUR 100,000,000. The share capital can be raised or lowered within these limits without amending the Articles of Association. There were no changes in the share capital during 2008. The company has not issued securities that entitle the holder to shares.
Raisio plc’s shares are listed on NASDAQ OMX Helsinki Ltd. (hereafter referred to as the stock exchange). The company’s free shares are quoted in the Mid Cap segment under the Consumer Staples sector, and its restricted shares on the Prelist. The trading code for free shares is RAIVV and the ISIN code FI 0009002943, and for restricted shares RAIKV and FI 0009800395, respectively. The company’s shares have been entered into the book-entry system.
Free and restricted shares have an equal entitlement to equity and profits. At Annual General Meetings, each restricted share entitles the holder to 20 votes and each free share to one vote. No shareholder is entitled to exercise more than 1/10 of the total number of votes represented at the Meeting.
The assignment of restricted shares requires the approval of the Board of Directors. Approval is required even if the party who the shares are assigned to already owns restricted shares in the company. Approval must be given if the share recipient is a natural person whose primary occupation is farming. If approval is not given, the Board of Directors must convert the assigned restricted share into a free share.
The Board may also convert restricted shares into free shares on request and likewise give advance information on whether the applicant will be granted permission to acquire restricted shares. In 2008, a total of 100 (one hundred) restricted shares were converted into free shares.
RAISIO’S FINANCIAL STATEMENTS 200844

in spring 2009. The record date is 31 March 2009, and the payable date 7 April 2009.
SHARE-BASED INCENTIVE SYSTEMS 2008–2010
Raisio plc’s Board of Directors decided in May 2008 to set up a three-year share-based incentive scheme as a part of the incentive and reward system offered to Raisio’s key person-nel. The goal is to integrate the targets of shareholders and key employees in order to increase the company’s market capitalisation, to enhance the key employees’ commitment to the company and to offer them a competitive reward system based on share ownership.
The scheme gives authorisation to distribute a maximum of 1,600,000 of Raisio plc’s free shares already in the company’s possession after previous share repurchases. Rewards are paid as a combination of shares and cash. Cash payments are to cover the taxes and fiscal fees arising from share-based rewards.
The financial year 2008 is the first earnings period in the scheme, which uses net sales growth (with a weight of 30%) and profit before one-off items and taxes (70%) as earnings criteria. The maximum number of shares to be distributed is 400,000 free shares. The amount earned in rewards will be determined on the basis of the achievement of targets after the financial statements have been prepared in the spring of 2009. Any rewards will be paid to those covered by the scheme in August 2009. Shares distributed as part of the scheme are subject to a disposal restriction and return obli-gation, which last until 1 September 2011 and will be applied if the employee’s employment or job contract end prior to the expiration of the disposal restriction. The scheme covers 15 people in the first earnings period.
In December 2008, the Board of Directors decided on a share-based incentive scheme for the second earnings pe-riod, which is the financial year 2009. The earnings criteria to be used are return on capital employed (with a weight of 1/3) and profit before one-off items and taxes (2/3). The maximum number of shares to be distributed is 600,000 free shares. The amount earned in rewards will be determined on the basis of the achievement of targets after the financial statements have been prepared in the spring of 2010. Any re-wards will be paid to those covered by the scheme in August 2010. Shares distributed as part of the scheme are subject to a disposal restriction and return obligation, which last un-til 31 December 2011 and will be applied if the employee’s employment or job contract end prior to the expiration of the disposal restriction. The scheme covers 55 people in the second earnings period.
COMPANY MANAGEMENT SHAREHOLDINGS
The members of the company’s Supervisory Board, the mem-bers of the Board of Directors and the CEO, as well as associa-tions and foundations under their control, owned 1,405,760 restricted shares and 4,673,401 free shares on 31 December 2008. This accounts for 3.7% of all shares and represents 4.00% of the maximum voting power.
The CEO is covered by the Group’s share-based incentive scheme, under which he may receive a maximum of 66,667 of Raisio plc’s free shares in August 2009 (first earnings period) and a maximum of 66,667 free shares in August 2010 (second earnings period). Should the CEO obtain these maxi-mum amounts of free shares, the shareholdings of the group defined above will rise to 3.8% of all shares and 4.01% of the maximum voting power.
SHAREHOLDER AGREEMENTS
Raisio’s Board of Directors is not aware of any valid agree-ments related to the ownership of the company’s shares and the use of voting power.
kANTAOSAkkEIdEN vAIhTOMääRäT
shareholders on 31 decemBer 2008
hOuSEhOLdS 58%
FOREIgN OwNERS 2) 15%
pRIvATE ENTERpRISES 3) 11%
NON-pROFIT ORgANIzATIONS 5%
FINANCIAL ANd INSuRANCE INSTITuTIONS 1) 5%
wAITINg LIST ANd jOINT ACCOuNT 4%
pubLIC CORpORATIONS 2%
1) ExCLudINg NOMINEE-REgISTEREd2) INCLudINg NOMINEE-REgISTEREd3) INCLudINg ThE ShARES hELd by ThE COMpANy
marKet value
400
350
300
250
200
150
100
50
0
234.
8287.1
EquITyEuR MILLION
2006 2007 2008
ExCLudINg ThE ShARES hELd by ThE COMpANy
235.
8
structure of share capital on 31 decemBer 2008
numBer of shares
% of total shares
% of total votes
free shares 130,674,780 79.1 15.9
restricted shares 34,474,250 20.9 84.1
total 165,149,030 100.0 100.0
RAISIO’S FINANCIAL STATEMENTS 2008 45

300
250
200
150
100
50
0
trading volume, restricted share
1,000 ShARES
2006 2007 2008
MILLION ShARES
30
25
20
15
10
5
0
trading volume, free share
2006 2007 2008
2006 2007 2008
share price development, restricted share
2.60
2.40
2.20
2.00
1.80
1.60
1.40
1.20
AvERAgE quOTATION
share price development, free share
OMx hELSINkI gIRAISIO’S FREE ShARE
2006 2007 2008
5.00
4.00
3.50
3.00
2.50
2.00
1.50
1.00
AMENDMENTS TO THE ARTICLES OF ASSOCIATION
As a rule, amendments to the Articles of Association require that the proposed amendment is supported by a minimum of two-thirds of the given votes and shares represented at the meeting. However, amendments to sections 6, 7, 8, 9 and 18 of the Articles of Association require a decision by a three-quarter majority of the votes given and the shares represented to be made at two successive shareholders’ meetings held with an interval of at least twenty days. In certain cases, the Companies Act requires a vote by types of shares and the shareholders’ consent.
AMENDMENT TO THE ARTICLES OF ASSOCIATION IN 2008
The Annual General Meeting approved the Board of Direc-tors’ proposal to amend the business definition (Section 3) in the Articles of Association by removing the reference to food diagnostics equipment. The amendment was entered in the Trade Register in April 2008.
CORPOR ATE GOVERNANCE SYSTEM
With the exception of representatives of personnel groups, the members of the company’s Supervisory Board, who number 15 as a minimum and 25 as a maximum, are elected by the shareholders’ meeting for a term that begins at the Annual General Meeting at which the election takes place and lasts until the end of the third shareholders’ meeting following the election. One-third of the members are replaced every year. The Supervisory Board also has three representatives elected
by personnel groups formed by Raisio’s employees in Finland. Their term is approximately three years.
The Board of Directors consists of a minimum of five and a maximum of eight members elected by the Annual General Meeting. Their term begins at the end of the Annual General Meeting at which the election takes place and lasts until the end of the following Annual General Meeting.
The CEO is appointed and discharged by the Board of Direc-tors. The CEO is appointed for an indefinite term.
The body that elects the members of the Supervisory Board and the Board of Directors may make a new appointment decision at any time, meaning that the duties of a member or all members may be terminated before the term comes to an end.
SHARE REPURCHASE AUTHORISATION FOR THE BOARD OF D IRECTORS
The Annual General Meeting held in spring 2008 author-ised the Board of Directors to decide on the repurchase of a maximum of 6,000,000 free shares and 1,500,000 restricted shares through public trading arranged by the stock exchange. The authorisation allows shares to be repurchased in order to develop the capital structure of the company, to finance or carry out acquisitions or other arrangements, to implement share-based incentive systems or to be otherwise further as-signed or cancelled. The authorisation expires, at the latest, on 27 September 2009.
The shares that may be repurchased under the authorisation amount to 4.5% of the share capital and to 4.4% of overall votes.
RAISIO’S FINANCIAL STATEMENTS 200846

shareholders
SERIES k, NO. SERIES v, NO. TOTAL, NO. % vOTES, NO. %
niemistö Kari 4,120,000 4,120,000 2.49 4,120,000 0.50
central union of agricultural producers and forest oWners 3,733,980 199,000 3,932,980 2.38 74,878,600 9.13
sKagen gloBal verdipapirfond 2,247,300 2,247,300 1.36 2,247,300 0.27
op-finland small firms fund 1,832,560 1,832,560 1.11 1,832,560 0.22
op-finland value fund 1,434,800 1,434,800 0.87 1,434,800 0.17
aKtia capital fund 1,223,853 1,223,853 0.74 1,223,853 0.15
arvo asset management ltd arvo finland value 1,150,000 1,150,000 0.70 1,150,000 0.14
ilmarinen mutual pension insurance company 1,016,966 1,016,966 0.62 1,016,966 0.12
etra invest oy aB 1,000,000 1,000,000 0.61 1,000,000 0.12
mutual insurance company pension-fennia 1,000,000 1,000,000 0.61 1,000,000 0.12
maa- Ja vesiteKniiKan tuKi r.y. 1,000,000 1,000,000 0.61 1,000,000 0.12
sKagen gloBal ii verdipapirfond 933,800 933,800 0.57 933,800 0.11
sKagen veKst verdipapierfond 916,743 916,743 0.56 916,743 0.11
relander harald Bertel 900,000 900,000 0.55 900,000 0.11
Brotherus ilKKa 42,540 784,500 827,040 0.50 1,635,300 0.20
varma mutual pension insurance company 820,000 820,000 0.50 820,000 0.10
central union of sWedish-speaKing agricultural producers in finland 659,500 113,000 772,500 0.47 13,303,000 1.62
nordea nordic small cap fund 683,959 683,959 0.41 683,959 0.08
langh hans 654,480 654,480 0.40 13,089,600 1.60
haavisto maiJa 393,120 264,270 657,390 0.40 8,126,670 0.99
haavisto heiKKi 542,300 96,090 638,390 0.39 10,942,090 1.33
KesKitien tuKisäätiö 100,000 500,000 600,000 0.36 2,500,000 0.30
haavisto erKKi 364,940 172,260 537,200 0.33 7,471,060 0.91
haavisto antti 382,140 140,740 522,880 0.32 7,783,540 0.95
myllymäKi erKKi 374 320 113,080 487,400 0.30 7,599,480 0.93
25 maJor shareholders on 31 decemBer 2008, according to shareholders register
In August, the Board of Directors decided to initiate repurchases of shares through public trading arranged by the stock exchange starting on 3 September 2008. Based on the authorisation, the company repurchased 1,000,000 free shares for some EUR 1.55 million and 20,005 restricted shares for some EUR 33,000 in the review period.
SHARE ISSUE AUTHORISATION FOR THE BOARD OF D IRECTORS
The Annual General Meeting in spring 2008 authorised the Board of Directors to decide on share issues by (1) disposing all of the company shares held by the company at the time of the decision and any repurchased shares – a maximum total of 16,500,000 shares, 2,269,500 of which can be restricted shares, and by (2) issuing a maximum of 16,500,000 new free shares against payment.
On 31 December 2008, the company shares available for dis-posal under the authorisation totalled 5.7% of the share capital and 1.6% of overall votes. The new free shares that can be is-sued under the authorisation total 10.0% of the share capital and 2.0% of overall votes.
The Board of Directors is entitled to decide to whom and in which order the company shares are disposed and new shares issued. The Board of Directors is entitled to deviate from shareholders’ pre-emptive rights in the disposal of shares and the issue of new shares if significant financial grounds thereto exist from the company’s perspective. The development of the company’s capital structure, the financing or implementation of acquisitions or other arrangements, as well as the implemen-tation of share-based incentive systems, may be considered significant financial grounds. The Board of Directors may also decide to dispose of company shares through public trading arranged by the stock exchange in order to obtain funds to finance investments and possible acquisitions.
As a minimum, the price paid for shares shall equal the fair value of the shares at the time of disposal, as determined in the public trading arranged by the stock exchange. For the pur-pose of implementing share-based incentive systems, shares may be assigned without payment. The shares may also be disposed of against compensation other than money, against acknowledgement or on other specific terms.
The disposal authorisation expires, at the latest, on 27 March 2013 and has not been used to date.
ShARES REgISTEREd uNdER FOREIgN OwNERShIp, INCLudINg NOMINEE REgISTRATIONS, TOTALLEd 24,380,051 ON 31 dECEMbER 2008 OR 14.8% OF ThE TOTAL ANd 18.7% OF FREE ShARES.
AT ThE ENd OF ThE yEAR, RAISIO pLC OwNEd 9,356,308 COMpANy ShARES, whICh REpRESENTS 5.7% OF ThE TOTAL.
RAISIO’S FINANCIAL STATEMENTS 2008 47

split of shareholdings on 31 decemBer 2008
shares
no. no. % no. % no. % no. %
1–1,000 22,343 64.1 10,844,541 8.3 3,765 58.0 1,346,362 3.9
1,001–5,000 9,757 28.0 23,833,233 18.2 1,747 26.9 4,161,084 12.1
5,001–10,000 1,698 4.9 12,776,221 9.8 509 7.8 3,628,429 10.5
10,001–25,000 729 2.1 11,560,576 8.9 326 5.0 5,032,289 14.6
25,001–50,000 169 0.5 6,005,825 4.6 101 1.6 3,301,262 9.6
50,001– 147 0.4 65,295,764 50.0 45 0.7 10,735,980 31.1
Waiting list 0 0.0 5,648,414 16.4
Joint account 189,320 0.1 620,330 1.8
special accounts 169,400 0.1 0 0.0
total 34,843 100.0 130,674,880 100.0 6,493 100.0 34,474,150 100.0
31 dECEMbER 2008 RAISIO pLC hAd A TOTAL OF 37,269 REgISTEREd ShAREhOLdERS.
restricted sharesfree shares
shareholders shares shareholders shares
RAISIO’S FINANCIAL STATEMENTS 200848

shareholders shares shareholders sharesnote 1.1.–31.12.2008 1.1.–31.12.2007
n et sales 2.7 13.3
Other income from business operations 0.0 0.7
Materials and services 1 –0.1 –0.1Personnel expenses 2 –2.2 –3.8Depreciation and write-downs 3 –0.1 –3.0Other expenses from business operations 4 –5.1 –12.0
operati ng resu lt –4.7 –4.9
Financial income and expenses 5 +13.1 +10.8
resu lt Before extraordi nary items 8.4 5.9
Extraordinary items 6 –6.6 –10.1
resu lt Before appropriations an d taxes 1.8 –4.2
Appropriations 7 0.0 +2.7Income taxes 8 –0.7 –0.2
resu lt for th e fi nancial period 1.1 –1.7
PARENT COMPANY INCOME STATEMENT
(eur million)
RAISIO’S FINANCIAL STATEMENTS 2008 49

PARENT COMPANY BALANCE SHEET
note 31.12.2008 31.12.2007
assets
non-cu rrent assets
Intangible assets 9 0.1 0.1Tangible assets 9 0.4 0.5Holdings in Group companies 10 103.9 85.0Other investments 10 139.1 199.0
243.5 284.6
cu rrent assets
Inventories 0.0 0.0Current receivables 11 34.6 58.6Securities under financial assets 64.5 34.7Cash in hand and at banks 6.7 1.3
105.8 94.6
total assets 349.3 379.2
liaBi liti es an d shareholders’ eQu ity
shareholders’ eQu ity 12
Share capital 27.8 27.8Premium fund 2.9 2.9Reserve fund 88.6 88.6Retained earnings 198.5 208.0Result for the year 1.1 –1.7
318.9 325.6
appropriations 13 0.0 0.0
liaBi liti es
Non-current liabilities 14 7.8 0.0Current liabilities 15 22.6 53.5
30.4 53.5
total l iaBi liti es an d shareholders’ eQu ity 349.3 379.2
(eur million)
RAISIO’S FINANCIAL STATEMENTS 200850

(eur million) 2008 2007
CASH FLOW FROM BUSINESS OPERATIONSOperating result –4.7 –4.9Operating result adjustments:
Planned depreciation 0.1 3.0Other adjustments 0.8 0.6
Cash flow before change in working capital –3.8 –1.3
Increase (–)/decrease (+) in current receivables +8.2 +0.1Increase (–)/decrease (+) in inventories 0.0 0.0Increase (+)/decrease (–) in current interest-free liabilities +2.5 –18.3Change in working capital 10.7 –18.2
Cash flow from business operations before financial items and taxes 6.9 –19.5
Interest paid and payments on financial operating expenses –2.6 –1.9Dividends received 0.2 0.2Interest and other financial income from operations 16.6 13.0
cash floW from Busi n ess operations 21.1 –8.3
CASH FLOW FROM INVESTMENTSInvestments in tangible and intangible assets 0.0 –1.8Income from surrender of tangible and intangible assets 0.0 1.9Investments in Group company shares 0.0 –0.1Loans granted –28.0 –47.0Repayment of loan receivables 67.0 29.2
cash floW from i nvestments 39.1 –17.7
Cash flow after investments 60.2 –25.9
CASH FLOW FROM FINANCIAL OPERATIONSIncrease (+)/decrease (–) in non-current loans +9.2 –11.0Increase (+)/decrease (–) in current liabilities –45.3 +24.3Increase (–)/decrease (+) in loan receivables +15.5 0.0Group contributions received and paid 3.5 –10.0Repurchase of company shares –1.6 –6.5Dividend paid and other distribution of profit –6.2 –4.8
cash floW from fi nancial operations –24.9 –7.9
Change in liquid funds 35.2 –33.8
Liquid funds at the beginning of the period 36.0 69.8Liquid funds at period-end 71.2 36.0
PARENT COMPANY CASH FLOw STATEMENT
RAISIO’S FINANCIAL STATEMENTS 2008 51

ARENT COMPANY ACCOUNTING PRINCIPLESThe parent company’s financial statements have been drawn up in compliance with the Finnish Accounting and Companies Acts. The accounts have been drawn up in euros.
INVENTORIES
Inventories has been entered on the balance sheet in pur-chase cost.
VALUATION OF NON-CURRENT ASSETS
Tangible and intangible assets have been recognised on the balance sheet under cost of acquisition less planned depreciation. Planned depreciation has been calculated on a straight-line basis from the original cost of acquisition and the useful life of the asset. The depreciation plan is the same as the previous year.
The depreciation periods are as follows:
buildings and structures 10–25 years <
machinery and equipment 4–10 years <
intangible rights 5–10 years <
other long-term expenses 5–20 years <
Planned depreciation was not carried out on land areas or revaluations.
PENSION ARR ANGEMENTS
Statutory and voluntary pension security for Raisio’s personnel is arranged through pension insurance companies. The com-pany’s Managing Director is entitled and obligated to retire upon turning 62.
NET SALES
Net sales consist of product sales as well as income from services that the parent company provides to Group companies.
OTHER INCOME FROM BUSINESS OPER ATIONS
Other income from business operations has been included profit from the sale of assets and other regular income not related to actual sales of goods or services, such as rents.
EXTR AORDINARY INCOME AND EXPENSES
Extraordinary income and expenses consist of received and paid Group subsidies.
INCOME TA XES
The taxes in the company’s income statement include the taxes paid in the financial period, calculated on the basis of the taxable profit, as well as taxes paid in previous finan-cial periods. The financial statements show accrued appro-priations in full on the balance sheet, and the tax liability included in them is not treated as debt. Deferred taxes have not been entered.
FORE IGN CURRENCY ITEMS
The company’s foreign currency receivables and liabilities have been converted into euros at the mean rates on the date of closing. Realised exchange rate differences, as well as gains and losses arising from the valuation of receivables and liabilities, have been entered in the income statement. Exchange rate gains and losses related to actual business operations are treated as adjustment items on sales and purchases, and those related to financing are entered under financing income and expenses.
DERIVATIVE CONTR ACTS
In line with its risk management policy, Raisio uses deriva-tives to hedge against foreign exchange and interest rate risks. Currency derivatives are used to hedge foreign currency receivables and liabilities and exchange rate differences arising from them are recorded in the income statement.
The interest rate risk of the portfolio consisting of the Group’s interest-bearing receivables and liabilities is reduced using interest rate swaps. The accrued interest from swaps is entered under financial income or expenses to adjust interest expenses or income from the receivables and liabilities portfolio. The market value of the interest rate swaps has not been recorded.
COMPANY SHARES
Share repurchase and related expenses are recognised in the company’s financial statements as a decrease in retained earnings, while disposals are recognised as an increase in retained earnings.
INCENTIVE SCHEME FOR MANAGEMENT
The expenses related to the management’s long-term, share-based incentive scheme are recognised as an earnings period expense in the income statement and as liabilities in the balance sheet.
CASH FLOw STATEMENT
Cash flows for the financial period have been categorised into cash flows from business operations, investments and financ-ing. Cash flow items are primarily based on payments.
RAISIO’S FINANCIAL STATEMENTS 200852

(eur million) 2008 2007
1. materials an d services
Materials, supplies and goodsPurchases in the period 0.1 0.1Change in inventories 0.0 0.0
External services 0.0 0.0Total 0.1 0.1
2. person n el expenses
Wages and fees 1.6 2.9Pension expenses 0.2 0.6Other personnel expenses 0.4 0.2Total 2.2 3.8
Wages an d fees pai d to management
Managing Director and members of the Board of Directors 0.8 0.7
average n umBer of parent company person n el
Workers 0 1Office workers 2 45
2 46
pension liaBi lity
Pension liability for members of the Board of Directors and the Managing Director
The parent company’s Managing Director is entitled and obligated to retire upon turning 62.
3. depreciation an d Write-doWns
Planned depreciation 0.1 3.0
4. oth er expenses from Busi n ess operations
Auditors’ remuneration:
PricewaterhouseCoopers OyAudit 0.0 0.1Tax guidance 0.0 0.0Other services 0.2 0.1
0.2 0.2
NOTES TO THE PARENT COMPANY INCOME STATEMENT
RAISIO’S FINANCIAL STATEMENTS 2008 53

(eur million) 2008 2007
5. f i nancial i ncome an d expenses
Dividend receivedFrom participating interest companies 0.0 0.0From others 0.2 0.2Total 0.2 0.2
Total income from long-term investment From Group companies 12.3 8.7
Total income from long-term investment 12.5 8.9
Other interest and financial incomeFrom Group companies 2.1 1.8From others 1.6 1.8Total 3.7 3.6
Total interest received from long-term investment and other interest and financial income 16.0 12.3
Exchange rate differencesTo Group companies –1.4 0.0To others 1.3 0.2Total –0.1 0.2
Interest paid and other financial expensesTo Group companies –1.7 –1.3To others –1.4 –0.5Total –3.0 –1.8
Total financial income and expenses 13.1 10.8
6. extraordi nary i ncome an d expenses
Extraordinary incomeGroup subsidies received 0.0 10.4Total 0.0 10.4
Extraordinary expenses Group subsidies paid –6.6 –20.5Total –6.6 –20.5
Total extraordinary income and expenses –6.6 –10.1
7. appropriations
Difference between planned depreciation and depreciation made in taxation 0.0 2.7
8. i ncome taxes
Income tax on extraordinary items 1.7 2.6Income tax on ordinary operations –2.4 –2.8Taxes on previous financial years 0.0 0.0Total –0.7 –0.2
RAISIO’S FINANCIAL STATEMENTS 200854

NOTES TO THE PARENT COMPANY BALANCE SHEET
9. parent company i ntangi Ble assets 2008
9. parent company tangi Ble assets 2008
(eur million)intangible
rights
other long-term
expenditureadvances
paidintangible
assets total
Acquisition cost 1.1. 0.2 0.4 0.0 0.6Increase 1.1.–31.12. 0.0 0.0Decrease 1.1.–31.12. 0.0Reclassifications 0.0
Acquisition cost 31.12. 0.2 0.4 0.0 0.6
Accumulated depreciation and write-downs 1.1. 0.2 0.3 0.5Accumulated depreciation of decrease and transfers 0.0 0.0Depreciation for the year 0.0 0.1 0.1
Accumulated depreciation 31.12. 0.2 0.3 0.0 0.6
Book value 31.12.2008 0.0 0.0 0.0 0.1
Book value 31.12.2007 0.0 0.1 0.0 0.1
(eur million) land and
water areas
buildings and
construc-tions
machi-nery and
equip-ment
other tangible
assets
advances paid and
incomplete acquisitions
tangible assetstotal
Acquisition cost 1.1. 0.0 0.7 0.2 0.3 0.0 1.2Increase 1.1.–31.12. 0.0Decrease 1.1.–31.12. 0.0 0.0 0.0Reclassifications 0.0
Acquisition cost 31.12. 0.0 0.7 0.2 0.3 0.0 1.2
Accumulated depreciation and write-downs 1.1. 0.5 0.2 0.7Accumulated depreciation of decrease and transfers 0.0 0.0Depreciation for the year 0.0 0.0 0.0
Accumulated depreciation 31.12. 0.0 0.6 0.2 0.0 0.0 0.8
Book value 31.12.2008 0.0 0.2 0.0 0.3 0.0 0.4
Book value 31.12.2007 0.0 0.2 0.0 0.3 0.0 0.5
Book value of the production machinery and equipment31.12.2008 0.031.12.2007 0.0
RAISIO’S FINANCIAL STATEMENTS 2008 55

Acquisition cost 1.1. 85.0 0.0 0.0 199.0 284.0Increase 1.1.–31.12. 19.0 28.0 47.0Decrease 1.1.–31.12. 87.9 87.9
Acquisition cost 31.12. 103.9 0.0 0.0 139.0 243.0
Book value 31.12.2008 103.9 0.0 0.0 139.0 243.0
Book value 31.12.2007 85.0 0.0 0.0 199.0 284.0
grou p compan i es
Raisio Malt Ltd, Raisio 100.00 100.00Raision Konsernipalvelut Oy, Raisio 100.00 100.00Raisionkaari Industrial Park Ltd., Raisio 100.00 50.00Raisio Nutrition Ltd, Raisio 100.00 100.00Raisio Feed Ltd, Raisio 100.00 100.00
associated compan i es
Vihervakka Oy, Pöytyä 38.50 38.50
shares an d holdi ngs 2008
10. parent company i nvestment 2008
(eur million)
groupholding, %
parent company holding, %
participating interest com-
pany shares
groupcompany
sharesother
shares
receivables, group
companies
total invest-
ment
RAISIO’S FINANCIAL STATEMENTS 200856

(eur million) 2008 2007
11. receivaBles
Current receivables
Accounts receivables 0.0 0.3
Receivables from Group companiesAccounts receivables 0.1 0.8Loan receivables 23.5 36.5Other receivables 0.1 10.5Prepaid expenses and accrued income 2.0 1.9
25.7 49.8
Receivables from participating interest companiesAccounts receivables 0.0 0.0
Other receivables 6.7 7.7Prepaid expenses and accrued income 2.2 0.9
Total current receivables 34.6 58.6
Prepaid expenses and accrued income include items related to the timing of operational income and expenses, financial items and taxes.
12. shareholders’ eQu ity
Restricted shareholders’ equity
Share capital 1.1. 27.8 27.8Share capital 31.12. 27.8 27.8
Premium fund 1.1. 2.9 2.9Premium fund 31.12. 2.9 2.9
Reserve fund 1.1. 88.6 88.6Reserve fund 31.12. 88.6 88.6
Total restricted shareholders’ equity 119.3 119.3
Retained earnings 1.1. 206.4 219.4Dividend distributed –6.3 –4.8Disposal of company shares 0.1 0.0Repurchase of company shares –1.6 –6.5Retained earnings 31.12. 198.5 208.0
Result for the year 1.1 –1.7
Total unrestricted shareholders’ equity 199.6 206.4
Total shareholders’ equity 318.9 325.6
Distributable equity 199.6
RAISIO’S FINANCIAL STATEMENTS 2008 57

Company share capital dividend by share series as follows:
The probable assignment price of company shares held by Raisio on the date of the financial statements was EUR 13.8 million (EUR 12.6 million in 2007).
Series K (20 votes/share) 34,474,150 5,798 34,474,250 5,798Series V (1 vote/share) 130,674,880 21,978 130,674,780 21,978Total 165,149,030 27,776 165,149,030 27,776
eur 1,000 shares shares eur 1,000 2008 2007
Series K (20 votes/share) 197,808 382 158,300 318Series V (1 vote/share) 9,158,500 19,027 8,230,500 17,576Total 9,356,308 19,409 8,388,800 17,894
acquisi-tion cost eur 1,000
acquisi-tion cost eur 1,000shares shares
Company shares held by Raisio:
2008 2007
(eur million) 2008 2007
13. appropriations
Appropriations consist of the accumulated depreciation difference.
liaBi liti es
14. non-cu rrent liaBi liti es
Loans from credit institutions 7.8 0.0Total non-current liabilities 7.8 0.0
15. cu rrent liaBi liti es
Loans from credit institutions 2.2 0.8Accounts payable 0.2 0.2
Liabilities to Group companiesAccounts payable 0.0 0.3Other liabilities 17.5 50.5Accrued liabilities and deferred income 0.2 0.1
17.7 50.9
Other liabilities 0.6 0.7Accrued liabilities and deferred income 2.0 0.9
Total current liabilities 22.6 53.5
Accrued liabilities and deferred income comprises items related to the periodization of operational expenses, financial items and taxes.
Interest-free debtsNon-current 9.5 23.2
RAISIO’S FINANCIAL STATEMENTS 200858

(eur million) 2008 2007
16. conti ngent an d oth er liaBi liti es an d pledged assets
CONTINGENT OFF-BALANCE SHEET LIABILITIES:
Leasing liabilities
Amounts outstanding on leasing contractsFalling due in 2009 0.0 0.0Falling due after 2009 0.0 0.0Total 0.0 0.0
Leasing contracts do not include substantial liabilities related to termination and redemption terms.
Contingent liabilities for Group companies Guarantees 27.5 17.9
Contingent liabilities for others Guarantees 0.0 0.1
derivative contracts:
The company uses derivative contract for hedging. The values of underlying instruments for derivative contracts, stated below, indicate the scope of hedging measures. The fair values of derivative contracts show the result had the derivative position been closed at market price on the closing day.
Currency forward contracts:Fair value 1.6 0.2Value of underlying instrument 28.9 18.6
The value of the underlying instrument in currency forward contracts is the sum of open forward contracts, converted into euros at the exchange rate of the closing day.
Interest rate swaps:Fair value –0.1 0.0Value of underlying instrument 10.0 0.0
The value of interest rate swaps is the nominal amount of open contracts.
OTHER NOTES TO THE PARENT COMPANY ACCOUNTS
RAISIO’S FINANCIAL STATEMENTS 2008 59

AUDITOR’S REPORT
To the Annual General Meeting of Raisio plcWe have audited the accounting records, the financial state-ments, the report of the Board of Directors and the adminis-tration of Raisio plc for the year ended on 31 December, 2008. The financial statements comprise the consolidated balance sheet, income statement, cash flow statement, statement of changes in equity and notes to the consolidated financial statements, as well as the parent company’s balance sheet, income statement, cash flow statement and notes to the financial statements.
Responsibility of the Board of Directors and the Managing DirectorThe Board of Directors and the Managing Director are respon-sible for the preparation of the financial statements and the report of the Board of Directors and for the fair presentation of the consolidated financial statements in accordance with International Financial Reporting Standards (IFRS) as adopted by the EU, as well as for the fair presentation of the parent company’s financial statements and the report of the Board of Directors in accordance with laws and regulations governing the preparation of the financial statements and the report of the Board of Directors in Finland. The Board of Directors is responsible for the appropriate arrangement of the control of the company’s accounts and finances, and the Managing Director shall see to it that the accounts of the company are in compliance with the law and that its financial affairs have been arranged in a reliable manner.
Auditor’s Responsibility
Our responsibility is to perform an audit in accordance with good auditing practice in Finland, and to express an opinion on the parent company’s financial statements, on the consolidated financial statements and on the report of the Board of Direc-tors based on our audit. Good auditing practice requires that
we comply with ethical requirements and plan and perform the audit to obtain reasonable assurance whether the finan-cial statements and the report of the Board of Directors are free from material misstatement and whether the members of the Supervisory Board and the Board of Directors of the parent company and the Managing Director have complied with the Limited Liability Companies Act.
An audit involves performing procedures to obtain audit evidence about the amounts and disclosures in the financial statements and the report of the Board of Directors. The pro-cedures selected depend on the auditor’s judgment, including the assessment of the risks of material misstatement of the financial statements, whether due to fraud or error. In making those risk assessments, the auditor considers internal control relevant to the entity’s preparation and fair presentation of the financial statements in order to design audit procedures that are appropriate in the circumstances. An audit also includes evaluating the appropriateness of accounting policies used and the reasonableness of accounting estimates made by management, as well as evaluating the overall presenta-tion of the financial statements and the report of the Board of Directors.
The audit was performed in accordance with good auditing practice in Finland. We believe that the audit evidence we have obtained is sufficient and appropriate to provide a basis for our audit opinion.
Opinion on the Consolidated Financial StatementsIn our opinion, the consolidated financial statements give a true and fair view of the financial position, financial performance, and cash flows of the group in accordance with International Financial Reporting Standards (IFRS) as adopted by the EU.
Opinion on the Company’s Financial Statements and the Report of the Board of DirectorsIn our opinion, the financial statements and the report of the Board of Directors give a true and fair view of both the con-solidated and the parent company’s financial performance and financial position in accordance with the laws and regulations governing the preparation of the financial statements and the report of the Board of Directors in Finland. The information in the report of the Board of Directors is consistent with the information in the financial statements.
Raisio, 12 February 2009
Johan Kronberg Mika Kaarisalo
Authorised Public Authorised Public Accountant Accountant
STATEMENT OF THE SUPERVISORY BOARD
At its meeting today, the Supervisory Board studied the financial statement, the consolidated financial statement and auditors’ report for the financial year 1 January – 31 December 2008.
The Supervisory Board gives its assent to the approval of the financial statements and the consolidated financial state-ments and concurs with the Board of Directors’ proposal for the allocation of profits.
Raisio, 24 February 2009
For the Supervisory Board
Juha Saura, Chairman
BOARD’S PROPOSAL FOR THE D ISPOSAL OF PROFIT
Shareholders’ equity according to the balance sheet at 31 December 2008 is EUR 199,648,743.48. The Board of Directors proposes that a dividend of EUR 0.07 per share be paid from the parent company’s earnings
totalling EUR 11,560,432.10
carried over on the retained earnings account EUR 188,088,311.38
Total EUR 199,648,743.48
However, dividend will not be paid on the shares which are held by the company at the record date 31 March 2009.
There has not been any essential changes in the Group’s financial condition since the end of the financial period. The Group’s liquidity is good and the payment of the proposed dividend does not, in our opinion, endanger the company’s liquidity.
Raisio, 12 February 2009
Simo PalokangasErkki HaavistoMichael Ramm-Schmidt
Anssi AapolaSatu LähteenmäkiMatti Rihko, CEO
RAISIO’S FINANCIAL STATEMENTS 200860

Raisio plc • Raisionkaari 55 • P.O. Box 101 • FI-21201 Raisio, FinlandTel. +358 2 443 2111 • Fax +358 2 443 2315
Business ID 0664032-4 • Domicile Raisio, Finlandwww.raisio.com

www.raisio.com