Metso Corporation Financial Statements 2008 - Cision
119
Metso Corporation Financial Statements 2008 Business ID 1538032-5 Domicile Helsinki
-
Upload
khangminh22 -
Category
Documents
-
view
1 -
download
0
Transcript of Metso Corporation Financial Statements 2008 - Cision

Metso CorporationFinancial Statements
2008
Business ID 1538032-5Domicile Helsinki

TABLE OF CONTENTS
Consolidated Financial Statements
Board of Directors Report .................................................................. 2
Shares and Shareholders ................................................................ 18
Consolidated Statements of Income................................................. 23
Consolidated Statement of Recognized Income and Expense .......... 23
Consolidated Balance Sheets .......................................................... 24
Consolidated Statements of Cash Flows .......................................... 26
Consolidated Statements of Changes in Shareholders' Equity ......... 28
Notes to Consolidated Financial Statements .................................... 29
Financial Indicators ........................................................................ 101
Share Related Indicators ............................................................... 103
Formulas for Calculation of Indicators ............................................ 104
Exchange Rates Used ................................................................... 105
Parent Company Financial Statements
Parent Company Statement of Income .......................................... 106
Parent Company Balance Sheet .................................................... 107
Parent Company Statement of Cash Flows .................................... 108
Notes to Parent Company Financial Statements ............................ 109
List of Account Books Used in the Parent Company ............................... 118

BOARD OF DIRECTORS’ REPORT
Board of Directors’ Report
Operating environment and demand for products in 2008
During the year major changes took place in the market situation of Metso’s products and services.The demand was good in the early year and weakened considerably from the end of Septemberonwards.
Demand for Mining and Construction Technology products was excellent until September, whencustomers in both mining and construction industries began scaling back their investments. Thedrop in base metal prices that started in the summer led to cuts in mine production and even toshutdowns of mines. In the construction industry the slowdown of global economic growth and pooravailability of nancing reduced new investments. As a result, demand for mining and constructionproducts and services deteriorated quickly and some customers cancelled orders or postponedproject delivery schedules. On the annual level, demand grew in the services business, particularlyin the Mining business line. Geographically, the demand for Metso’s Mining and ConstructionTechnology’s products increased substantially in Asia-Paci c but decreased in the United Statesand in Northern Europe.
The demand for Energy and Environmental Technology’s products and services in 2008 wassatisfactory. In particular, the demand for services increased substantially during the year. Demandfor power plants utilizing renewable energy sources was satisfactory. The demand for metalsrecycling equipment decreased, as the prices and demand for scrap metal declined. In geo-graphical terms, the demand for Energy and Environmental Technology’s products remainedsatisfactory, apart from Western Europe where the demand declined notably.
The demand for Paper and Fiber Technology products and services was satisfactory from thebeginning of the year until September, when demand started to decline and the downward trendintensi ed towards the year’s end. The demand for paper, board and ber diminished globally, andthere was overcapacity on the markets. Decision-making schedules for new investments wereextended and several projects having reached execution phase were cancelled or postponed. Thedemand for tissue lines remained fairly even throughout the year. The demand for services sloweddown towards the end of the year as a result of shutdowns of a number of customer mills and thecost savings programs carried out by customers.
Orders received and order backlog
Orders received by Metso in 2008 totaled EUR 6,384 million, down 8 percent on the comparisonperiod. Calculated at comparable exchange rates, the value of orders received decreased by 5percent. Orders received were close to the previous year’s level in Mining and ConstructionTechnology, and at a lower level in Energy and Environmental Technology and Paper and FiberTechnology due to the weak fourth quarter.
The three countries generating the largest total value of orders received were the United States,Brazil and China. When combined, these countries accounted for 33 percent of all orders received.Order intake increased in South America and was on a par with the comparison period in NorthAmerica and Eastern Europe. The Western European market experienced the most abruptslowdown during the year. Emerging markets made up 48 percent (2007: 43%) of the ordersreceived. At the end of December, Metso’s order backlog was EUR 4,088 million, 6 percent lowerthan at the end of 2007. Some customers have initiated discussions with Metso about eitherextending delivery times or putting projects on hold. Timing of slightly over 20 percent of the orderbacklog can be considered uncertain. These uncertain orders include the large pulp mill projects forZhanjiang Chenming in China and Aracruz in Brazil.
2

BOARD OF DIRECTORS’ REPORT
Orders received by reporting segment:
EUR million % EUR million % EUR million %Mining and Construction Technology 2,399 42 2,776 39 2,709 42Energy and Environmental Technology 980 17 1,884 27 1,658 26Paper and Fiber Technology 2,276 39 2,293 33 2,021 31Valmet Automotive 109 2 85 1 65 1Intra-Metso and other orders received -59 -73 -69Total 5,705 100 6,965 100 6,384 100
2006 2007 2008
Orders received by market area:
EUR million % EUR million % EUR million %Europe 1,993 35 3,135 44 2,375 38North America 1,099 19 1,033 15 1,070 17South and Central America 757 13 818 12 1,056 16Asia-Pacific 1,503 27 1,514 22 1,476 23Rest of the world 353 6 465 7 407 6Total 5,705 100 6,965 100 6,384 100
2006 2007 2008
Net sales
Metso’s net sales in 2008 were at the previous year’s level, totaling EUR 6,400 million. At com-parable exchange rates, net sales growth would have been approximately 6 percent. At compa-rable exchange rates, the net sales of Mining and Construction Technology and Energy andEnvironmental Technology grew by 16 and 18 percent respectively, while Paper and Fiber Tech-nology’s net sales decreased by 12 percent. The net sales of the services business grew by 9percent (about 13 percent at comparable exchange rates), accounting for 35 percent of Metso’s netsales (33% in 2007). The growth of the services business was strongest in Energy and Environ-mental Technology, where the growth was 20 percent at comparable exchange rates.
Measured by net sales, the three largest countries in 2008 were the United States, China andFinland, which together accounted for about 29 percent of total net sales.
Net sales by reporting segment:
EUR million % EUR million % EUR million %Mining and Construction Technology 1,945 39 2,330 37 2,586 40Energy and Environmental Technology 881 17 1,543 25 1,775 27Paper and Fiber Technology 2,092 42 2,364 37 2,044 32Valmet Automotive 109 2 85 1 65 1Intra Metso and other net sales -72 -72 -70Total 4,955 100 6,250 100 6,400 100
2006 2007 2008
Net sales by market area:
EUR million % EUR million % EUR million %Europe 2,002 41 2,551 40 2,680 41North America 1,012 20 1,049 17 1,015 16South and Central America 685 14 859 14 770 12Asia-Pacific 991 20 1,488 24 1,516 24Rest of the world 265 5 303 5 419 7Total 4,955 100 6,250 100 6,400 100
2006 2005 2008
3

BOARD OF DIRECTORS’ REPORT
Financial result
Metso’s earnings before interest, tax and amortization (EBITA) for 2008 improved by 7 percent andwere EUR 680.9 million, or 10.6 percent of net sales (EUR 635.4 million and 10.2% in 2007). Theincrease of EBITA measured in euros was mainly attributable to Mining and Construction Techno-logy. Improvement in the EBITA margin was primarily due to Paper and Fiber Technology.
Metso’s operating pro t for 2008 was EUR 637.2 million, or 10.0 percent of net sales (EUR 579.8million and 9.3% in 2007).
Metso’s net nancial expenses for 2008 were EUR 89 million (EUR 33 million in 2007). Interest-bearing liabilities have increased substantially through the signi cant growth in net working capitalover the year, the high level of investments and the pay-out of an extra dividend. The increaseddebt level, the relatively large share of oating interest rate debt and the general rise in interestrates have resulted in an increase in interest expenses of almost EUR 25 million from the compari-son period. Another reason for the increase in net nancial expenses was foreign exchange lossesof EUR 24 million (in 2007, EUR 7 million gains). These gains and losses derive mainly from USD-denominated export credit nancing of a Brazilian subsidiary. On the other hand, related gains andlosses arising from customer deliveries are, once recognized, reported in operating pro t.
Metso’s pro t before taxes was EUR 548 million (EUR 547 million in 2007). Metso’s tax rate for2008 was 29 percent, and it is estimated to be approximately 30 percent in 2009. The pro t attrib-utable to shareholders was EUR 389 million (EUR 381 million) in 2008, corresponding to earningsper share (EPS) of EUR 2.75 (EUR 2.69 per share).
Metso’s return on capital employed (ROCE) before taxes was 23.2 percent (26.1%) and return onequity (ROE) was 26.0 percent (25.4%). Financial indicators for the years 2004–2008 are presen-ted on pages 101– 102.
Cash flow and financing
Metso’s net cash generated by operating activities was EUR 137 million in 2008 (EUR 294 millionin 2007). Net cash generated by operating activities was burdened by the net working capital beingtied up in all segments. Strong organic growth during the past years has made supply chain ma-nagement more challenging, resulting in working capital being tied up in inventories. Net workingcapital increased by EUR 437 million during the year. The increase was highest in Mining andConstruction Technology but also other segments reported clear increases. Over half of the in-crease came from the inventories but also receivables increased by almost EUR 100 million as aresult of high level of net sales in December, and payables decreased by almost EUR 100 milliondue to decrease in procurement towards the end of the year. During the last quarter, net workingcapital increased by EUR 140 million, the main reasons being increase in receivables anddecrease in payables. Inventories decreased clearly during the last quarter in spite of negativeimpact of order cancellations and delivery schedule extensions. Also advances received decreasedtowards the end of the year as a result of low level of new orders.
Metso’s free cash ow in 2008 was EUR 29 million (EUR 198 million). Net interest-bearing liabilitiestotaled EUR 1,099 million at the end of the year (EUR 540 million on December 31, 2007).
The total amount of short-term debt maturing within the next 12 months decreased by EUR 79million during the nal quarter and was EUR 346 million at the end of the year. EUR 141 million ofshort-term debt consists of commercial papers issued in the Finnish markets. EUR 101 million arecurrent portions of long-term debt and the remainder is local working capital nancing of certainsubsidiaries, primarily in Brazil. About EUR 160 million of existing long-term debt will mature in2010.
The total amount of net funding acquired in 2008 was EUR 621 million, of which almost EUR 500million was new long-term debt. Metso’s liquidity position is satisfactory. The syndicated EUR 500million revolving loan facility is available until late 2011, and it is currently undrawn.
4

BOARD OF DIRECTORS’ REPORT
Gearing was 75.7 percent (33.4%) and the equity-to-assets ratio was 30.9 percent (37.7%). InApril, following the Annual General Meeting, Metso paid EUR 425 million in dividends for 2007,which together with the growth in net working capital and high level of investments increasedgearing.
Capital expenditure
Metso’s gross capital expenditure for 2008 grew by 60 percent on the previous year and was EUR255 million (EUR 159 million in 2007). Capital expenditure on xed assets includes technology andcapacity acquisitions, the total value of which was approximately EUR 64 million. These were: theacquisition of Lachine’s heavy fabrication plant in Canada, the purchase of a Swedish research anddevelopment company specializing in biofuels, LignoBoost AB and the acquisition of the papermachinery technology of Mitsubishi Heavy Industries in Japan. Other acquisitions of businessesare not included in the gross capital expenditure mentioned above.
In May, Metso acquired from the Swedish STFI-Packforsk AB the shares of LignoBoost AB, aresearch company. The transaction included all the intellectual property rights as well as theLignoBoost brand and the related know-how. The acquired company became part of Metso’sPower business line. The acquisition opens an interesting biofuel business opportunity withinpulping processes.
In May, Metso closed the deal with Mitsubishi Heavy Industries (MHI) over the purchase of MHI’spaper machinery technology, making Metso globally the sole owner of Beloit’s paper machineryintellectual property. The effect of MHI on annual services sales is estimated to be about EUR 10million.
In August, Metso completed the acquisition of GE Energy’s Lachine main plant, a heavy fabricationand machining facility in Canada. The plant was integrated into Metso’s Mining business line andapproximately 170 employees were transferred to Metso. The acquisition added signi cantly toMetso’s mining equipment supply capacity.
Major capital expenditure on xed assets in 2008 was targeted to strengthen Metso’s presence inemerging markets, to improve the efficiency of the production chain and to expand the servicenetwork. In China, a new pulp and paper industry service center in Guangzhou started itsoperations, and Metso decided to establish a third service center in Zibo, located in the province ofShandong. In Tianjin, a crushing unit production capacity was expanded and new premises forAutomation business line in Shanghai are under construction. In India, an assembly line forcrushers and vibrating equipment in Bawal and a steel casting expansion in Ahmedabad werenalized, and construction of Metso Industrial Park in Rajasthan is underway. In the United States,
a boiler service center was opened in Lancaster, South Carolina, and the extension of anotherboiler service center was completed in Fairmont, West Virginia. In Finland, Metso is rebuilding apilot machine at the Paper Technology Center in Jyväskylä. Investment projects in enterpriseresource planning systems were underway in Mining and Construction Technology and inAutomation business line.
Metso’s capital expenditure in 2009, excluding corporate acquisitions, is estimated at about EUR150 million. New investment commitments will be cut considerably due to the changes in the globaleconomy.
Acquisitions and divestments
In May, Metso acquired Kemotron A/S, a Danish manufacturer of measurement systems. Thecompany had a workforce of 13. The acquired company was integrated into Metso’s Automationbusiness line.
In June, Metso completed the acquisition of MAPAG Valves GmbH, a company manufacturingprimarily butter y valves, from the Linde Group, a German company. With the acquisition, Metso
5

BOARD OF DIRECTORS’ REPORT
complements the product offering for the energy and hydrocarbon industries. The debt-freeacquisition price was EUR 36 million, and the acquired company was integrated into Metso’sAutomation business line. The company employs about 100 people. The company’s annual netsales amount to approximately EUR 36 million.
In September, Metso increased its ownership in the associated company Valmet-Xi’an PaperMachinery Co. Ltd in China from 48.3 percent to 75 percent. The value of the share transactionwas approximately EUR 5 million. The company has been consolidated into Metso’s balance sheetas of September, and its annual net sales are approximately EUR 30 million, of which sales toMetso have accounted for more than half. At the end of the year, Valmet-Xi’an had about 1,100employees.
In September, Metso announced the acquisition of a paper quality control business from FinnishFastpap Oy Ab. The business operations based in Ylöjärvi, Finland, including a staff of 11 wereintegrated into Metso’s Automation business line as of October 1, 2008.
In September, Metso acquired PSP Slévárna a.s., a producer of nished machined manganesewear parts located in Prerov, the Czech Republic. The acquisition price was approximately EUR 6million. The company was integrated into Metso’s Construction business line on October 1, 2008.The acquired company has a personnel of 385 and annual net sales of about EUR 20 million.
In October, Metso acquired the Australian company G & F Belt-line Services Pty Ltd, a provider ofconveyor belt installations and maintenance services to the mining industry. The value of the dealwas approximately EUR 6 million. The company was integrated into Metso’s Mining business lineon October 15, 2008. Approximately 90 employees were transferred to Metso. Beltline’s annual netsales are approximately EUR 11 million.
In January, Metso concluded the divestment of its Panelboard business. The panelboard pressoperations in Germany were divested to G. Siempelkamp GmbH & Co. KG in September 2007,and an agreement was concluded on the divestment of the panelboard operations in Nastola,Finland and Sundsvall, Sweden to the German company Dieffenbacher GmbH + Co. KG inJanuary 2008.
In May, Metso sold its spreader roll manufacturing business (Finbow) and the related assets to agroup of Finnish investors. The business is based in Finland and employs 20 people. The divestedbusiness was part of Metso’s Paper business line.
In September, Metso divested the shares in Sweden-based Metso Foundries Karlstad AB to agroup of nancial investors represented by Primaca Group Oy. Metso will continue as a minorityowner with a 16.7 percent holding in Heavycast Oy, a new company to which the Primaca Grouptransferred the acquired shares. The value of the transaction was approximately EUR 15 million,and Metso recognized a small tax-free capital gain from the sale. The divested business was partof Metso’s Tissue business line.
Research and development
The focus areas of Metso’s research and development are environmental technology, technologyrelated to the services business and the development of smart applications. Metso’s research anddevelopment expenses in 2008 totaled EUR 134 million, representing 2.1 percent of net sales(EUR 117 million and 1.9% in 2007). In addition to this, expenses for intellectual property rightsamounted to EUR 14 million in 2008. R&D employed 905 people (923) in 2008. Metso’s personnelmade about 900 invention disclosures (850), which led to over 230 priority patent applications(220). At the end of 2008, approximately 3,000 Metso inventions were protected by patents (2,800).
Metso launched about 120 new products in 2008. New products introduced to the markets includedfor example a new otation cell for a de-inking process, a rebuild concept for gap formers, wheel-mounted crushing plant and the paper quality control system PaperIQ Select.
6

BOARD OF DIRECTORS’ REPORT
In December, Metso and the European Investment Bank (EIB) signed a EUR 160 million researchand development loan agreement. This funding will be used to nance part of Metso’s developmentand innovation activities relating to environmental products and services as well as other strategicR&D programs over the years 2008–2012. The overall loan period is seven years with semiannualinstallments starting in 2011.
Environment and environmental technology
The environmental impact of Metso’s own production is minor and relates mainly to the con-sumption of raw materials and energy, emissions to air, water consumption and waste. Metsoseeks to reduce environmental hazards through continuous development and by decreasing theuse of energy, materials and hazardous substances.
Metso supplies its customers with complete product and service concepts, and environmentalefficiency is integral to the company’s offering. Many of Metso’s technology solutions have beendeveloped in close cooperation with customers. Metso’s environmental solutions are relatedespecially to renewable energy sources, energy efficiency of our customers’ production processes,waste management, recycling, efficient utilization of raw materials and water, reducing dust, noise,carbon dioxide and particle emissions, and process optimization. Metso also provides training,maintenance and service relating to the products. Metso takes care of the entire life cycles ofproduction processes and promotes the right and environmentally sustainable way to use thesolutions it provides.
Over one half of Metso’s net sales can be classified as environmental business, using the OECDde nition.
Risks and business uncertainties
Metso’s operations are affected by various strategic, nancial, operational and hazard risks. Metsotakes measures to manage and limit the potential adverse effects of these risks. If such risksmaterialized, they could have material adverse effects on Metso’s business, nancial situation, andoperating result or on the value of shares and other securities.
Metso’s risk assessments take into consideration the probability and effects of the risks on netsales and nancial results. The management estimates that the overall risk level of the company iscurrently manageable in proportion to the scope of Metso’s operations and the practical measuresavailable to manage these risks.
Owing to the uncertainty of the nancial markets and the slowdown of global economic growth,Metso’s business environment is expected to be demanding in 2009. In an operating environmentthat is subject to rapid changes, the importance of efficient risk management increases, and themanagement of strategic and nancial risks will receive emphasis in particular. Even though thegeographical diversity of Metso’s operations and the broad range of the company’s customerindustries serve to even out the effects of cyclical changes over the long term, the rapid slowdownof global economic growth and prolongation of the nancial crisis and downturn in the economymay deteriorate the demand for Metso’s products and services further.
Global economic uncertainty and the nancial crisis may have adverse effects on projects inMetso’s order backlog. Some projects may be postponed or they may be suspended or dis-continued. Metso’s management estimates that slightly over 20 percent of projects in the orderbacklog are subject to uncertainties relating to delivery schedules. Metso applies the percentage ofcompletion method to long-term delivery agreements. The customer advance payment is typically10–30 percent, in addition to which the customer makes payments based on the milestones duringthe project execution. Metso continually evaluates its customers’ creditworthiness and ability toful ll their obligations. If a customer faces liquidity problems, Metso discusses with the customerthe possibility of changing project delivery schedules and the resulting cost escalation effects orany other measures needed. As a rule, Metso does not nance customer projects.
7

BOARD OF DIRECTORS’ REPORT
Metso has launched many measures to adapt to the rapidly-changing operating environment.Capacity and cost structure is adjusted to correspond with the demand to maintain the company’scompetitiveness. The global economic crisis may shrink the markets for Metso’s products, whichmay lead to intensi ed price competition.
Securing the continuity of Metso’s operations requires that sufficient funding is ensured under allcircumstances. The nancial crisis may have adverse effects on the availability of Metso’s debtnancing or increase the costs related to it. Metso’s management estimates that the company’snancial assets and available credit facilities are sufficient to secure short-term liquidity. At the end
of December, cash and cash equivalents totaled EUR 314 million and credit facilities available forwithdrawal totaled EUR 500 million. Metso’s long-term loans mature relatively evenly during 2009–2012, the average repayment period of loan capital is four years, and they do not have covenantsinitiating premature repayment on the basis of credit ratings. Currently Metso fully meets thecovenants and other terms related to its nancing agreements.
The capital tied up in net working capital and the level of capital expenditure have a fundamentaleffect on the adequacy of nancing. A prolonged economic downturn could slow Metso’s attemptsto release some of its net working capital. Metso has no particularly large-scale investmentschemes underway, and Metso’s management estimates that it is well positioned to manage thecapital expenditure levels in the coming years.
Changes in the prices of raw materials and components could also affect Metso’s pro tability. Onone hand, the risk of increases in direct costs typically diminishes during economic downturn. Onthe other hand, some of Metso’s customers are raw material producers, whose ability to operateand invest may be hampered by declining raw material prices.
Of the nancial risks that affect Metso’s pro t, currency exchange rate risks are among the mostsubstantial ones. Exchange rate changes can affect the business, although the geographicaldiversity of operations decreases the signi cance of any individual currency. The prevailinguncertainty in the markets is likely to increase exchange rate uctuations. Exchange rate variationscan have a direct impact in situations where the invoicing currency is different from the currency ofthe manufacturing costs. Exchange rate uctuations may also weaken the cost competitiveness ofMetso’s products against the products of competitors manufactured in another currency area.Alongside the euro, the most important currencies used in invoicing are the U.S. dollar, theSwedish krona, the Canadian dollar and the Brazilian real. Exchange rate changes affect Metso’sbusiness indirectly, as Metso translates the net sales and nancial results of its subsidiaries basedoutside the Eurozone into euros. Metso hedges in full those currency exposures that arise from rmdelivery and purchase agreements. In addition, Metso’s units can hedge anticipated foreigncurrency denominated cash ows by taking into account the signi cance of such cash ows, thecompetitive situation and other opportunities to adapt.
Subpoena from the United States Department of Justice requiring Metso to producedocuments
In November 2006, Metso Minerals Industries, Inc., which is Metso’s U.S. subsidiary, received asubpoena from the Antitrust Division of the United States Department of Justice calling for MetsoMinerals Industries, Inc. to produce certain documents. The subpoena relates to an investigation ofpotential antitrust violations in the rock crushing and screening equipment industry. Metso iscooperating fully with the Department of Justice.
8

BOARD OF DIRECTORS’ REPORT
Adjusting to changes in demand
Metso has begun to adjust its operations for an extended period of weak demand. The focus is onadjusting the capacity to correspond with the demand, ensuring pro tability and strengthening thecash ow. The measures which were commenced in early October, will continue in 2009. The rstmeasures were to cut down the use of temporary work force and subcontracting. In a rapidlydeteriorating market situation these measures have turned out to be insufficient, and Metso hashad to start temporary lay-offs and personnel reductions in many units. In most cases, thetemporary lay-offs concern all employee groups, and their duration varies, depending on the workload, from few weeks to longer periods. The measures are intended to secure the competitivenessof Metso’s businesses by adjusting the operations and cost structures to correspond with thedemand situation.
Personnel
At the end of 2008, Metso had 29,322 employees, which was 2,485 more than at the end of 2007(26,837 employees at December 31, 2007). In terms of regions, the growth in personnel numberswas most substantial in Asia-Paci c, where 15 percent of the Group’s personnel are based. In2008, Metso had an average of 28,010 employees.
The main drivers behind personnel increases were the investments in delivery and servicecapability and strengthening of Metso’s global presence. Personnel in Mining and ConstructionTechnology increased due to growth investments in Canada, Brazil and India. Personnel in Energyand Environmental Technology increased mainly through the increase in the production capacity ofthe Power and Automation business lines in India and China and the MAPAG acquisition inGermany. Personnel in Paper and Fiber Technology increased during the year by about 1,100people in China due to the acquisition of Valmet-Xi’an Paper Machinery Co. Ltd, but decreased inEurope and particularly in the Nordic countries as a result of efficiency improvement measures.
Metso’s personnel is divided as follows by reporting segment: Mining and Construction Technology38 percent, Energy and Environmental Technology 22 percent, Paper and Fiber Technology 36percent, and Valmet Automotive, shared service centers and Group Head Office 4 percent. Thecountries with the largest numbers of Metso’s personnel were Finland, the United States, Sweden,China and Brazil. These countries accounted for 70 percent of the entire Metso’s personnel.
The salaries and wages of Metso employees are determined on the basis of local collective andindividual agreements, employee performance and job evaluations. Basic salaries and wages arecomplemented by performance-based compensation systems. In 2008, the total amount of salariesand wages paid was EUR 1,066 million (EUR 1,036 million in 2007).
Personnel by area:
Dec 31, 2006 Dec 31, 2007 Dec 31, 2008 Change %Finland 9,281 9,386 9,252 -1Other Nordic countries 3,580 3,602 3,332 -7Other European countries 3,067 3,183 3,842 21North America 3,715 3,865 3,964 3South and Central America 2,439 2,675 2,991 12Asia-Pacific 2,262 2,705 4,469 65Other countries 1,334 1,421 1,472 4Total 25,678 26,837 29,322 9
9

BOARD OF DIRECTORS’ REPORT
Strategic study
In August, Metso initiated a study to assess value-enhancing opportunities, including structuraloptions. In December, Metso’s Board of Directors decided to discontinue the study as a result ofthe signi cant change in global economy. Metso’s Board and management continue to look forvalue enhancing opportunities in the normal course of business.
Reorganization of Metso’s business
Metso’s businesses were reorganized into three reporting segments as of December 1, 2008;Mining and Construction Technology, which is headed by Matti Kähkönen, Energy and Environ-mental Technology, headed by Pasi Laine, and Paper and Fiber Technology, headed byBertel Langenskiöld.
Changes in top management
Metso appointed two new members to its Executive Team as of December 1, 2008. The newmembers are Kalle Reponen, Senior Vice President, Strategy and M&A, and Perttu Louhiluoto,who started at Metso on October 1, 2008 as Senior Vice President, Operational Excellence.
Metso also established Metso Executive Forum to enforce strategy execution globally as ofDecember 1, 2008. In addition to the Metso Executive Team members, the members of the MetsoExecutive Forum are from Metso’s main business lines and geographical regions: Andrew Benko(Mining business line), João Ney Colagrossi (Construction business line), Per-Åke Färnstrand(Fiber business line), Heinz Gerdes (Recycling business line), Ari Harmaala (China), Hannu Mälkiä(Paper business line), Lennart Ohlsson (Power business line) and Sudhir Srivastava (India).
Financial targets and dividend policy
In connection with the annual strategy rounds Metso updated its long-term nancial targets for theperiod 2009–2012. The following targets were set in August 2008 to replace the previous nancialtargets set in October 2006:
Net sales growth more than 10 percent EBITA to improve annually and EBITA margin to exceed 12 percent ROCE-% before taxes to exceed 25 percent Cash conversion (free cash ow / net income) to exceed 100 percent Solid investment grade credit ratings to be maintained To distribute at least 50 percent of annual earnings per share as a dividend or in the other
forms of repatriation of capital (share buybacks, redemptions etc.)
Even though the net sales growth, EBITA and ROCE targets continue to be valid for longer term,Metso does not consider these targets to be achievable for 2009 after major changes in Metso’soperating environment. The cash conversion, and solid investment grade status as well as dividendpolicy, are valid targets also for 2009. As usual, Metso will assess its nancial targets and dividendpolicy after the annual strategy round during the second half of 2009.
Decisions of the Annual General Meeting
The Annual General Meeting of Metso Corporation on April 2, 2008 approved the accounts for2007 as presented by the Board of Directors and decided to discharge the members of the Boardof Directors and the President and CEO of Metso Corporation from liability for the nancial year2007. In addition, the Annual General Meeting approved the proposals of the Board of Directors to
10

BOARD OF DIRECTORS’ REPORT
authorize the Board to decide upon repurchasing the Corporation’s own shares, arranging a shareissue, granting special rights and decreasing the share premium reserve and the legal reserve.The Annual General Meeting decided to establish a Nomination Committee of the Annual GeneralMeeting to prepare proposals for the next Annual General Meeting in respect of the composition ofthe Board of Directors and director remuneration. The Nomination Committee consists of therepresentatives appointed by the four biggest shareholders and the Chairman of Metso’s Board asan expert member.
Matti Kavetvuo was re-elected as the Chairman of the Board and Jaakko Rauramo was re-electedas the Vice Chairman. Jukka Viinanen and Arto Honkaniemi were elected as new members of theBoard. Board members re-elected were Maija-Liisa Friman, Christer Gardell and Yrjö Neuvo. Theterm of office of Board members lasts until the end of the next Annual General Meeting.
The Annual General Meeting decided that the annual remunerations for Board members be EUR92,000 for the Chairman, EUR 56,000 for the Vice Chairman and EUR 45,000 for the members andthat the meeting fee including committee meetings be EUR 600 per meeting. The auditing com-pany PricewaterhouseCoopers Oy, Authorized Public Accountants, was re-elected as the Corp-oration’s Auditor until the end of the next Annual General Meeting.
The Annual General Meeting decided that a dividend of EUR 3.00 per share be paid for the nan-cial year which ended on December 31, 2007. The dividend comprised an ordinary dividend ofEUR 1.65 per share and an extra dividend of EUR 1.35 per share. The dividend was paid on April15, 2008.
Members of Metso’s Board Committees
Metso Corporation’s Board of Directors elected from its midst the members of the Audit Committeeand Compensation Committee at its assembly meeting. The Board’s Audit Committee consists ofMaija-Liisa Friman (Chairman), Arto Honkaniemi and Jukka Viinanen. The Board’s CompensationCommittee consists of Matti Kavetvuo (Chairman), Christer Gardell, Yrjö Neuvo and JaakkoRauramo.
The Nomination Committee consists of Metso’s four biggest registered shareholders on November3, 2008 and they have named the following persons as their representatives for Metso’s Nomi-nation Committee i.e. State of Finland: Pekka Timonen, Cevian Capital II Master Fund L.P.: LarsFörberg, Varma Mutual Pension Insurance Company: Mikko Koivusalo and Ilmarinen MutualPension Insurance Company: Harri Sailas. The Chairman of Metso’s Board of Directors serves asthe Committee’s expert member. The Nomination Committee prepares proposals on the composi-tion of the Board of Directors along with the director remuneration for the next Annual GeneralMeeting and presents its proposal to the company’s Board of Directors.
Shares, options and share capital
At the end of December, Metso’s share capital was EUR 240,982,843.80 and the number of shareswas 141,754,614. The number of shares includes 60,841 Metso shares held by the Parent Com-pany and 70,131 Metso shares held by a limited partnership consolidated in Metso’s consolidatednancial statements. Together these represent 0.09 percent of all the shares and votes. The
average number of shares outstanding in 2008, excluding Metso shares held by the company, was141,595,026.
Metso’s Annual General Meeting on April 2, 2008 decided to decrease the share premium reserveand the legal reserve. The decreased amounts were transferred to the reserve of invested non-restricted equity as of August 7, 2008.
In August, Metso’s Board of Directors decided to cancel the remaining 100,000 year 2003A stockoptions. Following this and earlier cancellations and share subscriptions there are no options
11

BOARD OF DIRECTORS’ REPORT
outstanding or available from any of Metso’s option programs for subscription of shares in MetsoCorporation.
Metso’s market capitalization, excluding Metso shares held by the company, was EUR 1,207million on December 31, 2008.
Share ownership plans
Metso has a share ownership plan for years 2006–2008. The maximum number of shares to beallocated in the incentive plan is 360,000 Metso Corporation shares. The 2007 share ownershipplan comprised 86 Metso executives, including the entire Executive Team. At the end of March2008, 67,657 shares were distributed as rewards, corresponding to approximately 0.05 percent ofall Metso shares. Members of the Executive Team received 15,763 shares.
Metso’s Board of Directors decided in February on the number of shares to be allocated for 2008plan and the criteria for earning them. The potential reward from the plan will be based on theoperating pro t of Metso and its business areas in 2008. In 2008, the share ownership plan willcover a maximum of 130,000 Metso shares, corresponding to 0.09 percent of all Metso shares.Metso’s Executive Team is covered by the 2008 plan, and a maximum of 27,500 shares has beenallocated to the Executive Team members. The maximum reward from the plan is limited to eachperson’s annual salary. The payment of rewards will be decided during the rst quarter of 2009.
In October, Metso’s Board approved a new, share-based incentive plan for the Metso Groupmanagement, Metso Share Ownership Plan 2009–2011 (SOP 2009–2011). The plan includes onethree-year earnings period, which will begin on January 1, 2009 and will end on December 31,2011. The plan was initially targeted to about 100 key managers, out of which 89 decided toparticipate. The plan requires participants’ personal investment in Metso shares and the partici-pants have committed to invest in about 55,000 shares. The rewards to be paid on the basis of theplan will correspond to a maximum total of approximately 380,000 Metso shares. The shares to betransferred in possible rewards are Metso shares obtained in public trading, and therefore, the SOP2009–2011, will have no diluting effect on the share value.
12

BOARD OF DIRECTORS’ REPORT
Reporting segments
As of December 1, 2008, Metso’s businesses were reorganized into three reporting segments:Mining and Construction Technology, consisting of Mining and Construction business lines, Energyand Environmental Technology, consisting of Power, Automation and Recycling business lines andPaper and Fiber Technology, consisting of Paper, Fiber and Tissue business lines. These nancialstatements are prepared based on the new operating structure.
Mining and Construction Technology
EUR million 2006 2007 2008Net sales 1,945 2,330 2,586Net sales of services business 856 960 1,078
% of net sales 44 41 42Earnings before interest, tax andamortization (EBITA) 262.0 323.0 361.2
% of net sales 13.5 13.9 14.0Operating profit 259.8 319.8 358.4
% of net sales 13.4 13.7 13.9Orders received 2,399 2,776 2,709Order backlog, Dec 31 1,099 1,496 1,492Personnel, Dec 31 8,800 9,754 11,259
Net sales of Mining and Construction Technology grew by 11 percent on the comparison periodand were EUR 2,586 million (the growth was 16% at comparable exchange rates). Both of thesegment’s business lines increased net sales over the previous year. Net sales of the servicesbusiness were at a good level and grew by 12 percent (19% at comparable exchange rates). Theservices business accounted for 42 percent of the net sales (41% in 2007).
The operating pro t in 2008 increased by 12 percent and was EUR 358.4 million, or 13.9 percent ofnet sales (EUR 319.8 million and 13.7%). Strong volume growth and the favorable development ofthe services business improved pro tability. However, in the fourth quarter pro tability weakenedbecause of a slowdown in net sales growth while xed costs continued to increase.
The value of orders received in 2008 was EUR 2,709 million (EUR 2,776 million in 2007). Thedecrease was due to the impact of exchange rates. The value of new orders was on par with theprevious year in the Mining business line and slightly down in the Construction business line. Thelast quarter of 2008 was clearly the weakest in terms of orders received. The volume of ordersreceived from emerging markets was at the previous year’s level, and they accounted for 50percent of the new orders (49%). Orders received increased in Asia-Paci c by close to 30 percent.Among the largest orders received during the year were those received for grinding equipment toMinera Petaquilla S.A.’s copper mine in Panama, minerals processing equipment to ChinaMetallurgical Group in Australia, and grinding equipment to Metallurgical Company Norilsk Nickel inRussia. The order backlog remained at the previous year’s level and totaled EUR 1,492 million atthe end of December (EUR 1,496 million on Dec 31, 2007). Slightly over 10 percent of orders in theorder backlog are subject to uncertainties, related to delivery schedules.
13

BOARD OF DIRECTORS’ REPORT
Energy and Environmental Technology
EUR million 2006 2007 2008Net sales 881 1,543 1,775Net sales of services business 213 347 404
% of net sales 26 23 23Earnings before interest, tax andamortization (EBITA) 128.4 182.4 198.3
% of net sales 14.6 11.8 11.2Operating profit 124.6 150.3 176.0
% of net sales 14.1 9.7 9.9Orders received 980 1,884 1,658Order backlog, Dec 31 1,079 1,337 1,204Personnel, Dec 31 5,591 5,857 6,357
Net sales of Energy and Environmental Technology increased by 15 percent on the comparisonperiod (18% at comparable exchange rates) and were EUR 1,775 million. The growth originatedfrom all business lines, and the strongest growth was experienced in the Power business line. Theservices business grew by 16 percent (20 percent at comparable exchange rates). The servicesbusiness accounted for 23 percent of the net sales, as was the case a year before (23% in 2007).
The operating pro t increased by 17 percent on the previous year and was EUR 176.0 million, or9.9 percent of net sales (EUR 150.3 million and 9.7% in 2007). Operating pro t is burdened by theEUR 15 million of amortization of intangible assets related to the acquisition of the Power business(EUR 28 million in 2007). Operating pro t in 2008 increased in the Automation business line owingto strong volume growth and decreased slightly in the Recycling business line. Also the operatingpro t of Power business line improved, but the improvement was mainly due to the decrease in theamortization of intangible assets.
The value of orders received fell by 12 percent from the comparison period and totaled EUR 1,658million. The decrease was due to the Power and Recycling business lines. Orders received by theAutomation business line remained on the previous year’s level. Major orders for valves during theyear included valve deliveries for the oil and gas industry in Asia and the Middle East, of which themost signi cant was the delivery for the Qatar Petroleum and Shell GTL (gas-to-liquids) project inQatar. Major system deliveries included the large automation package for the Propapier paperplant in Germany. The Power business line’s major orders were the evaporation plant to SCAPackaging’s pulp and paper mill in Sweden, the biomass- red power boiler to Dalkia France SCA’scombined heat-and-power plant in France, and a multifuel- red boiler to Stora Enso Poland S.A.’spower plant in Poland. The order backlog amounted to EUR 1,204 million at the end of the year, 10percent below the level at the end of 2007. Projects accounting for close to 20 percent of the orderbacklog’s total value are subject to uncertainties relating to delivery schedules. These uncertainorders include pulp mill orders for Zhanjiang Chenming in China and Aracruz in Brazil.
14

BOARD OF DIRECTORS’ REPORT
Paper and Fiber Technology
EUR million 2006 2007 2008Net sales 2,092 2,364 2,044Net sales of services business 636 718 716
% of net sales 30 30 35Earnings before interest, tax andamortization (EBITA) 105.6 146.6 146.1
% of net sales 5.0 6.2 7.1Operating profit 89.8 128.2 130.1
% of net sales 4.3 5.4 6.4Orders received 2,276 2,293 2,021Order backlog, Dec 31 1,600 1,553 1,434Personnel, Dec 31 9,952 10,093 10,544
Net sales of Paper and Fiber Technology decreased by 14 percent in 2008 and were EUR 2,044million. Net sales decreased considerably in the Paper and Fiber business lines. The net sales ofthe services business were on a par with the comparison period (at comparable exchange rates,the growth would have been about 3 percent), accounting for 35 percent of net sales (30% in2007).
Paper and Fiber Technology’s EBITA for January–December was EUR 146.1 million, i.e. 7.1percent of net sales (EUR 146.6 million and 6.2%). The pro tability improvement in the nal quartercompared to the same period last year was due to the successful deliveries of major projects andthe nonrecurring costs that were lower than the year before.
The operating pro t was EUR 130.1 million, i.e. 6.4 percent of net sales (EUR 128.2 million and5.4%), and it includes EUR 4 million in amortization of intangible assets relating to the acquisitionof the Pulping business (EUR 8 million in 2007). The Paper and Tissue business lines improvedtheir operating pro t slightly, while the Fiber business line’s operating pro t decreased considerablycompared with the previous year.
The pulp and paper industry’s demand for equipment and services weakened considerably duringthe year. Orders received by the Tissue business line were on a par with the comparison year,while those of the Paper business line decreased. Orders received by the Fiber business lineincreased in 2008, but include two pulp technology projects with uncertain delivery schedules.The value of orders received decreased 12 percent from the comparison period and was EUR2,021 million. The largest orders received during the year were a papermaking line for Propapier inGermany, pulp mill equipment for Zhanjiang Chenming in China, a pulp technology delivery toAracruz in Brazil, board making lines for Shandong Bohui in China and Amcor in Australia, and ane paper production line to Fujian Nanping Paper Co. in China.
The nal scope of the Zhanjiang Chenming pulp mill project is currently being nalized. Thecustomer of the Aracruz pulp mill project has announced that it plans to resume the expansionproject in Brazil, as from the rst half of 2011. Metso has done some work relating to the project onthe basis of the prepayment made by the customer. Metso is negotiating with both ZhanjiangChenming and Aracruz regarding project implementation schedules and the effects of schedulingchanges.
The order backlog at the end of December, EUR 1,434 million, was 8 percent lower than the orderbacklog at the end of 2007. About one-third of the projects in the order backlog are subject touncertainties relating to delivery schedules, such as the pulp mill orders mentioned above.
In the fourth quarter, the segment commenced measures to adjust capacity to the decreasedmachine and equipment demand in the pulp and paper industry. The change in the market situationhas escalated further as a result of the global nancial crisis. The planned measures are intendedto secure the competitiveness of the business by streamlining the operational and cost structure ofoperations.
15

BOARD OF DIRECTORS’ REPORT
Valmet Automotive
Valmet Automotive’s net sales in 2008 totaled EUR 65 million. The operating loss was EUR 3.5million, or 5.4 percent of net sales. During the year, Valmet Automotive produced an average of 87vehicles (in 2007, 110 vehicles) per day. At the end of December, Valmet Automotive employed783 people (789 employees at December 31, 2007).
In November, Valmet Automotive and the U.S. company Fisker Automotive signed a cooperationagreement on the manufacture of Fisker Karma cars in Finland. Production is planned to start inthe nal quarter of 2009, and the rst cars will be delivered to North America. The annualproduction is projected to be 15,000 cars. Valmet Automotive’s current assembly contract withPorsche will continue until 2012.
Short-term outlook
As a result of the uncertainty in the nancial markets and the slowdown of global economic growth,Metso’s operating environment is expected to be demanding in 2009. Metso’s customers are cauti-ous in their decisions to invest, which will especially affect the demand for Metso’s new equipmentand project business.
Mining companies are expected to make substantial cuts in their investment plans compared withthe peak investment levels of recent years and further limit their production during the year. Basedon the strong product and services offering, the demand for Metso’s mining equipment is expectedto be satisfactory in 2009. In the construction industry, the demand for equipment relating to aggre-gates production is estimated to be weak at least during the rst half of the year. Many countrieshave introduced stimulus measures relating to infrastructure development, which, at some point,are expected to have a positive effect on the demand for construction industry products. The de-mand for Mining and Construction Technology’s services business is expected to be satisfactory.
The demand for power plants utilizing renewable energy sources is expected to be satisfactory inEurope and North America in 2009. The goals set for the use of renewable energy sources and theefforts to secure and increase energy self-sufficiency are expected to boost the demand for thesepower plants. The demand for Metso’s automation products is expected to be satisfactory in 2009.The demand for metals recycling equipment is expected to be weak, owing to the low demand ofscrap metal and reduction in steel production. Demand for services business in Energy and En-vironmental Technology is expected to be satisfactory.
The demand for paper, pulp and ber lines is expected to be weak in 2009. The delivery schedulesof some large paper and board machine and ber line projects in the order backlog have beenprolonged. In the pulp and paper industry, low capacity utilization rates are expected to weaken thedemand for Metso’s services business, particularly in North America and Europe.
Metso’s total net sales in 2009 are estimated to exceed EUR 5 billion. Metso’s order backlog isover EUR 4 billion, out of which about EUR 3 billion is scheduled for 2009. Metso’s servicesbusiness volumes are expected to remain satisfactory in 2009.
The focus of Metso’s management has shifted from growth to pro tability and cash ow. The aim isto quickly adjust the capacity and the cost structure to correspond with the demand. Metso’s pro -tability is expected to be satisfactory in 2009. Free cash ow is expected to improve considerablyon 2008 owing to the measures aimed at releasing working capital.
The net sales and pro tability estimates are based on Metso’s current market outlook and businessscope.
16

BOARD OF DIRECTORS’ REPORT
Board of Directors’ proposal for the distribution of profit
The Parent Company’s distributable funds totaled EUR 1,017,111,051.25 on December 31, 2008,of which the net pro t for the year was EUR 361,829,353.31.
The Board proposes to the Annual General Meeting that the dividend of EUR 0.70 per share bedistributed for the year ended on December 31, 2008, and that the rest be retained and carriedfurther. It is proposed that the record date for the payment of the dividend will be April 3, 2009 andthat the dividend will be paid on April 15, 2009.
In addition the Board of Directors proposes that the Board of Directors be authorized to decidewithin its discretion, and when the economic situation of the Company favours it, on the payment ofdividend addition to the dividend decided in the Annual General Meeting, however no more thanEUR 0.68 per share. The Board of Directors shall make its decision no later than December 31,2009. The dividend paid on the basis of the decision of the Board of Directors will be paid to theshareholders registered in the Company’s shareholders’ register maintained by the Finnish CentralSecurities Depository (Euroclear Finland Ltd) on the record date decided by the Board of Directors.The Board of Directors shall decide the record date for dividend and the date of payment of thedividend, which can at the earliest be the fth banking day from the record date.
All the shares outstanding on the dividend record date will be entitled to a dividend, except for thetreasury shares held by the Parent Company.
Annual General Meeting 2009
The Annual General Meeting of Metso Corporation will be held at 3 p.m. on Tuesday, March 31,2009 at Helsinki Fair Centre (Messuaukio 1, 00520 Helsinki, Finland).
Helsinki, February 4, 2009
Metso Corporation’s Board of Directors
17

SHARES AND SHAREHOLDERS
Shares and Shareholders
Shares and share capital
On December 31, 2008, Metso Corporation’s fully paid share capital entered in the trade registerwas EUR 240,982,843.80 and it was divided into 141,754,614 shares. Metso has one class ofshares and each share entitles its holder to one vote at the Annual General Meeting and to anequal amount of dividend. Metso’s shares are registered in the Finnish book-entry system.
Changes in number of shares and share capital, January 1, 2001 – December 31, 2008:
Number ofshares
Change innumber of
sharesShare capital,
EUR
Change inshare capital,
EUR2001 New shares subscribed with the Metso
1994 options, which were transferred fromValmet Corporation
136,250,545 793,270 231,625,926.50 1,348,559.00
2005 New shares subscribed with the Metso2000A/B and 2001A/B options
141,654,614 5,404,069 240,812,843.80 9,186,917.30
2006 New shares subscribed with the Metso2003A options
141,719,614 65,000 240,923,343.80 110,500.00
2007 New shares subscribed with the Metso2003A options
141,754,614 35,000 240,982,843.80 59,500.00
2008 No changes in number of shares nor inshare capital
141,754,614 - 240,982,843.80 -
Share ownership plan
On December 31, 2008, MEO1V Incentive Ky, a limited partnership company that administersMetso’s share ownership plan and is included in Metso’s consolidated financial statements, held70,131 Metso shares to implement the share ownership plan. The acquisition price of the shares isEUR 2,585,818 and they were acquired in 2006. On December 31, 2008, the Parent Company held60,841 treasury shares, which were repurchased in 1999 at a total price of EUR 654,813. Theaggregate of the above-mentioned shares is 130,972 shares, or 0.09 percent of the Corporation’sshare capital.
Board authorizations
On April 2, 2008, the Annual General Meeting authorized Metso’s Board of Directors to resolve of arepurchase of the Corporation’s own shares, of a share issue and to grant of special rights, andapproved the decrease of the share premium reserve and legal reserve.
Decided decrease of the share premium reserve and the legal reserve was implemented in August7, 2008 and the decreased amounts were transferred to the reserve of invested non-restrictedequity.
Authorization to repurchase and convey the Corporation’s own shares
The Annual General Meeting authorized the Board of Directors to decide on the repurchase of amaximum of 5,000,000 of the Corporation’s own shares. The Corporation’s own shares may beacquired using non-restricted equity through public trading on the NASDAQ OMX Helsinki Ltd, atthe market price of the share prevailing at the time of acquisition.
The Corporation’s own shares so acquired may be held, cancelled or conveyed by the Corporation.The shares so acquired may be used as consideration in acquisitions or other arrangementsconcerning the Corporation’s business, in financing investments or as part of the Corporation’sshare ownership plan. The Board had not exercised the authorization by December 31, 2008.
18

SHARES AND SHAREHOLDERS
Authorization to decide on a share issue
The Board of Directors has been authorized to decide on issuing up to a maximum of 15,000,000new shares and on conveying up to a maximum of 5,000,000 of the Corporation’s own shares. Thenew shares may be issued and own shares held by the Corporation may be conveyed eitheragainst payment or for no consideration.
The Board may also decide on a share issue for no consideration to the Corporation itself. Thenumber of shares issued to the Corporation shall not exceed 5,000,000, including the number ofown shares acquired by the Corporation by virtue of the authorization to repurchase the Corp-oration’s own shares.
The new shares can be issued and the own shares held by the Corporation can be conveyed to theCorporation’s shareholders in proportion to their present holding or by means of a share offering,waiving the preemptive subscription rights of the shareholders, if there is a weighty financial reasonfor the Corporation to do so. Such reasons may include using the shares as consideration in acqui-sitions or other arrangements concerning the Corporation’s business, to finance investments or aspart of the Corporation’s share ownership plan. A share offering may take place without considera-tion only if there are particularly weighty reasons to do so from the Corporation’s point of view andconsidering the benefit of all of the Corporation’s shareholders. The Board has not exercised theauthorization.
Market capitalization and trading
Metso Corporation’s shares have been listed on the NASDAQ OMX Helsinki (OMXH: MEO1V)since July 1, 1999. The listing of Metso’s American Depository Shares (ADS) on the New YorkStock Exchange began on July 1, 1999 and ended on September 14, 2007. Trading with theCorporation’s American Depository Receipts continues in the United States OTC markets underthe code MXCYY.
Metso’s share price on the NASDAQ OMX Helsinki decreased by 77 percent during 2008 fromEUR 37.33 to EUR 8.52. At the same time, the portfolio index of Helsinki stock exchange, OMXHelsinki CAP (OMXHCAP), decreased by 50 percent. The highest quotation of Metso’s share onthe NASDAQ OMX Helsinki was EUR 38.56, and the lowest EUR 7.74. The share price on Dec-ember 31, 2008 was EUR 8.52, and the average trading price for the year was EUR 23.66. TheCorporation’s end-of-year market capitalization was EUR 1,207 million, excluding own shares heldby the Group.
In 2008, 359,378,566 Metso shares were traded on the NASDAQ OMX Helsinki. The total turnoverwas EUR 8,503 million. The average daily trading volume was 1.4 million shares, or 2.6 percenthigher than in 2007. 254 percent of shares were traded during the year (relative turnover in 2007:248 percent).
In 2008, the highest price of Metso’s American depository share (ADS) in the United States wasUSD 56.40, and the lowest USD 10.15. The ADS price in the OTC trade on December 31, 2008was USD 12.19. Each ADS represents one share.
Incentive systems
Options programs
In August, Metso’s Board of Directors decided to cancel the remaining 100,000 year 2003A stockoptions. Following this and earlier cancellations and share subscriptions there are no options out-standing or available from any of Metso’s option programs for subscription of shares in Metso.
Further information on the 2003A options program is presented in the Notes to the FinancialStatements (Note 22 on page 76).
19

SHARES AND SHAREHOLDERS
Share ownership plans
Metso has a share ownership plan for the strategy period 2006–2008, and it is part of the remune-ration and commitment program for the management of Metso and its business areas. The plancovers three earnings periods, each of which lasts one calendar year, i.e. 2006, 2007 and 2008.The incentive will consist of both shares and cash. In 2008, the share ownership plan covers amaximum total of 130,000 Metso shares, corresponding to 0.09 percent of all Metso shares. Thepayment of rewards will be decided during the first quarter of 2009.
Metso’s Board has approved a new, share-based incentive plan for the Metso Group management,Metso Share Ownership Plan 2009–2011 (SOP 2009–2011). The plan includes one three-yearearnings period, which will begin on January 1, 2009 and will end on December 31, 2011. Therewards to be paid on the basis of the plan will correspond to a maximum total of approximately380,000 Metso shares. The shares to be transferred in possible rewards are Metso shares obtain-ned in public trading, and therefore, the SOP 2009–2011, will have no diluting effect on the sharevalue.
Further information on the share ownership plan for the 2007, 2008 and 2009 earnings periods ispresented in the Board of Directors’ report and for the 2006, 2007 and 2008 earnings periods onNotes to the Financial Statements (Note 22 on page 76).
Holdings of Metso’s Board of Directors and executive management on December 31, 2008
At the end of 2008, the members of Metso’s Board of Directors, Jorma Eloranta, President andCEO, and Olli Vaartimo, Executive Vice President and CFO and people in their immediate circleheld a total of 54,840 Metso shares. These shares represent 0.04 percent of the Corporation’sshare capital and voting rights.
Up-to-date information on Metso’s statutory insiders with their holdings are presented on Metso’sweb site.
Dividend policy
Metso’s dividend policy is to distribute at least 50 percent of earnings per share in annual dividendsor in other forms of repatriation of capital to its shareholders. The Board proposes to the AnnualGeneral Meeting that the dividend of EUR 0.70 per share be distributed for the year ended onDecember 31, 2008. The Board is further proposing to the Annual General Meeting to authorize theBoard to pay at its discretion an additional dividend later in the year 2009 in the amount notexceeding EUR 0.68 per share should Metso’s financial position support the distribution of suchadditional dividend.
The proposed dividend of EUR 0.70 corresponds to 25 percent of the profit attributable to theequity shareholders for the year. The effective dividend yield is 8.2 percent.
Shareholders
At the end of 2008, Metso had 41,840 shareholders in the book-entry register, and the biggest ofthese was the Solidium Oy (wholly-owned by the Finnish state) with an 11.1 percent (2007: 11.1%)holding.
Nominee registered shares and shares in direct foreign ownership accounted for 55.4 percent(66.8%) of the total stock. 20.7 percent (16.4%) of the total stock was held by Finnish institutions,companies and foundations and 12.8 percent (5.7%) was held by Finnish private individuals.
20

SHARES AND SHAREHOLDERS
Metso’s biggest shareholders on December 31, 2008:Number ofshares and
votes
% of sharecapital and
voting rights1 Solidium Oy 1) 15,695,287 11.12 Ilmarinen Mutual Pension Insurance Company 4,027,621 2.83 Varma Mutual Pension insurance company 3,520,204 2.54 The State Pension Fund 1,800,000 1.35 Odin Funds 1,590,207 1.1
Odin Norden 977,678 0.7Odin Forvaltnings AS 430,637 0.3Odin Forvaltnings AS / Odin Europa 152,694 0.1Odin Norden II 29,198 0.0
6 Sampo-rahastot 1,051,298 0.7Danske Fund Finnish Equity 605,757 0.4Danske Fund Finnish Institutional Equity 322,901 0.2Sampo European Balanced Fund 80,640 0.1Sampo Pohjoisen parhaat Fund 42,000 0.0
7 OP Funds 1,015,653 0.7OP-Delta Fund 591,482 0.4OP-Finland Value Fund 300,000 0.2OP-Focus Non-UCITS Fund 101,151 0.1OP-ryhmän Tutkimussäätiö 23,020 0.0
8 Etera Mutual Pension Insurance Company 948,000 0.79 Svenska litteratursällskapet i Finland r.f. 922,495 0.7
10 Nordea Funds 738,483 0.5Nordea Life Assurance Finland Ltd. 232,170 0.2Nordea Fennia Fund 212,000 0.2Nordea Pro Finland Fund 195,000 0.1Nordea Avanti Fund 57,771 0.0Nordea Fennia Plus Fund 41,542 0.010 largest owner groups in total 31,309,248 22.1
Nominee-registered shares 2) 76,198,568 53.8Other shareholders 34,105,686 24.1Treasury shares held by the Parent Company 60,841 0.0Shares administered by a partnership (MEO1V Incentive Ky) 70,131 0.0On shared account 10,140 0.0Total 141,754,614 100.0
1) The Finnish State has on December 11, 2008 transferred all its Metso Corporation shares to the entirely state-ownedSolidium Oy as a capital contribution. The shares transferred to Solidium Oy include 15,695,287 Metso Corporation shares,which corresponds to 11.1 percent of the paid up share capital and votes in Metso. After the transfer, there are no MetsoCorporation shares owned by the state.
2) During 2008, only one flagging notification was received from Metso’s shareholders, whose holdings reached orexceeded 5 percent of Metso’s share capital or voting rights. An up-to-date list of all flagging notifications made can befound at www.metso.com/investors.Marathon Asset Management LLP announced that on November 11, 2008 the funds they managed held 7,258,794 shares,which corresponds to 5.12 percent of the paid up share capital of Metso Corporation. Out of this holding, Marathon AssetManagement LLP was in possession of 5,545,225 shares to which they had voting rights. This voting authority represents3.91percent of the total voting rights in Metso.
21

SHARES AND SHAREHOLDERS
Breakdown of share ownership on December 31, 2008:
Number of sharesShare-
holders
% ofshare-
holders
Total numberof sharesand votes
% of sharecapital and
voting rights1-100 16,416 39.2 893,674 0.6101-1,000 21,027 50.3 7,829,975 5.51,001-10,000 4,045 9.7 10,487,094 7.410,001-100,000 290 0.7 7,819,415 5.5over 100,001 42 0.1 38,384,776 27.2Total 41,820 100.0 65,414,934 46.2
Nominee-registered shares 18 76,198,568 53.8Treasury shares held by theParent Company 1 60,841 0.0Shares administered by a partnership(MEO1V Incentive Ky) 1 70,131 0.0On shared account 10,140 0.0Number of shares issued 141,754,614 100.0
Up-to-date information on Metso’s share price, ownership structure and the shareholdings ofstatutory insiders is available on Metso’s website www.metso.com/investors.
22

CONSOLIDATED STATEMENTS OF INCOME
EUR million Note 2006 2007 2008Net sales 32 4,955 6,250 6,400Cost of goods sold 6, 7 -3,659 -4,702 -4,733Gross profit 1,296 1,548 1,667
Selling, general and administrative expenses 4, 6, 7 -846 -972 -1,043Other operating income and expenses, net 5, 32 6 1 11Share in profits and losses of associated companies 14, 32 1 3 2Operating profit 32 457 580 637
% of net sales 9.2% 9.3% 10.0%
Financial income and expenses, net 8 -36 -33 -89Profit before tax 421 547 548
Income taxes 9 -11 -163 -158Profit 410 384 390
Attributable to:Shareholders of the company 409 381 389Minority interests 1 3 1
410 384 390
Earnings per shareBasic, EUR 12 2.89 2.69 2.75Diluted, EUR 12 2.89 2.69 2.75
CONSOLIDATED STATEMENTS OF RECOGNIZED INCOME AND EXPENSE
EUR million Note 2006 2007 2008Cash flow hedges, net of tax 21, 30 16 -2 -33Available-for-sale equity investments, net of tax 15, 21 1 22 -19Currency translation on subsidiary net investments 21 -59 -29 -49Net investment hedge gains (+) / losses (-), net of tax 21 22 -2 -11Defined benefit plan actuarial gains (+) / losses (-), net of tax 27 2 -1 -22Other 2 2 0Net income and expense recognized directly in equity -16 -10 -134Profit 410 384 390Total recognized income and expense for the year 394 374 256
Attributable to:Shareholders of the company 393 371 255Minority interests 1 3 1
394 374 256
Year ended December 31,
Year ended December 31,
23

CONSOLIDATED BALANCE SHEETS
Assets
As at December 31,EUR million Note 2007 2008Non-current assets
Intangible assets 13Goodwill 772 778Other intangible assets 251 254
1,023 1,032Property, plant and equipment 13
Land and water areas 54 58Buildings and structures 216 239Machinery and equipment 315 366Assets under construction 49 63
634 726Financial and other assets
Investments in associated companies 14 19 14Available-for-sale equity investments 15, 19 45 18Loan and other interest bearing receivables 18, 19 5 8Available-for-sale financial investments 18, 19 5 5Derivative financial instruments 19, 30 3 -Deferred tax asset 9 144 174Other non-current assets 18, 19 19 26
240 245
Total non-current assets 1,897 2,003
Current assetsInventories 17 1,410 1,606
ReceivablesTrade and other receivables 18, 19 1,256 1,146Cost and earnings of projects under construction inexcess of advance billings 16 374 362Loan and other interest bearing receivables 18, 19 2 9Available-for-sale financial investments 18, 19 0 -Derivative financial instruments 19, 30 18 48Income tax receivables 30 23
1,680 1,588
Cash and cash equivalents 20 267 314
Total current assets 3,357 3,508
Total assets 5,254 5,511
24

CONSOLIDATED BALANCE SHEETS
Shareholders' equity and liabilities
As at December 31,EUR million Note 2007 2008
Equity 21Share capital 241 241Share premium reserve 77 -Cumulative translation adjustments -76 -136Fair value and other reserves 456 490Retained earnings 910 849
Equity attributable to shareholders 1,608 1,444
Minority interests 7 9
Total equity 1,615 1,453
LiabilitiesNon-current liabilities
Long-term debt 19, 23 700 1,089Post-employment benefit obligations 27 177 191Provisions 24 37 36Derivative financial instruments 19, 30 1 8Deferred tax liability 9 41 45Other long-term liabilities 19 1 4
Total non-current liabilities 957 1,373
Current liabilitiesCurrent portion of long-term debt 19, 23 22 101Short-term debt 19, 25 97 245Trade and other payables 19, 26 1,291 1,189Provisions 24 222 218Advances received 637 479Billings in excess of cost and earnings ofprojects under construction 16 331 323Derivative financial instruments 19, 30 16 82Income tax liabilities 66 48
Total current liabilities 2,682 2,685
Total liabilities 3,639 4,058
Total shareholders' equity and liabilities 5,254 5,511
25

CONSOLIDATED STATEMENTS OF CASH FLOWS
Year ended December 31,EUR million Note 2006 2007 2008
Cash flows from operating activities:Profit 410 384 390Adjustments to reconcile profit to net cash provided by operating activities
Depreciation and amortization 7 105 148 138Gain (-) / loss (+) on sale of fixed assets 5 -6 -2 -2Gain (-) / loss (+) on sale of subsidiaries andassociated companies 11 -10 -4 -4Gain on sale of available-for-sale equity investments 5 -1 -7 -2Share of profits and losses of associated companies 14 -1 -3 -3Dividend income and interests, net 8 26 32 57Income taxes 9 11 163 158Other non-cash items 18 12 45
-18 -286 -437Interest paid -45 -45 -64Interest received 19 14 13Dividends received 2 2 2Income taxes paid -68 -114 -154Net cash provided by operating activities 442 294 137
Cash flows from investing activities:Capital expenditures on fixed assets 13 -129 -159 -255Proceeds from sale of fixed assets 14 16 10Business acquisitions, net of cash acquired 10 -277 -55 -44Proceeds from sale of businesses, net of cash sold 11 13 9 12Investments in available-for-sale equity investments -2 0 0Proceeds from sale of available-for-sale equity investments 2 3 7Investments in available-for-sale financial investments -23 0 -Proceeds from sale of available-for-sale financial investments 177 10 -Increase in loan receivables -4 -2 -8Decrease in loan receivables 2 2 1
Net cash used in investing activities -227 -176 -277
Cash flows from financing activities:Share options exercised 21 1 0 -Redemption of own shares 21 -11 - -Dividends paid -198 -212 -425Hedging of net investment in foreign subsidiaries -6 15 13Net borrowings (+) / payments (-) on short-term debt 90 -37 163Proceeds from issuance of long-term debt 113 122 486Principal payments of long-term debt -165 -87 -25Principal payments of finance leases -3 -3 -3Other items - - 2
Net cash provided by (+) / used in (-) financing activities -179 -202 211
Net increase (+) / decrease (-) in cash and cash equivalents 36 -84 71Effect of changes in exchange rates on cash and cash equivalents -6 -2 -24Cash and cash equivalents at beginning of year 20 323 353 267Cash and cash equivalents at end of year 353 267 314
Change in net working capital, net of effect frombusiness acquisitions and disposals
26

CONSOLIDATED STATEMENTS OF CASH FLOWS
Change in net working capital, net of effect from business acquisitions and disposals
Year ended December 31,EUR million 2006 2007 2008Increase (-) / decrease (+) in assets and increase (+) / decrease (-) in liabilities:
Inventory -215 -335 -230Trade and other receivables -194 -64 58Percentage of completion: recognized assets and liabilities, net 1 31 -7Trade and other payables 390 82 -258
Total -18 -286 -437
Breakdown of business combinations is presented in note 10.
27

CONSOLIDATED STATEMENT OF CHANGES IN SHAREHOLDER'S EQUITY
EUR million Sha
re c
apita
l
Sha
re p
rem
ium
rese
rve
Cum
ulat
ive
trans
-la
tion
adju
stm
ents
Fair
valu
e an
dot
her r
eser
ves
Ret
aine
dea
rnin
gs
Equ
ity a
ttrib
utab
leto
sha
reho
lder
s
Min
ority
inte
rest
s
Tota
l equ
ity
Balance at December 31, 2005 241 76 -9 424 526 1,258 7 1,265
Net income and expense recognizeddirectly in equity - - -36 17 3 -16 - -16Profit - - - - 409 409 1 410Total recognized income andexpense for the year - - -36 17 412 393 1 394
Dividends - - - - -198 -198 0 -198Share options exercised - 1 - - - 1 - 1Redemption of own shares - - - -11 - -11 - -11Share-based payments - - - 1 - 1 - 1Other - - - 1 -1 0 -2 -2Balance at December 31, 2006 241 77 -45 432 739 1,444 6 1,450
Net income and expense recognizeddirectly in equity - - -31 20 1 -10 - -10Profit - - - - 381 381 3 384Total recognized income andexpense for the year - - -31 20 382 371 3 374
Dividends - - - - -212 -212 0 -212Share options exercised 0 0 - - - 0 - 0Redemption of own shares - - - - - - - -Share-based payments - - - 5 - 5 - 5Other - - - -1 1 0 -2 -2Balance at December 31, 2007 241 77 -76 456 910 1,608 7 1,615
Net income and expense recognizeddirectly in equity - - -60 -52 -22 -134 - -134Profit - - - - 389 389 1 390Total recognized income andexpense for the year - - -60 -52 367 255 1 256
Dividends - - - - -425 -425 -2 -427Share options exercised - - - - - - - -Redemption of own shares - - - - - - - -Share-based payments - - - 4 - 4 - 4Decrease and transfer of share premiumand legal reserve - -77 - 77 - - - -Other - - - 5 -3 2 3 5Balance at December 31, 2008 241 - -136 490 849 1,444 9 1,453
28

NOTES TO THE CONSOLIDATED FINANCIAL STAEMENTS
1 Accounting principles
Description of businesses
Metso Corporation (the “Parent Company”) and its subsidiaries (together with the ParentCompany, “Metso” or the “Group”) form a global supplier of sustainable technology andservices, which designs, develops and produces systems, automation solutions, machinery andequipment for process industries. The main customer industries are mining and construction,energy, metal recycling as well as pulp and paper industries. Metso Corporation was formed in1999 as a result of the merger of Rauma Corporation and Valmet Corporation. The merger wasconsummated on July 1, 1999 and is accounted for by the pooling-of-interests method.
Metso Corporation is a public listed company and the shares have been listed on the NASDAQOMX Helsinki (OMXH:MEO1V) since July 1, 1999. The address of the Group Head Office isFabianinkatu 9A, 00100 Helsinki.
These consolidated financial statements were authorized for issue by the Board of Directors onFebruary 4, 2009.
Basis of preparation
The consolidated financial statements, prepared in accordance with International FinancialReporting Standards (“IFRS”) as adopted by the EU, include the financial statements of MetsoCorporation and its subsidiaries. There are no differences between IFRS as adopted by theEU, as applied in Metso, and IFRS as written by the IASB.
As of January 1, 2008 Metso adopted IFRIC 14, ‘IAS 19 – The Limit on a Defined Benefit Asset,Minimum Funding Requirements and their Interaction’, which is applied to post-employmentdefined benefit plans and other long-term defined benefit plans under IAS 19, if the plan inclu-des minimum funding requirements. The interpretation also clarifies the criteria for recognition ofan asset on future refunds or reductions in future contributions. The adoption did not have anyimpact on the financial statements.
Use of estimates
The preparation of financial statements, in conformity with IFRS, requires management to makeestimates and assumptions that affect the reported amounts of assets and liabilities and dis-closure of contingent assets and liabilities at the dates of the financial statements and thereported amounts of revenues and expenses during the reporting period. Actual results coulddiffer from those estimates.
Accounting convention
The financial statements are prepared under the historical cost convention, except for assetsand liabilities classified as fair valued through profit and loss and available-for-sale investments,which are recognized at fair value.
Principles of consolidation
Subsidiaries
The consolidated financial statements include the financial statements of the Parent Companyand each of those companies in which it owns, directly or indirectly through subsidiaries, over50 percent of the voting rights or in which it is in a position to govern the financial and opera-ting policies of the entity. The companies acquired during the financial period have been con-
29

NOTES TO THE CONSOLIDATED FINANCIAL STAEMENTS
solidated from the date Metso acquired control. Subsidiaries sold have been included up totheir date of disposal.
All intercompany transactions, balances and gains or losses on transactions betweensubsidiaries are eliminated as part of the consolidation process. Minority interests arepresented in the consolidated balance sheets within equity, separate from the equityattributable to shareholders. Minority interests are separately disclosed in the consolidatedstatements of income.
Acquisitions of companies are accounted for using the purchase method. The cost of anacquisition is measured at fair value over the assets given up, shares issued or liabilitiesincurred or assumed at the date of acquisition including any costs directly attributable to theacquisition. The excess acquisition cost over the fair value of net assets acquired is recog-nized as goodwill (see also intangible assets). If the cost of acquisition is less than the fairvalue of the Group’s share of the net assets acquired, the difference is recognized directlythrough profit and loss.
Associated companies and joint ventures
The equity method of accounting is used for investments in associated companies in which theinvestment provides Metso the ability to exercise significant influence over the operating andfinancial policies of the investee company. Such influence is presumed to exist for investmentsin companies in which Metso’s direct or indirect ownership is between 20 and 50 percent ofthe voting rights. Investments in associated companies are initially recognized at cost.
Investments in joint ventures in which Metso has the power to jointly govern the financial andoperating activities of the investee company are accounted for using the equity method.
Under the equity method, the share of profits and losses of associated companies and jointventures is presented separately in the consolidated statements of income. Metso’s share ofpost-acquisition retained profits and losses of associated companies and joint ventures isreported as part of investments in associated companies in the consolidated balance sheets.
Segment reporting
Metso’s operations are divided into three reporting segments: Mining and ConstructionTechnology, Energy and Environmental Technology, and Paper and Fiber Technology.
Mining and Construction Technology provides equipment and services for quarrying, aggre-gates production, construction, civil engineering and mining and minerals processing. Thesegment consists of Mining and Construction business lines.
Energy and Environmental Technology consists of Power, Automation and Recycling businesslines. Through Energy and Environmental Technology Metso supplies power generation, auto-mation, field controls as well as recycling and waste management solutions for power, oil andgas, metals recycling, and pulp and paper industries.
Paper and Fiber Technology supplies processes, machinery, equipment and services for thepulp and paper industry. The offering covers the entire process life-cycle and includes newlines, rebuilds and the services business. The segment consists of Paper, Fiber and Tissuebusiness lines.
Foreign currency translation
The financial statements are presented in euros, which is the Parent Company’s functionalcurrency and Metso’s presentation currency.
30

NOTES TO THE CONSOLIDATED FINANCIAL STAEMENTS
Transactions in foreign currencies are recorded at the rates of exchange prevailing at the dateof the transaction. At the end of the accounting period, unsettled foreign currency transactionbalances are valued at the rates of exchange prevailing at the balance sheet date. Trade flowrelated foreign currency exchange gains and losses are recorded in other operating income andexpenses, net, unless the foreign currency denominated transactions have been subject tohedge accounting, in which case the related exchange gains and losses are recorded in thesame line item as the hedged transaction. Foreign exchange gains and losses associated withfinancing are entered as a net amount under financial income and expenses, net.
The statements of income of subsidiaries with a functional currency different from the presen-tation currency are translated into euro at the average exchange rates for the financial year andthe balance sheets are translated at the exchange rate of the balance sheet date. The resultingtranslation differences are recorded in the cumulative translation adjustment line item in equity.The resulting translation differences from subsidiary net investments are recognized through theConsolidated Statement of Recognized Income and Expense (SORIE) to the cumulative trans-lation adjustments. When Metso hedges the equity of its foreign subsidiaries with foreigncurrency loans and with financial derivatives, the translation difference is adjusted by thecurrency effect of hedging instruments and recorded through the SORIE in equity, net of taxes.When a foreign entity is disposed of the accumulated translation difference is reversed throughSORIE and recognized in the consolidated statements of income as part of the gain or loss onthe sale.
Derivative financial instruments
Derivatives are initially recognized in the balance sheet at fair value and subsequentlymeasured at their fair value at each balance sheet date. Derivatives are designated at inceptioneither as hedges of firm commitments or forecasted transactions (cash flow hedge), or as fairvalue hedges of assets or liabilities, or as hedges of net investment in a foreign operation (netinvestment hedge), or as derivatives at fair value through profit and loss that do not meet thehedge accounting criteria.
In case of hedge accounting, Metso documents at inception the relationship between thehedging instruments and hedged items according to its risk management strategy andobjectives. Metso also tests the effectiveness of the hedge relationships at hedge inception andquarterly both prospectively and retrospectively.
Derivatives are classified as non-current assets or liabilities when the remaining maturity ismore than 12 months and as current assets or liabilities when the remaining maturity is lessthan 12 months.
Cash flow hedge
Metso uses cash flow hedge accounting for certain interest rate swaps, foreign currencyforward contracts and for electricity forwards.
Metso designates only the currency component of the foreign currency forward contracts as ahedging instrument. Both at hedge inception and at each balance sheet date an assessmentis performed to ensure the continued effectiveness of the designated component of the deriva-tives in offsetting changes in the fair values of the cash flows of hedged items.
Metso assesses the effectiveness of the fair value changes of the electricity forwards to offsetthe changes in the fair value changes of the underlying forecasted electricity purchases indifferent countries on an ongoing basis.
The effective portion of the derivatives is recognized through SORIE in the hedge reserve ofequity and reversed through SORIE to be recorded through profit and loss concurrently withthe underlying transaction being hedged. The gain or loss relating to the ineffective portion ofthe derivatives or to a portion, which has not been designated as a hedging instrument, is
31

NOTES TO THE CONSOLIDATED FINANCIAL STAEMENTS
reported under other operating income and expenses, net. Should a hedged transaction nolonger be expected to occur, any cumulative gain or loss previously recognized under equity isreversed through SORIE to profit and loss.
Net investment hedge
Metso hedges its net foreign investments in certain currencies to reduce the effect of ex-change rate fluctuations. The hedging instruments are mainly foreign currency loans andforeign currency forward contracts. Both realized and unrealized exchange gains and lossesmeasured on these instruments are recorded, net of taxes, through SORIE in a separatecomponent of equity against the translation differences arising from consolidation to the extentthat these hedges are effective. The interest portion of derivatives qualifying as hedges of netinvestment is recognized under financial income and expenses, net.
Fair value hedge
Changes in the fair value of derivatives that are designated and qualify as fair value hedgesare recorded in financial income and expenses, net, together with the changes in the fair valueof the hedged asset or liability that are attributable to the hedged interest rate risk.
Derivatives at fair value through profit and loss
Certain derivative instruments do not qualify for hedge accounting. These instruments, whichhave been contracted to mitigate risks arising from operating activities, include for exampleforeign currency forward contracts, interest rate swaps and swap agreements for nickel.Changes in the fair value of interest rate swaps are recognized in interest expenses, andchanges in the fair value of other derivative instruments are recognized in other operatingincome and expenses, net.
Fair value estimation
The fair value of the foreign currency forward contracts is determined using forward exchangemarket rates at the balance sheet date. The fair value of the interest rate swaps is calculatedas the present value of the estimated future cash flows. The fair value of the commodity for-wards and swaps are based on quoted market prices at the balance sheet date. The fair valueof options is determined using Black-Scholes valuation model.
Employee benefits
Share-based payments
Metso operates various share-based compensation schemes, including share ownership plan,for its key personnel.
The equity-settled share awards are valued based on the market price of Metso’s share as ofthe grant date, and recognized as an employee benefit expense over the vesting period withcorresponding entry in other reserves of the equity. The liability resulting from the cash-settledtransactions is measured based on the fair value of Metso’s share as of the balance sheetdate and accrued as an employee benefit expense with corresponding entry in the currentliabilities until the settlement date.
The fair value of options is either based on quoted market price, if available, or a value ob-tained using valuation models. When the options are exercised, the proceeds received, net oftransaction costs, are recognized in the fund for invested non-restricted equity.
Non-market vesting conditions (such as operating profit targets) are included in assumptionsabout the amount of share-based payments that are expected to vest. At each balance sheetdate, Metso revises its estimates of the amount of share-based payments that are expected tovest. The impact of the revision to previous estimate is recognized through profit and loss withcorresponding adjustment to equity and current liabilities, as appropriate.
32

NOTES TO THE CONSOLIDATED FINANCIAL STAEMENTS
Pensions and coverage of pension liabilities
Metso has several different pension schemes in accordance with local regulations andpractices in countries where it operates. In certain countries, the pension schemes are definedbenefit plans with retirement, disability, death, and other post retirement benefits, such ashealth services, and termination income benefits. The retirement benefits are usually based onthe number of service years and the salary levels of the final service years. The schemes aregenerally funded through payments to insurance companies or to trustee-administered fundsas determined by periodic actuarial calculations.
In addition, certain companies within Metso have multi-employer pension arrangements anddefined contribution pension schemes. The contributions to defined contribution plans and tomulti-employer and insured plans are charged to profit and loss concurrently with the paymentobligations.
In the case of defined benefit plans, the liability arising from the plan is the present value of thedefined benefit obligation as of the balance sheet date, adjusted by the fair value of the planassets and by the unamortized portion of past service cost. Independent actuaries calculatethe defined benefit obligation by applying the projected unit credit method under which theestimated future cash flows are discounted to their present value using the interest ratesapproximating the terms of the pension engagement. The cost of providing retirement andother post retirement benefits to the personnel is charged to profit and loss concurrently withthe service rendered by the personnel. Actuarial gains and losses arising from experienceadjustments, changes in actuarial assumptions and amendments to plans are recognizedthrough SORIE in shareholders' equity.
Revenue recognition
Revenues from goods and services sold are recognized, net of sales taxes and discounts, whensubstantially all the risks and rewards of ownership are transferred to the buyer, or when legaltitle of the goods and responsibility for shipment has transferred to the buyer. The transfer ofrisk takes place either when the goods are shipped or made available to the buyer for shipment,depending on the delivery terms clause of the contract. The credit worthiness of the buyer isverified before engaging into a sale. However, should a risk of non-payment arise after revenuerecognition, a provision for non-collectability is established.
Percentage-of-completion method
Sales and anticipated profits under engineering and construction contracts are recorded on apercentage-of-completion basis. The stage of completion is determined either by units ofdelivery, which are based on predetermined milestones and on the realized value added(contract value of the work performed to date) or by the cost-to-cost method of accounting.Estimated contract profits are recorded in earnings in proportion to recorded sales. In the cost-to-cost method, sales and profits are recorded after considering the ratio of accumulated coststo estimated total costs to complete each contract. In certain cases, subcontractor materials,labor and equipment, are included in sales and costs of goods sold when managementbelieves that Metso is responsible for the ultimate acceptability of the project. Changes to totalestimated contract costs and losses, if any, are recognized in the period in which they aredetermined.
Service revenue
Revenues from short-term service contracts are recognized once the service has been ren-dered. Revenues from long-term service contracts are recognized using the output method.
Sales with repurchase commitments
If the conditions of a sales contract with repurchase commitment indicate that the transfer ofrisks and rewards has not taken place at initial delivery of equipment and transfer ofownership, the revenue is deferred. The monies received for the machines, net of the
33

NOTES TO THE CONSOLIDATED FINANCIAL STAEMENTS
guaranteed amount, are recognized over the contract term as lease income concurrently withthe depreciation of the equipment until the expiry of the resale right. If the repurchase commit-ment expires unexercised, the remaining deferred revenue is recognized as income.
Trade-ins
Sales, against which trade-ins are accepted, are recorded at contract price. Any reductionbetween the agreed trade-in price and its recorded value in the inventory is recognized in costof goods sold concurrently with the sale.
Government grants
Government grants relating to acquisition of property, plant and equipment are deducted fromthe acquisition cost of the asset and recognized in profit and loss as a reduction of the depre-ciation charge of the related asset. Other government grants are deferred and recognized inprofit and loss concurrently with the costs they compensate.
Emission Rights and Trading
Metso has received emission rights under the European Emission Trading Scheme. Theserights, for the recognition of which there are no authoritative rules, are recognized as govern-ment grants at acquisition price and as they have been granted free of charge their acquisitionvalue is nil. They are being consumed concurrently with CO2 emissions over the complianceperiod. Any excess of rights is disposed of and the gain is recognized under other operatingincome. Should the emissions made exceed the initially allocated rights, additional rights areacquired at prevailing market price and recognized as cost in the costs of goods sold.
Other operating income and expenses, net
Other operating income and expenses, net, comprise income and expenses, which do notdirectly relate to the operating activity of businesses within Metso or which arise from unrealizedand realized changes in fair value of foreign currency denominated financial instruments asso-ciated with the operating activity, including forward exchange contracts. Such items includecosts related to significant restructuring programs, gains and losses on disposal of assets,except for those qualifying as discontinued operations, and foreign exchange gains and losses,excluding those qualifying for hedge accounting and those, which are reported under financialincome and expenses, net.
Income taxes
Income taxes presented in the consolidated statements of income consist of current anddeferred taxes. Current taxes include estimated taxes corresponding to the Group companies’results for the financial year, and adjustments of taxes for previous years.
A deferred tax liability or asset has been determined for all temporary differences between thetax bases of assets and liabilities and their amounts in financial reporting, using the enacted taxrates effective for the future years. The deferred tax liabilities are recognized in the balancesheet in full, and the deferred tax assets are only recognized when it is probable that there willbe sufficient taxable profit against which the asset can be utilized. No deferred income tax isaccounted for if it arises from initial recognition of an asset or liability in a transaction other thana business combination.
No deferred tax liability has been recognized for undistributed earnings of domestic subsidiaries(i.e., Finnish) since such earnings can be transferred to the Parent Company without taxconsequences. Metso does not provide deferred income taxes on undistributed earnings of
34

NOTES TO THE CONSOLIDATED FINANCIAL STAEMENTS
foreign subsidiaries, except in situations where Metso has elected to distribute earnings, whichbecome subject to additional non-recoverable taxes triggered by a distribution.
Earnings per share
Basic earnings per share are calculated by dividing the profit attributable to equity shareholdersof the Parent Company by the weighted average number of ordinary shares in issue during theyear, excluding own shares.
The diluted earnings per share are calculated by applying the “treasury stock” method, underwhich earnings per share data is computed as if the warrants and options were exercised at thebeginning of the period, or on the issuance of warrants and options, if that occurs later duringthe period, and as if the funds obtained thereby were used to purchase ordinary shares at theaverage market price during the period. In addition to the weighted average number of ordinaryshares outstanding, the denominator includes the incremental shares obtained through theassumed exercise of the warrants and options. The warrants and options have a dilutive effectonly when the average market price of the ordinary shares during the period exceeds theexercise price of the warrants and options.
Fixed assets
Fixed assets comprise intangible assets and property, plant and equipment.
Intangible assets
Intangible assets, which comprise mainly goodwill, trademarks, patents and licenses, arestated at historical cost less accumulated amortization and impairment loss, if any. Goodwilland intangible assets with indefinite useful lives, such as trademarks, are not amortized, buttested annually for impairment.
Amortization of intangible assets
Amortization of intangible assets with a definite useful life is calculated on a straight-linebasis over the expected economic lives of the assets as follows:
Patents and licenses 5-10 yearsComputer software 3-5 yearsTechnology 3-15 yearsCustomer relationships 3-12 yearsOther intangibles (incl. order backlog) < 1-15 years
Expected useful lives are reviewed at each balance sheet date and if they differ significantlyfrom previous estimates, the remaining amortization periods are adjusted accordingly.
The carrying value of intangible assets subject to amortization is reviewed for impairmentwhenever events and changes in circumstances indicate that the carrying amount of anasset may not be recoverable. A previously recognized impairment loss may be reversed ifthere is a significant improvement to the circumstances having initially caused the impair-ment, however not to a higher value than the carrying amount, which would have beenrecorded had there been no impairment in prior years.
Impairment of intangible assets with indefinite useful lives
The carrying value of goodwill for each segment and of other intangible assets with indefiniteuseful lives are reviewed annually or more frequently for impairment, if the facts and circum-stances, such as declines in sales, operating profit or cash flows or material adversechanges in the business climate, suggest that its carrying value may not be recoverable. Thetesting of goodwill is performed at the cash generating unit level, whereas the testing of other
35

NOTES TO THE CONSOLIDATED FINANCIAL STAEMENTS
intangible assets with an indefinite useful life is either performed as part of a cash generatingunit or separately if the asset generates independent cash flows. The annual testing may beperformed using previous year’s recoverable amounts of the cash generating units if therehas not been any significant changes to the assets and liabilities of the cash generating unit,if in the previous testing the recoverable value clearly exceeded the carrying values tested,or if the likelihood that the current recoverable value would be less than the current carryingvalue of the cash generating unit is remote. Metso uses a discounted cash flow analysis toassess the fair value of goodwill or another intangible assets subject to testing. A previouslyrecognized impairment loss on goodwill is not reversed even if there is a significant improve-ment in circumstances having initially caused the impairment, whereas an impairment losson another intangible asset with an indefinite life may be reversed should there be a signifi-cant improvement to cash flows compared to the projections having generated the impair-ment loss in the first place. However, the impairment loss may not be reversed to exceed thecarrying amount, which would have been recorded had there been no impairment in prioryears.
Research and development
Research and development costs are mainly expensed as incurred. Research and develop-ment costs comprise salaries, administration costs, depreciation and amortization of tangibleand intangible fixed assets. Development costs meeting certain capitalization criteria underIAS 38 are capitalized and amortized during the expected economic life of the underlyingtechnology.
Property, plant and equipment
Property, plant and equipment are stated at historical cost, less accumulated depreciation andimpairment loss, if any. Land and water areas are not depreciated.
Depreciation and amortization is calculated on a straight-line basis over the expected usefullives of the assets as follows:
Buildings and structures 15-40 yearsMachinery and equipment 3-20 years
Expected useful lives are reviewed at each balance sheet date and if they differ significantlyfrom previous estimates, the remaining depreciation periods are adjusted accordingly.
Subsequent improvement costs related to an asset are included in the carrying value of suchasset or recognized as a separate asset, as appropriate, only when the future economicbenefits associated with the costs are probable and the related costs can be separated fromnormal maintenance costs.
Metso reviews property, plant and equipment to be held and used by the company forimpairment whenever events and changes in circumstances indicate that the carrying amountof an asset may not be recoverable. Impairment of property, plant and equipment and capitalgains and losses on their disposal are included in other operating income and expenses, net.Previously recognized impairment on property, plant and equipment is reversed only if therehas been a significant change in the estimates used to determine the recoverable amount,however not to exceed the carrying value, which would have been recorded had there beenno impairment in prior years.
Capitalization of interest expenses
The interest expenses of self-constructed investments are capitalized in Metso’s financialstatements. The capitalized interest expense is amortized over the estimated useful life ofthe underlying asset.
36

NOTES TO THE CONSOLIDATED FINANCIAL STAEMENTS
Leases
Leases for property, plant and equipment, where Metso has substantially all the risks andrewards of ownership, are classified as finance leases. Finance leases are capitalized at theinception of the lease at the lower of the fair value of the leased property or the present valueof the minimum lease payments. Each lease payment is allocated between the liability andfinance charges. The corresponding rental obligations, net of finance charges, are includedin long-term debt, and the interest element is charged to profit and loss over the leaseperiod. Property, plant and equipment acquired under finance leases are depreciated overthe useful life of the asset or over the lease period, if shorter.
Leases of property, plant and equipment, where the lessor retains a significant portion of therisk and rewards, are classified as operating leases. Payments under operating leases areexpensed as incurred.
Financial assets
Metso classifies its financial investments into the following categories: assets and liabilities atfair value through profit and loss, loans and receivables and available-for-sale financial assets.The classification is determined at the time of the acquisition depending on the intendedpurpose. Assets and liabilities at fair value through profit and loss comprise solely derivatives.
Available for sale financial assets are further classified into available-for-sale equity investmentsand available-for-sale financial investments. Loans and receivables are classified into loans andother interest bearing receivables and other receivables, which are not interest bearing.
Purchases and sales of assets and liabilities at fair value through profit and loss (derivatives),and loans and receivables are recognized or derecognized on the trade date, i.e. the dateMetso commits to purchase or sell the asset. Purchases and sales of available-for-sale financialassets are recognized at fair value including transaction costs on the settlement date.
Financial assets are presented as non-current when their maturity exceeds one year.
At each balance sheet date, Metso assesses whether there is objective evidence of anavailable-for-sale financial asset or of a group of assets under this category being impaired. Incase of prolonged significant decline in the fair value of such an asset compared to itsacquisition value, the accumulated net loss is reversed from equity and recognized in theincome statement.
Available-for-sale equity investments
Available-for-sale equity investments include mainly shares in listed companies. Available-for-sale equity investments are carried at fair value, based on quoted closing prices as of therespective balance sheet date. Unrealized gains and losses arising from changes in fair valueare recognized through SORIE in the fair value reserve of equity. Gains and losses at disposaland impairment, if any, are recorded in the profit and loss and the accumulated change in fairvalue previously recorded in the fair value reserve of equity is reversed through SORIE.Unlisted shares, for which fair values cannot be measured reliably, are recognized at cost lessimpairment, if any.
Available-for-sale financial investments
Non-current available-for-sale financial investments
Available-for-sale financial investments, which are reported under non-current assets andwhich have been contracted as part of the cash management of Metso, comprise invest-ments in financial instruments, e.g. bonds, commercial papers and time deposits withmaturities exceeding one year at acquisition or with an undefined maturity and which Metsoplans to hold for more than one year. The instruments are fair valued quarterly and thechange in fair value is recognized through SORIE in the fair value reserve of equity. Gains
37

NOTES TO THE CONSOLIDATED FINANCIAL STAEMENTS
and losses at disposal and impairment, if any, are recorded in profit and loss and theaccumulated change in fair value previously recorded in the fair value reserve of equity isreversed through SORIE.
Current available-for-sale financial investments
Available-for-sale financial investments, which are reported under current assets, comprisehighly liquid investments, which have been contracted as part of the cash management ofMetso and which do not qualify as cash and cash equivalents. They are fair valued quarterlyand the change in fair value is recognized in the fair value reserve of equity. Gains andlosses at disposal and impairment, if any, are recorded in profit and loss and the accumu-lated change in fair value previously recorded in the fair value reserve of equity is reversedthrough SORIE.
Loans and receivables
Loan and other interest bearing receivables comprise interest bearing trade and loanreceivables. Other non-interest bearing receivables comprise non-interest bearing loanreceivables.
Loans and receivables are initially recognized at fair value including transaction costs. Sub-sequently they are recognized using the effective interest method. They are subject to regularand systematic review as to collectability. If a loan receivable is estimated to be partly or totallyunrecoverable, an impairments loss is recognized for the shortfall between the carrying valueand the present value of the expected cash flows. Interest income on loan and other interestbearing receivables is included in financial income and expenses, net.
Inventories
Inventories are stated at the lower of historical cost calculated on average cost basis or netrealizable value. Costs include purchase costs as well as transportation and processing costs.The costs of finished goods include direct materials, wages and salaries plus social costs,subcontracting and other direct costs. In addition, production costs include an allocable portionof production and project administration overheads. Net realizable value is the estimatedamount that can be realized from the sale of the asset in the normal course of business afterallowing for the costs of realization.
Inventories are shown net of a reserve for obsolete and slow-moving inventories. A reserve isestablished and a corresponding charge is taken to profit and loss in the period in which theloss occurs based upon an assessment of technological obsolescence and related factors.
Trade-in equipment received is recorded as inventory at the lower of cost or net realizablevalue.
Trade receivables
Trade receivables are recognized at original invoice amount to customers and reported in thebalance sheet, net of provision for doubtful receivables. The provision, which is expensed underselling, general and administrative expenses, is recorded on the basis of periodic reviews ofpotential non-recovery of receivables by taking into consideration individual customer credit risk,economic trends in customer industries and changes in payment terms. Bad debts are writtenoff when official announcement of receivership, liquidation or bankruptcy is received confirmingthat the receivable will not be honored.
If extended payment terms, exceeding one year, are offered to customers, the invoiced amountis discounted to its present value and interest income is recognized over the credit term.
38

NOTES TO THE CONSOLIDATED FINANCIAL STAEMENTS
Cash and cash equivalents
Cash and cash equivalents consist of cash in banks and other liquid investments with originalmaturity of three months or less.
Assets classified as held-for-sale
Non-current assets and discontinued operations are classified as held-for-sale and stated at thelower of carrying value and the fair value less cost to sell, if their carrying value is recoveredprincipally through a sale transaction rather than through a continuing use.
A discontinued operation results from the management’s decision and commitment to disposeof a separate business for which the related assets, liabilities and operating results can bedistinguished both operationally and for financial reporting purposes. When specific criteria forthe held-for-sale classification has been met, the non-current assets are recorded at the lowerof carrying value or fair value less cost to sell, and non-current assets subject to depreciation oramortization are no longer amortized. The assets and liabilities of a disposal group classified asheld-for-sale are presented in the balance sheet separate from assets and liabilities related tocontinuing operations as of the date the operation qualified as discontinued. The results ofdiscontinued operations, net of taxes and the gain or loss on their disposal are presented for allperiods separate from continuing operations in the consolidated statements of income. Balancesheet data from periods preceding the qualifying disposal decision is not reclassified.
Share capital and own shares
Transaction costs directly attributable to the issue of new shares or options are shown net oftheir tax effect in equity as a deduction from the proceeds.
Own shares, valued at historical acquisition price, are deducted from equity. Should suchshares be subsequently sold or reissued, the consideration received, net of any directlyattributable transaction costs and related income tax, is recorded in the equity.
Own shares comprise both shares held by the Parent Company i.e. treasury shares and sharesheld by a partnership (MEO1V Incentive Ky), which is consolidated in Metso’s financialstatements.
Dividends
Dividends proposed by the Board of Directors are not recognized in the financial statementsuntil they have been approved by the shareholders in the Annual General Meeting.
Long-term debt
Long-term debt is initially recognized at fair value, net of transaction costs incurred. Debt isclassified as current liability unless the Group has an unconditional right to defer settlement ofthe liability for at least 12 months after the balance sheet date.
Capitalization of transaction costs related to issuance of debt instruments
Transaction costs arising from issuance of debt instruments are included in the carrying valueof the debt, and amortized using the effective interest method over the period of the respectiveliability.
39

NOTES TO THE CONSOLIDATED FINANCIAL STAEMENTS
Capitalization of transaction costs related to exchange of debt instruments
Transaction costs arising from exchange of debt instruments are included in the carrying valueof the debt and amortized using the effective interest method over the remaining period of themodified liability provided that the new conditions obtained through the exchange do notsubstantially differ from those of the original debt. The assessment of whether the conditionsare substantially different is based on a comparison of the discounted present value of thecash flows under the new terms and the present value of the remaining cash flows of theoriginal financial liability.
Provisions
Provisions, for which settlement is expected to occur more than one year after the initialrecognition, are discounted to their present value and adjusted in subsequent closings for thetime effect.
Restructuring costs
A provision for restructuring is recognized only after management has developed andapproved a formal plan to which it is committed. Employee termination benefits are onlyrecognized when the representatives of employees or individual employees have beeninformed of the intended measures in detail and the related compensation packages can bereliably measured. The costs included in a provision for restructuring are those costs that areeither incremental or incurred as a direct result of the plan or are the result of a continuingcontractual obligation with no continuing economic benefit to Metso or a penalty incurred tocancel the contractual obligation. Restructuring expenses are recognized in either cost ofgoods sold or selling general and administrative expenses depending on the nature of therestructuring expenses. Should there be a Metso or segment wide restructuring program, therelated costs are recognized in other operating income and expenses, net. Restructuring costscan also include other costs incurred as a result of the plan, which are recorded under otheroperating income and expenses, net, such as asset write-downs.
Environmental remediation costs
Metso accrues for losses associated with environmental remediation obligations when suchlosses are probable and can be estimated reliably. Accruals for estimated losses fromenvironmental remediation obligations generally are recognized no later than completion of theremedial feasibility study. Such accruals are adjusted as further information develops orcircumstances change. Recoveries of environmental remediation costs from other parties arerecorded as assets when their receipt is deemed virtually certain.
Warranty costs
An accrual is made for expected warranty costs. The adequacy of this accrual is reviewedperiodically based on an analysis of historical experience and anticipated probable warrantyliabilities.
40

NOTES TO THE CONSOLIDATED FINANCIAL STAEMENTS
2 Financial risk management
As a global company, Metso is exposed to a variety of business and financial risks. Financialrisks are managed centrally by the Group Treasury under annually reviewed written policiesapproved by the Board of Directors. Treasury operations are monitored by the Treasury Mana-gement Team chaired by CFO. Group Treasury functions as counterparty to the operating units,manages centrally external funding and is responsible for the management of financial assetsand appropriate hedging measures. Group Treasury identifies, evaluates and hedges financialrisks in close co-operation with the operating units. The objective of financial risk managementis to minimize potential adverse effects on Metso's financial performance.
Liquidity and refinancing risk and capital structure management
Liquidity or refinancing risk arises when a company is not able to arrange funding at terms andconditions corresponding to its creditworthiness. Sufficient cash, short-term investments andcommitted and uncommitted credit facilities are maintained to protect short-term liquidity. Diver-sification of funding among different markets and adequate number of financial institutions isused to safeguard the availability of liquidity at all times.
At the end of 2008 (end of 2007 respectively) cash and cash equivalents amounted to EUR 314million (EUR 267 million), available-for-sale financial investments to EUR 5 million (EUR 5 mil-lion) and committed undrawn credit facilities to EUR 500 million (EUR 500 million).
Liquidity risk management as described here excludes interest bearing trade receivables andsimilar financial instruments, as they are not considered active risk management tools within theresponsibility of Group Treasury. Similarly, non-interest bearing liabilities such as trade andother payables are not included in liquidity management.
Metso's refinancing risk is managed by balancing the proportion of short-term and long-termdebt as well as the average remaining maturity of long-term debt. The tables below analyze therepayments and interests on Metso’s liabilities and cash flows from derivative contracts byrelevant maturity groupings based on remaining period at the balance sheet date to thecontractual maturity date.
December 31, 2008EUR million <1 year 1-5 years >5 yearsLong-term debt
Repayments 101 774 315Interests 59 141 43
Short-term debtRepayments 245 - -Interests 10 - -
Trade payables 733 - -Other liabilities 456 - -Forward exchange contracts / outflow 1,359 102 -Forward exchange contracts / inflow -1,388 -103 -
Net settled interest rate and commodityderivatives (outflow positive, inflow negative) 5 2 -2Total 1,581 915 356
41

NOTES TO THE CONSOLIDATED FINANCIAL STAEMENTS
December 31, 2007EUR million <1 year 1-5 years >5 years
Long-term debtRepayments 22 616 84Interests 39 110 7
Short-term debtRepayments 97 - -Interests 2 - -
Trade payables 856 - -Other liabilities 435 - -Forward exchange contracts / outflow 1,244 146 -Forward exchange contracts / inflow -1,246 -145 -
Net settled interest rate and commodityderivatives (outflow positive, inflow negative) -2 0 -Total 1,447 727 91
Detailed information of balance sheet items is presented in other notes to consolidated financialstatements.
Capital structure management in Metso comprises both equity and interest bearing debt. As ofDecember 31, 2008 the equity attributable to shareholders was EUR 1,444 million (EUR 1,608million) and the amount of interest bearing debt was EUR 1,435 million (EUR 819 million). Theobjectives are to safeguard the ongoing business operations and to optimize the cost of capital.Metso has a target to maintain a solid investment grade credit rating.
The credit ratings are currently:
Moody's Baa2Standard & Poor's BBB / A-3
There are no prepayment covenants in Metso's financial contracts that would be triggered bychanges in credit rating. Financial covenants included in some loan agreements refer to Metso’scapital structure. Metso is in compliance with all covenants and other terms of its debtinstruments.
Capital structure is assessed regularly by the Board of Directors and managed operationally byGroup Treasury.
Capital structure ratios are included in financial indicators for years 2004-2008 on pages 101–102 in these financial statements. The formulas for calculating the financial indicators arepresented on page 104.
Interest rate risk
Interest rate risk arises when changes in market interest rates and interest margins influencefinance costs, returns on financial investments and valuation of interest bearing balance sheetitems. Interest rate risks are managed through balancing the ratio between fixed and floatinginterest rates and duration of debt and investment portfolios. Additionally, Metso may usederivative instruments such as forward rate agreements, swaps, options and futures contractsto mitigate the risks arising from interest bearing assets and liabilities. The interest rate risk ismanaged and controlled by the Group Treasury and measured using sensitivity analysis andduration of long term debt. The Macaulay Duration of long term debt was 2.0 years on Decem-ber 31, 2008 (2.1 years).
42

NOTES TO THE CONSOLIDATED FINANCIAL STAEMENTS
At the end of 2008 the balance sheet items exposed to interest rate risk were interest bearingassets of EUR 336 million (EUR 279 million) and interest bearing debt of EUR 1,435 million(EUR 819 million). Of interest bearing debt 74 percent (75%) was denominated in EUR.
In the interest rate risk, the basis for the sensitivity analysis is an aggregate Group level interestrate exposure, composed of interest bearing assets, interest bearing debt and financial deri-vatives, such as interest rate swaps, which are used to hedge the underlying exposures. For allinterest bearing debt and assets to be fixed during next 12 months a one percentage point (100basis points) move upwards or downwards in interest rates with all other variables held constantwould increase or decrease Metso's net interest expenses, net of taxes, in next 12 months byEUR 2.1 million (EUR 0.5 million).
A one percentage point (100 basis points) move upwards or downwards in all interest rates withall other variables held constant would have following effects, net of taxes, in income statementand equity:
EUR million 2007 2008Effects in income statement equity
-/+ 0.2+/- 2.3
+/- 1.2+/- 1.6
The effect in the income statement is comprised of the change in the fair value of derivativeswhich are directly recognized through profit and loss. The effect in the equity is comprised of thechange in the fair value of available-for-sale financial assets and derivatives qualifying as effect-tive cash flow hedge instruments for long-term floating rate debt.
Foreign exchange risk
Metso operates globally and is exposed to foreign exchange risk in several currencies, althoughthe geographical diversity of operations decreases the significance of any individual currency.Almost 60 percent of Metso's net sales originate from outside euro zone; the main currenciesbeing USD, EUR, SEK, BRL, AUD and CAD.
Transaction exposure
Foreign exchange transaction exposure arises when an operating unit has commercial orfinancial transactions and payments in other than its own functional currency, and whenrelated cash inflow and outflow amounts are not equal or concurrent.
In accordance with the Treasury Policy, operating units are required to hedge in full the foreigncurrency exposures arising from firm sales and purchase commitments. Future cash flowsdenominated in a currency other than the functional currency of the unit are hedged withinternal foreign exchange contracts with the Group Treasury for periods, which do not usuallyexceed two years. The majority of the hedged future currency cash flows relate to foreigncurrency denominated order backlog. In addition, units can hedge anticipated foreign currencydenominated cash flows.
Group Treasury monitors the net position of each currency and decides to what extent acurrency position is to be closed. Group Treasury is however responsible for entering intoexternal forward transaction whenever operating unit chooses to apply hedge accounting.Upper limits have been set on the open currency exposures managed by the Group Treasury;limits have been calculated on the basis of their potential profit impact. To manage the foreigncurrency exposure Group Treasury may use forward exchange contracts, foreign exchangeswaps and options.
43

NOTES TO THE CONSOLIDATED FINANCIAL STAEMENTS
Total foreign exchange transaction exposure at the end of the year was as follows:
EUR million 2007 2008Operational items 676 508Financial items -273 -178Hedges -370 -359Total exposure 33 -28
The aggregate Group level currency exposure is the basis for the sensitivity analysis of foreignexchange risk. This exposure, net of respective hedges, is composed of all assets and liabili-ties denominated in foreign currencies, projected cash flows for unrecognized firm commit-ments, both short- and long-term sales and purchase contracts and anticipated operationalcash flows to the extent their realization has been deemed highly probable. This analysisexcludes net foreign currency investments in subsidiaries together with instruments hedgingthese investments. Assuming the euro to appreciate or depreciate ten percent against all othercurrencies, the impact on cash flows, net of taxes, derived from the year-end net exposure asdefined above, however excluding EUR as foreign currency, would be a correspondingdecrease or increase of less than EUR 1 million (EUR 2.5 million).
Transaction exposure is spread in 30 currencies and there are no major open exposures inany single currency. As of December 31, 2008 the biggest open exposures were in SEK(13%), USD (10%) and GBP (8%). A 10 percent appreciation of any of the currencies wouldhave an effect, net of taxes, of less than EUR 1 million.
A sensitivity analysis of financial instruments as required by IFRS 7, excludes following items:projected cash flows for unrecognized firm commitments, advance payments, both short- andlong-term purchase contracts and anticipated operational cash flows. The table below pre-sents the effects, net of taxes, of a +/- 10 percent change in EUR foreign exchange rates:
EUR million2007 2008total USD SEK others total
Effects in income statement equity
+/- 31.0+/- 6.5
+/- 10.0+/- 5.8
+/- 14.6-/+ 2.6
+/- 2.5+/- 1.4
+/- 27.1+/- 4.7
Effect in equity is the fair value change in derivatives contracts qualifying as cash flow hedgesfor unrecognized firm commitments. Effect in income statement is the fair value change for allother financial instruments exposed to foreign exchange risk including derivatives, whichqualify as cash flow hedges, to the extent the underlying sales transaction, recognized underthe percentage of completion method, has been recognized as revenue.
Translation or equity exposure
Foreign exchange translation exposure arises when the equity of a subsidiary is denominatedin currency other than the functional currency of its respective parent company. The majortranslation exposures are in USD, BRL, CNY and SEK. As of December 31, 2008 Metso hadhedged 74 percent (32%) of USD, 81 percent (92%) of SEK and 0 percent (67%) of CADdenominated net investments to reduce the effect of exchange rate fluctuations. The hedginginstruments are foreign currency loans and forward exchange contracts.
A sensitivity analysis of financial instruments includes forward exchange contracts and foreigncurrency loans qualified as net investment hedges. A 10 percent change in EUR foreignexchange rates would have an effect of EUR 14.8 million (EUR 29.2 million), net of taxes, inequity.
44

NOTES TO THE CONSOLIDATED FINANCIAL STAEMENTS
Commodity risk
Metso is exposed to variations in prices of raw materials and of supplies including energy.Metso units identify their commodity price hedging needs and hedges are executed through theGroup Treasury using approved counterparties and instruments. For commodity risks separateoverall hedging limits are defined and approved. Hedging is done on a rolling basis with adeclining hedging level over time.
Electricity exposure in the Scandinavian units has been hedged with electricity forwards andfixed price physical contracts, which are designated as hedges of highly probable futureelectricity purchases. Hedging is focused on the estimated energy consumption for the nexttwelve-month period with some contracts extended to approximately three years. Execution ofelectricity hedging has been outsourced to an external broker. As of December 31, 2008 Metsohad outstanding electricity forwards amounting to 635 GWh (356 GWh).
To reduce its exposure to the volatility caused by the surcharge for certain metal alloys (AlloyAdjustment Factor) comprised in the price of stainless steel charged by its suppliers, Metso hasentered into average-price swap agreements for nickel. The Alloy Adjustment Factor is basedon monthly average prices of its components of which nickel is the most significant. As ofDecember 31, 2008 Metso had outstanding nickel swaps amounting to 258 tons (396 tons).
The following table on the sensitivity analysis of the commodity prices based on financial inst-ruments under IFRS 7 comprises the net aggregate amount of commodities bought throughforward contracts and swaps but excludes the anticipated future consumption of raw materialsand electricity.
A 10 percent parallel change upwards or downwards in commodity price curves would havefollowing effects, net of taxes:
EUR million 2007 2008Electricity – effect in equity +/- 1.3 +/- 1.5Electricity – effect in income statement +/- 0.0 +/- 0.3Nickel – effect in income statement +/- 1.4 +/- 0.1
As hedge accounting is applied, the effective portion of electricity forwards is recognized inshareholders’ equity. The ineffective portion is recognized through profit and loss. Hedgeaccounting is not applied to nickel agreements, and the change in the fair value is recordedthrough profit and loss.
Other commodity risks are not managed using financial derivative instruments.
Credit and counterparty risk
Credit or counterparty risk is defined as the possibility of a customer or a financial counterpartynot fulfilling its commitments towards Metso. Metso's operating units are primarily responsiblefor credit risks pertaining to sales and procurement activities. The units assess the credit qualityof their customers, taking into account their financial position, past experience and other relev-ant factors. When appropriate, advance payments, letters of credit and third party guaranteesare used to mitigate credit risks. Group Treasury provides centralized services related to cus-tomer financing and seeks to ensure that the principles of the Treasury Policy are adhered towith respect to terms of payment and required collateral. Metso has no significant concentrat-ions of credit risks.
The maximum credit risk equals to the carrying value of trade and loan receivables. The creditquality is evaluated both on the basis of ageing of the trade receivables and also on the basis ofcustomer specific analysis. The aging structure of trade receivables is shown in note 18.
45

NOTES TO THE CONSOLIDATED FINANCIAL STAEMENTS
Counterparty risk arises also from financial transactions agreed upon with banks and financialinstitutions. The risk is managed by careful selection of banks and other counterparties, bycounterparty specific limits and netting agreements such as ISDA (Master agreement ofInternational Swaps and Derivatives Association). The compliance with counterparty limits isregularly monitored.
The maximum amount of financial counterparty risk is calculated as the fair value of available-for-sale assets, derivatives and cash and cash equivalents on the balance sheet date.
3 Critical accounting estimates and judgments
The preparation of the consolidated financial statements requires management to makeestimates and judgments affecting the amounts reported in the consolidated financialstatements and accompanying notes. These estimates and judgments, based on historicalevidence and plausible future scenarios, are continually evaluated. Following assets andliabilities include a high degree of management estimate and assumptions and their carryingvalue can therefore materially differ from current value in the next financial year.
Trade receivables
Metso's policy is to maintain a provision for bad debt based on the best estimate of the amountsthat are potentially uncollectable at the balance sheet date. The estimates are based on a sys-tematic, on-going review and evaluation performed as part of the credit-risk evaluation process.As part of this evaluation, Metso takes into account the history of collections, the size andcompositions of the receivable balances, current economic events and conditions and otherpertinent information.
Inventory
Metso's policy is to maintain a provision for slow-moving and obsolete inventory based on thebest estimate of such amounts at the balance sheet date. The estimates are based on asystematic, on-going review and evaluation of inventory balances. As part of this evaluation,Metso also considers the composition and age of the inventory as compared to anticipatedfuture needs.
Revenue recognition
Metso delivers complete installations to its customers, where the moment of signing a salescontract (firm commitment) and the final acceptance of a delivery by the customer may takeplace in different financial periods. In accordance with its accounting principles, Metso appliesthe percentage of completion method (“POC method”) for recognizing such long-term deliverycontracts. In year 2008, approximately 36 percent of the net sales were recognized under thePOC method, which is based on predetermined milestones and where the revenue is recog-nized based on the estimated realized value added or on the cost-to-cost method. A projectedloss on a firm commitment is recognized through profit and loss, when it becomes known. Theestimated revenue, the costs and profit, together with the planned delivery schedule of theprojects are subject to regular revisions as the contract progresses to completion. Revisions inprofit estimates are charged through profit and loss in the period in which the facts that give riseto the revision become known. Although Metso has significant experience using the POCmethod, the total costs estimated to be incurred on projects may change over time due tochanges in the underlying project cost structures, which may ultimately affect the revenuerecognized. Therefore, the POC method is not applied for recognizing sales commitments
46

NOTES TO THE CONSOLIDATED FINANCIAL STAEMENTS
where the final outcome of the project and related cost structure cannot be pre-establishedreliably.
Accounting for income taxes
As part of the process of preparing its consolidated financial statements, Metso is required toestimate the income taxes in each of the jurisdictions and countries in which it operates. Thisprocess involves estimating the actual current tax exposure together with assessing temporarydifferences resulting from differing treatment of items, such as deferred revenue and cost re-serves, for tax and accounting purposes. These differences result in deferred tax assets andliabilities, which are included in the consolidated balance sheet. The likelihood for the recoveryof deferred tax assets from future taxable income is assessed, and to the extent the recovery isnot considered likely the deferred asset is adjusted in accordance.
Significant management judgment is required in determining the provision for income taxes andthe deferred tax assets. Metso has recorded net deferred tax assets of EUR 129 million as ofDecember 31, 2008, adjusted by EUR 9 million for uncertainties related to its ability to utilizesome of the deferred tax assets, primarily consisting of operating losses carried forward anddeductible temporary differences for certain foreign subsidiaries and the final outcome of taxaudits in some subsidiaries. The adjustment is based on Metso's estimates of taxable incomeby country in which it operates, and the period over which the deferred tax assets will berecoverable based on estimated future taxable income and planned tax strategies to utilizethese assets. In the event that actual results differ from these estimates, the deferred tax assetneeds to be adjusted in coming financial years. The final outcome may also be affected byfuture changes in tax laws applicable in the jurisdictions where Metso operates.
Allocation of purchase price to acquired assets
In accordance with the accounting principles, the purchase price has been allocated to acquiredassets and assumed liabilities, and the excess recognized as goodwill in the balance sheet.Whenever feasible, Metso has used as a basis for such allocations readily available marketvalues to determine the fair value to be recognized. However, when this has not been possible,as often is the case with non-current intangible assets and certain assets with no active marketsor available price quotations, the valuation has been based on past performance of such assetand expected future cash generating capacity. The appraisals, which have been based oncurrent replacement costs, discounted cash flows and estimated selling prices depending on theunderlying asset, require management to make estimates and assumptions of the future per-formance and use of these assets and their impact on the financial position. Any change in ourfuture business priorities and orientations may affect the planned outcome of initial appraisals.
Impairment testing
The carrying value of identifiable intangible assets with indefinite economic life and goodwill istested annually or more frequently if events or changes in circumstances indicate that suchcarrying value may not be recoverable. The carrying values of property, plant and equipmentand intangible assets, subject to depreciation and amortization are reviewed for impairmentwhenever there are indications that their carrying values could exceed their value in use ordisposal value if disposal is considered as a possible option. Triggering events for impairmentreviews include the following:
Material permanent deterioration in the economic or political environment of the customers’or of own activity.
Significant under-performance relative to historical or projected future performance. Significant changes in Metso’s strategic orientations affecting the business plans and
previous investment policies.
47

NOTES TO THE CONSOLIDATED FINANCIAL STAEMENTS
The accounting policy related to the impairment tests is based on numerous estimates. Thevaluation is inherently judgmental and highly susceptible to change from period to periodbecause it requires Metso to make assumptions about future supply and demand related to itsindividual business units, future sales prices and achievable cost savings. The value of thebenefits and savings expected from the efficiency improvement programs are inherently sub-jective. The fair value of the reporting units is determined using a derived weighted average costof capital as the rate to discount estimated future cash flows. This rate may not be indicative ofactual rates obtained in the market. In the annual impairment test, a one percentage pointincrease in the discount rates applied for determining the fair values of the cash generatingunits would have reduced the total fair value of units tested by little over 14 percent and wouldnot have indicated any impairment needs.
Reserve for warranty and guarantee costs
The warranty and guarantee reserve is based on the history of past warranty costs and claimson machines and equipment under warranty. The typical warranty period is 12 months from thedate of customer acceptance of the delivered equipment. For larger projects, the average war-ranty period is two years. For sales involving new technology and long-term delivery contracts,additional warranty reserves can be established on a case by case basis to take into accountthe potentially increased risk.
Pensions
In accordance with IAS 19, the pension benefit expense is based on assumptions that includethe following:
A weighted average expected return assessed in the beginning of the financial year onplan assets. Actual return on plan assets may differ significantly based on market activity.
An assumed discount rate based on rates observed in the beginning of the financial year tobe used in the calculation of the current year pension expense and pension liabilitybalance. This rate may not be indicative of actual rates realized in the market.
Estimated rates of future pay increases. Actual increases may not reflect estimated futureincreases. Due to the significant change in the Group’s structure and the uncertainty of theglobal market place, these estimates are difficult to project.
The actuarial experience that differs from the assumptions and changes in the assumptionsresults in gains and losses, which are recognized in the statement of recognized income andexpenses. A one percentage point increase in the expected return on plan assets would havereduced pension benefit expense by approximately EUR 2 million, and a one percentage pointdecrease in the expected return on plan assets would have increased pension benefit expenseby approximately EUR 2 million for the year ended December 31, 2008.
Share-based payments
Share-based payment plans and related incentive programs include vesting conditions such astargets for operating profit, earnings per share and total shareholder return, and service yearrequirements subsequent to the grant date. The maximum share reward is in relation to eachparticipant’s annual salary. At each balance sheet date, the management revises its estimatesfor the number of shares that are expected to vest. As part of this evaluation, Metso takes intoaccount the changes in the forecasted performance of the Group and its reporting segments,the expected turnover of the personnel benefiting from the incentive plan and other pertinentinformation impacting the number of shares to be vested.
48

NOTES TO THE CONSOLIDATED FINANCIAL STAEMENTS
Financial instruments
In accordance with the disclosure requirements of financial instruments, the management isobliged to make certain assumptions of the future cash in- and outflows arising from financialinstruments and of the calculation of the sensitivity of such instruments:
It is impossible to predict the movements of different currencies in relation to one another,hence the realized cash in- and outflows of a foreign currency denominated financialinstruments and their impact to the consolidated bank and cash can materially differ fromthe forecasted flows as calculated at the balance sheet date.
The sensitivity is calculated by assuming a change in one of the risk factors of a financialinstrument, such as interest or currency. It is not likely that the future volatility of a riskfactor will develop in accordance with the test assumptions and that only one factor wouldbe impacted. The sensitivity analysis does not either take into account the timing of thechange.
Sensitivity analysis is based on the risk exposures at the balance sheet date. The finaloutcome can be affected by other factors, such as future profitability and its impact toborrowing costs, which are not included in sensitivity analysis.
The management has also had to assume that the fair values of derivatives, especially foreigncurrency denominated derivatives at balance sheet date materially reflect the future realizedcash in- or outflow of such instruments. When calculating the sensitivity, Metso has chosen touse market conventions in assuming a 100 basis point variation in interest rates, 10 percentchange in currency parities and in commodity prices because this provides better comparabilityfrom one period to another and information on the volatility to users of financial statements.Metso is aware that such assumptions may not be realistic when compared to past volatility;they are not intended to reflect the future development of the volatility. The management haschosen not to use past volatility as this could mislead the users of financial statements toassume the analysis reflect management's view on the future volatility of the financialinstruments.
4 Selling, general and administrative expenses
EUR million 2006 2007 2008Marketing and selling expenses -468 -521 -543Research and development expenses, net -94 -112 -127Administrative expenses -284 -339 -373Total -846 -972 -1,043
Research and development expenses, net, consist of following:
EUR million 2006 2007 2008Research and development expenses, total -109 -117 -134Capitalized development costs -1 0 0Capital expenditure 14 5 7Grants received 8 6 5Depreciation and amortization -6 -6 -5Research and development expenses, net -94 -112 -127
Year ended December 31,
Year ended December 31,
49

NOTES TO CONSOLIDATED FINANCIAL STATEMENTS
5 Other operating income and expenses, net
EUR million 2006 2007 2008Gain on sale of subsidiaries and businesses 1) 10 4 4Gain on sale of fixed assets 6 3 2Gain on sale of available-for-sale equity investments 1 7 2Rental income 3 3 3Foreign exchange gains 2) 7 19 28Change in fair value of derivatives 3) 5 2 15Other income 10 11 9
Other operating income, total 42 49 63
Impairment of goodwill 4) -7 - -Loss on sale of fixed assets 0 -1 0Write-downs on fixed assets -6 -5 -4Foreign exchange losses 2) -14 -19 -22Change in fair value of derivatives 3) -4 -6 -19Other expenses -5 -17 -7
Other operating expenses, total -36 -48 -52
Other operating income and expenses, net 6 1 11
4) Goodwill impairment charge related to Metso's Panelboard business.
1) Gain on disposal of Metso Powdermet AB in the year ended December 31, 2006, gain on sale of theassets of panelboard operations in Hannover, Germany, for the year ended December 31, 2007, andgains on sale of panelboard operations in Nastola, Finland and Sundsvall, Sweden, as well asspreader roll manufacturing business (Finbow) and shares in Sweden-based Metso Foundries KarlstadAB for the year ended December 31, 2008.2) Includes foreign exchange gains and losses resulting from trade receivables and payables andrelated derivatives.3) For more information on derivative financial instruments, see note 30.
Year ended December 31,
50

NOTES TO CONSOLIDATED FINANCIAL STATEMENTS
6 Personnel expenses and the number of personnel
Personnel expenses:
EUR million 2006 2007 2008Salaries and wages -909 -1,033 -1,064Pension costs, defined contribution plans -79 -89 -86Pension costs, defined benefit plans 1) -9 -8 -10Other post-employment benefits 1) -4 -3 -3Share-based payments -5 -3 -2Other indirect employee costs -162 -203 -208Total -1,168 -1,339 -1,3731) For more information on pension costs, see note 27.
Board remuneration:
EUR thousand 2006 2007 2008Serving Board members December 31, 2008:Matti Kavetvuo -87 -89 -105Jaakko Rauramo -57 -56 -67Maija-Liisa Friman -58 -59 -58Christer Gardell -38 -48 -56Arto Honkaniemi - - -46Yrjö Neuvo -38 -48 -56Jukka Viinanen - - -44Jukka Leppänen1) -6 -7 -7Former Board members:Svante Adde -49 -50 -12Eva Liljeblom - -38 -12Satu Huber -49 -12 -Juhani Kuusi -9 - -Pentti Mäkinen1) -2 - -Total -393 -407 -4631) Has attended meetings as a personnel representative, no voting right.
According to the resolution of the Annual General Meeting held on April 2, 2008, the annual fees of theBoard members are as follows: Chairman EUR 92,000, Vice Chairman EUR 56,000, and other membersEUR 45,000 each. In addition, an attendance fee of EUR 600 per meeting is paid to all members formeetings of the Board and its Committees. Compensation for traveling expenses and daily allowances arepaid in accordance with Metso’s travel policy.
Year ended December 31,
Year ended December 31,
51

NOTES TO CONSOLIDATED FINANCIAL STATEMENTS
Remuneration paid to the Executive Team:
EUR thousand 2006 2007 2008Salaries and other short-term employee benefits -3,195 -2,682 -3,021Share-based payments - -2,147 -1,079Total -3,195 -4,829 -4,100
Remuneration paid to Chief Executive Officer and Chief Financial Officer:
Annual fixed Bonus from Share-based Number ofEUR salary previous year payment shares granted2006President and CEO 486,580 236,291 - -Executive Vice President and CFO 336,631 157,577 - -
2007President and CEO 512,096 249,530 415,848 5,000Executive Vice President and CFO 361,185 175,173 401,709 4,830
2008President and CEO 546,034 232,283 254,453 3,717Executive Vice President and CFO 382,999 159,448 181,752 2,655
Year ended December 31,
Metso has subscribed pension plans for senior management for retirement at the age of 60, thebeneficiaries include some members of the Metso Executive Team and certain senior executives. For theyears ended December 31, 2006, 2007 and 2008, the pension insurance premium payments totaledapproximately EUR 1.4 million, EUR 1.8 million and EUR 2.3 million, respectively.
Remuneration paid to President and CEO Jorma Eloranta is presented in the table above. In addition, hebenefited from a company car and a telephone. Mr. Eloranta is part of the remuneration and commitmentprogram for Metso's management, the remuneration of which consists of Metso shares and a cash-settledportion. For more information on share-based payments, see note 22.
In 2004, Mr. Eloranta was granted a total of 100,000 Metso 2003A option rights. In 2006 he sold 50,000options and in the beginning of 2007 further 33,000 options. Eloranta subscribed Metso shares with 15,000options in 2006 and with 2,000 in the beginning of 2007. At the end of 2007, he did not have Metso options.
According to his employment contract, Jorma Eloranta's age of retirement is 60 years with a pension benefitamounting to 60 percent of the higher of his average monthly salary for four or ten service years prior toretirement. In case of termination of contract, he is entitled to compensation equal to 24 months' salary.
Remuneration paid to Executive Vice President and CFO Olli Vaartimo is presented in the table above. Inaddition, he benefited from a company car, an apartment and a telephone. Mr. Vaartimo is part of theremuneration and commitment program for Metso's management, the remuneration of which consists ofMetso shares and a cash-settled portion. For more information on share-based payments, see note 22.
According to his employment contract, Olli Vaartimo's age of retirement is 60 years with a pension benefitamounting to 60 percent of the higher of his average monthly salary for four or ten service years prior toretirement. In case of termination of contract, he is entitled to compensation equal to 24 months' salary.
52

NOTES TO CONSOLIDATED FINANCIAL STATEMENTS
Board share ownership in Metso:
Year ended December 31,2008
Serving Board members December 31, 2008:Matti Kavetvuo 1,000Jaakko Rauramo 6,000Maija-Liisa Friman 1,500Christer Gardell -Arto Honkaniemi -Yrjö Neuvo 7,100Jukka Viinanen -Jukka Leppänen1) 520Total 16,120
Number of personnel at end of year:
2006 2007 2008Mining and Construction Technology 8,800 9,754 11,259Energy and Environmental Technology 5,591 5,857 6,357Paper and Fiber Technology 9,952 10,093 10,544
Valmet Automotive 1,013 789 783Group Head Office and other 322 344 379
Group Head Office and others total 1,335 1,133 1,162Metso total 25,678 26,837 29,322
Average number of personnel during the period:
2006 2007 2008Mining and Construction Technology 8,460 9,259 10,481Energy and Environmental Technology 4,213 5,716 6,160Paper and Fiber Technology 9,296 10,109 10,256
Valmet Automotive 1,066 852 744Group Head Office and other 329 333 369
Group Head Office and others total 1,395 1,185 1,113Metso total 23,364 26,269 28,010
1) Has attended meetings as a personnel representative, no voting right.
53

NOTES TO CONSOLIDATED FINANCIAL STATEMENTS
7 Depreciation and amortization
Depreciation and amortization expenses consist of the following:
EUR million 2006 2007 2008Intangible assets -17 -56 -44Property, plant and equipment
Buildings and structures -21 -19 -20Machinery and equipment -67 -73 -74
Total -105 -148 -138
EUR million 2006 2007 2008Cost of goods sold -65 -91 -80Selling, general and administrative expenses
Marketing and selling -6 -14 -14Research and development -6 -6 -5Administrative -28 -37 -39
Total -105 -148 -138
8 Financial income and expenses, net
EUR million 2006 2007 2008Financial income
Dividends received 1 1 0Interest income on cash and cash equivalents 18 14 14Other financial income 1 3 2
Financial income total 20 18 16
Financial expensesInterest expenses from financial liabilities at amortized cost -44 -46 -70Interest expenses on financial leases -1 -1 -1Other financial expenses -10 -11 -10Net gain (+) / loss (-) from foreign exchange -1 7 -24
Financial expenses total -56 -51 -105
Financial income and expenses, net -36 -33 -89
Depreciation and amortization charged against operations by activity are as follows:
Year ended December 31,
Year ended December 31,
Year ended December 31,
54

NOTES TO CONSOLIDATED FINANCIAL STATEMENTS
9 Income taxes
The components of income taxes are as follows:
Year ended December 31,EUR million 2006 2007 2008Current tax expense -85 -109 -145Deferred taxes 74 -54 -13Income taxes, total -11 -163 -158
Year ended December 31,EUR million 2006 2007 2008Income before taxes 421 547 548
Income tax expense at Finnish statutory rate -109 -142 -142Income tax for prior years -4 4 11Difference between Finnish and foreign tax rates -12 -31 -25Benefit of operating loss carryforward 33 5 0Operating losses with no current tax benefit -4 -1 -2Non-deductible expenses -2 -2 -2Deferred tax asset attributable to the U.S. subsidiaries 1) 87 - -Other 0 4 2Income tax expense -11 -163 -158
The differences between income tax expense computed at Finnish statutory rate and income tax expenseprovided on earnings are as follows:
1) In the year ended December 31, 2006 Metso recorded a deferred tax asset of EUR 87 million foroperating loss carryforwards, net deductible temporary differences and unused tax credits attributable tothe U.S. subsidiaries in full.
55

NOTES TO CONSOLIDATED FINANCIAL STATEMENTS
Reconciliation of deferred tax balances:
EUR million
Balance atbeginning
of year
Chargedto incomestatement
Chargedto equity
Translationdifferences
Acquisitionsand
disposals
Balanceat end
of year2007Deferred tax assets
Tax losses carried forward 111 -63 -4 -3 - 41Fixed assets 10 4 - - - 14Inventory 26 4 - -1 - 29Provisions 20 3 - -1 - 22Accruals 33 -2 - -2 - 29Pension related items 28 -3 -1 -1 - 23Other 41 -3 7 -5 - 40Total deferred tax assets 269 -60 2 -13 - 198Offset against deferred tax liabilities 1) -31 -23 - - - -54
Net deferred tax assets 238 -83 2 -13 - 144
Deferred tax liabilitiesPurchase price allocations 56 -7 - - 5 54Fixed assets 11 - - - - 11Other 21 1 8 - - 30Total deferred tax liabilities 88 -6 8 - 5 95Offset against deferred tax assets 1) -31 -23 - - - -54
Net deferred tax liabilities 57 -29 8 - 5 41
Deferred tax assets, net 181 -54 -6 -13 -5 103
2008Deferred tax assets
Tax losses carried forward 41 -19 14 -1 - 35Fixed assets 14 - - - - 14Inventory 29 5 - - - 34Provisions 22 -1 6 - - 27Accruals 29 3 - - - 32Pension related items 23 -3 13 - - 33Other 40 -3 8 -3 - 42Total deferred tax assets 198 -18 41 -4 - 217Offset against deferred tax liabilities 1) -54 11 - - - -43
Net deferred tax assets 144 -7 41 -4 - 174
Deferred tax liabilitiesPurchase price allocations 54 -4 - - 4 54Fixed assets 11 4 - - - 15Other 30 -5 -7 - 1 19Total deferred tax liabilities 95 -5 -7 - 5 88Offset against deferred tax assets 1) -54 11 - - - -43
Net deferred tax liabilities 41 6 -7 - 5 45
Deferred tax assets, net 103 -13 48 -4 -5 129
A deferred tax liability on undistributed profits of subsidiaries located in countries where distribution generates taxconsequences is recognized when it is likely that earnings will be distributed in the near future. For the years endedDecember 31, 2007 and 2008, respectively, earnings of EUR 119 million and EUR 137 million would have beensubject to recognition of a deferred tax liability, had Metso regarded a distribution in the near future as likely.
1) Deferred tax assets and liabilities are offset when there is a legally enforceable right to offset current tax assetsagainst current tax liabilities and when the deferred income taxes relate to the same fiscal authority.
56

NOTES TO CONSOLIDATED FINANCIAL STATEMENTS
10 Acquisitions
Acquisitions in 2008
EUR millionCarrying
value Fair valueallocations Fair value
Intangible assets 0 12 12Property, plant and equipment 10 3 13Inventories 24 - 24Trade and other receivables 18 - 18Deferred tax liabilities -1 -4 -5Minority interest -3 - -3Other liabilities assumed -24 - -24Non-interest bearing net assets 24 11 35
Cash and cash equivalents acquired 13Pre-acquisition investment in associated companies (Valmet-Xi'an) -6Debt assumed -11Purchase price -48Goodwill 17
Purchase price settled in cash -48Settlement of acquired debt -9Cash and cash equivalents acquired 13Cash outflow on acquisitions -44
In May, Metso acquired Kemotron A/S, a Danish manufacturer of advanced measurement systems mainly to thepulp, paper and chemical industry. The purchase price was about EUR 3 million and the company wascombined into the Energy and Environmental Technology segment.
The acquired businesses contributed net sales of EUR 32 million and net profit of EUR 0 million for the periodfrom their acquisition to December 31, 2008. Had these acquisitions taken place on January 1, 2008, Metso'snet sales and net profit would have increased by EUR 55 million and EUR 1 million, respectively.
Summary information on acquisitions made in 2008:
In October Metso acquired G & F Beltline Services Pty Ltd, a provider of conveyer belt line installations andmaintenance services based in Australia. The acquisition price was approximately EUR 6 million and EUR 2million thereof was allocated to intangible assets being the fair value of Beltline's customer base. Goodwill ofEUR 3 million arose from the acquisition. The company was integrated into Metso's Mining and ConstructionTechnology segment on October 15, 2008.
In September Metso acquired PSP Slévárna a.s in Czech Republic. The company is a producer of finishedmanganese wear parts. The transaction was valued at about EUR 6 million whereof EUR 2 million was allocatedto property, plant and equipment representing their fair values. The company was transferred into Metso'sownership on October 1, 2008 and was integrated into the Mining and Construction Technology segment.
In September Metso also acquired from Finnish Fastpap Oy Ab its paper quality control business comprising themanufacturing and final assembly of measuring scanners used in Metso's Quality Control Systems as well asafter sales services. The unit was combined into the Energy and Environmental Technology segment onOctober 1, 2008.
In September Metso increased its ownership in associated company Valmet-Xi'an Paper Machinery Co. Ltd inChina. Metso's holding increased from 48.3% to 75% and the company was consolidated into Metso's balancesheet in September. The cash paid for the incremental portion was EUR 5 million and the value of the previouslyheld investment in associated companies was EUR 6 million. The company held a cash balance of EUR 13million. A goodwill of EUR 1 million was recognized from the transaction.
Metso acquired in June Mapag Valves GmbH, a German manufacturer of butterfly valves which was combinedinto the Energy and Environmental Technology segment. The debt-free acquisition price was EUR 36 million, ofwhich EUR 10 million was allocated to intangible assets, representing the fair values of the acquired technology,customer base and order backlog. The excess purchase price of EUR 10 million represents goodwill associatedto Metso's improved market position in new and rapidly growing industrial markets.
57

NOTES TO CONSOLIDATED FINANCIAL STATEMENTS
EUR million Amortization periods Fair valueTechnology 10 years 3Customer relationships 5 to 7 years 7Order backlog 12 months 2Total 12
Acquisitions in 2007
EUR millionCarrying
value Fair valueallocations Fair value
Intangible assets 0 16 16Property, plant and equipment 2 - 2Inventories 2 - 2Trade and other receivables 8 - 8Deferred tax liabilities -1 -5 -6Other liabilities assumed -7 - -7Non-interest bearing net assets 4 11 15
Cash and cash equivalents acquired 4Debt assumed -1Purchase price -36Goodwill 18
Purchase price settled in cash -36Cash and cash equivalents acquired 4Cash outflow on acquisitions -32
Metso recognized intangible assets relating to the acquired businesses as follows:
Metso acquired North American metal recycling provider, Bulk Equipment Systems and Technologies Inc(B.E.S.T. Inc), on March 30, 2007 and it was consolidated into the Energy and Environmental Technologysegment. The acquisition price was approximately EUR 9 million, of which EUR 3 million was allocated tointangible assets, representing the fair values of the acquired customer base, brands, technology and orderbacklog. The excess purchase price of EUR 7 million represents goodwill associated to Metso's improvedposition in the North American metal recycling market.
On June 27, 2007, Metso acquired Mecanique et Dépannage Industries s.a.r.l. (MDI), a French companysupplying maintenance services to the paper industry. The purchase price was less than EUR 1 million. Thecompany became part of Metso's Paper and Fiber Technology.
Metso's Paper and Fiber Technology acquired on July 18, 2007 a UK based service provider Bender HoldingsLimited with its subsidiaries. The purchase price was EUR 16 million, net of cash acquired. EUR 10 million wasallocated to intangible assets, representing the fair values of acquired technology, customer base and existinglong-term contracts. The excess purchase price of EUR 6 million is goodwill related to Metso's improved positionin the worldwide market for services to pulp and paper industry.
Metso strengthened its metal recycling business by acquiring Mueller Engineering Inc. in the USA on October31, 2007 when the company was consolidated into the Energy and Environmental Technology. MuellerEngineering is a shredder plant service provider specializing in servicing the drive motors and related equipmentcritical to the functioning of the shredder. The purchase price was EUR 6 million, of which EUR 3 million wasallocated to intangible assets representing the fair values of acquired customer base, technology and orderbacklog and the remaining EUR 4 million represents goodwill arising from the leading market position gained onmetal recycling plant services in North America.
The acquired businesses contributed net sales of EUR 17 million and net profit of EUR 2 million for the periodfrom their acquisition to December 31, 2007. Had these acquisitions taken place on January 1, 2007, Metso'snet sales and net profit would have increased by EUR 26 million and EUR 3 million, respectively.
Summary information on acquisitions made in 2007:
58

NOTES TO CONSOLIDATED FINANCIAL STATEMENTS
EUR million Amortization periods Fair valueTechnology 3 to 10 years 4Customer relationships 3 to 8 years 8Order backlog 10 months to 6 years 2Brands not amortized 1Other intangible assets 2 to 3 years 1Total 16
Acquisition of Pulping and Power businesses in 2006
Carrying Fair valueEUR million value allocations Fair valueIntangible assets 5 154 159Property, plant and equipment 25 - 25Inventories 52 - 52Trade and other receivables 186 - 186Other assets 29 - 29Minority interests - - -Advances received -214 - -214Deferred tax liabilities -4 -41 -45Other liabilities assumed -175 - -175Non-interest bearing net assets -96 113 17
Cash and cash equivalents acquired 248Debt assumed -195Purchase price -330Costs related to acquisition -6Goodwill 266
Purchase price settled in cash -307Settlement of acquired debt -195Costs related to acquisition -6Cash and cash equivalents acquired 248Cash outflow on acquisition for 2006 -260
Purchase price adjustment paid in July 2007 -23Total cash outflow on acquisition -283
Metso recognized intangible assets relating to the acquired businesses as follows:
Metso acquired the Pulping and Power businesses from Aker Kvaerner on December 29, 2006 from which dateon the businesses were consolidated into Metso's Fiber and Power business lines. The final asset values of thebusinesses were agreed upon in July 2007 and the final purchase price amounted to EUR 336 million includingEUR 6 million in expenses related to the acquisition and EUR 53 million of net cash. The resulting purchaseprice adjustment of EUR 23 million was settled in July.
The total purchase price decreased by EUR 6 million from the initial assessment and EUR 154 million thereofwas allocated to intangible assets, representing the fair values of acquired customer base, technology and orderbacklog. The related deferred tax liability was EUR 41 million. The remaining excess purchase price of EUR 266million represents goodwill, which reflects the value of assembled workforce, significant synergy benefits andwidened business portfolio offering Metso potential to expand its operations into new markets and customersegments.
Had the acquisition occurred on January 1, 2006, Metso's net sales for 2006 would have increased by EUR 600million.
Details of the acquired net assets and goodwill are as follows:
59
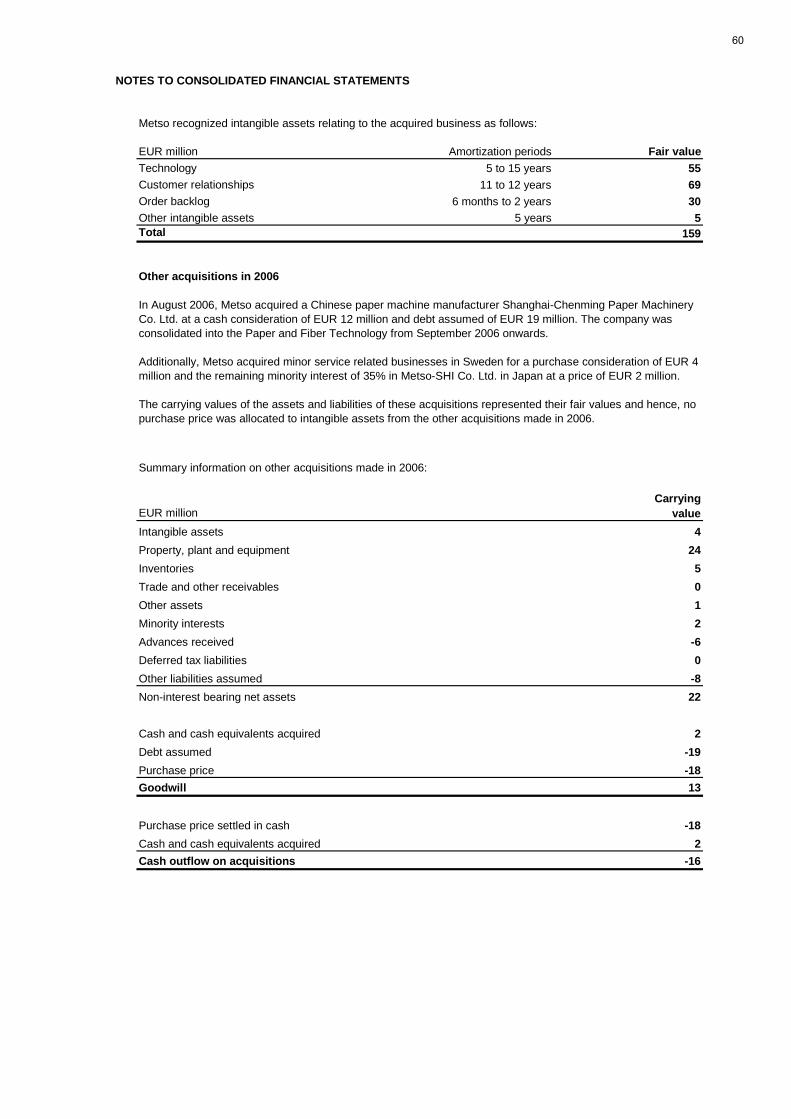
NOTES TO CONSOLIDATED FINANCIAL STATEMENTS
Metso recognized intangible assets relating to the acquired business as follows:
EUR million Amortization periods Fair valueTechnology 5 to 15 years 55Customer relationships 11 to 12 years 69Order backlog 6 months to 2 years 30Other intangible assets 5 years 5Total 159
Other acquisitions in 2006
CarryingEUR million valueIntangible assets 4Property, plant and equipment 24Inventories 5Trade and other receivables 0Other assets 1Minority interests 2Advances received -6Deferred tax liabilities 0Other liabilities assumed -8Non-interest bearing net assets 22
Cash and cash equivalents acquired 2Debt assumed -19Purchase price -18Goodwill 13
Purchase price settled in cash -18Cash and cash equivalents acquired 2Cash outflow on acquisitions -16
Summary information on other acquisitions made in 2006:
In August 2006, Metso acquired a Chinese paper machine manufacturer Shanghai-Chenming Paper MachineryCo. Ltd. at a cash consideration of EUR 12 million and debt assumed of EUR 19 million. The company wasconsolidated into the Paper and Fiber Technology from September 2006 onwards.
Additionally, Metso acquired minor service related businesses in Sweden for a purchase consideration of EUR 4million and the remaining minority interest of 35% in Metso-SHI Co. Ltd. in Japan at a price of EUR 2 million.
The carrying values of the assets and liabilities of these acquisitions represented their fair values and hence, nopurchase price was allocated to intangible assets from the other acquisitions made in 2006.
60

NOTES TO CONSOLIDATED FINANCIAL STATEMENTS
11 Disposals of businesses
In September 2008, Metso divested the shares in Sweden-based Metso Foundries Karlstad AB to a group offinancial investors represented by Primaca Group Oy. Metso will continue as a minority owner with a 16.7percent holding in Heavycast Oy, a new company to which the Primaca Group transferred the acquired shares.The value of the transaction was approximately EUR 15 million, and Metso recognized a small tax-free capitalgain from the sale. The divested business was part of Paper and Fiber Technology segment.
In May 2008, Metso sold its spreader roll manufacturing business and related assets located in Nokia, Finland toa group of Finnish investors. They continued the business under the name of Finbow Oy. The divestment was notmaterial for Metso. The divested business was part of Paper and Fiber Technology.
In January 2008, Metso concluded the divestment of its Panelboard business. The panelboard operations inNastola, Finland and Sundsvall, Sweden were divested to the German company Dieffenbacher GmbH + Co. KG.The transaction price was EUR 2 million. The assets of the Panelboard business in Hannover, Germany, weresold to Siempelkamp Energy Systems GmbH in September 2007. The transaction price was EUR 7 million.
Metso sold the majority of Metso Paper AG in Delémont, Switzerland, in March 2007. Metso remained as aminority shareholder in the company. The transaction price net of cash sold was EUR 2 million.
Metso finalized in December 2006 the divestment of Metso Powdermet AB in Sweden to Sandvik AB for EUR 13million. Metso recorded a tax-free gain of EUR 10 million on the divestment.
None of these businesses qualified as separate business line within Metso, hence was not classified asdiscontinued operations. The gains on these disposals are reported under other operating income and expenses,net.
EUR million 2006 2007 2008Cash and cash equivalents 0 1 0Intangible assets - 0 1Property, plant and equipment 0 0 5Goodwill - - 1Other assets 7 8 5Liabilities sold -4 -3 -4Net assets of disposed businesses 3 6 8
Gain on disposal 10 4 4Total consideration 13 10 12
Consideration received in cash 13 10 12Cash and cash equivalents disposed of 0 -1 0Cash inflow on disposals 13 9 12
The business disposals were as follows:Year ended December 31,
61

NOTES TO CONSOLIDATED FINANCIAL STATEMENTS
12 Earnings per share
Earnings per share are calculated as follows:
Basic
Year ended December 31,2006 2007 2008
Profit attributable to equity shareholders, EUR million 409 381 389
Weighted average number of shares issued and outstanding (in thousands) 141,581 141,460 141,595
Basic earnings per share, EUR 2.89 2.69 2.75
Diluted
Year ended December 31,2006 2007 2008
Profit attributable to equity shareholders, EUR million 409 381 389
Weighted average number of shares issued and outstanding (in thousands) 141,581 141,460 141,595Adjustment for share options (in thousands) 19 - -Weighted average number of diluted shares issued and outstanding(in thousands) 141,600 141,460 141,595
Diluted earnings per share, EUR 2.89 2.69 2.75
The diluted earnings per share have been calculated by applying the “treasury stock” method, under whichearnings per share data is calculated as if the warrants and options were exercised at the beginning of the period,or on the issuance of warrants and options, if that occurs later during the period, and as if the funds obtainedthereby were used to purchase ordinary shares at the average market price during the period. In addition to theweighted average number of shares outstanding, the denominator includes the incremental shares obtainedthrough the assumed exercise of the warrants and options. The warrants and options have a dilutive effect onlywhen the average market price of the ordinary shares during the period exceeds the exercise price of the warrantsand options.
Basic earnings per share are calculated by dividing the profit attributable to equity shareholders of the ParentCompany by the weighted average number of ordinary shares in issue during the year, excluding own shares.
62

NOTES TO CONSOLIDATED FINANCIAL STATEMENTS
13 Intangible assets and property, plant and equipment
EUR million Goodwill
Patentsand
licencesCapitalized
software
Otherintangible
assets
Intangibleassets
total2007
Acquisition cost at beginning of year 768 69 48 251 1,136Translation differences -9 -1 0 -1 -11Business acquisitions 13 0 - 16 29Disposals of businesses - -1 - -1 -2Capital expenditure - 3 2 18 23Reclassifications - 4 3 -7 0Decreases - -3 -1 -7 -11
Acquisition cost at end of year 772 71 52 269 1,164
Accumulated depreciation and amortizationat beginning of year - -34 -22 -38 -94Translation differences - 0 0 1 1Business acquisitions - 0 0 0 0Disposals of businesses - 1 - 1 2Reclassifications - 0 0 0 0Decreases - 2 0 4 6Amortization charges for the year - -7 -6 -43 -56
Accumulated depreciation at end of year - -38 -28 -75 -141
Net book value at end of year 772 33 24 194 1,023
2008Acquisition cost at beginning of year 772 71 52 269 1,164Translation differences -8 0 -1 -9 -18Business acquisitions 17 - 0 12 29Disposals of businesses -1 -1 0 - -2Capital expenditure - 1 4 41 46Reclassifications -2 1 31 -30 0Decreases - -2 -1 -2 -5
Acquisition cost at end of year 778 70 85 281 1,214
Accumulated depreciation and amortizationat beginning of year - -38 -28 -75 -141Translation differences - 0 1 0 1Business acquisitions - 0 0 - 0Disposals of businesses - 0 0 - 0Reclassifications - 4 -9 5 0Decreases - 1 1 0 2Amortization charges for the year - -7 -9 -28 -44
Accumulated depreciation at end of year - -40 -44 -98 -182
Net book value at end of year 778 30 41 183 1,032
Metso participates in the European Emissions Tradings Scheme (EU ETS) and has been granted CO2 emissionrights of 93,839 units for the current compliance period of 2008-2012 against greenhouse gases emitted by itsproduction units. As of December 31, 2008, the remaining emission rights amounted to 75,068 units the marketvalue of which was roughly EUR 1 million. No value has been recognized in the balance sheet. In 2008, Metso sold3,000 units in excess.
63

NOTES TO CONSOLIDATED FINANCIAL STATEMENTS
EUR million
Land andwaterareas
Buildingsand
structures
Machineryand
equipment
Assetsunder
construction
Property,plant and
equipmenttotal
2007Acquisition cost at beginning of year 57 482 1,161 19 1,719Translation differences -1 -9 -15 0 -25Business acquisitions 0 1 7 - 8Disposals of businesses - - -2 0 -2Capital expenditure 1 16 57 62 136Reclassifications 0 8 23 -31 0Decreases -3 -9 -61 -1 -74
Acquisition cost at end of year 54 489 1,170 49 1,762
Accumulated depreciation and amortizationat beginning of year - -261 -843 - -1,104Translation differences - 4 11 - 15Business acquisitions - -1 -5 - -6Disposals of businesses - - 2 - 2Reclassifications - 0 0 - 0Decreases - 4 53 - 57Depreciation charges for the year - -19 -73 - -92
Accumulated depreciation at end of year - -273 -855 - -1,128
Net book value at end of year 54 216 315 49 634
2008Acquisition cost at beginning of year 54 489 1,170 49 1,762Translation differences -1 -9 -47 0 -57Business acquisitions 2 4 15 0 21Disposals of businesses 0 -2 -4 -1 -7Capital expenditure 4 24 105 76 209Reclassifications 0 22 39 -61 0Decreases -1 -6 -54 0 -61
Acquisition cost at end of year 58 522 1,224 63 1,867
Accumulated depreciation and amortizationat beginning of year - -273 -855 - -1,128Translation differences - 6 34 - 40Business acquisitions - 0 -8 - -8Disposals of businesses - 0 2 - 2Reclassifications - 0 0 - 0Decreases - 4 43 - 47Depreciation charges for the year - -20 -74 - -94
Accumulated depreciation at end of year - -283 -858 - -1,141
Net book value at end of year 58 239 366 63 726
For information on pledged assets, see note 28.
64

NOTES TO CONSOLIDATED FINANCIAL STATEMENTS
Intangible assets arising from fair value allocations relating to acquired businesses
EUR millionOrder
backlogTech-
nology Patents
Customerrelation-
ships Brands
Otherintan-gibles
Acquiredintangible
assetstotal
2007Acquisition cost at beginning of year 30 55 6 70 15 - 176Translation differences 0 0 0 -1 0 - -1Business acquisitions 2 4 - 8 1 1 16Decreases -24 - - - - - -24
Acquisition cost at end of year 8 59 6 77 16 1 167
Accumulated depreciation andamortization at beginning of year 0 0 -3 0 - - -3Translation differences 0 - - 0 - - 0Decreases 24 - - - - - 24Depreciation and amortizationcharges for the year -24 -7 -1 -6 - - -38
Accumulated depreciation at end of year 0 -7 -4 -6 - - -17
Net book value at end of year 8 52 2 71 16 1 150
A follow-up on all business combinations that Metso has recognized in accordance with IFRS 3 is presented in thetable below.
2008Acquisition cost at beginning of year 8 59 6 77 16 1 167Translation differences -1 -4 - -4 0 0 -9Business acquisitions 2 3 - 7 - - 12Decreases -6 - - - - - -6
Acquisition cost at end of year 3 58 6 80 16 1 164
Accumulated depreciation andamortization at beginning of year 0 -7 -4 -6 - - -17Translation differences - 0 - 0 - 0 0Decreases 6 - - - - - 6Depreciation and amortizationcharges for the year -8 -8 0 -8 - 0 -24
Accumulated depreciation at end of year -2 -15 -4 -14 - 0 -35
Net book value at end of year 1 43 2 66 16 1 129
Other intangible assets with indefinite useful life, i.e. brands, amounted to EUR 16 million for the years endedDecember 31, 2007 and 2008. They relate to Mining and Construction Technology as well as Energy andEnvironmental Technology segments, and have been recognized in connection with business acquisitions.Economic useful life could not to be determined at the time of the acquisition, and the management has assessedthem to have indefinite useful lives based on their continuous competitive advantage to the business. The brandsare actively used in promoting the products. They are subject to annual impairment test concurrently with that of thegoodwill.
For the year ended December 31, 2008 the amortization expense related to the intangible assets recognizedthrough business acquisitions was EUR 24 million. The future amortization expense is expected to amount to EUR18, EUR 17, EUR 16, EUR 13 and EUR 12 million for the years 2009, 2010, 2011, 2012 and 2013, respectively.
65

NOTES TO CONSOLIDATED FINANCIAL STATEMENTS
EUR million
Buildingsand
structures
Machineryand
equipment
Property,plant and
equipmenttotal
2007Acquisition cost at end of year 27 8 35Accumulated depreciation at end of year -13 -5 -18Net book value at end of year 14 3 17
2008Acquisition cost at end of year 27 6 33Accumulated depreciation at end of year -14 -5 -19Net book value at end of year 13 1 14
Capitalization of interest expenses
EUR million 2007 2008Net capitalized interest at beginning of year 1 1Capitalization of interest expenses - 0Amortization of capitalized interest expense 0 0Net capitalized interest at end of year 1 1
Assets leased under financial lease arrangements are included in property, plant and equipmentas follows:
66

NOTES TO CONSOLIDATED FINANCIAL STATEMENTS
Goodwill impairment
A summary of changes in Metso's goodwill by reporting segment is as follows:
EUR million
Derived weightedaverage cost
of capital applied
Balance atbeginning
of year
Translationdifferences
and otherchanges
Impairmentloss
Balanceat end
of year2007Mining and Construction Technology 10.6% 392 -36 - 356Energy and Environmental Technology 10.5 - 11.4% 226 41 - 267Paper and Fiber Technology 10.4 - 10.6% 150 -1 - 149Total 10.4 - 11.4% 768 4 - 772
2008Mining and Construction Technology 11.2 - 11.3% 356 1 - 357Energy and Environmental Technology 10.9 - 11.3% 267 13 - 280Paper and Fiber Technology 11.2 - 11.4% 149 -8 - 141Total 10.9 - 11.4% 772 6 - 778
As a result of the annual impairment tests, no impairment losses were recognized in 2007 and 2008. Due to theunexpected weakening of the market prospects in the last quarter of 2008, Metso performed additional tests inDecember to ensure the carrying values of certain cash generating units. These tests were based on newprojections with reduced future demand and weakened forecasted performance including analysis of break evenlevels in future performance, and did not indicate a need for recognizing impairment losses.
Metso assesses the value of the goodwill for impairment annually or more frequently, if facts and circumstancesindicate the need, using fair value measurement techniques, such as the discounted cash flow methodology. Thetesting is performed on the cash generating unit level. The recoverable amount of a cash generating unit is basedon value-in-use calculations. In the discounted cash flow method, Metso discounts forecasted performance plans totheir present value.
The sensitivity to impairment of each cash generating unit is tested by applying a change both in the discount andterminal growth rate. The latter is assumed to drop from 1.7% to 1.2% and the former to increase by roughly 25%.
The performance plans, which include four years of projection, are calculated in the annual strategy process andsubsequently approved by Metso's management and the Board of Directors. In addition to the projection period, thediscounted cash flows include an additional year, which is extrapolated from the average performance of theprojection period adjusted for cyclicality of each cash generating unit. The growth rate reflecting the long-termaverage growth rate of businesses subject to testing, was determined to be 1.7% in 2006, 2007 and 2008. Theforecasted sales and production volumes are based on current structure and existing property, plant and equipmentof Metso. The most significant assumptions are the market and product mix. Values assigned to key assumptionsreflect past experience. Data on growth, demand and price development provided by various research institutionsare utilized in establishing the assumptions for the projection period.
67

NOTES TO CONSOLIDATED FINANCIAL STATEMENTS
14 Investments in associated companies
EUR million 2007 2008Investments in associated companies and joint ventures
Acquisition cost at beginning of year 6 6Translation differences 0 0Increases 0 -Disposals and other decreases 0 -3
Acquisition cost at end of year 6 3
Equity adjustments in investments in associated companies and joint venturesEquity adjustments at beginning of year 13 13Share of results 3 3Translation differences -1 0Dividend income -1 -2Disposals and other changes -1 -3
Equity adjustments at end of year 13 11
Carrying value of investments in associatedcompanies and joint ventures at end of year 19 14
As at December 31,
Owner- Carrying Owner- CarryingEUR million ship value ship valueAllimand S.A. 35.8% 5 35.8% 5Valmet-Xi'an Paper Machinery Co. Ltd. 48.3% 6 75.0% -Shanghai Neles-Jamesbury Valve Co. Ltd 50.0% 5 50.0% 6Others 3 3Total investments in associated companiesand joint ventures 19 14
EUR million 2006 2007 2008Assets 50 52 37Liabilities 31 33 22
Net sales 40 55 51Profit 1 3 3
Related party transactions
EUR million 2006 2007 2008Net sales 1 4 2Purchases 19 13 7
Receivables 1 2 3Payables 1 1 0
Year ended December 31,
2007
The amounts representing Metso's share of the assets and liabilities, net sales and results of the associatedcompanies and joint ventures, which have been accounted for using the equity method are presented below:
The following transactions were carried out with associated companies and joint ventures and the followingbalances have arisen from such transactions:
2008
Shanghai Neles-Jamesbury Valve Co. Ltd is classified as joint venture because Metso has, together with theother shareholder, joint power to govern the company.
In September 2008, Metso increased its ownership in Valmet-Xi'an Paper Machinery Co. Ltd to 75 percent andthe company was consolidated into Metso's balance sheet as a subsidiary.
Year ended December 31,
68

NOTES TO CONSOLIDATED FINANCIAL STATEMENTS
15 Available-for-sale equity investments
Number Owner- Carrying Number Owner- CarryingEUR million (except for number of shares) of shares ship value of shares ship valueTamfelt Corporation 726,300 2.6% 8 726,300 2.6% 5Talvivaara Mining Company Ltd. 7,616,535 3.4% 31 7,116,535 3.2% 9Other shares and securities 6 4Total available-for-sale equity investments 45 18
The available-for-sale equity investments have changed as follows:
EUR million 2007 2008Carrying value at beginning of year 15 45Additions 0 1Changes in fair values 38 -24Disposals -8 -4Carrying value at end of year 45 18
16 Percentage of completion
Cost and earnings Billingsof uncompleted of
EUR million projects projects Net2007Projects where cost and earnings exceed billings 1,514 1,140 374Projects where billings exceed cost and earnings 1,125 1,456 331
2008Projects where cost and earnings exceed billings 1,754 1,392 362Projects where billings exceed cost and earnings 968 1,291 323
2007 2008As at December 31,
Net sales recognized under the percentage of completion method amounted to EUR 2,362 million, or 38 percentof net sales, in 2007 and EUR 2,280 million, or 36 percent of net sales, in 2008. The percentage was highest inthe Paper and Fiber Technology segment, where it accounted for 55 percent in 2007 and 51 percent in 2008.
Information on balance sheet items of uncompleted projects at December 31, 2007 and 2008 is as follows:
69

NOTES TO CONSOLIDATED FINANCIAL STATEMENTS
17 Inventory
As at December 31,EUR million 2007 2008Materials and supplies 294 361Work in process 680 706Finished products 436 539Total inventory 1,410 1,606
Provision for inventory obsolescence has changed as follows:
As at December 31,EUR million 2007 2008Balance at beginning of year 54 57Impact of exchange rates -2 -3Additions charged to expense 12 14Increase from business acquisitions 0 3Realized reserve -4 -3Deductions / other additions -3 -1Balance at end of year 57 67
For additional information on provisions, see also note 3.
The cost of inventories recognized as expense was EUR 4,611 million and EUR 4,652million for the years ended December 31, 2007 and 2008, respectively.
70

NOTES TO CONSOLIDATED FINANCIAL STATEMENTS
18 Interest bearing and non-interest bearing receivables
As at December 31,2007 2008
EUR millionNon-
current Current TotalNon-
current Current TotalInterest bearing receivablesLoan receivables 4 2 6 7 2 9Available-for-sale financial investments 5 0 5 5 - 5Trade receivables 1 - 1 1 7 8Total 10 2 12 13 9 22
Non-interest bearing receivablesLoan receivables 0 1 1 0 3 3Trade receivables 1 998 999 1 930 931Prepaid expenses and accrued income - 109 109 - 71 71Other receivables 18 148 166 25 142 167Total 19 1,256 1,275 26 1,146 1,172
Provision for doubtful notes and receivables has changed as follows:As at December 31,
EUR million 2007 2008Balance at beginning of year 35 36Impact of exchange rates -1 -2Additions charged to expense 13 16Increase from business acquisitions 0 0Realized reserve -5 -6Deductions / other additions -6 -4Balance at end of year 36 40
For additional information on provisions, see also note 3.
Analysis of non-interest bearing trade receivables by age:As at December 31,
EUR million 2007 2008Trade receivables, not due at reporting date 705 632Trade receivables 1-30 days overdue 152 136Trade receivables 31-60 days overdue 60 66Trade receivables 61-90 days overdue 30 37Trade receivables 91-180 days overdue 23 35Trade receivables more than 180 days overdue 29 25Total 999 931
Metso actively manages its cash by investing in financial instruments with varying maturities. Instruments, suchas commercial papers, exceeding maturity of three months are classified as available-for-sale financialinvestments.
As of December 31, 2008, other non-interest bearing receivables comprised EUR 58 million of various federaland state tax receivables of Brazilian subsidiaries of which EUR 16 million of state tax receivables wereclassified as long-term. As of December 31, 2007, the Brazilian tax receivables amounted to EUR 58 million allof which were classified as short-term non-interest bearing.
71

NOTES TO CONSOLIDATED FINANCIAL STATEMENTS
19 Financial assets and liabilities
Financial assets and liabilities divided by categories were as follows as of December 31:
Financial assets/ Financialliabilities at fair Loans Available- liabilities
value through and for-sale measuredprofit and loss recei- financial at amor- Carrying Fair
EUR million and derivatives vables assets tized cost value value2007Non-current assetsAvailable-for-sale equity investments - - 45 - 45 45Loan receivables - 5 - - 5 5Available-for-sale financial investments - - 5 - 5 5Trade receivables - 2 - - 2 2Derivative financial instruments 3 - - - 3 3Other receivables - 17 - - 17 17Carrying value by category 3 24 50 - 77 77
Current assetsLoan receivables - 2 - - 2 2Available-for-sale financial investments - - 0 - 0 0Trade receivables - 998 - - 998 998Trade receivables - 998 - - 998 998Derivative financial instruments 18 - - - 18 18Other receivables - 258 - - 258 258Carrying value by category 18 1,258 0 - 1,276 1,276
Non-current liabilitiesBonds - - - 509 509 529Loans from financial institutions - - - 176 176 176Finance lease obligations - - - 12 12 12Other long-term debt - - - 3 3 3Derivative financial instruments 1 - - - 1 1Other liabilities - - - 1 1 1Carrying value by category 1 - - 701 702 722
Current liabilitiesCurrent portion of long-term debt - - - 22 22 22Loans from financial institutions - - - 82 82 82Other short-term debt - - - 15 15 15Trade payables - - - 856 856 856Derivative financial instruments 16 - - - 16 16Other liabilities - - - 435 435 435Carrying value by category 16 - - 1,410 1,426 1,426
72

NOTES TO CONSOLIDATED FINANCIAL STATEMENTS
Financial assets/ Financialliabilities at fair Loans Available- liabilities
value through and for-sale measuredprofit and loss recei- financial at amor- Carrying Fair
EUR million and derivatives vables assets tized cost value value2008Non-current assetsAvailable-for-sale equity investments - - 18 - 18 18Loan receivables - 7 - - 7 7Available-for-sale financial investments - - 5 - 5 5Trade receivables - 2 - - 2 2Derivative financial instruments - - - - - -Other receivables - 25 - - 25 25Carrying value by category - 34 23 - 57 57
Current assetsLoan receivables - 5 - - 5 5Available-for-sale financial investments - - - - - -Trade receivables - 937 - - 937 937Derivative financial instruments 48 - - - 48 48Other receivables - 213 - - 213 213Carrying value by category 48 1,155 - - 1,203 1,203
Non-current liabilitiesBonds - - - 710 710 747Loans from financial institutions - - - 368 368 376Finance lease obligations - - - 9 9 9Other long-term debt - - - 2 2 2Derivative financial instruments 8 - - - 8 8Other liabilities - - - 4 4 4Carrying value by category 8 - - 1,093 1,101 1,146
Current liabilitiesCurrent portion of long-term debt - - - 101 101 101Loans from financial institutions - - - 104 104 104Other short-term debt - - - 141 141 141Trade payables - - - 733 733 733Derivative financial instruments 82 - - - 82 82Other liabilities - - - 456 456 456Carrying value by category 82 - - 1,535 1,617 1,617
For more information on derivative financial instruments, see note 30.
20 Cash and cash equivalents
As at December 31,EUR million 2007 2008Bank and cash 199 146Commercial papers and other investments 68 168Total cash and cash equivalents 267 314
73

NOTES TO CONSOLIDATED FINANCIAL STATEMENTS
21 Equity
Share capital and number of shares
2007 2008Number of outstanding shares, January 1 141,358,773 141,487,234
Share options exercised 1) 35,000 -Own shares sold by partnership (MEO1V Incentive Ky) - 70,949Shares granted from share ownership plans 93,461 65,459
Number of outstanding shares, December 31 141,487,234 141,623,642Treasury shares held by the Parent Company 60,841 60,841Shares administered by partnership (MEO1V Incentive Ky) 206,539 70,131
Total number of shares, December 31 141,754,614 141,754,614
Dividends
Fair value and other reserves
Fair value reserve includes the change in fair values of assets classified as available-for-sale. Shareoptions and shares granted are presented in fair value reserve.
Other reserves consist of a distributable fund held by the Parent Company.
Metso Corporation's registered share capital, which is fully paid, was EUR 240,982,843.80 as atDecember 31, 2007 and 2008, respectively.
Legal reserve consists of restricted equity, which has been transferred from distributable funds under theArticles of Association, local company act or by a decision of the shareholders.
Hedge reserve includes the fair value movements of derivative financial instruments which qualify ascash flow hedges.
Metso has outsourced the administration of the share ownership plan 2006-2008 to a partnership(MEO1V Incentive Ky) consolidated in Metso's financial statements. As of December 31, 2008, theacquisition price of 60,841 treasury shares acquired in 1999 and currently held by the Parent Companyamounted to EUR 654,813. The acquisition price of 70,131 own shares acquired in 2006 and held by thepartnership was EUR 2,585,818. The acquisition price of own shares is recognized in the treasury stock.
Metso Corporation's Board of Directors proposes to the Annual General Meeting to be held on March 31,2009 that a dividend of EUR 0.70 per share be distributed for the year ended December 31, 2008. Thesefinancial statements do not reflect this dividend payable of EUR 99 million. The Board is furtherproposing the Annual General Meeting to authorize the Board to pay at its discretion an additionaldividend later in the year 2009 in the amount not exceeding EUR 0.68 per share, should Metso's financialposition support the distribution of such additional dividend. The 70,131 shares held by MEO1V IncentiveKy are also entitled to dividend.
1) Shares subscribed with Metso's 2003A stock options, the subscription price was EUR 8.70 per shareand as a result of these share subscriptions, Metso's share capital increased by EUR 59,500.
Metso's Annual General Meeting on April 2, 2008 decided to decrease the share premium reserve andthe legal reserve. The decreased amounts were transferred to the invested non-restricted equity fund asof August 7, 2008.
74

NOTES TO CONSOLIDATED FINANCIAL STATEMENTS
Changes in fair value and other reserves:Fair
Treasury Hedge value Legal OtherEUR million stock reserve reserve reserve reserves TotalBalance as of December 31, 2005 -1 -7 2 228 202 424
Cash flow hedgesFair value gains (+) / losses (-), net of taxes - 24 - - - 24Transferred to profit and loss, net of taxes
Net sales - -8 - - - -8Available-for-sale equity investments
Fair value gains (+) / losses (-), net of taxes - - 2 - - 2Transferred to profit and loss, net of taxes - - -1 - - -1
Redemption of own shares -11 - - - - -11Share-based payments, net of taxes - - 1 - - 1Other - - - 1 - 1Balance as of December 31, 2006 -12 9 4 229 202 432
Cash flow hedgesFair value gains (+) / losses (-), net of taxes - 4 - - - 4Transferred to profit and loss, net of taxes
Net sales - -8 - - - -8Cost of goods sold / Administrative expenses - 2 - - - 2
Available-for-sale equity investmentsFair value gains (+) / losses (-), net of taxes - - 28 - - 28Transferred to profit and loss, net of taxes - - -6 - - -6
Share-based payments, net of taxes 4 - 1 - - 5Other - - - 7 -8 -1Balance as of December 31, 2007 -8 7 27 236 194 456
Cash flow hedgesFair value gains (+) / losses (-), net of taxes - -42 - - - -42Transferred to profit and loss, net of taxes
Net sales - 10 - - - 10Cost of goods sold / Administrative expenses - -1 - - - -1
Available-for-sale equity investmentsFair value gains (+) / losses (-), net of taxes - - -17 - - -17Transferred to profit and loss, net of taxes - - -2 - - -2
Share-based payments, net of taxes 3 - 1 - - 4Decrease and transfer of share premiumand legal reserve - - - -215 292 77Other 2 - - 3 - 5Balance as of December 31, 2008 -3 -26 9 24 486 490
Foreign currency translation included in the shareholders' equity:
EUR million 2006 2007 2008Cumulative translation adjustment as of January 1 -9 -45 -76Currency translation on subsidiary net investments -59 -29 -49Hedging of net investment denominated in foreign currency 28 -5 -15Tax effect -6 3 4Transfer of translation differences 1 - -Cumulative translation adjustment as of December 31 -45 -76 -136
75

NOTES TO CONSOLIDATED FINANCIAL STATEMENTS
22 Share-based payments
Share ownership plan 2006-2008
MetsoExecutive
Team Shares
Otherbenefi-ciaries Shares
Benefi-ciaries
totalShares
totalPlan 2006
Granted 7 25,815 53 74,146 60 99,961Returned during 2007 -4 -6,500 -4 -6,500Returned during 2008 -4 -4,500 -4 -4,500Returning during 2009 - -2,004 - -2,004
At end of year 7 25,815 45 61,142 52 86,957
Plan 2007Granted 7 15,763 83 55,186 90 70,949Returned during 2008 -4 -990 -4 -990Returning during 2009 - -2,302 - -2,302
At end of year 7 15,763 79 51,894 86 67,657
Plan 2008Maximum to be granted 7 27,500 91 102,500 98 130,000
Total at the end of year 69,078 215,536 284,614
The equity-settled portion for the earnings period 2006 is recognized over the vesting period i.e. from2006 until March 2010 based on the average share price on the grant dates of EUR 29.71. The finalamount of the granted shares was based on the average share price during the first two full weeks ofMarch 2007. If the share price exceeded the maximum, the number of shares awarded would have beenreduced by a corresponding ratio. The maximum share price determined for the plan was EUR 38. Theaverage price for the Metso share was EUR 37.66 during the two full weeks of March 2007.
The equity-settled portion for the earnings period 2007 is recognized over the vesting period i.e. from2007 until March 2011 based on the average share price on the grant dates of EUR 39.94. The finalamount of the granted shares was based on the average share price during the first two full weeks ofMarch 2008. If the share price exceeded the maximum, the number of shares awarded would have beenreduced by a corresponding ratio. The maximum share price determined for the plan was EUR 48. Theaverage price for the Metso share was EUR 31.49 during the two full weeks of March 2008.
Beneficiaries and granted shares of the share ownership plan as at December 31, 2008:
Share ownership plan during earnings period 2007
Share ownership plan during earnings period 2008
The Board of Directors of Metso decided in December 2005 upon a share ownership plan for the 2006-2008 strategy period. The share ownership plan is part of the remuneration and commitment program ofthe management and covers a maximum of 360,000 own shares. The share ownership plan covers threeearnings periods i.e. calendar years 2006, 2007 and 2008. The incentives consist of both shares andcash. The cash-settled portion is dedicated to cover taxes and tax-related payments of the beneficiaries.The main earnings triggers are the operating profit targets and four years of service subsequent to grantdate. The operating profit targets and potential personal earnings triggers are set separately for each year.
A maximum share price is determined annually for the share ownership plan.
The equity-settled portion for the earnings period 2008 is recognized over the vesting period i.e. from2008 until March 2012 based on the average share price on the grant dates of EUR 32.36. The maximumreward under the plan is limited to each participant's annual salary, calculated by multiplying 12.5 timesthe participant's taxable monthly base salary payable in the month when the shares are received.
Share ownership plan during earnings period 2006
76

NOTES TO CONSOLIDATED FINANCIAL STATEMENTS
EUR thousand Plan 2006 Plan 2007 Plan 2008 Total2006
Metso Executive Team -1,365 - - -1,365Other beneficiaries -3,466 - - -3,466Total -4,831 - - -4,831
2007Metso Executive Team -187 -685 - -872Other beneficiaries -182 -2,059 - -2,241Total -369 -2,744 - -3,113
2008Metso Executive Team -161 -258 -128 -547Other beneficiaries -406 -575 -300 -1,281Total -567 -833 -428 -1,828
Total -5,767 -3,577 -428 -9,772
2003 options program
Average Amount Average Amountexercise price of exercise price of
EUR/share options EUR/share optionsBeginning of period 10.10 100,000 8.70 35,000
Granted - - - -Forfeited - - - -Exercised 8.70 -65,000 8.70 -35,000Expired - - - -
End of period 8.70 35,000 - -
Changes and average exercise prices related to the year 2003 options program are as follows:
As at December 31,2006 2007
Costs recognized for the share ownership plan:
The compensation expense for the shares, which is accounted for as equity-settled, is recognized as anemployee benefit expense with corresponding entry in equity. The cost of the equity-settled portion, whichwill be evenly recognized during the required service period, is based on the market price of Metso'sshare on the grant date. The compensation expense resulting from the cash-settled transaction isrecognized as an employee benefit expense with a corresponding entry in short-term liabilities. The cash-settled portion is fair valued at each balance sheet date based on the prevailing share price and accrueduntil the settlement date.
Subsequent to a decision by Metso's Board of Directors taken in August 2008, the remaining 100,000 year2003A options of the program were cancelled. Consequently, there are no options outstanding oravailable from any of Metso's option programs for subscription of shares in Metso Corporation.
President and CEO Jorma Eloranta was granted 100,000 year 2003A options in 2004. He sold 50,000options in 2006 and further 33,000 options in the beginning of following year. Eloranta subscribed Metsoshares with 15,000 options in 2006 and with 2,000 options in the beginning of 2007.
77

NOTES TO CONSOLIDATED FINANCIAL STATEMENTS
2004Share price, EUR 10.85Exercise price, EUR 10.65Volatility, % 39.93Risk-free interest rate, % 3.29Expected annual dividends, EUR -Expected life in years 5.17
23 Long-term debt
Long-term debt consists of the following at December 31:
EUR million 2007 2008 2007 2008Bonds 509 793 529 830Loans from financial institutions 195 383 195 391Finance lease obligations 15 12 15 12Other long-term debt 3 2 3 2
722 1,190 742 1,235Less current maturities 22 101 22 101Total 700 1,089 720 1,134
The fair values of long-term debt are equal to the present value of their future cash flows.
Bonds:
Nominal Effective Originalinterest rate interest rate loan
EUR million Dec. 31, 2008 Dec. 31, 2008 amount 2007 2008Public bond 2004-2011 5.125% 6.46% 274 262 265Private placements maturing 2009-2018 4.67 - 7.38% 529 247 528Bonds total 509 793Less current maturities - 83Bonds, long-term portion 509 710
Fair valuesCarrying values
Outstanding carrying valueat December 31,
Metso has a Euro Medium Term Note Program (EMTN) of EUR 1 billion, under which EUR 509 million and EUR 793million expressed in carrying value were outstanding at the end of 2007 and 2008, respectively. EUR 265 million ofthe outstanding amount were public bonds and EUR 528 million private placements. USD denominated bondregistered with the U.S. Securities and Exchange Commission which had an outstanding notional amount of USD109 million matured according to its terms in 2007.
Loans from financial institutions consist of bank borrowings with either fixed or variable interest rates. A major shareof loans is either EUR, USD or SEK denominated. The interest rates vary from 1.0% to 5.9%. The loans are payablefrom year 2009 to 2018.
Interest rates of the finance lease obligations vary from 4.0% to 5.0%.
Since 2006 Metso has had a revolving five-year loan facility of EUR 500 million with a syndicate of 14 banks. Thefacility was undrawn at the end of 2007 and 2008.
The volatility measured at the standard deviation of expected share price returns is based on statistical analysis ofdaily historical share prices over last five years.
The fair value of 2003A options granted in 2004 was EUR 4.47 each determined using the Black-Scholes valuationmodel. The variables applied in the Black-Scholes model were as follows:
78

Contractual maturities of interest bearing debt as at December 31, 2008 are as follows:
Loans from Finance Otherfinancial lease long-term
EUR million Bonds institutions obligations debt TotalRepayments 83 15 3 0 101Interests 44 16 0 0 60
Total 2009 127 31 3 0 161
Repayments 124 34 2 0 160Interests 39 15 0 0 54
Total 2010 163 49 2 0 214
Repayments 332 51 1 2 386Interests 33 14 0 0 47
Total 2011 365 65 1 2 433
Repayments 92 67 1 - 160Interests 13 11 0 - 24
Total 2012 105 78 1 - 184
Repayments - 66 2 - 68Interests 8 8 0 - 16
Total 2013 8 74 2 - 84
Repayments 162 150 3 - 315Interests 35 10 0 - 45
Later 197 160 3 - 360
The maturities of derivative financial instruments are presented in note 30.
24 Provisions
As at December 31,2007 2008
EUR millionNon-
current Current TotalNon-
current Current TotalWarranty and guarantee liabilities 15 178 193 16 162 178Accrued restructuring expenses 6 17 23 3 13 16Environmental and product liabilities 1 5 6 1 7 8Other provisions 15 22 37 16 36 52Total 37 222 259 36 218 254
79

NOTES TO CONSOLIDATED FINANCIAL STATEMENTS
The provisions, both non-current and current, have changed as follows during the financial year 2008:
Balance at Impact of Additions Reversal of Balancebeginning exchange charged to Realized reserve/ at end of
EUR million of year rates expense reserve other changes yearAccrued restructuring expenses 23 -1 9 -10 -5 16Environmental and product liabilities 6 0 4 -1 -1 8Total 29 -1 13 -11 -6 24
Accrued restructuring expenses
Environmental and product liabilities
Warranty and guarantee provisions
The provisions for warranty and guarantee liabilities have changed as follows:
As at December 31,EUR million 2007 2008Balance at beginning of year 194 193Impact of exchange rates -3 -8Increase for current year's deliveries 76 98Increase for previous years deliveries 28 23Increase from business acquisitions 0 2Realized reserve -69 -82Reversal of reserve / other changes -33 -48Balance at end of year 193 178
Metso issues various types of contractual product warranties under which it generally guarantees the performancelevels agreed in the sales contract, the performance of products delivered during the agreed warranty period andservices rendered for a certain period or term. The warranty liability is based on historical realized warranty costs fordeliveries of standard products and services. The usual warranty period is 12 months from the date of customeracceptance of the delivered equipment. For larger projects, the average warranty period is two years. For morecomplex contracts, including long-term projects, the warranty reserve is calculated contract by contract and updatedregularly to take into consideration any changes in the potential warranty liability.
Provisions, for which the expected settlement date exceeds one year from the moment of their recognition, arediscounted to their present value and adjusted in subsequent periods for the time effect.
The costs included in a provision for restructuring are those costs that are either incremental and incurred as a directresult of the formal plan approved and committed by management, or are the result of a continuing contractualobligation with no continuing economic benefit to Metso or a penalty incurred to cancel the contractual obligation.Provision also includes other costs incurred as a result of the plan, such as environmental liabilities and costs totransfer operations to new locations.
Metso accrues for losses associated with environmental remediation obligations when such losses are probable andreasonably estimable. The amounts of accruals are adjusted later as further information develops or circumstanceschange. As at December 31, 2008, environmental liabilities amounted to EUR 3 million. It included clean-up costs forsoil and water contamination at various sites in the Unites States previously operated by Mining and ConstructionTechnology and clean-up costs for groundwater contamination at a site in Belgium previously owned by MetsoPanelboard.
Metso is occasionally involved in product liability claims. As at December 31, 2008, provisions for product liabilitiesamounted to EUR 5 million.
80

NOTES TO CONSOLIDATED FINANCIAL STATEMENTS
25 Short-term debt
Other interest bearing short-term debt consists of the following at December 31:
EUR million 2007 2008Loans from financial institutions 82 104Finnish commercial paper financing 15 141Total 97 245
26 Trade and other payables
Trade and other payables consist of the following at December 31:
EUR million 2007 2008Trade payables 856 733Accrued interests 8 16Accrued personnel costs 191 173Accrued project costs 106 106Other 130 161Total 1,291 1,189
The weighted average interest rate applicable to short-term borrowing at December 31, 2007 and2008 was 3.3% and 5.3%, respectively. In 2009, interest amounting to EUR 10 million is expectedto be paid concurrently with respective principals on the short-term debt presented above.
In 2008, Metso terminated the short-term Euro Commercial Paper program of EUR 150 million andincreased the Finnish commercial paper program from EUR 300 million to EUR 500 million. Finnishcommercial papers worth EUR 15 million and EUR 141 million were outstanding as of December31, 2007 and 2008, respectively.
The maturities of payables rarely exceed six months. The maturities of trade payables are largelydetermined by local trade practices and individual agreements between Metso and its supplier.
Accrued project costs may be settled after six months depending on the issuance of the supplierinvoice when the costs arise from work performed by third parties.
The accrued personnel costs, which include holiday pay, are settled in accordance with local lawsand stipulations.
81

NOTES TO CONSOLIDATED FINANCIAL STATEMENTS
27 Post-employment benefit obligations
The amounts recognized as of December 31 in the balance sheet were following:
Pension benefits,Total TotalFinnish
Pension benefits,foreign loyment benefits
Other post-emp-
On January 1, 2008 Metso adopted IFRIC 14, ‘IAS 19 – The Limit on a Defined Benefit Asset, Minimum FundingRequirements and their Interaction’ providing guidance on recognition of minimum funding requirements andclarification on the criteria for recognition of an asset on future refunds or reductions in future contributions. Theadoption did not have any impact on the financial statements.
The companies within Metso have various pension schemes pursuant to local conditions and practices of thecountries in which they operate. Some of these programs are defined benefit schemes with retirement,healthcare, death, jubilee and termination income benefits. The benefits are generally a function of years ofemployment and salary with Metso. The schemes are mostly funded through payments to insurance companiesor to trustee-administered funds as determined by periodic actuarial calculations. Metso uses December 31 asmeasurement date for its defined benefit arrangements. The discount rates applied are based on yields availableon high quality (“AA” rated) corporate bonds. If such reference is not available, the rates are based ongovernment bond yields as of the balance sheet date. The terms of corporate and government bonds areconsistent with the currency and the estimated term of the pension obligations.
On January 1, 2007 Metso adopted the Amendment to IAS 19 'Actuarial Gains and Losses, Group Plans andDisclosures' permitting the recognition of all actuarial gains and losses in the period in which they occur outsidethe income statement directly in the shareholders' equity. The pension benefit cost for the year ended December31, 2006 is presented in accordance.
Total TotalEUR million 2007 2008 2007 2008 2007 2008 2007 2008Present value of funded obligations 9 11 272 245 - 0 281 256Fair value of plan assets -7 -8 -243 -202 - 0 -250 -210
2 3 29 43 - - 31 46Present value of unfunded obligations - - 107 103 36 36 143 139Unrecognized asset - - 2 4 - - 2 4Unrecognized past service cost 1 1 - - - - 1 1Net liability recognized 3 4 138 150 36 36 177 190
Amounts in the balance sheet:Liabilities 3 4 138 151 36 36 177 191Assets - - - -1 - - - -1Net liability recognized 3 4 138 150 36 36 177 190
Movements in the net liability recognized in the balance sheet were as follows:
EUR million 2007 2008 2007 2008Net liability at beginning of year 4 3 185 174Liability for new plans covered - - 9 -Acquisitions (+) and disposals (-) - - -1 4Net expense recognized in the income statement 0 2 11 11Employer contributions -1 -2 -22 -23
0 1 0 30Translation differences - - -8 -10Net liability at end of year 3 4 174 186
Foreign pension andother post-employment
benefits
Gain (+) / loss (-) recognized through Statementof Recognized Income and Expense
Finnish
Pension benefits,Finnish
foreign loyment benefits
82

NOTES TO CONSOLIDATED FINANCIAL STATEMENTS
The amounts recognized in the income statement were as follows:
EUR million 2006 2007 2008Service cost 1 1 1Interest cost 0 0 0Expected return on plan assets 0 0 0Amortization - Past service cost 0 0 2Gains (-) / losses (+) on immediate settlements 0 -1 -1Expense (+) / income (-) recognized in income statement 1 0 2
Actual return (+) / loss (-) on plan assets 0 0 1
EUR million 2006 2007 2008Service cost 5 6 5Interest cost 18 20 19Expected return on plan assets -15 -18 -16Amortization - Past service cost 0 0 -Gains (-) / losses (+) on immediate settlements 0 0 0Expense (+) / income (-) recognized in income statement 8 8 8
Pension benefits, foreign
Pension benefits, FinnishYear ended December 31,
Year ended December 31,
Expense (+) / income (-) recognized in income statement 8 8 8
Actual return (+) / loss (-) on plan assets 23 17 -26
EUR million 2006 2007 2008Service cost 1 1 1Interest cost 3 2 2Expected return on plan assets - - -Amortization - Past service cost - 0 -Gains (-) / losses (+) on immediate settlements - - -Expense (+) / income (-) recognized in income statement 4 3 3
Actual return (+) / loss (-) on plan assets - - -
Other post-employment benefitsYear ended December 31,
83

NOTES TO CONSOLIDATED FINANCIAL STATEMENTS
The amounts recognized in the Statement of Recognized Income and Expense (SORIE) were following:
Total TotalEUR million 2007 2008 2007 2008 2007 2008 2007 2008Experience gain (-) / loss (+) on assets 0 0 0 42 - - 0 42Actuarial gain (-) / loss (+) on liabilitiesdue to change in assumptions 0 -1 -1 -9 0 -2 -1 -12Actuarial gain (-) / loss (+) on liabilitiesdue to experience 0 2 2 -1 -1 -2 1 -1Loss as result of asset ceiling - - 0 2 - - 0 2Total gain (-) / loss (+) recognizedin the SORIE 0 1 1 34 -1 -4 0 31
The changes in the value of the defined benefit obligation were as follows:
Total TotalEUR million 2007 2008 2007 2008 2007 2008 2007 2008Defined benefit obligation atbeginning of year 9 9 381 379 41 36 431 424Service cost 1 1 6 5 1 1 8 7Interest cost 0 0 20 19 2 2 22 21Plan participant contributions - - 1 1 0 0 1 1Past service cost - 2 0 - 0 - 0 2Acquisitions (+) and disposals (-) - - -1 1 - 3 -1 4Adjustment to coverage 1) - - 11 - - - 11 -Actuarial gain (-) / loss (+) due tochange in assumptions 0 -1 -1 -9 0 -2 -1 -12Actuarial gain (-) / loss (+) due toexperience 0 2 2 -1 -1 -2 1 -1Settlements -1 -2 -1 -2 - - -2 -4Translation differences - - -20 -26 -4 0 -24 -26Benefits paid - - -19 -19 -3 -2 -22 -21Defined benefit obligation atend of year 9 11 379 348 36 36 424 395
Other post-emp-loyment benefits
Pension benefits,Finnish
Pension benefits,foreign
Pension benefits,Finnish
Pension benefits,foreign
Other post-emp-loyment benefits
Year ended December 31,
1) In the year ended December 31, 2007, includes EUR 4 million early retirement plans subsequent to theacquisition of Pulping business in Sweden and EUR 7 million of reclassification of existing plans in North America.
The cumulative amount of actuarial gains and losses recognized in the SORIE amounted to net loss of EUR 35million, EUR 35 million and EUR 66 million for the years ended December 31, 2006, 2007 and 2008, respectively.
In certain countries, companies are liable to pay a specific payroll tax on employee benefits, including definedbenefits. To the extent the changes in the benefit obligation arise from actuarial gains and losses, the relatedpayroll tax is also recognized in the Statement of Recognized Income and Expense. For the years ended December31, 2007 and 2008 the amount of payroll tax recognized through SORIE was a loss of EUR 1 million and of EUR 4million, respectively.
84

NOTES TO CONSOLIDATED FINANCIAL STATEMENTS
The changes in the fair value of the plan assets during the year were as follows:
Foreign pension and otherPension benefits, Finnish post-employment benefits
EUR million 2007 2008 2007 2008Fair value of assets at beginning of year 7 7 239 243Adjustments for new plans covered - - 2 -Settlements -1 -2 0 -2Acquisitions - - - 0Actual return on plan assets 0 1 17 -26Plan participant contributions - - 1 1Employer contributions 1 2 22 23Benefits paid - - -22 -21Translation differences - - -16 -16Fair value of assets at end of year 7 8 243 202
The major categories of plan assets as a percentage of total plan assets as at December 31 were as follows:
2007 2008Equity securities 42% 32%Bonds 53% 60%Other 5% 8%
Summarized information on pension liabilities and plan assets for the five periods is as follows:
EUR million 2004 2005 2006 2007 2008Present value of defined benefit obligations at December 31 354 428 431 424 395Fair value of plan assets at December 31 181 234 246 250 210Deficit 173 194 185 174 185Unrecognized asset 2 1 2 2 4Unrecognized past service cost - 2 2 1 1
The principal actuarial assumptions at December 31 (expressed as weighted averages):
2007 2008 2007 2008Benefit obligation: discount rate 5.00% 5.50% 5.58% 5.98%Benefit obligation: rate of compensation increase 4.81% 4.75% 3.79% 3.66%Benefit obligation: rate of pension increase 2.10% 2.10% 1.50% 1.54%Expense in income statement: discount rate 4.50% 5.00% 5.32% 5.58%Expense in income statement: rate of compensation increase 3.70% 4.81% 3.68% 3.79%Expense in income statement: expected return on plan assets 6.14% 5.82% 7.55% 7.43%Expense in income statement: rate of pension increase 2.10% 2.10% 1.30% 1.50%
The expected return on plan assets is set by reference to historical returns on each of the main asset classes,current market indicators such as long-term bond yields and the expected long-term strategic asset allocation ofeach plan.
Finnish Foreign
The expected contributions in 2009 shall amount to EUR 2 million to Finnish plans and EUR 15 million to foreignplans.
85

NOTES TO CONSOLIDATED FINANCIAL STATEMENTS
Finland Gompertz' model with Finnish TEL parametersGermany Heubeck RT 2005 GUnited Kingdom PXA92 year of birthCanada UP94 projected to 2010/2015United States of America RP2000 projected to 2015
28 Mortgages and contingent liabilities
Mortgages and contingent liabilities consist of the following at December 31:
EUR million 2007 2008On own behalf
Mortgages 11 5Pledged assets 0 0
On behalf of associated companiesGuarantees - -
On behalf of othersGuarantees 11 9
Other commitmentsRepurchase commitments 4 3Other contingencies 4 3
Total 30 20
The mortgages given as security for own commitments relate to industrial real estate and other companyassets. The mortgage amount on corporate debt has been calculated as the amount of correspondingloans. The nominal value of the mortgages at December 31, 2008 was EUR 11 million higher than theamount of the corresponding loans.
The repurchase commitments represent engagements whereby Metso agrees to purchase backequipment sold to customer. The conditions triggering the buy back obligation are specific to each salescontract. The amounts in the above table comprise the agreed value in full of each repurchasecommitment.
Metso Corporation has guaranteed obligations arising in the ordinary course of business of many of itssubsidiaries up to a maximum of EUR 1,301 million and EUR 1,271 million as of December 31, 2007 and2008, respectively.
The life expectancy of the participants is based on regularly updated mortality tables, which reflect the lifeexpectancy of the local population. The mortality tables used for the major defined benefit plans arefollowing:
An increase of one percentage point in the assumed health care cost trend would increase theaccumulated post-employment benefit obligation by EUR 2 million at December 31, 2008. It wouldincrease the sum of the service and interest cost by EUR 0.2 million for 2008. A decrease of onepercentage point in the assumed health care cost trend would decrease the accumulated post-employment benefit obligation by EUR 2 million at December 31, 2008. It would decrease the sum of theservice and interest cost by EUR 0.2 million for 2008. The health care cost trend is expected to fall to 5%over the next four years by 0.75 percentage point per annum.
86

NOTES TO CONSOLIDATED FINANCIAL STATEMENTS
29 Lease contracts
Operating leases Finance leasesEUR million 2007 2008 2007 2008
Not later than 1 year 45 46 4 4Later than 1 year and not later than 2 years 35 38 4 2Later than 2 years and not later than 3 years 24 21 2 2Later than 3 years and not later than 4 years 13 14 2 2Later than 4 year and not later than 5 years 8 10 2 2Later than 5 years 17 23 5 3
Total minimum lease payments 142 152 19 15Future financial expenses -4 -3
Total net present value of finance leases 15 12
EUR million 2007 2008Not later than 1 year 3 3Later than 1 year and not later than 2 years 3 2Later than 2 years and not later than 3 years 2 1Later than 3 years and not later than 4 years 2 1Later than 4 year and not later than 5 years 1 2Later than 5 years 4 3
Total net present value of finance leases 15 12
Metso leases offices, manufacturing and warehouse space under various noncancellable leases. Certaincontracts contain renewal options for various periods of time.
Minimum annual rentals for leases in effect at December 31 are shown in the table below:
Total rental expenses amounted to EUR 34 million, EUR 31 million and EUR 29 million in the years endedDecember 31, 2006, 2007 and 2008, respectively. Annual repayments of principal are presented in thematurities of long-term debt, see note 23.
Net present value of annual rentals for finance leases in effect at December 31 are shown in the table below:
87
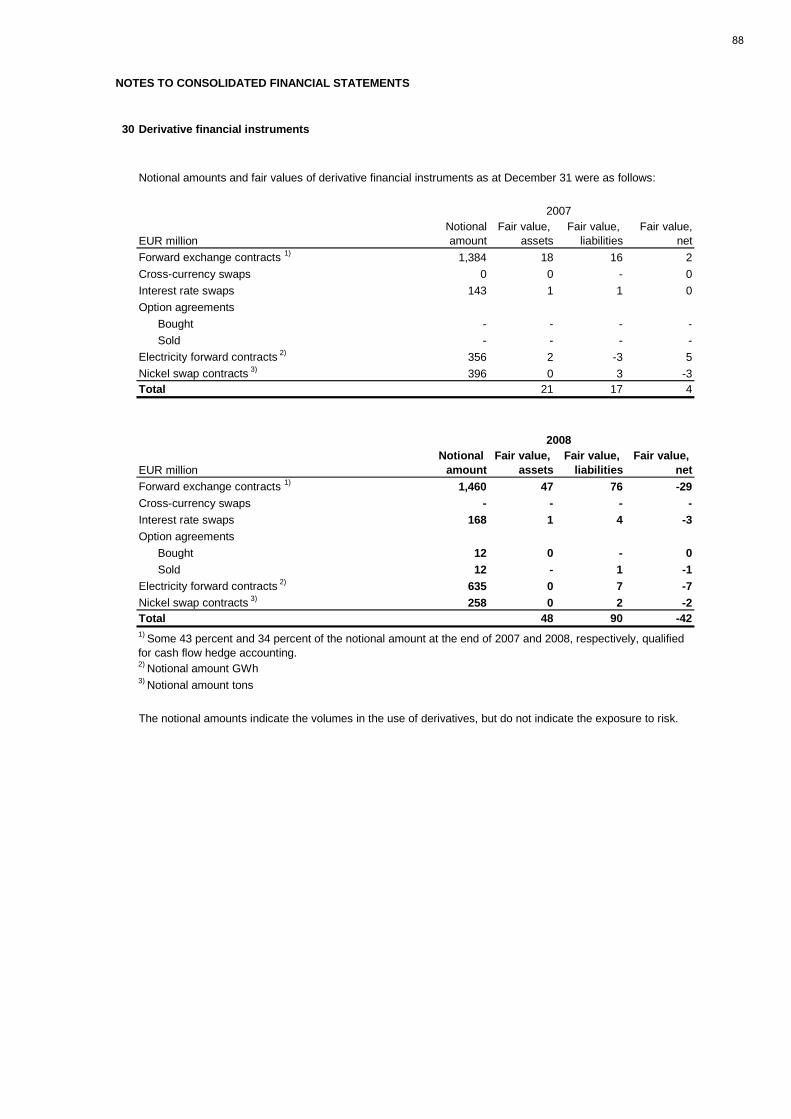
NOTES TO CONSOLIDATED FINANCIAL STATEMENTS
30 Derivative financial instruments
Notional amounts and fair values of derivative financial instruments as at December 31 were as follows:
EUR millionNotionalamount
Fair value,assets
Fair value,liabilities
Fair value,net
Forward exchange contracts 1) 1,384 18 16 2Cross-currency swaps 0 0 - 0Interest rate swaps 143 1 1 0Option agreements
Bought - - - -Sold - - - -
Electricity forward contracts 2) 356 2 -3 5Nickel swap contracts 3) 396 0 3 -3Total 21 17 4
EUR millionNotional
amountFair value,
assetsFair value,
liabilitiesFair value,
netForward exchange contracts 1) 1,460 47 76 -29Cross-currency swaps - - - -Interest rate swaps 168 1 4 -3Option agreements
Bought 12 0 - 0Sold 12 - 1 -1
Electricity forward contracts 2) 635 0 7 -7Nickel swap contracts 3) 258 0 2 -2Total 48 90 -42
2) Notional amount GWh3) Notional amount tons
The notional amounts indicate the volumes in the use of derivatives, but do not indicate the exposure to risk.
2007
2008
1) Some 43 percent and 34 percent of the notional amount at the end of 2007 and 2008, respectively, qualifiedfor cash flow hedge accounting.
88

NOTES TO CONSOLIDATED FINANCIAL STATEMENTS
Derivative financial instruments recognized in balance sheet as at December 31 are presented below:
EUR million Assets Liabilities Assets LiabilitiesInterest rate swaps - cash flow hedges 1 1 0 3Interest rate swaps - fair value hedges - - - -Interest rate swaps - non-qualifying hedges 0 0 1 1
1 1 1 4
Forward exchange contracts - cash flow hedges 7 7 11 38Forward exchange contracts - net investment hedges 6 3 0 4Forward exchange contracts - non-qualifying hedges 5 6 36 34
18 16 47 76
Electricity forward contracts - cash flow hedges 2 -3 0 7Nickel swaps - non-qualifying hedges - 3 0 2Cross-currency swaps - non-qualifying hedges 0 0 - -Options - non-qualifying hedges - - 0 1Total derivatives 21 17 48 90
EUR million 2009 2010 2011 20122013
and afterForward exchange contracts 1,359 79 22 - -Interest rate swaps 45 15 63 20 25Option agreements 0 - - - -Electricity forward contracts 1) 258 228 114 26 9Nickel swap contracts 2) 258 - - - -1) Notional amount GWh2) Notional amount tons
As at December 31, 2008, the maturities of financial derivatives are the following (expressed as notionalamounts):
20082007
In the years ended December 31, 2007 and 2008, respectively, there was no ineffectiveness related to thecash flow hedges, which would have resulted in an immediate recognition of an ineffective portion in theincome statement.
As at December 31, 2008, the fixed interest rates of swaps varied from 3.0 percent to 6.1 percent. The mainfloating rates were Euribor and Libor.
89

NOTES TO CONSOLIDATED FINANCIAL STATEMENTS
31 Principal subsidiaries
% of net salesMetso Paper Oy Finland 10.9Metso Minerals Industries Inc. USA 9.3Metso Minerals Oy Finland 5.9Metso Automation Oy Finland 4.6Metso Power Oy Finland 4.5Metso Minerals (France) SA France 4.3Metso Brazil Indústria e Comércio Ltda Brazil 3.9Metso Paper USA Inc. USA 3.3Metso Paper Valkeakoski Oy Finland 2.9Metso Minerals (Australia) Ltd Australia 2.9Metso Paper Sundsvall AB Sweden 2.8Metso Lindemann GmbH Germany 2.5Metso Automation USA Inc. USA 1.9Metso Power AB Sweden 1.9Metso Minerals Canada Inc. Canada 1.9Metso Minerals (South Africa) Pty. Ltd. South Africa 1.7Metso Paper Karlstad AB Sweden 1.6Metso Paper Japan Co. Ltd Japan 1.5Metso Paper Sulamericana Ltda Brazil 1.2Metso Minerals (Wear Protection) AB Sweden 1.2Metso Minerals (Sala) AB Sweden 1.1Metso Minerals (Sweden) AB Sweden 0.9Metso Minerals (Mexico) SA de CV Mexico 0.9Metso Fiber Karlstad AB Sweden 0.8Metso Paper Ltd. Canada 0.8Metso Automation S.A.S. France 0.8Valmet Automotive Oy Finland 0.8Metso Minerals (Norway) A/S Norway 0.8Metso Minerals (Tianjin) International Trade Co. Ltd. China 0.7Metso Automation Pte Ltd Singapore 0.7Metso Minerals (Austria) GmbH Germany 0.7Metso Minerals (Chile) SA Chile 0.7Metso Minerals (India) Private Ltd India 0.7Noviter Oy Finland 0.6Metso Minerals Espana SA Spain 0.6Metso Minerals (Hong Kong) Ltd Hong Kong 0.6Metso Automation (Shanghai) Co. Ltd China 0.6Metso Paper (China) Co. Ltd China 0.6Metso Minerals (UK) Ltd. United Kingdom 0.5Metso Panelboard AB Sweden 0.5Metso Endress+Hauser Oy Finland 0.5Metso Foundries Jyväskylä Oy Finland 0.5Metso Minerals (Peru) SA Peru 0.5Metso Minerals (Singapore) Pte Ltd Singapore 0.5Metso Minerals (Tianjin) Co. Ltd China 0.4Metso Minerals (Germany) GmbH Germany 0.4Metso Minerals Systems AB Sweden 0.4Metso Automation GmbH Germany 0.4Metso Automation KK Japan 0.4Metso Minerals (Belux) SA Netherlands 0.4Metso Paper France SAS France 0.3Metso Automation do Brasil Ltda Brazil 0.3Metso Minerals (Portugal) Lda Portugal 0.3Metso Panelboard Oy Finland 0.3Metso Minerals (Finland) Oy Finland 0.3Metso Minerals (Cappagh) Ltd. United Kingdom 0.3Metso Automation Mapag GmbH Germany 0.3Metso Paper (Thailand) Co. Ltd. Thailand 0.3Metso Minerals Japan Co. Ltd Japan 0.3Metso Paper Limited United Kingdom 0.3
The following is a list of Metso's principal subsidiaries ranked by net sales. These companies accounted for89 percent and 92 percent of total net sales for the years ended December 31, 2007 and 2008, respectively.
90
NOTES TO THE CONSOLIDATED FINANCIAL STAEMENTS
32 Reporting segment and geographic information
Corporate structure
Metso Group is a global supplier of sustainable technology and services for mining,construction, energy, metal recycling and the pulp and paper industries. Metso Groupcomprises three reporting segments: Mining and Construction Technology, Energy andEnvironmental Technology and Paper and Fiber Technology.
Metso’s businesses are global in scope with operations in over 50 countries. The main marketareas are Europe and North America, which account for over half of net sales. However, Asiaand South America are becoming increasingly important. Metso has production on allcontinents. The principal production plants are located in Finland, Sweden, France, Germany,Canada, the United States, China, India, South Africa and Brazil.As of December 1, 2008 the operations were organized into the following three reportingsegments:
Mining and Construction Technology is a leading global supplier of technology andservices for the mining and construction industries. Our customers work in quarrying,aggregates production, construction, civil engineering, mining and minerals processing. Theoperations are organized in two business lines: Mining and Construction.
Energy and Environmental Technology is one of the leading global suppliers in powergeneration, automation as well as metals recycling solutions and lifecycle services. Ourcustomers work in the power generation, oil and gas, metals recycling as well as pulp andpaper industries. Energy and Environmental Technology comprises three business lines:Power, Automation and Recycling.
Paper and Fiber Technology is a leading global supplier of processes, machinery,equipment and services for the pulp and paper industry. The offering extends over the entireprocess life-cycle, covering new lines, rebuilds and the services business. The segment isorganized in three business lines: Paper, Fiber and Tissue.
Metso acquired Aker Kvaerner’s Pulping and Power businesses as of December 29, 2006.Aker Kvaerner’s Pulping businesses were consolidated into Paper and Fiber Technologysegment’s and Power businesses into Energy and Environmental Technology segment’sbalance sheet. The acquisition had no effect on the 2006 income statement.
Group Head Office and other is comprised of the Parent Company and holding companieslocated in the United States and in Sweden as well as financial shared service centers inFinland, Sweden and in Canada. Valmet Automotive is reported as a separate holding unit.
Transfer pricing in intra-Metso transactions is primarily based on market prices. In some cases,cost-based prices are used, thereby including the margin (cost plus method).
The financial performance of the segments is measured through their ability to generateoperating profit and earnings before interest, tax and amortization (EBITA) both in absolutefigures and as percentage of net sales. Financial income and expenses, net, and income taxesare not allocated to segments but included in the profit (loss) of Group Head Office and other.The treasury activities of Metso are coordinated and managed by the Group Treasury in orderto utilize the cost efficiency benefits retained from pooling arrangements, financial riskmanagement, bargaining power, cash management, and other measures. Tax planning aims atthe minimization of Metso's overall tax cost and it is based on the legal structure and theutilization of holding company structure as applicable.
Segment assets comprise intangible assets, property, plant and equipment, investments inassociated companies, joint ventures, available-for-sale equity investments, inventories andnon-interest bearing operating assets and receivables. They exclude interest bearing assets,
91

NOTES TO THE CONSOLIDATED FINANCIAL STAEMENTS
including also cash and cash equivalents, income tax receivables and deferred tax assets,which are included in the assets of Group Head Office and other.
Segment liabilities comprise non-interest bearing operating liabilities and exclude income taxliabilities and deferred tax liabilities, which are included in the liabilities of Group Head Officeand other. Interest bearing liabilities are not allocated to segments, but included in the liabilitiesof Group Head Office and other.
Non-cash write-downs include write-offs made to the value of notes, receivables, andinventories and impairment and other write-offs recognized to reduce the value of intangibleassets, property, plant and equipment and other assets.
Gross capital expenditure comprises investments in intangible assets, property, plant andequipment, associated companies, joint ventures and available-for-sale equity investmentsincluding additions through business acquisitions.
Information about Metso’s reportable segments as of and for the years ended December 31,2006, 2007 and 2008 is presented in the following tables.
92

NOTES TO CONSOLIDATED FINANCIAL STATEMENTS
EUR million Min
ing
and
Con
-st
ruct
ion
Tech
nolo
gy
Ene
rgy
and
Envi
ron-
men
tal T
echn
olog
y
Pap
er a
nd F
iber
Tech
nolo
gy
Val
met
Aut
omot
ive
Gro
up H
ead
Offi
cean
d ot
her
Elim
inat
ions
Met
so to
tal
2006External net sales 1,936 811 2,089 109 10 - 4,955Intra-Metso net sales 9 70 3 - - -82 -Net sales 1,945 881 2,092 109 10 -82 4,955
Other operating income and expenses, net 16.3 0.1 -11.0 0.0 0.4 - 5.8Share in profits and losses ofassociated companies 0.2 0.8 1.7 - -1.8 - 0.9Operating profit (loss) 259.8 124.6 89.8 11.7 -28.7 - 457.2
% of net sales 13.4 14.1 4.3 10.7 n/a - 9.2EBITA 262.0 128.4 105.6 11.7 -26.6 - 481.1
% of net sales 13.5 14.6 5.0 10.7 n/a - 9.7
Amortization 2 5 9 0 2 - 18Depreciation 25 10 40 10 2 - 87Gross capital expenditure (includingbusiness acquisitions) 69 211 125 2 1 - 408Non-cash write-downs 13 0 15 0 1 - 29
Intangible assets and property,plant and equipment 562 451 551 55 38 - 1,657Investments in associated companies 1 6 12 - 0 - 19Available-for-sale equity investments 2 1 1 0 11 - 15Inventories and other non-interestbearing assets 1,082 530 1,050 9 -8 - 2,663Interest bearing assets - - - - 376 - 376Deferred tax assets - - - - 238 - 238Total assets 1,647 988 1,614 64 655 - 4,968
Non-interest bearing liabilities 758 580 1,197 41 55 - 2,631Interest bearing debt - - - - 830 - 830Deferred tax liability - - - - 57 - 57Total liabilities 758 580 1,197 41 942 - 3,518
Capital employed 889 408 417 23 543 - 2,280
Orders received 2,399 980 2,276 109 15 -74 5,705Order backlog 1,099 1,079 1,600 - - -41 3,737
93

NOTES TO CONSOLIDATED FINANCIAL STATEMENTS
EUR million Min
ing
and
Con
-st
ruct
ion
Tech
nolo
gy
Ene
rgy
and
Envi
ron-
men
tal T
echn
olog
y
Pap
er a
nd F
iber
Tech
nolo
gy
Val
met
Aut
omot
ive
Gro
up H
ead
Offi
cean
d ot
her
Elim
inat
ions
Met
so to
tal
2007External net sales 2,317 1,490 2,358 85 - - 6,250Intra-Metso net sales 13 53 6 - - -72 -Net sales 2,330 1,543 2,364 85 - -72 6,250
Other operating income and expenses, net 8.1 0.9 -10.4 0.0 2.5 - 1.1Share in profits and losses ofassociated companies 0.3 1.7 0.8 - - - 2.8Operating profit (loss) 319.8 150.3 128.2 8.0 -26.5 - 579.8
% of net sales 13.7 9.7 5.4 9.4 n/a - 9.3EBITA 323.0 182.4 146.6 8.1 -24.7 - 635.4
% of net sales 13.9 11.8 6.2 9.5 n/a - 10.2
Amortization 3 32 19 0 2 - 56Depreciation 27 13 41 9 2 - 92Gross capital expenditure (includingbusiness acquisitions) 50 63 91 4 6 - 214Non-cash write-downs 8 3 13 0 0 - 24
Intangible assets and property,plant and equipment 574 440 555 50 38 - 1,657Investments in associated companies 1 6 12 - - - 19Available-for-sale equity investments 2 1 1 - 41 - 45Inventories and other non-interestbearing assets 1,346 641 1,097 4 22 - 3,110Interest bearing assets - - - - 279 - 279Deferred tax assets - - - - 144 - 144Total assets 1,923 1,088 1,665 54 524 - 5,254
Non-interest bearing liabilities 919 556 1,207 33 64 - 2,779Interest bearing debt - - - - 819 - 819Deferred tax liability - - - - 41 - 41Total liabilities 919 556 1,207 33 924 - 3,639
Capital employed 1,004 532 458 21 419 - 2,434
Orders received 2,776 1,884 2,293 85 - -73 6,965Order backlog 1,496 1,337 1,553 - - -45 4,341
94

NOTES TO CONSOLIDATED FINANCIAL STATEMENTS
EUR million Min
ing
and
Con
-st
ruct
ion
Tech
nolo
gy
Ene
rgy
and
Envi
ron-
men
tal T
echn
olog
y
Pap
er a
nd F
iber
Tech
nolo
gy
Val
met
Aut
omot
ive
Gro
up H
ead
Offi
cean
d ot
her
Elim
inat
ions
Met
so to
tal
2008External net sales 2,565 1,731 2,039 65 - - 6,400Intra-Metso net sales 21 44 5 - - -70 -Net sales 2,586 1,775 2,044 65 - -70 6,400
Other operating income and expenses, net 3.9 -1.2 2.7 0.0 5.2 - 10.6Share in profits and losses ofassociated companies 0.1 1.2 1.2 - - - 2.5Operating profit (loss) 358.4 176.0 130.1 -3.5 -23.8 - 637.2
% of net sales 13.9 9.9 6.4 -5.4 n/a - 10.0EBITA 361.2 198.3 146.1 -3.5 -21.2 - 680.9
% of net sales 14.0 11.2 7.1 -5.4 n/a - 10.6
Amortization 3 22 16 0 3 - 44Depreciation 31 15 39 8 1 - 94Gross capital expenditure (includingbusiness acquisitions) 121 80 90 3 5 - 299Non-cash write-downs 17 3 10 0 1 - 31
Intangible assets and property,plant and equipment 637 494 566 45 16 - 1,758Investments in associated companies 1 7 6 - 0 - 14Available-for-sale equity investments 2 1 1 0 14 - 18Inventories and other non-interestbearing assets 1,530 706 893 8 74 - 3,211Interest bearing assets - - - - 336 - 336Deferred tax assets - - - - 174 - 174Total assets 2,170 1,208 1,466 53 614 - 5,511
Non-interest bearing liabilities 940 561 935 31 111 - 2,578Interest bearing debt - - - - 1,435 - 1,435Deferred tax liability - - - - 45 - 45Total liabilities 940 561 935 31 1,591 - 4,058
Capital employed 1,230 647 531 22 458 - 2,888
Orders received 2,709 1,658 2,021 65 - -69 6,384Order backlog 1,492 1,204 1,434 - - -42 4,088
95

NOTES TO CONSOLIDATED FINANCIAL STATEMENTS
Net sales to unaffiliated customers by destination:
Other Other South andNordic European North Central Asia- Rest of Elimi- Metso
EUR million Finland countries countries America America Pacific the world nations total2006 341 283 1,378 1,012 685 991 265 - 4,9552007 473 517 1,561 1,049 859 1,488 303 - 6,2502008 461 467 1,752 1,015 770 1,516 419 - 6,400
Other Other South andNordic European North Central Asia- Rest of
EUR million countries countries America America Pacific the world Total2006 148 738 144 123 470 51 1,6742007 209 775 144 97 792 40 2,0572008 172 931 107 121 745 85 2,161
Intangible assets and property, plant and equipment by location:
Other Other South andNordic European North Central Asia- Rest of Elimi- Metso
EUR million Finland countries countries America America Pacific the World nations total2006 704 615 43 148 67 73 7 - 1,6572007 664 618 58 157 72 80 8 - 1,6572008 675 609 65 201 68 132 8 - 1,758
Gross capital expenditure (excluding business acquisitions) by location:
Other Other South andNordic European North Central Asia- Rest of Elimi- Metso
EUR million Finland countries countries America America Pacific the world nations total2006 65 9 15 15 17 8 2 - 1312007 82 14 14 16 14 17 2 - 1592008 91 23 19 56 16 47 3 - 255
### Audit feesYear ended December 31,
EUR million 2006 2007 2008Audit -5.2 -2.8 -2.7Tax consulting -1.7 -1.3 -1.8Other services -1.7 -1.3 -1.1Total -8.6 -5.4 -5.6
Metso's exports, including sales to unaffiliated customers and intra-group sales from Finland, bydestination:
96

NOTES TO THE CONSOLIDATED FINANCIAL STAEMENTS
34 Lawsuits and claims
Several lawsuits and claims based on various grounds, including product liability lawsuits andclaims in the United States as well as normal risks of legal disputes concerning deliveries, arepending against Metso in various countries. However, management does not believe that theoutcome of these actions, claims and disputes will have a material adverse effect on Metso inview of the grounds presented for the claims, provisions made, insurance coverage in force andthe extent of Metso’s total business activities. Metso is also a plaintiff in several lawsuits e.g. inthe cases purported to protect its intellectual property rights in the United States and Australia.
Pending asbestos litigation
As of December 31, 2008, there had been a total of 795 complaints alleging asbestos injuriesfiled in the United States in which a Metso entity is one of the named defendants. Where agiven plaintiff has named more than one viable Metso unit as a defendant, the cases arecounted by the number of viable Metso defendants. Of these claims, 261 are still pending and534 cases have been closed. Of the closed cases, 55 were by summary judgment, 369 weredismissed, and 110 were settled. The outcome of the pending cases is not expected tomaterially deviate from the outcome of the previous claims. Hence, management believes thatthe risk caused by the pending asbestos lawsuits and claims in the United States is not materialin view of the extent of Metso’s total business operations.
Subpoena from U.S. Department of Justice requiring Metso to produce documents
In November 2006, Metso Minerals Industries, Inc., which is Metso’s U.S. subsidiary, received asubpoena from the Antitrust Division of the United States Department of Justice calling forMetso Minerals Industries, Inc. to produce certain documents. The subpoena relates to aninvestigation of potential antitrust violations in the rock crushing and screening equipmentindustry. Metso is co-operating fully with the Department of Justice. Metso recognized aboutEUR 1 million in costs from the investigation for the year ended December 31, 2008 and has notmade any provision related to this investigation as at December 31, 2008.
35 New accounting standards
IFRS 8
In November 2006, IASB issued IFRS 8 ‘Operating Segments’ requiring the company to adopt a‘management approach’ to reporting on the financial performance of its operating segments.Thus, the information to be reported is the same management uses internally for evaluatingsegment performance.
Metso will apply the standard for the financial year beginning on January 1, 2009. The newstandard does not affect the reporting segment structure.
IAS 1 (Revised)
In September 2007, IASB published IAS 1 (Revised) ‘Presentation of Financial Statements’.The revised standard is aimed at improving users’ ability to analyze and compare theinformation provided in financial statements. It requires all non-owner changes in equity(comprehensive income) to be presented in one statement of comprehensive income or in twostatements, a separate income statement and a statement of comprehensive income. However,
97

NOTES TO THE CONSOLIDATED FINANCIAL STAEMENTS
components of total comprehensive income are not permitted to be presented separately in thestatement of changes in equity.
IAS 1 (revised) was endorsed by the European Union in December 2008. Metso adopted thestatement of comprehensive income or statement of recognized income and expenses in 2007when it began recognizing the actuarial gains and losses. The standard will be fully applied forthe financial year beginning on January 1, 2009.
IFRS 3 (Revised)
IASB has published IFRS 3 (Revised), ‘Business combinations’, which maintains therequirement to apply the acquisition method to business combinations, but with some significantchanges such as expensing of transaction costs. In addition, all payments to purchase abusiness are to be recorded at fair value on the acquisition date, with some contingentpayments subsequently remeasured at fair value through income. Goodwill may be calculatedbased on the parent’s share of net assets or it may include goodwill related to the minorityinterest. Metso is currently evaluating the effects on its financial statements but expects it toaffect only future business combinations.
IFRS 3 (Revised), still subject to endorsement by the European Union, becomes effective forannual financial statements for periods beginning on or after July 1, 2009.
Provided the revision receives endorsement by the European Union, Metso will apply thestandard for the financial year beginning on January 1, 2010.
IAS 23 (Amended)
IASB has published Amendment to IAS 23 ‘Borrowing Costs’, which requires an entity tocapitalize borrowing costs directly attributable to the acquisition, construction or production of aqualifying asset as part of the cost of that asset. A qualifying asset can be intended for its ownuse (self-constructed asset) or for sale. The option of immediately expensing these borrowingcosts will be removed.
IAS 23 (revised) was endorsed by the European Union in December 2008. Metso will apply thestandard for the financial year beginning on January 1, 2009. As Metso capitalizes interest costson self-constructed long-lived assets, the amendment does not impact Metso’s financialstatements.
IAS 27 (Revised)
IASB has published IAS 27 (Revised), ‘Consolidated and separate financial statements’. Therevised standard requires the effects of all transactions with non-controlling interests to berecorded in equity if there is no change in control. They will no longer result in goodwill or gainsand losses. The standard also specifies the accounting when control is lost. Any remaininginterest in the entity is remeasured to fair value and a gain or loss is expensed. Metso does notexpect the standard to affect its financial statements.
IAS 27 (Revised) is effective for annual financial statements for periods beginning on or afterJuly 1, 2009. The standard is still subject to endorsement by the European Union.
Provided the revision receives endorsement by the European Union, Metso will apply thestandard for the financial year beginning on January 1, 2010.
98

NOTES TO THE CONSOLIDATED FINANCIAL STAEMENTS
IFRS 2 (Amended)
IASB published in January 2008 an amendment to IFRS 2 ‘Share-based payments‘ clarifyingthe accounting of vesting conditions and cancellations. Vesting conditions are limited to serviceand performance conditions, other features are not vesting conditions and only impact the grantdate fair value. Cancellations whether by the Company or by other parties are accounted for insimilar way. Metso does not expect the amendment to affect its financial statements.
IFRS 2 (revised) was endorsed by the European Union in December 2008. Metso will apply thestandard for the financial year beginning on January 1, 2009.
IAS 39 (Amended)
In May 2008, as part of the annual Improvements to IFRSs project, IASB published anamendment to IAS 39 'Financial instruments: Recognition and measurement'. The amendmentclarifies among other things the classification of derivative instruments where there is a changein the hedge accounting, the definition of financial asset or financial liability at fair value throughprofit or loss and requires use of a revised effective interest rate to remeasure the carryingamount of a debt instrument on cessation of fair value hedge accounting. Metso does notexpect the amendment to affect its financial statements.
IAS 39 (amended) was endorsed by the European Union in January 2009. Metso will apply thestandard for the financial year beginning on January 1, 2009.
36 Events after balance sheet date
New corporate governance
The new corporate governance policy of Metso became effective on January 1, 2009. Theupdated policy takes into considerations the changes in Metso’s organizational structure andoperating model as well as the recommendations outlined in the Finnish Corporate GovernanceCode issued by the Finnish Securities Market Association.
Metso and Wärtsilä completed the joint venture transaction
In September 2008, Metso and Wärtsilä signed an agreement to combine Metso’s Heat &Power business and Wärtsilä’s Biopower business into a joint venture named MW Power Oy. Inaccordance with the agreement, the joint venture started operations in January 2009.
Metso owns 60 percent and Wärtsilä 40 percent of MW Power Oy. An order backlog of approx-imately EUR 116 million was transferred with Wärtsilä Biopower Oy to the joint venture. Theconsolidated annual pro forma net sales of the company were approximately EUR 130 millionfor the year ended December 31, 2008, and the number of employees was about 200.
Disposal of composites manufacturing business
Metso sold its composites manufacturing business and related assets in Oulu, Finland toxperion Oy as of January 1, 2009. The divestment was not material to Metso and a small profitfrom the sale was recognized.
99

NOTES TO THE CONSOLIDATED FINANCIAL STAEMENTS
The composites manufacturing business was part of Metso's Paper and Fiber Technologysegment. Its annual net sales have been less than EUR 5 million. The whole personnel, 21people, was transferred to xperion Oy.
Metso adjusts its Finnish units serving the paper industry
In January 2009, Metso started personnel negotiations regarding employee reductions in itsFinnish units serving the paper industry. The employee reduction is estimated to affect a total of900-1,200 employees. Approximately 4,700 employees work in the units subject to the person-nel negotiations. The possible reduction in the number of units and the consolidation of opera-tions into bigger units will be examined as part of the negotiations.
The aim is to conclude the personnel negotiations involving the Paper business line and theProcess Automation Systems business unit of Automation business line by mid-March. Theemployee reductions are expected to take place during April-September of this year.
As a result of the arrangements, the annual expenses of the businesses in question areestimated to decrease by EUR 40-50 million. The cost reductions are estimated to be realized infull starting in 2010. The nonrecurring expenses caused by the arrangements and recognized in2009 are estimated to be EUR 10-20 million.
Moody’s revised Metso’s rating outlook to negative
In January, Moody’s Investor Service confirmed Metso’s Baa2 long-term credit rating andchanged the outlook from stable to negative.
Smurfit-Stone Container Corporation files for Chapter 11 bankruptcy
Smurfit-Stone Container Corporation, one of Metso’s Paper and Fiber Technology’s customersin North America, announced on January 26, 2009 that it has filed voluntary petition forreorganization under Chapter 11. Metso estimates that maximum credit risk related toreceivables from Smurfit-Stone is about EUR 3 million.
Standard & Poor’s revised Metso’s rating outlook to negative
In February, Standard & Poor’s affirmed Metso’s BBB long-term credit rating and changed theoutlook from stable to negative. At the same time the short-term corporate credit rating waslowered from A-2 to A-3.
100

FINANCIAL INDICATORS 2004-2008
EUR million 2004 2005 2006 2007 2008Net sales 3,602 4,221 4,955 6,250 6,400
Net sales change, % n/a 17.2 17.4 26.1 2.4Operating profit 199 335 457 580 637
% of net sales 5.5 7.9 9.2 9.3 10.0Profit on continuing operations before tax 140 292 421 547 548
% of net sales 3.9 6.9 8.5 8.8 8.6Profit on continuing operations 158 220 410 384 390
% of net sales 4.4 5.2 8.3 6.1 6.1Profit 144 237 410 384 390Profit attributable to equity shareholders 143 236 409 381 389
Exports and international operations 3,302 3,879 4,652 5,795 5,957% of net sales 91.7 91.9 93.9 92.7 93.1
Amortization 15 16 17 56 44Depreciation 100 86 88 92 94
Depreciation and amortization 115 102 105 148 138% of net sales 3.2 2.4 2.1 2.4 2.2
Goodwill impairment - - 7 - -EBITA 214 351 481 636 681
% of net sales 5.9 8.3 9.7 10.2 10.6EBITDA 314 437 569 728 775
% of net sales 8.7 10.4 11.5 11.6 12.1
Financial income and expenses, net 59 43 36 33 89% of net sales 1.6 1.0 0.7 0.5 1.4
Interest expenses, net 53 39 27 33 71% of net sales 1.5 0.9 0.5 0.5 1.1
Interest cover (EBITDA) 5.3x 10.2x 15.8x 22.1x 8.7x
Gross capital expenditure(excl. business acquisitions) 97 107 131 159 255
% of net sales 2.7 2.5 2.6 2.5 4.0Business acquisitions, net of cash acquired 2 14 277 55 44Net capital expenditure (excl. businessacquisitions and disposals) 30 58 115 140 238
% of net sales 0.8 1.4 2.3 2.2 3.7Cash flow from operations 261 164 442 294 137Free cash flow 1) 211 138 364 198 29Cash conversion, % 147 58 89 52 7
Research and development 96 96 109 117 134% of net sales 2.7 2.3 2.2 1.9 2.1
101

FINANCIAL INDICATORS 2004-2008
EUR million 2004 2005 2006 2007 2008Balance sheet total 3,572 3,917 4,968 5,254 5,511Equity attributable to shareholders 984 1,258 1,444 1,608 1,444Total equity 989 1,265 1,450 1,615 1,453Interest bearing liabilities 935 788 830 819 1,435Net interest bearing liabilities 495 289 454 540 1,099Capital employed 1,925 2,053 2,280 2,434 2,888Return on equity (ROE), % 16.0 21.1 30.9 25.4 26.0Return on capital employed (ROCE) before tax, % 10.7 18.9 22.5 26.1 23.2Return on capital employed (ROCE) after tax, % 10.8 15.3 21.9 19.0 17.3Equity to assets ratio, % 30.7 36.6 35.4 37.7 30.9Gearing, % 50.1 22.8 31.3 33.4 75.7Debt to capital, % 48.6 38.4 36.4 33.7 49.7
Orders received 3,989 4,745 5,705 6,965 6,384Order backlog, December 31 1,705 2,350 3,737 4,341 4,088
Average number of personnel 24,363 22,405 23,364 26,269 28,010Personnel, December 31 22,802 22,178 25,678 26,837 29,322
Formulas for calculation of financial indicators are presented on page 104.
1) The calculation of free cash flow has been revised: Only capital expenditure related to maintenance, and not thecapital expenditure related to growth investments increasing capacity, is deducted from net cash provided byoperating activities. FCF for the years ended December 31, 2006, 2007 and 2008 is presented in accordance withthe revised concept, prior comparison periods have not been restated.
102

SHARE CAPITAL AND SHARE DATA 2004-2008
EUR million(except for number of shares, per share data and share prices) 2004 2005 2006 2007 2008Share capital, December 31 232 241 241 241 241Number of shares, December 31:
Number of outstanding shares 136,189,704 141,593,773 141,358,773 141,487,234 141,623,642Treasury shares held by the Parent Company 60,841 60,841 60,841 60,841 60,841Shares administered by a partnership(MEO1V Incentive Ky) - - 300,000 206,539 70,131
Total number of shares 136,250,545 141,654,614 141,719,614 141,754,614 141,754,614Average number of outstanding shares 136,189,704 139,639,425 141,580,759 141,460,012 141,595,026Average number of diluted shares 136,192,037 139,665,197 141,600,424 141,460,012 141,595,026
Trading volume, NASDAQ OMX Helsinki Ltd 108,469,701 239,282,695 266,774,359 350,168,659 359,378,566Trading volume, NYSE 1) 6,057,500 7,931,000 4,682,700 6,020,320 - % of shares 2) 84.1 174.6 192.0 251.8 253.8Earnings/share from continuing operations, basic 1.16 1.57 2.89 2.69 2.75Earnings/share from discontinued operations, basic -0.11 0.12 - - -Earnings/share from continuing anddiscontinued operations, basic 1.05 1.69 2.89 2.69 2.75Free cash flow/share 3) 1.55 0.76 2.57 1.40 0.20Dividend/share 4) 0.35 1.40 1.50 3.00 0.70Dividend 4) 48 198 212 425 99Dividend/earnings, % 4) 33 83 52 112 25Effective dividend yield, % 4) 3.0 6.0 3.9 8.0 8.2P/E ratio 11.13 13.81 13.23 13.88 3.10Equity/share 7.22 8.89 10.21 11.36 10.19Highest share price 12.89 24.46 38.65 49.95 38.56Lowest share price 9.12 11.31 23.21 34.06 7.74Average share price 10.85 16.85 30.45 41.43 23.66Share price, December 31 11.66 23.12 38.24 37.33 8.52Market capitalization, December 31 5) 1,588 3,274 5,406 5,282 1,207
1) Trading volume until December 14, 2007.
4) Proposal by the Board of Directors5) Excluding treasury shares held by the Parent Company and shares administered by a partnership
Formulas for calculation of share-related indicators are on page 104.
2) Of the total amount of shares for public trading (For the years 2004-2007 trading in both NASDAQ OMX Helsinki Ltd and NYSE,for 2008 only in NASDAQ OMX Helsinki Ltd).3) The calculation of free cash flow has been revised: Only capital expenditure related to maintenance is deducted from net cashprovided by operating activities. FCF for the years ended December 31, 2006, 2007 and 2008 is presented in accordance with therevised concept, prior comparison periods have not been restated.
103

FORMULAS FOR CALCULATION OF FINANCIAL INDICATORS
Formulas for calculation of Formulas for calculation offinancial indicators share-related indicators
EBITA: Earnings/share:
Operating profit + amorization Profit+ goodwill impairment Average number of shares during period
EBITDA: Free cash flow/share:
Operating profit + depreciation and Free cash flowamortization + goodwill impairment Average number of shares during period
Return on equity (ROE), %: Equity/share:
Profit Equity attributable to shareholdersTotal equity (average for period) Number of shares at end of period
Dividend/share:
Profit before tax + interest andother financial expenses Dividend distributionBalance sheet total - non-interest bearing Number of shares at end of periodliabilities (average for period)
Dividend/earnings, %:
Profit + interest and other financial expenses Dividend per shareBalance sheet total - non-interest bearing Earnings per shareliabilities (average for period)
Gearing, %: Effective dividend yield, %:
Net interest bearing liabilities Dividend per shareTotal equity Share price on December 31
Equity to assets ratio, %: P/E ratio:
Total equity Share price on December 31Balance sheet total – advances received Earnings per share
Capital employed: Market capitalization:
Balance sheet total - non-interest bearing liabilities Total number of shares x share price at end of period
Average share price:
Operating cash flow Total value of shares traded in euro - capital expenditures on maintenance investments Number of shares traded during period + proceeds from sale of fixed assets
Cash conversion:
Free cash flowProfit
Debt to capital, %:
Interest bearing liabilitiesTotal equity + interest bearing liabilities
Interest cover (EBITDA):
EBITDAFinancial income and expenses, net
x 100
Return on capital employed (ROCE)before tax, %:
x 100
Return on capital employed (ROCE)after tax, %:
x 100 x 100
x 100 x 100
x 100
Free cash flow:
x 100
x 100
104

EXCHANGE RATES USED
2006 2007 2008 2006 2007 2008USD (US dollar) 1.2630 1.3797 1.4726 1.3170 1.4721 1.3917SEK (Swedish krona) 9.2533 9.2647 9.6833 9.0404 9.4415 10.8700GBP (Pound sterling) 0.6819 0.6873 0.8026 0.6715 0.7334 0.9525CAD (Canadian dollar) 1.4267 1.4663 1.5656 1.5281 1.4449 1.6998BRL (Brazilian real) 2.7375 2.6623 2.6711 2.8105 2.5949 3.2441
Average rates Year-end rates
105

PARENT COMPANY STATEMENT OF INCOME
Year ended December 31,EUR Note 2007 2008Other operating income 2 3,035,074.64 645,861.16Personnel expenses 3 -12,381,686.40 -12,615,609.79Depreciation and amortization 4 -552,485.37 -683,121.32Other operating expenses -17,079,238.81 -18,466,887.60Operating profit (loss) -26,978,335.94 -31,119,757.55
Financial income and expenses, net 6 393,300,419.16 266,976,313.46Profit before extraordinary items 366,322,083.22 235,856,555.91
Extraordinary items 7 180,667,000.00 136,934,000.00Profit before appropriations and taxes 546,989,083.22 372,790,555.91
Income taxes 8Current tax expense -740,813.13 -186,306.58Change in deferred taxes -27,452,688.60 -10,774,896.02
Profit 518,795,581.49 361,829,353.31
106

PARENT COMPANY BALANCE SHEET
Assets
EUR Note 2007 2008Non-current assets
Intangible assets 9 1,306,716.99 1,714,218.19Tangible assets 9 1,013,849.65 1,240,118.79Investments
Shares in Group companies 10 2,100,617,939.80 2,229,933,689.80Other investments 10 338,534,212.02 350,007,501.78
Total non-current assets 2,441,472,718.46 2,582,895,528.56
Current assetsLong-term receivables 12 25,263,328.79 14,264,522.49Short-term receivables 12 775,197,259.28 746,210,361.00Securities 8,000,000.00 121,174,653.90Bank and cash 20,185,280.12 16,216,891.37
Total current assets 828,645,868.19 897,866,428.76
Total assets 3,270,118,586.65 3,480,761,957.32
Shareholders' equity and liabilitiesAs at December 31,
EUR 2007 2008Shareholders' equity 13
Share capital 240,982,843.80 240,982,843.80Share premium reserve 151,671,470.23 -Legal reserve 215,489,536.19 -Other reserves 194,210,758.91 561,371,765.33Retained earnings 234,630.12 93,909,932.61Profit 518,795,581.49 361,829,353.31
Total shareholders' equity 1,321,384,820.74 1,258,093,895.05
LiabilitiesLong-term liabilities 14 675,599,278.67 1,075,835,842.59Current liabilities 15 1,273,134,487.24 1,146,832,219.68
Total liabilities 1,948,733,765.91 2,222,668,062.27
Total shareholders' equity and liabilities 3,270,118,586.65 3,480,761,957.32
As at December 31,
107

PARENT COMPANY STATEMENT OF CASH FLOWS
Year ended December 31,EUR thousand 2007 2008
Cash flows from operating activities:Profit 518,796 361,829Adjustments to operating profit (loss)
Depreciation and amortization 552 683Unrealized foreign exchange gains (+) / losses (-) 22,082 25,732Financial income and expenses, net -424,030 -289,659Gains (+) / losses (-) on sale, net -2,438 -274Group contributions -180,667 -136,934Write-downs - 538Taxes -28,194 -10,961
Total adjustments to operating profit (loss) -612,695 -410,875
Increase (-) / decrease (+) in short-term non-interest bearing trade receivables 75,745 -38,677Increase (+) / decrease (-) in short-term non-interest bearing debt 2,033 58,649
Change in working capital 77,778 19,972
Interest and other financial expenses paid -71,447 -79,587Dividends received 104,349 670,780Interest received 3,572 3,705Income taxes paid -741 -186Net cash provided by operating activities 19,612 565,638
Cash flows from investing activities:Investments in tangible and intangible assets -720 -1,290Proceeds from sale of tangible and intangible assets -280 -1Long-term loans granted -265,802 -131,923Repayments of long-term loans 92,283 27,503Short-term loans granted -46,336 -48,785Repayments of short-term loans 75,851 56,966Purchase of other investments -20,150 -129,586Proceeds from other investments 28,803 284Interest received from investments 10,237 22,357Dividends received from investments 528 388Net cash used in investing activities -125,586 -204,087
Cash flows from financing activities:Share options exercised 304 -Withdrawals (+) and instalments (-) of short-term loans, net -181,588 291,800Withdrawal of long-term loans 121,612 485,252Repayments of long-term loans -78,341 -15,702Dividends paid -212,541 -425,081Change in Group pool accounts 413,762 -769,280Group contributions 13,908 180,667Net cash provided by (+) / used in (-) financing activities 77,116 -252,344
Net increase (+) / decrease (-) in bank and cash -28,858 109,207Bank and cash at beginning of year 57,043 28,185Bank and cash at end of year 28,185 137,392
108

NOTES TO PARENT COMPANY FINANCIAL STATEMENTS
1 Accounting principles
The parent company financial statements have been prepared in accordance with the FinnishGenerally Accepted Accounting Principles.
Tangible and intangible assets
Tangible and intangible assets are valued at historical cost, less accumulated depreciationaccording to plan. Land and water areas are not depreciated.
Depreciation and amortization is calculated on a straight-line basis over the expected useful livesof the assets as follows:
Computer software 3–5 yearsOther intangibles 10 yearsBuildings and structures 20 yearsMachinery and equipment 3–5 years
Financial Instruments
Metso’s financial risk management is carried out by a central treasury department (GroupTreasury) under the policies approved by the Board of Directors. Group Treasury functions in co-operation with the operating units to minimize financial risks in both the Parent Company and theGroup.
The Group’s external and internal forward exchange contracts are measured at fair value. Thechange in fair value is recognized as income or expense in the income statement. The fair valueof forward exchange contracts is determined using forward exchange market rates at the balancesheet date.
Transaction costs arising from issuance of bonds are recognized over the life of the bond usingthe effective yield method. The unrecognized portion as of the balance sheet date is presented asa decrease in liabilities.
Other financial instruments are measured at historical cost, less possible impairment loss.
Deferred taxes
A deferred tax liability or asset has been determined for all temporary differences between the taxbases of assets and liabilities and their amounts in financial reporting, using the enacted tax rateseffective for the future years. The deferred tax liabilities are recognized in the balance sheet infull, and the deferred tax assets are recognized when it is probable that there will be sufficienttaxable profit against which the asset can be utilized.
109

NOTES TO PARENT COMPANY FINANCIAL STATEMENTS
2 Other operating incomeYear ended December 31,
EUR thousand 2007 2008Gain on sale of fixed assets 2,743 278Rental income 88 91Other 204 277Total 3,035 646
3 Personnel expensesYear ended December 31,
EUR thousand 2007 2008Salaries and wages -7,129 -8,224Share-based payments -1,707 -796Pension costs -3,108 -3,219Other indirect employee costs -438 -377Total -12,382 -12,616
Year ended December 31,EUR thousand 2007 2008Fringe benefits 246 638
Remuneration paid to Executive Team:Year ended December 31,
EUR thousand 2007 2008Chief Executive Officer and his deputy -1,298 -1,321Share-based payments -818 -436Board members 1) -407 -463Total -2,523 -2,2201) Board remuneration is presented in note 6 for Consolidated Financial Statements.
According to his employment contract, Chief Executive Officer's age of retirement is 60 years.
Number of personnel:2007 2008
Personnel at end of year 88 103Average number of personnel during the year 81 98
4 Depreciation and amortization
Depreciation and amortization expenses consist of the following:Year ended December 31,
EUR thousand 2007 2008Buildings and structures -16 -16Machinery and equipment -73 -72Other tangible assets -3 -3Intangible assets -460 -592Total -552 -683
110

NOTES TO PARENT COMPANY FINANCIAL STATEMENTS
5 Audit feesYear ended December 31,
EUR thousand 2007 2008Authorised Public Accountant PricewaterhouseCoopers Oy
Audit 606 577Tax consulting 240 374Other services 140 64
Total 986 1,015
6 Financial income and expensesYear ended December 31,
EUR thousand 2007 2008Dividends received from
Group companies 444,349 330,780Others 528 388
444,877 331,168Interest income from investments from
Group companies 10,376 25,939Others 93 247
10,469 26,186Other interest and financial income from
Others 14,953 3,788
Interest and financial income, total 470,299 361,142
Interest and other financial expenses toGroup companies -33,775 -25,821Others -43,224 -68,345
Interest and other financial expenses, total -76,999 -94,166
Financial income and expenses, net 393,300 266,976
Other interest and financial income includes net gainfrom foreign exchange 11,524 -
Interest and other financial expenses to others includenet loss from foreign exchange - -1,901
7 Extraordinary itemsYear ended December 31,
EUR thousand 2007 2008Group contributions received 180,667 136,934
8 Income taxesYear ended December 31,
EUR thousand 2007 2008Withheld taxes recorded for the financial year -741 -186Change in deferred taxes -27,453 -10,775Total -28,194 -10,961
111

NOTES TO PARENT COMPANY FINANCIAL STATEMENTS
9 Fixed assets
Buildings Machinery Other TangibleIntangible Land and and tangible assets
EUR thousand assets areas structures equipment assets total TotalAcquisition cost at Jan 1, 2007 3,321 295 476 2,564 372 3,707 7,028Additions 677 - - 72 - 72 749Decreases -43 - - -65 0 -65 -108Acquisition cost at Dec 31, 2007 3,955 295 476 2,571 372 3,714 7,669
Accumulated depreciationat Jan 1, 2007 -2,218 - -196 -2,467 -8 -2,671 -4,889Accumulated depreciationof decreases 30 - - 63 0 63 93Depreciation charges for the year -460 - -17 -72 -3 -92 -552Accumulated depreciationat Dec 31, 2007 -2,648 - -213 -2,476 -11 -2,700 -5,348
Net carrying value at Dec 31, 2007 1,307 295 263 95 361 1,014 2,321
Buildings Machinery Other TangibleIntangible Land and and tangible assets
EUR thousand assets areas structures equipment assets total TotalAcquisition cost at Jan 1, 2008 3,955 295 476 2,571 372 3,714 7,669Additions 999 - - 294 29 323 1,322Decreases - - - -10 -6 -16 -16Acquisition cost at Dec 31, 2008 4,954 295 476 2,855 395 4,021 8,975
Accumulated depreciationat Jan 1, 2008 -2,648 - -213 -2,476 -11 -2,700 -5,348Accumulated depreciation ofdecreases - - - 10 - 10 10Depreciation charges for the year -592 - -16 -72 -3 -91 -683Accumulated depreciationat Dec 31, 2008 -3,240 - -229 -2,538 -14 -2,781 -6,021
Net carrying value at Dec 31, 2008 1,714 295 247 317 381 1,240 2,954
112

NOTES TO PARENT COMPANY FINANCIAL STATEMENTS
10 InvestmentsShares Shares Receivables Receivables OtherGroup Participating Shares Group Other investments
EUR thousand companies interests Others companies companies totalAcquisition cost at Jan 1, 2007 2,106,474 3,474 6,623 161,416 5,115 176,628Additions 20,000 - 150 265,802 - 265,952Decreases -25,856 -3,474 -242 -100,241 -89 -104,046Acquisition cost at Dec 31, 2007 2,100,618 0 6,531 326,977 5,026 338,534
Accumulated impairmentat Jan 1, 2007 - -3,474 - - - -3,474Other change - 3,474 - - - 3,474Accumulated impairmentat Dec 31, 2007 - 0 - - - 0
Net carrying value at Dec 31, 2007 2,100,618 0 6,531 326,977 5,026 338,534
Shares Shares Receivables Receivables OtherGroup Participating Shares Group Other investments
EUR thousand companies interests Others companies companies totalAcquisition cost at Jan 1, 2008 2,100,618 - 6,531 326,977 5,026 338,534Additions 129,316 - 270 131,923 - 132,193Decreases - - -36 -120,658 -26 -120,720Acquisition cost at Dec 31, 2008 2,229,934 - 6,765 338,242 5,000 350,007
Accumulated impairmentat Jan 1, 2008 - - - - - -Other change - - - - - -Accumulated impairmentat Dec 31, 2008 - - - - - -
Net carrying value at Dec 31, 2008 2,229,934 - 6,765 338,242 5,000 350,007
113

NOTES TO PARENT COMPANY FINANCIAL STATEMENTS
11 Shareholdings
SubsidiariesOwnership
Domicile %Metso Shared Services Oy Finland, Helsinki 100.0Kaukotalo Oy Finland, Helsinki 87.2MEO1V Incentive Ky Finland, Helsinki 98.9Metso Automation Oy Finland, Helsinki 100.0Metso Automation Canada Ltd. Canada, St. Laurent 100.0Metso Belgium N.V. Belgium, Wemmel 100.0Metso Canada Ltd. Canada, Toronto 100.0Metso Capital Oy Finland, Helsinki 100.0Metso Captive Insurance Limited Great Britain, Guernsey 100.0Metso Minerals Oy Finland, Helsinki 100.0Metso Minerals Canada Inc. Canada, Belleville 100.0Metso Paper Oy Finland, Helsinki 100.0Metso Powdermet Oy Finland, Tampere 100.0Metso SAS France, Neuilly sur Seine 62.3Metso Svenska AB Sweden, Karlstad 100.0Metso USA Inc. USA, Norcross 100.0Valmet Automotive Oy Finland, Uusikaupunki 100.0Rauma Oy Finland, Helsinki 100.0Avantone Oy Finland, Tampere 96.4
114

NOTES TO PARENT COMPANY FINANCIAL STATEMENTS
12 Specification of receivables
Long-term receivablesAs at December 31,
EUR thousand 2007 2008Deferred tax asset 24,825 14,050Long-term receivables from others 438 215Long-term receivables total 25,263 14,265
Short-term receivablesAs at December 31,
EUR thousand 2007 2008Trade receivables from
Group companies 2,112 3,291Others 92 122
2,204 3,413Loan receivables from
Group companies 230,815 514,575Others 0 690
230,815 515,265Prepaid expenses and accrued income from
Group companies 182,371 142,487Others 19,302 84,449
201,673 226,936Other receivables
From Group companies 340,000 -VAT receivable 499 636Other receivables 6 -40
340,505 596
Short-term receivables total 775,197 746,210
Specification of prepaid expenses and accrued incomeAs at December 31,
EUR thousand 2007 2008Prepaid expenses and accrued income from Group companies
Group contribution receivables 180,667 136,934Accrued interest income 1,681 5,495Other accrued items 23 58
Total 182,371 142,487
Prepaid expenses and accrued income from othersAccrued interest income 116 214Accrued derivatives 17,848 83,246Other accrued items 1,338 989
Total 19,302 84,449
115

NOTES TO PARENT COMPANY FINANCIAL STATEMENTS
13 Statement of changes in shareholders' equity
EUR thousand 2007 2008Share capital at Jan 1 240,923 240,982Increase in share capital 59 -Share capital at Dec 31 240,982 240,982
Share premium reserve at Jan 1 151,426 151,671Change in financial year 245 -Decrease and transfer - -151,671Share premium reserve at Dec 31 151,671 -
Legal reserve at Jan 1 215,490 215,490Decrease and transfer - -215,490Legal reserve at Dec 31 215,490 -
Other reserves at Jan 1 201,826 194,211Transfer -7,615 367,161Other reserves at Dec 31 194,211 561,372
Retained earnings at Jan 1 204,926 519,031Dividend distribution -212,541 -425,081Transfer 7,615 -Other change 235 -39Retained earnings at Dec 31 235 93,911
Profit 518,796 361,829
Total shareholders' equity at Dec 31 1,321,385 1,258,094
Statement of distributable funds at December 31
EUR 2007 2008Other reserves 194,210,758.91 561,371,765.33Retained earnings 234,630.12 93,909,932.61Profit 518,795,581.49 361,829,353.31Total distributable funds 713,240,970.52 1,017,111,051.25
14 Long-term liabilities
As at December 31,EUR thousand 2007 2008Bonds 1) 508,644 710,201Loans from financial institutions 166,955 365,635Total 675,599 1,075,8361) Specification of bonds in note 23 for Consolidated Financial Statements.
Debt maturing later than in five years timeAs at December 31,
EUR thousand 2007 2008Bonds - 161,673Loans from financial institutions 78,139 149,849Total 78,139 311,522
At the end of the year, Metso Oyj held 60,841 treasury shares, the acquisition price of which, EUR 655thousand, has been deducted from retained earnings.
116

NOTES TO PARENT COMPANY FINANCIAL STATEMENTS
15 Short-term liabilitiesAs at December 31,
EUR thousand 2007 2008Current portion of long-term liabilities
Bonds - 83,000Loans from financial institutions 15,978 13,220Other short-term debt to Group companies 835 -
16,813 96,220
Trade payables toGroup companies 1,158 517Others 1,610 1,402
2,768 1,919
Accrued expenses and deferred income toGroup companies 3,152 3,842Others 28,074 93,886
31,226 97,728
Other short-term interest bearing debt toGroup companies 264,516 419,199Group pool accounts 942,748 389,947Others 14,756 141,329
1,222,020 950,475
Other short-term non-interest bearing debt toOthers 307 490
307 490
Short-term liabilities total 1,273,134 1,146,832
Short-term liabilities to Group companies total 1,212,409 813,505
Specification of accrued expenses and deferred incomeAs at December 31,
EUR thousand 2007 2008Accrued expenses and deferred income to Group companies
Accrued interest expenses 2,840 3,753Other accrued items 312 89
3,152 3,842Accrued expenses and deferred income to others
Accrued interest expenses 6,048 12,100Accrued derivatives 18,658 78,579Accrued salaries, wages and social costs 2,368 2,034Other accrued items 1,000 1,173
28,074 93,886
16 Other contingencies
GuaranteesAs at December 31,
EUR thousand 2007 2008Guarantees on behalf of subsidiaries 1,300,799 1,270,859Guarantees on behalf of others 5,422 8,052Total 1,306,221 1,278,911
Lease commitmentsAs at December 31,
EUR thousand 2007 2008Payments in the following year 440 498Payments later 297 212Total 737 710
117

LIST OF ACCOUNT BOOKS USED IN PARENT COMPANY
Voucher classGeneral journal and general ledger In electronic formatSpecifications of accounts receivable and payable On paperBank vouchers 16,42 In electronic formatSales invoices RV,11 Paper vouchersPurchase invoices 23 In electronic formatPayroll accounting with vouchers 33 In electronic formatJournal entries 01,31,34,35,46,59,79 Paper vouchers
118