Results DNB Group - Cision
22
Results DNB Group Q3 Third quarter 2021 Kjerstin R. Braathen (CEO) Ottar Ertzeid (CFO) 21 October 2021
-
Upload
khangminh22 -
Category
Documents
-
view
0 -
download
0
Transcript of Results DNB Group - Cision

Results DNB Group
Q3Third quarter 2021
Kjerstin R. Braathen (CEO)Ottar Ertzeid (CFO)
21 October 2021

1) CET1: Common equity Tier 1.
Continued strong performance and solid asset quality
Profitable lending and deposit growth and increased net interest incomeNet interest income increased by 3.8 per cent from the last quarter, driven by increased volumes. Loans up 0.6 per cent and deposits up 1.7 from June 2021
Net commissions and fees up 3.2 per cent from 3Q20Positive development within money transfer services, insurance and asset management in an otherwise seasonally slow quarter
Net reversals of impairment provisionsNet reversals of NOK 200 million reflecting the robust portfolio and improved macroeconomic outlook
Strong earnings per share (EPS) – a firm foundation for dividend policyEPS of NOK 4.29 in the quarter, up 25.8 per cent from 3Q20
Return on equity (ROE) of 11.4 per cent in 3Q21Solid performance across the Group, lower expenses in the quarter and further net reversals of impairment provisions
Return on equityPer cent, trailing 12-month figures
Profit for the periodNOK billion
6.9
CET11)
capital ratioPer cent
19.2
2
12.3 11.7
9.8 9.1 8.8 8.49.2 9.8 10.3
3Q19 4Q19 1Q20 2Q20 3Q20 4Q20 1Q21 2Q21 3Q21

Dividend per share (DPS) and payout ratio
1) Share buy-backs approved by both the Annual General Meetings and Finanstilsynet (the Financial Supervisory Authority of Norway) based on the accounts for the previous year.
Profitability and solid capital position enabling delivery on our dividend policy
Key points
3
Dividend policy stands: Distribution of excess capital through
dividends and share buy-backs
Payout ratio of more than 50 per cent in cash dividends
Ambition of annual increase in DPS
Delivery on dividend policy of more than 50 per cent in cash dividends before considering share buy-backs
2.00 2.10 2.703.80
4.505.70
7.108.25 8.40 9.00
2.34
2.433.09
25% 25% 25%30% 30%
50%
73% 73% 72%75%
0%
10%
20%
30%
40%
50%
60%
70%
80%
0.00
2.00
4.00
6.00
8.00
10.00
12.00
14.00
2011 2012 2013 2014 2015 2016 2017 2018 2019 2020
Dividend per share (NOK) Share buy-back (NOK) Total payout ratio1)

High activity level in the Norwegian economy, fully reopened society since September with no significant restrictions Before the reopening, Norway was ranked no. 1 in Bloomberg’s Covid Resilience Ranking of the countries handling COVID-19 most effectively After a key policy rate hike of 25 basis points in September, Norges Bank forecasts an additional six rate hikes before the end of 2024
Sources: DNB Markets, Statistics Norway (SSB), Norges Bank (the Norwegian central bank), NAV (the Norwegian Labour and Welfare Administration).
Mainland GDP growthYoY, per cent
Norges Bank’s key policy rate pathPer cent
Registered unemploymentFull-time unemployment, per cent
Improved and strong outlook for the Norwegian economy
4
2.3
(2.5)
3.8 3.5
1.5 1.5
2013
2014
2015
2016
2017
2018
2019
2020
2021
e
2022
e
2023
e
2024
e
2.3
10.4
2.3 2.4
Dec
19
Feb
20M
ar 2
0Ap
r 20
May
20
Aug
20D
ec 2
0Ap
r 21
Jun
21Se
p 21
Oct
21
2022
e20
23e
2024
e
1.50
0.25
1.68
1.07
2013
2014
2015
2016
2017
2018
2019
2020
2021
e
2022
e
2023
e
2024
e
Forecast September Forecast June
2 347 2 4372 303
3Q20 2Q21 3Q21
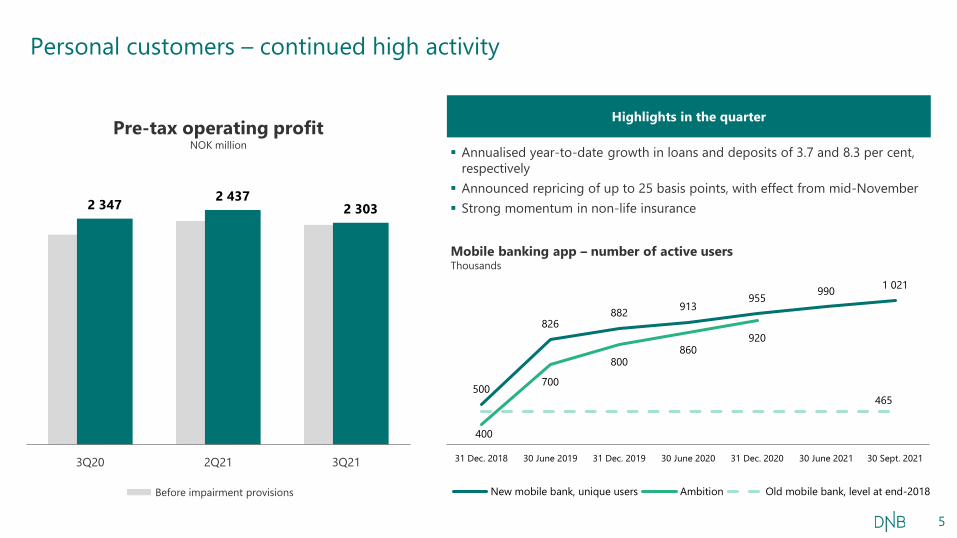
Personal customers – continued high activity
Highlights in the quarter
Mobile banking app – number of active usersThousands
500
826882 913
955 990 1 021
400
700
800860
920
31 Dec. 2018 30 June 2019 31 Dec. 2019 30 June 2020 31 Dec. 2020 30 June 2021 30 Sept. 2021
New mobile bank, unique users Ambition Old mobile bank, level at end-2018
465
Pre-tax operating profitNOK million
Annualised year-to-date growth in loans and deposits of 3.7 and 8.3 per cent, respectively Announced repricing of up to 25 basis points, with effect from mid-November Strong momentum in non-life insurance
5
Before impairment provisions

3 760
5 5355 200
3Q20 2Q21 3Q21
1) Source: Finance Norway.
Corporate customers – strong results driven by high customer activity and net reversals of impairment provisions
Highlights in the quarter
Defined-contribution pensions
39.749.6
63.5 67.2
87.2103.5
118.3
27.7
28.4
28.928.5
29.0
27.6
29.3
2015 2016 2017 2018 2019 2020 3Q21
Capital (NOK billion) Market share (per cent)1)
Pre-tax operating profitNOK million
Profitable lending growth, annualised year-to-date, of 8.4 per cent in the segment small and medium-sized customers Solid performance within investment banking and pensions Reversals of impairment provisions reflecting robust asset quality and strong
macroeconomic outlook
6
Before impairment provisions

811 834 840
800 784 788
Personal customers Corporate customers
30 Sept. 2020 30 June 2021 30 Sept. 2021
28
Of which currency effects from 30 Sept. 2021
1 554 1 570 1 591 1 571 1 592 1 574 1 581 1 600
974 994 1 065 1 081 1 107 1 138
1 180 1 221
4Q19 1Q20 2Q20 3Q20 4Q20 1Q21 2Q21 3Q21
Performing loans Deposits
Loans to personal customers up 0.7 per cent and to corporate customers up 0.5 per cent in the quarter Currency-adjusted growth year-to-date, annualised:
‒ Loans: personal customers 3.7 per cent, corporate customers 2.9 per cent, total segments 3.3 per cent‒ Deposits: personal customers 8.3 per cent, corporate customers 19.3 per cent, total segments 14.7 per cent
Loans per customer segmentNOK billion
Average loans and deposits in the customer segmentsNOK billion
Profitable increase in both loans and deposits
7

1.61 1.62
1.421.38 1.39 1.37 1.36 1.36
4Q19 1Q20 2Q20 3Q20 4Q20 1Q21 2Q21 3Q21
²⁾
1.801.94
2.14 2.08 2.02 1.95 2.05 1.97
0.620.49
(0.07) (0.00) 0.08 0.13 0.02 0.11
1.34 1.381.25 1.23 1.23 1.19 1.18 1.16
4Q19 1Q20 2Q20 3Q20 4Q20 1Q21 2Q21 3Q21 Lending spreads Deposit spreadsCombined spreads – weighted average
Spreads on loans and deposits reflected the increase of 12 basis points in average NOK money market rates Increased deposit-to-loan ratio had a negative effect of ~1 basis point on both combined spreads and net interest margin
Net interest margin1)
Per centSpreads in customer segments
Per cent
1) Total net interest income relative to average loans and deposits in the customer segments.2) Norges Bank reduced the key policy rate from 1.50 to 0.25 per cent in March 2020 and to 0 per cent in May 2020.
Stable development in net interest margin
8

Norges Bank increased the key policy rate from 0 to 0.25 per cent in September DNB announced increase in customer interest rates with effect from mid-November The announced repricing is expected to have an annual effect of approximately NOK 1.5 billion
Net interest income from 2Q21 to 3Q21NOK million
1) Negative effect of increased NOK money market rates on spreads offset by higher interest on equity.
Net interest income driven by volume growth and high activity
9
1)

Real estate brokingExtraordinarily high activity in 3Q20
Investment banking services Solid performance in a seasonally slow quarter
Asset management and custodial servicesAll-time high income from asset management
Guarantee commissions Temporarily reduced demand for some guarantee products, increasing from a low 2Q21
Money transfer and banking services Money transfer services up 7.2 per cent, offset by increased costs within banking services
Sale of insurance products High activity within defined-contribution pensions and non-life insurance, DNB no.1 in Norway within defined-contribution pensions
Commissions and feesNOK million / Change in per cent from 3Q20
Commissions and fees – positive development in seasonally slow quarter
10
588 642 624
355 293 334 222 202 211
424 496 531
436 855
451
347
395
298
2 372
2 883
2 448
3Q20 2Q21 3Q21
+6.1
-5.8
-14.3
-4.9
+25.2
+3.3

IT expenses reduced due to capitalisation and a seasonally slow quarter Reduced pension expenses in the closed defined-benefits scheme, driven by lower returns in the stock market1)
Operating expenses from 2Q21 to 3Q21NOK million
1) The scheme is partly hedged and a corresponding gain is recognised in net gains on financial instruments. The reduction from the previous quarter was NOK 58 million.
Operating expenses affected by capitalisation and reduced pension expenses
11
1)

98.9 per cent of the portfolio in stages 1 and 2 Reversals in stages 1 and 2 reflected improved underlying credit quality and macroeconomic outlook
Impairment of financial instruments by industry segment NOK million
Maximum exposure (on- and off-balance sheet items), net of accumulated impairment provisions
Net reversals of impairment provisions reflect the robust portfolio
12
NOK 2 223 billion(+17)
Stage 1 Stage 2 Stage 3NOK 155 billion
(-0)NOK 27 billion
(+2)
1.1%92.4% 6.5%
3Q21 2Q21 3Q20
Total 200 833 (776) Of which:
Personal customers- Stages 1 and 2 25 69 380- Stage 3 (51) (30) (20)
Corporate customers*)
- Stages 1 and 2 289 244 636- Stage 3 (62) 550 (1 773)
*) Of which oil, gas and offshore:- Stages 1 and 2 82 182 294- Stage 3 8 (208) (1 331)
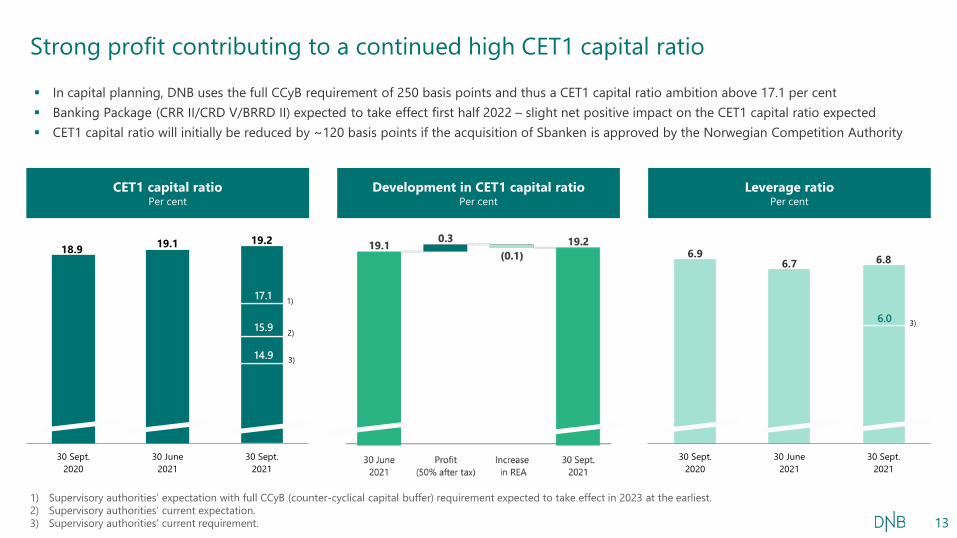
In capital planning, DNB uses the full CCyB requirement of 250 basis points and thus a CET1 capital ratio ambition above 17.1 per cent Banking Package (CRR II/CRD V/BRRD II) expected to take effect first half 2022 – slight net positive impact on the CET1 capital ratio expected CET1 capital ratio will initially be reduced by ~120 basis points if the acquisition of Sbanken is approved by the Norwegian Competition Authority
1) Supervisory authorities’ expectation with full CCyB (counter-cyclical capital buffer) requirement expected to take effect in 2023 at the earliest. 2) Supervisory authorities’ current expectation. 3) Supervisory authorities’ current requirement.
18.9 19.1 19.2
30 Sept.2020
30 June2021
30 Sept.2021
1)
2)
3)14.9
15.9
17.1
6.96.7 6.8
30 Sept.2020
30 June2021
30 Sept.2021
3)6.0
CET1 capital ratioPer cent
Development in CET1 capital ratioPer cent
Leverage ratioPer cent
Strong profit contributing to a continued high CET1 capital ratio
13

ROE positively affected by increased income, low expenses and net reversals of impairment provisions The first of several expected interest rate hikes from Norges Bank implemented, will contribute positively to future earnings High profitability reflected by a year-to-date EPS of NOK 11.95, up 36.4 per cent from corresponding period in 2020
9.5
11.1 11.4
3Q20 2Q21 3Q21
3.41
4.014.29
3Q20 2Q21 3Q21
42.544.4
40.1
3Q20 2Q21 3Q21
Return on equityPer cent
Cost/income ratioPer cent
Earnings per shareNOK
Strong earnings per share – a firm foundation for delivering on dividend policy
14

Dividend per share (DPS) and payout ratio
1) Share buy-backs approved by both the Annual General Meetings and Finanstilsynet (the Financial Supervisory Authority of Norway) based on the accounts for the previous year.
Profitability and solid capital position enabling delivery on our dividend policy
Key points
15
Dividend policy stands: Distribution of excess capital through
dividends and share buy-backs
Payout ratio of more than 50 per cent in cash dividends
Ambition of annual increase in DPS
Delivery on dividend policy of more than 50 per cent in cash dividends before considering share buy-backs
The Board of Directors has decided to pay out a dividend of NOK 9.00 per share for 2020 Ex-dividend date: 28 October
Distribution of dividends: as of 5 November2.00 2.10 2.70
3.804.50
5.707.10
8.25 8.40 9.00
2.34
2.433.09
25% 25% 25%30% 30%
50%
73% 73% 72%75%
0%
10%
20%
30%
40%
50%
60%
70%
80%
0.00
2.00
4.00
6.00
8.00
10.00
12.00
14.00
2011 2012 2013 2014 2015 2016 2017 2018 2019 2020
Dividend per share (NOK) Share buy-back (NOK) Total payout ratio1)

Appendix

Income statement
17
NOK million 3Q21 2Q21 3Q20Change
from 2Q21Change
from 3Q20
Net interest income 9 766 9 409 9 298 357 468
Other operating income 4 577 4 184 4 109 393 468
Total income 14 343 13 593 13 407 749 935
Operating expenses (5 752) (6 038) (5 702) 287 (50)
Pre-tax operating profit before impairment 8 591 7 555 7 706 1 036 885
Impairment of loans and guarantees and gains on assets 200 730 (776) (530) 976
Pre-tax operating profit 8 791 8 285 6 929 506 1 862
Tax expense (1 934) (1 823) (1 386) (111) (548)
Profit from operations held for sale, after taxes 26 (30) 2 56 24
Profit for the period 6 883 6 432 5 546 451 1 337
Portion attributable to shareholders 6 657 6 210 5 293 447 1 364

Other operating income
18
NOK million 3Q21 2Q21 3Q20Change
from 2Q21Change
from 3Q20
Net commissions and fees 2 448 2 883 2 372 (435) 76
Customer revenues in DNB Markets 558 515 546 43 12
Trading revenues in DNB Markets 81 30 55 52 26
Hedging of defined-benefit pension scheme 9 67 41 (58) (32)
Credit spreads on bonds 86 18 211 68 (125)
Credit spreads on fixed-rate loans 47 14 133 33 (86)
CVA/DVA/FVA (9) 30 138 (39) (148)
Other mark-to-market adjustments 392 12 448 380 (56)
Basis swaps 147 (212) (363) 359 510
Exchange rate effects on additional Tier 1 capital 274 59 (391) 216 665
Net gains on financial instruments at fair value 1 585 532 819 1 052 766
Net financial and risk result, life insurance 147 228 299 (81) (152)
Profit from investments accounted for by the equity method 185 260 310 (76) (126)
Other 212 281 309 (69) (97)
Net other operating income, total 4 577 4 184 4 109 393 468

Scandinavian countries among the world’s most digitalised societies – this has limited the impact of the restrictions on the economy A high level of public trust in the authorities has, together with strong welfare policies, led to a high degree of compliance with guidelines More than 90 per cent of those who have been offered the vaccine have accepted
Sources: WEF, the Norwegian Tax Administration, Statistics Norway (SSB), Norges Bank, OECD, the Norwegian Institute of Public Health (FHI) and European Centre for Disease Prevention and Control
68.7
58.7 55.751.3
42.334.3 33.3
22.7N
orw
ay
Germ
any
Den
mar
k
Swed
en UK
Fran
ce US Italy
Digital societyUnique digital infrastructure
Trust in the authoritiesShare of people reporting confidence in national
government, per cent
VaccinationIn Norway
Norwegian society has shown resilience in its handling of the pandemic
19
97 per centof Norwegians use the
internet
3 per centof payments are made in
cash
>80 per centfully-digital tax returns
No. 1on Governance in the
Network Readiness Index
Progress
- Everyone above the age of 12 has been offered the vaccine
Status as at 19 October
- 78 per cent of the population have received the first vaccine dose
- 69 per cent of the population have received the second vaccine dose

DNB will be a driving force for sustainable transition
20
Increase assets under management in sustainability themed funds to
NOK100 BNby 2025 and reduce the emissions intensity of DNB Livsforsikring’s portfolio by 55% by
2030
Finance and facilitate
NOK1500 BNfor sustainable activities by 2030
Net-zero emissions in
2050across our financing and investment
activities and own operations
Reduce the emissions intensity of our portfolio by
2030Oil and gas: 25%
Shipping: one thirdCommercial property: 25–35%
DNB combats financial crime and contributes to a secure digital economy
DNB is a driving force for diversity
and inclusion
DNB is financing the climate transition and
sustainable value creation
1
2
3

CAUTIONARY NOTE REGARDING FORWARD-LOOKING STATEMENTS
DISCLAIMER
The statements contained in this presentation may include forward-looking statements, such as statements of future expectations. These statements are based on the management’s current views and assumptions and involve both known and unknown risks and uncertainties.
Although DNB believes that the expectations implied in any such forward-looking statements are reasonable, no assurance can be given that such expectations will prove to be correct.
Actual results, performance or events may differ materially from those set out or implied in the forward-looking statements. Important factors that may cause such a difference include, but are not limited to: (i) general economic conditions, (ii) performance of financial markets, including market volatility and liquidity, (iii) the extent of credit defaults, (iv) interest rate levels, (v) currency exchange rates, (vi) changes in the competitive climate, (vii) changes in laws and regulations, (viii) changes in the policies of central banks and/or foreign governments, or supranational entities.
DNB assumes no obligation to update any forward-looking statement.
This presentation contains alternative performance measures, or non-IFRS financial measures. Definitions and calculations are presented on ir.dnb.no.
21

We are here.So you can stay
ahead.
Results DNB Group We are here.So you can stay
ahead.
Third quarter 2021