RESULTS - Telefónica
54
RESULTS JANUARY | SEPTEMBER 2019
-
Upload
khangminh22 -
Category
Documents
-
view
1 -
download
0
Transcript of RESULTS - Telefónica

RESULTSJANUARY | SEPTEMBER 2019

2
FINANCIAL HIGHLIGHTS
• Reported revenues back to growth and customer value improvement.
– LTE (+16% y-o-y; +3.6m quarterly net adds), mobile contract (+6%; +1.9m) and FTTx/Cable (+11%; +0,3m).
– Solid average revenue per access growth (+4.3% y-o-y) and churn improvement (-0.2 p.p.).
– July-September Revenues (€11,902m; +1.7% y-o-y) increased by 3.4% y-o-y in organic terms (+3.6% in 9M 19).
– July-September OIBDA (€2,748m; -31.9% y-o-y) grew by 0.8% organic.
Underlying OIBDA (€4,243m) excluded restructuring costs (€-1,876m), capital gains (€+391m) and other factors (€-10m).
– Net Income (€-443m July-September) reached €806m in underlying terms, excluding restructuring costs (€-1,402m), capital gains (€+267m) and other factors (€-114m). January-September underlying net income was €2,588m.
• Advances in UBB network deployment and Digital Transformation.
– 123m premises passed with FTTx/Cable, 54.5m proprietary (+11% y-o-y), and LTE coverage of 79% (+2 p.p.).
– Execution of the E2E Digital Transformation program: 80% of 2019E savings achieved (>€340m incremental to >€300m in 2018).
• Net Debt reduction for the 10th consecutive quarter.
– Free cash flow (€4,150m in January-September 2019) up by 40.3% y-o-y.
– Net Debt stood at €38,293m at September (-8.1% y-o-y) and decreased by €1,937m in the quarter. Net Debt decreases to c.a. €37.6bn including post-closing events of c.a. €0.7bn.
• The Company reiterates its guidance and dividend announced for 2019.
• T. España; a more segmented and differential commercial strategy (+5% convergent accesses) boosted y-o-y revenue growth, which accelerated +0.7 p.p. q-o-q to +1.0%. OIBDA was back to organic growth (+0.1% vs. -1.6% in Q2), on lower content costs and higher digitalization savings.
• T. Brasil accelerated its revenue growth to 2.6%, the highest in 15 quarters, mainly due to mobile business (ARPU +4.7%). OIBDA grew 3.6%, +4.3 p.p. v.s. Q2 and margin expanded to 42.7% (+0.4 p.p. y-o-y).
• T. Deutschland; +0.3 p.p. and +1.0 p.p improvement in revenue and OIBDA y-o-y trends to +1.9% and -0.8% respectively in Q3, reflecting solid net adds and stable churn in mobile contract.
• T. UK; sustained market leadership position; growth in accesses (+6%), revenues (+4.1%), and OIBDA (+5.7%). OIBDA-CapEx grew by 6.2% in 9M 19.
• T. Hispam Sur; y-o-y growth in revenues (+16.1%) and OIBDA (+15.6%), despite competitive environment, macro and regulation. Commercial highlights included contract net adds in all countries and +28% growth in FTTx connections.
• T. Hispam Norte; contract accesses grew by 2%, Colombia and México posting again positive net adds in the quarter. Revenues decreased by 2.5% and OIBDA (-14.1%) continued affected by spectrum commitments in Mexico.
• Telxius accelerated tower expansion (+580 in Q3 to 18,130); tenancy ratio stood at 1.35x; revenues increased by 4.3% y-o-y in 9M 19, OIBDA by 6.1% and OIBDA-CapEx by 1.8x (excluding exceptional cable sale and tower purchases).

3
Comments of José María Álvarez-Pallete, Chairman and Chief Executive Officer:
“Telefónica continued to post solid & profitable revenue growth in a quarter marked by a strong performance in our main
markets, Spain, Brazil, Germany and UK. We continued to generate very strong free cash flow, up 40% year-on-year in the
first nine months of 2019, driving a reduction in net debt for the 10th consecutive quarter.
We made good progress on key strategic initiatives to simplify our business this quarter, including a workforce restructuring
program in Spain. We are forging ahead with plans to monetise further our mobile telco infrastructure, making a more
efficient use of our networks by sharing them, whilst adding new partners to enrich the value of our commercial offer in the
home.
Telefónica remained focus on deploying next generation networks in our markets, improving our 4G coverage and launching
5G selectively, as we have in the UK. Looking ahead, we reiterate our guidance for this year and are confident that our digital
transformation will boost returns and deliver the best technological solutions for our customers.”

4
TELEFÓNICASELECTED FINANCIAL DATAUnaudited figures (Euros in millions)
January -September % Chg July -
September % Chg
2019 Reported Organic 2019 Reported Organic
Revenues 36,023 0.7 3.6 11,902 1.7 3.4Telefónica España 9,501 0.5 0.5 3,218 1.0 1.0Telefónica Deutschland 5,429 1.4 1.4 1,865 1.9 1.9Telefónica UK 5,184 4.8 4.7 1,773 3.0 4.1Telefónica Brasil 7,536 (0.5) 1.6 2,507 6.9 2.6Telefónica Hispam Sur (1) 4,785 2.0 16.3 1,430 8.7 16.1Telefónica Hispam Norte (2) 2,880 (5.2) (0.4) 895 (14.0) (2.5)Other companies & eliminations 708 (2.3) (3.2) 214 (17.4) (18.0)
Telxius 635 6.4 4.3 200 (13.8) (14.9)
OIBDA 11,450 (4.9) 1.1 2,748 (31.9) 0.8Telefónica España 2,318 (38.9) (1.0) (353) c.s. 0.1Telefónica Deutschland 1,697 25.6 (1.0) 597 27.0 (0.8)Telefónica UK 1,595 18.7 6.2 543 17.0 5.7Telefónica Brasil 3,121 (6.3) 2.0 1,071 (0.4) 3.6Telefónica Hispam Sur (1) 1,267 2.5 13.6 331 6.2 15.6Telefónica Hispam Norte (2) 799 6.8 (14.0) 274 (12.6) (14.1)Other companies & eliminations 653 188.1 (21.0) 286 151.6 (60.9)
Telxius 381 36.4 6.1 128 20.2 (6.9)
OIBDA margin 31.8% (1.9 p.p.) (0.8 p.p.) 23.1% (11.4 p.p.) (0.8 p.p.)Telefónica España 24.4% (15.8 p.p.) (0.6 p.p.) n.s. c.s. (0.3 p.p.)Telefónica Deutschland 31.3% 6.0 p.p. (0.6 p.p.) 32.0% 6.3 p.p. (0.7 p.p.)Telefónica UK 30.8% 3.6 p.p. 0.4 p.p. 30.6% 3.7 p.p. 0.4 p.p.Telefónica Brasil 41.4% (2.6 p.p.) 0.2 p.p. 42.7% (3.1 p.p.) 0.4 p.p.Telefónica Hispam Sur (1) 26.5% 0.1 p.p. (0.7 p.p.) 23.1% (0.5 p.p.) (0.1 p.p.)Telefónica Hispam Norte (2) 27.7% 3.1 p.p. (3.8 p.p.) 30.7% 0.5 p.p. (3.6 p.p.)Other companies & eliminations 92.2% 60.9 p.p. (5.3 p.p.) 133.6% 89.7 p.p. (18.9 p.p.)
Telxius 60.0% 13.2 p.p. 0.8 p.p. 64.1% 18.1 p.p. 4.3 p.p.
Operating Income (OI) 3,622 (33.6) (1.6) 169 (91.2) (2.7)
Net income attributable to equity holders of the Parent 1,344 (50.6) (443) c.s.Basic and diluted earnings per share (euros) 0.22 (52.6) (0.10) c.s.
CapEx 6,657 17.2 4.6 3,273 82.3 1.4Telefónica España 1,194 3.3 3.9 382 0.7 2.5Telefónica Deutschland 2,207 198.3 5.7 1,711 n.s. (9.4)Telefónica UK 652 (45.8) 6.1 242 12.6 13.6Telefónica Brasil 1,486 4.5 6.7 553 4.2 1.6Telefónica Hispam Sur (1) 678 (1.0) 9.8 185 3.9 (0.4)Telefónica Hispam Norte (2) 327 10.0 2.1 143 7.7 0.8Other companies & eliminations 113 (36.5) (37.2) 57 28.4 25.6
Telxius 177 34.2 30.7 84 143.3 139.5
Spectrum 1,465 139.2 136.0 1,443 n.s. n.s.Telefónica España — — — — — —Telefónica Deutschland 1,425 n.s. n.s. 1,425 n.s. n.s.Telefónica UK — — — — — —Telefónica Brasil — — — — — —Telefónica Hispam Sur (1) 3 (83.8) (80.1) 0 c.s. c.s.Telefónica Hispam Norte (2) 37 n.s. n.s. 18 n.s. n.s.
OIBDA-CapEx 4,793 (24.6) (1.5) (524) c.s. 0.3Telefónica España 1,124 (57.4) (3.1) (735) c.s. (0.8)Telefónica Deutschland (509) c.s. (8.5) (1,114) c.s. 15.2Telefónica UK 943 n.s. 6.2 301 20.8 (1.0)Telefónica Brasil 1,635 (14.4) (2.9) 518 (4.9) 6.6Telefónica Hispam Sur (1) 589 6.8 17.9 145 9.3 33.3Telefónica Hispam Norte (2) 472 4.6 (22.7) 131 (27.5) (25.7)Other companies & eliminations 540 n.s. 85.3 229 230.9 c.s.
Telxius 204 38.3 (15.9) 44 (38.4) (76.4)-
Reconciliation included in the excel spreadsheets.Notes:-January-September 2019 results reported under accounting standards IFRS 16, effective since January 2019. January-September 2018 results reported under prior accounting IAS 17.-OIBDA and OI are presented before brand fees and management fees.(1) Telefónica Hispam Sur includes Argentina, Chile, Peru and Uruguay(2) Telefónica Hispam Norte includes Colombia, Mexico, Venezuela, Central America and Ecuador.-Group consolidated results deconsolidate T. Panamá since 1 September 2019, T. Nicaragua since 1 May 2019, T. Guatemala since 1 January 2019 and Antares' results since 1 February 2019.Organic criteria 2019: Assumes average constant foreign exchange rates of 2018, except for Venezuela (2018 and 2019 results converted at the closing synthetic exchange rate for each period) and excludes the hyperinflation adjustment in Argentina. Considers constant perimeter of consolidation. Excludes the effects of the accounting change to IFRS 16, write-offs, capital gains/losses from the sale of companies, restructuring costs and material non-recurring impacts. CapEx excludes spectrum investments.

5
TABLE OF CONTENTS
TELEFÓNICA
Consolidated Results
• Digitalisation and Monetisation
• Telxius
RESULTS BY BUSINESS UNITS
Telefónica España
Telefónica Deutschland
Telefónica UK
Telefónica Brasil
Telefónica Hispam Sur
• Argentina, Chile, Perú
Telefónica Hispam Norte
• Colombia, México
ADDENDA
Key Holdings of the Telefonica Group
Changes to the Perimeter
Alternative performance measures
The financial information related to January-September 2019 contained in this document has been prepared under International Financial
Reporting Standards (IFRS), as adopted by the European Union, which do not differ for the purposes of the Telefónica Group, from IFRS
as issued by the International Accounting Standards Board (IASB). Telefonica Group applies hyper-inflation accounting to its companies
whose functional currency is the Argentine peso for financial information of periods ended after July 1, 2018. The information presented
in prior results to July 1, 2018 have not been restated.
Telefónica’s management model, regional and integrated, means that the legal structure of the companies is not relevant for the release
of Group financial information, and therefore, the operating results of each of these business units are presented independently, regardless
of their legal structure. For the purpose of presenting information on a business unit basis, revenue and expenses arising from invoicing
among companies within Telefónica’s perimeter of consolidation for the use of the brand and management contracts have been excluded
from the operating results for each business unit. This breakdown of the results does not affect Telefónica’s consolidated earnings.
The English language translation of the consolidated financial statements originally issued in Spanish has been prepared solely for the
convenience of English speaking readers. Despite all the efforts devoted to this translation, certain omissions or approximations may
subsist. Telefónica, its representatives and employees decline all responsibility in this regard. In the event of a discrepancy, the
Spanish-language version prevails.
6
9
11
19
22
25
28
31
41
48
49
50

6
01CONSOLIDATED RESULTS
Telefónica Group's access base stood at 345.8m at September 2019, virtually stable y-o-y excluding changes in the perimeter. The continued quality improvement of the customer base explained the growth in average revenue per access (+4.3%y-o-y organic; +4.7% in January-September), while churn improved 0.2 p.p. both y-o-y and q-o-q.
Commercial highlights include: i) LTE accesses totalling 129.8m (+16% y-o-y), with 3.6m quarterly net additions and a penetration of 54% (+10 p.p. y-o-y); ii) mobile contract accesses (128.2m; +6% y-o-y organic), with quarterly organic net additions of 1.9m (49% of total mobile accesses; +4 p.p. y-o-y); iii) smartphones (168.3m; +3% y-o-y organic), reached a penetration of 71% (+4 p.p. y-o-y); and iv) FTTx/Cable (14.2m; +11% y-o-y) reported quarterly net additions of 261k, accounting for 67% of total fixed broadband (+8 p.p. y-o-y) with a coverage of 54.5m premises passed with proprietary network (+11% y-o-y).
Telefónica Group's January-September 2019 results were affected by the exit from the perimeter of consolidation of T. Panamá (1 September), T. Nicaragua (1 May), T. Guatemala (1 January), and Antares (1 February), as well as the sale of 9 Data Centers. Their corresponding capital gains amounted to €664m in January-September at OIBDA level (T. Panamá, €199m, and Data Centers, €197m, in the quarter) and at the same time their exit from the perimeter detracted 0.6 p.p. from revenue y-o-y reported growth and 0.7 p.p. from that of OIBDA (-0.9 p.p. and -1.1 p.p.respectively in the third quarter). On the other hand, the sale of T. Panamá, T. Nicaragua and T. Guatemala reduced total accesses by 8,6m in January-September 2019 (7,6m mobile prepay).
At the same time, the reported variation of the consolidated financial statements for January-September 2019 reflected the adoption of IFRS 16 since 1 January 2019 (the statements for January-September 2018 were reported according to IAS 17). The organic variation excluded the impact of the accounting change to IFRS 16 (+€412m in July-September and +€1,180m in January-September on OIBDA; -€406m and -€1,189m respectively on depreciation and amortisation; -€65m and -€166m on net financial expenses; and -€25m and -€112m on profit attributable to ordinary equity holders of the parent company). The Consolidated Statement of Financial Position at 30 September 2019 included lease liabilities, including those held for sale, amounting to €7,301m.
On the other hand, exchange rate evolution negatively affected the Company's reported results for January-September 2019 mainly due to the depreciation of the Brazilian real and the Argentine peso against the Euro. In the third quarter foreign currencies reduced y-o-y revenue growth by 2.0 p.p. and OIBDA by 1.5 p.p. mainly due to the evolution of the Argentine Peso, though the trend improved sequentially on better y-o-y comps of the Brazilian real against the Euro (-3.7 p.p. and -3.2 p.p. respectively in the first nine months). At the same time, the negative impact of the depreciation of currencies at the OIBDA level (-€391m in the first nine months) decreased significantly in terms of cash flow generation (-€160m).
Additionally, the inflation adjustment negatively impacted the consolidated results of the Telefónica Group in January-September (-€155m on revenues, -€79m on OIBDA,-€215m on OI and -€19m on CapEx) and in July-September (-€207m on revenues, -€71m on OIBDA, -€93m on OI and -€22m on CapEx), being the y-o-y evolution comparable in both periods as the Group started applying hyperinflation accounting to its companies whose functional currency is the Argentine peso for periods ending since 1 July 2018.
Revenues totalled €11,902m in the third quarter (€36,023m in January-September) and increased by 1.7% y-o-y (+0.7% in January-September). In organic terms, revenues increased by 3.4% y-o-y in the third quarter (+3.6% in the first nine months), highlighting handset sales growth acceleration (+17.0%) and sustained service revenue growth (+1.8%).
Excluding the negative impact from regulation (-0.6 p.p. in the third quarter; -0.7 p.p. in the first nine months) revenues would have grown by 4.0% y-o-y organic (+4.3% in January-September).
Revenues coming from broadband connectivity and services beyond connectivity accounted for 55% of the total (+2 p.p. y-o-y), reflecting the transformation of the revenue mix and increasing business sustainability, while voice and access decreased by 3 p.p. to represent less than a third of the total.
In the third quarter, provisions for restructuring costs amounted to €1,876m (€34m in the same period of 2018), affecting personnel expenses (€1,873m) and other net income/expense (€3m), mainly €1,732m in T. España, €93m in T. Hispam Sur, and €48m in Other Companies.

7
Such provisions did not impact free cash flow generation in the quarter and were carried out within the Company’s transformation and simplification process, which shall enable the generation of incremental savings and efficiencies with a positive impact on cash generation.
Operating expenses were €9,897m in July-September (€26,270m in January-September) and their y-o-y evolution in reported terms (+24.0% in the quarter; +7.7% in the first nine months) was significantly affected by i) the provision for restructuring costs in personnel expenses; and ii) the positive impact recorded in 2018 associated with a favourable court ruling in Brazil (€307m in July-September; €792m in January-September). In addition to the positive impact in 2019 associated with the application of the new IFRS 16 accounting standard mentioned above.
In organic terms, operating expenses increased by 5.3% y-o-y in the third quarter (+5.6% in the first nine months). Supplies grew by 8.2% y-o-y in July-September (+7.1% in January-September) due to strong high-value handset consumption, higher content costs and more expenses associated with increased IT business. Other operating expenses increased (+2.6% compared with July-September 2018; +4.3% vs. January-September 2018) after recording higher network and system costs as well as customer management, although their growth trend eased vs. prior quarter. Personnel expenses increased by 5.2% y-o-y in the quarter (+5.4% in the first nine months), mainly affected by salary updates in Argentina and higher expense in Brazil, associated to the insourcing of IT/systems activities.
The average staff of January-September 2019 stood at 118,022 employees (-3.4% y-o-y).
Gains on sale of fixed assets totalled €459m in the third quarter (€65m in the same period of 2018), highlighting mainly the impact on OIBDA of capital gains from the sale of T. Panamá (€199m), 9 Data Centers (€197m; of which €109m in Other Companies, €29m in T. Hispam Sur, €27m in T. España, €15m in T. Brasil and €17m in T. Hispam Norte), towers (highlighting €16m in T. Colombia) and real estate (highlighting €18m in T. España).
Operating income before depreciation and amortisation (OIBDA) totalled €2,748m in July-September (€11,450m in January-September) and its y-o-y evolution is affected by the abovementioned factors. Underlying OIBDA totalled €4,243m in the third quarter (€12,611m in January-September), after excluding restructuring costs (-€1,876m), capital gains (+€391m) and other factors (-€10m).
In organic terms, OIBDA grew by 0.8% y-o-y in the quarter (+1.1% in the first nine months), on the back of sustained revenue growth and savings from digitalisation and simplification, among other cost control measures. Excluding the negative impact of regulation (-0.5 p.p. in July-September; -0.6 p.p. in January-September), OIBDA would have increased by 1.3% y-o-y organic (+1.7% in the first nine months).
OIBDA margin stood at 23.1% in the third quarter (-11.4 p.p. y-o-y; -0.8 p.p. organic), mainly affected by the provision for restructuring costs before mentioned. In January-September, OIBDA margin reached 31.8% (-1.9 p.p. y-o-y; -0.8 p.p. in organic terms).
Depreciation and amortisation totalled €2,580m in July-September and increased by 22.1% y-o-y (+18.9% in January-September), affected by the aforementioned impact from IFRS 16 adoption. In organic terms, it increased 3.9% y-o-y in the third quarter (+3.4% in January-September).
Thus, operating income (OI) reached €169m in the third quarter (-2.7% organic). In the first nine months, operating income totalled €3,622m (-1.6% organic).
Net financial expenses in July-September totalled €540m vs. €209m in July-September 2018 (positively impacted in €223m due to a favourable court ruling in Brazil), and reflected the impact from the adoption of IFRS 16.
Corporate income tax in the third quarter was affected by the aforementioned restructuring provision and increased results by €102m. In January-September corporate income tax totalled €654m (-60.8% y-o-y).
Profit attributable to non-controlling interests in the third quarter (€176m) fell 15.6% y-o-y, mainly due to the lower profit attributable to minority interests of T. Brasil, partly offset by the impact from the capital gain from the sale of T. Panamá.
Thus, the profit attributable to ordinary equity holders of the parent company (-€443m in July-September; €1,344m in January-September) was mainly affected by the provision for restructuring costs of the third quarter. However, in underlying terms net income reached €806m in July-September, after excluding restructuring costs (-€1,402m), capital gains (+€267m) and other factors (-€114m). January-September underlying net income was €2,588m.
Basic earnings per share amounted to -€0.10 in the third quarter and €0.22 in January-September. In underlying terms, EPS totalled €0.14 and €0.47, respectively.

8
CapEx in January-September totalled €6,657m (+17.2% y-o-y) and included €1,465m of spectrum (€1,443m in the third quarter of which €1,425m in T. Deutschland, with no impact on free cash flow in the period following the approval of a deferred payment schedule). In organic terms, it increased 4.6% y-o-y affected by a different calendar of execution, decelerating sequentially its growth trend (+1.4% in the third quarter), and continued to focus on accelerating excellent connectivity (deployment of LTE and fibre networks, increased network capacity and virtualisation) and improving quality and customer experience (implementation of AI in the Company's technology platforms).
OIBDA-CapEx reached €4,793m in the first nine months of 2019, down 24.6% y-o-y mainly due to the impact on OIBDA of the third quarter provision for restructuring costs (-1.5% organic, affected by a different calendar of CapEx execution).
Interest payments in January-September (€1,058m) decreased by 17.5% y-o-y (-28.0% excluding IFRS 16), mostly due to the reduction of both debt and cost of debt, and the collection of proceeds from the interests associated to the extraordinary tax refund in Spain. The effective cost of interest payments over the last 12 months (excluding IFRS 16 and the extraordinary tax refund in Spain) stood at 3.30% as of September 2019 (3.52% as of September 2018).
As a result of the extraordinary €702m tax refund in Spain in the first quarter 2019, tax payments in the first nine months amounted to a positive €328m. Excluding this effect, tax payments would be below the reported figure for the same period of 2018, mainly due to lower corporate income tax payment at a Group level.
Working capital contributed €482m to free cash flow generation in January-September 2019 mainly due to the deferred payment of the spectrum acquired in Germany in the third quarter, the application of Brazilian court rulings and real estate sales, partially offset by CapEx seasonality and tax prepayments. It was particularly noteworthy the execution of factoring measures on accounts receivable and the extension of payment terms with suppliers or the factoring firm where those had been discounted. Compared to January-September 2018, there was an improvement of €1,642m, mainly due to the spectrum in Germany and the aforementioned Brazilian court rulings.
Operations with minority shareholders detracted €445m to free cash flow generation in the first nine months of 2019 vs. the €527m drag in the same period of 2018.
Thus, free cash flow before principal payments of lease liabilities reached €5,302m in January-September 2019. However, after these payments (-€1,152m), free cash flow totalled €4,150m in January-September 2019 and increased by 40.3% y-o-y.
Net financial debt at September 2019 (€38,293m) decreased by €2,781m vs. December 2018 thanks to free cash flow generation (€4,150m), net financial divestments (€1,170m; sale of 9 Data Centers, T. Panamá, T. Nicaragua, T. Guatemala and Antares) and the issuance and replacement of capital instruments (€686m). In contrast, the factors that increased debt were: i) shareholder remuneration (€1,529m, including coupon payments of capital instruments), ii) labour-related commitments (€595m), and iii) other factors (€1,101m mainly partial compensations from favourable Brazilian court rulings in 2018).
In the third quarter, net financial debt decreased by €1,937m thanks to free cash flow generation (€1,394m), net financial divestments (€849m; sale of 9 Data Centers and T. Panamá) and the issuance of capital instruments (€500m). In contrast, the factors that increased debt were: i) shareholder remuneration (€254m, including coupon payments of capital instruments), ii) labour-related commitments (€176m) and iii) other factors (€376m; mainly the partial compensations from favourable Brazilian court rulings in 2018).
On the other hand, following the adoption of IFRS 16, lease liabilities, including those held for sale, amounted to €7,301m. Net financial debt including lease liabilities amounted to €45,594m.
In January-September 2019, the financing activity of Telefónica amounted to €6,899m equivalent (without considering the refinancing of commercial paper and short-term bank loans) and focused on maintaining a solid liquidity position and refinancing and extending debt maturities (in an environment of low interest rates). Thus, as of the end of September, the Group has covered debt maturities for the next two years. The average debt life stood at 10.7 years (vs. 9.0 years in December 2018).
The main financing operations of the quarter included:
– In July, Telefónica Emisiones, S.A.U. completed a €500m, 20-year senior debt issue with an annual coupon of 1.957%. These tenors are usually very difficult to access, as they are carried out under very positive market conditions, and are often restricted to companies with high credit ratings.

9
– In September, T. Europe, B.V. issued Undated Deeply Subordinated Guaranteed Fixed Rate Reset Securities, with the subordinated guarantee of Telefónica S.A., for a nominal amount of €500m subject to a call option excercisable from the eighth anniversary of the issuance date.
Throughout the first nine months, Telefónica Group obtained funding by means of extending payment terms with suppliers or the factoring firm where those had been discounted, for a total of €302m equivalent (€349m equivalent in July-September 2018).
Telefónica, S.A. and its holding companies continued their issuance activity under the Promissory Notes and Commercial Paper Programmes (Domestic and European), maintaining an outstanding notional balance of €1,477m at September.
At September, Telefónica maintained undrawn, committed credit lines with different credit institutions for an approximate amount of €13,084m (€12,741m maturing in over twelve months) which, combined with the cash equivalents position and current financial assets, placed liquidity at €24,899m.
Definitions:
Organic growth: Assumes average constant foreign exchange rates of 2018, except for Venezuela (2018 and 2019 results converted at the closing synthetic exchange rate for each period) and excludes the hyperinflation adjustment in Argentina. Considers a constant perimeter of consolidation. Excludes the effect of the accounting change to IFRS 16, write-downs, capital gains/losses from the sale of companies, restructuring costs and material non-recurring impacts. CapEx excludes spectrum investments.
Underlying growth: Reported figures excluding write-downs, capital gains/losses from the sale of companies, restructuring costs, material non-recurring impacts and depreciation and amortisation charges from purchase price allocation processes.
Digitalisation and Monetisation
(y-o-y changes in organic terms)
Telefónica made progress in the digital transition towards sustainable and profitable growth, upgrading its network infrastructures and providing excellent connectivity in speed, coverage and security.
– The Group’s FTTx/cable network reached 123m of premises passed (54.5m own network; +11% y-o-y); 22.7m FTTH in Spain, 20.7M in Brazil and 11.1M FTTx/cable in Hispam (+24% y-o-y). Connected retail FTTx/cable accesses totalled 14.2m (+11% y-o-y), where UBB accesses accounted for 67% of total broadband (+8 p.p. y-o-y).
Investment in fiber is key for Telefónica and will allow the generation of revenues and efficiencies with the capture of savings due to the dismantling of copper networks. The technological evolution of the fiber throughout its useful life of more than 30 years, will allow offering up to 10 Gbps symmetrical and optimise the deployment of 5G. In parallel, the new access network “Open Access” will support increasingly flexible and virtually controlled services.
– LTE coverage already reached 79% (+2.3 p.p. y-o-y; 95% in Europe and 73% in Latin America) and traffic accounted for 77% of total. Its deployment benefits from the higher spectral efficiency of 4G (x2.4 vs. 3G) and the spectrum released in 2G (56% in 2019 vs. 41% in 2016), an expanded effect with VoLTE (10% of total voice traffic).
“MIMO 4x4” helps to improve the quality of mobile service, highlighting Brazil and Germany where the network quality improved significantly.
Progress in 5G was driven by leadership in fibre and network virtualisation (“UNICA” in 10 countries), highlighting:
The 5G Technological Cities project (Talavera, Segovia and Málaga) was extended to Alcobendas and Galicia with new use cases such as virtual reality in bank branches, assisted driving or remote medical diagnostics.
In the UK, the launch of the 5G network in October (Belfast, Cardiff, Edinburgh, London, Slough and Leeds).
Progress in validating 4.5G and “Massive MIMO” technologies, use of “OpenRAN” and tests of “Open Source MANO” for the orchestration of “Network Slices” on the same infrastructure.

10
– The expansion of the mobile network and fibre access in Europe is accelerating through the network sharing agreements, which will reduce the resources needed to increase coverage and quality of service. It is worth highlighting the agreements signed with Vodafone, in the United Kingdom for 5G deployment, in Germany for the access to its cable network (24m households passed with 300 Mbps), and in Brazil the agreement reached with TIM for 2G network compaction and 4G deployment, have been crucial new developments. In parallel, mobile and fixed legacy network shutdown plans (3G and copper) in Spain and LatAm were accelerated.
– The transformation of the data network core (IP network) reached 43% (+29 p.p. y-o-y), enabling less investment to support the same traffic levels (40% vs the former IP technology).
– The unified fixed access customer equipment ecosystem, developed in-house has increased scale, 36m devices (6.3M HGUs, fibre terminal and 10G router with WiFi 6; 80% of FTTH customers), offering state-of-the-art connectivity and access to the open digital services platform with lower costs and breakdown rate.
Telefónica increased by 6 p.p. y-o-y the migration to “Full Stack” with 33% of migrated customers (99m) and 67% of processes digitalised and managed in real time (+4 p.p. y-o-y).
Through the E2E Digital Transformation programme in January-September 80% of 2019 savings targets were achieved (>€340m on top of >€300m achieved in 2018). The main drivers for the transformation were:
– Improved digital experience in sales process
Online commercial operations grew by 27% y-o-y in 9M 19, mainly due to the enhance of e-commerce portals and Data Driven models that allow marketing, offers and interactions with customers to be customised. In Spain, over 75% of online offers are customised; in the United Kingdom online sales grew over 27% up to September; and in Brazil, FTTH's digital sales increased over 60%.
– Digitalisation of customer services
The number of calls answered in Call Centres decreased by 13% vs 9M 18 thanks to the Cognitive Platforms of the Contact Centres that continued their use cases deployment in Peru and Brazil (>34m of calls answered by virtual agents; >90% understanding rate) and the common use of digital channels such as chatbots and WhatsApp.
Blockchain applied to supply chain management in Brazil, was over 800,000 daily transactions.
– Process automation
RPA programmes in Brazil and Spain, among the most ambitious programmes in the sector, surpassed 1,000 robots deployed (with impact on service quality and cost savings). In Brazil, the amount of technician field visits fell by >20%.
In the third platform and in the consumer segment (customised and flexible proposals), is worth highlighting in the quarter the new data and handset configurable offering in Germany, and new unlimited data plans in the UK (with entry tariffs above blended ARPU). The integrated offer with handset drove handset revenues, ARPU and churn reduction. "Phoenix" handset renewal program of contract customers, based in AI and implemented in 7 countries, offered very positive results in Colombia and Peru (+17% and +36% in renewals vs. Q3 18 respectively) in terms of revenue generation and commercial cost savings.
In the business segment, the “Core Digital” offer (Communication, Cloud, Security) was further enriched with own and third party VAS, leveraged on the Group's scale and assets (virtualised networks, 25 data centres and 11 security centres). Business revenues in the quarter (€2,263m) rose by 3.7% y-o-y (Europe: €1,270m, +1.3% and Latin America: €993m, +6.5%). Digital services (€545m; +28.0% y-o-y) continued to drive B2B revenue growth, primarily Cloud, IoT and Security.
In relation with the customer satisfaction in both segments, the Group’s NPS (Net Promoter Score) indicator was 20% at September (+1 p.p. y-o-y).
Digital services revenues totalled €1,939m in July-September (+17.4% y-o-y) and €5,722m in the first nine months (+19.2% y-o-y):
– Video revenues (€757m in the quarter, 39% of digital revenues) accelerated their growth to 6.9% y-o-y, supported by the increase in accesses to 9.8m (8.6m in pay TV, +13% y-o-y in IPTV, and 1.2m active accesses in the OTT “Movistar Play” service in Latin America, +86% y-o-y).

11
– Revenues in Advanced Digital Services (€439m in the quarter, 23% of digital services) increased by 32.1%, driven by the business segment. Highlights of the quarter:
Cloud (€176m; +23.6% y-o-y) underpinned by the IaaS and SaaS businesses, which outperformed the market in every country, highlighting the “Virtual Data Centre” service, new multi-cloud projects won and the commercialisation of O365 licences (+825k managed, +41% y-o-y in revenues).
IoT (€130m; +33.4% y-o-y) reached 22.4m of connected accesses (+1.1m in the quarter) thanks to the positive traction of the IoT solutions of managed connectivity. “Vivo Car” was launched in Brazil, following the Spain launch in Q1 19.
Security (€128m; +41.8% y-o-y) achieved further solid progress; Telefónica was acknowledged as a “Very Strong Player” in the Global Managed Security Services by the GlobalData industry analyst.
– Contents revenues (€573m in the quarter) were up 24.0% y-o-y on the back of the performance in Brazil and Other Digital Services (€170m in July-September) rose by 12.3% y-o-y mainly driven by advertising.
Lastly, the fourth platform accelerates the transformation of the Company through the application of Artificial Intelligence-based solutions with very positive results in customer experience, revenue generation and efficiency.
Several projects are progressing for the final customer: “Aura”, new customer relationship and home service management model, in 8 countries; “Movistar Home”, a home assistant with Aura that uses the “Home as a Computer” strategy to create differential experiences open to third parties; “Novum”, the global self-management application which helps to integrate the Big Data capabilities in the platform; and LUCA portfolio, that helps B2B customers to accelerate the AI capabilities creation.
At the same time, AI drives internal processes in various areas such as network planning or customization of offerings.
Telxius
(y-o-y changes in organic terms)
In the third quarter of 2019 Telxius strengthened its positioning as a reference operator.
In the Towers business it is noteworthy the acquisition of 432 towers from Telefónica in Spain, Peru and Chile, up to a total of 1,090 towers acquired in 2019, and the acceleration of new towers built with 148 in the quarter (361 in January-September). Thus, the portfolio reached 18,130 towers to September (+9.5% y-o-y), with a tenancy ratio of 1.35x being that of the new towers acquired 1.01x.
In the Cable business, it is worth mentioning the exceptional sales of capacity registered in BRUSA (Brazil - United States) in Q3 18, and in MAREA (United States - Spain) in Q1 19 and Q2 19.
Revenues totalled €200m in the quarter and decreased by 14.9% y-o-y, although they accelerated the growth to 7.5% y-o-y excluding the exceptional sale of capacity (+3.8 p.p. q-o-q), with Towers revenues (€89m) registering a solid growth of 7.6% y-o-y, and cable revenues improving its evolution sequentially thanks to a more favourable y-o-y comparison (€111m; +7.5% y-o-y excluding the mentioned transactions).
In January-September, revenues amounted to €635m (+4.3%; + 5.5% excluding exceptional sales in Cable), those of Towers' business amounted to €261m (+8,8%) and those of Cable €374m (+2.9% excluding the mentioned transactions).
OIBDA amounted to €128m (€381m in 9M) in July-September and accelerated its strong y-o-y growth up to 13.8% (+9.1% in 9M) excluding the mentioned exceptional sale (-6.9% including it; +6.1% in 9M). OIBDA margin stood at 64.1% in the quarter (60.0% in 9M) and improved by 4.3 p.p. y-o-y (+2.8 p.p. excluding the exceptional sale).
CapEx totalled €177m (+30.7% y-o-y) in 9M, including €118m for the acquisition of towers. Excluding this acquisition, CapEx maintained the decreasing trend following the completion of MAREA and BRUSA cables deployment in 2018.
Thus, OIBDA-CapEx amounted to €204m in January-September (1.8x higher y-o-y excluding exceptional sales in cable and towers acquisition).

12
TELEFÓNICAACCESSES
Unaudited figures (thousands)
2018 2019
March June September December March June September % Chg
Final Clients Accesses 338,190.8 338,830.1 337,396.8 337,051.5 331,995.4 326,231.2 324,975.2 (3.7)
Fixed telephony accesses (1) 36,674.0 36,281.6 35,733.5 35,273.6 34,262.8 33,202.5 32,338.2 (9.5)
Internet and data accesses 21,827.0 21,911.5 22,087.7 22,087.5 21,956.2 21,788.5 21,596.2 (2.2)
Broadband 21,385.9 21,460.2 21,638.0 21,645.2 21,586.5 21,449.2 21,262.9 (1.7)
FTTx/Cable 11,491.8 12,216.0 12,766.4 13,213.1 13,580.5 13,931.1 14,191.8 11.2
Mobile accesses 271,084.9 271,901.0 270,730.3 270,814.9 266,948.5 262,471.8 262,439.1 (3.1)
Prepay 153,623.2 152,234.0 149,131.7 147,062.0 142,125.6 135,997.9 134,228.9 (10.0)
Contract 117,461.7 119,667.0 121,598.5 123,752.9 124,822.9 126,473.9 128,210.1 5.4
M2M 16,778.1 17,623.4 18,397.9 19,483.0 20,388.6 21,357.5 22,390.1 21.7
Pay TV 8,604.9 8,736.1 8,845.3 8,875.4 8,828.0 8,768.5 8,601.7 (2.8)
Wholesale Accesses 19,021.1 18,966.5 19,207.0 19,520.0 20,419.6 20,349.2 20,845.4 8.5
Fixed wholesale accesses 4,222.2 4,082.6 3,987.7 3,951.5 3,895.1 3,859.9 3,851.1 (3.4)
Mobile wholesale accesses 14,798.9 14,883.9 15,219.3 15,568.5 16,524.5 16,489.3 16,994.3 11.7
Total Accesses 357,211.9 357,796.6 356,603.8 356,571.5 352,415.0 346,580.4 345,820.6 (3.0)- T. Panamá's accesses excluded since 1 September 2019, T. Nicaragua's since 1 May of 2019 and T. Guatemala's since 1 January of 2019.(1) Includes fixed wireless and VoIP accesses. In Spain, since Q1 18 business accesses were restated.
TELEFÓNICAMOBILE ACCESSESUnaudited figures
2018 2019
March June September Decembe March June September %Chg
Contract percentage (%) 43.3% 44.0% 44.9% 45.7% 46.8% 48.2% 48.9% 3.9 p.p.
Smartphones ('000) 161,572.5 163,886.0 166,794.1 167,693.5 166,241.7 165,070.0 168,284.4 0.9
Smartphone penetration (%) 64.4% 65.3% 66.9% 67.5% 68.2% 69.1% 70.8% 3.9 p.p.
LTE ('000) 102,910.4 106,617.8 111,529.1 117,369.5 121,494.0 126,229.0 129,790.4 16.4
LTE penetration (%) 40.5% 41.9% 44.2% 46.7% 49.3% 52.4% 54.1% 9.9 p.p.
13
TELEFÓNICA
CONSOLIDATED INCOME STATEMENT
Unaudited figures (Euros in millions)
January - September % Chg July - September % Chg
2019 2018 Reported Organic 2019 2018 Reported Organic
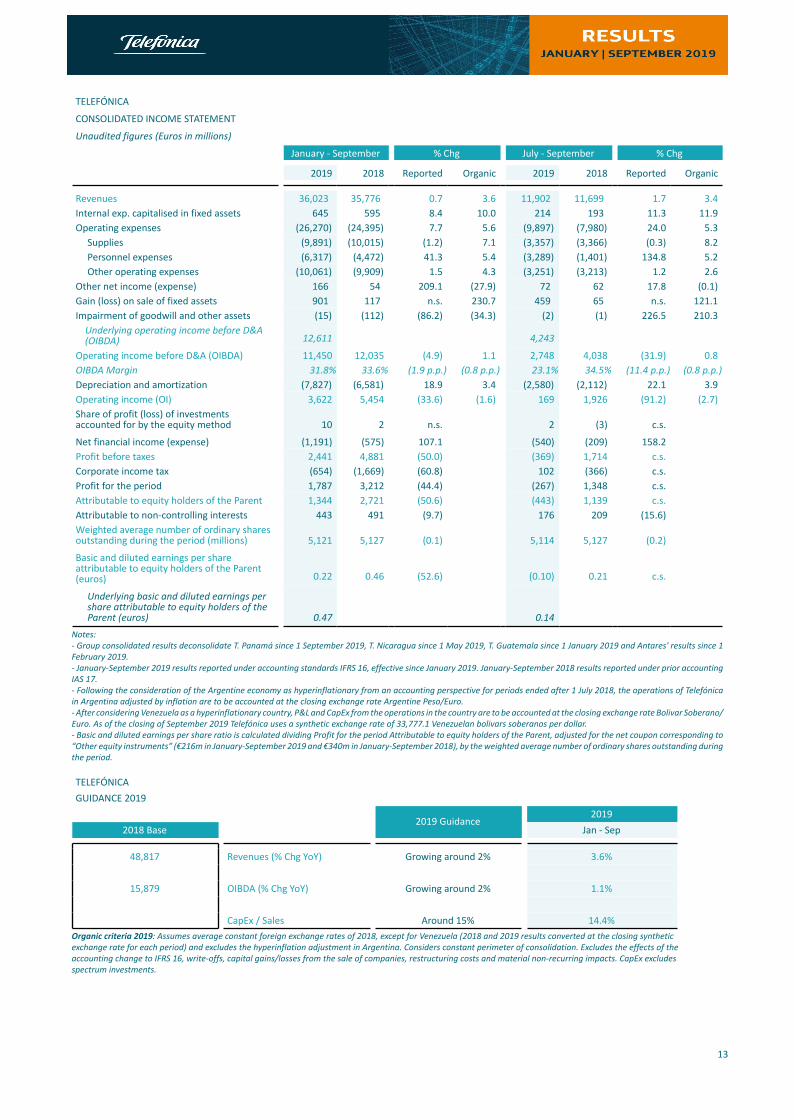
Revenues 36,023 35,776 0.7 3.6 11,902 11,699 1.7 3.4Internal exp. capitalised in fixed assets 645 595 8.4 10.0 214 193 11.3 11.9Operating expenses (26,270) (24,395) 7.7 5.6 (9,897) (7,980) 24.0 5.3
Supplies (9,891) (10,015) (1.2) 7.1 (3,357) (3,366) (0.3) 8.2Personnel expenses (6,317) (4,472) 41.3 5.4 (3,289) (1,401) 134.8 5.2Other operating expenses (10,061) (9,909) 1.5 4.3 (3,251) (3,213) 1.2 2.6
Other net income (expense) 166 54 209.1 (27.9) 72 62 17.8 (0.1)Gain (loss) on sale of fixed assets 901 117 n.s. 230.7 459 65 n.s. 121.1Impairment of goodwill and other assets (15) (112) (86.2) (34.3) (2) (1) 226.5 210.3
Underlying operating income before D&A(OIBDA) 12,611 4,243
Operating income before D&A (OIBDA) 11,450 12,035 (4.9) 1.1 2,748 4,038 (31.9) 0.8OIBDA Margin 31.8% 33.6% (1.9 p.p.) (0.8 p.p.) 23.1% 34.5% (11.4 p.p.) (0.8 p.p.)
Depreciation and amortization (7,827) (6,581) 18.9 3.4 (2,580) (2,112) 22.1 3.9Operating income (OI) 3,622 5,454 (33.6) (1.6) 169 1,926 (91.2) (2.7)Share of profit (loss) of investmentsaccounted for by the equity method 10 2 n.s. 2 (3) c.s.
Net financial income (expense) (1,191) (575) 107.1 (540) (209) 158.2Profit before taxes 2,441 4,881 (50.0) (369) 1,714 c.s.Corporate income tax (654) (1,669) (60.8) 102 (366) c.s.Profit for the period 1,787 3,212 (44.4) (267) 1,348 c.s.Attributable to equity holders of the Parent 1,344 2,721 (50.6) (443) 1,139 c.s.Attributable to non-controlling interests 443 491 (9.7) 176 209 (15.6)Weighted average number of ordinary sharesoutstanding during the period (millions) 5,121 5,127 (0.1) 5,114 5,127 (0.2)
Basic and diluted earnings per shareattributable to equity holders of the Parent(euros) 0.22 0.46 (52.6) (0.10) 0.21 c.s.
Underlying basic and diluted earnings pershare attributable to equity holders of theParent (euros) 0.47 0.14
Notes:- Group consolidated results deconsolidate T. Panamá since 1 September 2019, T. Nicaragua since 1 May 2019, T. Guatemala since 1 January 2019 and Antares' results since 1 February 2019.- January-September 2019 results reported under accounting standards IFRS 16, effective since January 2019. January-September 2018 results reported under prior accounting IAS 17.- Following the consideration of the Argentine economy as hyperinflationary from an accounting perspective for periods ended after 1 July 2018, the operations of Telefónica in Argentina adjusted by inflation are to be accounted at the closing exchange rate Argentine Peso/Euro.- After considering Venezuela as a hyperinflationary country, P&L and CapEx from the operations in the country are to be accounted at the closing exchange rate Bolivar Soberano/Euro. As of the closing of September 2019 Telefónica uses a synthetic exchange rate of 33,777.1 Venezuelan bolivars soberanos per dollar. - Basic and diluted earnings per share ratio is calculated dividing Profit for the period Attributable to equity holders of the Parent, adjusted for the net coupon corresponding to “Other equity instruments” (€216m in January-September 2019 and €340m in January-September 2018), by the weighted average number of ordinary shares outstanding during the period.
TELEFÓNICAGUIDANCE 2019
2019 Guidance2019
2018 Base Jan - Sep
48,817 Revenues (% Chg YoY) Growing around 2% 3.6%
15,879 OIBDA (% Chg YoY) Growing around 2% 1.1%
CapEx / Sales Around 15% 14.4%Organic criteria 2019: Assumes average constant foreign exchange rates of 2018, except for Venezuela (2018 and 2019 results converted at the closing syntheticexchange rate for each period) and excludes the hyperinflation adjustment in Argentina. Considers constant perimeter of consolidation. Excludes the effects of theaccounting change to IFRS 16, write-offs, capital gains/losses from the sale of companies, restructuring costs and material non-recurring impacts. CapEx excludesspectrum investments.

14
TELEFÓNICA
CONSOLIDATED STATEMENT OF FINANCIAL POSITION
Unaudited figures (Euros in millions)
September 2019 December 2018 % Chg
Non-current assets 97,123 90,707 7.1Intangible assets 16,767 16,856 (0.5)Goodwill 25,409 25,748 (1.3)Property, plant and equipment 32,006 33,295 (3.9)Rights of Use 7,087 n.a.Investments accounted for by the equity method 137 68 100.7Financial assets and other non-current assets 8,399 7,109 18.1Deferred tax assets 7,318 7,631 (4.1)
Current assets 27,220 23,340 16.6Inventories 2,347 1,692 38.7Receivables and other current assets 10,547 10,579 (0.3)Tax receivables 1,612 1,676 (3.8)Other current financial assets 3,043 2,209 37.8Cash and cash equivalents 8,778 5,692 54.2Non-current assets classified as held for sale 893 1,492 (40.1)
Total Assets = Total Equity and Liabilities 124,343 114,047 9.0
Equity 25,235 26,980 (6.5)
Equity attributable to equity holders of the parent and other holdersof equity instruments 16,874 17,947 (6.0)
Equity attributable to non-controlling interests 8,361 9,033 (7.4)Non-current liabilities 68,211 57,418 18.8
Non-current financial liabilities 47,611 45,334 5.0Non-current Lease liabilities 5,631 n.a.Payables and other non-current liabilities 3,342 1,890 76.8Deferred tax liabilities 2,619 2,674 (2.1)Non-current provisions 9,008 7,520 19.8
Current liabilities 30,897 29,649 4.2Current financial liabilities 9,288 9,368 (0.9)Current Lease liabilities 1,509 n.a.Payables and other current liabilities 15,732 15,485 1.6Current tax payables 1,831 2,047 (10.6)Current provisions 2,174 1,912 13.7Liabilities associated with non-current assets held for sale 363 837 (56.6)
Financial Data
Net Financial debt (1) 38,293 41,074 (6.8)
Net Financial Debt plus Lease Liabilities 45,594 n.a.- Following the consideration of the Argentine economy as hyperinflationary from an accounting perspective for periods ended after 1 July 2018, the operations ofTelefónica in Argentina are adjusted by inflation.(1) Net financial debt calculation has been redefined in the 1st quarter 2019 excluding the mark to market adjustment of the unmatured cash flow hedges associatedto debt instruments. This change seeks to eliminate the asymmetry generated by the accounting valuation method of both financial instruments; the debt instrumentvalued at amortized cost and the derivative at market value. The change has been applied to all comparative periods. Also, following the entry into force of IFRS 16since 1st January 2019, for comparison purposes, the net financial debt figure of December 2018 has been modified to exclude the lease liability of finance leases.

15
TELEFÓNICA
NET FINANCIAL DEBT PLUS COMMITMENTS
Unaudited figures (Euros in millions)
September 2019
Non-current financial liabilities 47,611
Current financial liabilities 9,288
Gross Financial Debt 56,900
Cash and cash equivalents (8,778)
Other assets included in "Other current financial assets" (3,037)
Cash and other current financial assets included in "Non-current Assets Held for Sale" (19)
Positive mark-to-market value of long-term derivative instruments (4,635)
Other liabilities included in "Payables and other non-current liabilities" 808
Other liabilities included in "Payables and other current liabilities" 102
Other assets included in "Financial assets and other non-current assets" (952)
Other assets included in "Receivables and other current assets" (767)
Other assests included in “Tax receivables" (564)
Financial liabilities included in "Liabilities associated with non-current assets held for sale" 37
Finance Leases under IAS 17 n.a
Mark-to-market adjustment by cash flow hedging activities related to debt (801)
Net Financial Debt* 38,293
Lease Liabilities 7,301
Net Financial Debt including Lease liabilities 45,594
Gross commitments related to employee benefits 6,869
Value of associated Long-term assets (134)
Tax benefits (1,772)
Net commitments related to employee benefits 4,963
Net financial debt plus commitments* 43,256
Net Financial Debt / OIBDA 2.49xNotes:* Includes assets and liabilities defined as net financial debt plus commitments for El Salvador and Costa Rica, that are classified as non-current assets held for sale and liabilities associated with non-current assets held for sale.Net financial debt includes a positive value of the derivatives portfolio for a net amount of €2,330m, €3,784m included as financial liabilities and €6,114m included as financial assets.

16
TELEFÓNICA
CONSOLIDATED CASH FLOW STATEMENT
Unaudited figures (Euros in millions)
January - September
2019 2018 % Chg
Cash received from operations 42,921 43,393
Cash paid from operations (31,138) (32,382)
Net payments of interest and other financial expenses net of dividens received (1,058) (1,283)
Net interest and other financial expenses paid (1,082) (1,305)
Dividends received 24 22
Taxes proceeds / (paid) 328 (518)
Net cash flow provided by operating activities 11,053 9,210 20.0
(Payments)/proceeds on investments in property, plant and equipment andintangible assets (5,902) (6,345)
Proceeds from the sale in property, plant and equipment and intangible assets 478 102
Payments on investments in property, plant and equipment and intangibleassets (6,380) (6,447)
Proceeds on disposals of companies, net of cash and cash equivalents disposed 1,762 29
Payments on investments in companies, net of cash and cash equivalentsacquired (2) (2)
Proceeds on financial investments not included under cash equivalents 1,462 597
Payments on financial investments not included under cash equivalents (919) (657)
(Payments)/proceeds on placements of cash surpluses not included under cashequivalents, net (220) (247)
Government grants received — 37
Net cash flow used in investing activities (3,819) (6,588) (42.0)
Dividends paid (1,638) (1,720)
Proceeds from issue of share capital increase — —
Proceeds/(payments) of treasury shares and other operations with shareholdersand with minority interests (509) 379
Operations with other equity holders (1) 443 (492)
Proceeds on issue of debentures and bonds, and other debts 4,187 4,268
Proceeds on loans, borrowings and promissory notes 1,561 3,197
Cancellation of debentures and bonds, and other debts (1,868) (3,833)
Repayments of loans, borrowings and promissory notes (4,782) (2,923)
Lease Principal Payments (1,152) n.a.
Financed operating payments and investments in property, plant and equipment and intangible assets payments (383) (321)
Net cash used in financing activities (4,141) (1,445) 186.6
Effect of changes in exchange rates 5 (231)
Cash reclassified to assets held for sale (9) —
Effect of changes in consolidation methods and others (3) —
Net increase (decrease) in cash and cash equivalents during the year 3,086 946 226.2
Cash and cash equivalents at the beginning of the period 5,692 5,192
Cash and cash equivalents at the end of the period 8,778 6,138
Notes:- Following the consideration of the Argentine economy as hyperinflationary from an accounting perspective for periods ended after 1 July 2018, the operations ofTelefónica in Argentina adjusted by inflation are to be accounted at the closing exchange rate Argentine Peso/Euro.(1) Includes issuance and coupons of undated deeply subordinated securities.

17
TELEFÓNICAFREE CASH FLOW AND CHANGE IN DEBTUnaudited figures (Euros in millions)
January - September
2019 2018 % Chg
I Cash flow from operations 11,783 11,049 6.6II Net interest payment (1) (1,058) (1,283)III Payment for income tax 328 (518)A=I+II+III Net cash provided by operating activities (2) 11,053 9,248 19.5B Net payment for investment in fixed and intangible assets (3) (5,902) (6,344)
Spectrum (4) (153) (634)C=A+B Net free cash flow after CapEx 5,152 2,903 77.4D Net payment for financial investment 2,303 (33)E Net payment for operations with minority shareholders and treasury stock (5) (1,704) (1,833)F=C+D+E Free cash flow after dividends 5,750 1,037 n.s.G Effects of exchange rate changes on net financial debt 120 (106)H Effects on net financial debt of changes in consolid. and others (6) 2,850 (501)I Net financial debt at beginning of period (7) 41,074 43,301J=I-F+G+H Net financial debt at end of period (7) 38,293 41,658 (8.1)K Lease Liabilities (8) 7,301 n.a.L=J+K Net Financial Debt plus Lease Liabilities at end of period (8) 45,594 n.a.
TELEFÓNICA
RECONCILIATIONS OF CASH FLOW AND OIBDA MINUS CAPEX
Unaudited figures (Euros in millions)
January - September
2019 2018 % Chg
OIBDA 11,450 12,035 (4.9)
- CapEx accrued during the period (6,657) (5,680)
- Payments related to cancellation of commitments (595) (581)
- Net interest payment (1,058) (1,283)
- Payment for tax 328 (518)
- Gain (loss) on sale of fixed assets and impairment of goodwill and other assets (658) 91
- Investment In working capital and other deferred income and expenses and Others (3) (9) 2,342 (1,160)
= Net Free Cash Flow after CapEx 5,152 2,903 77.4
+ Payments related to cancellation of commitments 595 581
- Dividends paid to minority shareholders (445) (527)
= Free Cash Flow excluding Lease Principal Payments (8) 5,302 n.a.
- Lease Principal Payments (8) (1,152) n.a.
= Free Cash Flow including Lease Principal Payments 4,150 2,957 40.3
Weighted average number of ordinary shares outstanding during the period (millions) 5,121 5,127
= Free Cash Flow per share excluding Lease Principal Payments (8) 1.04 n.a.
= Free Cash Flow per share (euros) 0.81 0.58 40.5Notes:- Following the consideration of the Argentine economy as hyperinflationary from an accounting perspective for periods ended after 1 July 2018, the operations of Telefónica in Argentina adjusted by inflation are to be accounted at the closing exchange rate Argentine Peso/Euro.(1) Includes cash received from dividends paid by subsidiaries that are not fully consolidated.(2) Includes government grants received.(3) Includes Net Cash received from sale of Real Estate. (4) Figures in €m. 2019 includes mainly: 129 in Mexico, 2 in Spain, 1 in UK, 3 in Colombia, 1 in Ecuador and 18 in El Salvador. In 2018 mainly: 591 in UK, 15 in Spain, 5 in Argentina, 3 in Colombia and 20 in Costa Rica.(5) Dividends paid by Telefónica S.A., operations with treasury stock, issuance of shares, issuance and coupons of undated deeply subordinated securities, issuance of mandatorily convertible bonds into Telefónica S.A. shares and operations with minority shareholders from subsidiaries that are consolidated through the equity method.(6) Includes Lease Principal Payments following IFRS 16 adoption.(7) Net financial debt calculation has been redefined in the first quarter of 2019 excluding the mark to market adjustment of the unmatured cash flow hedges associated to debt instruments. This change seeks to eliminate the asymmetry generated by the accounting valuation method of both financial instruments; the debt instrument valued at amortized cost and the derivative at market value. The change has been applied to all comparative periods. Also, following the entry into force of IFRS 16 since 1 January 2019, for comparison purposes, the net financial debt figure of December 2018 has been modified to exclude the lease liability of finance leases.(8) Considered since 1 January 2019. No data available in 2018.(9) Includes €1,860m in January-September 2019 related to commitments associated with long-term restructuring plans mainly in Spain.

18
TELEFÓNICA
EXCHANGES RATES APPLIED
P&L and CapEx (1) Statement of Financial Position (2)
Currency units per Euro Jan - Sep 2019 Jan - Sep 2018 September 2019 December 2018
USA (US Dollar) 1.124 1.194 1.091 1.145
United Kingdom (Sterling) 0.883 0.884 0.886 0.895
Argentina (Argentine Peso) (3) 62.786 47.369 62.786 43.303
Brazil (Brazilian Real) 4.364 4.276 4.543 4.438
Chile (Chilean Peso) 770.125 750.008 794.370 795.754
Colombia (Colombian Peso) 3,637.925 3,444.297 3,793.382 3,722.094
Costa Rica (Colon) 667.557 682.594 636.943 700.771
Guatemala (Quetzal) 8.641 8.895 8.438 8.861
Mexico (Mexican Peso) 21.628 22.712 21.527 22.507
Nicaragua (Cordoba) 36.993 37.435 36.578 37.030
Peru (Peruvian Nuevo Sol) 3.740 3.895 3.691 3.864
Uruguay (Uruguayan Peso) 38.713 35.886 40.295 37.116
Venezuela (4) 36,888.780 496.074 36,888.780 8,714.287(1) Average exchange rate for the period.(2) Exchange rates as of 30/09/19 and 31/12/18.(3) Following the consideration of the Argentine economy as hyperinflationary from an accounting perspective for periods ended after 1 July 2018, the operations of Telefónica in Argentina adjusted by inflation are to be accounted at the closing exchange rate Argentine Peso/Euro.(4) After considering Venezuela as a hyperinflationary country, P&L and CapEx from the operations in the country are to be accounted at the closingexchange rate Bolivar Soberano/Euro. As of the closing of September 2019 and December 2018, Telefónica uses a synthetic exchange rate of 33,777.1and 7,608.4 Venezuelan bolivars soberanos per dollar respectively.
NET FINANCIAL DEBT STRUCTURE BY CURRENCY
Unaudited figures
September 2019
EUR LATAM GBP USD
Net financial debt structure by currency 77% 11% 10% 2%
TOTAL FINANCIAL LIABILITIES BREAKDOWN
Unaudited figures
September 2019
Bonds andcommercial paper
Debt with financialinstitutions
Other financial debt(including
governments) andnet derivatives
Total financial liabilities (1) 92% 9% (1%)(1) Includes positive value of derivatives and other financial debt.
CREDIT RATINGS
Long-Term Short-Term PerspectiveDate of last rating
change
Moody's1 Baa3 P-3 Stable 7/11/2016
Fitch1 BBB F-2 Stable 5/9/2016
S&P1 BBB A-2 Stable 17/5/2016(1) The rating is issued by a credit rating agency established in the EU and registered under Regulation (EC) 1060/2009.

19
02TELEFÓNICA ESPAÑA(y-o-y changes in organic terms)
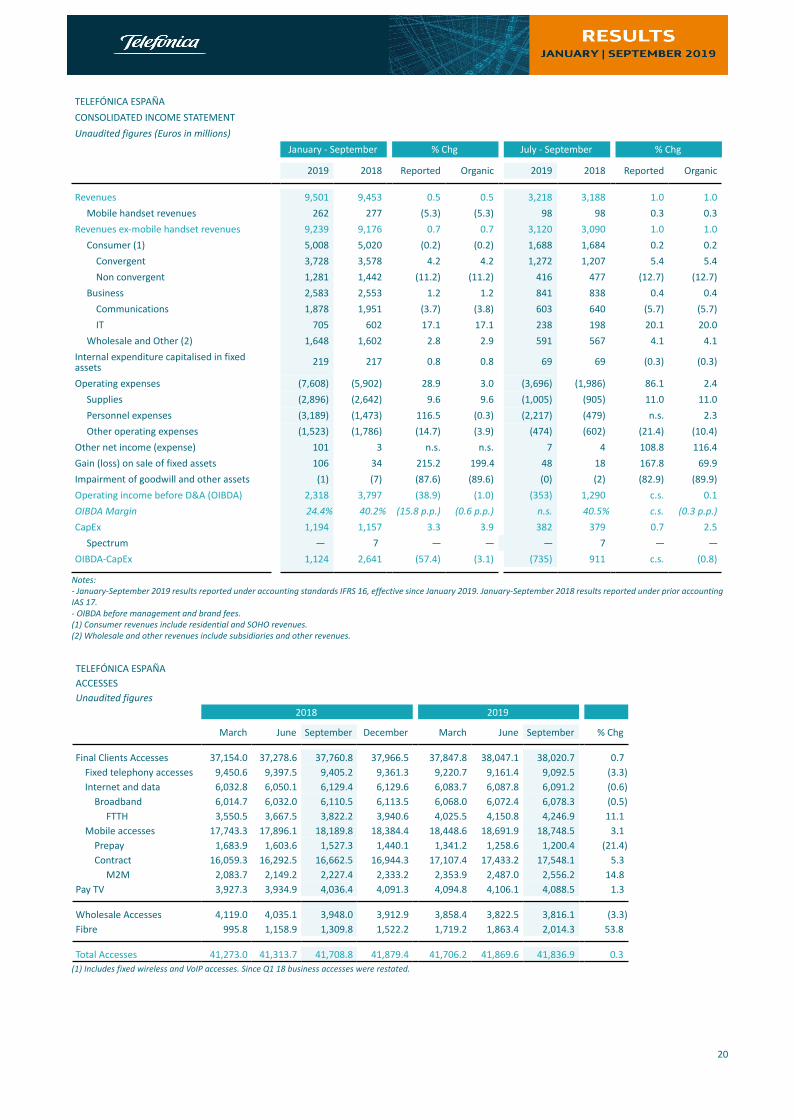
Service revenues pace of growth accelerated in the third quarter of 2019 to +1.0% y-o-y (+0.7 p.p. vs. Q2 19) and OIBDA grew again in organic terms (+0.1%, +1.8 p.p. vs. the previous quarter). This performance reflects the differential offer of Telefónica España, which supports consolidation of growth in convergent revenues (on a larger base and higher ARPU), business revenues and wholesale and others.
Convergent customers, which generate 41% of service revenues, grew 2% y-o-y to 4.7M (10k net adds). The number of convergent services increased 5% to 22.9M, resulting in an increase in services per customer (to 4.9; +3%). Particularly noteworthy was the growth in convergent accesses of premium speed fibre (+21% y-o-y), mobile contract (+7%) and pay TV (+5%) and, in parallel, the solid traction of "O2".
The higher quality of the customer base fostered convergent ARPU growth to 90.6 € in the quarter (+1.7% y-o-y). Its better y-o-y performance compared to the previous quarter was driven by: i) the increased percentage of higher ARPU customers, ii) tariff repositioning in higher value bundles (effective July 5), iii) the exit of the 2018 summer campaign promotion, and iv) the increase in the number of services per customer. These factors more than offset the dilutive effect of a higher number of "O2" customers and the seasonal promotions. Convergent churn increased in the quarter (1.6%) due to tariff changes and the end of promotions. The loyalty of high-value customers continues to be 20% higher than that of lower-value customers, despite tariffs’ changes.
Total mobile contract accesses increased 5% y-o-y, fixed broadband accesses grew for the second consecutive quarter (+6k) with retail fibre growing +11% y-o-y (+96k accesses in the quarter), whilst pay TV customers increased 1% y-o-y, with higher value pay TV customers growing at the expense of declines in lower value bundles (to a total net loss of -18k in the quarter impacted by promotions calendar).
T. España continued to increase the uptake of customers connected to its own FTTH network to 28% (+3 p.p. y-o-y) over 22.7M premises passed (+435k in the quarter). Total connected fibre accesses (retail and wholesale) reached 6.3M, with strong progress (+11% retail; x1.6 wholesale), and already accounting for 70% of retail fixed broadband customers and 53% of wholesale accesses (+20 p.p. y-o-y).
Revenues in the quarter (3,218M€) accelerated its pace of growth to 1.0% y-o-y (+0.7p.p. vs. Q2), thanks to the improved performance of service revenues (+1.0%; +0.7 p.p. sequentially). Revenues from handsets increased 0.3% y-o-y. Revenue growth vs. 3Q 18 was seen in all segments: Consumer grew again (+0.2%; +1.1 p.p.) thanks to convergent revenues (+5.4%; +2.5 p.p.) which, driven by a larger customer base and higher ARPU, now account for more than 75% of consumer revenues. Businesses accelerated their y-o-y growth (+0.4%; +0.3 p.p. sequentially) with strong growth in IT, and Wholesale & Other grew +4.1% y-o-y, in line with the previous quarter.
Operating expenses in July-September were impacted by the recognition of a provision of €1,732m in personnel expenses, mainly associated with the 2019 voluntary redundancy plan and, in addition, with the headcount reskilling programme and the update of estimates from the previous plan. This new suspension plan will generate close to 210M€ of recurring direct savings from 2020 in addition to those already captured with previous plans.
In organic terms, operating expenses in the quarter (€2,034m) grew 2.4% y-o-y (vs. +4.0% in Q2 19; +3.0% in January-September). Supplies increased 11.0% in Q3, including since the start of this new season the total gross cost of "La Liga" rights. However, and as anticipated, the net cost of content eased its pace of y-o-y growth vs the previous quarter (+11%; -10 p.p. sequential) due to the lower increase in the cost of the new football season, an effect that will become more evident in the fourth quarter. Personnel expenses increased 2.3% and reflected lower incremental savings (€12m) from the redundancy plan completed in 2018. The number of employees at the end of September stood at 25,566 (-3% y-o-y). Other operating expenses come down 10.4% due to lower commercial costs.
OIBDA in July-September rose again in organic terms (+0.1%; -1.0% in January-September), 1.8 p.p. better than in the previous quarter. In the quarter, €27m of capital gains from the sale of data centres and €18m of capital gains from the sale of real estate (€10m in Q3 18) were booked. The organic OIBDA margin stood at 40.1% in the quarter (-0.3 p.p. y-o-y) and at 39.6% in the first nine months (-0.6 p.p. y-o-y).
CapEx in January-September grew 3.9% y-o-y and OIBDA-CapEx in organic terms amounted to €2,566m.
20
TELEFÓNICA ESPAÑACONSOLIDATED INCOME STATEMENTUnaudited figures (Euros in millions)
January - September % Chg July - September % Chg
2019 2018 Reported Organic 2019 2018 Reported Organic
Revenues 9,501 9,453 0.5 0.5 3,218 3,188 1.0 1.0Mobile handset revenues 262 277 (5.3) (5.3) 98 98 0.3 0.3
Revenues ex-mobile handset revenues 9,239 9,176 0.7 0.7 3,120 3,090 1.0 1.0Consumer (1) 5,008 5,020 (0.2) (0.2) 1,688 1,684 0.2 0.2
Convergent 3,728 3,578 4.2 4.2 1,272 1,207 5.4 5.4Non convergent 1,281 1,442 (11.2) (11.2) 416 477 (12.7) (12.7)
Business 2,583 2,553 1.2 1.2 841 838 0.4 0.4Communications 1,878 1,951 (3.7) (3.8) 603 640 (5.7) (5.7)IT 705 602 17.1 17.1 238 198 20.1 20.0
Wholesale and Other (2) 1,648 1,602 2.8 2.9 591 567 4.1 4.1Internal expenditure capitalised in fixedassets 219 217 0.8 0.8 69 69 (0.3) (0.3)
Operating expenses (7,608) (5,902) 28.9 3.0 (3,696) (1,986) 86.1 2.4Supplies (2,896) (2,642) 9.6 9.6 (1,005) (905) 11.0 11.0Personnel expenses (3,189) (1,473) 116.5 (0.3) (2,217) (479) n.s. 2.3Other operating expenses (1,523) (1,786) (14.7) (3.9) (474) (602) (21.4) (10.4)
Other net income (expense) 101 3 n.s. n.s. 7 4 108.8 116.4Gain (loss) on sale of fixed assets 106 34 215.2 199.4 48 18 167.8 69.9Impairment of goodwill and other assets (1) (7) (87.6) (89.6) (0) (2) (82.9) (89.9)Operating income before D&A (OIBDA) 2,318 3,797 (38.9) (1.0) (353) 1,290 c.s. 0.1OIBDA Margin 24.4% 40.2% (15.8 p.p.) (0.6 p.p.) n.s. 40.5% c.s. (0.3 p.p.)
CapEx 1,194 1,157 3.3 3.9 382 379 0.7 2.5Spectrum — 7 — — — 7 — —
OIBDA-CapEx 1,124 2,641 (57.4) (3.1) (735) 911 c.s. (0.8)
Notes:- January-September 2019 results reported under accounting standards IFRS 16, effective since January 2019. January-September 2018 results reported under prior accounting IAS 17.- OIBDA before management and brand fees.(1) Consumer revenues include residential and SOHO revenues.(2) Wholesale and other revenues include subsidiaries and other revenues.
TELEFÓNICA ESPAÑAACCESSESUnaudited figures
2018 2019
March June September December March June September % Chg
Final Clients Accesses 37,154.0 37,278.6 37,760.8 37,966.5 37,847.8 38,047.1 38,020.7 0.7Fixed telephony accesses 9,450.6 9,397.5 9,405.2 9,361.3 9,220.7 9,161.4 9,092.5 (3.3)Internet and data 6,032.8 6,050.1 6,129.4 6,129.6 6,083.7 6,087.8 6,091.2 (0.6)
Broadband 6,014.7 6,032.0 6,110.5 6,113.5 6,068.0 6,072.4 6,078.3 (0.5)FTTH 3,550.5 3,667.5 3,822.2 3,940.6 4,025.5 4,150.8 4,246.9 11.1
Mobile accesses 17,743.3 17,896.1 18,189.8 18,384.4 18,448.6 18,691.9 18,748.5 3.1Prepay 1,683.9 1,603.6 1,527.3 1,440.1 1,341.2 1,258.6 1,200.4 (21.4)Contract 16,059.3 16,292.5 16,662.5 16,944.3 17,107.4 17,433.2 17,548.1 5.3
M2M 2,083.7 2,149.2 2,227.4 2,333.2 2,353.9 2,487.0 2,556.2 14.8Pay TV 3,927.3 3,934.9 4,036.4 4,091.3 4,094.8 4,106.1 4,088.5 1.3
Wholesale Accesses 4,119.0 4,035.1 3,948.0 3,912.9 3,858.4 3,822.5 3,816.1 (3.3)Fibre 995.8 1,158.9 1,309.8 1,522.2 1,719.2 1,863.4 2,014.3 53.8
Total Accesses 41,273.0 41,313.7 41,708.8 41,879.4 41,706.2 41,869.6 41,836.9 0.3 (1) Includes fixed wireless and VoIP accesses. Since Q1 18 business accesses were restated.

21
TELEFÓNICA ESPAÑACONSUMER ACCESSES (Convergent + Non convergent)Unaudited figures (thousands)
2018 2019
March June September December March June September % Chg
Fixed telephony accesses 6,799.9 6,721.7 6,716.6 6,657.7 6,520.7 6,453.6 6,419.7 (4.4)Internet and data accesses 5,187.7 5,198.6 5,274.0 5,272.9 5,224.9 5,225.3 5,271.8 0.0Mobile accesses 12,141.4 12,236.6 12,450.2 12,530.5 12,540.7 12,650.3 12,692.6 1.9
Prepay 1,683.9 1,603.6 1,527.3 1,440.1 1,341.2 1,258.6 1,200.4 (21.4)Contract 10,457.5 10,633.0 10,922.8 11,090.4 11,199.5 11,391.7 11,492.2 5.2
Pay TV 3,927.3 3,934.9 4,036.4 4,091.3 4,094.8 4,106.1 4,088.5 1.3
Total Consumer Accesses 28,056.3 28,091.8 28,477.1 28,552.4 28,381.0 28,435.2 28,472.7 0.0
TOTAL MOBILE ACCESSESUnaudited figures
2018 2019
March June September December March June September % Chg
Contract percentage (%) 90.5% 91.0% 91.6% 92.2% 92.7% 93.3% 93.6% 2.0 p.p.Smartphones ('000) 12,264.6 12,356.6 12,731.9 12,889.7 13,001.6 13,170.8 13,183.7 3.5
Smartphonepenetration (%) 78.5% 78.7% 79.9% 80.5% 80.9% 81.4% 81.6% 1.6 p.p.
LTE ('000) 8,002.5 8,270.0 8,596.5 8,843.2 9,006.7 9,197.5 9,362.1 8.9LTE penetration (%) 51.1% 52.5% 53.9% 55.1% 56.0% 56.8% 57.8% 4.0 p.p.
CONSUMER CONVERGENTUnaudited figures (thousands)
2018 2019
March June September December March June September % Chg
Convergent Customers 4,460.0 4,482.1 4,562.6 4,613.8 4,626.5 4,663.7 4,673.8 2.4High speed Fibre 1,708.5 1,696.9 1,773.6 1,823.4 1,885.6 2,032.1 2,148.9 21.2IPTV/Satellite 3,470.6 3,508.6 3,625.6 3,711.0 3,755.5 3,795.8 3,799.0 4.8
Mobile add-ons 4,036.7 4,248.0 4,482.3 4,687.7 4,818.0 4,968.4 5,044.5 12.5Convergent Accesses 20,887.3 21,203.0 21,795.7 22,240.0 22,453.1 22,755.2 22,892.7 5.0
CONSUMER CONVERGENTUnaudited figures
2018 2019
Q1 Q2 Q3 Q4 Q1 Q2 Q3 % Chg org.
Convergent ARPU (EUR) 87.8 89.5 89.2 88.2 88.2 88.5 90.6 1.7Convergent churn 1.5% 1.5% 1.5% 1.5% 1.7% 1.5% 1.6% 0.1 p.p.
Jan - Mar Jan - Jun Jan - Sep Jan - Dec Jan - Mar Jan - Jun Jan - Sep % Chg org.
Convergent ARPU (EUR) 87.8 88.6 88.8 88.7 88.2 88.4 89.1 0.3Convergent churn 1.5% 1.5% 1.5% 1.5% 1.7% 1.6% 1.6% 0.1 p.p.
SELECTED OPERATIONAL DATAUnaudited figures 2018 2019
Jan - Mar Jan - Jun Jan - Sep Jan - Dec Jan - Mar Jan - Jun Jan - Sep % Chg
Total data traffic (TB) 2,113,454 4,296,235 6,598,644 9,176,392 2,733,020 5,584,845 8,543,548 29.5Fixed data traffic 1,978,154 4,010,990 6,120,345 8,507,409 2,538,715 5,162,458 7,834,654 28.0Mobile data traffic 135,300 285,245 478,299 668,984 194,305 422,388 708,894 48.2
Notes:- Convergent: Fusión and Multibrand included from Q4 18.- Data traffic is defined as Terabytes used by the company customers, both upload and download (1TByte = 10^12 bytes). Promotional traffic is included. Traffic not associated to the Company's mobile customers (roaming-in, MVNOs, interconnection of third parties and other business lines) is also included. Traffic volume non-rounded.

22
03TELEFÓNICA DEUTSCHLAND(y-o-y changes in organic terms)
Telefónica Deutschland achieved strong operational and revenue momentum in both, own and partner brands. The company continued improving its network quality through LTE roll-out further enhancing customer experience. Thus, contract churn remained at low levels. A “very good” rating of the My O2 app in the latest connect test also confirmed the improvement in customer experience.
Contract mobile customers (23.3m; +6% y-o-y) registered strong 392k net additions in Q3 19 (+999k in 9M) supported again by O2 Free portfolio and partner trading (61% of gross additions in Q3; 63% in Q2), while contract churn stood at 1.5% in Q3 (flat y-o-y). Prepay customer base (20.3m; -3% y-o-y) continued to stabilise with only 3k net disconnections in Q3 (+3k in Q2). LTE accesses increased to 20.9m (+22% y-o-y), with penetration of 49% (+8 p.p. y-o-y). The average data usage for O2 contract LTE customers increased by 37% y-o-y to 5.4 GB per month in the quarter (+12% q-o-q). Retail broadband accesses improved by 7% y-o-y mainly driven by healthy VDSL demand (1.6m; +17% y-o-y; 74% of the base), after posting 53k net additions in Q3 (+178k in 9M).
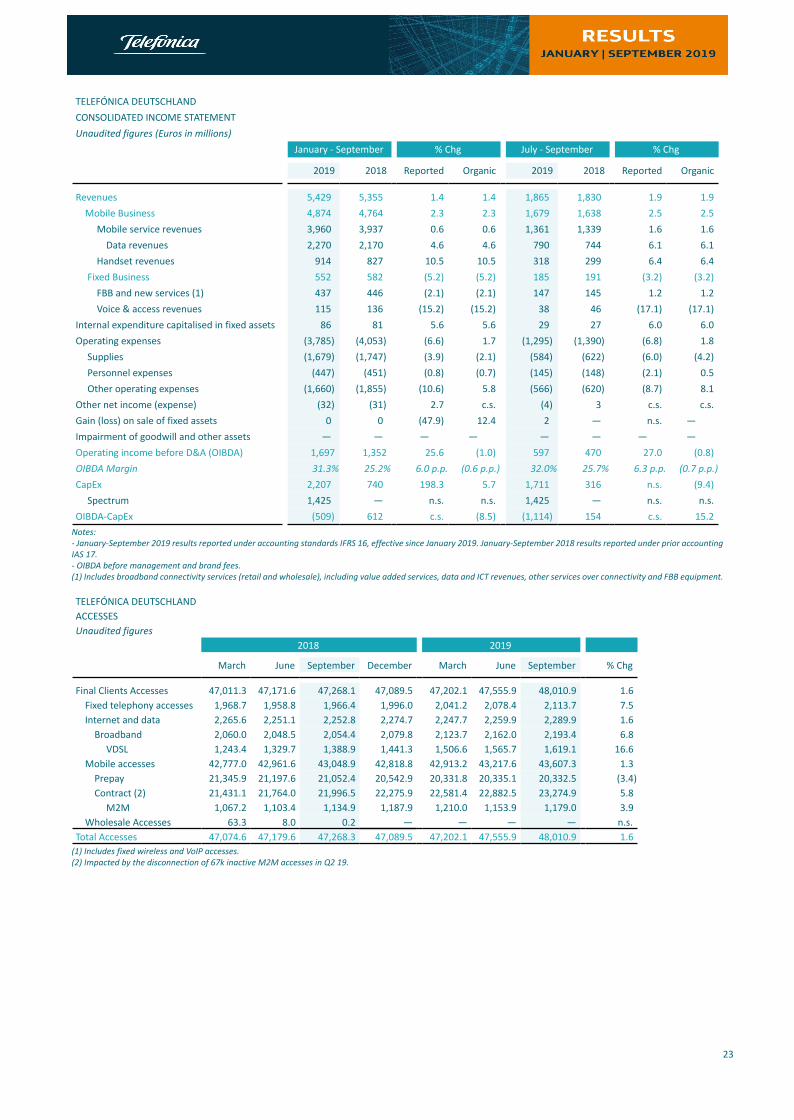
Revenues amounted to €1,865m accelerating growth to +1.9% y-o-y in Q3 19 (€5,429m in 9M; +1.4% y-o-y). Mobile service revenues totalled €1,361m, improving growth by 1.1 p.p. q-o-q to +1.6% y-o-y (€3,960m in 9M; +0.6% y-o-y) supported by the good traction of retail, also reflected in visible ARPU uplift effects in the O2 Free portfolio.
Handset revenues grew by 6.4% y-o-y to €318m in Q3 (€914m in 9M, +10.5% y-o-y), on the back of continued strong demand for high value handsets. Fixed revenues registered €185m in Q3 further reducing its decline to 3.2% y-o-y (€552m in 9M; -5.2% y-o-y) primarily driven by strong VDSL demand.
Operating expenses amounted to €1,295m in Q3 19 and increased by 1.8% y-o-y (+1.7% y-o-y in 9M). Supplies (€584m) decreased by 4.2% y-o-y (-2.1% y-o-y in 9M), mainly as a result of lower interconnectivity related cost of sales. Personnel expenses (€145m) were up 0.5% y-o-y (-0.7% y-o-y in 9M). Other operating expenses (€566m) were +8.1% y-o-y (+5.8% y-o-y in 9M), primarily driven by ongoing investment in the O2 brand positioning as well as the ongoing digital transformation. Restructuring costs amounted to €2m in the quarter (€14m in Q3 18).
OIBDA of €597m in Q3 reduced its decline by 1.0 p.p. q-o-q to -0.8% y-o-y (€1,697m in 9M; -1.0% y-o-y). This improved trend was supported by top-line growth and remaining integration synergies (roll-over effects of €5m in Q3 and €35m in 9M) while also reflecting continued transformation & market investments into the O2 brand. IFRS 16 accounting changes accounted for a positive impact of €125m in Q3 (€362m in 9M). OIBDA margin stood at 32.0% in Q3 slowing its decline to -0.7 p.p. y-o-y (-0.6 p.p. in 9M).
CapEx of €2,207m in 9M included 5G spectrum obligations (€1,425m). The continued LTE roll-out with a focus on improving customer experience primarily drove the 5.7% y-o-y growth in 9M, easing front loaded H1 effects (+16.9% y-o-y in H1). OIBDA-CapEx amounted to -€509m for January-September 2019.
23
TELEFÓNICA DEUTSCHLANDCONSOLIDATED INCOME STATEMENTUnaudited figures (Euros in millions)
January - September % Chg July - September % Chg
2019 2018 Reported Organic 2019 2018 Reported Organic
Revenues 5,429 5,355 1.4 1.4 1,865 1,830 1.9 1.9Mobile Business 4,874 4,764 2.3 2.3 1,679 1,638 2.5 2.5
Mobile service revenues 3,960 3,937 0.6 0.6 1,361 1,339 1.6 1.6Data revenues 2,270 2,170 4.6 4.6 790 744 6.1 6.1
Handset revenues 914 827 10.5 10.5 318 299 6.4 6.4Fixed Business 552 582 (5.2) (5.2) 185 191 (3.2) (3.2)
FBB and new services (1) 437 446 (2.1) (2.1) 147 145 1.2 1.2Voice & access revenues 115 136 (15.2) (15.2) 38 46 (17.1) (17.1)
Internal expenditure capitalised in fixed assets 86 81 5.6 5.6 29 27 6.0 6.0Operating expenses (3,785) (4,053) (6.6) 1.7 (1,295) (1,390) (6.8) 1.8
Supplies (1,679) (1,747) (3.9) (2.1) (584) (622) (6.0) (4.2)Personnel expenses (447) (451) (0.8) (0.7) (145) (148) (2.1) 0.5Other operating expenses (1,660) (1,855) (10.6) 5.8 (566) (620) (8.7) 8.1
Other net income (expense) (32) (31) 2.7 c.s. (4) 3 c.s. c.s.Gain (loss) on sale of fixed assets 0 0 (47.9) 12.4 2 — n.s. —Impairment of goodwill and other assets — — — — — — — —Operating income before D&A (OIBDA) 1,697 1,352 25.6 (1.0) 597 470 27.0 (0.8)OIBDA Margin 31.3% 25.2% 6.0 p.p. (0.6 p.p.) 32.0% 25.7% 6.3 p.p. (0.7 p.p.)
CapEx 2,207 740 198.3 5.7 1,711 316 n.s. (9.4)Spectrum 1,425 — n.s. n.s. 1,425 — n.s. n.s.
OIBDA-CapEx (509) 612 c.s. (8.5) (1,114) 154 c.s. 15.2Notes:- January-September 2019 results reported under accounting standards IFRS 16, effective since January 2019. January-September 2018 results reported under prior accounting IAS 17.- OIBDA before management and brand fees.(1) Includes broadband connectivity services (retail and wholesale), including value added services, data and ICT revenues, other services over connectivity and FBB equipment.
TELEFÓNICA DEUTSCHLANDACCESSESUnaudited figures
2018 2019
March June September December March June September % Chg
Final Clients Accesses 47,011.3 47,171.6 47,268.1 47,089.5 47,202.1 47,555.9 48,010.9 1.6Fixed telephony accesses 1,968.7 1,958.8 1,966.4 1,996.0 2,041.2 2,078.4 2,113.7 7.5Internet and data 2,265.6 2,251.1 2,252.8 2,274.7 2,247.7 2,259.9 2,289.9 1.6
Broadband 2,060.0 2,048.5 2,054.4 2,079.8 2,123.7 2,162.0 2,193.4 6.8VDSL 1,243.4 1,329.7 1,388.9 1,441.3 1,506.6 1,565.7 1,619.1 16.6
Mobile accesses 42,777.0 42,961.6 43,048.9 42,818.8 42,913.2 43,217.6 43,607.3 1.3Prepay 21,345.9 21,197.6 21,052.4 20,542.9 20,331.8 20,335.1 20,332.5 (3.4)Contract (2) 21,431.1 21,764.0 21,996.5 22,275.9 22,581.4 22,882.5 23,274.9 5.8
M2M 1,067.2 1,103.4 1,134.9 1,187.9 1,210.0 1,153.9 1,179.0 3.9Wholesale Accesses 63.3 8.0 0.2 — — — — n.s.
Total Accesses 47,074.6 47,179.6 47,268.3 47,089.5 47,202.1 47,555.9 48,010.9 1.6 (1) Includes fixed wireless and VoIP accesses.(2) Impacted by the disconnection of 67k inactive M2M accesses in Q2 19.

24
SELECTED OPERATIONAL DATA
Unaudited figures
2018 2019
March June September December March June September % Chg
Contract percentage (%) 50.1% 50.7% 51.1% 52.0% 52.6% 52.9% 53.4% 2.3 p.p.
Smartphones ('000) 25,707.5 26,411.1 27,079.8 27,335.3 27,779.7 28,577.0 29,420.4 8.6
Smartphone penetration (%) 62.0% 63.5% 64.9% 66.0% 66.6% 67.9% 69.3% 4.4 p.p.
LTE ('000) 16,093.5 16,595.8 17,157.3 18,433.7 19,253.6 20,175.4 20,905.3 21.8
LTE penetration (%) 38.6% 39.6% 40.9% 44.3% 46.2% 48.0% 49.3% 8.3 p.p.
Mobile churn (quarterly) 2.2% 1.8% 2.0% 2.3% 1.9% 1.8% 1.9% (0.2 p.p.)
Contract (1) 1.7% 1.5% 1.6% 1.8% 1.6% 1.5% 1.5% 0.0 p.p.
Mobile churn (cumulative YTD) 2.2% 2.0% 2.0% 2.1% 1.9% 1.8% 1.8% (0.2 p.p.)
Contract (1) 1.7% 1.6% 1.6% 1.6% 1.6% 1.5% 1.5% (0.1 p.p.)
Mobile ARPU (EUR)(cumulative YTD) 9.8 9.9 10.0 10.0 9.8 9.9 10.0 0.2
Prepay 5.6 5.7 5.8 5.8 5.7 5.8 6.0 3.3
Contract (1) 14.8 14.8 14.9 14.9 14.2 14.3 14.3 (3.5)
Fixed data traffic (TB) (cumulative YTD) 718,369 1,383,972 2,067,582 2,887,439 766,641 1,569,617 2,393,790 15.8
Mobile data traffic (TB) (cumulative YTD) 126,040 277,660 443,100 622,349 193,007 419,760 672,282 51.7Notes:- ARPU: monthly average revenue divided by the monthly average accesses of the period. % organic change.- Data traffic is defined as Terabytes used by the company customers, both upload and download (1TByte = 10^12 bytes). Promotional traffic is included. Traffic not associated to the Company's mobile customers (roaming-in, MVNOs, interconnection of third parties and other business lines) is also included. Traffic volume non-rounded.(1) Excludes M2M.

25
04TELEFÓNICA UK(y-o-y changes in organic terms)
Telefónica UK continued posting a strong set of results in the third quarter, delivering healthy growth across all key financial metrics and all main segments of its customer base in a competitive market environment. The Company reiterated its market leading position and remained UK’s favourite mobile network with sector leading loyalty at 1.0%, supported by the continued success of its innovative propositions such as “Custom Plans”. Towards the end of the quarter and coinciding with the latest smartphone launches, Telefónica UK successfully introduced its first offer for customers seeking unlimited mobile data while providing upselling opportunities.
Mobile accesses totalled 34.1m customers at the end of September (including MVNO partners), growing by 6% y-o-y. Own brand contract net additions of 496k (43k ex-M2M) gained further traction in Q3 (Q2: 392k, 28k ex-M2M), driving growth of 9% y-o-y to 17.4m contract customers (67% penetration, +2 p.p. y-o-y). MVNO partners continued good commercial performance and recorded net additions of 188k in Q3 (+454k in 9M) and reached a 8.1m customer base at the end of Q3 (+8% y-o-y) . Prepay quarterly net additions turned positive and stood at 142k in Q3 (-118k in 9M), supported by seasonality.
Revenues posted healthy growth of 4.1% y-o-y to €1,773m (€5,184m; +4.7% in 9M). This solid growth trend was primarily driven by handset revenues on the back of increasing customer appetite for high value handsets, progress in the Smart Metering Implementation Programme (SMIP) and increased MVNO revenues.
Mobile service revenues (MSR) totalled €1,193m, a decline of 2.8% y-o-y (€3,577m; -1.4% in 9M), again mainly due to regulatory impacts (i.e. out of bundle spend caps, intra-EU calling), a smaller y-o-y RPI increase and lower out of bundle spend, while partially mitigated by continued MVNO growth. Since the introduction of IFRS 15 and “Custom Plans”, MSR has developed into a less meaningful metric as the allocation between MSR and handset revenues is based on a stand-alone selling price.
Handset & other revenues of €580m were up 22.1% y-o-y (€1,607m in 9M; +21.6%y-o-y), primarily due to increasing customer appetite for high value handsets (through “Custom Plans”) as well as continued growth from SMIP.
Operating expenses totalled €1,251m and increased by 2.8% y-o-y in Q3 19 (+3.3% in 9M), mainly due to higher handset trading, non-mobile business growth and higher Annual License Fee payments (ALFs) from February 2019. Supplies (€639m) grew by 12.8% y-o-y (+9.9% in 9M) primarily as a result of increased costs for higher-value handsets and other services growth; Personnel expenses amounted to €114m in Q3 and increased by 2.9% y-o-y (+7.7% in 9M). Other expenses (€498m) decreased by 7.1% y-o-y in Q3 (-4.1% in 9M) on the back of efficient commercial cost management.
OIBDA strongly grew by 5.7% y-o-y and totalled €543m in Q3 19 (+6.2% in 9M; €1,595m), mainly driven by healthy top-line performance and supported by ongoing efficient cost management. IFRS16 accounting changes resulted in a positive impact of €58m in Q3 (€167m in 9M). OIBDA margin increased by 0.4 p.p. y-o-y in Q3 (+0.4 p.p. y-o-y in 9M).
CapEx amounted to €652m in 9M 19, up 6.1% y-o-y, reflecting continued investment in network capacity, customer experience and the start of laying the foundations for 5G. OIBDA-CapEx grew by 6.2% y-o-y in 9M to €943m.

26
TELEFÓNICA UKCONSOLIDATED INCOME STATEMENTUnaudited figures (Euros in millions)
January - September % Chg July - September % Chg
2019 2018 Reported Organic 2019 2018 Reported Organic
Revenues 5,184 4,945 4.8 4.7 1,773 1,721 3.0 4.1Mobile service revenues 3,577 3,625 (1.3) (1.4) 1,193 1,241 (3.9) (2.8)
Data revenues 2,048 2,065 (0.8) (0.9) 676 698 (3.2) (2.1)Handset revenues and other 1,607 1,319 21.8 21.6 580 480 20.9 22.1
Internal expenditure capitalised in fixed assets 109 92 19.4 19.3 34 29 16.9 18.4Operating expenses (3,645) (3,687) (1.1) 3.3 (1,251) (1,286) (2.7) 2.8
Supplies (1,782) (1,668) 6.8 9.9 (639) (589) 8.6 12.8Personnel expenses (357) (331) 7.8 7.7 (114) (112) 1.6 2.9Other operating expenses (1,506) (1,688) (10.8) (4.1) (498) (585) (14.9) (7.1)
Other net income (expense) (60) (6) n.s. n.s. (12) (1) n.s. n.s.Gain (loss) on sale of fixed assets 7 — n.s. n.s. (2) 0 n.s n.sImpairment of goodwill and other assets — — — — — — — —Operating income before D&A (OIBDA) 1,595 1,343 18.7 6.2 543 464 17.0 5.7OIBDA Margin 30.8% 27.2% 3.6 p.p. 0.4 p.p. 30.6% 26.9% 3.7 p.p. 0.4 p.p.
CapEx 652 1,202 (45.8) 6.1 242 215 12.6 13.6Spectrum — 588 — — — — — —
OIBDA-CapEx 943 141 n.s. 6.2 301 249 20.8 (1.0)
Notes:- January-September 2019 results reported under accounting standards IFRS 16, effective since January 2019. January-September 2018 results reported under prior accounting IAS 17.- OIBDA before management and brand fees.
TELEFÓNICA UKACCESSESUnaudited figures (Thousands)
2018 2019
March June September December March June September % Chg
Fixed telephony accesses (1) 285.8 296.1 301.3 306.9 309.3 310.9 312.2 3.6Internet and data accesses 25.7 26.6 27.7 28.1 28.4 28.5 28.7 3.8
Broadband 25.7 26.6 27.7 28.1 28.4 28.5 28.7 3.8Mobile accesses 24,775.3 24,758.7 24,821.4 25,044.1 25,056.2 25,396.5 26,034.6 4.9
Prepay 8,959.1 8,858.3 8,804.0 8,742.6 8,534.6 8,482.6 8,625.1 (2.0)Contract 15,816.2 15,900.3 16,017.4 16,301.4 16,521.6 16,913.9 17,409.4 8.7
M2M 3,370.1 3,411.7 3,408.3 3,578.0 3,785.2 4,149.1 4,601.3 35.0Wholesale accesses 7,247.1 7,340.0 7,457.2 7,599.2 7,690.1 7,865.3 8,053.2 8.0
Mobile wholesale accesses 7,247.1 7,340.0 7,457.2 7,599.2 7,690.1 7,865.3 8,053.2 8.0Total accesses 32,334.0 32,421.4 32,607.6 32,978.3 33,084.0 33,601.3 34,428.7 5.6
(1) Includes fixed wireless and VoIP accesses.
MOBILE ACCESSESUnaudited figures (Thousands)
2018 2019
March June September December March June September % Chg
Retail mobile accesses 24,775.3 24,758.7 24,821.4 25,044.1 25,056.2 25,396.5 26,034.6 4.9
Wholesale mobile accesses 7,247.1 7,340.0 7,457.2 7,599.2 7,690.1 7,865.3 8,053.2 8.0
Total mobile accesses 32,022.4 32,098.6 32,278.6 32,643.2 32,746.3 33,261.8 34,087.7 5.6

27
SELECTED OPERATIONAL DATAUnaudited figures
2018 2019
March June September December March June September % Chg
Contract percentage (%) 63.8% 64.2% 64.5% 65.1% 65.9% 66.6% 66.9% 2.3 p.p.
Smartphones ('000) 15,917.8 15,979.7 15,824.1 16,302.8 16,325.0 16,523.4 16,767.3 6.0
Smartphone penetration (%) 77.2% 77.8% 76.8% 79.0% 79.8% 80.9% 81.4% 4.6 p.p.
LTE ('000) 12,773.3 12,500.3 13,362.6 13,502.1 13,728.1 14,110.4 15,089.5 12.9
LTE penetration (%) 59.7% 58.6% 62.4% 62.9% 64.5% 66.4% 70.4% 8.0 p.p.
Mobile churn (quarterly) 1.9% 1.9% 2.1% 1.9% 1.9% 1.7% 1.7% (0.4 p.p.)
Contract (1) 1.0% 1.0% 1.0% 1.0% 0.9% 0.9% 1.0% (0.1 p.p.)
Mobile churn (cumulative YTD) 1.9% 1.9% 2.0% 1.9% 1.9% 1.8% 1.8% (0.2 p.p.)
Contract (1) 1.0% 1.0% 1.0% 1.0% 0.9% 0.9% 0.9% (0.1 p.p.)
Mobile ARPU (EUR)(cumulative YTD) 14.7 15.0 15.1 15.1 14.6 14.7 14.5 (4.3)
Prepay 6.8 6.9 7.1 7.1 7.2 7.4 7.4 4.2
Contract (1) 24.2 24.7 24.8 24.6 23.7 23.8 23.6 (4.9)
Mobile data traffic (TB) (cumulative YTD) 126,797 274,846 442,731 613,219 177,868 381,754 601,112 35.8Notes: - ARPU: monthly average revenue divided by the monthly average accesses of the period. % organic change.- Data traffic is defined as Terabytes used by the company customers, both upload and download (1TByte = 10^12 bytes). Promotional traffic is included. Traffic not associated to the Company's mobile customers (roaming-in, MVNOs, interconnection of third parties and other business lines) is also included. Traffic volume non-rounded.(1) Excludes M2M.

28
05TELEFÓNICA BRASIL(y-o-y changes in organic terms)
Telefónica Brasil posted a significant revenue growth acceleration in Q3 to +2.6% y-o-y, the highest in the last 15 quarters, namely thanks to strong mobile service revenues (3 p.p. sequential improvement in contract and 6 p.p. in prepay). OIBDA rose by 3.6% on revenue growth and digitalisation efforts, once again allowing for margin expansion, which stood at 42.7%.
Vivo continued to lead the mobile market, both in total mobile accesses (market share of 32.3% as of August) and in contract accesses (39.8% as of August). The latter were up 7% y-o-y after registering 585k net adds in the quarter, with stable churn rate compared to Q2 despite tariff hikes implemented during the quarter. Prepay accesses fell 10% (due to migrations to contract and reflecting a general market trend), although accesses with frequent top-ups increased due to the improved commercial offering, which, coupled with the progressive rise in tariffs, resulted into an increase in prepay ARPU of 10.1% in the quarter (+4.7% in total ARPU).
In the fixed business, both FTTH deployment and connections accelerated, reaching 10.2M premises passed (0.6m in the quarter, 2.2m in the last 12 months), and an uptake of 23% (+1 p.p. y-o-y). During the quarter, the strategic decision to abandon the commercialisation of Pay TV services via satellite (DTH) was made, focusing service growth on IPTV (accesses +27% y-o-y; +33k new accesses in the quarter). Growth in FTTH and IPTV accesses boosted ARPU in the quarter (+12.0% and +3.9% y-o-y in broadband and pay TV, respectively).
Revenues in the quarter (€2,507m) accelerated their growth to +2.6% y-o-y (+1.6% in 9M) thanks to the improved performance of the mobile business and despite the decline in the fixed business and the regulatory impact.
Mobile revenues were up 6.6% y-o-y (+4.5% in 9M). Mobile service revenues accelerated to +4.6% (+0.1% in Q2, +2.1% in 9M) due to better trends in both contract (+6.8% in Q3, +6.2% in 9M) and prepay (-0.8% in Q3, -8.9% in 9M) after the price increases previously mentioned and the higher quality of prepay accesses. Handset revenues continued growing at very high rates (+31.5% in July-September, +38.4% in January-September) thanks to the greater focus on handsets sales with positive margin.
Fixed revenues were down 3.9% y-o-y (-3.3% in 9M), impacted by the fall in voice, traditional accesses and DTH revenues; however, broadband and new service revenues continued posting solid growth (+8.9% y-o-y in Q3, +9.3% in 9M) due to the gradual connection of fibre and IPTV accesses. As the transformation process in the company continued, 67% (+6 p.p. y-o-y) of fixed revenues already come from broadband and new services and Pay TV.
Operating expenses (€1,528m in the quarter) increased 4.3% y-o-y (+2.3% in 9M) due to the growth in handset consumption and were partially offset by the continuous progress in digitalisation.
Supplies (€415m) rose 6.1% y-o-y (+5.6% in 9M) due to higher handset consumption, partially offset by lower interconnection costs. Personnel expenses (€258m) increased by 5.4% (+0.3% in 9M) due to the internalisation process of IT/systems and activities associated with strategic and transformation investment projects, which therefore led to a positive impact on internal expenditure capitalised in fixed assets. Other operating expenses (€855m) were up 2.9% (+1.1% in 9M) due to higher network and systems expenses, partially offset by lower call centre, billing, advertising, and back office expenses.
OIBDA reached €1,071m (+€109m due to IFRS 16 and +€324m in 9M) and returned to positive growth (+3.6% y-o-y; -0.6% in 2Q; +2.0% in 9M). Additionally, €15m in capital gains from the sale of data centres were registered in the quarter.
OIBDA margin in the quarter stood at 42.7% (+0.4 p.p. y-o-y; 41.4% in January-September, +0.2 p.p. y-o-y).
CapEx in January-September amounted to €1,486m (+6.7% y-o-y), devoted to FTTH deployment (33 new cities deployed in the first nine months) and the expansion of the 4G network to 3,190 cities (88.5% population coverage; +1 p.p. y-o-y). CapEx accounted for 20% of revenues (+1 p.p. y-o-y).
OIBDA-CapEx reached €1,635m in the first nine months, -2.9% as a result of the acceleration of investments.

29
TELEFÓNICA BRASILCONSOLIDATED INCOME STATEMENTUnaudited figures (Euros in millions)
January - September % Chg July - September % Chg
2019 2018 Reported Organic 2019 2018 Reported Organic
Revenues 7,536 7,572 (0.5) 1.6 2,507 2,345 6.9 2.6Mobile Business 4,861 4,748 2.4 4.5 1,625 1,463 11.1 6.6
Mobile service revenues 4,431 4,431 0.0 2.1 1,479 1,355 9.1 4.6Data revenues 3,610 3,471 4.0 6.1 1,182 1,076 9.9 5.5
Handset revenues 429 317 35.6 38.4 146 108 35.8 31.5Fixed Business 2,676 2,825 (5.3) (3.3) 882 882 0.0 (3.9)
FBB and new services (1) 1,426 1,331 7.1 9.3 490 434 12.9 8.9Pay TV 318 336 (5.3) (3.3) 102 107 (4.4) (8.0)Voice & access revenues 931 1,157 (19.5) (17.8) 290 341 (15.1) (18.8)
Internal expenditure capitalised in fixed assets 115 88 31.1 33.8 42 27 57.2 50.6Operating expenses (4,580) (4,284) 6.9 2.3 (1,528) (1,312) 16.5 4.3
Supplies (1,261) (1,498) (15.9) 5.6 (415) (465) (10.8) 6.1Personnel expenses (758) (808) (6.3) 0.3 (258) (234) 10.5 5.4Other operating expenses (2,562) (1,978) 29.5 1.1 (855) (613) 39.5 2.9
Other net income (expense) (2) (53) (96.9) c.s. 10 5 105.2 247.3Gain (loss) on sale of fixed assets 53 7 n.s. n.s. 42 9 n.s. 218.1Impairment of goodwill and other assets (2) 2 c.s. c.s. (2) 1 c.s. c.s.Operating income before D&A (OIBDA) 3,121 3,332 (6.3) 2.0 1,071 1,075 (0.4) 3.6OIBDA Margin 41.4% 44.0% (2.6 p.p.) 0.2 p.p. 42.7% 45.9% (3.1 p.p.) 0.4 p.p.
CapEx 1,486 1,422 4.5 6.7 553 530 4.2 1.6Spectrum — — — — — — — —
OIBDA-CapEx 1,635 1,910 (14.4) (2.9) 518 545 (4.9) 6.6
Notes:- January-September 2019 results reported under accounting standards IFRS 16, effective since January 2019. January-September 2018 results reported under prior accounting IAS 17.- OIBDA before management and brand fees.(1) Includes broadband connectivity services (retail and wholesale), including value added services, ICT revenues, other services over connectivity and FBB equipment.
TELEFÓNICA BRASIL
ACCESSES
Unaudited figures (Thousands)
2018 2019
March June September December March June September % Chg
Final Clients Accesses 97,905.1 97,897.8 96,817.2 95,287.2 95,091.7 94,458.3 93,815.0 (3.1)
Fixed telephony accesses (1) 13,679.5 13,459.7 13,209.6 13,004.6 12,557.9 11,891.0 11,384.9 (13.8)
Internet and data accesses 7,544.9 7,569.9 7,583.4 7,564.7 7,493.2 7,371.7 7,222.9 (4.8)
Broadband 7,476.6 7,489.9 7,502.6 7,485.2 7,414.4 7,297.1 7,150.8 (4.7)
FTTx/Cable 4,643.2 4,791.7 4,917.3 4,991.1 5,031.5 5,041.1 5,055.4 2.8
Mobile accesses 75,089.3 75,253.9 74,423.6 73,151.3 73,519.1 73,735.3 73,824.4 (0.8)
Prepay 37,599.0 36,827.1 35,017.0 32,754.4 32,506.2 32,030.2 31,533.9 (9.9)
Contract 37,490.3 38,426.8 39,406.7 40,396.9 41,012.8 41,705.1 42,290.5 7.3
M2M 6,664.9 7,105.5 7,628.7 8,203.3 8,674.5 9,115.8 9,469.8 24.1
Pay TV 1,591.5 1,614.3 1,600.5 1,566.6 1,521.5 1,460.2 1,382.7 (13.6)
Total Accesses T. Brasil 97,919.1 97,912.7 96,832.0 95,302.0 95,106.4 94,472.8 93,828.7 (3.1)(1) Includes fixed wireless and VoIP accesses.

30
SELECTED OPERATIONAL DATAUnaudited figures
2018 2019
March June September December March June September % Chg
Contract percentage (%) 49.9% 51.1% 52.9% 55.2% 55.8% 56.6% 57.3% 4.3 p.p.
Smartphones ('000) 56,291.8 57,636.1 58,725.5 57,834.5 56,282.3 55,157.2 59,048.1 0.5
Smartphone penetration (%) 83.8% 86.0% 89.3% 90.4% 88.1% 86.5% 93.0% 3.7 p.p.
LTE ('000) 37,566.4 39,404.1 40,325.9 41,103.8 42,956.1 45,192.4 46,830.4 16.1
LTE penetration (%) 54.9% 57.8% 60.4% 63.3% 66.2% 69.9% 72.8% 12.4 p.p.
Mobile churn (quarterly) 3.1% 3.0% 3.7% 4.1% 3.2% 3.4% 3.4% (0.2 p.p.)
Contract (1) 1.6% 1.8% 1.9% 1.7% 1.7% 1.8% 1.8% (0.1 p.p.)
Mobile churn (cumulative YTD) 3.1% 3.0% 3.3% 3.5% 3.2% 3.3% 3.3% 0.1 p.p.
Contract (1) 1.6% 1.7% 1.8% 1.7% 1.7% 1.8% 1.8% 0.0 p.p.
Mobile ARPU (EUR)(cumulative YTD) 7.0 6.6 6.4 6.4 6.7 6.5 6.5 2.9
Prepay 3.2 3.0 2.8 2.8 2.8 2.8 2.8 2.7
Contract (1) 13.0 12.4 11.9 11.9 12.2 11.8 11.7 (0.7)
Mobile data traffic (TB) (cumulative YTD) 228,836 477,228 777,616 1,110,125 381,864 781,043 1,230,922 58.3
Fixed telephony ARPU (EUR) (cumulative YTD) 10.3 9.8 9.3 9.1 8.4 8.4 8.3 (9.0)
Pay TV ARPU (EUR) (cumulative YTD) 24.7 23.9 23.3 23.5 23.8 23.7 23.8 4.1
Broadband ARPU (EUR) (cumulative YTD) 13.2 12.7 12.6 13.0 14.0 14.0 14.1 14.0
Fixed data traffic (TB) (cumulative YTD) 4,838,067 10,190,227 15,949,403 21,954,704 6,201,789 12,436,560 18,907,997 18.5Notes:- ARPU: monthly average revenue divided by the monthly average accesses of the period. % organic change.- Data traffic is defined as Terabytes used by the company customers, both upload and download (1TByte = 10^12 bytes). Promotional traffic is included. Traffic not associated to the Company's mobile customers (roaming-in, MVNOs, interconnection of third parties and other business lines) is also included. Traffic volume non-rounded.(1) Excludes M2M.

31
06TELEFÓNICA HISPAM SUR(y-o-y changes in organic terms)
Hispam Sur's third quarter results maintained a solid y-o-y growth trend in both revenues and OIBDA (+16.1% and +15.6% y-o-y respectively), reflecting growth in value accesses (contract and FTTx/Cable), tariffs update in Argentina and savings from digitalisation.
Contract mobile accesses (+1.6% y-o-y) presented positive net additions in all countries for another quarter, thanks to the offer differentiation with new functionalities, and to Movistar Play's launch in all countries (OTT Pay TV service with 801k active users). The transformation process continued in the fixed business, with FTTx/Cable accesses increasing to 2.9m (+96k connected in Q3) reaching an uptake of 31% (+2 p.p. y-o-y) despite the deployment acceleration (9.5m premises passed, +1.7m in the last twelve months).
Revenues amounted to €1,430m in Q3, up 16.1% y-o-y (+16.3% in 9M) mainly on growth in value, tariffs update in Argentina, back to growth in Peru after two and a half years, and acceleration of broadband revenues in Chile; all of this despite the regulatory impact in Chile and Peru (impact of -1.6 p.p. in the quarter's growth, -1.8 p.p. in 9M).
Operating expenses increased 18.7% y-o-y (+19.0% in 9M) due to higher expenses in Argentina (inflation impact and Argentinian peso depreciation), partially offset by efficiencies achieved in all countries and lower interconnection expenses following regulatory changes in Chile and Peru. €93m in restructuring costs were registered in the quarter (€24m in Q3 18). OIBDA (€331m in Q3; +€22m due to IFRS 16 and +€81m in 9M) grew 15.6% y-o-y in the quarter (+13.6% in 9M). Additionally, €29m of capital gains from the sale of data centres were registered in the quarter.
OIBDA margin stood at 23.1% (stable y-o-y; 26.5% in January-September, -0.7 p.p. y-o-y).
CapEx for January-September amounted to €678m, +9.8% y-o-y mainly allocated to the deployment of LTE, FTTx and cable networks. CapEx represented 14% of revenues (-1 p.p. y-o-y). OIBDA-CapEx totalled €589m in 9M (+17.9% y-o-y).
In the third quarter, Telefónica Argentina showed a consistent growth trend in revenues and OIBDA (+47.7% and +31.5% respectively) thanks to the increase in value accesses, the gradual tariffs update and handset sales with higher markup, in an environment of high inflation and currency depreciation.
Reported results for January-September 2019 were affected by the accounting treatment of Argentina as a hyperinflationary economy, impacting reported terms: revenue (Q3: -€210m; 9M: -€157m); OIBDA (Q3: -€64m; 9M: -€76m); CapEx (Q3: -€22m; 9M: -€19m).
Mobile accesses (17.0m) decreased by 8% y-o-y due to prepay (-13%, negatively impacted by the obligation to identify prepay users since March 2018, with no significant impact on revenues); however, accesses with frequent top-up increased (+105k in the quarter). In contract, accesses grew by 0.5% y-o-y with positive net additions in the quarter and positive portability (+7.6k accesses). ARPU rose 39.5% y-o-y in 9M on the back of higher contract weight and gradual tariffs increase.
Retail broadband accesses (1.4m; -10% impacted by the decrease in ADSL) posted solid ARPU growth (+76.5% in the quarter, +65.4% in 9M) thanks to tariff updates and the gradual connection to FTTx networks, which accesses increased by 1.4x y-o-y to 566k by September (34k connected in the quarter). Premises passed rose to 2.5m. Pay TV accesses totalled 130k, with quarterly net additions of 39k. Movistar Play service (launched in March) accounted for 142k active users as of September.
Revenues grew by 47.7% y-o-y to €362m in July-September (€1,575m in January-September, +45.3%). Operating expenses(€273m in the quarter) rose by 54.0% y-o-y (€1,179m; +53.2% in 9M), affected by the impact of the peso depreciation and inflation (mainly on personnel and energy expenses) and by higher commercial expenses. OIBDA in the quarter totalled €94m, €419m in January-September (+€10m due to IFRS 16 adoption; +€25m in 9M) and increased by 31.5% en Q3 (+28.1%en 9M). OIBDA margin stood at 26.0% (-3.3 p.p. y-o-y) and at 26.6% in January-September (-3.7 p.p.).
CapEx in the first nine months amounted to €212m, accounting for 13% of sales, mainly devoted to the fibre and 4G network expansion. OIBDA-CapEx stood at €207m in September (+44.2% y-o-y).

32
In the third quarter Telefónica Chile maintained its focus in value, highlighting the increase in FTTx accesses, that together with IT's good performance, resulted into a solid growth in fixed broadband and new services revenues (+6.4% y-o-y).
Contract accesses grew (+6% y-o-y) after posting +45k net additions (+17k in Q2) thanks to the improved commercial offering. Prepaid (-21%) continued affected by market aggressiveness and migrations to contract. Fixed broadband ARPU accelerated its growth to +10.2% in Q3 (vs. +3.9% in Q2) on the gradual connection of FTTx accesses (+28% y-o-y) driven by the good performance of FTTH (+65%). Pay TV accesses (-16% y-o-y) fell on DTH reduction (less focus on the service), despite IPTV accesses increased (+33% y-o-y).
Revenues for the quarter (€470m) decreased by 5.1% (€1,456m; -3.9% in January-September), impacted by regulation (-2.4% in Q3 and -1.6% in 9M when excluding this impact) and intense competition in the mobile business. It is worth to highlight FTTH revenues growth (x2 y-o-y) and the good performance of IT and cloud. Operating expenses (€311m in Q3) decreased by 6.4% y-o-y (€973m and -5.2% in 9M) thanks to the efficiency measures implemented (mainly in customer service and billing) and lower termination expenses. OIBDA totalled €183m in Q3 and €521m in 9M (+€11m following IFRS 16 adoption; +€49m in 9M) and rose 5.2% y-o-y in the quarter (+1.1% in 9M). Additionally, €14m of capital gains were registered from the sale of data centres in the quarter. OIBDA margin stood at 39.0% in Q3 (+3.3 p.p. y-o-y; +1.6 p.p. in 9M).
CapEx (€254m in January-September; +12.9% y-o-y, 17% of revenues; +2.6 p.p. y-o-y) was mainly devoted to FTTH deployment (1.5m premises passed as of September, +53% y-o-y). Y-o-y change and weight on revenues for 9M cannot be extrapolated to the full year, given the different execution levels of investment in both years. OIBDA-CapEx totalled €268m in September (-10.4% y-o-y).
Telefónica Perú posted revenue growth in the third quarter (+0.6% y-o-y vs. -0.9% in Q2) after decreasing for two and a half years, leveraged on the gradual tariffs updates in the fixed service and handset sales, and despite the tough competitive environment and the regulatory impact (57% cut in mobile termination rate from 1st January). OIBDA rose on revenues evolution, efficiencies capture and capital gains from the sale of data centres (€12m).
Mobile accesses (12.5m) decreased by 7% y-o-y due to the fall in prepay and the disconnection of inactive accesses in the first quarter. However, it is worth to highlight contract net additions in Q3 (174k; +251k in 9M), which resulted in a 6% growth in accesses excluding the aforementioned disconnection. Retail broadband accesses (2.0m) rose by 7% y-o-y, thanks to the growth in FTTx and cable accesses (+26%; 1.7m connected) which, coupled with the tariffs update mentioned above, drove ARPU growth. Premises passed with FTTx and cable amounted to 4.8m after passing 548k premises in the last 12 months (160k in Q3). Pay TV accesses (1.6m) increased by 4% y-o-y.
The Movistar Total convergent offering (launched in January) already has 156k customers, while the Movistar Play OTT service has 504k active accesses in September.
Revenues (€547m) reverted the negative trend in the quarter (+0.6% y-o-y; €1,600m, -0.6% in 9M) and would have grown by 2.7% excluding the regulatory impact, driven by handset sales (+3.2% y-o-y) with higher margin, and the y-o-y growth in fixed revenues (+3.4%; +4.4% in January-September).
Operating expenses (€547m) rose by 5.2% (€1,413m; +3.0% in 9M) due to higher commercial activity and partly offset by higher efficiencies. €87m of personnel restructuring costs were included in the quarter (€20m in Q3 18). Thus, OIBDA in the quarter stood at €33m and €265m in January-September (+€2m positive impact on IFRS 16 adoption; +€5m in 9M), and rose by 3.9% y-o-y (+4.1% in January-September). OIBDA margin stood at 6.0% (+0.6 p.p. y-o-y) and at 16.6% in January-September (+1.0 p.p.).
CapEx in January-September (€196m; -2.1% y-o-y), accounted for 12% of revenues (-0.2 p.p vs. 9M 18) and was focused on 4G, fibre and cable networks deployment. OIBDA-CapEx totalled €69m (+14.3% y-o-y).
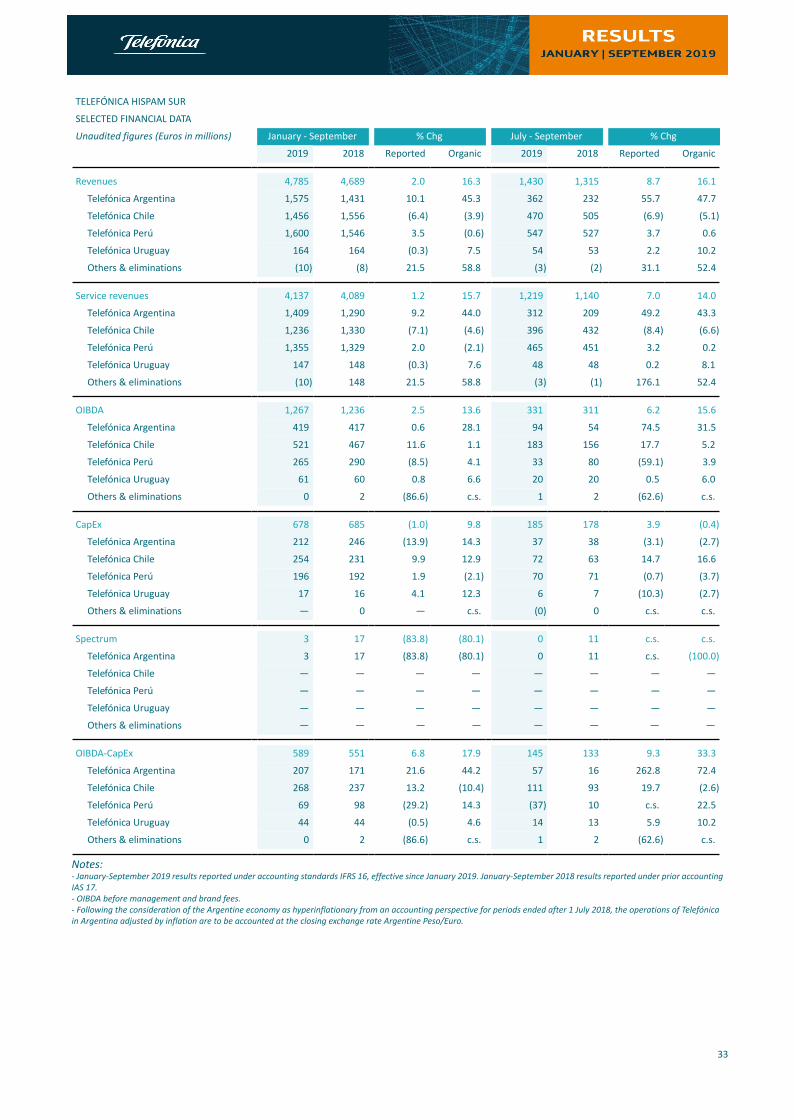
33
TELEFÓNICA HISPAM SUR
SELECTED FINANCIAL DATA
Unaudited figures (Euros in millions) January - September % Chg July - September % Chg
2019 2018 Reported Organic 2019 2018 Reported Organic
Revenues 4,785 4,689 2.0 16.3 1,430 1,315 8.7 16.1
Telefónica Argentina 1,575 1,431 10.1 45.3 362 232 55.7 47.7
Telefónica Chile 1,456 1,556 (6.4) (3.9) 470 505 (6.9) (5.1)
Telefónica Perú 1,600 1,546 3.5 (0.6) 547 527 3.7 0.6
Telefónica Uruguay 164 164 (0.3) 7.5 54 53 2.2 10.2
Others & eliminations (10) (8) 21.5 58.8 (3) (2) 31.1 52.4
Service revenues 4,137 4,089 1.2 15.7 1,219 1,140 7.0 14.0
Telefónica Argentina 1,409 1,290 9.2 44.0 312 209 49.2 43.3
Telefónica Chile 1,236 1,330 (7.1) (4.6) 396 432 (8.4) (6.6)
Telefónica Perú 1,355 1,329 2.0 (2.1) 465 451 3.2 0.2
Telefónica Uruguay 147 148 (0.3) 7.6 48 48 0.2 8.1
Others & eliminations (10) 148 21.5 58.8 (3) (1) 176.1 52.4
OIBDA 1,267 1,236 2.5 13.6 331 311 6.2 15.6
Telefónica Argentina 419 417 0.6 28.1 94 54 74.5 31.5
Telefónica Chile 521 467 11.6 1.1 183 156 17.7 5.2
Telefónica Perú 265 290 (8.5) 4.1 33 80 (59.1) 3.9
Telefónica Uruguay 61 60 0.8 6.6 20 20 0.5 6.0
Others & eliminations 0 2 (86.6) c.s. 1 2 (62.6) c.s.
CapEx 678 685 (1.0) 9.8 185 178 3.9 (0.4)
Telefónica Argentina 212 246 (13.9) 14.3 37 38 (3.1) (2.7)
Telefónica Chile 254 231 9.9 12.9 72 63 14.7 16.6
Telefónica Perú 196 192 1.9 (2.1) 70 71 (0.7) (3.7)
Telefónica Uruguay 17 16 4.1 12.3 6 7 (10.3) (2.7)
Others & eliminations — 0 — c.s. (0) 0 c.s. c.s.
Spectrum 3 17 (83.8) (80.1) 0 11 c.s. c.s.
Telefónica Argentina 3 17 (83.8) (80.1) 0 11 c.s. (100.0)
Telefónica Chile — — — — — — — —
Telefónica Perú — — — — — — — —
Telefónica Uruguay — — — — — — — —
Others & eliminations — — — — — — — —
OIBDA-CapEx 589 551 6.8 17.9 145 133 9.3 33.3
Telefónica Argentina 207 171 21.6 44.2 57 16 262.8 72.4
Telefónica Chile 268 237 13.2 (10.4) 111 93 19.7 (2.6)
Telefónica Perú 69 98 (29.2) 14.3 (37) 10 c.s. 22.5
Telefónica Uruguay 44 44 (0.5) 4.6 14 13 5.9 10.2
Others & eliminations 0 2 (86.6) c.s. 1 2 (62.6) c.s.
Notes:- January-September 2019 results reported under accounting standards IFRS 16, effective since January 2019. January-September 2018 results reported under prior accounting IAS 17.- OIBDA before management and brand fees.- Following the consideration of the Argentine economy as hyperinflationary from an accounting perspective for periods ended after 1 July 2018, the operations of Telefónica in Argentina adjusted by inflation are to be accounted at the closing exchange rate Argentine Peso/Euro.
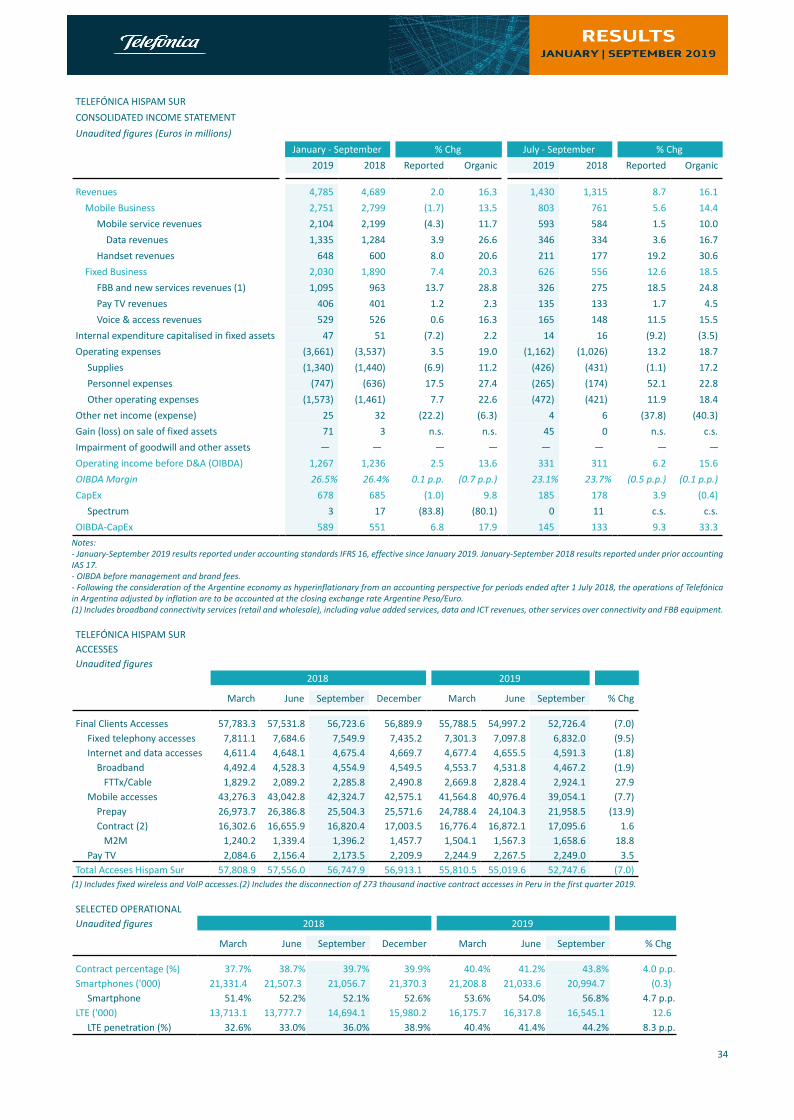
34
TELEFÓNICA HISPAM SURCONSOLIDATED INCOME STATEMENTUnaudited figures (Euros in millions)
January - September % Chg July - September % Chg2019 2018 Reported Organic 2019 2018 Reported Organic
Revenues 4,785 4,689 2.0 16.3 1,430 1,315 8.7 16.1Mobile Business 2,751 2,799 (1.7) 13.5 803 761 5.6 14.4
Mobile service revenues 2,104 2,199 (4.3) 11.7 593 584 1.5 10.0Data revenues 1,335 1,284 3.9 26.6 346 334 3.6 16.7
Handset revenues 648 600 8.0 20.6 211 177 19.2 30.6Fixed Business 2,030 1,890 7.4 20.3 626 556 12.6 18.5
FBB and new services revenues (1) 1,095 963 13.7 28.8 326 275 18.5 24.8Pay TV revenues 406 401 1.2 2.3 135 133 1.7 4.5Voice & access revenues 529 526 0.6 16.3 165 148 11.5 15.5
Internal expenditure capitalised in fixed assets 47 51 (7.2) 2.2 14 16 (9.2) (3.5)Operating expenses (3,661) (3,537) 3.5 19.0 (1,162) (1,026) 13.2 18.7
Supplies (1,340) (1,440) (6.9) 11.2 (426) (431) (1.1) 17.2Personnel expenses (747) (636) 17.5 27.4 (265) (174) 52.1 22.8Other operating expenses (1,573) (1,461) 7.7 22.6 (472) (421) 11.9 18.4
Other net income (expense) 25 32 (22.2) (6.3) 4 6 (37.8) (40.3)Gain (loss) on sale of fixed assets 71 3 n.s. n.s. 45 0 n.s. c.s.Impairment of goodwill and other assets — — — — — — — —Operating income before D&A (OIBDA) 1,267 1,236 2.5 13.6 331 311 6.2 15.6OIBDA Margin 26.5% 26.4% 0.1 p.p. (0.7 p.p.) 23.1% 23.7% (0.5 p.p.) (0.1 p.p.)
CapEx 678 685 (1.0) 9.8 185 178 3.9 (0.4)Spectrum 3 17 (83.8) (80.1) 0 11 c.s. c.s.
OIBDA-CapEx 589 551 6.8 17.9 145 133 9.3 33.3Notes:- January-September 2019 results reported under accounting standards IFRS 16, effective since January 2019. January-September 2018 results reported under prior accounting IAS 17.- OIBDA before management and brand fees.- Following the consideration of the Argentine economy as hyperinflationary from an accounting perspective for periods ended after 1 July 2018, the operations of Telefónica in Argentina adjusted by inflation are to be accounted at the closing exchange rate Argentine Peso/Euro.(1) Includes broadband connectivity services (retail and wholesale), including value added services, data and ICT revenues, other services over connectivity and FBB equipment.
TELEFÓNICA HISPAM SURACCESSESUnaudited figures
2018 2019
March June September December March June September % Chg
Final Clients Accesses 57,783.3 57,531.8 56,723.6 56,889.9 55,788.5 54,997.2 52,726.4 (7.0)Fixed telephony accesses 7,811.1 7,684.6 7,549.9 7,435.2 7,301.3 7,097.8 6,832.0 (9.5)Internet and data accesses 4,611.4 4,648.1 4,675.4 4,669.7 4,677.4 4,655.5 4,591.3 (1.8)
Broadband 4,492.4 4,528.3 4,554.9 4,549.5 4,553.7 4,531.8 4,467.2 (1.9)FTTx/Cable 1,829.2 2,089.2 2,285.8 2,490.8 2,669.8 2,828.4 2,924.1 27.9
Mobile accesses 43,276.3 43,042.8 42,324.7 42,575.1 41,564.8 40,976.4 39,054.1 (7.7)Prepay 26,973.7 26,386.8 25,504.3 25,571.6 24,788.4 24,104.3 21,958.5 (13.9)Contract (2) 16,302.6 16,655.9 16,820.4 17,003.5 16,776.4 16,872.1 17,095.6 1.6
M2M 1,240.2 1,339.4 1,396.2 1,457.7 1,504.1 1,567.3 1,658.6 18.8Pay TV 2,084.6 2,156.4 2,173.5 2,209.9 2,244.9 2,267.5 2,249.0 3.5
Total Acceses Hispam Sur 57,808.9 57,556.0 56,747.9 56,913.1 55,810.5 55,019.6 52,747.6 (7.0)(1) Includes fixed wireless and VoIP accesses.(2) Includes the disconnection of 273 thousand inactive contract accesses in Peru in the first quarter 2019.
SELECTED OPERATIONALUnaudited figures 2018 2019
March June September December March June September % Chg
Contract percentage (%) 37.7% 38.7% 39.7% 39.9% 40.4% 41.2% 43.8% 4.0 p.p.Smartphones ('000) 21,331.4 21,507.3 21,056.7 21,370.3 21,208.8 21,033.6 20,994.7 (0.3)
Smartphone 51.4% 52.2% 52.1% 52.6% 53.6% 54.0% 56.8% 4.7 p.p.LTE ('000) 13,713.1 13,777.7 14,694.1 15,980.2 16,175.7 16,317.8 16,545.1 12.6
LTE penetration (%) 32.6% 33.0% 36.0% 38.9% 40.4% 41.4% 44.2% 8.3 p.p.

35
TELEFÓNICA ARGENTINA
SELECTED FINANCIAL DATA
Unaudited figures (Euros inmillions)
January - September % Chg July - September % Chg
2019 2018 % Chg% Organic
Chg 2019 2018 % Chg% Organic
Chg
Revenues 1,575 1,431 10.1 45.3 362 232 55.7 47.7
Mobile Business 989 945 4.6 38.5 230 151 52.9 44.2
Mobile service revenues 822 804 2.2 35.1 181 128 41.8 36.4
Data revenues 568 471 20.5 59.7 87 66 33.4 43.7
Handset revenues 166 140 18.4 57.9 49 23 114.5 88.6
Fixed Business 584 486 20.1 57.6 131 82 60.0 53.7
FBB and new services (1) 312 257 21.5 60.9 50 32 55.6 50.6
Pay TV 8 — — — 3 — — —
Voice & access revenues 264 229 14.9 46.0 78 50 57.1 49.6
OIBDA 419 417 0.6 28.1 94 54 74.5 31.5
OIBDA margin 26.6% 29.1% (2.5 p.p.) (3.7 p.p.) 26.0% 23.2% 2.8 p.p. (3.3 p.p.)
CapEx 212 246 (13.9) 14.3 37 38 (3.1) (2.7)
Spectrum 3 17 (83.8) (80.1) 0 11 c.s. (100.0)
OIBDA-CapEx 207 171 21.6 44.2 57 16 262.8 72.4
Notes:- January-September 2019 results reported under accounting standards IFRS 16, effective since January 2019. January-September 2018 results reported under prior accounting IAS 17.- OIBDA is presented before management and brand fees.- Following the consideration of the Argentine economy as hyperinflationary from an accounting perspective for periods ended after 1 July 2018, the operations of Telefónica in Argentina adjusted by inflation are to be accounted at the closing exchange rate Argentine Peso/Euro.(1) Includes broadband connectivity services (retail and wholesale), including value added services, data and ICT revenues, other services over connectivity and FBB equipment.
ACCESSESUnaudited figures (Thousands)
2018 2019
March June September December March June September % Chg
Final Clients Accesses 24,507.7 24,208.3 23,798.2 23,910.6 23,477.2 23,315.9 21,855.2 (8.2)Fixed telephony accesses (1) 4,023.4 3,908.5 3,770.6 3,667.3 3,530.3 3,400.7 3,267.9 (13.3)
Fixed wireless 192.9 184.5 170.4 173.2 161.0 156.9 151.4 (11.2)Internet and data accesses 1,648.5 1,613.3 1,579.9 1,546.1 1,497.8 1,453.5 1,417.9 (10.3)
Broadband 1,613.5 1,578.6 1,545.5 1,512.1 1,463.8 1,419.8 1,384.5 (10.4)FTTx 294.7 353.2 416.9 468.6 495.1 531.9 566.2 35.8
Mobile accesses 18,835.8 18,686.5 18,446.3 18,666.8 18,389.8 18,370.1 17,039.1 (7.6)Prepay 11,259.6 11,011.4 10,726.8 10,907.0 10,702.3 10,616.1 9,283.3 (13.5)Contract 7,576.2 7,675.1 7,719.5 7,759.7 7,687.5 7,754.0 7,755.8 0.5
M2M 614.3 629.4 658.0 698.0 717.0 758.7 810.6 23.2Pay TV — — 1.4 30.4 59.2 91.6 130.3 n.sTotal Accesses 24,528.1 24,227.4 23,817.1 23,928.3 23,493.5 23,332.2 21,870.2 (8.2)
(1) Includes fixed wireless and VoIP accesses.

36
SELECTED OPERATIONAL DATA
Unaudited figures
2018 2019
March June September December March June September % Chg
Contract percentage (%) 40.2% 41.1% 41.8% 41.6% 41.8% 42.2% 45.5% 3.7 p.p.
Smartphones ('000) 8,879.0 8,988.5 8,949.3 9,074.2 8,967.5 9,254.1 9,316.6 4.1
Smartphone penetration (%) 49.0% 50.1% 50.6% 50.8% 51.0% 52.8% 57.7% 7.1 p.p.
LTE ('000) 6,673.1 6,714.7 6,751.7 7,647.0 7,759.0 7,807.6 7,929.3 17.4
LTE penetration (%) 36.6% 37.2% 38.0% 42.6% 43.9% 44.3% 48.9% 10.9 p.p.
Mobile churn (quarterly) 3.2% 2.9% 2.6% 1.7% 2.7% 2.7% 5.4% 2.8
Contract (1) 1.1% 1.1% 1.3% 1.5% 2.1% 2.2% 2.5% 1.2 p.p.
Mobile churn (cumulative YTD) 3.2% 2.9% 2.8% 2.5% 2.7% 2.7% 3.6% 0.8
Contract (1) 1.1% 1.1% 1.2% 1.3% 2.1% 2.1% 2.2% 1.1 p.p.
Mobile ARPU (EUR)(cumulative YTD) 7.8 7.5 4.2 4.8 5.2 5.5 4.5 39.5
Prepay 2.4 2.4 1.3 1.5 1.5 1.5 1.3 28.0
Contract (1) 16.7 15.9 8.9 10.0 11.0 11.7 9.3 38.3
Mobile data traffic (TB) (cumulative YTD) 71,626 147,967 230,363 318,130 87,371 182,579 287,520 24.8
Fixed telephony ARPU (EUR) (cumulativeYTD) 8.5 8.4 4.8 5.6 6.7 7.4 6.1 69.4
Pay TV ARPU (EUR) (cumulative YTD) 10.9 12.8 10.6
Broadband ARPU (EUR) (cumulative YTD) 18.1 17.1 9.4 11.1 13.5 14.6 11.7 65.4
Fixed data traffic (TB) (cumulative YTD) (2) 425,127 893,893 1,466,706 2,027,293 555,796 1,086,029 1,602,988 9.3Notes:- ARPU: monthly average revenue divided by the monthly average accesses of the period. % organic Change.- Data traffic is defined as Terabytes used by the company customers, both upload and download (1TByte = 10^12 bytes). Promotional traffic is included. Traffic not associated to the Company's mobile customers (roaming-in, MVNOs, interconnection of third parties and other business lines) is also included. Traffic volume non-rounded.(1) Excludes M2M.(2) Includes solely traffic related with FBB accesses, not Business customers.

37
TELEFÓNICA CHILE
SELECTED FINANCIAL DATA
Unaudited figures (Euros in millions)
January - September % Chg July - September % Chg
2019 2018 % Chg% Organic
Chg 2019 2018 % Chg% Organic
Chg
Revenues 1,456 1,556 (6.4) (3.9) 470 505 (6.9) (5.1)
Mobile Business 832 909 (8.4) (6.0) 269 296 (8.9) (7.2)
Mobile service revenues 612 684 (10.4) (8.0) 195 223 (12.6) (10.8)
Data revenues 335 356 (5.9) (2.9) 108 118 (8.5) (6.8)
Handset revenues 220 226 (2.5) 0.2 74 73 2.2 4.0
Fixed Business 623 646 (3.6) (1.0) 201 209 (4.0) (2.2)
FBB and new services (1) 349 332 5.0 7.8 116 111 4.3 6.4
Pay TV 153 172 (11.1) (8.7) 48 54 (12.3) (10.6)
Voice & access revenues 122 142 (14.5) (12.2) 38 44 (14.7) (13.1)
OIBDA 521 467 11.6 1.1 183 156 17.7 5.2
OIBDA margin 35.8% 30.0% 5.8 p.p. 1.6 p.p. 39.0% 30.9% 8.2 p.p. 3.3 p.p.
CapEx 254 231 9.9 12.9 72 63 14.7 16.6
Spectrum — — — — — — — —
OIBDA-CapEx 268 237 13.2 (10.4) 111 93 19.7 (2.6)
Notes:- January-September 2019 results reported under accounting standards IFRS 16, effective since January 2019. January-September 2018 results reported under prior accounting IAS 17.- OIBDA is presented before management and brand fees.(1) Includes broadband connectivity services (retail and wholesale), including value added services, data and ICT revenues, other services over connectivity and FBB equipment.
ACCESSESUnaudited figures (Thousands)
2018 2019March June September December March June September % Chg
Final Clients Accesses 12,061.9 11,887.5 11,836.3 11,591.5 11,133.4 10,847.1 10,627.1 (10.2)Fixed telephony accesses (1) 1,289.1 1,273.5 1,251.9 1,222.4 1,176.4 1,143.9 1,112.4 (11.1)Internet and data accesses 1,141.9 1,151.0 1,156.1 1,150.2 1,133.8 1,117.4 1,099.4 (4.9)
Broadband 1,089.2 1,097.8 1,102.0 1,095.8 1,078.9 1,062.0 1,043.3 (5.3)FTTx 379.0 421.5 475.1 522.9 556.0 587.1 608.0 28.0
Mobile accesses 8,957.4 8,783.8 8,758.8 8,567.5 8,201.1 7,991.7 7,855.8 (10.3)Prepay 5,658.8 5,391.6 5,245.6 4,957.7 4,545.1 4,318.5 4,137.8 (21.1)Contract 3,298.5 3,392.2 3,513.2 3,609.8 3,656.0 3,673.3 3,718.0 5.8
M2M 422.1 426.8 440.8 441.0 463.7 487.2 498.3 13.1Pay TV 673.6 679.2 669.5 651.3 622.0 594.1 559.5 (16.4)
Total Accesses 12,067.0 11,892.6 11,841.7 11,597.0 11,139.0 10,853.3 10,633.3 (10.2)(1) Includes fixed wireless and VoIP accesses.
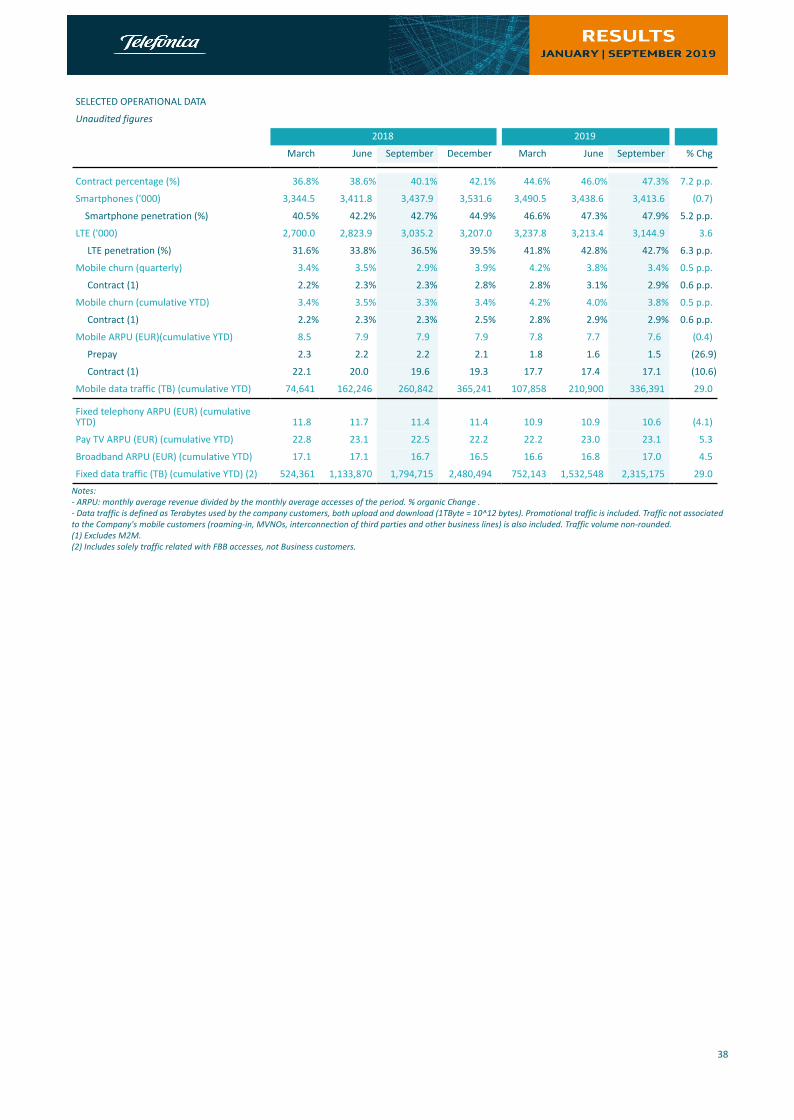
38
SELECTED OPERATIONAL DATA
Unaudited figures
2018 2019
March June September December March June September % Chg
Contract percentage (%) 36.8% 38.6% 40.1% 42.1% 44.6% 46.0% 47.3% 7.2 p.p.
Smartphones ('000) 3,344.5 3,411.8 3,437.9 3,531.6 3,490.5 3,438.6 3,413.6 (0.7)
Smartphone penetration (%) 40.5% 42.2% 42.7% 44.9% 46.6% 47.3% 47.9% 5.2 p.p.
LTE ('000) 2,700.0 2,823.9 3,035.2 3,207.0 3,237.8 3,213.4 3,144.9 3.6
LTE penetration (%) 31.6% 33.8% 36.5% 39.5% 41.8% 42.8% 42.7% 6.3 p.p.
Mobile churn (quarterly) 3.4% 3.5% 2.9% 3.9% 4.2% 3.8% 3.4% 0.5 p.p.
Contract (1) 2.2% 2.3% 2.3% 2.8% 2.8% 3.1% 2.9% 0.6 p.p.
Mobile churn (cumulative YTD) 3.4% 3.5% 3.3% 3.4% 4.2% 4.0% 3.8% 0.5 p.p.
Contract (1) 2.2% 2.3% 2.3% 2.5% 2.8% 2.9% 2.9% 0.6 p.p.
Mobile ARPU (EUR)(cumulative YTD) 8.5 7.9 7.9 7.9 7.8 7.7 7.6 (0.4)
Prepay 2.3 2.2 2.2 2.1 1.8 1.6 1.5 (26.9)
Contract (1) 22.1 20.0 19.6 19.3 17.7 17.4 17.1 (10.6)
Mobile data traffic (TB) (cumulative YTD) 74,641 162,246 260,842 365,241 107,858 210,900 336,391 29.0
Fixed telephony ARPU (EUR) (cumulativeYTD) 11.8 11.7 11.4 11.4 10.9 10.9 10.6 (4.1)
Pay TV ARPU (EUR) (cumulative YTD) 22.8 23.1 22.5 22.2 22.2 23.0 23.1 5.3
Broadband ARPU (EUR) (cumulative YTD) 17.1 17.1 16.7 16.5 16.6 16.8 17.0 4.5
Fixed data traffic (TB) (cumulative YTD) (2) 524,361 1,133,870 1,794,715 2,480,494 752,143 1,532,548 2,315,175 29.0Notes:- ARPU: monthly average revenue divided by the monthly average accesses of the period. % organic Change .- Data traffic is defined as Terabytes used by the company customers, both upload and download (1TByte = 10^12 bytes). Promotional traffic is included. Traffic not associated to the Company's mobile customers (roaming-in, MVNOs, interconnection of third parties and other business lines) is also included. Traffic volume non-rounded.(1) Excludes M2M.(2) Includes solely traffic related with FBB accesses, not Business customers.
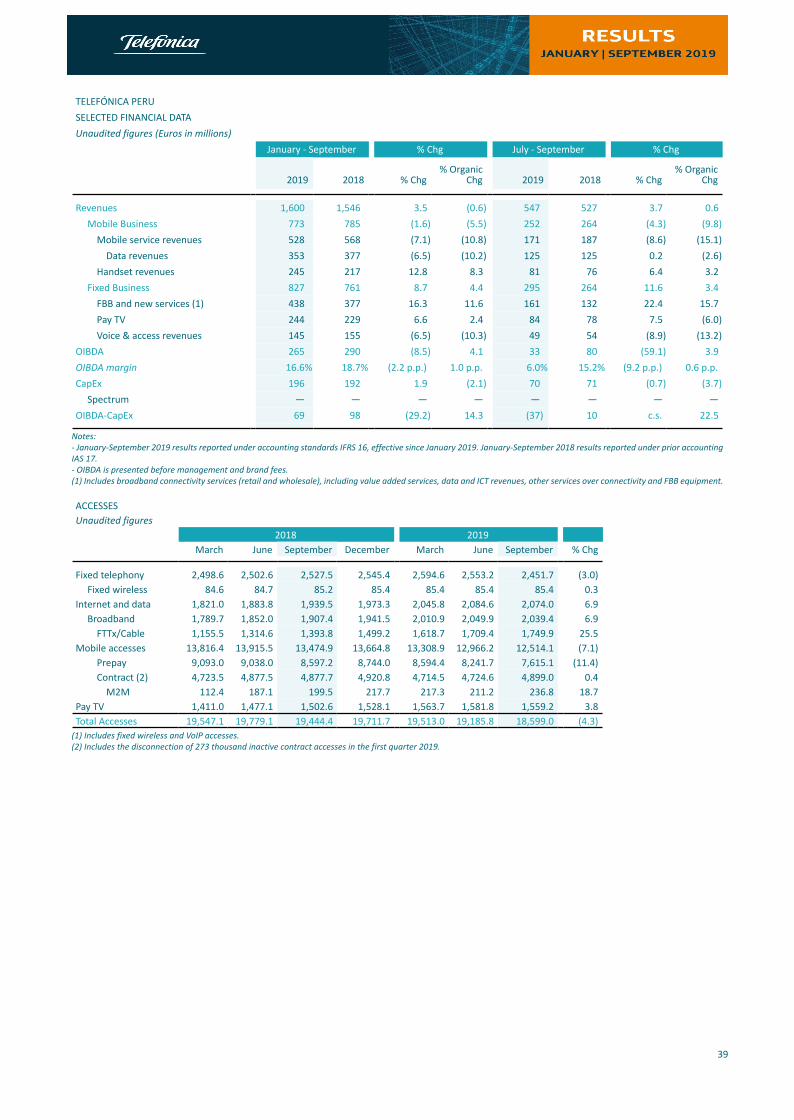
39
TELEFÓNICA PERUSELECTED FINANCIAL DATAUnaudited figures (Euros in millions)
January - September % Chg July - September % Chg
2019 2018 % Chg% Organic
Chg 2019 2018 % Chg% Organic
Chg
Revenues 1,600 1,546 3.5 (0.6) 547 527 3.7 0.6Mobile Business 773 785 (1.6) (5.5) 252 264 (4.3) (9.8)
Mobile service revenues 528 568 (7.1) (10.8) 171 187 (8.6) (15.1)Data revenues 353 377 (6.5) (10.2) 125 125 0.2 (2.6)
Handset revenues 245 217 12.8 8.3 81 76 6.4 3.2Fixed Business 827 761 8.7 4.4 295 264 11.6 3.4
FBB and new services (1) 438 377 16.3 11.6 161 132 22.4 15.7Pay TV 244 229 6.6 2.4 84 78 7.5 (6.0)Voice & access revenues 145 155 (6.5) (10.3) 49 54 (8.9) (13.2)
OIBDA 265 290 (8.5) 4.1 33 80 (59.1) 3.9OIBDA margin 16.6% 18.7% (2.2 p.p.) 1.0 p.p. 6.0% 15.2% (9.2 p.p.) 0.6 p.p.CapEx 196 192 1.9 (2.1) 70 71 (0.7) (3.7)
Spectrum — — — — — — — —OIBDA-CapEx 69 98 (29.2) 14.3 (37) 10 c.s. 22.5
Notes:- January-September 2019 results reported under accounting standards IFRS 16, effective since January 2019. January-September 2018 results reported under prior accounting IAS 17.- OIBDA is presented before management and brand fees.(1) Includes broadband connectivity services (retail and wholesale), including value added services, data and ICT revenues, other services over connectivity and FBB equipment.
ACCESSESUnaudited figures
2018 2019March June September December March June September % Chg
Fixed telephony 2,498.6 2,502.6 2,527.5 2,545.4 2,594.6 2,553.2 2,451.7 (3.0)Fixed wireless 84.6 84.7 85.2 85.4 85.4 85.4 85.4 0.3
Internet and data 1,821.0 1,883.8 1,939.5 1,973.3 2,045.8 2,084.6 2,074.0 6.9Broadband 1,789.7 1,852.0 1,907.4 1,941.5 2,010.9 2,049.9 2,039.4 6.9
FTTx/Cable 1,155.5 1,314.6 1,393.8 1,499.2 1,618.7 1,709.4 1,749.9 25.5Mobile accesses 13,816.4 13,915.5 13,474.9 13,664.8 13,308.9 12,966.2 12,514.1 (7.1)
Prepay 9,093.0 9,038.0 8,597.2 8,744.0 8,594.4 8,241.7 7,615.1 (11.4)Contract (2) 4,723.5 4,877.5 4,877.7 4,920.8 4,714.5 4,724.6 4,899.0 0.4
M2M 112.4 187.1 199.5 217.7 217.3 211.2 236.8 18.7Pay TV 1,411.0 1,477.1 1,502.6 1,528.1 1,563.7 1,581.8 1,559.2 3.8Total Accesses 19,547.1 19,779.1 19,444.4 19,711.7 19,513.0 19,185.8 18,599.0 (4.3)
(1) Includes fixed wireless and VoIP accesses.(2) Includes the disconnection of 273 thousand inactive contract accesses in the first quarter 2019.

40
SELECTED OPERATIONAL DATA
Unaudited figures
2018 2019
March June September December March June September % Chg
Contract percentage (%) 34.2% 35.1% 36.2% 36.0% 35.4% 36.4% 39.1% 2.9 p.p.
Smartphones ('000) 8,230.3 8,231.3 7,803.0 7,873.5 7,858.5 7,456.2 7,363.9 (5.6)
Smartphone penetration (%) 60.4% 60.3% 59.1% 58.9% 60.4% 58.8% 60.3% 1.2 p.p.
LTE ('000) 3,725.1 3,586.3 4,217.9 4,391.3 4,437.6 4,556.7 4,682.1 11.0
LTE penetration (%) 27.2% 26.1% 31.9% 32.7% 33.9% 35.7% 38.1% 6.2 p.p.
Mobile churn (quarterly) 5.8% 6.2% 7.1% 6.8% 6.8% 7.6% 7.0% (0.1 p.p.)
Contract (1)(2) 3.0% 3.2% 3.5% 3.3% 3.0% 3.2% 3.1% (0.4 p.p.)
Mobile churn (cumulative YTD) 5.8% 6.2% 6.5% 6.6% 6.8% 7.2% 7.2% 0.7 p.p.
Contract (1)(2) 3.0% 3.2% 3.3% 3.3% 3.0% 3.1% 3.2% (0.1 p.p.)
Mobile ARPU (EUR)(cumulative YTD) 5.2 4.4 4.4 4.4 4.2 4.3 4.3 (6.5)
Prepay 1.8 1.7 1.7 1.8 1.7 1.6 1.7 (9.3)
Contract (1)(2) 12.0 9.6 9.5 9.5 9.1 9.3 9.2 (7.0)
Mobile data traffic (TB) (cumulative YTD) 62,196 133,741 224,923 326,110 114,944 238,332 385,070 71.2
Fixed telephony ARPU (EUR) (cumulativeYTD) 5.8 5.8 5.8 5.8 5.0 5.0 4.8 (20.0)
Pay TV ARPU (EUR) (cumulative YTD) 17.5 17.6 17.5 17.4 16.9 17.1 17.3 (5.5)
Broadband ARPU (EUR) (cumulative YTD) 12.6 12.7 12.7 12.7 12.5 13.0 13.4 1.3
Fixed data traffic (TB) (cumulative YTD) (3) 752,346 1,559,607 2,463,278 3,499,664 1,263,115 2,696,039 4,351,311 76.6Notes:- ARPU: monthly average revenue divided by the monthly average accesses of the period. % organic change.- Data traffic is defined as Terabytes used by the company customers, both upload and download (1TByte = 10^12 bytes). Promotional traffic is included. Traffic not associated to the Company's mobile customers (roaming-in, MVNOs, interconnection of third parties and other business lines) is also included. Traffic volume non-rounded.(1) Excludes M2M.(2) Excludes the disconnection of 273 thousand inactive contract accesses in the first quarter 2019.(3) Includes solely traffic related with FBB accesses, not Business customers.

41
07TELEFÓNICA HISPAM NORTE(y-o-y changes in organic terms)
Hispam Norte's results showed similar trends to those seen in the previous quarter, and remained affected by the competitive intensity and by 2.5 GHz and 1,900 MHz spectrum commitments in Mexico, registered as OpEx instead of CapEx since Q4 18. Since 1st of September, and after the closing of its sale, Telefónica Panamá was no longer consolidated (Nicaragua since 1st of May and Guatemala since 1st of January), the closing of the divestments in El Salvador and Costa Rica are still pending.
Total accesses stood at 64.9m (+1% y-o-y excluding Guatemala, Nicaragua and Panama) and mobile accesses at 60.1m(+2% y-o-y, worth highlighting Colombia, with positive net additions for the 10th consecutive quarter). Contract accesses rose 2% y-o-y, with +69k net additions in the quarter (+200k in 9M), worth highlighting Colombia and Mexico as both presented once again positive contract net additions. Regarding retail broadband accesses (-2% y-o-y), it is worth mentioning the strong growth in fibre accesses (FTTH +154% y-o-y), boosted by the network deployment (1.5m FTTx premises passed to September, of which 60% with FTTH). Movistar Play (OTT pay TV service) presented 368k active users at September.
Revenues (€895m) fell 2.5% y-o-y in the quarter (€2,880m, -0.4% in 9M), although the reversed trend in Mexico is particularly noteworthy (+0.6% y-o-y). Operational expenses (€701m) increased 8.1% y-o-y (€2,237m, +8.6% in 9M) due to the negative impact of the 2.5 GHz and 1,900 MHz spectrum commitments in Mexico, which started to be recorded as OpEx (impact of €26m in Q3; €78m in 9M) since Q4 18, to higher commercial expenses associated with value growth, and to currency depreciation impacts. OIBDA (€274m; +€37m following IFRS16 adoption; +€116m in 9M) decreased 14.1% y-o-y in the quarter (€799m in 9M, -14.0%). In Q3 19, €16m in capital gains from the sale of towers in Colombia were registered (€33m registered in Q219 in Colombia and Mexico; €24m in Q318 in Colombia) and €17m from the sale of data centres in Mexico. OIBDA margin stood at 30.7% (-3.6 p.p. y-o-y; 27.7% in 9M, -3.8 p.p.).
CapEx (€327m in January-September) rose 2.1% y-o-y. Furthermore, in the quarter €18m were registered for spectrum renewal in the 7.5 GHz and 23 GHz bands in Mexico. CapEx (excluding spectrum) represented 10% over sales in 9M (+0,2 p.p. y-o-y). OIBDA-CapEx totalled €472m in January-September.
Telefónica Colombia continued presenting solid commercial results in high-value segments, mainly in contract (positive net additions for 6 consecutive quarters) and FTTH. OIBDA slightly increased (+0.1% y-o-y in Q3 19) thanks to the growth in value, efficiency measures and capital gains from tower sales that more than compensated the impact of lower fixed revenues from legacy services and higher commercial expenses.
Mobile accesses rose to 16.1m (+5% y-o-y) after posting positive net additions for the 10th consecutive quarter (+31k in Q3; +344k in 9M), worth highlighting contract (+64k in Q3; +160k in 9M) as a result of the positive performance of the commercial offer (with differentiation elements: Movistar Play, "pasa gigas" and data roaming), which translated into an upward trend in the gross additions (+13% y-o-y) and churn stabilization at low levels (1.8%). Retail broadband accesses decreased 6% due to ADSL, even though the quality of accesses improved as a result of FTTH (+154% y-o-y) thanks to the network deployment (1.5m premises passed as of September; 60% with FTTH). Regarding Pay TV accesses, IPTV accesses rose to 48k as of September following the recent launch of the service in Q1 19 and partially offset the losses in DTH, resulting from a lower focus on the service.
Revenues (€350m) fell 1.5% y-o-y (€1,061m in 9M, +1.4%) mainly due to fixed revenues from voice, ADSL and DTH, which were partially offset by the growth in fibre revenues and handset sales (the latter accelerated its growth to 30.6% y-o-y; +16.9% in 9M). Operating expenses (€247m) increased 6.7% y-o-y (€754m in 9M, +8.7%) mainly as a result of higher commercial expenses associated with the growing commercial activity, the depreciation of the peso against the U.S. dollar impacting networks, IT and content expenses, and higher interconnection costs (traffic growth). OIBDA (€137m; -9M€ following IFRS16 adoption; -5M€ in 9M) increased 0.1% y-o-y (€400m in 9M, +4.6%) and it was registered €16m from the sales of towers in the quarter (€26m in 2Q 19; €24m in Q3 18). OIBDA margin stood at 39.2% (+0.7 p.p. y-o-y; 37.7% in 9M, +1.1 p.p. y-o-y).
CapEx (151M€ in January-September) increased 34.9% y-o-y. CapEx represented 14% over sales in 9M (+3.5 p.p. y-o-y). OIBDA-CapEx totalled €249m in January-September.

42
Telefónica México continued showing good commercial results, with an acceleration of accesses growth (+4% in contract, +6% in prepaid; +1% and -4% at June, respectively). Likewise, revenues reverted the trend to increase again (+0.6% in Q3 19; +0.1% in 9M). OIBDA y-o-y growth (-89.1% in Q3 19; -90.2% in 9M) was still impacted by spectrum commitments, registered as OpEx instead of CapEx since Q4 18.
Mobile accesses totalled 26.9m and rose 5% y-o-y, improving sequentially (-4% in Q2 19). Contract accesses increased 4% (representing 9% of the total) after registering positive net additions for four consecutive quarters (+28k in Q3 19, +63k in 9M). Contract churn improved for the 4th consecutive quarter (-1.5 p.p. y-o-y in Q3 19) resulting from an improvement and simplification of the commercial offers. Prepaid accesses continued presenting positive growth (+6% y-o-y, -4% in 2T 19), consequence of the loyalty plans.
Revenues (€300m) were back to positive y-o-y growth and rose 0.6% (€912m in 9M, +0.1% y-o-y) driven mainly by revenues from handset sales (+14.7% y-o-y in Q3 19, +15.8% in 9M) and by the positive performance from contract and prepaid, which offset lower wholesale revenues. Operating expenses (€281m) increased 18.3% y-o-y (€867m in 9M, +17.4%) and were affected by the registration of 2.5 GHz and 1,900 MHz spectrum commitments (impact of €26m in Q3 19; €78m in 9M), and by higher commercial expenses. OIBDA (€53m; +€32m following IFRS16 adoption, +€69m in 9M) fell 89.1% y-o-y (€100m in 9M, -90.2% y-o-y) affected by spectrum commitments mentioned previously. In addition, €17m capital gains from the sale of data centres were registered in the quarter.
CapEx (€89m in January-September) decreased 23.4% y-o-y. Furthermore, in the quarter €18m were registered for spectrum renewal in the 7.5 GHz and 23 GHz bands. CapEx (excluding spectrum) represented 8% over sales in 9M (-2.4 p.p. y-o-y). OIBDA-CapEx totalled €11m in January-September.
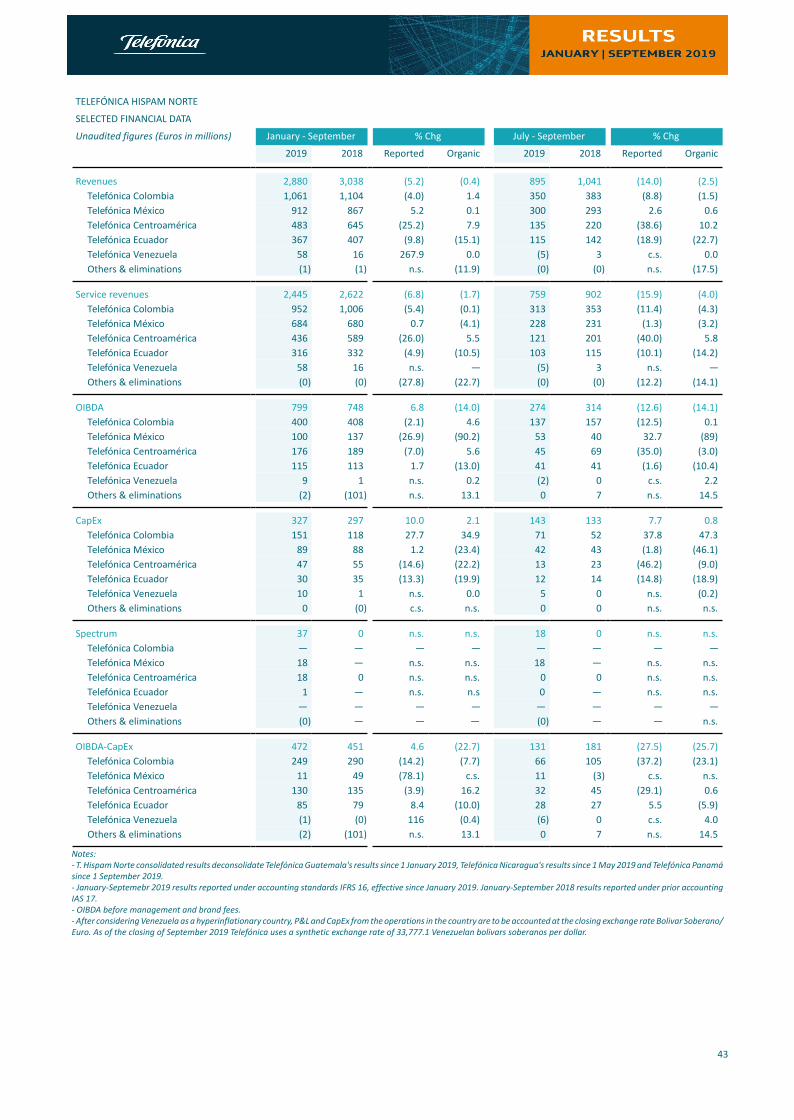
43
TELEFÓNICA HISPAM NORTE
SELECTED FINANCIAL DATA
Unaudited figures (Euros in millions) January - September % Chg July - September % Chg
2019 2018 Reported Organic 2019 2018 Reported Organic
Revenues 2,880 3,038 (5.2) (0.4) 895 1,041 (14.0) (2.5)Telefónica Colombia 1,061 1,104 (4.0) 1.4 350 383 (8.8) (1.5)Telefónica México 912 867 5.2 0.1 300 293 2.6 0.6Telefónica Centroamérica 483 645 (25.2) 7.9 135 220 (38.6) 10.2Telefónica Ecuador 367 407 (9.8) (15.1) 115 142 (18.9) (22.7)Telefónica Venezuela 58 16 267.9 0.0 (5) 3 c.s. 0.0Others & eliminations (1) (1) n.s. (11.9) (0) (0) n.s. (17.5)
Service revenues 2,445 2,622 (6.8) (1.7) 759 902 (15.9) (4.0)Telefónica Colombia 952 1,006 (5.4) (0.1) 313 353 (11.4) (4.3)Telefónica México 684 680 0.7 (4.1) 228 231 (1.3) (3.2)Telefónica Centroamérica 436 589 (26.0) 5.5 121 201 (40.0) 5.8Telefónica Ecuador 316 332 (4.9) (10.5) 103 115 (10.1) (14.2)Telefónica Venezuela 58 16 n.s. — (5) 3 n.s. —Others & eliminations (0) (0) (27.8) (22.7) (0) (0) (12.2) (14.1)
OIBDA 799 748 6.8 (14.0) 274 314 (12.6) (14.1)Telefónica Colombia 400 408 (2.1) 4.6 137 157 (12.5) 0.1Telefónica México 100 137 (26.9) (90.2) 53 40 32.7 (89)Telefónica Centroamérica 176 189 (7.0) 5.6 45 69 (35.0) (3.0)Telefónica Ecuador 115 113 1.7 (13.0) 41 41 (1.6) (10.4)Telefónica Venezuela 9 1 n.s. 0.2 (2) 0 c.s. 2.2Others & eliminations (2) (101) n.s. 13.1 0 7 n.s. 14.5
CapEx 327 297 10.0 2.1 143 133 7.7 0.8Telefónica Colombia 151 118 27.7 34.9 71 52 37.8 47.3Telefónica México 89 88 1.2 (23.4) 42 43 (1.8) (46.1)Telefónica Centroamérica 47 55 (14.6) (22.2) 13 23 (46.2) (9.0)Telefónica Ecuador 30 35 (13.3) (19.9) 12 14 (14.8) (18.9)Telefónica Venezuela 10 1 n.s. 0.0 5 0 n.s. (0.2)Others & eliminations 0 (0) c.s. n.s. 0 0 n.s. n.s.
Spectrum 37 0 n.s. n.s. 18 0 n.s. n.s.Telefónica Colombia — — — — — — — —Telefónica México 18 — n.s. n.s. 18 — n.s. n.s.Telefónica Centroamérica 18 0 n.s. n.s. 0 0 n.s. n.s.Telefónica Ecuador 1 — n.s. n.s 0 — n.s. n.s.Telefónica Venezuela — — — — — — — —Others & eliminations (0) — — — (0) — — n.s.
OIBDA-CapEx 472 451 4.6 (22.7) 131 181 (27.5) (25.7)Telefónica Colombia 249 290 (14.2) (7.7) 66 105 (37.2) (23.1)Telefónica México 11 49 (78.1) c.s. 11 (3) c.s. n.s.Telefónica Centroamérica 130 135 (3.9) 16.2 32 45 (29.1) 0.6Telefónica Ecuador 85 79 8.4 (10.0) 28 27 5.5 (5.9)Telefónica Venezuela (1) (0) 116 (0.4) (6) 0 c.s. 4.0Others & eliminations (2) (101) n.s. 13.1 0 7 n.s. 14.5
Notes:- T. Hispam Norte consolidated results deconsolidate Telefónica Guatemala's results since 1 January 2019, Telefónica Nicaragua's results since 1 May 2019 and Telefónica Panamá since 1 September 2019.- January-Septemebr 2019 results reported under accounting standards IFRS 16, effective since January 2019. January-September 2018 results reported under prior accounting IAS 17.- OIBDA before management and brand fees.- After considering Venezuela as a hyperinflationary country, P&L and CapEx from the operations in the country are to be accounted at the closing exchange rate Bolivar Soberano/Euro. As of the closing of September 2019 Telefónica uses a synthetic exchange rate of 33,777.1 Venezuelan bolivars soberanos per dollar.

44
TELEFÓNICA HISPAM NORTE
CONSOLIDATED INCOME STATEMENT
Unaudited figures (Euros in millions)
January - September % Chg July - September % Chg
2019 2018 Reported Organic 2019 2018 Reported Organic
Revenues 2,880 3,038 (5.2) (0.4) 895 1,041 (14.0) (2.5)
Mobile Business 2,344 2,489 (5.8) (0.8) 727 848 (14.2) (2.4)
Mobile service revenues 1,909 2,072 (7.9) (2.6) 591 709 (16.6) (4.2)
Data revenues 1,177 1,168 0.8 4.4 380 393 (3.4) 7.1
Handset revenues 435 417 4.5 8.1 136 139 (1.9) 6.5
Fixed Business 533 549 (3.1) 0.8 167 193 (13.7) (3.8)
FBB and new services revenues (1) 318 300 6.0 7.9 99 109 (9.7) 0.6
Pay TV revenues 61 67 (8.9) (3.5) 20 23 (12.0) (1.8)
Voice & access revenues 153 182 (15.7) (9.6) 48 61 (21.4) (12.7)
Internal expenditure capitalised in fixed assets 33 36 (7.4) 0.6 11 12 (1.5) 12.1
Operating expenses (2,237) (2,305) (2.9) 8.6 (701) (773) (9.3) 8.1
Supplies (922) (982) (6.1) 11.2 (296) (333) (11.1) 13.6
Personnel expenses (248) (263) (5.5) (2.0) (73) (86) (15.3) (4.2)
Other operating expenses (1,067) (1,061) 0.6 8.8 (332) (354) (6.2) 6.1
Other net income (expense) 50 23 111.7 88.3 29 6 n.s. 257.4
Gain (loss) on sale of fixed assets 86 64 35.3 96.3 41 29 39.6 67.6
Impairment of goodwill and other assets (2) (12) (108) (88.4) (88.2) — — — —
Operating income before D&A (OIBDA) 799 748 6.8 (14.0) 274 314 (12.6) (14.1)
OIBDA Margin 27.7% 24.6% 3.1 p.p. (3.8 p.p.) 30.7% 30.2% 0.5 p.p. (3.6 p.p.)
CapEx 327 297 10.0 2.1 143 133 7.7 0.8
Spectrum 37 — n.s. n.s. 18 — n.s. n.s.
OIBDA-CapEx 472 451 4.6 (22.7) 131 181 (27.5) (25.7)
Notes:- T. Hispam Norte consolidated results deconsolidate Telefónica Guatemala's results since 1 January 2019, Telefónica Nicaragua's results since 1 May 2019 and Telefónica Panamá since 1 September 2019.- January-September 2019 results reported under accounting standards IFRS 16, effective since January 2019. January-September 2018 results reported under prior accounting IAS 17.- OIBDA before management and brand fees.- After considering Venezuela as a hyperinflationary country, P&L and CapEx from the operations in the country are to be accounted at the closing exchange rate Bolivar Soberano/Euro. As of the closing of September 2019 Telefónica uses a synthetic exchange rate of 33,777.1 Venezuelan bolivars soberanos per dollar.(1) Includes broadband connectivity services (retail and wholesale), including value added services, data and ICT revenues, other services over connectivity and FBB equipment.(2) Includes goodwill impairment of €108m in Mexico in April-June 2018.
TELEFÓNICA HISPAM NORTEACCESSESUnaudited figures (Thousands)
2018 2019
March June September December March June September % Chg
Final Clients Accesses 72,590.0 73,145.9 72,902.0 73,555.6 69,657.0 64,377.9 64,923.0 (10.9)
Fixed telephony accesses (1) 3,478.3 3,484.8 3,301.0 3,169.8 2,832.4 2,663.0 2,602.8 (21.2)
Internet and data accesses 1,253.1 1,274.7 1,332.3 1,337.1 1,344.6 1,306.8 1,297.5 (2.6)
Broadband 1,223.2 1,244.0 1,301.4 1,305.6 1,317.1 1,279.2 1,269.9 (2.4)
FTTx 167.7 284.4 302.7 303.7 305.5 308.0 311.7 3.0
Mobile accesses 66,857.0 67,355.8 67,233.7 68,041.1 64,513.3 59,473.4 60,141.1 (10.5)
Prepay 57,061.5 57,360.4 57,226.8 58,010.4 54,623.4 49,787.1 50,578.5 (11.6)
Contract 9,795.4 9,995.4 10,006.9 10,030.7 9,889.9 9,686.3 9,562.7 (4.4)
M2M 1,785.1 1,882.0 1,914.3 1,922.8 1,927.5 1,903.6 1,896.2 (0.9)
Pay TV 1,001.6 1,030.6 1,034.9 1,007.6 966.8 934.8 881.6 (14.8)
Total Acceses Hispam Norte 72,590.5 73,146.4 72,902.5 73,556.1 69,657.0 64,378.4 64,923.0 (10.9)
- T. Guatemala accesses are excluded from 1 January of 2019, T. Nicaragua from 1 May 2019 and T. Panamá from 1 September 2019.(1) Includes fixed wireless and VoIP accesses.

45
SELECTED OPERATIONAL DATA
Unaudited figures 2018 2019
March June September December March June September % Chg
Contract percentage (%) 14.7% 14.8% 14.9% 14.7% 15.3% 16.3% 15.9% 1.0 p.p.
Smartphones ('000) 30,059.4 29,995.2 31,376.2 31,960.9 31,644.3 30,608.0 28,870.2 (8.0)
Smartphone penetration (%) 46.6% 46.2% 48.4% 48.6% 50.9% 53.4% 49.8% 1.4 p.p.
LTE ('000) 14,761.5 16,069.9 17,392.6 19,506.4 20,373.8 21,235.5 21,058.0 21.1
LTE penetration (%) 22.7% 24.6% 26.6% 29.5% 32.6% 36.9% 36.2% 9.5 p.p.
TELEFÓNICA COLOMBIA
SELECTED FINANCIAL DATA
Unaudited figures (Euros in millions)
January - September % Chg July - September % Chg
2019 2018 % Chg% Organic
Chg 2019 2018 % Chg% Organic
Chg
Revenues 1,061 1,104 (4.0) 1.4 350 383 (8.8) (1.5)
Mobile Business 657 671 (2.1 3.5 217 233 (6.7) 0.7
Mobile service revenues 548 572 (4.3) 1.1 180 202 (10.9) (3.8)
Data revenues 353 339 4.0 9.9 122 118 3.7 11.8
Handset revenues 109 98 10.7 16.9 37 31 21.1 30.6
Fixed Business 401 434 (7.5) (2.3) 132 151 (12.6) (5.6)
FBB and new services (1) 235 240 (1.9 3.5 78 85 (8.3) (1.0)
Pay TV 57 64 (11.1) (6.0) 20 22 (9.8) (2.7)
Voice & access revenues 108 129 (16.2) (11.4) 34 43 (22.5) (16.1)
OIBDA 400 408 (2.1) 4.6 137 157 (12.5) 0.1
OIBDA margin 37.7% 37.0% 0.7 p.p. 1.1 p.p. 39.2% 40.9% (1.7 p.p.) 0.7 p.p.
CapEx 151 118 27.7 34.9 71 52 37.8 47.3
Spectrum — — — — — — — —
OIBDA-CapEx 249 290 (14.2) (7.7) 66 105 (37.2) (23.1)
Notes:- January-September 2019 results reported under accounting standards IFRS 16, effective since January 2019. January-September 2018 results reported under prior accounting IAS 17.- OIBDA is presented before management and brand fees.(1) Includes broadband connectivity services (retail and wholesale), including value added services, data and ICT revenues, other services over connectivity and FBB equipment.
ACCESSESUnaudited figures (Thousands)
2018 2019
March June September December March June September % Chg
Final Clients Accesses 18,116.5 18,515.9 18,728.2 19,067.3 19,191.2 19,268.5 19,257.0 2.8
Fixed telephony accesses (1) 1,619.8 1,635.8 1,626.0 1,582.4 1,561.0 1,520.6 1,497.3 (7.9)
Internet and data accesses 1,233.9 1,245.8 1,247.7 1,220.4 1,205.7 1,185.6 1,176.7 (5.7)
Broadband 1,220.2 1,232.2 1,234.2 1,207.1 1,193.6 1,173.3 1,164.1 (5.7)
FTTx 167.7 284.4 302.7 303.7 305.5 308.0 311.7 3.0
Mobile accesses 14,716.1 15,070.6 15,290.6 15,716.3 15,884.3 16,029.1 16,060.0 5.0
Prepay 11,003.8 11,298.3 11,469.3 11,880.8 12,015.3 12,097.7 12,064.5 5.2
Contract 3,712.3 3,772.3 3,821.3 3,835.5 3,869.0 3,931.4 3,995.4 4.6
M2M 452.1 480.2 491.5 487.9 485.6 478.3 491.6 0.0
Pay TV 546.7 563.8 563.9 548.2 540.2 533.2 523.0 (7.2)
Total Accesses 18,117.0 18,516.4 18,728.7 19,067.8 19,191.2 19,269.0 19,257.0 2.8
(1) Includes fixed wireless and VoIP accesses.

46
SELECTED OPERATIONAL DATA
Unaudited figures
2018 2019
March June September December March June September % Chg
Contract percentage (%) 25.2% 25.0% 25.0% 24.4% 24.4% 24.5% 24.9% (0.1 p.p.)
Smartphones ('000) 6,069.0 6,304.2 6,539.8 6,887.2 7,005.5 7,164.7 6,945.4 6.2
Smartphone penetration (%) 42.9% 43.6% 44.6% 45.5% 45.9% 46.1% 44.6% 0.1 p.p.
LTE ('000) 4,585.6 5,006.8 5,492.4 6,030.8 6,536.1 6,946.0 7,203.5 31.2
LTE penetration (%) 32.1% 34.3% 37.1% 39.6% 42.4% 44.7% 46.3% 9.2 p.p.
Mobile churn (quarterly) 3.4% 3.2% 3.3% 3.0% 3.2% 3.0% 3.2% (0.1 p.p.)
Contract (1) 1.7% 1.6% 1.7% 1.9% 1.8% 1.8% 1.8% 0.1 p.p.
Mobile churn (cumulative YTD) 3.4% 3.2% 3.2% 3.2% 3.2% 3.1% 3.1% (0.1 p.p.)
Contract (1) 1.7% 1.6% 1.6% 1.7% 1.8% 1.8% 1.8% 0.2 p.p.
Mobile ARPU (EUR)(cumulative YTD) 4.0 4.0 4.0 3.9 3.6 3.5 3.5 (6.7)
Prepay 1.1 1.1 1.1 1.0 0.9 0.9 0.9 (5.8)
Contract (1) 13.4 13.4 13.5 13.3 12.5 12.3 12.1 (5.3)
Mobile data traffic (TB) (cumulative YTD) 31,191 65,600 105,536 152,025 49,686 104,975 167,827 59.0
Fixed telephony ARPU (EUR) (cumulative YTD) 8.0 8.1 8.2 8.1 7.7 7.5 7.2 (6.2)
Pay TV ARPU (EUR) (cumulative YTD) 12.5 12.6 12.8 11.7 11.9 11.4 11.7 (3.5)
Broadband ARPU (EUR) (cumulative YTD) 10.6 10.9 11.1 11.2 11.1 11.2 11.3 7.0
Fixed data traffic (TB) (cumulative YTD) (2) 295,782 619,750 964,597 1,338,012 451,809 907,557 1,404,397 45.6Notes:- ARPU: monthly average revenue divided by the monthly average accesses of the period. % organic change.- Data traffic is defined as Terabytes used by the company customers, both upload and download (1TByte = 10^12 bytes). Promotional traffic is included. Traffic not associated to the Company's mobile customers (roaming-in, MVNOs, interconnection of third parties and other business lines) is also included. Traffic volume non-rounded.(1) Excludes M2M.(2) Includes solely traffic pertaining to FBB accesses, not Business customers.
TELEFÓNICA MEXICO
SELECTED FINANCIAL DATA
Unaudited figures (Euros in millions)
January - September % Chg July - September % Chg
2019 2018 % Chg % OrganicChg 2019 2018 % Chg % Organic
Chg
Revenues 912 867 5.2 0.1 300 293 2.6 0.6
Service revenues 684 680 0.7 (4.1) 228 231 (1.3) (3.2)
Data revenues 398 352 13.3 7.9 139 123 13.4 18.1
Handset revenues 227 187 21.6 15.8 73 62 16.9 14.7
OIBDA 100 137 (26.9) (90.2) 53 40 32.7 (89.1)
OIBDA margin 11.0% 15.8% (4.8 p.p.) (14.2 p.p.) 17.8% 13.7% 4.0 p.p. (12.0 p.p.)
CapEx 89 88 1.2 (23.4) 42 43 (1.8) (46.1)
Spectrum 18 — n.s. n.s. 18 — n.s. n.s.
OIBDA-CapEx 11 49 (78.1) c.s. 11 (3) c.s. n.s.
Notes:- January-September 2019 results reported under accounting standards IFRS 16, effective since January 2019. January-September 2018 results reported under prior accounting IAS 17.- OIBDA is presented before management and brand fees.

47
ACCESSESUnaudited figures (Thousands)
2018 2019
March June September December March June September % Chg
Mobile accesses 25,269.3 25,499.9 25,525.0 26,309.9 25,502.3 24,567.3 26,926.3 5.5
Prepay 22,977.1 23,124.3 23,193.1 23,947.0 23,136.6 22,169.1 24,499.9 5.6
Contract 2,292.2 2,375.6 2,331.9 2,362.9 2,365.7 2,398.2 2,426.4 4.1
M2M 932.7 982.8 1,002.1 1,012.1 1,020.0 1,020.9 1,006.4 0.4
Fixed Wireless 750.6 768.6 706.9 703.1 635.1 572.0 575.2 (18.6)
Total Accesses 26,019.9 26,268.5 26,231.9 27,013.0 26,137.4 25,139.3 27,501.4 4.8
SELECTED OPERATIONAL DATAUnaudited figures
2018 2019
March June September December March June September % Chg
Contract percentage (%) 9.1% 9.3% 9.1% 9.0% 9.3% 9.8% 9.0% (0.1 p.p.)
Smartphones ('000) 11,339.0 11,020.6 11,464.6 11,351.1 11,494.7 12,066.1 11,585.3 1.1
Smartphone penetration (%) 46.7% 45.0% 46.8% 44.9% 47.0% 51.3% 44.7% (2.1 p.p.)
LTE ('000) 5,427.6 5,591.8 5,828.7 6,589.6 6,996.1 7,520.5 7,429.5 27.5
LTE penetration (%) 22.3% 22.8% 23.8% 26.0% 28.6% 31.9% 28.7% 4.9 p.p.
Mobile churn (quarterly) 3.7% 3.6% 3.8% 3.2% 4.7% 5.2% 0.7% (3.1 p.p.)
Contract (1) 3.1% 4.1% 4.6% 4.0% 3.3% 3.2% 3.1% (1.5 p.p.)
Mobile churn (cumulative YTD) 3.7% 3.6% 3.7% 3.6% 4.7% 5.0% 3.5% (0.2 p.p.)
Contract (1) 3.1% 3.6% 3.9% 4.0% 3.3% 3.2% 3.2% (0.7 p.p.)
Mobile ARPU (EUR)(cumulative YTD) 2.4 2.4 2.4 2.3 2.3 2.4 2.4 (3.5)
Prepay 1.9 2.0 2.0 1.9 1.9 2.0 2.0 (3.2)
Contract (1) 11.4 10.4 10.5 9.5 10.9 10.8 10.7 (2.7)
Mobile data traffic (TB) (cumulative YTD) 46,704 101,195 170,382 261,553 105,005 226,080 358,400 (3.1)Notes:- ARPU: monthly average revenue divided by the monthly average accesses of the period. % organic change.- Data traffic is defined as Terabytes used by the company customers, both upload and download (1TByte = 10^12 bytes). Promotional traffic is included. Traffic not associated to the Company's mobile customers (roaming-in, MVNOs, interconnection of third parties and other business lines) is also included. Traffic volume non-rounded.(1) Excludes M2M.

48
08ADDENDA
Key Holdings of the Telefónica Group
% Stake % Stake
TELEFÓNICA ESPAÑA OTHER STAKES
Telefónica de España 100.0 Telefónica de Contenidos 100.0Telefónica Móviles España 100.0 Telxius Telecom S.A. 50.0Telyco 100.0 Telefónica Digital 100.0Acens Technologies 100.0 China Unicom 0.6Telefónica Servicios Integrales de Distribución 100.0 BBVA 0.7DTS, Distribuidora de Televisión Digital 100.0 Prisa (3) 9.4
TELEFÓNICA UK 100.0
TELEFÓNICA DEUTSCHLAND 69.2
TELEFÓNICA BRASIL 73.7
TELEFÓNICA HISPAM SUR
Telefónica de Argentina 100.0Telefónica Móviles Argentina 100.0Telefónica Móviles Chile 100.0Telefónica Móviles Uruguay 100.0Telefónica del Perú 98.6Telefónica Chile 99.1
TELEFÓNICA HISPAM NORTE
Telefónica Móviles México 100.0Telefónica Venezolana 100.0Telefónica Ecuador 100.0Telefónica Costa Rica (1) 100.0Telefónica Colombia 67.5Telefónica Móviles El Salvador (2) 59.6
(1) In February 2019, Telefónica Centroamérica Inversiones,S.L. aagreed the sale of the entire share capital of Telefónica Costa Rica, Telefonía Celular Nicaragua and Telefónica Móviles Panamá . The sale of T. Costa Rica is subject to the applicable regulatory conditions while the closing of the sale of Telefónica Nicaragua and Telefónica Panamá took place on May, 16 and August, 29 respectively, after obtaining the pertinent regulatory approvals.(2) In January 2019, Telefonica Centroamérica Inversiones, S.L. agreed the sale of 99.3% share capital of Telefónica Móviles El Salvador, S.A. The sale is subject to obtaining the corresponding regulatory approvals.(3) As of 20 February 2018, stake communicated to CNMV.
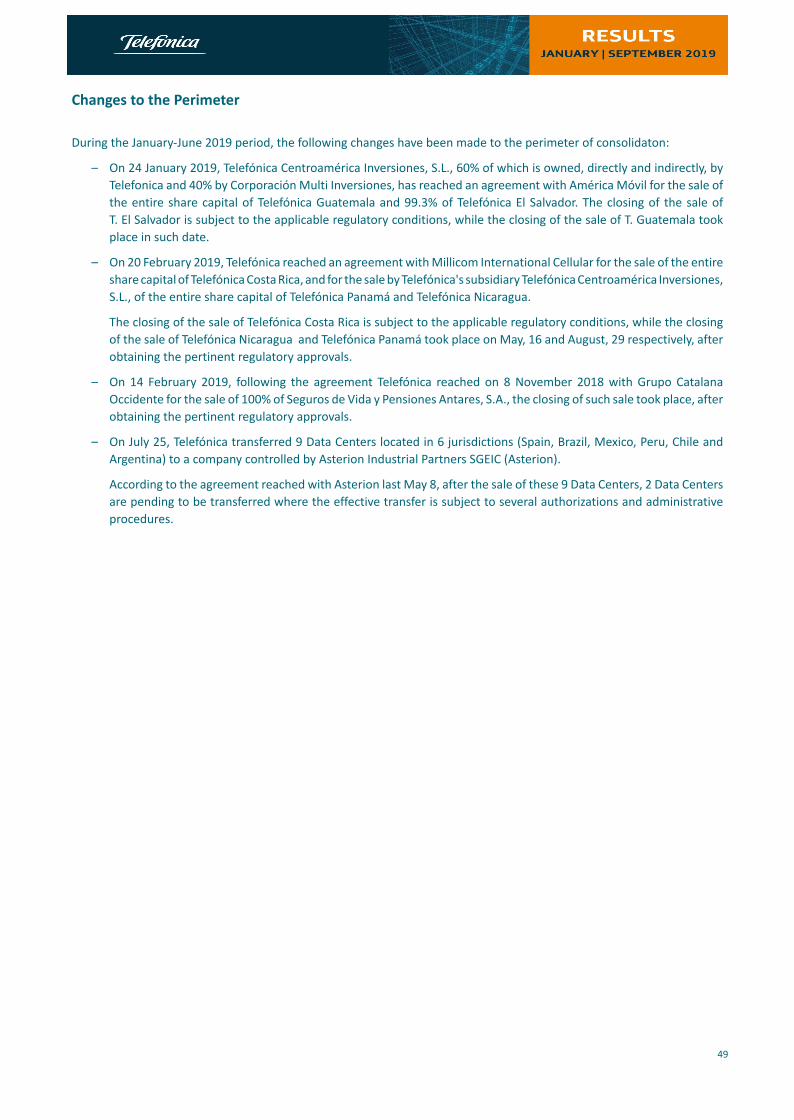
49
Changes to the Perimeter
During the January-June 2019 period, the following changes have been made to the perimeter of consolidaton:
– On 24 January 2019, Telefónica Centroamérica Inversiones, S.L., 60% of which is owned, directly and indirectly, by Telefonica and 40% by Corporación Multi Inversiones, has reached an agreement with América Móvil for the sale of the entire share capital of Telefónica Guatemala and 99.3% of Telefónica El Salvador. The closing of the sale of T. El Salvador is subject to the applicable regulatory conditions, while the closing of the sale of T. Guatemala took place in such date.
– On 20 February 2019, Telefónica reached an agreement with Millicom International Cellular for the sale of the entire share capital of Telefónica Costa Rica, and for the sale by Telefónica's subsidiary Telefónica Centroamérica Inversiones, S.L., of the entire share capital of Telefónica Panamá and Telefónica Nicaragua.
The closing of the sale of Telefónica Costa Rica is subject to the applicable regulatory conditions, while the closing of the sale of Telefónica Nicaragua and Telefónica Panamá took place on May, 16 and August, 29 respectively, after obtaining the pertinent regulatory approvals.
– On 14 February 2019, following the agreement Telefónica reached on 8 November 2018 with Grupo Catalana Occidente for the sale of 100% of Seguros de Vida y Pensiones Antares, S.A., the closing of such sale took place, after obtaining the pertinent regulatory approvals.
– On July 25, Telefónica transferred 9 Data Centers located in 6 jurisdictions (Spain, Brazil, Mexico, Peru, Chile and Argentina) to a company controlled by Asterion Industrial Partners SGEIC (Asterion).
According to the agreement reached with Asterion last May 8, after the sale of these 9 Data Centers, 2 Data Centers are pending to be transferred where the effective transfer is subject to several authorizations and administrative procedures.

50
Alternative performance measures
Information included in compliance with the ESMA Guidelines, 5 October 2015, on Alternative Performance Measures (APM), applicable to published regulated information from 3 July 2016.
The management of the Group uses a series of APM in its decision-making, in addition to those expressly defined in the IFRS, because they provide additional information useful to assess the Group’s performance, solvency and liquidity. These measures should not be viewed in isolation or as a substitute for the measures presented according to the IFRS.
The APM included in this report are: Operating Income Before Depreciation and amortisation, Net Financial Debt, Net Financial Debt plus leases and Net Financial Debt plus commitments, Leverage Ratio, Free cash flow and Free cash flow excluding lease principal payments, Organic Result and Underlying Result.
Operating income before amortisation (OIBDA)
Operating income before depreciation and amortisation (OIBDA) is calculated by excluding solely depreciation and amortisation from operating income. OIBDA is used to track the performance of the business and to establish operating and strategic targets of the Telefónica Group companies. OIBDA is a commonly reported measure and is widely used among analysts, investors and other interested parties in the telecommunications industry, although not a measure explicitly defined in IFRS, and therefore, may not be comparable to similar indicators used by other companies. OIBDA should not be considered as a substitute for operating income.
Furthermore, the Group uses the measure OIBDA margin, which is the result of dividing the OIBDA by the revenues.
As a result of the entry into force of the new standard IFRS 16 Leases, in 2019 most of lease expenses that under prior accounting standard affected operating income, are now affecting depreciation and amortisation or net financial expenses, resulting in higher OIBDA under IFRS 16. Nonetheless, in order to ensure comparability vs. prior year figures, organic variations exclude the effect of IFRS 16 adoption (see Organic Result below).
The detailed reconciliation of Telefónica Group's OIBDA and Operating Income and each of its segments, can be found in this document (Telefónica Group and Segment P&Ls), as well as on the selected financial information contained in “https://www.telefonica.com/documents/162467/145168336/rdos19t3-data.zip”. OIBDA is also defined on the financial information published by the Group as of June 30, 2019 (see particularly Note 2 of the Condensed Consolidated Interim Financial Statements for the first half of 2019).
Debt indicators
a) Net financial debt and Net financial debt plus leases and Net financial debt plus commitments
As calculated by us, net financial debt includes: (i) current and non-current financial liabilities in our consolidated statement of financial position (which includes the negative mark-to-market value of derivatives) and (ii) other payables included in “Payables and other non-current liabilities” and "Payables and other current liabilities" (mainly corresponding to payables for deferred payment of radio spectrum that have an explicit financial component). From these liabilities, the following are subtracted: i) cash and cash equivalents, ii) current financial assets (which include short-term derivatives), iii) the positive mark-to-market value of derivatives with a maturity beyond one year, and iv) other interest-bearing assets (components of “Receivables and other current assets”, “Tax receivables” and “Financial assets and other non-current assets” in our consolidated statement of financial position). In "Receivables and other current assets" we include the customer financing of terminal sales classified as short term, and "Financial assets and other non-current assets" includes derivatives, instalments for the long-term sales of terminals to customers and other long term financial assets.
After the entry into force of IFRS 16 Leases, the distinction between finance leases and operating leases disappears for the purpose of computing the payment obligation. As a result, for comparison purposes, the net financial debt figure of the comparative periods has been modified to exclude the lease liability of finance leases (€202m as of December 31, 2018), and the new indicator “Net financial debt plus leases” has been included in 2019, which is calculated by adding to the net financial debt lease liabilities under IFRS 16 (including also those corresponding to the companies held for sale) and deducting assets from subleases. This new indicator cannot be presented comparatively for periods prior to 2019.

51
We calculate net financial debt plus commitments by adding gross commitments related to employee benefits to net financial debt and deducting the value of long-term assets associated with those commitments and the tax benefits arising from the future payments of those commitments. Gross commitments related to employee benefits are current and non-current provisions recorded for certain employee benefits such as termination plans, post-employment defined benefit plans and other benefits.
We believe that net financial debt, net financial debt plus leases and net financial debt plus commitments are meaningful for investors and analysts because they provide an analysis of our solvency using the same measures used by our management. We use them to calculate internally certain solvency and leverage ratios. Nevertheless, none of them as calculated by us should be considered as a substitute for gross financial debt as presented in the consolidated statement of financial position.
The reconciliation of Telefónica Group's gross financial debt according to the consolidated statement of financial position, net financial debt, net financial debt plus leases and net financial debt plus commitments at the end of June 2019 can be found on page 15 of this document and in the financial information contained in “https://www.telefonica.com/documents/162467/145168336/rdos19t3-data.zip”. Net financial debt is also defined on the financial information published by the Group as of June 30, 2019 (see Note 2 of the Condensed Consolidated Interim Financial Statements for the first half of 2019).
b) Leverage ratio
The leverage ratio is calculated as the ratio of net financial debt over OIBDA for the past 12 months, including or excluding the OIBDA of the companies which are incorporated or removed from the perimeter of consolidation, and excluding certain factors in line with the calculation of organic OIBDA. Likewise, for these purposes OIBDA excludes the impact of IFRS 16 and includes the expense corresponding to the amortisation of assets under finance leases whose payment obligation has been excluded from the calculation of net financial debt in comparative periods, as explained above.
The reconciliation of the leverage ratio can be found in the selected financial information contained in “https://www.telefonica.com/documents/162467/145168336/rdos19t3-data.zip”.
Free Cash Flow
The Group’s free cash flow is calculated starting from “Net cash flow provided by operating activities” as indicated in the consolidated statement of cash flows; deducting (Payments)/proceeds on investments in property, plant and equipment and intangible assets, net, adding the cash received form government grants and deducting dividends paid to minority interests. The cash used to cancel commitments related to employee benefits (originally included in the Net cash flow provided by operating activities) is added as it represents the payments of principal of the debt incurred with those employees.
After the entry into force of IFRS 16 in 2019, the principal payments of lease liabilities are considered as net cash used in financing activities within the consolidated cash flow statement. Under the previous standard, it was considered within net cash flow provided by operating activities. However, to guarantee comparability with previous periods, the principal payments of lease liabilities are deducted in the calculation of the “Free cash flow” of the first half of 2019. For information purposes, the indicator "Free cash flow excluding lease principal payments" has been added, which excludes these payments. This indicator cannot be presented comparatively for periods prior to 2019.
We believe that free cash flow is a meaningful measure for investors and analysts because it provides an analysis of the cash flow available to protect solvency levels and to remunerate the parent company’s shareholders and other equity holders. The same measure is used internally by our management. Nevertheless, free cash flow as calculated by us should not be considered as a substitute for the various flows of cash as presented in the consolidated statements of cash flows.
The reconciliation of net cash flow from operations, according to the consolidated statement of cash flows (on a straight-line basis) and the Group’s Free cash flow according to the above definition, can be found on the selected financial information contained in “https://www.telefonica.com/documents/162467/145168336/rdos19t3-data.zip”. Free cash flow is also defined in the financial information published by the Group as of June 30, 2019 (see Note 2 of the Condensed Consolidated Interim Financial Statements for the first half of 2019).
52
Organic Result
Year-on-year changes referred to in this document as "organic" or presented "in organic terms" intend to present a homogeneous comparison, by applying a constant perimeter of consolidation, constant exchange rates and other specific adjustments which are described herein. "Organic" variations provide useful information about the evolution of the business due to several factors:
– They provide information on the organic performance of the Group's operations in the different markets in which it operates, by maintaining constant exchange rates and perimeter, removing the impact of certain exogenous factors which may distort the year-on-year comparison since they are specific to a certain moment and not associated with the ordinary performance of the business (such as, for example, capital gains or losses from the sale of companies or restructuring associated to simplification plans and aimed at improving efficiency and future profitability of the Company) and therefore, helping the business performance analysis in homogeneous terms.
– Organic results are therefore used both internally and by the various agents in the market to conduct consistent monitoring of trends and of the operating performance of the business. Moreover, this data helps the comparison between the business performance of Telefónica and that of other operators, although the term "organic" is not a term defined in IFRS, and the "organic" measures included herein may not be comparable to similar measures presented by other companies.
For the purposes of this document, "organic" variation 2019/2018 is defined as the reported variation adjusted by the following factors:
– Assumes average constant foreign exchange rates of 2018, except for Venezuela (2019 and 2018 results converted at the closing synthetic exchange rate for each period).
– Excludes the hyperinflation adjustment in Argentina.
– Considers a constant perimeter of consolidation.
– Excludes in 2019 the impact of IFRS 16 accounting change.
– At OIBDA and Operating Cash Flow levels, excludes write-offs, capital gains/losses from the sale of companies, restructuring expenses and non-recurrent material impacts.
– CapEx also excludes investment in spectrum.
Reconciliation between reported data and organic revenue figures, OIBDA and operating cash flow can be found in the selected financial information contained in “https://www.telefonica.com/documents/162467/145168336/rdos19t3-data.zip”.
The Management Report of Telefónica Group contained in the Condensed Consolidated Interim Financial Statements for the first half of 2019 also includes the description of the adjustments for the calculation of the organic variations.
Underlying Result
“Underlying” result or results in “underlying” terms intend to present a result adjusted by certain factors which distort the analysis of the business performance. Unlike the organic result, no exchange rate nor hyperinflation, nor perimeter adjustments are made to the underlying result. Likewise, due to the entry into force of IFRS 16 in 2019, it has been considered appropriate to present the underlying result in accordance with current accounting standards (previously presented excluding the impact of IFRS 16). As in the case of the measures “Net financial debt plus leases” and “Free cash flow excluding principal lease payments” explained above, this measure cannot be presented comparatively with periods prior to 2019. However, the Company provides quarterly data for 2019.
The underlying result is calculated up to net income, while organic variations are calculated up to the Operating income and OIBDA - CapEx. The "underlying" result provides useful information for the company and market agents because:
– It provides additional information on the underlying performance of the Group's operations, removing the distorting effects of certain factors, as they are specific to a certain moment and not associated with the ordinary performance of the business, facilitating the underlying analysis of the business.
– The inclusion of the business underlying performance is used both internally and by the various agents in the market to perform consistent monitoring of trends and operating performance of the business; this data also facilitates the comparison between the business performance of Telefónica and that of other operators, although the term "underlying" is not a term defined in IFRS, and the "underlying" measures included herein may not be comparable to similar measures presented by other companies.

53
For the purposes of this document, "underlying" result is defined as the reported result as adjusted by the following factors:
– Excludes write-downs, capital gains/losses from the sale of companies, restructuring expenses and material non-recurrent impacts.
– Amortisation of intangible assets from purchase price allocation processes is also excluded.
Reconciliation between reported data and OIBDA underlying figures and net income can be found on the selected financial information contained on “https://www.telefonica.com/documents/162467/145168336/rdos19t3-data.zip”.

54
DISCLAIMER
This document may contain forward-looking statements and information (hereinafter, the “Statements”) relating to the Telefónica Group (hereinafter, the "Company" or "Telefónica") or otherwise. These Statements may include financial forecasts and estimates based on assumptions or statements regarding plans, objectives and expectations that make reference to different matters, such as the customer base and its evolution, growth of the different business lines and of the global business, market share, possible acquisitions, divestitures or other transactions, Company’s results and other aspects related to the activity and situation of the Company.
The Statements can be identified, in certain cases, through the use of words such as “forecast”, "expectation", "anticipation", “aspiration”, "purpose", "belief" or similar expressions or variations of such expressions. These Statements reflect the current views of Telefónica with respect to future events, do not represent, by their own nature, any guarantee of future fulfilment, and are subject to risks and uncertainties that could cause the final developments and results to materially differ from those expressed or implied by such Statements. These risks and uncertainties include those identified in the documents containing more comprehensive information filed by Telefónica before the different supervisory authorities of the securities markets in which its shares are listed and, in particular, the Spanish National Securities Market Commission.
Except as required by applicable law, Telefónica does not assume any obligation to publicly update the Statements to adapt them to events or circumstances taking place after the date hereof, including changes in the Company's business, in its business development strategy or any other unexpected circumstance.
This document may contain summarized, non-audited or non-GAAP financial information. The information contained herein should therefore be considered as a whole and in conjunction with all the public information regarding the Company available, including, if any, other documents released by the Company that may contain more detailed information. Information related to Alternative Performance Measures (APM) used in the present document are included in the Appendix “Alternative performance measures”, page 50 of this document. Moreover, recipients of this document are invited to read our condensed consolidated interim financial statements and consolidated interim management report for the six-month period ended June 30, 2019 submitted to the Spanish National Securities Market Commission (CNMV), in Note 2, page 15,of the pdf file.
Neither this document nor any of its contents constitute an offer to purchase, sale or exchange any security, a solicitation of any offer to purchase, sale or exchange any security, or a recommendation or advice regarding any security.
Investor Relations
Distrito Telefónica - Ronda de la Comunicación, s/n28050 Madrid (Spain)Telephone: +34 91 482 87 00Pablo Eguirón ([email protected])Isabel Beltrán ([email protected])Adrián Zunzunegui ([email protected])Christian Kern ([email protected])[email protected]/accionistaseinversores
FOLLOW US: