2012 Annual Results
29
2012 Annual Results 18 March 2013
-
Upload
khangminh22 -
Category
Documents
-
view
0 -
download
0
Transcript of 2012 Annual Results

2012 Annual Results
18 March 2013

Content
ANNUAL RESULTS
BUSINESS REVIEW
PROSPECTS
2
Majestic City, Foshan

ANNUAL RESULTS
3
Glorious International, Xiamen

08 09 10 11 12
5,190 7,646
12,671
15,464
18,722
08 09 10 11 12
19,836
39,278 46,650
51,332
64,581
4
Unit 2012 2011
(Restated) Change
Turnover HK$ Million 64,580.7 51,332.3 25.8%
Turnover(including share of turnover of JCEs)
HK$ Million 77,907.9 57,723.3 35.0%
Gross Profit HK$ Million 24,725.2 20,672.2 19.6%
Net Profit HK$ Million 18,722.2 15,464.1 21.1%
Gross Margin Percentage % 38.3 40.3 - 2 ppts
Net Profit Margin Percentage % 29.0 30.1 -1.1 ppts
EPS HK cents 229.0 189.0 21.2%
DPS HK cents 41 33 24.2%
Turnover (HK$ mn)
Net Profit (HK$ mn)
Dividend payout ratio
Financial Summary
66 94
155
189 229
13 20 27 33 41
20% 21%
17% 17% 18%
0%
5%
10%
15%
20%
25%
0
100
200
300
400
2008 2009 2010 2011 2012
EPS (HK cents) DPS (HK cents) Payout ratio

08 09 10 11 12
33.56 42.61
55.56
71.62
87.22
Financial Summary (cont’d)
5
Unit 31/12/2012 31/12/2011 (Restated)
Change
Cash on Hand HK$ Million 40,932 19,197 113.2%
L/T Debt HK$ Million 53,243 32,803 62.3%
Shareholders' Equity
HK$ Million 87,244 71,617 21.8%
Net Gearing (%) Percentage % 20.5 32.7 -12.2 ppts
Liabilities/Assets (%)
Percentage % 61.9 59.1 2.8 ppts
ROE(%) Percentage % 23.6 24.3 -0.7 ppts
ROA(%) Percentage % 9.2 9.1 0.1 ppts
ROE (%)
ROA(%)
Shareholder’s Equity (HK$ bn)
6.9
7.7
9.2 9.1 9.2
08 09 10 11 12
17.3
20.1
25.8 24.3 23.6
08 09 10 11 12

Pearl River Delta 17.3%
Yangtze River Delta
21.9% Bohai Rim
22.1%
Northern Region 10.4%
Western Region 24.2%
HK & Macau 4.1%
Pearl River Delta
15.5% Yangtze River Delta
20.0%
Bohai Rim 22.0%
Northern Region 16.3%
Western Region 23.0%
HK & Macau 3.2%
6
Turnover (HK$ million) Profit (HK$ million)
2012 2011
(Restated) Change 2012
2011 (Restated)
Change
Property Development
61,407 49,432 24.2% 25,152 20,025 25.6%
Property Investment
585 373 56.8% 4,147 3,331 24.5%
Others 2,589 1,527 69.5% 136 186 -26.8%
Total 64,581 51,332 25.8% 29,435 23,542 25.0%
Property Development Turnover by Region
Total Property Turnover: HK$ 61,407 million
Property Development Operating Profit by Region
Property Development Operating Profit: HK$ 22,510 million
Segment Results Highlights
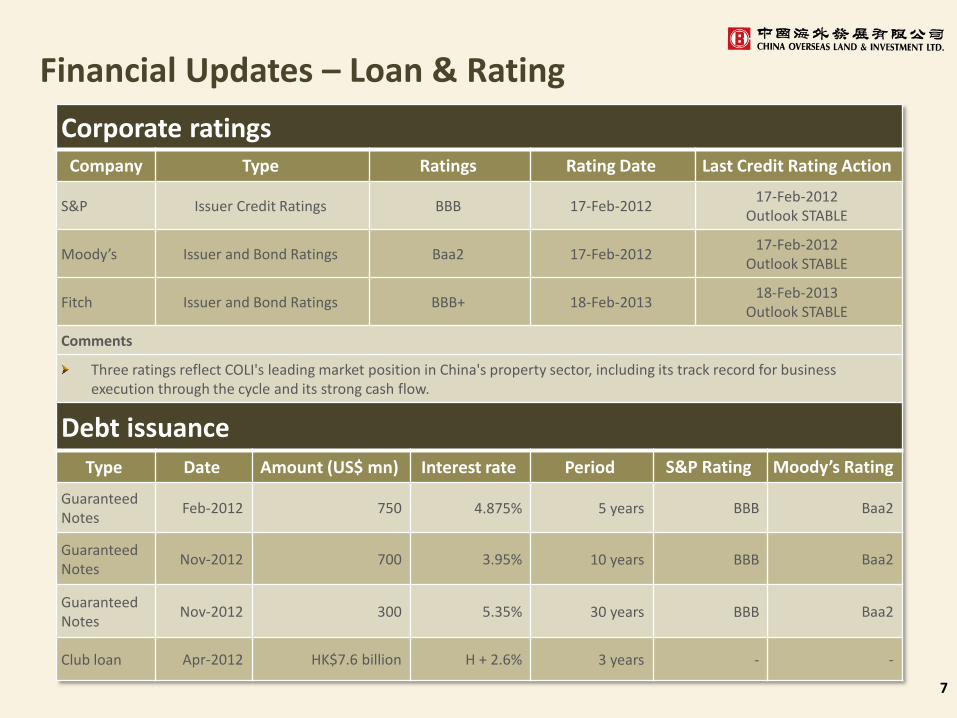
Financial Updates – Loan & Rating
7
Corporate ratings Company Type Ratings Rating Date Last Credit Rating Action
S&P Issuer Credit Ratings BBB 17-Feb-2012 17-Feb-2012
Outlook STABLE
Moody’s Issuer and Bond Ratings Baa2 17-Feb-2012 17-Feb-2012
Outlook STABLE
Fitch Issuer and Bond Ratings BBB+ 18-Feb-2013 18-Feb-2013
Outlook STABLE
Comments
Three ratings reflect COLI's leading market position in China's property sector, including its track record for business execution through the cycle and its strong cash flow.
Debt issuance Type Date Amount (US$ mn) Interest rate Period S&P Rating Moody’s Rating
Guaranteed Notes
Feb-2012 750 4.875% 5 years BBB Baa2
Guaranteed Notes
Nov-2012 700 3.95% 10 years BBB Baa2
Guaranteed Notes
Nov-2012 300 5.35% 30 years BBB Baa2
Club loan Apr-2012 HK$7.6 billion H + 2.6% 3 years - -

Financial Updates –Debt Structure
8
Interest bearing debts by currency
Debt maturity profile *
$HK mn Within 1
year 1-5
years 5-10 years
10+ years
Bank borrowings
5,546 32,095 - -
bonds - 5,787 13,060 2,301
Subtotal 5,546 37,882 13,060 2,301
Percentage 9% 91%
Amount(HK$ billion)
Cash 40.93
Unused credit facilities 8.22
Total 49.15
Net gearing 20.5%
13.7%
36.8%
49.5%
RMB US$ HK$

The Investment Property
The investment property
9
Major Occupied Investment Property
City Name of the project Usage GFA(000㎡)
Beijing China Overseas Plaza Office 139
China Overseas Property Building Office 24 China Overseas Property Plaza Office 82
Chengdu China Overseas International Center phase 1&2 Office 201
China Overseas Building Office 35
Hong Kong China Overseas Building Office 19.5
Horae Plaza Shopping mall 3.6 Union Plaza Shopping mall 6.2
Macau La Cite Shopping mall 4.2
The Fact of COLI’s Investment Property in 2012 (ex COGO)
Total Attributable Investment Property GFA (mn sq.m.) 2.4
The Number of Cities Entered 9
The Number of Unipark Shopping Malls 5
Total Rental Income(HKD mn) 585 22%
53%
25%
Investment property GFA by progress
Investment property GFAleased out
Investment propertylandbank under construction
Investment propertylandbank to be developped
Shopping mall Office
19% 7%
30%
6%
36%
2%
Investment Property landbank GFA by Region
Pearl River Delta
Yangtze River Delta
Bohai Rim
Northern Region
Western Region
HK& Macau

BUSINESS REVIEW
Property Sales
Landbank
Xue Fu Road, Kunming
10

18.14%
23.47%
19.11%
17.21%
15.62%
6.45%
Pearl River Delta
Yangtze River Delta
Bohai Rim
Northern Region
Western Region
HK & Macau
2012 Property Sales
11
Property sales sold by region
202.3
261.7
213.1 191.9
174.2
72.0
145.6
175.0
204.4
158.2 163.5
24.3 38.9% 49.6%
4.3% 21.3% 6.6%
196.3%
0%
50%
100%
150%
200%
250%
0
40
80
120
160
200
240
280
Pearl RiverDelta
Yangtze RiverDelta
Bohai Rim NorthernRegion
WesternRegion
HK & Macau
2012 Sales value (HK$'00mn) 2011 Sales value (HK$'00mn) YoY
Property sales in value
137.04 125.05
140.02
184.37
136.48
6.18
92.39 80.14
97.12
159.5
127.43
1.62
48.3% 56.0% 44.2%
15.6% 7.1%
281.5%
0.00%
50.00%
100.00%
150.00%
200.00%
250.00%
300.00%
0
20
40
60
80
100
120
140
160
180
200
Pearl RiverDelta
Yangtze RiverDelta
Bohai Rim NorthernRegion
WesternRegion
HK & Macau
2012 Sales GFA(‘000 Sq.m.) 2011 Sales GFA(‘000 Sq.m.) YoY
Property sales in GFA
18.79%
17.15%
19.20% 25.29%
18.72%
0.85%
Pearl River Delta
Yangtze River Delta
Bohai Rim
Northern Region
Western Region
HK & Macau
Property sales GFA by region
For 2012, the property contracted sales amounted to HK$ 104.7 billion and the contracted GFA reached 6.8 million square meters.
As at the end of 2012, the property subscription sales amounted to HK$ 6.79 billion and the subscription GFA reached 0.49 million square meters.

2013 Property Sales Updates
12
From Jan-13’ to Feb-13’, the total property contracted sales amounted to HK$25.5 billion and the total contracted GFA reached 1.6 million square. As at the end of February 2013, the property subscription sales amounted to HK$6.8 billion and the subscription GFA reached 377,500 square meters.
Region Contracted GFA
(‘0000sq.m.) Contracted amount
(HK$’00mn) Subscription GFA*
(‘0000sq.m.) Subscription amount*
(HK$’00mn)
Pearl River Delta 55.30 78.19 13.41 20.44
Yangtze River Delta 34.59 72.06 5.53 15.29
Bohai Rim 24.35 43.96 5.85 13.75
Northern Region 18.75 18.78 7.03 9.12
Western Region 26.08 32.64 5.93 9.40
HK & Macau 0.56 9.21 - -
Total 159.63 254.84 37.75 68.00
*As at the end of February 2013

Pearl River Delta, 24.3%
Yangtze River Delta, 45.8%
Bohai Rim, 9.5%
Northern Region, 6.4%
Western Region, 7.4%
HK & Macau, 6.6%
Pearl River Delta, 31.5%
Yangtze River Delta,
40.9%
Bohai Rim, 4.5%
Northern Region, 11.3%
Western Region, 11.5%
HK & Macau,
0.3%
New Land Acquisition in 2012
13
2 projects in 1st tier cities with attributable GFA of 300,703 m2 . 18 projects in 2nd tier cities with attributable GFA of 6.3 mn m2 .
* Exchange rate of Hongkong dollar to RMB is 0.812.
No. City Name of Project Attributable
Interest Land Area
(m2) Total GFA
(m2) Attributable
GFA (m2) Land Cost (RMB mn)
1 Foshan Nanhai District Guicheng Project
100% 199,471.70 731,481.00 731,481.00 1,456.30
2 Hongkong Ap Lei Chau Project 100% 3,050.00 21,350.00 21,350.00 2,060.86*
3 Chengdu Chengnan New District Project
100% 102,309.27 590,034.00 590,034.00 1,676.75
4 Tianjin Hexi District Project 100% 79,955.70 300,000.00 300,000.00 2,970.00
5 Kunming Wuhua District Project 100% 38,973.53 171,484.00 171,484.00 636.00
6 Yantai Gaoxin District Project 100% 74,203.00 207,515.00 207,515.00 270.70
7 Dalian Ganjingzi District Project 100% 99,000.00 216,930.00 216,930.00 648.35
8 Hangzhou Jianggan District Project 100% 84,255.00 422,656.00 422,656.00 5,588.00
9 Shenyang Huanggu District Project 100% 23,101.10 101,834.00 101,834.00 202.17
10 Shenzhen Bao'an District Project 100% 151,787.21 279,353.00 279,353.00 2,000.00
11 Wuhan Hangyang District Project 100% 48,765.00 209,853.00 209,853.00 966.00
12 Hangzhou Xihu District Project 100% 73,321.00 202,713.00 202,713.00 1,321.78
13 Xiamen Jimei District Project 51% 78,760.02 254,700.00 129,897.00 308.14
14 Suzhou Gusu District Project 100% 133,910.70 434,344.00 434,344.00 1,990.00
15 Qingdao Shibei District Project 100% 74,005.70 221,700.00 221,700.00 872.38
16 Suzhou Yuan District Project 100% 121,747.69 284,077.00 284,077.00 837.00
17 Foshan Nanhai Gaoxin District C project
100% 112,291.00 619,279.00 619,279.00 2,840.00
18 Suzhou Wuzhong District G-103 Project
100% 126,911.80 339,819.00 339,819.00 890.00
19 Ningbo Yinzhou New City No.11 South project
100% 186,211.00 507,945.00 507,945.00 1,787.63
20 Ningbo Yinzhou New City No.11 North project
100% 192,471.00 525,021.00 525,021.00 1,847.72
Subtotal: 2,004,501.42 6,642,088.00 6,517,285.00 31,169.78
New land acquisition of COGO : 1,204,068.58 3,679,017.00 3,407,568.36 4,489.42
Total: 3,208,570.00 10,321,105.00 9,924,853.36 35,659.20
Total GFA by region
Total land cost by region

New Land Acquisition in 2013
14
No. City Name of Project Attributable Interest Land Area
(m2) Total GFA
(m2) Attributable GFA (m2)
Land Cost (RMB mn)
1 Kunming Guandu District Project 65% 172,634.96 377,061.00 245,089.65 504.95
2 Beijing Shijingshan District Project 100% 38,097.08 159,648.00 159,648.00 2,018.00
3 Nanjing Jiangning District Project 100% 234,058.70 931,382.00 931,382.00 2,806.00
Subtotal: 444,790.74 1,468,091.00 1,336,119.65 5,328.95
New land acquisition of COGO : 427,543.99 1,459,175.07 1,293,790.27 2,164.12
Total: 872,334.73 2,927,266.07 2,629,909.92 7,493.07
Jiangangshan project, Baoan District Shenzhen

Project Completed in 2012
15
A total of 28 projects and 12 JV projects were completed in 2012.
Total Gross Floor Area (GFA) completed was 4.9 and 2.1 million m2 respectively.
About 82.3% and 67.8% of the total saleable GFA m2 completed was sold by 31 December 2012.
COLI projects completion
City Project Name GFA Completion (‘000m2 )
Beijing
The Metropolis(中海城) 72.3
Residence Nine(九号公馆) 178.3
Walden Pond Villa Phase 4(瓦尔登湖四期) 20.2
Suli Manner(苏黎世家) 66.8
Laogucheng(老古城) 193.5
Jinan International Community (国际社区) 457.4
Shenyang COLI City(中海城) 493.3
La Cite(寰宇天下) 378.3
Dalian Violet Palace(中海紫御观邸) 94.9
Qingdao International Community(国际社区) 219.8
Changchun
Rayal Court(紫御华府) 151.2
International Community(国际社区) 20.4
The Arch(凯旋门) 123.7
Suzhou International Community(国际社区) 346.5
Lohas Island(独墅岛二期) 130.4
Nanchang Sunrise Manor(中海朝阳郡) 58.4
Nanjing The Phoenix(凤凰熙岸) 130.8
Shenzhen Olympic City(康城国际花园) 15.2
Foshan Golden Sand Coast(中海金沙湾中区) 192.3
Zhongshan Dragon Bay phase 1 (龙湾花园一期) 77.5
Xiamen La cite(寰宇天下) 68.6
Changsha International Community(国际社区) 309.8
Xi'an International Community(国际社区) 304.9 Qianjiang new city project, Hangzhou

Pearl River Delta,
6 Yangtze River
Delta, 8
Bohai Rim, 8
Northern Region,
9
Western Region,
9
16
City Project Name GFA Completion (‘000 m2 )
Chengdu
One Villa South(中海城南官邸) 50.7
International Community(国际社区) 120.9
One City South(城南一号) 53.8
Majestic City(中海锦城) 462.6
Zhuhai Silver Bay(银海湾二期) 69.7
Subtotal: 4,862.3
COLI JV projects completion
City Project Name GFA Completion (‘000 m2 )
Tianjin Peaceland Cove(北宁湾) 336.3
Jinan Dragon Manor Phase 2(奥龙观邸二期) 55.3
Shenyang International Community(国际社区) 206.3
Qingdao Violet Palace(紫御观邸) 250.9
Suzhou Gusu Mansion(姑苏公馆一期) 49.0
Ningbo The Dynasty phase 1 (九唐华府一期) 46.1
Hangzhou La Cite(寰宇天下) 164.9
The Tudor(篁外山庄二期) 84.3
Xi'an Greenwood Cove(碧林湾) 244.4
Chongqing
The Throne(紫御江山) 124.2
La Cite(寰宇天下) 282.0
International Community(国际社区) 262.9
Subtotal: 2,106.6
Total: 6,968.9
Project completion by region
No. of Project completion by region
Project Completed in 2012
Pearl River Delta 11% Yangtze River
Delta 14%
Bohai Rim 20%
Northern Region
28%
Western Region
27%

Property Unbooked, Sales Presold & Booked GFA & Amount*
17
112 173 171
267
131 215
152 225
266
379 455
713
418
614
303
478
GFA('0000sq.m.) Amount(HK$'00mn) GFA('0000sq.m.) Amount(HK$'00mn) GFA('0000sq.m.) Amount(HK$'00mn) GFA('0000sq.m.) Amount(HK$'00mn)
JV 688
2011 Unbooked Sales 2012 Property Sales 2012 Booked Property Sales Presold Property
378 552 626 980 549 829 455 703
*Note: Excluding COGO’s property sales.

18
Current Landbank
18
Qingdao
Cities with COLI & COGO
Cities with COLI
COLI landbank by region
Total landbank by city tiers
Bohai
Rim
Yangtze River
Delta
Pearl River
Delta
Western
Region
Northern
Region
Shenzhen
Macau
Zhuhai
Hongkong Zhongshan
Guangzhou Foshan
Nanchang
Changsha
Xi’an
Chengdu
Chongqing
Shanghai
Ningbo
Hangzhou
Suzhou
Beijing
Tianjin
Jinan
Dalian
Shenyang
Changchun
Xiamen
Wuhan
HK&Macau
Yantai Qingdao
Nanjing
Kunming
Region No. City GFA
('000 m2) % Tier
Northern Region
4 Changchun 1,422 3.9% 2
5 Shenyang 5,116 14.0% 2
6 Dalian 608 1.6% 2
7 Qingdao 1,927 5.3% 2
8 Yantai 486 1.3% 2
Subtotal 9,559 26.1%
Region No. City GFA
('000 m2) % Tier
Bohai Rim
1 Beijing 437 1.2% 1
1 Tianjin 810 2.2% 2
3 Jinan 2,515 6.9% 2
Subtotal 3,762 10.3%
Region No. City GFA
('000 m2) % Tier
Yangtze River Delta
9 Shanghai 701 1.9% 1
10 Suzhou 2,407 6.6% 2
11 Nanjing 1,914 5.2% 2
12 Ningbo 1,428 3.9% 2
13 Hangzhou 1,739 4.8% 2
14 Nanchang 438 1.2% 2
Subtotal 8,627 23.6%
Region No. City GFA
('000 m2) % Tier
Pearl River Delta
15 Shenzhen 512 1.4% 1
16 Guangzhou 1,373 3.8% 1
17 Zhongshan 431 1.2% 2
18 Foshan 2,306 6.3% 2
19 Zhuhai 1,332 3.6% 2
20 Changsha 1,020 2.8% 2
21 Xiamen 399 1.1% 2
Subtotal 7,373 20.2%
Region No. City GFA
('000 m2) % Tier
Western Region
23 Chengdu 1,316 3.6% 2
24 Chongqing 3,210 8.8% 2
25 Xi'an 1,386 3.8% 2
26 Kunming 611 1.6%
Subtotal 6,523 17.8%
Region No. City GFA
('000 m2) % Tier
HK & Macau
27 Hongkong 70 0.2% 1
28 Macau 112 0.3% 1
Subtotal 182 0.5%
No. City GFA
('000 m2) % Tier
22 Wuhan 545 1.5% 2
Total Landbank (mn m²)
Att. Landbank (mn m²)
COLI (Incl. COGO) 47.16 41.98
COLI (EX. COGO) 36.57 32.91
COGO 10.59 9.07
8.8%
91.2%
1st tier cities('000sq.m)
2nd tier cities('000sq.m)
20.2%
23.6%
10.3%
26.1%
17.8%
1.5% 0.5%
Pearl River Delta Yangtze River Delta
Bohai Rim Northern Region
Western Region Wuhan
HK & Macau

PROSPECT
19
Qianjiang new city project, Hangzhou

Market Segment
20
Tier-1 Cities
Beijing, Shanghai, Guangzhou, Shenzhen
Cities COLI developed. Cities COLI would enter.
Cities COGO developed. Cities COGO would enter
COLI continues to focus on property market in tier-1 &2 cities.
COGO continues to develop in tier-3 cities with business potentiality.
The number of tier-1 &2 cities is more than 50. In light of current expansion pace, COLI should have ample development space.
Note: 4 national municipalities, 285 prefecture-level cities, and 369 county-level cities for a total amount of 658 cities in China.

Opportunities and Challenges Opportunities Challenges
Tier 1 in Mainland
Fast pace of economic development creates strong demand from first- home buyers
The upgrade of the service industry attracts a large number of talents with strong affordability
The risk associated with huge amount of individual project investments
Industry consolidation in the property market will accelerate, and the market share of top developers will increase
Risk from tightening policies
Tier 2 in Mainland
The acceleration of new urbanization and regional integration bring opportunities
Upgraded industry and population migration will create more demand and investment
Intensified market competition
Risk from inventory oversupply
Hong Kong & Macau
Scarcity of supply, strong affordability, and low interest-rate environment
High development cost with policy uncertainty
21

Strategies
22
Marketing
Investment
Financing
Operational
Stick to Marketing Segmentation Strategy towards various regions and product lines, leveraging market acumen to artfully schedule and organize new launches.
Ensure solid liquidity fundamentals and maintain sound liabilities structure, with net gearing level consistently below 40%.
Land replenishment will be focused on primary locations and strictly in line with cash collection and financial resources on hand.
Further strengthen control and management in every steps of the whole value chain to proactively enhance operational efficiency and effectiveness.
COLI

23
2013 Guidance 2012 Actual
Net profit growth Over 20% 21.1%
Project Completion (million Sq.m. ) 9.0 7.0
New Project Commencement (million Sq.m. )
10.8 9.7
Property Sales (HK$ billion ) 100(Contracted sales amount) 111.5
New Land Acquisition (million Sq.m. ) 8.0 6.6
Total Capex (HK$ billion) 102 65.0
- Outstanding Land Payment (HK$ billion)
22 5.7
- New Land Acquisition (HK$ billion)
30 21.5
- Projects Construction (HK$ billion)
50 37.8
Guidance for 2013

Property Completion Estimate by Region in 2013
24
Region GFA Completion
(‘000 m2)
Pearl River Delta * 2,054.6
Yangtze River Delta 1,815.1
Northern Region 2,890.4
Bohai Rim 770.0
Western Region 1,445.4
HK & Macau 37.6
Total 9,013.1
*Note: Including Zhuhai & Wuhan
Property completion by region in 2013
Pearl River Delta 23%
Yangtze River Delta 20%
Northern Region
32%
Bohai Rim 9%
Western Region
16%
HK & Macau 0%

Subsidiary of China State Construction Engineering Corporation(CSCEC), the largest construction conglomerate in China. CSCEC hold 53.2% of total shares. Incorporated in Hong Kong in 1979. listed on the Stock Exchange of Hong Kong Limited in August 1992. It was the first Chinese enterprise to acquire the listing status by its own local business or assets located in Hong Kong. On 10 December 2007, it became a constituent stock of the Hang Seng Index. Market value rank the first in mainland property sector. The first mainland property company awarded Standard & poors’ BBB rating and Moody’s Baa2 rating. Selected as one of the constituent of Standard & Poor's Global Property 40 Index
Appendix 1: Shareholding Structure
100%
53.0%
100%
53.2%
38%

Appendix 1: Corporate Profile
Macau
Zhuhai Hongkong
Zhongshan
Guangzhou Foshan
Nanchang
Changsha
Xi’an
Chengdu
Chongqing
Shanghai
Ningbo Hangzhou
Suzhou
Nanjing Hefei
Nanning
Guilin
Yinchuan
Hohhot
Beijing
Tianjin
Jinan
Dalian
Yantai
Qingdao
Shenyang
Changchun Jilin
Xiamen
Lanzhou
Wuhan
Ganzhou
Yangzhou
Kunming
Nantong
Changzhou
Yancheng Cities with COLI & COGO
Cities with COGO
Cities with COLI
Bohai
Rim
Yangtze River
Delta
Pearl
River
Delta
Western
Region
Northern
Region

Milestone
In 1995, the layout of the domestic market in tier 1 cities completed, established business in Beijing, Shanghai, Guangzhou, Shenzhen and HK
In 1992, listed on the Stock Exchange of Hong Kong Limited . It was the first Chinese enterprise to acquire listing status by its own local business or assets located in Hong Kong.
In 1988, the group invested in real estate projects in Shenzhen, started to enter China real estate industry.
Incorporated in Hong Kong in 1979.
In 2005, the first mainland property company awarded Standard & Poors’ BBB rating and Moody’s Baa2 rating, which is the highest rating in the industry.
In 2003, the land development became the majority source of profits for the group.
In 2000, Chengdu company established, starting to enter 2 tier cities.
After 1997 financial crisis, the group transferred its business to domestic market.
In 2012, the sales exceed 100 billion HKD,market capitalization exceed 180 billion HKD.
In 2008, city entries reached 20, the group has gradually developed into a trans-regional, first-class China property development enterprise and a national property brand.
On 10 December 2007, it became a constituent stock of the Hang Seng Index, with market capitalization over 160 billion HKD.
Footprints 1984 1988 1992 1993 1995 2000 2002 2003 2004 2005 2006 2007
Hongkong Shenzhen Shanghai Guangzhou Beijing Chengdu Changchun Zhongshan Xi'an Nanjing Macau Suzhou Foshan Ningbo Chongqing Hangzhou Zhuhai Qingdao Dalian Shenyang Tianjin
Cont’d 2008 2010 2011 2012 2013
Jinan Hohhot Guilin Yinchuan Changsha Jilin Yantai Nanchang Hefei Nanning Xiamen Lanzhou Wuhan Ganzhou Yangzhou Kunming Nantong Changzhou Yancheng

Thank you!
Q & A
Jiangangshan project, Shenzhen Acquired in Nov. 2012

Disclaimer
These materials have been prepared by China Overseas Land and Investment Ltd. (“COLI” or the “Company”) solely for information use during its presentation may not be reproduced or redistributed to any other person without the permissions from COLI. By attending this presentation, you are agreeing to be bound by the foregoing restrictions.
It is not the intention to provide, and you may not rely on these materials as providing, a complete or comprehensive analysis of the company’s financial or trading position or prospects. The information and opinions in these materials are provided as at the date of this presentation and are subject to change without notice. None of the Company nor any of its respective affiliates, advisors or representatives shall have any liability whatsoever (in negligence or otherwise) for any loss howsoever arising from any use of these materials.
The information in this material contains certain forward-looking statements. These include statements regarding outlook on future development schedules, business plans and expectations of capital expenditures.
These statements are based on current expectations that involve a number of risks and uncertainties which could cause actual results to differ from those anticipated by the Company.
The materials and information in the presentations and other documents are for informational purposes only, and are not an offer or solicitation for the purchases or sale of any securities or financial instruments or to provide any investment service or investment advice.