Annual Report 2012 - Oerlikon
171
shaping the portfolio Annual Report 2012
-
Upload
khangminh22 -
Category
Documents
-
view
1 -
download
0
Transcript of Annual Report 2012 - Oerlikon

shaping the portfolio
Annual Report 2012

Key figures Oerlikon Group 2012(in CHF million)
2012 2011 Change (abs.) Change (%)
Sales 1 2 906 2 731 +175 +6.4Order intake 1 2 802 2 878 – 76 – 2.6EBITDA 1 547 450 +97 +21.6EBIT 1 421 318 +103 +32.4Operating cash flow 506 438 +68 +15.5Net income 385 224 +161 +71.9
Key figures Oerlikon Group
January 1 to December 31
January 1 to December 31
in CHF million 2012 2011
Order intake 1 2 802 2 878Order backlog 1 834 971Sales 1 2 906 2 731EBITDA 1 547 450– as % of sales 19 % 16 %EBIT 1 421 318– as % of sales 14.5 % 11.6 %Net income 385 224– as % of equity attributable to shareholders of the parent 21 % 14 %Cash flow from operating activities 506 438Capital expenditure for property, plant and equipment and intangible assets 2 181 167Total assets 4 159 4 573Equity attributable to shareholders of the parent 1 858 1 586– as % of total assets 45 % 35 %Net cash 3 339 –86Net Operating Assets 2, 4 1 575 2 205Number of employees 1 12 708 12 726Personnel expense 1 765 740Research and development expenditure 1, 5 106 102
1 2012 continuing operations, 2011 restated.2 2012 continuing operations, 2011 as reported.3 Net cash includes cash and cash equivalents and marketable securities less current and non-current debt.4 Net Operating Assets include current and non-current operating assets (including goodwill and brands and excluding cash and cash equivalents, financial assets, current and deferred tax receivables) less operating liabilities (excluding financial liabilities, current tax payables and deferred tax liabilities).
5 Research and development expenditure includes expense recognized as intangible assets in the amount of CHF 15 million (previous year: CHF 16 million).
Key share-related figures 1
January 1 to December 31
January 1 to December 31
2012 2011
Year high in CHF 10.85 7.85Year low in CHF 5.06 4.06Year-end in CHF 10.35 5.03
Shares outstanding at year-end 325 964 498 323 124 010Market capitalization at year-end in CHF million 3 374 1 625EBIT per share in CHF 1.30 0.99Earnings per share in CHF 1.18 0.68Cash flow from operating activities per share in CHF 1.56 1.36Equity per share in CHF 2 5.74 4.91Dividend per share in CHF 0.25 3 0.20 4
1 Average number of shares with voting and dividend rights (undiluted).2 Attributable to shareholders of the parent.3 Dividend proposed for 2012, to be paid in 2013.4 For financial year 2011, paid in 2012.

Contents
Shareholders’ letter 4
I. Profile
1.0 Information for investors 8
1.1 Oerlikon in the capital markets 9
1.2 Shareholder structure 14
1.3 Communication and information 16
2.0 Oerlikon Group 18
2.1 Markets 22
2.2 Innovation 26
2.3 Regions 28
2.4 Operational excellence 32
II. Operations
3.0 Oerlikon Group operational review 36
3.1 Textile Segment 44
3.2 Drive Systems Segment 46
3.3 Vacuum Segment 48
3.4 Coating Segment 50
3.5 Advanced Technologies Segment 52
III. Governance
4.0 Sustainability 56
5.0 Compliance 58
6.0 Corporate Governance 60
7.0 Remuneration report 84
8.0 Risk management 96
Notes
Accounting principles 107
Notes to the consolidated financial statements 113
Segment information 146
Companies by country 150
Report of the Statutory Auditor 152
Five-year summary of key figures 153
OC Oerlikon Corporation AG, Pfäffikon
Income statement 156
Balance sheet 157
Notes to the financial statements 158
Report of the Statutory Auditor 162
Legal structure 163
IV. Financial report
Key Figures
Key figures Oerlikon Group 101
Key figures by Segment 102
Group
Consolidated income statement/ Consolidated statement of comprehensive income 103
Consolidated balance sheet 104
Consolidated cash flow statement 105
Consolidated statement of changes in equity 106

Dear Shareholders,
It gives me great pleasure to report on a very successful year for your company. 2012 was a transformational year for Oerlikon in which the portfolio was significantly streamlined, the balance sheet was refinanced, operational performance was very good, profitability improved and cash generation was strong.
The sale of our Solar Segment and the announced divestment of the Natural Fibers and Textile Components Business Units have recast the portfolio. These transactions reduce the cyclicality and simplify the Group.
The capital markets have rewarded our strategic and operational achievements with a share price increase of more than 100 %.
2012 also saw a structural transformation of the balance sheet. We have a significant cash position as a result of both divestments and operational performance, and have materially reduced the cost of financing for the company. The refinancing, completed in July, includes a new unsecured credit facility and, for the first time, a Swiss bond. The structure, which demonstrates renewed market confidence in the company, greatly increases flexibility and reduces financing costs by almost half.
The Board of Directors believes the company is well positioned to create sustainable value; the dividend policy introduced last year was a clear indication of this. I am pleased to announce that the Board will recommend a dividend of CHF 0.25 per share for 2012, an increase of 25 % over the last year, to the Annual General Meeting of Shareholders.
Looking forward, the achievements of 2012 have laid the foundation for the next phase in Oerlikon’s history. Through disciplined use of cash we will stimulate profitable growth through R&D investment, operational excellence and by entering new markets and regions.
We continue to face economic uncertainties in many interrelated markets and industries. The Eurozone crisis appears to have calmed for the moment, but sovereign debt, sluggish growth and consumer confidence remain issues around the world. Given our focus on operational excellence, highermargin growth markets and the diversity of our global footprint, which is extensive relative to Oerlikon’s size, I believe the company is well positioned to manage these challenges and will successfully navigate through uncertain times.
On behalf of the Board, I would like to thank our shareholders, our employees, customers and business partners for the commitment and the support they have invested in Oerlikon.
March 4, 2013
Sincerely,
Tim SummersChairman of the Board of Directors
Shareholders’ letter
5
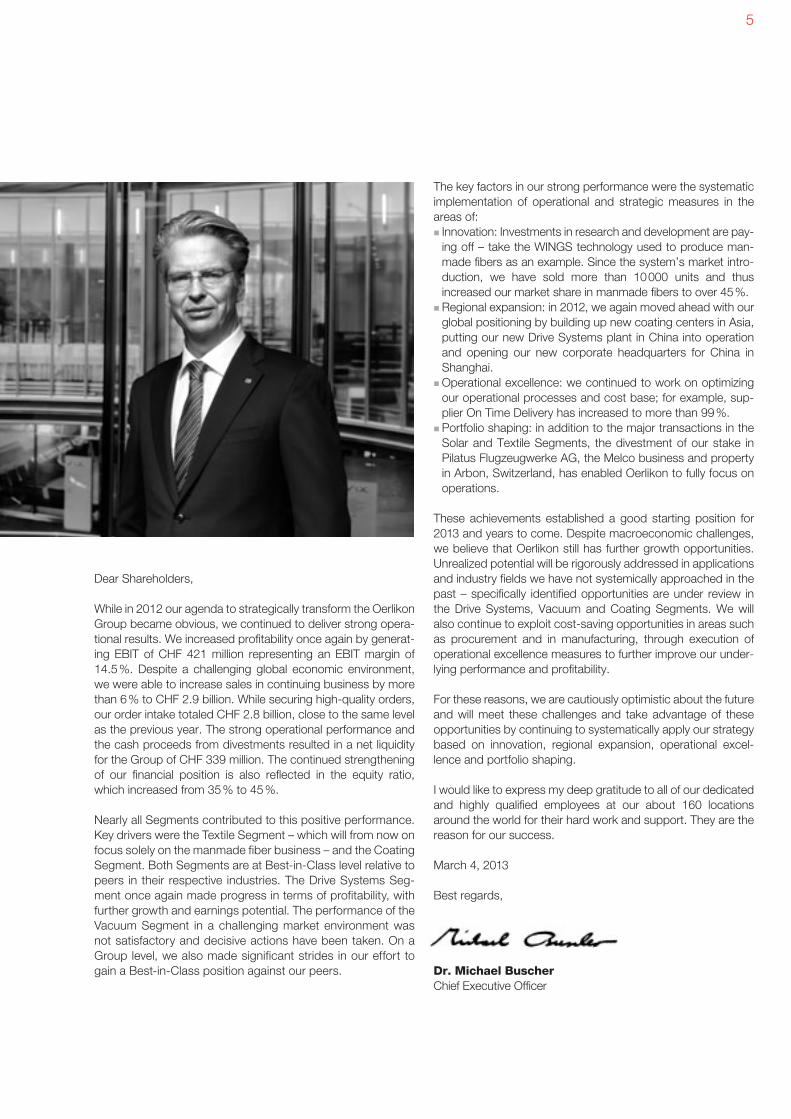
Dear Shareholders,
While in 2012 our agenda to strategically transform the Oerlikon Group became obvious, we continued to deliver strong operational results. We increased profitability once again by generating EBIT of CHF 421 million representing an EBIT margin of 14.5 %. Despite a challenging global economic environment, we were able to increase sales in continuing business by more than 6 % to CHF 2.9 billion. While securing highquality orders, our order intake totaled CHF 2.8 billion, close to the same level as the previous year. The strong operational performance and the cash proceeds from divestments resulted in a net liquidity for the Group of CHF 339 million. The continued strengthening of our financial position is also reflected in the equity ratio, which increased from 35 % to 45 %.
Nearly all Segments contributed to this positive performance. Key drivers were the Textile Segment – which will from now on focus solely on the manmade fiber business – and the Coating Segment. Both Segments are at BestinClass level relative to peers in their respective industries. The Drive Systems Segment once again made progress in terms of profitability, with further growth and earnings potential. The performance of the Vacuum Segment in a challenging market environment was not satisfactory and decisive actions have been taken. On a Group level, we also made significant strides in our effort to gain a BestinClass position against our peers.
The key factors in our strong performance were the systematic implementation of operational and strategic measures in the areas of:
� Innovation: Investments in research and development are paying off – take the WINGS technology used to produce manmade fibers as an example. Since the system’s market introduction, we have sold more than 10 000 units and thus increased our market share in manmade fibers to over 45 %.
�Regional expansion: in 2012, we again moved ahead with our global positioning by building up new coating centers in Asia, putting our new Drive Systems plant in China into operation and opening our new corporate headquarters for China in Shanghai.
�Operational excellence: we continued to work on optimizing our operational processes and cost base; for example, supplier On Time Delivery has increased to more than 99 %.
� Portfolio shaping: in addition to the major transactions in the Solar and Textile Segments, the divestment of our stake in Pilatus Flugzeugwerke AG, the Melco business and property in Arbon, Switzerland, has enabled Oerlikon to fully focus on operations.
These achievements established a good starting position for 2013 and years to come. Despite macroeconomic challenges, we believe that Oerlikon still has further growth opportunities. Unrealized potential will be rigorously addressed in applications and industry fields we have not systemically approached in the past – specifically identified opportunities are under review in the Drive Systems, Vacuum and Coating Segments. We will also continue to exploit costsaving opportunities in areas such as procurement and in manufacturing, through execution of operational excellence measures to further improve our underlying performance and profitability.
For these reasons, we are cautiously optimistic about the future and will meet these challenges and take advantage of these opportunities by continuing to systematically apply our strategy based on innovation, regional expansion, operational excellence and portfolio shaping.
I would like to express my deep gratitude to all of our dedicated and highly qualified employees at our about 160 locations around the world for their hard work and support. They are the reason for our success.
March 4, 2013
Best regards,
Dr. Michael BuscherChief Executive Officer


I. Profile


1.0Information for investors
1. Oerlikon shares outperformed indices and peers in 2012, gaining 106 %.
2. Balance sheet transformed: positive net liquidity position.
3. The Board of Directors proposes dividend for a second consecutive time with a 25 % increase over the last year to CHF 0.25 per share.

0 3
8
Analyst recommendations
After FY 2010 After Q1 2011 After Q2 2011 After Q3 2011 After FY 2011 After Q1 2012 After Q2 2012 After Q3 2012
Buy
Sell
Hold 0
6
2
0 6
2
0 6
3
1 4
3
0 3
6
0 2
8
0 2
8
Year-end 2012
0 2
8
External factors
Fukushima
Decisions at EU summit (lower interest rates for Ireland and Portugal, new bailout package for Greece)
Greece parliament agrees on savings program
Approval of Portuguese bailout (third country after Ireland and Greece)
S&P decreases rating for the US
S&P decreases rating for Portugal and Greece
SNB decision to implement floor for the EUR/CHF rate at 1.20
Decisions at EU summit (haircut for Greece, increase of bailout volume)
ECB announces measures to support bank lending and money market activity
Initial three-year ECB tender
Troika agrees on second bailout package for Greece
ECB second loan
S&P downgrades Spain
Spain announces to request for EU aid for banks
The Eurogroup grants financial assistance to Spain’s banking sector
ECB announces unlimited bailout program
US elections
Federal Court rules that Germany can proceed with its contribution to bailout program
Elections in Greece
Chinese Communist Party elects new leadership
Decisions on US fiscal cliff
Lender approval to amend syndicated credit facility agreement
Divestment of carding business in Textile Segment
Signing of technology partnership with Sauber F1 Team
Capital Market Days 2011
Announce-ment of Solar divestment
Announcement of Italian footprint adjustment in Drive Systems
Sale of Arbon property
Pilatus Flugzeugwerke AGdivestment
Signing of new credit facilityRegulatory approval to divest Solar Segment
Sale of Solar Segment completed
Opening Chinese headquarters in Shanghai
Swiss bond issue
Divestment of Melco in Textile Segment
Refinancing completed
Announcement of new Vacuum CEO
Announcement of new Drive Systems CEO
Announcement of Natural Fibers and Textile Components divestment
2012performance
Dividend payment of CHF 0.20 per share
Announcement of relocation of Textile Segment management to China
Production expansion of Vacuum Segment in China
Oerlikon corporate actions
Jan. 2011 Apr. 2011 Jul. 2011 Oct. 2011 Jan. 2012 Apr. 2012 Jul. 2012 Oct. 2012
2502402302202102001901801701601501401301201101009080706050
Oerlikon
STOXX Europe 600
SMI
SMIM FY
201
0 re
sult
s
Q1
2011
res
ults
Q2
2011
res
ults
Q3
2011
res
ults
FY 2
011
resu
lts
Q1
2012
res
ults
Q2
2012
res
ults
Q3
2012
res
ults
+106%
Development of the Oerlikon share priceIndexed; 100 % = closing price as of December 31, 2010

9
350
300
250
200
150
100
50
0
Capital marketsDespite continued economic uncertainty, European capital markets delivered good performance in 2012; the Swiss Market Index (SMI) gained 15 % and the STOXX Europe 600 index rose 14 %.
From the beginning of 2012 stock market indices benefited from the considerable easing in the banking sector resulting from the threeyear tender launched by the European Central Bank (ECB) in December 2011. Overall, the Swiss capital market performed well in the first quarter of 2012, rising 5 %. Both the SMI and the SIM Mid (SMIM) benefited from the minimum EUR/CHF exchange rate of 1.20 set by the Swiss National Bank (SNB).
Sentiment in the second quarter of 2012 was driven by the worsening of Spain’s banking situation and speculation about the collapse of the European monetary union. Continuing uncertainty surrounding Greece and doubts as to the willingness of the European Union to inject capital led to record yields on government bonds, most notably in the peripheral Eurozone countries. This contributed to a general weakening of the equity markets (SMI –3 %).
Recapitalization of Spanish banks and the ECB commitment to maintain the monetary union restored investor confidence in the third quarter. The SMI surpassed the 6 500 mark and gained 7 % between July and September. Despite concerns over a possible fiscal cliff and ensuing recession in the USA, the fourth quarter was positive for the European capital markets. The SMI posted its annual high of 6 974 points on December 11 before closing the year at 6 823 (+5 %).
Oerlikon share performance in 2012Despite volatility in the capital markets, Oerlikon shares gained 106 %, closing the year at CHF 10.35 (closing price 2011: CHF 5.03). Oerlikon was one of the topthree performers in the Swiss All Share Index and the top performer in the SMI Expanded Index, which consists of the 50 most highly capitalized stocks in the Swiss equity market. In the global industrial sector, represented by the Dow Jones Industrial and the STOXX 600 Industrial indices, Oerlikon was the top performer. Oerlikon shares were lowest in intraday trading on January 3 at CHF 5.06 and hit an annual high of CHF 10.85 in intraday trading on December 4.
Key events in 2012: The announced sale of the Solar Segment to Japan’s Tokyo Electron (TEL) and publication of the higherthanexpected annual results for 2011 at the beginning of March 2012 contributed to a share price increase of 11 % within a month. In April the Annual General Meeting of Shareholders approved a dividend payment (CHF 0.20 per share) for the first time in nearly a decade. Following successful completion of the refinancing in July and publication of halfyear results, which were accompanied by an upward revision of the annual guidance for 2012, the share price gained a further 19 % within six weeks. Conclusion of the Solar transaction in November 2012 and the announced sale of the Natural Fibers and Textile Components Business Units in December 2012 resulted in a further gain of 15 % in the fourth quarter.
The strong performance of Oerlikon’s share price also is a clear sign of the regained belief and confidence of the financial market in our ability to consistently execute on our strategic and operational plans in order to deliver on our announced targets.
Market capitalizationin million shares / in CHF million
Compliance Corporate Governance Remuneration report Risk management Financial report
1.1Oerlikon in the capital markets
Shares outstanding
3 500
3 000
2 500
2 000
1 500
1 000
500
0
31/12/2012
31/12/2011
31/03/2012
30/06/2012
30/09/2012
Price range and trading volume 2012 (SIX Swiss Exchange)in thousand shares / in CHF
J F M A M J J A S O N D
2 500
2 000
1 500
1 000
500
0
Average daily trading volume
Price min – price max Closing price
12
10
8
6
4
2
0
323.1 323.1 323.3 325.5 326.0

10
Key share-related figures 1
2012 2011 2010 2009 2008
Yearend in CHF 10.35 5.03 4.90 31.68 69.00Year high in CHF 10.85 7.85 12.30 86.20 472.00Year low in CHF 5.06 4.06 3.69 20.82 66.50Year average in CHF 8.20 6.05 4.86 n/a n/a
Average daily trading volume in thousands 1 463 1 600 879 98 90Average daily trading volume in CHF
thousands11 982 9 596 4 373 n/a n/a
Shares outstanding at yearend Number 325 964 498 323 124 010 323 085 471 14 142 437 14 142 437
Market capitalization at yearend in CHF million 3 374 1 625 1 583 448 976
Earnings per share (undiluted) in CHF 1.18 0.68 0.01 –54.27 –17.69Earnings per share (diluted) in CHF 1.16 0.68 0.01 –54.27 –17.69Priceearnings ratio 8.77 7.40 490.00 –0.58 –3.90
Payout ratio 29 % 2 29 % 0 % 0 % 0 %Dividend per share in CHF 0.25 3 0.20 4 0.00 0.00 0.00Dividend yield 2 % 4 % – – –
Equity per share 5 in CHF 5.74 4.91 6.92 38.44 85.26Cash flow from operating activities per share in CHF 1.56 1.36 2.47 7.02 9.59
1 Average number of shares with voting and dividend rights.2 Based on a normalized EPS of CHF 0.85.3 Dividend proposed for 2012, to be paid in 2013.4 For financial year 2011, paid in 2012.5 Attributable to shareholders of the parent.
Listing on the stock exchangeThe registered shares of OC Oerlikon Corporation AG, Pfäffikon have been listed on the SIX Swiss Exchange since December 22, 1975, and are traded in the main segment.
2012 2011SMIM 2.0155 –SMI Expanded 0.1892 –SPI 0.1770 0.10104SPI Extra 1.2644 0.66936SPI ex SLI 1.8295 0.92962STOXX Europe 600 0.0255 –Swiss All Share 0.1763 0.10005UBS 100 Index 0.1795 0.10261
Securities symbol OERLSecurities number 81 682Security type Registered shareISIN International Stock Identification Number CH0000816824Settlement currency CHFStock exchange SIX Swiss ExchangeFirst trading day 22.12.1975Bloomberg ticker symbol OERL SReuters ticker symbol OERL.S
Weighting of the Oerlikon share in indicesas of December 31, 2012, in %
Letter Information for investors Oerlikon Group Operational review Sustainability
Oerlikon in the capital markets

11
0.40
0.35
0.30
0.25
0.20
0.15
0.10
0.05
0.00
100 %
90 %
80 %
70 %
60 %
50 %
40 %
30 %
20 %
10 %
0 %2008 2009 2010 2011 2012 1
0.20
000
0.25
29 % 29 %
Dividend in CHF
Payout ratio Dividend 2012 Dividend 2011
Compliance Corporate Governance Remuneration report Risk management Financial report
By yearend, Oerlikon’s total market capitalization increased to CHF 3 374 million, a yearonyear gain of 108 %, based on Oerlikon’s share performance and increased shares outstanding (2011 reporting date: CHF 1 625 million).
Average daily trading volume on the 250 trading days in 2012 continued to be on a strong level of 1 463 396 shares (0.4 % of the issued shares; 2011: 1 600 078 shares).
Shareholder returnsOerlikon announced a new dividend policy in 2012 that allows for annual distribution to shareholders of up to 40 % of net profits, subject to the level of funds available.
Oerlikon generated earnings per share of CHF 1.18 in 2012. At the Annual General Meeting of Shareholders on April 30, 2013, the Board of Directors will propose a 25 % dividend increase to CHF 0.25 per share paid from capital contribution reserves, equivalent to an unchanged payout ratio of 29 % based on normalized earnings per share of CHF 0.85 (without the effects of the Solar divestment and property sale of Arbon, Switzerland).
Based on the yearend closing price of CHF 10.35, Oerlikon shares yielded 2.4 % in 2012.
1 Proposed to the AGM; based on a normalized EPS of CHF 0.85.

12
14
12
10
8
6
4
2
0
J F M A M J J A S O N D
Analyst recommendationsEleven financial analysts covered Oerlikon in 2012 and published recommendations and performance estimates based on their analyses. Two financial institutions, Berenberg Bank and Société Générale, initiated coverage during the course of the year. MainFirst suspended coverage in 2012 following a change of analysts, but intends to resume coverage in 2013. Oerlikon provides analysts and investors with market consensus figures in order to meet the requirement for an independent and transparent assessment of performance. This consensus is based purely on analyst estimates and in no way reflects the opinion of Oerlikon.
Oerlikon’s strong operating performance, comprehensive refinancing and portfolio shaping – the sale of the Solar Segment and the announced disposal of the Natural Fibers and Textile Components Business Segments in particular – were well received by the financial community. Consequently, all analysts revised their valuation and price targets upward during the course of the year. The analysts’ average target price increased by 75 % from CHF 6.75 to CHF 11.79 during 2012.
As of December 31, 2012, eight out of ten analysts recommended the purchase of Oerlikon shares (buy/accumulate). There were two neutral (hold/neutral) and no negative (underperform/underweight) recommendations.
Oerlikon seeks to expand the number of institutions covering the company, particularly outside of Switzerland, in order to broaden the basis for consensus figures.
Institution Recommendation (2011 recommendation)
Target price in CHF (2011 target price in CHF)
as of December 31, 2012
AlphaValue (F) Pierre-Yves Gauthier
Buy(Buy)
12.50(8.57)
Bank am Bellevue AG (CH)Michael Studer
Hold(Hold)
10.50(4.80)
Berenberg Bank (D)Benjamin Gläser
Buy(–)
11.00(–)
Credit Suisse AG (CH)Patrick Laager
Outperform(Underperform)
12.40(4.50)
Helvea SA (CH)Reto Amstalden
Accumulate(Accumulate)
11.20(8.10)
Kepler Capital Markets (CH)Christoph Ladner
Buy(Hold)
13.00(7.80)
MainFirst Schweiz AG (CH)Thomas Baumann (until Sept. 2012)
Suspended(Buy)
Suspended(6.50)
Société Générale (F)Jean-Baptiste Roussille
Hold(–)
11.00(–)
UBS AG (CH)André Rudolf von Rohr
Buy(Buy)
12.00(6.60)
Bank Vontobel AG (CH)Michael Foeth
Buy(Hold)
12.50(7.10)
Zürcher Kantonalbank (CH)Armin Rechberger
Overweight(Underweight)
–(–)
Consensus 11.79(6.75)
Target price 2012 in CHF
Letter Information for investors Oerlikon Group Operational review Sustainability
Oerlikon in the capital markets
Maximum target price miminum target price Consensus Share price
Analyst recommendations

13
638 3045
339
700
600
500
400
300
200
100
0
700
600
500
400
300
200
100
02013 2014 2015 2016 2017
Credit ratings and financingStrong operational and financial performance improved Oerlikon’s access to capital markets and facilitated optimization of financing and diversification of funding sources. In July 2012 Oerlikon successfully issued a fouryear Swiss bond with a coupon of 4.25 % for CHF 300 million. The net proceeds from the transaction were used to refinance the previous credit facility, which was repaid two years ahead of schedule. As a result, the financing from Oerlikon’s first comprehensive recapitalization in 2010 was paid back in full.
The bond, which was last rated BB+ by UBS AG in November 2012, was a precondition for entry into a new CHF 800 million syndicated loan agreement in July 2012. The new unsecured loan agreement, which reduces financing costs by nearly half, comprises 1) a tranche of CHF 700 million (Facility A), consisting of a CHF 450 million revolving credit facility and an ancillary tranche of CHF 250 million with a term of three years with two additional extension options of one year each, and 2) an optional credit tranche (term loan) of CHF 100 million with a term
of 12 months (Facility B). As the performance of the bond issue exceeded expectations, Facility B was canceled. Facility A is intended for general corporate financing, whereby the flexible terms and conditions of the contract will allow the company to tap new growth potential. The initial margin of the new syndicated loan was 250 basis points above the LIBOR rate.
As of December 31, 2012, the Group had noncurrent loans and borrowings of CHF 304 million, attributable primarily to the Swiss bond. No liquidity was drawn from Facility A as of the reporting date. Cash and cash equivalents amounted to CHF 638 million. In total, the Group reported a net liquidity of CHF 339 million at December 31, 2012.
Financing instrumentsNet liquidity in CHF million, as of December 31, 2012
Compliance Corporate Governance Remuneration report Risk management Financial report
Maturity of financing instruments
Facility A CHF 700 million (prolongation options until 2017)
Swiss bond CHF 300 million
Facility A CHF 700 million Swiss bond CHF 300 million
Cash and cash equivalents Others Non-current loans and borrowings Net liquidity

14
Shareholder structure was essentially unchanged in 2012. Under the terms of the Federal Act on Stock Exchanges and Securities Trading, shareholders with holdings above a certain percentage of the share capital are required to disclose their holding. In 2012 the only disclosures were for minor changes in the holding of the Renova Group, which remains Oerlikon’s main shareholder with yearend holdings of 47.92 % (2011: 47.98 %).
At the end of 2012, Oerlikon held 0.9 million treasury shares (0.28 % of the share capital), which are intended to be used, among other things, as incentive instruments for top management as part of the company’s longterm compensation policy (2011: 0.6 million).
Excluding the holding of Renova Group and the treasury shares, the remaining 51.8 % of the shares were spread among institutional and private investors. The number of registered shareholders fell from 17 700 in 2011 to 15 600 in 2012.
Oerlikon regularly commissions an analysis of the shareholder base in order to track the composition of nonregistered shareholders in addition to registered shareholders. The latest study conducted in January 2013 revealed that slightly above 8 % of the share capital is held by private investors, the vast majority of whom are Swiss residents (2011: around 11 %). 92 % of the share capital belongs to a group of professional investors comprised of financial investors such as the Renova Group, institu
1.2Shareholder structure
Letter Information for investors Oerlikon Group Operational review Sustainability
Shareholder structure
Shareholder structureas of December 31, 2012
Regional distribution of institutional investors as of December 31, 2012
Oerlikon 0.28 %
Others 51.80 % Switzerland 42 %
Renova Group 47.92 %
tional investors, as well as insurances and pension funds. The intensified dialog with the capital market and the strong performance of Oerlikon increased the interest and investment especially of institutional investors. In 2012, the proportion of shares held by this group nearly doubled to 32 % compared to 17 % a year ago. The regional distribution of institutional holdings also balanced in 2012. The majority of institutional holdings remains in Switzer land, representing 42 % of the institutional investors, but declined from 57 % a year ago. In contrast, the share from institutional investors from the United Kingdom and Ireland increased to 22 % compared to 12 % in 2011. A total of 21 % of the institutional shareholders reside in North America (2011: 19 %). Institutional investors located in the rest of the world increased slightly from 12 % to 15 %. Subsequent to the reporting period, BlackRock Group, New York, disclosed that they hold 9 720 390 shares representing 2.98 % of the equities (325 964 498 shares issued).
North America 21 %
United Kingdom and Ireland 22 %
Others 15 %

15
20 000
18 000
16 000
14 000
12 000
10 000
8 000
6 000
4 000
2 000
0
31/12/2008
31/12/2009
31/12/2010
31/12/2011
31/12/2012
16 944
14 065
20112010 J F M A M J J A S O N D 12 12 12 12 12 12 12 12 12 12 12 12
8 %11 %11 %12 %7 %
92 %
89 %89 %
88 %93 %
13 600 14 400
17 600 17 700
15 600
Number of registered shareholders Warrants (outstanding) in thousand
Shareholder structure
ShareholderDec. 2012
No. of shares in %Dec. 2011
No. of shares in %Dec. 2010
No. of shares in %
Renova Group 1 (composed of Liwet Holding AG, Zurich, Switzerland, Renova Industries Ltd., Nassau, Bahamas, and Lamesa Holding S.A., Panama, Republic of Panama) 156 210 954 47.92 2 155 035 964 47.98 148 984 860 46.11
RB Capital East GmbH (previously: Victory Industriebeteiligung GmbH), Vienna, Austria n/a – n/a > 3.00 11 272 528 3.49
OC Oerlikon Corporation AG, Pfäffikon 902 248 0.28 589 011 0.18 300 000 0.09
Others 168 851 296 51.80 167 499 035 51.84 162 528 083 50.31
1 Beneficial owner (as per disclosure notification): Viktor F. Vekselberg, Zug and Moscow.2 Basis: shares issued (325 964 498).
Compliance Corporate Governance Remuneration report Risk management Financial report
In the course of the 2010 refinancing process certain creditors were granted 16 944 182 options (warrants) with the right to purchase one OC Oerlikon Corporation AG, Pfäffikon registered share. The options expire on June 30, 2014. The exercise price after the dilution adjustment is CHF 5.86 and must be fully paid in cash. During the 2012 reporting period a total of 2 840 488 options were exercised. At December 31, 2012, there were 14 065 155 options outstanding.
Private investors Institutional / financial investors
16
Transparency in communicationOerlikon provides its shareholders and the capital markets with transparent, comprehensive and timely information on facts and developments of relevance to them, and in a manner that is in keeping with the principle of equal treatment of all capital market participants. Apart from the detailed annual report and the halfyear report, Oerlikon publishes key financial figures (sales, order intake, order backlog) for the first and third quarters of the financial year. In 2012 these quarterly reports were supplemented by profitability figures (EBIT) at Group and Segment level. In addition, press releases keep shareholders and the capital markets informed of significant changes and developments in the company.
As a company listed on the SIX Swiss Exchange, Oerlikon is subject to the obligation to disclose pricesensitive information (ad hoc publicity obligation).
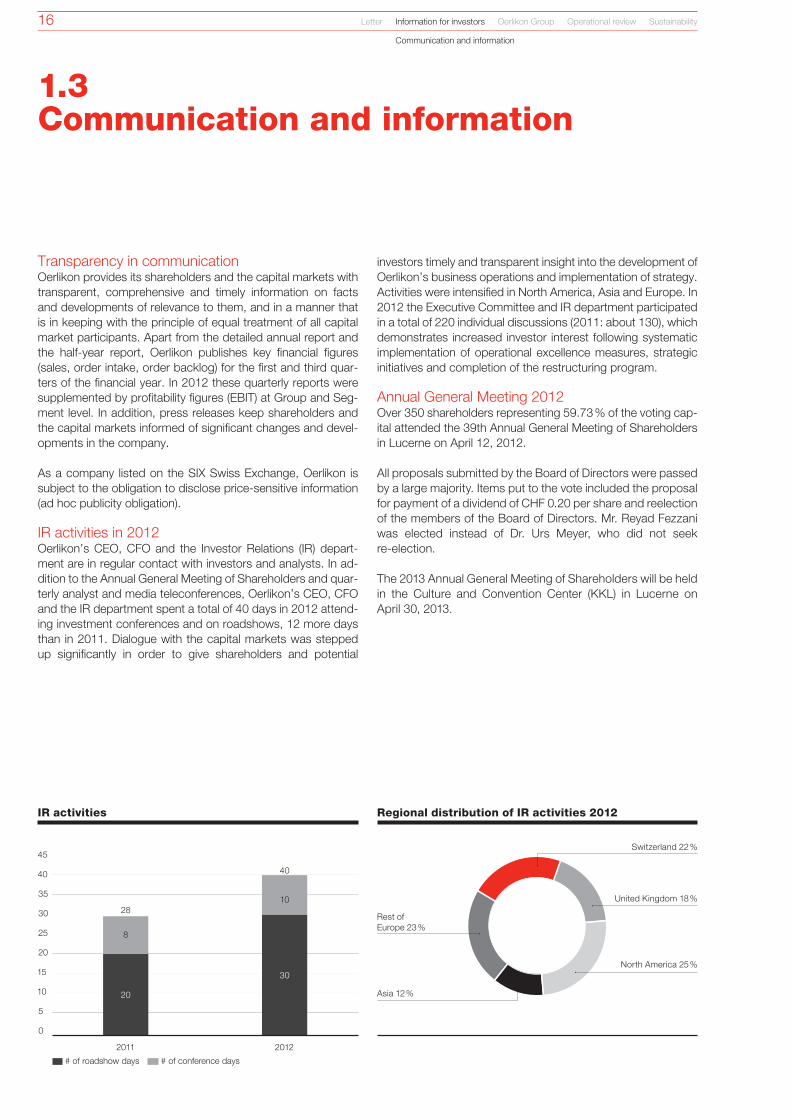
IR activities in 2012Oerlikon’s CEO, CFO and the Investor Relations (IR) department are in regular contact with investors and analysts. In addition to the Annual General Meeting of Shareholders and quarterly analyst and media teleconferences, Oerlikon’s CEO, CFO and the IR department spent a total of 40 days in 2012 attending investment conferences and on roadshows, 12 more days than in 2011. Dialogue with the capital markets was stepped up significantly in order to give shareholders and potential
investors timely and transparent insight into the development of Oerlikon’s business operations and implementation of strategy. Activities were intensified in North America, Asia and Europe. In 2012 the Executive Committee and IR department participated in a total of 220 individual discussions (2011: about 130), which demonstrates increased investor interest following systematic implementation of operational excellence measures, strategic initiatives and completion of the restructuring program.
Annual General Meeting 2012Over 350 shareholders representing 59.73 % of the voting capital attended the 39th Annual General Meeting of Shareholders in Lucerne on April 12, 2012.
All proposals submitted by the Board of Directors were passed by a large majority. Items put to the vote included the proposal for payment of a dividend of CHF 0.20 per share and reelection of the members of the Board of Directors. Mr. Reyad Fezzani was elected instead of Dr. Urs Meyer, who did not seek reelection.
The 2013 Annual General Meeting of Shareholders will be held in the Culture and Convention Center (KKL) in Lucerne on April 30, 2013.
1.3Communication and information
IR activities
Switzerland 22 %
United Kingdom 18 %
North America 25 %
Rest of Europe 23 %
Asia 12 %
Regional distribution of IR activities 2012
Letter Information for investors Oerlikon Group Operational review Sustainability
Communication and information
45
40
35
30
25
20
15
10
5
0
2011 2012 # of roadshow days # of conference days
8
20
30
2810
40

17
Financial calendarMarch 5, 2013Annual Results 2012 and Annual Report 2012
April 30, 2013Annual General Meeting of Shareholders, Lucerne
May 7, 2013Q1 Results 2013
August 6, 2013Q2 / HY 2013 and HalfYear Report 2013
October 29, 2013Q3 Results / 9M 2013
Dates of roadshows, conferences and other events can be found in the financial calendar on our website at www.oerlikon.com/ir
ContactGroup HeadquartersOC Oerlikon Corporation AG, PfäffikonChurerstrasse 120CH8808 Pfäffikon SZSwitzerlandwww.oerlikon.com
Investor RelationsAndreas SchwarzwälderTel. +41 58 360 96 22Fax +41 58 360 98 [email protected]
Group CommunicationsBurkhard BöndelTel. +41 58 360 96 02Fax +41 58 360 91 [email protected]
Compliance Corporate Governance Remuneration report Risk management Financial report

2.0Oerlikon Group
1. Oerlikon creates innovative industrial solutions for a better life.
2. Innovation is at the very core of Oerlikon’s culture and the key differentiator for our customers as well as for the company itself.
3. With a regional footprint of about 160 sites in 34 countries, Oerlikon is a global player with a strong position in emerging markets such as China and India.
Manmade Fibers
Natural Fibers
Textile Components
Innovative industrial solutions
Oerlikon is a highly innovative industrial group specializing in machine and plant engineering. The Group is active in five businesses: textile machines for manufacturing manmade fibers, drive and transmission systems and components, vacuum systems, thinfilm coatings and nanotechnology. In 2012, around 12 700 employees at about 160 sites in 34 countries generated sales of CHF 2.9 billion. The Oerlikon Group provides leading technology solutions that enable customers to generate competitive advantage. Both industrial and commercial customers use Oerlikon production technologies and components in the successful manufacture or application of hightech products; whether in cars, computers, machine tools, technical clothing, oil platforms, tires or a host of other products, Oerlikon’s applications are omnipresent because they offer measurable added value. For example, almost 70 % of all agricultural vehicles in use today are equipped with Oerlikon synchronizers and powershift clutch technology which considerably lower fuel consumption and increase durability.
Research and development (R&D) is at the heart of the company. Oerlikon invests around CHF 100 million every year in R&D and has more than 1 000 highly qualified developers and engineers around the world working on tomorrow’s innovations. We are continuously reinventing ourselves and using our technological expertise to develop completely new applications and access new markets: this is fundamental to Oerlikon’s success and positions the company for growth markets such as food, clothing, transportation systems, infrastructure, energy and electronics. Group structureThe Oerlikon Group comprises five Segments: Textile, Drive Systems, Vacuum, Coating and Advanced Technologies. The primary areas of activity are production of textile machinery (Textile Segment), drive technology (Drive Systems Segment), protective coatings for precision tools and components (Coating Segment), systems for vacuum production and process gas extraction (Vacuum Segment) and production systems for semiconductor and nanotechnology applications (Advanced Technologies Segment). Each of the Segments holds a leading position in its respective market: No. 1 in coating solutions and

19
the production of textile machinery for manmade fibers, and No. 2 in niche markets for drive systems and in the areas of vacuum and nanotechnology.
Sustainable value creation“Oerlikon creates innovative industrial solutions for a better life.” Following our Vision, Oerlikon continuously strives to generate added value for its stakeholders, including customers, shareholders and employees. The Group has enshrined this objective in its mission statement and corresponding Core Values.
Since the beginning of the company’s turnaround in 2010, Oerlikon has focused on the successful, consistent implementation of:
� Innovation �Regional expansion �Operational excellence � Portfolio shaping
From a strategic perspective, 2012 marked a key milestone in the optimization of the portfolio. With the sale of the Solar Segment and the announced sale of the Natural Fibers and Textile Components Business Units, Oerlikon has refocused the portfolio in markets with lower cyclicality.
The Group is increasing its focus on highmargin businesses with attractive growth potential. Alongside further operational improvements in the Group’s core activities, emphasis will be placed on developing new areas of application, adding complementary or related technologies to the portfolio and regional expansion in order to generate sustainable, profitable growth, both organically and through acquisitions.
Textile Segment Oerlikon’s Textile Segment is the market leader in machinery for the manmade fibers sector, a less cyclical and growing market in the global fiber industry. End usage of manmade fibers includes not only clothes like apparel, functional or sportswear, but also home textiles (carpets, curtains) as well as more and more technical applications in cars (tire cord, seat belts, interior), fibers for geotextiles or new materials (composite materials).
Focused on highend solutions delivered to a bluechip customer base, the Segment continuously sets new industry standards with innovations marketed under the Oerlikon Barmag and Oerlikon Neumag brands. The portfolio encompasses a comprehensive range of solutions including plant design for both manmade fibers and nonwoven production. The Segment has a strong global footprint with 10 sites in 4 countries, with production concentrated in Germany and China.
Oerlikon Barmag is the global market leader in spinning line production for manmade fibers such as polyester, polypropylene fibers and nylon as well as in texturizing machines. Oerlikon Barmag also manufactures associated components such as gear metering pumps. Yarn produced on Oerlikon Barmag machines is used in the production of automobiles, home textiles, sports equipment, artificial turf, roads and, of course, clothing.
Oerlikon Neumag delivers comprehensive solutions for key processes in the production of bulked continuous filament (BCF) carpet yarns, synthetic staple fibers and nonwoven fabrics. The nonwoven portfolio includes turnkey solutions for the production of spunlaid and airlaid webs.
Filament spinning / texturizing 80 %
Plastic processing / carpet yarn 13 %
Staple fiber / nonwoven 7 %
Market segments Textile

20
Drive Systems SegmentThe Drive Systems Segment is a leading provider of drive and transmission systems focused on the agricultural, construction and on / offhighway vehicular markets. The Segment develops innovative solutions to demanding technical challenges of highend customers such as Aston Martin, Audi, Caterpillar, CNH, Lamborghini or McLaren. Marketed under the Oerlikon Grazi ano and Oerlikon Fairfield brands, the portfolio includes applications for agricultural vehicles, highperformance sports cars and solutions for the construction, energy and mining industries.
The Drive Systems Segment is a truly global manufacturer with 5 200 employees at nine sites across the world which deliver products including cuttingedge dual clutch and continuously variable transmissions, synchronizers, powershift units, axles, TorqueHub® planetary transmissions and other precision transmissions, components and systems to a variety of markets.
The Drive Systems Segment stands out as a provider with a global production network, broad geographical coverage and a hightech and comprehensive product range for various markets and applications:
� Solutions for tractors, combine harvesters, harvesting equipment and feed mixers for the agricultural sector.
� Solutions for work platforms and cranes, wheel loaders, road pavers and compaction technology, trench diggers, graders, compact chain loaders and other trackdriven auxiliaries for the construction sector.
� Solutions for highperformance sports cars, electric hybrid vehicles, commercial vehicles, urban buses and ground support equipment in the on/offhighway sector as well as heavy haul trucks, locomotives and railcar maintenance vehicles.
� Solutions for mining machinery, transport vehicles and cranes, borehole services and production plants for the energy market.
Vacuum SegmentThe Vacuum Segment offers a broad spectrum of innovative fore and highvacuum pumps, components, vacuum solutions and services under the brand of Oerlikon Leybold Vacuum. The Segment’s products are used in analysis, manufacturing and research by more than 18 000 customers primarily involved in the process industry, the solar and coating sectors and in research and development. The Segment delivers both standard products and individual customer solutions characterized by a high level of efficiency, quality and flexibility. A global sales and service network complements the Segment’s engineering and consulting competence.
This expertise, for example, enabled the delivery of vacuum technology for the world’s largest vacuum chamber at the Karls ruhe Research Center in Germany. The biggest particle accelerator in the world – CERN, in Geneva, Switzerland – is also equipped with vacuum pumps from Oerlikon. As an enabling technology, our vacuum solutions are used to produce cell phones, displays, TV sets, semiconductors, coated glass, solar cells and panels, steel and many more applications.
The Segment differentiates itself by offering a comprehensive product portfolio; from forevacuum pumps and standardized vacuum systems to consulting services and customized vacuum solutions. Vacuum gauges, leakdetection instruments, flanges, valves and fittings round off the product range, enabling the Segment, as a solutions provider, to cover the entire value chain in the vacuum business.
Letter Information for investors Oerlikon Group Operational review Sustainability
On/offhighway / Transportation 17 %
Construction 22 %
Agriculture 39 %
Highend automotive 8 %
Energy / mining / speciality industrial 14 %
Market segments Drive Systems
Process industry 47 %
R&D / analytics 20 %
Solar / coating 18 %
Other 15 %
Market segments Vacuum

21
Coating Segment The Coating Segment, known on the market as Oerlikon Balzers, is the leading global provider of thinfilm coatings, which significantly improve the performance and longevity of precision components and tools. Oerlikon coatings are used in a broad range of applications in the automotive and machine industry, in food and packaging, medical technology and increasingly in aerospace. For example, modern diesel fuel injection pumps could not withstand the operating parameters without coatings from Oerlikon Balzers. Wellknown companies such as Audi, Bosch, Continental, Delfi, Kennametal, Sandvik, Siemens, VW and ZF count among Oerlikon’s customers.
The Segment develops the coatings and the coating systems themselves and is a pioneer in the associated coating procedures. More than 90 % of the Segment’s sales come from the coating service within the company’s centers; less than 10 % is generated by the sale of systems and related process technologies to major customers, such as precision tool manufacturers, who integrate these directly into their production processes. The Segment currently has a network of 90 coating centers spread over 33 countries and over 20 000 customers around the world. The Segment processes more than 200 million precision tools and components every year, ranging from items as small as watch pins up to dies for entire car bodies.
The largest area of application for physical vapor deposition (PVD) hard material coatings is precision tools for metal cutting (drills and cutters), forming tools, followed by plastics processing and metal die casting. A relatively new but rapidly growing area of focus is the coating of precision components in order to reduce friction and improve durability. Other industries in which PVD hard material coatings are used include general machinery industries, the aircraft industry, motor racing and the medical and hygiene technology industry. PVD coatings are also being increasingly used in the luxury goods industry (watches, cell phones) – for aesthetics and practicality.
Advanced Technologies Segment The Advanced Technologies Segment focuses on production systems for advanced nanotechnology and semiconductor applications. The Segment’s core expertise in thinfilm coating technology allows it to provide nanotechnology solutions for touch panels, photovoltaics, thermoelectric generators as well as for energy storage, saving, conversion and transmission. Applications in the semiconductor market include advanced packaging, power devices, read/write heads for hard disks, LEDs and MicroElectroMechanical Systems (MEMS). These solutions facilitate the production of chips, devices and components used in consumer electronics and various industrial sectors, including the IT, telecommunications and automotive industries. As one example, around 30 % of the cell phones produced worldwide use chips processed on Oerlikon machines. Customers include ABB, Bosch, Infineon, Osram and Seagate.
New innovative production solutions in plant engineering are developed at the technology center in Balzers, Liechtenstein. Thanks to its close relationship with leading chip manufacturers, the Advanced Technologies Segment is ideally prepared to develop manufacturing processes that will streamline the production of future generations of highperformance chips. The customer base is primarily concentrated in Asia. The Advanced Techno logies Segment also has a global infrastructure. From its 18 sales, service and spare parts centers, it provides customer support and conducts training courses.
Future growth markets for the Segment include: �Mobile communication: special equipment to produce ultracompact semiconductors (advanced packaging) for applications such as smartphones or tablet computers.
�MEMS and nanotechnology: various sensors, actuators, micro fluid and thinfilm read heads.
�Cleantech: solidstate lighting (LEDs), applications to increase energy efficiency (power semiconductors, thermoelectric con verters).
Compliance Corporate Governance Remuneration report Risk management Financial report
Cutting tools 51 %
Forming tools 21 %
Precision components 9 %
Automotive components 11 %
Coating equipment 8 %
Market segments Coating
Semiconductors 80 %
Photovoltaics 3 %
Others 17 %
Market segments Advanced Technologies

22 Letter Information for investors Oerlikon Group Operational review Sustainability
Markets
End markets and value chainAs a hightech engineering Group providing machinery and services, Oerlikon is at the beginning of the value chain in the six end markets shown below – but when developing new solutions and products, Oerlikon analyzes the entire value chain. Topdown analysis of market trends guides our R&D teams to develop solutions in anticipation of customer needs rather than as a reaction to them. Bottomup analysis guides the design of plant and machinery such that the direct or indirect impact on further processing are factored in, right up to and including the functionality of end products.
2.1Positioned in global growth markets
Electronicsusers
Raw material producers (silicon, rare earth, etc.)
Production equipment /machinery suppliers
Endproduct producers
Distributors and retailers
Component and subsystem producers
Energyconsumers
Fossil fuel and other minerals producers
Energy conversion equipment producers
Net / gridoperators
Distributors and retailers
Energy generation and storage
Infrastructureusers
Raw material producers
Infrastructure builders
Infrastructure operators and brokers
Equipment / machinery suppliers
Transportationusers
Material producers (steel, resins, etc.)
Production equipment / machinery suppliers
Equipment manufacturers
Distributors and retailers
Component and sub-system producers
Clothesconsumers
Raw material producers (cotton, polymers, etc.)
Production equipment / machinery suppliers
Designers,fashion houses
Distributors and retailers
Yarn and fabric producers
Foodconsumers
Input material (seeds, fertilizers, etc.)
Agricultural equipment / machinery
Processors and packers
Distributors and retailers Food producers
Oerlikon products

23Compliance Corporate Governance Remuneration report Risk management Financial report
Food – better supply with highquality food
The demand for food in a world of 7 billion people and a growing population means that producers must increase efficiency in an environmentally friendly manner to further increase quality and shelf life and ensure stable prices. Oerlikon is present during harvest via transmissions fitted in agricultural machinery (Drive Systems), in packaging through coatings applied to forming tools to produce plastic containers of all kinds (Coating) and in preservation through vacuum systems which make freezedrying and/or sealing packages possible (Vacuum). The Drive Systems Segment, for example, provides solutions offering 20–30 % fuel savings to the agricultural market.
Clothing – more ecological, less expensive and better functionality
The market for manmade fibers is forecast to grow disproportionately at a rate of up to 5 % over the coming years, as new features – dirt repellence, UV protection, enhanced durability, etc. – are embedded into clothing fibers. Customers of the Textile Segment machinery will have to produce more yarn with better features more efficiently to stay competitive. Oerlikon is successfully tackling this challenge with the “esave” line of faster, more compact machines which consume less energy and fewer raw materials and produce less waste. “esave” equipment delivers energy savings of up to 30 % compared to standard products.

24
Transportation – greater mobility with lower fuel consumption
A growing population as well as globalization and urbanization are driving demand for mobility and transportation capacity. The transport and automotive industry is served by practically all Oerlikon Segments at different points along the value chain. Drive Systems markets components, transmissions and complete drive systems to automotive, city bus and rail manufacturers. These products help reduce consumption of fossil fuel vehicles and increase the efficiency of new alternative drives. The Coating Segment provides special solutions for coating of precision components in car engines such as diesel injection systems or piston pins, which significantly improves the lifespan of components.
The Textile Segment satisfies growing demand in the automobile industry for textile products such as upholstery, tire cord, seat belts and airbags. The Textile Segment also provides solutions for manufacturing lightweight carbonfiber components.
Modern vehicles are becoming increasingly intelligent, with features such as sensorcontrolled assistants and navigation systems. The Advanced Technologies Segment solutions for highperformance vehicle electronic chips, touch screens and LEDs support this trend.
Infrastructure – more efficient and energyconscious construction
Urbanization is accelerating, particularly in emerging markets. This demographic change is leading to increased demand for housing and infrastructure. Current estimates suggest that some 1 billion people will live in China’s cities by midcentury.
The Drive Systems, Textile and Vacuum Segments are active in the field of large infrastructure. Drive Systems offers solutions for construction machinery and commercial vehicles such as excavators, wheel loaders, trucks and road graders. The Textile Segment provides machinery to manufacture geotextiles which are fabrics, nonwoven materials and composites increasingly used in road construction and erosion protection. The Vacuum Segment supplies glass manufacturers and operators of largescale coating systems with robust and highperformance vacuum systems for coated architectural glass, which is used to protect building interiors from UV rays and minimize heat and cooling loss.
Letter Information for investors Oerlikon Group Operational review Sustainability
Markets
25
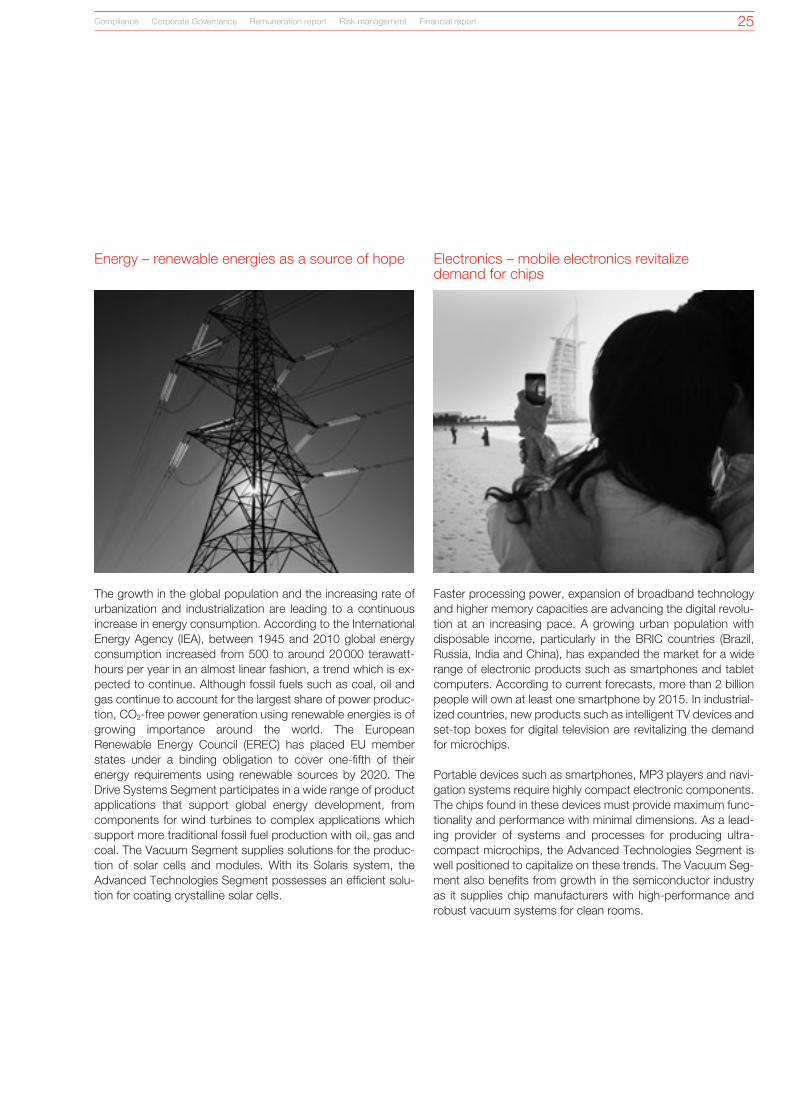
Energy – renewable energies as a source of hope
The growth in the global population and the increasing rate of urbanization and industrialization are leading to a continuous increase in energy consumption. According to the International Energy Agency (IEA), between 1945 and 2010 global energy consumption increased from 500 to around 20 000 terawatthours per year in an almost linear fashion, a trend which is expected to continue. Although fossil fuels such as coal, oil and gas continue to account for the largest share of power production, CO2free power generation using renewable energies is of growing importance around the world. The European Renewable Energy Council (EREC) has placed EU member states under a binding obligation to cover onefifth of their energy requirements using renewable sources by 2020. The Drive Systems Segment participates in a wide range of product applications that support global energy development, from components for wind turbines to complex applications which support more traditional fossil fuel production with oil, gas and coal. The Vacuum Segment supplies solutions for the production of solar cells and modules. With its Solaris system, the Advanced Technologies Segment possesses an efficient solution for coating crystalline solar cells.
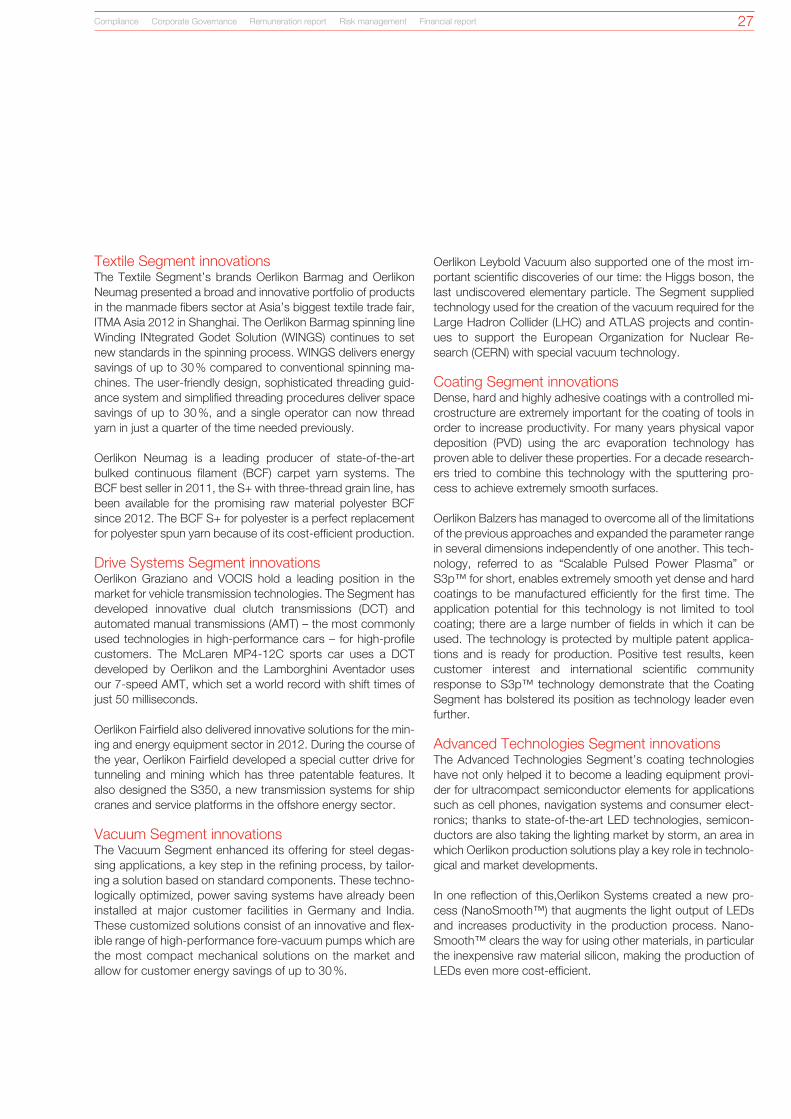
Electronics – mobile electronics revitalize demand for chips
Faster processing power, expansion of broadband technology and higher memory capacities are advancing the digital revolution at an increasing pace. A growing urban population with disposable income, particularly in the BRIC countries (Brazil, Russia, India and China), has expanded the market for a wide range of electronic products such as smartphones and tablet computers. According to current forecasts, more than 2 billion people will own at least one smartphone by 2015. In industrialized countries, new products such as intelligent TV devices and settop boxes for digital television are revitalizing the demand for microchips.
Portable devices such as smartphones, MP3 players and navigation systems require highly compact electronic components. The chips found in these devices must provide maximum functionality and performance with minimal dimensions. As a leading provider of systems and processes for producing ultracompact microchips, the Advanced Technologies Segment is well positioned to capitalize on these trends. The Vacuum Segment also benefits from growth in the semiconductor industry as it supplies chip manufacturers with highperformance and robust vacuum systems for clean rooms.
Compliance Corporate Governance Remuneration report Risk management Financial report

26
900
800
700
600
500
400
300
200
100
0Textile Drive
SystemsVacuum Coating Adv. Tech.
802
87160162
358
35
91
92212
41
7
R&D as a driver of future growth
Focus on added value for customersMarkets are constantly changing, posing ever new challenges for Oerlikon and its customers. Oerlikon meets these challenges by focusing on the customer. More efficient production of manmade fibers, improved engine and transmission components that reduce fuel consumption, and more advanced tools that extend durability and reduce wear and tear on materials – these are just a few examples of how Oerlikon is adding value to a global and diverse set of customers through continuous development of higherquality, higherperformance solutions.
Innovation is the key to success here. Oerlikon leverages more than 160 years of technology leadership to deliver the following core benefits:
�Reduced cost of ownership: optimizing customers’ operating costs through more efficient products and solutions.
�Higher quality: innovative gearboxes allow for faster gear times, while new production technologies for manmade fibers increase yarn quality.
� Increased clean technology: delivering measurable improvements in the environmental performance of production processes by lowering energy consumption, reducing use of material, emissions and waste.
�New markets and applications: many Oerlikon technologies allow our customers to enter new markets, e.g. with manmade fibers such as geotextiles, artificial turf or composite materials.
Strategic importance of R&D at OerlikonResearch and development (R&D) is fundamental to Oerlikon’s continued success. Expenditures on R&D totaled CHF 106 million in 2012, about 4 % of sales, and has remained at a high level for many years. More than 1 000 engineers and scientists were employed by the Group worldwide.
In 2012 R&D efforts by Oerlikon led to substantial renewal of the Group’s intellectual property (IP). More than 10 % of its patents were newly registered last year, laying ground for future growth with new products and applications. The main patents belong to the WINGS FDY or BCF machines of the Textile Segment, S3p™ or ePD™ technology of Oerlikon Balzers or patents for the Dryvac®, Sogevac® and Turbovac® vacuum pumps.
2.2Innovation
Letter Information for investors Oerlikon Group Operational review Sustainability
Innovation
Patents 2012
New registrations in 2012 Total patent families
Group
27
Textile Segment innovationsThe Textile Segment’s brands Oerlikon Barmag and Oerlikon Neumag presented a broad and innovative portfolio of products in the manmade fibers sector at Asia’s biggest textile trade fair, ITMA Asia 2012 in Shanghai. The Oerlikon Barmag spinning line Winding INtegrated Godet Solution (WINGS) continues to set new standards in the spinning process. WINGS delivers energy savings of up to 30 % compared to conventional spinning machines. The userfriendly design, sophisticated threading guidance system and simplified threading procedures deliver space savings of up to 30 %, and a single operator can now thread yarn in just a quarter of the time needed previously.
Oerlikon Neumag is a leading producer of stateoftheart bulked continuous filament (BCF) carpet yarn systems. The BCF best seller in 2011, the S+ with threethread grain line, has been available for the promising raw material polyester BCF since 2012. The BCF S+ for polyester is a perfect replacement for polyester spun yarn because of its costefficient production.
Drive Systems Segment innovationsOerlikon Graziano and VOCIS hold a leading position in the market for vehicle transmission technologies. The Segment has developed innovative dual clutch transmissions (DCT) and automated manual transmissions (AMT) – the most commonly used technologies in highperformance cars – for highprofile customers. The McLaren MP412C sports car uses a DCT developed by Oerlikon and the Lamborghini Aventador uses our 7speed AMT, which set a world record with shift times of just 50 milliseconds.
Oerlikon Fairfield also delivered innovative solutions for the mining and energy equipment sector in 2012. During the course of the year, Oerlikon Fairfield developed a special cutter drive for tunneling and mining which has three patentable features. It also designed the S350, a new transmission systems for ship cranes and service platforms in the offshore energy sector.
Vacuum Segment innovationsThe Vacuum Segment enhanced its offering for steel degassing applications, a key step in the refining process, by tailoring a solution based on standard components. These technologically optimized, power saving systems have already been installed at major customer facilities in Germany and India. These customized solutions consist of an innovative and flexible range of highperformance forevacuum pumps which are the most compact mechanical solutions on the market and allow for customer energy savings of up to 30 %.
Oerlikon Leybold Vacuum also supported one of the most important scientific discoveries of our time: the Higgs boson, the last undiscovered elementary particle. The Segment supplied technology used for the creation of the vacuum required for the Large Hadron Collider (LHC) and ATLAS projects and continues to support the European Organization for Nuclear Research (CERN) with special vacuum technology.
Coating Segment innovationsDense, hard and highly adhesive coatings with a controlled microstructure are extremely important for the coating of tools in order to increase productivity. For many years physical vapor deposition (PVD) using the arc evaporation technology has proven able to deliver these properties. For a decade researchers tried to combine this technology with the sputtering process to achieve extremely smooth surfaces.
Oerlikon Balzers has managed to overcome all of the limitations of the previous approaches and expanded the parameter range in several dimensions independently of one another. This technology, referred to as “Scalable Pulsed Power Plasma” or S3p™ for short, enables extremely smooth yet dense and hard coatings to be manufactured efficiently for the first time. The application potential for this technology is not limited to tool coating; there are a large number of fields in which it can be used. The technology is protected by multiple patent applications and is ready for production. Positive test results, keen customer interest and international scientific community response to S3p™ technology demonstrate that the Coating Segment has bolstered its position as technology leader even further.
Advanced Technologies Segment innovationsThe Advanced Technologies Segment’s coating technologies have not only helped it to become a leading equipment provider for ultracompact semiconductor elements for applications such as cell phones, navigation systems and consumer electronics; thanks to stateoftheart LED technologies, semiconductors are also taking the lighting market by storm, an area in which Oerlikon production solutions play a key role in technological and market developments.
In one reflection of this,Oerlikon Systems created a new process (NanoSmooth™) that augments the light output of LEDs and increases productivity in the production process. NanoSmooth™ clears the way for using other materials, in particular the inexpensive raw material silicon, making the production of LEDs even more costefficient.
Compliance Corporate Governance Remuneration report Risk management Financial report

28
2.3 Strengthening global presence
Letter Information for investors Oerlikon Group Operational review Sustainability
Regions

29
Global player
Oerlikon fosters intensive and longterm partnerships with its customers. The cooperation goes beyond the actual development and manufacture of products and extends to support during plant commissioning and service, support and training onsite. To this end, Oerlikon has built a global infrastructure with a network of about 160 locations in 34 countries. Oerlikon uses its regional capabilities in a targeted manner to benefit the entire Group. This means that along the entire value chain of a product – from research and development to sales and customer support – the capabilities required are available and nearby.
Expansion in the growth markets of China and IndiaChina: The company employs around 2 600 employees at 17 sites in China. The fact that Oerlikon already generates 25 % of its total sales in China is the result of developments over decades. The Textile Segment has been represented in China for around 50 years. Oerlikon’s new Chinese headquarters in Shanghai were opened in 2012, bringing the Segments together under one roof and allowing for local marketing in closer proximity to customers.
The Oerlikon China Technology Suzhou site is one of the Group’s largest facilities worldwide. In addition to the Textile Segment, the 70 000squaremeter office and production complex houses the Coating Segment and, since more recently, Drive Systems. The “shared service” concept at Suzhou is instrumental in driving growth at the campus through centralized, crossSegment provision of services of various nonoperational functions, such as IT, financing, administration and HR development.
Compliance Corporate Governance Remuneration report Risk management Financial report

30
Drive Systems completed construction work at the factory in Suzhou and started assembly in the first quarter of 2012. The new production site, the Segment’s first in China, will provide drive systems, transmission components and solutions tailored to the needs of local customers. This is of particular significance because China is now the world’s biggest on / offhighway manufacturer.
During 2011 the Vacuum Segment expanded its activities in China, increasing capacity at the factory in Tianjin. Focus here was placed on deepening solution knowhow in the area of complex vacuum systems, which are increasingly in demand from Chinese industry. The site also serves as a production hub for the manufacture of competitive and more costefficient standard systems.
In 2012 the Coating Segment continued to implement its global expansion strategy with the opening of its 10th coating center in China. While the company operated 41 centers in 17 countries back in 2000, it now has 90 centers in 33 countries. The Asian market has played a key role in this strong growth. Of the 90 centers, 31 are located in Asia.
The Chinese government’s efforts to protect intellectual property rights have allowed Oerlikon to strengthen R&D activities in the country. Oerlikon aims to expand R&D capacity and accelerate the regional adaptation of products and solutions to better meet specific customer requirements in the region. Whereas lower production costs were once the primary draw of emerging markets, local demand is now the most attractive element in the equation. The demand for highquality systems and processes is growing continuously in China, which has decisive benefits for Oerlikon as a “local” technology leader.
Oerlikon is also benefiting from growth in Chinese domestic sales. An everlarger share of textile production is used to satisfy domestic rather than export demand. As such, Oerlikon has evolved from a pure exporter to a company regionally anchored in China and operating in the local market with products and solutions tailored to the needs of domestic customers.
India: In 2012 Oerlikon expanded its already strong presence in India, southern Asia’s largest growth market. This enormous market offers the company diverse opportunities to advance and broaden business activities. Even following a downward revision of the expectations for 2012, the Indian economy continues to grow at rates far higher than global GDP. Over the long term, the Indian economy is forecast to grow at a rate six times faster than OECD countries.
This momentum is primarily due to high and rapidly growing domestic demand, which is also the investment focus of the Textile, Drive Systems and Coating Segments. During the past three years the Group has generated up to 8 % of its total sales in India and is developing a strategy to expand its domestic market share and further improve cost structures. Drive Systems is currently studying the feasibility of a shared service concept similar to the one which the Segment has already successfully implemented in China. Drive Systems has also invested substantially in expanding its capacities in India, and continued in this vein in 2012. The focus is on developing innovative bespoke products with the objective of further strengthening domestic sales and tapping into new domestic markets. The increased production volumes in India have reduced product costs, making a profitable and growing export business with other emerging markets such as Turkey and Brazil possible for the first time.
The 2012 appointment of the new Drive Systems Segment CEO based in Delhi underscores the importance of the Indian market, in which the Segment operates two major production plants and has more than 2 500 employees. The Coating Segment is also continuing its growth in India with the provision of services for the growing domestic automotive industry.
Letter Information for investors Oerlikon Group Operational review Sustainability
Regions

31
Europe: Although Oerlikon has materially expanded its business in such markets as China and India, Europe remains the solid foundation of the company’s activities. About 51 % (6 439) of all employees work there, and the majority of Oerlikon’s production sites are located on the Continent. Because most products are made in Europe at the moment, the region generates the highest share of sales by location: around 60 %.
Europe is also the home of Oerlikon’s primary research and development capability. For example, the new generation of PPD™ (pulsed plasma diffusion) coating technology introduced in 2012 was jointly developed by Oerlikon Balzers in Schopfheim, Germany and Liechtenstein. This technology is a replacement of the hardchrome plating process for coating forming and punching tools. In Remscheid, Germany, Oerlikon Barmag operates the world’s most advanced technical center for the development of manmade fibers. More than 100 engineers and technicians create a wide range of applications that ensure the Textile Segment’s technology leadership in production and finishing.
Through systematic investments, the company is working to ensure that its European locations remain competitive over the long term in a changing global marketplace. The Vacuum Segment in Cologne, for example, is currently building a new logistics center that will materially improve production processes and make products even more cost effective. Also in Germany, Oerlikon Barmag has prepared itself for the future through implementation of an array of operational excellence programs. In 2012, the Drive Systems Segment realigned its European manufacturing footprint to further improve operational performance.
Europe will likely also generate growth. There is untapped potential for all Oerlikon Segments in Russia, for example, where the company’s sales have remained immaterial in recent years. To capitalize on Russia’s continuing transformation into an increasingly innovationfocused economy, Oerlikon coordinated a comprehensive crosssegment Russia strategy in 2012.
The Americas: Oerlikon is well represented in the Americas, particularly in the United States. Oerlikon Fairfield’s headquarters are located in Indiana, which deliver solutions to the North American domestic market for offhighway vehicles, agricultural equipment and construction machinery. Oerlikon Fairfield’s customers include Caterpillar and John Deere. Oerlikon Balzers has nine strategically located coating centers in the United States and is a key service provider for the US automotive industry. Oerlikon Barmag and Oerlikon Neumag have operations in the United States to serve the major producers of manmade fibers and carpeting. Vacuum Segment customers in the US include a number of research institutions including the National Ignition Facility (NIF) located at the Lawrence Livermore National Laboratory in California, where the very highest level of nuclear research is conducted.
Oerlikon has yet to realize its potential in South America, particularly Brazil. Market research suggests Brazil will enjoy annual GDP growth rates of up to 5 % for some years to come. Economic momentum is being produced by the expansion of the energy, infrastructure and transport sectors and major upcoming events such as the World Cup soccer tournament in 2014 and the Olympic Games in 2016. The expansion of Brazil’s middle class has fueled domestic demand. Today, Oerlikon only generates slightly above 1 % of Group sales in Brazil, South America’s largest economy, primarily in the Coating, Textile and Drive Systems Segments.
Compliance Corporate Governance Remuneration report Risk management Financial report

32
2011 20122010 2011 2012
100
90
80
70
60
50
40
30
20
10
0
The product development process at Oerlikon follows a similar pattern in all five Segments. To improve operational efficiency on an ongoing basis, Oerlikon measures the results of the individual process steps and feeds them back to the previous level in the chain. By conducting a balanced evaluation based on the criteria quality, response time, cost and consumption of materials, Oerlikon is able to achieve a sustainable improvements to all process steps.
35 % shorter production timeDuring 2012 Oerlikon once again made significant improvements in production processes. For example, the production time of a product line in the Vacuum Segment was reduced by some 35 %. This was made possible by comprehensive review and adjustment of the manufacturing process by the employees themselves, who identified unnecessary or inefficient work steps which in some cases were a function of workstation design. Following a complete layout redesign, processes were shortened, work and material flow improved, and space requirements were cut in half.
This increased operational performance is based on valuestream mapping, a process in which members of a team rigorously assess existing work steps of the entire production chain before optimizing them independently with a subsequent synchronization. This process, which has been rolled out at various sites in Europe and Asia, has led to significant improvements across the portfolio.
Continuous improvement for sustained operational performance
Optimization potential along the entire value chainFirstclass operational performance is critical for Oerlikon to meet financial targets. In an environment characterized by accelerating change, Oerlikon continuously evaluates individual process steps in its search for ways to improve reliability, efficiency and effectiveness – from product development to delivery to customer service. Oerlikon uses Business Performance Management as an instrument for measuring time, quality, cost and other factors. Oerlikon actively promotes networking and the sharing of information and ideas across divisions and Segments. By systematically adopting best practices, the Group is continuously improving operational performance.
Oerlikon’s operational efficiency agenda has three core areas of focus, in which substantial room for improvement in existing capabilities and capacities exists:
� Production: improvements in economic and environmental effectiveness and capacity utilization.
� Procurement: consolidation of suppliers including improvements in quality and ordering processes and efficiency improvements in supply chain management.
� IT: global standardization and utilization of infrastructure and processes as a basis for the aforementioned improvements.
2.4Operational excellence
Letter Information for investors Oerlikon Group Operational review Sustainability
Operational excellence
Supplier On Time Delivery (at year end) in %
Lost time accidents rate (per 200 000 working hours)
Best-in-Class: 0.4 Best-in-Class: 99.0 %
4.0
3.5
3.0
2.5
2.0
1.5
1.0
0.5
0
79.2
99.296.5
3.22
1.76

33
60 % shorter lead timesAt one site in the Vacuum Segment, the individuals responsible for a given process step in supply chain management now actively request the components necessary for assembly from the team entrusted with the previous step (pull instead of push). In 2012 this reduced lead times by 60 % in this area, reduced inventories by 75 % and cut the lot size by 50 %. At the same time actual material consumption was also reduced. The success achieved in these process optimizations will be rolled out to other product lines and manufacturing sites.
99 % supplier On Time Delivery The significant effort in 2011 to improve supplier On Time Delivery carried over into 2012, and schedules have been successfully maintained. The Advanced Technologies Segment was the first in the Group to increase this figure to 99 % using networked planning and precise checks.
Reduction in procurement costsOerlikon launched the worldclass procurement (WCP) project in 2012, a process for stepchanging the Group’s procurement effectiveness. About 16 000 suppliers sell some CHF 2 billion of goods and services to Oerlikon each year. The numbers of suppliers shall be reduced and the procurement of services will be consolidated across the Group. Groupwide purchasers, called Category Managers, responsible for one product category were appointed for this purpose in 2012. Oerlikon is also shifting procurement to Asia in an effort to gain more favorable conditions and shorten supply distances by maintaining the same quality level. Oerlikon’s goal is to generate significant runrate cost savings as a result of these measures.
Unified IT infrastructure and processes In 2012 Oerlikon launched spirIT, a project to better coordinate IT at Group level. The first step was to identify the strengths and weaknesses of IT services in the Segments and deploy the strengths identified across the Group to harmonize existing instruments, processes and technologies. The project will make a contribution to achieving sustained improvements in operating efficiency across individual Business Units and Segments.
BenchmarkingOerlikon aspires to BestinClass performance and benchmarks itself against leading companies on a continuous basis. Peer groups against which underlying operational performance is measured have been defined for the Group and for each Segment. Oerlikon compares itself to these peers on a variety of key performance metrics including RONA, EBIT margin and order intake. This benchmarking process plays an important role in steering the operational management of the company and is fundamental to management incentive pay.
Compliance Corporate Governance Remuneration report Risk management Financial report
Peer Groups for benchmarking Group(Swiss Peers)
Group(International Peers)
TextileSegment
Drive SystemsSegment
VacuumSegment
CoatingSegment
Advanced TechnologiesSegment
ABB General Electric Jingwei American Axle AtlasCopco Bodycote Applied MaterialsSulzer Siemens Lakshmi Brembo Gardner Denver Kennametal Lam ResearchGeorg Fischer GEA Carraro INFICON Praxair Singulus
Sumitomo Dana IngersollRand Sandvik UlvacThyssenKrupp Bharat Gears Pfeiffer Vacuum
BorgWarner


II. Operations
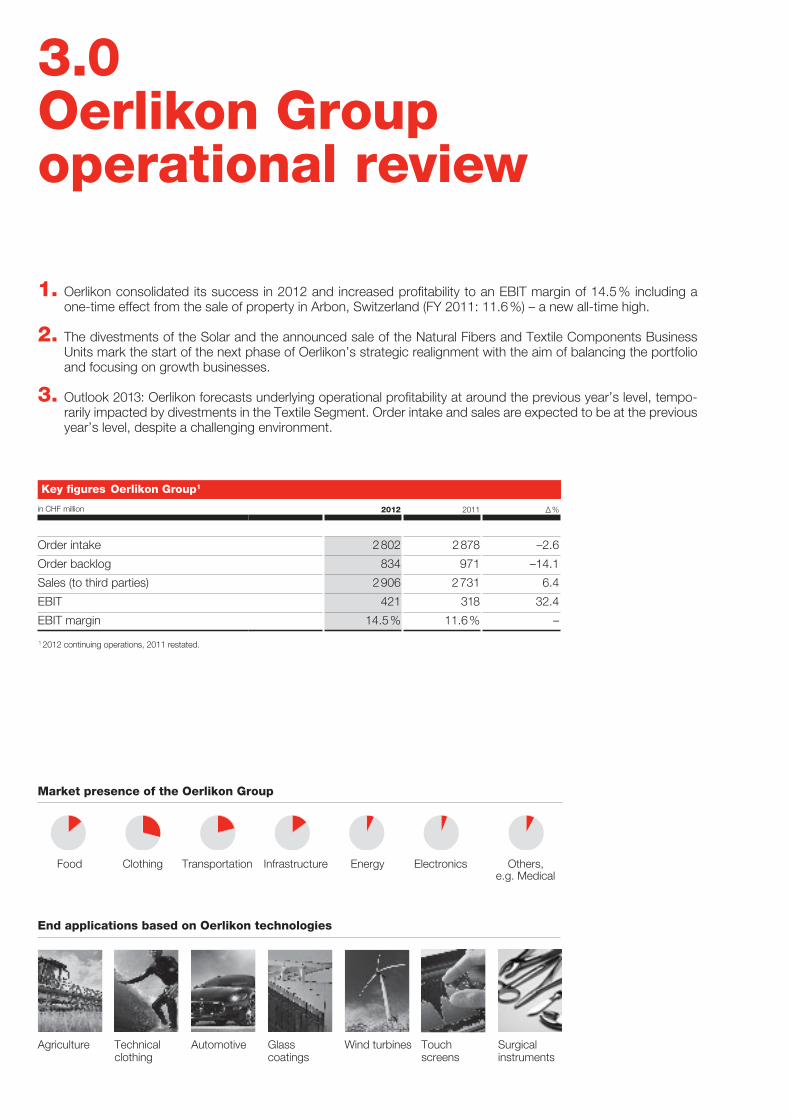
3.0Oerlikon Group operational review
1. Oerlikon consolidated its success in 2012 and increased profitability to an EBIT margin of 14.5 % including a onetime effect from the sale of property in Arbon, Switzerland (FY 2011: 11.6 %) – a new alltime high.
2. The divestments of the Solar and the announced sale of the Natural Fibers and Textile Components Business Units mark the start of the next phase of Oerlikon’s strategic realignment with the aim of balancing the portfolio and focusing on growth bu si nesses.
3. Outlook 2013: Oerlikon forecasts underlying operational profitability at around the previous year’s level, temporarily impacted by divestments in the Textile Segment. Order intake and sales are expected to be at the previous year’s level, despite a challenging environment.
Key figures Oerlikon Group1
in CHF million 2012 2011 %
Order intake 2 802 2 878 –2.6
Order backlog 834 971 –14.1
Sales (to third parties) 2 906 2 731 6.4
EBIT 421 318 32.4
EBIT margin 14.5 % 11.6 % –
Market presence of the Oerlikon Group
Food Clothing Transportation Infrastructure Energy Electronics Others, e.g. Medical
End applications based on Oerlikon technologies
Touch screens
Surgical instruments
Agriculture Glasscoatings
Technical clothing
Automotive Wind turbines
1 2012 continuing operations, 2011 restated.

37
51
318
2010 1 2011 2 2012 3
318
186
70
38
103421421 17
7
Driv
e S
yste
ms
Vacu
um Coa
ting
Adv
ance
d Te
chno
logi
es
Text
ile
EBIT 2011 1 EBIT 2012 2
Oerlikon made further operational improvements and started a process of strategic transformation in 2012. In operational terms, the Group continued the positive business development achieved over the past two years and increased the EBIT margin to 14.5 % including a onetime effect by the sale of property in Arbon, Switzerland (FY 2011: 11.6 %) – a new record in the company’s recent history. This meant that Oerlikon reached another important milestone on the road to carving out its targeted BestinClass positions in all areas.
The record operating result was bolstered by the ongoing implementation of the Group’s strategy based on the following core elements – innovation, regional expansion, operational excellence and portfolio shaping. The Textile, Drive Systems and Coating Segments were the main drivers behind this continued upward trend; Asia and, once again, China, in particular, were among the regions posting the strongest growth. The Group’s return on capital employed (ROCE) of 19.7 % (2011 as reported: 14.9 %) indicates that Oerlikon has created substantial added value. The share price more than doubled, making it the bestperforming industrial equity in 2012 – globally. A dividend of CHF 0.20 per share was paid out to shareholders in 2012 for the first time in nearly 10 years, a signal of the business model’s sustainability. For this reporting year, the Board of Directors is proposing to the Annual General Meeting of Shareholders a 25 % increase in the dividend payout of CHF 0.25 per share. The successful refinancing and diversification of sources of financing, through which the loan from the 2010 recapitalization was repaid two years ahead of maturity, are also testament to the company’s improved operational strength and the financial markets’ restored trust in Oerlikon.
2012 was the year in which Oerlikon took a number of strategic steps to balance and optimize the portfolio. The completed divestment of the Solar Segment and targeted sale of the Natural Fibers and Textile Components Business Units, which are reported as “discontinued operations”, are key milestones in the process of strategic realignment. These transactions and the successful refinancing of the company have established a firm foundation that will allow Oerlikon to better manage the portfolio and concentrate on highmargin business areas with attractive growth potential. The next phase of the Group’s strategic realignment is therefore already under way: alongside continuous operational improvements in core businesses, emphasis will be placed on developing new areas of application and new geographies, and on adding more complementary and adjacent technologies to the portfolio to generate sustainable, profitable growth, both organically and through acquisitions.
Key Group 2012 figures at a glanceData relating to the divested Solar Segment and for the Natural Fibers and Textile Components Business Units are reported separately as discontinued operations and are not included below. Certain 2011 figures are restated.
� Sales were up 6.4 % to CHF 2 906 million, compared with CHF 2 731 million in FY 2011, driven largely by Textile and Coating Segment growth.
� The EBIT margin reached an alltime high of 14.5 %: EBIT improved to CHF 421 million from CHF 318 million in FY 2011.
� EBITDA increased significantly to CHF 547 million (FY 2011: CHF 450 million), which is equivalent to an EBITDA margin of 18.8 %.
� The Group’s net income rose to CHF 385 million (FY 2011: CHF 224 million).
EBITin CHF million
EBIT by Segmentin CHF million
1 Restated. 2 Continuing operations.1 As reported. 2 Restated. 3 Continuing operations.
Cor
pora
te/E
limin
atio
ns
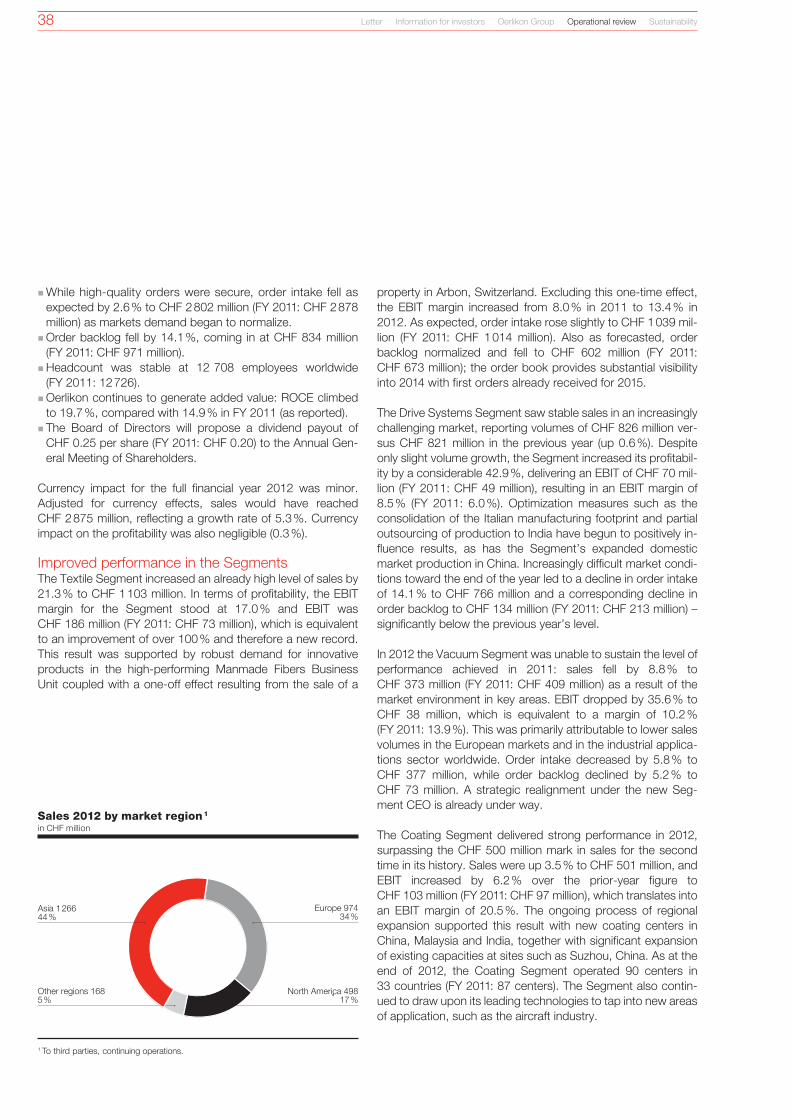
38
�While highquality orders were secure, order intake fell as expected by 2.6 % to CHF 2 802 million (FY 2011: CHF 2 878 million) as markets demand began to normalize.
�Order backlog fell by 14.1 %, coming in at CHF 834 million (FY 2011: CHF 971 million).
�Headcount was stable at 12 708 employees worldwide (FY 2011: 12 726).
�Oerlikon continues to generate added value: ROCE climbed to 19.7 %, compared with 14.9 % in FY 2011 (as reported).
� The Board of Directors will propose a dividend payout of CHF 0.25 per share (FY 2011: CHF 0.20) to the Annual General Meeting of Shareholders.
Currency impact for the full financial year 2012 was minor. Adjusted for currency effects, sales would have reached CHF 2 875 million, reflecting a growth rate of 5.3 %. Currency impact on the profitability was also negligible (0.3 %).
Improved performance in the Segments The Textile Segment increased an already high level of sales by 21.3 % to CHF 1 103 million. In terms of profitability, the EBIT margin for the Segment stood at 17.0 % and EBIT was CHF 186 million (FY 2011: CHF 73 million), which is equivalent to an improvement of over 100 % and therefore a new record. This result was supported by robust demand for innovative products in the highperforming Manmade Fibers Business Unit coupled with a oneoff effect resulting from the sale of a
property in Arbon, Switzerland. Excluding this onetime effect, the EBIT margin increased from 8.0 % in 2011 to 13.4 % in 2012. As expected, order intake rose slightly to CHF 1 039 million (FY 2011: CHF 1 014 million). Also as forecasted, order backlog normalized and fell to CHF 602 million (FY 2011: CHF 673 million); the order book provides substantial visibility into 2014 with first orders already received for 2015.
The Drive Systems Segment saw stable sales in an increasingly challenging market, reporting volumes of CHF 826 million versus CHF 821 million in the previous year (up 0.6 %). Despite only slight volume growth, the Segment increased its profitability by a considerable 42.9 %, delivering an EBIT of CHF 70 million (FY 2011: CHF 49 million), resulting in an EBIT margin of 8.5 % (FY 2011: 6.0 %). Optimization measures such as the consolidation of the Italian manufacturing footprint and partial outsourcing of production to India have begun to positively influence results, as has the Segment’s expanded domestic market production in China. Increasingly difficult market conditions toward the end of the year led to a decline in order intake of 14.1 % to CHF 766 million and a corresponding decline in order backlog to CHF 134 million (FY 2011: CHF 213 million) – significantly below the previous year’s level.
In 2012 the Vacuum Segment was unable to sustain the level of performance achieved in 2011: sales fell by 8.8 % to CHF 373 million (FY 2011: CHF 409 million) as a result of the market environment in key areas. EBIT dropped by 35.6 % to CHF 38 million, which is equivalent to a margin of 10.2 % (FY 2011: 13.9 %). This was primarily attributable to lower sales volumes in the European markets and in the industrial applications sector worldwide. Order intake decreased by 5.8 % to CHF 377 million, while order backlog declined by 5.2 % to CHF 73 million. A strategic realignment under the new Segment CEO is already under way.
The Coating Segment delivered strong performance in 2012, surpassing the CHF 500 million mark in sales for the second time in its history. Sales were up 3.5 % to CHF 501 million, and EBIT increased by 6.2 % over the prioryear figure to CHF 103 million (FY 2011: CHF 97 million), which translates into an EBIT margin of 20.5 %. The ongoing process of regional expansion supported this result with new coating centers in China, Malaysia and India, together with significant expansion of existing capacities at sites such as Suzhou, China. As at the end of 2012, the Coating Segment operated 90 centers in 33 countries (FY 2011: 87 centers). The Segment also continued to draw upon its leading technologies to tap into new areas of application, such as the aircraft industry.
Letter Information for investors Oerlikon Group Operational review Sustainability
1 To third parties, continuing operations.
North America 49817 %
Europe 97434 %
Asia 1 26644 %
Other regions 1685 %
Sales 2012 by market region 1in CHF million

39
The Advanced Technologies Segment reported a slight decrease in sales to CHF 103 million (FY 2011: CHF 108 million) and lower EBIT of CHF 7 million (FY 2011: CHF 11 million) including restructuring costs of around CHF 1 million, which is equivalent to a margin of 6.6 %. With soft demand in the semiconductor market, customers in all market segments reported lower machine capacity utilization, which resulted in postponement of projects. The Segment also withdrew from the area of optical storage media in 2012 after streamlining its product portfolio. Order intake increased, up by 35.2 % from CHF 88 million to CHF 119 million, as did order backlog, which increased more than threefold to CHF 25 million due to the low level in 2011 of CHF 8 million.
Expansion in growth marketsThe growth markets, and Asia in particular, once again made a positive contribution to Oerlikon’s business performance in 2012. However, also in terms of regional split the divestments led to a more balanced global setup. Asia grew by 14 % and recorded sales of CHF 1 266 million, accounting now for 44 % of the Group’s total sales. Sales in Europe grew by 4 % to CHF 974 million, accounting for 34 % of total Group sales, while North America recorded sales of CHF 498 million, representing a decrease of 9 % and accounting for 17 % of Group sales. The share of other regions in Group sales was 5 % (FY 2011: 5 %).
In order to meet the needs of local customers even more effectively, the Group strengthened its focus on Asia, currently the most important growth region. The new China Group Headquarters was opened in Shanghai, bringing all Segments under one roof for the first time. Drive Systems is expanding the
new factory in Suzhou, China, and has increased capacity in India at its existing sites. The new Segment CEO of Drive Systems is located in India. The Vacuum Segment moved production of more products to the site in Tianjin, China, to secure significant cost benefits. As mentioned above, Coating opened additional coating centers in China, Malaysia and India and expanded existing capacities at various sites, such as Suzhou, China.
Oerlikon has appointed Country Representatives in the emerging economies and global key markets such as the Americas, Russia, India and China in order to assess new growth opportunities. These Representatives help to evaluate and capitalize on growth opportunities in their regions and across the various Segments.
Portfolio optimizationOerlikon announced two fundamental, strategic portfolio rebalancing decisions in 2012: exit from the Solar business through the sale of the Solar Segment and exit from the natural fibers business through the announced divestment of the Natural Fibers and Textile Components Business Units.
Oerlikon announced the sale of the Solar business to Tokyo Electron Ltd. (TEL) on March 2, 2012, and completed the transaction on November 26, 2012. The transaction was structured as a cash deal, in which TEL acquired 100 % of the shares in the Solar Segment, and was concluded within the parameters of the original agreement, leading to a net inflow of CHF 231 million in cash for the Oerlikon Group. The sale substantially reduced the complexity of the Oerlikon portfolio and paved the way for an enhanced focus on core highgrowth and highmargin corporate divisions.
Compliance Corporate Governance Remuneration report Risk management Financial report
Sales 2012 by production region 1in CHF million
1 To third parties, continuing operations.
Asia 68424 %
North America 47916 %
Europe 1 70959 %
Other regions 341 %

40
150
181
167
2010 1 201020111 20112012 2 2012
511 506
438
The sale of the Natural Fibers and Textile Components Business Units to China’s Jinsheng Group for an enterprise value of around CHF 650 million was announced on December 3, 2012. The transaction, which is subject to merger control approvals, is expected to close in the second quarter of 2013. This move significantly reduces Oerlikon’s exposure to the textile business as a whole and effectively removes the company from the most cyclical part thereof, natural fibers. Focusing exclusively on the highperforming, less cyclical manmade fibers market reduces the textile share of sales from 53 % (adjusted 2011) to 38 % of Oerlikon Group sales. The manmade fiber area is the fastest growing in the textile business and Oerlikon, a market leader with cutting edge technology, is ideally positioned to benefit disproportionally from this growth.
In addition to these major transactions, Oerlikon took a number of smaller portfolio streamlining actions in 2012. In March, the company sold its property in Arbon, Switzerland, with a positive effect to the EBIT of about CHF 39 million. In April, Oerlikon announced withdrawal from the optical disc business. The Group also divested its 13.97 % minority stake in Swiss aircraft manufacturer Pilatus Flugzeugwerke AG. Oerlikon Graziano reduced the number of Italian manufacturing sites from seven to five following the sale of the Poretta and Garessio plants.
Successful refinancing Transformation in 2012 was not limited to the portfolio; the Group also comprehensively refinanced the balance sheet in the first half of the year with a new syndicated credit facility and the issue of a Swiss bond. The unsecured syndicated loan of CHF 700 million (Facility A) was agreed with an international syndicate of 13 banks. The fouryear, 4.25 % coupon Swiss bond of CHF 300 million was placed successfully in June. The new financing package reduces annual costs by a substantial CHF 40 million, provides greater scope and flexibility for financing at improved conditions, requires no collateral and diversifies the company’s sources of capital. Oerlikon successfully completed the refinancing on July 20, 2012, with repayment of the old credit facility.
Strengthened financial position Oerlikon recorded net financing costs of CHF 87 million for fullyear 2012 (FY 2011: CHF 95 million). Tax expense amounted to CHF 111 million (FY 2011: CHF 64 million) as a result of the higher pretax profit and the oneoff tax effects of the refinancing, which led to a higher tax rate of 33 %. Accordingly, the result for continuing operations stood at CHF 223 million (FY 2011: CHF 159 million). Group net income for 2012 including the result from discontinued operations amounted to CHF 385 million (FY 2011: CHF 224 million). The Group’s performance led to a return on capital employed (ROCE) of 19.7 % as of yearend 2012, versus a ROCE of 14.9 % at yearend 2011 (as reported).
Letter Information for investors Oerlikon Group Operational review Sustainability
Operating cash flow in CHF million
Capital expenditurein CHF million
1 As reported. 2 Continuing operations. In % of sales.
4.2 4.0
6.2

41
2010 2010 12011 2011 22012 2012 2
1 430 (32 %)
1 858 (45 %)
1 586 (35 %)
–274
–86
339
Strong equity ratio of 45 %, strong cash flowStrong operating performance in 2012 and the various portfolio adjustments further strengthened Oerlikon’s balance sheet. As at the reporting date, the Group had equity capital attributable to shareholders of CHF 1 858 million, putting the equity ratio at 45 % compared with 35 % at yearend 2011.
Disciplined investment and use of cash continues to top Oerlikon’s agenda. Capital expenditure (Capex) amounted to CHF 181 million, an increase of 20 % to the prioryear level (continuing operations). The Capex to depreciation ratio was again above 1 indicating return to growth over medium to long term. Focus areas were the Asian growth markets China and India, followed by North America, notably in the Drive Systems and Coating businesses.
The main investment activities were: � Textile: production capacity expansion in Germany due to high customer demand for manmade fiber out of Asia.
�Drive Systems: expansion of manufacturing footprint and production capacity in China and India to meet local demand and shift to lower cost region.
� Vacuum: new logistics center in Cologne and further expansion of Tianjin plant (China).
�Coating: continuous expansion of the worldwide footprint by adding new coating centers, expanding capacity of existing ones and rollout of new technologies.
Cash flow from operating activities grew by 15.5 % to CHF 506 million (FY 2011: CHF 438 million). Net working capital (defined as trade receivables + inventories – trade payables – current customer advances) amounted to CHF 125 million, which corresponds to 4.3 % of sales. The inflow of funds from divestment of nonoperating assets and of the Solar business resulted in a cash flow from investing activities in the amount of CHF 136 million. The dividend payment for 2011 and the refinancing of the Group resulted in a cash flow from financing activities of CHF –718 million. As a consequence, Oerlikon recorded net liquidity of CHF 339 million for the first time in six years. Innovation Oerlikon continued to strengthen prospects for the future through extensive investment in research and development (R&D). R&D expenditures in 2012 remained unchanged at around 4 % of total sales or a total of CHF 106 million (FY 2011: CHF 102 million).
Successful R&D efforts across the Group resulted in new products and/or solutions in 2012:
The market launch of the WINGS technology for fully drawn yarn (FDY) was a tremendous success for the Textile Segment. By yearend, Oerlikon had sold more than 10 000 examples of this revolutionary spinning technology and upped its market share in the chemical fibers industry to over 45 %. The WINGS product line stands out from the competition by providing customers energy savings of up to 30 % and footprint reductions of 30 %.
Compliance Corporate Governance Remuneration report Risk management Financial report
Net debt/ -liquidity in CHF million
Equity 1in CHF million (% of assets)
1 As reported. 2 Continuing operations.1 Attributable to shareholders of the parent.

42
12 726
2011 1
12 708
2012 2
The Drive Systems Segment presented a new generation of gear synchronizers for the latest 9 and 14speed premium heavy goods vehicle gearboxes; these herald a new standard in terms of fuel savings and ease of shifting. The increased manual gear shifting speed and the shorter torque interruptions delivered by these synchronizers improve engine performance by 10 % and reduce fuel consumption by up to 5 %.
The Vacuum Segment successfully entered the application market for steel degassing through development of a bespoke solution based on standard components. This solution is already being used by major customers in Germany and India. The customerspecific systems consist of an innovative and very flexible selection of highperformance forevacuum pumps and represent the most compact mechanical solution on the market today, with energy savings of up to 30 %.
The Coating Segment launched the second generation of its PPD™ (pulsed plasma diffusion) equipment for hardening the surface of large tools such as bodywork molds for the automotive industry. This new PPD™ generation is up to 40 % more efficient, and unlike industrystandard hard chrome plating, uses no toxic materials. Oerlikon’s PPD™ procedure offers customers a decisive advantage in terms of quality, costeffectiveness and environmental friendliness.
In the Advanced Technologies Segment, the first Solaris nanotechnology solution system was sold to Asia for the development of electronic paper. The first Hexagon facility, a solution designed for the mass production of ultracompact semiconductors (advanced packaging), is now in full production mode at a large customer for manufacturing smartphones, tablets and wireless applications in general.
Operational excellenceFundamental to sustainable growth of Group profitability is underlying operational performance, which has been improved by major enhancements to processes through ongoing operational excellence programs. The consistent implementation of these initiatives has enhanced process efficiency and stability to a marked degree; supplier On Time Delivery (OTD), for example, has increased to over 99 % Groupwide for the first time since recording began in 2010. In 2012 Oerlikon launched worldclassprocurement (WCP), a process to improve global procurement, and spirIT, a global IT rationalization and modernization initiative. The company has made substantial improvements to operating processes in all Segments:
� In the Textile Segment, production of winders was increased from 250 to 600 units a month thanks to a revised manufacturing process.
� The Drive Systems Segment introduced various improvements such as an optimized product mix, relocation of production to more costeffective regions, and productivityenhancing measures along the entire value chain, which contributed significantly to the Segment’s 43 % profitability increase.
Letter Information for investors Oerlikon Group Operational review Sustainability
Asia/Pacific 4 33434 %
North America 1 702 13 %
Europe 6 43951 %
Other regions 2332 %
Employees Employees 2012 by region 1
1 Adjusted. 2 Continuing operations. 1 Continuing operations.

43
0.40
0.35
0.30
0.25
0.20
0.15
0.10
0.05
0.002010 2011 2012
0
0.20
0.25
� The Vacuum Segment focused on improving logistics in 2012 and took a major step toward making operating processes more efficient by starting the construction of a new logistics center in Cologne, Germany. In addition to optimizing site logistics, the design allows for significant capacity for future growth.
� The Advanced Technologies Segment was the first Group Segment to achieve 99 % On Time Delivery (OTD) from its over 400 suppliers. The Segment’s own OTD performance for customer deliveries increased to 100 % as a result of the newly introduced processes.
Increased dividendIn 2012, Oerlikon paid a dividend to its shareholders for the first time since 2004 (paid for fiscal year 2003), in the amount of CHF 0.20 per share. Because of the increased Group net income, which was significantly improved by nonrecurring items, the Board of Directors of Oerlikon will propose an increased dividend of CHF 0.25 per share to the Annual General Meeting of Shareholders following a stable and progressive payout approach.
Outlook for 2013 The global economic environment remains uncertain and challenging, which will also continue to affect Oerlikon’s markets. Growth is likely to be weak in the first half of 2013 with upside potential going forward. For continuing operations, the Oerlikon Group forecasts the following for 2013:
�Order intake at around the previous year’s level with performance in the first half offset at least by better performance in the second half of the year.
� Sales at around the previous year’s level. �Underlying operational profitability to be around the previous year’s level, temporarily impacted by the divestments in the Textile Segment.
2012 saw the establishment of an excellent foundation for further developing the Group in operational and strategic terms. The Group will continue to focus on innovation, regional expansion, operational excellence and portfolio shaping to strengthen and expand the basis for sustainable increases in profitability.
Compliance Corporate Governance Remuneration report Risk management Financial report
Dividend per share in CHFEmployees 2012 by Segment 1
1 Continuing operations.
Others 215
2 %
Advanced Technologies 1881 %
Vacuum 1 49112 %
Coating 3 12624 %
Drive Systems 5 17741 %
Textile 2 511 20 %

44
1. Strategic refocus on growth in the highperforming manmade fiber business; sale of the Natural Fibers and Textile Components Business Units announced.
2. Segment profitability at record levels; EBIT margin (including onetime effects) of 17.0 % achieved.
3. Strong sales growth driven by new and innovative “esave” products.
Letter Information for investors Oerlikon Group Operational review Sustainability
Textile Segment
Key figures 1
in CHF million 2012 2011 %
Order intake 1 039 1 014 2.5
Order backlog 602 673 –10.5
Sales (to third parties) 1 103 909 21.3
EBIT2 186 73 >100
EBIT margin 2 17.0 % 8.0 % –
End applications based on Oerlikon technologies
CarpetingFashion Artificial turf New materials
GeotextilesTechnical clothing
Tire cord
Best-in-Class
Oerlikon’s Textile Segment: 17.0 % EBIT margin (FY 2012); followed by Lakshmi Machine Works Ltd.: 7.8 % EBIT margin (FY 2012)
Market presence of Textile Segment
Food Clothing Transportation Infrastructure Energy Electronics Others
1 2012 continuing operations, 2011 restated.2 2012 EBIT includes a onetime effect of CHF 39 million from the sale of property in Arbon, Switzerland. Excluding this onetime effect, EBIT would have been CHF 147 million, giving it a margin of 13.4 %.
3.1Textile Segment

45
Manmade Fibers
In 2013, the Textile Segment expects continued high order intake and sales with some market softening. Due to the anticipated temporary effect caused by the announced disposal of the Natural Fibers and Textile Components Business Units, the Segment anticipates a lower reported profitability compared to 2012, with a stable underlying operating margin.
Innovation and energy-efficient productsThe Segment’s success story continued with the energy efficient products introduced under the “esave” label. These products allow customers to save up to 50 % on energy use and up to 75 % in space. The spinning line “Winding INtegrated Godet Solution (WINGS)” for partially oriented yarn (POY), for example, continues to set new standards in the spinning process, integrating the godets and winding unit into one system for the first time. WINGS delivers energy savings of up to 30 % compared to conventional spinning machines. The userfriendly design, sophisticated threading guidance system and simplified threading procedures deliver space savings of up to 30 %, and a single operator can now thread yarn in just a quarter of
Key topics
Business performance
Outlook
Oerlikon announced on December 3, 2012, that it plans to divest the Natural Fibers and Textile Components Business Units, a move that represents a realignment of the Segment strategy. The results of the Business Units to be divested are reported under discontinued operations. The key figures for the Manmade Fibers Business Unit (continuing operations) are reported in this section along with FY 2011 restated data to allow likeforlike comparison.
The Textile Segment saw another increase in profitability compared with the prior year, posting a record EBIT margin of 17.0 % (FY 2011: 8.0 %). Driven by good sales growth, an innovative product mix and the successful execution of operational excellence programs, EBIT was CHF 186 million. In addition to the planned divestment of the Natural Fibers and Textile Components Business Units, the Segment made tactical adjustments to the portfolio during 2012. Textile sold the Melco business to USbased Mizar Holding Company Inc. at the beginning of the third quarter. In May, the 200 000squaremeter property in Arbon, Switzerland, was sold to HRS Investment AG, Frauenfeld, resulting in a nonrecurring EBIT of about CHF 39 million. Excluding this onetime effect, EBIT would have been CHF 147 million, giving it a underlying margin of 13.4 %.
The Segment boosted 2012 sales by 21.3 % to CHF 1 103 million. The market for manmade fiber equipment continued to post strong growth, and there was high order intake for six quarters in succession. The order book provides substantial visibility into fiscal year 2014; the Segment has already received first orders for fiscal year 2015. For the period under review, order intake was CHF 1 039 million (FY 2011: CHF 1 014 million) and order backlog was CHF 602 million (FY 2011: CHF 673 million).
The “esave” products introduced at the 2011 ITMA in Europe, the world’s largest textile trade fair, have been very successful and account for a large portion of the increase in sales as market demand for more energyefficient solutions increases. The “esave” label continues to set industry standards. It has become well established with a wide range of areas of application, enabling customers to produce more efficiently, save energy and raw materials, and use more economical and ecological manufacturing methods.
The Segment posted the strongest growth for the year in China – the Segment’s most important market – as sales expanded by 31 %. In total, the Asian market represented 76 % of Segment sales. Sales in Europe increased by 41 %, followed by India with 21 % sales growth.
the time needed previously. This significant savings in human capital is a critical advantage as labor costs increase worldwide, particularly in markets such as China, India and Turkey.
Ongoing focus on Asia The core markets in Asia continued to grow at doubledigit rates in 2012. The region is the most important one for the Segment, accounting for more than 75 % of total sales. In order to meet the needs of customers at local level even more effectively, the Group has strengthened its focus there. The new Oerlikon Headquarters for China were opened in Shanghai, bringing all Segments under one roof for the first time.
Compliance Corporate Governance Remuneration report Risk management Financial report
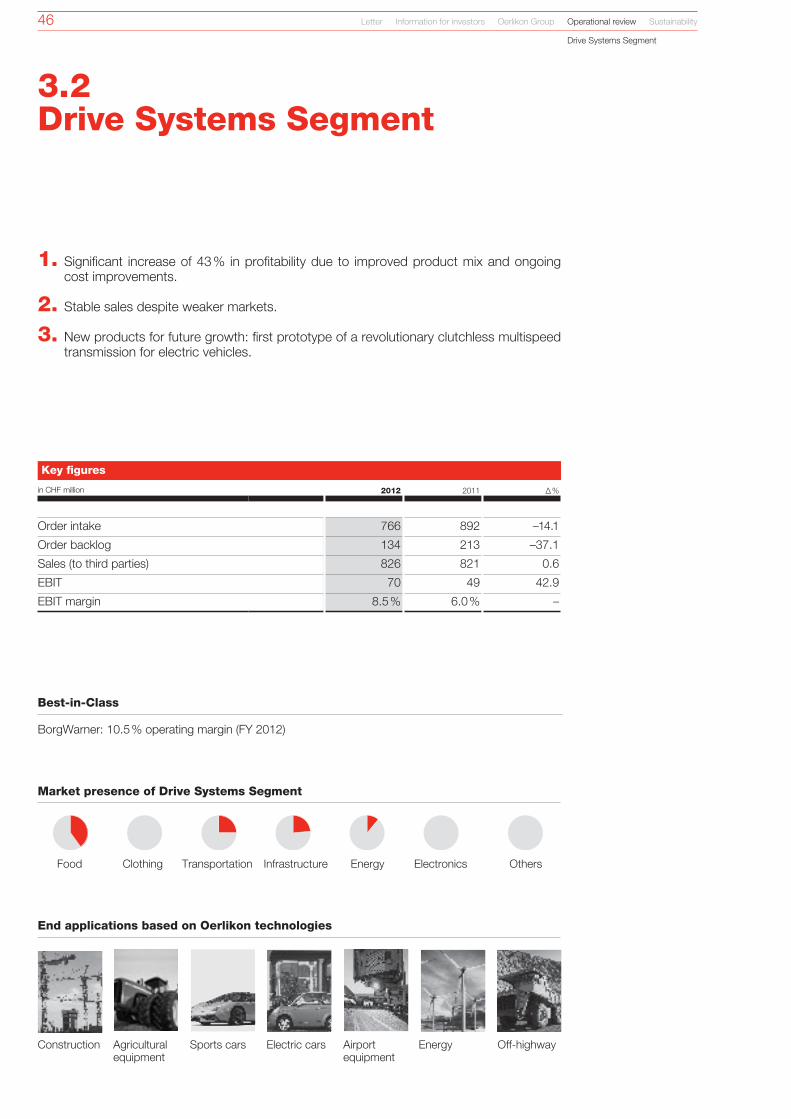
46
1. Significant increase of 43 % in profitability due to improved product mix and ongoing cost improvements.
2. Stable sales despite weaker markets.
3. New products for future growth: first prototype of a revolutionary clutchless multispeed transmission for electric vehicles.
Sports cars EnergyAirport equipment
OffhighwayConstruction Agriculturalequipment
Electric cars
Letter Information for investors Oerlikon Group Operational review Sustainability
Drive Systems Segment
Key figures
in CHF million 2012 2011 %
Order intake 766 892 –14.1
Order backlog 134 213 –37.1
Sales (to third parties) 826 821 0.6
EBIT 70 49 42.9
EBIT margin 8.5 % 6.0 % –
Food Clothing Transportation Infrastructure Energy Electronics Others
End applications based on Oerlikon technologies
Market presence of Drive Systems Segment
Best-in-Class
BorgWarner: 10.5 % operating margin (FY 2012)
3.2Drive Systems Segment

47
Operational excellenceThe Segment engaged an operational excellence program to reach manufacturing excellence at its plant in Rivoli, focusing on safety, On Time Delivery, quality, productivity and the efficient use of equipment. It was rolled out in May 2011 with the introduction of eight technical pillars and involves all the employees at the plant. The first measurable results have included a 60 % reduction in the accident rate and a 10 % drop in the costs incurred for insufficient quality in production. In July 2012 the program was expanded to include two other plants in the EMEA region. Rollout of the program in the United States, China and India will begin in 2013.
Expansion in AsiaTo keep growing and better serve its customers in Asia, especially in China and India, Drive Systems has expanded its existing production facilities at Greater Noida in India. The plant footprint was expanded by 30 %, a modern grinding shop was
The Drive Systems Segment expects an overall challenging market environment especially in the first half of 2013. Order intake is forecasted to grow based on upside potential in the second half of the year, while sales for the full year are expected to decline slightly. The recognized headwinds in key mar
built, the packing area was redesigned, and a purposebuilt warehouse for efficient material handling was constructed. In addition, the existing area for heat treatment was equipped with a modern carburizing furnace. The Segment is also expanding capacity and capability at its Belgaum plant, India with completion expected in June. Furthermore, the new Segment CEO is located in Delhi, India.
At the beginning of 2012, Drive Systems expanded its manufacturing capacities by opening a plant in Suzhou, China, to take better advantage of business opportunities in the region. This plant will primarily manufacture specialized drive system solutions for the growing Chinese market. Additional technical equipment was installed over the course of the year, which has enabled more extensive manufacturing of drive systems. In addition, a new heat treatment plant is set to start operations in early 2013.
The Segment experienced a strong increase in profitability for the year as EBIT increased by 42.9 % to CHF 70 million (FY 2011: CHF 49 million). The increase in EBIT margin to 8.5 % (FY 2011: 6.0 %) is due to a focus on operational excellence measures such as streamlining of the European production network. The sale of two facilities brings the number of plants in Italy to five. Product overhaul across the entire Segment, stronger focus on the sale of solutions and an improved product mix resulting from increased demand in the mining and energy markets also boosted profitability.
Global key markets slowed down during the second half of the year. The demand for agricultural machinery, the Segment’s largest market, declined due to the droughts in North America, India and China. Demand also slowed in Europe and Brazil due to weakening of the agriculture market. The trend in the construction industry was hampered by weak European demand caused by the debt crisis and lower spending on infrastructure projects in China and India. In the Americas, a shortterm oversupply of natural gas and US policy regarding coal have reduced equipment demands for mining and gas exploration. Longterm global prospects in these markets remain favorable, however, with new processes for extracting oil and natural gas driving commercial opportunities for special equipment. The automotive industry also experienced a global drop in demand.
In this challenging environment, the Segment was able to record stable sales compared with the prior year, monetizing order backlog at the beginning of the year. Sales amounted to CHF 826 million (2011: CHF 821 million); and order backlog fell by 37.1 % to CHF 134 million. The softening of demand in the second half of the year caused the order intake for the Segment to fall by 14.1 % compared with the prior year. Order intake was CHF 766 million (FY 2011: CHF 892 million).
To secure future growth, Drive Systems continued to develop and introduce new products with a focus on transmission solutions for electric and hybrid drives. A first prototype of a revolutionary clutchless multispeed transmission for electric vehicles improves efficiency by up to 15 % – meaning less power consumption and a higher range. The concept is scalable from city cars to light commercial vehicles. Also a next generation of synchronizers for heavyduty trucks was introduced, which supports ease of shifting and saves fuel by up to 5 %.
Key topics
Outlook
Business performance
kets such as mining and energy will transiently impact profitability. However, the Segment will consequently continue to execute its strategy for midterm margin improvement by operational excellence initiatives and regional expansion.
Compliance Corporate Governance Remuneration report Risk management Financial report

48
1. Sales and profitability lower in a slowing market environment.
2. New Segment CEO to focus on growth and cost structure.
3. Ongoing expansion as technology leader for highperformance vacuum solutions and enhanced performance in aftersales services.
LEDs /lighting
Glasscoating
Steelproduction
SunglassesResearch &Development
Solar cells and modules
Processindustry
Letter Information for investors Oerlikon Group Operational review Sustainability
Vacuum Segment
Key figures
in CHF million 2012 2011 %
Order intake 377 400 –5.8
Order backlog 73 77 –5.2
Sales (to third parties) 373 409 –8.8
EBIT 38 59 –35.6
EBIT margin 10.2 % 13.9 % –
Food Clothing Transportation Infrastructure Energy Electronics Others
End applications based on Oerlikon technologies
Market presence of Vacuum Segment
Best-in-Class
INFICON: 15.8 % operating margin (Q3 2012)
3.3Vacuum Segment

49
Realignment of the Segment Sustainable growth, a stronger technological and market position and an improved, flexible cost structure – these are the priorities. The following initiatives will help to increase profitability even in unfavorable market conditions:
� Standardization, modularization and homologation of the existing product portfolio, along with shifting the manufacture of standard products to China, will create ongoing cost benefits for the Segment.
� The Segment is continuing to focus on reducing complexity and executing operational excellence measures: initiatives in worldclass procurement (WCP), lowcost sourcing and lean manufacturing to continuously improve the cost base.
The Vacuum Segment forecasts rising order intake and sales despite an increasingly challenging market environment, and improved margins.
� The introduction of innovative new products in existing markets and modular solutions for new applications on the basis of the existing product portfolio will be the drivers of sustainable and profitable growth.
� Expansion of local engineering, services and solution competencies in order to serve specific customer needs: the Vacuum Segment has seen an increase in the need for product and service solutions. Consequently, Oerlikon Leybold Vacuum has participated in several countries in 2012, including the growth markets of China and India.
The Segment had a lower order intake and backlog in 2012 and recorded a drop in sales compared with the strong results in 2011, when sales were extraordinarily high due to restocking following the financial crisis. Sales in 2012 were CHF 373 million, or 8.8 % below the previous year’s level (FY 2011: CHF 409 million), due to overall weaker market demand. The Segment posted an order intake of CHF 377 million compared with CHF 400 million in 2011, and order backlog at the end of 2012 was CHF 73 million (FY 2011: CHF 77 million). Demand in the process and solar industries, the most important markets for the Segment, slowed considerably over the course of the year. Sales were weak in Asia, Europe and North America. Sales in China in particular was negatively affected by a weaker lighting market and general postponing of projects in, for example, solar technology and the OLED/LED business. Sales of pumps for the global coating industry stabilized but at a lower level, and numerous major projects were postponed in this sector. In contrast, there was a gain in market share for vacuum pumps for analytical applications.
Various growth initiatives were launched during the year; these focused on new sectors and applications, such as secondary metallurgy. For example, in 2012 the Segment received several
orders for a new vacuum solution for steel degassing in Germany, Italy, China and India. Thanks to a new procedure, the energy needed for this process step has been reduced by up to 30 %.
Profitability fell in these difficult market conditions due to lower sales: the Segment recorded EBIT of CHF 38 million and a margin of 10.2 % (FY 2011: CHF 59 million, 13.9 %). Nevertheless, the Segment made targeted investments in new product launches, logistics and regional expansion with a focus on Asia in order to be ready for the next growth phase. Topping the Segment agenda are cost structure and strategy redesign.
To improve profitability, the Segment invested in additional operational excellence measures so that its processes can run more efficiently. Following an extensive analysis of internal logistics processes, the construction of a new logistics center began at Vacuum’s primary facility in Cologne, Germany. This will commence operations in fall 2013.
Key topics
Outlook
Business performance
Compliance Corporate Governance Remuneration report Risk management Financial report

50
1. Coating posted the highest profitability in the Group and the highest in the Segment’s own history despite a difficult market environment.
2. Regional expansion key to growth and ongoing; now 90 coating centers in 33 countries.
3. Innovation sparks further growth: global market and technology leader with new coating technologies such as ePD™, S3p™ and PPD™.
PET WatchmakingGearboxesCars Aerospace components
Precision tools
Plastic metallization
Letter Information for investors Oerlikon Group Operational review Sustainability
Coating Segment
Key figures
in CHF million 2012 2011 %
Order intake 501 484 3.5
Order backlog – – –
Sales (to third parties) 501 484 3.5
EBIT 103 97 6.2
EBIT margin 20.5 % 20.1 % –
Food Clothing Transportation Infrastructure Energy Electronics Others
End applications based on Oerlikon technologies
Market presence of Coating Segment
Best-in-Class
Sandvik Machining Solutions: 22.0 % operating margin (FY 2012)
3.4Coating Segment
51
Regional expansion Proximity to customers and rapid, reliable completion of orders are critical in the coating business; a coating center can in general only serve a radius of some 200 kilometers. Expansion of the global network will therefore remain a Segment priority, especially in the emerging markets.
The Coating Segment expects modest sales growth in 2013 and a continued high level of profitability.
Innovation Following a pilot in Germany, the first ePD™ (embedded PVD) technology center in the world was opened at the Suzhou location, China. In contrast to traditional procedures, the lowemissions, ecofriendly ePD™ technology for the metallization of plastic parts does not use any environmentally damaging materials such as chromium VI. ePD™ offers innovative functional features such as radartransparent metallization for distance sensor systems, lightweight construction and a greater variety of design possibilities. Testing by major car manufacturers is underway and certification for use in highvolume production is expected in 2013.
With an EBIT margin of 20.5 % the Segment continued to increase its already high level of profitability. Increased sales from new, innovative products and the continued successful implementation of operational excellence programs were the main contributors to this positive trend. These results mean that the Coating Segment is operating closed to BestinClass level.
In 2012 Coating sales rose by 3.5 % to CHF 501 million (FY 2011: CHF 484 million), driven primarily by new, innovative products. The pace of growth in the market slowed over the course of the year; this was particularly evident in the automotive industry, which negatively impacted the Segment’s tools and components business in Europe. The precision components business continued to grow in Europe, thanks to stronger market penetration in the general engineering industries. Regionally, Germany, the United States and Japan had especially strong growth rates.
The Segment further penetrated the market in 2012, particularly in Asia, where 31 coating centers are already in service. With the new plant in Malaysia, new coating centers in India and China, the company continues to expand its global pres
ence in new regions. The Segment currently operates 90 coating centers worldwide and has expanded its capacities in the components business, primarily in Germany, the United States, France and Thailand.
Success of new coating solutions for automotive components – especially in the area of fuelsaving injection systems – has led to important new projects. One major German customer for these highquality systems selected the Coating Segment for its expansion in Thailand. Following the successful introduction of the high standards of quality and innovation from Germany in the local coating center in Thailand, the next step in expanding capacity to serve the growing demand in Asia has begun.
Industrialization of the recently launched S3p™ technology for extremely smooth coatings and ePD™, a clean alternative process for the metallization of plastic parts, is proceeding as planned. Furthermore, a new generation of the PPD™ technology for hardening surfaces of forming tools was introduced to the market with significantly improved performance para meters.
Key points
Outlook
Business performance
Compliance Corporate Governance Remuneration report Risk management Financial report

52
1. Solid profitability after streamlining of the portfolio.
2. Much higher order intake thanks to leading technology position and successful innovations for mobile communication devices; sales slightly below previous year’s level.
3. The Segment’s innovative solutions form the basis for further growth on the markets for telecommunication, LEDs and power devices.
Cell phonesCameras
Tabletcomputers
Automotiveelectronics
Touch screens
MP3 players TelecomsSolar cells
Key figures
in CHF million 2012 2011 %
Order intake 119 88 35.2
Order backlog 25 8 >100
Sales (to third parties) 103 108 –4.6
EBIT 7 11 –36.4
EBIT margin 6.6 % 10.3 % –
Food Clothing Transportation Infrastructure Energy Electronics Others
End applications based on Oerlikon technologies
Market presence of Advanced Technologies Segment
Best-in-Class
Applied Materials: 11.5 % EBIT margin (FY 2012)1
Letter Information for investors Oerlikon Group Operational review Sustainability
Advanced Technologies Segment
3.5Advanced Technologies Segment
1 Source: Bloomberg

53
Innovations to enter new marketsAs part of the opening up of new markets, the first Solaris system for the development of electronic paper was sold to Asia in 2012. The first Hexagon deposition equipment, an advanced solution for the highvolume production of electronic components, is now being used by a major customer in Asia. It produces semiconductor components that are primarily used in smartphones, tablets and for wireless applications. The wafer throughput achieved is much higher than for comparable systems.
Advanced Technologies’ coating technologies have helped it to not only become a leading equipment provider for ultracompact semiconductor elements for such applications as cell
The Advanced Technologies Segment expects further improvement of order intake and strong sales growth on an increased order backlog. Substantial investments in growth opportunities are forecast to affect the profitability in 2013.
phones, navigation systems and consumer electronics; thanks to stateoftheart LED technologies, semiconductors are also taking the lighting market by storm, an area in which Oerlikon production solutions play a key role in technological and market developments.
In one reflection of this, the Segment created a new process (NanoSmooth™) that augments the light output of LEDs and increases productivity in the production process. NanoSmooth™ clears the way for using other materials, in particular the inexpensive raw material silicon, making the production of LEDs even more costefficient.
The positive trend in the Segment’s core markets continued in 2012, although the global market for semiconductor equipment fell by approximately 12 % as compared to the previous year. Despite this difficult market environment, sales of the Advanced Technologies Segment were only slightly below 2011 and reached CHF 103 million (FY 2011: CHF 108 million). Order intake was up by 35.2 % compared with 2011 to CHF 119 million (FY 2011: CHF 88 million). Successful qualification of Advanced Technologies solutions to address the rising demand for mobile devices (smartphones, tablets and notebooks) and energyefficient solutions (LEDs, power devices) were the main drivers of Segment order intake growth.
Leading semiconductor companies without own manufacturing capabilities posted strong growth with their solutions for mobile communication. All major contract manufacturers for semiconductors benefited from this growth, and this in turn provided a significant boost to the Segment’s equipment business. The negative trend in the semiconductor industry in the second half of the year was primarily due to the low demand for PCs, preceded by downward pressure in the storage business. Weakness in the automotive industry caused a softening in the market for power devices, but the solid state lighting
(LED) market was showing recovery by mid year. Investments in new technologies (mobile devices, MEMS, LED) became particularly important in this consolidation phase.
Regionally, overall demand fell in Europe and North America, which was nearly compensated by 25 % growth in the Asian market.
The Segment underwent a restructuring in 2012, as the optical storage disc business was discontinued due to the declining market conditions. EBIT of CHF 7 million includes restructuring costs of CHF 1 million from this simplification of the Advanced Technologies product portfolio. The Segment posted an EBIT margin of 6.6 % in 2012, which compares to 10.3 % in 2011.
The Segment also stepped up its R&D activities in 2012 and boosted its partnerships with key customers in strategic markets for semiconductors and nanotechnology, thereby establishing the foundation for sustainable and solid profitability.
Key topics
Outlook
Business performance
Compliance Corporate Governance Remuneration report Risk management Financial report


III. Governance

Responsible operations Sustainability is a key element in Oerlikon’s daily business operations and a major competitive factor – the more sustainably the company acts, the more attractive it becomes for investors, customers, job applicants and employees. Sustainability covers a wide field of topics, the most important of them being occupational health and safety and environment. Oerlikon has decided to focus first on achieving BestinClass status in occupational safety while at the same time assuring full compliance with the relevant norms for health and environment at all sites. Oerlikon’s current sustainability recording, monitoring and reporting standards have improved but do not yet meet the company’s aspirations. Oerlikon is not yet able, for example, to carry out a complete environmental audit of its operations, because the necessary data have not yet been collected across the Group. The company is taking steps to improve in this and other areas.
Focus on safetyThe Board of Directors and management have approved a new vision for Occupational Health & Safety at Oerlikon: “Zero Harm to People”. This ambitious vision is grounded in the belief that all occupational accidents, illnesses and diseases are preventable. To achieve this vision, Oerlikon has put in motion the “safety wheel”, consisting of four parts: working systematically, enabling all managers and staff by extensive training, measuring for learning and making safety desirable for everyone. An HSE unit was set up at corporate level at the beginning of 2012 to help implement the mentioned safety wheel.
1. Oerlikon is taking steps to improve its sustainability monitoring and reporting on Group level.
2. Innovative products of Oerlikon contribute to energy efficiency and environmental protection.
3. With our focus on safety, accidents were substantially reduced.
The systematic working part was tackled by developing a new and uniform safety policy and will be followed in 2013 by an equally common and uniform Safety Management System. For the enabling part, two major training programs for all management levels were set up, piloted and then started, which is essential since every line manager is also a safety officer of the company. All top and senior managers will be trained until the end of 2013; all other managers at the latest by the end of 2014. The main metric for safety collected during 2012 was the Lost Time Accident Frequency Rate (LTAFR), which measures the accidents causing the loss of at least one working day per 200 000 hours worked. The new focus on safety together with management training has already shown substantial progress: Oerlikon reduced the LTAFR from 3.22 in 2011 to 1.76 in 2012. Main contributors were Balzers and Graziano Italy. Both organizations achieved a 50 % reduction in the number of LTAs. Safety goals were also introduced as part of the shortterm incentive (STI) system.
In the coming two years, the same systematic approach will be extended to the issues of occupational health and of environment. Currently both issues are managed at the Segment level, with the Segments having the obligation to ensure that all Oerlikon sites are always compliant with the relevant legal obligations. All sites are currently very active in the recycling of production waste, which is turned into secondary raw material for other industries, some having even achieved a rate of 100 % for recycling. It is also noteworthy that energysaving measures have become standard procedure at all sites.
4.0Sustainability

57
500
450
400
350
300
250
200
150
100
50
0
2011 2012
473
266
2011 2012
Product innovations contribute to environmental protectionOerlikon generates added value for customers by offering innovative, energyefficient products across all markets. Many Oerlikon products are designed to directly or indirectly improve the customers’ environmental friendliness by reducing consumption of energy, raw materials and waste or by increasing the efficiency of customer operations in terms of space requirements and application of alternative energies. Oerlikon’s products provide value not only for customers, but also to society. This is illustrated by selected examples from the segments:
For several years the Textile Segment has been setting industry benchmarks with compact, economical and energyefficient “esave” products. For example, the spinning line “Winding INtegrated Godet Solution (WINGS)” for partially oriented yarn delivers energy savings of up to 30 % compared to conventional spinning machines. The sophisticated threading guidance system and simplified threading procedures deliver space savings of up to 30 % per square meter, and a single operator can now thread yarn in just a quarter of the time needed previously. Oerlikon sold the 10 000th WINGS technologyequipped machine at the end of 2012.
In the Drive Systems Segment, Oerlikon develops synchronizers for agricultural and other offroad vehicles that deliver 20 to 30 % fuel savings. This innovative drive technology not only makes shifting gear faster and simpler, contributing to lower fuel consumption, but also lowers CO2 emissions.
In 2012 the Vacuum Segment launched innovative solutions for steel degassing, a step in the refining process that removes gases released from the molten metal. Oerlikon Leybold Vacuum developed a flexible vacuum solution using standard
pumps to replace the methods generally used. The new solution features intelligent control to produce an efficient and highly flexible system that delivers energy savings of up to 90 % compared with conventional degassing methods. The new vacuum solution is already in use in steelworks in Germany, Italy, India and China.
In 2012 the Coating Segment launched an environmentally friendly technology for the surface treatment of large forming tools used primarily in the automobile industry. Unlike existing technologies, it does not use environmentally unfriendly heavy metals. This next generation of PPD™ (pulsedplasma diffusion) coating technology can be used on forming tools to protect against abrasion and increase efficiency in industrial production. Chrome plating, which PPD™ technology can replace, is still the most widely used coating technology today, despite using toxic and environmentally unfriendly substances. Oerlikon Balzers’ environmentally friendly alternative to chrome plating uses no hazardous chemicals.
Thermogenerators produced by the Advanced Technologies Segment enable energy savings of up to a substantial 10 %. The innovative application makes use of thermovoltaics to directly generate electrical energy from temperature fluctuations. As a result, waste heat – the heat energy that is not used by a machine – is converted back into electricity, which in turn can be used to partially drive the machine. Nanotechnology supplied by the Advanced Technologies Segment is required to manufacture these thermogenerators.
Lost time accidents (absolute number)Lost time accidents (rate) per 200 000 working hours
Oerlikon Group Oerlikon Group
5.0
4.5
4.0
3.5
3.0
2.5
2.0
1.5
1.0
0.5
0
3.22
1.76

The compliance issue reporting process resulted in 12 potential compliance infringements in 2012, compared with 17 in 2011. Each of these has been or is being thoroughly investigated. If infringement is confirmed, the aim is not only to punish misconduct, but also to identify possible shortcomings in processes and organizational structures and to introduce appropriate improvements.
In 2012, the company took disciplinary measures (termination for cause) against compliance infringements in one case; another is still under investigation. This represents a marked reduction in the number of serious cases compared to 2011 and demonstrates that employees are becoming increasingly aware of the issues governed by the Code of Conduct.
Compliance at Oerlikon goes well beyond legal and internal company directives; Integrity is one of the four core values on which the company’s corporate culture is founded, and Oerlikon places great importance on adhering to the highest ethical standards.
In 2011 Oerlikon introduced its Integrity Due Diligence (IDD) process, which is designed to assess business partners, among others, in relation to their compliance with anticorruption legislation. The process was rolled out in 2012, and the responsible persons in each Business Unit were given training to broaden their understanding of the process, content and application.
Business partners were assessed using the IDD process: Oerlikon verified and researched the beneficial owner of each, the business partners reputation, how long it had been operating, its track record, etc. As of publication of this report, Oerlikon terminated a relationship with one business partner on the basis of IDD process findings. The process will continue to be applied.
1. Some 300 managers were trained in the principles of antitrust law in 2012.
2. The Integrity Due Diligence process for business partners presented in 2011 was rolled out in 2012. Oerlikon was obliged to end its relationship with one business partner as a result of the assessment.
3. Twelve potential cases were received through the compliance issue reporting process in 2012 – five fewer than in the previous year.
5.0Compliance
Compliance eLearning program
Tasks
2012 2013
Oct. Nov. Dec. Q1 Q2 Q3 Q4
Launch of antitrust module to compliance specialists
Launch of antitrust module to managers
Launch of antitrust module to exposed employees
Follow-up training workshops on antitrust module
Launch of anticorruption module to employees
Relaunch of CoC training to all employees
completed
completed42 people
900 people
1 200 people
all
250 people

59
2010
17
12
2011 2012
5
1
2010 2011 2012
12
9 98
9
2010 2011 2012
Compliance cases1Compliance cases with dismissals
1 All cases are closed; judicial proceedings may still go on.
Formal compliance investigations
In 2012 Oerlikon launched a compliance eLearning program for managers and employees. Some 300 staff at management level received training in the rollout module, addressing issues relating to antitrust law. In addition to learning about cartels and market mechanisms, the program includes rules of behavior with competitors.
In order to raise employee awareness of compliance as early as possible, new employees receive training on the Code of Conduct. The comprehensive guidelines stipulate how employees should behave in daytoday business. In this way, the company integrates sustainability and social responsibility into its overall business operations.
Trade ControlIn 2012, roughly 100 Trade Control Officers in Europe, China, India and the United States completed a new round of expert training sessions on all applicable regulations, taking and passing a demanding written test at the conclusion. These employees in turn conduct training sessions within their respective units. An additional eLearning module was certified as a way to reach all affected employees. The module will be launched in summer of 2013 and then systematically rolled out. An internationally unique coding system was implemented to measure the organization’s performance. All Segments adhere to strict bestpractice guidelines; the largely standardized internal control programs have been hailed as exemplary by authorities.
At Oerlikon, implementation of export control regulations goes beyond legal requirements. In summer 2012, an updated policy statement was published in which management declared its commitment to a strict adherence to all laws and regulations as well as to our “zero tolerance” policy concerning violations of any kind.
In addition, Oerlikon is aware of the responsibility it shoulders as an international company active in the hightech industry; although few of our products exhibit dualuse capabilities that would subject them to export restrictions, we nevertheless, after suitable internal consensus is reached, refrain from engaging in business if we have reason to believe that our provision of a product or service could lead to an unacceptable end use.
In order to maintain this high standard and to continue expanding it, we will carry on with applying the elements determined in the internal control program: training, clearly defined roles and responsibilities, and execution of internal audits and assessments.

Group structure 1
1 Status at the time this annual report went to print.2 Reports directly to the Chairman of the Audit Committee.* The sale of these Business Units was announced on December 3, 2012, and
is expected to close in the second quarter of 2013, subject to merger control approvals.
Board of Directorsand Committees
Executive Committee
Corporate Functions
Country Representatives
Segments
Business Units
Audit Committee
Human Resources Committee
Strategy Committee
Board of Directors
Tim Summers (Chairman)
Reyad FezzaniKurt J. HausheerGerhard PegamCarl StadelhoferWolfgang TölsnerHans Ziegler
Coating
Dr. Hans Brändle
Advanced Technologies
Andreas R. Dill
Drive Systems
Heriberto Diarte
Vacuum
Dr. Martin Füllenbach
Chief Executive Officer
Dr. Michael Buscher
Corporate Functions reporting to the CEO
Group Business Governance
Group Strategy Development
Group Business Services
Group Legal Services (incl. Group Trade Control)
Group Communications, Investor Relations, Marketing & Brands
Country Representatives reporting to the CEO
China
India
Chief Human Resources Officer
vacant
Chief Financial Officer
Jürg Fedier
Country Representatives reporting to the CFO
Americas
Russia
Corporate Functions reporting to the CFO
Group Controlling &Risk Management
Group Accounting & Reporting
Group Treasury
Group Tax
Group Internal Audit 2
Group Mergers andAcquisitions
Corporate Function reporting to the CHRO
Group Compliance
6.0Corporate Governance
Textile
Clement Woon
*
*
*
Manmade Fibers
Natural Fibers
Textile Components
61
Oerlikon is committed to the principles of good corporate governance as defined by Economiesuisse in the Swiss Code of Best Practice for Corporate Governance of March 25, 2002 (as amended on September 6, 2007). Through this commitment Oerlikon aims to reinforce the trust placed in it by the company’s present and future shareholders, lenders, employees, business partners and the general public.
Responsible corporate governance requires transparency with regard to the organization of management and control mechanisms at the uppermost level of the enterprise. Therefore, the Directive on Information relating to Corporate Governance (DCG), enacted by the SIX Swiss Exchange on July 1, 2002, and revised on March 29, 2006, and on October 29, 2008, requires issuers of securities to make available to investors certain key information pertaining to corporate governance.
In this annual report the corporate governance information is once again presented in a separate section, as prescribed by DCG. The framework of the directive has been adopted, however the section “Compensations, shareholdings and loans” has been phased out in a separate chapter (7.0 Remuneration report). References to other portions of this annual report are included in certain instances in an effort to avoid redundancies and enhance readability. All statements in this section 6.0 Corporate Governance are as of the balance sheet date, except where – in case of material change between the balance sheet date and the time this annual report went to print – otherwise indicated.
Further information regarding corporate governance can be found on the company website www.oerlikon.com/en/investorrelations/investorrelationsnewgovernance/.
Group structure and shareholders
Operational Group structureThe Board of Directors is responsible for the strategic management of the Group. Pursuant to Art. 22 Para. 3 of the Articles of Association, the Board of Directors has delegated corporate management to the CEO. Operational responsibility lies with the individual Segments, each of which is overseen by its own Segment CEO. The Board of Directors, the CEO, the Executive Committee and the Business Units are supported by centralized Corporate Functions. A graphical presentation of the operational Group structure can be found on page 60.
Listed Group companiesOC Oerlikon Corporation AG, Pfäffikon is listed on the SIX Swiss Exchange (symbol: OERL; securities number: 81682; ISIN: CH0000816824). On December 31, 2012, the company’s market capitalization totaled CHF 3 374 million. For further information on OC Oerlikon Corporation AG, Pfäffikon see page 155 et seq.
OC Oerlikon Corporation AG, Pfäffikon holds indirectly 83.9 % of Fairfield Atlas Limited, Kolhapur/IN. Fairfield Atlas Limited is listed on the Bombay Stock Exchange (symbol: FAIRFIEL; ISIN: INE922C01013). On December 31, 2012, the market capitalization of Fairfield Atlas Limited totaled INR 3 800 million.
Committed to international standards
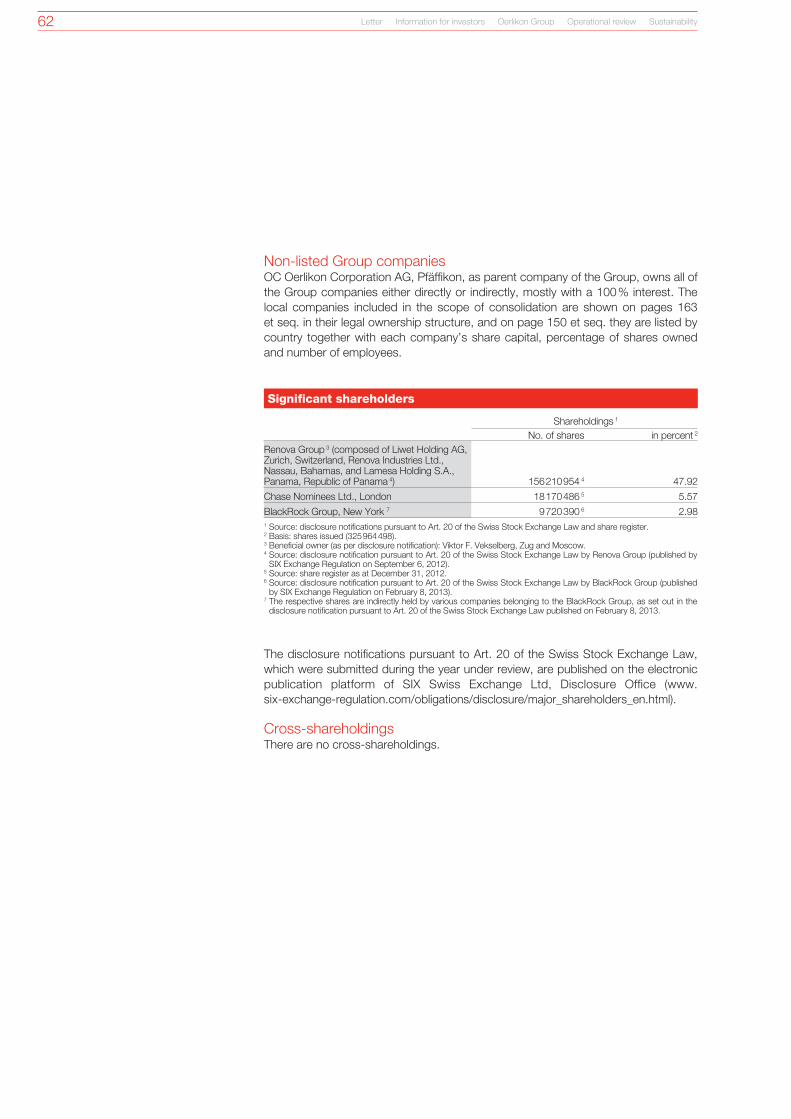
62
Nonlisted Group companiesOC Oerlikon Corporation AG, Pfäffikon, as parent company of the Group, owns all of the Group companies either directly or indirectly, mostly with a 100 % interest. The local companies included in the scope of consolidation are shown on pages 163 et seq. in their legal ownership structure, and on page 150 et seq. they are listed by country together with each company’s share capital, percentage of shares owned and number of employees.
Significant shareholders
Shareholdings 1
No. of shares in percent 2
Renova Group 3 (composed of Liwet Holding AG, Zurich, Switzerland, Renova Industries Ltd., Nassau, Bahamas, and Lamesa Holding S.A., Panama, Republic of Panama 4) 156 210 954 4 47.92
Chase Nominees Ltd., London 18 170 486 5 5.57
BlackRock Group, New York 7 9 720 390 6 2.981 Source: disclosure notifications pursuant to Art. 20 of the Swiss Stock Exchange Law and share register.2 Basis: shares issued (325 964 498).3 Beneficial owner (as per disclosure notification): Viktor F. Vekselberg, Zug and Moscow.4 Source: disclosure notification pursuant to Art. 20 of the Swiss Stock Exchange Law by Renova Group (published by
SIX Exchange Regulation on September 6, 2012).5 Source: share register as at December 31, 2012.6 Source: disclosure notification pursuant to Art. 20 of the Swiss Stock Exchange Law by BlackRock Group (published
by SIX Exchange Regulation on February 8, 2013).7 The respective shares are indirectly held by various companies belonging to the BlackRock Group, as set out in the
disclosure notification pursuant to Art. 20 of the Swiss Stock Exchange Law published on February 8, 2013.
The disclosure notifications pursuant to Art. 20 of the Swiss Stock Exchange Law, which were submitted during the year under review, are published on the electronic publication platform of SIX Swiss Exchange Ltd, Disclosure Office (www. six exchangeregulation.com/obligations/disclosure/major_shareholders_en.html).
CrossshareholdingsThere are no crossshareholdings.
Letter Information for investors Oerlikon Group Operational review Sustainability

63
Capital structure
Capital The share capital of OC Oerlikon Corporation AG, Pfäffikon amounts to CHF 325 964 498, composed of 325 964 498 registered shares, each with a par value of CHF 1. The company also has conditional capital in the amount of CHF 40 million for convertible and warrant bonds, etc., CHF 7.2 million for employee stock option plans, and CHF 14 134 431 for option rights granted to the financial creditors (as defined below).
Authorized capital and conditional capital in particularAuthorized capital: The company has no authorized capital.
Conditional capital for warrant and convertible bonds: Pursuant to Art. 11a of the Articles of Association, the company’s share capital shall be increased by a maximum aggregate amount of CHF 40 million through the issuance of a maximum of 40 million registered shares with a par value of CHF 1 per share, by exercising the option and conversion rights granted in connection with bonds of the company or one of its Group companies. The subscription rights of shareholders are excluded in this regard. Current holders of option certificates and/or convertible bonds are entitled to acquire the new shares. When issuing warrant or convertible bonds, the Board of Directors can limit or exclude the preemptive subscription rights of shareholders (1) to finance and refinance the acquisition of enterprises, units thereof or equity interests, or newly planned investments of the company, and (2) to issue warrant and convertible bonds on international capital markets. Insofar as preemptive subscription rights are excluded, (1) the bonds are to be placed publicly on market terms, (2) the exercise period for the option and conversion rights may not exceed seven years from the date the bond was issued, and (3) the exercise price for the new shares must at least correspond to the market terms at the time the bond was issued.
Conditional capital for employee stock option plans: Pursuant to Art. 11b of the Articles of Association, the company’s share capital will be increased by a maximum aggregate amount of CHF 7.2 million, excluding the preemptive subscription rights of current shareholders, through the issuance of a maximum of 7.2 million fully paidin registered shares with a par value of CHF 1 each, through the exercise of option rights granted to the employees of the company or one of its Group companies under a stock option plan yet to be approved by the Board of Directors. The issuance of shares at less than the market price will be permissible; futher details shall be determined by the Board of Directors.
Conditional capital for warrants: Pursuant to Art. 11c of the Articles of Association, the company’s share capital may be increased by the issue of a maximum of 14 134 431 to be fully paidin registered shares of a par value of CHF 1 each, i.e., in the par value of a total of a maximum amount of CHF 14 134 431, by the exercise of option rights that are granted to the financial creditors of the company under the Facility Agreement of June 7, 2007, with the amendments of June 26, 2007, of August 17, 2007, of March 5, 2008, and of June 8, 2009, (“Financial Creditors”) for loans granted to the company or one of its Group companies. The allocation of these options was a conditio sine qua non of the urgently needed restructuring measures of the company. The preemptive right of the shareholders is therefore completely excluded with regard to the entire conditional capital. The option rights granted to the Financial Creditors have a maximum term until June 30, 2014, from the issue date and may be exercised at the earliest 90 days after the issue date.
Compliance Corporate Governance Remuneration report Risk management Financial report

64
In connection with a dividend of CHF 0.20 resolved on April 12, 2012, the terms of the warrants not yet exercised have been adjusted in a dilution adjustment notice as follows: – exercise price (to be fully paid in cash): CHF 5.86 (predividend: CHF 6.00), and – exercise ratio: 1.02451 (predividend: 1) per warrant. This adjustment came into effect on April 16, 2012, the exdividend date. The respective owners of option rights may subscribe for new shares. The preemptive rights of the shareholders with regard to the entire conditional capital are entirely excluded.
Changes in capitalDuring 2012, as a result of the exercise of 2 840 488 option rights, which were granted to the financial creditors of the company under the Facility Agreement of June 7, 2007, with the amendments of June 26, 2007, of August 17, 2007, of March 5, 2008, and of June 8, 2009, for loans granted to the company or one of its Group companies, the share capital of OC Oerlikon Corporation AG, Pfäffikon has been increased from CHF 323 124 010 to CHF 325 964 498 by the issuance of 2 840 488 fully paidin registered shares of a par value of CHF 1. On May 11, 2011, as a result of the exercise of 38 539 option rights, which were granted to the financial creditors of the company under the same Facility Agreement (with the respective amendments), the share capital of OC Oerlikon Corporation AG, Pfäffikon has been increased from CHF 323 085 471 to CHF 323 124 010 by the issuance of 38 539 fully paidin registered shares of a par value of CHF 1.
For the capital changes in 2010 and before, see the chapter “Changes in capital” on page 56 (section 6.0 Corporate Governance) of the Annual Report 2011. Detailed information on changes in the equity capital of OC Oerlikon Corporation AG, Pfäffikon over the last three years can be found in the holding company’s equity capital statement on page 161 of the Annual Report.
Shares and participation certificatesThe equity securities of OC Oerlikon Corporation AG, Pfäffikon consist exclusively of 325 964 498 fully paidin registered shares with a par value of CHF 1, all of which are equal with respect to their attendant voting rights, dividend entitlement and other rights. The registered shares of OC Oerlikon Corporation AG, Pfäffikon are in principle not certificated but instead issued as dematerialized securities within the meaning of the Swiss Code of Obligations and as bookentry securities in terms of the BookEntry Securities Act, respectively. Shareholders may at any time request that the company print and deliver their shares in certificate form free of charge, and the company may, at any time and without shareholders’ approval, convert the dematerialized securities into share certificates, global certificates or collectively deposited securities. If registered shares are to be printed, OC Oerlikon Corporation AG, Pfäffikon may issue certificates covering multiples of registered shares. The share certificates bear the facsimile signatures of two members of the Board of Directors.
Letter Information for investors Oerlikon Group Operational review Sustainability
65
Profitsharing certificatesOC Oerlikon Corporation AG, Pfäffikon has not issued any profitsharing certificates.
Limitations on transferability and nominee registrationsThere are no restrictions on the transfer of OC Oerlikon Corporation AG, Pfäffikon shares. The company recognizes only those parties entered in the share register as shareholders or usufructuaries. Fiduciary shareholders and nominees will also be entered in the share register.
Convertible bonds and optionsAs at December 31, 2012, there were no convertible bonds or warrant bonds outstanding.
In conjunction with stock option plans, employees held a total of 37 128 options (see page 141, Note 23) on December 31, 2012, each of which entitles the holder to subscribe for one registered share in OC Oerlikon Corporation AG, Pfäffikon. These options will be covered by shares acquired in the open market, such that their exercise will not result in any change in share capital. The aggregate par value of the shares purchasable via option rights granted to employees is CHF 37 128.
In conjunction with the option rights granted to the Financial Creditors, Financial Creditors held a total of 14 065 155 options on December 31, 2012, each of which entitles the holder to subscribe for 1.02451 registered shares in OC Oerlikon Corporation AG, Pfäffikon. The option rights granted to the Financial Creditors have a maximum term until June 30, 2014. The exercise price is CHF 5.86 and must be fully paid in cash. The options are covered by shares pursuant to Art. 11c of the Articles of Association, or by shares purchased on the open market. The aggregate par value of the shares purchasable via option rights granted to the Financial Creditors is CHF 14 409 892.
Compliance Corporate Governance Remuneration report Risk management Financial report

66
321
Stability and competenceThe Oerlikon Board of Directors
1 Gerhard Pegam1962, Austrian citizen Member of the Board of Directors, Member of the Strategy Committee
Professional background and education Gerhard Pegam was elected to the Board of Directors at the 2010 Annual General Meeting. In 2012, he founded his own consulting firm. From June 2011 until June 2012, he was a Corporate Officer of TDK Corporation, Japan. From 2001 until 2012, he was the CEO of EPCOS AG, Germany, and from 2009 until 2012, he additionally served as a Board Member of TDKEPC Corp., the parent company of EPCOS AG. From 1982 to 2001, he held several management positions with EPCOS AG, the Siemens Group and Philips. Gerhard Pegam graduated from the Technical College Klagenfurt, Austria, with a diploma in Electrical Engineering.
Other activities and vested interestsGerhard Pegam is a Board Member of Süss Micro Tech AG and Schaffner Holding AG.
2 Carl Stadelhofer1953, Swiss citizen Member of the Board of Directors, Member of the Human Resources Committee
Professional background and education Carl Stadelhofer was elected to the Board of Directors at the 2008 Annual General Meeting. Since 2004, he has been Chief Legal Counsel of the Renova Group, based in Switzerland. Since 1990, he has been a Senior Partner and since 2011 a Senior Counsel of Klein Attorneys (formerly RKS Rinderknecht Klein & Stadelhofer) in Zurich, Switzer land, specialized in banking and finance law, as well as the resource and commodity business, including M&A. Carl Stadelhofer is admitted to the Bar of the Canton of Zurich, Switzerland. He graduated from the University of Berne, Switzerland, with a degree in Law.
Other activities and vested interestsCarl Stadelhofer is Chairman of Renova Industries Ltd., Renova Holding Ltd., LogObject AG and Calle Services Management Ltd., as well as President of Fondation Merac, Fondation Acteria and Fondation Smartpeace. He is Vice Chairman of Renova Management AG, as well as Vice President of the Fondation JeanPascal Imsand. Furthermore, he is a Board Member of Conrad Electronic, Stadelhofer Enterprises, Terraco Holding, Valamur Enterprise Ltd., Widex Hörgeräte and Wincap, and Actuary of the International Brachet Foundation.
3 Reyad Fezzani1966, British citizen Member of the Board of Directors, Member of the Audit Committee
Professional background and education Reyad Fezzani was elected to the Board of Directors at the 2012 Annual General Meeting. Since 2011, he has been Chairman and Chief Executive of Regenerate Power LLC, a Californiabased Energy Company, and since mid 2011, he has been Chairman and Managing Partner of Energy Finance Company, a distributed generation financier and asset manager. Prior to this, from 2008 to 2010, he was Chairman of TataBP India and President of BP’s renewable energy business based in California, USA. From 2006 to 2008, he was Chief Executive of BP’s Global Chemicals business based in China, with operations across Asia and manufacturing sites in China, Taiwan, Korea, Indonesia, Malaysia, the Americas and Europe. Between 1989 and 2005, he held various commercial and operational posts with BP in the USA and Europe, including Executive Assistant to the Group Chief Executive of BP, UK, Vice President Strategic Planning, President BP US Fuels in the USA, and Head of European Oil Supply & Trading. Reyad Fezzani holds a Master’s Degree in Chemical Engineering and Chemical Technology from Imperial College, London. He is a Chartered Engineer, and a Fellow of the Institute of Chemical Engineers, and of the Institute of Materials, Minerals and Mining.
Other activities and vested interestsReyad Fezzani is a Board Member of the technology companies Enkitech Inc. and QBotix Inc, an Advisory Board Member of Paradigm Change Capital Partners LLP, an Operating Partner of Potomac Asset Management Company Inc., and a Supervisory Board Member of Renova US Holdings Ltd.
4 Kurt J. Hausheer1947, Swiss citizen Member of the Board of Directors, Chairman of the Audit Committee
Professional background and education Kurt J. Hausheer was elected to the Board of Directors at the 2008 Annual General Meeting. Since 2008, he has been the owner of Hausheer Consulting, Switzerland. From 1998 until his retirement in 2008, he served as Managing Partner of the Advisory Practice (M&A and Business Consulting) at PricewaterhouseCoopers (PwC), Switzerland, between 1996 and 2008 additionally as a Member of the Management Board and the Board of Directors of PwC/STGCoopers & Lybrand AG, Switzerland. Between 1969 and 1998, he held several positions in the Audit and Consulting practices of PwC and the predecessor companies in Switzerland and the USA. Kurt J. Hausheer is a Certified Public Accountant (CPA), and completed management programs at IMD, Switzerland, INSEAD, France, and Harvard University, USA.
Other activities and vested interestsNone
Letter Information for investors Oerlikon Group Operational review Sustainability

67
4 5 6 7
5 Tim Summers1967, British citizen Chairman of the Board of Directors, Chairman of the Human Resources Committee, Chairman of the Strategy Committee
Professional background and education Tim Summers was elected to the Board of Directors at the 2011 Annual General Meeting and was thereafter appointed Chairman. From 2010 to 2011, he acted as nonexecutive Chairman of KCA Deutag, Switzerland. Between 2006 and 2009, he served as Chief Operating Officer and from 2008 until 2009 additionally as interim CEO of TNK BP, Russia. Between 2007 and 2009, he was Director of Slavneft in Russia. Between 1989 and 2006, he filled several positions with BP. Tim Summers holds a Bachelor’s Degree in Chemical Engineering from the University of Manchester, UK.
Other activities and vested interestsTim Summers is Chairman of Venetos Management AG (a company of the Renova Group) and Managing Director of Renova Management AG.
6 Wolfgang Tölsner1948, German citizen Member of the Board of Directors, Member of the Audit Committee
Professional background and education Wolfgang Tölsner was elected to the Board of Directors at the 2010 Annual General Meeting. Since 2009, he has been an independent management consultant. Between 2004 and 2009, he served as Global COO of Bombardier Transportation, as a Member of the Board of Bombardier Germany, as Deputy Chairman of the Board of Bombardier Austria and as Chairman of the Board of Bombardier Poland. From 2001 to 2004, he acted as President of the Global Division Locomotives & Freight, Switzerland, and as a Member of the Board of Directors of Bombardier Switzerland and Italy. Between 1986 and 2001, he filled several leading management positions with predecessor companies of Bombardier Transportation and ABB. Wolfgang Tölsner holds a diploma in Electrical Engineering (Dipl.Ing.) from the TU Hannover, Germany.
Other activities and vested interestsWolfgang Tölsner is a Board Member of Bochumer Verein Verkehrstechnik GmbH.
7 Hans Ziegler1952, Swiss citizen Member of the Board of Directors, Member of the Human Resources Committee, Member of the Strategy Committee
Professional background and education Hans Ziegler was elected to the Board of Directors at the 2008 Annual General Meeting. Between 2009 and 2010, he additionally acted as Delegate and CEO ad interim. Since 1996, he has been owner of a consultancy operating in Switzerland and abroad, specializing in corporate restructuring, turnaround management and repositioning. Between 1974 and 1995, he held management positions with the Globus Group, the Usego Trimerco Group, Alcon Pharmaceuticals, Ericsson and SBG. Hans Ziegler earned a degree as Business Economist (KSZ) from Kaderschule Zürich, Switzerland, and completed postgraduate courses in Business Administration and Information Technology at TCU in DallasFort Worth, USA.
Other activities and vested interestsHans Ziegler is Chairman of Swisslog Holding AG and of Charles Vögele Holding AG.
Compliance Corporate Governance Remuneration report Risk management Financial report

68
Board of Directors
The rules and regulations governing the organization and duties of the Board of Directors of OC Oerlikon Corporation AG, Pfäffikon are to be found in the Swiss Code of Obligations, the Articles of Association of OC Oerlikon Corporation AG, Pfäffikon and the Organizational and Governance Rules of OC Oerlikon Corporation AG, Pfäffikon.
Members of the Board of DirectorsIn the year under review, the Board of Directors of OC Oerlikon Corporation AG, Pfäffikon was composed of Tim Summers (Chairman), Reyad Fezzani (Board Member since April 12, 2012), Kurt J. Hausheer, Gerhard Pegam, Carl Stadelhofer, Wolfgang Tölsner, Hans Ziegler and Dr. Urs A. Meyer (Board Member until April 12, 2012), whose statutory term of office expired on April 12, 2012. With the exception of Dr. Urs A. Meyer, who did not run for reelection, they were all elected or reelected, respectively, by the Annual General Meeting of Shareholders on April 12, 2012 for a term of office of one year.
In the three financial years preceding the reporting period, the nonexecutive members of the Board of Directors were not involved in the executive management of OC Oerlikon Corporation AG, Pfäffikon or any other Group company, with the exception of Hans Ziegler, who acted as CEO ad interim from August 25, 2009, until May 18, 2010. They also do not have any significant business connections with companies of the Oerlikon Group.
Composition of the Board of Directors
Name (nationality) Domicile Position Age Joined Term expiresExecutive/ nonexecutive
Tim Summers (GB) CH Chairman 45 2011 2013 NonexecutiveReyad Fezzani (GB) USA Member since April 12, 2012 47 2012 2013 NonexecutiveKurt J. Hausheer (CH) CH Member 65 2008 2013 NonexecutiveGerhard Pegam (AT) DE Member 51 2010 2013 NonexecutiveCarl Stadelhofer (CH) CH Member 59 2008 2013 NonexecutiveWolfgang Tölsner (DE) DE Member 64 2010 2013 NonexecutiveHans Ziegler (CH) CH Member 60 2008 2013 Nonexecutive
Dr. Urs A. Meyer (CH) CH Member until April 12, 2012 48 2008 – Nonexecutive
Letter Information for investors Oerlikon Group Operational review Sustainability

69
Other activities and vested interestsRegarding the activities of the members of the Board of Directors in governing and supervisory bodies of important Swiss and foreign organizations, institutions and foundations under private and public law, permanent management and consultancy functions for important Swiss and foreign interest groups, and official functions and political posts, see page 66 et seq.
Elections and terms of officeBoard members are elected annually by the General Meeting of Shareholders for a term of one year. They are eligible for reelection; a “year” means the period from one ordinary General Meeting of Shareholders to the next. In the event of elections for replacement or elections of additional members during the year, the period until the next ordinary General Meeting of Shareholders shall be deemed to constitute a year. Each member of the Board of Directors shall be elected individually. Eligible are only persons who have not completed their 70th year of age on the election date. The General Meeting may, under special circumstances, grant an exception to this rule and may elect a member of the Board of Directors for one or several terms of office provided that the total number of these additional terms of office does not exceed three.
Internal organizational structureThe Board of Directors is the ultimate supervisory body of the Oerlikon Group. It is responsible for the overall management, oversight and control of the Oerlikon Group, determines the Group strategy and oversees the CEO. It sets forth guidelines on the general and strategic direction of OC Oerlikon Corporation AG, Pfäffikon and the Oerlikon Group and periodically reviews their implementation.
The Board of Directors consists of at least three but not more than seven members, the majority of whom are independent from and not performing any executive management duties within the Oerlikon Group whilst in office, not having significant business relations with the Oerlikon Group, and have not been a member of the Executive Committee or a member of the executive management of an Oerlikon Group company in the preceding three years.
The Board of Directors is selfconstituting. It shall appoint from amongst its mem bers the Chairman and may appoint a member to act as the Chairman in the event of incapacity or absence of the Chairman, and the members of the Board Committees.
The Chairman of the Board of Directors shall ensure that the Board of Directors may and does effectively carry out its superintendence and oversight role on an informed basis. He shall endeavor, in close contact with the CEO, to provide the Board of Directors with optimal information regarding operating activities of OC Oerlikon Corporation AG, Pfäffikon and the Oerlikon Group. Together with the CEO, the Chairman shall perform a leadership role in the implementation of the strategic orientation of the Group, as set out by the Board of Directors on a collegial basis, and shall represent OC Oerlikon Corporation AG, Pfäffikon and the Oerlikon Group in relations with important shareholders, clients, further stakeholders and with the general public.
Compliance Corporate Governance Remuneration report Risk management Financial report

70
The Chairman shall convene, prepare and chair Board meetings, may convene meetings of the Board Committees and shall coordinate the work of the Board of Directors and the Board Committees. In cases of uncertainty, he shall delineate authorities between the Board of Directors, its Committees and the CEO, unless the entire Board of Directors intends to address the matter.
The Board of Directors may at any time create committees from amongst its members to assist it in the performance of its duties. These committees are permanent advisory groups supporting the Board of Directors with their particular expertise. Unless expressly stated in the Organizational and Governance Rules, the Chart of Competences or the relevant committee’s rules and regulations, they shall not have any authority to decide matters in lieu of the Board of Directors. All cases in which the currently existing committees do in fact have authority to decide matters in lieu of the Board of Directors will be specified hereinafter. They may prepare, review and investigate matters of relevance within their field of expertise and submit proposals to the Board of Directors for deliberation, but must not themselves take resolutions beyond recommendations, proposals or motions to be submitted to the Board of Directors for deliberation.
Currently there are three permanent Committees of the Board of Directors, namely the Audit Committee (AC), the Human Resources Committee (HRC) and the Strategy Committee (SC).
Membership of these Committees in the year under review was as follows:
Audit Committee (AC)As a rule, the AC shall be composed of at least three members of the Board of Directors. Members of the AC are not eligible if they perform any executive management duties within the Oerlikon Group whilst in office, or have significant business relations with OC Oerlikon Corporation AG, Pfäffikon the Oerlikon Group, or have been members of the Executive Committee in the preceding three years. They must by all means have the degree of independence required by the Swiss Code of Best Practice for Corporate Governance, as amended from time to time. The majority of AC members, including its Chairman, must be experienced in the fields of finance and accounting and be familiar with internal and external auditing. As a separate advisory group, independent from the CEO, the AC shall advise the Board of Directors and exclusively follow the Board of Directors’ instructions.
Composition of Committees of the Board of Directors
Name (nationality) Audit Committee (AC) Human Resources Committee (HRC) Strategy Committee (SC)Tim Summers (GB) Chairman ChairmanReyad Fezzani (GB) Member since April 12, 2012Kurt J. Hausheer (CH) ChairmanGerhard Pegam (AT) MemberCarl Stadelhofer (CH) MemberWolfgang Tölsner (DE) MemberHans Ziegler (CH) Member Member
Dr. Urs A. Meyer (CH) Member until April 12, 2012
Letter Information for investors Oerlikon Group Operational review Sustainability

71
The AC monitors Groupwide with a view to providing a basis for assessment to the Board of Directors
� in relation to external audits: the relevance of the audit work plan and the price/performance ratio;
� in relation to internal audits: the relevance of the engagement of internal auditors and the professional performance of the auditors;
� in relation to the accounting and internal control systems: the relevance of the accounting system, financial strategy and planning, as well as financial risk control;
� in relation to annual and interim reports: the preparation of Oerlikon’s financial statements and consolidated financial statements, annual business report, specific interim financial statements for publication, and the financial reports on operating results and cash flows of the Oerlikon Group; and
� in relation to corporate governance and compliance: the reasonableness of Oerlikon’s corporate governance and compliance, the relevant guidelines and organization, particularly as instruments to ensure Groupwide compliance with relevant applicable laws and regulations.
The AC decides about the appointment and dismissal of the Head of Group Internal Audit. Furthermore, the AC approves the issuance of material comfort letters and material sureties securing Group companies by the CEO.
Human Resources Committee (HRC)As a rule, the HRC shall be composed of at least three members of the Board of Directors. Members of the HRC are not eligible if they perform any executive management duties within the Oerlikon Group whilst in office, or have significant business relations with OC Oerlikon Corporation AG, Pfäffikon the Oerlikon Group, or have been members of the Executive Committee in the preceding three years. They must by all means have the degree of independence required by the Swiss Code of Best Practice for Corporate Governance, as amended from time to time.
The HRC supports the Board of Directors with regard to human resources related matters, in particular
� the compensation policies for the members of the Board of Directors, the Executive Committee, the Executive Leadership Team and the Groupwide managerial and nonmanagerial staff;
� the succession planning related to members of the Board of Directors and the Executive Committee;
� the performance management of the members of the Board of Directors and the Executive Committee;
� the appointment of the Chairman of the Board of Directors; � the appointment of Board members to the Committees; and � the appointment and dismissal of the Executive Committee members.
The HRC approves the appointment and dismissal of Segment CEOs by the CEO as well as the Executive Committee’s groupwide compensation policies for nonmanagerial staff and the Annual Pay Plan for the Group (including general salary increases). Furthermore, the individual compensation packages of the Board of Directors and the members of the Executive Committee are set by the HRC, subject to approval of the Board of Directors.
Compliance Corporate Governance Remuneration report Risk management Financial report
72
Strategy Committee (SC)As a rule, the SC shall be composed of at least three members of the Board of Directors. All but one must be independent from and not performing any executive management duties within the Oerlikon Group whilst in office, not having significant business relations with the Oerlikon Group, and have not been a member of the Executive Committee or a member of the executive management of an Oerlikon Group company in the preceding three years.
The SC monitors that Oerlikon’s strategy is properly established, implemented and complied with by the CEO and all other management levels of the Oerlikon Group. Furthermore, it ensures that the Board of Directors becomes aware on a timely basis of changing trends, technologies, markets, habits and terms of trade that could jeopardize Oerlikon’s strategy.
The SC has currently no authority to decide matters in lieu of the Board of Directors.
Work methods of the Board of Directors and its CommitteesThe Board of Directors meets at the invitation of its Chairman at least four times a year, or more often if necessary. As a rule, the members of the Executive Committee are also invited to attend the Board meetings. Each Board member and the CEO may request the Chairman to convene a Board meeting by stating the reasons for such a request.
In 2012, six physical Board meetings and six telephone conferences were held, lasting on average around three hours and 15 minutes. All meetings were attended by all Board members.
The members of the Committees, as well as their respective chairmen, are elected by the Board of Directors at the proposal of the Chairman of the Board. Their respective terms of office correspond to their term of office as a Director. Those Board members who are not a member of a committee have the right to attend committee meetings with consultative vote. As a rule, the CFO and the Head of Group Internal Audit should attend the meetings of the AC, the CEO and the CHRO the meetings of the HRC, and the CEO the meetings of the SC. Additional persons (e.g. other members of the Executive Committee, representatives of the external auditors or Heads of Corporate Functions) may be invited, if required.
The AC and the SC meet at the invitation of their Chairmen at least four times a year, or more often if necessary. The HRC meets at the invitation of its Chairman at least three times a year, or more often if necessary.
In 2012, there were seven meetings of the AC, lasting on average around four hours. The members of the AC participated in these meetings along with members of the Executive Committee and representatives of the Corporate Functions concerned (in particular Group Accounting & Reporting and Group Internal Audit). The external auditors (KPMG AG) took part in four AC meetings. The HRC held six meetings in 2012 lasting on average two hours and 45 minutes, the SC held seven meetings lasting on average around four hours. In addition to the official meetings of the Board Committees, numerous workgroup meetings comprised of different participants were held.
Letter Information for investors Oerlikon Group Operational review Sustainability

73
Definition of areas of responsibilityPursuant to Art. 716b CO and Art. 22 Para. 3 of the Articles of Association, the Board of Directors has in principle delegated the operational management of the business of OC Oerlikon Corporation AG, Pfäffikon and of the Oerlikon Group to the CEO. The scope of tasks for which the Board of Directors bears responsibility essentially encompasses those inalienable and nondelegable duties defined by law. These include the ultimate management of the corporation, the determination of the strategic direction and of the organization of the Group, the structuring of the accounting system, the financial controls and the financial planning, the appointment and removal of the persons entrusted with the management and representation of the corporation as well as the ultimate supervision of those individuals entrusted with the management of the corporation. According to the company’s Organizational and Governance Rules it is also incumbent upon the Board of Directors to decide on the acquisition, divestiture, establishment, restructuring or liquidation of strategyrelevant companies or businesses, and on business transactions whose financial value exceeds certain amounts.
The CEO is responsible for all issues relating to the operational management of the business of OC Oerlikon Corporation AG, Pfäffikon and the Oerlikon Group, to the extent such decisions are not expressly reserved to the Board of Directors or delegated to individual Group companies. The Executive Committee is the supreme advisory body advising the CEO with respect to the management of the business of OC Oerlikon Corporation AG, Pfäffikon and the Oerlikon Group. The Executive Committee is chaired by the CEO. In the case of an Executive Committee member dissenting with a decision of the CEO, such member may immediately request the CEO to submit such matter to the Chairman of the Board of Directors for his recommendation, however, the CEO will take the final decision on all issues relating to the operational management.
More information regarding the areas of responsibility of the Board of Directors, the CEO and the Executive Committee can be found in the company’s Organi zational and Governance Rules published on the Oerlikon website: www.oerlikon.com/en/investorrelations/corporategovernance/investorrelationsnewstatutes/.
Information and control instruments visàvis the Executive Committee The Board of Directors has a wide array of instruments that enable it to perform the tasks of monitoring strategic and operational progress as well as risk exposure. The instruments at its disposal include the following elements:
The Board of Directors’ right of access to and the CEO’s duty of informa-tion: The CEO reports at Board of Directors’ meetings on its daytoday operations, operating results and important business matters. Extraordinary occurrences (if any)must be immediately notified to the Chairman of the Board of Directors and to the Chairman of the relevant Committee. With the approval of the Chairman, members of the Board of Directors may also access specific business records and/or obtain information from any employees of the Oerlikon Group. The Board of Directors and its Committees regularly take advice from members of the Executive Committee in order to ensure that the most comprehensive and uptodate information on the state of the company and all relevant elements are included in its decisionmaking. Additionally, Segment CEOs, Heads of Business Units and Corporate Functions, or other experts may be consulted on a casebycase basis in order to gain detailed and comprehensive information on complex matters.
Compliance Corporate Governance Remuneration report Risk management Financial report

74
Accounting & reporting: The Group Accounting & Reporting function is responsible for the Group’s Management Information System (MIS), which links all major Group companies and production sites directly with Group Headquarters to provide the Executive Committee and the Board of Directors with an institutionalized Group reporting on a monthly basis. This is consolidated to show the performance of each Business Unit and the Group and explains the reasons for any deviations of the key performance indicators. The Board of Directors may demand access to the relevant details at any time. Furthermore, Group Accounting and Reporting ensures compliance with International Financial Reporting Standards (IFRS).
Controlling: With regard to strategic controlling, the key instruments are strategic analyses prepared by the Business Units, as well as an annually revised 3Year Business Plan. In terms of operational controlling, the Board of Directors receives the annual financial plan (budget) as well as periodic financial forecasts. Additionally, the Board of Directors and the Executive Committee receive a monthly actual/target analysis of the key performance indicators to assist in the assessment of the Business Units’ performance. Furthermore, the Executive Committee holds quarterly strategic business outlook and financial review meetings.
Risk management: A key component of the risk management system is the halfyearly generation of risk maps for the Group as a whole, as well as for its individual Business Units. All types of risks, internal and external, such as market, credit and operational risks, are considered, including compliance and reputational aspects; and actions are defined in order to mitigate the risk exposure. Internal risk reporting is performed via the Group Risk Report, displaying the relevant risks and defined risk mitigation actions from a Groupwide perspective. The Group Risk Report is prepared halfyearly and is discussed in the Executive Committee and finally in the Board of Directors (Audit Committee, entire Board). On this basis, the Board of Directors is monitoring the risk profile of the Group and the risk mitigation actions. For further information regarding risk management, see page 96 et seq. (section 8.0 Risk management), page 134 et seq. (Notes 19–21 to the consolidated financial statements) and page 159 (Note 21, to the financial statements of OC Oerlikon Corporation AG, Pfäffikon).
Compliance: There is a Groupwide compliance function in order to ensure the compliance with legal, regulatory and internal regulations as well as the Group’s ethical standards, in particular by preventive measures, training, information and consulting. In this context, in 2009, a new Code of Conduct (including a whistleblowing policy) was introduced. To further strengthen the compliance within Oerlikon, an external web and telephonebased whistleblowing hotline was set up in 2011. Furthermore, in 2011, emphasis was put on preventing corruption and on the introduction of a process for business partner due diligence, which was rolled out in 2012. Additionally, in order to increase awareness in the fields of antitrust law and correct interaction with competitors, a compliance eLearning program in this respect was introduced in 2012. For further information regarding Compliance, see page 58 et seq. (section 5.0 Compliance).
Letter Information for investors Oerlikon Group Operational review Sustainability

75
Internal audit: Group Internal Audit is an independent and objective assurance activity that assists Oerlikon in accomplishing its objectives by bringing a systematic and disciplined approach to evaluating and improving the effectiveness of risk management, control and governance processes. The Head of Group Internal Audit reports functionally to the Chairman of the Audit Committee of the Board of Directors and administratively to the CFO. The Audit Committee approves the budget, the resources and the internal audit plan for the following year every fall. Group Internal Audit closely coordinates their plans and activities with the external auditor. Group Internal Audit projects are selected on the basis of a Groupwide risk assessment in coordination with Group Risk Management and a selection of the strategic initiatives from the 3YBPs. The annual audit plan has the appropriate balance between strategy, operational, financial, compliance, information technology and followup reviews. The results of internal audits are communicated to the management team responsible, the Executive Committee, the Audit Committee, the Chairman of the Board and the external auditors through formal audit reports. During 2012 more than 45 internal audits were conducted.
External audit: The external auditor examines the books and accounts of OC Oerlikon Corporation AG, Pfäffikon and those of the Oerlikon Group, coordinating his audit plan with that of Group Internal Audit. On completion of the audit, the external auditor prepares a comprehensive auditor’s report to inform the Audit Committee and the Board of Directors about the detailed findings of the audit, and prepares a summary thereof for the Annual General Meeting of Shareholders. Since 2003, the external audit has been carried out by KPMG AG. For further information regarding auditors, see page 80 et seq.
The continuing independence of the external auditors is ensured by written repre sentations provided by the auditors and also by monitoring of audit fees in relation to total fees for all services paid by Oerlikon to the audit firm.
Compliance Corporate Governance Remuneration report Risk management Financial report

76
Leadership and accountabilityThe Oerlikon Executive Committee
1 Dr. Michael Buscher1965, German citizen Chief Executive Officer (CEO)1
Professional background and educationDr. Michael Buscher was appointed Chief Executive Officer effective May 19, 2010. From 2007 to 2010, Dr. Michael Buscher acted as President of Bombardier’s Business Unit Propulsion & Controls, Switzerland. From 2003 to 2007, Dr. Michael Buscher served as Vice President of the Business Unit Locomotives, responsible for global engineering, and from 2004 until 2007, he additionally served as Site Coordinator Zurich and Member of the Management Team of Bombardier Switzerland. Between 2000 and 2003, he acted as Engineering Head of Mannheim and Hennigsdorf (Director) at DaimlerChrysler Rail System GmbH (now Bombardier Transportation), Germany. Between 1990 and 2000, he held several positions with predecessor companies of Bombardier Transportation. Dr. Michael Buscher graduated from the Technical University Darmstadt, Germany, with a PhD and a master’s degree in electrical engineering.
Other activities and vested interestsDr. Michael Buscher is Deputy Chairman of the Advisory Board of PCS Power Converter Solutions GmbH and a Board Member of KnorrBremse AG.
2 Jürg Fedier1955, Swiss citizen Chief Financial Officer (CFO)1
Professional background and educationJürg Fedier was appointed Chief Financial Officer effective January 1, 2009. From 2007 to 2008 he acted as CFO of Ciba, Switzerland. Between 2006 and 2007, he was Head of Finance of Dow Europe and a Member of the Executive Board. From 2002 to 2006, Jürg Fedier served as Vice President Finance for Dow Chemical, Performance Chemicals, USA, between 2000 and 2002 as Global Business Finance Director for Dow Chemical, Thermosets. From 1978 to 2000, he filled several management positions with Dow Chemical in the USA and in Asia. Jürg Fedier holds a Commercial Diploma from the College of Commerce in Zurich, Switzerland, and completed international executive management programs at the IMD, Switzerland, and the University of Michigan, USA.
Other activities and vested interestsNone
Adrian Cojocaru 2
1964, Romanian citizen Chief Human Resources Officer (CHRO)1
Professional background and educationAdrian Cojocaru was appointed Chief Human Resources Officer effective November 10, 2010, and held this position until his resignation on December 31, 2012. From 2009 to 2010, he served as Regional Chief Human Resources Officer Middle East & Africa of LG Electronics in Dubai, United Arab Emirates. From 2008 to 2009, he worked as Human Resources Vice President Europe at Reader’s Digest in the UK. Between 2001 and 2008, Adrian Cojocaru filled various HR management positions at Mars Inc., based in Central Europe and the UK and, from 1992 to 2001, several management positions with Unilever and CocaCola in Central and Eastern Europe, the Netherlands and in the USA. Adrian Cojocaru holds a Mechanical Engineer Diploma from the Polytechnic University in Bucharest, Romania, and completed postgraduate studies in organizational change at Ashridge Business School, UK.
Other activities and vested interestsNone
1 A description of the role and authority of each member of the Executive Committee can be found in the company’s Organizational and Governance Rules, published on the Oerlikon website: www.oerlikon.com/en/investorrelations/corporategovernance/investorrelationsnewstatutes/.
2 Adrian Cojocaru left the Group on December 31, 2012.
Letter Information for investors Oerlikon Group Operational review Sustainability
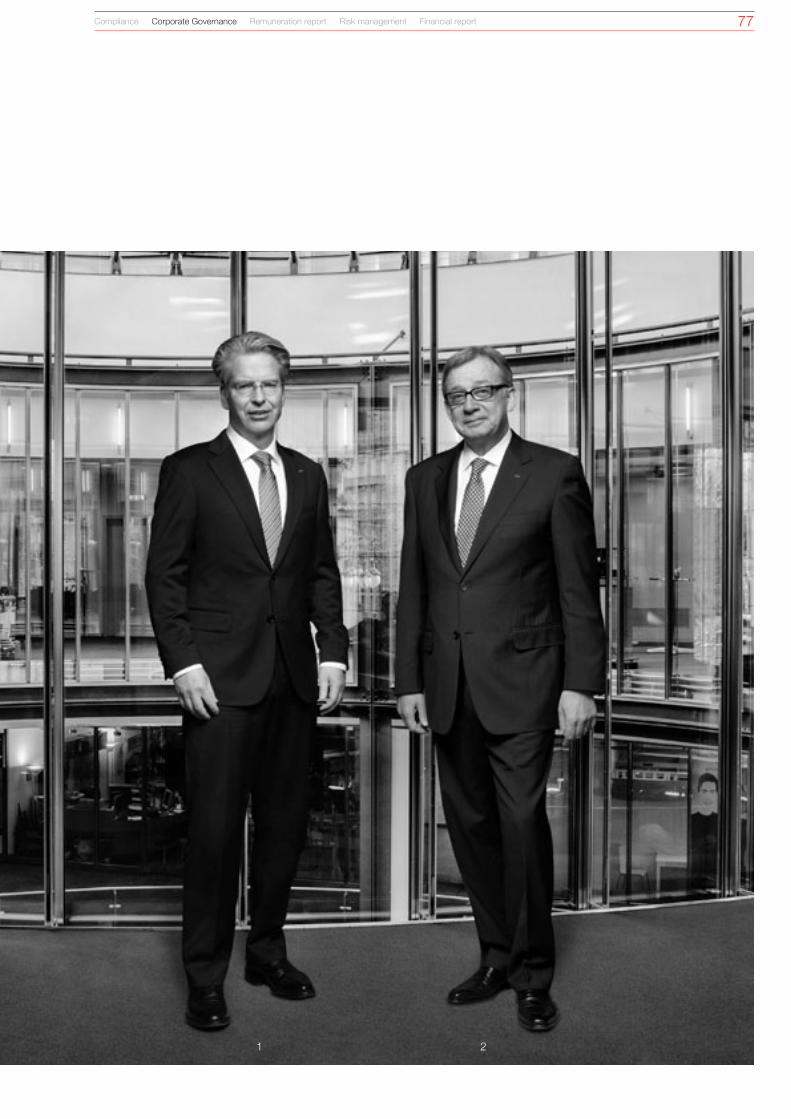
77
21
Compliance Corporate Governance Remuneration report Risk management Financial report
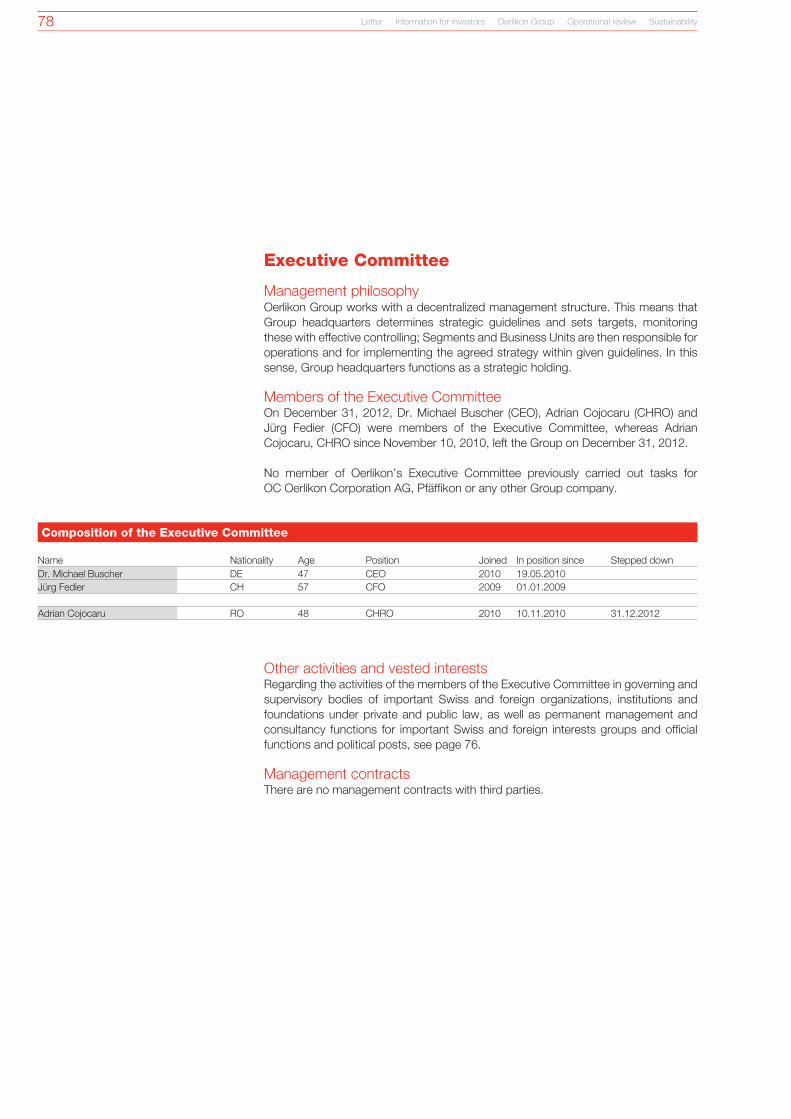
78
Executive Committee Management philosophyOerlikon Group works with a decentralized management structure. This means that Group headquarters determines strategic guidelines and sets targets, monitoring these with effective controlling; Segments and Business Units are then responsible for operations and for implementing the agreed strategy within given guidelines. In this sense, Group headquarters functions as a strategic holding.
Members of the Executive CommitteeOn December 31, 2012, Dr. Michael Buscher (CEO), Adrian Cojocaru (CHRO) and Jürg Fedier (CFO) were members of the Executive Committee, whereas Adrian Cojocaru, CHRO since November 10, 2010, left the Group on December 31, 2012.
No member of Oerlikon’s Executive Committee previously carried out tasks for OC Oerlikon Corporation AG, Pfäffikon or any other Group company.
Other activities and vested interestsRegarding the activities of the members of the Executive Committee in governing and supervisory bodies of important Swiss and foreign organizations, institutions and foundations under private and public law, as well as permanent management and consultancy functions for important Swiss and foreign interests groups and official functions and political posts, see page 76.
Management contractsThere are no management contracts with third parties.
Composition of the Executive Committee
Name Nationality Age Position Joined In position since Stepped downDr. Michael Buscher DE 47 CEO 2010 19.05.2010Jürg Fedier CH 57 CFO 2009 01.01.2009
Adrian Cojocaru RO 48 CHRO 2010 10.11.2010 31.12.2012
Letter Information for investors Oerlikon Group Operational review Sustainability

79
Shareholders’ participation
Voting rights and representation restrictionsEach shareholder may be represented at the Annual General Meeting by the institutional representative (OC Oerlikon Corporation AG, Pfäffikon), by the companyappointed independent voting rights representative, or by some other registered shareholder appointed by him to act as proxy with written authorization to represent his shares. Where the power of proxy is based on facts other than a legal contract (e.g. legal representation by a guardian), the proxy need not to be a registered shareholder. On the other hand, where the power of proxy arises from a legal contract (e.g. a power of attorney), the proxy must be a registered shareholder. Otherwise, there are no restrictions on voting rights.
Statutory quorumsThe Articles of Association of OC Oerlikon Corporation AG, Pfäffikon provide for no specific quorums that go beyond the provisions of corporate law.
Convocation of the Annual General Meeting of ShareholdersSupplemental to the provisions of corporate law, the company’s Articles of Associa tion provide for the convocation of an Annual General Meeting of Shareholders by a oneoff announcement in the Swiss Commercial Gazette.
Inclusion of items on the agendaThe company’s Articles of Association provide that shareholders with a holding of CHF 1 000 000 nominal value are entitled to request that an item be included on the agenda, provided that their requests are submitted in writing and include the actual agenda item and the actual motions; this request is to be made at the latest ten weeks prior to the date of the Annual General Meeting of Shareholders.
Inscriptions into the share registerThe 40th Annual General Meeting of Shareholders will be held on April 30, 2013, in the KKL Luzern (Culture and Convention Center), Lucerne. Entitled to vote in the Annual General Meeting of Shareholders are the shareholders whose names are inscribed into the share register as shareholders with voting rights at the cutoff date to be determined by the Board of Directors.
Right to inspect the minutes of the Annual General MeetingThe minutes of the 39th Annual General Meeting of Shareholders held on April 12, 2012, can be viewed on the Internet at www.oerlikon.com and shareholders may also read the minutes at the headquarters of the corporation upon prior notice. The minutes of the 2013 Annual General Meeting of Shareholders will be published on the Oerlikon website as soon as they have been compiled.
Compliance Corporate Governance Remuneration report Risk management Financial report

80
Changes of control and defense measures
Duty to make an offerIn accordance with the Articles of Association of OC Oerlikon Corporation AG, Pfäffikon a person who acquires shares in the company is not required to make a public purchase bid pursuant to Articles 32 and 52 of the Federal Act on Stock Exchanges and Securities Trading (opting out).
Clauses on changes of controlPlease see page 95 (section 7.0 Remuneration report).
Auditors
Duration of the mandate and term of office of the lead auditorKPMG AG has been the auditor of the company since 2003, and was elected by the Annual General Meeting of Shareholders of May 23, 2003 for the first time. The auditor is elected by the Annual General Meeting of Shareholders for a oneyear term of office. At the 39th Annual General Meeting of Shareholder of April 12, 2012, KPMG was confirmed in that role for an additional year. The lead auditor responsible for the mandate, Mr. Thomas Affolter, has served in this function since the financial year ended December 31, 2012. In accordance with Art. 730a Para. 2 of the Swiss Code of Obligations, the lead auditor’s term of office is a maximum of seven years.
Auditing feesIn the calendar year 2012, KPMG invoiced the company for CHF 2 729 215 in global auditing fees.
Additional feesIn the calendar year 2012, KPMG invoiced the company for CHF 739 152 in additional services, CHF 732 807 for tax consultancy and the rest (CHF 6 345) for general consultancy work. The tax consultancy fees mainly include worldwide tax consultancy in connection with the divestment of the Natural Fibers and Textile Components Business Units.
Informational instruments pertaining to an external auditIn accordance with Art. 728b Para. 1 of the Swiss Code of Obligations, the external auditors issue to the Board of Directors, on an annual basis, a comprehensive report including statements pertinent to bookkeeping and company reporting, the internal controlling system and the performance, and the result of the audit. Furthermore, the external auditors conduct interim audits during the year, on which they report their findings to the Executive Committee and the Audit Committee. During the reporting period, several of such interim audits have been conducted between September and December 2012.
Once the auditing work has been completed, the Audit Committee assesses the results and findings of the external audit, discusses its assessment with the lead auditor in charge and reports the relevant findings to the Board of Directors. Further, the Audit Committee submits proposals in response to the external auditors’ recommendations, objections and other discovered deficiencies, if any, to the Board of Directors for deliberation, and monitors the implementation of any relevant action decided upon by the Board of Directors.
Letter Information for investors Oerlikon Group Operational review Sustainability

81
The Chairman of the Audit Committee meets regularly with the lead auditor and other representatives of the auditing firm. The latter also participates in meetings of the Audit Committee dealing with the relevant agenda points. In the reporting year, KPMG AG participated in four meetings of the Audit Committee.
On behalf of the Board of Directors, the Audit Committee evaluates the work done by the external auditors, based on the documents, reports and presentations issued by them as well as on the materiality and objectivity of their statements. Therefore, the Audit Committee consults with the CFO and the Head of Group Internal Audit. The fees paid to the external auditors are reviewed on a regular basis and compared with the auditing fees paid by other comparable listed Swiss companies. Auditing fees are negotiated by the CFO, evaluated by the Audit Committee and subject to the approval of the Board of Directors.
The Audit Committee submits a proposal to the Board of Directors for the election of external auditors by the Annual General Meeting of Shareholders.
Information policy
GeneralOerlikon provides its shareholders and the capital market with transparent, compre hensive and timely information on facts and developments of relevance to them, and in a manner that is in keeping with the principle of equal treatment of all capital market participants. Apart from its detailed annual report and halfyear report, which are prepared in accordance with International Financial Reporting Standards (IFRS), Oerlikon publishes key financial figures (sales, order intake, order backlog and EBIT) and a related commentary for the first and third quarters of its financial year. Like this, Oerikon has increased its transparency. Additionally, press releases keep shareholders and the capital market informed of significant changes and developments in the company. The company’s website, www.oerlikon.com, is a permanently accessible platform for information concerning the company. As already indicated at the beginning of this section 6.0 Corporate Governance, Oerlikon has phased out all information relating to the DCG’s section “Compensations, shareholdings and loans” in a separate chapter (7.0 Remuneration report).
As a company listed on the SIX Swiss Exchange, OC Oerlikon Corporation AG, Pfäffikon is subject to the obligation to disclose pricesensitive information (ad hoc publicity obligation).
The publication medium for corporation notices is the Swiss Official Gazette of Commerce. The Board of Directors may select additional publishing mediums. Communications to registered shareholders shall be served in writing to their address last notified to the company.
Press releasesPress releases published in 2012, along with all others dating back to January 2007, can be accessed on our website at www.oerlikon.com/pressreleases. Those interested in receiving our press releases regularly by email can register at www.oerlikon.com/en/media/pressreleases/subscribetomediareleases/.
Compliance Corporate Governance Remuneration report Risk management Financial report

82
Financial calendarMarch 5, 2013Annual Results 2012 and Annual Report 2012
April 30, 2013Annual General Meeting of Shareholders, Lucerne
May 7, 2013Q1 Results 2013
August 6, 2013Q2 / HY 2013 and HalfYear Report 2013
October 29, 2013Q3 Results / 9M 2013
Dates of roadshows, conferences and other events can be found in the financial calendar on our website at www.oerlikon.com/en/investor-relations/investor-relations-new-financialcalendar
ContactGroup HeadquartersOC Oerlikon Corporation AG, PfäffikonChurerstrasse 120CH8808 Pfäffikon SZSwitzerlandwww.oerlikon.com
Investor RelationsAndreas SchwarzwälderTel. +41 58 360 96 22Fax +41 58 360 98 [email protected]
Group CommunicationsBurkhard BöndelTel. +41 58 360 96 02Fax +41 58 360 91 [email protected]
Letter Information for investors Oerlikon Group Operational review Sustainability

83Compliance Corporate Governance Remuneration report Risk management Financial report

Attractive, motivating and fair compensation for all staff is the foundation of Oerlikon’s performancebased corporate culture. Compensation for the Board of Directors and the Executive Committee is made up of various components, which are described in detail in this report. This section discloses a summary of the following aspects for 2012:
�General principles of the compensation policy � Setting and approving compensation �Compensation system and compensation paid to the Board of Directors in 2012 �Compensation systems applicable to management (incl. the Executive Committee) �Compensation paid to the Executive Committee in 2012
With this remuneration report, Oerlikon meets the requirements of Art. 663bbis and 663c Para. 3 of the Swiss Code of Obligations (CO) and Para. 5.1 of the Annex to the Corporate Governance Directive (DCG) of the SIX Swiss Exchange, governing the disclosure of remuneration systems and compensation paid to members of the Board of Directors and the Executive Committee. Moreover, in regard to remuneration reporting, Oerlikon voluntarily complies with economiesuisse’s Swiss Code of Best Practice for Corporate Governance. Oerlikon prepares its consolidated financial statements in accordance with IFRS (International Financial Reporting Standards). These regulations require different interpretations and presentations, where appropriate (see also Notes 23 and 24).
Compensation policy
Oerlikon believes that compensation must be attractive, motivating and fair. The compensation systems provide competitive base salaries and attractive incentive schemes. They give equal consideration to individual and company performance, reward excellence, and promote an entrepreneurial attitude.
To determine competitive and equitable compensation, Oerlikon uses external and internal benchmarks. The company establishes its external equity by continuously surveying the markets in which it operates, and its internal equity is established by following a performance management process. Performance management is a crucial element in assessing the achievement of expectations and targets in relation to individual and business results.
7.0Remuneration report

85
Determining compensationThe Human Resources Committee supports the Board of Directors in all matters relating to the compensation and performance management systems in place at Oerlikon, in particular:
� the compensation policies for members of the Board of Directors, the Executive Committee, the Executive Leadership Team and Groupwide managerial and nonmanagerial staff;
� the annual pay plan for the Group (including general salary increases); � the objectives for the CEO and assessment of performance; � the performance assessment of Executive Committee members by the CEO.
The compensation policies for the Board of Directors, the Executive Committee and the Executive Leadership Team require an ongoing review of whether or not the compensation offered is:
� competitive, transparent and fair, by analyzing comparable companies and salary trends in the market;
� commensurate with the company’s results and individual performance; � consistent with Oerlikon’s values and longterm strategy.
This review forms the basis for the Board of Directors to approve in: �December, the target compensation of the members of the Board of Directors, the Executive Committee and the Executive Leadership Team for the following year;
� February, the target achievement and variable compensation of members of the Board of Directors and the Executive Committee for the past year;
�March and November, LongTerm Incentive (LTI) grants, i.e. participants in equity programs and share awards allocated to them.
The Chairman of the Board of Directors is present at the meeting when decisions are approved by the Board of Directors, including his own remuneration. In his role as Chairman of the Human Resources Committee, he is also involved in the determination of Board remuneration, including his own.
The CEO, or other members of the Executive Committee, are neither involved in the determination of their remuneration nor are they present when the Board of Directors approve them.
Approval process
Decision on Prepared by Set by Approved byCompensation of members of the Board of Directors (incl. Chairman) Chairman Human Resources Committee Board of DirectorsCompensation of the CEO Chairman Human Resources Committee Board of DirectorsCompensation of members of the Executive Committee CEO Human Resources Committee Board of DirectorsLTI grants CEO Human Resources Committee Board of Directors
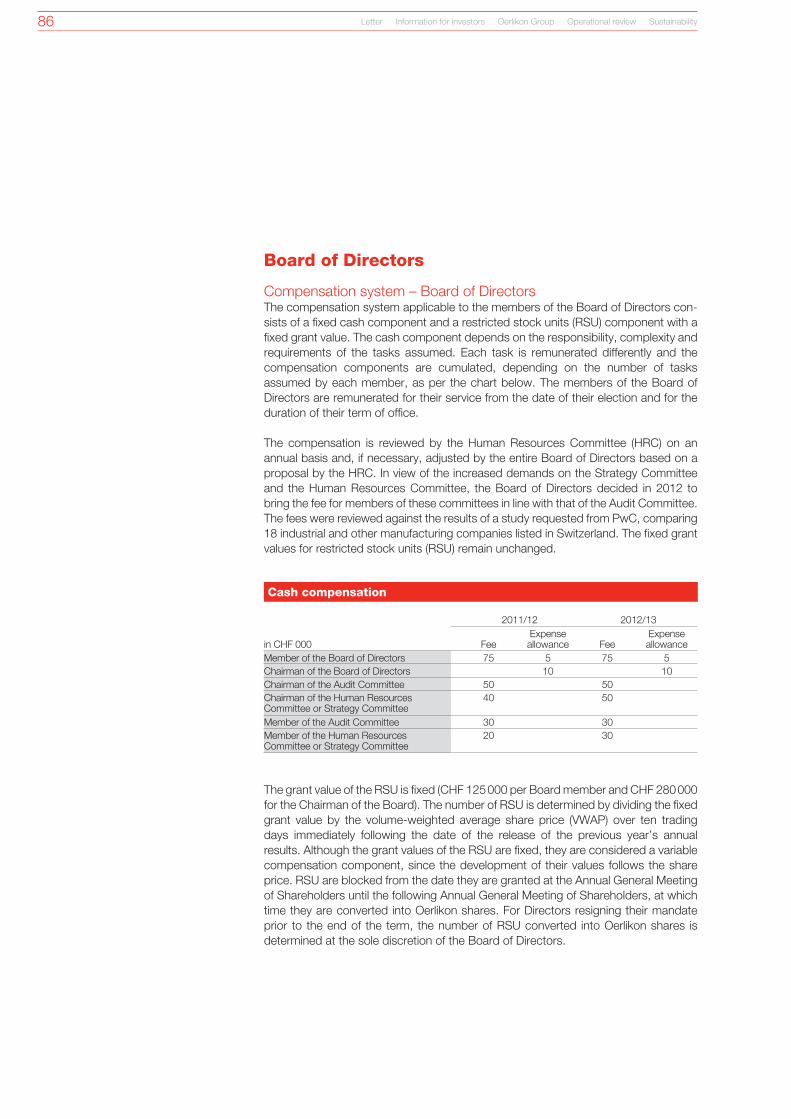
86
Board of Directors
Compensation system – Board of DirectorsThe compensation system applicable to the members of the Board of Directors consists of a fixed cash component and a restricted stock units (RSU) component with a fixed grant value. The cash component depends on the responsibility, complexity and requirements of the tasks assumed. Each task is remunerated differently and the compensation components are cumulated, depending on the number of tasks assumed by each member, as per the chart below. The members of the Board of Directors are remunerated for their service from the date of their election and for the duration of their term of office.
The compensation is reviewed by the Human Resources Committee (HRC) on an annual basis and, if necessary, adjusted by the entire Board of Directors based on a proposal by the HRC. In view of the increased demands on the Strategy Committee and the Human Resources Committee, the Board of Directors decided in 2012 to bring the fee for members of these committees in line with that of the Audit Committee. The fees were reviewed against the results of a study requested from PwC, comparing 18 industrial and other manufacturing companies listed in Switzerland. The fixed grant values for restricted stock units (RSU) remain unchanged.
Cash compensation
2011/12 2012/13
in CHF 000 FeeExpense allowance Fee
Expense allowance
Member of the Board of Directors 75 5 75 5Chairman of the Board of Directors 10 10Chairman of the Audit Committee 50 50Chairman of the Human Resources Committee or Strategy Committee
40 50
Member of the Audit Committee 30 30Member of the Human Resources Committee or Strategy Committee
20 30
The grant value of the RSU is fixed (CHF 125 000 per Board member and CHF 280 000 for the Chairman of the Board). The number of RSU is determined by dividing the fixed grant value by the volumeweighted average share price (VWAP) over ten trading days immediately following the date of the release of the previous year’s annual results. Although the grant values of the RSU are fixed, they are considered a variable compensation component, since the development of their values follows the share price. RSU are blocked from the date they are granted at the Annual General Meeting of Shareholders until the following Annual General Meeting of Shareholders, at which time they are converted into Oerlikon shares. For Directors resigning their mandate prior to the end of the term, the number of RSU converted into Oerlikon shares is determined at the sole discretion of the Board of Directors.
Letter Information for investors Oerlikon Group Operational review Sustainability

87
Compensation 2012 – Board of DirectorsNo member of the Board of Directors served in an executive role in 2012. Total compensation paid to the eight nonexecutive members of the Board of Directors in 2012 was CHF 2.2 million. In 2011, the total compensation for the same nonexecutive members of the Board of Directors amounted to CHF 2.1 million, while the total compensation for all nonexecutive members of the Board of Directors in 2011 amounted to CHF 2.3 million. The proportion of variable compensation changed from 46 % in 2011 to 51 % in 2012.
Members of the Board of Directors did not receive any fees or other remuneration for additional services to OC Oerlikon or its subsidiaries in the 2012 business year. Neither OC Oerlikon nor its subsidiaries granted any guarantees, loans, advances or credit facilities to members of the Board of Directors or related parties in 2012.
No compensation was paid to any former members of the Board of Directors of OC Oerlikon Corporation AG, Pfäffikon or a Group company in 2012.
Restricted Stock Units (RSU) – Board of Directors
Year of Grant
Outstanding on 1.1.
Granted in 2012
Forfeited in 2012
Exercised in 2012
Outstanding on 31.12.
Average share price
in CHF
Expenses for the period in
MCHF Vesting period2011 145 684 – – 145 684 – 6.9 0.4 11.05.11–12.04.122012 – 130 711 – – 130 711 8.1 0.7 12.04.12–30.04.13Total 145 684 130 711 145 684 130 711 1.1
Compensation of non-executive members of the Board of Directors
in CHF 000Board of Directors
Strategy Committee
AuditCommittee
HRCommittee
Cash compen
sation
Restricted Stock Units
(RSU) 2011/12 1
Restricted Stock Units
(RSU) 2012/13 1
Other compen
sation 2
Total compen
sation 2012
Total compen
sation 2011
Tim Summers C C C 169 115 193 40 517 277Kurt J. Hausheer M C 125 50 86 22 283 287Dr. Urs A. Meyer 3 M M 30 51 – 10 91 294Reyad Fezzani 4 M M 75 – 86 5 166 –Hans Ziegler M M M 129 51 86 22 288 293Carl Stadelhofer M M 102 51 86 21 260 258Gerhard Pegam M M 102 50 86 5 243 241Wolfgang Tölsner 5 M M 232 50 86 5 373 478Total 964 418 709 130 2 221 2 128
C(hairman), M(ember)
1 Accounting value of restricted stock units (RSU) for the mandate 2011/12 is based on a share price of CHF 6.9 (grant date), and for the mandate 2012/13, it is based on a share price of CHF 8.1 (grant date).
2 Other compensation consists of social security contributions and expense allowances, which are paid by OC Oerlikon Corporation AG, Pfäffikon. 3 Until April 12, 2012.4 As of April 12, 2012.5 Included in the aggregate cash compensation of Mr. Tölsner is, in addition to his Board remuneration, a fee for his consultancy work during 2012 for Oerlikon Group companies in the amount of KCHF 127. Mr. Tölsner’s consulting contract with Oerlikon has been terminated as of November 1, 2012.
Compliance Corporate Governance Remuneration report Risk management Financial report

88
Pay-
for-
Perf
orm
ance
Management
Compensation system – managementThe compensation system for management staff, including the CEO, the Executive Committee, the Executive Leadership Team, as well as other management functions (Global Leaders) was revised in 2012 in order to make it more attractive for talented individuals and to promote, recognize and reward BestinClass performance. The compensation system consists of fixed and variable components. The fixed component entails a base salary commensurate with the role, local market level and, depending on role and local practice, includes allowances. The variable component entails an annual cash bonus (ShortTerm Incentive). In addition, Global Leaders consisting of over 120 management staff participate in a threeyear equity program (LongTerm Incentive). The mix between these components is defined by the profile, strategic impact and pay level of the role, as described hereinafter.
Letter Information for investors Oerlikon Group Operational review Sustainability
Long-Term Incentive program (LTI)� Three-year equity bonus aimed at motivating Global Leaders.� Variable component based on a target number of shares.� Depending on the achievement of performance and vesting conditions, LTI bonus
can amount to zero or lie above the target value.
Base salary� Aims to reward employees at market level for effectively using their competencies,
skills and knowledge to meet the requirements of their role.� Reviewed annually or when an employee changes roles or adopts additional
responsibilities.
Short-Term Incentive program (STI)� Annual cash bonus aimed at motivating managers and specialists to focus their
efforts on specific financial and individual objectives.� Variable component based on a target amount depending on job level.� Bonus can – depending on the achievement of targets – amount to zero or lie
above the target value.
Pay mix
89
ShortTerm Incentive (STI) program 2012The Oerlikon ShortTerm Incentive (STI) program is an annual cash bonus aimed at motivating eligible managers and specialists to focus their efforts on specific financial and individual objectives. It helps them to align their efforts, promotes initiative and contributes to the performance of individuals and the company.
The program determines a variable part of compensation with a target amount that is based on the role and responsibility of the participant. Oerlikon’s compensation policy sets target amounts above the market standard, in order to offer attractive incentives for outperforming peer companies and achieving and defending top positions in the respective market segments.
The STI program for Global Leaders, including the CEO, the Executive Committee and the Executive Leadership Team, consists of financial and individual objectives as well as strategic milestones. Financial objectives account for 70 %, individual objectives for 15 % and strategic milestones for 15 % of the target bonus.
The STI for management staff and specialists consists of financial and individual objectives. Financial objectives make up 70 % and individual objectives 30 % of the target bonus.
Financial objectives are set for each business and aim at increasing the growth, profitability and cash efficiency of the respective business. Global Leaders, including the Executive Committee and the Executive Leadership Team, are measured in sales growth (20 %), EBIT margin (30 %) and return on net assets (RONA) (20 %). Segment CEOs have their profitability target split into the EBIT margin of their Segment (15 %) and the EBIT margin of the Oerlikon Group (15 %). Participants are to aim their actions at reaching and exceeding these objectives and thus to reaching and exceeding their bonus target.
Strategic milestones are defined for the Group, Segments and Regions and aim at focusing on the timely and incremental achievement of longerterm business objectives. For the Executive Committee, they include the development and implementation of regional strategies or procurement savings.
Individual objectives are agreed upon between each plan participant and their manager, in order to define concrete and measurable targets that the plan participant is responsible for achieving. For Global Leaders, including the Executive Committee, they include the improvement of health, safety and environment throughout the Group.
Financial targets are based on the annual budget and the payout on the actual financial results. A financial result at target corresponds to a payout of 100 % of target bonus, at the lower threshold 50 %, and below the lower threshold, 0 %. A financial result above the target is based on a factor that represents the competitiveness of the target, with respect to the relevant peer companies. No upper threshold exists, but the Human Resources Committee will finally assess the overall bonus payout, based on factual business circumstances and reasonable business judgment in order to achieve a fair result originated from true performance, and will make a recommendation to the Board of Directors for a final discretionary decision.
Compliance Corporate Governance Remuneration report Risk management Financial report
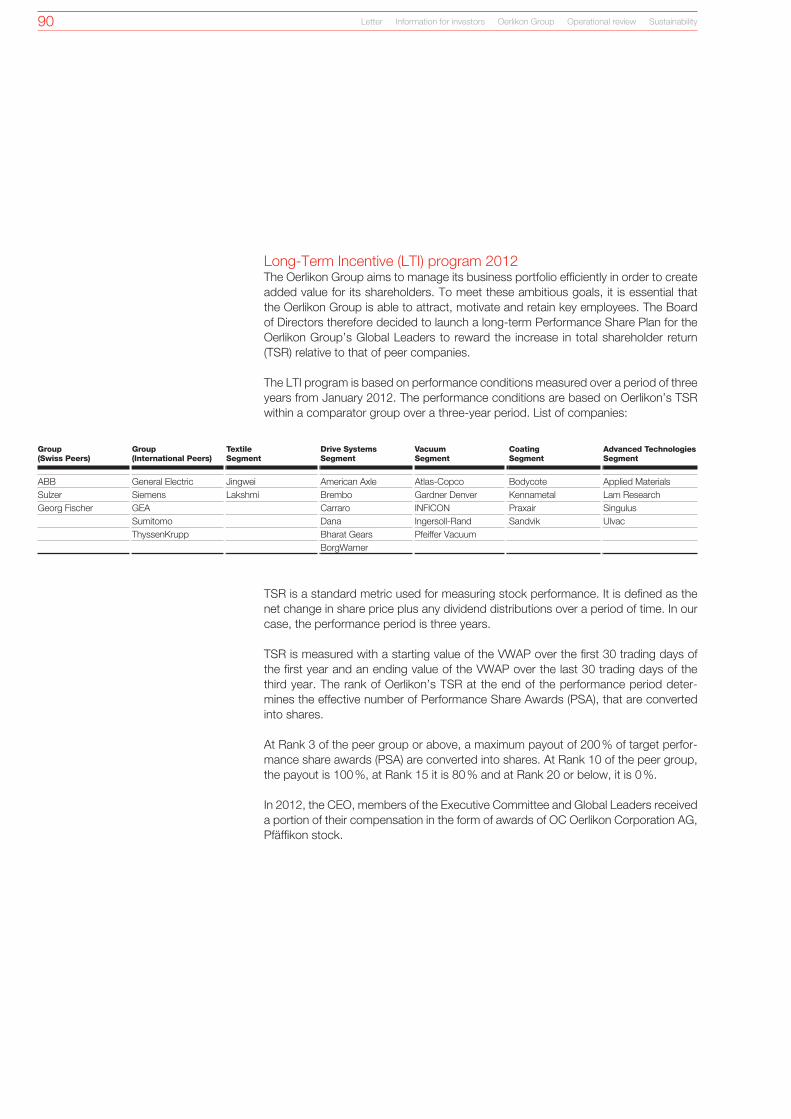
90
LongTerm Incentive (LTI) program 2012The Oerlikon Group aims to manage its business portfolio efficiently in order to create added value for its shareholders. To meet these ambitious goals, it is essential that the Oerlikon Group is able to attract, motivate and retain key employees. The Board of Directors therefore decided to launch a longterm Performance Share Plan for the Oerlikon Group’s Global Leaders to reward the increase in total shareholder return (TSR) relative to that of peer companies.
The LTI program is based on performance conditions measured over a period of three years from January 2012. The performance conditions are based on Oerlikon’s TSR within a comparator group over a threeyear period. List of companies:
TSR is a standard metric used for measuring stock performance. It is defined as the net change in share price plus any dividend distributions over a period of time. In our case, the performance period is three years.
TSR is measured with a starting value of the VWAP over the first 30 trading days of the first year and an ending value of the VWAP over the last 30 trading days of the third year. The rank of Oerlikon’s TSR at the end of the performance period determines the effective number of Performance Share Awards (PSA), that are converted into shares.
At Rank 3 of the peer group or above, a maximum payout of 200 % of target performance share awards (PSA) are converted into shares. At Rank 10 of the peer group, the payout is 100 %, at Rank 15 it is 80 % and at Rank 20 or below, it is 0 %.
In 2012, the CEO, members of the Executive Committee and Global Leaders received a portion of their compensation in the form of awards of OC Oerlikon Corporation AG, Pfäffikon stock.
Group(Swiss Peers)
Group(International Peers)
TextileSegment
Drive SystemsSegment
VacuumSegment
CoatingSegment
Advanced TechnologiesSegment
ABB General Electric Jingwei American Axle AtlasCopco Bodycote Applied MaterialsSulzer Siemens Lakshmi Brembo Gardner Denver Kennametal Lam ResearchGeorg Fischer GEA Carraro INFICON Praxair Singulus
Sumitomo Dana IngersollRand Sandvik UlvacThyssenKrupp Bharat Gears Pfeiffer Vacuum
BorgWarner
Letter Information for investors Oerlikon Group Operational review Sustainability

91
Shareholding requirementIn 2012, the Board of Directors instituted a shareholding requirement to further align the interests of the Executive Leadership Team (ELT) and shareholders. The CEO, members of the Executive Committee, Segment CEOs and selected Corporate Functions are required to build a significant personal shareholding in the business.
For each role, a minimum target number of shares should be attained by the relevant individuals. The minimum threshold is a percentage of annual base salary.
Current members of the Executive Leadership Team (ELT) are required to reach their minimum investment limit within a period of five years. The shareholding of the individuals is reviewed regularly from 2012. New members of the Executive Leadership Team (ELT) have five years during which to reach their minimum investment limit.
Performance Share Awards (PSA) 2012 – management
Year of grant
Outstanding on 1.1.
Granted in 2012
Forfeited in 2012
Exercised in 2012
Outstanding on 31.12.
Average share price
in CHF
Expenses for the period
in CHF million Vesting period2012 – 956 696 19 734 83 771 853 191 9.0 3.8 01.05.12– 30.04.15Total – 956 696 19 734 83 771 853 191 3.8
Role
% of base salary
CEO 200 %
Members of the Executive Committee 100 %
Segment CEO 100 %
Corporate Function 50 %
Compliance Corporate Governance Remuneration report Risk management Financial report

92
Earlier LongTerm Incentive (LTI) program 2007–2011 (not continued)Previous LTI programs have been discontinued, however any grants issued will be governed by the respective policy until they have vested or expired in 2013 and 2014 respectively.
Stock options (not continued)In 2007, members of senior management received a portion of their compensation in the form of options to purchase shares in OC Oerlikon Corporation AG, Pfäffikon with a blocking period of one, two, three or four years. Holders of these options are entitled to purchase one share for each option held. The value of the options at year end was calculated using the Black Scholes valuation model and a weighted average share price of CHF 70. No options have been granted after 2007.
Restricted Stock Units (RSU, not continued)In 2009, members of senior management, excluding the CEO or the Executive Committee, could receive a portion of their compensation in the form of Restricted Stock Units (RSU) for OC Oerlikon Corporation AG, Pfäffikon stock, with a vesting period of three years. The value of the RSU per year end is based on the weighted average stock price of CHF 5.7. No RSU were granted to the members of senior management after 2009.
Grant year
LTI program
Status
2007 Options Expiry 20132008 Performance Share Awards Vested in 20102009 Restricted Stock Units (Executive Committee) Vested in 20112009 Restricted Stock Units (Senior Management) Vested in 20122010 Performance Share Awards Vest in 20132011 Performance Share Awards Vest in 2014
Options – management
Year of grant
Outstanding on 1.1.
Granted in 2012
Forfeited in 2012
Exercised in 2012
Outstanding on 31.12.
Exercise price
in CHF
Expenses for the period
in CHF million Vesting period2007 9 282 – – – 9 282 80 0.0 01.01.08 – 31.12.13
9 282 – – – 9 282 80 0.0 01.01.08 – 31.12.139 282 – – – 9 282 80 0.0 01.01.08 – 31.12.139 282 – – – 9 282 80 0.0 01.01.08 – 31.12.13
Total 37 128 – – – 37 128 0.0
Restricted Stock Units (RSU) – management
Year of grant
Outstanding on 1.1.
Granted in 2012
Forfeited in 2012
Exercised in 2012
Outstanding on 31.12.
Average share price
in CHF
Expenses for the period
in CHF million Vesting period2009 235 791 – – 235 791 – 5.7 0.3 01.05.09 – 30.04.12Total 235 791 235 791 0.3
Letter Information for investors Oerlikon Group Operational review Sustainability

93
Performance Share Awards (PSA, not continued)In 2010 and 2011, the CEO, members of the Executive Committee and senior management could receive a portion of their compensation in the form of awards of OC Oerlikon Corporation AG, Pfäffikon stocks, which are subject to performance conditions and a vesting period of three years. The performance conditions consist of the cumulative economic profit (Oerlikon Value Added) over a threeyear period of the respective business in which participants operate. Their achievement determines the effective number of total Performance Share Awards (PSA) that are converted into shares.
Each target has a lower threshold, below which no Performance Share Awards (PSA) are converted into stocks, and an upper threshold, above which no additional stocks are granted. The number of PSA cannot exceed 200 % of the target number. Upon vesting, the effective number of PSA is converted into shares.
Compensation 2012 – Executive Committee
The Board of Directors approved the decision of the Human Resources Committee (HRC) to adapt the compensation system for Global Leaders, including members of the Executive Committee in 2012, compensation consisting of a base salary, expense allowances, a performancerelated ShortTerm Incentive (STI) and a performancerelated LongTerm Incentive (LTI). However, the new compensation system is based on a different mix of fixed and variable components, putting a stronger emphasis on performancebased, mid to longterm variable compensation. No members of the Executive Committee were present when decisions on Executive Committee compensation were made.
Performance Share Awards (PSA) – management
Year of grant
Outstanding on 1.1.
Granted in 2012
Forfeited in 2012
Exercised in 2012
Outstanding on 31.12.
Average share price
in CHF
Expenses for the period
in CHF million Vesting period2010 484 465 – 114 149 – 370 316 4.6 0.7 01.05.10 –30.04.13
2011 565 718 – 138 024 – 427 694 6.8 1.5 01.05.11 –30.04.14
Total 1 050 183 – 252 173 – 798 010 2.2
Compliance Corporate Governance Remuneration report Risk management Financial report
CEO Executive Committee
Long-Term Incentive (LTI) Short-Term Incentive (STI) Base salary
2011
36 %
30 %
34 %
2012
31 %
28 %
41 %
2012
37 %
29 %
35 %
2011
41 %
29 %
30 %

94
The implementation of the new compensation system included a systematic review of pay levels together with Towers Watson, leading to increases in the base salary of the CEO and increases in STI and LTI target amounts for other members of the Executive Committee. The base salary is determined primarily by the executive’s tasks, responsibilities, skills, managerial experience and market conditions, and is paid in cash. All compensation elements have been benchmarked by Towers Watson against comparable positions in companies of comparable size in terms of revenue, employees and geographical scope, that are operating in the general industry in some of the major markets in which we operate – including Switzerland, Germany, Italy and USA. Among other companies, Towers Watson also provides other compensation services to the Oerlikon Group and its subsidiaries.
The STI 2011 paid in 2012 reached the maximum payout of 205 % when, in the former STI Plan, the two financial measures – return on net assets (RONA) and operating free cash flow (OFCF) – reached their respective upper threshold and individual objectives were fully met. The expected payout for the STI 2012 is 108 % when, in the new STI Plan, the three financial measures – sales growth, EBIT margin and return on net assets (RONA) – reached or exceeded their respective target and the strategic milestones and individual objectives were fully met.
The total compensation for all members of the Executive Committee in 2012 amounted to CHF 9.7 million. The highest compensation paid to an individual member of the Executive Committee was CHF 3.5 million.
Members of the Executive Committee did not receive any fees or other remuneration for additional services to OC Oerlikon or its subsidiaries in the 2012 business year. Neither OC Oerlikon nor its subsidiaries granted any guarantees, loans, advances or credit facilities to members of the Executive Committee or related parties in 2012.
Compensation of members of the Executive Committee
in CHF 000 Salary Bonus 1LTI
(2010–13) 2LTI
(2011–14) 2LTI
(2012–15) 2 Pension
Other compen
sation 3Severance payment 4
Total compen
sation 2012
Total compen
sation 2011Total compensation of the Executive Committee
2 065 3 391 545 818 1 305 564 137 895 9 720 9 902
Of which, highest individual compensation: Michael Buscher (CEO) in 2012, Thomas Babacan (former COO) in 2011
858 1 333 187 432 441 189 42 0 3 482 4 128
1 Effective bonus 2011, paid in 2012, and one bonus 2012, paid in 2012. The expected bonus outcome for the year 2012 amounts to CHF 1.5 million. Bonus payments will be made in March/April 2013, after the financial results are published.
2 Accounting value of Performance Share Awards (PSA) is based on a weighted average share price of CHF 4.6 (grant date in 2010), CHF 6.8 (grant date in 2011) and CHF 9.0 (grant date in 2012).
3 Other compensation includes expense and car allowances.4 Adrian Cojocaru’s (former CHRO) employment ended on December 31, 2012. The LTI grant 2012 vested on a prorated basis upon termination. The termination payment included
the contractually agreed compensation for the notice period of 12 months.
Letter Information for investors Oerlikon Group Operational review Sustainability

95
The employment contracts of the most recent members of the Executive Committee (CEO and CHRO) contain no provisions relating to severance payment or change of control. The employment contracts of Executive Committee members are of unlimited duration and end automatically when the member reaches the age of 62. The contracts provide for a notice period of 12 months.
The contract of one member of the Executive Committee contains provisions relating to a severance payment or change of control. They include:
Severance payment: In case of termination by OC Oerlikon (other than for good cause within the meaning of Art. 337 of the Swiss Code of Obligations or other than in case of a change of control), the Executive Committee member is entitled to a severance payment. The severance payment is equal to the market value of the grants of the individual under the existing LTI plans.
In case of termination by OC Oerlikon or the Executive Committee member within a period of 12 months from the effective date of a change of control regarding OC Oerlikon Corporation AG, Pfäffikon, the Executive Committee member is entitled to a severance payment. The severance payment is equal to an annual compensation and the market value of the grants of the individual under the existing LTI plans.
Change of control: A change of control means (summarized) one of the following events:
� A person, group of persons or entity acquires, either directly or indirectly, 33.33 % or more of the combined voting power of all issued securities of OC Oerlikon Corporation AG, Pfäffikon (hereinafter “OC Oerlikon”) or, in the event of a merger, of the issued voting securities of the surviving or resulting entity, while at the same time no other shareholder of OC Oerlikon, who had more than 10 % of the voting rights on October 1, 2008, disposes of more voting rights in OC Oerlikon or, in the event of a merger, in the surviving or resulting entity.
� The shareholders of OC Oerlikon approve the sale of substantially all the business and/or assets of OC Oerlikon to a person or entity of which OC Oerlikon, directly or indirectly, controls 50 % or less of all outstanding securities.
During 2012, no compensation was paid to former members of the Executive Committee, either by OC Oerlikon Corporation AG, Pfäffikon or by any other company of the Oerlikon Group.
Compliance Corporate Governance Remuneration report Risk management Financial report

1. Oerlikon conducted two Groupwide risk management cycles in 2012 in order to identify and evaluate risks and mitigation actions.
2. A new risk management software was rolled out across the Group in 2012 to support enterprisewide performance of risk assessments, central consolidation of risk data and calculation of total risk exposure.
3. Oerlikon took its first steps towards riskreturn management by calculating the total risk exposure, introducing a riskadjusted key performance indicator (KPI) and defining the riskbearing capacity.
Oerlikon’s Risk Management SystemThe Risk Management System is a management tool that serves to integrate risk management within the company’s executive ranks and organizational structure.
Risk management at Oerlikon is based on the Group’s risk policy, which has been approved by the Board of Directors, and the risk management directive adopted by the Executive Committee. The policy outlines the fundamental objectives and principles, while the directive defines the framework and methods of operational implementation.
Objectives and principlesThe Board of Directors has defined five primary objectives for the Risk Management System. First, it must help secure the company’s continued existence and profitability by creating a transparent risk profile and continuously improving and monitoring it. Second, it must contribute to improving planning and supporting a better achievement of targets. Third, it must secure revenue and reduce potential riskrelated expenses, which safeguards and enhances the company’s value. Fourth, it must align total risk exposure with the company’s riskbearing capacity and ensure that the riskreturn ratio of business activities is transparent. Finally, risk management must also help protect the company’s reputation.
OrganizationRoles and responsibilities within the Risk Management System are defined as follows:
� In accordance with Swiss stock corporation law, the Board of Directors has overall responsibility for supervising and monitoring risk management. Supported by the Audit Committee, it monitors the Group’s risk profile on the basis of internal
reporting. In addition, it reviews the Risk Management System’s performance and effectiveness. The Board of Directors also uses internal auditing to fulfill and document its supervisory and monitoring duties.
� Pursuant to Oerlikon’s Organizational and Governance Rules, the Chief Executive Officer (CEO), with the support of the Executive Committee, bears overall responsibility for structuring and implementing risk management (delegated management responsibility for risk management). He approves the risk management directive and is responsible for revising it, and also monitors the Group’s risk profile and the implementation of risk mitigation actions.
� In accordance with the principle of risk ownership, the Segments and Group Departments (assessment units) bear responsibility for risks and damage/losses in their respective areas. Each is responsible for implementation of the risk management process. Each assessment unit has a risk management coordinator who coordinates the unit’s activities with Group Risk Management. The assessment units conduct risk assessments, establish risk mitigation actions and report the results to Group Risk Management. They continuously monitor their risk profiles and report damage/losses to Group Risk Management.
� As process owner, Group Risk Management is tasked with operation and further development of the Risk Management System. The Head of Group Risk Management assumes technical responsibility for risk management. Group Risk Management provides, among other things, methods and tools, supports the assessment units in conducting risk assessments and developing mitigation actions and oversees the implementation of risk mitigation actions. Other responsibilities include calculating the total risk exposure and the riskadjusted KPI, internal reporting, conducting internal audits and providing training with respect to the Risk Management System. Group Risk Management also coordinates riskrelated activities of other units as and when necessary.
8.0Risk management

97
�Central units and decentralized departments carry out certain riskrelated activities. For example: Group Treasury (liquidity, foreign exchange and interest rate risks); Group Tax (tax risks); Group Legal Services (legal risks, including trade control); Group Compliance (compliance risks); IT Security (IT risks); Security (security risks); and Insurance Management (insurable risks) etc.
CultureOerlikon’s risk culture is shaped and developed by the Code of Conduct, training, bestpractice sharing, continuous implementation of the risk management process, and the Executive Committee and senior management, which act as role models. The risk management directive also contains statements illustrating the desired risk culture.
Current risk situationOerlikon operates in markets characterized by various uncertainties. The Segments have different risk profiles contingent upon strategy, the business model and operational implementation. From the perspective of the Group holding company, the following risks might impact Oerlikon’s businesses and its performance: Market risks
� Economic slowdown and business cycles: Deterioration of the macroeconomic environment in Europe (sovereigndebt and Euro crisis) and around the world and business cycles in various markets could cause demand to decline. As a result, order intake, sales and profitability could decrease.
�Competition: Competition and overcapacity in various markets could exert pressure on prices or trigger a decline in orders. As a result, order intake, sales and profitability could decrease.
� Foreign currency effects (transaction and translation risk): Unfavorable currency developments, mainly with respect to the Euro and US dollar, could trigger higher procurement costs and lower sales figures. In addition, profitability could decline as a result of local currencies being translated into the Group’s reporting currency (Swiss franc).
� Technology risks: If technologies do not prove successful in the market, order intake and sales targets may not be reached. Impairment charges may have to be taken.
�Country risks: For example, new or higher taxes and fees, currency appreciation or depreciation, higher interest rates, reduced growth, loss of proprietary information (intellectual property), etc. could cause sales to decline and costs to rise, resulting in decreased profitability.
Credit risksCredit risks arise when customers cannot meet their obligations as agreed. At present, there are no significant credit risks for the Group.
Operational risks � Additional costs/warranties: Insufficient product quality or machines and equipment that fail to perform as promised, could lead to additional costs (contractual warranty obligations). This could reduce profitability.
� Legal: Oerlikon is exposed to numerous legal risks as a result of its international operations. These include, in particular, risks in the areas of competition and antitrust law, patent law, tax law and environmental protection law. Oerlikon has a valuable portfolio of industrial property rights, such as patents and trademarks. These property rights can become the target of attacks and infringements.
� Loss of key people / shortage of qualified skilled staff and managers: If key people leave the company and qualified skilled staff and managers are not available, sales and profitability targets may not be reached.
Riskreturn managementIn 2012, Oerlikon took its first steps towards systematic riskreturn management. The primary objectives are to ensure transparent riskreturn ratios for the various business activities and to align the total risk exposure with the company’s riskbearing capacity.
Oerlikon also defined its riskbearing capacity for the first time in 2012. This is seen as a risk buffer that will absorb incurred risks up to a specifically defined lower limit. On this basis, Oerlikon is aligning the total risk exposure of the Group with its riskbearing capacity. The aim is to ensure that total risk exposure does not exceed the riskbearing capacity.
For further information on risk management, see page 74 (section 6.0 Corporate Governance), page 134 et seq. (Notes 19–21 to the consolidated financial statements) and page 159 (Note 21 to the financial statements of OC Oerlikon Corporation AG, Pfäffikon).

Contents
Shareholders’ letter 4
I. Profile
1.0 Information for investors 8
1.1 Oerlikon in the capital markets 9
1.2 Shareholder structure 14
1.3 Communication and information 16
2.0 Oerlikon Group 18
2.1 Markets 22
2.2 Innovation 26
2.3 Regions 28
2.4 Operational excellence 32
II. Operations
3.0 Oerlikon Group operational review 36
3.1 Textile Segment 44
3.2 Drive Systems Segment 46
3.3 Vacuum Segment 48
3.4 Coating Segment 50
3.5 Advanced Technologies Segment 52
III. Governance
4.0 Sustainability 56
5.0 Compliance 58
6.0 Corporate Governance 60
7.0 Remuneration report 84
8.0 Risk management 96
Notes
Accounting principles 107
Notes to the consolidated financial statements 113
Segment information 146
Companies by country 150
Report of the Statutory Auditor 152
Five-year summary of key figures 153
OC Oerlikon Corporation AG, Pfäffikon
Income statement 156
Balance sheet 157
Notes to the financial statements 158
Report of the Statutory Auditor 162
Legal structure 163
IV. Financial report
Key Figures
Key figures Oerlikon Group 101
Key figures by Segment 102
Group
Consolidated income statement/ Consolidated statement of comprehensive income 103
Consolidated balance sheet 104
Consolidated cash flow statement 105
Consolidated statement of changes in equity 106

IV. Financial report


101
Key figures Oerlikon Group
Key figures Group Notes OC Oerlikon Corporation AG, Pfäffikon
Key figures Oerlikon Group
Key figures Oerlikon Group
January 1 to December 31
January 1 to December 31
in CHF million 2012 2011
Order intake 1 2 802 2 878Order backlog 1 834 971Sales 1 2 906 2 731EBITDA 1 547 450– as % of sales 19 % 16 %EBIT 1 421 318– as % of sales 14.5 % 11.6 %Net income 385 224– as % of equity attributable to shareholders of the parent 21 % 14 %Cash flow from operating activities 506 438Capital expenditure for property, plant and equipment and intangible assets 2 181 167Total assets 4 159 4 573Equity attributable to shareholders of the parent 1 858 1 586– as % of total assets 45 % 35 %Net cash 3 339 –86Net Operating Assets 2, 4 1 575 2 205Number of employees 1 12 708 12 726Personnel expense 1 765 740Research and development expenditure 1, 5 106 102
1 2012 continuing operations, 2011 restated.2 2012 continuing operations, 2011 as reported.3 Net cash includes cash and cash equivalents and marketable securities less current and noncurrent debt.4 Net Operating Assets include current and noncurrent operating assets (including goodwill and brands and excluding cash and cash equivalents, financial assets, current and deferred tax receivables) less operating liabilities (excluding financial liabilities, current tax payables and deferred tax liabilities).
5 Research and development expenditure includes expense recognized as intangible assets in the amount of CHF 15 million (previous year: CHF 16 million).
Key share-related figures 1
January 1 to December 31
January 1 to December 31
2012 2011
Year high in CHF 10.85 7.85Year low in CHF 5.06 4.06Yearend in CHF 10.35 5.03
Shares outstanding at yearend 325 964 498 323 124 010Market capitalization at yearend in CHF million 3 374 1 625EBIT per share in CHF 1.30 0.99Earnings per share in CHF 1.18 0.68Cash flow from operating activities per share in CHF 1.56 1.36Equity per share in CHF 2 5.74 4.91Dividend per share in CHF 0.25 3 0.20 4
1 Average number of shares with voting and dividend rights (undiluted).2 Attributable to shareholders of the parent.3 Dividend proposed for 2012, to be paid in 2013.4 For financial year 2011, paid in 2012.

102
Key figures by SegmentJanuary 1 to
December 31January 1 to
December 31in CHF million 2012 2011
Oerlikon GroupOrder intake 2 802 2 878Order backlog 834 971Sales 2 906 2 731EBITDA 547 450EBIT 421 318– as % of sales 14.5 % 11.6 %Net Operating Assets 1, 2 1 575 2 205Number of employees 12 708 12 726
Textile SegmentOrder intake 1 039 1 014Order backlog 602 673Sales to third parties 1 103 909EBITDA 209 97EBIT 186 73– as % of sales 17.0 % 8.0 %Net Operating Assets 1, 2 31 618Number of employees 2 511 2 389
Drive Systems SegmentOrder intake 766 892Order backlog 134 213Sales to third parties 826 821EBITDA 111 94EBIT 70 49– as % of sales 8.5 % 6.0 %Net Operating Assets 1 959 936Number of employees 5 177 5 471
Vacuum SegmentOrder intake 377 400Order backlog 73 77Sales to third parties 373 409EBITDA 52 72EBIT 38 59– as % of sales 10.2 % 13.9 %Net Operating Assets 1 179 165Number of employees 1 491 1 472
Coating SegmentOrder intake 501 484Order backlog – –Sales to third parties 501 484EBITDA 145 141EBIT 103 97– as % of sales 20.5 % 20.1 %Net Operating Assets 1 332 303Number of employees 3 126 2 986
Advanced Technologies SegmentOrder intake 119 88Order backlog 25 8Sales to third parties 103 108EBITDA 11 14EBIT 7 11– as % of sales 6.6 % 10.3 %Net Operating Assets 1 87 82Number of employees 188 200
1 Net Operating Assets include current and noncurrent operating assets (including goodwill and brands and excluding cash and cash equivalents, financial assets, current and deferred tax receivables) less operating liabilities (excluding financial liabilities, current tax payables and deferred tax liabilities).
2 2012 continuing operations, 2011 as reported.
Key figures Group Notes OC Oerlikon Corporation AG, Pfäffikon
Key figures by Segment
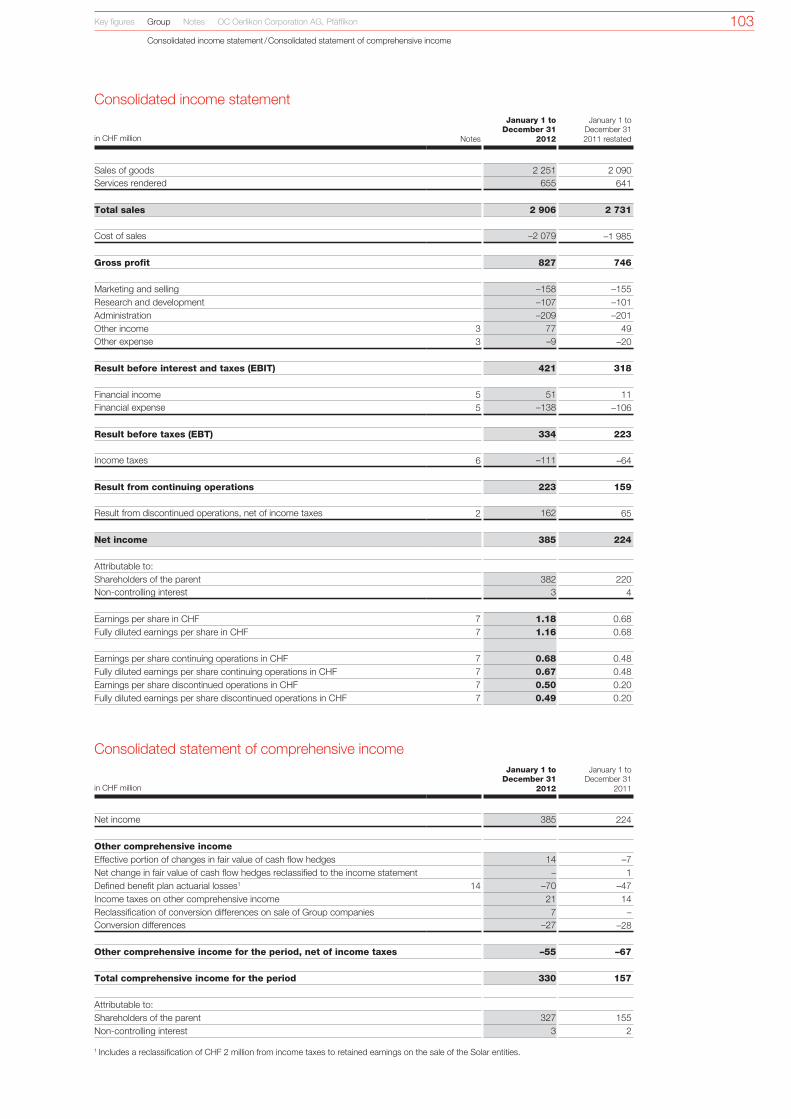
103Key figures Group Notes OC Oerlikon Corporation AG, Pfäffikon
Consolidated income statement / Consolidated statement of comprehensive income
Consolidated income statementJanuary 1 to
December 31January 1 to
December 31in CHF million Notes 2012 2011 restated
Sales of goods 2 251 2 090Services rendered 655 641
Total sales 2 906 2 731
Cost of sales –2 079 –1 985
Gross profit 827 746
Marketing and selling –158 –155Research and development –107 –101Administration –209 –201Other income 3 77 49Other expense 3 –9 –20
Result before interest and taxes (EBIT) 421 318
Financial income 5 51 11Financial expense 5 –138 –106
Result before taxes (EBT) 334 223
Income taxes 6 –111 –64
Result from continuing operations 223 159
Result from discontinued operations, net of income taxes 2 162 65
Net income 385 224
Attributable to:Shareholders of the parent 382 220Noncontrolling interest 3 4
Earnings per share in CHF 7 1.18 0.68Fully diluted earnings per share in CHF 7 1.16 0.68
Earnings per share continuing operations in CHF 7 0.68 0.48Fully diluted earnings per share continuing operations in CHF 7 0.67 0.48Earnings per share discontinued operations in CHF 7 0.50 0.20Fully diluted earnings per share discontinued operations in CHF 7 0.49 0.20
Consolidated statement of comprehensive income January 1 to December 31
January 1 to December 31
in CHF million 2012 2011
Net income 385 224
Other comprehensive incomeEffective portion of changes in fair value of cash flow hedges 14 –7Net change in fair value of cash flow hedges reclassified to the income statement – 1Defined benefit plan actuarial losses1 14 –70 –47Income taxes on other comprehensive income 21 14Reclassification of conversion differences on sale of Group companies 7 –Conversion differences –27 –28
Other comprehensive income for the period, net of income taxes –55 –67
Total comprehensive income for the period 330 157
Attributable to:Shareholders of the parent 327 155Noncontrolling interest 3 2
1 Includes a reclassification of CHF 2 million from income taxes to retained earnings on the sale of the Solar entities.

104
Consolidated balance sheet at December 31
Assets
in CHF million Notes 2012 2011
Cash and cash equivalents 8 638 742Current financial investments and derivatives 9 16 8Trade receivables 10 474 635Other receivables 10 89 234Current tax receivables 19 18Inventories 11 388 582Prepaid expenses and accrued income 18 20Assets classified as held for sale 2 737 –
Current assets 2 379 2 239
Loans and other noncurrent financial receivables 10 6 8Noncurrent financial investments 9 4 39Property, plant and equipment 12 718 915Intangible assets 13 938 1 261Postemployment benefit assets 14 1 –Deferred tax assets 6 113 111
Non-current assets 1 780 2 334
Total assets 4 159 4 573
Liabilities and equity
in CHF million Notes 2012 2011
Trade payables 15 287 457Other current financial liabilities and derivatives 15 3 24Other current liabilities 15 47 62Accrued liabilities 16 199 271Current customer advances 450 471Current income taxes payable 57 61Current postemployment benefit provisions 14 24 28Other current provisions 17 57 111Liabilities classified as held for sale 2 239 –
Current liabilities 1 363 1 485
Noncurrent loans and borrowings 15 304 832Noncurrent postemployment benefit provisions 14 533 525Deferred tax liabilities 6 73 73Other noncurrent provisions 17 4 48
Non-current liabilities 914 1 478
Total liabilities 2 277 2 963
Share capital 326 323Treasury shares –8 –3Retained earnings and reserves 1 540 1 266
Equity attributable to shareholders of the parent 1 858 1 586
Noncontrolling interest 24 24
Total equity 1 882 1 610
Total liabilities and equity 4 159 4 573
Key figures Group Notes OC Oerlikon Corporation AG, Pfäffikon
Consolidated balance sheet at December 31

105
Consolidated cash flow statement 1
January 1 to December 31
January 1 to December 31
in CHF million 2012 2011 reclassified 2
Net income 385 224Income taxes 124 91Interest expense (net) 86 89Other financial expense (net) 6 5Depreciation of property, plant and equipment 123 137Amortization of intangible assets 28 38Impairment losses on property, plant and equipment 3 7Impairment losses on intangible assets – 4Addition to other provisions (net) 9 30Decrease in postemployment benefit provisions –21 –13Gains on sale of property, plant and equipment and intangible assets –40 –2Gain on sale of discontinued operations, net of tax –207 –Income taxes paid –97 –63Other noncash expense / income 15 –3
Cash flow from operating activities before changes in net current assets 414 544
Decrease/increase in receivables, prepaid expenses and accrued income 99 –127Decrease/increase in inventories 46 –128Decrease/increase in payables, accrued liabilities and use of other provisions –125 7Increase in customer advances 76 143Noncash impact on net current assets due to hedge accounting –4 –1
Cash flow from changes in net current assets 92 –106
Cash flow from operating activities 506 438
Purchase of property, plant and equipment –181 –141Purchase of intangible assets –21 –26Proceeds from sale of Group companies, net of cash disposed of 232 –6Purchase of financial investments –2 –6Proceeds from sale of financial investments 54 –Purchase of marketable securities 3 – –129Proceeds from sale of property, plant and equipment 45 14Interest received 6 11Dividends received 3 –
Cash flow from investing activities 136 –283
Dividends paid –67 –3Purchase of treasury shares –7 –3Proceeds from issue of share capital 17 –Proceeds from the issue of financial debt 630 25Payment of transaction costs related to financial debt –18 –Repayment of financial debt 3 –1 170 –139Acquisition of noncontrolling interest –8 –Interest paid –58 –52Other payments related to financing activities –37 –3
Cash flow from financing activities –718 –175
Translation adjustments to cash and cash equivalents –6 6
Decrease in cash and cash equivalents –82 –14
Cash and cash equivalents at the beginning of the year 742 756Cash and cash equivalents at the end of the year 4 660 742
Decrease in cash and cash equivalents –82 –14
1 The consolidated cash flow statement is presented without any effects from discontinued operations as well as assets and liabilities held for sale. Refer to Note 2 for cash flows from discontinued operations.
2 The presentation of the cash flows from operating and financing activities have been changed in the current year and the 2011 figures have been reclassified to conform to the current year presentation. The reclassification of the prior year figures concerns the line items “Other financial expense (net)”, “Other noncash expense / income” and “Other payments related to financing activities” and had no material effect.
3 During 2011, CHF 129 million of own debt was bought back and was offset with the syndicated credit facility as of December 31, 2011.4 Includes CHF 22 million which are included in “Assets classified as held for sale” in the balance sheet as of December 31, 2012.
Key figures Group Notes OC Oerlikon Corporation AG, Pfäffikon
Consolidated cash flow statement

106
Consolidated statement of changes in equity
in CHF million Sha
re
capi
tal 1
Add
ition
al
paid
in
capi
tal 2
Trea
sury
sh
ares
Con
vers
ion
di
ffere
nces
Ret
aine
d
earn
ings
Hed
ge
acco
untin
g
Inco
me
taxe
s
Tota
l eq
uit
y
att
rib
uta
ble
to
sh
are
hold
ers
Non
con
trol
ling
inte
rest
Tota
l sh
are
- h
old
ers
’ eq
uit
y
Balance at January 1, 2011 323 1 475 –2 –441 53 –1 23 1 430 24 1 454
Net income – – – – 220 – – 220 4 224
Other comprehensive incomeEffective portion of changes in fair value of cash flow hedges – – – – – –7 – –7 – –7Net change in fair value of cash flow hedges reclassified to the income statement – – – – – 1 – 1 – 1Defined benefit plan actuarial losses – – – – –47 – – –47 – –47Income taxes on other comprehensive income – – – – – – 14 14 – 14Conversion differences, net – – – –26 – – – –26 –2 –28Total other comprehensive income for the period – – – –26 –47 –6 14 –65 –2 –67
Total comprehensive income for the period – – – –26 173 –6 14 155 2 157
Dividend distributions – – – – – – – – –2 –2Acquisition of noncontrolling interest – – – – – – – – – –Sharebased payments – – – – 4 – – 4 – 4Purchase of treasury shares – – –3 – – – – –3 – –3Transfer of treasury shares – – 2 – –2 – – – – –
Balance at December 31, 2011 323 1 475 –3 –467 228 –7 37 1 586 24 1 610
Net income – – – – 382 – – 382 3 385
Other comprehensive incomeEffective portion of changes in fair value of cash flow hedges – – – – – 14 –5 9 – 9Defined benefit plan actuarial losses 3 – – – – –70 – 26 –44 – –44Conversion differences, net – – – –20 – – – –20 – –20Total other comprehensive income for the period – – – –20 –70 14 21 –55 – –55
Total comprehensive income for the period – – – –20 312 14 21 327 3 330
Capital increase 3 14 – – – – – 17 – 17Dividend distributions – –65 – – – – – –65 –2 –67Sharebased payments – – – – 4 – – 4 – 4Purchase of treasury shares – – –7 – – – – –7 – –7Transfer of treasury shares – – 2 – 1 – – 3 – 3Acquisition of noncontrolling interest – – – – –7 – – –7 –1 –8
Balance at December 31, 2012 326 1 424 –8 –487 538 7 58 1 858 24 1 882
1 The share capital of OC Oerlikon Corporation AG, Pfäffikon consists of 325 964 498 registered shares with a nominal value CHF 1.2 As of December 31, 2012, additional paidin capital includes CHF 1 197 million of legal reserves in OC Oerlikon Corporation AG, Pfäffikon.3 Includes a reclassification of CHF 2 million from income taxes to retained earnings on the sale of the Solar entities.
Treasury shares Number
of sharesPrice per share
in CHFCost
in CHF millionFair value
in CHF millionResult
in CHF million
Balance at January 1, 2011 300 000 5 2 – –
Transfer 2011 due to employee purchase plan –280 989 6 –2 –2 –Purchase 2011 570 000 6 3 – –
Balance at December 31, 2011 589 011 6 3 – –
Transfer 2012 due to employee purchase plan –317 147 6 –1 –3 2Transfer 2012 to warrant holders –69 616 7 –1 – –1Purchase 2012 700 000 10 7 – –
Balance at December 31, 2012 902 248 9 8 – –
Key figures Group Notes OC Oerlikon Corporation AG, Pfäffikon
Consolidated statement of changes in equity

107
Company operationsOC Oerlikon Corporation AG, Pfäffikon is a Swiss public company located on Churerstrasse 120 in 8808 Pfäffikon SZ (community of Freienbach SZ). It is the ultimate parent company of the Oerlikon Group, a globally leading supplier of production systems, transmission technology, yarn processing solutions (textile machinery), components and services for selected information technology market segments and industrial applications.
Apart from its activities in Switzerland, the Oerlikon Group operates in the EU region, North America and Asia, and employs 12 708 individuals (continuing operations).
Basis of preparationThe consolidated financial statements of OC Oerlikon Corporation AG, Pfäffikon have been prepared in accordance with International Financial Reporting Standards (IFRS) and Swiss company law. These accounting standards have been applied consistently in all periods presented in this report. The reporting period is twelve months. The consolidated financial statements are presented in Swiss francs (CHF). The consolidated income statement shows operating costs grouped by function. Assets and liabilities in the consolidated balance sheet are classified as current or noncurrent. The consolidated financial statements were approved by the Board of Directors on March 1, 2013, and will be submitted to the Annual General Meeting of Shareholders on April 30, 2013, for approval. All standards issued by the IASB and all interpretations of the IFRS Interpretations Committee (IFRIC) effective at the date of the consolidated financial statements have been taken into account. The consolidation is based on audited annual individual company accounts of the Group’s material subsidiaries, prepared according to uniform Group accounting principles. All line item amounts in the consolidated financial statements are presented in millions of Swiss francs and all such amounts (including totals and subtotals) have been rounded according to normal commercial practice. Thus an addition of the figures presented can result in rounding differences. Values of assets and liabilities have been determined in accordance with the historical cost convention, with the exception of derivative financial instruments and financial assets held for trading purposes, which are stated at fair value. These consolidated financial statements are published in English and German. If there is any divergence in the wording, the English original text is authoritative.
Judgements, estimates and assumptionsPreparation of the consolidated financial statements in accordance with IFRS requires management to make estimates and assumptions that affect the values of reported revenues, expenses, assets, liabilities and contingent liabilities at the reporting date. These estimates and assumptions are constantly being revised. Depending on the issues involved, revision of such assumptions can have an effect on the current period as well as potentially on future periods. These estimates, judgements and assumptions are based on historical experience and other factors that are believed to be reasonable and justified as expectations of future events. However, actual results can differ from these estimates. Moreover, consistent application of the chosen accounting principles can require management to make decisions that may have a material impact on the amounts reported in the annual financial statements. Above all, assessment of business transactions that involve complex structures or legal forms calls for decisions on management’s part. The most important accounting estimates are to be found in:
Impairment of value: Property, plant and equipment, goodwill and in tangibles: A detailed test for impairment of value is carried out for goodwill and other intangible assets with indefinite useful life annually or, as for all other assets, if there is any indication of a loss of value. Goodwill is allocated to the cashgenerating units (CGUs) or a group of CGUs that is expected to benefit from the synergies of the business combination to which goodwill gave rise. The recoverable amount of the CGUs is determined based on the higher of either valueinuse or fair value less cost to sell calculations. In the same way, future cash flows from the use of tangible fixed assets can be estimated and the carrying value tested, using the same rules. These tests use estimates of future cash flows to be expected from use of the assets concerned, or from their possible sale. Actual cash flows may vary significantly from these estimates following changes of plan for the use of assets such as land and buildings, technological obsolescence or market changes. Refer to Note 12 for impairment of property, plant and equipment and Note 13 for impairment of intangible assets.
Provisions and contingent liabilities: In the ordinary course of their business, companies of the Group may become involved in litigious conflict or disagreement with third parties. Provisions are made to cover the Group’s exposure in such matters, based on a realistic estimate of the economic outflow that may result. However, the ultimate resolution of such disputes can give rise to claims against the Group, which may not be fully covered by provisions or insurance. Specific warranty provisions are set up for known warranty claims as required, and also for situations where it is known from recent experience that the company is exposed to claims, usually for technical reasons. Besides this, a general provision is made for other possible claims, based on experience and linked to sales volumes. In cases where the company has entered into contractual obligations whose cost exceeds the economic benefit to be expected, corresponding provisions are made. These are based on management’s estimates. Refer to Note 17 for provisions and Note 25 for contingent liabilities.
The Group entered into an agreement to divest its Solar Segment in March 2012 as well as its Natural Fibers and Textile Components Business in December 2012. In connection with these divestments, Oerlikon has assumed certain customary obligations like warranty obligations and indemnifications. To assess the impact of these obligations on reported provisions and contingent liabilities, management had to make assumptions with estimation uncertainties. Further details see Note 2.
Pensions: The estimates and assumptions used are based on future projections and actuarial calculations which have been determined together with the actuaries. Refer to Note 14 for details.
Taxes on income: Estimates are used initially to determine amounts receivable and payable in respect of current and deferred taxes on income. These estimates are based on interpretation of existing tax law and regulation. Many internal and external factors can influence the final determination of amounts receivable or payable, such as changes in tax law, changes in tax rates, the level of future profits and fiscal audits carried out by the tax authorities. Refer to Note 6 for details.
Adoption of new and revised accounting standardsThe International Accounting Standards Board (IASB) has published a number of new and revised standards and interpretations, which have been applied by the Oerlikon Group since January 1, 2012:– IFRS 7 amended – Disclosures: Transfers of Financial Assets– IAS 12 amended – Deferred Tax: Recovery of Underlying Assets
The new and revised accounting standards had no material effect on the consolidated financial statements.
Accounting principles
Key figures Group Notes OC Oerlikon Corporation AG, Pfäffikon
Accounting principles

108
Newly published accounting standards not early adoptedThe International Accounting Standards Board (IASB) has published a number of new and revised standards and interpretations which come into force later and have not been implemented ahead of their effective dates. Their effects on the Oerlikon Group’s financial statements have not yet been fully analyzed, but a first review has been conducted and the expected effects of each standard and interpretation are presented in the table below:
Standard/InterpretationImpact
level Effective date
Planned application by
Oerlikon
IFRS 7 amended – Offsetting Financial Assets and Liabilities
* 1 January 2013
Reporting year 2013
IFRS 10 – Consolidated Financial Statements * 1 January 2013
Reporting year 2013
IFRS 11 – Joint Arrangements * 1 January 2013
Reporting year 2013
IFRS 12 – Disclosure of Interests in Other Entities
** 1 January 2013
Reporting year 2013
IFRS 13 – Fair Value Measurement * 1 January 2013
Reporting year 2013
Improvements to IFRSs (May 2012) * 1 January 2013
Reporting year 2013
IAS 1 amended – Presentation of Items of Other Comprehensive Income
** 1 July 2012 Reporting year 2013
IAS 19 amended – Employee Benefits **** 1 January 2013
Reporting year 2013
IAS 27 rev. – Separate Financial Statements * 1 January 2013
Reporting year 2013
IAS 28 rev. – Investments in Associates and Joint Ventures
* 1 January 2013
Reporting year 2013
Consolidated Financial Statements, Joint Arrangements and Disclosures of Interests in Other Entities: Transition Guidance (Amendments to IFRS 10, IFRS 11 and IFRS 12)
* 1 January 2013
Reporting year 2013
IAS 32 amended – Offsetting Financial Assets and Financial Liabilities
*** 1 January 2014
Reporting year 2014
IFRS 10, IFRS 12 and IAS 27 amended – Investment Entities
*** 1 January 2014
Reporting year 2014
IFRS 9 – IFRS 9 Financial Instruments *** 1 January 2015
Reporting year 2015
* No impact or no significant impact is expected on the consolidated financial statements of the Oerlikon Group.
** The impact on the consolidated financial statements is expected to result in additional disclosures or changes in presentation.
*** The impact on the consolidated financial statements cannot yet be determined with sufficient reliability.
**** The net profit is expected to be reduced by a singledigit million amount. The impact on the consolidated financial statements is expected to result in additional disclosures.
Principles of consolidation
Method and scope of consolidationDecember 31 is the uniform closing date for all companies included in the consolidated financial statements. All companies in which OC Oerlikon Corporation AG, Pfäffikon has either a direct or indirect interest exceeding 50 % of the shareholders’ voting rights, and companies over which control is assured through contractual arrangements are consolidated. Using the full consolidation method the assets, liabilities, income and expenses of these consolidated subsidiaries are included in their entirety.
Noncontrolling interests are recorded separately under equity in the consolidated financial statements. Group companies acquired or sold during the course of the financial year are included in or, respectively, eliminated from the consolidated financial statements as of the date of purchase or sale. All significant consolidated investments held are shown in the listing at the end of the notes.
Business combinations and goodwillThe equity consolidation follows the “acquisition method of accounting”. At the date of their initial consolidation, the identifiable assets acquired and liabilities assumed of subsidiaries are measured at fair value. Goodwill is measured at the acquisition date as the fair value of the consideration transferred less the net recognized assets. Goodwill denominated in foreign currencies is translated into Swiss francs at the rates prevailing at the balance sheet date. Goodwill is not amortized, but instead is tested annually for possible value impairment.
Translation of foreign currenciesThe accounts of foreign entities are prepared in the relevant functional currency and translated into Swiss francs in accordance with IAS 21. An entity’s functional currency is the currency of the primary economic environment in which the entity operates, or its local currency. In the consolidation, assets and liabilities of foreign subsidiaries are translated into Swiss francs at the exchange rate prevailing on the balance sheet date, while income, expenses and cash flows are translated using average rates for the year. Differences resulting from the application of different exchange rates are recognized in other comprehensive income. Exchange gains and losses, as recorded in the individual company accounts of subsidiaries, are included in the income statement. Excluded from this rule are specific longterm intercompany monetary items that form part of the net investment in a foreign subsidiary, whose exchange translation differences are recognized in other comprehensive income. In the year that a foreign entity is divested, the cumulative translation differences recorded in other comprehensive income are reclassified to the income statement as part of the gain or loss upon disposal.
Elimination of inter-company profitsProfits on intercompany sales not yet realized through sales to third parties, as well as profits on transfers of fixed assets and investments in subsidiaries, are eliminated.
Segment informationThe Segment reporting of the Oerlikon Group is in accordance with the “management approach” and based on the internal structure and reporting. The Executive Committee is an advisory body to the Chief Executive Officer (CEO). The CEO performs the function of the Chief Operating Decision Maker (CODM) and assesses performance and makes resource allocation decisions. The internal reporting to the Executive Committee and the Board of Directors is based on uniform Group accounting principles, which correspond to those used in the consolidated financial statements. Intersegment pricing is determined on an arm’s length basis.
Key figures Group Notes OC Oerlikon Corporation AG, Pfäffikon
Accounting principles

109
According to the internal Segment reporting, the Group consists of the following reportable Segments (which are partially an aggregation of operating segments):
– Textile Segment develops and manufactures textile machinery.– Drive Systems Segment manufactures gears and other components for
power transmission, mainly in motor vehicles.– Vacuum Segment develops application and customerspecific systems
for the creation of vacuums and extraction of processing gases.– Coating Segment supplies metal coatings that improve the performance
of tools and precision components, offering coating services at 90 centers worldwide.
– Advanced Technologies Segment develops applications and technologies, from which the highest precision and accuracy is required and mainly specializes in nanotechnology.
Assets
Cash and cash equivalents are placed with various financial institutions with topquality international ratings. Time deposits included therein mature in three months or less from the date of acquisition. Cash and cash equivalents are stated at nominal value.
Financial assets and derivative financial instruments: Marketable securities are held at fair values, with their values adjusted as required through the income statement. Gains or losses are measured by reference to fair value. Unquoted securities are valued by standard valuation methods, with value adjustments also through the income statement.
Regular way purchases or sales of financial assets are recognized at settlement date. Financial investments held to maturity as well as loans and receivables are carried at amortized cost using the effective interest method. Gains and losses from changes in the fair value of financial investments available for sale are temporarily recorded in other comprehensive income until such investments are sold or disposed of, at which time the gains or losses are transferred to the income statement. Any loss from value impairment is immediately recorded in the income statement.
Forward contracts and options are utilized systematically and mainly for the purpose of reducing businessrelated foreign currency and interest rate risks. These transactions are concluded with firstrate financial institutions and, as a general rule, have a term to maturity of up to 12 months. These derivative financial instruments are stated at fair value. If all requirements are fulfilled with regard to documentation, probability of occurrence, effectiveness and reliability of valuation, hedge accounting is applied in accordance with IAS 39. Until the hedged underlying business transactions are accounted for, the unrealized profits and losses resulting from the valuation of derivative financial instruments at fair value are recorded in other comprehensive income, with no impact on the income statement.
Trade receivables: Receivables are stated at the original invoiced amount less any necessary value adjustments for default risks. These risks are insured with third parties only in exceptional cases. Value adjustments are set at varying levels corresponding to risks recognized in the different Business Units.
Inventories: Inventories of raw materials, purchased components and trade merchandise are carried at the lower of cost or net realizable value, using FIFO and weighted average cost valuation methods. Selfmade components, work in progress and finished goods are carried at production cost. This includes all related material and labor costs, as well as a reason able allocation of indirect production costs. Recognizable reductions in value resulting from excess inventory, reduced replacement cost or sales price and similar are taken into account through appropriate writedowns of inventory items.
Investments in associated companies: Investments in associated companies (20 % to 50 % ownership of voting rights) are accounted for in accordance with IAS 28 (Accounting for Investments in Associates) using the equity method. The book value of the investment, initially its acquisition cost, is increased or reduced in response to the development in equity value of the associate, in proportion to the percentage held by the Oerlikon Group.
Property, plant and equipment: Tangible fixed assets are recorded at historical purchase or production costs, less necessary depreciation. Components of PP&E that have a differing useful life are recorded separately and depreciated accordingly (component approach). Depreciation is calculated on a straightline basis according to the expected useful life of the asset, as follows:IT hardware 3 – 7 yearsCompany cars 4 – 7 yearsTrucks and electric vehicles 5 – 10 yearsTechnical installations and machines 5 – 15 yearsOther operating and business equipment 3 – 15 yearsCentral building installations 10 – 25 yearsLeasehold improvements Duration of rental
contract (max. 20 years) or, if shorter, individual useful life
Plant and administrative buildings –used operationally 20 – 60 years
Estimated useful life and residual values are examined annually.
Fixed assets under financial leasing agreements are treated identically to fixed assets owned. Nonoperating properties that are classified as held for sale are measured at the lower of their carrying amount or fair value less costs to sell, less any impairment.
Major spare parts and servicing equipment qualify as property, plant and equipment when an entity expects to use them during more than one period.
Intangible assets: Intangible assets are identifiable nonmonetary assets without physical substance from which future economic benefits are expected to flow to the Group. Intangible assets are amortized on a straightline basis over their useful lives, where these can be clearly determined, for example software over two to three years or development costs over five years. In the case of intangible assets with indefinite useful lives, an impairment test of the asset value is conducted annually at the balance sheet date, or earlier on the occurrence of a triggering event.
Key figures Group Notes OC Oerlikon Corporation AG, Pfäffikon
Accounting principles

110
Liabilities
Current and non-current financial liabilities: Current and noncurrent financial liabilities are initially valued at fair value less directly attributable costs. Subsequent valuation is at amortized cost adjusted using the effec tive interest rate method. The financial liabilities consist mainly of the bond.
Current and non-current provisions: Provisions are set up if the future outflow of resources is more likely than not and can be estimated reliably, for obligations arising from past events. Other provisions represent uncertainties, for which a best estimate is made in arriving at the amount reserved. The value of provisions whose expected maturity exceeds one year is discounted at normal market rates.
Restructuring provisions: Provisions are established in cases where a detailed restructuring plan exists and the Group has informed those concerned, or the restructuring process has started.
Onerous customer contracts: Provisions are established when unavoidable estimated costs to fulfill a contract exceed the related contract revenues. The difference is provided against income in the current period. When accounts are prepared, the related risks are reassessed systematically by all Business Units and all costs are adjusted as required. This reassessment is based on the socalled “most likely outcome”, which uses assumptions regarding technical feasibility and timely realization of the projects and includes a quantification of the risks. The actual future obligation can vary from these estimates.
Warranty provisions: Provisions are established for known customer claims and also for potential warranty exposure.
Product liability: Provisions are established for known claims; potential exposure is not provided for.
Provisions for pensions and other post-employment benefits: The net obligation for defined benefit and other postretirement benefit plans has been calculated for each plan according to IAS 19 using the projected unit credit method as of the balance sheet date. The way these benefits are provided varies according to the legal, fiscal and economic conditions of each country, the benefits generally being based on the employees’ remuneration and years of service. The obligations relate both to existing retirees’ pensions and to pension entitlements of future retirees. Actuarial gains and losses from defined benefit plans and deductions in connection with asset limitation are recognized in other comprehensive income, so they have no impact on the income statement, and are presented in the consolidated statement of comprehensive income.
Service costs for pensions and other postretirement obligations are recognized as an expense in the operating result, while interest costs and the expected return on plan assets recognized as components of net periodic pension costs are included in net financial income/expense in the consolidated statement of income.
The Group obligations for contributions to defined contribution plans are recognized as expense in the operating result as incurred.
Treasury shares: Treasury shares are shown as a reduction of shareholders’ equity. Gains or losses arising from the sale of treasury shares are also shown in the consolidated statement of changes in equity, in retained earnings.
Income Statement
Sales of goods and services: Sales of goods and services are recognized when the transaction occurs, when the amounts involved are reliably known and when it is considered likely that the related economic benefit will flow to the Oerlikon Group. Sales are booked net of credits for returns and rebates at such time as the risk and reward of ownership of the goods passes to the customer.
Longterm contracts are accounted for under the “Percentage of Completion” (POC) method. In the Textile Segment the percentage of completion is determined by measuring costs incurred to date as a proportion of extrapolated total contract cost (cost to cost method).
Revenues from services that have been rendered are recorded in the income statement, according to the level of completion at the balance sheet date.
Research and development: Development costs are recognized as intangible assets if they meet the criteria for such recognition set forth in IAS 38. The cost capitalized comprises all costs directly attributable to the development process. After the development phase is complete, the asset is amortized over its estimated useful life, usually five years.
Other income and expenses: Other income consists of income from real estate, investments, licences, patents and nonoperating assets. Other expense consists of nonoperating expenses and taxes not based on income.
Financial expenses: Interest expense is charged to the income statement without restriction. In principle, borrowing costs are recognized in the income statement by using the effective interest rate method. Borrowing costs which can be directly allocated to the construction, buildup or purchase of a qualified asset are capitalized through the costs of the assets.
Current income taxes: Current income taxes are accrued on the basis of income reported locally for the financial year by the individual Group companies in keeping with the current year taxation principle. The valuation of assets and liabilities pertaining to both current and deferred taxation calls for extensive use of judgement and estimation.
Deferred taxes: Wherever local company tax values differ from Group values (temporary differences), deferred taxes are determined and recorded by applying tax rates enacted or substantially enacted at the balance sheet date to the differences (balance sheet liability method). Taxes on dividends from subsidiaries are only accrued when distributions are contemplated. The value of deferred tax assets deriving from tax losses carried forward is subject to annual review. Tax losses are only recognized as assets if they are expected to be realized within the next five years, by offset against taxable profits of Group companies individually or in tax groups. In countries or companies where realization of the losses cannot be foreseen, no asset is recognized. Management believes that its estimates are appropriate and that uncertainties in the valuation of tax assets and liabilities have been appropriately addressed. Deferred tax is not recognized for: a) temporary differences on the initial recognition of assets or liabilities in a transaction that is not a business combination, and that affects neither accounting profit nor taxable profit or loss; b) temporary differences related to investments in subsidiaries to the extent that it is probable that they will not reverse in the foreseeable future; and c) taxable temporary differences arising on the initial recognition of goodwill.
Earnings per share: Earnings per share (EPS) is based on the portion of consolidated net profit/loss attributable to shareholders of OC Oerlikon Corporation AG, Pfäffikon divided by the weighted average number of shares outstanding during the reporting period. Fully diluted earnings per share take into account additionally all potential equity securities that could have come into existence as the result of an exercise of option rights.
Key figures Group Notes OC Oerlikon Corporation AG, Pfäffikon
Accounting principles

111
Discontinued operations and assets and liabilities classified as held for sale
A component of the Group is reclassified into “discontinued operations” if its divestment is intended and if it fulfils the criteria for being classified as “held for sale” and for being presented as discontinued operations. Noncurrent assets held for sale are carried at the lower of their carrying amount or fair value less cost to sell, and any value impairments are recognized in the income statement. Depreciation of noncurrent assets ceases when the respective qualification as assets held for sale is met.
All disclosures in the notes to the consolidated financial statements refer to continuing operations, except where otherwise indicated.
Risks
Financial risk management/financial instruments: Due to its international activities, the Group is exposed to various financial risks, such as foreign exchange risk, interest rate risk, pricing risk, credit risk and liquidity risk. The Group’s financial risk management aims to limit any adverse effects that the markets may have on the Group’s financial health, at an acceptable hedging cost. Risk limitation does not mean complete exclusion of financial risks, rather it means following a policy of economically sensible management of the Group’s finances within an agreed framework of documented authority. The Group uses derivative financial instruments to hedge certain risks. Only preapproved instruments are used, and as a fundamental rule, no speculative transactions are conducted in the areas of foreign exchange or interest rates. No hedges are entered into without a correspond ing base transaction. Management monitors and steers such risks continuously with the support of Group Treasury, who identifies and evaluates all financial risks, working with the Group’s operating companies and hedging the risks as appropriate. The Group has documented guide lines for financial risk management, covering the use of derivative and nonderivative financial instruments and policies for use of surplus funds.
Foreign exchange risks: Risks related to fluctuations in foreign currencies are in certain instances hedged at Group level (refer to Note 21 “Foreign exchange risks”)
Interest rate risks: Risks related to fluctuations in interest rates are monitored by Group Treasury and in certain instances hedged at Group lev el (refer to Note 21 “Interest rate risk”).
Credit risks: Risks of financial loss if a customer or counterparty to a financial instrument fails to meet its contractual obligations is monitored locally by the individual Group companies (refer to Note 20 “Credit risk”).
Liquidity risks: the Oerlikon Group supervises and manages the Group’s liquidity centrally to ensure that outstanding financial liabilities can at all times be met within their maturity period and at an acceptable financing cost (refer to Note 19 “Liquidity risk”).
Contingent liabilitiesContingent liabilities represent potential obligations whose impact depends on the occurrence of one or more future events which cannot be influenced. Contingent liabilities are also existing obligations which are not expected to result in a future outflow of benefits, or where the outflow of benefits cannot reliably be quantified.
Participation plans/share-based paymentsOC Oerlikon Corporation AG, Pfäffikon offers members of the Board of Directors and Executive Committee, as well as senior managers, options to purchase shares of the company under various participation plans. The fair value is determined on the day such sharebased remuneration is granted and charged to the income statement on a straightline basis over the vesting period as personnel expense, with a corresponding increase in equity (equity settled plans). For cashsettled plans, a liability is recorded, which is measured at fair value at each reporting date with any movements in fair value being recorded as personnel expense.
Related-party transactionsMembers of the Board of Directors or Executive Committee, significant shareholders and companies controlled or jointly controlled by any of those individuals as well as postemployment benefit plans of the Group are deemed to be related parties.
Key figures Group Notes OC Oerlikon Corporation AG, Pfäffikon
Accounting principles
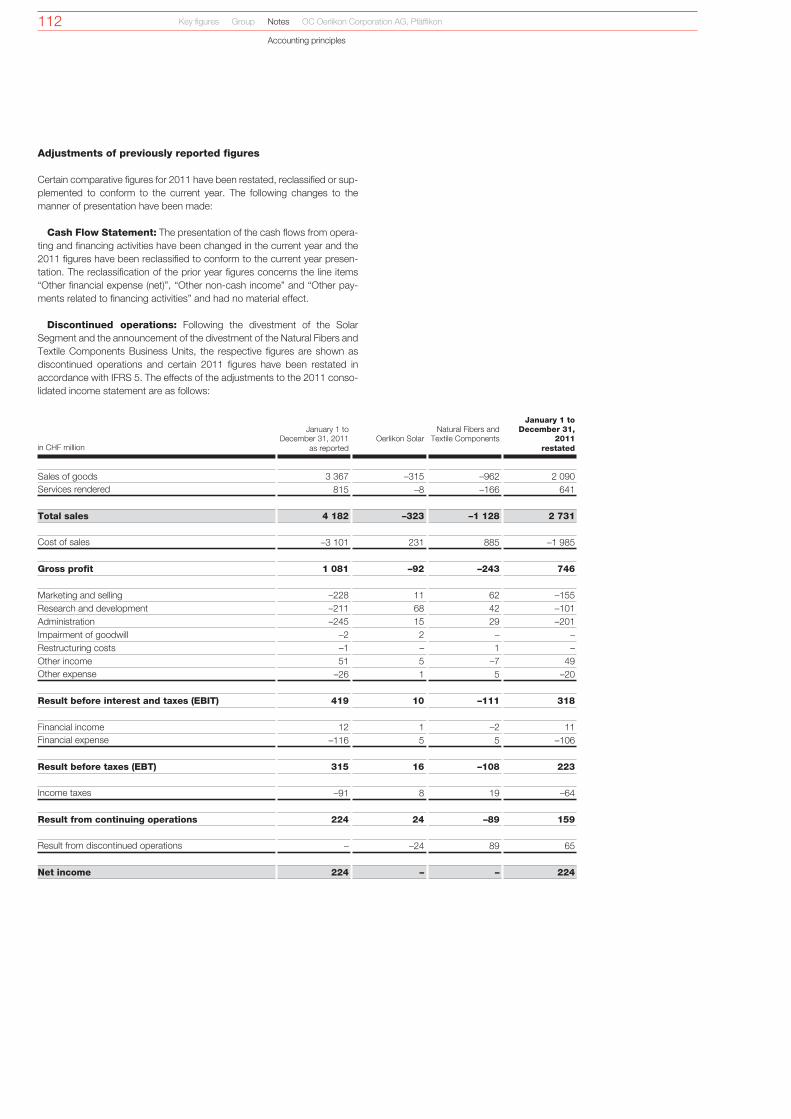
112 Key figures Group Notes OC Oerlikon Corporation AG, Pfäffikon
Accounting principles
Adjustments of previously reported figures
Certain comparative figures for 2011 have been restated, reclassified or supplemented to conform to the current year. The following changes to the manner of presentation have been made:
Cash Flow Statement: The presentation of the cash flows from operating and financing activities have been changed in the current year and the 2011 figures have been reclassified to conform to the current year presentation. The reclassification of the prior year figures concerns the line items “Other financial expense (net)”, “Other noncash income” and “Other payments related to financing activities” and had no material effect.
Discontinued operations: Following the divestment of the Solar Segment and the announcement of the divestment of the Natural Fibers and Textile Components Business Units, the respective figures are shown as discontinued operations and certain 2011 figures have been restated in accordance with IFRS 5. The effects of the adjustments to the 2011 consolidated income statement are as follows:
January 1 to December 31, 2011 Oerlikon Solar
Natural Fibers and Textile Components
January 1 to December 31,
2011 in CHF million as reported restated
Sales of goods 3 367 –315 –962 2 090Services rendered 815 –8 –166 641
Total sales 4 182 –323 –1 128 2 731
Cost of sales –3 101 231 885 –1 985
Gross profit 1 081 –92 –243 746
Marketing and selling –228 11 62 –155Research and development –211 68 42 –101Administration –245 15 29 –201Impairment of goodwill –2 2 – –Restructuring costs –1 – 1 –Other income 51 5 –7 49Other expense –26 1 5 –20
Result before interest and taxes (EBIT) 419 10 –111 318
Financial income 12 1 –2 11Financial expense –116 5 5 –106
Result before taxes (EBT) 315 16 –108 223
Income taxes –91 8 19 –64
Result from continuing operations 224 24 –89 159
Result from discontinued operations – –24 89 65
Net income 224 – – 224

113
Changes in scope of consolidation and Group structure Note 1
During the financial year 2012, the following changes in scope of consolidation have occurred:
Acquisition of non-controlling interest– On January 25, 2012, the Group purchased the noncontrolling interest in Oerlikon Fibrevision Ltd, increasing the ownership to 100 %.
Divestments– On March 2, 2012, Oerlikon Group agreed to sell the segment Oerlikon Solar. The transaction was closed on November 26, 2012. The
following companies were sold as part of this transaction: Oerlikon Solar Holding AG, Oerlikon Solar AG, Oerlikon Mechatronics AG, Oerlikon SolarLab SA, Oerlikon Solar IP AG, Oerlikon Solar USA Inc., Oerlikon Laser Systems GmbH, Oerlikon Solar Taiwan Ltd., Oerlikon Solar Singapore Pte. Ltd., Oerlikon Solar (Shanghai) Trading Co. Ltd., OOO Oerlikon Rus. Refer to Note 2 for details.
– On June 29, 2012, the Textile Segment’s Melco business was sold.– On December 3, 2012, Oerlikon Group announced the divestment of its Natural Fibers and Textile Components Business Units.
The transaction has not yet closed as per December 31, 2012. Refer to Note 2 for details.
Mergers– On January 1, 2012, Oerlikon Optics USA Inc. was merged into Oerlikon Management USA Inc.– On June 19, 2012, Saurer Financing LP was merged into Saurer AG.– On November 26, 2012, Barmag Liegenschaften GmbH & Co. KG was merged into W. Reiners VerwaltungsGmbH.
Liquidations and foundations– On January 12, 2012, Oerlikon SEA Pte. Ltd. and on April 5, 2012, Oerlikon Textile Components Far East Ltd. were liquidated.– As of May 23, 2012, Oerlikon Balzers Coating Malaysia Sdn. Bhd. was founded.
Notes to the consolidated financial statements
Key figures Group Notes OC Oerlikon Corporation AG, Pfäffikon
Notes to the consolidated financial statements

114
Discontinued operations and assets and liabilities classified as held for sale Note 2
Divestment of the Solar SegmentOn March 2, 2012, the Oerlikon Group agreed the terms of a divestment of its Solar Segment to a leading global supplier of semiconductor production equipment, Tokyo Electron Limited (TEL) of Japan. The transaction closed on November 26, 2012. The segment was not a discontinued operation or classified as held for sale as of December 31, 2011, and the comparative consolidated statement of comprehensive income has been represented to show the discontinued operation separately from continuing operations. In connection with this divestment, Oerlikon has assumed specifically restricted representations for disclosure of claims with a notification duration which lapses in 2013. Based on estimates and assumptions made by management, neither a provision is recorded nor a contingent liability is disclosed as of December 31, 2012.
Divestment of the Natural Fibers and Textile Components Business UnitsOn December 3, 2012, the Oerlikon Group signed an agreement with the Jinsheng Group of China to divest the Natural Fibers and Textile Components Business Units from its Textile Segment. For nonoccurrence of closing by either party, a breakup fee of CHF 20 million is agreed as a contractual penalty. The amount was paid into a deposit account in February 2013. The closing of the sale is expected in the second quarter of 2013, subject to merger control approvals. Consequently, the Natural Fibers and Textile Components Business Units are presented as a disposal group held for sale. On December 31, 2012, the disposal group comprised assets of CHF 713 million less liabilities of CHF 239 million. Cumulative exchange differences relating to foreign operations to be disposed of previously recognized in other comprehensive income, will be reclassified to the income statement on disposal of the Business Units, i.e. when control of the subsidiaries is lost. On December 31, 2012, the cumulative exchange differences concerned were negative (CHF –117 million) and, therefore, management assumes that a loss will be reclassified from other comprehensive income to the income statement on disposal. There is no other cumulative income or expense included in other comprehensive income relating to the disposal group. The disposal group was not a discontinued operation or classified as held for sale as of December 31, 2011, and the comparative consolidated statement of comprehensive income has been represented to show the discontinued operation separately from continuing operations. In connection with this divestment, Oerlikon has assumed certain customary obligations like warranty obligations and indemnifications. The indemnification obligations cover in particular employment, intellectual property and environmentrelated topics. The duration and overall liability caps for these indemnifications vary, but are customary for transactions of this nature. Based on estimates and assumptions made by management, neither a provision is recorded nor a contingent liability is disclosed as of December 31, 2012.
Divestment of property in GermanyFollowing the commitment of Oerlikon Group in December 2012 to sell a property in Germany, the respective assets amounting to CHF 24 million have been classified as held for sale. The sale was finalized in January 2013.
Result of discontinued operations
January 1 to December 31, 2012 January 1 to December 31, 2011
in CHF million Solar
Natural Fibers and Textile
Components Total Solar
Natural Fibers and Textile
Components Total
Sales 51 956 1 007 323 1 128 1 451
Total expenses –145 –894 –1 039 –339 –1 020 –1 359
Result before taxes (EBT) from operating activities
–94
62
–32
–16
108
92
Income taxes –5 –8 –13 –8 –19 –27
Result from operating activities –99 54 –45 –24 89 65
Gain on sale of discontinued operations 207 – 207 – – –Income tax on sale of discontinued operations – – – – – –
Net result from discontinued operations 108 54 162 –24 89 65
Attributable to:Shareholders of the parent 108 55 163 –24 88 64 Noncontrolling interest – –1 –1 – 1 1
Earnings per share in CHF 0.33 0.17 0.50 –0.07 0.27 0.20 Fully diluted earnings share in CHF 0.32 0.17 0.49 –0.07 0.27 0.20
Cash flows from discontinued operations
January 1 to December 31, 2012 January 1 to December 31, 2011
in CHF million Solar
Natural Fibers and Textile
Components Total Solar
Natural Fibers and Textile
Components Total
Cash flow from operating activities 3 131 134 –57 70 13 Cash flow from investing activities –9 –5 –14 –22 –13 –35 Cash flow from financing activities 50 –9 41 82 –4 78 Net cash flows from discontinued operations 44 117 161 3 53 56
Key figures Group Notes OC Oerlikon Corporation AG, Pfäffikon
Notes to the consolidated financial statements

115
Effect of disposal of the Solar Segment on the financial position
in CHF million 2012
Cash and cash equivalents –65 Trade and other receivables –38 Prepaid expenses and accrued income –3 Inventories –16 Noncurrent financial investments –7 Property, plant and equipment –78 Intangible assets –19 Trade and other payables 22 Accrued liabilities 26 Current customer advances 54 Other current provisions 22 Deferred tax liabilities 7 Noncurrent postemployment benefit provisions 11 Net assets and liabilities –84
Consideration received (cash and cash equivalents) 296 Cash and cash equivalents disposed of –65 Net cash inflow 231
The reclassification of foreign currency differences previously recorded in other comprehensive income amounts to CHF 7 million.
Disposal group classified as held for sale
The assets and liabilities of the disposal group classified as held for sale are measured at the lower of their carrying amount and fair value less cost to sell, and presented separately in the balance sheet. No losses on remeasurement have been incurred.
At December 31, 2012, the following assets and liabilities have been classified as held for sale:
Assets classified as held for sale
in CHF million 2012
Cash and cash equivalents 22Current financial investments and derivatives 2Trade receivables 137Other receivables 13Current tax receivables 2Inventories 125Prepaid expenses and accrued income 2Loans and other noncurrent financial receivables 2Noncurrent financial investments 3Property, plant and equipment 1 137Intangible assets 281Postemployment benefit assets 8Deferred tax assets 3Total assets classified as held for sale 737
1 Includes CHF 24 million related to the proposed sale of the property in Germany (refer to “Divestment of property in Germany”)
Liabilities classified as held for sale
in CHF million 2012
Trade payables 104Other current liabilities 12Accrued liabilities 27Current customer advances 38Current income taxes payable 3Other current provisions 16Noncurrent postemployment benefit provisions 34Deferred tax liabilities 3Other noncurrent provisions 2Total liabilities classified as held for sale 239
Discontinued operations and assets and liabilities classified as held for sale Note 2 (cont.)
Key figures Group Notes OC Oerlikon Corporation AG, Pfäffikon
Notes to the consolidated financial statements

116
Other income and expense Note 3
in CHF million 2012 2011 restated
Licensing, patent and knowhow income 2 3 Rental income from nonoperating real estate 13 13 Gain on sale of nonoperating real estate 1 8 Other income 1 61 25
Other income 77 49
Taxes not based on income –4 –6 Impairment of property, plant and equipment and intangible assets – –6 Other expense –5 –8
Other expense –9 –20
Other income, net 68 29
1 Other income for the financial year 2012 includes the gain on sale of Oerlikon Group’s property in Arbon, Switzerland, amounting to CHF 39 million.
Key figures Group Notes OC Oerlikon Corporation AG, Pfäffikon
Notes to the consolidated financial statements

117Key figures Group Notes OC Oerlikon Corporation AG, Pfäffikon
Notes to the consolidated financial statements
Expenses included in EBIT Note 4
in CHF million 2012 2011 restated
Personnel expense
Salaries and wages 595 566Social security and other employee benefits 1 170 174
Total 765 740
Depreciation and amortization
– operating property, plant and equipment 105 104of which in:Cost of sales 82 84Marketing and selling 1 1Research and development 5 5Administration 17 14
– intangible assets 21 22of which in:Cost of sales – –Marketing and selling 2 2Research and development 16 15Administration 3 5
Total 126 126
1 Included in the CHF 170 million expense for social security and other benefits is CHF 32 million (previous year: CHF 26 million), attributable to specific postemployment benefit plans of the individual companies. The remainder includes the legally required benefit contributions of Group companies, as well as other social security expenses.

118
Financial income and expense Note 5
in CHF million 2012 2011 restated
Interest income 5 6Other financial income 1 32 5Net gain on hedging transactions recognized in the income statement 14 –
Financial income 51 11
Interest on financial debt 2 –41 –65Interest on provisions for postemployment benefit plans –17 –11Other financial expense 3 –67 –22Foreign currency loss, net –13 –8
Financial expense –138 –106
Total –87 –95
1 Other financial income for the financial year 2012 includes the gain from the sale of a financial investment.
2 The total interest expense amounted to CHF 70 million (previous year: CHF 77 million), which is included in interest on financial debt and other financial expense.
3 Other financial expense for the financial year 2012 includes onetime charges amounting to CHF 47 million, in connection with the replacement of the old Syndicated Credit Facility.
Key figures Group Notes OC Oerlikon Corporation AG, Pfäffikon
Notes to the consolidated financial statements

119Key figures Group Notes OC Oerlikon Corporation AG, Pfäffikon
Notes to the consolidated financial statements
Income taxes Note 6
2012 2011
in CHF millionContinuing operations
Discontinued operations Total Total
Current income tax expense –92 –6 –98 –78Deferred tax expense –19 –7 –26 –13
Total –124 –91
Analysis of tax expense
in CHF million 2012 2011
Result before taxes from continuing operations 334 223Result before taxes from discontinued operations, including gain on sale 175 92Total 509 315
Tax expense from continuing operations –111 –64Tax expense from discontinued operations –13 –27Total –124 –91
Expected tax expense 1 –135 –86
Difference between actual and expected tax expense 11 –5
The difference between the tax expense calculated using the weighted average tax rate of Oerlikon Group (expected tax expense) of 26.4 % (previous year: 27.4 %) and the effective tax expense arises from the following factors:
Nontaxable income and expenses 34 1Unrecognized deferred taxes on currentyear losses –27 –12Nonrefundable withholding tax –16 –9Utilization of unrecognized tax loss carry forwards from previous periods 7 3Income tax from prior periods 14 –1Recognition of previously not recognized tax losses 4 8Other effects –5 5
11 –5
1 The expected tax expense is calculated from the various profits and losses of the individual group companies, using local tax rates. From these a composite tax rate is developed, averaged over the whole Group.

120 Key figures Group Notes OC Oerlikon Corporation AG, Pfäffikon
Notes to the consolidated financial statements
Deferred taxes Note 6 (cont.)
Composition of deferred taxes 2012 2011
Deferred tax balances Deferred tax balances
in CHF million Assets Liabilities Assets Liabilities
Trade accounts receivable 4 1 4 2Other receivables and accruals 1 12 2 26Inventories 42 2 44 1Financial assets 1 6 1 1Property, plant and equipment 18 46 20 54Assets classified as held for sale –3 –3 – –Intangible assets 2 115 3 111
Assets 65 179 74 195
Trade accounts payable 1 – – –Other current and longterm liabilities 11 15 11 18Financial liabilities 3 – 7 1Provisions 112 7 97 4
Liabilities 127 22 115 23
Deferred tax asset from recognized tax loss carry forwards 1 49 – 67 –Netting –128 –128 –145 –145
Total 113 73 111 73
1 In 2012, tax loss carry forwards of CHF 296 million for federal taxes and CHF 70 million for state/local taxes were recognized (previous year: CHF 380 million for federal taxes and CHF 128 million for state/local taxes).
Movement in deferred tax balances during the year
2012
in CHF million
Balance at January 1,
2012Recognized in the income statement
Recognized in other comprehen-
sive income Other 1
Balance at December 31,
2012
Total 38 –26 21 7 40
1 Effect of disposal of the Solar Segment on the financial position (see Note 2).
2011
in CHF million
Balance at January 1,
2011Recognized in the income statement
Recognized in other comprehensive
income Other
Balance at December 31,
2011
Total 36 –13 14 1 38
Limitation of utilization of tax loss carry forwards
in CHF million
Tax losses not recognized as
deferred tax assetsTotal tax loss
carry forwards
federal tax state / local tax federal tax state / local tax
1 year 5 3 9 52 years 4 4 5 43 years 1 13 14 134 years 14 15 130 155 years 55 22 85 22over 5 years 384 335 515 403
Total 463 392 758 462
Compared to previous year, tax loss carry forwards not recognized decreased by CHF 51 million for federal taxes and CHF 21 million for state/local taxes. On the one hand, the reason is that the tax loss carry forwards of the Solar Segment cannot be considered anymore, and on the other hand, that the forfeiture of certain tax loss carry forwards could be avoided. These additional tax loss carry forwards are only partially recognizable.
The deferred tax on unrecognized tax loss carry forwards would amount to CHF 103 million in 2012 (previous year: CHF 90 million).

121Key figures Group Notes OC Oerlikon Corporation AG, Pfäffikon
Notes to the consolidated financial statements
Cash and cash equivalents Note 8
in CHF million 2012 2011
Cash, postal and bank current accounts 469 584Time deposits 169 158
Total 638 742
CHF 189 million (previous year: CHF 214 million) of total cash and cash equivalents are held in countries in which prior approval is required to transfer funds abroad. Nevertheless, if the Group complies with these requirements, such liquid funds are at its disposal within a reasonable period of time.
Cash and cash equivalents are held in the following currencies:
Currencyin CHF million 2012 2011
CHF 207 265EUR 185 188USD 70 81CNY 120 153Other 56 55
Total 638 742
Earnings per share Note 7
Earnings per share of CHF 1.18 have been calculated on the basis of a net profit of CHF 382 million, attributable to shareholders (previous year: CHF 220 million), and the average weighted number of outstanding shares (issued shares less treasury shares). In 2012, the average weighted number of shares entitled to vote and receive dividends amounted to 323 700 961 (previous year: 322 718 881). Diluted earn ings per share amounted to CHF 1.16. The average weighted number of shares used in the calculation of diluted earnings per share amounted to 328 200 827 (previous year: 322 718 881).
Number of outstanding shares 2012 2011
Total shares issued at yearend 325 964 498 323 124 010Weighted average number of shares outstanding for the year 323 700 961 322 718 881Effect of potential exercise of option rights 4 499 866 –Weighted average number of shares diluted for the year 328 200 827 322 718 881

122
Financial investments Note 9
in CHF million 2012 2011
Current 1 5 5Noncurrent – –
Financial assets, carried at fair value 5 5
Current – –Noncurrent 2 4 39
Financial assets, carried at cost 4 39
Current 11 3Noncurrent – –
Derivatives used for hedging 3 11 3
Total current financial investments and derivatives 16 8Total noncurrent financial investments 4 39
Total 20 47
1 Financial assets carried at fair value include marketable securities held as funding for the provision for partial retirement. 2 Noncurrent financial investments include several small investments, which are not publicly traded and for which no financial information is available. These investments are held at cost. Currently, Oerlikon has no intention to sell these investments. On April 16, 2012, Oerlikon Group has sold its 13.97 % minority stake in Pilatus Flugzeugwerke AG.
3 Valued at forward rates.
Loans and receivables Note 10
in CHF million 2012 2011
Current Trade receivables 419 577Trade notes receivable 55 58Other receivables 1 89 234
Non-current Loans and other noncurrent financial receivables 6 8
Total 569 877
1 Other receivables include: – Receivables from Swiss and foreign tax authorities (VAT) and insurance companies. – Accrued sales under the POC method for orders which are not completely prefinanced by customer advances.
Key figures Group Notes OC Oerlikon Corporation AG, Pfäffikon
Notes to the consolidated financial statements

123Key figures Group Notes OC Oerlikon Corporation AG, Pfäffikon
Notes to the consolidated financial statements
Inventories Note 11
2012 2011
in CHF million Gross valueValue
adjustment Net value Gross valueValue
adjustment Net value
Raw material and components 172 –28 144 298 –54 244Work in progress 143 –7 136 176 –17 159Finished goods 64 –7 57 113 –15 98Trade merchandise 62 –11 51 110 –29 81
Total 441 –53 388 697 –115 582
Amounts charged to the income statement for writedowns of inventories in the reporting year were CHF 7 million (previous year restated: CHF 7 million).
Construction contracts according to the percentage of completion method (POC)The accrued sales under the POC method pertain to customer orders in the Textile Segment, summarized as follows:
in CHF million 2012 2011
POC sales recognized as revenue in the period 1 610 477
Aggregate contract costs incurred and recognized contract profits to date 1 80 120
Gross amount due from customers for contract work as an asset 18 138
Net amount of customer advances for POC projects 2 68 121
1 2011 restated. 2 This amount is included in the current customer advances totaling CHF 449 million (previous year: CHF 470 million).

124
Property, plant and equipment Note 12
in CHF million
Plant, equipment
and furniture
Production and
administration buildings
Developed land
Facilities under
construction 2012 Total
CostBalance at January 1, 2012 1 369 598 94 42 2 103 Conversion differences –21 –6 –2 – –29 Changes in the scope of consolidated companies – – – – –Additions 89 4 – 82 175 Disposals –27 –12 –2 –2 –43 Reclassifications to assets held for sale –288 –181 –15 –5 –489 Transfers 53 22 – –75 –
Balance at December 31, 2012 1 175 425 75 42 1 717
Accumulated depreciationand impairment lossesBalance at January 1, 2012 –903 –285 – – –1 188 Conversion differences 12 3 – – 15 Changes in the scope of consolidated companies – – – – –Depreciation –106 –17 – – –123 Impairment losses – – – – –Disposals 21 2 – – 23 Reclassifications to assets held for sale 189 85 – – 274 Transfers – – – – –
Balance at December 31, 2012 –787 –212 – – –999
Net Group values at December 31, 2011 466 313 94 42 915 Net Group values at December 31, 2012 388 213 75 42 718
Of which assets held under finance leases 1 2 – – 3 Insured values in event of fire 1 876 976 – 10 2 862
Open purchase commitments for property, plant and equipment at the end of 2012 amounted to CHF 14 million (previous year: CHF 12 million).
Key figures Group Notes OC Oerlikon Corporation AG, Pfäffikon
Notes to the consolidated financial statements

125Key figures Group Notes OC Oerlikon Corporation AG, Pfäffikon
Notes to the consolidated financial statements
Property, plant and equipment Note 12 (cont.)
in CHF million
Plant, equipment
and furniture
Production and
administration buildings
Developed land
Facilities under
construction 2011 Total
CostBalance at January 1, 2011 1 305 603 95 36 2 039 Conversion differences –24 –3 –1 –1 –29 Changes in the scope of consolidated companies – –1 – – –1 Additions 82 2 1 56 141 Disposals –41 –5 –1 – –47 Transfers 47 2 – –49 –
Balance at December 31, 2011 1 369 598 94 42 2 103
Accumulated depreciationand impairment lossesBalance at January 1, 2011 –834 –263 – – –1 097 Conversion differences 15 1 – – 16 Changes in the scope of consolidated companies – – – – –Depreciation –116 –21 – – –137 Impairment losses –1 –6 – – –7 Disposals 33 4 – – 37 Transfers – – – – –
Balance at December 31, 2011 –903 –285 – – –1 188
Net Group values at December 31, 2010 471 340 95 36 942 Net Group values at December 31, 2011 466 313 94 42 915
Of which assets held under finance leases 1 2 – – 3 Insured values in event of fire 2 340 1 287 1 7 3 635

126
Intangible assets Note 13
in CHF million Goodwill Software
Technology and
Development costs 1
Other intangible
assets 2 2012 Total
CostBalance at January 1, 2012 1 204 43 142 463 1 852 Conversion differences –15 – –1 –2 –18 Additions – 2 15 – 17 Disposals – –2 – 1 –1 Reclassifications to assets held for sale –264 –3 –60 –179 –506
Balance at December 31, 2012 925 40 96 283 1 344
Accumulated amortizationand impairment lossesBalance at January 1, 2012 –398 –34 –61 –98 –591 Conversion differences 3 – 1 – 4 Amortization – –3 –18 –7 –28 Impairment losses – – – – –Disposals – 2 1 – 3 Reclassifications to assets held for sale 133 3 26 44 206
Balance at December 31, 2012 –262 –32 –51 –61 –406
Net Group values at December 31, 2011 806 9 81 365 1 261 Net Group values at December 31, 2012 663 8 45 222 938
1 Additions to capitalized development costs are costs incurred in internal development projects and acquired technology. Development costs are recognized as intangible assets if they meet the criteria for such recognition set forth in IAS 38. After the development phase is complete, the asset is amortized over five years.
2 Other intangible assets include brands of CHF 207 million (previous year: CHF 339 million) with indefinite useful life.
The capitalized development costs pertain to the Segments as follows:
Capitalized development costs for the period
in CHF million 2012 2011 1
Textile Segment 3 6 Vacuum Segment 5 5 Solar Segment – 4 Coating Segment 5 6 Advanced Technologies Segment 2 3
Total 15 24
1 Total includes CHF 8 million related to discontinued operations.
Key figures Group Notes OC Oerlikon Corporation AG, Pfäffikon
Notes to the consolidated financial statements

127Key figures Group Notes OC Oerlikon Corporation AG, Pfäffikon
Notes to the consolidated financial statements
Intangible assets Note 13 (cont.)
Goodwill and brands are attributed to the Segments as follows:
Goodwill and brands 20122011
represented 20122011
representedin CHF million Goodwill Brands
Textile Segment 114 248 136 267 Manmade Fibers 114 115 136 137 Natural Fibers 1 – 54 – 127 Textile Components 1 – 79 – 3 Drive Systems Segment 485 494 71 72 Coating Segment 26 26 – –Advanced Technologies Segment 38 38 – –
Total 663 806 207 339
1 On December 3, 2012, the Oerlikon Group signed an agreement with the Jinsheng Group of China to divest the Natural Fibers and Textile Components Business Units from its Textile Segments. Consequently, the Natural Fibers and Textile Components Business Units are presented as a disposal group held for sale. Goodwill and brands of the Natural Fibers and Components Business Units have been reclassified to assets classified as held for sale, following the announcement of the planned divestment (refer to Note 2 for details). For the Natural Fibers Business Unit, goodwill amounting to CHF 54 million and brands amounting to CHF 127 million have been reclassified to assets classified as held for sale. For the Components Business Unit, goodwill amounting to CHF 79 million and brands amounting to CHF 3 million have been reclassified to assets classified as held for sale. Before reclassification to assets held for sale, impairment tests for goodwill and brands have been carried out for the Natural Fibers and Components Business Units. The impairment tests supported the carrying amounts of goodwill and brands for both Business Units and therefore, no need for impairment was identified.
Goodwill and other intangible assets with indefinite useful life are allocated to those cashgenerating units (CGUs) which are expected to benefit from the relevant business combination. The Business Units correspond to CGUs and are the lowest level at which goodwill is monitored by management. Goodwill and intangible assets with indefinite useful life are tested annually for possible impairment of value, using discounted cash flow analysis.
Effective January 1, 2012, the Textile Segment introduced a new organizational structure which reduced the number of Business Units from five to three. The new Manmade Fibers Business Unit comprises Oerlikon Barmag and Oerlikon Neumag, and the new Natural Fibers Business Unit consists of Oerlikon Schlafhorst and Oerlikon Saurer. The structure of the Textile Components Business Unit remained unaffected by the realignment. The attribution of goodwill and brands has been reclassified accordingly, and 2011 figures have been reclassified to conform with the new Business Unit structure.
As of January 1, 2012, the Business Units Graziano and Fairfield became fully integrated in the Drive Systems Segment. With this realigmnent, the global operations of these two Business Units are monitored and managed on a Segment level, including the review of financial information and the servicing of the global customer base. The attribution of goodwill and brands has been reclassified accordingly, and 2011 figures have been reclassified to conform with the new structure.
Asset values used in the impairment testing are based on net realizable values (fair value less costs to sell), and on the latest forecasts approved by management. The forecast period used for future cash flows covers the years 2013 to 2017. The discount rates used are based on the weighted average cost of capital (WACC), derived from peer groups adjusted to specific risks of the businesses concerned and the countries in which they operate. The capital costs were determined using the capital asset pricing model (CAPM).
The annual impairment tests carried out at Business Unit level supported the carrying amounts and therefore, no need for impairment was identified.
Detailed results of the impairment testing are presented below for the four goodwill items (Textile, Drive Systems, Coating and Advanced Technologies), representing 100 % of the net book value at December 31, 2012.
The following growth rates and pretax discount rates were used:
Growth rates and discount rates per Segment 2012 2011 2012 2011Growth rates 1 Discount rates
Textile Segment 2.0 % 1.0–2.0 % 10.5 % 9.8–11.2 %Drive Systems Segment 2.5 % 2.5 % 10.5 % 10.3–10.4 %Coating Segment 2.0 % 2.0 % 10.9 % 11.7 %Advanced Technologies Segment 2.0 % 2.0 % 9.6 % 9.7 %
1 For periods following the fiveyear plan period 2013 to 2017.
For the Business Units of the Textile Segment as well as for the Advanced Technologies and the Coating Segments, neither a reduction of the growth rate of the terminal value to 0.5 % (prior year: 1.0 %), nor an increase in the discount rate of 1.5 % (prior year: 0.5 %) would give rise to an impairment of goodwill.
For the Drive Systems Segment, neither a reduction of the growth rate of the terminal value to 0.5 % (prior year: 1.5 %), nor an increase in the discount rate of 1.5 % (prior year: 0.5 %) would give rise to an impairment of goodwill.

128
Intangible assets Note 13 (cont.)
Previous year
Goodwill Software
Technology and
Development costs
Other intangible
assets 2011 Total in CHF million
CostBalance at January 1, 2011 1 219 44 121 471 1 855Conversion differences –15 –1 –1 –5 –22Additions – 1 24 1 26Disposals – –1 –2 –4 –7Reclassifications to assets held for sale – – – – –
Balance at December 31, 2011 1 204 43 142 463 1 852
Accumulated amortizationand impairment lossesBalance at January 1, 2011 –403 –31 –41 –87 –562Conversion differences 7 – – – 7Amortization – –4 –20 –14 –38Impairment losses –2 – –2 – –4Disposals – 1 2 3 6Reclassifications to assets held for sale – – – – –
Balance at December 31, 2011 –398 –34 –61 –98 –591
Net Group values at December 31, 2010 816 13 80 384 1 293Net Group values at December 31, 2011 806 9 81 365 1 261
Key figures Group Notes OC Oerlikon Corporation AG, Pfäffikon
Notes to the consolidated financial statements
Post-employment benefit provisions Note 14
Due Duewithin beyond within beyond
in CHF million 2012 1 year 1 year 2011 1 year 1 year
Postemployment benefit provisions 549 23 526 539 26 513Other noncurrent employee benefit provisions 8 1 7 14 2 12Subtotal 557 24 533 553 28 525Postemployment benefit provisions classified as held for sale 30 – 30 – – –Other noncurrent employee benefit provisions classified as held for sale 4 – 4 – – –Total 591 24 567 553 28 525
Postemployment benefit provisions are related to the following plans:
2012 2011
in CHF million TotalDefined benefit
Defined contribution Total
Defined benefit
Defined contribution
Number of plansFunded plans 33 24 9 40 26 14Unfunded plans 25 25 – 27 27 –
Number of insured membersActive members 1 11 329 9 615 1 714 12 342 10 644 1 698Vested terminations 2 5 450 5 016 434 6 373 5 060 1 313Retired members 8 493 8 462 31 8 530 8 454 76
in CHF millionPension cost (operative) 32 24 8 26 23 3Pension cost (financial) 16 16 – 11 11 –
Total postemployment benefit plan cost 48 40 8 37 34 3
Postemployment benefit provisions 579 579 – 539 539 –Postemployment benefit assets 9 9 – – – –
1 In certain Group companies, members belong to multiple plans. 2 Former employees of a Group company with vested rights in a pension plan.

129Key figures Group Notes OC Oerlikon Corporation AG, Pfäffikon
Notes to the consolidated financial statements
Post-employment benefit provisions Note 14 (cont.)
Defined benefit plans 2012 2011
Funded Unfunded Funded Unfundedin CHF million Total Total
Projected benefit obligation (PBO) –1 178 –767 –411 –1 184 –812 –372Plan assets at market value 3 632 632 – 673 673 –
Assets below PBO –546 –135 –411 –511 –139 –372
Postemployment benefit provisions 579 168 411 539 167 372Postemployment benefit assets 4 9 9 – – – –
Unrecognized surplus 24 24 – 28 28 –of which:– past service costs – – – 2 2 –– unrecognized assets (effect of capitalization limit IAS
19.58(b)) 24 24 – 26 26 –
3 Plan assets include: 2012 2011
Equity instruments 195 31 % 173 26 %Bonds and other obligations 228 36 % 229 34 %Real estate 5 97 15 % 101 15 %Other 112 18 % 170 25 %
Total plan assets 632 100 % 673 100 %
4 The postemployment benefit asset relates mainly to an impending divestment and is shown as assets held for sale (see Note 2).5 Plan assets include real estate in Germany with a fair value of CHF 9 million (previous year: CHF 9 million); the property is rented by a Group company, with an annual rent of CHF 1 million (previous year: CHF 1 million).
Funded status and experience adjustments 2012 2011 2010 2009 2008
Projected benefit obligation (PBO) –1 178 –1 184 –1 158 –1 215 –1 335Plan assets at market value 632 673 682 730 861
Assets below PBO –546 –511 –476 –485 –474
Experience adjustments – to obligations (gains (–) / losses (+)) –11 9 12 –3 –7– to plan assets (gains (+) / losses (–)) 23 –28 7 14 –147

130 Key figures Group Notes OC Oerlikon Corporation AG, Pfäffikon
Notes to the consolidated financial statements
Post-employment benefit provisions Note 14 (cont.)
in CHF million 2012 2011
Plan assets at market value at January 1 673 682Expected return on plan assets 26 32Employee contributions 9 10Employer contributions 24 20Actuarial gains (+) / losses (–) 23 –28Amounts paid out –36 –42Changes in the scope of consolidated companies –84 –Conversion differences –3 –1
Plan assets at market value at December 31 632 673
Present value of projected benefit obligation (PBO) at January 1 1 184 1 158Service cost 33 33Interest cost 43 43Actuarial losses 89 28Amounts paid out –59 –68Changes in the scope of consolidated companies –102 –5Conversion differences –10 –5
Present value of projected benefit obligation (PBO) at December 31 1 178 1 184
Pension cost – defined benefit plansCurrent service cost –33 –33Employee contributions 9 10
Current service cost after deduction of employee contributions –24 –23
Current service cost after deduction of employee contributions –24 –23Interest cost –43 –43Expected return on plan assets 26 32Effect of plan mutations 1 –
Total pension cost – defined benefit plans 6 –40 –34
6 Pension costs of CHF 8 million are included in result of discontinued operations (2011: CHF 7 million).
Assumptions used in actuarial calculations 2012 2011
(weighted average rates)Discount rate 3.1 % 3.9 %Salary progression 2.1 % 2.1 %Benefit progression 0.8 % 0.7 %Return on plan assets 4.4 % 4.3 %
The expected return on funded plan assets is based on the longterm historical performance of the separate categories of plan assets for each funded pension plan. The calculation includes assumptions concerning expected income and realized or unrealized gains on plan assets. The expected return on plan assets included in the income statement is calculated by multiplying the expected rate of return by the fair value of plan assets. The difference between the expected return and the actual return in any twelvemonth period is an actuarial gain / loss, and is recorded directly in other comprehensive income. In 2012, the actual return on plan assets was CHF 49 million (previous year: CHF 4 million).
Actuarial losses recognized in other comprehensive income
in CHF million 2012 2011
Accumulated values at January 1 144 97Actuarial losses recognized during year 72 47Changes in the scope of consolidated companies –17 –Accumulated values at December 31 199 144Effect of capitalization limit IAS 19.58(b) 6 –9
The employer contributions for 2013 are expected to be approximately CHF 22 million (previous year: CHF 27 million).

131Key figures Group Notes OC Oerlikon Corporation AG, Pfäffikon
Notes to the consolidated financial statements
Liabilities Note 15
in CHF million Note 2012 2011
Current
Bank debts 2 1Trade payables 287 457Other payables, excluding derivatives 47 62
Total 336 520
Derivatives used for hedging 1 23
Total current financial liabilities 337 543
Non-current
Loans payable 19 3 830Financial leases 19 3 2Bond 19 298 –
Total non-current financial liabilities 304 832
Accrued liabilities Note 16
in CHF million 2012 2011
Accrued personnel costs 94 117Accrued material costs 44 70Other accrued liabilities 61 84
Total 199 271

132 Key figures Group Notes OC Oerlikon Corporation AG, Pfäffikon
Notes to the consolidated financial statements
Provisions Note 17
in CHF millionProduct
warrantiesOnerous
contracts 1 Restructuring 2Other
provisions 32012 Total
Balance at January 1, 2012 78 11 39 31 159Conversion differences –2 – – – –2Change in the scope of consolidated companies – – – – –Additions 27 1 3 6 37Amounts used –18 –1 –33 –3 –55Amounts reversed –13 –5 –3 –16 –37Reclassifications to liabilities held for sale –36 –3 –1 –3 –43Transfers – – – 2 2
Balance at December 31, 2012 36 3 5 17 61
Due within 1 year 36 1 5 15 57Due beyond 1 year 4 – 2 – 2 4
1 Provisions are made for cases where the costs of fulfilling contractual obligations (e.g. projects) are higher than their expected economic benefit. During the preparation of the financial statements, a systematic reassessment of the project risks was conducted and appropriate adjustments were made to the cost estimates for the projects underway in the individual Business Units. The basis for such was the socalled “most likely outcome”. This requires estimates to be made with regard to the technical and timerelated realization of those projects, and also includes a quantification of the relevant risks.
2 The restructuring provisions pertain to the Segments Vacuum (CHF 3 million) and Textile (CHF 2 million).3 Other provisions cover various risks which occur in the normal course of business. They consist mainly of provisions for pending litigation, technical risks and product anomalies.
4 For the longterm provisions, the cash outflow is assumed to be within the next two to three years.

133
Financial instruments Note 18
2012 2011Contract
volumeFair value Contract
volumeFair value
in CHF million positive negative positive negative
Forward exchange contracts 430 11 1 505 3 23
Interest-rate derivatives 600 – – 600 – –Interestrate swaps – – – – – –Interest caps 1 600 – – 600 – –
Total 1 030 11 1 1 105 3 23
Based on the Group’s business activities, the following main currencies are hedged: EURO and US dollar. Positive and negative changes in fair values of currency derivatives are offset by the corresponding gain or loss on the underlying hedged transactions. The maximum risk of counterparty nonperformance is equal to the positive deviation from fair value. In view of the reputation of the counterparties, this risk is deemed to be minimal. In principle, the maturities of currency and interestrate hedges correspond to the maturity of the underlying base transaction. If the maturity of the base transaction shifts, the maturity of the hedge contract will be shifted correspondingly (rollover / swaps). Thus, the cash flows deriving from the hedge contracts are synchronized with the impact of the base transaction in the income statement. The hedging transactions are first recorded in other comprehensive income, then recycled to the income statement when the base transaction is recorded. For this reason, there is no need for a separate presentation of the maturities of hedge contracts and their underlying transactions.
Maturity structure of open foreign exchange contracts and interestrate derivatives at December 31:
in CHF millionCarrying amount
Expected cash flows
6 months or less
6–12 months 1–2 years 2–5 years
more than 5 years
Forward exchange contracts2012 10 430 389 38 3 – –2011 –20 505 417 82 6 – –
1 As a hedge against the interest rate risk inherent in the interest rate of the syndicated loan, two interest caps were taken out in June 2010 for a nominal amount of CHF 600 million. The interest caps run to 2014, and over that period, they compensate for any excess of the 3monthCHFLIBOR over 2 % by paying out the difference.
Key figures Group Notes OC Oerlikon Corporation AG, Pfäffikon
Notes to the consolidated financial statements

134 Key figures Group Notes OC Oerlikon Corporation AG, Pfäffikon
Notes to the consolidated financial statements
Liquidity risk Note 19
Liquidity risk is the risk that Oerlikon may be unable to discharge its financial liabilities in a timely manner or at an acceptable cost. Oerlikon Group supervises and manages the Group’s liquidity centrally, in order to ensure that outstanding financial liabilities can at all times be met within their maturity period and at an acceptable financing cost. GroupTreasury prepares and provides the relevant decision support and arranges for the availability of the relevant funds, once approval is given.
Oerlikon’s liquidity is monitored using short, medium and longterm rolling liquidity forecasts, about which senior management are kept informed. On the basis of this plan, Oerlikon mobilizes the necessary liquid funds and takes any further steps necessary on a timely basis.
Terms and debt repayment schedule2012
in CHF millionCarrying amount
Contractual cash flow
within 1 year 1 to 5 years
more than 5 years
of which secured
Bank overdrafts 1 1 1 – – –Fixed advances 1 1 1 – – –Trade payables 287 287 287 – – –Loans and borrowings 1 299 364 17 347 – –Gross finance lease obligation 3 3 – – 3 –Accrued liabilities 98 98 98 – – –
Non-derivative financial liabilities 689 754 404 347 3 –
Forward exchange contracts used for hedging –10 430 427 3 – –– thereof: for hedging fxoutflows –10 117 115 2 – –– thereof: for hedging fxinflows – 313 312 1 – –
Derivative financial instruments 2 –10 430 427 3 – –
Total 679 1 184 831 350 3 –
1 Loans and borrowings mainly include a CHF 300 million Swiss Franc bond with a coupon rate of 4.25 %, maturing in July 2016, including capitalized transaction costs of CHF 2 million. The contractual cash flows include future interest payments until maturity.
2 Contractual cash flows relate to underlying transactions which cover the contractual cash flows almost completely.
2011
in CHF millionCarrying amount
Contractual cash flow
within 1 year 1 to 5 years
more than 5 years
of which secured
Bank overdrafts 1 1 1 – – –Fixed advances – – – – – –Trade payables 457 457 457 – – –Loans and borrowings 830 1 037 34 1 003 – –Gross finance lease obligation 2 2 – – 2 –Accrued liabilities 151 151 151 – – –
Non-derivative financial liabilities 1 441 1 648 643 1 003 2 –
Forward exchange contracts used for hedging 20 505 499 6 – –– thereof: for hedging fxoutflows – 117 114 3 – –– thereof: for hedging fxinflows 20 388 385 3
Derivative financial instruments 20 505 499 6 – –
Total 1 461 2 153 1 142 1 009 2 –
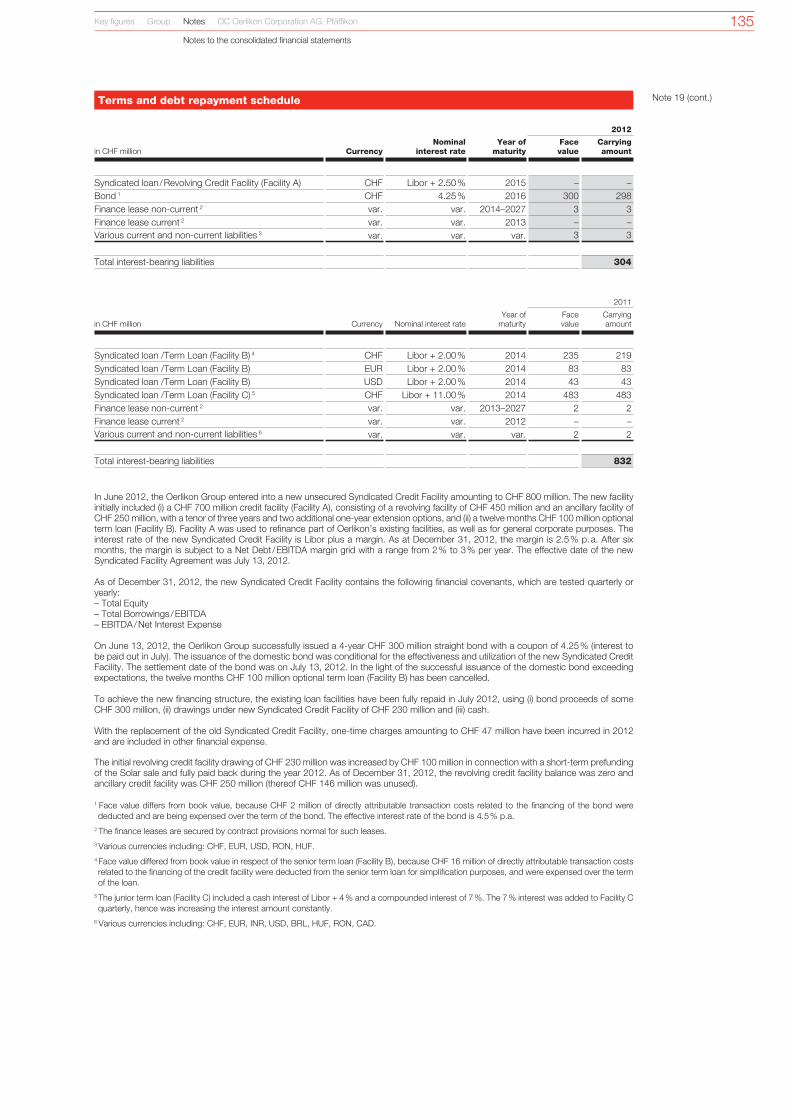
135
Terms and debt repayment schedule Note 19 (cont.)
2012
in CHF million CurrencyNominal
interest rateYear of
maturityFace value
Carrying amount
Syndicated loan / Revolving Credit Facility (Facility A) CHF Libor + 2.50 % 2015 – –Bond 1 CHF 4.25 % 2016 300 298 Finance lease noncurrent 2 var. var. 2014–2027 3 3 Finance lease current 2 var. var. 2013 – –Various current and noncurrent liabilities 3 var. var. var. 3 3
Total interestbearing liabilities 304
2011
in CHF million Currency Nominal interest rateYear of
maturityFace value
Carrying amount
Syndicated loan /Term Loan (Facility B) 4 CHF Libor + 2.00 % 2014 235 219 Syndicated loan /Term Loan (Facility B) EUR Libor + 2.00 % 2014 83 83 Syndicated loan /Term Loan (Facility B) USD Libor + 2.00 % 2014 43 43 Syndicated loan /Term Loan (Facility C) 5 CHF Libor + 11.00 % 2014 483 483 Finance lease noncurrent 2 var. var. 2013–2027 2 2 Finance lease current 2 var. var. 2012 – –Various current and noncurrent liabilities 6 var. var. var. 2 2
Total interestbearing liabilities 832
In June 2012, the Oerlikon Group entered into a new unsecured Syndicated Credit Facility amounting to CHF 800 million. The new facility initially included (i) a CHF 700 million credit facility (Facility A), consisting of a revolving facility of CHF 450 million and an ancillary facility of CHF 250 million, with a tenor of three years and two additional oneyear extension options, and (ii) a twelve months CHF 100 million optional term loan (Facility B). Facility A was used to refinance part of Oerlikon’s existing facilities, as well as for general corporate purposes. The interest rate of the new Syndicated Credit Facility is Libor plus a margin. As at December 31, 2012, the margin is 2.5 % p. a. After six months, the margin is subject to a Net Debt / EBITDA margin grid with a range from 2 % to 3 % per year. The effective date of the new Syndicated Facility Agreement was July 13, 2012. As of December 31, 2012, the new Syndicated Credit Facility contains the following financial covenants, which are tested quarterly or yearly:– Total Equity– Total Borrowings / EBITDA– EBITDA / Net Interest Expense On June 13, 2012, the Oerlikon Group successfully issued a 4year CHF 300 million straight bond with a coupon of 4.25 % (interest to be paid out in July). The issuance of the domestic bond was conditional for the effectiveness and utilization of the new Syndicated Credit Facility. The settlement date of the bond was on July 13, 2012. In the light of the successful issuance of the domestic bond exceeding expectations, the twelve months CHF 100 million optional term loan (Facility B) has been cancelled. To achieve the new financing structure, the existing loan facilities have been fully repaid in July 2012, using (i) bond proceeds of some CHF 300 million, (ii) drawings under new Syndicated Credit Facility of CHF 230 million and (iii) cash. With the replacement of the old Syndicated Credit Facility, onetime charges amounting to CHF 47 million have been incurred in 2012 and are included in other financial expense.
The initial revolving credit facility drawing of CHF 230 million was increased by CHF 100 million in connection with a shortterm prefunding of the Solar sale and fully paid back during the year 2012. As of December 31, 2012, the revolving credit facility balance was zero and ancillary credit facility was CHF 250 million (thereof CHF 146 million was unused).
1 Face value differs from book value, because CHF 2 million of directly attributable transaction costs related to the financing of the bond were deducted and are being expensed over the term of the bond. The effective interest rate of the bond is 4.5 % p.a.
2 The finance leases are secured by contract provisions normal for such leases.3 Various currencies including: CHF, EUR, USD, RON, HUF.4 Face value differed from book value in respect of the senior term loan (Facility B), because CHF 16 million of directly attributable transaction costs related to the financing of the credit facility were deducted from the senior term loan for simplification purposes, and were expensed over the term of the loan.
5 The junior term loan (Facility C) included a cash interest of Libor + 4 % and a compounded interest of 7 %. The 7 % interest was added to Facility C quarterly, hence was increasing the interest amount constantly.
6 Various currencies including: CHF, EUR, INR, USD, BRL, HUF, RON, CAD.
Key figures Group Notes OC Oerlikon Corporation AG, Pfäffikon
Notes to the consolidated financial statements

136 Key figures Group Notes OC Oerlikon Corporation AG, Pfäffikon
Notes to the consolidated financial statements
Credit risk Note 20
Credit risk is the risk of financial loss to the Group, if a customer or counterparty to a financial instrument fails to meet its contractual obligations. Credit risk arises principally from the Group’s receivables from customers and investment securities. The credit or default risk associated with operating receivables is monitored locally by the individual Group companies. These companies follow an established groupwide credit policy, under which each new customer is analyzed individually for creditworthiness before payment and delivery terms and conditions are offered. Credit ratings are reviewed regularly, and defined country credit limits are set and monitored on an ongoing basis. “High risk” customers are placed on a restricted customer list, and future sales with them are made on a prepayment basis only. Letters of credit and other instruments are also used to reduce credit risk. Goods are sold subject to retention of title clauses, so that in the event of nonpayment the Group may have a secured claim.
Trade receivables are valued at the original invoiced amount less any necessary value adjustments for default risks. These risks are insured with third parties only in exceptional cases.
As a fundamental principle, the Group places funds only with firstrate domestic and foreign banking institutions, and Group Treasury periodically assesses the relevant ratings of these bank institutions.
Oerlikon Group’s maximum credit risk from financial instruments is reflected in the book values of the individual financial assets. There are no commitments or obligations which might lead to an exposure exceeding these book values. The maximum credit risk is therefore:
in CHF million 2012 2011
Cash and cash equivalents 638 742Financial assets, carried at fair value 5 5Financial assets, carried at cost 4 39Derivatives used for hedging 11 3Trade receivables 474 635Accrued sales under percentage of completion (POC) method for orders without customer advances 18 138Loans and other financial receivables 6 8
Total 1 156 1 570
Trade receivables are distributed geographically (by location of the Group company) as follows:
in CHF million 2012 2011
Asia 133 148Europe 290 410North America 47 68Other 4 9
Total 474 635
No concentrations of risk to the Group are expected from the outstanding receivables.

137
Ageing of trade receivables Note 20 (cont.)
2012 1 2011 2
in CHF million Gross amount Value adjustment Gross amount Value adjustment
Current (not due) 417 –1 555 –2
Total past due 69 –11 97 –15 0–30 days 33 –2 51 –1 31–60 days 13 – 16 –1 61–90 days 5 –1 8 –91–120 days 4 –1 4 –1 over 120 days 14 –7 18 –12
Total 486 –12 652 –17
1 Continuing operations.2 As reported.
Provisions for doubtful debts are based on the difference between the nominal value of receivables and the amounts considered collectible. Amounts considered collectible are developed from experience. A receivable is considered to be doubtful if certain facts are known which suggest that a debtor is in significant financial difficulty and that amounts receivable from that source are unlikely to be received at all, or only in part.
Reconciliation of changes in allowance accounts for credit losses:
in CHF million 2012 2011
Balance at January 1 –17 –21 Change in the scope of consolidated companies 1 –Reclassifications to assets held for sale 5 –Additional impairment losses charged to income 1 –6 –4 Reversal of impairment losses 4 6 Writeoff 1 2
Balance at December 31 –12 –17
1 2011 includes CHF 1 million related to discontinued operations.
Key figures Group Notes OC Oerlikon Corporation AG, Pfäffikon
Notes to the consolidated financial statements

138 Key figures Group Notes OC Oerlikon Corporation AG, Pfäffikon
Notes to the consolidated financial statements
Market risk Note 21
Market risk is the risk that the fair value or the future cash flows of a financial instrument may change as a result of fluctuations in market prices. Oerlikon is exposed in particular to fluctuations in foreign exchange and interest rates. The Group also has a minor risk from exposure to fluctuations in raw material prices.
Foreign exchange risk
Foreign exchange transaction riskThe Group has adopted the Swiss franc as its reporting currency. Due to its most significant markets, the Group is primarily exposed to exchange risks versus the US dollar and Euro. If costs and revenues of Group companies are incurred or earned in differing or nonlocal currencies, the underlying business transactions are hedged on a centrally coordinated basis by means of commonly used financial instruments. Group companies make regular plans for receipt or payment of cash in foreign currencies and advise these to Group Treasury, who hedges the related exchange risks using internal hedging contracts with the companies concerned, and external contracts with firstclass banks.
The Group’s hedging strategy for exchange risks distinguishes between the routine business of supplying components or spare parts. and the Group’s project activities. For the routine business, cash flows in foreign currencies are hedged for a whole year in advance, based on the annual budget. The hedging quota, i.e. the percentage of the base volume to be hedged, is set forth in the related guidelines. Periodically, a check is made as to whether the latest forecast of business volumes calls for an increase or a reduction in the hedging volume. For projects, the exchange risks are hedged when the contract is entered into. For special transactions which do not fall into either category – routine or project –, the hedging strategy can be determined for individual cases.
Foreign exchange translation riskTranslation exposure arises from consolidation of foreign currency denominated financial statements of the Group’s subsidiaries. The Group’s consolidated financial statements are reported in Swiss francs. The risk arising from foreign subsidiary balance sheets – the effect of which is a currency impact on consolidated Group equity – is not hedged.
Foreign exchange economic riskThe Group policy is not to hedge longterm foreign exchange risk.
The following rates were used to convert the most important foreign currencies in the financial statements:
Average rates Change Year-end rates Change2012 2011 11/12 2012 2011 11/12
1 USD 0.938 0.887 5.7 % 0.914 0.940 –2.8 %1 EUR 1.205 1.233 –2.3 % 1.208 1.219 –0.9 %100 CNY 14.900 13.700 8.8 % 14.700 14.900 –1.3 %100 HKD 12.100 11.300 7.1 % 11.800 12.100 –2.5 %100 JPY 1.177 1.112 5.8 % 1.063 1.212 –12.3 %1 SGD 0.751 0.705 6.5 % 0.746 0.723 3.2 %
Sensitivity analysisFor the sensitivity analysis, the two most important currencies were selected in which the Group holds significant amounts of receivables and payables. Based on a twoyear volatility of 12.87 % (USD / CHF) and 11.01 % (EUR / CHF), a corresponding change in exchange rates at December 31, 2012 would have changed the equity and the income statement by the amounts listed below.
31 December 2012 2011Effect in CHF million Equity Income statement Equity Income statement
USD 1 3 –1 6 EUR –1 3 1 3
A 12.87 % (USD / CHF) and 11.01 % (EUR / CHF) weakening of the Swiss franc against the above currencies would have had the same but opposite effect on the above currencies to the amounts shown above, assuming all other variables remain constant. In the previous period, the sensitivity analysis was calculated with 13.8 (USD / CHF) and 12.67 (EUR / CHF).

139
Exposure to foreign exchange risk Note 21 (cont.)
The Group’s exposure to foreign exchange risk was as follows, based on nominal amounts as of December 31, 2012:
2012 1 2011 2
in million EUR USD CHF EUR USD CHF
Trade receivables 11 10 – 11 26 –Trade payables 6 5 2 14 13 4Net financial position 21 34 –67 33 48 –
Gross exposure consolidated balance sheet 38 49 –65 58 87 4
Foreign exchange risk in business operations –9 140 –12 159 121 –31
Open foreign exchange forward contracts –6 –124 8 –147 –128 21
Net exposure 23 65 –69 70 80 –6
1 Continuing operations.2 As reported.
Interest rate risk
Oerlikon is exposed to interest rate risk mainly from drawings from the syndicated loan facility (at which no drawing is open at year end 2012), which are placed at variable interest rates, but also on a much smaller scale from its liquid funds, which are also placed at variable rates or held as shortterm investments. Amounts drawn down from the syndicated loan are subject to interest rate fluctuations. Group Treasury prepares and provides the relevant decision support for senior management (Board of Directors, senior financial management) and arranges for hedging against interest rate fluctuations, once approval is given. Such hedging is carried out using derivative financial instruments, such as Interest Rate Swaps and Interest Rate Caps.
At December 31, 2012, the interest rate profile of the Group’s interestbearing financial instruments was:
2012 2011
in CHF millionNet carrying
amountNet carrying
amount
Fixed rate interestFinancial assets – 3Financial liabilities –303 –
Total –303 3
Variable rate interestFinancial assets 643 745Financial liabilities –1 –832
Total 642 –87
Cash flow sensitivity analysis for variable rate instrumentsA change of 100 basis points (bp) in interest rates at the reporting date would have decreased (increased) profit or loss by the amounts shown below. This analysis assumes that all other variables, in particular foreign currency rates, remain constant.
Income statement
100 bp 100 bpEffect in CHF million increase decrease
2012Cash flow sensitivity 5 –
2011Cash flow sensitivity –2 3
It has been assumed that a change of +100 bp has a full impact on interest income and expenses. In case of a decrease of 100 bp, we assumed no negative impact of interest on assets, due to the overall low interest rates. Tax impact has been included in all figures regarding interest sensivity.
A change of 100 basis points in interest rates would have no impact on Group equity.
Key figures Group Notes OC Oerlikon Corporation AG, Pfäffikon
Notes to the consolidated financial statements

140 Key figures Group Notes OC Oerlikon Corporation AG, Pfäffikon
Notes to the consolidated financial statements
Capital management Note 21 (cont.)
The positive result in 2012 has again led to an improved equity ratio, debttoequity ratio and return on equity compared to last year.
The ratios are shown in the table below:
in CHF million 2012 2011
Total assets 4 159 4 573Equity attributable to shareholders of the parent 1 858 1 586
Equity ratio in % 45 % 35 %
Interestbearing debt 304 832Equity 1 882 1 610
Debt-to-equity ratio 0.2 0.5
Average equity 1 746 1 532Net result attributable to the shareholders of the parent 382 220
Return on equity 22 % 14 %
With an equity ratio of 45 % (2011: 35 %), the Oerlikon Group trails well within the range of its financial policy, approaching investment grade for capital markets.
Fair values versus carrying amounts at December 31 Note 22
The fair values of financial assets and liabilities, together with the carrying amounts shown in the balance sheet, are as follows:
2012 2011
in CHF million Carrying amount Fair Value Carrying amount Fair Value
Cash and cash equivalents 638 638 742 742Financial assets 9 9 44 44Loans and receivables 498 498 781 781Forward exchange contracts– Assets 11 11 3 3– Liabilities –1 –1 –23 –23Secured bank loans – – –828 –828Unsecured bank loans –2 –2 –2 –2Bond –298 –319 – –Finance lease liabilities –3 –3 –2 –2Trade payables –287 –287 –457 –457Accrued liabilities –98 –98 –151 –151
Total 467 446 107 107
Unrecognized gains/losses –21 –
Fair value hierarchyThe fair values for financial instruments carried at fair value have been calculated, from a hierarchy point of view, as level 2 assessments (observable inputs other than quoted prices in markets for identical assets and liabilities), and include financial assets of CHF 9 million (prior year: CHF 44 million), derivative financial assets of CHF 11 million (prior year: 3 million) and derivative financial liabilities of CHF 1 million (prior year: CHF 23 million).

141Key figures Group Notes OC Oerlikon Corporation AG, Pfäffikon
Notes to the consolidated financial statements
OC Oerlikon participation plans Note 23
On December 31, 2012, the following equitysettled plans were open, pursuant to which the holder is entitled to shares of OC Oerlikon Corporation AG, Pfäffikon:
Restricted Stock Units (RSU)Members of the Board of Directors of OC Oerlikon Corporation AG, Pfäffikon receive a portion of their compensation by means of Restricted Stock Units (RSU), which are allocated on the day of the Annual General Meeting of Shareholders and vest upon the next Annual General Meeting of Shareholders, at which time they are converted into Oerlikon shares. For Directors resigning their mandate prior to the end of the term, the number of RSU converted into shares is determined at the sole discretion of the Board of Directors. The value of the RSU per year end is based on the weighted average share price of CHF 8.1.
Members of senior management may receive, as portion of their compensation, a longterm incentive in the form of Restricted Stock Units (RSU) for OC Oerlikon Corporation AG, Pfäffikon shares, with a vesting period of 3 years. The value of the RSU per year end is based on a weighted average share price of CHF 5.7. The RSU program for senior management has been discontinued after 2009.
Year of allocation
Outstanding on 1.1.
Granted in 2012
Forfeited in 2012
Exercised in 2012
Outstanding on 31.12.
Average share price
in CHF
Expenses for the period
in CHF million Vesting period
2009 235 791 – – 235 791 – 5.7 0.3 01.05.09–30.04.122011 145 684 – – 145 684 – 6.9 0.4 11.05.11–12.04.122012 – 130 711 – – 130 711 8.1 0.7 12.04.12–30.04.13Total 381 475 130 711 – 381 475 130 711 1.4
Performance Share Awards (PSA)Members of the Executive Committee and senior management may receive a portion of their compensation as longterm bonus, in the form of awards for OC Oerlikon Corporation AG, Pfäffikon shares, which are based on performance conditions and a vesting period of three years. Performance conditions may consist of financial objectives. Their achievement determines the effective number of total Performance Share Awards (PSA). Upon vesting, the effective number of PSA is converted into shares. The population eligible for participating in the Performance Share Plan was expanded in 2012. Performance conditions are based on the rank of the Total Sharerholder Return (TSR) of Oerlikon over a threeyear period, within a Peer Group consisting of 28 companies including OC Oerlikon. TSR is measured with a starting value of the Volume Weighted Average Share Price (VWAP) over the first 30 trading days of the first year, and an ending value of the VWAP over the last 30 trading days of the third year. The fair market value at grant date is CHF 16.55, and has been calculated using a Monte Carlo Simulation. Main assumptions include a stock price of CHF 8.97 and an average expected volatility of the peer group of 40.38 %. The rank of Oerlikon’s TSR at the end of the Performance Period determines the effective number of total shares. At Rank 3 of the peer group or above, a maximum payout of 200 % of target performance share awards (PSA) are converted into shares. At Rank 10 of the peer group, the payout is 100 %, at Rank 15 it is 80 % and at Rank 20 or below, it is 0 %.
Year of allocation
Outstanding on 1.1.
Granted in 2012
Forfeited in 2012
Exercised in 2012
Outstanding on 31.12.
Average share price
in CHF
Expenses for the period
in CHF million1 Vesting period
2010 484 465 – 114 149 – 370 316 4.6 0.7 01.05.10–30.04.132011 565 718 – 138 024 – 427 694 6.8 1.5 01.05.11–30.04.142012 – 956 696 19 734 83 771 853 191 9.0 3.8 01.05.12–30.04.15Total 1 050 183 956 696 271 907 83 771 1 651 201 6.0
1 The total expense of CHF 6.0 million includes expenses of discontinued operations in the amount of CHF 0.6 million.
Share OptionsIn previous years, employees could receive a portion of their compensation as options for OC Oerlikon Corporation AG, Pfäffikon with a blocking period of one, two, three or four years. Holders are entitled to purchase one share for each option held. The value per year end is based on a BlackScholes valuation, including a weighted average share price of CHF 70. No options have been granted since 2008.
Year of allocation
Outstanding on 1.1.
Granted in 2012
Forfeited in 2012
Exercised in 2012
Outstanding on 31.12.
Exercise price
in CHF
Expenses for the period
in CHF million Vesting period
2007 9 282 – – – 9 282 80 – 01.01.08–31.12.139 282 – – – 9 282 80 – 01.01.09–31.12.139 282 – – – 9 282 80 – 01.01.10–31.12.139 282 – – – 9 282 80 – 01.01.11–31.12.13
Total 37 128 – – – 37 128 –

142 Key figures Group Notes OC Oerlikon Corporation AG, Pfäffikon
Notes to the consolidated financial statements
Related Party transactions Note 24
Members of the Board of Directors or Executive Committee, significant shareholders and companies controlled or jointly controlled by any of those individuals as well as postemployment benefit plans of the Group are deemed to be related parties. Transactions with related parties are generally conducted at arm’s length.
Significant shareholdersThe share capital of CHF 325 964 498 consists of 325 964 498 registered shares, each with a par value of CHF 1.00. On December 31, 2012, conditional capital amounted to CHF 61 334 431 (2011: CHF 64 174 919). The shareholders registered as holding more than 5 % of the shares as at December 31, 2012, were:
Share ownership 1
Shareholder No. of shares in %
Renova Group 2 156 210 954 3 47.92 %Chase Nominees Ltd, London 18 170 486 4 5.57 %
1 Sources: Disclosure notification pursuant to Art. 20 of the Swiss Stock Exchange Law by Renova Group (published by SIX Exchange Regulation on September 6, 2012) and share register (Chase Nominees Ltd).
2 Beneficial owner (as per disclosure notification): Viktor F. Vekselberg, Zug and Moscow. Renova Group is composed of Liwet Holding AG, Zurich, Switzerland, Renova Industries Ltd., Nassau, Bahamas, and Lamesa Holding S.A., Panama, Republic of Panama.
3 At the end of 2011, the Renova Group held (as per disclosure notification) 155 035 964 shares (47.98 % of the issued Oerlikon shares).4 At the end of 2011, Chase Nominees Ltd, London, held (according to the share register) 9 501 954 shares (2.94 % of the issued Oerlikon shares).
Compensation of Non-Executive Members of the Board of DirectorsMembers of the Board of Directors receive a cash compensation and Restricted Stock Units (RSU). The cash compensation consists of a Board member fee, a fee for Committee Chairmen, a fee for Committee members and a fee for the Chairman of the Board of Directors. In addition, a cash allowance is paid to all Board members. Board members receive Restricted Stock Units (RSU), which are blocked from their grant at the annual shareholders meeting until the following annual shareholders meeting at which time they are converted into Oerlikon shares. For Directors resigning their mandate prior to the end of the term, the number of RSU converted into shares is determined at the sole discretion of the Board of Directors. The compensation is set by the Human Resources Committee and approved by the Board of Directors after the annual shareholders meeting. The total compensation for the eight nonexecutive members of the Board of Directors in 2012 was CHF 2.2 million. In 2011, the total compensation for the same nonexecutive members of the Board of Directors amounted to CHF 2.1 million, while the total compensation for all nonexecutive members of the Board of Directors in 2011 amounted to CHF 2.3 million.
in CHF 000 Boa
rd o
f D
irect
ors
Str
ateg
y
Com
mitt
ee
Aud
it C
omm
ittee
HR
C
omm
ittee
Cas
h
Com
pen
sa
tion
Res
tric
ted
Sto
ck
Uni
ts (R
SU
) 20
11/1
2 1
Res
tric
ted
Sto
ck
Uni
ts (R
SU
) 20
12/1
3 1
Oth
er
Com
pen
sa
tion 2
Tota
l
Com
pen-
sati
on
2012
Tota
l C
om
pen-
sati
on
2011
Tim Summers C C C 169 115 193 40 517 277 Kurt J. Hausheer M C 125 50 86 22 283 287 Dr. Urs A. Meyer 3 M M 30 51 – 10 91 294 Reyad Fezzani 4 M M 75 – 86 5 166 –Hans Ziegler M M M 129 51 86 22 288 293 Carl Stadelhofer M M 102 51 86 21 260 258 Gerhard Pegam M M 102 50 86 5 243 241 Wolfgang Tölsner 5 M M 232 50 86 5 373 478
Total 964 418 709 130 2 221 2 128
C(hairman), M(ember)
1 Accounting value of restricted stock units (RSU) for the mandate 2011/12 is based on a share price of CHF 6.9 (grant date), and for the mandate 2012 / 13, it is based on a share price of CHF 8.1 (grant date).
2 Other compensation consists of social security contributions and an expense allowance, which are paid by OC Oerlikon Corporation AG, Pfäffikon.
3 Until April 12, 2012.4 As of April 12, 2012.5 Included in the aggregate cash compensation of Mr. Tölsner is, in addition to his Board remuneration, a fee for his consultancy work during 2012 for Oerlikon Group companies in the amount of KCHF 127. Mr. Tölsner’s consulting contract with Oerlikon has been terminated as of November 1, 2012.

143
Related Party transactions Note 24 (cont.)
Key figures Group Notes OC Oerlikon Corporation AG, Pfäffikon
Notes to the consolidated financial statements
Compensation of Members of the Executive CommitteeMembers of the Executive Committee receive a compensation consisting of base salary and performancebased bonus paid in cash. In addition, members of the Executive Committee participate in a longterm bonus plan paid in shares.
The compensation for the members of the Executive Committee is set by the Human Resources Committee and approved by the Board of Directors at the end of the year. The achievement of targets defined for the annual performancebased bonus are reviewed by the Human Resources Committee at the end of the year, and the bonus is usually paid in April of the following year. In 2012, members of the Executive Committee participated in a longterm performance share program for 2012–15. In 2011, they participated in a longterm performance share program for 2011–14. In 2010, they participated in a longterm performance share program for 2010–13.
The total compensation paid to members of the Executive Committee for the year 2012 was CHF 9.7 million. The highest compensation paid to an individual Committee member was CHF 3.5 million.
Compensation to the Executive Committee is composed as follows:
in CHF 000 Sal
ary
Bon
us 1
LTI
(201
0–13
) 2
LTI
(201
1–14
) 2
LTI
(201
2–15
) 2
Pen
sion
Oth
er
Com
pens
atio
n 3
Sev
eran
ce
paym
ent 4
Tota
l
Com
pen
sati
on
2
01
2
Tota
l C
ompe
nsat
ion
2011
Total compensation to members of the Executive Committee 2 065 3 391 545 818 1 305 564 137 895 9 720 9 902
Thereof highest paid to one individual: 5
Michael Buscher (CEO) 858 1 333 187 432 441 189 42 – 3 482 4 128
1 Effective bonus 2011, paid in 2012, and one bonus 2012, paid in 2012.2 Accounting value of Performance Share Awards (PSA) is based on a weighted average share price of CHF 4.6 (grant date in 2010), CHF 6.8 (grant date in 2011) and CHF 9.0 (grant date in 2012).
3 Other compensation includes expense and car allowances.4 Adrian Cojocaru’s (former CHRO) employment ended on December 31, 2012. The LTI grant 2012 vested on a prorated basis upon termination. The termination payment included the contractually agreed compensation for the notice period of 12 months.
5 The highest compensation in 2011 went to the former COO.
Compensation of Former Members of Governing BodiesDuring 2012, no compensation was paid to former members of the Board of Directors or the Executive Committee, either by OC Oerlikon Corporation AG, Pfäffikon or by any other company of the Oerlikon Group. No compensation was paid to former members of the Board of Directors in 2011, however, a former member of the Executive Committee received a fee of CHF 21 000 for a board membership.
Share Ownership, Options and Related InstrumentsThe disclosure below follows Art. 663c Para. 3 of the Swiss Code of Obligations, which requires disclosure of share ownership, options and related instruments individually for each member of the Board of Directors and Executive Committee, including shares, options and related instruments held by persons closely related to, and by companies controlled by members of the Board of Directors and Executive Committee.
Members of the Board of DirectorsNumber of
Shares
Number of Restricted
Stock Units (RSU)
Tim Summers 31 683 35 533 Kurt J. Hausheer 168 748 15 863 Reyad Fezzani – 15 863 Carl Stadelhofer 97 945 15 863 Hans Ziegler 159 486 15 863 Gerhard Pegam 33 228 15 863 Wolfgang Tölsner 33 228 15 863
Total 524 318 130 711
Tim Summers (Chairman), Reyad Fezzani (Board Member) and Carl Stadelhofer (Board Member) are also in senior positions at Renova Group. Mr. Summers is Chairman of Venetos Management AG and Managing Director of Renova Management AG. Mr. Fezzani is Supervisory Board Member of Renova US Holdings Ltd. Mr. Stadelhofer is Chairman of Renova Industries Ltd. and Renova Holding Ltd., Vice President of Renova Management AG and Chief Legal Counsel of Renova Group. 200 of his shares are held by a related party.
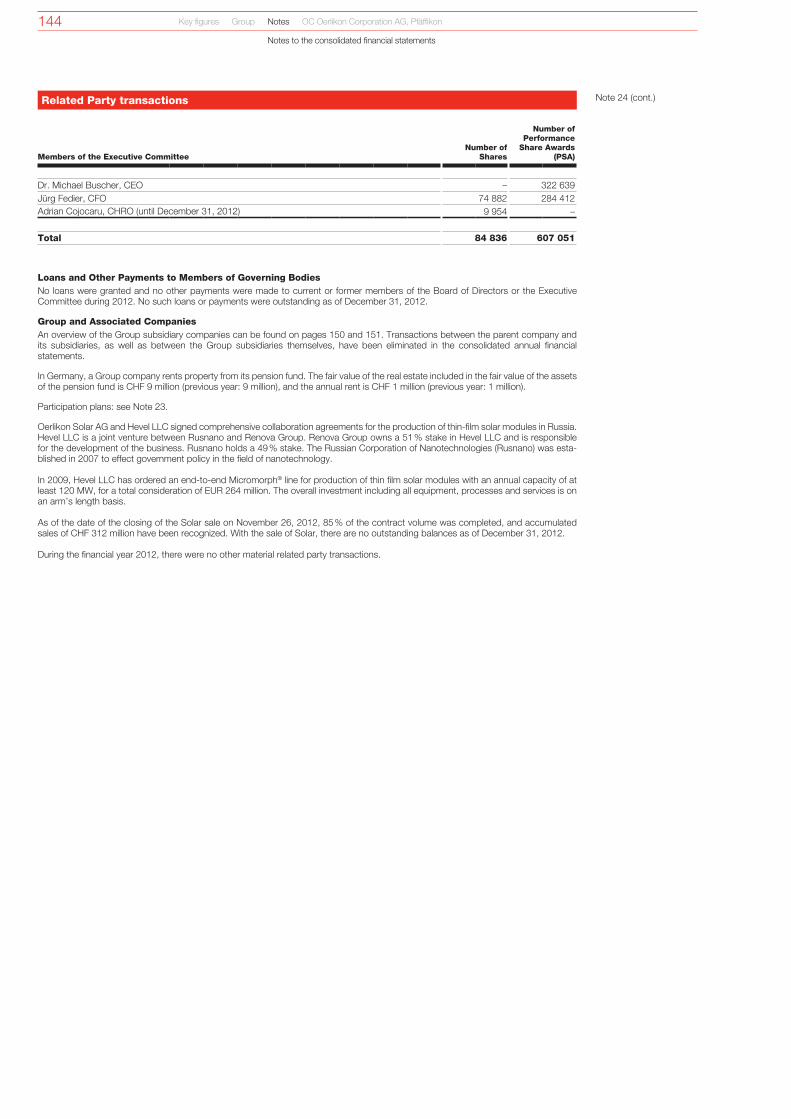
144
Related Party transactions Note 24 (cont.)
Key figures Group Notes OC Oerlikon Corporation AG, Pfäffikon
Notes to the consolidated financial statements
Members of the Executive CommitteeNumber of
Shares
Number of Performance
Share Awards (PSA)
Dr. Michael Buscher, CEO – 322 639 Jürg Fedier, CFO 74 882 284 412 Adrian Cojocaru, CHRO (until December 31, 2012) 9 954 –
Total 84 836 607 051
Loans and Other Payments to Members of Governing BodiesNo loans were granted and no other payments were made to current or former members of the Board of Directors or the Executive Committee during 2012. No such loans or payments were outstanding as of December 31, 2012.
Group and Associated CompaniesAn overview of the Group subsidiary companies can be found on pages 150 and 151. Transactions between the parent company and its subsidiaries, as well as between the Group subsidiaries themselves, have been eliminated in the consolidated annual financial statements.
In Germany, a Group company rents property from its pension fund. The fair value of the real estate included in the fair value of the assets of the pension fund is CHF 9 million (previous year: 9 million), and the annual rent is CHF 1 million (previous year: 1 million).
Participation plans: see Note 23.
Oerlikon Solar AG and Hevel LLC signed comprehensive collaboration agreements for the production of thinfilm solar modules in Russia. Hevel LLC is a joint venture between Rusnano and Renova Group. Renova Group owns a 51 % stake in Hevel LLC and is responsible for the development of the business. Rusnano holds a 49 % stake. The Russian Corporation of Nanotechnologies (Rusnano) was established in 2007 to effect government policy in the field of nanotechnology. In 2009, Hevel LLC has ordered an endtoend Micromorph® line for production of thin film solar modules with an annual capacity of at least 120 MW, for a total consideration of EUR 264 million. The overall investment including all equipment, processes and services is on an arm’s length basis. As of the date of the closing of the Solar sale on November 26, 2012, 85 % of the contract volume was completed, and accumulated sales of CHF 312 million have been recognized. With the sale of Solar, there are no outstanding balances as of December 31, 2012.
During the financial year 2012, there were no other material related party transactions.

145
Contingent liabilities Note 25
Contingent liabilities as of December 31, 2012, amount to CHF 8 million, net of CHF 1 million for discontinued operations (2011: CHF 8 million, net of CHF 0 million for discontinued operations) and mainly consist of debt guarantees to banks.
Payments under non-cancellable operating leases Note 26
in CHF million 2012 2011
Due in 1st year 24 29Due in 2nd year 19 25Due in 3rd year 11 15Due in 4th year 8 11Due in or beyond 5th year 24 29
Total 86 109
The expenses of operating leases charged to the income statement amount to CHF 22 million (2011 restated: CHF 26 million).
Pledged assets Note 27
The following assets shown on the balance sheet were pledged as security:
in CHF million 2012 2011
Cash and cash equivalents – 129Receivables – 171Inventories – 83Other current assets – 8Property, plant and equipment 7 306Other noncurrent assets – 248
Total 7 945
In 2011, a significant part of the pledged assets was provided as security for the syndicated loan facility dated March 31, 2010. Having met the security release condition specified in the Facility Agreement, these securities have been released as of June 30, 2012. The security release condition specified that the ratio of Net Debt to EBITDA for each of the six most recent quarters is less than 2.25 to 1.
Key figures Group Notes OC Oerlikon Corporation AG, Pfäffikon
Notes to the consolidated financial statements
Events subsequent to the balance sheet date Note 28
No events occurred between the balance sheet date and the date on which this report was approved by the Board of Directors which could have a significant impact on the consolidated financial statements 2012.

146 Key figures Group Notes OC Oerlikon Corporation AG, Pfäffikon
Segment information
Segment information
Textile Segment
Drive Systems
Segment Vacuum Segment Coating Segment Advanced Technologies
Segment Total SegmentsGroup /
EliminationsTotal from continuing
operations Discontinued operations 1Total including
discontinued operationsin CHF million 2012 2011 2012 2011 2012 2011 2012 2011 2012 2011 2012 2011 2012 2011 2012 2011 2012 2011 2012 2011
Order intake 1 039 1 014 766 892 377 400 501 484 119 88 2 802 2 878 – – 2 802 2 878 922 1 165 3 724 4 043
Order backlog 602 673 134 213 73 77 – – 25 8 834 971 – – 834 971 274 510 1 108 1 481
SalesSales to third parties 1 103 909 826 821 373 409 501 484 103 108 2 906 2 731 – – 2 906 2 731 1 007 1 451 3 913 4 182Sales to other segments – – – – 4 13 1 2 1 1 6 16 –6 –16 – – 33 47 33 47Eliminations – – – – –4 –13 –1 –2 –1 –1 –6 –16 6 16 – – –33 –47 –33 –47
1 103 909 826 821 373 409 501 484 103 108 2 906 2 731 – – 2 906 2 731 1 007 1 451 3 913 4 182
Sales by market region to third partiesAsia / Pacific 833 686 86 93 135 143 154 143 58 49 1 266 1 114 – – 1 266 1 114 673 917 1 939 2 031Europe 134 95 396 359 166 191 245 248 33 45 974 938 – – 974 938 209 248 1 183 1 186North America 48 76 309 330 64 71 66 58 11 13 498 548 – – 498 548 44 61 542 609Other regions 88 52 35 39 8 4 36 35 1 1 168 131 – – 168 131 81 225 249 356
1 103 909 826 821 373 409 501 484 103 108 2 906 2 731 – – 2 906 2 731 1 007 1 451 3 913 4 182
Sales by location to third partiesAsia / Pacific 315 233 101 93 111 116 157 130 – – 684 572 – – 684 572 158 171 842 743 thereof China 301 221 17 9 51 57 29 26 – – 398 313 – – 398 313 136 139 534 452Europe 763 646 413 470 193 220 248 267 92 95 1 709 1 698 – – 1 709 1 698 801 1 206 2 510 2 904 thereof Switzerland 1 3 – 53 – – 47 65 61 54 109 175 – – 109 175 109 385 218 560
Germany 762 628 – – 193 220 100 97 31 41 1 086 986 – – 1 086 986 680 810 1 766 1 796Italy – 7 407 412 – – 11 13 – – 418 432 – – 418 432 – – 418 432
North America 25 29 312 258 69 73 62 53 11 13 479 426 – – 479 426 39 60 518 486Other regions – 1 – – – – 34 34 – – 34 35 – – 34 35 9 14 43 49
1 103 909 826 821 373 409 501 484 103 108 2 906 2 731 – – 2 906 2 731 1 007 1 451 3 913 4 182
Capital expenditure for property, plant and equipment and intangible assets 2
Asia / Pacific 11 7 31 14 4 5 24 27 – – 70 53 – – 70 53 1 – 71 53Europe 18 28 18 17 12 10 28 18 4 6 80 79 2 4 82 83 17 16 99 99North America – – 17 11 – – 9 3 – – 26 14 – – 26 14 – – 26 14Other regions – – – – – – 3 1 – – 3 1 – – 3 1 – – 3 1
29 35 66 42 16 15 64 49 4 6 179 147 2 4 181 151 18 16 199 167
EBITDA 209 97 111 94 52 72 145 141 11 14 528 418 19 32 547 450 –19 155 528 605EBIT 186 73 70 49 38 59 103 97 7 11 404 289 17 29 421 318 –47 101 374 419
Other material itemsResearch and development expense –31 –30 –12 –11 –19 –19 –33 –30 –12 –11 –107 –101 – – –107 –101 –98 –110 –205 –211Depreciation and amortization –24 –17 –40 –45 –14 –13 –41 –44 –4 –3 –123 –122 –3 –4 –126 –126 –25 –49 –151 –175Impairment of property, plant and equipment – –6 – – – – – – – – – –6 – – – –6 –3 –1 –3 –7Impairment of goodwill – – – – – – – – – – – – – – – – – –2 – –2Restructuring costs –1 – 2 – – – – – –1 – – – – – – – –1 –1 –1 –1
Assets 2 31.12. 31.12. 31.12. 31.12. 31.12. 31.12. 31.12. 31.12. 31.12. 31.12. 31.12. 31.12. 31.12. 31.12. 31.12. 31.12. 31.12. 31.12. 31.12. 31.12.Operating assets 3 715 1 458 1 132 1 184 249 258 402 387 117 111 2 615 3 398 22 43 2 637 3 441 682 242 3 319 3 683
Liabilities 2
Operating liabilities 4 684 840 173 248 70 93 70 84 30 29 1 027 1 294 35 39 1 062 1 333 202 145 1 264 1 478
Number of employees 31.12. 31.12. 31.12. 31.12. 31.12. 31.12. 31.12. 31.12. 31.12. 31.12. 31.12. 31.12. 31.12. 31.12. 31.12. 31.12. 31.12. 31.12. 31.12. 31.12.
Asia / Pacific 980 929 2 010 1 901 357 336 987 923 – – 4 334 4 089 – – 4 334 4 089 1 633 1 830 5 967 5 919Europe 1 496 1 373 1 902 2 333 1 052 1 060 1 609 1 557 170 180 6 229 6 503 210 203 6 439 6 706 1 977 2 537 8 416 9 243North America 35 80 1 265 1 237 82 76 302 279 18 20 1 702 1 692 – 1 1 702 1 693 63 72 1 765 1 765Other regions – 7 – – – – 228 227 – – 228 234 5 4 233 238 58 62 291 300
2 511 2 389 5 177 5 471 1 491 1 472 3 126 2 986 188 200 12 493 12 518 215 208 12 708 12 726 3 731 4 501 16 439 17 227
1 Discontinued operations include the divestments of the Solar Segment and the Natural Fibers and Textile Components Business Units.2 For 2011, Oerlikon Solar is shown under discountinued operations while the Natural Fibers and Textile Components Business Units are included in the Textile Segment.3 Operating assets include current and noncurrent operating assets (including goodwill and brands), whereas cash and cash equivalents, current and noncurrent financial invest
ments, current tax receivables as well as deferred tax assets are not included.4 Operating liabilities include current and noncurrent operating liabilities, whereas current and noncurrent financial liabilities, current tax payables and deferred tax liabilities are not
included.

147Key figures Group Notes OC Oerlikon Corporation AG, Pfäffikon
Segment information
Segment information
Textile Segment
Drive Systems
Segment Vacuum Segment Coating Segment Advanced Technologies
Segment Total SegmentsGroup /
EliminationsTotal from continuing
operations Discontinued operations 1Total including
discontinued operationsin CHF million 2012 2011 2012 2011 2012 2011 2012 2011 2012 2011 2012 2011 2012 2011 2012 2011 2012 2011 2012 2011
Order intake 1 039 1 014 766 892 377 400 501 484 119 88 2 802 2 878 – – 2 802 2 878 922 1 165 3 724 4 043
Order backlog 602 673 134 213 73 77 – – 25 8 834 971 – – 834 971 274 510 1 108 1 481
SalesSales to third parties 1 103 909 826 821 373 409 501 484 103 108 2 906 2 731 – – 2 906 2 731 1 007 1 451 3 913 4 182Sales to other segments – – – – 4 13 1 2 1 1 6 16 –6 –16 – – 33 47 33 47Eliminations – – – – –4 –13 –1 –2 –1 –1 –6 –16 6 16 – – –33 –47 –33 –47
1 103 909 826 821 373 409 501 484 103 108 2 906 2 731 – – 2 906 2 731 1 007 1 451 3 913 4 182
Sales by market region to third partiesAsia / Pacific 833 686 86 93 135 143 154 143 58 49 1 266 1 114 – – 1 266 1 114 673 917 1 939 2 031Europe 134 95 396 359 166 191 245 248 33 45 974 938 – – 974 938 209 248 1 183 1 186North America 48 76 309 330 64 71 66 58 11 13 498 548 – – 498 548 44 61 542 609Other regions 88 52 35 39 8 4 36 35 1 1 168 131 – – 168 131 81 225 249 356
1 103 909 826 821 373 409 501 484 103 108 2 906 2 731 – – 2 906 2 731 1 007 1 451 3 913 4 182
Sales by location to third partiesAsia / Pacific 315 233 101 93 111 116 157 130 – – 684 572 – – 684 572 158 171 842 743 thereof China 301 221 17 9 51 57 29 26 – – 398 313 – – 398 313 136 139 534 452Europe 763 646 413 470 193 220 248 267 92 95 1 709 1 698 – – 1 709 1 698 801 1 206 2 510 2 904 thereof Switzerland 1 3 – 53 – – 47 65 61 54 109 175 – – 109 175 109 385 218 560
Germany 762 628 – – 193 220 100 97 31 41 1 086 986 – – 1 086 986 680 810 1 766 1 796Italy – 7 407 412 – – 11 13 – – 418 432 – – 418 432 – – 418 432
North America 25 29 312 258 69 73 62 53 11 13 479 426 – – 479 426 39 60 518 486Other regions – 1 – – – – 34 34 – – 34 35 – – 34 35 9 14 43 49
1 103 909 826 821 373 409 501 484 103 108 2 906 2 731 – – 2 906 2 731 1 007 1 451 3 913 4 182
Capital expenditure for property, plant and equipment and intangible assets 2
Asia / Pacific 11 7 31 14 4 5 24 27 – – 70 53 – – 70 53 1 – 71 53Europe 18 28 18 17 12 10 28 18 4 6 80 79 2 4 82 83 17 16 99 99North America – – 17 11 – – 9 3 – – 26 14 – – 26 14 – – 26 14Other regions – – – – – – 3 1 – – 3 1 – – 3 1 – – 3 1
29 35 66 42 16 15 64 49 4 6 179 147 2 4 181 151 18 16 199 167
EBITDA 209 97 111 94 52 72 145 141 11 14 528 418 19 32 547 450 –19 155 528 605EBIT 186 73 70 49 38 59 103 97 7 11 404 289 17 29 421 318 –47 101 374 419
Other material itemsResearch and development expense –31 –30 –12 –11 –19 –19 –33 –30 –12 –11 –107 –101 – – –107 –101 –98 –110 –205 –211Depreciation and amortization –24 –17 –40 –45 –14 –13 –41 –44 –4 –3 –123 –122 –3 –4 –126 –126 –25 –49 –151 –175Impairment of property, plant and equipment – –6 – – – – – – – – – –6 – – – –6 –3 –1 –3 –7Impairment of goodwill – – – – – – – – – – – – – – – – – –2 – –2Restructuring costs –1 – 2 – – – – – –1 – – – – – – – –1 –1 –1 –1
Assets 2 31.12. 31.12. 31.12. 31.12. 31.12. 31.12. 31.12. 31.12. 31.12. 31.12. 31.12. 31.12. 31.12. 31.12. 31.12. 31.12. 31.12. 31.12. 31.12. 31.12.Operating assets 3 715 1 458 1 132 1 184 249 258 402 387 117 111 2 615 3 398 22 43 2 637 3 441 682 242 3 319 3 683
Liabilities 2
Operating liabilities 4 684 840 173 248 70 93 70 84 30 29 1 027 1 294 35 39 1 062 1 333 202 145 1 264 1 478
Number of employees 31.12. 31.12. 31.12. 31.12. 31.12. 31.12. 31.12. 31.12. 31.12. 31.12. 31.12. 31.12. 31.12. 31.12. 31.12. 31.12. 31.12. 31.12. 31.12. 31.12.
Asia / Pacific 980 929 2 010 1 901 357 336 987 923 – – 4 334 4 089 – – 4 334 4 089 1 633 1 830 5 967 5 919Europe 1 496 1 373 1 902 2 333 1 052 1 060 1 609 1 557 170 180 6 229 6 503 210 203 6 439 6 706 1 977 2 537 8 416 9 243North America 35 80 1 265 1 237 82 76 302 279 18 20 1 702 1 692 – 1 1 702 1 693 63 72 1 765 1 765Other regions – 7 – – – – 228 227 – – 228 234 5 4 233 238 58 62 291 300
2 511 2 389 5 177 5 471 1 491 1 472 3 126 2 986 188 200 12 493 12 518 215 208 12 708 12 726 3 731 4 501 16 439 17 227
1 Discontinued operations include the divestments of the Solar Segment and the Natural Fibers and Textile Components Business Units.2 For 2011, Oerlikon Solar is shown under discountinued operations while the Natural Fibers and Textile Components Business Units are included in the Textile Segment.3 Operating assets include current and noncurrent operating assets (including goodwill and brands), whereas cash and cash equivalents, current and noncurrent financial invest
ments, current tax receivables as well as deferred tax assets are not included.4 Operating liabilities include current and noncurrent operating liabilities, whereas current and noncurrent financial liabilities, current tax payables and deferred tax liabilities are not
included.

148 Key figures Group Notes OC Oerlikon Corporation AG, Pfäffikon
Segment information
Reconciliation to the segment information
in million CHF 2012 2011
EBIT 421 318Financial income 51 11Financial expense –138 –106EBT 334 223
Operating assets 1 3 319 3 683Nonoperating assets 1 840 890Total assets 4 159 4 573
Operating liabilities 2 1 264 1 478Nonoperating liabilities 2 1 013 1 485Total liabilities 2 277 2 963
1 Including assets classified as held for sale.2 Including liabilities classified as held for sale.
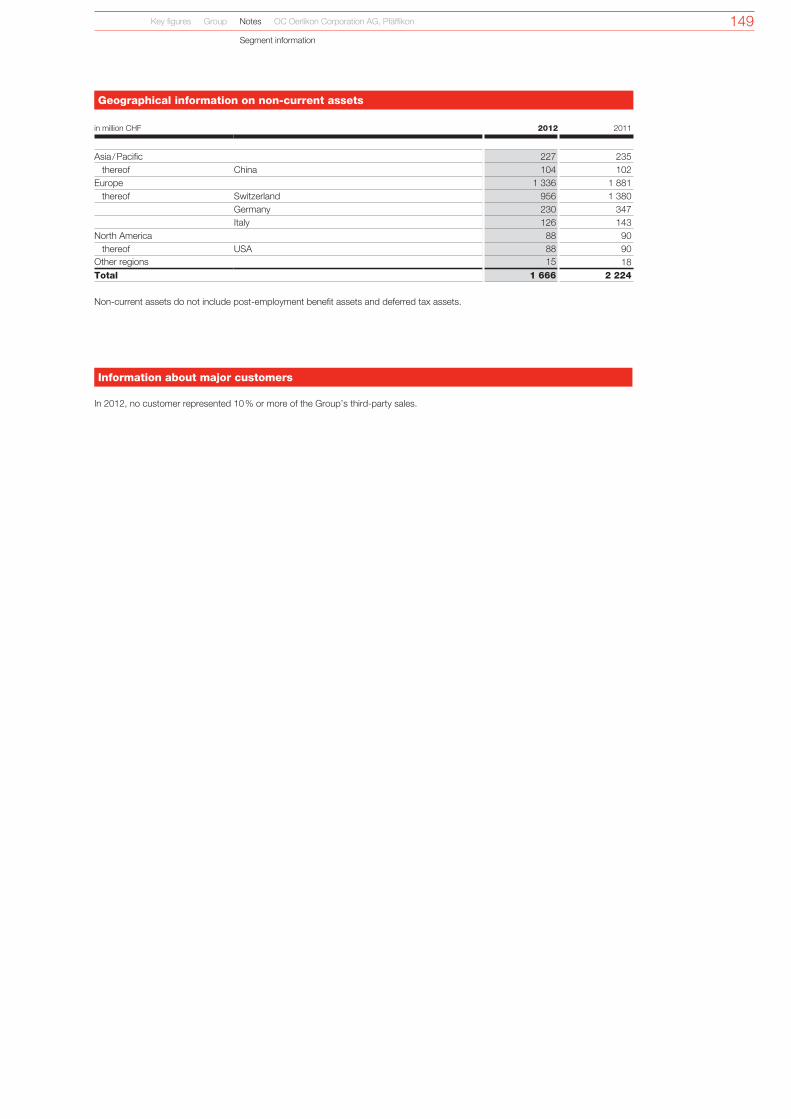
149Key figures Group Notes OC Oerlikon Corporation AG, Pfäffikon
Segment information
Geographical information on non-current assets
in million CHF 2012 2011
Asia / Pacific 227 235 thereof China 104 102Europe 1 336 1 881 thereof Switzerland 956 1 380
Germany 230 347Italy 126 143
North America 88 90 thereof USA 88 90Other regions 15 18Total 1 666 2 224
Noncurrent assets do not include postemployment benefit assets and deferred tax assets.
Information about major customers
In 2012, no customer represented 10 % or more of the Group’s thirdparty sales.

150
Companies by country
Country Pro
duct
ion
Dis
trib
utio
n
R&
D
Ser
vice
Name, registered office of significant companies by country Currency Share capital 1Group
owns %Number of employees
Austria ■ ■ Oerlikon Balzers Coating Austria GmbH, Kapfenberg/AT EUR 350 000 100.00 98Austria ■ Saurer Holding GmbH, Leonding/AT EUR 35 000 100.00 –Belgium ■ ■ Oerlikon Balzers Coating Benelux N.V., SintTruiden/BE EUR 620 000 100.00 51Brazil ■ ■ Oerlikon Balzers Revestimentos Metálicos Ltda., Jundiaí, SP/BR BRL 30 662 100 99.99 132Brazil ■ ■ Oerlikon Textile do Brasil Máquinas Ltda., São Leopoldo, RS/BR BRL 9 384 968 100.00 36Cayman Islands ■ Saurer Group Investments Ltd., George Town/KY CHF 474 469 300 100.00 –China ■ ■ Jintan Texparts Component Co. Ltd., Jintan/CN USD 5 062 288 70.00 164China ■ ■ ■ Oerlikon (China) Technology Co. Ltd., Suzhou/CN USD 30 000 000 100.00 800China ■ ■ Oerlikon Balzers Coating (Suzhou) Co. Ltd., Suzhou/CN USD 6 150 000 100.00 311China ■ ■ Oerlikon Drive Systems (Suzhou) Co. Ltd., Suzhou/CN USD 2 000 000 100.00 149China ■ Oerlikon Leybold Vacuum (Tianjin) International Trade Co. Ltd., Tianjin/CN USD 200 000 100.00 102China ■ ■ Oerlikon Leybold Vacuum Equipment (Tianjin) Co. Ltd., Tianjin/CN USD 4 960 000 100.00 121China ■ Oerlikon Textile China Investments Ltd., Hongkong/CN HKD 266 052 505 100.00 –China ■ ■ Oerlikon Textile Far East Ltd., Hongkong/CN HKD 100 000 100.00 37China ■ ■ ■ Oerlikon Textile Machinery (Wuxi) Co. Ltd., Wuxi/CN USD 7 000 000 100.00 199China ■ ■ ■ ■ Oerlikon Textile Technology (Beijing) Co. Ltd., Beijing/CN USD 1 112 220 100.00 201China ■ Oerlikon Textile Trading and Services Ltd., Hongkong/CN HKD 275 200 100.00 –China ■ Saurer China Equity Ltd., Hongkong/CN HKD 253 910 000 100.00 –China ■ ■ ■ ■ Saurer Jintan Textile Machinery Co. Ltd., Jintan/CN USD 22 482 422 70.00 477Czech Republic ■ ■ ■ Oerlikon Czech s.r.o., Cerveny Kostelec/CZ CZK 30 000 000 100.00 38Finland ■ ■ Oerlikon Balzers Sandvik Coating Oy, Helsinki/FI EUR 2 500 51.00 7France ■ ■ Oerlikon Balzers Coating France SAS, SaintThibaultdesVignes/FR EUR 3 150 000 100.00 103France ■ Oerlikon France Holding SAS, SaintThibaultdesVignes/FR EUR 4 000 000 100.00 –France ■ ■ ■ ■ Oerlikon Leybold Vacuum France SAS, VillebonsurYvette/FR EUR 3 095 750 100.00 173Germany ■ Afetau GmbH, Remscheid/DE EUR 25 000 100.00 –Germany ■ ■ Oerlikon Balzers Coating Germany GmbH, Bingen/DE EUR 511 300 100.00 556Germany ■ ■ ■ Oerlikon Balzers Hartec GmbH, Stetten am kalten Markt/DE EUR 25 000 100.00 47Germany ■ Oerlikon Deutschland Holding GmbH, Köln/DE EUR 30 680 000 100.00 –Germany ■ Oerlikon Deutschland Vertriebs GmbH, Aschheim/DE EUR 26 000 100.00 27Germany ■ ■ Oerlikon Leybold Vacuum Dresden GmbH, Dresden/DE EUR 100 000 100.00 59Germany ■ ■ ■ ■ Oerlikon Leybold Vacuum GmbH, Köln/DE EUR 1 200 000 100.00 761Germany ■ Oerlikon Real Estate GmbH, Köln/DE EUR 50 000 100.00 –Germany ■ ■ ■ Oerlikon Textile Components GmbH, Fellbach/DE EUR 51 400 100.00 254Germany ■ ■ ■ ■ Oerlikon Textile GmbH & Co. KG, Remscheid/DE EUR 41 000 000 100.00 2 809Germany ■ Oerlikon Vacuum Holding GmbH, Köln/DE EUR 25 000 100.00 –Germany ■ Oerlikon Vermietungs und Verwaltungsgesellschaft mbH, Köln/DE EUR 25 000 100.00 –Germany ■ Oerlikon VermögensVerwaltungs GmbH, Köln/DE EUR 25 000 100.00 –Germany ■ W. Reiners VerwaltungsGmbH, Remscheid/DE EUR 38 346 900 100.00 –Great Britain ■ ■ Graziano Trasmissioni UK Ltd., St. Neots/UK GBP 40 000 100.00 7Great Britain ■ ■ Oerlikon Balzers Coating UK Ltd., Milton Keynes/UK GBP 2 000 000 100.00 45Great Britain ■ ■ ■ Oerlikon Fibrevision Ltd., Macclesfield/UK GBP 48 78.00 26Great Britain ■ ■ Oerlikon Leybold Vacuum UK Ltd., Chessington/UK GBP 300 000 100.00 24Great Britain ■ Oerlikon Optics UK Ltd., London/UK GBP 1 100.00 –Great Britain ■ ■ Vocis Limited, Warwick/UK GBP 200 51.00 25India ■ ■ Fairfield Atlas Ltd., Kolhapur/IN INR 273 205 400 83.87 734India ■ ■ Graziano Trasmissioni India Pvt. Ltd., New Delhi/IN INR 267 124 880 100.00 1 127India ■ ■ Oerlikon Balzers Coating India Ltd., Pune/IN INR 70 000 000 100.00 227India ■ Oerlikon Leybold Vacuum India Pvt. Ltd., Pune/IN INR 2 000 000 100.00 20India ■ ■ ■ Oerlikon Textile India Pvt. Ltd., Mumbai/IN INR 57 360 000 100.00 342India ■ ■ ■ ■ Peass Industrial Engineers Pvt. Ltd., Gujarat/IN INR 15 000 000 51.00 146India ■ ■ ■ ■ Zinser Textile Systems Pvt. Ltd., Ahmedabad/IN INR 45 500 000 70.00 40Italy ■ ■ Oerlikon Balzers Coating Italy S.p.A., Brugherio/IT EUR 130 000 100.00 80Italy ■ Oerlikon Graziano Group S.p.A., Torino/IT EUR 59 669 000 100.00 –Italy ■ ■ ■ ■ Oerlikon Graziano S.p.A., Cascine Vica Rivoli/IT EUR 58 697 357 100.00 1 869Italy ■ ■ Oerlikon Leybold Vacuum Italia S.r.l., Milano/IT EUR 110 000 100.00 12Japan ■ Oerlikon Leybold Vacuum Japan Co. Ltd., Yokohama/JP JPY 450 000 000 100.00 35Japan ■ ■ Oerlikon Nihon Balzers Coating Co. Ltd., Hiratsuka/JP JPY 100 000 000 100.00 135Liechtenstein ■ ■ ■ ■ OC Oerlikon Balzers AG, Balzers/LI CHF 30 000 000 100.00 617Luxembourg ■ ■ Oerlikon Balzers Coating Luxembourg S.à r.l., DifferdangeNiedercorn/LU EUR 1 000 000 60.00 19Malaysia ■ ■ Oerlikon Balzers Coating Malaysia Sdn. Bhd., Puchong/MY MYR 2 000 000 100.00 17Mexico ■ ■ Oerlikon Balzers Coating Mexico S.A. de C.V., Querétaro/MX MXN 71 458 000 100.00 85Netherlands ■ ■ Oerlikon Leybold Vacuum Nederland B.V., Utrecht/NL EUR 463 000 100.00 7Netherlands ■ SAC Saurer Automotive Components B.V., Rotterdam/NL EUR 11 500 000 100.00 –Poland ■ ■ Oerlikon Balzers Coating Poland Sp.z o.o., Polkowice Dolne/PL PLN 5 000 000 100.00 64Russia ■ ■ ■ OOO Oerlikon Balzers Rus, Elektrostal/RU RUB 1 000 000 100.00 11
Key figures Group Notes OC Oerlikon Corporation AG, Pfäffikon
Companies by country
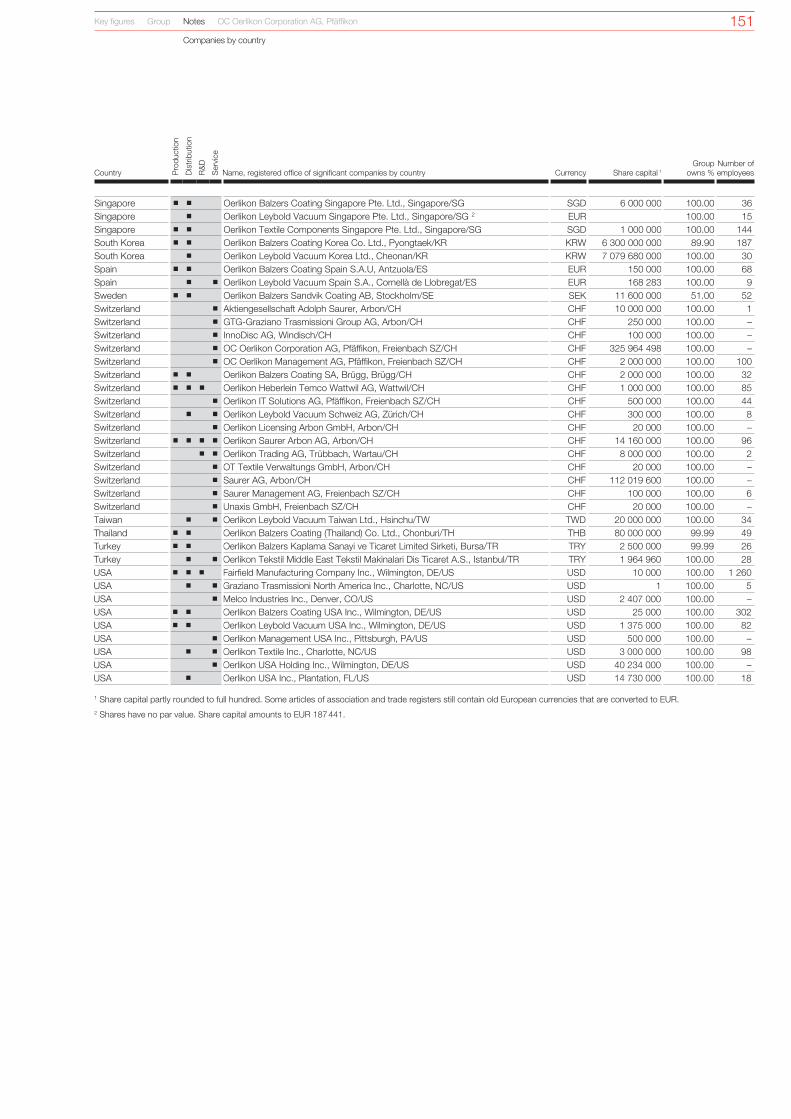
151
Country Pro
duct
ion
Dis
trib
utio
n
R&
D
Ser
vice
Name, registered office of significant companies by country Currency Share capital 1Group
owns %Number of employees
Singapore ■ ■ Oerlikon Balzers Coating Singapore Pte. Ltd., Singapore/SG SGD 6 000 000 100.00 36Singapore ■ Oerlikon Leybold Vacuum Singapore Pte. Ltd., Singapore/SG 2 EUR 100.00 15Singapore ■ ■ Oerlikon Textile Components Singapore Pte. Ltd., Singapore/SG SGD 1 000 000 100.00 144South Korea ■ ■ Oerlikon Balzers Coating Korea Co. Ltd., Pyongtaek/KR KRW 6 300 000 000 89.90 187South Korea ■ Oerlikon Leybold Vacuum Korea Ltd., Cheonan/KR KRW 7 079 680 000 100.00 30Spain ■ ■ Oerlikon Balzers Coating Spain S.A.U, Antzuola/ES EUR 150 000 100.00 68Spain ■ ■ Oerlikon Leybold Vacuum Spain S.A., Cornellà de Llobregat/ES EUR 168 283 100.00 9Sweden ■ ■ Oerlikon Balzers Sandvik Coating AB, Stockholm/SE SEK 11 600 000 51.00 52Switzerland ■ Aktiengesellschaft Adolph Saurer, Arbon/CH CHF 10 000 000 100.00 1Switzerland ■ GTGGraziano Trasmissioni Group AG, Arbon/CH CHF 250 000 100.00 –Switzerland ■ InnoDisc AG, Windisch/CH CHF 100 000 100.00 –Switzerland ■ OC Oerlikon Corporation AG, Pfäffikon, Freienbach SZ/CH CHF 325 964 498 100.00 –Switzerland ■ OC Oerlikon Management AG, Pfäffikon, Freienbach SZ/CH CHF 2 000 000 100.00 100Switzerland ■ ■ Oerlikon Balzers Coating SA, Brügg, Brügg/CH CHF 2 000 000 100.00 32Switzerland ■ ■ ■ Oerlikon Heberlein Temco Wattwil AG, Wattwil/CH CHF 1 000 000 100.00 85Switzerland ■ Oerlikon IT Solutions AG, Pfäffikon, Freienbach SZ/CH CHF 500 000 100.00 44Switzerland ■ ■ Oerlikon Leybold Vacuum Schweiz AG, Zürich/CH CHF 300 000 100.00 8Switzerland ■ Oerlikon Licensing Arbon GmbH, Arbon/CH CHF 20 000 100.00 –Switzerland ■ ■ ■ ■ Oerlikon Saurer Arbon AG, Arbon/CH CHF 14 160 000 100.00 96Switzerland ■ ■ Oerlikon Trading AG, Trübbach, Wartau/CH CHF 8 000 000 100.00 2Switzerland ■ OT Textile Verwaltungs GmbH, Arbon/CH CHF 20 000 100.00 –Switzerland ■ Saurer AG, Arbon/CH CHF 112 019 600 100.00 –Switzerland ■ Saurer Management AG, Freienbach SZ/CH CHF 100 000 100.00 6Switzerland ■ Unaxis GmbH, Freienbach SZ/CH CHF 20 000 100.00 –Taiwan ■ ■ Oerlikon Leybold Vacuum Taiwan Ltd., Hsinchu/TW TWD 20 000 000 100.00 34Thailand ■ ■ Oerlikon Balzers Coating (Thailand) Co. Ltd., Chonburi/TH THB 80 000 000 99.99 49Turkey ■ ■ Oerlikon Balzers Kaplama Sanayi ve Ticaret Limited Sirketi, Bursa/TR TRY 2 500 000 99.99 26Turkey ■ ■ Oerlikon Tekstil Middle East Tekstil Makinalari Dis Ticaret A.S., Istanbul/TR TRY 1 964 960 100.00 28USA ■ ■ ■ Fairfield Manufacturing Company Inc., Wilmington, DE/US USD 10 000 100.00 1 260USA ■ ■ Graziano Trasmissioni North America Inc., Charlotte, NC/US USD 1 100.00 5USA ■ Melco Industries Inc., Denver, CO/US USD 2 407 000 100.00 –USA ■ ■ Oerlikon Balzers Coating USA Inc., Wilmington, DE/US USD 25 000 100.00 302USA ■ ■ Oerlikon Leybold Vacuum USA Inc., Wilmington, DE/US USD 1 375 000 100.00 82USA ■ Oerlikon Management USA Inc., Pittsburgh, PA/US USD 500 000 100.00 –USA ■ ■ Oerlikon Textile Inc., Charlotte, NC/US USD 3 000 000 100.00 98USA ■ Oerlikon USA Holding Inc., Wilmington, DE/US USD 40 234 000 100.00 –USA ■ Oerlikon USA Inc., Plantation, FL/US USD 14 730 000 100.00 18
1 Share capital partly rounded to full hundred. Some articles of association and trade registers still contain old European currencies that are converted to EUR. 2 Shares have no par value. Share capital amounts to EUR 187 441.
Key figures Group Notes OC Oerlikon Corporation AG, Pfäffikon
Companies by country

152
Report of the Statutory Auditor
Report of the Statutory Auditor on the Consolidated Financial Statements to the Annual General Meeting of Shareholders of OC Oerlikon Corporation AG, Pfäffikon, Freienbach
As statutory auditor, we have audited the accompanying consolidated financial statements of OC Oerlikon Corporation AG, Pfäffikon, which comprise the consolidated income statement, consolidated statement of comprehensive income, consolidated balance sheet, consolidated cash flow statement, consolidated statement of changes in equity and notes on pages 103 to 149 for the year ended 31 December 2012.
Board of Directors’ ResponsibilityThe board of directors is responsible for the preparation and fair presentation of the consolidated financial statements in accordance with International Financial Reporting Standards (IFRS) and the requirements of Swiss law. This responsibility includes designing, implementing and maintaining an internal control system relevant to the preparation and fair presentation of consolidated financial statements that are free from material misstatement, whether due to fraud or error. The board of directors is further responsible for selecting and applying appropriate accounting policies and making accounting estimates that are reasonable in the circumstances.
Auditor’s ResponsibilityOur responsibility is to express an opinion on these consolidated financial statements based on our audit. We conducted our audit in accordance with Swiss law and Swiss Auditing Standards as well as International Standards on Auditing. Those standards require that we plan and perform the audit to obtain reasonable assurance whether the consolidated financial statements are free from material misstatement.
An audit involves performing procedures to obtain audit evidence about the amounts and disclosures in the consolidated financial statements. The procedures selected depend on the auditor’s judgment, including the assessment of the risks of material misstatement of the consolidated financial statements, whether due to fraud or error. In making those risk assessments, the auditor considers the internal control system relevant to the entity’s preparation and fair presentation of the consolidated financial statements in order to design audit procedures that are appropriate in the circumstances, but not for the purpose of expressing an opinion on the effectiveness of the entity’s internal control system. An audit also includes evaluating the appropriateness of the accounting policies used and the reasonableness of accounting estimates made, as well as evaluating the overall presentation of the consolidated financial statements. We believe that the audit evidence we have obtained is sufficient and appropriate to provide a basis for our audit opinion.
OpinionIn our opinion, the consolidated financial statements for the year ended 31 December 2012 give a true and fair view of the financial position, the results of operations and the cash flows in accordance with International Financial Reporting Standards (IFRS) and comply with Swiss law.
Report on Other Legal RequirementsWe confirm that we meet the legal requirements on licensing according to the Auditor Oversight Act (AOA) and independence (article 728 CO and article 11 AOA) and that there are no circumstances incompatible with our independence.
In accordance with article 728a paragraph 1 item 3 CO and Swiss Auditing Standard 890, we confirm that an internal control system exists, which has been designed for the preparation of consolidated financial statements according to the instructions of the board of directors.
We recommend that the consolidated financial statements submitted to you be approved.
KPMG AG
Thomas Affolter Toni WattenhoferLicensed Audit Expert Licensed Audit ExpertAuditor in Charge
Zurich, March 1, 2013
Key figures Group Notes OC Oerlikon Corporation AG, Pfäffikon
Report of the Statutory Auditor

153
Five-year summary of key figures
in CHF million 2012 2011 2010 2009 2008
Order intake 1 2 802 2 878 4 520 2 996 4 209Order backlog 1 834 971 1 702 997 1 147Sales 1 2 906 2 731 3 601 2 877 4 632EBITDA 1 547 450 278 –165 471– as % of sales 19 % 16 % 8 % –6 % 10 %EBIT 1 421 318 51 –589 –59– as % of sales 14 % 12 % 1 % –20 % –1 %Net profit/loss 385 224 5 –592 –422– as % of equity attributable to shareholders of the parent 21 % 14 % 0 % –120 % –39 %Cash flow from operating activities 2 414 544 354 –92 411Capital expenditure for property, plant and equipment and intangible assets 3
181
167
150
130
336
Total assets 4 159 4 573 4 475 4 342 5 476Equity attributable to shareholders of the parent 1 858 1 586 1 430 493 1 093– as % of total assets 45 % 35 % 32 % 11 % 20 %Net cash 4 339 –86 –274 –1 646 –1 585Net Operating Assets 3, 5 1 575 2 205 2 196 2 821 3 498Number of employees 1 12 708 12 726 16 657 16 369 18 372Personnel expense 1 765 740 1 015 1 001 1 277Research and development expenditure 1, 6 106 102 239 210 246
1 2012, 2011, 2009 and 2008 continuing operations.2 Before changes in net current assets.3 2012: continuing operations; 2011, 2010, 2009 and 2008: as reported.4 Net cash includes cash and cash equivalents and marketable securities less current and noncurrent debt.5 Net Operating Assets include current and noncurrent operating assets (including goodwill and brands and excluding cash and cash equivalents, financial assets, current and
deferred tax receivables) less operating liabilities (excluding financial liabilities, current tax payables and deferred tax liabilities).6 Research and development expenditure includes expense recognized as intangible assets.
Key figures Group Notes OC Oerlikon Corporation AG, Pfäffikon
Fiveyear summary of key figures


155
OC OerlikonCorporation AG, Pfäffikon
Key figures Group Notes OC Oerlikon Corporation AG, Pfäffikon

156
Income Statement of OC Oerlikon Corporation AG, Pfäffikon
in CHF Notes 2012 2011
Income from investments 2 197 828 748 22 702 828Financial income 3 53 832 108 62 715 438Other income 5 47 947 263 61 738 387
299 608 119 147 156 653
Financial expense 4 –97 363 077 –85 918 066Other expense 6 –55 245 859 –35 396 775
146 999 183 25 841 812
Gain on disposal of investments 7 52 733 668 440 208Valuation adjustments on loans and investments in subsidiaries –11 043 810 –9 322 865
Net income 188 689 041 16 959 155
Key figures Group Notes OC Oerlikon Corporation AG, Pfäffikon
Income statement of OC Oerlikon Corporation AG, Pfäffikon
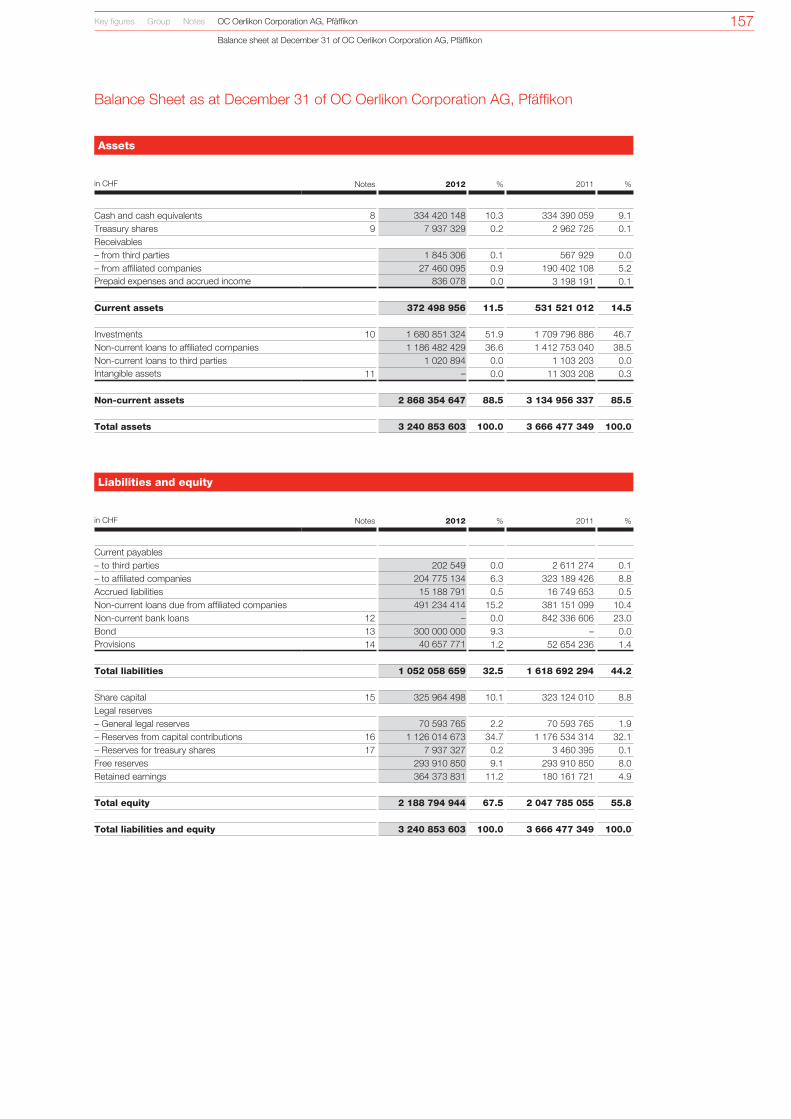
157
Balance Sheet as at December 31 of OC Oerlikon Corporation AG, Pfäffikon
Assets
in CHF Notes 2012 % 2011 %
Cash and cash equivalents 8 334 420 148 10.3 334 390 059 9.1Treasury shares 9 7 937 329 0.2 2 962 725 0.1Receivables– from third parties 1 845 306 0.1 567 929 0.0– from affiliated companies 27 460 095 0.9 190 402 108 5.2Prepaid expenses and accrued income 836 078 0.0 3 198 191 0.1
Current assets 372 498 956 11.5 531 521 012 14.5
Investments 10 1 680 851 324 51.9 1 709 796 886 46.7Noncurrent loans to affiliated companies 1 186 482 429 36.6 1 412 753 040 38.5Noncurrent loans to third parties 1 020 894 0.0 1 103 203 0.0Intangible assets 11 – 0.0 11 303 208 0.3
Non-current assets 2 868 354 647 88.5 3 134 956 337 85.5
Total assets 3 240 853 603 100.0 3 666 477 349 100.0
Liabilities and equity
in CHF Notes 2012 % 2011 %
Current payables– to third parties 202 549 0.0 2 611 274 0.1– to affiliated companies 204 775 134 6.3 323 189 426 8.8Accrued liabilities 15 188 791 0.5 16 749 653 0.5Noncurrent loans due from affiliated companies 491 234 414 15.2 381 151 099 10.4Noncurrent bank loans 12 – 0.0 842 336 606 23.0Bond 13 300 000 000 9.3 – 0.0Provisions 14 40 657 771 1.2 52 654 236 1.4
Total liabilities 1 052 058 659 32.5 1 618 692 294 44.2
Share capital 15 325 964 498 10.1 323 124 010 8.8Legal reserves– General legal reserves 70 593 765 2.2 70 593 765 1.9– Reserves from capital contributions 16 1 126 014 673 34.7 1 176 534 314 32.1– Reserves for treasury shares 17 7 937 327 0.2 3 460 395 0.1Free reserves 293 910 850 9.1 293 910 850 8.0Retained earnings 364 373 831 11.2 180 161 721 4.9
Total equity 2 188 794 944 67.5 2 047 785 055 55.8
Total liabilities and equity 3 240 853 603 100.0 3 666 477 349 100.0
Key figures Group Notes OC Oerlikon Corporation AG, Pfäffikon
Balance sheet at December 31 of OC Oerlikon Corporation AG, Pfäffikon

158
GeneralReporting basis (1)The financial statements of OC Oerlikon Corporation AG, Pfäffikon (the Company) are prepared in compliance with Swiss Company Law. They are a supplement to the consolidated financial statements, prepared according to International Financial Reporting Standards (IFRS). While the consolidated financial statements reflect the economic situation of the Group as a whole, the information contained in the financial statements of OC Oerlikon Corporation AG, Pfäffikon relates to the ultimate parent company alone.
Income statement Income from investments (2) The income from investments consists only of dividend income from subsidiary companies.
Financial income (3) Financial income includes interest income.
Financial expense (4)Financial expense mainly includes interest expenses and net exchange losses. In addition, onetime charges amounting to CHF 50 million have been incurred in connection with the replacement of the old syndicated credit facility.
Other income (5)Other income consists mainly of trade mark fees.
Other expense (6) Other expense consists mainly of management fees charged by OC Oerlikon Management AG, Pfäffikon and amortization of capitalized brands.
Gain on disposal of investments (7)Gain on disposal of investments is driven by the gain from the sale of the investment in Oerlikon Solar Holding AG in connection with the disposal of the Solar Segment, and the gain from the sale of the investment in Pilatus Flugzeugwerke AG.
Balance sheetCash and cash equivalents (8) This item consists of current balances denominated in CHF, EUR and USD and held with European Banks.
Treasury shares (9) The total of 902 248 treasury shares (2011: 589 011) held at December 31, 2012 represents 0.28 % of the company’s share capital.
The treasury shares are carried at the lower of cost or market, (and therefore have been valued at their cost value) at close of business on December 31, 2012 (CHF 8.80), giving a total value of CHF 8 million (2011: CHF 3 million).
During the year, 700 000 shares (2011: 570 000) were bought on the stock exchange, and 317 147 shares (2011: 280 989) were given to employees and further 69 616 shares were transferred to warrant holders (2011: 0).
Investments (10)The list of the Company’s major investments is on page 160.
These investments are recorded at historical cost less any valuation adjustments. The change in the net book value is mainly caused by disposals of investments.
Having met the security release condition specified in the syndicated loan facility agreement, the pledges on the investments in major subsidiaries, amounting to CHF 1 608 million as of December 31, 2011, have been released in 2012.
Intangible assets (11)All intangible assets (trademarks of Oerlikon and Saurer) are fully amortized, as of December 31, 2012.
Bank loans (12) No bank loans are used by end of the year (2011: CHF 842 million). Additional information to the terms and conditions of the syndicated loan and the financial covenants can be found in Note 19 of the Group’s consolidated financial statements on page 134 and 135.
Bond (13)On June 13, 2012 OC Oerlikon Corporation AG, Pfäffikon issued CHF 300 million of bonds bearing interest at 4.25 % per annum and due on July 13, 2016. The first interest coupon is payable on July 13, 2013. Additional information of the bond can be found in Note 19 of the Group’s consolidated financial statements on page 134 and 135.
Provisions (14) Provisions cover mainly risks related to investments and also other risks.
Share capital (15) The share capital of CHF 326 million (2011: CHF 323 million) consists of 325 964 498 registered shares (2011: 323 124 010), each with a par value of CHF 1.00. On December 31, 2012, conditional capital amounted to CHF 61 334 431 (2011: CHF 64 174 919).
In 2012, 2 840 488 new shares (2011: 38 539) were issued based on exercises of warrants.
The shareholders registered as holding more than 5 % of the shares as at December 31, 2012, were 1:
47.92 % (156 210 954 registered shares 2) Renova Group 3 (composed of Liwet Holding AG, Zurich, Switzerland, Renova Industries Ltd., Nassau, Bahamas, and Lamesa Holding S.A., Panama, Republic of Panama)
5.57 % (18 170 486 registered shares 4) Chase Nominees Ltd, London
1 Sources: Disclosure notification pursuant to Art. 20 of the Swiss Stock Exchange Law by Renova Group (published by SIX Exchange Regulation on September 6, 2012) and share register (Chase Nominees Ltd).
2 At the end of 2011, the Renova Group held (as per disclosure notification) 155 035 964 shares (47.98 % of the issued Oerlikon shares).
3 Beneficial owner (as per disclosure notification): Viktor F. Vekselberg, Zug and Moscow.4 At the end of 2011, Chase Nominees Ltd, London, held (according to the share register) 9 501 954 shares (2.94 % of the issued Oerlikon shares).
Reserves from capital contributions (16)OC Oerlikon Corporation AG, Pfäffikon shows as of December 31, 2012, reserves from capital contributions of CHF 1 126 014 673. Thereof, based on a socalled revers CHF 268 706 303 has not been confirmed yet due to the current practice of the Swiss Federal Tax Authorities. Dividend distributions can be done out of the confirmed reserve from capital contribution first. Confirmed reserve from capital contributions amounts to CHF 857 308 370. In 2012, the value of confirmed reserves of capital contribution has been changed due to dividend payment of minus CHF 64 533 138, as well as plus capital surplus of CHF 14 013 497 (net amount), due to capital increase triggered by exercises of warrants.
in CHF confirmed not confirmed yet Total
Balance at January 1, 2012
907 828 011
268 706 303
1 176 534 314
Dividend payment –64 533 138 – –64 533 138 Exercises of warrants 14 013 497 – 14 013 497
Balance at December 31, 2012
857 308 370
268 706 303
1 126 014 673
Notes to the financial statements of OC Oerlikon Corporation AG, Pfäffikon
Key figures Group Notes OC Oerlikon Corporation AG, Pfäffikon
Notes to the financial statements of OC Oerlikon Corporation AG, Pfäffikon

159
Reserves for treasury shares (17) This reserve represents the acquisition cost of 902 248 treasury shares (2011: 589 011).
Contingent liabilities (18) Contingent liabilities relate primarily to performance guarantees and guarantees for bank loans of affiliated companies, and amount to approximately CHF 284 million (2011: CHF 330 million).
Pledged assets (19)Having met the security release condition specified in the syndicated loan facility agreement, the pledges on the investments in major subsidiaries (see Note 10) and other pledged assets have been released in 2012.
Disclosure of directors’ remunerations (20)The disclosure of directors’ remunerations as required by Swiss Company Law may be found in Note 24 on pages 142 to 144 of the Group’s consolidated financial statements.
Risk assessment according to the Swiss Code of Obligations (OR 663b, Z. 12) (21)Oerlikon has a risk management system in place, with which the enterprisewide risk management is centrally managed and decentrally implemented. Risk assessments are conducted at various levels, and corresponding risk reports are prepared.
From a methodological perspective, risk assessments are conducted according to a standard procedure comprising the following steps: preparation of the risk assessment, identification of risks, risk evaluation and planning of risk mitigation actions. The process is supported Groupwide by a risk management software.
Internal reporting requirements to the Executive Committee and the Board of Directors (the Audit Committee and the entire Board) are fulfilled by the Group Risk Report that outlines relevant risks and risk mitigation actions from a Group perspective. The Group Risk Report is published twice a year, discussed by the Executive Committee and subsequently considered by the Board of Directors (the Audit Committee and the entire Board).
In its meeting on August 29, 2012, the Audit Committee discussed the Group Risk Report 2012–14 and related its findings to the Board of Directors. The Board of Directors reviewed the Group Risk Report 2013–15 in its meeting on December 6, 2012.
For further information regarding risk management, see page 74 (section 6.0 Corporate Governance), page 96 et seq. (section 8.0 Risk management) and page 134 et seq. (Notes 19–21 to the consolidated financial statements).
Key figures Group Notes OC Oerlikon Corporation AG, Pfäffikon
Notes to the financial statements of OC Oerlikon Corporation AG, Pfäffikon

160
Investments
Company Currency Share capital Investment in %
Aktiengesellschaft Adolph Saurer, Arbon/CH CHF 10 000 000 100.00InnoDisc AG, Windisch/CH CHF 100 000 100.00OC Oerlikon Balzers AG, Balzers/LI CHF 30 000 000 100.00OC Oerlikon Management AG, Pfäffikon, Freienbach SZ/CH CHF 2 000 000 100.00Oerlikon Balzers Coating India Ltd., Pune/IN INR 70 000 000 78.40Oerlikon Balzers Coating (Suzhou) Co. Ltd., Suzhou/CN USD 6 150 000 100.00Oerlikon Balzers Coating (Thailand) Co. Ltd., Chonburi/TH THB 80 000 000 99.99Oerlikon Balzers Coating Austria GmbH, Kapfenberg/AT EUR 350 000 100.00Oerlikon Balzers Coating Italy S.p.A., Brugherio/IT EUR 129 100 100.00Oerlikon Balzers Coating Korea Co. Ltd., Pyongtaek/KR KRW 6 300 000 000 89.10Oerlikon Balzers Coating Luxembourg S.à r.l., DifferdangeNiedercorn/LU EUR 1 000 000 60.00Oerlikon Balzers Coating Poland Sp.z o.o., Polkowice Dolne/PL PLN 5 000 000 100.00Oerlikon Balzers Coating SA, Brügg, Brügg/CH CHF 2 000 000 100.00Oerlikon Balzers Coating Singapore Pte. Ltd., Singapore/SG SGD 6 000 000 100.00Oerlikon Balzers Coating UK Ltd., Milton Keynes/UK GBP 2 000 000 99.99Oerlikon Balzers Kaplama Sanayi ve Ticaret Limited Sirketi, Bursa/TR TRY 2 500 000 99.99Oerlikon Balzers Revestimentos Metálicos Ltda., Jundiaí, SP/BR BRL 30 662 100 99.99Oerlikon Balzers Sandvik Coating AB, Stockholm/SE SEK 11 600 000 51.00Oerlikon Balzers Coating Spain S.A.U, Antzuola/ES EUR 150 300 100.00Oerlikon Deutschland Holding GmbH, Köln/DE EUR 30 680 000 6.00Oerlikon France Holding SAS, SaintThibaultdesVignes/FR EUR 4 000 000 100.00Oerlikon IT Solutions AG, Pfäffikon, Freienbach SZ/CH CHF 500 000 100.00Oerlikon Leybold Vacuum Taiwan Ltd., Hsinchu/TW TWD 20 000 000 100.00Oerlikon Licensing Arbon GmbH, Arbon/CH CHF 20 000 100.00Oerlikon Nihon Balzers Coating Co. Ltd., Hiratsuka/JP JPY 100 000 000 100.00Oerlikon Optics UK Ltd., London/UK GBP 1 100.00Oerlikon Trading AG, Trübbach, Wartau/CH CHF 8 000 000 100.00Oerlikon USA Holding Inc., Wilmington, DE/US USD 40 234 000 62.00Oerlikon VermögensVerwaltungs GmbH, Köln/DE EUR 25 000 100.00OOO Oerlikon Balzers Rus, Elektrostal/RU RUB 1 000 000 100.00OT Textile Verwaltungs GmbH, Arbon/CH CHF 20 000 100.00PT. Oerlikon Balzers Artoda Indonesien IDR 1 8000 000 000 42.00Saurer AG, Arbon/CH CHF 112 019 600 100.00Saurer Management AG, Freienbach SZ/CH CHF 100 000 100.00Unaxis GmbH, Freienbach SZ/CH CHF 20 000 100.00
Key figures Group Notes OC Oerlikon Corporation AG, Pfäffikon
Notes to the financial statements of OC Oerlikon Corporation AG, Pfäffikon

161
Changes in equity of OC Oerlikon Corporation AG, Pfäffikon
General Reserves Reserves TotalShare legal from capital for treasury Free Retained shareholders
in CHF million capital reserves contributions shares reserves earnings equity
Balance at January 1, 2010 282.8 196.8 0.0 291.6 235.0 –62.9 943.3
Changes in capital decrease and capital increase
40.2
–
–
–
1 109.0
–
1 149.2
Changes in reserves for treasury shares – – – –290.1 – 290.1 –Net loss 2010 – – – – – –62.0 –62.0
Balance at December 31, 2010 323.0 196.8 – 1.5 1 344.0 165.2 2 030.5
Changes in capital increase 0.1 – 0.2 – – – 0.3Changes in reserves from capital contributions – –126.2 1 176.3 – –1 050.1 – –Changes in reserves for treasury shares – – – 2.0 – –2.0 –Net income 2011 – – – – – 17.0 17.0
Balance at December 31, 2011 323.1 70.6 1 176.5 3.5 293.9 180.1 2 047.7
Changes in capital increase 2.9 – 14.0 – – – 16.9Changes in reserves for treasury shares – – – 4.4 – –4.4 –Dividend payment – – –64.5 – – – –64.5Net income 2012 – – – – – 188.7 188.7
Balance at December 31, 2012 326.0 70.6 1 126.0 7.9 293.9 364.4 2 188.8
Key figures Group Notes OC Oerlikon Corporation AG, Pfäffikon
Notes to the financial statements of OC Oerlikon Corporation AG, Pfäffikon
Proposal of the Board of Directors
The available earnings amount to:
in CHF 2012
Balance brought forward from previous year 180 161 721Net income 2012 188 689 041Release in reserves for treasury shares –4 476 931
Available earnings 364 373 831
The Board of Directors proposes to the Annual General Meeting of Shareholders that the available earnings are to be appropriated as follows:
Balance to be carried forward 364 373 831
The Board of Directors proposes to the Annual General Meeting of Shareholders a distribution of a dividend, distributed from reserves from capital contributions:
Dividend from reserves from capital contributions (without withholding tax) of CHF 0.25 on dividend bearing shares with a nominal value of CHF 1.00 each 85 250 000
The company will not pay dividend on treasury shares held by OC Oerlikon Corporation AG, Pfäffikon. The proposed dividend includes the maximum number of shares which could be issued from the conditional capital, as a result of the exercise of warrants, before the date of dividend payments.
Pfäffikon SZ, March 1, 2013
On behalf of the Board of DirectorsChairman
Tim Summers

162
Report of the Statutory Auditor
Report of the Statutory Auditor on the Financial Statements to the Annual General Meeting of Shareholders of OC Oerlikon Corporation AG, Pfäffikon, Freienbach
As statutory auditor, we have audited the accompanying statutory financial statements of OC Oerlikon Corporation AG, Pfäffikon, which comprise the balance sheet, income statement and notes on pages 156 to 161 for the year ended 31 December 2012.
Board of Directors’ ResponsibilityThe board of directors is responsible for the preparation of the financial statements in accordance with the requirements of Swiss law and the company’s articles of incorporation. This responsibility includes designing, implementing and maintaining an internal control system relevant to the preparation of financial statements that are free from material misstatement, whether due to fraud or error. The board of directors is further responsible for selecting and applying appropriate accounting policies and making accounting estimates that are reasonable in the circumstances.
Auditor’s ResponsibilityOur responsibility is to express an opinion on these financial statements based on our audit. We conducted our audit in accordance with Swiss law and Swiss Auditing Standards. Those standards require that we plan and perform the audit to obtain reasonable assurance whether the financial statements are free from material misstatement.
An audit involves performing procedures to obtain audit evidence about the amounts and disclosures in the financial statements. The procedures selected depend on the auditor’s judgment, including the assessment of the risks of material misstatement of the financial statements, whether due to fraud or error. In making those risk assessments, the auditor considers the internal control system relevant to the entity’s preparation of the financial statements in order to design audit procedures that are appropriate in the circumstances, but not for the purpose of expressing an opinion on the effectiveness of the entity’s internal control system. An audit also includes evaluating the appropriateness of the accounting policies used and the reasonableness of accounting estimates made, as well as evaluating the overall presentation of the financial statements. We believe that the audit evidence we have obtained is sufficient and appropriate to provide a basis for our audit opinion.
OpinionIn our opinion, the financial statements for the year ended 31 December 2012 comply with Swiss law and the company’s articles of incorporation.
Report on Other Legal RequirementsWe confirm that we meet the legal requirements on licensing according to the Auditor Oversight Act (AOA) and independence (article 728 CO and article 11 AOA) and that there are no circumstances incompatible with our independence.
In accordance with article 728a paragraph 1 item 3 CO and Swiss Auditing Standard 890, we confirm that an internal control system exists, which has been designed for the preparation of financial statements according to the instructions of the board of directors.
We further confirm that the proposed appropriation of available earnings complies with Swiss law and the company’s articles of incorporation. We recommend that the financial statements submitted to you be approved.
KPMG AG
Thomas Affolter Toni WattenhoferLicensed Audit Expert Licensed Audit ExpertAuditor in Charge
Zurich, March 1, 2013
Key figures Group Notes OC Oerlikon Corporation AG, Pfäffikon
Report of the Statutory Auditor

163
Legal Structure
Legal Structure of significant companies as at December 31, 2012
OC Oerlikon Corporation AG, Pfäffikon, Freienbach SZ/CH–Aktiengesellschaft Adolph Saurer, Arbon/CH–InnoDisc AG, Windisch/CH–OC Oerlikon Balzers AG, Balzers/LI–OC Oerlikon Management AG, Pfäffikon, Freienbach SZ/CH–Oerlikon Balzers Coating India Ltd., Pune/IN–Oerlikon Balzers Coating (Suzhou) Co. Ltd., Suzhou/CN–Oerlikon Balzers Coating (Thailand) Co. Ltd., Chonburi/TH–Oerlikon Balzers Coating Austria GmbH, Kapfenberg/AT–Oerlikon Balzers Coating Italy S.p.A., Brugherio/IT–Oerlikon Balzers Coating Spain S.A.U, Antzuola/ES–Oerlikon Balzers Coating Korea Co. Ltd., Pyongtaek/KR–Oerlikon Balzers Coating Luxembourg S.à r.l., DifferdangeNiedercorn/LU–Oerlikon Balzers Coating Poland Sp.z o.o., Polkowice Dolne/PL–Oerlikon Balzers Coating SA, Brügg, Brügg/CH–Oerlikon Balzers Coating Singapore Pte. Ltd., Singapore/SG–Oerlikon Balzers Coating UK Ltd., Milton Keynes/UK–Oerlikon Balzers Kaplama Sanayi ve Ticaret Limited Sirketi, Bursa/TR–Oerlikon Balzers Revestimentos Metálicos Ltda., Jundiaí, SP/BR–Oerlikon Balzers Sandvik Coating AB, Stockholm/SE
. Oerlikon Balzers Sandvik Coating Oy, Helsinki/FI–Oerlikon France Holding SAS, SaintThibaultdesVignes/FR
. Oerlikon Balzers Coating France SAS, SaintThibaultdesVignes/FR–Oerlikon IT Solutions AG, Pfäffikon, Freienbach SZ/CH–Oerlikon Leybold Vacuum Taiwan Ltd., Hsinchu/TW–Oerlikon Licensing Arbon GmbH, Arbon/CH
. Oerlikon Drive Systems (Suzhou) Co. Ltd., Suzhou/CN–Oerlikon Nihon Balzers Coating Co. Ltd., Hiratsuka/JP–Oerlikon Optics UK Ltd., London/UK–Oerlikon Trading AG, Trübbach, Wartau/CH
. Oerlikon Balzers Coating Malaysia Sdn. Bhd., Puchong/MY
. Oerlikon Balzers Coating Mexico S.A. de C.V., Querétaro/MX–Oerlikon USA Holding Inc., Wilmington, DE/US
. Oerlikon Balzers Coating USA Inc., Wilmington, DE/US
. Oerlikon Leybold Vacuum USA Inc., Wilmington, DE/US
. Oerlikon Management USA Inc., Pittsburgh, PA/US
. Oerlikon USA Inc., Plantation, FL/US
. Fairfield Manufacturing Company Inc., Wilmington, DE/US. Fairfield Atlas Ltd., Kolhapur/IN
. Graziano Trasmissioni North America Inc., Charlotte, NC/US
. Melco Industries Inc., Denver, CO/US
. Oerlikon Textile Inc., Charlotte, NC/US–Oerlikon VermögensVerwaltungs GmbH, Köln/DE–OOO Oerlikon Balzers Rus, Elektrostal/RU–OT Textile Verwaltungs GmbH, Arbon/CH–Saurer AG, Arbon/CH
. GTGGraziano Trasmissioni Group AG, Arbon/CH
. Oerlikon Czech s.r.o., Cerveny Kostelec/CZ
. Oerlikon Fibrevision Ltd., Macclesfield/UK
. Oerlikon Saurer Arbon AG, Arbon/CH. Oerlikon Heberlein Temco Wattwil AG, Wattwil/CH. Oerlikon Textile China Investments Ltd., Hongkong/CN
. Oerlikon (China) Technology Co. Ltd., Suzhou/CN
. Oerlikon Textile Machinery (Wuxi) Co. Ltd., Wuxi/CN. Saurer China Equity Ltd., Hongkong/CN
. Jintan Texparts Component Co. Ltd., Jintan/CN
. Saurer Jintan Textile Machinery Co. Ltd., Jintan/CN. W. Reiners VerwaltungsGmbH, Remscheid/DE
. Oerlikon Textile GmbH & Co. KG, Remscheid/DE. AFETAU GmbH, Friedberg/DE. Oerlikon Deutschland Holding GmbH, Köln/DE
. Oerlikon Balzers Coating Benelux N.V., St.Truiden/BE
. Oerlikon Balzers Coating Germany GmbH, Bingen/DE
. Oerlikon Balzers Hartec GmbH, Stetten am kalten Markt/DE
. Oerlikon Deutschland Vertriebs GmbH, Aschheim/DE
. Oerlikon Leybold Vacuum GmbH, Köln/DE
Key figures Group Notes OC Oerlikon Corporation AG, Pfäffikon
Legal structure

164
Legal Structure of significant companies as at December 31, 2012
. Oerlikon Leybold Vacuum Equipment (Tianjin) Co. Ltd., Tianjin/CN
. Oerlikon Leybold Vacuum (Tianjin) International Trade Co. Ltd., Tianjin/CN
. Oerlikon Leybold Vacuum Dresden GmbH, Dresden/DE
. Oerlikon Leybold Vacuum France SAS, VillebonsurYvette/FR
. Oerlikon Leybold Vacuum India Pvt. Ltd., Pune/IN
. Oerlikon Leybold Vacuum Italia S.r.l., Milano/IT
. Oerlikon Leybold Vacuum Japan Co. Ltd., Yokohama/JP
. Oerlikon Leybold Vacuum Nederland B.V., Utrecht/NL
. Oerlikon Leybold Vacuum Schweiz AG, Zürich/CH
. Oerlikon Leybold Vacuum Singapore Pte. Ltd., Singapore/SG
. Oerlikon Leybold Vacuum Spain S.A., Cornellà de Llobregat/ES
. Oerlikon Leybold Vacuum UK Ltd., Chessington/UK. Oerlikon Leybold Vacuum Korea Ltd., Cheonan/KR. Oerlikon Real Estate GmbH, Köln/DE. Oerlikon Vermietungs und Verwaltungsgesellschaft mbH, Köln/DE
. Oerlikon Textile Components GmbH, Fellbach/DE
. Oerlikon Textile Far East Ltd., Hongkong/CN. Oerlikon Textile Technology (Beijing) Co. Ltd., Beijing/CN
. Oerlikon Textile India Pvt. Ltd., Mumbai/IN
. Peass Industrial Engineers Pvt. Ltd., Gujarat/IN
. Zinser Textile Systems Pvt. Ltd., Ahmedabad/IN. Oerlikon Vacuum Holding GmbH, Köln/DE
. Oerlikon Textile Components Singapore Pte. Ltd., Singapore/SG
. Oerlikon Textile do Brasil Máquinas Ltda., São Leopoldo, RS/BR
. Oerlikon Tekstil Middle East Tekstil Makinalari Dis Ticaret A.S., Istanbul/TR
. Oerlikon Textile Trading and Services Ltd., Hongkong/CN
. SAC Saurer Automotive Components B.V., Rotterdam/NL. Oerlikon Graziano Group S.p.A., Torino/IT
. Oerlikon Graziano S.p.A., Cascine Vica Rivoli/IT. Graziano Trasmissioni India Pvt. Ltd., New Delhi/IN. Graziano Trasmissioni UK Ltd., St. Neots/UK. Vocis Limited, Warwick/UK
. Saurer Group Investments Ltd., George Town/KY
. Saurer Holding GmbH, Leonding/AT–Saurer Management AG, Freienbach SZ/CH–Unaxis GmbH, Freienbach SZ/CH
Key figures Group Notes OC Oerlikon Corporation AG, Pfäffikon
Legal structure


166
ImprintProject management: OC Oerlikon Management AG, Pfäffikon (Switzerland), Corporate Communications Design concept: Hotz Brand Consultants, Steinhausen/Zug (Switzerland)Layout/prepress: gateB AG, Communication Engineering, Steinhausen/Zug (Switzerland)Press: Victor Hotz AG, Lasting Impressions In Print, Steinhausen/Zug (Switzerland)
This annual report is also available in German.The master language is English.
neutralPrinted Matter
No. 01-12-388807 – www.myclimate.org© myclimate – The Climate Protection Partnership
PERFORMANCE
Financial calendarMarch 5, 2013Annual Results 2012 and Annual Report 2012
April 30, 2013Annual General Meeting of Shareholders, Lucerne
May 7, 2013Q1 Results 2013
August 6, 2013Q2 / HY 2013 and HalfYear Report 2013
October 29, 2013Q3 Results / 9M 2013
Dates of roadshows, conferences and other events can be found in the financial calendar on our website at www.oerlikon.com/ir
ContactGroup HeadquartersOC Oerlikon Corporation AG, PfäffikonChurerstrasse 120CH8808 Pfäffikon SZSwitzerlandwww.oerlikon.com
Investor RelationsAndreas SchwarzwälderTel. +41 58 360 96 22Fax +41 58 360 98 [email protected]
Group CommunicationsBurkhard BöndelTel. +41 58 360 96 02Fax +41 58 360 91 [email protected]

Clients and partners (selection)
®

Oerlikon’s Segments in brief
Key figures Applications and products
� Filament yarn plants � Texturizing systems � Staple fiber plants � Carpet yarn plants
� Spunbond plants � Components for the manmade fiber industry
� Engineering solutions
TextileThe Textile Segment businesses are the market leaders in the areas of the manmade fibers machinery industry. Oerlikon innovations are continuously setting new stan-dards in a global production for markets like clothing, home textiles, automotive, geo and agro textiles, construction and sports. The Segment provides comprehensive solutions of an engineered plant design for the production of manmade fibers, nonwovens, carpet yarns and synthetic staple fibers. Oerlikon covers the entire value chain in the manmade fibers sector.
Drive SystemsThe Drive Systems Segment is a leading pro vider of gear and transmission solutions for a wide range of markets and applications, including agricultural machinery, construction equipment, energy and mining, high-performance auto cars, and similar on-/off-highway and industrial market segments. Drive Systems’ portfolio of solutions includes dual clutch and continuously variable transmissions, trans-mission synchronizers, axles, Torque-Hub® planetary final drives and precision gear components and assemblies.
� Agricultural equipment � Construction equipment
� Mining equipment � Passenger cars � High-performance cars
� All-wheel vehicles � Zero-emission vehicles
� Material handling and ground support equipment
� City buses � Rail and transportation � Offshore oil and gas � Wind power � Specialty industrial
VacuumThe Vacuum Segment offers a wide range of vacuum com-ponents for industrial manufacturing, analytical technology, and research and development purposes. The Vacuum Segment delivers standard and fully customized vacuum solutions which offer customers high efficiency, quality and flexibility. A global sales and service network complements the consulting and engineering expertise.
� Fore- and high- vacuum pumps
� Consulting and enginee ring of vacuum solutions
� Vacuum gauges
� Leak detecting � Instruments � Fittings and valves � After-sales service and training
CoatingThe Coating Segment is the world’s leading supplier of PVD coatings for tools and precision components. The coatings – deposited with state-of-the-art equipment from Oerlikon Balzers – increase per formance and therefore productivity. Coating services are offered through a network of 90 cen-ters in 33 countries.
High-performance coatings for:
� Cutting tools � Punching and forming tools
� Dies and molds
� Precision components for engine and fluid technology and mechanical drives
Advanced TechnologiesThe Advanced Technologies Segment focuses on produc-tion systems for advanced nanotechnology and semicon-ductor applications. The core competence of the Segment in the thin-film coating technology enables solutions in the area of advanced nanotechnology for touch panels, photo-voltaics, thermoelectric generators and energy storage, saving, conversion and transmission. Applications for the semiconductor market include advanced packaging, power devices, read/write heads for hard disks, LEDs and Micro-Electro-Mechanical Systems (MEMS).
Semiconductor deposition equipment for:
� Read/Write heads for hard drives
� Advanced packaging/ 3D
� Thin wafer processing for backside metal
� MEMS and solid state lighting (LED)
Deposition equipment for Advanced Nanotechnology:
� c-Si solar cells � Energy harvesting applications
� Thermoelectric generators
� Touch panels
in CHF million 2012 2011
Orders received 1 039 1 014
Order backlog 602 673
Sales (to third parties) 1 103 909
EBIT 186 73
Employees 2 511 2 389
in CHF million 2012 2011
Orders received 766 892
Order backlog 134 213
Sales (to third parties) 826 821
EBIT 70 49
Employees 5 177 5 471
in CHF million 2012 2011
Orders received 377 400
Order backlog 73 77
Sales (to third parties) 373 409
EBIT 38 59
Employees 1 491 1 472
in CHF million 2012 2011
Orders received 501 484
Order backlog – –
Sales (to third parties) 501 484
EBIT 103 97
Employees 3 126 2 986
in CHF million 2012 2011
Orders received 119 88
Order backlog 25 8
Sales (to third parties) 103 108
EBIT 7 11
Employees 188 200
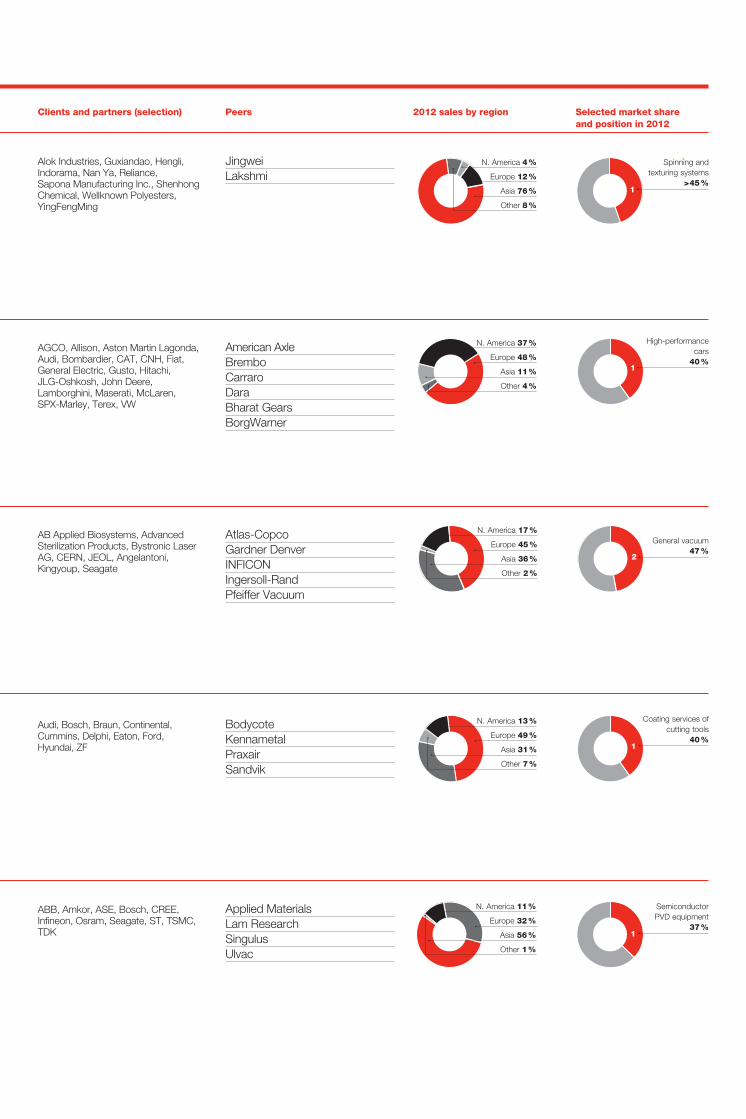
1
1
1
2
1
JingweiLakshmi
Spinning and texturing systems
> 45 %
2012 sales by region Selected market share and position in 2012
PeersClients and partners (selection)
Alok Industries, Guxiandao, Hengli, Indorama, Nan Ya, Reliance, Sapona Manufacturing Inc., Shenhong Chemical, Wellknown Polyesters, YingFengMing
N. America 4 %
Europe 12 %
Asia 76 %
Other 8 %
American AxleBremboCarraroDaraBharat GearsBorgWarner
AGCO, Allison, Aston Martin Lagonda, Audi, Bombardier, CAT, CNH, Fiat, General Electric, Gusto, Hitachi, JLG-Oshkosh, John Deere, Lamborghini, Maserati, McLaren, SPX-Marley, Terex, VW
Atlas-CopcoGardner DenverINFICONIngersoll-RandPfeiffer Vacuum
AB Applied Biosystems, Advanced Sterilization Products, Bystronic Laser AG, CERN, JEOL, Angelantoni, Kingyoup, Seagate
General vacuum
47 %
N. America 17 %
Europe 45 %
Asia 36 %
Other 2 %
BodycoteKennametal PraxairSandvik
Audi, Bosch, Braun, Continental, Cummins, Delphi, Eaton, Ford, Hyundai, ZF
Coating services of
cutting tools 40 %
N. America 13 %
Europe 49 %
Asia 31 %
Other 7 %
Applied MaterialsLam ResearchSingulusUlvac
ABB, Amkor, ASE, Bosch, CREE, Infineon, Osram, Seagate, ST, TSMC, TDK
Semiconductor PVD equipment
37 %
N. America 11 %
Europe 32 %
Asia 56 %
Other 1 %
High-performance cars
40 %
N. America 37 %
Europe 48 %
Asia 11 %
Other 4 %