Oerlikon Graziano SpA Annual Report 2012
136
Oerlikon Graziano SpA Annual Report 2012
-
Upload
khangminh22 -
Category
Documents
-
view
1 -
download
0
Transcript of Oerlikon Graziano SpA Annual Report 2012
Oerlikon Graziano SpAAnnual Report 2012


Oerlikon Graziano SpAAnnual Report 2012
3
Oerlikon sviluppa soluzioni industriali innovative volte a migliorare la qualità della vita.
Oerlikon creates innovative industrial solutions for a better life.
Oerlikon vuole essere il vostro partner aziendale di fiducia, in tutto il mondo.
Noi generiamo valore aggiunto grazie alle nostre soluzioni industriali innovative e di alta qualità, continuamente.
Noi assumiamo professionisti altamente qualificati.
Noi ci impegniamo per il vostro successo!
Oerlikon strives to be your most reliable business partner, worldwide.
We increase value through high-quality innovative industrial solutions, continuously.
We engage highly qualified professionals.Our commitment is your success!
La nostra visioneOur vision
La nostra missioneOur mission
4
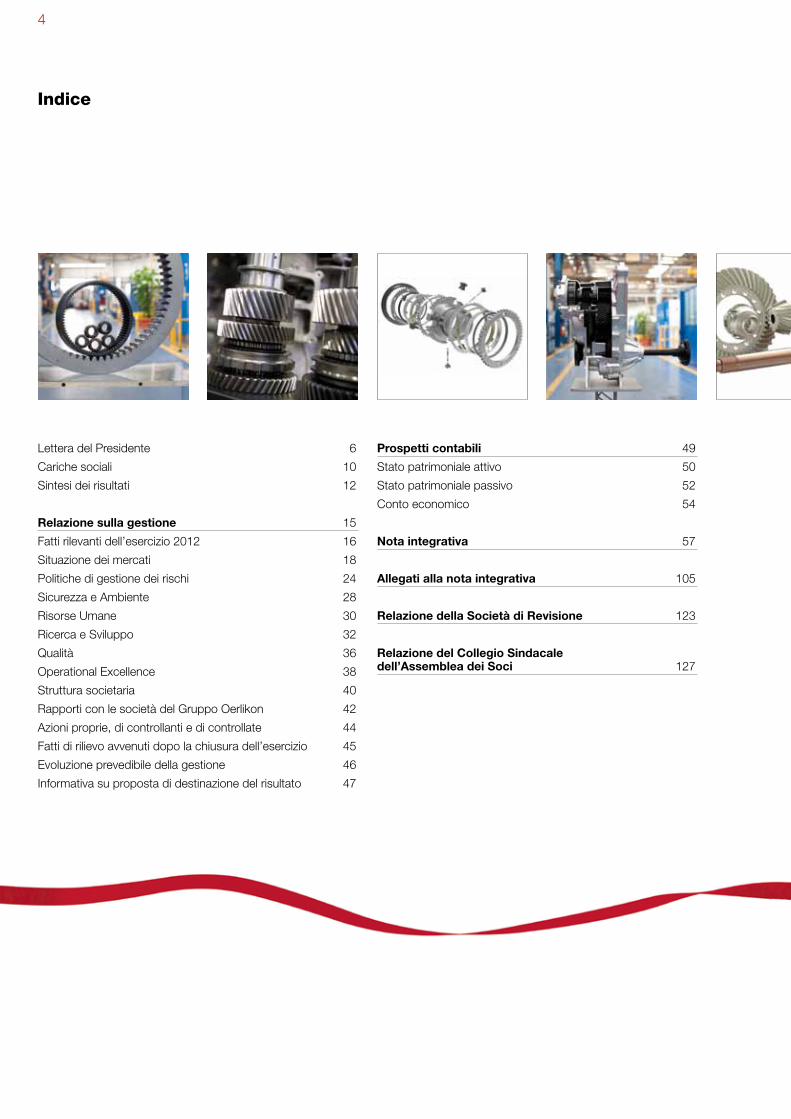
Indice
Lettera del Presidente 6
Cariche sociali 10
Sintesi dei risultati 12
Relazione sulla gestione 15
Fatti rilevanti dell’esercizio 2012 16
Situazione dei mercati 18
Politiche di gestione dei rischi 24
Sicurezza e Ambiente 28
Risorse Umane 30
Ricerca e Sviluppo 32
Qualità 36
Operational Excellence 38
Struttura societaria 40
Rapporti con le società del Gruppo Oerlikon 42
Azioni proprie, di controllanti e di controllate 44
Fatti di rilievo avvenuti dopo la chiusura dell’esercizio 45
Evoluzione prevedibile della gestione 46
Informativa su proposta di destinazione del risultato 47
Prospetti contabili 49
Stato patrimoniale attivo 50
Stato patrimoniale passivo 52
Conto economico 54
Nota integrativa 57
Allegati alla nota integrativa 105
Relazione della Società di Revisione 123
Relazione del Collegio Sindacale dell’Assemblea dei Soci 127
5
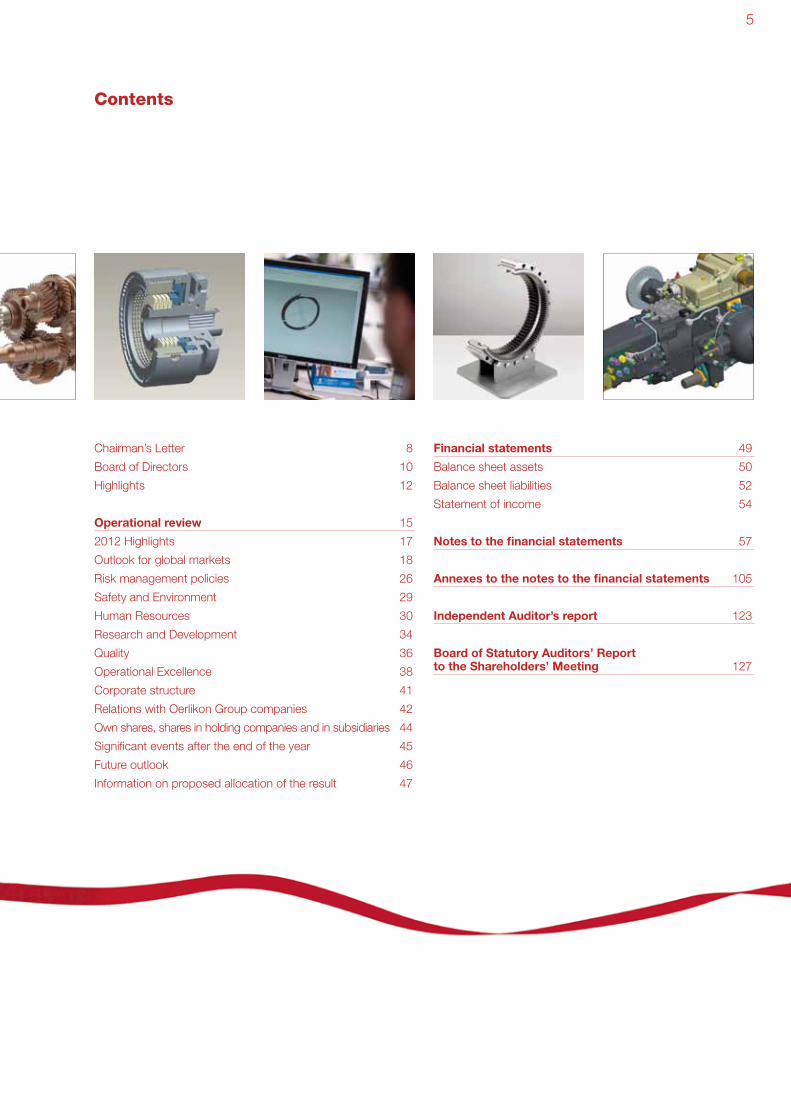
Contents
Chairman’s Letter 8
Board of Directors 10
Highlights 12
Operational review 15
2012 Highlights 17
Outlook for global markets 18
Risk management policies 26
Safety and Environment 29
Human Resources 30
Research and Development 34
Quality 36
Operational Excellence 38
Corporate structure 41
Relations with Oerlikon Group companies 42
Own shares, shares in holding companies and in subsidiaries 44
Significant events after the end of the year 45
Future outlook 46
Information on proposed allocation of the result 47
Financial statements 49
Balance sheet assets 50
Balance sheet liabilities 52
Statement of income 54
Notes to the financial statements 57
Annexes to the notes to the financial statements 105
Independent Auditor’s report 123
Board of Statutory Auditors’ Reportto the Shareholders’ Meeting 127
6
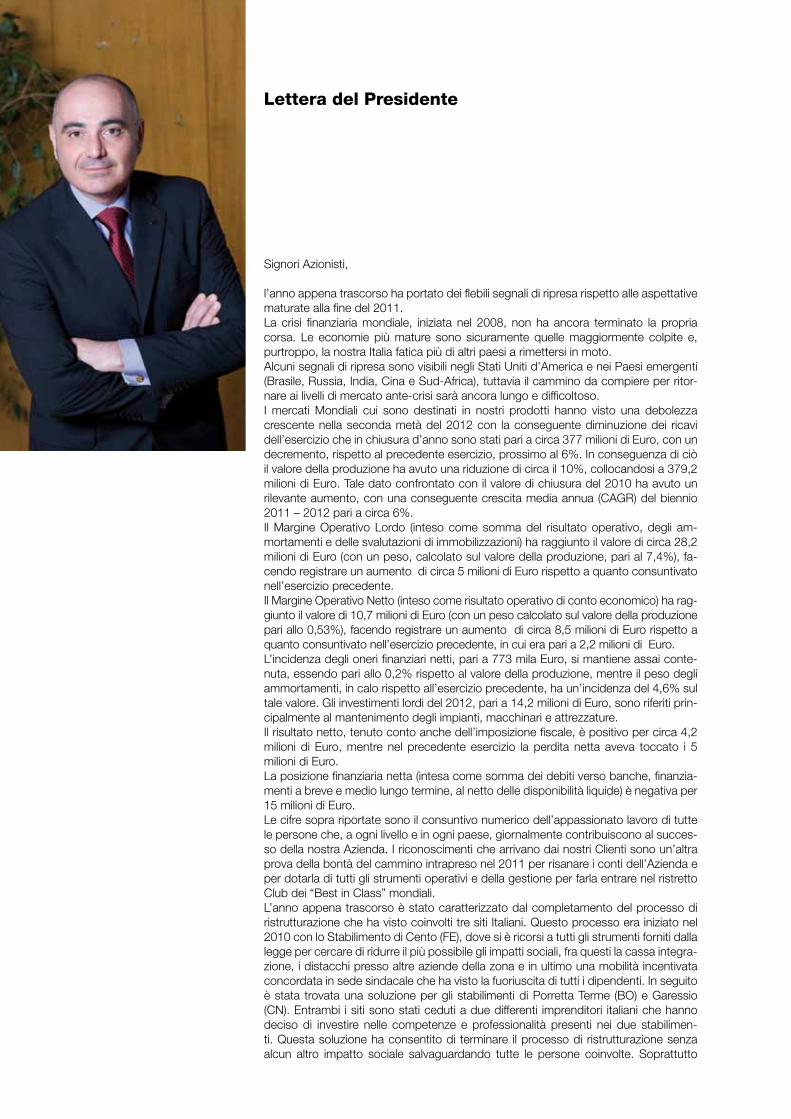
Lettera del Presidente
Signori Azionisti,
l’anno appena trascorso ha portato dei flebili segnali di ripresa rispetto alle aspettative maturate alla fine del 2011.La crisi finanziaria mondiale, iniziata nel 2008, non ha ancora terminato la propria corsa. Le economie più mature sono sicuramente quelle maggiormente colpite e, purtroppo, la nostra Italia fatica più di altri paesi a rimettersi in moto.Alcuni segnali di ripresa sono visibili negli Stati Uniti d’America e nei Paesi emergenti (Brasile, Russia, India, Cina e Sud-Africa), tuttavia il cammino da compiere per ritor-nare ai livelli di mercato ante-crisi sarà ancora lungo e difficoltoso.I mercati Mondiali cui sono destinati in nostri prodotti hanno visto una debolezza crescente nella seconda metà del 2012 con la conseguente diminuzione dei ricavi dell’esercizio che in chiusura d’anno sono stati pari a circa 377 milioni di Euro, con un decremento, rispetto al precedente esercizio, prossimo al 6%. In conseguenza di ciò il valore della produzione ha avuto una riduzione di circa il 10%, collocandosi a 379,2 milioni di Euro. Tale dato confrontato con il valore di chiusura del 2010 ha avuto un rilevante aumento, con una conseguente crescita media annua (CAGR) del biennio 2011 – 2012 pari a circa 6%.Il Margine Operativo Lordo (inteso come somma del risultato operativo, degli am-mortamenti e delle svalutazioni di immobilizzazioni) ha raggiunto il valore di circa 28,2 milioni di Euro (con un peso, calcolato sul valore della produzione, pari al 7,4%), fa-cendo registrare un aumento di circa 5 milioni di Euro rispetto a quanto consuntivato nell’esercizio precedente.Il Margine Operativo Netto (inteso come risultato operativo di conto economico) ha rag-giunto il valore di 10,7 milioni di Euro (con un peso calcolato sul valore della produzione pari allo 0,53%), facendo registrare un aumento di circa 8,5 milioni di Euro rispetto a quanto consuntivato nell’esercizio precedente, in cui era pari a 2,2 milioni di Euro.L’incidenza degli oneri finanziari netti, pari a 773 mila Euro, si mantiene assai conte-nuta, essendo pari allo 0,2% rispetto al valore della produzione, mentre il peso degli ammortamenti, in calo rispetto all’esercizio precedente, ha un’incidenza del 4,6% sul tale valore. Gli investimenti lordi del 2012, pari a 14,2 milioni di Euro, sono riferiti prin-cipalmente al mantenimento degli impianti, macchinari e attrezzature.Il risultato netto, tenuto conto anche dell’imposizione fiscale, è positivo per circa 4,2 milioni di Euro, mentre nel precedente esercizio la perdita netta aveva toccato i 5 milioni di Euro. La posizione finanziaria netta (intesa come somma dei debiti verso banche, finanzia-menti a breve e medio lungo termine, al netto delle disponibilità liquide) è negativa per 15 milioni di Euro.Le cifre sopra riportate sono il consuntivo numerico dell’appassionato lavoro di tutte le persone che, a ogni livello e in ogni paese, giornalmente contribuiscono al succes-so della nostra Azienda. I riconoscimenti che arrivano dai nostri Clienti sono un’altra prova della bontà del cammino intrapreso nel 2011 per risanare i conti dell’Azienda e per dotarla di tutti gli strumenti operativi e della gestione per farla entrare nel ristretto Club dei “Best in Class” mondiali.L’anno appena trascorso è stato caratterizzato dal completamento del processo di ristrutturazione che ha visto coinvolti tre siti Italiani. Questo processo era iniziato nel 2010 con lo Stabilimento di Cento (FE), dove si è ricorsi a tutti gli strumenti forniti dalla legge per cercare di ridurre il più possibile gli impatti sociali, fra questi la cassa integra-zione, i distacchi presso altre aziende della zona e in ultimo una mobilità incentivata concordata in sede sindacale che ha visto la fuoriuscita di tutti i dipendenti. In seguito è stata trovata una soluzione per gli stabilimenti di Porretta Terme (BO) e Garessio (CN). Entrambi i siti sono stati ceduti a due differenti imprenditori italiani che hanno deciso di investire nelle competenze e professionalità presenti nei due stabilimen-ti. Questa soluzione ha consentito di terminare il processo di ristrutturazione senza alcun altro impatto sociale salvaguardando tutte le persone coinvolte. Soprattutto

7
nel caso di Garessio, l’Azienda è andata incontro alle preferenze delle persone che non avrebbero accettato un trasferimento in altri siti produttivi della provincia, come inizialmente prospettato ai dipendenti, alle parti sociali e ai responsabili istituzionali regionali e locali.Sebbene nel biennio 2011 – 2012 l’Azienda fosse in una fase di ristrutturazione, sono stati lanciati degli investimenti di notevole rilevanza per migliorare la Sicurezza e la Salute sul posto di lavoro: ogni anno sono stati ridotti della metà gli infortuni sul lavoro e le ore perse a seguito di ciò. Questo cammino continuerà con la stessa attenzione e determinazione fino a che non sarà conseguito l’obiettivo di avere “zero infortuni” nei nostri siti lavorativi.Allo stesso modo si è affrontato il tema del rispetto dell’Ambiente: molteplici interventi sono stati fatti in ogni sito produttivo per eliminare o mitigare qualsivoglia rischio di in-quinamento legato ai processi produttivi ed ai servizi ad essi connessi. A tal proposito abbiamo conseguito in tempi record le certificazioni ISO 14001 (2004) e BS OHSAS 18001 (2007) per tutti i siti Italiani, portandoci quindi al livello dei più qualificati prota-gonisti della vita industriale in Italia ed Europa.Il 2012 è stato un anno fondamentale per quanto riguarda la formazione delle nostre persone arrivando al record di 50.000 ore di formazione effettuata in Azienda. Lo sviluppo delle competenze e capacità delle nostre risorse umane è fondamentale ed essenziale per continuare il cammino verso i “Best in Class”.In ambito produttivo, l’implementazione dei processi connessi al “Oerlikon Operatio-nal Excellence” ed al “World Class Manufacturing” ha consentito di migliorare signifi-cativamente la produttività dei nostri siti di manifattura. I prossimi passi saranno legati all’analisi dei processi logistici e qualitativi per continuare a migliorare le performances dell’Azienda e conseguentemente garantire ai nostri Clienti un livello di servizio all’al-tezza delle loro attese.I nostri Centri di Ricerca e Sviluppo per i settori “Automotive Transmissions e Shifting Solutions”, siti in Italia ed Inghilterra, hanno prodotto delle soluzioni innovative che, dando lustro al brand Oerlikon Graziano, genereranno dei volumi di business addizio-nali rispetto a quelli storici dei due settori. Inoltre stiamo partecipando con successo a due programmi finanziati dalla Comunità Europea per lo sviluppo della tecnologia del veicolo elettrico.Abbiamo introdotto delle nuove dinamiche della gestione attraverso l’implementazio-ne di processi di “Project Management” con il conseguente miglioramento della sod-disfazione dei Clienti e dando visibilità alle aree di sofferenza dei progetti (naturalmente trovando le soluzioni adeguate per la risoluzione dei problemi).La nostra Qualità ha continuato a perseguire i livelli di eccellenza conseguiti nel corso degli anni ed al tal proposito una menzione di merito va fatta per la creazione del por-tale Web a supporto dei Fornitori e dei Clienti. Abbiamo, infine, continuato a generare valore attraverso la creazione di partnership con i nostri fornitori, senza i quali, il cammino verso l’eccellenza sarebbe arduo e irto di difficoltà.Grazie alla capacità, alla motivazione ed alla tenacia delle nostre persone, ad una strategia vincente ed alla fiducia dei nostri Clienti, abbiamo posto le basi per guardare con crescente fiducia al futuro della nostra Azienda.
Il Presidente e Amministratore Delegato Ing. Paolo Ramadori
8
Chairman’s Letter
Dear Shareholders,
The past year has brought some faint signs of recovery compared to the expecta-tions matured at the end of 2011.The global financial crisis, which began in 2008, has not yet finished its run. The more mature economies are certainly those most affected and unfortunately Italy is struggling more than other countries to return to normal.Some signs of recovery are visible in the United States of America and in the emerg-ing countries (Brazil, Russia, India, China and South Africa), but the road to the return of the market to pre-crisis levels will be still long and difficult.The world markets on which our products are sold suffered growing weakness in the second half of 2012, with a corresponding decrease in revenues amounting to about € 377 million at year end, with almost a 6% decrease on the previous year. Consequently, the production value was down by about 10%, standing at € 379.2 million. This figure, compared with the value at the end of 2010, has risen signifi-cantly, with about an average annual growth rate (CAGR) of about 6% in 2011-2012.The Gross Operating Margin (considered as the sum of operating profit, deprecia-tion and devaluation of fixed assets) reached a value of approximately € 28.2 million (with a weight, calculated on the value of production, equal to 7.4%), registering an increase of about € 5 million compared to the figure of the previous year.The Net Operating Margin (considered as the operating income) reached the value of € 10.7 million (with a weight, calculated on the value of production, equal to 0.53%), registering an increase of about € 8.5 million compared to the figure of the previous year, which was € 2.2 million.The ratio of net financial expense, amounting to € 773 thousand, remains rather low, at 0.2% of the production value, while the weight of amortisation and depreciation, which is less than the previous year, accounts for 4.6% of said value. Gross invest-ments in 2012, equating to € 14.2 million, are mainly related to the maintenance of systems, machinery and equipment.The net result, after tax, is approximately € 4.2 million, while the previous year was characterised by a net loss of € 5 million.The net financial position (the sum of amounts due to banks, short and medium/long-term loans, net of cash and cash equivalents) is negative by € 15 million.The above figures are the final result of the passionate work by all the people, work-ing at all levels and in every country, that contribute to the success of our company every day. The acknowledgements received from our customers are further proof that the actions undertaken in 2011 to balance the Company accounts and to provide all the operating tools to enter the restricted world club of “Best in Class” were right.The past year has been characterised by the completion of the restructuring pro-cess that has involved three Italian factories. This process started in 2010 in the Cento plant (FE), where we used all the tools provided by law to minimize possible social impacts, including temporary layoffs, secondment to other companies in the area and, lastly, mobility incentives negotiated with the trade union, which resulted in the exit of all employees. A solution was subsequently found for the Porretta Terme (BO) and Garessio (CN) plants, which were sold to two different Italian busi-nessmen who decided to invest in the skills and in the professionalism of these two plants. This solution has allowed us to finish the restructuring process without any other social impact while protecting all the people involved. Especially in the case of Garessio, the Company considered the preferences of the employees, who would not have accepted a transfer to other production plants in the province, as initially suggested to the employees, corporate parties and the representatives of regional and local institutions.Despite undergoing a restructuring phase in 2011 – 2012, the Company launched some investments of considerable importance to improve health and safety in the

9
workplace: every year, accidents at work, and the hours lost as a result of them, have been reduced by half. This process will continue with the same focus and determination until we achieve the goal of having “zero accidents” in our plants.In the same way we have dealt with the matter of environmental respect: lots of work has been done in each plant to eliminate or mitigate any risk of pollution related to production processes and the pertinent services. To this end, we have attained ISO 14001 (2004) and BS OHSAS 18001 (2007) certifications for all the Italian plants in record time, reaching the level of the most skilled industrial players in Italy and Europe.2012 was a fundamental year for the training of our employees, reaching a record 50,000 training hours carried out in the Company. The development of the skills and capacity of our human resources is paramount and essential to continue our way towards the “Best in Class”.Concerning production, the implementation of the processes related to “Oerlikon Operational Excellence” and “World Class Manufacturing” has improved the pro-ductivity of our plants considerably. The next steps will be the analysis of logistic processes and quality to continue improving the performance of the Company and consequently guaranteeing our Customers a level of service that lives up to their expectations.Our Research and Development Centres for the “Automotive Transmissions and Shifting Solutions” sectors in Italy and England, have produced innovative solutions that, highlighting the Oerlikon Graziano brand, will generate additional business vol-umes compared to those historically attained by the two sectors. We are also suc-cessfully participating in two European Union programmes for the development of electric vehicle technology.We have introduced new management dynamics through the implementation of a project management processes with the consequent improvement of customer satisfaction, offering visibility to the areas of difficulty within the projects (naturally find adequate solutions to the problems).Our quality has continued to pursue the levels of excellence achieved over the years and, with this in mind, a special mention should go to the creation of the website in support of suppliers and customers.Lastly, we continued to generate value through the creation of partnerships with our suppliers, without whom the path towards excellence would be difficult and strenuous.Thanks to the ability, motivation and tenacity of our staff, a winning strategy and the trust of our customers, we have laid the foundations for looking with growing confidence to the future of our Company.
The Chairman and Managing Director Ing. Paolo Ramadori
10
PresidenteChairman
Amministratore DelegatoManaging Director
ConsiglieriDirectors
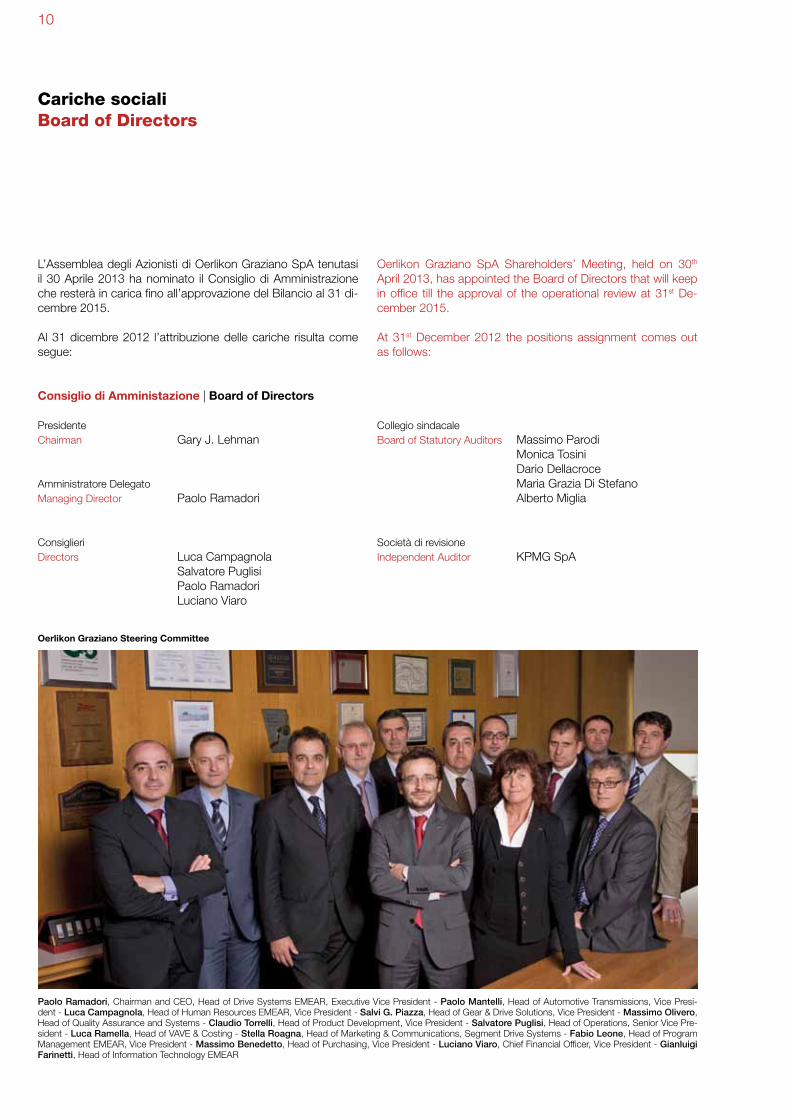
Cariche socialiBoard of Directors
L’Assemblea degli Azionisti di Oerlikon Graziano SpA tenutasi il 30 Aprile 2013 ha nominato il Consiglio di Amministrazione che resterà in carica fino all’approvazione del Bilancio al 31 di-cembre 2015.
Al 31 dicembre 2012 l’attribuzione delle cariche risulta come segue:
Oerlikon Graziano SpA Shareholders’ Meeting, held on 30th April 2013, has appointed the Board of Directors that will keep in office till the approval of the operational review at 31st De-cember 2015.
At 31st December 2012 the positions assignment comes out as follows:
Consiglio di Amministazione | Board of Directors
Gary J. Lehman
Paolo Ramadori
Luca Campagnola Salvatore Puglisi Paolo RamadoriLuciano Viaro
Collegio sindacaleBoard of Statutory Auditors
Società di revisioneIndependent Auditor
Massimo ParodiMonica TosiniDario DellacroceMaria Grazia Di StefanoAlberto Miglia
KPMG SpA
Paolo Ramadori, Chairman and CEO, Head of Drive Systems EMEAR, Executive Vice President - Paolo Mantelli, Head of Automotive Transmissions, Vice Presi-dent - Luca Campagnola, Head of Human Resources EMEAR, Vice President - Salvi G. Piazza, Head of Gear & Drive Solutions, Vice President - Massimo Olivero, Head of Quality Assurance and Systems - Claudio Torrelli, Head of Product Development, Vice President - Salvatore Puglisi, Head of Operations, Senior Vice Pre-sident - Luca Ramella, Head of VAVE & Costing - Stella Roagna, Head of Marketing & Communications, Segment Drive Systems - Fabio Leone, Head of Program Management EMEAR, Vice President - Massimo Benedetto, Head of Purchasing, Vice President - Luciano Viaro, Chief Financial Officer, Vice President - Gianluigi Farinetti, Head of Information Technology EMEAR
Oerlikon Graziano Steering Committee
11
12
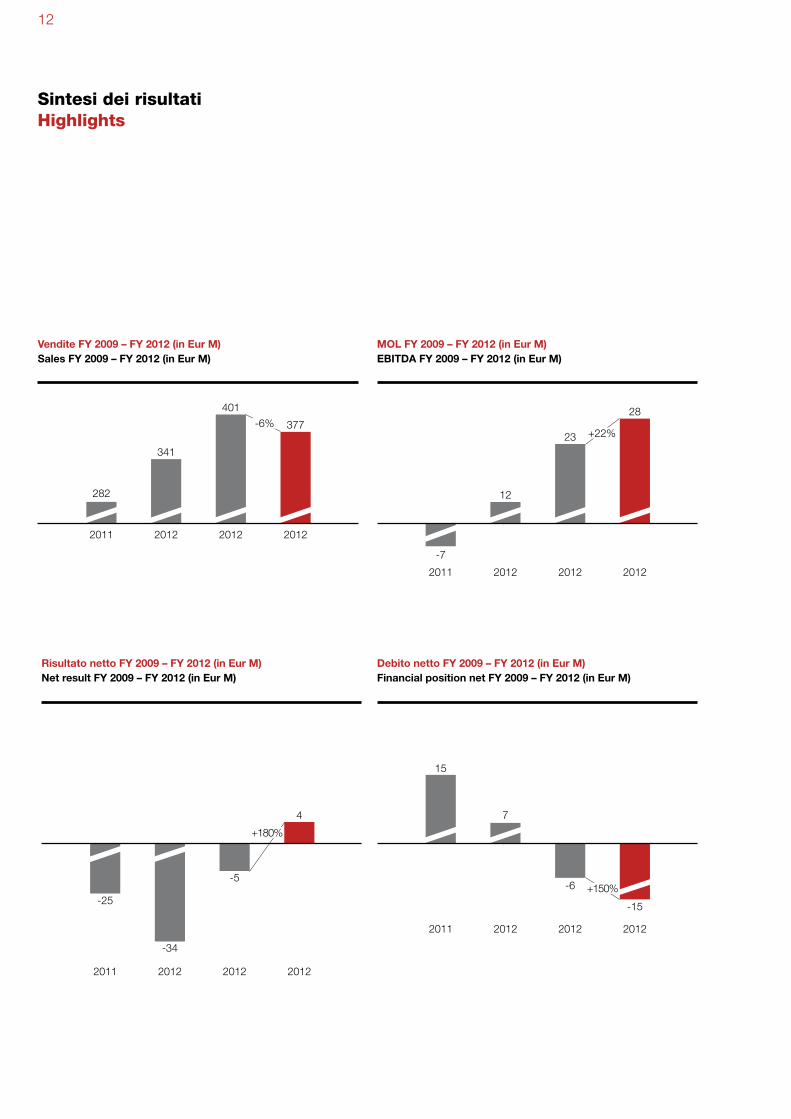
Sintesi dei risultatiHighlights
Vendite FY 2009 – FY 2012 (in Eur M)Sales FY 2009 – FY 2012 (in Eur M)
20122011 2012 2012
MOL FY 2009 – FY 2012 (in Eur M)EBITDA FY 2009 – FY 2012 (in Eur M)
20122011 2012 2012
-7
12
23
28
282
341
401
377-6%+22%
Risultato netto FY 2009 – FY 2012 (in Eur M)Net result FY 2009 – FY 2012 (in Eur M)
20122011 2012 2012
-25
-34
-5
4
Debito netto FY 2009 – FY 2012 (in Eur M)Financial position net FY 2009 – FY 2012 (in Eur M)
20122011 2012 2012
15
7
-6
-15
+150%
+180%

13
17%Nord AmericaNorth America 6%
America LatinaSouth America
29%ItaliaItaly 44%
Resto d’EuropaRest of Europe
4%AsiaAsia
FY 2011FY 2011
Vendite per area geografica FY2011 - FY 2012Sales by destination FY2011 - FY 2012
15%Nord AmericaNorth America
8%America LatinaSouth America
27%ItaliaItaly 46%
Resto d’EuropaRest of Europe
4%AsiaAsia
FY 2012FY 2012
Conto economico sintetico | Summarised income statement
31-12-2011 31-12-2012
Ricavi | Revenues 401.053.413 95,13% 377.194.899 99,47%
Valore della produzione | Production value 421.595.900 100,00% 379.201.023 100,00%
Acquisti e servizi | Purchases and services (296.947.186) -70,43% (253.298.801) -66,80%
Valore aggiunto | Added Value 124.648.714 29,57% 125.902.222 33,20%
Costo del lavoro | Personnel costs (101.466.436) -24,07% (97.731.616) -25,77%
MOL | EBITDA (before extraordinary) 23.182.278 5,50% 28.170.606 7,43%
Ammortamenti, leasing e accantonamentiAmortisation, leasings and provisions (20.946.905) -4,97% (17.511.497) -4,62%
MON | MON 2.235.373 0,53% 10.659.109 2,81%
Oneri finanziari netti Oneri finanziari nettiNet financial expense (416.451) -0,10% (772.993) -0,20%
Risultato gestione corrente | Current operating result 1.818.923 0,43% 9.886.116 2,61%
Proventi e oneri straordinari Proventi e oneri straordinariExtraordinary income and expense (4.394.910) -1,04% 4.583.378 1,21%
Risultato ante imposte | Result before taxes (2.575.987) -0,61% 14.469.495 3,82%
Imposte | Taxes (2.462.188) -0,58% (10.308.253) -2,72%
Risultato netto | Net result (5.038.176) -1,20% 4.161.242 1,10%

14 Relazione sulla gestione / Directors’ Report on operations

15Relazione sulla gestione / Directors’ Report on operations
Relazione sulla gestioneOperational review

16 Fatti rilevanti dell’esercizio 2012 / 2012 Highlights
Fatti rilevanti dell’esercizio 2012
Agosto 2012
Ottenuta certificazione ISO/TS16949:2009 per gli stabilimenti italiani di Cascine Vica (TO), Bari, Luserna (TO) e Sommariva (CN).
Settembre 2012
Acquisito terreno nella regione del Gujarat (India) da parte della controllata Graziano Trasmissioni India Pvt Ltd.
Ottobre 2012
Presentata, al Rally Legend 2012 di San Marino, la Lancia 037 4WD-H trazione integrale a propulsione ibrida con un nuovo differenziale anteriore autobloccante prodotto da Oerlikon Gra-ziano SpA.
Firmato accordo per la cessione dello stabilimento di Garessio alla società Marachella Wood Building Srl.
La controllata Graziano Trasmissioni India Pvt Ltd nominata da CNH India miglior fornitore per il secondo anno consecutivo.
Dicembre 2012
Ottenuta certificazione OHSAS 18001.
Gennaio 2012
Ampliato lo stabilimento di Noida (India) della controllata Gra-ziano Trasmissioni India Pvt Ltd.
Maggio 2012
Ron Dennis (CEO di McLaren) visita lo stabilimento di Luserna San Giovanni (TO) dove vengono assemblati i cambi per vetture ad alte prestazioni assegnando all’azienda il riconoscimento di Best in Class Supplier.
Giugno 2012
Ottenuta certificazione UNI EN ISO 9001:2008.
Presentata al VDI di Friedrichshafen (Germania) la nuova tra-smissione a due marce per veicoli elettrici.
Firmato accordo per la cessione dello stabilimento di Porretta Terme alla società Paritel SpA.

17Fatti rilevanti dell’esercizio 2012 / 2012 Highlights
2012 Highlights 2012
January 2012
Expansion of the Noida plant (India) of the subsidiary Graziano Trasmissioni India Pvt Ltd.
May 2012
Ron Dennis (McLaren CEO) visited the plant in Luserna San Giovanni (Torino-Italy) where gearboxes for high-performance vehicles are assembled, awarding the company the acknowl-edgement of Best in Class Supplier.
June 2012
Attainment of UNI EN ISO 9001:2008 certification.
Presentation of the new dual clutch transmission for electric vehicles at VDI in Friedrichshafen (Germany).
Signing of the agreement for sale of the Porretta Terme plant (Italy) to Paritel SpA.
August 2012
Attainment of ISO/TS16949:2009 certification for the italian Cascine Vica, Bari, Luserna and Sommaria plants.
September 2012
Purchase of land in the Gujarat region (India) by the subsidiary Graziano Trasmissioni India Pvt Ltd.
October 2012
Presentation, at Rally Legend 2012 in San Marino (Italy), of the Lancia 037 4WD-H hybrid powered 4-wheel drive with new self-locking front differential made by Oerlikon Graziano SpA.
Signing of agreement for the sale of the Garessio plant (Italy) to Marachella Wood Building Srl.
Nomination by CNH India of the subsidiary Graziano Trasmis-sioni India Pvt Ltd as best supplier for the second year running.
December 2012
Attainment of OHSAS 18001 certification.

18 Situazione dei mercati / Outlook for global markets
Situazione dei mercati Outlook for global markets
Gli eventi manifestatisi nel 2011 hanno continuato i loro effetti nel corso del 2012. L’economia mondiale è in rallentamento, le tensioni sui debiti sovrani hanno contribuito ad alimentare le incertezze e ad incrementare l’avversione al rischio degli inve-stitori con un conseguente peggioramento delle prospettive di crescita. Nella seconda parte dell’anno 2012, le misure adotta-te dalla BCE in settembre e l’accordo raggiunto negli USA sulla politica fiscale hanno reso meno probabile un aggravamento della crisi ed hanno stabilizzato l’attività economica mondiale.
Nel corso del 2012, i Governi europei, tra cui quello Italiano, si sono concentrati nel mettere in atto interventi per assicurare l’equilibrio dei conti pubblici, ora la priorità è la creazione delle condizioni favorevoli al rilancio dell’economia.
Gli Stati Uniti hanno perso la loro leadership nell’economia mondiale; i paesi del BRIC, seppur con un calo nella crescita rispetto alle previsioni, hanno dimostrato di essere ai primi posti nei mercati internazionali.
Sulla base delle ultime stime disponibili dell’OECD, il PIL relativo al 2012, mette la Cina al primo posto con una crescita rispetto all’anno precedente del 7,5%, rispetto alla media mondiale del 1,4%. In questo contesto i paesi dell’area EURO mostrano una contrazione dello 0,4%, dove l’Italia evidenzia un -2,4% secon-do i dati ISTAT.
L’indice della produzione industriale, predisposto dall’ISTAT, evidenzia una significativa recessione rispetto all’anno prece-dente, - 5,3%, con un trend in continuo peggioramento.
Il tasso di disoccupazione a fine 2012 si attestava in Italia al 10,7%, sostanzialmente in linea con la media Europea forte-mente penalizzata da paesi quali la Spagna, il Portogallo, la Grecia e l’Irlanda. In questo ambito la Germania evidenziava un tasso di disoccupazione del 5,4% che la posiziona tra i paesi più virtuosi in ambito Europeo. Ma l’indice più preoccupante è il tasso di disoccupazione giovanile che cresce di 6,2 punti percentuali arrivando al 35,3%.
Il tasso di inflazione, misurato sull’indice dei prezzi al consumo, ha raggiunto, in Italia, un valore del 2,3% a dicembre 2012 ri-spetto ad un 2,1% medio nell’Euro Zona, con un rallentamento della pressione principalmente dovuto all’allentamento delle tensioni sui costi di input e di debolezza della domanda che ha generato un eccesso di capacità produttiva.
The events that occurred in 2011 continued to have an effect for the whole 2012. The global economy is slowing down, tension regarding sovereign debts has contributed to feeding uncertainties and increasing the aversion to risk by investors, with a consequent deterioration in growth prospects. In the second part of 2012, measures taken by the ECB in Septem-ber and the agreement on fiscal policy reached in the USA made a worsening of the crisis less likely and stabilised global economic activity.
During 2012, the European governments, including the Italian government, focused on implementing activities to ensure the balance of public accounts. Now the priority is the creation of conditions to favour the relaunch of the economy.
The United States has lost its leadership of the global econo-my. Despite a drop in growth compared with the figures fore-cast, the BRIC countries occupied the top positions on the international markets.
On the basis of the latest OECD estimates available, the GDP for 2012 puts China in first place with a growth of 7.5% on the previous year, compared to the global average of 1.4%. In this context, the EURO area member states show a con-traction of 0.4%, with Italy at -2.4% according to figures from ISTAT.
The industrial production index, drawn up by ISTAT, highlights a significant recession compared to the previous year (-5.3%), with a constantly worsening trend.
The rate of unemployment at the end of 2012 was 10.7% in Italy, substantially in line with the European average, heav-ily penalised by countries such as Spain, Portugal, Greece and Ireland. In this context, Germany highlighted a rate of un-employment of 5.4%, making it one of the best-performing countries in Europe. The most worrying index is the rate of unemployment among young people, which is up 6.2 per-cent, to 35.3%.
The rate of inflation, measured using the consumer price in-dex, reached 2.3% in Italy in December 2012, compared to an average 2.1% in the Euro Zone, with a reduction in pres-sure largely due to the relaxation of tension on input costs and weakness in demand, which generated an excess of produc-tion capacity.

19Situazione dei mercati / Outlook for global markets
Andamento delle valute dei principali mercati in cui opera Oerlikon Graziano nei confronti dell’EuroPerformance against the Euro of the currencies of the ma-jor markets on which Oerlikon Graziano operates
Lira Sterlina: ha avuto una rivalutazione nel corso del 2012, con un picco a 1,28 nel mese di luglio, per poi attestarsi attorno a 1,22 sul fine annoGB Pound: it was revaluated during 2012, with a peak of 1.28 in July, settling at around 1.22 towards the end of the year.
Euro/Dollaro americano | Euro/US dollar
%
0,84
0,82
0,8
0,78
0,76
0,74
0,72
0,7
31/1
231
/01
20122011
31/0
231
/03
31/0
431
/05
31/0
631
/07
31/0
831
/09
31/1
031
/11
31/1
2
Euro/Sterlina inglese | Euro/British Pound
%
1,3
1,28
1,26
1,24
1,22
1,2
1,18
1,16
1,14
1,12
31/1
231
/01
20122011
31/0
231
/03
31/0
431
/05
31/0
631
/07
31/0
831
/09
31/1
031
/11
31/1
2
Rupia Indiana: ha avuto un trend discontinuo nel corso del 2012, in crescita nella prima parte dell’anno con un picco a inizio febbraio di 0,0155, per poi ritornare ai livelli di inizio anno.Indian Rupee: it has a discontinuous trend during 2012, up during the first part of the year, with a peak of 0.0155 at the beginning of February, later returning to the same levels as at the start of the year.
Euro/Rupia Indiana | Euro/Indian Rupee
%
0,84
0,82
0,8
0,78
0,76
0,74
0,72
0,7
31/1
231
/01
20122011
31/0
231
/03
31/0
431
/05
31/0
631
/07
31/0
831
/09
31/1
031
/11
31/1
2
Yuan Cinese: ha avuto un trend similare al Dollaro Americano con un picco a fine luglio di 1,2851 nei confronti dell’Euro.Chinese Yuan: it had a trend similar to that of the US Dollar, with a peak of 1.2851 against the Euro at the end of July
Euro/Yuan Cinese | Euro/Chinese Yuan
%
1,3
1,28
1,26
1,24
1,22
1,2
1,18
1,16
1,14
1,12
31/1
231
/01
20122011
31/0
231
/03
31/0
431
/05
31/0
631
/07
31/0
831
/09
31/1
031
/11
31/1
2
Dollaro Americano: dopo un recupero nella prima metà dell’an-no, è ritornato, nella seconda parte del 2012 ai livelli di inizio anno.US Dollar: following a recovery in the first half of the year, in the second half of 2012 it returned to the same levels as at the start of the year.
20 Situazione dei mercati / Outlook for global markets
Automotive Transmissions
MercatoOerlikon Graziano opera in segmenti molto specifici del mondo dell’automobile. Il focus non è sulle applicazioni ad alto volume dove spesso la performance passa in secondo piano rispetto alla economicità ed alla standardizzazione delle piattaforme e dei componenti in esse utilizzati.
Al contrario, il core business è centrato proprio sulle vetture che si distinguono dalla massa per caratteristiche uniche, che vanno dalla sportività, alla versatilità di impiego su terreni difficili, alle “emissioni zero” o estremamente ridotte di sostanze inqui-nanti. Da questo imprescindibile principio e “missione” dell’a-zienda sono nate e cresciute le tre linee di prodotto Automotive Transmissions:
1 Cambi manuali, elettro attuati e doppia frizione per vetture sportive ad alte ed altissime prestazioni
2 Gruppi di trasmissione (prese di forza e differenziali) per au-tovetture a 4 ruote motrici
3 Gruppi di trasmissione del moto per veicoli elettrici ed ibridi
Oerlikon Graziano ha continuato a puntare anche nel 2012 su queste tre colonne portanti per crescere il proprio business nel mondo dell’automobile, progressivamente aumentando il pro-prio valore del marchio in un ambiente estremamente compe-titivo e puntando sulll’innovazione tecnologica e sulla qualità dell’esecuzione come valori distintivi.
In un contesto ancora difficile a livello mondiale, il 2012 è sta-to un anno di sostanziale stabilità del fatturato per la divisione Automotive Transmissions, un anno però determinante e ricco di eventi, sia dal punto di vista del debutto sul mercato di vei-coli equipaggiati da propri cambi o gruppi di trasmissione, sia di sostanziali innovazioni presentate nei contesti mondiali più prestigiosi del settore.
Veicoli con tecnologia Oerlikon Graziano lanciati nel 2012:
Mercedes Classe A 4WD: presentata al Salone di Ginevra è equipaggiata di una Power Transfer Unit (PTU) specificamente sviluppata, è la prima vettura del marchio Mercedes con piat-taforma normalmente “front wheel drive” ad essere disponibile anche in versione 4WD. Molti veicoli di natura ed apparenza diversa seguiranno, dalla berlina CLA appena presentata al Salone di Detroit ad un piccolo SUV che darà battaglia nel set-tore presidiato da altri prestigiosi marchi tedeschi come Audi e BMW. Per Oerlikon Graziano è un primo importante esempio di collaborazione col gruppo Daimler.
Fiat Panda 4WD: lanciata al Salone di Parigi è dotata di una PTU completamente nuova: il progetto segna la continuità nel-la collaborazione fra Fiat e Oerlikon Graziano, che già aveva svi-luppato un analogo gruppo di trasmissione per la precedente versione della vettura.
Aston Martin Vanquish: la granturismo a 12 cilindri, completa-mente nuova, segna il rilancio del marchio al top della gamma ed è equipaggiata di un gruppo differenziale a slittamento limi-tato sviluppato specificamente per le caratteristiche dinamiche della vettura.
Audi R8: la versione aggiornata della sportiva di casa Audi lan-ciata al Salone di Parigi è dotata di un cambio completamente nuovo, a doppia frizione, sviluppato in stretta collaborazione con il Cliente; anche questo sviluppo avviene nel segno della continuità: sin dal suo debutto nel 2006, infatti, il modello è stato equipaggiato dai cambi Made in Italy, marchiati Oerlikon Graziano.
Audi R8 eTron: il 2012 è stato un anno importante per la rela-zione fra Oerlikon Graziano e la casa dei quattro anelli: anche la prima vettura sportiva completamente elettrica del marchio, che ha portato al debutto il brand “eTron” (simbolo delle future vetture “full electric” del marchio) è infatti dotata di un cambio appositamente progettato e realizzato in serie limitata.
Lancia Rally 037 4WD-H: Oerlikon Graziano ha messo a frutto la propria esperienza anche nel settore trasmissioni elettriche per sviluppare il differenziale ibrido anteriore per la mitica Lan-cia Rally 037, che grazie a questo prototipo di trasmissione è diventata 4WD e ibrida. In tempi molto stretti, a sole dieci settimane dal kick off del progetto, il gruppo di lavoro ha reso futuribile la Lancia 037, mostrando al mondo - durante il Ral-lylegend 2012 di San Marino - come potranno essere le vetture ibride ad alte prestazioni del futuro.

21Situazione dei mercati / Outlook for global markets
Automotive Transmissions
MarketOerlikon Graziano operates in very specific segments of the automotive sector. The focus isn’t on high-volume applica-tions where performance often takes second place behind the economic aspect and the standardisation of platforms and adopted components.
To the contrary, the core business is concentrated on vehi-cles that are set aside from the mass by unique features, ranging from those of a sports nature to versatility of use on harsh terrain, to “zero” or extremely reduced emissions of pollutants. It is this principle and “mission” of the company that has generated the three Automotive Transmissions pro-ducts lines:
1 Manual, automated manual and dual clutch transmission systems for high and very high-performance sports cars
2 Transmission units (power transfer units and differentials) for 4-wheel drive vehicles
3 Driveline assemblies for full electric and hybrid vehicles
During 2012 Oerlikon Graziano continued to focus on these three main areas to increase its business in the automo-bile sector, progressively increasing its brand equity in an extremely competitive environment and concentrating on technological innovation and quality of execution as distin-ctive values.
In a context which continues to be difficult at international level, 2012 was a substantially stable year in terms of tur-nover for the Automotive Transmissions division. However, it was also an important year, full of events, both from the point of view of the debut on the market of vehicles equip-ped with its gearboxes or assemblies, and of substantial in-novations presented in the most prestigious global contexts of the sector.
Vehicles with Oerlikon Graziano technology launched in 2012
Mercedes A Class 4WD: presented at the Geneva Motor Show, it is equipped with a specifically developed Power Transfer Unit (PTU) and is the first ever front wheel drive-ba-sed Mercedes platform to be featured in a 4WD version too. Many vehicles of differing nature and appearance will follow on, from the CLA sedan which has just been presented at the Detroit Auto Show to a small SUV which will compete in the sector covered by other prestigious German brands like Audi and BMW. For Oerlikon Graziano this is a first important example of collaboration with the Daimler group.
Fiat Panda 4WD: launched at the Paris Motor Show, it has an all-new PTU: the project marks the continuity of the collabo-ration between Fiat and Oerlikon Graziano, which had already developed a similar transmission unit for the previous version of the vehicle.
Aston Martin Vanquish: the all-new 12-cylinder grand tourer marks the relaunch of the brand at the top of the range and features a limited slip differential unit developed specifically for the vehicle’s dynamic features.
Audi R8: the latest version of the Audi sports car launched at the Paris Motor Show has a completely new dual clutch transmission, developed in close collaboration with the Cu-stomer. This is another development highlighting continuity in a relationship: since its debut in 2006, in fact, the model has been equipped with gearboxes made in Italy by Oerlikon Graziano.
Audi R8 eTron: 2012 was an important year for the rela-tionship between Oerlikon Graziano and Audi: the brand’s first full-electric sports car, which sees the debut of the “eTron” brand (symbol of the brand’s future full-eclectic vehicles) is, in fact, equipped with a specially designed gearbox built in a limited edition.
Lancia Rally 037 4WD-H: Oerlikon Graziano has also chan-nelled its experience in the electric transmissions sector into developing the front hybrid differential for the legendary Lancia Rally 037, which, thanks to this transmission system has become 4WD and hybrid at the same time. Within a really short space of time, just ten weeks from the kick off of the project, the work team made the Lancia 037 futurable, showing the world – during Rally legend 2012 in San Marino – how the high-performance hybrid vehicles of the future are going to be.

22 Situazione dei mercati / Market situations
Gear and Drive Solutions
Il 2012 è stato un anno di sostanziale crescita nel settore del-le macchine agricole, mentre nel settore della “construction” si sono verificati dei macro fenomeni diversi in relazione alle diverse regioni; quello che ha avuto più effetti negativi è stato il crollo del mercato in Cina, in altri settori la situazione è stata particolarmente negativa (eolico), mentre per quanto riguarda i veicoli industriali si sono verificate situazioni diverse: in Europa una situazione di crisi, mentre nei paesi BRIC un trend positivo.
Per quanto riguarda Oerlikon Graziano l’anno 2012 è stato so-stanzialmente positivo.
Durante il 2012 è stata completata con successo l’attività di ristrutturazione del portafoglio, questa attività era stata iniziata nel 2011 e ha consentito di essere oggi posizionati meglio con i clienti strategici ed inoltre di poter essere più focalizzati sui prodotti chiave dell’azienda.
è stata inoltre svolta un’importante attività per promuovere la capacità di sviluppo dell’azienda, focalizzata sull’obiettivo di ampliamento dell’offerta, ovvero permettere all’azienda di offri-re non solo prodotti per la serie ma anche prototipi ed attività di ricerca e sviluppo utilizzando le competenze già in posses-so; nel 2012 si sono potuti finalizzare alcuni importanti ordini di prototipi ed anche i primi ordini di sola attività di progettazione.
Sono state avviate importanti iniziative di collaborazione con clienti Cinesi per lo sviluppo di sistemi di sincronizzazione, con due clienti maggiori si è già alla fase di testing dopo aver con successo fornito i prototipi, mentre con un terzo si è comple-tata la fase di progettazione, si sono consegnati i prototipi e le prove inizieranno nel 2013.
L’attività di sviluppo in India continua in modo molto positivo: dopo aver consolidato la propria presenza come leader in quel mercato soprattutto come partner di riferimento per i costrut-tori di trattrici agricole, si sono finalizzati importanti accordi di sviluppo con primari costruttori di veicoli industriali; sempre in India nel 2012 è stata rilanciata con successo la produzione della trasmissione CVT per trattori compatti.
Per quanto riguarda la Russia ed il CIS si sono avviate impor-tanti iniziative con costruttori locali che saranno di supporto per lo sviluppo del business in quell’area.
23Situazione dei mercati / Market situations
Gear and Drive Solutions
2012 was a year of substantial growth in the agricultural field, while in the construction sector, different macro phenomena occurred in different regions. What had the greatest negative effects was the collapse of the market in China, and in other sectors (wind power) the situation was particularly difficult, which the industrial vehicles’ sector experienced different si-tuations: there was a crisis in Europe, with a positive trend in the BRIC countries.
As far as Oerlikon Graziano is concerned, 2012 was substan-tially positive.
During 2012, the portfolio was successfully rebuilt. This activity had begun in 2011 and now allows to have a better position with strategic customers and also to focus more clearly on the company’s key products.
An important activity was also carried out to promote the com-pany’s development capacity, focused on the aim of expanding the products offered, i.e. allowing the company to offer not only products for the standard series but also prototypes as well as research and development activities, implementing existing skills. In 2012, some important orders for prototypes were fina-lised, along with first orders for design activity only.
Important collaborations with Chinese customers were laun-ched for the development of synchronisation systems. With two major customers the company is already in the testing phase, having successfully supplied the prototypes, while with a third it has already completed the design phase and delivered the prototypes, with tests scheduled to start in 2013.
Development activity in India continues very positively: after consolidating its presence as leader on that market, especial-ly as reference partner for farm tractor manufacturers, impor-tant development agreements were finalised with the leading manufacturers of industrial vehicles. Also in India, in 2012 the production of the CVT transmission for compact tractors was successfully relaunched.
As regards Russia and the CIS, important initiatives with local manufacturers were launched to support the development of business in that area.
24 Politiche di gestione dei rischi / Risk management policies
Politiche di gestione dei rischi
La gestione dei rischi è un elemento importante per il manteni-mento del valore della società nel tempo. All’interno del Gruppo Oerlikon la gestione dei rischi è parte integrante del sistema di governance. Il monitoraggio dei rischi avviene tramite analisi specifica delle varie aree del business risultante nella definizio-ne di una risk-map che ne quantifica l’impatto e ne identifica le azioni per mitigarne gli effetti.
Inoltre, con l’ausilio della funzione di Internal Audit della Cor-porate, vengono effettuate delle verifiche sistematiche sui di-versi processi/aree aziendali, traendo anche beneficio da best practices delle altre aziende del Gruppo Oerlikon, i cui risultati dell’attività svolta vengono poi riportati al Collegio Sindacale.
Le tipologie di rischi identificate sono:a Rischi strategicib Rischi operativic Rischi finanziarid Rischi legali e di compliance
Rischi strategiciOerlikon Graziano è esposta ai rischi legati all’evoluzione tecno-logica dei prodotti ed alla globalizzazione dei mercati.
Il primo, dove prodotti tecnicamente superiori possono essere offerti al mercato da parte di concorrenti, è mitigato da Oer-likon Graziano con investimenti in attività di Ricerca e Sviluppo nell’ambito delle tecnologie esistenti come in quelle di futura applicazione. Le innovazioni di prodotto e di processo, svilup-pate anche con il supporto della controllata Vocis, sono brevet-tate al fine di proteggere la leadership della Società (per ulteriori approfondimenti si rimanda alla sezione “Ricerca e Sviluppo della relazione sulla gestione).
Oerlikon Graziano opera nel settore On/Off-highway, servendo tutti i maggiori OEM, i quali hanno globalizzato le loro sedi pro-duttive cercando fonti locali di approvvigionamento. Al fine di mitigare il rischio di riduzione della quota di mercato nei settori agricolo e movimento terra, Oerlikon Graziano ha sviluppato, facendo anche leva sulla struttura del Gruppo Oerlikon, una strategia di localizzazione verso le aree geografiche con mag-gior potenziale di sviluppo, rafforzando così la partnership con i propri clienti.
Rischi operativiI principali rischi operativi di Oerlikon Graziano sono legati ai prezzi ed alla disponibilità delle materie prime, all’andamento della congiuntura economica internazionale, alle tematiche del-la sicurezza sul lavoro e dell’ambiente.
Per le materie prime, essendo la produzione sostanzialmente basata sull’utilizzo di acciaio, il rischio è legato alla volatilità dei prezzi sul mercato. Oerlikon Graziano ha mitigato ciò, tramite un processo di revisione trimestrale con i fornitori e con i prin-cipali clienti dei prezzi dei prodotti sulla base dell’andamento
25Politiche di gestione dei rischi / Risk management policies
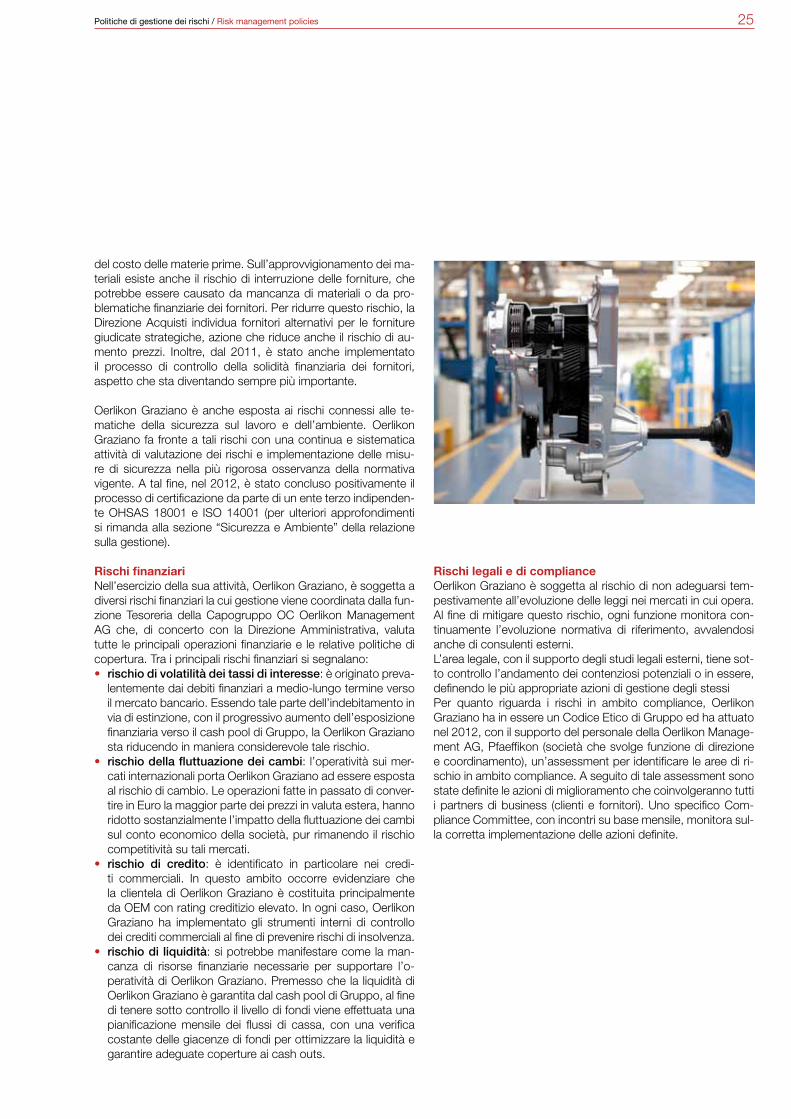
del costo delle materie prime. Sull’approvvigionamento dei ma-teriali esiste anche il rischio di interruzione delle forniture, che potrebbe essere causato da mancanza di materiali o da pro-blematiche finanziarie dei fornitori. Per ridurre questo rischio, la Direzione Acquisti individua fornitori alternativi per le forniture giudicate strategiche, azione che riduce anche il rischio di au-mento prezzi. Inoltre, dal 2011, è stato anche implementato il processo di controllo della solidità finanziaria dei fornitori, aspetto che sta diventando sempre più importante.
Oerlikon Graziano è anche esposta ai rischi connessi alle te-matiche della sicurezza sul lavoro e dell’ambiente. Oerlikon Graziano fa fronte a tali rischi con una continua e sistematica attività di valutazione dei rischi e implementazione delle misu-re di sicurezza nella più rigorosa osservanza della normativa vigente. A tal fine, nel 2012, è stato concluso positivamente il processo di certificazione da parte di un ente terzo indipenden-te OHSAS 18001 e ISO 14001 (per ulteriori approfondimenti si rimanda alla sezione “Sicurezza e Ambiente” della relazione sulla gestione).
Rischi finanziariNell’esercizio della sua attività, Oerlikon Graziano, è soggetta a diversi rischi finanziari la cui gestione viene coordinata dalla fun-zione Tesoreria della Capogruppo OC Oerlikon Management AG che, di concerto con la Direzione Amministrativa, valuta tutte le principali operazioni finanziarie e le relative politiche di copertura. Tra i principali rischi finanziari si segnalano:• rischio di volatilità dei tassi di interesse: è originato preva-
lentemente dai debiti finanziari a medio-lungo termine verso il mercato bancario. Essendo tale parte dell’indebitamento in via di estinzione, con il progressivo aumento dell’esposizione finanziaria verso il cash pool di Gruppo, la Oerlikon Graziano sta riducendo in maniera considerevole tale rischio.
• rischio della fluttuazione dei cambi: l’operatività sui mer-cati internazionali porta Oerlikon Graziano ad essere esposta al rischio di cambio. Le operazioni fatte in passato di conver-tire in Euro la maggior parte dei prezzi in valuta estera, hanno ridotto sostanzialmente l’impatto della fluttuazione dei cambi sul conto economico della società, pur rimanendo il rischio competitività su tali mercati.
• rischio di credito: è identificato in particolare nei credi-ti commerciali. In questo ambito occorre evidenziare che la clientela di Oerlikon Graziano è costituita principalmente da OEM con rating creditizio elevato. In ogni caso, Oerlikon Graziano ha implementato gli strumenti interni di controllo dei crediti commerciali al fine di prevenire rischi di insolvenza.
• rischio di liquidità: si potrebbe manifestare come la man-canza di risorse finanziarie necessarie per supportare l’o-peratività di Oerlikon Graziano. Premesso che la liquidità di Oerlikon Graziano è garantita dal cash pool di Gruppo, al fine di tenere sotto controllo il livello di fondi viene effettuata una pianificazione mensile dei flussi di cassa, con una verifica costante delle giacenze di fondi per ottimizzare la liquidità e garantire adeguate coperture ai cash outs.
Rischi legali e di complianceOerlikon Graziano è soggetta al rischio di non adeguarsi tem-pestivamente all’evoluzione delle leggi nei mercati in cui opera. Al fine di mitigare questo rischio, ogni funzione monitora con-tinuamente l’evoluzione normativa di riferimento, avvalendosi anche di consulenti esterni. L’area legale, con il supporto degli studi legali esterni, tiene sot-to controllo l’andamento dei contenziosi potenziali o in essere, definendo le più appropriate azioni di gestione degli stessiPer quanto riguarda i rischi in ambito compliance, Oerlikon Graziano ha in essere un Codice Etico di Gruppo ed ha attuato nel 2012, con il supporto del personale della Oerlikon Manage-ment AG, Pfaeffikon (società che svolge funzione di direzione e coordinamento), un’assessment per identificare le aree di ri-schio in ambito compliance. A seguito di tale assessment sono state definite le azioni di miglioramento che coinvolgeranno tutti i partners di business (clienti e fornitori). Uno specifico Com-pliance Committee, con incontri su base mensile, monitora sul-la corretta implementazione delle azioni definite.

26 Politiche di gestione dei rischi / Risk management policies
Risk management is an important element for upholding the value of the company in time. Within the Oerlikon Group, risk management is an integral part of the governance system. Risks are monitored through specific analyses of the various areas of business resulting in the definition of a risk map which quantifies the impact and defines actions to mitigate the ef-fects.
Moreover, with the aid of the Corporate Internal Audit func-tion, systematic checks are carried out on the different busi-ness areas/processes, also gaining benefit from the best practices of the other Oerlikon Group companies, with the results of these activities being reported to the Board of Statu-tory Auditors.
The types of risks identified are:a Strategic risksb Operational risksc Financial risksd Legal and compliance risks
Strategic risksOerlikon Graziano is exposed to risks linked to the technologi-cal evolution of the products and globalisation of the markets.
The first, where technically superior products can be offered to the market by competitors, is mitigated by Oerlikon Grazi-ano with investments in Research and Development within the scope of existing technologies and those that will be applied in future. Product and process innovations, also developed with the support of the subsidiary Vocis, are patented to protect the Company leadership (for further details see the “Research and Development” section of the Operational review).
Oerlikon Graziano operates in the On/Off-highway segment, serving all the major OEM, who have globalised their produc-tion premises seeking local procurement sources. In order to mitigate the risk of reduction of the market share in the agricul-tural and earth moving sectors, Oerlikon Graziano has devel-oped, also with the aid of the Oerlikon Group structure, a strat-egy of localisation towards geographic areas with the greatest development potential, thus strengthening the partnership with customers.
Risk management policies

27Politiche di gestione dei rischi / Risk management policies
Operational risksThe main operational risks incurred by Oerlikon Graziano are linked to the prices and availability of raw materials, to the trend of the international economy and to safety in the workplace and environment matters.
For the raw materials, as production is based substantially on the use of steel, the risk is linked to the volatility of prices on the market. Oerlikon Graziano has mitigated this risk thanks to a quarterly product price review process with suppliers and the main customers, based on the cost of raw materials. The procurement of materials is still subject to the risk of interrup-tion of supplies, which could be caused by a lack of materials or by financial problems affecting suppliers. To mitigate this risk, the Purchasing Management identifies alternative suppli-ers of products considered to be strategic and this action also reduces the risk of price increases. Moreover, since 2011, the supplier solvency checking process has also been imple-mented to cover an aspect which is becoming increasingly important.
Oerlikon Graziano is also exposed to risks connected to mat-ters of safety in the workplace and the environment. Oerlikon Graziano tackles these risks with a continuing and systematic risk assessment activity and implementation of safety meas-ures in the strictest observance of the regulations in force. To this end, in 2012, the OHSAS 18001 and ISO 14001 inde-pendent certification processes were successfully completed (for more details see the “Safety and Environment” section of the Operational review).
Financial risksIn the exercise of its activity, Oerlikon Graziano is subject to different financial risks, the management of which is coordi-nated by the Treasury function of the Parent Company, OC Oerlikon Management AG which, in conjunction with the Ad-ministrative Management, assesses all the major financial op-erations and corresponding hedge policies. The main financial risks include:• risk of volatility of interest rates. This risk originates main-
ly from medium/long-term financial debts with the banking market. As this part of the debt is becoming extinct, with the progressive increase in financial exposure towards the Group cash pool, Oerlikon Graziano is considerably reduc-ing this risk.
• exchange rate risk. Operations on international markets expose Oerlikon Graziano to the exchange rate risk. Trans-actions in the past to convert most prices in foreign cur-rencies into euro have substantially reduced the impact of fluctuating exchange rates on the company’s statement of income. However the competitive risk on these markets re-mains.
• credit risk. This risk is particularly identified in customer receivables. In this sphere it is necessary to highlight the fact that Oerlikon Graziano’s customers consists mainly of OEMs, with high credit ratings. In any case, Oerlikon Gra-ziano has implemented internal activities to monitor cus-tomer receivables to prevent insolvency risks.
• liquidity risk. This could occur in the form of an absence of financial resources to support the operations of Oerlikon Graziano. Considering that Oerlikon Graziano’s liquidity is guaranteed by the Group cash pool, in order to monitor the level of funds, a monthly cash flow plan is drawn up, constantly checking the funds available to optimise liquidity and guarantee adequate cash out hedges.
Legal and compliance risksOerlikon Graziano is subject to the risk of failing to adapt promptly to the evolution of the laws of the markets on which it operates. In order to mitigate this risk, every function con-stantly monitors the evolution of the reference standards, also engaging independent consultants. The legal area, with the support of independent legal studios, monitors the progress of potential or current disputes, estab-lishing the most appropriate actions to manage them. As regards compliance risks, Oerlikon Graziano has a Group Ethics Code and, in 2012, with the support of Oerlikon Man-agement AG, Pfaeffikon staff (a company which carries out management and coordination activities), it performed an as-sessment to identify the compliance risk areas. Following this assessment, improvement actions were defined, involving all the business partners (customers and suppliers). A specific Compliance Committee, which meets monthly, will monitor the correct implementation of the actions defined.

28 Sicurezza e ambiente / Safety and Environment
Sicurezza e ambiente
Nel corso degli ultimi anni Oerlikon Graziano ha prestato una sempre maggiore attenzione agli aspetti legati alla salute, sicu-rezza ed ambiente. Alla fine del 2011, nell’ottica di assicurare il costante miglioramento nel tempo delle prestazioni, si è scelto di adottare un sistema di gestione integrato per Salute Sicurez-za ed Ambiente (SSA). Nel Dicembre 2012 i cinque stabilimenti italiani Oerlikon Graziano hanno ottenuto la certificazione del sistema secondo gli schemi BS OHSAS 18001:2007 (Sicurez-za) e ISO 14001:2004 (Ambiente) da parte di DNV Det Norske Veritas.
SicurezzaUn elemento fondamentale per il raggiungimento di questo obiettivo è stata l’adozione del sistema World Class Manufac-turing (WCM) che prevede quale pilastro fondamentale quello della sicurezza. Grazie agli strumenti forniti da questo sistema sono stati possibili:• una profonda analisi dei dati storici, necessari per definire un
piano di miglioramento adeguato• una migliore analisi delle cause e gestione di infortuni, medi-
cazioni, mancati infortuni• un maggior coinvolgimento del personale (lavoro in team,
segnalazioni..)• un approccio dettagliato di risoluzione dei problemi (Quick
Kaizen, One point lesson, Standard operating procedure…)• un’ampia e chiara divulgazione dei dati (bacheche, safety
room, video all’ingresso)
Tutte le attività messe in campo hanno portato alla riduzione in un anno del 51% del numero di infortuni e del 56% dei giorni persi per infortunio. Questo costituisce un primo passo verso l’obiettivo triennale di riduzione del 50% di anno in anno, per passare dall’indice di frequenza (LTAFR) 11,6 del 2011 ad un LTAFR intorno all’ 1,5 entro il 2014. Resta inteso che l’obiettivo di riduzione triennale fissato rappresenta un traguardo per arri-vare all’unico vero obiettivo accettabile: ZERO infortuni.
Ambiente Le principali attività di riduzione dell’impatto ambientale portate avanti nel corso dell’anno sono state le seguenti:• eliminazione di serbatoi interrati per prevenire la possibile
contaminazione del suolo• rimozione di materiali contenenti amianto• implementazione della raccolta differenziata per ridurre i
quantitativi di rifiuti avviati allo smaltimento in discarica• rifacimento delle isole ecologiche e dei depositi dell’olio• miglioramento della gestione delle sostanze chimiche• riduzione del consumo di energia elettrica e gas grazie a pro-
getti specifici
Il punto centrale per l’ottenimento degli obiettivi fissati è co-stituito dal forte impegno da parte della Direzione sancito nel-la Politica Salute Sicurezza e Ambiente e portato avanti con grande coerenza nel corso dell’anno. Per evidenziare il focus sulla materia, l’aggiornamento di Salute Sicurezza e Ambiente è diventato il primo argomento di tutti gli Ste-Co e dei Comitati industriali. Un vasto piano di formazione in materia di sicurezza e salute sul posto di lavoro condotto nell’anno ha coinvolto tutti i lavoratori mettendo ognuno di essi in aula da un minimo di 8 ore sino a 24 ore per i preposti.
Il coinvolgimento delle persone è aumentato considerevolmen-te grazie ad un piano della comunicazione in materia HSE che ha previsto nel corso dell’anno una serie di appuntamenti ormai istituzionali quali: “la giornata per la sicurezza” per dare a tutti i lavoratori un’informazione circa i risultati raggiunti nell’anno precedente e per condividere gli obiettivi per l’anno in corso; i “30 minuti mensili HSE” nel corso dei quali ogni responsa-bile aggiorna i lavoratori circa i risultati del mese; i “5 minuti” effettuati ogni giorno su tutti i turni per mantenere sempre viva l’attenzione sugli argomenti di salute sicurezza e ambiente.
www.oerlikon.com/graziano

29Sicurezza e ambiente / Safety and Environment
Safety and Environment
In recent years Oerlikon Graziano has paid more and more at-tention to aspects linked to health, safety and environment. At the end of 2011, with a view to ensuring the constant improve-ment in time of performance, the decision was made to imple-ment an integrated management system for Health, Safety and Environment (HSE). In December 2012, all Italian Oerlikon Gra-ziano plants attained certification of the system in compliance with BS OHSAS 18001:2007 (Safety) and ISO 14001:2004 (Environment) by DNV Det Norske Veritas.
SafetyA fundamental element for achieving this aim was the adop-tion of the World Class Manufacturing (WCM) system which envisages safety as a fundamental pillar. Thanks to the tools supplied by this system, the following has been possible:• in-depth analysis of the historical data required to draw up
an adequate improvement plan• better analysis of the causes and management of accidents,
medication, near misses• greater involvement of staff (team work, reporting...)• a detailed approach to problem solving (Quick Kaizen, One
point lesson, Standard operating procedure…)• an extensive and clear divulgation of data (notice boards,
safety room, video at entrance)
All the activities implemented have led, in one year, to a 51% reduction in the number of accidents and a 56% reduction in the days lost as a consequence of accident. This is a first step towards the three-year aim to achieve a 50% reduction year by year, to switch from a frequency index (LTAFR) of 11.6 in 2011 to an LTAFR of around 1.5 by 2014. It is understood that the three-year reduction aim set represents a way of achieving the only real acceptable target: ZERO accidents.
EnvironmentThe main activities to reduce the environmental impact pursued throughout the year were the following: • elimination of underground tanks to prevent possible con-
tamination of the soil• removal of materials containing asbestos• implementation of differentiated waste collection to reduce
the amount of waste sent to the dump for disposal• renewal of the ecological islands and oil deposits• improvement of the management of chemical substances• reduction of the consumption of electricity and gas thanks to
specific projects
The central point for achieving the aims set consists of the strong commitment by the Management sanctioned in the Health, Safety and Environment Policy and carried forward consistently during the year. To highlight the focus on the mat-ter, the Health, Safety and Environment update has become the leading subject of all the Ste-Co and Industrial Commit-tees. A wide training plan on safety and health in the work-place has involved all employees, putting everyone in the classroom for a minimum of 8 and a maximum of 24 hours for those appointed.
The involvement of people has increased considerably thanks to an HSE communication plan, which envisaged a series of appointments during the year which have now become a constant: “safety day” to give all employees information on the results achieved during the previous year and to share the aims for the year in progress; “30 monthly minutes of HSE”, half an hour where every manager updates employees on the month’s results; “5 minutes” every day on all shifts, to keep attention focused constantly on health, safety and environ-ment updates.
www.oerlikon.com/graziano

30 Risorse Umane / Human Resources
Risorse Umane
Il 2012 è stato un anno particolarmente intenso, che ha visto le risorse umane al centro delle attività di Oerlikon Graziano.
Il 2012 è stato l’anno in cui si è data maggiore enfasi alla forma-zione del personale arrivando al dato record di oltre 50.000 ore di formazione effettuata in azienda.
Lo sviluppo delle competenze e capacità delle risorse umane è fondamentale ed essenziale per continuare a crescere e a progredire nella ricerca di risultati Best in Class: solo con per-sonale BiC l’Azienda potrà raggiungere questi traguardi. Mol-teplici sono state le aree di intervento su tutta la popolazione aziendale, in primis la sicurezza che ha visto oltre 21.000 ore ad essa dedicate, ma non solo. Nel grafico sono riportate le di-stribuzioni fra i diversi argomenti delle attività formative, mentre nella tabella si può apprezzare l’incremento pari a circa il 100% delle ore fatte rispetto all’anno precedente.
L’introduzione dei core values aziendali, gli steering committee in ogni stabilimento, l’avvio di un processo di valutazione del-le prestazioni oggettivato, le attività di mappatura dei Talenti aziendali, sono tutte iniziative che hanno come elemento co-mune le risorse umane dell’Azienda come l’asset strategico per eccellenza.
2012 was a particularly intense year, which witnessed human resources at the centre of Oerlikon Graziano’s activities.
2012 was the year in which greatest emphasis was placed on staff training, reaching a record number of over 50,000 training hours within the company.
The development of the skills and capacities of human re-sources is fundamental and essential to continue growing and progressing in the achievement of Best in Class results. Only with BiC staff the Company can achieve these aims. The ar-eas of action throughout the whole company were numerous, prioritising safety, with over 21,000 hours dedicated, among other things. The chart shows the distribution of the training activities among the various subjects, while the table indicates the increase, equating to 100% of the training hours carried out in the previous year.
The introduction of the company’s core values, steering com-mittees in every plant, the launch of an objectified performance assessment process and company talent mapping activities are all initiatives that share the Company’s human resources as the strategic asset par excellence.
Human Resources
Ore di formazione | Training hours
2011 2012
Operai | Blue collars 31.021 12.129
Impiegati | White collars 18.270 13.004
Dirigenti | Management 1.203 655
Totale | Total 50.493 25.78743%SicurezzaSafety
2%Istituzionale
Company training
10,5%ComportamentaleInterpersonal skills
3%Economics Economics
0,5%Informatica/CADOffice/CAD
22%Specialistica
Functional/ Technical skills
9%QualitàQuality
2,5%Programmi executive
Executive Prog.
7,5%LingueLanguage

31Risorse Umane / Human Resources

32 Ricerca e Sviluppo / Research and Development
Ricerca e Sviluppo
Nel 2012 è iniziato lo sviluppo di due importanti progetti innova-tivi, le trasmissioni note come “e-DCT” ed “OG-Eco”.Per entrambe sono state depositate le domande di brevetto internazionale. La trasmissione OG-Eco è destinata principalmente alle vet-ture ibride sportive. In questo campo le due tecnologie che la fanno da padrone sono il DCT (Dual Clutch Transmission) e l’AMT (Automated Manual Transmission).Oerlikon Graziano è già fornitore di due trasmissioni che sono un riferimento nel settore: il DCT per la McLaren MP4-12C e l’AMT per la Lamborghini Aventador.La trasmissione OG-Eco vuole coniugare vantaggi delle due soluzioni, eliminandone gli intrinseci svantaggi.I cambi DCT hanno l’indubbio vantaggio del comfort nel cam-bio marcia, mentre sono penalizzate in termini di efficienza, peso e costo.Di contro i cambi AMT hanno il loro tallone d’Achille nella inter-ruzione di coppia motrice alle ruote, che il guidatore avverte nel passaggio tra due marce successive.L’OG-Eco sfrutta l’azione di un motore elettrico, che lavora in parallelo al tradizionale motore termico ed è direttamente colle-gato alla trasmissione, per sopperire alla mancanza di trazione durante la cambiata.Altrettanto innovativa è la trasmissione e-DCT, che prende ispirazione dai cambi DCT, ma ne risolve i problemi di peso, dimensioni, efficienza e costi.La trasmissione e-DCT sfrutta la potenza derivante dall’utilizzo di due motori elettrici che lavorano in parallelo, permettendo un cambio marcia, senza interruzione di coppia.Il concept è applicabile ad una ampia gamma di veicoli, dalle city-car ai veicoli commerciali.E’ nata per veicoli puramente elettrici, ma si presta molto bene ad essere impiegata su un assale di un veicolo tradizionale, ottenendo così un ibrido 4WD. Sia l’e-DCT che l’OG-Eco sono la testimonianza dell’impegno di Oerlikon Graziano nel settore dei veicoli a basso impatto am-bientale e sono state anche presentate a due convegni orga-nizzati dal CTI (Car Training Institute), che sono universalmente riconosciuti come gli eventi di riferimento nel mondo delle tra-smissioni. A questi convegni partecipano esponenti delle più importanti aziende nel mondo delle trasmissioni per veicoli.Nel 2012 ai tradizionali convegni CTI Europeo e Nord-America-no si è aggiunto per la prima volta quello organizzato a Shang-hai. Proprio a Shanghai è stato presentato il progetto e-DCT, una trasmissione destinata ai veicoli elettrici.
Oerlikon Graziano è inoltre attiva anche nel campo delle cosid-dette “shifting solutions”, cioè gruppi sincronizzatori e frizioni powershift, che l’Azienda sviluppa per altri costruttori di tra-smissioni manuali ed automatiche.Vale la pena ricordare che Oerlikon Graziano è leader nella for-nitura di gruppi sincronizzatori destinati ai trattori agricoli, con oltre il 90% del mercato mondiale.Con l’obiettivo di estendere il campo di applicazioni, nel corso del 2012 è stato completato lo sviluppo di una nuova famiglia

33Ricerca e Sviluppo / Research and Development
di sincronizzatori destinata ai veicoli industriali.Si è ottenuto un significativo miglioramento in termini di ridu-zione dei consumi e delle emissioni, oltre ad una ottimizzazione della fase di cambiata. Tale prodotto è stato testato su nuove trasmissioni 9 e 14 mar-ce di un importante costruttore cinese con risultati eccezionali.
Per poter meglio fare fronte alle sempre crescenti esigenze di innovazione, Oerlikon Graziano si è dotata nel corso dell’anno di importanti strumenti di calcolo, tra i quali un nuovo SW per la simulazione dei flussi d’olio nella trasmissione, importante per l’ottimizzazione delle condizioni di lubrificazione.Questo SW, utilizzato per la cosiddetta CFD (Computational Fluid Dynamics), permette di definire a calcolo e prima della di-sponibilità di prototipi fisici, la quantità d’olio minima necessaria al corretto funzionamento della trasmissione.Ridurre la quantità d’olio all’interno di una trasmissione significa ridurre le perdite per sbattimenti interni e quindi la quantità di energia dissipata per calore.
Nel corso del 2012 sono proseguiti due importanti sviluppi fi-nanziati dalla Comunità Europea all’interno del cosiddetto 7° Programma Quadro.I due progetti sono noti come “AutoSuperCap”, che terminerà nel 2013, ed “AVTR”, il cui termine è previsto per il 2015. En-trambi si riferiscono allo sviluppo di veicoli elettrici.Nel caso di sviluppi finanziati con il contributo della Comunità Europea, si sono costituiti dei team di Università e Partner indu-striali di vari Paesi comunitari.Per ciascuno di questi due progetti il ruolo di Oerlikon Graziano è stato quello di sviluppare, sino alla realizzazione del prototi-po di veicolo dimostratore, una trasmissione innovativa a due marce, con il processo di cambio marcia che avviene senza interruzione di coppia.
L’attenzione di Oerlikon Graziano ai temi dell’innovazione è testimoniata anche dalla collaborazione con Università di diversi Paesi Europei, tra cui quella con l’Università inglese del Surrey, che ospita due ricercatori che lavorano in esclusiva per Oerlikon Graziano.Analoga collaborazione è iniziata con l’Università di Modena e Reggio Emilia, mentre presso quella di Napoli, l’Azienda svol-ge un’attività di insegnamento di Progettazione delle Trasmis-sioni, inserita all’interno di un Master Post Laurea.
Oltre che all’innovazione sul prodotto, Oerlikon Graziano è attiva anche in quella sui processi produttivi.Nel corso del 2012 sono stati sperimentati, tra gli altri, nuo-vi processi di trattamento termico e acciai speciali alternativi destinati alla produzione di componenti di trasmissione (alberi ed ingranaggi).L’obiettivo è quello di ridurre il consumo di energia necessaria al trattamento termico, migliorarne la qualità e ridurre l’impie-go di elementi leganti dell’acciaio.Tutti questi aspetti sono oggi di estrema importanza anche per l’indispensabile attenzione alle problematiche ambientali legate al consumo di energia, alle emissioni in atmosfera ed alla riduzione dell’utilizzo di materie prime. Con l’ obiettivo umanitario di porre fine ai conflitti violenti in certe aree geografiche del Mondo, si sono coinvolti i nostri fornitori di acciaio nel prestare particolare attenzione a non utilizzare nei loro processi i “Conflict minerals”, cioè quei mi-nerali come Columbite-Tantalite (Coltan), Casserite, Stagno, Oro, Niobio e Tungsteno la cui estrazione e commercio in Paesi come ad esempio la Repubblica Democratica del Con-go e altre “Covered Countries”, possono dar luogo a conflitti armati.
34 Ricerca e Sviluppo / Research and Development
Research and Development
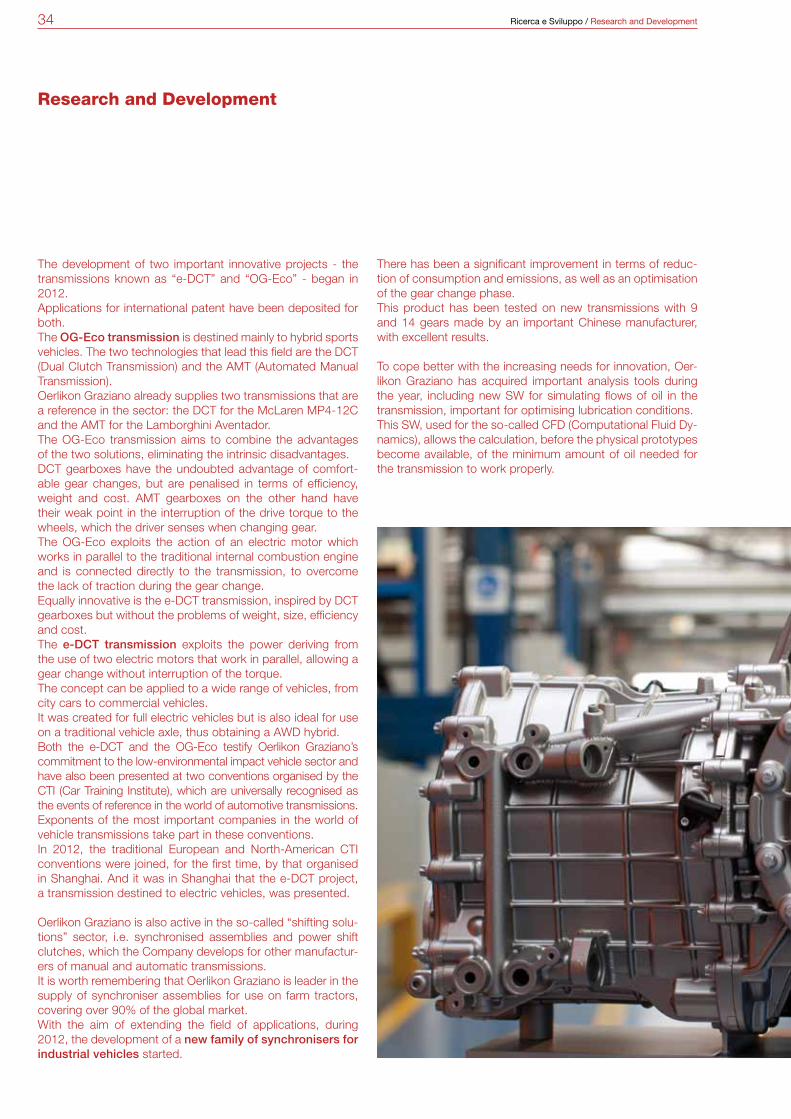
The development of two important innovative projects - the transmissions known as “e-DCT” and “OG-Eco” - began in 2012. Applications for international patent have been deposited for both.The OG-Eco transmission is destined mainly to hybrid sports vehicles. The two technologies that lead this field are the DCT (Dual Clutch Transmission) and the AMT (Automated Manual Transmission).Oerlikon Graziano already supplies two transmissions that are a reference in the sector: the DCT for the McLaren MP4-12C and the AMT for the Lamborghini Aventador.The OG-Eco transmission aims to combine the advantages of the two solutions, eliminating the intrinsic disadvantages.DCT gearboxes have the undoubted advantage of comfort-able gear changes, but are penalised in terms of efficiency, weight and cost. AMT gearboxes on the other hand have their weak point in the interruption of the drive torque to the wheels, which the driver senses when changing gear.The OG-Eco exploits the action of an electric motor which works in parallel to the traditional internal combustion engine and is connected directly to the transmission, to overcome the lack of traction during the gear change.Equally innovative is the e-DCT transmission, inspired by DCT gearboxes but without the problems of weight, size, efficiency and cost.The e-DCT transmission exploits the power deriving from the use of two electric motors that work in parallel, allowing a gear change without interruption of the torque.The concept can be applied to a wide range of vehicles, from city cars to commercial vehicles.It was created for full electric vehicles but is also ideal for use on a traditional vehicle axle, thus obtaining a AWD hybrid. Both the e-DCT and the OG-Eco testify Oerlikon Graziano’s commitment to the low-environmental impact vehicle sector and have also been presented at two conventions organised by the CTI (Car Training Institute), which are universally recognised as the events of reference in the world of automotive transmissions. Exponents of the most important companies in the world of vehicle transmissions take part in these conventions.In 2012, the traditional European and North-American CTI conventions were joined, for the first time, by that organised in Shanghai. And it was in Shanghai that the e-DCT project, a transmission destined to electric vehicles, was presented.
Oerlikon Graziano is also active in the so-called “shifting solu-tions” sector, i.e. synchronised assemblies and power shift clutches, which the Company develops for other manufactur-ers of manual and automatic transmissions.It is worth remembering that Oerlikon Graziano is leader in the supply of synchroniser assemblies for use on farm tractors, covering over 90% of the global market.With the aim of extending the field of applications, during 2012, the development of a new family of synchronisers for industrial vehicles started.
There has been a significant improvement in terms of reduc-tion of consumption and emissions, as well as an optimisation of the gear change phase. This product has been tested on new transmissions with 9 and 14 gears made by an important Chinese manufacturer, with excellent results.
To cope better with the increasing needs for innovation, Oer-likon Graziano has acquired important analysis tools during the year, including new SW for simulating flows of oil in the transmission, important for optimising lubrication conditions.This SW, used for the so-called CFD (Computational Fluid Dy-namics), allows the calculation, before the physical prototypes become available, of the minimum amount of oil needed for the transmission to work properly.

35Ricerca e Sviluppo / Research and Development
Reducing the amount of oil in a transmission means reduc-ing loss due to internal burning and therefore the amount of energy dissipated through heat.
During 2012 work continued on two important develop-ments financed by the European Community within the so-called 7th Framework Programme.The two projects are known as “AutoSuperCap”, which will end in 2013, and “AVTR”, the end of which is envisaged for 2015. Both refer to the development of electric vehicles.In the case of developments financed with the contribution of the European Community, teams of Universities and Industrial Partners from various EU countries were set up. For each of these two projects, the role of Oerlikon Graziano has been to develop, as far as the construction of the demon-
stration prototype vehicle, an innovative two clutch transmis-sion, with the gear changing processing taking place without interrupting the torque. Oerlikon Graziano’s attention to innovation is also testified by the collaboration with Universities from different Eu-ropean countries, including the English University of Surrey, which hosts two researchers who work exclusively for Oer-likon Graziano.A similar collaboration has been started with the University of Modena and Reggio Emilia, while at Naples University, the Company performs a teaching activity for Designing Trans-missions, included within a Post Graduate Master.
In addition to product innovation, Oerlikon Graziano is also active in innovation relating to production processes.During 2012, among other things, new heat treatment pro-cesses and special alternative steels destined to the produc-tion of transmission components (shafts and gears) were tested.The aim is to reduce the amount of energy consumed during heat treatment, improve quality and reduce the use of alloy elements.All these aspects are now of the utmost importance due to the vital attention to environmental problems linked to energy consumption, emissions into the atmosphere and the reduc-tion in use of raw materials. With the humanitarian aim of ending violent conflicts in certain geographic areas of the world, our steel suppliers have paid particular attention to avoid using “Conflict minerals” in their processes. These are minerals such as Columbite-Tantalite (Coltan), Casserite, Tin, Gold, Niobium and Tungsten, the ex-traction and sale of which in countries like the Democratic Republic of Congo and other “Covered Countries”, can cause armed conflicts.

36 Qualità / Quality
Qualità Quality
Oerlikon Graziano persegue un approccio qualitativo globale, da sempre rivolto non solo all’affidabilità dei prodotti realizzati, ma anche alla totalità dei servizi offerti al cliente.
Tale orientamento qualitativo affonda le radici nel passato e, a partire dal 1996, ha scelto di essere omologato ufficialmente come Sistema Qualità, da parte di enti terzi qualificati.
Negli anni è stato riconosciuto conforme alle norme interna-zionali ISO 9001 (1996), QS 9000 (2001) ed infine alla ISO TS16949 (2002) com’è ancora oggi; gli Organismi Terzi di certi-ficazione sono stati scelti tra quelli meglio riconosciuti e stimati a livello internazionale.
Parte integrante del Sistema Qualità è rappresentato dal Ma-nuale Qualità (Headquarters e per singola location produttiva) e dal corpus di Procedure/Istruzioni/Modulistica interna.
Tali riconoscimenti esterni, oltre ai numerosi “premi qualitativi” ricevuti dai Clienti principali, sono il frutto dell’impegno profuso da Oerlikon Graziano in tutti questi anni, nell’essere sempre più compliant con i requisiti specifici dei Clienti (spesso Top Line nel loro settore), adottando processi aziendali interni sempre più snelli ed efficaci e promuovendo la filosofia del “miglioramento continuo”.
Al proprio interno, l’Azienda ritiene basilare la valorizzazione, lo sviluppo e la responsabilizzazione di tutti i dipendenti e pertanto attua politiche per un loro costante coinvolgimento e motivazio-ne, conscia del fatto che solo il contributo e la dedizione di tutto il Gruppo può far pervenire a risultati convincenti e duraturi.
Dal momento che la soddisfazione finale del Cliente è forte-mente influenzata anche dalla catena di Fornitori, un grande sforzo è stato attuato per creare un adeguato Web Portal multi-lingue, facilmente accessibile e completo di Requisiti/Capitola-ti/Istruzioni/Programmi informatici per la fornitura, onde rendere idoneo ed immediato lo scambio di dati ed informazioni tra le parti, a cui si affianca l’efficace team dell’Assicurazione Qualità e Sviluppo Fornitori, che supporta i processi ed i nuovi avvia-menti direttamente presso i siti produttivi dei Fornitori.
Oerlikon Graziano, infine, a cadenza ravvicinata, effettua inda-gini di Customer Satisfaction, per valutare l’apprezzamento dei propri sforzi presso i Clienti ed eventualmente rivalutarli nell’ot-tica di poter performare sempre meglio in un mercato molto esigente.
Oerlikon Graziano pursues a global qualitative approach, which has always been aimed not only at the reliability of the products made, but also at the totality of services offered to customers.
This qualitative orientation is rooted in the past and, since 1996, has chosen to be officially certified as a Quality System by qualified independent certification boards.
Over the years it has been acknowledged as compliant with the international standards ISO 9001 (1996), QS 9000 (2001) and, lastly, ISO TS16949 (2002), which is still applicable today; the independent certification boards have been chosen from those best recognised and respected at international level.
An integral part of the Quality System is represented by the Quality Manual (Headquarters and for every single manufac-turing location) and by the Procedures/Instructions/In-house forms.
This external acknowledgements, as well as the numerous “quality awards” received from our major customers, are the result of the hard work carried out by Oerlikon Graziano over the years, to ensure increasing compliance with the specific requirements of our customers (often Top Line in their sector), implementing in-house company processes that are more and more streamlined and effective and promoting the philosophy of “continuous improvement”.
Within the company, value enhancement, development and creation of responsibility in all employees are considered of fun-damental importance, so the company implements policies for their involvement and motivation, aware of the fact that only the contribution and dedication of the whole Group can achieve convincing and lasting results.
Since Customer satisfaction is also strongly influenced by the Supply Chain, considerable effort has been made to create an adequate multilingual website that is easily accessible and complete with Requirements/Specifications/Instructions/IT pro-grams for supply, in order to make the exchange of data and in-formation between the parties immediate. This flanks the effec-tive Quality Assurance and Supplier Development team, which supports the processes and new launches directly at Supplier production sites.
Lastly, Oerlikon Graziano carries out regular Customer Satis-faction investigations to assess the appreciation of its efforts by customers and reassess them if necessary, with a view to performing better all the time on a very demanding market.
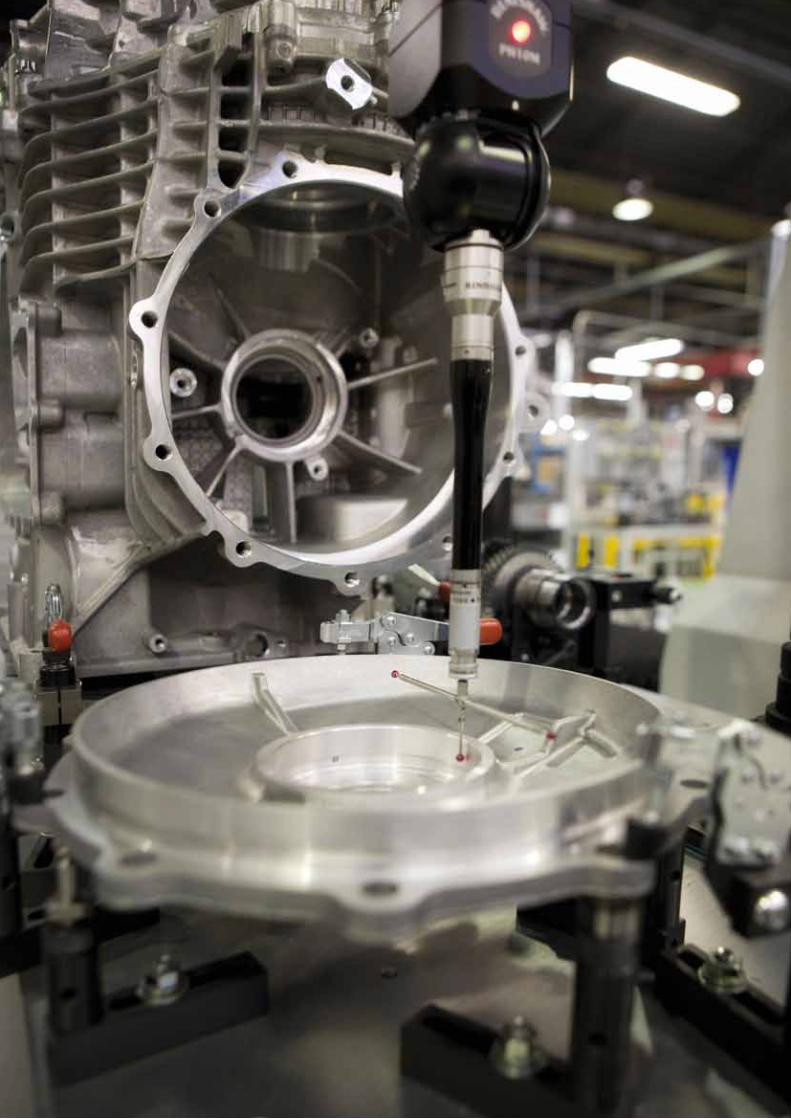
37Relazione sulla gestione / Directors’ Report on operations

38 Operational Excellence / Operational Excellence
Operational Excellence Operational Excellence
Oerlikon Graziano ha dato il via ad un programma di Eccellenza Operativa al fine di ottenere un’Eccellenza Produttiva presso i propri stabilimenti italiani.
Sin dalla fondazione dell’azienda, nel 1951, Oerlikon Graziano ha sempre puntato al miglioramento, creandosi con il tempo una solida reputazione a livello mondiale di leader nella fornitura di sistemi di trasmissione completi, soluzioni di trasmissione e componenti di trasmissione. Il know-how e le competenze acquisite hanno consentito all’Azienda di aprirsi completamen-te ad un programma di sviluppo articolato a partire dalle fasi di concettualizzazione e simulazione sino a giungere alla pro-duzione in serie, sia per sistemi di trasmissione meccatronica completi sia per singoli componenti di trasmissione. Lo sta-bilimento Oerlikon Graziano di Rivoli è l’esempio di un altissi-mo livello di complessità nelle operazioni, poiché si occupa di diverse linee di prodotti, clienti e mercati, con le conseguenti fluttuazioni nei volumi.
A partire dal 1992 lo stabilimento si è concentrato sul miglio-ramento dei processi produttivi, introducendo diverse metodo-logie al fine di garantire un controllo di alto livello nonché con-stanti miglioramenti in termini di processi e prodotti.
Il programma di Eccellenza operativa è un sistema altamente strutturato sia dal punto di vista operativo sia valutativo che si basa su competenze tecniche e gestionali, ponendo l’accento sull’efficienza e sulla minimizzazione degli sprechi e delle per-dite. Il programma si regge su otto pilastri tecnici e gestionali quali Sicurezza, Sviluppo dei costi, Miglioramento, Controllo qualità, Manutenzione autonoma e Organizzazione del luogo di lavoro, Manutenzione professionale, Logistica e Sviluppo del personale. Tutto ciò consente ad Oerlikon Graziano di concen-trarsi sulle priorità e soddisfare le necessità del sistema produt-tivo, il quale deve essere, al contempo, flessibile ed efficace, semplice, solido e in grado di coinvolgere le persone. Questo sistema è stato introdotto presso lo stabilimento di Rivoli nel maggio 2011 ed è stato mantenuto nel 2012, coinvolgendo l’intero personale. I primi risultati tangibili hanno visto una ridu-zione del 60% nel tasso di infortuni e un calo del 10% dei costi dovuti alla carenza di qualità nella produzione. A luglio 2012 il programma è stato ampliato sino ad includere altri stabilimenti nella regione EMEAR. Per quanto riguarda Stati Uniti, Cina e India, l’attuazione del programma è prevista per il 2013.
Oerlikon Graziano engaged an Operational Excellence program to reach Manufacturing Excellence at its Italian plants.
Since its foundation in 1951, Oerlikon Graziano has constantly grown up, building its strong reputation as worldwide leader in providing complete drive systems, gearing solutions and trans-mission components. The know-how and the capabilities allow the Company to lead the full deployment of a development pro-gram from conceptual and simulation phases to mass produc-tion, for complete mechatronic driveline systems as well as for single gearing components. Oerlikon Graziano Rivoli plant is representative of a very high level of complexity in operations, because it deals with different lines of product, several custom-ers and markets and consequent volumes fluctuations.
Since 1992 the plant focused on manufacturing process im-provement, introducing several methodologies to provide a high-level control and continuous improvement of processes and products.
The Operational Excellence program is a highly structured operational and audit system that has both a technical and management-oriented foundation focused on efficiency and reduction of waste and losses. The program is based on eight technical and managerial pillars, which are Safety, Cost Deploy-ment, Focus Improvement, Quality Control, Autonomous Main-tenance & Workplace Organization, Professional Maintenance, Logistics and People Development. It allows Oerlikon Graziano to focus on priorities and fulfils the need of a production system which is flexible and powerful at the same time, simple, rigor-ous and able to involve people. It was rolled out in May 2011 in Rivoli plant and continued in 2012, involving all the employees. The first measurable results have included a 60 % reduction in the accident rate and a 10 % drop in the costs incurred for insufficient quality in production. In July 2012 the program was expanded to include other plants in the EMEAR region. Roll-out of the program in the United States, China and India will begin in 2013.

39Relazione sulla gestione / Directors’ Report on operations
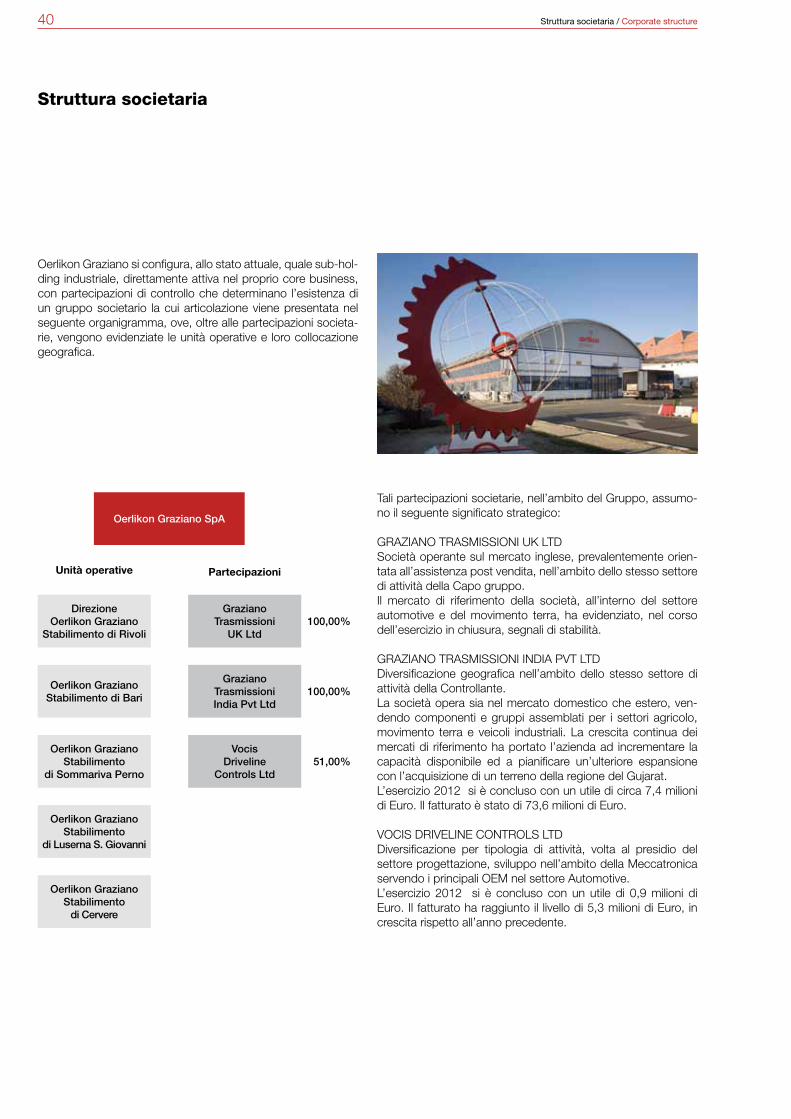
40 Struttura societaria / Corporate structure
Struttura societaria
Oerlikon Graziano si configura, allo stato attuale, quale sub-hol-ding industriale, direttamente attiva nel proprio core business, con partecipazioni di controllo che determinano l’esistenza di un gruppo societario la cui articolazione viene presentata nel seguente organigramma, ove, oltre alle partecipazioni societa-rie, vengono evidenziate le unità operative e loro collocazione geografica.
Tali partecipazioni societarie, nell’ambito del Gruppo, assumo-no il seguente significato strategico:
GRAZIANO TRASMISSIONI UK LTDSocietà operante sul mercato inglese, prevalentemente orien-tata all’assistenza post vendita, nell’ambito dello stesso settore di attività della Capo gruppo. Il mercato di riferimento della società, all’interno del settore automotive e del movimento terra, ha evidenziato, nel corso dell’esercizio in chiusura, segnali di stabilità.
GRAZIANO TRASMISSIONI INDIA PVT LTDDiversificazione geografica nell’ambito dello stesso settore di attività della Controllante. La società opera sia nel mercato domestico che estero, ven-dendo componenti e gruppi assemblati per i settori agricolo, movimento terra e veicoli industriali. La crescita continua dei mercati di riferimento ha portato l’azienda ad incrementare la capacità disponibile ed a pianificare un’ulteriore espansione con l’acquisizione di un terreno della regione del Gujarat.L’esercizio 2012 si è concluso con un utile di circa 7,4 milioni di Euro. Il fatturato è stato di 73,6 milioni di Euro.
VOCIS DRIVELINE CONTROLS LTD Diversificazione per tipologia di attività, volta al presidio del settore progettazione, sviluppo nell’ambito della Meccatronica servendo i principali OEM nel settore Automotive.L’esercizio 2012 si è concluso con un utile di 0,9 milioni di Euro. Il fatturato ha raggiunto il livello di 5,3 milioni di Euro, in crescita rispetto all’anno precedente.
Oerlikon Graziano SpA
Direzione Oerlikon Graziano
Stabilimento di Rivoli
Oerlikon GrazianoStabilimento di Bari
Oerlikon GrazianoStabilimento
di Sommariva Perno
Oerlikon GrazianoStabilimento
di Luserna S. Giovanni
Graziano Trasmissioni
UK Ltd
Graziano Trasmissioni India Pvt Ltd
Vocis Driveline
Controls Ltd
Oerlikon GrazianoStabilimento
di Cervere
100,00%
Unità operative Partecipazioni
100,00%
51,00%
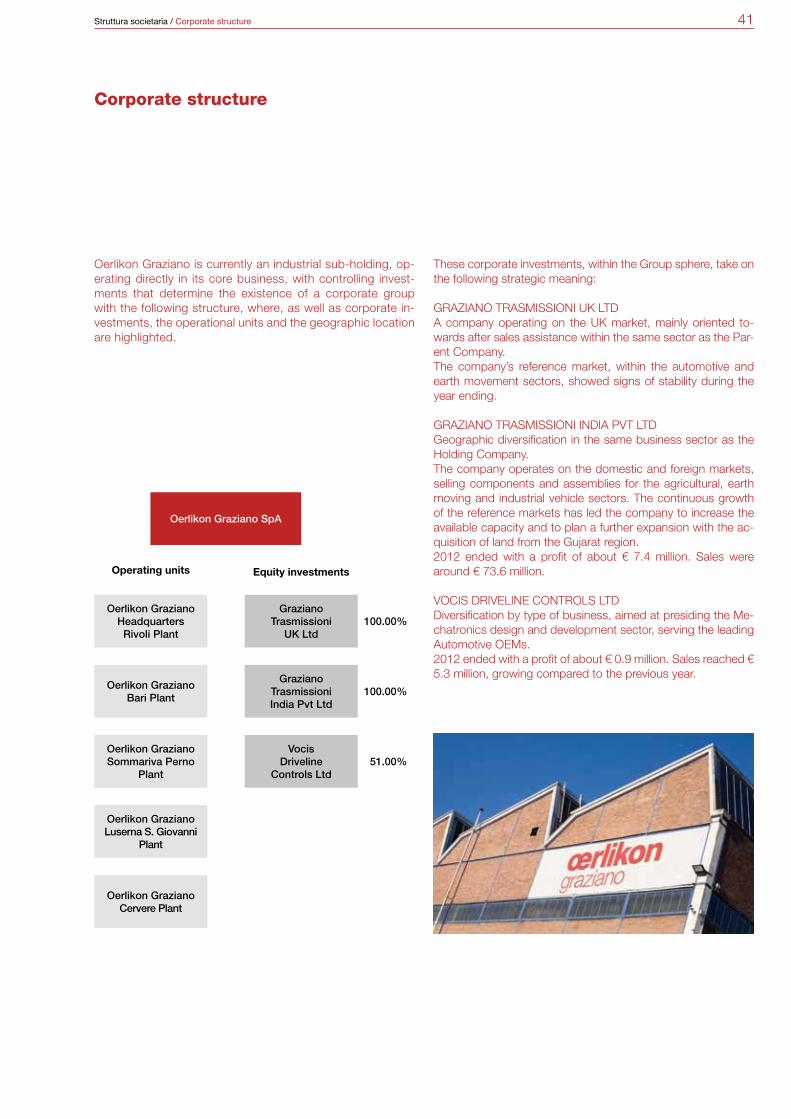
41Struttura societaria / Corporate structure
Corporate structure
Oerlikon Graziano is currently an industrial sub-holding, op-erating directly in its core business, with controlling invest-ments that determine the existence of a corporate group with the following structure, where, as well as corporate in-vestments, the operational units and the geographic location are highlighted.
These corporate investments, within the Group sphere, take on the following strategic meaning:
GRAZIANO TRASMISSIONI UK LTDA company operating on the UK market, mainly oriented to-wards after sales assistance within the same sector as the Par-ent Company. The company’s reference market, within the automotive and earth movement sectors, showed signs of stability during the year ending.
GRAZIANO TRASMISSIONI INDIA PVT LTDGeographic diversification in the same business sector as the Holding Company. The company operates on the domestic and foreign markets, selling components and assemblies for the agricultural, earth moving and industrial vehicle sectors. The continuous growth of the reference markets has led the company to increase the available capacity and to plan a further expansion with the ac-quisition of land from the Gujarat region.2012 ended with a profit of about € 7.4 million. Sales were around € 73.6 million.
VOCIS DRIVELINE CONTROLS LTD Diversification by type of business, aimed at presiding the Me-chatronics design and development sector, serving the leading Automotive OEMs.2012 ended with a profit of about € 0.9 million. Sales reached € 5.3 million, growing compared to the previous year.
Oerlikon Graziano SpA
Oerlikon GrazianoHeadquartersRivoli Plant
Oerlikon GrazianoBari Plant
Oerlikon GrazianoSommariva Perno
Plant
Oerlikon GrazianoLuserna S. Giovanni
Plant
Graziano Trasmissioni
UK Ltd
Graziano Trasmissioni India Pvt Ltd
Vocis Driveline
Controls Ltd
Oerlikon GrazianoCervere Plant
100.00%
Operating units Equity investments
100.00%
51.00%

42 Rapporti con le società del Gruppo Oerlikon / Relations with Oerlikon Group companies
Rapporti con le società del Gruppo Oerlikon
Nel corso dell’esercizio, con le società facenti parte del Gruppo si sono intrattenuti rapporti di finanziamento e di fornitura che hanno originato le seguenti componenti positive e negative di reddito:
I crediti e i debiti sono distintamente appostati in bilancio ed illustrati nella nota integrativa.
Ai sensi degli articoli 2497 e seguenti del Codice Civile, discipli-nanti la trasparenza nell’esercizio di attività di direzione e coor-dinamento di società, si dà atto che questa viene esercitata nei confronti della Vostra società dalla Oerlikon Management AG di Pfaeffikon. Nell’esercizio di tale attività:• la Oerlikon Management AG non ha in alcun modo arrecato
pregiudizio agli interessi ed al patrimonio della società e del-le sue controllate;
• è stata assicurata una completa trasparenza dei rapporti in-tercompany, tale da consentire a tutti coloro che ne abbiano interesse di verificare l’osservanza del principio precedente;
• le operazioni commerciali concluse nel corso dell’esercizio con le società facenti parte del gruppo sono avvenute a con-dizioni sostanzialmente in linea con quelle di mercato.
Rammentiamo che la società fa parte del consolidato fisca-le nazionale della controllante Oerlikon Graziano Group SpA. Nell’esercizio 2012 ha trasferito la propria perdita fiscale al consolidato, appostando la relativa remunerazione per 222 mila euro nei crediti verso la consolidante Oerlikon Graziano Group SpA.
Relations with Oerlikon Group companies
During the year, financing and supply relations with the Group companies have generated positive and negative income com-ponents:
Receivables and payables were separately disclosed in the fi-nancial statements and illustrated in the notes to said financial statements.
In accordance with article 2497 and subsequent articles of the Italian Civil Code, regulating transparent company manage-ment and coordination, it is acknowledged that these activities are exercised for your Company by Oerlikon Management AG of Pfaeffikon. In the exercise of these activities:• Oerlikon Management AG did not in any way influence the
interest and equity of the company and its subsidiaries;• complete transparency of intercompany relations was en-
sured, such as to allow all those with an interest to verify the observance of the previous principle;
• commercial operations entered into during the year with group companies were pursued at conditions substantially in line with those of the market.
We would like to remind you that the company adheres to the national tax consolidation system of the holding company Oer-likon Graziano Group SpA. In 2012, it transferred its tax loss to consolidation, disclosing relative remuneration for € 222 thou-sand among receivables from the consolidating company Oer-likon Graziano Group SpA.
valori in €/000values in €/000
GrazianoTrasmissioni
UK Ltd
GrazianoTrasmissioniIndia Pvt Ltd
Vocis Driveline
Controls Ltd
OerlikonGraziano
Group SpA
Impreseconsociate
Sister companies
TotaleTotal
Costi I Costs
Acquisti di beni I Purchases of goods 0 27.712 0 0 3.341 31.053
Prestazioni di serviziServices 217 0 1.865 2.000 11.328 15.410
Interessi passivi I interest expense 0 0 0 827 0 827
Totale I Total 217 27.712 1.865 2.827 14.669 47.290
Ricavi I Revenues
Cessioni di beni e prestazioni di serviziSales of goods and services 810 7.406 0 0 41.468 49.684
Affitti attivi I Income from rents 0 0 0 10 0 10
Totale I Total 810 7.406 0 10 41.468 49.694

43Rapporti con le società del Gruppo Oerlikon / Rapporti con le società del Gruppo Oerlikon

44 Azioni proprie, di controllanti e di controllate / Own shares, shares in holding companies and in subsidiaries
Azioni proprie, di controllanti e di controllate
Alla data di chiusura del bilancio risultano in portafoglio nr. 4.245.848 azioni proprie dal valore nominale di un Euro ciascu-na, che sono state svalutate nei precedenti esercizi per ade-guare il valore a quello della società stimato sulla base dei cash flow attesi, ed ammontano ora ad Euro 15.447.311. Le azio-ni proprie in portafoglio rappresentano al 31 dicembre 2012 il 7,23% del capitale sociale.
Al passivo è stato costituito un fondo di riserva indisponibile (voce A.V) pari all’importo delle azioni proprie iscritte all’attivo, nel rispetto della normativa civilistica (articoli 2357 e seguenti del Codice civile).
Nel corso dell’esercizio dette azioni non hanno avuto movimen-tazione. Alla data di chiusura del bilancio non risultano in porta-foglio azioni / quote di società controllanti.
Own shares, shares in holding companies and in subsidiaries
On the closing date, there were 4,245,848 own shares with a par value of one euro each, which were written back in previ-ous years to adapt their value to that of the company estimated on the basis of the cash flows expected, and now amount to € 15,447,311. Own shares held in the portfolio account for 7.23% of the share capital at 31 December 2012.
An unavailable provision (item A.V) of the same amount as the own shares booked to assets was set up under liabilities, in observance of the statutory legislation (article 2357 and subse-quent articles of the Civil Code).
These shares were not moved at all during the year. On the closing date there were no shares/stocks of holding companies held in the portfolio.
45Fatti di rilievo avvenuti dopo la chiusura dell’esercizio / Significant events after the end of the year
Fatti di rilievo avvenuti dopo la chiusura dell’esercizio
Non si evidenziano fatti di rilievo avvenuti dopo la chiusura dell’esercizio 2012.
Significant events after the end of the year
No significant events occurred after the end of 2012.
46 Evoluzione prevedibile della gestione / Future outlook
Evoluzione prevedibile della gestione
Il primo trimestre 2013 ha evidenziato un rallentamento dei mercati, anche se dal secondo semestre le previsioni dei prin-cipali clienti mostrano un leggero miglioramento. Allo stato at-tuale delle cose, è possibile ipotizzare una seppur lenta ripresa dei volumi nella seconda parte dell’anno.
Il completamento delle attività di miglioramento dei margini consente, ad oggi, di ipotizzare un risultato positivo anche per l’anno in corso.
Future outlook
The first quarter of 2013 highlighted a deceleration of the mar-kets, with the schedules of our major customers indicating a slight improvement from the second half of the year. The way things stand at the moment, it is possible to imagine a slow recovery in volumes in the second part of the year.
The completion of activities to improve margins allows us to hope for a possible result for the year in progress.

47Informativa su proposta di destinazione del risultato / Information on the proposed allocation of the result
Informativa su proposta di destinazione del risultato
Vi invitiamo a voler approvare il bilancio (stato patrimoniale, conto economico e nota integrativa) e a destinare l’utile netto di esercizio di Euro, pari a 4.161.242 Euro come segue:
5% alla Riserva legale Euro 208.062
Perdite esercizi precedenti Euro 3.953.180
Information on the proposed allocation of the result
We invites you to approve the financial statements (balance sheet, income statement and notes to the financial statements) and to allocate the net income of € 4,161,242 as follows:
5% to the legal Reserve € 208,062
Losses from previous years € 3,953,180

48
49
Prospetti contabiliFinancial statements
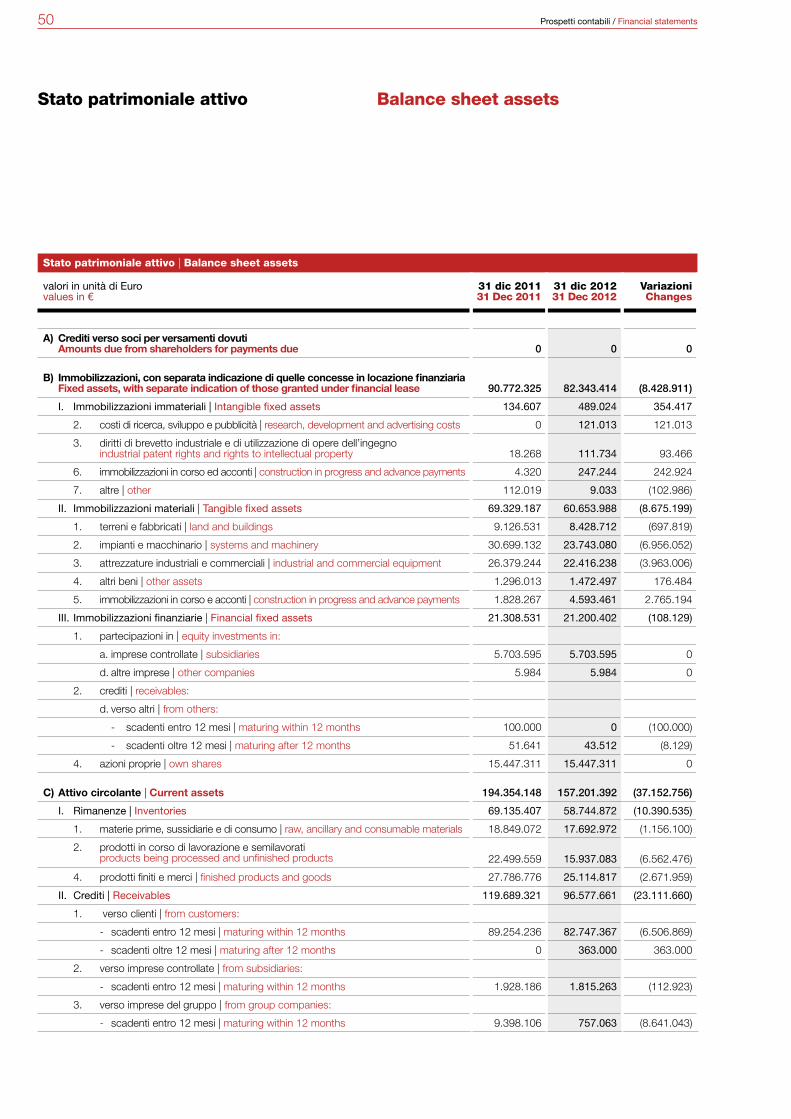
50 Prospetti contabili / Financial statements
Stato patrimoniale attivo Balance sheet assets
Stato patrimoniale attivo | Balance sheet assets
valori in unità di Eurovalues in €
31 dic 201131 Dec 2011
31 dic 201231 Dec 2012
Variazioni Changes
A) Crediti verso soci per versamenti dovuti Amounts due from shareholders for payments due 0 0 0
B) Immobilizzazioni, con separata indicazione di quelle concesse in locazione finanziaria Fixed assets, with separate indication of those granted under financial lease 90.772.325 82.343.414 (8.428.911)
I. Immobilizzazioni immateriali | Intangible fixed assets 134.607 489.024 354.417
2. costi di ricerca, sviluppo e pubblicità | research, development and advertising costs 0 121.013 121.013
3. diritti di brevetto industriale e di utilizzazione di opere dell’ingegno industrial patent rights and rights to intellectual property 18.268 111.734 93.466
6. immobilizzazioni in corso ed acconti | construction in progress and advance payments 4.320 247.244 242.924
7. altre | other 112.019 9.033 (102.986)
II. Immobilizzazioni materiali | Tangible fixed assets 69.329.187 60.653.988 (8.675.199)
1. terreni e fabbricati | land and buildings 9.126.531 8.428.712 (697.819)
2. impianti e macchinario | systems and machinery 30.699.132 23.743.080 (6.956.052)
3. attrezzature industriali e commerciali | industrial and commercial equipment 26.379.244 22.416.238 (3.963.006)
4. altri beni | other assets 1.296.013 1.472.497 176.484
5. immobilizzazioni in corso e acconti | construction in progress and advance payments 1.828.267 4.593.461 2.765.194
III. Immobilizzazioni finanziarie | Financial fixed assets 21.308.531 21.200.402 (108.129)
1. partecipazioni in | equity investments in:
a. imprese controllate | subsidiaries 5.703.595 5.703.595 0
d. altre imprese | other companies 5.984 5.984 0
2. crediti | receivables:
d. verso altri | from others:
- scadenti entro 12 mesi | maturing within 12 months 100.000 0 (100.000)
- scadenti oltre 12 mesi | maturing after 12 months 51.641 43.512 (8.129)
4. azioni proprie | own shares 15.447.311 15.447.311 0
C) Attivo circolante | Current assets 194.354.148 157.201.392 (37.152.756)
I. Rimanenze | Inventories 69.135.407 58.744.872 (10.390.535)
1. materie prime, sussidiarie e di consumo | raw, ancillary and consumable materials 18.849.072 17.692.972 (1.156.100)
2. prodotti in corso di lavorazione e semilavorati products being processed and unfinished products 22.499.559 15.937.083 (6.562.476)
4. prodotti finiti e merci | finished products and goods 27.786.776 25.114.817 (2.671.959)
II. Crediti | Receivables 119.689.321 96.577.661 (23.111.660)
1. verso clienti | from customers:
- scadenti entro 12 mesi | maturing within 12 months 89.254.236 82.747.367 (6.506.869)
- scadenti oltre 12 mesi | maturing after 12 months 0 363.000 363.000
2. verso imprese controllate | from subsidiaries:
- scadenti entro 12 mesi | maturing within 12 months 1.928.186 1.815.263 (112.923)
3. verso imprese del gruppo | from group companies:
- scadenti entro 12 mesi | maturing within 12 months 9.398.106 757.063 (8.641.043)

51Prospetti contabili / Financial statements
Stato patrimoniale attivo | Balance sheet assets
valori in unità di Eurovalues in €
31 dic 201131 Dec 2011
31 dic 201231 Dec 2012
Variazioni Changes
4. verso imprese controllanti e loro controllate | from holding companies and their subsidiaries:
- scadenti entro 12 mesi | maturing within 12 months 1.602.370 223.623 (1.378.747)
4-bis crediti tributari | tax credits
- scadenti entro 12 mesi | maturing within 12 months 3.445.107 3.372.162 (72.945)
4-ter imposte anticipate | prepaid taxes
- scadenti entro 12 mesi | maturing within 12 months 4.739.109 780.957 (3.958.152)
- scadenti oltre 12 mesi | maturing after 12 months 6.965.691 3.312.489 (3.653.202)
5. verso altri | from others:
- scadenti entro 12 mesi | maturing within 12 months 2.356.516 3.205.737 849.221
III. Attività finanziarie che non costituiscono immobilizzazioni Financial assets other than fixed assets 0 0 0
IV. Disponibilità liquide | Cash and cash equivalents 5.529.420 1.878.859 (3.650.561)
1. depositi bancari e postali | bank and post office deposits 5.491.010 1.843.846 (3.647.164)
3. danaro e valori in cassa | cash and cash equivalents 38.410 35.013 (3.397)
D) Ratei e riscontri | Accruals and deferral 156.589 182.143 25.554
- ratei attivi | accrued income 39.566 449 (39.117)
- risconti attivi | prepaid expenses 117.023 181.694 64.671
TOTALE ATTIVO (A + B + C + D) | TOTAL ASSETS (A + B + C + D) 285.283.062 239.726.949 (45.556.113)
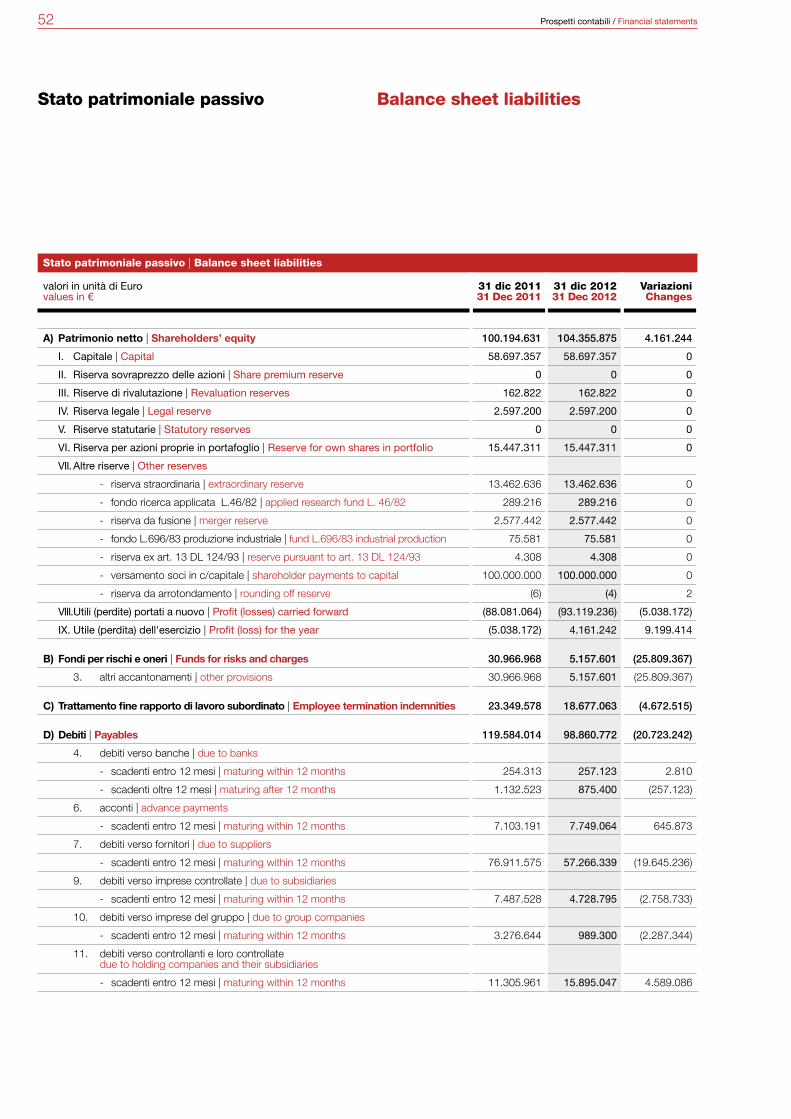
52 Prospetti contabili / Financial statements
Stato patrimoniale passivo Balance sheet liabilities
Stato patrimoniale passivo | Balance sheet liabilities
valori in unità di Eurovalues in €
31 dic 201131 Dec 2011
31 dic 201231 Dec 2012
Variazioni Changes
A) Patrimonio netto | Shareholders’ equity 100.194.631 104.355.875 4.161.244
I. Capitale | Capital 58.697.357 58.697.357 0
II. Riserva sovraprezzo delle azioni | Share premium reserve 0 0 0
III. Riserve di rivalutazione | Revaluation reserves 162.822 162.822 0
IV. Riserva legale | Legal reserve 2.597.200 2.597.200 0
V. Riserve statutarie | Statutory reserves 0 0 0
VI. Riserva per azioni proprie in portafoglio | Reserve for own shares in portfolio 15.447.311 15.447.311 0
VII. Altre riserve | Other reserves
- riserva straordinaria | extraordinary reserve 13.462.636 13.462.636 0
- fondo ricerca applicata L.46/82 | applied research fund L. 46/82 289.216 289.216 0
- riserva da fusione | merger reserve 2.577.442 2.577.442 0
- fondo L.696/83 produzione industriale | fund L.696/83 industrial production 75.581 75.581 0
- riserva ex art. 13 DL 124/93 | reserve pursuant to art. 13 DL 124/93 4.308 4.308 0
- versamento soci in c/capitale | shareholder payments to capital 100.000.000 100.000.000 0
- riserva da arrotondamento | rounding off reserve (6) (4) 2
VIII. Utili (perdite) portati a nuovo | Profit (losses) carried forward (88.081.064) (93.119.236) (5.038.172)
IX. Utile (perdita) dell'esercizio | Profit (loss) for the year (5.038.172) 4.161.242 9.199.414
B) Fondi per rischi e oneri | Funds for risks and charges 30.966.968 5.157.601 (25.809.367)
3. altri accantonamenti | other provisions 30.966.968 5.157.601 (25.809.367)
C) Trattamento fine rapporto di lavoro subordinato | Employee termination indemnities 23.349.578 18.677.063 (4.672.515)
D) Debiti | Payables 119.584.014 98.860.772 (20.723.242)
4. debiti verso banche | due to banks
- scadenti entro 12 mesi | maturing within 12 months 254.313 257.123 2.810
- scadenti oltre 12 mesi | maturing after 12 months 1.132.523 875.400 (257.123)
6. acconti | advance payments
- scadenti entro 12 mesi | maturing within 12 months 7.103.191 7.749.064 645.873
7. debiti verso fornitori | due to suppliers
- scadenti entro 12 mesi | maturing within 12 months 76.911.575 57.266.339 (19.645.236)
9. debiti verso imprese controllate | due to subsidiaries
- scadenti entro 12 mesi | maturing within 12 months 7.487.528 4.728.795 (2.758.733)
10. debiti verso imprese del gruppo | due to group companies
- scadenti entro 12 mesi | maturing within 12 months 3.276.644 989.300 (2.287.344)
11. debiti verso controllanti e loro controllate due to holding companies and their subsidiaries
- scadenti entro 12 mesi | maturing within 12 months 11.305.961 15.895.047 4.589.086

53Prospetti contabili / Financial statements
Stato patrimoniale passivo | Balance sheet liabilities
valori in unità di Eurovalues in €
31 dic 201131 Dec 2011
31 dic 201231 Dec 2012
Variazioni Changes
12. debiti tributari | due to the tax authorities
- scadenti entro 12 mesi | maturing within 12 months 5.338.541 4.895.890 (442.651)
13. debiti verso istituti di previdenza e di sicurezza sociale due to welfare and social security institutes
- scadenti entro 12 mesi | maturing within 12 months 5.122.947 4.498.244 (624.703)
14. altri debiti | other amounts due
- scadenti entro 12 mesi | maturing within 12 months 1.650.791 1.705.570 54.779
E) Ratei e risconti | Accruals and deferrals 11.187.871 12.675.638 1.487.767
- ratei passivi | accrued liabilities 10.857.766 12.390.795 1.533.029
- risconti passivi | deferred income 330.105 284.843 (45.262)
TOTALE PASSIVO (A + B + C + D + E) | TOTAL LIABILITIES (A + B + C + D + E) 285.283.062 239.726.949 (45.556.113)
F) Conti d’ordine | Memorandum accounts 805.491 1.840.692 1.035.201
2. rischi | risks
- debitori per fidejussioni e garanzie prestate e verso altre imprese debts for sureties and guarantees granted 1.498 1.498 0
3. altri | other
- fidejussioni e garanzie ricevute | sureties and guarantees received 803.993 1.839.194 1.035.201
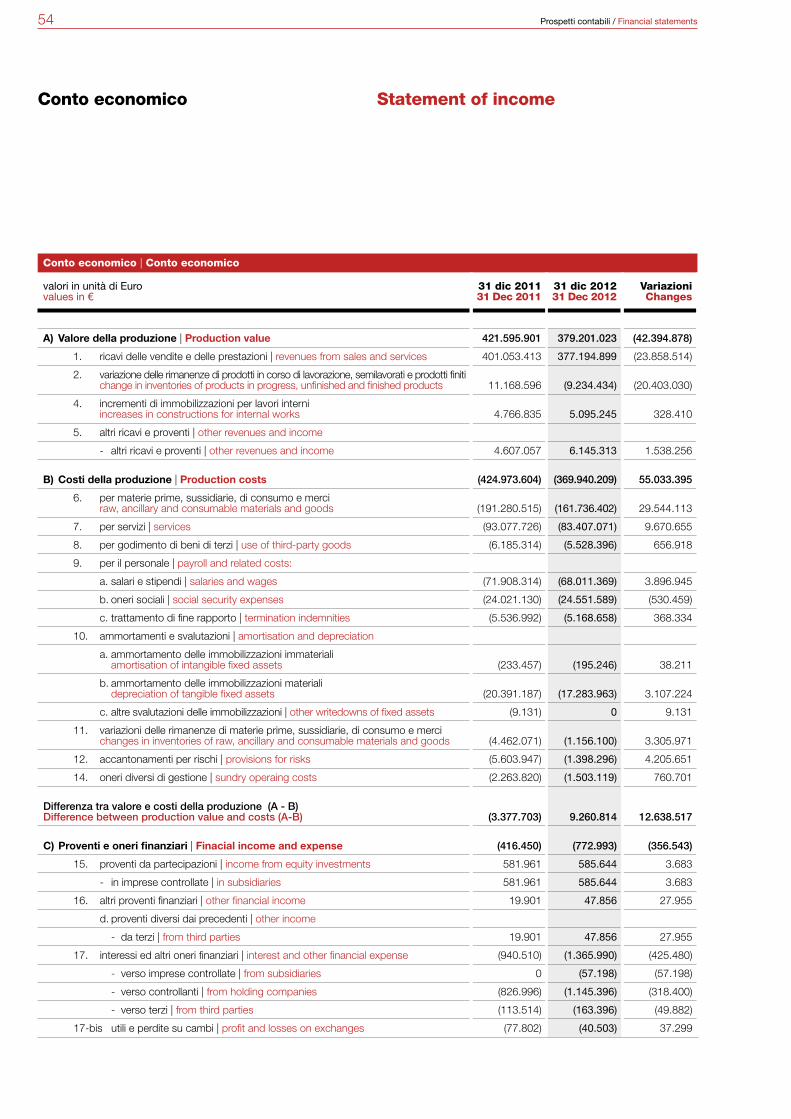
54 Prospetti contabili / Financial statements
Conto economico Statement of income
Conto economico | Conto economico
valori in unità di Eurovalues in €
31 dic 201131 Dec 2011
31 dic 201231 Dec 2012
Variazioni Changes
A) Valore della produzione | Production value 421.595.901 379.201.023 (42.394.878)
1. ricavi delle vendite e delle prestazioni | revenues from sales and services 401.053.413 377.194.899 (23.858.514)
2. variazione delle rimanenze di prodotti in corso di lavorazione, semilavorati e prodotti finiti change in inventories of products in progress, unfinished and finished products 11.168.596 (9.234.434) (20.403.030)
4. incrementi di immobilizzazioni per lavori interni increases in constructions for internal works 4.766.835 5.095.245 328.410
5. altri ricavi e proventi | other revenues and income
- altri ricavi e proventi | other revenues and income 4.607.057 6.145.313 1.538.256
B) Costi della produzione | Production costs (424.973.604) (369.940.209) 55.033.395
6. per materie prime, sussidiarie, di consumo e merci raw, ancillary and consumable materials and goods (191.280.515) (161.736.402) 29.544.113
7. per servizi | services (93.077.726) (83.407.071) 9.670.655
8. per godimento di beni di terzi | use of third-party goods (6.185.314) (5.528.396) 656.918
9. per il personale | payroll and related costs:
a. salari e stipendi | salaries and wages (71.908.314) (68.011.369) 3.896.945
b. oneri sociali | social security expenses (24.021.130) (24.551.589) (530.459)
c. trattamento di fine rapporto | termination indemnities (5.536.992) (5.168.658) 368.334
10. ammortamenti e svalutazioni | amortisation and depreciation
a. ammortamento delle immobilizzazioni immateriali amortisation of intangible fixed assets (233.457) (195.246) 38.211
b. ammortamento delle immobilizzazioni materiali depreciation of tangible fixed assets (20.391.187) (17.283.963) 3.107.224
c. altre svalutazioni delle immobilizzazioni | other writedowns of fixed assets (9.131) 0 9.131
11. variazioni delle rimanenze di materie prime, sussidiarie, di consumo e merci changes in inventories of raw, ancillary and consumable materials and goods (4.462.071) (1.156.100) 3.305.971
12. accantonamenti per rischi | provisions for risks (5.603.947) (1.398.296) 4.205.651
14. oneri diversi di gestione | sundry operaing costs (2.263.820) (1.503.119) 760.701
Differenza tra valore e costi della produzione (A - B)Difference between production value and costs (A-B) (3.377.703) 9.260.814 12.638.517
C) Proventi e oneri finanziari | Finacial income and expense (416.450) (772.993) (356.543)
15. proventi da partecipazioni | income from equity investments 581.961 585.644 3.683
- in imprese controllate | in subsidiaries 581.961 585.644 3.683
16. altri proventi finanziari | other financial income 19.901 47.856 27.955
d. proventi diversi dai precedenti | other income
- da terzi | from third parties 19.901 47.856 27.955
17. interessi ed altri oneri finanziari | interest and other financial expense (940.510) (1.365.990) (425.480)
- verso imprese controllate | from subsidiaries 0 (57.198) (57.198)
- verso controllanti | from holding companies (826.996) (1.145.396) (318.400)
- verso terzi | from third parties (113.514) (163.396) (49.882)
17-bis utili e perdite su cambi | profit and losses on exchanges (77.802) (40.503) 37.299
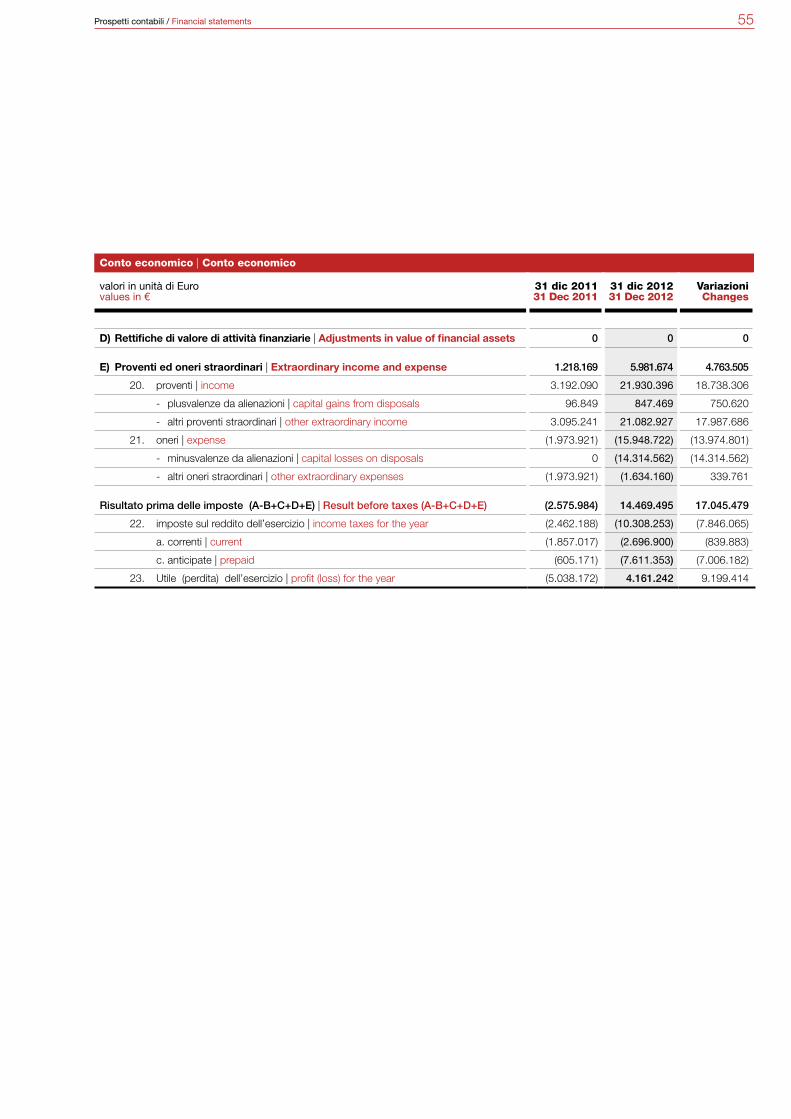
55Prospetti contabili / Financial statements
Conto economico | Conto economico
valori in unità di Eurovalues in €
31 dic 201131 Dec 2011
31 dic 201231 Dec 2012
Variazioni Changes
D) Rettifiche di valore di attività finanziarie | Adjustments in value of financial assets 0 0 0
E) Proventi ed oneri straordinari | Extraordinary income and expense 1.218.169 5.981.674 4.763.505
20. proventi | income 3.192.090 21.930.396 18.738.306
- plusvalenze da alienazioni | capital gains from disposals 96.849 847.469 750.620
- altri proventi straordinari | other extraordinary income 3.095.241 21.082.927 17.987.686
21. oneri | expense (1.973.921) (15.948.722) (13.974.801)
- minusvalenze da alienazioni | capital losses on disposals 0 (14.314.562) (14.314.562)
- altri oneri straordinari | other extraordinary expenses (1.973.921) (1.634.160) 339.761
Risultato prima delle imposte (A-B+C+D+E) | Result before taxes (A-B+C+D+E) (2.575.984) 14.469.495 17.045.479
22. imposte sul reddito dell’esercizio | income taxes for the year (2.462.188) (10.308.253) (7.846.065)
a. correnti | current (1.857.017) (2.696.900) (839.883)
c. anticipate | prepaid (605.171) (7.611.353) (7.006.182)
23. Utile (perdita) dell’esercizio | profit (loss) for the year (5.038.172) 4.161.242 9.199.414

56 Relazione sulla gestione / Directors’ Report on operations
57Relazione sulla gestione / Directors’ Report on operations
Nota integrativaNotes to the financial statements

58 Nota integrativa / Notes to the financial statements
1. Introduzione
Signori Azionisti,
Vi presentiamo il bilancio di esercizio al 31 dicembre 2012, costituito dallo stato patri-moniale, dal conto economico e dalla presente nota integrativa, redatto in conformità al Decreto Legislativo 9 aprile 1991 n. 127 e successive modifiche.Ai sensi dell’articolo 27 D.Lgs. 127/91, la società è esonerata dall’obbligo di reda-zione del bilancio consolidato in quanto redatto dalla società controllante che risulta titolare di oltre il 95% delle azioni.La società controllante Oerlikon Graziano Group SpA, con sede in Torino, redige il bilancio consolidato al 31 dicembre 2012; copia dello stesso, unitamente alla rela-zione sulla gestione, alla relazione della società incaricata della revisione legale, sarà depositato, presso il Registro delle Imprese di Torino.La struttura dello stato patrimoniale e del conto economico è quella stabilita dagli articoli 2424 e 2425 del Codice civile.La nota integrativa viene redatta in unità di Euro.Ai sensi del penultimo comma dell’articolo 2423-ter del Codice civile, il bilancio Vi viene presentato indicando accanto ad ogni voce il corrispondente importo dell’eser-cizio precedente.
Con riferimento alla struttura del bilancio, Vi precisiamo quanto segue:a le voci precedute da numeri arabi (e relative sottovoci), di importo nullo sia nel
presente che nel precedente bilancio, non sono riportate; per le voci rimanenti, è comunque mantenuta la numerazione originale prevista dalla legge;
b si è provveduto ad effettuare i seguenti adattamenti:- evidenziazione dei rapporti verso consociate adattando il termine “collegate” in
“del gruppo” e “controllanti” in “controllanti e loro controllate”;- riclassificare crediti e debiti commerciali intercompany relativi all’esercizio prece-
dente allineandoli all’attuale struttura societaria;c la classificazione delle voci del conto economico rispetta quanto statuito dal docu-
mento interpretativo del principio contabile n. 12; d con riferimento al conto economico, al fine di una maggiore chiarezza, tutte le voci
relative a componenti negative di reddito sono riportate con segno negativo (tra parentesi).
In allegato alla nota integrativa si è ritenuto opportuno presentare un’informativa sup-plementare, come richiesto dai principi contabili di generale accettazione, costituita dal rendiconto finanziario, redatto in termini di liquidità (Allegato 1).Per quanto riguarda le informazioni sulla natura dell’attività dell’impresa e sui fatti di rilievo avvenuti dopo la chiusura dell’esercizio, si rinvia al contenuto della relazione sulla gestione.

59Nota integrativa / Notes to the financial statements
1. Introduction
Dear Shareholders,
We present the financial statements at 31 December 2012, made up of the balance sheet, income statement and notes to the financial statements, prepared in conform-ity to Legislative Decree no. 127, dated 9 April 1991, and subsequent amendments. In accordance with article 27 of Legislative Decree 127/91, the company is exoner-ated from the obligation to prepare the consolidated financial statements, insofar as they are prepared by the holding company which owns over 95% of the shares.The holding company, Oerlikon Graziano Group SpA, with registered office in Turin, prepares the consolidated financial statements at 31 December 2012; a copy of said statements, together with the operational review and the independent auditors’ report will be deposited in the Register of Companies of Turin. The structure of the balance sheet and the income statement is that established by articles 2424 and 2425 of the Italian Civil Code.The notes are prepared in euro units.In accordance with the penultimate paragraph of article 2423-ter of the Civil Code, the financial statements are presented with the indication alongside each item of the corresponding figure for the previous year.
With reference to the structure of the financial statement, we wish to point out the following:a the items preceded by Arabic numbers (and relative sub-items) with a total of zero
both in these and the previous financial statements, are not disclosed; for the re-maining items, the original numbering envisaged by the law is maintained;
b the following adaptations were made:- highlighting relations with sister companies and adapting the term “associated
companies” to “group companies” and “holding companies” into “holding com-panies and their subsidiaries”;
- reclassifying intercompany commercial receivables and payables relating to the previous year, aligning them to the current corporate structure;
c the classification of the income statement items respects that established by the interpretative document of accounting standard no. 12;
d with reference to the income statement, to offer greater clarity, all the items relating to negative income components are indicated with a negative sign (in brackets).
Annexed to the notes to the financial statements is a supplementary informative doc-ument, as requested by the generally accepted accounted standards, consisting of the cash flow statement, drawn up in terms of liquidity (Annex 1). As regards information on the nature of the company’s business and on significant events occurring after the end of the year, please see the operational review.
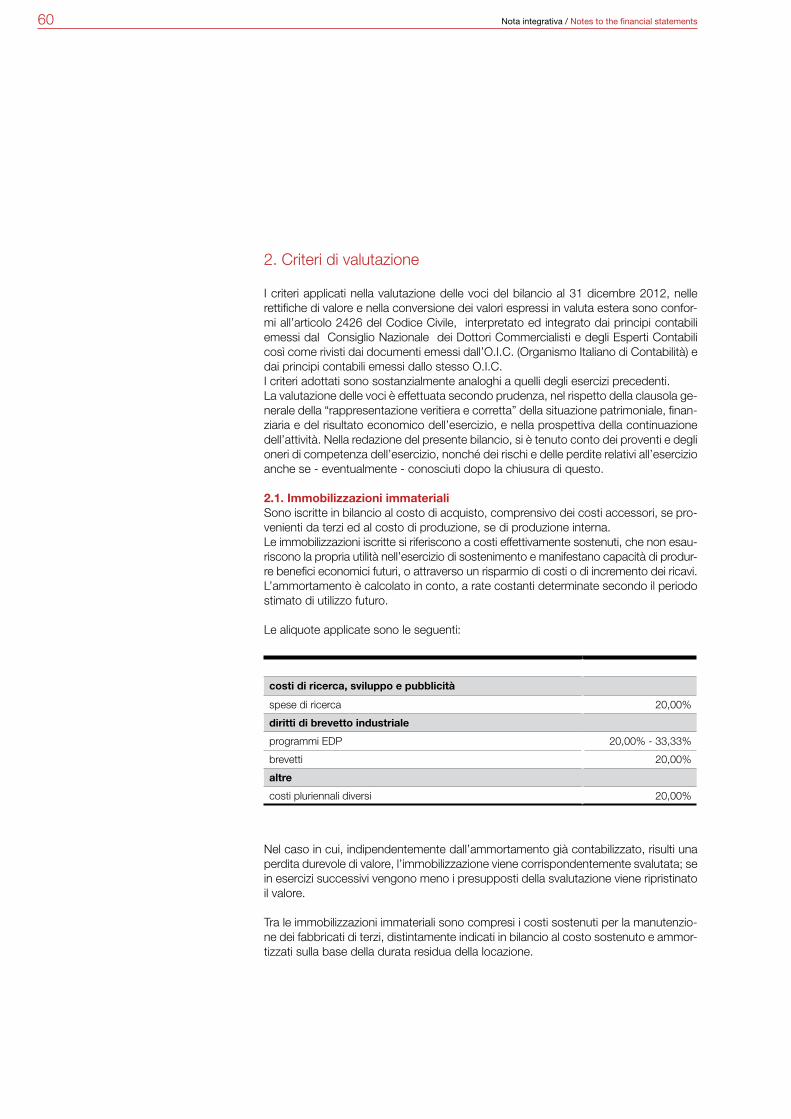
60 Nota integrativa / Notes to the financial statements
2. Criteri di valutazione
I criteri applicati nella valutazione delle voci del bilancio al 31 dicembre 2012, nelle rettifiche di valore e nella conversione dei valori espressi in valuta estera sono confor-mi all’articolo 2426 del Codice Civile, interpretato ed integrato dai principi contabili emessi dal Consiglio Nazionale dei Dottori Commercialisti e degli Esperti Contabili così come rivisti dai documenti emessi dall’O.I.C. (Organismo Italiano di Contabilità) e dai principi contabili emessi dallo stesso O.I.C. I criteri adottati sono sostanzialmente analoghi a quelli degli esercizi precedenti. La valutazione delle voci è effettuata secondo prudenza, nel rispetto della clausola ge-nerale della “rappresentazione veritiera e corretta” della situazione patrimoniale, finan-ziaria e del risultato economico dell’esercizio, e nella prospettiva della continuazione dell’attività. Nella redazione del presente bilancio, si è tenuto conto dei proventi e degli oneri di competenza dell’esercizio, nonché dei rischi e delle perdite relativi all’esercizio anche se - eventualmente - conosciuti dopo la chiusura di questo.
2.1. Immobilizzazioni immaterialiSono iscritte in bilancio al costo di acquisto, comprensivo dei costi accessori, se pro-venienti da terzi ed al costo di produzione, se di produzione interna.Le immobilizzazioni iscritte si riferiscono a costi effettivamente sostenuti, che non esau-riscono la propria utilità nell’esercizio di sostenimento e manifestano capacità di produr-re benefici economici futuri, o attraverso un risparmio di costi o di incremento dei ricavi.L’ammortamento è calcolato in conto, a rate costanti determinate secondo il periodo stimato di utilizzo futuro.
Le aliquote applicate sono le seguenti:
Nel caso in cui, indipendentemente dall’ammortamento già contabilizzato, risulti una perdita durevole di valore, l’immobilizzazione viene corrispondentemente svalutata; se in esercizi successivi vengono meno i presupposti della svalutazione viene ripristinato il valore.
Tra le immobilizzazioni immateriali sono compresi i costi sostenuti per la manutenzio-ne dei fabbricati di terzi, distintamente indicati in bilancio al costo sostenuto e ammor-tizzati sulla base della durata residua della locazione.
costi di ricerca, sviluppo e pubblicità
spese di ricerca 20,00%
diritti di brevetto industriale
programmi EDP 20,00% - 33,33%
brevetti 20,00%
altre
costi pluriennali diversi 20,00%

61Nota integrativa / Notes to the financial statements
2. Evaluation criteria
The criteria applied to the evaluation of the book values at 31 December 2012, in the value adjustments and in the conversion of values stated in foreign currency are conformant to article 2426 of the Civil Code, interpreted and added to by the ac-counting standards issued by the National Council of Accountants and Tax Advisors, as reviewed by the O.I.C. (Italian Accounting Organisation) and by the accounting standards issued by the O.I.C..The criteria implement are substantially the same as those used in previous years. The evaluation of the items is carried out prudently, in observance of he general clause of “truthful and correct portrayal” of the equity and financial situation and the income result for the year, and with a view to the ongoing nature of the activity. In preparing these financial statements, the income and expense accrued to the year were con-sidered, along with the risks and losses relating to the year, even when they became apparent after the end of the year.
2.1. Intangible fixed assets These are booked at purchase cost, including accessory costs, if originating from third parties, and at production cost if manufactured in-house.The fixed assets booked refer to costs effectively sustained, which do not cease to be useful in the year they are sustained and manifest a capacity to produce future economic benefits, either via cost savings or an increase in revenues. Amortisation is calculated at constant rates, determined according to the estimate period of future use.
The rates applied are the following:
If, regardless of the depreciation already booked, there is a durable loss in value, the asset is correspondingly written back; if, in subsequent years, the causes of the write-back cease to exist, the original value is restored.
Intangible assets include costs sustained for the maintenance of third-party buildings, distinctly indicated in the financial statements at the costs sustained and amortised on the basis of the residual duration of the lease.
research, development and advertising costs
research expenses 20.00%
industrial patent rights
EDP programmes 20.00% - 33.33%
patents 20.00%
other
miscellaneous long-term costs 20.00%
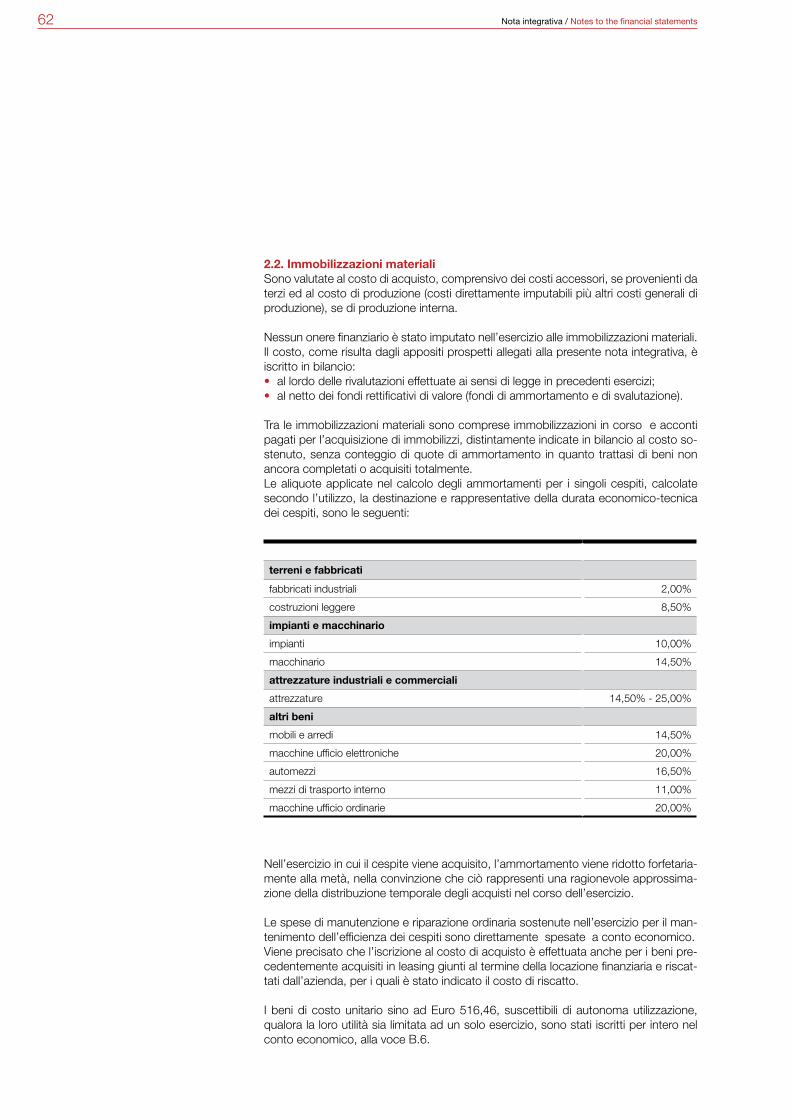
62 Nota integrativa / Notes to the financial statements
2.2. Immobilizzazioni materialiSono valutate al costo di acquisto, comprensivo dei costi accessori, se provenienti da terzi ed al costo di produzione (costi direttamente imputabili più altri costi generali di produzione), se di produzione interna.
Nessun onere finanziario è stato imputato nell’esercizio alle immobilizzazioni materiali. Il costo, come risulta dagli appositi prospetti allegati alla presente nota integrativa, è iscritto in bilancio:• al lordo delle rivalutazioni effettuate ai sensi di legge in precedenti esercizi;• al netto dei fondi rettificativi di valore (fondi di ammortamento e di svalutazione).
Tra le immobilizzazioni materiali sono comprese immobilizzazioni in corso e acconti pagati per l’acquisizione di immobilizzi, distintamente indicate in bilancio al costo so-stenuto, senza conteggio di quote di ammortamento in quanto trattasi di beni non ancora completati o acquisiti totalmente.Le aliquote applicate nel calcolo degli ammortamenti per i singoli cespiti, calcolate secondo l’utilizzo, la destinazione e rappresentative della durata economico-tecnica dei cespiti, sono le seguenti:
Nell’esercizio in cui il cespite viene acquisito, l’ammortamento viene ridotto forfetaria-mente alla metà, nella convinzione che ciò rappresenti una ragionevole approssima-zione della distribuzione temporale degli acquisti nel corso dell’esercizio.
Le spese di manutenzione e riparazione ordinaria sostenute nell’esercizio per il man-tenimento dell’efficienza dei cespiti sono direttamente spesate a conto economico.Viene precisato che l’iscrizione al costo di acquisto è effettuata anche per i beni pre-cedentemente acquisiti in leasing giunti al termine della locazione finanziaria e riscat-tati dall’azienda, per i quali è stato indicato il costo di riscatto.
I beni di costo unitario sino ad Euro 516,46, suscettibili di autonoma utilizzazione, qualora la loro utilità sia limitata ad un solo esercizio, sono stati iscritti per intero nel conto economico, alla voce B.6.
terreni e fabbricati
fabbricati industriali 2,00%
costruzioni leggere 8,50%
impianti e macchinario
impianti 10,00%
macchinario 14,50%
attrezzature industriali e commerciali
attrezzature 14,50% - 25,00%
altri beni
mobili e arredi 14,50%
macchine ufficio elettroniche 20,00%
automezzi 16,50%
mezzi di trasporto interno 11,00%
macchine ufficio ordinarie 20,00%
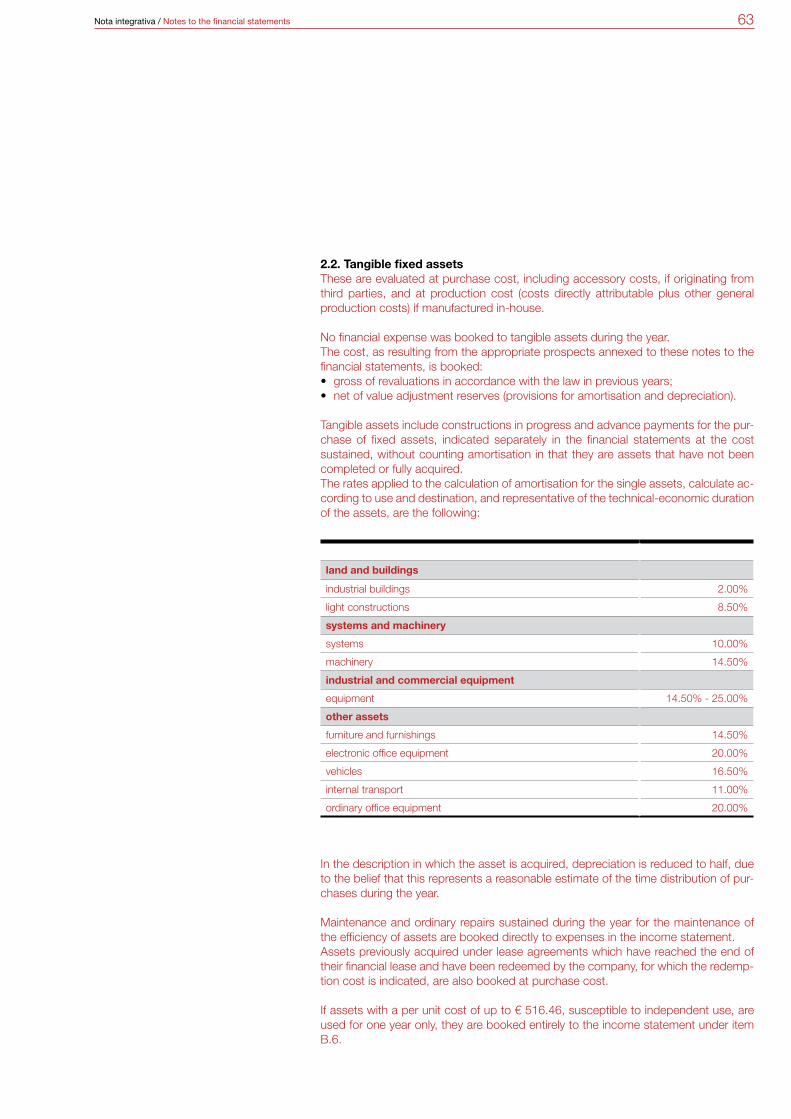
63Nota integrativa / Notes to the financial statements
2.2. Tangible fixed assets These are evaluated at purchase cost, including accessory costs, if originating from third parties, and at production cost (costs directly attributable plus other general production costs) if manufactured in-house.
No financial expense was booked to tangible assets during the year. The cost, as resulting from the appropriate prospects annexed to these notes to the financial statements, is booked:• gross of revaluations in accordance with the law in previous years;• net of value adjustment reserves (provisions for amortisation and depreciation).
Tangible assets include constructions in progress and advance payments for the pur-chase of fixed assets, indicated separately in the financial statements at the cost sustained, without counting amortisation in that they are assets that have not been completed or fully acquired.The rates applied to the calculation of amortisation for the single assets, calculate ac-cording to use and destination, and representative of the technical-economic duration of the assets, are the following:
In the description in which the asset is acquired, depreciation is reduced to half, due to the belief that this represents a reasonable estimate of the time distribution of pur-chases during the year.
Maintenance and ordinary repairs sustained during the year for the maintenance of the efficiency of assets are booked directly to expenses in the income statement.Assets previously acquired under lease agreements which have reached the end of their financial lease and have been redeemed by the company, for which the redemp-tion cost is indicated, are also booked at purchase cost.
If assets with a per unit cost of up to € 516.46, susceptible to independent use, are used for one year only, they are booked entirely to the income statement under item B.6.
land and buildings
industrial buildings 2.00%
light constructions 8.50%
systems and machinery
systems 10.00%
machinery 14.50%
industrial and commercial equipment
equipment 14.50% - 25.00%
other assets
furniture and furnishings 14.50%
electronic office equipment 20.00%
vehicles 16.50%
internal transport 11.00%
ordinary office equipment 20.00%
64 Nota integrativa / Notes to the financial statements
2.3. Contratti di leasingIl sistema di contabilizzazione seguito per i beni acquisiti in leasing è conforme alla prassi contabile vigente in Italia e prevede la contabilizzazione a conto economico dei canoni di locazione pagati (cosiddetto “metodo patrimoniale”). L’adozione della metodologia finanziaria avrebbe comportato la contabilizzazione degli interessi sul capitale finanziato e delle quote di ammortamento sul valore dei beni acquisiti in lea-sing, commisurate alla residua possibilità di utilizzo dei beni stessi, oltre all’iscrizione dei beni nell’attivo e del residuo debito nel passivo.
In allegato alla presente nota integrativa (Allegato 2), come richiesto dall’articolo 2427, punto 22, del Codice civile, Vi forniamo un apposito prospetto da cui risultano:- valore attuale delle rate di canone non scadute, conteggiato utilizzando un tasso di
interesse pari all’onere finanziario effettivo;- onere finanziario effettivo;- valore al quale il bene sarebbe stato iscritto qualora si fosse contabilizzato secondo
il metodo “finanziario”, secondo i Principi contabili internazionali;- ammortamenti dell’esercizio;- effetti sul risultato dell’esercizio e sul patrimonio netto dell’eventuale adozione del
metodo finanziario;- effetto fiscale.
2.4. Immobilizzazioni finanziarie - Partecipazioni e Altri TitoliTrattasi di partecipazioni, aventi carattere di investimento durevole e sono valutate al costo di acquisizione (prezzo di acquisto al lordo degli oneri accessori), che viene ridotto in caso di perdite durevoli di valore. Se in esercizi successivi le ragioni che avevano portato una svalutazione vengono meno, il valore originario viene ripristinato.Come meglio illustrato nella Relazione sulla Gestione, la voce “azioni proprie” accoglie azioni della società acquistate nel corso degli esercizi precedenti, in adempimento di quanto già in precedenza deliberato dalle diverse assemblee ordinarie degli azionisti.
2.5. RimanenzeSono valutate al minore tra costo e prezzo di mercato; il costo è determinato sulla base dei seguenti criteri:- materie prime, sussidiarie e di consumo, i semilavorati di acquisto e di produzione
e le merci destinate alla rivendita, al costo medio di acquisto;- prodotti in corso di lavorazione, semilavorati di produzione e prodotti finiti, il costo
di produzione (costi diretti - materiale e mano d’opera - più una quota ragionevol-mente imputabile di costi generali di produzione, mano d’opera indiretta, ammor-tamenti industriali, manutenzioni e riparazioni industriali, forza motrice, materiali di consumo, altre spese industriali) è determinato con il criterio del costo medio.
Il valore indicato in bilancio riflette, attraverso stanziamento di un apposito fondo ret-tificativo diretto, fenomeni di obsolescenza e/o lento rigiro.
2.6. CreditiI crediti (allocati tra le “Immobilizzazioni finanziarie” ovvero nell’”Attivo circolante”) sono iscritti al valore presumibile di realizzazione, al netto dell’apposito fondo svalutazione, commisurato all’effettivo rischio di inesigibilità.
2.7. Disponibilità liquideSono iscritte al valore nominale.
2.8. Ratei e risconti attiviSono costituiti da quote di proventi di competenza dell’esercizio esigibili in esercizi successivi e da quote di costi sostenuti entro la chiusura dell’esercizio ma di compe-tenza di esercizi successivi.
2.9. Fondi per rischi e oneriSono costituiti da accantonamenti destinati a coprire perdite o debiti di natura de-terminata, di esistenza certa o probabile, dei quali alla chiusura dell’esercizio sono indeterminati o l’ammontare o la data di sopravvenienza. Gli stanziamenti rappre-sentano la miglior stima possibile sulla base degli impegni assunti e degli elementi a disposizione alla data di redazione del bilancio.
65Nota integrativa / Notes to the financial statements
2.3. Leasing agreementsThe accounting system observed for goods purchased under lease complies with the accounting practice in force in Italy and envisages the booking to the income state-ment of lease instalments paid (this is known as the “equity method”). Application of the financial method would have led to the booking of interest on the principle funded and of amortisation on the value of the goods purchased under lease, in line with the residual possibilities of use of said goods, plus registration of the goods to assets and of the residual amount payable to liabilities.
Annexed to these notes (Annex 2), as requested by article 2427, point 22 of the Civil Code, is a special statement, stating the:- current value of the fee instalments still to mature, calculated using an interest rate
equal to the actual financial expense;- actual financial expense;- value at which the goods would have been registered if they had been booked ac-
cording to the “financial” method, according to the international accounting stand-ards;
- amortisation for the year;- effects on the result for the year and on shareholders’ equity net of the possible
application of the financial method;- tax effect.
2.4. Financial fixed assets - Equity Investments and Other SecuritiesThese are long-term equity investments and they are assessed at purchase cost (pur-chase price gross of accessory expenses), which is reduced in the case of durable losses in value. If, in subsequent years, the causes of the writeback cease to exist, the original value is restored.As better explained in the Operational review, the “own shares” item comprises com-pany shares purchased during previous years, fulfilling the obligations previously re-solved by the various ordinary shareholders’ meetings.
2.5. InventoriesThese are evaluated at the lower between cost and market price; the cost is deter-mined on the basis of the following criteria:- raw, ancillary and consumable materials, unfinished products purchased and man-
ufactured and goods destined for resale, at the average purchase cost; - products being processed, unfinished products and finished products, produc-
tion cost (direct costs – material and labour – plus a reasonably attributable por-tion of general production costs, indirect labour, industrial amortisation, industrial maintenance and repairs, driving power, consumable materials and other industrial expense) is determined with the average cost criterion.
The book value reflects obsolescence and/or slow turnover through a special direct adjustment provision.
2.6. ReceivablesReceivables (carried among “Financial fixed assets” or “Current assets”) are booked at their presumable sale value, net of the specific depreciation fund, aligned to the actual risk that they cannot be collected.
2.7. Cash and cash equivalentsThese are registered at par value.
2.8. Accrued income and prepaid expensesThese are made up of income accrued to the year but collectible in subsequent years and of portions of costs sustained before the end of the year but accrued to subse-quent years.
2.9. Provisions for risks and charges These are reserves that have been created to cover certain or probable losses or debts, for which it was not possible to determine the amount or date of occurrence at the end of the year. The allocations reflect the best possible estimate on the basis of the commitments undertaken and the elements available on the closing date.
66 Nota integrativa / Notes to the financial statements
2.10. Trattamento di fine rapporto di lavoro subordinatoRappresenta la passività prevista dall’articolo 2120 del Codice Civile, soggetta a riva-lutazione a mezzo di indici, maturata nei confronti di tutti i dipendenti in conformità alle legislazioni vigenti ed ai contratti collettivi di lavoro, tenuto conto delle anticipazioni erogate e dei versamenti alle forme pensionistiche complementari e al Fondo di teso-reria dell’Inps eseguiti in conformità al D.Lgs 252/2005.Il trattamento di fine rapporto è quello maturato sulla base delle disposizioni legisla-tive e contrattuali vigenti che regolano il rapporto di lavoro dei singoli dipendenti. Il debito iscritto a bilancio riflette il debito maturato nei confronti dei dipendenti, al netto delle anticipazioni erogate agli stessi, fino al mese precedente alla data in cui ogni dipendente abbia espressamente o tacitamente scelto il fondo a cui destinare il TFR maturando ai sensi del D.Lgs. 5 dicembre 2005 n. 252 e successive modificazioni e integrazioni.
A seguito dell’entrata in vigore del citato decreto si è tenuto conto:- della decisione dei dipendenti di destinare le quote del TFR ad un Fondo pensione
(privato o di categoria);- della decisione dei dipendenti di conservare il TFR presso il proprio datore di lavoro
e di conseguenza, avendo la società oltre 50 dipendenti, dell’obbligo di effettuare il versamento al Fondo di Tesoreria gestito dall’Inps.
Le quote maturate e non ancora versate ai fondi pensione sono state classificate nella voce debiti verso istituti di previdenza e di sicurezza sociale.
2.11. DebitiSono iscritti al valore nominale.
2.12. Ratei e risconti passiviSono costituiti da quote di costi di competenza dell’esercizio esigibili nell’esercizio successivo e da quote di proventi percepiti entro la chiusura dell’esercizio ma di com-petenza di esercizi successivi.
2.13. Conversione dei valori non espressi all’origine in EuroLe attività e le passività in valute estere dei Paesi non aderenti alla Moneta Unica Euro-pea, sono contabilizzate al cambio alla data di registrazione. Al termine dell’esercizio tutte le attività e passività, ad eccezione delle immobilizzazioni non monetarie, sono iscritte in bilancio ai cambi “a pronti” alla data di chiusura dell’esercizio. I relativi utili e perdite sono imputati a conto economico alla voce C.17 bis. Qualora dal proce-dimento di adeguamento dei cambi emerga una differenza positiva netta, in sede di destinazione dell’eventuale utile d’esercizio viene accantonata una apposita riserva non distribuibile di pari importo.Le immobilizzazioni non monetarie sono invece iscritte ai cambi storici, che vengono modificati solo in caso di riduzione del tasso di cambio considerata durevole.Inoltre, i saldi dei conti correnti valutari sono iscritti in bilancio al cambio di chiusura dell’esercizio.
2.14. Strumenti finanziari derivatiLe differenze economiche positive o negative sulle operazioni a termine a copertura di attività e passività in bilancio o “fuori bilancio” sono contabilizzate nello stesso mo-mento in cui vengono rilevati i proventi o gli oneri sulle attività o passività sottostanti.
2.15. Componenti positivi e negativi di redditoI proventi e gli oneri sono iscritti in conto economico in base al principio della compe-tenza economica.Inoltre, si dà atto che:- i ricavi per cessioni di beni sono riconosciuti al momento del passaggio di proprie-
tà, che generalmente coincide con la consegna o spedizione per i beni mobili; per gli immobili con il trasferimento giuridico (atto pubblico);
- i ricavi per prestazioni di servizi sono riconosciuti al momento dell’ultimazione della prestazione;
- i contributi in conto impianti, in quanto relativi a specifiche immobilizzazioni, sono accreditati a conto economico in ragione del processo di ammortamento dei ce-spiti cui si riferiscono nel periodo contabile in cui è acquisita la documentazione probatoria dell’erogazione, purché vi sia la ragionevole certezza del rispetto dei parametri necessari per l’ottenimento del contributo stesso in via definitiva;
67Nota integrativa / Notes to the financial statements
2.10. Employee termination indemnities This represents the liability envisaged by article 2120 of the Civil Code, subject to revaluation via indexes, matured for all employees in conformity to the legislation in force and to the collective labour contracts, taking into account the advance pay-ments disbursed and payments to complementary pension schemes and to the INPS Treasury reserve in conformity to Legislative Decree 252/2005.Termination indemnities are matured on the basis of the legislative and contractual provisions in force, which regulate the working relationship of the individual employ-ees. The amount payable booked reflects the debt matured towards employees, net of advance payments made to them, until the month prior to the date on which each employee expressly or tacitly chose the reserve into which the termination indemni-ties to mature should be paid in accordance with Legislative Decree no. 252 dated 5 December 2005 and subsequent amendments and additions.
After entry into force of the aforementioned decree the following were taken into ac-count:- the decision by employees to allocate the portions of termination indemnities to a
Pension fund (private or linked to the category);- the decision by employees to keep the termination indemnities with their employer
and consequently, as the company has over 50 employees, the obligation to pay them into the INPS Treasury Reserve.
Indemnities matured and not yet paid into pension funds are carried in the “due to welfare and social security institutes” item.
2.11. PayablesThese are registered at par value.
2.12. Accrued expenses and deferred incomeThese are portions of costs accrued to the year and maturing the following years, as well as portions of income perceived before the end of the year but accrued to subsequent years.
2.13. Conversion of values not originally stated in eurosAssets and liabilities in foreign currencies of countries that do not belong to the Eu-ropean Monetary Union are booked at the exchange rate in force on the date of registration. At the end of the year, all assets and liabilities, apart from non-monetary fixed assets, are booked at “spot” exchanges on the closing date. The correspond-ing gains and losses are booked to the income statement under item C. 17 bis. If the exchange adaptation procedure reveals a positive net difference, when allocating any net income a special non-distributable reserve is set up for the same amount.Non-monetary fixed assets on the other hand are booked at their historic exchanges, which are altered only in the case of a reduction in the exchange rate that is consid-ered durable.Moreover, the balance of current accounts held in foreign currency are booked at the exchange rate in force on the closing date.
2.14. Financial derivativesPositive or negative economic difference on termed operations to hedge assets and liabilities in the financial statements of “of-balance sheet” are booked at the time the income or expense is disclosed in relation to the assets or liabilities.
2.15. Positive and negative income componentsIncome and expense are booked to the income statement on the basis of the eco-nomic accruals principle.Also, it is acknowledged that:- revenues from the sales of goods are recognised at the time ownership is trans-
ferred, which usually coincides with the delivery or shipping of mobile assets and with legal transfer (public deed) for buildings;
- revenues from the performance of services are recognised upon completion of the service;
- contributions to the systems account, insofar as relating to specific assets, are car-ried in the income statement in relation to the amortisation process of the assets in question, in the accounting period in which the probatory documentation of the disbursement is acquired, as long as there is reasonable certainty that the param-eters necessary to obtain the contribution will be observed;

68 Nota integrativa / Notes to the financial statements
- le imposte sul reddito vengono iscritte nell’esercizio di competenza sulla base di una prudente interpretazione della vigente normativa fiscale. Rammentiamo che la società ha aderito al Consolidato Fiscale Nazionale, unitamente a Oerlikon Gra-ziano Group SpA (in qualità di consolidante). Le imposte differite e anticipate sono calcolate sulle differenze temporanee tra il valore contabile delle attività e passività e il valore attribuito alle stesse ai fini fiscali. Le attività per imposte anticipate sono iscritte qualora vi sia la ragionevole certezza dell’esistenza, negli esercizi in cui si riversano le relative differenze temporanee, di un reddito imponibile uguale o su-periore all’ammontare delle stesse e quindi della loro effettiva e probabile ricupera-bilità, e sono esposte nell’apposita voce dell’attivo dello Stato Patrimoniale C.II 4 ter. Le passività per imposte differite non sono contabilizzate solo qualora esistano scarse possibilità che il relativo debito insorga, e sono esposte tra i fondi per rischi ed oneri nella voce Fondo per imposte, anche differite.
3. Movimenti delle immobilizzazioni
In accordo con le previsioni dell’articolo 2427 n. 2 del Codice Civile vengono eviden-ziati i dati riguardanti le immobilizzazioni immateriali, materiali e finanziarie.
3.1. Movimenti delle immobilizzazioni immateriali e composizione di alcune vociNell’Allegato 3, presentato in calce alla nota integrativa, vengono fornite informazioni analitiche in ordine a:- consistenza delle immobilizzazioni immateriali relative all’esercizio precedente, nelle
varie componenti che la determinano;- variazioni intervenute nel corso dell’esercizio;- composizione analitica delle “altre” immobilizzazioni immateriali.
Gli investimenti effettuati riguardano in particolare: ricerca e sviluppo e programmi di elaborazione dati per l’importo complessivo di Euro 533.982.Si dà atto, inoltre, che permangono le condizioni che in esercizi passati avevano portato alla capitalizzazione dei precedenti costi.
3.2. Movimenti delle immobilizzazioni materialiNell’Allegato 4, presentato in calce alla nota integrativa, vengono fornite informazioni analitiche in ordine a:- consistenza delle immobilizzazioni materiali relative all’esercizio precedente, nelle
varie componenti che la determinano;- variazioni intervenute nel corso dell’esercizio.
Gli investimenti effettuati riguardano in particolare migliorie su fabbricati industriali, costruzioni leggere, impianti, macchinari, attrezzature e altri beni. Tra gli investimenti sono compresi capitalizzazioni per produzioni interne di impianti, macchinari, attrez-zature. L’importo complessivo degli investimenti ammonta a Euro 14.233.483.
A tal proposito, rammentiamo che la società dispone, al proprio interno, di un reparto specializzato in progettazione, revisione, costruzione e trasformazione di macchine utensili, anche a controllo numerico.Tra le alienazioni, per rinnovo, dell’esercizio troviamo dei macchinari, attrezzature, mo-bili e arredi, macchine ufficio e mezzi di trasporto. Nel corso dell’esercizio sono stati dismessi, a seguito di due operazioni di cessioni di ramo d’azienda, fabbricati, mac-chinari, attrezzature e altri beni relativi allo stabilimento di Porretta Terme aventi costo storico pari ad euro 55.838.448 e fondo ammortamento pari ad euro 51.673.886; fabbricati, macchinari, attrezzature e altri beni relativi allo stabilimento di Garessio aventi costo storico pari ad euro 10.718.647 e fondo ammortamento pari ad euro 10.167.321.Inoltre, si dà atto che non vi sono cespiti, iscritti in bilancio, gravati da ipoteche, privi-legi ed altre garanzie reali.

69Nota integrativa / Notes to the financial statements
- income taxes are booked to the year on the basis of a prudent interpretation of the tax laws in force. We would like to remind you that the company has adhered to the National tax Consolidation system, together with Oerlikon Graziano Group SpA (the consolidating company). Deferred and prepaid taxes are calculated on the temporary differences between the book value of assets and liabilities and the value attributed to them for tax purposes. Prepaid tax assets are booked where there is reasonable certainty of the existence, in the years to which the relative temporary differences will be accrued, of a taxable income equal to or above their amount, meaning that they will actually and probably be recovered, and they are disclosed in the specific asset item of the Balance Sheet C.II 4 ter. Liabilities for deferred taxes are not booked only if there is likely likelihood that the relative debt will arise, and they are disclosed among provisions for risks and charges in the Provision for taxes, also deferred item.
3. Movement of fixed assets
In accordance with the provisions of article 2427 no.2 of the Civil Code, the data re-garding intangible, tangible and financial fixed assets is highlighted.
3.1. Movements of intangible fixed assets and breakdown of certain itemsAnnex 3, presented at the end of the notes to the financial statements, supplies ana-lytical information on:- consistency of intangible fixed assets relating to the previous year, in the various
components;- changes during the year;- analytical breakdown of “other” intangible fixed assets.
Investments made particular concerned: research and development and data pro-cessing programmes for the total amount of € 533,982.It is also acknowledged that conditions that in past years had led to the capitalisation of previous costs continue to exist.
3.2. Movements of tangible fixed assetsAnnex 4, presented at the end of the notes to the financial statements, supplies ana-lytical information on:- consistency of tangible fixed assets relating to the previous year, in the various
components;- changes during the year.
The investments made particularly concern improvements to industrial buildings, light constructions, systems, machinery, equipment and other goods. The investments include capitalisations for internal productions of systems, machinery and equipment. The total amount of investments is € 14,233,483.
To this end, we would like to remind you that the company has an in-house depart-ment specialised in the design, review, construction and transformation of machine tools, also with numeric control.Among disposals for renewal during the year, we find machinery, equipment, furniture and furnishings, office machinery and transport. During the year, following two sales of business branches, buildings, machinery, equipment and other goods relating to Porretta Terme plant were disposed of, with a historical cost of € 55,838,448 and an amortisation reserve of € 51,673,886; along with buildings, machinery, equipment and other goods relating to Garessio plant, with a historical cost of € 10,718,647 and an amortisation reserve of € 10,167,321.Furthermore, it is acknowledged that there are assets booked to the financial state-ments that covered by mortgage guarantees, privileges and other unsecured guar-antees.
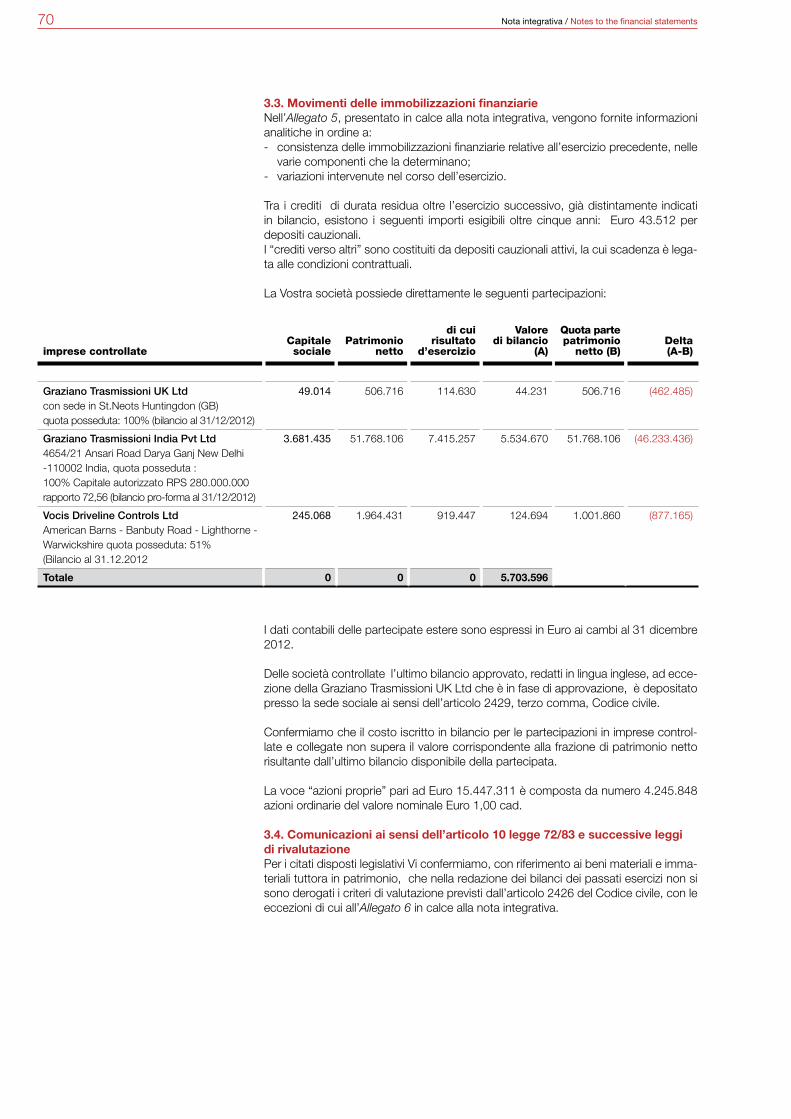
70 Nota integrativa / Notes to the financial statements
3.3. Movimenti delle immobilizzazioni finanziarieNell’Allegato 5, presentato in calce alla nota integrativa, vengono fornite informazioni analitiche in ordine a:- consistenza delle immobilizzazioni finanziarie relative all’esercizio precedente, nelle
varie componenti che la determinano;- variazioni intervenute nel corso dell’esercizio.
Tra i crediti di durata residua oltre l’esercizio successivo, già distintamente indicati in bilancio, esistono i seguenti importi esigibili oltre cinque anni: Euro 43.512 per depositi cauzionali.I “crediti verso altri” sono costituiti da depositi cauzionali attivi, la cui scadenza è lega-ta alle condizioni contrattuali.
La Vostra società possiede direttamente le seguenti partecipazioni:
I dati contabili delle partecipate estere sono espressi in Euro ai cambi al 31 dicembre 2012.
Delle società controllate l’ultimo bilancio approvato, redatti in lingua inglese, ad ecce-zione della Graziano Trasmissioni UK Ltd che è in fase di approvazione, è depositato presso la sede sociale ai sensi dell’articolo 2429, terzo comma, Codice civile.
Confermiamo che il costo iscritto in bilancio per le partecipazioni in imprese control-late e collegate non supera il valore corrispondente alla frazione di patrimonio netto risultante dall’ultimo bilancio disponibile della partecipata.
La voce “azioni proprie” pari ad Euro 15.447.311 è composta da numero 4.245.848 azioni ordinarie del valore nominale Euro 1,00 cad.
3.4. Comunicazioni ai sensi dell’articolo 10 legge 72/83 e successive leggi di rivalutazionePer i citati disposti legislativi Vi confermiamo, con riferimento ai beni materiali e imma-teriali tuttora in patrimonio, che nella redazione dei bilanci dei passati esercizi non si sono derogati i criteri di valutazione previsti dall’articolo 2426 del Codice civile, con le eccezioni di cui all’Allegato 6 in calce alla nota integrativa.
imprese controllateCapitalesociale
Patrimonionetto
di cui risultato
d’esercizio
Valoredi bilancio
(A)
Quota partepatrimonio
netto (B)Delta (A-B)
Graziano Trasmissioni UK Ltd con sede in St.Neots Huntingdon (GB) quota posseduta: 100% (bilancio al 31/12/2012)
49.014 506.716 114.630 44.231 506.716 (462.485)
Graziano Trasmissioni India Pvt Ltd 4654/21 Ansari Road Darya Ganj New Delhi -110002 India, quota posseduta : 100% Capitale autorizzato RPS 280.000.000 rapporto 72,56 (bilancio pro-forma al 31/12/2012)
3.681.435 51.768.106 7.415.257 5.534.670 51.768.106 (46.233.436)
Vocis Driveline Controls Ltd American Barns - Banbuty Road - Lighthorne - Warwickshire quota posseduta: 51% (Bilancio al 31.12.2012
245.068 1.964.431 919.447 124.694 1.001.860 (877.165)
Totale 0 0 0 5.703.596

71Nota integrativa / Notes to the financial statements
3.3. Movements of financial fixed assetsAnnex 5, presented at the end of the notes to the financial statements, supplies ana-lytical information on the:- consistency of financial fixed assets relating to the previous year, in the various
components;- changes during the year.
Receivables with a residual duration after the following year, already separately indi-cated in the financial statements, include the following amounts maturing after five years: € 43,512 for cautionary deposits.Amounts “due from others” consist of cautionary deposit income, the maturity of which is linked to the contractual conditions.
Your company directly owns the following equity investments:
The accounting data of the foreign investments is expressed in euros at the exchange rate in force at 31 December 2012.
The last approved financial statements of the subsidiaries, written in English, apart from the financial statements of Graziano Trasmissioni UK Ltd which are currently being approved, are deposited at company headquarters in accordance with article 2429, paragraph three of the Civil Code.
We are able to confirm that the cost booked to the financial statements for equity investments in subsidiaries and associated companies does not exceed the value corresponding to the fraction of shareholders’ equity resulting from the last financial statements available of the company in which the investment is held.
The “own shares” item, amounting to € 15,447.311, consists of 4,245,48 ordinary shares with a par value of € 1.00 each.
3.4. Communications in accordance with article 10 of law 72/83 andsubsequent revaluation lawsFor the aforementioned legislative depositions, we are able to confirm that, with refer-ence to the tangible and intangible assets in the equity, that in preparing the financial statements for past years, no exceptions were made to the evaluation criteria envis-aged by article 2426 of the Civil Code, apart from those indicated in Annex 6 to these notes.
subsidiariesShare
capital
Share-holders’
equity
Of which result
for yearBook value
(A)
Portion of share. equ.
(B)Delta (A-B)
Graziano Trasmissioni UK Ltd with reg. office in St.Neots Huntingdon (GB) share held: 100% (fin. statements at 31/12/2012)
49,014 506,716 114,630 44,231 506,716 (462,485)
Graziano Trasmissioni India Pvt Ltd 4654/21 Ansari Road Darya Ganj New Delhi -110002 India, share held: 100% Authorised capital RPS 280,000,000 ratio 72.56 (pro-forma fin. statements at 31/12/2012)
3,681,435 51,768,106 7,415,257 5,534,670 51,768,106 (46,233,436)
Vocis Driveline Controls Ltd American Barns - Banbuty Road - Lighthorne - Warwickshire share held: 51% (fin. statements at 31.12.2012)
245,068 1,964,431 919,447 124,694 1,001,860 (877,165)
Total 0 0 0 5,703,596

72 Nota integrativa / Notes to the financial statements
4. Variazioni intervenute nella consistenza delle altre voci dell’attivo e del passivo
4.1. Attivo circolanteI. RimanenzeLe variazioni e la composizione delle singole voci vengono qui di seguito esposte:
Il fondo svalutazione relativo alle rimanenze di materie prime e sussidiarie e prodotti finiti, è stato accantonato in precedenti esercizi, ed adeguato nell’esercizio 2012, al fine di tener conto di alcuni prodotti a lento rigiro.
Saldo iniziale Incrementi Decrementi Saldo finale
Totale 69.135.407 2.180.207 (12.570.742) 58.744.872
1. materie prime, sussidiarie e di consumo 18.849.072 2.180.207 (3.336.307) 17.692.972
- valore 25.201.279 0 (3.336.307) 21.864.972
- (fondo svalutazione) (6.352.207) 2.180.207 0 (4.172.000)
2. prodotti in corso di lavorazione e semilavorati
22.499.559 0 (6.562.476) 15.937.083
- valore 22.499.559 0 (6.562.476) 15.937.083
- (fondo svalutazione) 0 0 0 0
4. prodotti finiti e merci 27.786.776 0 (2.671.959) 25.114.817
- valore 29.660.240 0 (2.671.812) 26.988.428
- (fondo svalutazione) (1.873.464) 0 (147) (1.873.611)
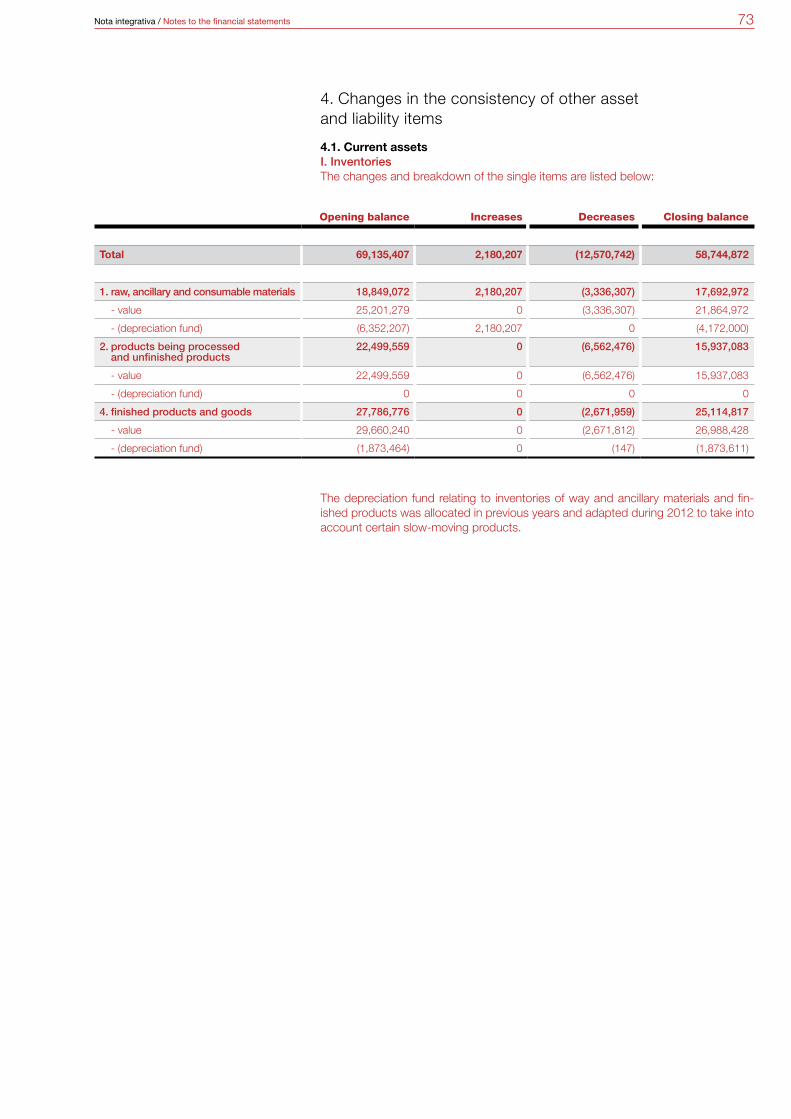
73Nota integrativa / Notes to the financial statements
Opening balance Increases Decreases Closing balance
Total 69,135,407 2,180,207 (12,570,742) 58,744,872
1. raw, ancillary and consumable materials 18,849,072 2,180,207 (3,336,307) 17,692,972
- value 25,201,279 0 (3,336,307) 21,864,972
- (depreciation fund) (6,352,207) 2,180,207 0 (4,172,000)
2. products being processed and unfinished products
22,499,559 0 (6,562,476) 15,937,083
- value 22,499,559 0 (6,562,476) 15,937,083
- (depreciation fund) 0 0 0 0
4. finished products and goods 27,786,776 0 (2,671,959) 25,114,817
- value 29,660,240 0 (2,671,812) 26,988,428
- (depreciation fund) (1,873,464) 0 (147) (1,873,611)
4. Changes in the consistency of other asset and liability items
4.1. Current assetsI. InventoriesThe changes and breakdown of the single items are listed below:
The depreciation fund relating to inventories of way and ancillary materials and fin-ished products was allocated in previous years and adapted during 2012 to take into account certain slow-moving products.

74 Nota integrativa / Notes to the financial statements
II. CreditiLe variazioni e la composizione delle singole voci vengono qui di seguito esposte:
Rispetto al 31 dicembre 2011, la variazione netta in diminuzione del credito “verso clienti” è sostanzialmente generata dalla riduzione di fatturato rispetto allo scorso periodo.Tra i crediti di durata residua oltre l’esercizio successivo, già distintamente indicati in bilancio, non esistono importi esigibili oltre cinque anni.I “crediti verso imprese controllate” sono relativi a normali operazioni commerciali.I “crediti verso imprese del gruppo” sono relativi a normali operazioni verso imprese del gruppo Oerlikon. Il decremento è sostanzialmente dovuto alla conclusione del rapporto con la società Graziano Trasmissioni Group AG.
Saldo iniziale Incrementi Decrementi Saldo finale
Totale 119.689.321 1.494.034 (24.605.694) 96.577.661
1. verso clienti:
- scadenti entro 12 mesi 89.254.236 281.813 (6.788.682) 82.747.367
valore 92.721.272 0 (6.788.682) 85.932.590
(fondo svalutazione) (3.467.036) 281.813 0 (3.185.223)
- scadenti oltre 12 mesi 0 363.000 0 363.000
valore 0 363.000 0 363.000
(fondo svalutazione) 0 0 0 0
2. verso imprese controllate:
- scadenti entro 12 mesi 1.928.186 0 (112.923) 1.815.263
valore 1.928.186 0 (112.923) 1.815.263
(fondo svalutazione) 0 0 0 0
3. verso imprese del gruppo:
- scadenti entro 12 mesi 9.398.106 0 (8.641.043) 757.063
valore 9.398.106 0 (8.641.043) 757.063
(fondo svalutazione) 0 0 0 0
4. verso imprese controllanti e loro controllate:
- scadenti entro 12 mesi 1.602.370 0 (1.378.747) 223.623
valore 1.602.370 0 (1.378.747) 223.623
(fondo svalutazione) 0 0 0 0
4-bis. crediti tributari
- scadenti entro 12 mesi 3.445.107 0 (72.945) 3.372.162
valore 3.445.107 0 (72.945) 3.372.162
(fondo svalutazione) 0 0 0 0
4-ter. imposte anticipate
- scadenti entro 12 mesi 4.739.109 0 (3.958.152) 780.957
valore 4.739.109 0 (3.958.152) 780.957
(fondo svalutazione) 0 0 0 0
- scadenti oltre 12 mesi 6.965.691 0 (3.653.202) 3.312.489
valore 6.965.691 0 (3.653.202) 3.312.489
(fondo svalutazione) 0 0 0 0
5. verso altri:
- scadenti entro 12 mesi 2.356.516 849.221 0 3.205.737
valore 2.356.516 849.221 0 3.205.737
(fondo svalutazione) 0 0 0 0
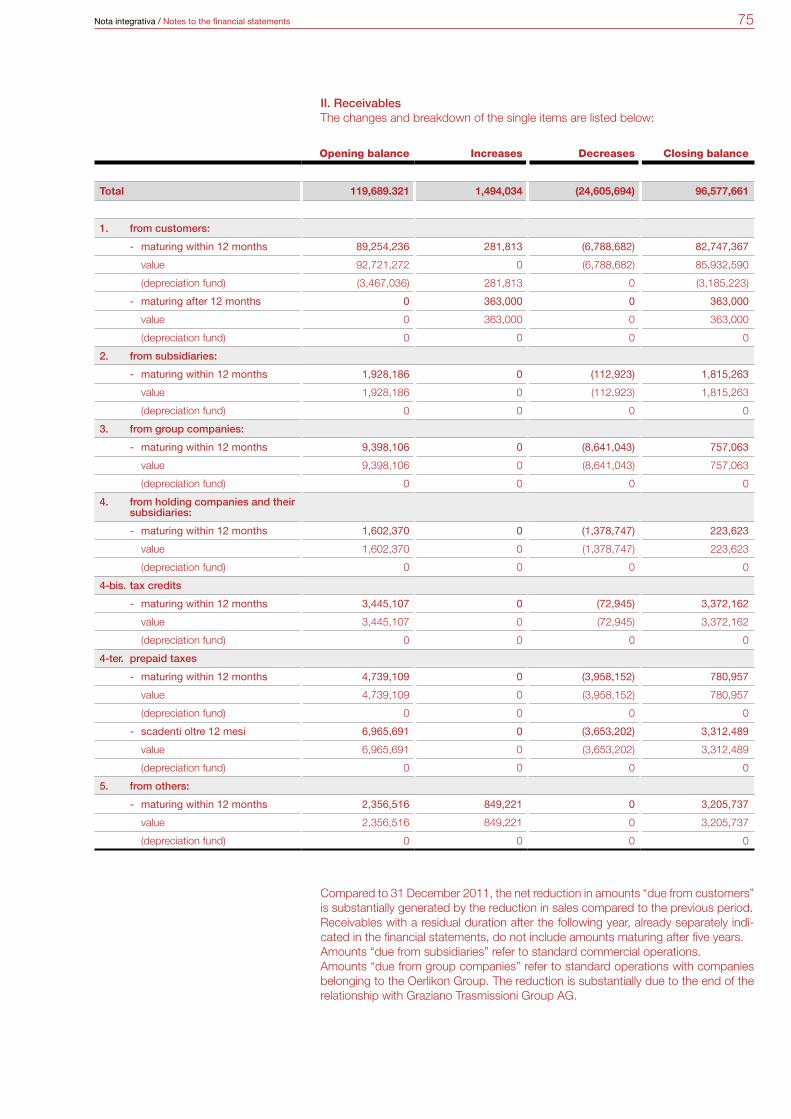
75Nota integrativa / Notes to the financial statements
Opening balance Increases Decreases Closing balance
Total 119,689.321 1,494,034 (24,605,694) 96,577,661
1. from customers:
- maturing within 12 months 89,254,236 281,813 (6,788,682) 82,747,367
value 92,721,272 0 (6,788,682) 85,932,590
(depreciation fund) (3,467,036) 281,813 0 (3,185,223)
- maturing after 12 months 0 363,000 0 363,000
value 0 363,000 0 363,000
(depreciation fund) 0 0 0 0
2. from subsidiaries:
- maturing within 12 months 1,928,186 0 (112,923) 1,815,263
value 1,928,186 0 (112,923) 1,815,263
(depreciation fund) 0 0 0 0
3. from group companies:
- maturing within 12 months 9,398,106 0 (8,641,043) 757,063
value 9,398,106 0 (8,641,043) 757,063
(depreciation fund) 0 0 0 0
4. from holding companies and their subsidiaries:
- maturing within 12 months 1,602,370 0 (1,378,747) 223,623
value 1,602,370 0 (1,378,747) 223,623
(depreciation fund) 0 0 0 0
4-bis. tax credits
- maturing within 12 months 3,445,107 0 (72,945) 3,372,162
value 3,445,107 0 (72,945) 3,372,162
(depreciation fund) 0 0 0 0
4-ter. prepaid taxes
- maturing within 12 months 4,739,109 0 (3,958,152) 780,957
value 4,739,109 0 (3,958,152) 780,957
(depreciation fund) 0 0 0 0
- scadenti oltre 12 mesi 6,965,691 0 (3,653,202) 3,312,489
value 6,965,691 0 (3,653,202) 3,312,489
(depreciation fund) 0 0 0 0
5. from others:
- maturing within 12 months 2,356,516 849,221 0 3,205,737
value 2,356,516 849,221 0 3,205,737
(depreciation fund) 0 0 0 0
II. ReceivablesThe changes and breakdown of the single items are listed below:
Compared to 31 December 2011, the net reduction in amounts “due from customers” is substantially generated by the reduction in sales compared to the previous period.Receivables with a residual duration after the following year, already separately indi-cated in the financial statements, do not include amounts maturing after five years. Amounts “due from subsidiaries” refer to standard commercial operations.Amounts “due from group companies” refer to standard operations with companies belonging to the Oerlikon Group. The reduction is substantially due to the end of the relationship with Graziano Trasmissioni Group AG.
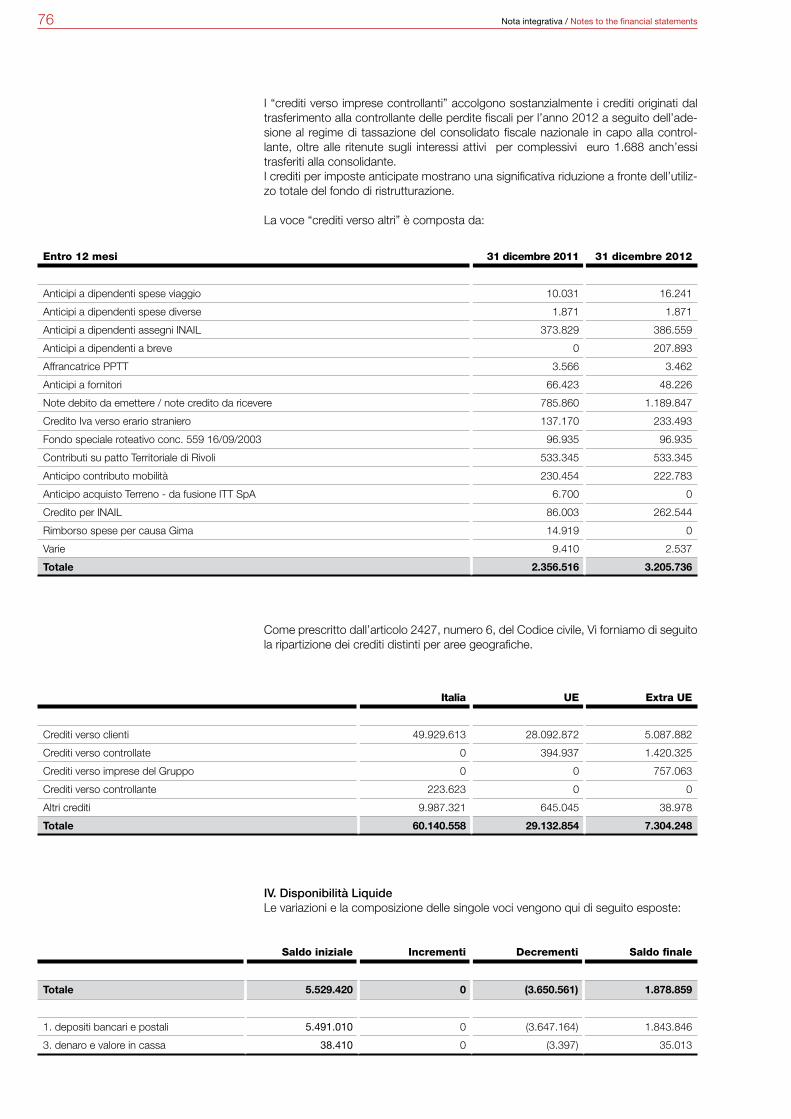
76 Nota integrativa / Notes to the financial statements
I “crediti verso imprese controllanti” accolgono sostanzialmente i crediti originati dal trasferimento alla controllante delle perdite fiscali per l’anno 2012 a seguito dell’ade-sione al regime di tassazione del consolidato fiscale nazionale in capo alla control-lante, oltre alle ritenute sugli interessi attivi per complessivi euro 1.688 anch’essi trasferiti alla consolidante.I crediti per imposte anticipate mostrano una significativa riduzione a fronte dell’utiliz-zo totale del fondo di ristrutturazione.
La voce “crediti verso altri” è composta da:
Come prescritto dall’articolo 2427, numero 6, del Codice civile, Vi forniamo di seguito la ripartizione dei crediti distinti per aree geografiche.
IV. Disponibilità LiquideLe variazioni e la composizione delle singole voci vengono qui di seguito esposte:
Entro 12 mesi 31 dicembre 2011 31 dicembre 2012
Anticipi a dipendenti spese viaggio 10.031 16.241
Anticipi a dipendenti spese diverse 1.871 1.871
Anticipi a dipendenti assegni INAIL 373.829 386.559
Anticipi a dipendenti a breve 0 207.893
Affrancatrice PPTT 3.566 3.462
Anticipi a fornitori 66.423 48.226
Note debito da emettere / note credito da ricevere 785.860 1.189.847
Credito Iva verso erario straniero 137.170 233.493
Fondo speciale roteativo conc. 559 16/09/2003 96.935 96.935
Contributi su patto Territoriale di Rivoli 533.345 533.345
Anticipo contributo mobilità 230.454 222.783
Anticipo acquisto Terreno - da fusione ITT SpA 6.700 0
Credito per INAIL 86.003 262.544
Rimborso spese per causa Gima 14.919 0
Varie 9.410 2.537
Totale 2.356.516 3.205.736
Italia UE Extra UE
Crediti verso clienti 49.929.613 28.092.872 5.087.882
Crediti verso controllate 0 394.937 1.420.325
Crediti verso imprese del Gruppo 0 0 757.063
Crediti verso controllante 223.623 0 0
Altri crediti 9.987.321 645.045 38.978
Totale 60.140.558 29.132.854 7.304.248
Saldo iniziale Incrementi Decrementi Saldo finale
Totale 5.529.420 0 (3.650.561) 1.878.859
1. depositi bancari e postali 5.491.010 0 (3.647.164) 1.843.846
3. denaro e valore in cassa 38.410 0 (3.397) 35.013

77Nota integrativa / Notes to the financial statements
Within 12 months 31 December 2011 31 December 2012
Advance payments to employees - travel 10,031 16,241
Advance payments to employees - sundry 1,871 1,871
Advance payments to employees - INAIL cheques 373,829 386,559
Short-term advance payments to employees 0 207,893
Post office franking machine 3,566 3,462
Advance payments to suppliers 66,423 48,226
Debt notes to issue/credit notes receivable 785,860 1,189,847
VAT credit with foreign tax department 137,170 233,493
Special revolving fund license 559 16/09/2003 96,935 96,935
Contributions on Rivoli Territorial pact 533,345 533,345
Advance payment of mobility contribution 230,454 222,783
Advance payment on purchase of land - from ITT SpA merger 6,700 0
INAIL credit 86,003 262,544
Refunding of expenses for Gima lawsuit 14,919 0
Miscellaneous 9,410 2,537
Total 2,356,516 3,205,736
Italy UE Non-EU
Due from customers 49,929,613 28,092,872 5,087,882
Due from subsidiaries 0 394,937 1,420,325
Due from group companies 0 0 757,063
Due from parent company 223,623 0 0
Other receivables 9,987,321 645,045 38,978
Total 60,140,558 29,132,854 7,304,248
Opening balance Increases Decreases Closing balance
Total 5,529,420 0 (3,650,561) 1,878,859
1. bank and post office deposits 5,491,010 0 (3,647,164) 1,843,846
3. cash and cash equivalents 38,410 0 (3,397) 35,013
Amounts “due from holding companies” substantially consist of receivables gener-ated by the transferral to the holding company of tax losses for 2012 following ad-hesion to the national tax consolidation system managed by the holding company, as well as withholdings on interest income totalling € 1,688, also transferred to the consolidating company.Prepaid tax credits show a significant reduction for the total use of the restructuring fund.
The amounts “due from others” item consists of:
As indicated by article 2427, number 6 of the Civil Code, we are able to supply the following breakdown of receivables by geographic area.
IV. Cash and cash equivalentsThe changes and breakdown of the single items are listed below:

78 Nota integrativa / Notes to the financial statements
4.2. Ratei e Risconti attiviLe variazioni e la composizione delle singole voci vengono qui di seguito esposte:
I risconti attivi per canoni leasing sono riferiti ai contratti di locazione finanziaria di apparecchiature telefoniche.
4.3. Patrimonio netto - categorie di azioniLe variazioni e la composizione delle singole voci vengono qui di seguito esposte:
Saldo iniziale Incrementi Decrementi Saldo finale
Totale 156.589 75.011 (49.457) 182.143
- ratei attivi 39.566 0 (39.117) 449
Assicurazioni 34.809 0 (34.809) 0
Interessi e rimborsi diversi 4.757 0 (4.308) 449
- risconti attivi 117.023 75.011 (10.340) 181.694
Assicurazioni 23.790 5.299 0 29.089
Canoni manutenzione 7.563 36.287 0 43.850
Servizi 54.084 33.425 0 87.509
Canoni leasing 28.059 0 (6.813) 21.246
Abbonamenti riviste 488 0 (488) 0
Locazioni 3.039 0 (3.039) 0
Saldo iniziale Incrementi Decrementi Saldo finale
Totale 100.194.631 9.199.416 (5.038.172) 104.355.875
I. Capitale 58.697.357 0 0 58.697.357
III. Riserve di rivalutazione 162.822 0 0 162.822
IV. Riserva legale 2.597.200 0 0 2.597.200
VI. Riserva per azioni proprie in portafoglio 15.447.311 0 0 15.447.311
VII. Altre riserve
- riserva straordinaria 13.462.636 0 0 13.462.636
- fondo ricerca applicata L.46/82 289.216 0 0 289.216
- riserva da fusione 2.577.442 0 0 2.577.442
- fondo L.696/83 produzione industriale 75.581 0 0 75.581
- riserva ex art. 13 DL 124/93 4.308 0 0 4.308
- versamento soci in c/capitale 100.000.000 0 0 100.000.000
- riserva da arrotondamento (6) 2 0 (4)
VIII. Utili (perdite) portati a nuovo (88.081.064) 0 (5.038.172) (93.119.236)
IX. Utile (perdita) dell'esercizio (5.038.172) 9.199.414 0 4.161.242

79Nota integrativa / Notes to the financial statements
Opening balance Increases Decreases Closing balance
Total 156,589 75,011 (49,457) 182,143
- accrued income 39,566 0 (39,117) 449
Insurance 34,809 0 (34,809) 0
Interest and other refunds 4,757 0 (4,308) 449
- prepaid expenses 117,023 75,011 (10,340) 181,694
Insurance 23,790 5,299 0 29,089
Maintenance fees 7,563 36,287 0 43,850
Services 54,084 33,425 0 87,509
Leasing instalments 28,059 0 (6,813) 21,246
Magazine subscriptions 488 0 (488) 0
Rentals 3,039 0 (3,039) 0
Opening balance Increases Decreases Closing balance
Total 100,194,631 9,199,416 (5,038,172) 104,355,875
I. Capital 58,697,357 0 0 58,697,357
III. Revaluation reserves 162,822 0 0 162,822
IV. Legal reserve 2,597,200 0 0 2,597,200
VI. Reserve for own shares in portfolio 15,447,311 0 0 15,447,311
VII. Other reserves
- extraordinary reserve 13,462,636 0 0 13,462,636
- applied research fund L. 46/82 289,216 0 0 289,216
- merger reserve 2,577,442 0 0 2,577,442
- fund L.696/83 industrial production 75,581 0 0 75,581
- reserve pursuant to art. 13 DL 124/93 4,308 0 0 4,308
- shareholder payments to capital 100,000,000 0 0 100,000,000
- rounding off reserve (6) 2 0 (4)
VIII. Profit (losses) carried forward (88,081,064) 0 (5,038,172) (93,119,236)
IX. Profit (loss) for the year (5,038,172) 9,199,414 0 4,161,242
4.2. Accrued income and prepaid expensesThe changes and breakdown of the single items are listed below:
Prepaid expenses for lease instalments refer to financial leasing agreements for tel-ephones.
4.3. Shareholders’ equity - categories of sharesThe changes and breakdown of the single items are listed below:
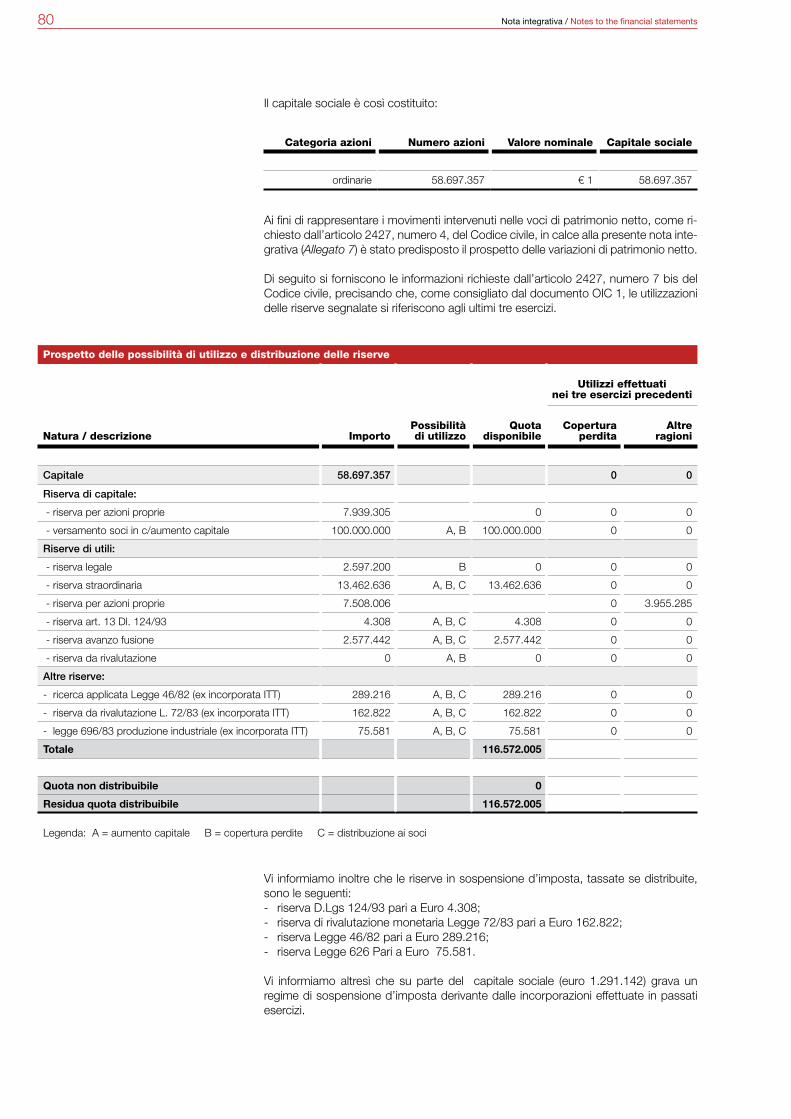
80 Nota integrativa / Notes to the financial statements
Il capitale sociale è così costituito:
Ai fini di rappresentare i movimenti intervenuti nelle voci di patrimonio netto, come ri-chiesto dall’articolo 2427, numero 4, del Codice civile, in calce alla presente nota inte-grativa (Allegato 7) è stato predisposto il prospetto delle variazioni di patrimonio netto.
Di seguito si forniscono le informazioni richieste dall’articolo 2427, numero 7 bis del Codice civile, precisando che, come consigliato dal documento OIC 1, le utilizzazioni delle riserve segnalate si riferiscono agli ultimi tre esercizi.
Vi informiamo inoltre che le riserve in sospensione d’imposta, tassate se distribuite, sono le seguenti:- riserva D.Lgs 124/93 pari a Euro 4.308;- riserva di rivalutazione monetaria Legge 72/83 pari a Euro 162.822;- riserva Legge 46/82 pari a Euro 289.216;- riserva Legge 626 Pari a Euro 75.581.
Vi informiamo altresì che su parte del capitale sociale (euro 1.291.142) grava un regime di sospensione d’imposta derivante dalle incorporazioni effettuate in passati esercizi.
Categoria azioni Numero azioni Valore nominale Capitale sociale
ordinarie 58.697.357 € 1 58.697.357
Prospetto delle possibilità di utilizzo e distribuzione delle riserve
Utilizzi effettuati nei tre esercizi precedenti
Natura / descrizione ImportoPossibilitàdi utilizzo
Quota disponibile
Coperturaperdita
Altre ragioni
Capitale 58.697.357 0 0
Riserva di capitale:
- riserva per azioni proprie 7.939.305 0 0 0
- versamento soci in c/aumento capitale 100.000.000 A, B 100.000.000 0 0
Riserve di utili:
- riserva legale 2.597.200 B 0 0 0
- riserva straordinaria 13.462.636 A, B, C 13.462.636 0 0
- riserva per azioni proprie 7.508.006 0 3.955.285
- riserva art. 13 Dl. 124/93 4.308 A, B, C 4.308 0 0
- riserva avanzo fusione 2.577.442 A, B, C 2.577.442 0 0
- riserva da rivalutazione 0 A, B 0 0 0
Altre riserve:
- ricerca applicata Legge 46/82 (ex incorporata ITT) 289.216 A, B, C 289.216 0 0
- riserva da rivalutazione L. 72/83 (ex incorporata ITT) 162.822 A, B, C 162.822 0 0
- legge 696/83 produzione industriale (ex incorporata ITT) 75.581 A, B, C 75.581 0 0
Totale 116.572.005
Quota non distribuibile 0
Residua quota distribuibile 116.572.005
Legenda: A = aumento capitale B = copertura perdite C = distribuzione ai soci
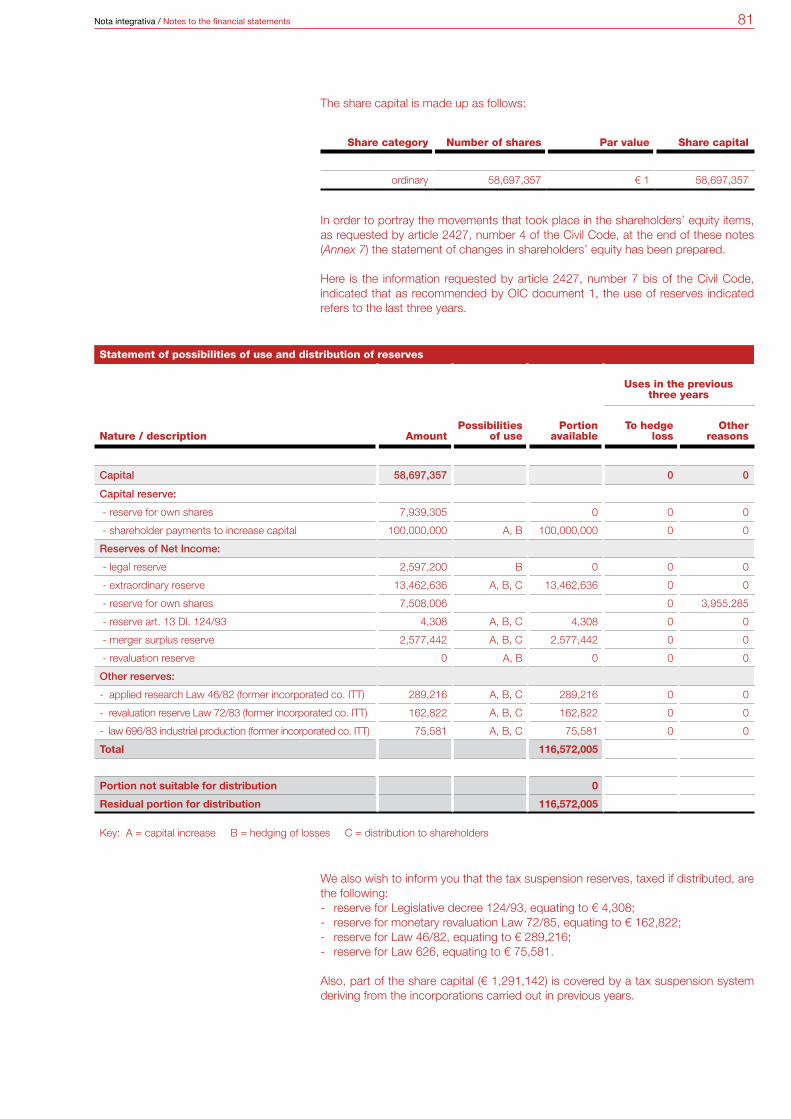
81Nota integrativa / Notes to the financial statements
Statement of possibilities of use and distribution of reserves
Uses in the previous three years
Nature / description AmountPossibilities
of usePortion
availableTo hedge
lossOther
reasons
Capital 58,697,357 0 0
Capital reserve:
- reserve for own shares 7,939,305 0 0 0
- shareholder payments to increase capital 100,000,000 A, B 100,000,000 0 0
Reserves of Net Income:
- legal reserve 2,597,200 B 0 0 0
- extraordinary reserve 13,462,636 A, B, C 13,462,636 0 0
- reserve for own shares 7,508,006 0 3,955,285
- reserve art. 13 Dl. 124/93 4,308 A, B, C 4,308 0 0
- merger surplus reserve 2,577,442 A, B, C 2,577,442 0 0
- revaluation reserve 0 A, B 0 0 0
Other reserves:
- applied research Law 46/82 (former incorporated co. ITT) 289,216 A, B, C 289,216 0 0
- revaluation reserve Law 72/83 (former incorporated co. ITT) 162,822 A, B, C 162,822 0 0
- law 696/83 industrial production (former incorporated co. ITT) 75,581 A, B, C 75,581 0 0
Total 116,572,005
Portion not suitable for distribution 0
Residual portion for distribution 116,572,005
Key: A = capital increase B = hedging of losses C = distribution to shareholders
The share capital is made up as follows:
In order to portray the movements that took place in the shareholders’ equity items, as requested by article 2427, number 4 of the Civil Code, at the end of these notes (Annex 7) the statement of changes in shareholders’ equity has been prepared.
Here is the information requested by article 2427, number 7 bis of the Civil Code, indicated that as recommended by OIC document 1, the use of reserves indicated refers to the last three years.
We also wish to inform you that the tax suspension reserves, taxed if distributed, are the following:- reserve for Legislative decree 124/93, equating to € 4,308;- reserve for monetary revaluation Law 72/85, equating to € 162,822;- reserve for Law 46/82, equating to € 289,216;- reserve for Law 626, equating to € 75,581.
Also, part of the share capital (€ 1,291,142) is covered by a tax suspension system deriving from the incorporations carried out in previous years.
Share category Number of shares Par value Share capital
ordinary 58,697,357 € 1 58,697,357
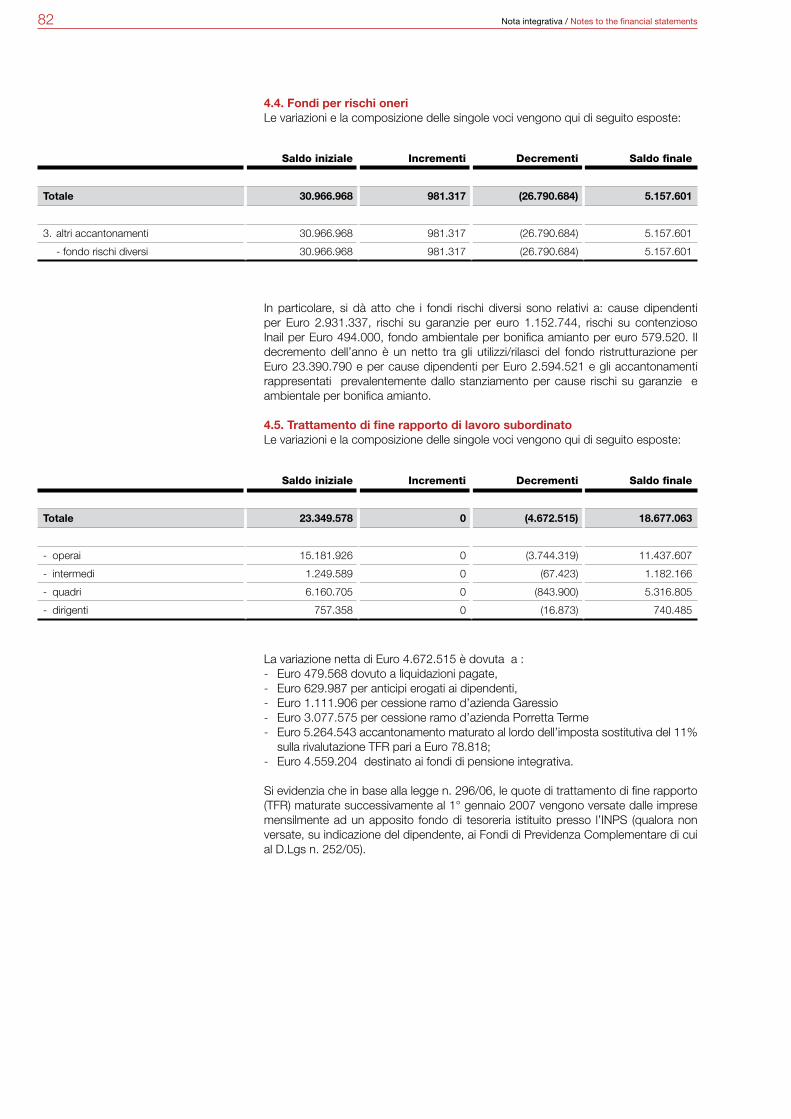
82 Nota integrativa / Notes to the financial statements
4.4. Fondi per rischi oneriLe variazioni e la composizione delle singole voci vengono qui di seguito esposte:
In particolare, si dà atto che i fondi rischi diversi sono relativi a: cause dipendenti per Euro 2.931.337, rischi su garanzie per euro 1.152.744, rischi su contenzioso Inail per Euro 494.000, fondo ambientale per bonifica amianto per euro 579.520. Il decremento dell’anno è un netto tra gli utilizzi/rilasci del fondo ristrutturazione per Euro 23.390.790 e per cause dipendenti per Euro 2.594.521 e gli accantonamenti rappresentati prevalentemente dallo stanziamento per cause rischi su garanzie e ambientale per bonifica amianto.
4.5. Trattamento di fine rapporto di lavoro subordinatoLe variazioni e la composizione delle singole voci vengono qui di seguito esposte:
La variazione netta di Euro 4.672.515 è dovuta a :- Euro 479.568 dovuto a liquidazioni pagate, - Euro 629.987 per anticipi erogati ai dipendenti, - Euro 1.111.906 per cessione ramo d’azienda Garessio- Euro 3.077.575 per cessione ramo d’azienda Porretta Terme- Euro 5.264.543 accantonamento maturato al lordo dell’imposta sostitutiva del 11%
sulla rivalutazione TFR pari a Euro 78.818;- Euro 4.559.204 destinato ai fondi di pensione integrativa.
Si evidenzia che in base alla legge n. 296/06, le quote di trattamento di fine rapporto (TFR) maturate successivamente al 1° gennaio 2007 vengono versate dalle imprese mensilmente ad un apposito fondo di tesoreria istituito presso l’INPS (qualora non versate, su indicazione del dipendente, ai Fondi di Previdenza Complementare di cui al D.Lgs n. 252/05).
Saldo iniziale Incrementi Decrementi Saldo finale
Totale 30.966.968 981.317 (26.790.684) 5.157.601
3. altri accantonamenti 30.966.968 981.317 (26.790.684) 5.157.601
- fondo rischi diversi 30.966.968 981.317 (26.790.684) 5.157.601
Saldo iniziale Incrementi Decrementi Saldo finale
Totale 23.349.578 0 (4.672.515) 18.677.063
- operai 15.181.926 0 (3.744.319) 11.437.607
- intermedi 1.249.589 0 (67.423) 1.182.166
- quadri 6.160.705 0 (843.900) 5.316.805
- dirigenti 757.358 0 (16.873) 740.485
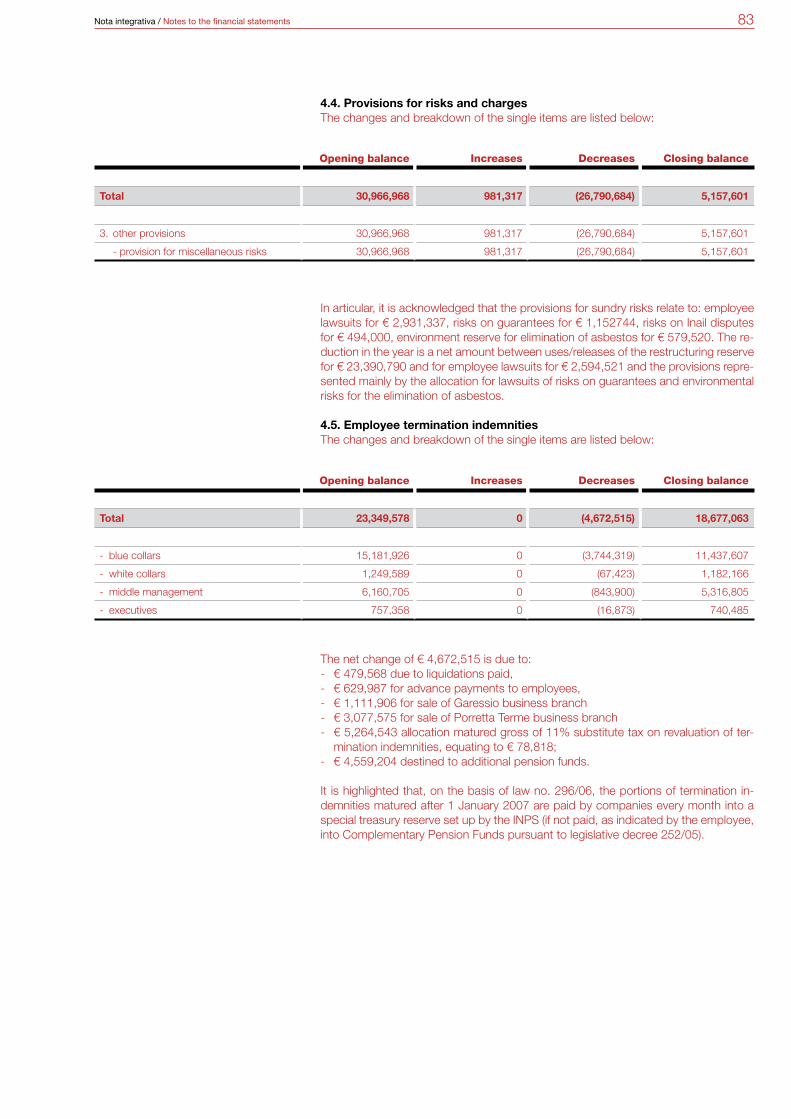
83Nota integrativa / Notes to the financial statements
Opening balance Increases Decreases Closing balance
Total 30,966,968 981,317 (26,790,684) 5,157,601
3. other provisions 30,966,968 981,317 (26,790,684) 5,157,601
- provision for miscellaneous risks 30,966,968 981,317 (26,790,684) 5,157,601
Opening balance Increases Decreases Closing balance
Total 23,349,578 0 (4,672,515) 18,677,063
- blue collars 15,181,926 0 (3,744,319) 11,437,607
- white collars 1,249,589 0 (67,423) 1,182,166
- middle management 6,160,705 0 (843,900) 5,316,805
- executives 757,358 0 (16,873) 740,485
4.4. Provisions for risks and charges The changes and breakdown of the single items are listed below:
In articular, it is acknowledged that the provisions for sundry risks relate to: employee lawsuits for € 2,931,337, risks on guarantees for € 1,152744, risks on Inail disputes for € 494,000, environment reserve for elimination of asbestos for € 579,520. The re-duction in the year is a net amount between uses/releases of the restructuring reserve for € 23,390,790 and for employee lawsuits for € 2,594,521 and the provisions repre-sented mainly by the allocation for lawsuits of risks on guarantees and environmental risks for the elimination of asbestos.
4.5. Employee termination indemnities The changes and breakdown of the single items are listed below:
The net change of € 4,672,515 is due to:- € 479,568 due to liquidations paid, - € 629,987 for advance payments to employees, - € 1,111,906 for sale of Garessio business branch - € 3,077,575 for sale of Porretta Terme business branch - € 5,264,543 allocation matured gross of 11% substitute tax on revaluation of ter-
mination indemnities, equating to € 78,818;- € 4,559,204 destined to additional pension funds.
It is highlighted that, on the basis of law no. 296/06, the portions of termination in-demnities matured after 1 January 2007 are paid by companies every month into a special treasury reserve set up by the INPS (if not paid, as indicated by the employee, into Complementary Pension Funds pursuant to legislative decree 252/05).
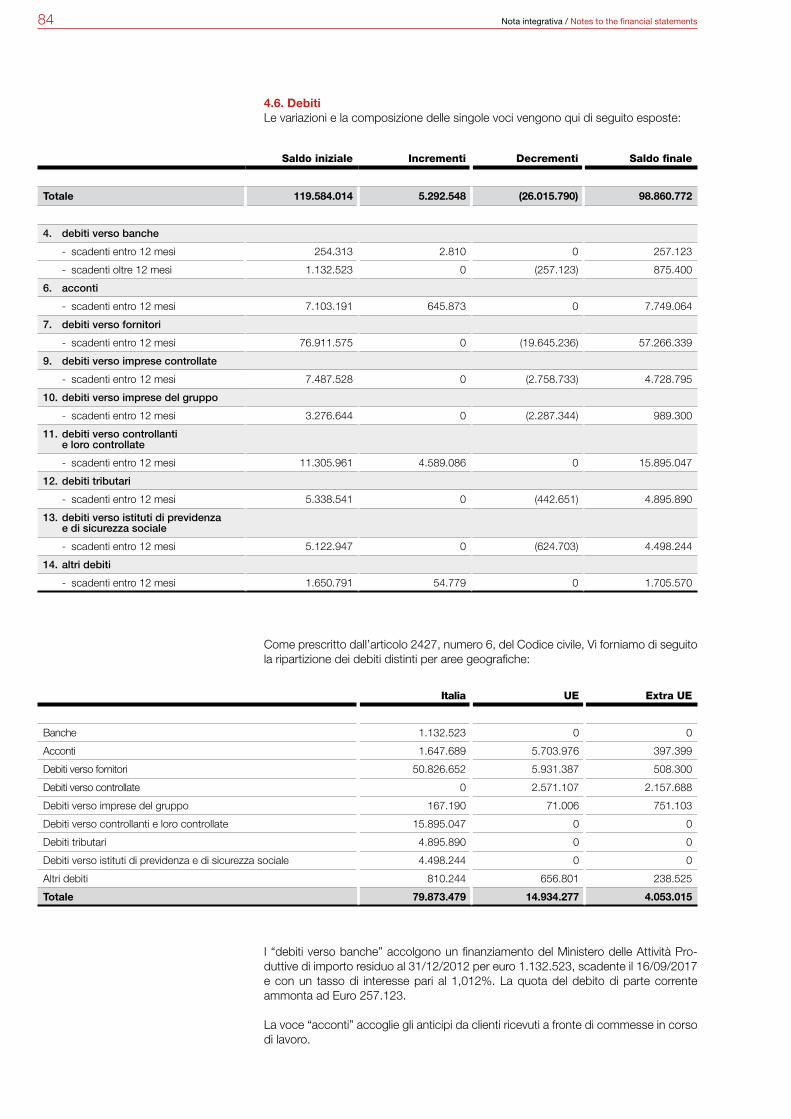
84 Nota integrativa / Notes to the financial statements
4.6. DebitiLe variazioni e la composizione delle singole voci vengono qui di seguito esposte:
Come prescritto dall’articolo 2427, numero 6, del Codice civile, Vi forniamo di seguito la ripartizione dei debiti distinti per aree geografiche:
I “debiti verso banche” accolgono un finanziamento del Ministero delle Attività Pro-duttive di importo residuo al 31/12/2012 per euro 1.132.523, scadente il 16/09/2017 e con un tasso di interesse pari al 1,012%. La quota del debito di parte corrente ammonta ad Euro 257.123.
La voce “acconti” accoglie gli anticipi da clienti ricevuti a fronte di commesse in corso di lavoro.
Saldo iniziale Incrementi Decrementi Saldo finale
Totale 119.584.014 5.292.548 (26.015.790) 98.860.772
4. debiti verso banche
- scadenti entro 12 mesi 254.313 2.810 0 257.123
- scadenti oltre 12 mesi 1.132.523 0 (257.123) 875.400
6. acconti
- scadenti entro 12 mesi 7.103.191 645.873 0 7.749.064
7. debiti verso fornitori
- scadenti entro 12 mesi 76.911.575 0 (19.645.236) 57.266.339
9. debiti verso imprese controllate
- scadenti entro 12 mesi 7.487.528 0 (2.758.733) 4.728.795
10. debiti verso imprese del gruppo
- scadenti entro 12 mesi 3.276.644 0 (2.287.344) 989.300
11. debiti verso controllanti e loro controllate
- scadenti entro 12 mesi 11.305.961 4.589.086 0 15.895.047
12. debiti tributari
- scadenti entro 12 mesi 5.338.541 0 (442.651) 4.895.890
13. debiti verso istituti di previdenza e di sicurezza sociale
- scadenti entro 12 mesi 5.122.947 0 (624.703) 4.498.244
14. altri debiti
- scadenti entro 12 mesi 1.650.791 54.779 0 1.705.570
Italia UE Extra UE
Banche 1.132.523 0 0
Acconti 1.647.689 5.703.976 397.399
Debiti verso fornitori 50.826.652 5.931.387 508.300
Debiti verso controllate 0 2.571.107 2.157.688
Debiti verso imprese del gruppo 167.190 71.006 751.103
Debiti verso controllanti e loro controllate 15.895.047 0 0
Debiti tributari 4.895.890 0 0
Debiti verso istituti di previdenza e di sicurezza sociale 4.498.244 0 0
Altri debiti 810.244 656.801 238.525
Totale 79.873.479 14.934.277 4.053.015

85Nota integrativa / Notes to the financial statements
Opening balance Increases Decreases Closing balance
Total 119,584,014 5,292,548 (26,015,790) 98,860,772
4. due to banks
- maturing within 12 months 254,313 2,810 0 257,123
- maturing after 12 months 1,132,523 0 (257,123) 875,400
6. advance payments
- maturing within 12 months 7,103,191 645,873 0 7,749,064
7. due to suppliers
- maturing within 12 months 76,911,575 0 (19,645,236) 57,266,339
9. due to subsidiaries
- maturing within 12 months 7,487,528 0 (2,758,733) 4,728,795
10. due to group companies
- maturing within 12 months 3,276,644 0 (2,287,344) 989,300
11. due to holding companies and their subsidiaries
- maturing within 12 months 11,305,961 4,589,086 0 15,895,047
12. due to the tax authorities
- maturing within 12 months 5,338,541 0 (442,651) 4,895,890
13. due to welfare and social security institutes
- maturing within 12 months 5,122,947 0 (624,703) 4,498,244
14. other amounts due
- maturing within 12 months 1,650,791 54,779 0 1,705,570
Italy UE Non-EU
Banks 1,132,523 0 0
Advance payments 1,647,689 5,703,976 397,399
Due to suppliers 50,826,652 5,931,387 508,300
Due to subsidiaries 0 2,571,107 2,157,688
Due to group companies 167,190 71,006 751,103
Due to holding companies and their subsidiaries 15,895,047 0 0
Due to the tax authorities 4,895,890 0 0
Due to welfare and social security institutes 4,498,244 0 0
Other payables 810,244 656,801 238,525
Total 79,873,479 14,934,277 4,053,015
4.6. PayablesThe changes and breakdown of the single items are listed below:
As indicated by article 2427, number 6 of the Civil Code, we are able to supply the following breakdown of payables by geographic area:
Amounts “due to banks” comprise a loan of the Ministry of Manufacturing Activities for a residual amount at 31/12/2012 of € 1,132,523, expiring on 16/09/2017 and with an interest rate of 1.012%. The current part of the debt amounts to € 252,123.
The “advance payments” item comprises prepayments received from customers for job orders in progress.
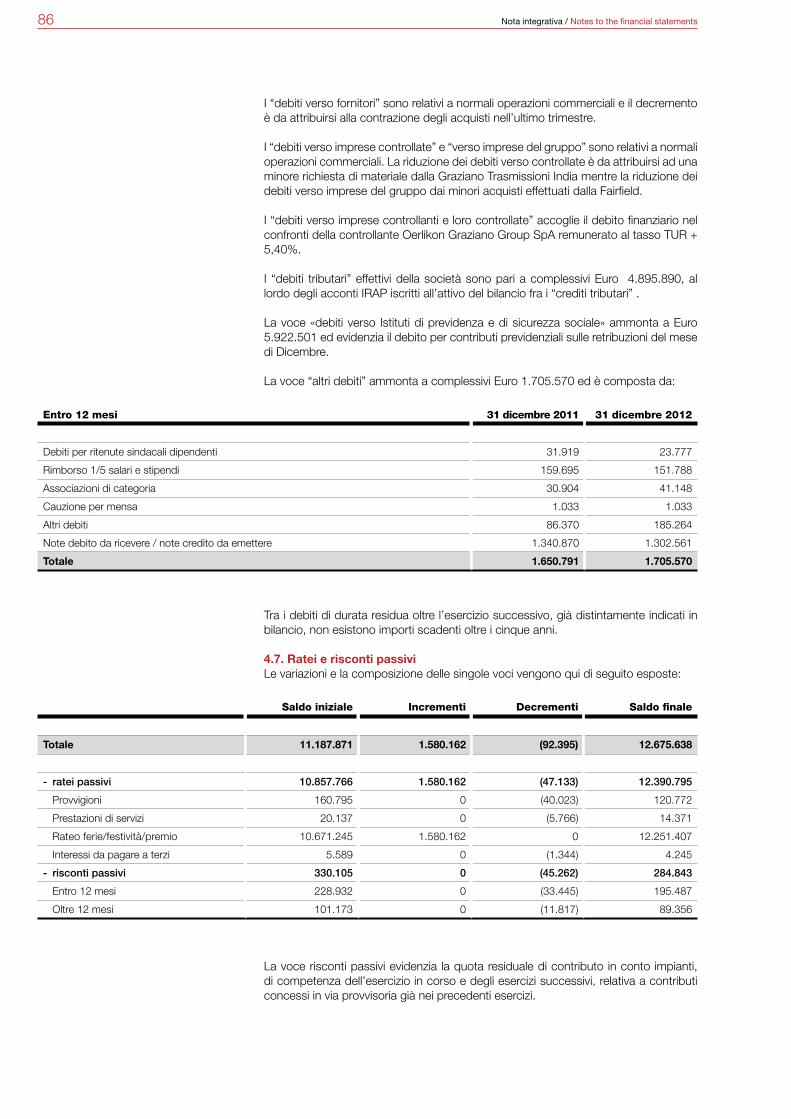
86 Nota integrativa / Notes to the financial statements
I “debiti verso fornitori” sono relativi a normali operazioni commerciali e il decremento è da attribuirsi alla contrazione degli acquisti nell’ultimo trimestre.
I “debiti verso imprese controllate” e “verso imprese del gruppo” sono relativi a normali operazioni commerciali. La riduzione dei debiti verso controllate è da attribuirsi ad una minore richiesta di materiale dalla Graziano Trasmissioni India mentre la riduzione dei debiti verso imprese del gruppo dai minori acquisti effettuati dalla Fairfield.
I “debiti verso imprese controllanti e loro controllate” accoglie il debito finanziario nel confronti della controllante Oerlikon Graziano Group SpA remunerato al tasso TUR + 5,40%.
I “debiti tributari” effettivi della società sono pari a complessivi Euro 4.895.890, al lordo degli acconti IRAP iscritti all’attivo del bilancio fra i “crediti tributari” .
La voce «debiti verso Istituti di previdenza e di sicurezza sociale» ammonta a Euro 5.922.501 ed evidenzia il debito per contributi previdenziali sulle retribuzioni del mese di Dicembre.
La voce “altri debiti” ammonta a complessivi Euro 1.705.570 ed è composta da:
Tra i debiti di durata residua oltre l’esercizio successivo, già distintamente indicati in bilancio, non esistono importi scadenti oltre i cinque anni.
4.7. Ratei e risconti passiviLe variazioni e la composizione delle singole voci vengono qui di seguito esposte:
La voce risconti passivi evidenzia la quota residuale di contributo in conto impianti, di competenza dell’esercizio in corso e degli esercizi successivi, relativa a contributi concessi in via provvisoria già nei precedenti esercizi.
Entro 12 mesi 31 dicembre 2011 31 dicembre 2012
Debiti per ritenute sindacali dipendenti 31.919 23.777
Rimborso 1/5 salari e stipendi 159.695 151.788
Associazioni di categoria 30.904 41.148
Cauzione per mensa 1.033 1.033
Altri debiti 86.370 185.264
Note debito da ricevere / note credito da emettere 1.340.870 1.302.561
Totale 1.650.791 1.705.570
Saldo iniziale Incrementi Decrementi Saldo finale
Totale 11.187.871 1.580.162 (92.395) 12.675.638
- ratei passivi 10.857.766 1.580.162 (47.133) 12.390.795
Provvigioni 160.795 0 (40.023) 120.772
Prestazioni di servizi 20.137 0 (5.766) 14.371
Rateo ferie/festività/premio 10.671.245 1.580.162 0 12.251.407
Interessi da pagare a terzi 5.589 0 (1.344) 4.245
- risconti passivi 330.105 0 (45.262) 284.843
Entro 12 mesi 228.932 0 (33.445) 195.487
Oltre 12 mesi 101.173 0 (11.817) 89.356

87Nota integrativa / Notes to the financial statements
Within 12 months 31 December 2011 31 December 2012
Payable for employee trade union withholdings 31,919 23,777
Refund of 1/5 of wages and salaries 159,695 151,788
Trade associations 30,904 41,148
Canteen deposit 1,033 1,033
Other payables 86,370 185,264
Debt notes receivable/credit notes to issue 1,340,870 1,302,561
Total 1,650,791 1,705,570
Opening balance Increases Decreases Closing balance
Total 11,187,871 1,580,162 (92,395) 12,675,638
- accrued liabilities 10,857,766 1,580,162 (47,133) 12,390,795
Commissions 160,795 0 (40,023) 120,772
Performance of services 20,137 0 (5,766) 14,371
Accrued holidays/bonus 10,671,245 1,580,162 0 12,251,407
Interest payable to third parties 5,589 0 (1,344) 4,245
- deferred income 330,105 0 (45,262) 284,843
Within 12 months 228,932 0 (33,445) 195,487
After 12 months 101,173 0 (11,817) 89,356
Amounts “due to suppliers” are related to standard commercial operations and the reduction can be attributed to the contraction of purchases in the last quarter.
Amounts “due to subsidiaries” and “due to group companies” are related to standard commercial operations. The reduction of amounts payable to subsidiaries can be at-tributed to the lower demand for material by Graziano Trasmissioni India, while the re-duction of amounts payable to group companies can be attributed to less purchases made by Fairfield.
Amounts “due to holding companies and their subsidiaries” comprises the financial payable to the holding company Oerlikon Graziano Group SpA, remunerated at the TUR rate + 5.40%.
The company’s “Tax debts” amount to a total of € 4,895,890 gross of IRAP advances booked to the balance sheet assets among “tax credits”.
Amounts “due to welfare and social security institutes” total € 5,922,501 and highlight the debt for welfare contributions on retributions for December.
The “other payables” items amounts to a total of € 1,705,570 and consists of:
Payables with a residual duration after the following year, already separately indicated in the financial statements, do not include amounts maturing after five years.
4.7. Accrued expenses and deferred incomeThe changes and breakdown of the single items are listed below:
Deferred income highlights the residual portion of contribution to the systems ac-count, accrued to the current an subsequent years, relating to contributions granted temporarily in previous years.
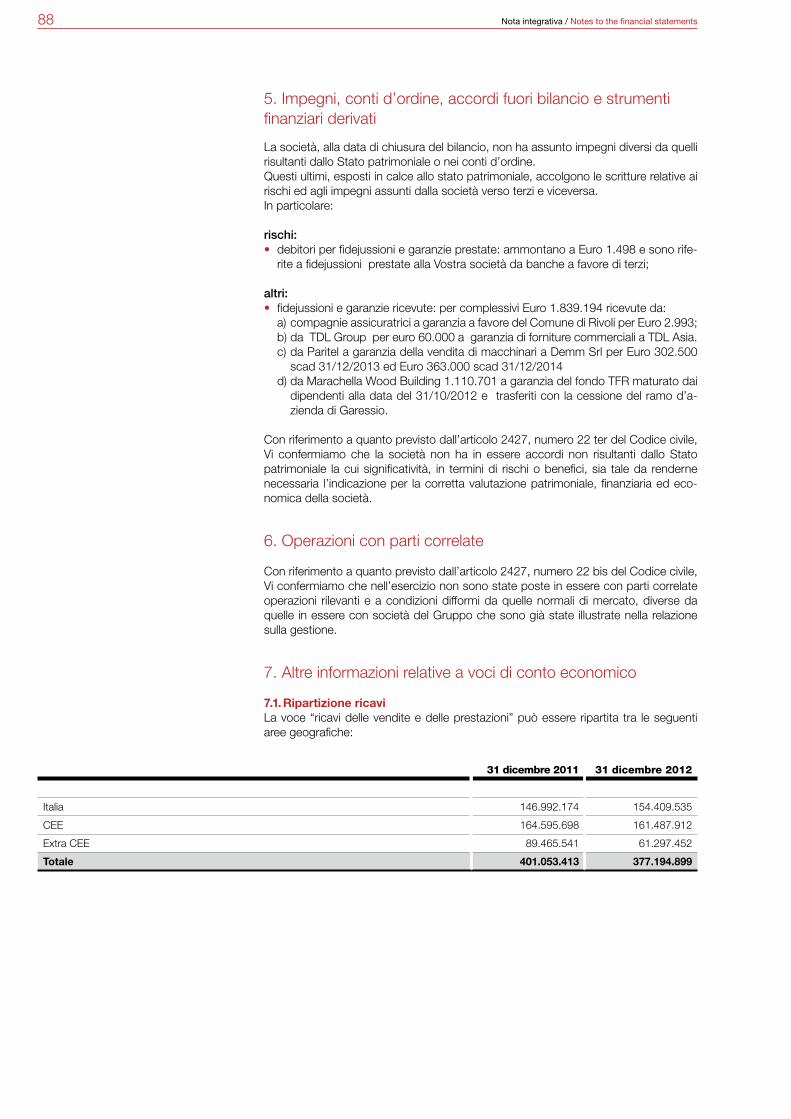
88 Nota integrativa / Notes to the financial statements
5. Impegni, conti d’ordine, accordi fuori bilancio e strumenti finanziari derivati
La società, alla data di chiusura del bilancio, non ha assunto impegni diversi da quelli risultanti dallo Stato patrimoniale o nei conti d’ordine. Questi ultimi, esposti in calce allo stato patrimoniale, accolgono le scritture relative ai rischi ed agli impegni assunti dalla società verso terzi e viceversa. In particolare:
rischi:• debitori per fidejussioni e garanzie prestate: ammontano a Euro 1.498 e sono rife-
rite a fidejussioni prestate alla Vostra società da banche a favore di terzi;
altri:• fidejussioni e garanzie ricevute: per complessivi Euro 1.839.194 ricevute da:
a) compagnie assicuratrici a garanzia a favore del Comune di Rivoli per Euro 2.993;b) da TDL Group per euro 60.000 a garanzia di forniture commerciali a TDL Asia.c) da Paritel a garanzia della vendita di macchinari a Demm Srl per Euro 302.500
scad 31/12/2013 ed Euro 363.000 scad 31/12/2014d) da Marachella Wood Building 1.110.701 a garanzia del fondo TFR maturato dai
dipendenti alla data del 31/10/2012 e trasferiti con la cessione del ramo d’a-zienda di Garessio.
Con riferimento a quanto previsto dall’articolo 2427, numero 22 ter del Codice civile, Vi confermiamo che la società non ha in essere accordi non risultanti dallo Stato patrimoniale la cui significatività, in termini di rischi o benefici, sia tale da renderne necessaria l’indicazione per la corretta valutazione patrimoniale, finanziaria ed eco-nomica della società.
6. Operazioni con parti correlate
Con riferimento a quanto previsto dall’articolo 2427, numero 22 bis del Codice civile, Vi confermiamo che nell’esercizio non sono state poste in essere con parti correlate operazioni rilevanti e a condizioni difformi da quelle normali di mercato, diverse da quelle in essere con società del Gruppo che sono già state illustrate nella relazione sulla gestione.
7. Altre informazioni relative a voci di conto economico
7.1. Ripartizione ricaviLa voce “ricavi delle vendite e delle prestazioni” può essere ripartita tra le seguenti aree geografiche:
31 dicembre 2011 31 dicembre 2012
Italia 146.992.174 154.409.535
CEE 164.595.698 161.487.912
Extra CEE 89.465.541 61.297.452
Totale 401.053.413 377.194.899
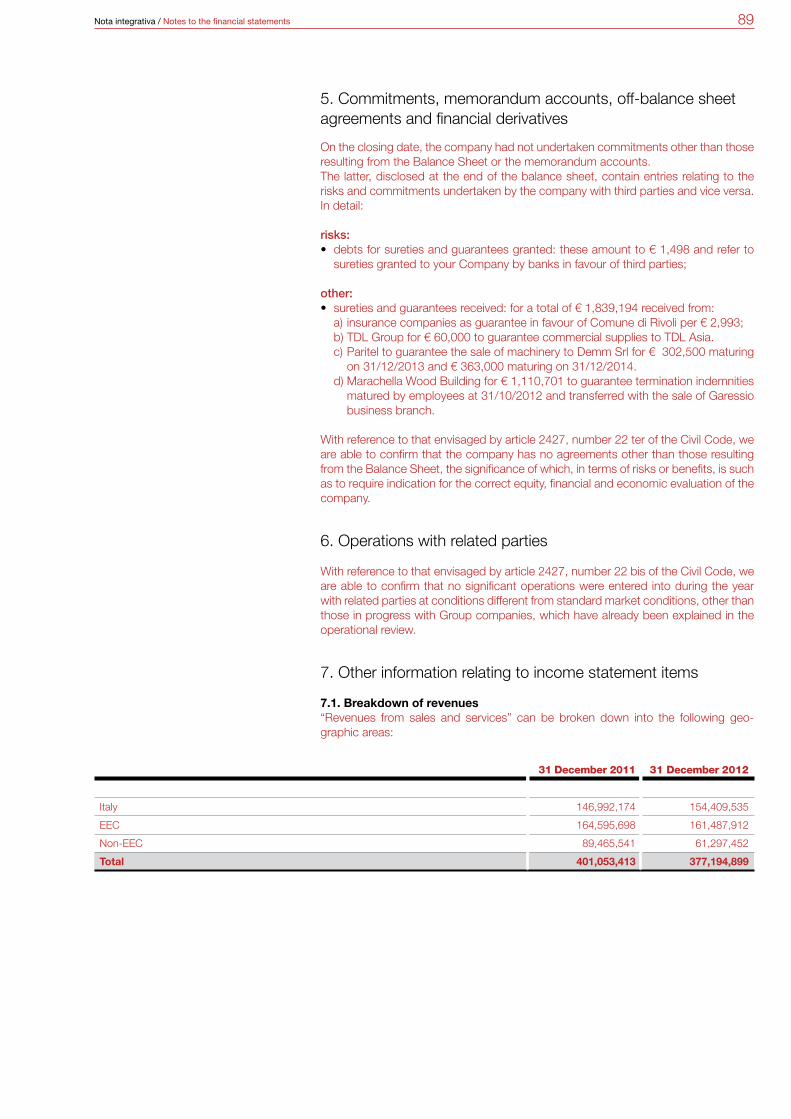
89Nota integrativa / Notes to the financial statements
31 December 2011 31 December 2012
Italy 146,992,174 154,409,535
EEC 164,595,698 161,487,912
Non-EEC 89,465,541 61,297,452
Total 401,053,413 377,194,899
5. Commitments, memorandum accounts, off-balance sheet agreements and financial derivatives
On the closing date, the company had not undertaken commitments other than those resulting from the Balance Sheet or the memorandum accounts. The latter, disclosed at the end of the balance sheet, contain entries relating to the risks and commitments undertaken by the company with third parties and vice versa. In detail:
risks:• debts for sureties and guarantees granted: these amount to € 1,498 and refer to
sureties granted to your Company by banks in favour of third parties;
other:• sureties and guarantees received: for a total of € 1,839,194 received from:
a) insurance companies as guarantee in favour of Comune di Rivoli per € 2,993;b) TDL Group for € 60,000 to guarantee commercial supplies to TDL Asia.c) Paritel to guarantee the sale of machinery to Demm Srl for € 302,500 maturing
on 31/12/2013 and € 363,000 maturing on 31/12/2014.d) Marachella Wood Building for € 1,110,701 to guarantee termination indemnities
matured by employees at 31/10/2012 and transferred with the sale of Garessio business branch.
With reference to that envisaged by article 2427, number 22 ter of the Civil Code, we are able to confirm that the company has no agreements other than those resulting from the Balance Sheet, the significance of which, in terms of risks or benefits, is such as to require indication for the correct equity, financial and economic evaluation of the company.
6. Operations with related parties
With reference to that envisaged by article 2427, number 22 bis of the Civil Code, we are able to confirm that no significant operations were entered into during the year with related parties at conditions different from standard market conditions, other than those in progress with Group companies, which have already been explained in the operational review.
7. Other information relating to income statement items
7.1. Breakdown of revenues“Revenues from sales and services” can be broken down into the following geo-graphic areas:
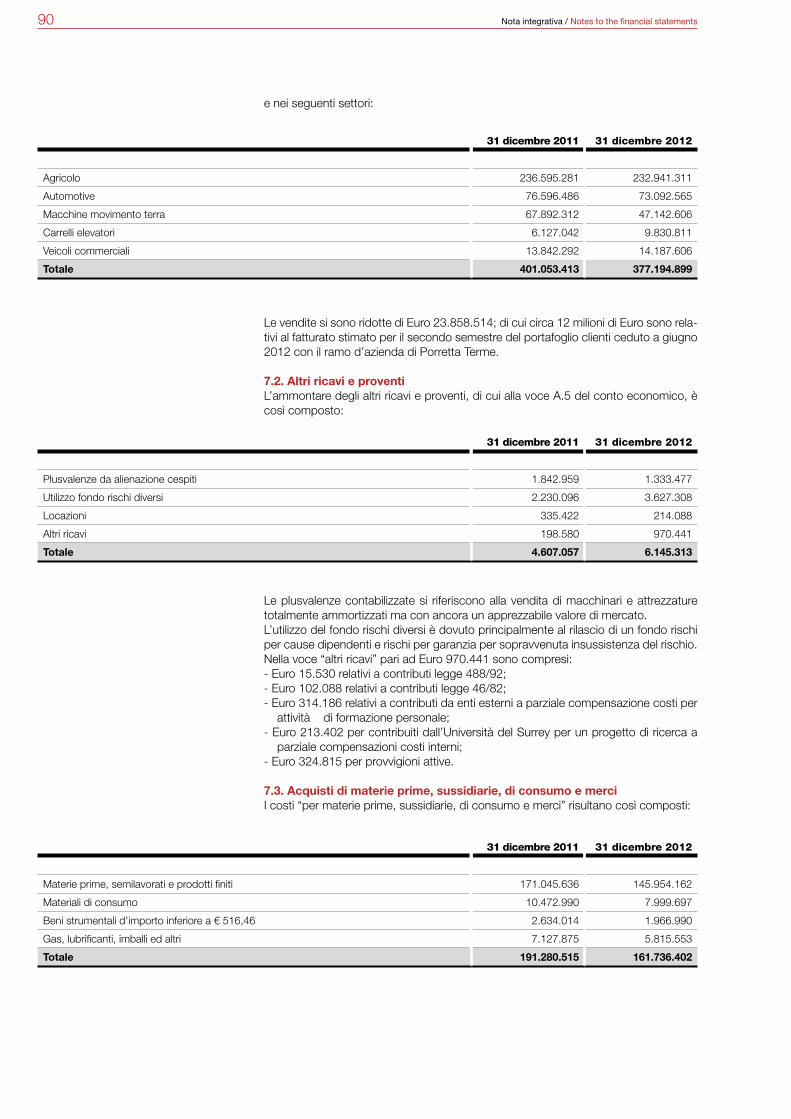
90 Nota integrativa / Notes to the financial statements
e nei seguenti settori:
Le vendite si sono ridotte di Euro 23.858.514; di cui circa 12 milioni di Euro sono rela-tivi al fatturato stimato per il secondo semestre del portafoglio clienti ceduto a giugno 2012 con il ramo d’azienda di Porretta Terme.
7.2. Altri ricavi e proventiL’ammontare degli altri ricavi e proventi, di cui alla voce A.5 del conto economico, è così composto:
Le plusvalenze contabilizzate si riferiscono alla vendita di macchinari e attrezzature totalmente ammortizzati ma con ancora un apprezzabile valore di mercato. L’utilizzo del fondo rischi diversi è dovuto principalmente al rilascio di un fondo rischi per cause dipendenti e rischi per garanzia per sopravvenuta insussistenza del rischio.Nella voce “altri ricavi” pari ad Euro 970.441 sono compresi:- Euro 15.530 relativi a contributi legge 488/92;- Euro 102.088 relativi a contributi legge 46/82;- Euro 314.186 relativi a contributi da enti esterni a parziale compensazione costi per
attività di formazione personale;- Euro 213.402 per contribuiti dall’Università del Surrey per un progetto di ricerca a
parziale compensazioni costi interni;- Euro 324.815 per provvigioni attive.
7.3. Acquisti di materie prime, sussidiarie, di consumo e merciI costi “per materie prime, sussidiarie, di consumo e merci” risultano così composti:
31 dicembre 2011 31 dicembre 2012
Agricolo 236.595.281 232.941.311
Automotive 76.596.486 73.092.565
Macchine movimento terra 67.892.312 47.142.606
Carrelli elevatori 6.127.042 9.830.811
Veicoli commerciali 13.842.292 14.187.606
Totale 401.053.413 377.194.899
31 dicembre 2011 31 dicembre 2012
Plusvalenze da alienazione cespiti 1.842.959 1.333.477
Utilizzo fondo rischi diversi 2.230.096 3.627.308
Locazioni 335.422 214.088
Altri ricavi 198.580 970.441
Totale 4.607.057 6.145.313
31 dicembre 2011 31 dicembre 2012
Materie prime, semilavorati e prodotti finiti 171.045.636 145.954.162
Materiali di consumo 10.472.990 7.999.697
Beni strumentali d'importo inferiore a € 516,46 2.634.014 1.966.990
Gas, lubrificanti, imballi ed altri 7.127.875 5.815.553
Totale 191.280.515 161.736.402
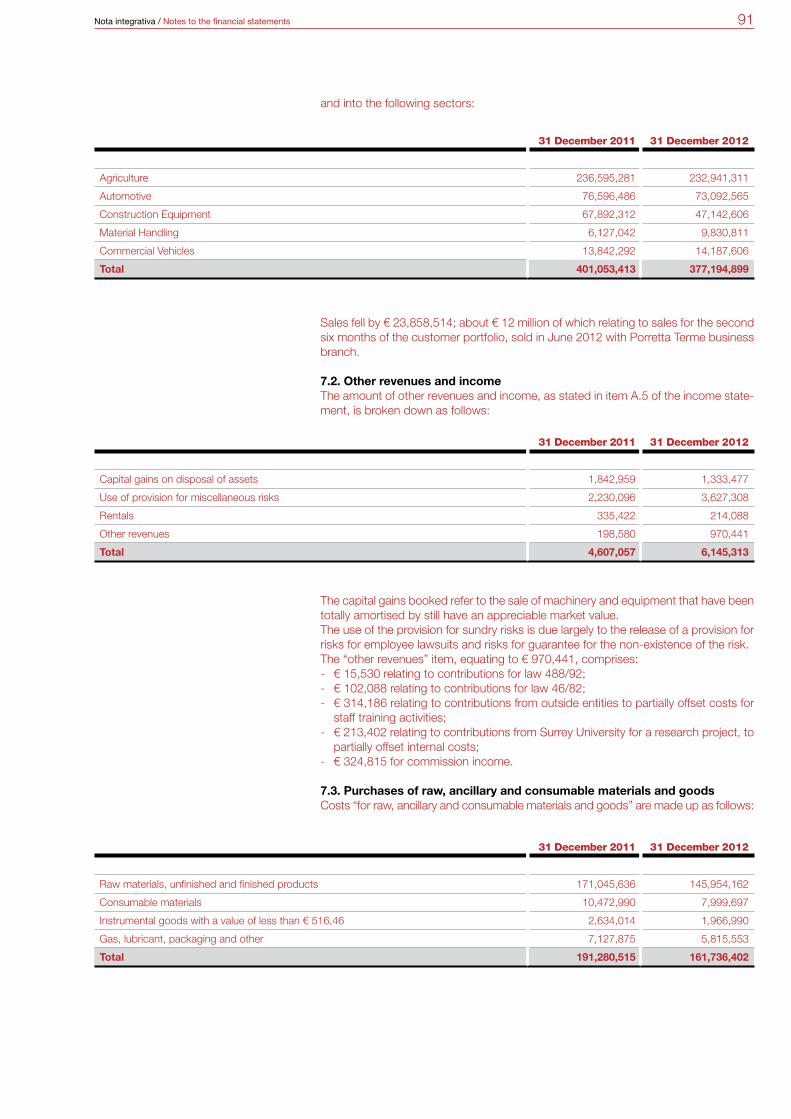
91Nota integrativa / Notes to the financial statements
31 December 2011 31 December 2012
Agriculture 236,595,281 232,941,311
Automotive 76,596,486 73,092,565
Construction Equipment 67,892,312 47,142,606
Material Handling 6,127,042 9,830,811
Commercial Vehicles 13,842,292 14,187,606
Total 401,053,413 377,194,899
31 December 2011 31 December 2012
Capital gains on disposal of assets 1,842,959 1,333,477
Use of provision for miscellaneous risks 2,230,096 3,627,308
Rentals 335,422 214,088
Other revenues 198,580 970,441
Total 4,607,057 6,145,313
31 December 2011 31 December 2012
Raw materials, unfinished and finished products 171,045,636 145,954,162
Consumable materials 10,472,990 7,999,697
Instrumental goods with a value of less than € 516,46 2,634,014 1,966,990
Gas, lubricant, packaging and other 7,127,875 5,815,553
Total 191,280,515 161,736,402
and into the following sectors:
Sales fell by € 23,858,514; about € 12 million of which relating to sales for the second six months of the customer portfolio, sold in June 2012 with Porretta Terme business branch.
7.2. Other revenues and incomeThe amount of other revenues and income, as stated in item A.5 of the income state-ment, is broken down as follows:
The capital gains booked refer to the sale of machinery and equipment that have been totally amortised by still have an appreciable market value. The use of the provision for sundry risks is due largely to the release of a provision for risks for employee lawsuits and risks for guarantee for the non-existence of the risk.The “other revenues” item, equating to € 970,441, comprises:- € 15,530 relating to contributions for law 488/92;- € 102,088 relating to contributions for law 46/82;- € 314,186 relating to contributions from outside entities to partially offset costs for
staff training activities; - € 213,402 relating to contributions from Surrey University for a research project, to
partially offset internal costs;- € 324,815 for commission income.
7.3. Purchases of raw, ancillary and consumable materials and goodsCosts “for raw, ancillary and consumable materials and goods” are made up as follows:
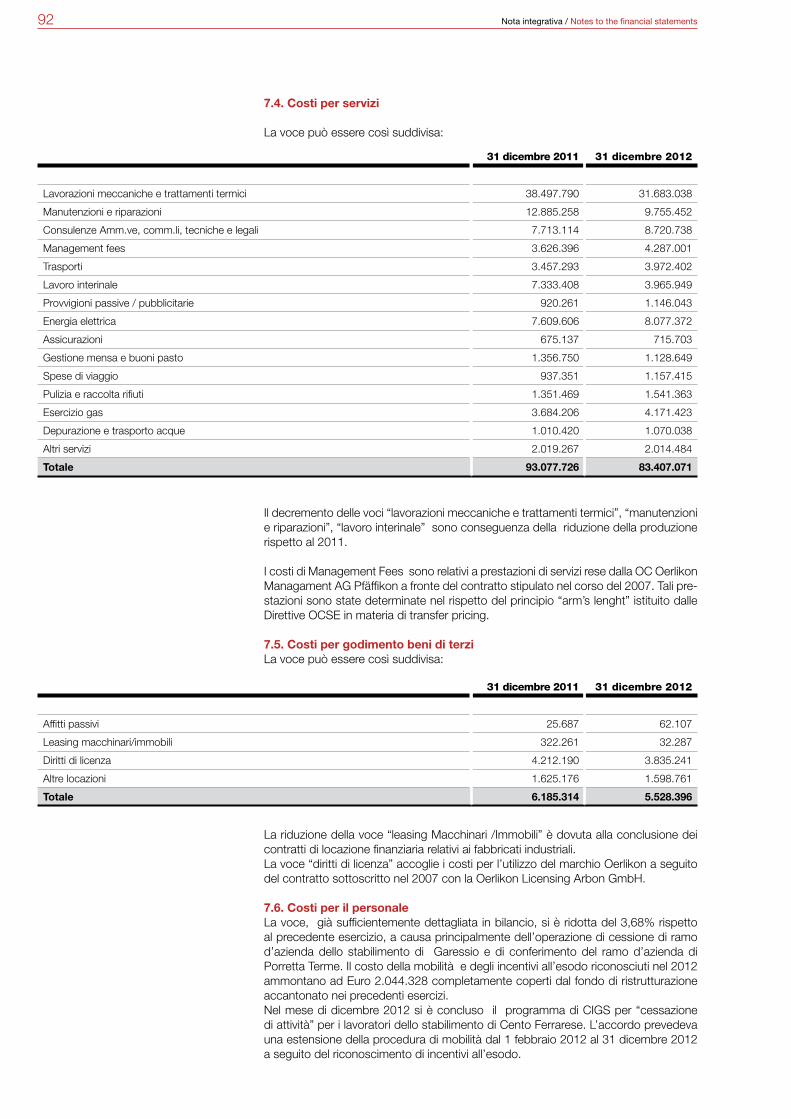
92 Nota integrativa / Notes to the financial statements
7.4. Costi per servizi
La voce può essere così suddivisa:
Il decremento delle voci “lavorazioni meccaniche e trattamenti termici”, “manutenzioni e riparazioni”, “lavoro interinale” sono conseguenza della riduzione della produzione rispetto al 2011.
I costi di Management Fees sono relativi a prestazioni di servizi rese dalla OC Oerlikon Managament AG Pfäffikon a fronte del contratto stipulato nel corso del 2007. Tali pre-stazioni sono state determinate nel rispetto del principio “arm’s lenght” istituito dalle Direttive OCSE in materia di transfer pricing.
7.5. Costi per godimento beni di terziLa voce può essere così suddivisa:
La riduzione della voce “leasing Macchinari /Immobili” è dovuta alla conclusione dei contratti di locazione finanziaria relativi ai fabbricati industriali. La voce “diritti di licenza” accoglie i costi per l’utilizzo del marchio Oerlikon a seguito del contratto sottoscritto nel 2007 con la Oerlikon Licensing Arbon GmbH.
7.6. Costi per il personaleLa voce, già sufficientemente dettagliata in bilancio, si è ridotta del 3,68% rispetto al precedente esercizio, a causa principalmente dell’operazione di cessione di ramo d’azienda dello stabilimento di Garessio e di conferimento del ramo d’azienda di Porretta Terme. Il costo della mobilità e degli incentivi all’esodo riconosciuti nel 2012 ammontano ad Euro 2.044.328 completamente coperti dal fondo di ristrutturazione accantonato nei precedenti esercizi.Nel mese di dicembre 2012 si è concluso il programma di CIGS per “cessazione di attività” per i lavoratori dello stabilimento di Cento Ferrarese. L’accordo prevedeva una estensione della procedura di mobilità dal 1 febbraio 2012 al 31 dicembre 2012 a seguito del riconoscimento di incentivi all’esodo.
31 dicembre 2011 31 dicembre 2012
Lavorazioni meccaniche e trattamenti termici 38.497.790 31.683.038
Manutenzioni e riparazioni 12.885.258 9.755.452
Consulenze Amm.ve, comm.li, tecniche e legali 7.713.114 8.720.738
Management fees 3.626.396 4.287.001
Trasporti 3.457.293 3.972.402
Lavoro interinale 7.333.408 3.965.949
Provvigioni passive / pubblicitarie 920.261 1.146.043
Energia elettrica 7.609.606 8.077.372
Assicurazioni 675.137 715.703
Gestione mensa e buoni pasto 1.356.750 1.128.649
Spese di viaggio 937.351 1.157.415
Pulizia e raccolta rifiuti 1.351.469 1.541.363
Esercizio gas 3.684.206 4.171.423
Depurazione e trasporto acque 1.010.420 1.070.038
Altri servizi 2.019.267 2.014.484
Totale 93.077.726 83.407.071
31 dicembre 2011 31 dicembre 2012
Affitti passivi 25.687 62.107
Leasing macchinari/immobili 322.261 32.287
Diritti di licenza 4.212.190 3.835.241
Altre locazioni 1.625.176 1.598.761
Totale 6.185.314 5.528.396

93Nota integrativa / Notes to the financial statements
31 December 2011 31 December 2012
Mechanical processes and heat treatments 38,497,790 31,683,038
Maintenance and repairs 12,885,258 9,755,452
Admin., commercial, technical and legal advice 7,713,114 8,720,738
Management fees 3,626,396 4,287,001
Transport 3,457,293 3,972,402
Temping 7,333,408 3,965,949
Commission expense / advertising 920,261 1,146,043
Electricity 7,609,606 8,077,372
Insurance 675,137 715,703
Canteen management and meal coupons 1,356,750 1,128,649
Travelling expenses 937,351 1,157,415
Cleaning and waste collection 1,351,469 1,541,363
Gas 3,684,206 4,171,423
Purification and transport of water 1,010,420 1,070,038
Other services 2,019,267 2,014,484
Total 93,077,726 83,407,071
31 December 2011 31 December 2012
Rent payable 25,687 62,107
Machinery/property leases 322,261 32,287
Licensing rights 4,212,190 3,835,241
Other rentals 1,625,176 1,598,761
Total 6,185,314 5,528,396
7.4. Costs for services
The item can be broken down as follows:
The reduction in the “mechanical processes and heat treatments”, “maintenance and repairs” and “temping” items are the consequence of the reduction in production compared to 2011.
Costs of Management Fees are related to the performance of services by OC Oerlikon Managament AG Pfäffikon in relation to the agreement entered into in 2007. These services are determined in observance of the “arm’s length” proposal set up by the OECD Directive of transfer pricing.
7.5. Costs for use of third-party goodsThe item can be broken down as follows:
The reduction of the “Machinery/property leases“ item is due to the termination of financial lease agreements relating to the industrial buildings. The “license rights” items comprises costs for use of the Oerlikon brand following the agreement signed in 2007 with Oerlikon Licensing Arbon GmbH.
7.6. Personnel costsThis item, which has already been explained in detail in the financial statements, was reduced by 3.68% compared to the previous year, due mainly to the sale of Gares-sio plant and the transferral of Porretta Terme business branch. The cost of mobility and staff leaving incentives recognised in 2012 amounts to € 2,044,328, completely hedged by the provision for restructuring allocated in previous years.In December 2012 the CIGS programme for “termination of activity” was completed for the employees of Cento Ferrarese plant. The agreement envisaged an extension of the mobility procedure from 1 February 2012 to 31 December 2012 following recogni-tion of the leaving incentives.

94 Nota integrativa / Notes to the financial statements
7.7. Oneri diversi di gestioneGli “oneri diversi di gestione” sono così composti:
La voce “altri costi minori” include costi per imposte e tasse diverse, associazioni di categoria e spese promozionali.
7.8. Proventi e oneri finanziariLa voce è così composta:
La voce “Proventi da partecipazioni in imprese controllate” è relativa a dividendi ri-cevuti dalle controllate Vocis Driveline Controls Ltd e Graziano Trasmissioni UK Ltd.
La voce altri proventi da Terzi accoglie prevalentemente gli interessi attivi su dilazioni di pagamento concesse a clienti.
7.9. Suddivisione degli interessi ed altri oneri finanziariGli interessi passivi e gli altri oneri finanziari di competenza dell’esercizio risultano pari a Euro 1.365.990 e sono stati interamente imputati al conto economico.
L’importo degli interessi verso terzi indicato alla voce 17 del Conto Economico è così suddiviso:
La riduzione degli interessi passivi di factoring è dovuta principalmente al minor ri-corso ad operazioni di cessione pro-soluto di crediti commerciali, mentre la riduzione degli interessi su mutui e finanziamenti è dovuta alla riduzione del debito residuo. Si è ricorso al pagamento rateale dei contributi INAIL.
31 dicembre 2011 31 dicembre 2012
Perdite su crediti 0 0
Minusvalenze da alienazione cespiti 1.047.702 233.114
Altri costi minori 1.216.118 1.270.005
Totale 2.263.820 1.503.119
31 dicembre 2011 31 dicembre 2012
Proventi da partecipazione
- in imprese controllate 581.961 585.644
Altri proventi
- da terzi 19.901 47.856
Totale 601.862 633.501
31 dicembre 2011 31 dicembre 2012
Interessi passivi bancari a breve 23.633 3.600
Interessi di factoring 50.478 424
Interessi passivi su mutui/finanziamenti 24.252 12.465
Interessi verso terzi 1.465 6
Interessi passivi per rateizzazione imp. sostitutiva 0 0
Interessi passivi per rateizzazione pagamento INAIL e IRAP 12.090 22.555
Differenze cambio 0 69.460
Spese bancarie ed altri oneri finanziari 1.596 54.886
Totale 113.514 163.396

95Nota integrativa / Notes to the financial statements
31 December 2011 31 December 2012
Losses on receivables 0 0
Capital losses on disposal of assets 1,047,702 233,114
Other minor costs 1,216,118 1,270,005
Total 2,263,820 1,503,119
31 December 2011 31 December 2012
Income from equity investment
- in subsidiaries 581,961 585,644
Other income
- from third parties 19,901 47,856
Total 601,862 633,501
31 December 2011 31 December 2012
Short-term bank interest expense 23,633 3,600
Factoring interest 50,478 424
Interest expense on mortgages/loans 24,252 12,465
Interest payable to third parties 1,465 6
Interest expense for instalments of subsitute tax 0 0
Interest expense for instalments of INAIL and IRAP 12,090 22,555
Exchange rate differences 0 69,460
Bank charges and other financial expense 1,596 54,886
Total 113,514 163,396
7.7. Sundry operating costs“Sundry operating costs” consist of the following:
“Other minor costs” include costs for sundry taxes, trade associations and promo-tional expenses.
7.8. Financial income and expensesThe item is composed as follows:
“Income from equity investments in subsidiaries” relates to dividends received from the subsidiaries Vocis Driveline Controls Ltd and Graziano Trasmissioni UK Ltd.
“Other income from third parties” consists mainly of interest income of payment ex-tensions granted to customers.
7.9. Breakdown of interest and other financial expenseInterest expense and other financial expense accrued to the year amount to € 1,365,990 and are filly attributed to the income statement.
The amount of interest payable to third parties indicated in item 17 of the Income Statement is broken down as follows:
The reduction of factoring interest expense is due mainly to less use of operations for the sale without recourse of commercial receivables, while the reduction in interest on loans is due to the reduction of the residual debt. The INAIL contributions were paid instalments.
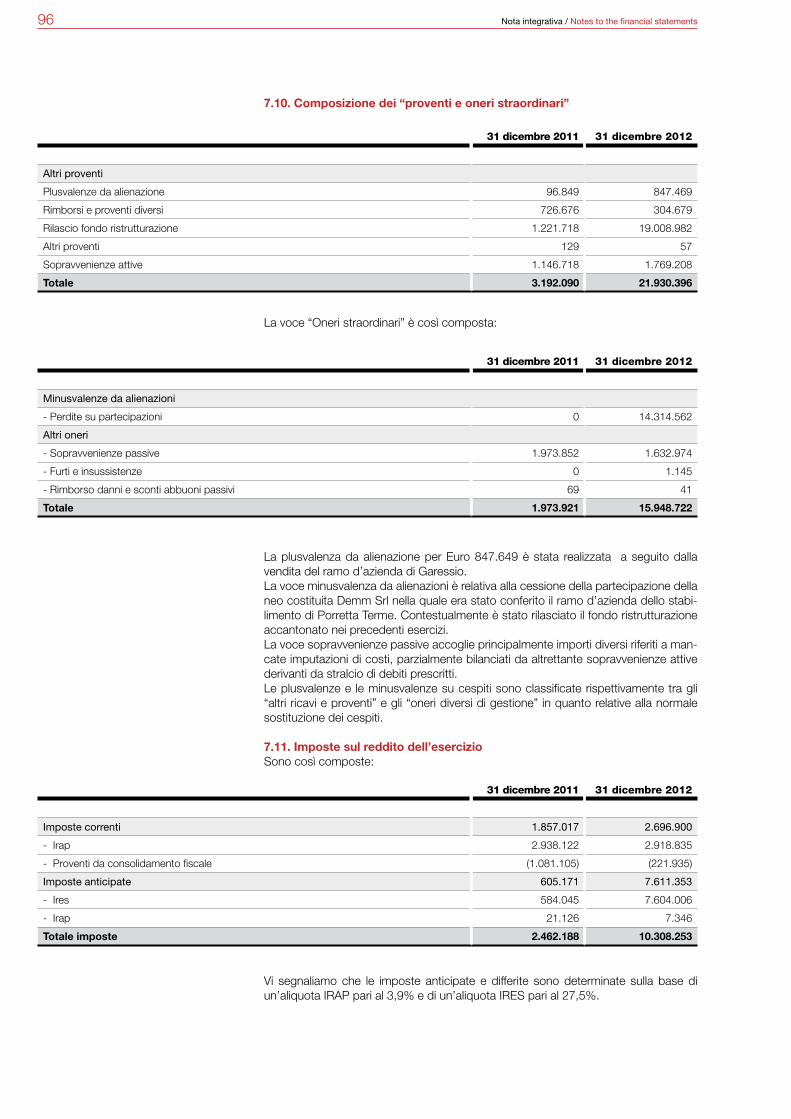
96 Nota integrativa / Notes to the financial statements
7.10. Composizione dei “proventi e oneri straordinari”
La voce “Oneri straordinari” è così composta:
La plusvalenza da alienazione per Euro 847.649 è stata realizzata a seguito dalla vendita del ramo d’azienda di Garessio.La voce minusvalenza da alienazioni è relativa alla cessione della partecipazione della neo costituita Demm Srl nella quale era stato conferito il ramo d’azienda dello stabi-limento di Porretta Terme. Contestualmente è stato rilasciato il fondo ristrutturazione accantonato nei precedenti esercizi.La voce sopravvenienze passive accoglie principalmente importi diversi riferiti a man-cate imputazioni di costi, parzialmente bilanciati da altrettante sopravvenienze attive derivanti da stralcio di debiti prescritti. Le plusvalenze e le minusvalenze su cespiti sono classificate rispettivamente tra gli “altri ricavi e proventi” e gli “oneri diversi di gestione” in quanto relative alla normale sostituzione dei cespiti.
7.11. Imposte sul reddito dell’esercizioSono così composte:
Vi segnaliamo che le imposte anticipate e differite sono determinate sulla base di un’aliquota IRAP pari al 3,9% e di un’aliquota IRES pari al 27,5%.
31 dicembre 2011 31 dicembre 2012
Altri proventi
Plusvalenze da alienazione 96.849 847.469
Rimborsi e proventi diversi 726.676 304.679
Rilascio fondo ristrutturazione 1.221.718 19.008.982
Altri proventi 129 57
Sopravvenienze attive 1.146.718 1.769.208
Totale 3.192.090 21.930.396
31 dicembre 2011 31 dicembre 2012
Minusvalenze da alienazioni
- Perdite su partecipazioni 0 14.314.562
Altri oneri
- Sopravvenienze passive 1.973.852 1.632.974
- Furti e insussistenze 0 1.145
- Rimborso danni e sconti abbuoni passivi 69 41
Totale 1.973.921 15.948.722
31 dicembre 2011 31 dicembre 2012
Imposte correnti 1.857.017 2.696.900
- Irap 2.938.122 2.918.835
- Proventi da consolidamento fiscale (1.081.105) (221.935)
Imposte anticipate 605.171 7.611.353
- Ires 584.045 7.604.006
- Irap 21.126 7.346
Totale imposte 2.462.188 10.308.253
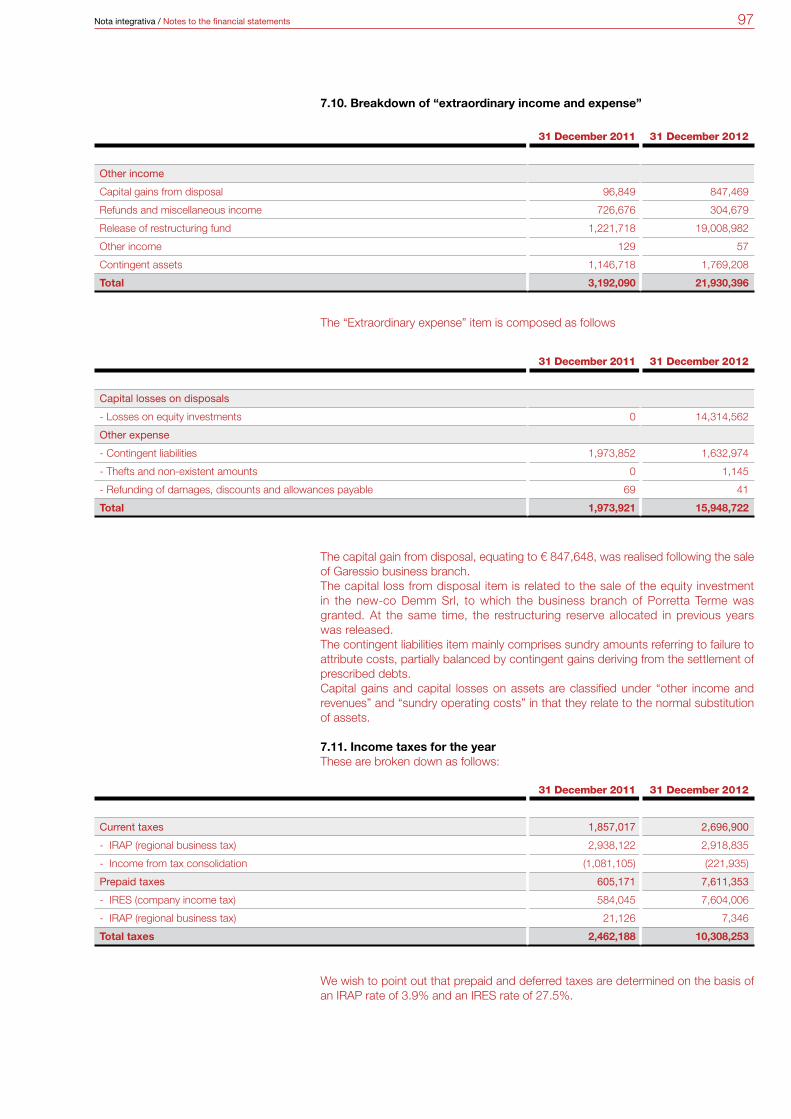
97Nota integrativa / Notes to the financial statements
31 December 2011 31 December 2012
Other income
Capital gains from disposal 96,849 847,469
Refunds and miscellaneous income 726,676 304,679
Release of restructuring fund 1,221,718 19,008,982
Other income 129 57
Contingent assets 1,146,718 1,769,208
Total 3,192,090 21,930,396
31 December 2011 31 December 2012
Capital losses on disposals
- Losses on equity investments 0 14,314,562
Other expense
- Contingent liabilities 1,973,852 1,632,974
- Thefts and non-existent amounts 0 1,145
- Refunding of damages, discounts and allowances payable 69 41
Total 1,973,921 15,948,722
31 December 2011 31 December 2012
Current taxes 1,857,017 2,696,900
- IRAP (regional business tax) 2,938,122 2,918,835
- Income from tax consolidation (1,081,105) (221,935)
Prepaid taxes 605,171 7,611,353
- IRES (company income tax) 584,045 7,604,006
- IRAP (regional business tax) 21,126 7,346
Total taxes 2,462,188 10,308,253
7.10. Breakdown of “extraordinary income and expense”
The “Extraordinary expense” item is composed as follows
The capital gain from disposal, equating to € 847,648, was realised following the sale of Garessio business branch. The capital loss from disposal item is related to the sale of the equity investment in the new-co Demm Srl, to which the business branch of Porretta Terme was granted. At the same time, the restructuring reserve allocated in previous years was released.The contingent liabilities item mainly comprises sundry amounts referring to failure to attribute costs, partially balanced by contingent gains deriving from the settlement of prescribed debts. Capital gains and capital losses on assets are classified under “other income and revenues” and “sundry operating costs” in that they relate to the normal substitution of assets.
7.11. Income taxes for the year These are broken down as follows:
We wish to point out that prepaid and deferred taxes are determined on the basis of an IRAP rate of 3.9% and an IRES rate of 27.5%.
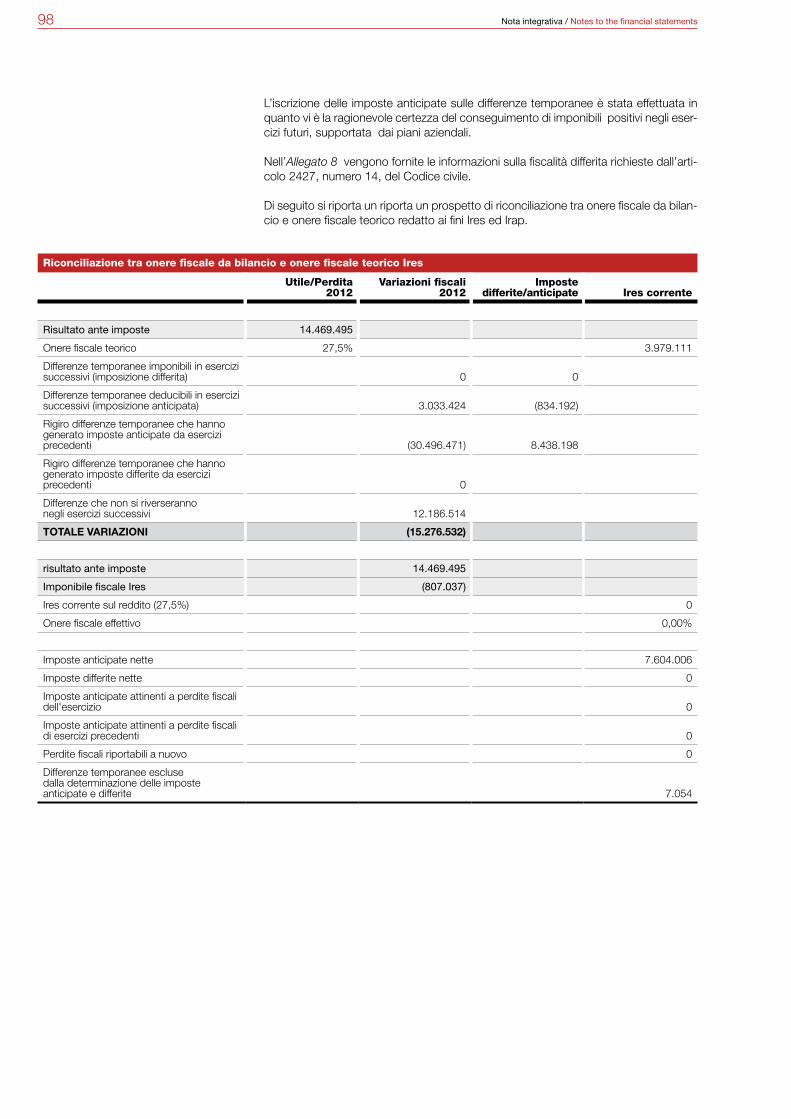
98 Nota integrativa / Notes to the financial statements
L’iscrizione delle imposte anticipate sulle differenze temporanee è stata effettuata in quanto vi è la ragionevole certezza del conseguimento di imponibili positivi negli eser-cizi futuri, supportata dai piani aziendali.
Nell’Allegato 8 vengono fornite le informazioni sulla fiscalità differita richieste dall’arti-colo 2427, numero 14, del Codice civile.
Di seguito si riporta un riporta un prospetto di riconciliazione tra onere fiscale da bilan-cio e onere fiscale teorico redatto ai fini Ires ed Irap.
Riconciliazione tra onere fiscale da bilancio e onere fiscale teorico Ires
Utile/Perdita 2012
Variazioni fiscali 2012
Impostedifferite/anticipate Ires corrente
Risultato ante imposte 14.469.495
Onere fiscale teorico 27,5% 3.979.111
Differenze temporanee imponibili in esercizi successivi (imposizione differita) 0 0
Differenze temporanee deducibili in esercizi successivi (imposizione anticipata) 3.033.424 (834.192)
Rigiro differenze temporanee che hanno generato imposte anticipate da esercizi precedenti (30.496.471) 8.438.198
Rigiro differenze temporanee che hanno generato imposte differite da esercizi precedenti 0
Differenze che non si riverseranno negli esercizi successivi 12.186.514
TOTALE VARIAZIONI (15.276.532)
risultato ante imposte 14.469.495
Imponibile fiscale Ires (807.037)
Ires corrente sul reddito (27,5%) 0
Onere fiscale effettivo 0,00%
Imposte anticipate nette 7.604.006
Imposte differite nette 0
Imposte anticipate attinenti a perdite fiscali dell'esercizio 0
Imposte anticipate attinenti a perdite fiscali di esercizi precedenti 0
Perdite fiscali riportabili a nuovo 0
Differenze temporanee escluse dalla determinazione delle imposte anticipate e differite 7.054

99Nota integrativa / Notes to the financial statements
Reconciliation between tax expense in the financial statements and the theoretic tax expense IRES (Company earnings’ tax )
Net income/Loss2012
Tax changes2012
Deferred/prepaidtaxes
CurrentIres
Result before taxes 14,469,495
Theoretic tax expense 27.5% 3,979,111
Temporary differences taxable in subsequent years (deferred tax) 0 0
Temporary differences deductible in subsequent years (prepaid tax) 3,033,424 (834,192)
Re-endorsement of temporary differences from previous years that generated prepaid taxes (30,496,471) 8,438,198
Re-endorsement of temporary differences from previous years that generated deferred taxes 0
Differences which will not be of influence in subsequent years 12,186,514
TOTAL CHANGES (15,276,532)
result before taxes 14,469,495
Income subject to Ires (807,037)
Current Ires on income (27.5%) 0
Effective tax expense 0.00%
Net prepaid taxes 7,604,006
Net deferred taxes 0
Prepaid taxes relating to fiscal losses during the year 0
Prepaid taxes relating to fiscal losses from previous years 0
Fiscal losses to be carried forward 0
Temporary differences excluded from the determination of prepaid and deferred taxes 7,054
The booking of prepaid taxes on temporary differences was carried out insofar as there is reasonable certainty of the attainment of positive taxable incomes in future years, supported by the company’s plans.
Annex 8 provides information on deferred taxation requested by article 2427, number 14 of the Civil Code.
A statement of reconciliation between tax expense in the financial statements and theoretic tax expense, prepared for the purposes of Ires and Irap, is shown below.

100 Nota integrativa / Notes to the financial statements
7.12. Numero medio dei dipendentiIl costo relativo al personale dipendente è pari a complessivi Euro 97.731.616 com-prensivo della quota di trattamento di fine rapporto di Euro 5.168.658.
Il numero medio dei dipendenti nell’esercizio è pari a complessive 1.882 unità; si ri-porta la suddivisione per categorie e il confronto con l’esercizio precedente:
Il calcolo è effettuato considerando le giornate lavorate complessivamente in azienda.
7.13. Compensi per il funzionamento degli organi socialiGli amministratori investiti di particolari incarichi non hanno ricevuto alcun compenso. I compensi spettanti al Collegio sindacale sono pari a Euro 40.752.I compensi spettanti all’organo deputato della revisione legale ammontano ad Euro 62.170.
Infine, Vi presentiamo il seguente prospetto di confronto con l’esercizio precedente:
Riconciliazione tra onere fiscale da bilancio e onere fiscale teorico Irap
Valore produzione 2012
Variazioni fiscali 2012
Impostedifferite/anticipate Irap corrente
Valore produzione lordo 69.012.385
Onere fiscale teorico 3,90% 2.691.483
Differenze temporanee imponibili in esercizi successivi (imposizione differita) 0 0
Differenze temporanee deducibili in esercizi successivi (imposizione anticipata) 0 0
Rigiro differenze temporanee che hanno generato imposte anticipate da esercizi precedenti (126.772) 7.346
Rigiro differenze temporanee che hanno generato imposte differite da esercizi precedenti 0
Differenze che non si riverseranno negli esercizi successivi 2.695.236
TOTALE VARIAZIONI 2.568.464
Totale imponibile irap 71.580.849
Irap corrente 3,9% 2.791.653
Onere fiscale effettivo 4,05%
Imposte anticipate nette dell'esercizio 7.346
Imposte differite nette dell'esercizio 0
Differenze temporanee escluse dalla determinazione delle imposte anticipate e differite 0
31 dicembre 2011 31 dicembre 2012
Dirigenti 30 31
Impiegati 451 407
Operai e intermedi 1.854 1.444
Totale 2.335 1.882
31 dicembre 2011 31 dicembre 2012
Sindaci 31.581 40.752
Società di Revisione 81.000 62.170
Totale 112.581 102.922
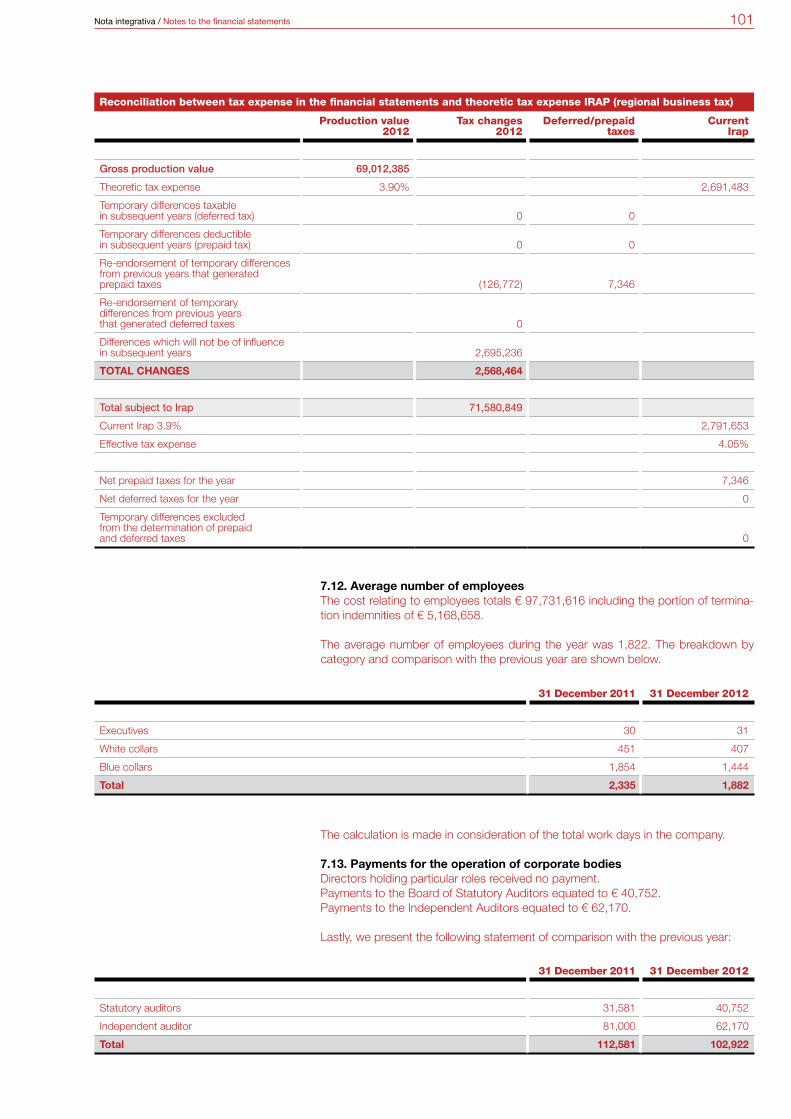
101Nota integrativa / Notes to the financial statements
Reconciliation between tax expense in the financial statements and theoretic tax expense IRAP (regional business tax)
Production value2012
Tax changes2012
Deferred/prepaidtaxes
CurrentIrap
Gross production value 69,012,385
Theoretic tax expense 3.90% 2,691,483
Temporary differences taxable in subsequent years (deferred tax) 0 0
Temporary differences deductible in subsequent years (prepaid tax) 0 0
Re-endorsement of temporary differences from previous years that generated prepaid taxes (126,772) 7,346
Re-endorsement of temporary differences from previous years that generated deferred taxes 0
Differences which will not be of influence in subsequent years 2,695,236
TOTAL CHANGES 2,568,464
Total subject to Irap 71,580,849
Current Irap 3.9% 2,791,653
Effective tax expense 4.05%
Net prepaid taxes for the year 7,346
Net deferred taxes for the year 0
Temporary differences excluded from the determination of prepaid and deferred taxes 0
31 December 2011 31 December 2012
Executives 30 31
White collars 451 407
Blue collars 1,854 1,444
Total 2,335 1,882
31 December 2011 31 December 2012
Statutory auditors 31,581 40,752
Independent auditor 81,000 62,170
Total 112,581 102,922
7.12. Average number of employeesThe cost relating to employees totals € 97,731,616 including the portion of termina-tion indemnities of € 5,168,658.
The average number of employees during the year was 1,822. The breakdown by category and comparison with the previous year are shown below.
The calculation is made in consideration of the total work days in the company.
7.13. Payments for the operation of corporate bodiesDirectors holding particular roles received no payment. Payments to the Board of Statutory Auditors equated to € 40,752.Payments to the Independent Auditors equated to € 62,170.
Lastly, we present the following statement of comparison with the previous year:

102 Nota integrativa / Notes to the financial statements
7.14. Informativa sull’attività di direzione e coordinamentoAi sensi dell’articolo 2497 bis del Codice civile, di seguito si espone il prospetto ri-epilogativo dei dati essenziali dell’ultimo bilancio regolarmente approvato chiuso al 31/12/2012 della società che esercita l’attività di direzione e coordinamento sulla Vostra società, OC OERLIKON CORPORATION AG, PFÄFFIKON.
Stato patrimoniale
Valori in CHF/1.000.000
ATTIVO
A) Credito verso soci per versamenti ancora dovuti 0
B) Immobilizzazioni 2.868
C) Attivo circolante 372
D) Ratei e risconti 1
Totale 3.241
PASSIVO
A) Patrimonio netto
Capitale sociale 326
Riserve 1.674
Utile (perdita) dell’esercizio 189
B) Fondi per rischi ed oneri 41
C) Trattamento di fine rapporto di lavoro subordinato 0
D) Debiti 996
E) Ratei e risconti 15
Totale 3.241
Conti impegni e rischi ed altri fonti d’ordine 0
CONTO ECONOMICO
A) Valore della produzione 246
B) Costi della produzione (55)
Differenza tra valore e costi della produzione 191
C) Proventi ed oneri finanziari (2)
D) Rettifiche di valore di attività finanziarie 0
E) Proventi ed oneri straordinari 0
Risultato prima delle imposte 189
Imposte sul reddito d’esercizio 0
Utile (perdita) dell’esercizio 189

103Nota integrativa / Notes to the financial statements
Balance sheet
Values in CHF/1,000,000
ASSETS
A) Receivable from shareholders for payments still due 0
B) Fixed assets 2,868
C) Current assets 372
D) Accrued income and prepaid expenses 1
Total 3,241
LIABILITIES
A) Shareholders’ equity
Share capital 326
Reserves 1,674
Profit (loss) for the year 189
B) Provisions for risks and charges 41
C) Employee termination indemnities 0
D) Payables 996
E) Accrued expenses and deferred income 15
Total 3,241
Accounts for commitments and risks and other sources of orders 0
INCOME STATEMENT
A) Production value 246
B) Production costs (55)
Difference between production value and costs 191
C) Financial income and expense (2)
D) Value adjustments in financial assets 0
E) Extraordinary income and expenses 0
Result before tax 189
Income taxes for the year 0
Profit (loss) for the year 189
7.14. Informative document on management and coordination activitiesIn accordance with article 2497 bis of the Civil Code, the statement summarising the essential data of the last regularly approved financial statements at 31/12/2012 for the company exercising the management and coordination of your Company, OC OERLIKON CORPORATION AG, PFÄFFIKON, is shown.
104

105
Allegati alla nota integrativa
Annexes to the notes to the financial statements
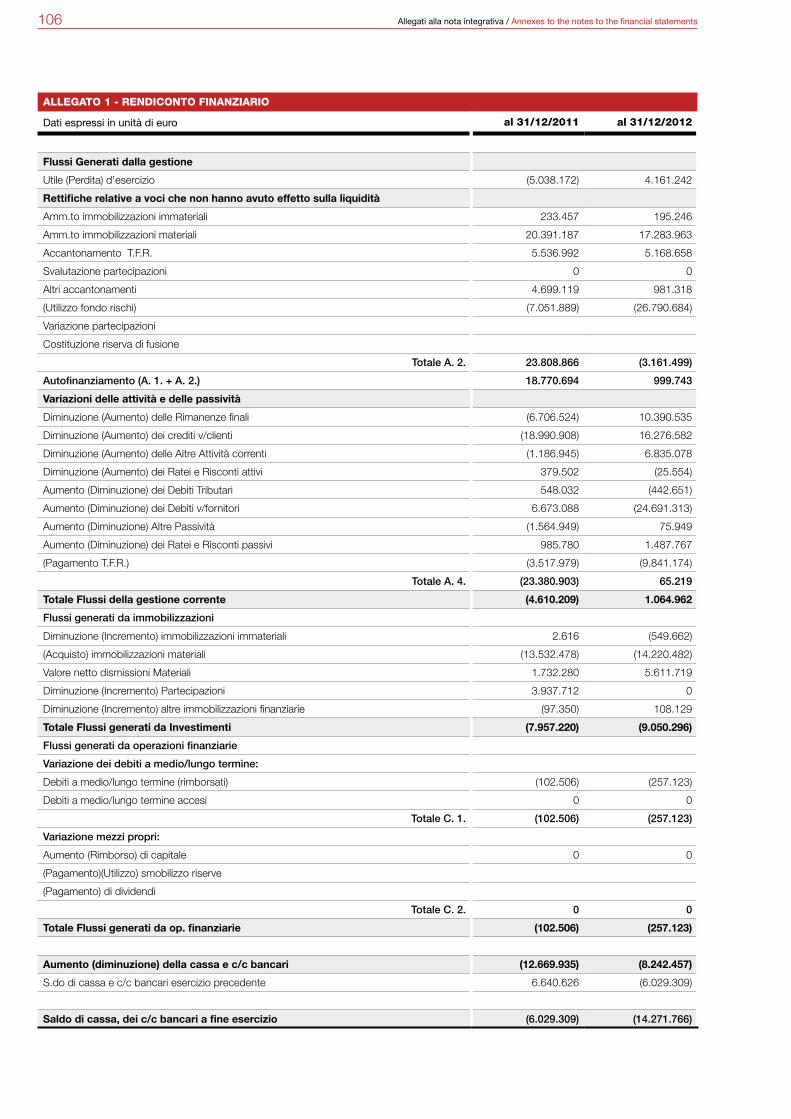
106 Allegati alla nota integrativa / Annexes to the notes to the financial statements
ALLEGATO 1 - RENDICONTO FINANZIARIO
Dati espressi in unità di euro al 31/12/2011 al 31/12/2012
Flussi Generati dalla gestione
Utile (Perdita) d’esercizio (5.038.172) 4.161.242
Rettifiche relative a voci che non hanno avuto effetto sulla liquidità
Amm.to immobilizzazioni immateriali 233.457 195.246
Amm.to immobilizzazioni materiali 20.391.187 17.283.963
Accantonamento T.F.R. 5.536.992 5.168.658
Svalutazione partecipazioni 0 0
Altri accantonamenti 4.699.119 981.318
(Utilizzo fondo rischi) (7.051.889) (26.790.684)
Variazione partecipazioni
Costituzione riserva di fusione
Totale A. 2. 23.808.866 (3.161.499)
Autofinanziamento (A. 1. + A. 2.) 18.770.694 999.743
Variazioni delle attività e delle passività
Diminuzione (Aumento) delle Rimanenze finali (6.706.524) 10.390.535
Diminuzione (Aumento) dei crediti v/clienti (18.990.908) 16.276.582
Diminuzione (Aumento) delle Altre Attività correnti (1.186.945) 6.835.078
Diminuzione (Aumento) dei Ratei e Risconti attivi 379.502 (25.554)
Aumento (Diminuzione) dei Debiti Tributari 548.032 (442.651)
Aumento (Diminuzione) dei Debiti v/fornitori 6.673.088 (24.691.313)
Aumento (Diminuzione) Altre Passività (1.564.949) 75.949
Aumento (Diminuzione) dei Ratei e Risconti passivi 985.780 1.487.767
(Pagamento T.F.R.) (3.517.979) (9.841.174)
Totale A. 4. (23.380.903) 65.219
Totale Flussi della gestione corrente (4.610.209) 1.064.962
Flussi generati da immobilizzazioni
Diminuzione (Incremento) immobilizzazioni immateriali 2.616 (549.662)
(Acquisto) immobilizzazioni materiali (13.532.478) (14.220.482)
Valore netto dismissioni Materiali 1.732.280 5.611.719
Diminuzione (Incremento) Partecipazioni 3.937.712 0
Diminuzione (Incremento) altre immobilizzazioni finanziarie (97.350) 108.129
Totale Flussi generati da Investimenti (7.957.220) (9.050.296)
Flussi generati da operazioni finanziarie
Variazione dei debiti a medio/lungo termine:
Debiti a medio/lungo termine (rimborsati) (102.506) (257.123)
Debiti a medio/lungo termine accesi 0 0
Totale C. 1. (102.506) (257.123)
Variazione mezzi propri:
Aumento (Rimborso) di capitale 0 0
(Pagamento)(Utilizzo) smobilizzo riserve
(Pagamento) di dividendi
Totale C. 2. 0 0
Totale Flussi generati da op. finanziarie (102.506) (257.123)
Aumento (diminuzione) della cassa e c/c bancari (12.669.935) (8.242.457)
S.do di cassa e c/c bancari esercizio precedente 6.640.626 (6.029.309)
Saldo di cassa, dei c/c bancari a fine esercizio (6.029.309) (14.271.766)

107Allegati alla nota integrativa / Annexes to the notes to the financial statements
ANNEX 1 - FINANCIAL REPORT
figures in euro units at 31/12/2011 at 31/12/2012
Flows generated by operation
Net income (Loss) for the year (5,038,172) 4,161,242
Adjustments relating to items with no effect on liquidity
Amortisation of intangible assets 233,457 195,246
Depreciation of tangible assets 20,391,187 17,283,963
Provision for staff servance indemnities 5,536,992 5,168,658
Writeback of equity investments 0 0
Other provisions 4,699,119 981,318
(Use of provision for risks) (7,051,889) (26,790,684)
Change in equity investments
Formation of merger reserve
Total A. 2. 23,808,866 (3,161,499)
Self-funding (A. 1. + A. 2.) 18,770,694 999,743
Changes in assets and liabilities
Decrease (Increase) of final inventories (6,706,524) 10,390,535
Decrease (Increase) of customer receivables (18,990,908) 16,276,582
Decrease (Increase) of other current assets (1,186,945) 6,835,078
Decrease (Increase) of accrued income and prepaid expenses 379,502 (25,554)
Increase (Decrease) of tax debts 548,032 (442,651)
Increase (Decrease) of amounts payable to suppliers 6,673,088 (24,691,313)
Increase (Decrease) of other liabilities (1,564,949) 75,949
Increase (Decrease) of accrued expenses and deferred income 985,780 1,487,767
(Payment of staff servance indemnities) (3,517,979) (9,841,174)
Total A. 4. (23,380,903) 65,219
Total flows of current operation (4,610,209) 1,064,962
Flows generated by fixed assets
Decrease (Increase) of intangible assets 2,616 (549,662)
(Purchase) tangible assets (13,532,478) (14,220,482)
Net value of disposals tangible 1,732,280 5,611,719
Decrease (Increase) in equity investments 3,937,712 0
Decrease (Increase) in other financial assets (97,350) 108,129
Total flows generated by investments (7,957,220) (9,050,296)
Flows generated by financial transactions
Change in medium/long-term payables:
Medium/long-term payables (refunded) (102,506) (257,123)
New medium/long-term payables 0 0
Total C. 1. (102,506) (257,123)
Change in own means:
Increase (decrease) of capital 0 0
(Payment)(Use) release of reserves
(Payment) of dividends
Total C. 2. 0 0
Total flows generated by financial transactions (102,506) (257,123)
Increase (decrease) of cash and bank accounts (12,669,935) (8,242,457)
Balance of cash and bank accounts from previous year 6,640,626 (6,029,309)
Balance of cash and bank accounts at year end (6,029,309) (14,271,766)

108 Allegati alla nota integrativa / Annexes to the notes to the financial statements
ALLEGATO 2 - CONTRATTI DI LEASING
ATTIVITA’
A Contratti in corso
+ a 1 ) Valore dei beni in leasing finanziario alla fine dell'esercizio precedente 49.300
+ a 2 ) Valore beni acquisiti in leasing finanziario nel corso dell'esercizio 0
- a 3 ) Valore beni in leasing finanziario riscattati nel corso dell'esercizio 0
- a 4 ) Quote di ammortamento di competenza dell'esercizio (19.720)
+/- a 5 ) Rettifiche / riprese di valore su beni in leasing finanziario 0
a 6 ) Valore beni in leasing finanziario al termine dell'esercizio 29.580
a 7) Storno risconti attivi 93
a 8) Risconti attivi su interessi di canoni a cavallo d'esercizio 222
B Beni riscattati
b 1) Maggiore valore complessivo dei beni riscattati, determinato secondo la metodologia finanziaria, rispetto al valore netto contabile alla fine dell’esercizio 17.508.540
Totale attivo 17.538.435
PASSIVITA’
C Contratti in corso
c 1 ) Debiti impliciti per operazioni di leasing finanziario alla fine dell'esercizio precedente 41.204
c 2 ) Debiti impliciti sorti nell'esercizio 0
c 3 ) Riduzioni per rimborso delle quote capitali e riscatti nel corso dell'esercizio 29.718
c 4 ) Debiti impliciti per operazioni di leasing finanziario alla fine dell'esercizio 11.486
c 5 ) Ratei passivi di interessi su canoni a cavallo d'esercizio 0
Effetto fiscale (saldo algebrico differenze temporanee generate nell'esercizio e nei precedenti) 6.526.555
Riserve 11.368.600
Risultato (368.206)
Effetto sul patrimonio netto alla fine dell'esercizio (D + E + F) 11.000.393
Totale passivo 17.538.435
CONTO ECONOMICO
H Contratti in corso
h 1 ) Effetti sul risultato prima delle imposte (saldo maggiori costi imputabili all'esercizio) (588.964)
di cui storno canoni su operazioni di leasing finanziario 34.016
di cui rilevazione degli oneri finanziari su operazioni di leasing finanziario (3.015)
di cui rilevazione di quote di ammortamento su contratti in essere (698.520)
di cui differenziale quote di ammortamento su beni riscattati 78.555
I Effetto fiscale (saldo minori imposte imputabili all’esercizio) 220.757
L Effetto netto che si avrebbe avuto sul risultato d’esercizio dalla rilevazione delle operazioni di leasing con il metodo finanziario rispetto al metodo patrimoniale adottato (h1 + I) (368.206)

109Allegati alla nota integrativa / Annexes to the notes to the financial statements
ANNEX 2 - LEASING AGREEMENTS
ASSETS
A Value of assets under financial lease at the end of the previous year
+ a 1 ) Value of assets purchased under financial lease during the year 49,300
+ a 2 ) Value of assets purchased under financial lease and redeemed during the year 0
- a 3 ) Amortisation accrued to the year 0
- a 4 ) Adjustments / recoveries in value of assets under financial lease (19,720)
+/- a 5 ) Value of assets under financial lease at year end 0
a 6 ) Value of assets under financial lease at year end 29,580
a 7) Reversal of prepaid expenses 93
a 8) Prepaid expenses on interest on fees at year end 222
B Assets redeemed
b 1) Higher overall value of the assets redeemed, determined according to the financial method, compared to the net book value at year end 17,508,540
Total assets 17,538,435
LIABILITIES
C Current agreements
c 1 ) Implicit payables for financial leases at the end of the previous year 41,204
c 2 ) Implicit payable arising during the year 0
c 3 ) Reductions for refunding of principle and redemptions during the year 29,718
c 4 ) Implicit payables for financial leases at the end of the year 11,486
c 5 ) Accrued expenses on interest on fees at year end 0
Tax effect (balance of temporary algebraic differences generated during the year and in previous ones) 6,526,555
Reserves 11,368,600
Result (368,206)
Effect on shareholders' equity at year end (D + E + F) 11,000,393
Total liabilities 17,538,435
INCOME STATEMENT
H Current agreements
h 1 ) Effects on the result before tax (balance of higher costs attributable to the year) (588,964)
of which reversal of fees on financial leases 34,016
of which disclosure of financial expense on financial leases (3,015)
of which disclosure of amortisation on current agreements (698,520)
of which amortisation differential on redeemed assets 78,555
I Tax effect (lower balance of taxes attributable to the year) 220,757
L Net effect that would have been had on the year with the disclosure of leases with the financial method instead of the equity method (h1 + l) (368,206)
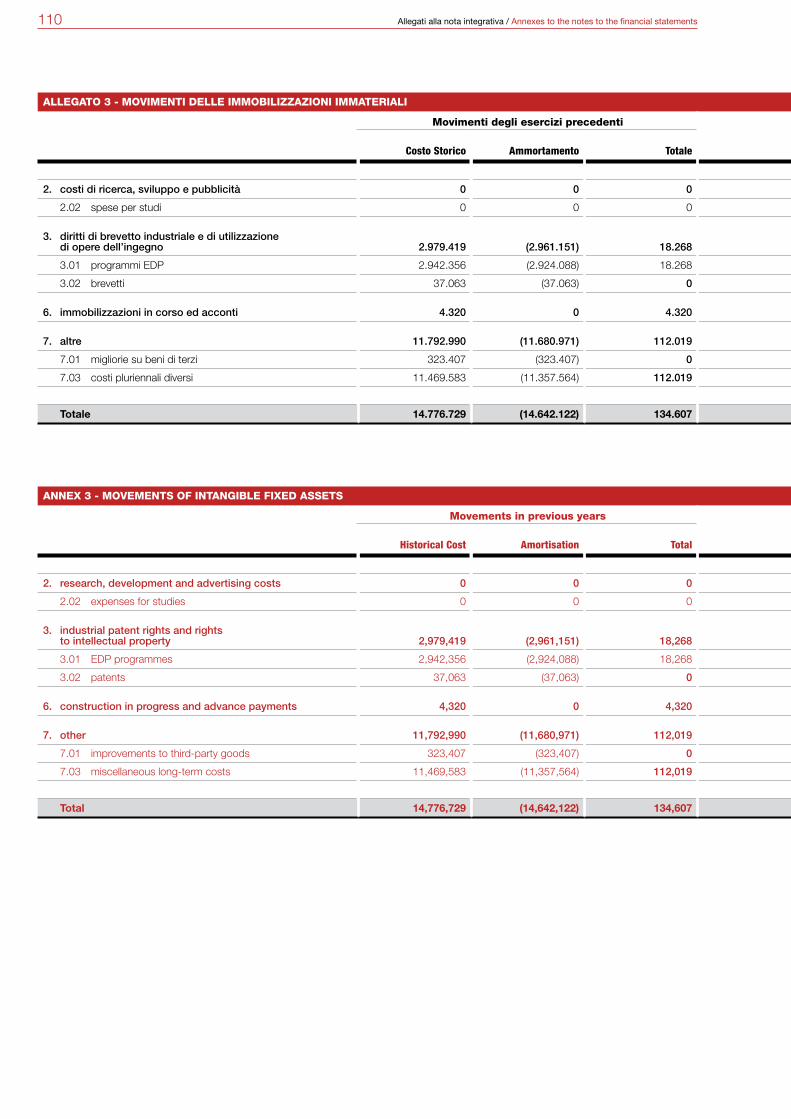
110 Allegati alla nota integrativa / Annexes to the notes to the financial statements
ALLEGATO 3 - MOVIMENTI DELLE IMMOBILIZZAZIONI IMMATERIALI
Movimenti degli esercizi precedenti Movimenti dell’esercizio Consistenza finale
Costo Storico Ammortamento TotaleRiclassificazioni
e stralci Acquisizioni Svalutazione Ammortamento Valore lordo (a)Fondo
Ammortamento (b) Consistenza finale
2. costi di ricerca, sviluppo e pubblicità 0 0 0 0 140.235 0 (19.222) 140.235 (19.222) 121.013
2.02 spese per studi 0 0 0 0 140.235 0 (19.222) 140.235 (19.222) 121.013
3. diritti di brevetto industriale e di utilizzazione di opere dell’ingegno 2.979.419 (2.961.151) 18.268 0 166.503 0 (73.037) 3.145.922 (3.034.188) 111.734
3.01 programmi EDP 2.942.356 (2.924.088) 18.268 0 166.503 0 (73.037) 3.108.859 (2.997.125) 111.734
3.02 brevetti 37.063 (37.063) 0 0 0 0 0 37.063 (37.063) 0
6. immobilizzazioni in corso ed acconti 4.320 0 4.320 (4.320) 247.244 0 0 247.244 0 247.244
7. altre 11.792.990 (11.680.971) 112.019 0 0 0 (102.986) 11.792.990 (11.783.957) 9.033
7.01 migliorie su beni di terzi 323.407 (323.407) 0 0 0 0 0 323.407 (323.407) 0
7.03 costi pluriennali diversi 11.469.583 (11.357.564) 112.019 0 0 0 (102.986) 11.469.583 (11.460.550) 9.033
Totale 14.776.729 (14.642.122) 134.607 (4.320) 553.982 0 (195.245) 15.326.391 (14.837.367) 489.024
ANNEX 3 - MOVEMENTS OF INTANGIBLE FIXED ASSETS
Movements in previous years Movements during the year Final balance
Historical Cost Amortisation TotalReclassificationsand settlements Acquisition Writeback Amortisation Gross value (a)
AmortisationFund (b) Final balance
2. research, development and advertising costs 0 0 0 0 140,235 0 (19,222) 140,235 (19,222) 121,013
2.02 expenses for studies 0 0 0 0 140,235 0 (19,222) 140,235 (19,222) 121,013
3. industrial patent rights and rights to intellectual property 2,979,419 (2,961,151) 18,268 0 166,503 0 (73,037) 3,145,922 (3,034,188) 111,734
3.01 EDP programmes 2,942,356 (2,924,088) 18,268 0 166,503 0 (73,037) 3,108,859 (2,997,125) 111,734
3.02 patents 37,063 (37,063) 0 0 0 0 0 37,063 (37,063) 0
6. construction in progress and advance payments 4,320 0 4,320 (4,320) 247,244 0 0 247,244 0 247,244
7. other 11,792,990 (11,680,971) 112,019 0 0 0 (102,986) 11,792,990 (11,783,957) 9,033
7.01 improvements to third-party goods 323,407 (323,407) 0 0 0 0 0 323,407 (323,407) 0
7.03 miscellaneous long-term costs 11,469,583 (11,357,564) 112,019 0 0 0 (102,986) 11,469,583 (11,460,550) 9,033
Total 14,776,729 (14,642,122) 134,607 (4,320) 553,982 0 (195,245) 15,326,391 (14,837,367) 489,024

111Allegati alla nota integrativa / Annexes to the notes to the financial statements
ALLEGATO 3 - MOVIMENTI DELLE IMMOBILIZZAZIONI IMMATERIALI
Movimenti degli esercizi precedenti Movimenti dell’esercizio Consistenza finale
Costo Storico Ammortamento TotaleRiclassificazioni
e stralci Acquisizioni Svalutazione Ammortamento Valore lordo (a)Fondo
Ammortamento (b) Consistenza finale
2. costi di ricerca, sviluppo e pubblicità 0 0 0 0 140.235 0 (19.222) 140.235 (19.222) 121.013
2.02 spese per studi 0 0 0 0 140.235 0 (19.222) 140.235 (19.222) 121.013
3. diritti di brevetto industriale e di utilizzazione di opere dell’ingegno 2.979.419 (2.961.151) 18.268 0 166.503 0 (73.037) 3.145.922 (3.034.188) 111.734
3.01 programmi EDP 2.942.356 (2.924.088) 18.268 0 166.503 0 (73.037) 3.108.859 (2.997.125) 111.734
3.02 brevetti 37.063 (37.063) 0 0 0 0 0 37.063 (37.063) 0
6. immobilizzazioni in corso ed acconti 4.320 0 4.320 (4.320) 247.244 0 0 247.244 0 247.244
7. altre 11.792.990 (11.680.971) 112.019 0 0 0 (102.986) 11.792.990 (11.783.957) 9.033
7.01 migliorie su beni di terzi 323.407 (323.407) 0 0 0 0 0 323.407 (323.407) 0
7.03 costi pluriennali diversi 11.469.583 (11.357.564) 112.019 0 0 0 (102.986) 11.469.583 (11.460.550) 9.033
Totale 14.776.729 (14.642.122) 134.607 (4.320) 553.982 0 (195.245) 15.326.391 (14.837.367) 489.024
ANNEX 3 - MOVEMENTS OF INTANGIBLE FIXED ASSETS
Movements in previous years Movements during the year Final balance
Historical Cost Amortisation TotalReclassificationsand settlements Acquisition Writeback Amortisation Gross value (a)
AmortisationFund (b) Final balance
2. research, development and advertising costs 0 0 0 0 140,235 0 (19,222) 140,235 (19,222) 121,013
2.02 expenses for studies 0 0 0 0 140,235 0 (19,222) 140,235 (19,222) 121,013
3. industrial patent rights and rights to intellectual property 2,979,419 (2,961,151) 18,268 0 166,503 0 (73,037) 3,145,922 (3,034,188) 111,734
3.01 EDP programmes 2,942,356 (2,924,088) 18,268 0 166,503 0 (73,037) 3,108,859 (2,997,125) 111,734
3.02 patents 37,063 (37,063) 0 0 0 0 0 37,063 (37,063) 0
6. construction in progress and advance payments 4,320 0 4,320 (4,320) 247,244 0 0 247,244 0 247,244
7. other 11,792,990 (11,680,971) 112,019 0 0 0 (102,986) 11,792,990 (11,783,957) 9,033
7.01 improvements to third-party goods 323,407 (323,407) 0 0 0 0 0 323,407 (323,407) 0
7.03 miscellaneous long-term costs 11,469,583 (11,357,564) 112,019 0 0 0 (102,986) 11,469,583 (11,460,550) 9,033
Total 14,776,729 (14,642,122) 134,607 (4,320) 553,982 0 (195,245) 15,326,391 (14,837,367) 489,024

112 Allegati alla nota integrativa / Annexes to the notes to the financial statements
ALLEGATO 4 - MOVIMENTI DELLE IMMOBILIZZAZIONI MATERIALI
Movimenti degli esercizi precedenti Movimenti dell’esercizio Consistenza finale
Costo Storico RivalutazioneFondo
Ammortamento Totale
Riclassificazionie stralci:
centro storico Acquisizione AlienazioneUtilizzo Fondo
Ammortamento Ammortamento Valore lordo (a)Fondo
Ammortamento (b)Valore
di bilancio (a-b)
1. terreni e fabbricati 11.908.464 996.428 (3.778.361) 9.126.531 55.249 209.670 (714.131) 31.301 (279.908) 12.455.680 (4.026.968) 8.428.712
1.01 terreni 987.283 57.762 0 1.045.045 0 0 0 0 0 1.045.045 0 1.045.045
1.03 fabbricati industriali 10.094.340 938.666 (3.386.951) 7.646.055 0 165.723 (684.651) 17.527 (207.821) 10.514.078 (3.577.245) 6.936.833
1.04 costruzioni leggere 826.841 0 (391.410) 435.431 55.249 43.947 (29.480) 13.774 (72.087) 896.557 (449.723) 446.834
2. impianti e macchinario 215.739.444 37.311.975 (222.352.287) 30.699.132 680.865 3.611.907 (58.738.938) 55.924.160 (8.434.046) 198.605.253 (174.862.173) 23.743.080
2.01 impianti 13.526.102 128.664 (9.239.231) 4.415.535 253.680 2.001.305 (4.583.326) 3.978.457 (835.549) 11.326.425 (6.096.323) 5.230.102
2.02 macchinario 202.213.342 37.183.311 (213.113.056) 26.283.597 427.185 1.610.602 (54.155.612) 51.945.703 (7.598.497) 187.278.828 (168.765.850) 18.512.978
3. attrezzature industriali e commerciali 151.394.812 53.130 (125.068.698) 26.379.244 757.524 5.384.482 (19.995.794) 17.972.978 (8.082.196) 137.594.154 (115.177.916) 22.416.238
3.01 attrezzature 151.394.812 53.130 (125.068.698) 26.379.244 757.524 5.384.482 (19.995.794) 17.972.978 (8.082.196) 137.594.154 (115.177.916) 22.416.238
4. altri beni 12.375.221 23.563 (11.102.771) 1.296.013 26.147 729.444 (1.531.379) 1.440.084 (487.812) 11.622.996 (10.150.499) 1.472.497
4.01 mobili e arredi 7.028.686 23.027 (6.136.307) 915.406 22.944 308.119 (471.604) 454.972 (320.365) 6.911.172 (6.001.700) 909.472
4.02 macchine ufficio elettroniche 4.627.015 536 (4.406.074) 221.477 3.203 418.575 (536.411) 536.412 (135.488) 4.512.918 (4.005.150) 507.768
4.03 automezzi 694.968 0 (539.855) 155.113 0 2.750 (523.364) 448.700 (29.281) 174.354 (120.436) 53.918
4.05 macchine ufficio ordinarie 24.552 0 (20.535) 4.017 0 0 0 0 (2.678) 24.552 (23.213) 1.339
5. immobilizzazioni in corso e acconti 1.828.267 0 0 1.828.267 (1.532.785) 4.297.979 0 0 0 4.593.461 0 4.593.461
Totale 393.246.208 38.385.096 (362.302.117) 69.329.187 (13.000) 14.233.482 (80.980.242) 75.368.523 (17.283.962) 364.871.544 (304.217.556) 60.653.988
ANNEX 4 - MOVEMENTS OF TANGIBLE FIXED ASSETS
Movements in previous years Movements during the year Final balance
Historical Cost RevaluationAmortisation
Fund Total
Reclassificationsand settlements:
Historical cost Acquisition Disposal
UseAmortisation
Fund Amortisation Gross value (a)Amortisation
Fund (b)Book value
(a-b)
1. land and buildings 11,908,464 996,428 (3,778,361) 9,126,531 55,249 209,670 (714,131) 31,301 (279,908) 12,455,680 (4,026,968) 8,428,712
1.01 land 987,283 57,762 0 1,045,045 0 0 0 0 0 1,045,045 0 1,045,045
1.03 industrial buildings 10,094,340 938,666 (3,386,951) 7,646,055 0 165,723 (684,651) 17,527 (207,821) 10,514,078 (3,577,245) 6,936,833
1.04 light constructions 826,841 0 (391,410) 435,431 55,249 43,947 (29,480) 13,774 (72,087) 896,557 (449,723) 446,834
2. systems and machinery 215,739,444 37,311,975 (222,352,287) 30,699,132 680,865 3,611,907 (58,738,938) 55,924,160 (8,434,046) 198,605,253 (174,862,173) 23,743,080
2.01 systems 13,526,102 128,664 (9,239,231) 4,415,535 253,680 2,001,305 (4,583,326) 3,978,457 (835,549) 11,326,425 (6,096,323) 5,230,102
2.02 machinery 202,213,342 37,183,311 (213,113,056) 26,283,597 427,185 1,610,602 (54,155,612) 51,945,703 (7,598,497) 187,278,828 (168,765,850) 18,512,978
3. industrial and commercial equipment 151,394,812 53,130 (125,068,698) 26,379,244 757,524 5,384,482 (19,995,794) 17,972,978 (8,082,196) 137,594,154 (115,177,916) 22,416,238
3.01 equipment 151,394,812 53,130 (125,068,698) 26,379,244 757,524 5,384,482 (19,995,794) 17,972,978 (8,082,196) 137,594,154 (115,177,916) 22,416,238
4. other assets 12,375,221 23,563 (11,102,771) 1,296,013 26,147 729,444 (1,531,379) 1,440,084 (487,812) 11,622,996 (10,150,499) 1,472,497
4.01 furniture and furnishings 7,028,686 23,027 (6,136,307) 915,406 22,944 308,119 (471,604) 454,972 (320,365) 6,911,172 (6,001,700) 909,472
4.02 electronic office equipment 4,627,015 536 (4,406,074) 221,477 3,203 418,575 (536,411) 536,412 (135,488) 4,512,918 (4,005,150) 507,768
4.03 vehicles 694,968 0 (539,855) 155,113 0 2,750 (523,364) 448,700 (29,281) 174,354 (120,436) 53,918
4.05 ordinary office equipment 24,552 0 (20,535) 4,017 0 0 0 0 (2,678) 24,552 (23,213) 1,339
5. construction in progress and advance payments 1,828,267 0 0 1,828,267 (1,532,785) 4,297,979 0 0 0 4,593,461 0 4,593,461
Total 393,246,208 38,385,096 (362,302,117) 69,329,187 (13,000) 14,233,482 (80,980,242) 75,368,523 (17,283,962) 364,871,544 (304,217,556) 60,653,988

113Allegati alla nota integrativa / Annexes to the notes to the financial statementsments
ALLEGATO 4 - MOVIMENTI DELLE IMMOBILIZZAZIONI MATERIALI
Movimenti degli esercizi precedenti Movimenti dell’esercizio Consistenza finale
Costo Storico RivalutazioneFondo
Ammortamento Totale
Riclassificazionie stralci:
centro storico Acquisizione AlienazioneUtilizzo Fondo
Ammortamento Ammortamento Valore lordo (a)Fondo
Ammortamento (b)Valore
di bilancio (a-b)
1. terreni e fabbricati 11.908.464 996.428 (3.778.361) 9.126.531 55.249 209.670 (714.131) 31.301 (279.908) 12.455.680 (4.026.968) 8.428.712
1.01 terreni 987.283 57.762 0 1.045.045 0 0 0 0 0 1.045.045 0 1.045.045
1.03 fabbricati industriali 10.094.340 938.666 (3.386.951) 7.646.055 0 165.723 (684.651) 17.527 (207.821) 10.514.078 (3.577.245) 6.936.833
1.04 costruzioni leggere 826.841 0 (391.410) 435.431 55.249 43.947 (29.480) 13.774 (72.087) 896.557 (449.723) 446.834
2. impianti e macchinario 215.739.444 37.311.975 (222.352.287) 30.699.132 680.865 3.611.907 (58.738.938) 55.924.160 (8.434.046) 198.605.253 (174.862.173) 23.743.080
2.01 impianti 13.526.102 128.664 (9.239.231) 4.415.535 253.680 2.001.305 (4.583.326) 3.978.457 (835.549) 11.326.425 (6.096.323) 5.230.102
2.02 macchinario 202.213.342 37.183.311 (213.113.056) 26.283.597 427.185 1.610.602 (54.155.612) 51.945.703 (7.598.497) 187.278.828 (168.765.850) 18.512.978
3. attrezzature industriali e commerciali 151.394.812 53.130 (125.068.698) 26.379.244 757.524 5.384.482 (19.995.794) 17.972.978 (8.082.196) 137.594.154 (115.177.916) 22.416.238
3.01 attrezzature 151.394.812 53.130 (125.068.698) 26.379.244 757.524 5.384.482 (19.995.794) 17.972.978 (8.082.196) 137.594.154 (115.177.916) 22.416.238
4. altri beni 12.375.221 23.563 (11.102.771) 1.296.013 26.147 729.444 (1.531.379) 1.440.084 (487.812) 11.622.996 (10.150.499) 1.472.497
4.01 mobili e arredi 7.028.686 23.027 (6.136.307) 915.406 22.944 308.119 (471.604) 454.972 (320.365) 6.911.172 (6.001.700) 909.472
4.02 macchine ufficio elettroniche 4.627.015 536 (4.406.074) 221.477 3.203 418.575 (536.411) 536.412 (135.488) 4.512.918 (4.005.150) 507.768
4.03 automezzi 694.968 0 (539.855) 155.113 0 2.750 (523.364) 448.700 (29.281) 174.354 (120.436) 53.918
4.05 macchine ufficio ordinarie 24.552 0 (20.535) 4.017 0 0 0 0 (2.678) 24.552 (23.213) 1.339
5. immobilizzazioni in corso e acconti 1.828.267 0 0 1.828.267 (1.532.785) 4.297.979 0 0 0 4.593.461 0 4.593.461
Totale 393.246.208 38.385.096 (362.302.117) 69.329.187 (13.000) 14.233.482 (80.980.242) 75.368.523 (17.283.962) 364.871.544 (304.217.556) 60.653.988
ANNEX 4 - MOVEMENTS OF TANGIBLE FIXED ASSETS
Movements in previous years Movements during the year Final balance
Historical Cost RevaluationAmortisation
Fund Total
Reclassificationsand settlements:
Historical cost Acquisition Disposal
UseAmortisation
Fund Amortisation Gross value (a)Amortisation
Fund (b)Book value
(a-b)
1. land and buildings 11,908,464 996,428 (3,778,361) 9,126,531 55,249 209,670 (714,131) 31,301 (279,908) 12,455,680 (4,026,968) 8,428,712
1.01 land 987,283 57,762 0 1,045,045 0 0 0 0 0 1,045,045 0 1,045,045
1.03 industrial buildings 10,094,340 938,666 (3,386,951) 7,646,055 0 165,723 (684,651) 17,527 (207,821) 10,514,078 (3,577,245) 6,936,833
1.04 light constructions 826,841 0 (391,410) 435,431 55,249 43,947 (29,480) 13,774 (72,087) 896,557 (449,723) 446,834
2. systems and machinery 215,739,444 37,311,975 (222,352,287) 30,699,132 680,865 3,611,907 (58,738,938) 55,924,160 (8,434,046) 198,605,253 (174,862,173) 23,743,080
2.01 systems 13,526,102 128,664 (9,239,231) 4,415,535 253,680 2,001,305 (4,583,326) 3,978,457 (835,549) 11,326,425 (6,096,323) 5,230,102
2.02 machinery 202,213,342 37,183,311 (213,113,056) 26,283,597 427,185 1,610,602 (54,155,612) 51,945,703 (7,598,497) 187,278,828 (168,765,850) 18,512,978
3. industrial and commercial equipment 151,394,812 53,130 (125,068,698) 26,379,244 757,524 5,384,482 (19,995,794) 17,972,978 (8,082,196) 137,594,154 (115,177,916) 22,416,238
3.01 equipment 151,394,812 53,130 (125,068,698) 26,379,244 757,524 5,384,482 (19,995,794) 17,972,978 (8,082,196) 137,594,154 (115,177,916) 22,416,238
4. other assets 12,375,221 23,563 (11,102,771) 1,296,013 26,147 729,444 (1,531,379) 1,440,084 (487,812) 11,622,996 (10,150,499) 1,472,497
4.01 furniture and furnishings 7,028,686 23,027 (6,136,307) 915,406 22,944 308,119 (471,604) 454,972 (320,365) 6,911,172 (6,001,700) 909,472
4.02 electronic office equipment 4,627,015 536 (4,406,074) 221,477 3,203 418,575 (536,411) 536,412 (135,488) 4,512,918 (4,005,150) 507,768
4.03 vehicles 694,968 0 (539,855) 155,113 0 2,750 (523,364) 448,700 (29,281) 174,354 (120,436) 53,918
4.05 ordinary office equipment 24,552 0 (20,535) 4,017 0 0 0 0 (2,678) 24,552 (23,213) 1,339
5. construction in progress and advance payments 1,828,267 0 0 1,828,267 (1,532,785) 4,297,979 0 0 0 4,593,461 0 4,593,461
Total 393,246,208 38,385,096 (362,302,117) 69,329,187 (13,000) 14,233,482 (80,980,242) 75,368,523 (17,283,962) 364,871,544 (304,217,556) 60,653,988

114 Allegati alla nota integrativa / Annexes to the notes to the financial statements
ALLEGATO 5 - MOVIMENTI DELLE IMMOBILIZZAZIONI FINANZIARIE
Movimenti degli esercizi precedenti Movimenti dell’esercizio
Costo Storico
Rivalutazione /Versamenti
in conto capitaleRettifiche di valore Totale
Riclassificazionie stralci Incrementi Costo storico
Fondo svalutazione
Consistenzafinale
1. partecipazioni in: 5.709.579 0 0 5.709.579 0 0 0 0 5.709.579
a. imprese controllate 5.703.595 0 0 5.703.595 0 0 0 0 5.703.595
Graziano Trasmissioni UK Ltd con sede in St.Neots Huntingdon (GB) quota posseduta 100,0% (bilancio al 31/12/2012) 44.231 0 0 44.231 0 0 0 0 44.231
Graziano Trasmissioni India Pvt Ltd 4654/21 Ansari Road Darya Ganj New Delhi -110002 India, quota posseduta al 100% Capitale autorizzato RPS 280.000.000 rapporto 68,713 (bilancio pro-forma al 31/12/2012) 5.534.670 0 0 5.534.670 0 5.534.670
Vocis Driveline Controls Ltd American Barns - Banbury Road - Lighthorne - Warwickshire quota posseduta al 51% (Bilancio al 31.12.2012) 124.694 124.694 124.694
d. altre imprese 5.984 0 0 5.984 0 0 0 0 5.984
Quote in consorzi diversi 5.984 0 0 5.984 0 0 0 0 5.984
2. crediti: 151.641 0 0 151.641
d. verso altri: 0 0 (108.129) 0 43.512
- scadenti entro 12 mesi 100.000 0 0 100.000 (100.000) 0 0
- scadenti oltre 12 mesi 51.641 0 0 51.641 0 0 (8.129) 0 43.512
4. azioni proprie 15.447.311 0 0 15.447.311 0 0 0 0 15.447.311
Totale 21.308.531 0 0 21.308.531 0 0 (108.129) 0 21.200.402
ANNEX 5 - MOVEMENTS OF FINANCIAL FIXED ASSETS
Movements in previous years Movements during the year
HistoricalCost
Revaluation /Payments into
capital account Value
adjustments TotalReclassificationsand settlements Increases Historical cost
Depreciation fund Final balance
1. equity investments in: 5,709,579 0 0 5,709,579 0 0 0 0 5,709,579
a. subsidiaries 5,703,595 0 0 5,703,595 0 0 0 0 5,703,595
Graziano Trasmissioni UK Ltd with reg. office in St.Neots Huntingdon (GB) share held: 100% (financial statements at 31/12/2012) 44,231 0 0 44,231 0 0 0 0 44,231
Graziano Trasmissioni India Pvt Ltd 4654/21 Ansari Road Darya Ganj New Delhi -110002 India, share held: 100% Authorised capital RPS 280,000,000 ratio 72.56 (pro-forma financial statements at 31/12/2012) 5,534,670 0 0 5,534,670 0 5,534,670
Vocis Driveline Controls Ltd American Barns - Banbury Road - Lighthorne - Warwickshire share held: 51% (financial statements at 31/12/2012) 124,694 124,694 124,694
d. other companies 5,984 0 0 5,984 0 0 0 0 5,984
Shares in other consortia 5,984 0 0 5,984 0 0 0 0 5,984
2. receivables: 151,641 0 0 151,641
d. from others: 0 0 (108,129) 0 43,512
- maturing within 12 months 100,000 0 0 100,000 (100,000) 0 0
- maturing after 12 months 51,641 0 0 51,641 0 0 (8,129) 0 43,512
4. own shares 15,447,311 0 0 15,447,311 0 0 0 0 15,447,311
Total 21,308,531 0 0 21,308,531 0 0 (108,129) 0 21,200,402

115Allegati alla nota integrativa / Annexes to the notes to the financial statements
ALLEGATO 5 - MOVIMENTI DELLE IMMOBILIZZAZIONI FINANZIARIE
Movimenti degli esercizi precedenti Movimenti dell’esercizio
Costo Storico
Rivalutazione /Versamenti
in conto capitaleRettifiche di valore Totale
Riclassificazionie stralci Incrementi Costo storico
Fondo svalutazione
Consistenzafinale
1. partecipazioni in: 5.709.579 0 0 5.709.579 0 0 0 0 5.709.579
a. imprese controllate 5.703.595 0 0 5.703.595 0 0 0 0 5.703.595
Graziano Trasmissioni UK Ltd con sede in St.Neots Huntingdon (GB) quota posseduta 100,0% (bilancio al 31/12/2012) 44.231 0 0 44.231 0 0 0 0 44.231
Graziano Trasmissioni India Pvt Ltd 4654/21 Ansari Road Darya Ganj New Delhi -110002 India, quota posseduta al 100% Capitale autorizzato RPS 280.000.000 rapporto 68,713 (bilancio pro-forma al 31/12/2012) 5.534.670 0 0 5.534.670 0 5.534.670
Vocis Driveline Controls Ltd American Barns - Banbury Road - Lighthorne - Warwickshire quota posseduta al 51% (Bilancio al 31.12.2012) 124.694 124.694 124.694
d. altre imprese 5.984 0 0 5.984 0 0 0 0 5.984
Quote in consorzi diversi 5.984 0 0 5.984 0 0 0 0 5.984
2. crediti: 151.641 0 0 151.641
d. verso altri: 0 0 (108.129) 0 43.512
- scadenti entro 12 mesi 100.000 0 0 100.000 (100.000) 0 0
- scadenti oltre 12 mesi 51.641 0 0 51.641 0 0 (8.129) 0 43.512
4. azioni proprie 15.447.311 0 0 15.447.311 0 0 0 0 15.447.311
Totale 21.308.531 0 0 21.308.531 0 0 (108.129) 0 21.200.402
ANNEX 5 - MOVEMENTS OF FINANCIAL FIXED ASSETS
Movements in previous years Movements during the year
HistoricalCost
Revaluation /Payments into
capital account Value
adjustments TotalReclassificationsand settlements Increases Historical cost
Depreciation fund Final balance
1. equity investments in: 5,709,579 0 0 5,709,579 0 0 0 0 5,709,579
a. subsidiaries 5,703,595 0 0 5,703,595 0 0 0 0 5,703,595
Graziano Trasmissioni UK Ltd with reg. office in St.Neots Huntingdon (GB) share held: 100% (financial statements at 31/12/2012) 44,231 0 0 44,231 0 0 0 0 44,231
Graziano Trasmissioni India Pvt Ltd 4654/21 Ansari Road Darya Ganj New Delhi -110002 India, share held: 100% Authorised capital RPS 280,000,000 ratio 72.56 (pro-forma financial statements at 31/12/2012) 5,534,670 0 0 5,534,670 0 5,534,670
Vocis Driveline Controls Ltd American Barns - Banbury Road - Lighthorne - Warwickshire share held: 51% (financial statements at 31/12/2012) 124,694 124,694 124,694
d. other companies 5,984 0 0 5,984 0 0 0 0 5,984
Shares in other consortia 5,984 0 0 5,984 0 0 0 0 5,984
2. receivables: 151,641 0 0 151,641
d. from others: 0 0 (108,129) 0 43,512
- maturing within 12 months 100,000 0 0 100,000 (100,000) 0 0
- maturing after 12 months 51,641 0 0 51,641 0 0 (8,129) 0 43,512
4. own shares 15,447,311 0 0 15,447,311 0 0 0 0 15,447,311
Total 21,308,531 0 0 21,308,531 0 0 (108,129) 0 21,200,402

116 Allegati alla nota integrativa / Annexes to the notes to the financial statements
ALLEGATO 6 - COMUNICAZIONI AI SENSI DELL’ARTICOLO 10 L. 72/83 E ARTICOLO 25 L. 413/91
Costo StoricoRivalutazione
legge 576 / 75Rivalutazione
L. 82 VisentiniRivalutazionelegge 72 / 83
Rivalutazionelegge 413 / 91
Rivalutazioneda Fusione
RivalutazioneL. 342 / 2000
Rivalutazione2423 bis C.C.
Valore lordodi bilancio
terreni e fabbricati
terreni 987.283 0 24.682 0 33.080 0 0 0 1.045.045
fabbricati industriali 9.575.412 0 429.085 0 509.581 0 0 0 10.514.078
costruzioni leggere 896.557 0 0 0 0 0 0 0 896.557
impianti e macchinario
impianti 11.197.761 0 128.664 0 0 0 0 0 11.326.425
macchinario 157.278.591 47.707 1.881.764 0 0 11.290.580 16.065.235 714.951 187.278.828
attrezzature industriali e commerciali
attrezzature 137.541.024 53.130 0 0 0 0 0 0 137.594.154
altri beni
mobili e arredi 6.888.146 8.187 14.840 0 0 0 0 0 6.911.173
macchine ufficio elettroniche 4.512.382 151 385 0 0 0 0 0 4.512.918
automezzi 174.354 0 0 0 0 0 0 0 174.354
macchine ufficio ordinarie 24.552 0 0 0 0 0 0 0 24.552
Totale 329.076.062 109.175 2.479.420 0 542.661 11.290.580 16.065.235 714.951 360.278.084
ANNEX 6 - COMMUNICATIONS IN ACCORDANCE WITH ARTICLE 10 L. 72/83 AND ARTICLE 25 L. 413/91
Historical CostRevaluation
law 576 / 75Revaluation
L. 82 VisentiniRevaluationlaw 72 / 83
Revaluationlaw 413 / 91
Revaluationfrom Merger
RevaluationL. 342/2000
Revaluation 2423 bis C.C. Gross book value
land and buildings
land 987,283 0 24,682 0 33,080 0 0 0 1,045,045
industrial buildings 9,575,412 0 429,085 0 509,581 0 0 0 10,514,078
light constructions 896,557 0 0 0 0 0 0 0 896,557
systems and machinery
systems 11,197,761 0 128,664 0 0 0 0 0 11,326,425
machinery 157,278,591 47,707 1,881,764 0 0 11,290,580 16,065,235 714,951 187,278,828
industrial and commercial equipment
equipment 137,541,024 53,130 0 0 0 0 0 0 137,594,154
other assets
furniture and furnishings 6,888,146 8,187 14,840 0 0 0 0 0 6,911,173
electronic office equipment 4,512,382 151 385 0 0 0 0 0 4,512,918
vehicles 174,354 0 0 0 0 0 0 0 174,354
ordinary office equipment 24,552 0 0 0 0 0 0 0 24,552
Total 329,076,062 109,175 2,479,420 0 542,661 11,290,580 16,065,235 714,951 360,278,084

117Allegati alla nota integrativa / Annexes to the notes to the financial statements
ALLEGATO 6 - COMUNICAZIONI AI SENSI DELL’ARTICOLO 10 L. 72/83 E ARTICOLO 25 L. 413/91
Costo StoricoRivalutazione
legge 576 / 75Rivalutazione
L. 82 VisentiniRivalutazionelegge 72 / 83
Rivalutazionelegge 413 / 91
Rivalutazioneda Fusione
RivalutazioneL. 342 / 2000
Rivalutazione2423 bis C.C.
Valore lordodi bilancio
terreni e fabbricati
terreni 987.283 0 24.682 0 33.080 0 0 0 1.045.045
fabbricati industriali 9.575.412 0 429.085 0 509.581 0 0 0 10.514.078
costruzioni leggere 896.557 0 0 0 0 0 0 0 896.557
impianti e macchinario
impianti 11.197.761 0 128.664 0 0 0 0 0 11.326.425
macchinario 157.278.591 47.707 1.881.764 0 0 11.290.580 16.065.235 714.951 187.278.828
attrezzature industriali e commerciali
attrezzature 137.541.024 53.130 0 0 0 0 0 0 137.594.154
altri beni
mobili e arredi 6.888.146 8.187 14.840 0 0 0 0 0 6.911.173
macchine ufficio elettroniche 4.512.382 151 385 0 0 0 0 0 4.512.918
automezzi 174.354 0 0 0 0 0 0 0 174.354
macchine ufficio ordinarie 24.552 0 0 0 0 0 0 0 24.552
Totale 329.076.062 109.175 2.479.420 0 542.661 11.290.580 16.065.235 714.951 360.278.084
ANNEX 6 - COMMUNICATIONS IN ACCORDANCE WITH ARTICLE 10 L. 72/83 AND ARTICLE 25 L. 413/91
Historical CostRevaluation
law 576 / 75Revaluation
L. 82 VisentiniRevaluationlaw 72 / 83
Revaluationlaw 413 / 91
Revaluationfrom Merger
RevaluationL. 342/2000
Revaluation 2423 bis C.C. Gross book value
land and buildings
land 987,283 0 24,682 0 33,080 0 0 0 1,045,045
industrial buildings 9,575,412 0 429,085 0 509,581 0 0 0 10,514,078
light constructions 896,557 0 0 0 0 0 0 0 896,557
systems and machinery
systems 11,197,761 0 128,664 0 0 0 0 0 11,326,425
machinery 157,278,591 47,707 1,881,764 0 0 11,290,580 16,065,235 714,951 187,278,828
industrial and commercial equipment
equipment 137,541,024 53,130 0 0 0 0 0 0 137,594,154
other assets
furniture and furnishings 6,888,146 8,187 14,840 0 0 0 0 0 6,911,173
electronic office equipment 4,512,382 151 385 0 0 0 0 0 4,512,918
vehicles 174,354 0 0 0 0 0 0 0 174,354
ordinary office equipment 24,552 0 0 0 0 0 0 0 24,552
Total 329,076,062 109,175 2,479,420 0 542,661 11,290,580 16,065,235 714,951 360,278,084
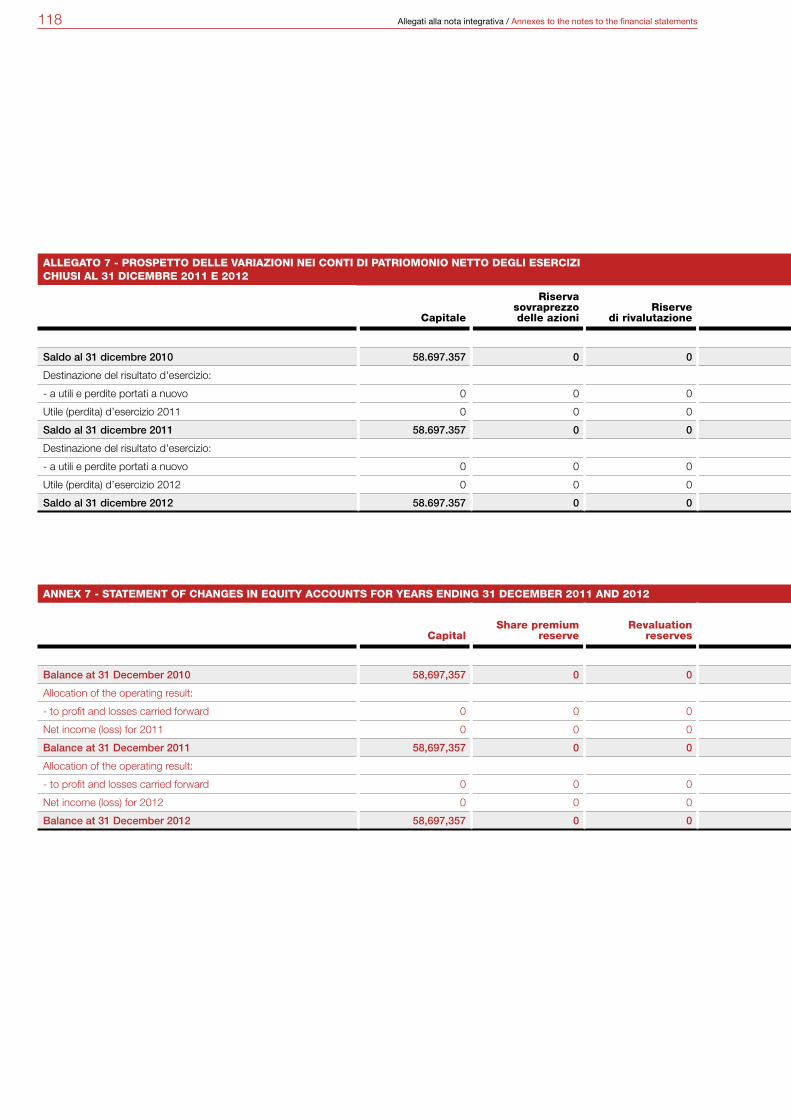
118 Allegati alla nota integrativa / Annexes to the notes to the financial statements
ALLEGATO 7 - PROSPETTO DELLE VARIAZIONI NEI CONTI DI PATRIOMONIO NETTO DEGLI ESERCIZI CHIUSI AL 31 DICEMBRE 2011 E 2012
Capitale
Riserva sovraprezzo delle azioni
Riserve di rivalutazione Riserva legale
Riservaazioni prorie
in portafoglio Altre riserveUtili (perdite)
portati a nuovoUtile (perdita) dell’esercizio Totale
Saldo al 31 dicembre 2010 58.697.357 0 0 2.597.200 15.447.311 116.572.007 (54.331.293) (33.749.771) 105.232.811
Destinazione del risultato d'esercizio:
- a utili e perdite portati a nuovo 0 0 0 0 0 0 (33.749.771) 33.749.771 0
Utile (perdita) d’esercizio 2011 0 0 0 0 0 (8) 0 (5.038.172) (5.038.180)
Saldo al 31 dicembre 2011 58.697.357 0 0 2.597.200 15.447.311 116.571.999 (88.081.064) (5.038.172) 100.194.631
Destinazione del risultato d'esercizio:
- a utili e perdite portati a nuovo 0 0 0 0 0 0 (5.038.172) 5.038.172 0
Utile (perdita) d’esercizio 2012 0 0 0 0 0 2 0 4.161.242 4.161.244
Saldo al 31 dicembre 2012 58.697.357 0 0 2.597.200 15.447.311 116.572.001 (93.119.236) 4.161.242 104.355.875
ANNEX 7 - STATEMENT OF CHANGES IN EQUITY ACCOUNTS FOR YEARS ENDING 31 DECEMBER 2011 AND 2012
CapitalShare premium
reserveRevaluation
reserves Legal reserve
Reserve for own shares
in portfolioOther
reservesProfit (losses)
carried forwardProfit (loss) for the year Total
Balance at 31 December 2010 58,697,357 0 0 2,597,200 15,447,311 116,572,007 (54,331,293) (33,749,771) 105,232,811
Allocation of the operating result:
- to profit and losses carried forward 0 0 0 0 0 0 (33,749,771) 33,749,771 0
Net income (loss) for 2011 0 0 0 0 0 (8) 0 (5,038,172) (5,038,180)
Balance at 31 December 2011 58,697,357 0 0 2,597,200 15,447,311 116,571,999 (88,081,064) (5,038,172) 100,194,631
Allocation of the operating result:
- to profit and losses carried forward 0 0 0 0 0 0 (5,038,172) 5,038,172 0
Net income (loss) for 2012 0 0 0 0 0 2 0 4,161,242 4,161,244
Balance at 31 December 2012 58,697,357 0 0 2,597,200 15,447,311 116,572,001 (93,119,236) 4,161,242 104,355,875
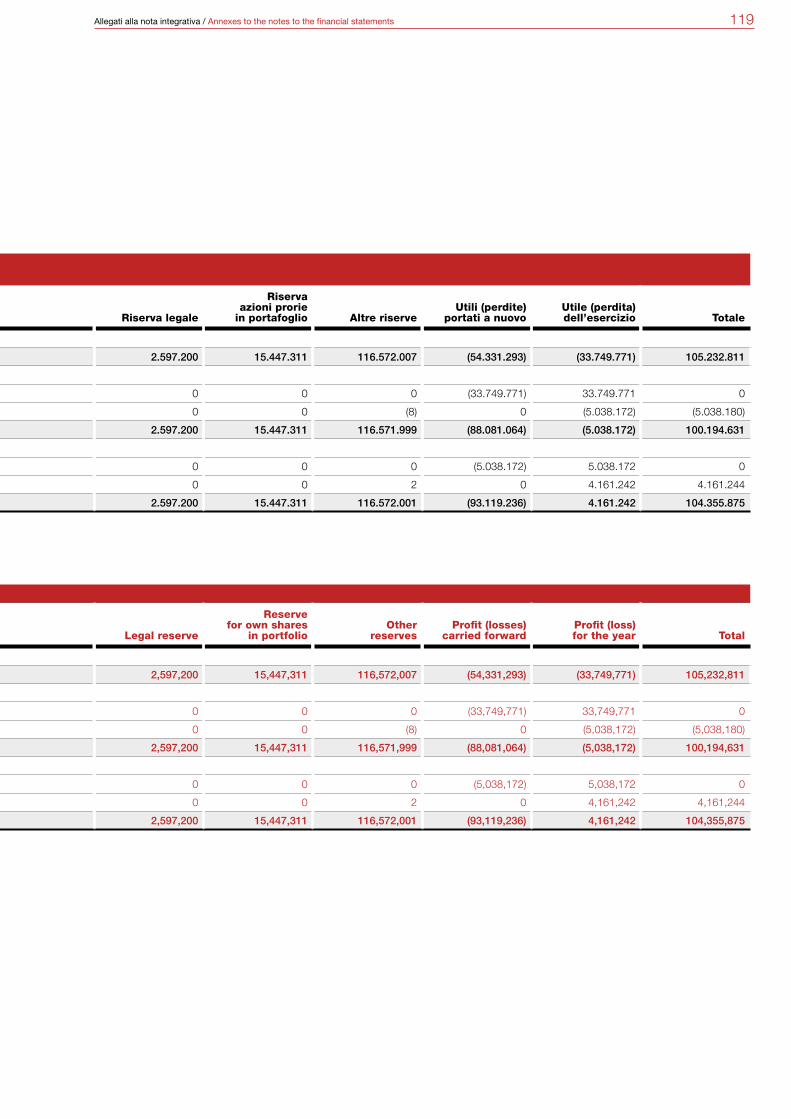
119Allegati alla nota integrativa / Annexes to the notes to the financial statements
ALLEGATO 7 - PROSPETTO DELLE VARIAZIONI NEI CONTI DI PATRIOMONIO NETTO DEGLI ESERCIZI CHIUSI AL 31 DICEMBRE 2011 E 2012
Capitale
Riserva sovraprezzo delle azioni
Riserve di rivalutazione Riserva legale
Riservaazioni prorie
in portafoglio Altre riserveUtili (perdite)
portati a nuovoUtile (perdita) dell’esercizio Totale
Saldo al 31 dicembre 2010 58.697.357 0 0 2.597.200 15.447.311 116.572.007 (54.331.293) (33.749.771) 105.232.811
Destinazione del risultato d'esercizio:
- a utili e perdite portati a nuovo 0 0 0 0 0 0 (33.749.771) 33.749.771 0
Utile (perdita) d’esercizio 2011 0 0 0 0 0 (8) 0 (5.038.172) (5.038.180)
Saldo al 31 dicembre 2011 58.697.357 0 0 2.597.200 15.447.311 116.571.999 (88.081.064) (5.038.172) 100.194.631
Destinazione del risultato d'esercizio:
- a utili e perdite portati a nuovo 0 0 0 0 0 0 (5.038.172) 5.038.172 0
Utile (perdita) d’esercizio 2012 0 0 0 0 0 2 0 4.161.242 4.161.244
Saldo al 31 dicembre 2012 58.697.357 0 0 2.597.200 15.447.311 116.572.001 (93.119.236) 4.161.242 104.355.875
ANNEX 7 - STATEMENT OF CHANGES IN EQUITY ACCOUNTS FOR YEARS ENDING 31 DECEMBER 2011 AND 2012
CapitalShare premium
reserveRevaluation
reserves Legal reserve
Reserve for own shares
in portfolioOther
reservesProfit (losses)
carried forwardProfit (loss) for the year Total
Balance at 31 December 2010 58,697,357 0 0 2,597,200 15,447,311 116,572,007 (54,331,293) (33,749,771) 105,232,811
Allocation of the operating result:
- to profit and losses carried forward 0 0 0 0 0 0 (33,749,771) 33,749,771 0
Net income (loss) for 2011 0 0 0 0 0 (8) 0 (5,038,172) (5,038,180)
Balance at 31 December 2011 58,697,357 0 0 2,597,200 15,447,311 116,571,999 (88,081,064) (5,038,172) 100,194,631
Allocation of the operating result:
- to profit and losses carried forward 0 0 0 0 0 0 (5,038,172) 5,038,172 0
Net income (loss) for 2012 0 0 0 0 0 2 0 4,161,242 4,161,244
Balance at 31 December 2012 58,697,357 0 0 2,597,200 15,447,311 116,572,001 (93,119,236) 4,161,242 104,355,875
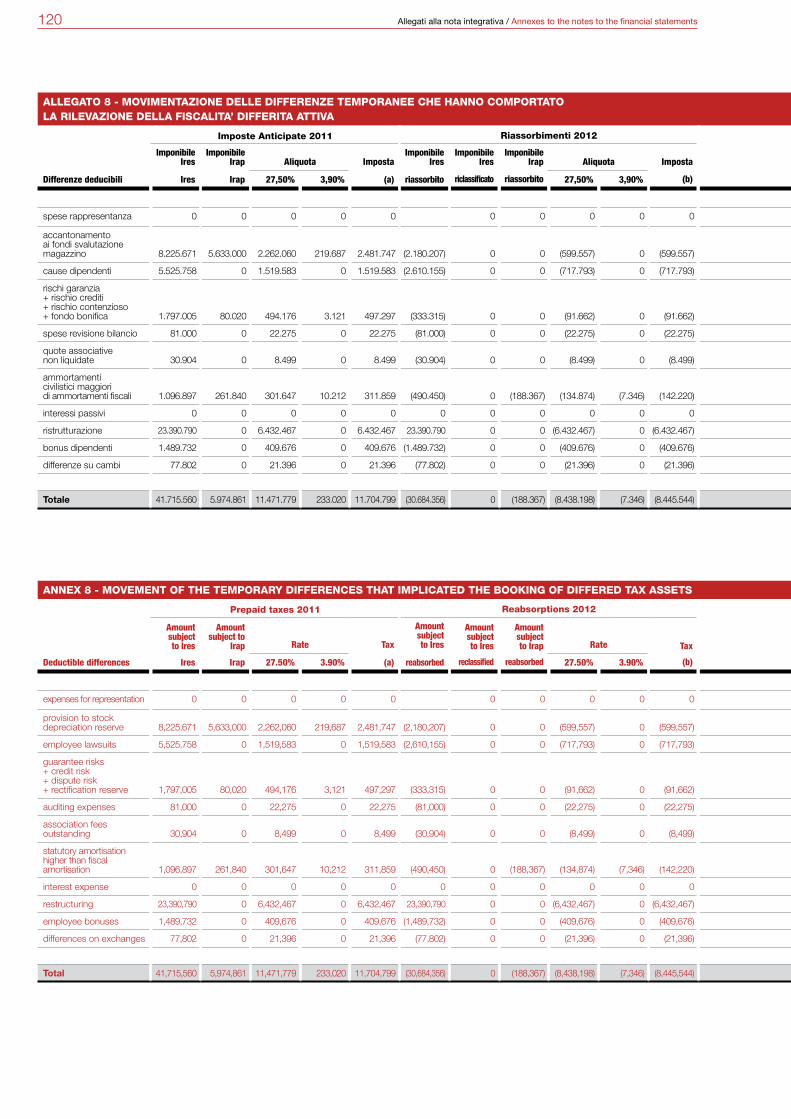
120 Allegati alla nota integrativa / Annexes to the notes to the financial statements
ALLEGATO 8 - MOVIMENTAZIONE DELLE DIFFERENZE TEMPORANEE CHE HANNO COMPORTATO LA RILEVAZIONE DELLA FISCALITA’ DIFFERITA ATTIVA
Imposte Anticipate 2011 Riassorbimenti 2012 Incrementi 2012 Imposte Anticipate 2012
Imponibile Ires
ImponibileIrap Aliquota Imposta
Imponibile Ires
Imponibile Ires
Imponibile Irap Aliquota Imposta Imponibile
Imponibile Ires Imponibile Aliquota Imposta Imponibile Imponibile Imposta
Differenze deducibili Ires Irap 27,50% 3,90% (a) riassorbito riclassificato riassorbito 27,50% 3,90% (b) Ires riclassificato Irap 27,50% 3,90% (c) Ires Irap Ires Irap
spese rappresentanza 0 0 0 0 0 0 0 0 0 0 0 0 0 0 0 0 0 0 0 0
accantonamento ai fondi svalutazione magazzino 8.225.671 5.633.000 2.262.060 219.687 2.481.747 (2.180.207) 0 0 (599.557) 0 (599.557) 0 0 0 0 0 0 6.045.464 5.633.000 1.662.503 219.687 1.882.190
cause dipendenti 5.525.758 0 1.519.583 0 1.519.583 (2.610.155) 0 0 (717.793) 0 (717.793) 147 0 0 40 0 40 2.915.750 0 801.831 0 801.831
rischi garanzia + rischio crediti + rischio contenzioso + fondo bonifica 1.797.005 80.020 494.176 3.121 497.297 (333.315) 0 0 (91.662) 0 (91.662) 1.391.242 0 0 382.592 0 382.592 2.854.932 80.020 785.106 3.121 788.227
spese revisione bilancio 81.000 0 22.275 0 22.275 (81.000) 0 0 (22.275) 0 (22.275) 62.170 0 0 17.097 0 17.097 62.170 0 17.097 0 17.097
quote associative non liquidate 30.904 0 8.499 0 8.499 (30.904) 0 0 (8.499) 0 (8.499) 41.148 0 0 11.316 0 11.316 41.148 0 11.316 0 11.316
ammortamenti civilistici maggiori di ammortamenti fiscali 1.096.897 261.840 301.647 10.212 311.859 (490.450) 0 (188.367) (134.874) (7.346) (142.220) 177.057 0 0 48.691 0 48.691 783.504 73.473 215.464 2.865 218.329
interessi passivi 0 0 0 0 0 0 0 0 0 0 0 0 0 0 0 0 0 0 0 0 0 0
ristrutturazione 23.390.790 0 6.432.467 0 6.432.467 23.390.790 0 0 (6.432.467) 0 (6.432.467) 0 0 0 0 0 0 0 0 0 0 0
bonus dipendenti 1.489.732 0 409.676 0 409.676 (1.489.732) 0 0 (409.676) 0 (409.676) 1.251.698 0 0 344.217 0 344.217 1.251.698 0 344.217 0 344.217
differenze su cambi 77.802 0 21.396 0 21.396 (77.802) 0 0 (21.396) 0 (21.396) 109.962 0 0 30.240 0 30.240 109.962 0 30.240 0 30.240
Totale 41.715.560 5.974.861 11.471.779 233.020 11.704.799 (30.684.356) 0 (188.367) (8.438.198) (7.346) (8.445.544) 3.033.424 0 0 834.192 0 834.192 14.064.628 5.786.494 3.867.773 225.673 4.093.446
ANNEX 8 - MOVEMENT OF THE TEMPORARY DIFFERENCES THAT IMPLICATED THE BOOKING OF DIFFERED TAX ASSETS
Prepaid taxes 2011 Reabsorptions 2012 Increases 2012 Prepaid taxes 2012
Amount subject to Ires
Amount subject to
Irap Rate Tax
Amount subject to Ires
Amount subject to Ires
Amount subject to Irap Rate Tax
Amount subject to
Amount subject to Ires
Amount subject to
Rate Tax Amount subject to
Amount subject to Tax
Deductible differences Ires Irap 27.50% 3.90% (a) reabsorbed reclassified reabsorbed 27.50% 3.90% (b) Ires reclassified Irap 27.50% 3.90% (c) Ires Irap Ires Irap
expenses for representation 0 0 0 0 0 0 0 0 0 0 0 0 0 0 0 0 0 0 0 0
provision to stock depreciation reserve 8,225,671 5,633,000 2,262,060 219,687 2,481,747 (2,180,207) 0 0 (599,557) 0 (599,557) 0 0 0 0 0 0 6,045,464 5,633,000 1,662,503 219,687 1,882,190
employee lawsuits 5,525,758 0 1,519,583 0 1,519,583 (2,610,155) 0 0 (717,793) 0 (717,793) 147 0 0 40 0 40 2,915,750 0 801,831 0 801,831
guarantee risks + credit risk + dispute risk + rectification reserve 1,797,005 80,020 494,176 3,121 497,297 (333,315) 0 0 (91,662) 0 (91,662) 1,391,242 0 0 382,592 0 382,592 2,854,932 80,020 785,106 3,121 788,227
auditing expenses 81,000 0 22,275 0 22,275 (81,000) 0 0 (22,275) 0 (22,275) 62,170 0 0 17,097 0 17,097 62,170 0 17,097 0 17,097
association fees outstanding 30,904 0 8,499 0 8,499 (30,904) 0 0 (8,499) 0 (8,499) 41,148 0 0 11,316 0 11,316 41,148 0 11,316 0 11,316
statutory amortisation higher than fiscal amortisation 1,096,897 261,840 301,647 10,212 311,859 (490,450) 0 (188,367) (134,874) (7,346) (142,220) 177,057 0 0 48,691 0 48,691 783,504 73,473 215,464 2,865 218,329
interest expense 0 0 0 0 0 0 0 0 0 0 0 0 0 0 0 0 0 0 0 0 0 0
restructuring 23,390,790 0 6,432,467 0 6,432,467 23,390,790 0 0 (6,432,467) 0 (6,432,467) 0 0 0 0 0 0 0 0 0 0 0
employee bonuses 1,489,732 0 409,676 0 409,676 (1,489,732) 0 0 (409,676) 0 (409,676) 1,251,698 0 0 344,217 0 344,217 1,251,698 0 344,217 0 344,217
differences on exchanges 77,802 0 21,396 0 21,396 (77,802) 0 0 (21,396) 0 (21,396) 109,962 0 0 30,240 0 30,240 109,962 0 30,240 0 30,240
Total 41,715,560 5,974,861 11,471,779 233,020 11,704,799 (30,684,356) 0 (188,367) (8,438,198) (7,346) (8,445,544) 3,033,424 0 0 834,192 0 834,192 14,064,628 5,786,494 3,867,773 225,673 4,093,446
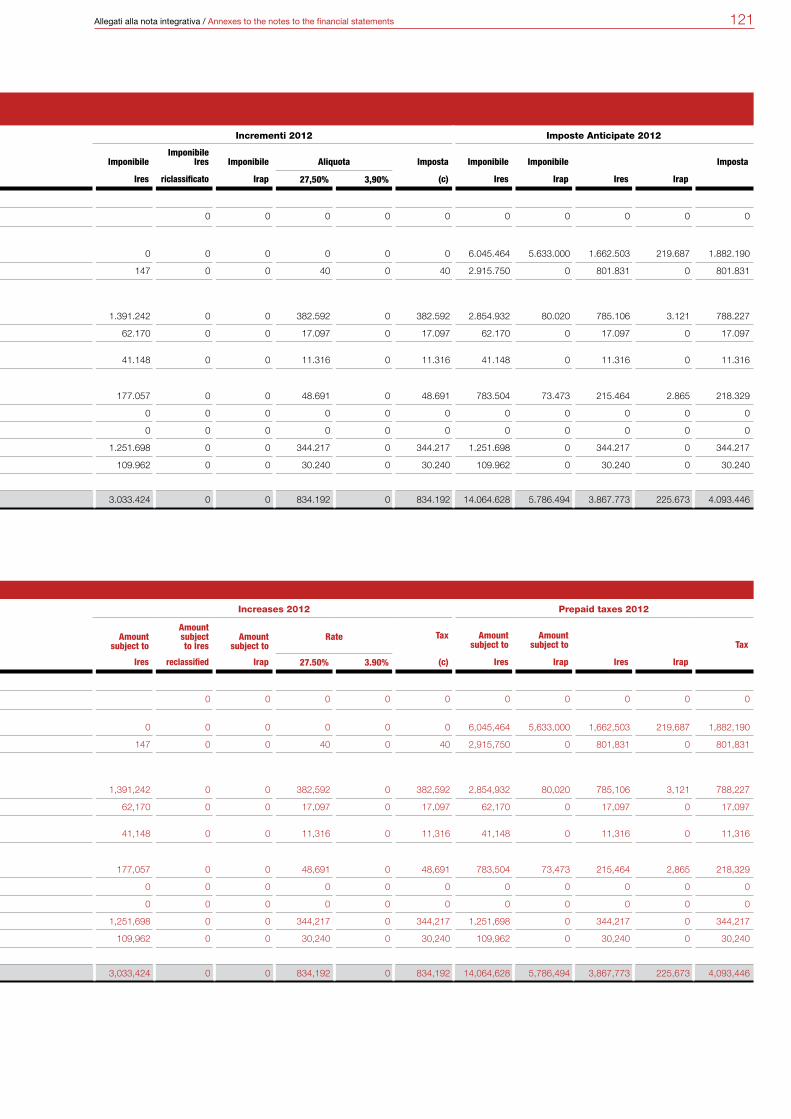
121Allegati alla nota integrativa / Annexes to the notes to the financial statements
ALLEGATO 8 - MOVIMENTAZIONE DELLE DIFFERENZE TEMPORANEE CHE HANNO COMPORTATO LA RILEVAZIONE DELLA FISCALITA’ DIFFERITA ATTIVA
Imposte Anticipate 2011 Riassorbimenti 2012 Incrementi 2012 Imposte Anticipate 2012
Imponibile Ires
ImponibileIrap Aliquota Imposta
Imponibile Ires
Imponibile Ires
Imponibile Irap Aliquota Imposta Imponibile
Imponibile Ires Imponibile Aliquota Imposta Imponibile Imponibile Imposta
Differenze deducibili Ires Irap 27,50% 3,90% (a) riassorbito riclassificato riassorbito 27,50% 3,90% (b) Ires riclassificato Irap 27,50% 3,90% (c) Ires Irap Ires Irap
spese rappresentanza 0 0 0 0 0 0 0 0 0 0 0 0 0 0 0 0 0 0 0 0
accantonamento ai fondi svalutazione magazzino 8.225.671 5.633.000 2.262.060 219.687 2.481.747 (2.180.207) 0 0 (599.557) 0 (599.557) 0 0 0 0 0 0 6.045.464 5.633.000 1.662.503 219.687 1.882.190
cause dipendenti 5.525.758 0 1.519.583 0 1.519.583 (2.610.155) 0 0 (717.793) 0 (717.793) 147 0 0 40 0 40 2.915.750 0 801.831 0 801.831
rischi garanzia + rischio crediti + rischio contenzioso + fondo bonifica 1.797.005 80.020 494.176 3.121 497.297 (333.315) 0 0 (91.662) 0 (91.662) 1.391.242 0 0 382.592 0 382.592 2.854.932 80.020 785.106 3.121 788.227
spese revisione bilancio 81.000 0 22.275 0 22.275 (81.000) 0 0 (22.275) 0 (22.275) 62.170 0 0 17.097 0 17.097 62.170 0 17.097 0 17.097
quote associative non liquidate 30.904 0 8.499 0 8.499 (30.904) 0 0 (8.499) 0 (8.499) 41.148 0 0 11.316 0 11.316 41.148 0 11.316 0 11.316
ammortamenti civilistici maggiori di ammortamenti fiscali 1.096.897 261.840 301.647 10.212 311.859 (490.450) 0 (188.367) (134.874) (7.346) (142.220) 177.057 0 0 48.691 0 48.691 783.504 73.473 215.464 2.865 218.329
interessi passivi 0 0 0 0 0 0 0 0 0 0 0 0 0 0 0 0 0 0 0 0 0 0
ristrutturazione 23.390.790 0 6.432.467 0 6.432.467 23.390.790 0 0 (6.432.467) 0 (6.432.467) 0 0 0 0 0 0 0 0 0 0 0
bonus dipendenti 1.489.732 0 409.676 0 409.676 (1.489.732) 0 0 (409.676) 0 (409.676) 1.251.698 0 0 344.217 0 344.217 1.251.698 0 344.217 0 344.217
differenze su cambi 77.802 0 21.396 0 21.396 (77.802) 0 0 (21.396) 0 (21.396) 109.962 0 0 30.240 0 30.240 109.962 0 30.240 0 30.240
Totale 41.715.560 5.974.861 11.471.779 233.020 11.704.799 (30.684.356) 0 (188.367) (8.438.198) (7.346) (8.445.544) 3.033.424 0 0 834.192 0 834.192 14.064.628 5.786.494 3.867.773 225.673 4.093.446
ANNEX 8 - MOVEMENT OF THE TEMPORARY DIFFERENCES THAT IMPLICATED THE BOOKING OF DIFFERED TAX ASSETS
Prepaid taxes 2011 Reabsorptions 2012 Increases 2012 Prepaid taxes 2012
Amount subject to Ires
Amount subject to
Irap Rate Tax
Amount subject to Ires
Amount subject to Ires
Amount subject to Irap Rate Tax
Amount subject to
Amount subject to Ires
Amount subject to
Rate Tax Amount subject to
Amount subject to Tax
Deductible differences Ires Irap 27.50% 3.90% (a) reabsorbed reclassified reabsorbed 27.50% 3.90% (b) Ires reclassified Irap 27.50% 3.90% (c) Ires Irap Ires Irap
expenses for representation 0 0 0 0 0 0 0 0 0 0 0 0 0 0 0 0 0 0 0 0
provision to stock depreciation reserve 8,225,671 5,633,000 2,262,060 219,687 2,481,747 (2,180,207) 0 0 (599,557) 0 (599,557) 0 0 0 0 0 0 6,045,464 5,633,000 1,662,503 219,687 1,882,190
employee lawsuits 5,525,758 0 1,519,583 0 1,519,583 (2,610,155) 0 0 (717,793) 0 (717,793) 147 0 0 40 0 40 2,915,750 0 801,831 0 801,831
guarantee risks + credit risk + dispute risk + rectification reserve 1,797,005 80,020 494,176 3,121 497,297 (333,315) 0 0 (91,662) 0 (91,662) 1,391,242 0 0 382,592 0 382,592 2,854,932 80,020 785,106 3,121 788,227
auditing expenses 81,000 0 22,275 0 22,275 (81,000) 0 0 (22,275) 0 (22,275) 62,170 0 0 17,097 0 17,097 62,170 0 17,097 0 17,097
association fees outstanding 30,904 0 8,499 0 8,499 (30,904) 0 0 (8,499) 0 (8,499) 41,148 0 0 11,316 0 11,316 41,148 0 11,316 0 11,316
statutory amortisation higher than fiscal amortisation 1,096,897 261,840 301,647 10,212 311,859 (490,450) 0 (188,367) (134,874) (7,346) (142,220) 177,057 0 0 48,691 0 48,691 783,504 73,473 215,464 2,865 218,329
interest expense 0 0 0 0 0 0 0 0 0 0 0 0 0 0 0 0 0 0 0 0 0 0
restructuring 23,390,790 0 6,432,467 0 6,432,467 23,390,790 0 0 (6,432,467) 0 (6,432,467) 0 0 0 0 0 0 0 0 0 0 0
employee bonuses 1,489,732 0 409,676 0 409,676 (1,489,732) 0 0 (409,676) 0 (409,676) 1,251,698 0 0 344,217 0 344,217 1,251,698 0 344,217 0 344,217
differences on exchanges 77,802 0 21,396 0 21,396 (77,802) 0 0 (21,396) 0 (21,396) 109,962 0 0 30,240 0 30,240 109,962 0 30,240 0 30,240
Total 41,715,560 5,974,861 11,471,779 233,020 11,704,799 (30,684,356) 0 (188,367) (8,438,198) (7,346) (8,445,544) 3,033,424 0 0 834,192 0 834,192 14,064,628 5,786,494 3,867,773 225,673 4,093,446

Relazione della Società di Revisione
Independent Auditor’s report
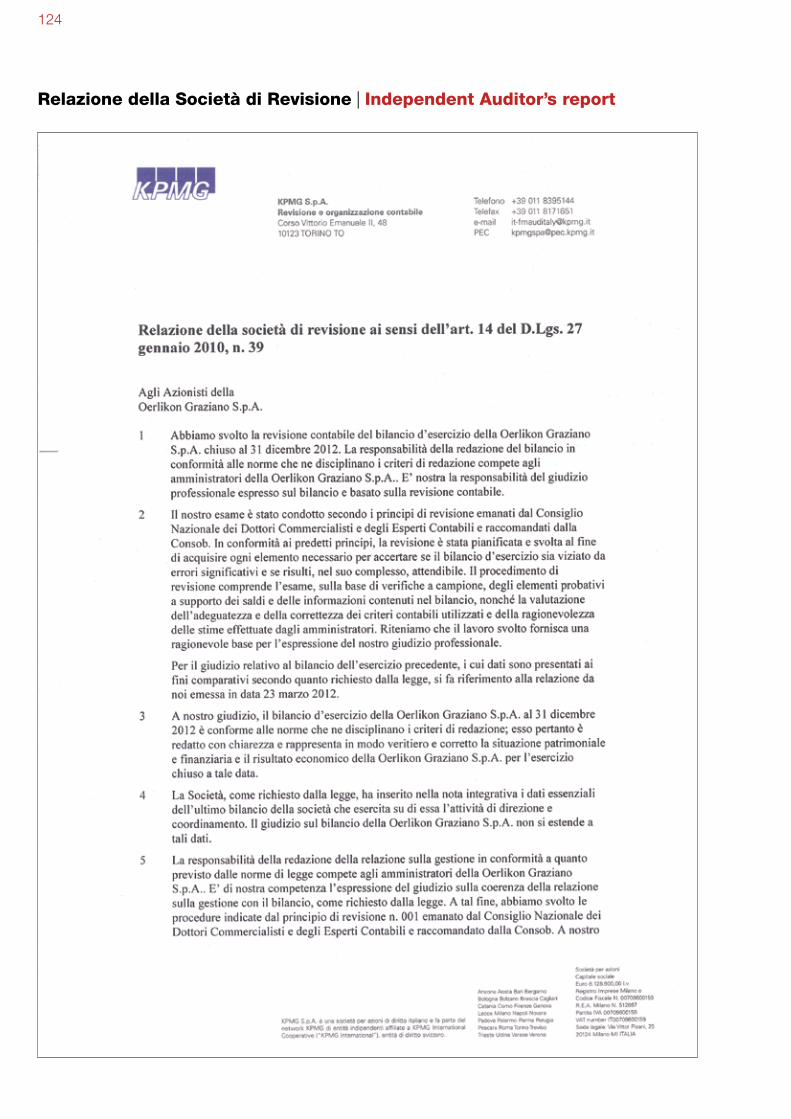
124
Relazione della Società di Revisione | Independent Auditor’s report

125
Relazione del Collegio Sindacale all’Assemblea dei Soci
Board of Statutory Auditors’ Report to the Shareholders’
Meeting

128
Relazione del Collegio Sindacale all’Assemblea dei SociBoard of Statutory Auditors’ Report to the Shareholders’ Meeting
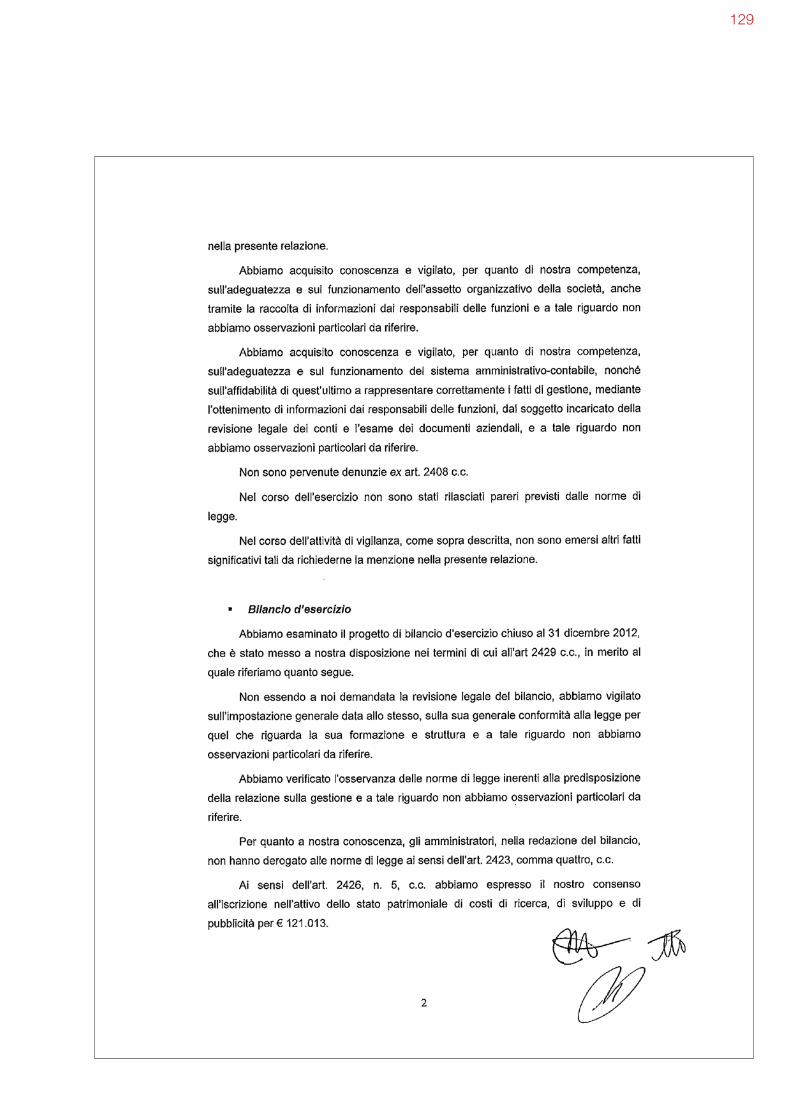
129
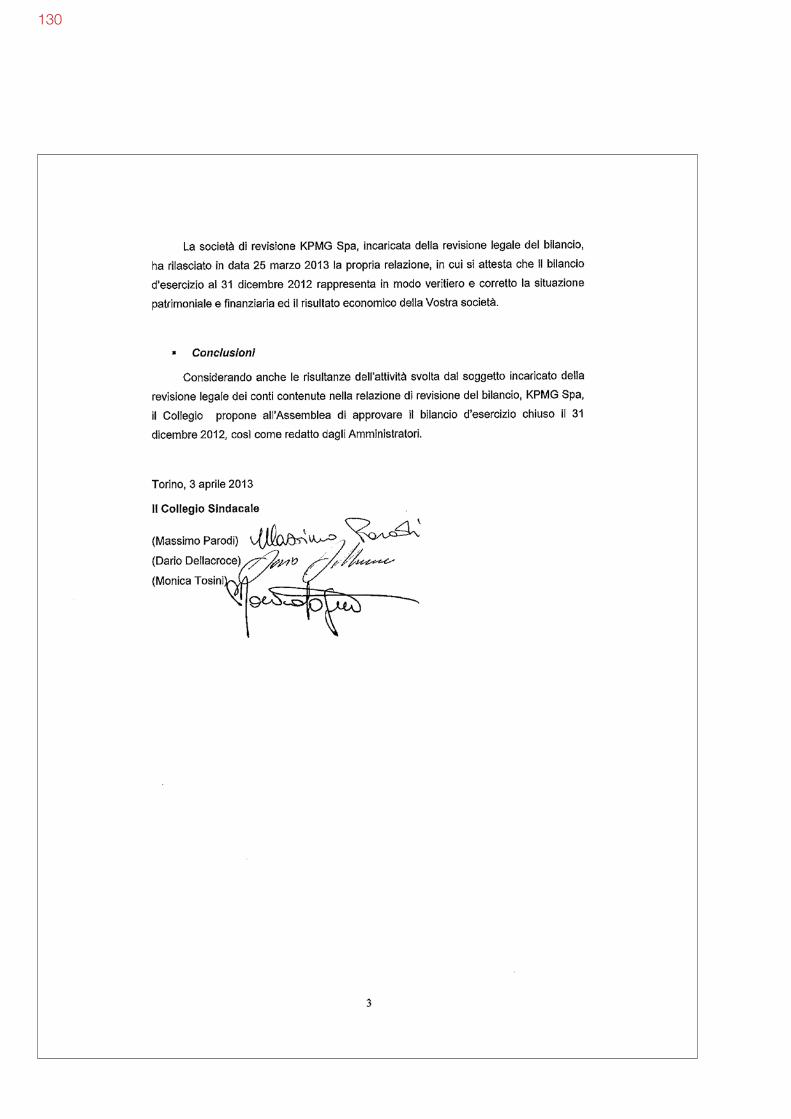
130


Oerlikon Graziano SpA
via Cumiana 1410098 Rivoli (Torino), Italytel./phone: +39 011 95701fax: +39 011 9594803
Pubblicato da | Published byOerlikon Graziano
DesignOpera
Stampa | PrintGaidano & Matta
Stampato su carta ecologica | Printed on ecologic paperScheufelen BVS
Aprile 2013 | 2013, April