2012 Annual Report PDF
200
2012 ANNUAL REPORT CONNECT
-
Upload
independent -
Category
Documents
-
view
0 -
download
0
Transcript of 2012 Annual Report PDF

2012 ANNUAL REPORT
CONNECT
6/20/13 2:14 PM

43271_Cvr.indd 4-5 6/21/13 9:16 AM

The traditional approach to healthcare creates fragmentation. Errors, unnecessary
tests, and lack of coordination result in costly
emergency room visits, extended hospital
stays, and preventable surgeries.
Our solutions close the gaps in today’s
frag ment ed healthcare landscape, allowing for
earlier interventions, personalized treatment,
fewer hospitalizations, better coordination, and
robust decision making, analysis, and reporting.
We help healthcare providers working across
the con tin uum of care deliver better outcomes
at both an individual and population level.
Alere Inc. 2012 Annual Report
Connected Healthcare 1
43271_Text.indd 1 6/20/13 11:05 AM

Connected Healthcare
Alere Inc. 2012 Annual Report
2
43271_Text.indd 2 6/20/13 11:05 AM

3Connected Healthcare
Alere Inc. 2012 Annual Report
43271_Text.indd 3 6/20/13 11:05 AM

Chairman’s Letter
Alere Inc. 2012 Annual Report
4
In 2012, Alere strengthened its position as the world’s leading provider of near-patient diagnostics, overcoming many of the regula-
tory challenges that often face large, global enterprises. We also broadened our footprint in the health information technology arena, adding a new set of tools to our portfolio that enable clinicians to make more effective health deci-sions in real time and better manage patients across the care continuum. Our commitment to empowering individuals to take greater control of their health under medical supervision remains strong, and we are rapidly progressing towards the achievement of this mission by continuing to move our diagnostic platforms closer to the patient. We are achieving this by integrating actionable data from these devices and other sources into longitudinal health records that all care providers can access, and supporting this engine with care manage-ment and monitoring programs that allow for earlier clinical interventions and facilitate true behavior change at the patient level.
As I visit our many offi ces around the world, I am reminded of how much our reach has grown, not just geographically, but also in terms of our ability to addressthe healthcare challenges facing individuals today. I am especially proud of the extent to which we have improved interaction among patients, care providers, and payers, activating information from diagnostic technologies in so many different areas of healthcare and in so many different venues.
For example, while a woman living in the remote corners of Africa with HIV is tested with our Alere™ CD4 Analyzer to monitor the effectiveness of her antiretroviral treatment, another woman in the United States uses the Alere INRatio® System to monitor her anticoagulation therapy from home. Concur-rently, a physician in India depends on our test for Dengue Fever to diagnose a critically ill patient, while doctors in an emergency room in Germany rely on the Alere Triage® tests to diagnose and manage patients who present with symptoms of chest pain and shortness of breath. Alere tests are being administered in virtually every country in the world, and we are the market’s leading diagnostic provider for several cardiovascular conditions, infectious and tropical diseases, and abused substances. These facts are a testament to both the quality and effectiveness of our products, as well as the commitment and innovation of our employees.
We also believe that fundamental changes to the way healthcare is practiced are inevitable, and we are in a position to successfully drive those changes well into the future. Providers will now be held more accountable for the effi cacy of their diagnoses and treatments, as well as their ability to control costs and im-prove outcomes at a population level. Our products, programs, and informationsolutions are designed to help them achieve these goals.
Alere™ CD4 Analyzer monitors the effectiveness of antiretroviral therapy.
CHAIRMAN’S LETTER
43271_Text.indd 4 6/20/13 11:05 AM

5Chairman’s Letter
Alere Inc. 2012 Annual Report
Today, for instance, chronic disease accounts for more than 60% of the world’s deaths, represents an enormous economic burden, and in 75% of cases can be prevented through effective behavior change programs such as those we offer. Chronically ill patients are also more likely to be hospitalized for critical events and treated by a variety of physicians beyond their general practitioners, most of whom work in separate record-keeping systems and consequently lack a holistic view into their patients’ health.
By feeding output from our near-patient monitoring platforms into a health information exchange, which also extracts data from disparate medical record systems and integrates it within a single electronic health record that all care providers can access, Alere is able to address the challenges encountered in treating people with chronic diseases. Our model not only improves the physician’s visibility into what is happening with the patient, but also deploys world-class analytics and decision support tools that enable healthcare providers to risk stratify patients more effectively, intervene earlier, personal-ize treatment plans, reduce costs by preventing hospital readmissions, and mea sure outcomes improvements at both a patient and population level.
Our acquisition pace slowed considerably in 2012, as we believe that the com-pany is essentially built to the degree that we had envisioned, but we did make a few small acquisitions this year to expand our diabetes supply business and strengthen our foothold in the health information arena. Going forward, we ascribe to the same approach towards acquisitions that we took in 2012, which consisted of some small, niche acquisitions to support our growth in health-care information technology and diabetes.
With regard to our R&D programs, 2012 provided FDA clearances for two new tests performed on our wireless point-of-care epoc® platform, creatinine and chloride. These tests, which have been added to the epoc® test card measuringblood gases, electrolytes and metabolites, will create new market opportunitiesfor Alere in hospital emergency room and radiology departments.
Two molecular programs stand out for 2013. We look forward to the launch of our rapid molecular HIV viral load device, the Alere™ Q, later this year. While initially developed to facilitate better monitoring and management of anti retro-viral therapy, we anticipate the expansion of the platform in the years ahead to support molecular testing for the Hepatitus C Virus and tuberculosis. In fact, we recently announced that we received a grant from the Bill & Melinda Gates Foundation that will help us expedite the development and commercializationof a tuberculosis test for this platform. We are also eagerly awaiting the launch of our second point-of-care molecular platform, the Alere™ I, which will initially feature a rapid fl u test, followed by applications for Strep A and other infectious diseases.
Chronic disease accounts for more than 60% of the world’s deaths.
75% of cases can be prevented through effective behavior change programs such as those we offer.
43271_Text.indd 5 6/20/13 11:05 AM

Chairman’s Letter
Alere Inc. 2012 Annual Report
6
In the area of Toxicology, we are very excited about the potential for our hand-held drug testing meter and expect to fi le for 510(k) clearance with the FDA in 2014. With the relaxation of laws related to marijuana possession in some states, and its legalization in others, state legislatures recognize the impor-tance of defi ning drug-impairment levels and their associated criminality. Our roadside testing device, a saliva-based system, will detect several different drugs, including marijuana. It is currently being evaluated by the NHTSA and some law enforcement agencies within the US and Canada. This device would also be effective for employers at the workplace.
Overall, 2012 was a year in which our vision of contributing to a connected healthcare system that incorporates patients, providers, and payers in a unifi ed model became more of a reality. With our near-patient diagnostic platforms connected to our proprietary health information exchange systems, we fi nd ourselves well positioned to deliver a better model of healthcare, providing better outcomes for patients, better real-time data for healthcare practitioners, and more effi cient cost structures for payers. When it comes to addressing and delivering these benefi ts, moreover, we feel we are at the forefront of the national dialogue.
Additionally, we are pleased to welcome Namal Nawana as our Chief OperatingOffi cer. Namal joined us in December, from Johnson & Johnson, where he most recently served as the Worldwide President of DePuy Synthes Spine and managed the company’s global operations. He was also responsible for the integration of several acquired businesses, including the multi-billion-dollar Synthes acquisition. We believe that Namal will be a perfect fi t to address the operational demands of our expanded global footprint, which necessi-tate the integration of the companies we have acquired to ensure consistent performance and accelerated growth, while reducing the cost to service our customers.
I believe that this is a most exciting time for Alere, as years of hard work and innovation are coalescing in the launch of several connected, proprietary near-patient diagnostic platforms, the company’s expansion into new geog-raphies where the introduction of these and existing platforms will drive rapid growth, and the widespread adoption of an internal philosophy that modifying behavior is key to improving health outcomes. None of this would be possible without the insight of our worldwide workforce and our employees’ commit-ment to put Alere at the forefront of innovation for connected healthcare, for which I sincerely thank them. I would also like to thank our long-term stake-holders for their continued faith in our vision, staying on board through some of the company’s more challenging periods, as well as our new stakeholders, for recognizing the importance of what we are trying to accomplish.
Ron ZwanzigerChairman, President, and CEO
43271_Text.indd 6 6/20/13 11:05 AM

The World’s Leading Provider of Rapid Diagnostics
7Diagnostics
Alere Inc. 2012 Annual Report
43271_Text.indd 7 6/20/13 11:05 AM

Diagnostics8
The Alere Triage® System
Leading diagnostic platform that helps physicians identify several critical health conditions, including heart failure and myo cardial infarction, and reduce the time to diagnosis by hours.
Improving Outcomes in Acute Care Settings // Our novel diagnostic tools enable medical professionals to evaluate risk, diagnose, and assess disease severity in acute care settings, helping to ensure that critically-ill patients receive the right course of treatment sooner.
The epoc® Blood Analysis System
Diagnostic platform that offers the broadest blood analysis menu on a single test card. With epoc®, critical care providers are not only able to detect several electrolyte and metabolic disorders in a matter of minutes, but they can also identify renal injury—which helps to expedite treatment, prevent more serious injury, and enable quicker recovery.
Featured Products
Alere Inc. 2012 Annual Report
43271_Text.indd 8 6/20/13 11:05 AM

9Diagnostics
Bringing Diagnosis Closer to the Patient // Our products and services enable the effective manage-ment of patients living with chronic conditions that include heart failure, diabetes, and dyslipidemia, as well as those taking oral anticoagulants.
Featured Products
The Alere™ Heart Check
FACT: 50% of hospitalizations for heart failure decompensation are preventable. Data from the recently published HABIT trial has shown that frequent BNP testing can identify risk for these events, which may trigger earlier interventions that reduce hospitalizations and readmissions.
Alere™ Home Monitoring
FACT: Alere™ Home Monitoring weekly patient self-testers spend 74% of the time in therapeutic range—which is signifi cantly better than the time individuals testing in leading anticoagulation clinics spend in therapeutic range.
Alere Cholestech LDX® System
FACT: Reductions in serum cholesterol can reduce heart disease risk by 50%, but as much as 1/3 of the population who may be at risk for developing heart disease is not screened. The Alere Cholestech LDX® System makes screening quick and easy at the point of care, allowing for responsive treatment that may help to reduce risk.
Alere Afi nion™ Analyzer
FACT: 20% of hospitalizations are diabetes-related. The Alere Afi nion™ Analyzer is one of the only systems in use today that provides a lab-quality reading of HbA1c, a measure of blood glucose control, at the point of care.
Alere Inc. 2012 Annual Report
43271_Text.indd 9 6/21/13 7:55 AM

Diagnostics10
Market-Leading Provider
HIV Screening
Infl uenza
Malaria
C.Diffi cile
Strep pneumo
Legionella
Strep A
Dengue Fever
RSV
Revolutionizing the Diagnosis and Management of Infectious Disease // Alere is the world’s leading provider of near-patient diagnostics for the most prevalent infectious and tropical diseases.
Alere™ CD4 Analyzer
The Alere™ CD4 Analyzer is the world’s fi rst device to provide absolute CD4 results at the point of care and has been shown to help initiate and improve the management of antiretroviral therapy.
Novel Platforms That Will Transform Diagnosis & Patient Management
The Alere™ Q
Also the fi rst of its kind, the Alere™ Q enables molecular viral load testing for HIV at the point of care. Applications for HCV and tuberculosis are currently in development, and develop-ment for our TB application has been supported by a recent grant from the Gates Foundation.
The Alere™ I
A molecular platform for acute, near-patient testing, the Alere™ I will offer signifi cant improvements over today’s lateral-fl ow technology, enabling healthcare providers working in lower-tech settings to diagnose with lab-quality accuracy. Launch of the platform’s fi rst application for infl uenza is expected in 2014.
Alere Inc. 2012 Annual Report
43271_Text.indd 10 6/20/13 11:05 AM

11Diagnostics
Full-Service Toxicology Provider // We are the world’s leading provider of toxicology diagnostics and specialty drug-testing services, with a portfolio that encompasses reagents, point-of-care analyzers, lab services, and program solutions.
Featured Solutions
Lab & Third-Party Administrative Services
We have built a strong franchise of lab and third-party solutions over the past several years, helping employers maintain drug-free workforces with our best-in-class tech nology and screening services. Additionally, we enable employers to move to a paperless screening process, reduce overall program costs, and improve compliance management.
Roadside & Point-of-Care Testing
The use of illegal substances continues to grow worldwide, and statistics indicate that the number of drivers under the infl uence of these substances is increasing rapidly. We offer several diagnostic tools, including the Alere DDS®2 Mobile Test System, which enable individuals working in law enforce-ment or drug treatment facilities to accurately detect abused substances at roadside or the point of care within a matter of minutes.
Drug Monitoring & Addiction Treatment
We understand that substance abuse is much like any other chronic disease, requiring active monitoring and patient management to facilitate true behavior change. Solutions like the Alere™ DataLink Dx enable clinicians to track the health and progress of their patients’ recoveries by providing them with instant, secure access to test results online.
Alere Inc. 2012 Annual Report
43271_Text.indd 11 6/20/13 11:05 AM

Our Patient-Centric Integrated Platform enables healthcare providers to take the next step in achieving value-driven care. Our offering is comprised of diagnostic devices, technology solutions, and care management programs that drive real-time, actionable physician interventions and patient behavior change.
Alere Inc. 2012 Annual Report
Connected Healthcare12
43271_Text.indd 12 6/20/13 11:05 AM

Care Management
Devices
Health Information Exchange
Population Analytics
Wellness & Health Coaching
Real-Time Decision Support
Personal Health Record
Electronic Health Records
Alere Inc. 2012 Annual Report
13Connected Healthcare
43271_Text.indd 13 6/20/13 11:05 AM

Connected Healthcare
Alere Inc. 2012 Annual Report
14
43271_Text.indd 14 6/20/13 11:05 AM

15Connected Healthcare
Alere Inc. 2012 Annual Report
43271_Text.indd 15 6/20/13 11:05 AM

Actionable data from connected devices along with information from personal and electronic health records give healthcare providers the ability to speed up and cus-tomize treatment for each patient.
Devices
Personal Health Record
Electronic Health Record
Alere Inc. 2012 Annual Report
Connected Healthcare16
43271_Text.indd 16 6/21/13 1:00 PM
17Connected Healthcare
Alere Inc. 2012 Annual Report
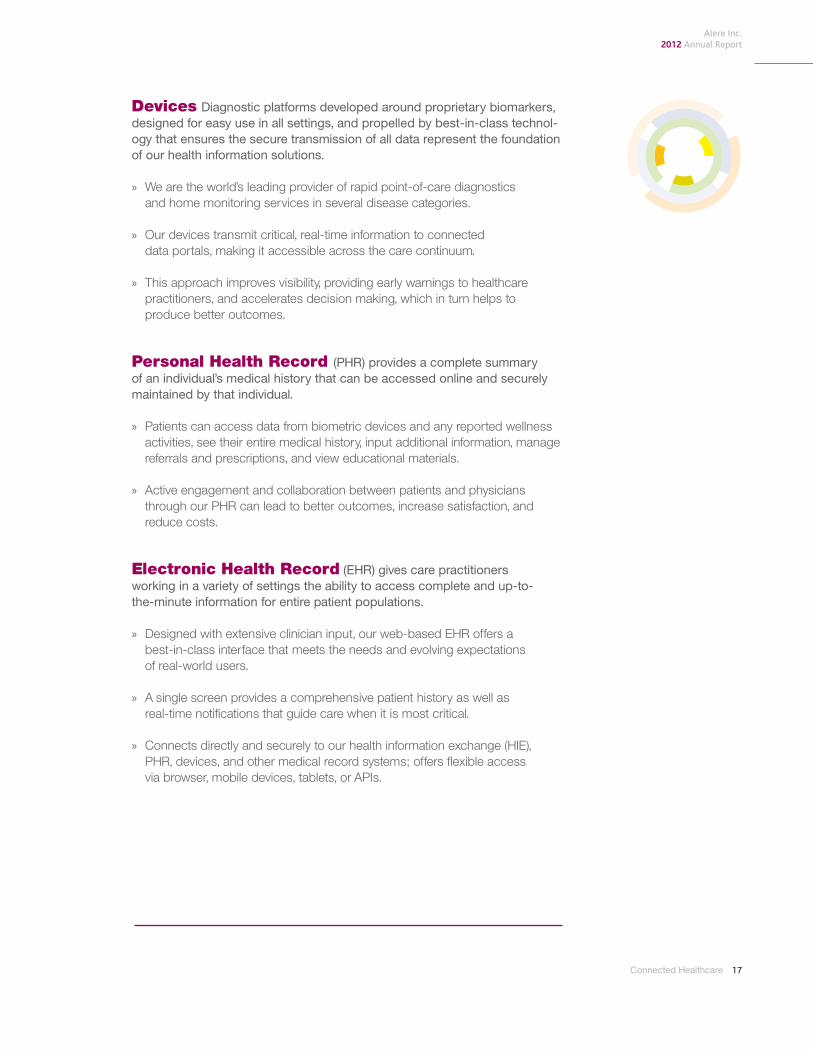
Devices Diagnostic platforms developed around proprietary biomarkers, designed for easy use in all settings, and propelled by best-in-class technol-ogy that ensures the secure transmission of all data represent the foundation of our health information solutions.
» We are the world’s leading provider of rapid point-of-care diagnostics and home monitoring services in several disease categories.
» Our devices transmit critical, real-time information to connected data portals, making it accessible across the care continuum.
» This approach improves visibility, providing early warnings to healthcare practitioners, and accelerates decision making, which in turn helps to produce better outcomes.
Personal Health Record (PHR) provides a complete summary of an individual’s medical history that can be accessed online and securely maintained by that individual.
» Patients can access data from biometric devices and any reported wellness activities, see their entire medical history, input additional information, manage referrals and prescriptions, and view educational materials.
» Active engagement and collaboration between patients and physicians through our PHR can lead to better outcomes, increase satisfaction, and reduce costs.
Electronic Health Record (EHR) gives care practitioners working in a variety of settings the ability to access complete and up-to-the-minute infor mation for entire patient populations.
» Designed with extensive clinician input, our web-based EHR offers a best-in-class interface that meets the needs and evolving expectations of real-world users.
» A single screen provides a comprehensive patient history as well as real-time notifi cations that guide care when it is most critical.
» Connects directly and securely to our health information exchange (HIE), PHR, devices, and other medical record systems; offers fl exible access via browser, mobile devices, tablets, or APIs.
43271_Text.indd 17 6/20/13 11:06 AM

Alere Inc. 2012 Annual Report
18 Connected Healthcare
43271_Text.indd 18 6/20/13 11:06 AM

19
Alere Inc. 2012 Annual Report
Connected Healthcare
43271_Text.indd 19 6/20/13 11:06 AM

Health Information Exchange (HIE) creates a virtual community where clinicians can access the most up-to-date patient information and better coordinate care and treatment.
» Our HIE captures data from patients, doctors, payers, and devices, integrating it in one patient-centered health record.
» Award-winning usability, standards-based archi-tecture, and the ability to incorporate data from other medical record systems make our HIE the only one capable of connecting entire health networks.
Health Information Exchange
(HIE) extracts clinical information from several different repos-itories and integrates that data within a single longi tudinal health record that all care providers can securely access.
patients doctorspayers devices
Alere Inc. 2012 Annual Report
Connected Healthcare20
43271_Text.indd 20 6/21/13 1:00 PM
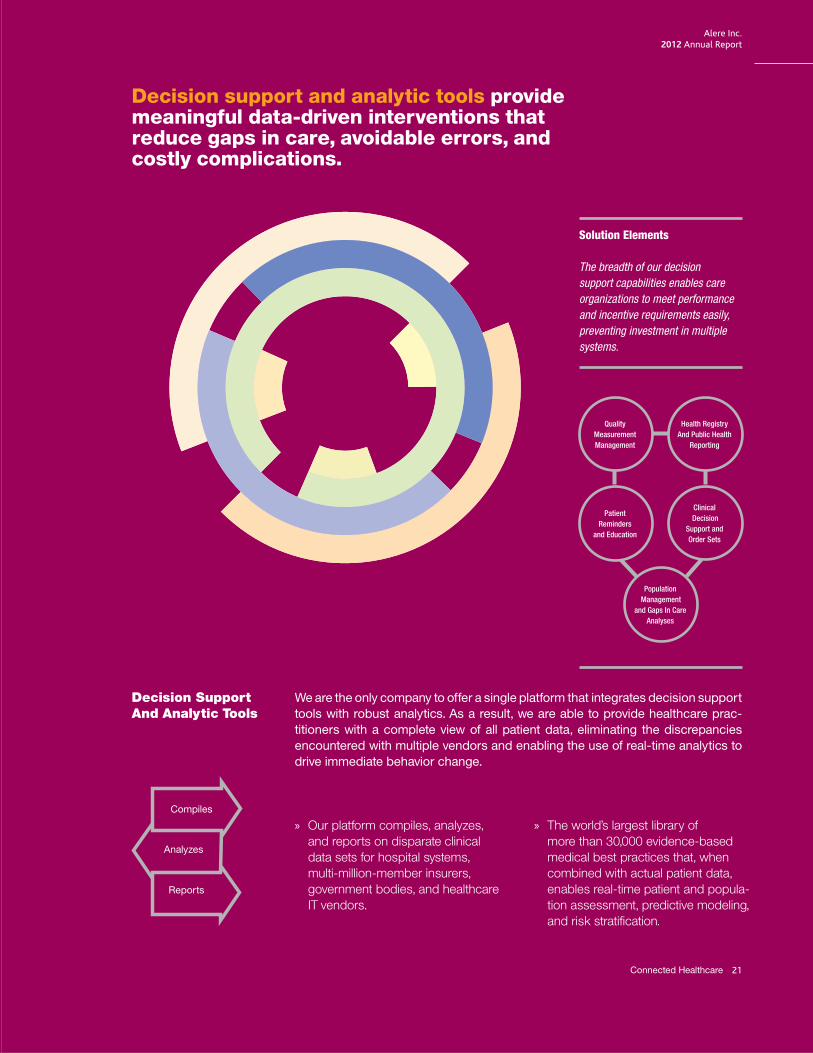
Decision support and analytic tools provide meaningful data-driven interventions that reduce gaps in care, avoidable errors, and costly complications.
We are the only company to offer a single platform that integrates decision supporttools with robust analytics. As a result, we are able to provide healthcare prac-titioners with a complete view of all patient data, eliminating the discrepancies encountered with multiple vendors and enabling the use of real-time analytics to drive immediate behavior change.
Decision Support And Analytic Tools
Compiles
Analyzes
Reports
» Our platform compiles, analyzes, and reports on disparate clinical data sets for hospital systems, multi-million-member insurers, government bodies, and healthcare IT vendors.
» The world’s largest library of more than 30,000 evidence-based medical best practices that, when combined with actual patient data, enables real-time patient and popula-tion assessment, predictive modeling, and risk stratifi cation.
Solution Elements
The breadth of our decision support capabilities enables care organizations to meet performance and incentive requirements easily, preventing investment in multiple systems.
Population Management
and Gaps In Care Analyses
Health Registry And Public Health
Reporting
Quality MeasurementManagement
Clinical Decision
Support and Order Sets
Patient Reminders
and Education
Alere Inc. 2012 Annual Report
21Connected Healthcare
43271_Text.indd 21 6/21/13 1:01 PM

Alere Inc. 2012 Annual Report
22 Connected Healthcare
43271_Text.indd 22 6/20/13 11:06 AM

23
Alere Inc. 2012 Annual Report
Connected Healthcare
43271_Text.indd 23 6/20/13 11:06 AM
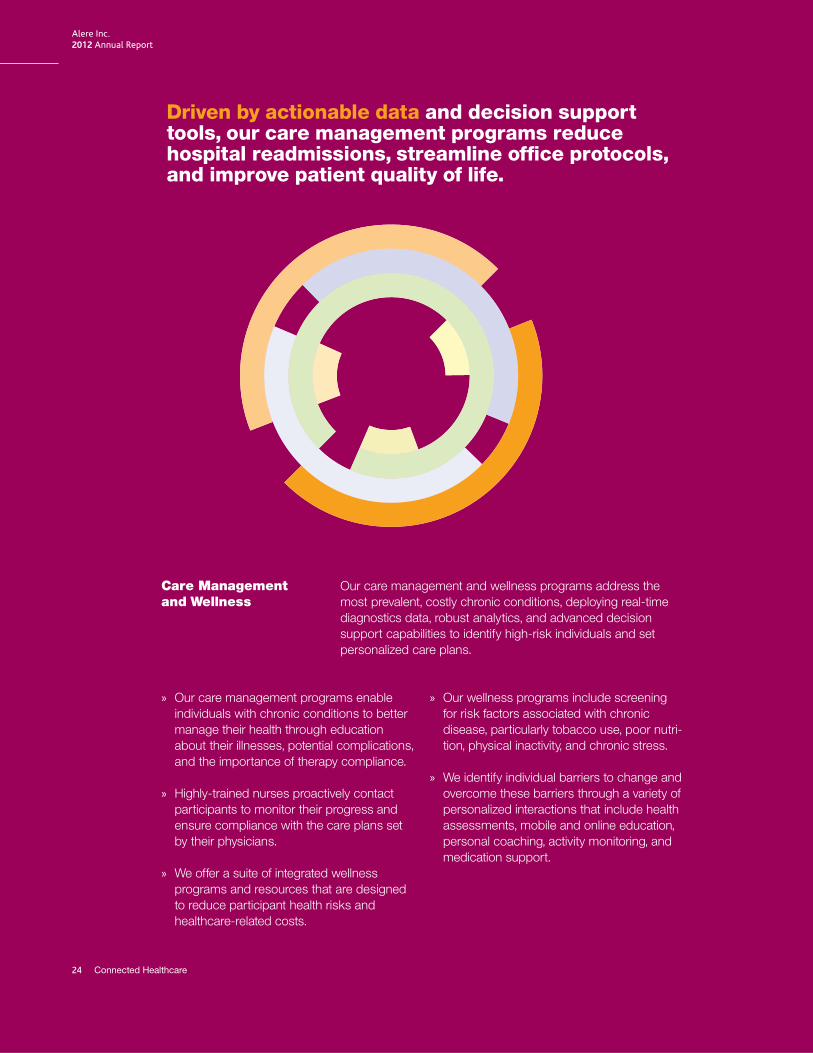
Driven by actionable data and decision support tools, our care management programs reduce hospital readmissions, streamline offi ce protocols, and improve patient quality of life.
» Our care management programs enable individuals with chronic conditions to better manage their health through education about their illnesses, potential complications, and the importance of therapy compliance.
» Highly-trained nurses proactively contact participants to monitor their progress and ensure compliance with the care plans set by their physicians.
» We offer a suite of integrated wellness programs and resources that are designed to reduce participant health risks and healthcare-related costs.
» Our wellness programs include screening for risk factors associated with chronic disease, particularly tobacco use, poor nutri-tion, physical inactivity, and chronic stress.
» We identify individual barriers to change and overcome these barriers through a variety of personalized interactions that include health assessments, mobile and online education, personal coaching, activity monitoring, and medication support.
Care Management and Wellness
Our care management and wellness programs address the most prevalent, costly chronic conditions, deploying real-time diagnostics data, robust analytics, and advanced decision support capabilities to identify high-risk individuals and set personalized care plans.
Alere Inc. 2012 Annual Report
Connected Healthcare24
43271_Text.indd 24 6/21/13 1:01 PM

UNITED STATESSECURITIES AND EXCHANGE COMMISSION
WASHINGTON, D.C. 20549
FORM 10-KANNUAL REPORT PURSUANT TO SECTIONS 13 OR 15(d)
OF THE SECURITIES EXCHANGE ACT OF 1934For the fiscal year ended December 31, 2012.
Commission file number 000-16789
ALERE INC.(Exact Name of Registrant as Specified in Its Charter)
Delaware 04-3565120(State or other jurisdiction of incorporation or organization) (I.R.S. Employer Identification No.)
51 Sawyer Road, Suite 200, Waltham, Massachusetts 02453(Address of principal executive offices) (Zip Code)
(781) 647-3900(Registrant’s telephone number, including area code)
Securities registered pursuant to Section 12(b) of the Securities Exchange Act of 1934 (the “Exchange Act”):Title of Each Class Name of Each Exchange on Which Registered
Common Stock, $0.001 per share par value New York Stock ExchangeSeries B Convertible Perpetual Preferred
Stock, $0.001 per share par valueNew York Stock Exchange
9.00% Senior Subordinated Notes Due 2016 New York Stock ExchangeSecurities registered pursuant to Section 12(g) of the Exchange Act: None
Indicate by check mark if the registrant is a well-known seasoned issuer, as defined in Rule 405 of the Securities Act of1933. Yes Í No ‘
Indicate by check mark if the registrant is not required to file reports pursuant to Section 13 or Section 15(d) of the ExchangeAct. Yes ‘ No Í
Indicate by check mark whether the registrant (1) has filed all reports required to be filed by Section 13 or 15(d) of the ExchangeAct during the preceding 12 months (or for such shorter period that the registrant was required to file such reports), and (2) has beensubject to such filing requirements for the past 90 days. Yes Í No ‘
Indicate by check mark whether the registrant has submitted electronically and posted on its corporate Web site, if any, everyInteractive Data File required to be submitted and posted pursuant to Rule 405 of Regulation S-T during the preceding 12 months (orfor such shorter period that the registrant was required to submit and post such files). Yes Í No ‘
Indicate by check mark if disclosure of delinquent filers pursuant to Item 405 of Regulation S-K is not contained herein, and willnot be contained, to the best of registrant’s knowledge, in definitive proxy or information statements incorporated by reference inPart III of this Form 10-K or any amendment to this Form 10-K. Í
Indicate by check mark whether the registrant is a large accelerated filer, an accelerated filer, a non-accelerated filer, or asmaller reporting company. See the definitions of “large accelerated filer,” “accelerated filer” and “smaller reporting company” inRule 12b-2 of the Exchange Act. (Check one):
Large accelerated filer Í Accelerated filer ‘ Non-accelerated filer ‘ Smaller reporting company ‘(Do not check if a smaller reporting company)
Indicate by check mark whether the registrant is a shell company (as defined in Rule 12b-2 of the ExchangeAct). Yes ‘ No Í
The aggregate market value of the common stock held by non-affiliates of the registrant based on the closing price of theregistrant’s common stock on the New York Stock Exchange on June 29, 2012 (the last business day of the registrant’s mostrecently completed second fiscal quarter) was $1,472,919,947.
As of February 25, 2013, the registrant had 81,201,382 shares of common stock, par value $0.001 per share, outstanding.
DOCUMENTS INCORPORATED BY REFERENCEPortions of the registrant’s definitive proxy statement to be filed in connection with the registrant’s 2013 annual meeting of
shareholders are incorporated by reference into Part III of this Form 10-K.

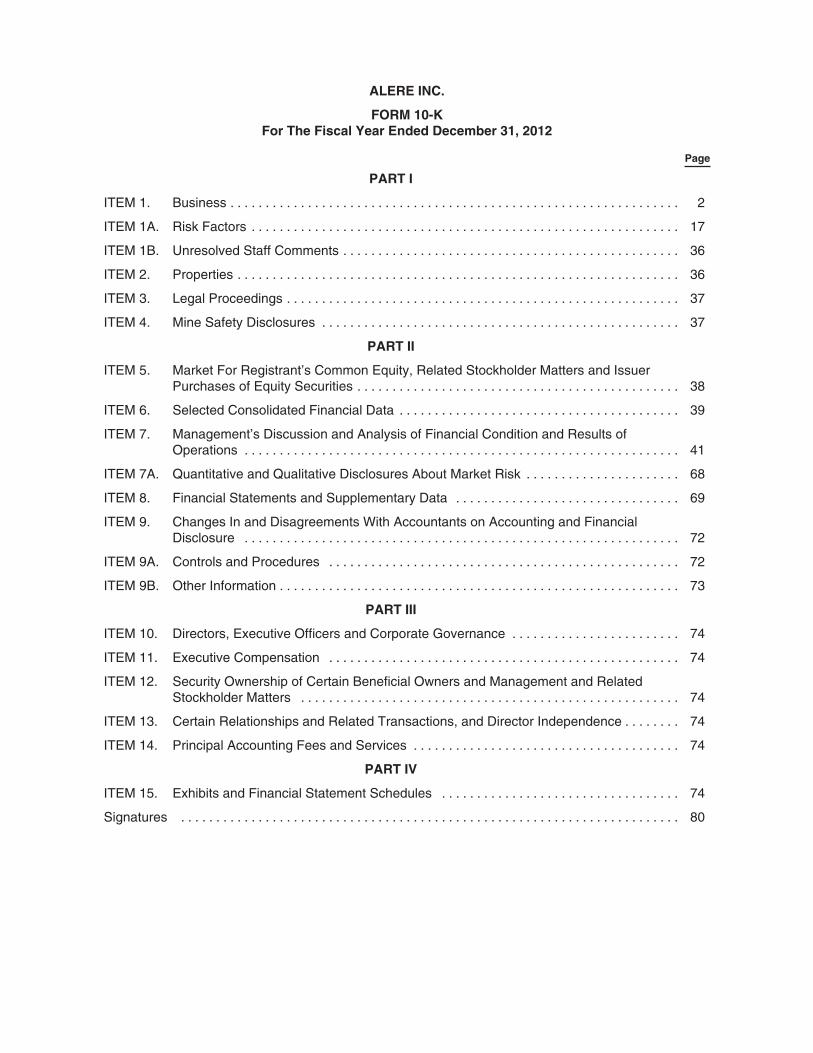
ALERE INC.
FORM 10-KFor The Fiscal Year Ended December 31, 2012
Page
PART I
ITEM 1. Business . . . . . . . . . . . . . . . . . . . . . . . . . . . . . . . . . . . . . . . . . . . . . . . . . . . . . . . . . . . . . . . . 2
ITEM 1A. Risk Factors . . . . . . . . . . . . . . . . . . . . . . . . . . . . . . . . . . . . . . . . . . . . . . . . . . . . . . . . . . . . . 17
ITEM 1B. Unresolved Staff Comments . . . . . . . . . . . . . . . . . . . . . . . . . . . . . . . . . . . . . . . . . . . . . . . . 36
ITEM 2. Properties . . . . . . . . . . . . . . . . . . . . . . . . . . . . . . . . . . . . . . . . . . . . . . . . . . . . . . . . . . . . . . . 36
ITEM 3. Legal Proceedings . . . . . . . . . . . . . . . . . . . . . . . . . . . . . . . . . . . . . . . . . . . . . . . . . . . . . . . . 37
ITEM 4. Mine Safety Disclosures . . . . . . . . . . . . . . . . . . . . . . . . . . . . . . . . . . . . . . . . . . . . . . . . . . . 37
PART II
ITEM 5. Market For Registrant’s Common Equity, Related Stockholder Matters and IssuerPurchases of Equity Securities . . . . . . . . . . . . . . . . . . . . . . . . . . . . . . . . . . . . . . . . . . . . . . 38
ITEM 6. Selected Consolidated Financial Data . . . . . . . . . . . . . . . . . . . . . . . . . . . . . . . . . . . . . . . . 39
ITEM 7. Management’s Discussion and Analysis of Financial Condition and Results ofOperations . . . . . . . . . . . . . . . . . . . . . . . . . . . . . . . . . . . . . . . . . . . . . . . . . . . . . . . . . . . . . . 41
ITEM 7A. Quantitative and Qualitative Disclosures About Market Risk . . . . . . . . . . . . . . . . . . . . . . 68
ITEM 8. Financial Statements and Supplementary Data . . . . . . . . . . . . . . . . . . . . . . . . . . . . . . . . 69
ITEM 9. Changes In and Disagreements With Accountants on Accounting and FinancialDisclosure . . . . . . . . . . . . . . . . . . . . . . . . . . . . . . . . . . . . . . . . . . . . . . . . . . . . . . . . . . . . . . 72
ITEM 9A. Controls and Procedures . . . . . . . . . . . . . . . . . . . . . . . . . . . . . . . . . . . . . . . . . . . . . . . . . . 72
ITEM 9B. Other Information . . . . . . . . . . . . . . . . . . . . . . . . . . . . . . . . . . . . . . . . . . . . . . . . . . . . . . . . . 73
PART III
ITEM 10. Directors, Executive Officers and Corporate Governance . . . . . . . . . . . . . . . . . . . . . . . . 74
ITEM 11. Executive Compensation . . . . . . . . . . . . . . . . . . . . . . . . . . . . . . . . . . . . . . . . . . . . . . . . . . 74
ITEM 12. Security Ownership of Certain Beneficial Owners and Management and RelatedStockholder Matters . . . . . . . . . . . . . . . . . . . . . . . . . . . . . . . . . . . . . . . . . . . . . . . . . . . . . . 74
ITEM 13. Certain Relationships and Related Transactions, and Director Independence . . . . . . . . 74
ITEM 14. Principal Accounting Fees and Services . . . . . . . . . . . . . . . . . . . . . . . . . . . . . . . . . . . . . . 74
PART IV
ITEM 15. Exhibits and Financial Statement Schedules . . . . . . . . . . . . . . . . . . . . . . . . . . . . . . . . . . 74
Signatures . . . . . . . . . . . . . . . . . . . . . . . . . . . . . . . . . . . . . . . . . . . . . . . . . . . . . . . . . . . . . . . . . . . . . . . 80

PART I
This Annual Report on Form 10-K contains forward-looking statements within the meaning ofSection 27A of the Securities Act of 1933, as amended, and Section 21E of the Securities ExchangeAct of 1934, as amended. Readers can identify these statements by forward-looking words such as“may,” “could,” “should,” “would,” “intend,” “will,” “expect,” “anticipate,” “believe,” “estimate,” “continue”or similar words. Readers should carefully review statements that contain these words because theydiscuss our future expectations, contain projections of our future results of operations or of our financialcondition or state other “forward-looking” information. We caution investors that all such forward-looking statements involve risks and uncertainties that could cause our actual results to differ materiallyfrom any projected results or expectations that we discuss in this report. You should therefore carefullyreview the risk factors and uncertainties discussed in Item 1A entitled “Risk Factors,” which begins onpage 17 of this report, as well as those factors identified from time to time in our periodic filings with theSecurities and Exchange Commission. We undertake no obligation to update any forward-lookingstatements.
Unless the context requires otherwise, references in this Annual Report on Form 10-K to “we,”“us,” “our,” or our “company” refer to Alere Inc. and its subsidiaries.
ITEM 1. BUSINESS
GENERAL
Alere Inc. enables individuals to take greater control of their health at home, under the supervisionof their healthcare providers, by combining near-patient diagnostics, health monitoring capabilities, andinformation technology solutions. A leading global provider of point-of-care diagnostics and services,we have developed a strong commercial presence in cardiology, infectious disease, toxicology, anddiabetes. Our products and services help healthcare practitioners make earlier, more effectivetreatment decisions and improve outcomes for individuals living with chronic disease. Our portfolio alsoincludes a broad array of health information solutions that increase access to critical health data,provide clinical decision support, and facilitate more comprehensive performance reporting andanalysis. We believe that the integration of these solutions with our novel diagnostics and monitoringservices positions us to enable customers to reduce the healthcare costs associated with managingchronic disease considerably, addressing what may be the greatest burden faced by most healthsystems around the world today.
Our company, formerly known as Inverness Medical Innovations, Inc., was formed to acquire thewomen’s health and professional diagnostics businesses of its predecessor, Inverness MedicalTechnology, Inc., through a split-off and merger transaction, which occurred in November 2001. Sincethat time, we have grown our businesses through strategic acquisitions, tactical use of our intellectualproperty portfolio and organic growth. In July 2010, our company changed its name to Alere Inc. Ourcommon stock is listed on the New York Stock Exchange under the symbol “ALR.”
Our principal executive offices are located at 51 Sawyer Road, Suite 200, Waltham,Massachusetts 02453 and our telephone number is (781) 647-3900. Our website is www.alere.com,and we make available through the investor center of this site, free of charge, our Annual Reports onForm 10-K, Quarterly Reports on Form 10-Q, Current Reports on Form 8-K, and amendments to thosereports, filed or furnished pursuant to Section 13(a) or 15(d) of the Securities Exchange Act of 1934, asamended, as soon as reasonably practicable after such reports are electronically filed with, orfurnished to, the Securities and Exchange Commission, or the SEC. We also make our code of ethicsand certain other governance documents and policies available through our website. We intend tomake required disclosures of amendments to our code of ethics, or waivers of a provision of our codeof ethics, on the “Corporate Governance” page of our website’s investor center.
2
Segments
Our reportable operating segments are professional diagnostics, health information solutions andconsumer diagnostics. Financial information about our reportable segments is provided in Note 17 ofthe Notes to Consolidated Financial Statements which are included elsewhere in this report.
Products and Services
Professional Diagnostics
Professional diagnostics are generally designed to assist medical professionals in bothpreventative and interventional medicine, and include testing and monitoring performed in hospitals,laboratories and doctors’ offices and, increasingly, patient self-testing, which we define as testing ormonitoring performed at home under the supervision of a medical professional. Professional diagnosticproducts provide for qualitative or quantitative analysis of patient samples for evidence of a specificmedical condition, disease state or toxicological state or to measure response to therapy. Withinprofessional diagnostics, we focus on point-of-care, rapid diagnostic testing and health monitoring andthe developing patient self-testing and patient self-management markets. We distinguish these marketsfrom clinical diagnostic markets consisting of large, centralized laboratories offering a wide range ofhighly-automated laboratory services in hospital or related settings. The point-of-care market for rapiddiagnostic products includes all areas where a patient is assessed or diagnosed, including hospitals,laboratories, physician offices, specialized mobile clinics, emergency rooms, rapid-responselaboratories and patient health screening locations.
In the market for rapid diagnostic products, the ability to deliver faster, accurate results atcompetitive prices generally drives demand. While there is certainly demand for faster, more efficientautomated equipment from large hospitals and major reference testing laboratories, we believe there isalso growing demand by point-of-care facilities and smaller laboratories for fast, high-quality, cost-effective and potentially life-saving, self-contained diagnostic kits. As the speed and accuracy of theseproducts improve, we believe that they will play an increasingly important role in achieving earlierdiagnosis, timely intervention and therapy monitoring outside acute medical environments, especiallywhere supplemented by the support and management services we also provide. Our currentprofessional diagnostic products include point-of-care and laboratory tests within the following areas:
Cardiology. Cardiovascular disease encompasses a spectrum of conditions and illnesses,including high blood pressure, high cholesterol, metabolic syndrome, coronary artery disease, heartattack, heart failure and stroke. It is estimated that 82 million American adults alone have one or moretypes of cardiovascular disease. The worldwide cardiology point-of-care diagnostics market, includingthe markets for heart failure diagnostics, coronary artery disease risk assessment, coagulation testingand acute coronary syndrome, exceeds $2.0 billion. Our Alere Triage, Alere Cholestech LDX and AlereINRatio products, have established us as a leader in this market. The Alere Triage system consists of aportable fluorometer that interprets consumable test devices for cardiovascular conditions, as well asthe detection of certain drugs of abuse. Alere Triage cardiovascular tests include the following:
• Alere Triage BNP Test. An immunoassay that measures B-type Natriuretic Peptide (BNP) inwhole blood or plasma, used as an aid in the diagnosis and assessment of severity ofcongestive heart failure. The test is used for the risk stratification of patients with acute coronarysyndromes and heart failure as well. We also offer a version of the Alere Triage BNP Test foruse on Beckman Coulter lab analyzers.
• Alere Triage NT-proBNP. An immunoassay for the rapid quantitative determination of N-terminal pro-Brain Natriuretic Peptide (NT-proBNP) in anticoagulated whole blood and plasmaspecimens. The test is used as an aid in the diagnosis of congestive heart failure, the riskstratification of patients with acute coronary syndromes and heart failure, and the assessment of
3

increased risk of cardiovascular events and mortality in patients at risk for heart failure who havestable coronary artery disease. Alere Triage NT-proBNP is CE marked, but not available for salein the United States.
• Alere Triage Cardiac Panel. An immunoassay for the quantitative determination of creatinekinase-MB (CK-MB), myoglobin and troponin I in whole blood or plasma, used as an aid in thediagnosis of acute myocardial infarction.
• Alere Triage CardioProfilER Panel. An immunoassay for use as an aid in the diagnosis ofacute myocardial infarction, the diagnosis and assessment of severity of congestive heart failureand the risk stratification of patients with acute coronary syndromes and heart failure. This panelcombines troponin I, CK-MB, myoglobin and BNP to provide rapid, accurate results in wholeblood and plasma.
• Alere Triage ProfilER Shortness of Breath (S.O.B.) Panel. An immunoassay for use as an aidin the diagnosis of myocardial infarction, the diagnosis and assessment of severity of congestiveheart failure, the assessment and evaluation of patients suspected of having disseminatedintravascular coagulation and thromboembolic events, including pulmonary embolism and deepvein thrombosis, and the risk stratification of patients with acute coronary syndromes. This panelcombines troponin I, CK-MB, myoglobin, BNP and D-dimer to provide rapid, accurate results inwhole blood and plasma.
• Alere Triage Cardio3 Panel. An immunoassay for the rapid quantitative determination of CK-MB, troponin I and BNP in whole blood and plasma specimens. This panel is used as an aid inthe diagnosis of myocardial infarction, the diagnosis and assessment of severity of congestiveheart failure and the risk stratification of patients with acute coronary syndromes and heartfailure. Alere Triage Cardio3 is CE marked, but not available for sale in the United States.
• Alere Triage Cardio2 Panel. An immunoassay for the rapid quantitative determination oftroponin I and BNP in whole blood and plasma specimens. This panel is used as an aid in thediagnosis of myocardial infarction, the diagnosis and assessment of severity of congestive heartfailure and the risk stratification of patients with acute coronary syndromes and heart failure.Alere Triage Cardio2 is CE marked, but not available for sale in the United States.
• Alere Triage Troponin I. An immunoassay for the quantitative determination of troponin I inwhole blood and plasma specimens. The test is used as an aid in the diagnosis of myocardialinfarction.
• Alere Triage D-Dimer Test. An immunoassay for use as an aid in the assessment andevaluation of patients suspected of having disseminated intravascular coagulation orthromboembolic events, including pulmonary embolism and deep vein thrombosis.
• Alere Triage NGAL. An immunoassay for use in the rapid, quantitative determination ofneutrophil gelantinase-associated lipocalin (NGAL) in anticoagulated whole blood or plasmaspecimens. Studies have shown a link between elevated NGAL levels and the later occurrenceof elevated creatinine indicative of prior acute kidney injury. Alere Triage NGAL is CE marked,but not available for sale in the United States.
• Alere Triage CardioRenal Panel. An immunoassay for use as an aid in the diagnosis of acutekidney injury and congestive heart failure, and the risk stratification of patients with heart failureand acute coronary syndromes. This panel combines two biomarkers, BNP and NGAL, toprovide rapid, accurate quantitative results in whole blood or plasma. Alere Triage CardioRenalPanel is CE marked, but is not available for sale in the United States.
Our Alere Cholestech LDX System is a point-of-care monitor of blood cholesterol and related lipidswhich is used to test patients at risk of, or suffering from, heart disease and related conditions. TheAlere Cholestech LDX System makes it possible to provide a complete lipid profile with tests for totalcholesterol, high-density lipoprotein cholesterol (HDL) and low-density lipoprotein cholesterol (LDL),triglycerides, and glucose. The system can also provide coronary heart disease risk assessment from
4
the patient’s results as measured on the lipid profile cassette. The Alere Cholestech LDX Systemprovides results in five minutes per test cassette and is CLIA-waived, meaning the United States Foodand Drug Administration, or FDA, has waived the more stringent requirements for laboratory testingapplicable to moderate or high complexity laboratories based on the Alere Cholestech LDX System’sease of use and accuracy. This waiver allows the Alere Cholestech LDX System to be marketed tophysician offices and clinics, rather than hospitals or larger laboratories, and to be used in healthscreening by medical professionals.
Our Alere INRatio System is an easy-to-use, hand-held blood coagulation monitoring system foruse by patients and healthcare professionals in the management of warfarin, a commonly prescribedmedication used to prevent blood clots. The Alere INRatio System measures PT/INR, which is thepatient’s blood clotting time reported pursuant to an internationally normalized ratio, to help ensure thatpatients at risk of blood clot formation are maintained within the therapeutic range with the properdosage of oral anticoagulant therapy. The Alere INRatio System is 510(k) cleared by the FDA for useby healthcare professionals, as well as for patient self-testing, and is also CE marked in Europe. Thesystem is targeted to both the professional, or point-of-care, market, as well as the patient self-testingmarket. We also sell an improved version of the system, the Alere INRatio2 System, which targets thepatient self-testing market through enhanced ease of use.
We also offer the epoc Blood Analysis System for blood gas, electrolyte and metabolite testing,which is manufactured by our recently acquired Epocal division. The epoc (enterprise point-of-care)platform is a point-of-care analysis system which provides wireless bedside blood gas, electrolyte andmetabolite measurement testing solutions and complements our Alere Triage products in cardiologyand emergency room settings. Utilizing easy to use, low-cost disposable Smart-Cards™, the epocSystem produces laboratory-quality results in critical and acute care settings in about 30 seconds.
During 2010, we launched the Alere Heart Check System in Europe. The Alere Heart CheckSystem provides a quantitative reading of BNP in less than 15 minutes using a fingerstick sample (12microliters) with substantially equivalent performance to lab instruments. Initially being marketed as apoint-of-care device, the Alere Heart Check System is ultimately designed for home use and isintended to enable doctors to remotely monitor BNP levels of congestive heart failure patients andadjust their therapy accordingly.
We also sell disposable, lateral flow rapid diagnostic tests for D-dimer and troponin I under ourClearview brand. These tests offer efficiency, as well as ease of use and accuracy, to clinics, hospitalsand laboratories around the world.
Infectious Disease. We believe that the demand for infectious disease diagnostic products isgrowing faster than many other segments of the immunoassay market due to the increasing incidenceand awareness of certain diseases or groups of diseases, including viral hepatitis, respiratory syncytialvirus (RSV), influenza, pneumonia, tuberculosis, human immunodeficiency virus (HIV) / acquiredimmunodeficiency syndrome (AIDS), enteric disease, vector-borne diseases such as malaria anddengue, herpes and other sexually-transmitted diseases. To meet this demand, we have continued toexpand our product offerings and now offer one of the world’s largest infectious disease test menus.We develop and market a wide variety of point-of-care tests for influenza A/B, RSV, strep throat,pneumonia, C. difficile, infectious mononucleosis, HIV, herpes simplex virus (HSV-2), hepatitis C(HCV), hepatitis B (HBV), malaria, lyme disease, Chlamydia, H. pylori, rubella and other infectiousdiseases. Our tests for infectious disease are currently sold under brand names that include Alere,Alere Determine, Acceava, BinaxNOW, Clearview, DoubleCheckGold, Panbio, SD, TECHLAB andAlere TestPack. We are also expanding commercialization of the Alere CD4 Analyzer in severalcountries in Africa, Asia and Europe, as well as in South America and the Caribbean. The Alere CD4Analyzer is one of the first point-of-care CD4 platforms which measures absolute CD4 counts. A CD4count is a measure of the number of T-helper lymphocytes per cubic millimeter of blood, which is usedto stage a patient’s HIV disease as well as monitor HIV disease progression. The Alere CD4 Analyzer
5

provides results in 20 minutes or less, using single-use, disposable fingerstick cartridges. CD4 resultsdelivered quickly and accurately at the point of care can improve patient retention and access totreatment.
In addition to point-of-care products, we also offer a line of indirect fluorescent antibody, or IFA,assays for over 20 viral, bacterial and autoimmune diseases, a full line of serology diagnostic productscovering a broad range of disease categories and over 50 enzyme-linked immunosorbent assay, orELISA, tests for a wide variety of infectious and autoimmune diseases, as well as a full line ofautomated instrumentation for processing ELISA tests. We are the exclusive U.S. distributor of theAtheNA Multi-Lyte® Test System, a multiplexed, fluorescent bead-based system designed tosimultaneously perform multiple assays from a single sample using just one well. It offers a simple andstreamlined alternative to IFA and ELISA testing, providing improved clinical sensitivity andcomparable clinical specificity in a labor-saving, automation-friendly format. Our IFA, serology andELISA products, which generally serve the clinical diagnostics laboratory markets, are generallymarketed under our Wampole brand.
Demand for certain infectious disease tests, such as influenza A/B, or flu, is significantly affectedby the seasonal nature of the cold and flu season. As a result, we typically experience higher sales ofour flu tests in the first and fourth quarters. Sales of our flu products also vary widely from year to yearbased in large part on the severity, duration and timing of the onset of the cold and flu season.
Toxicology. Drug abuse is a major global health problem, as well as a social and economicburden. In addition to being a primary cause of lost workforce productivity, family conflict and drug-related crime, abuse of illicit and prescription drugs is linked globally to the spread of HIV/AIDS,hepatitis and other blood-borne pathogens through the use of contaminated needles. This misuse ofdrugs and drug addiction are among the costliest health problems in the United States, andincreasingly abroad. As a result, employers, law enforcement officials, healthcare professionals andothers expend considerable effort to ensure that their employees, patients and other constituents arefree of substance abuse and misuse. This critical need creates a significant market for simple andreliable laboratory-based, point-of-care and rapid toxicology tests to detect the most commonly abusedsubstances and an ever-evolving set of newly-formulated, synthetic and regional toxins. Additionally,physicians and treatment centers are increasingly utilizing drug testing to identify and address signs ofprescription drug misuse, whether illicit or by prescription, and more broadly, to improve outcomes inaddiction medicine. Finally, both domestically and abroad, a substantial market exists for services tohelp employers and governments manage their workforces’ compliance with drug, alcohol and/orrelated fitness-for-duty health policies.
Urine and oral-based screening and confirmation tests for drugs of abuse range from simpleimmunoassay tests to complex analytical procedures. The speed and sensitivity of immunoassayshave made them the most widely accepted method for toxicology screening at the point of care.
We offer one of the most comprehensive lines of drugs-of-abuse tests, reagent systems andlaboratory testing options available today. Our products include tests to detect alcohol, as well asvarious device platforms for the detection of the following illicit and prescription drugs of abuse:amphetamines/methamphetamines, cocaine, opiates, phencyclidine, tetrahydrocannabinol,acetaminophen, barbiturates, benzodiazepines, methadone, propoxyphene and tricyclicantidepressants, and a growing range of designer drugs of abuse. Our products test using urine or, forcertain applications, saliva, hair or other body fluids.
Our rapid toxicology tests are sold primarily under the brands Alere Toxicology, Alere Triage, AlereiScreen and SureStep. The Alere Triage TOX Drug Screen panel sold for use with our Alere TriageMeterPro system detects the presence of many of the illicit and prescription drugs listed above at thepoint of care in approximately 15 minutes. It is widely used in hospital and clinical testing as alaboratory instrument to aid in the detection of drug abuse. Our Drug Detection System, or DDS, is an
6

enhanced, on-site saliva drug detection system utilized in roadside testing which displays results forthe presence of two drugs in less than 90 seconds and six different drugs in less than five minutes.
We also offer comprehensive laboratory-based testing services throughout Europe under thename Alere Toxicology, formerly Concateno, and in the United States under the names AlereToxicology Services, or Alere Toxicology, and Redwood Toxicology Laboratory, or Redwood. Three ofAlere Toxicology’s laboratories are certified to the highest standard by the U.S. Substance Abuse andMental Health Services Administration, or SAMHSA. In addition, we are expanding our offerings in thegrowing market for pain management and addiction medicine services, or the monitoring anddocumentation of adherence to prescription drug treatment or drug abstinence plans through complexlaboratory testing. Through Redwood, we offer comprehensive, low-cost laboratory testing services tomultiple domestic clients, including law enforcement agencies, penal systems, insurers and employersin the United States.
In 2012 we acquired eScreen, a leading provider of automated and efficient workplace drug testingservices. We believe this acquisition helps to position Alere’s toxicology business as a full-servicesolution provider to a broad range of domestic and foreign employers in transport, oil and gas, miningand related industries that follow rigorous drug testing policies. We believe that the combination ofproducts, laboratory testing and services that we offer for drugs of abuse enhances our ability tocompete in this market.
Diabetes. We offer point-of-care diabetes products, including our Afinion Analyzer System andour NycoCard System. The Afinion Analyzer System makes it possible to easily and rapidly determinethe level of glycated hemoglobin, or HbA1c, in a patient’s blood at the physician’s office during the visit,which can provide information regarding the patient’s average blood sugar levels over a period of time.This system will simplify monitoring of any type of diabetes, facilitating treatment management andprevention of complications. By providing timely information regarding a patient’s blood sugar levelsover time, it may also increase the patient’s motivation to comply with treatment and lifestyle changesto optimize prognosis. In June 2012, we added our CE-marked Lipid Panel, an important tool forcardiovascular disease risk assessment, to the Afinion Analyzer System. The NycoCard System, whichis a widely distributed, low-cost product suited to countries with developing healthcare systems,includes tests for CRP and HbA1c. Physicians test for elevated levels of CRP in a patient’sbloodstream to detect signs of inflammation or tissue damage, which can be associated with a widevariety of chronic and acute conditions. Through our subsidiary Arriva, we are a major, national mailorder supplier of diabetic testing supplies, including blood glucose monitors, test strips, lancets, lancingdevices, and control solution, as well as other related medical supplies in the U.S. These products areusually covered by Medicare, Medicaid and other third-party payers.
Oncology. The Alere NMP22 BladderChek Test is the only in-office test approved by the FDA asan aid in the diagnosis of bladder cancer. The Alere NMP22 BladderChek Test is a non-invasiveassay, performed on a single urine sample that detects elevated levels of NMP22 protein. The test canbe performed in a physician’s office with results delivered during the patient visit, allowing a rapid,accurate and cost-effective means of aiding the detection of bladder cancer in patients at risk, whenused in conjunction with standard diagnostic procedures. We also offer the Alere NMP22 Test Kit, aquantitative ELISA test designed to detect elevated levels of NMP22 protein.
Our Clearview FOB and Ultra FOB rapid tests aid in the early detection of colorectal cancer, thethird most common type of cancer in men and women. Also, as a result of our November 2010acquisition of AdnaGen, a German company specializing in the development of cancer diagnosticsthrough the detection and analysis of circulating tumor cells, we now sell the AdnaTest ColonCancerand AdnaTest BreastCancer products, which are CE marked for the detection of circulating tumor cells.
Women’s Health. In the professional marketplace, we are a global leader in pregnancy testing.Our professional pregnancy tests are generally urine- or serum-based, CLIA-waived rapid tests indipstick or cassette format.
7

Our professional women’s health products also target diseases or conditions, such aspreeclampsia, rubella, pre-term labor and premature rupture of membrane, which pose unique threatsto mothers and fetuses. Additionally, we offer osteoporosis therapy monitoring tests. We also market aportfolio of tests for sexually-transmitted diseases. Our women’s health products are currently soldunder our Alere, Clearview and Osteomark brands.
Connected Device Technologies. We understand that fast and accurate diagnostic results aloneare not likely to satisfy the future mandates of accountable care. We believe that, to be effective,diagnostic data should be actionable, comprehensive and readily accessible to patients, physicians,and payers. When this data is made available via an integrated electronic health record, or EHR, carecan more easily be personalized to meet the needs of each patient, and these patients can becomemore effectively engaged in their own health improvement. Additionally, when an EHR is paired withrobust analytical tools, healthcare providers, payers, and accountable organizations can more easilyassess treatment effectiveness and quantify patient outcomes and cost savings. For these reasons, weare developing several chronic care and other health information solutions built around fast, easy, andaccurate diagnostics that we expect to ultimately permit the automatic import of health data into ahealth information exchange, or HIE, which we believe will facilitate the sort of health interactions,analysis, and reporting that will fuel more effective delivery and quality of care.
Through Alere Informatics, a business unit formed through our acquisitions of Medical AutomationSystems, or MAS, in October 2011, and Laboratory Data Systems, or LDS, in August 2011, we offerRALS, the point-of-care industry’s leading data management solution, which is deployed in nearly 2,000hospitals nationwide, and RALS-Freedom, known as AegisPOC outside the U.S., the first web-baseddata management solution designed for critical care settings. Our RALS systems provide bidirectionalinterfaces that connect a hospital’s glucose meters and other point-of-care devices measuring bloodgases, prothrombin time, and cardiac parameters to its laboratory and health information systems.
Alere Connect, formerly MedApps, which we acquired in July 2012, develops and sells remotehealth monitoring solutions designed to deliver streamlined, cost-effective connectivity across patient,care provider and electronic medical records. Alere Connect’s comprehensive health informationplatform and suite of cloud-based software tools enhance care for patients in both wellness andchronic disease management programs. These solutions are intended to help care management andhealthcare practitioners to extend their services to a broader patient population, increasing the cost-avoidance benefits and efficiencies associated with remote health monitoring.
Our Alere Connect products include:
• HealthPAL: A small, portable hub device for collecting health readings from compatible medicalmonitors and transmitting them to a user’s EHR. HealthPAL provides the proactive benefits ofremote health monitoring and is designed to be a cost-effective telehealth solution.
• HealthCOM: A web-based application for healthcare professionals to remotely monitor andmanage the data collected with HealthPAL. HealthCOM also provides professionaladministration features to assist healthcare practitioners in managing their patient populationsand associated equipment inventory.
These products enable secure data integration with a variety of online electronic health records in amanner that is compliant with the requirements of the Health Insurance Portability and Accountability Act, orHIPAA, and are designed to be easily used by people of all ages and levels of comfort with technology.HealthPAL and HealthCOM also use cloud-based technology to lower implementation costs for providers,while delivering services that scale appropriately. In short, the Alere Connect platform is intended to bridgethe gap between diagnostic data and devices and our health information solutions described below.
Health Information Solutions (formerly Health Management)
Our health information solutions are designed to provide physicians with actionable data thatallows them to make more effective decisions in real time, deliver quality care, and put the individuals
8

they treat on a pathway to better health. Core to our strategy are our proprietary diagnostic platformsand biomarkers that provide rapid results at the point of care for the most costly chronic conditions andour health information technologies, which will ultimately enable diagnostic data to be fed directly intoan information exchange that integrates patient-related data in a single EHR. We offer a variety ofsoftware-based analytics, clinical decision support tools, and accountable care programs that enablehealthcare providers to initiate earlier interventions, personalize treatment plans, lower costs byreducing hospital readmissions, and measure improvements in outcomes at both a patient andpopulation level. With this wide range of scalable solutions, we are able to support healthcarepractitioners in the transition to accountable care as well as in meeting the new pay-for-performanceguidelines set by the Centers for Medicare & Medicaid Services, or CMS. Our information solutionsaddress the data and care gaps resulting from today’s fragmented healthcare environment, but arealso modular and can be easily integrated with many existing resources customers may already havein place. Our health information solutions are primarily available in the United States, but we intend tooffer them internationally in the future.
Through Alere Accountable Care Solutions, or Alere ACS, formerly known as Alere Wellogic, wedeliver health information solutions that help provider organizations meet the CMS “Meaningful Use”requirements and improve coordination across multiple venues of care. Our principal offering from thisgroup, the Alere Health Information Exchange, or Alere HIE, harmonizes multiple streams of data fromdisparate sources in a single patient-centered record and promotes the sharing of information among apatient’s various healthcare providers, collapsing geographic and technological barriers and enablingcare providers to more effectively identify and manage high-risk patients in a broad population. AlereACS also offers an EHR, known as Consult EHR, which gives healthcare practitioners greater visibilityinto a patient’s overall health status, as opposed to a more limited “snapshot”, and complies with therequirements of HIPAA. Consult EHR can also be used to manage administrative, billing and otherfunctions more effectively and efficiently. Consult EHR is certified under the Medicare and MedicaidEHR Incentive Programs that have been authorized as part of the Health Information Technology forEconomic and Clinical Health Act, or the HITECH Act, which allows clients to qualify for incentivepayments by demonstrating the meaningful use of EHR technology.
Through Alere Analytics, formerly known as DiagnosisOne, which we acquired in July 2012, weoffer a broad array of analytical and clinical decision support tools, which are delivered on oursmartPath platform. smartPath leverages our extensive library of evidence-based medical knowledgeto enable real-time patient and population assessment, predictive modeling, and risk stratification. Italso generates immediate recommendations for care, enabling earlier interventions and helping toreduce avoidable errors and improve overall health outcomes. The smartPath platform compiles,analyzes, and enables reporting on disparate clinical data sets for hospital systems, multi-million-member insurers, government bodies, and several EHR and healthcare IT vendors. It can be easilyintegrated with various existing hospital and laboratory information systems. Key features of thesmartPath platform include:
• combines rules and evidence-based content with actual patient data to quickly create relevantcare plans;
• uses the evidence-based knowledge and proprietary analytics to enable improved clinicaldecision making and efficiency;
• applies continuously available patient- and population-level data in a manner tailored to theuser; and
• provides continuous, automated syndromic reporting that enables users to address communityhealth issues.
Also, our Apollo technology platform, which is the supporting infrastructure underlying many of ourhealth improvement programs described below, integrates data from a variety of sources that includehealth plans, pharmacy benefit managers, point-of-care devices, and patient self-reports in a highly
9

dynamic, interactive portal to deliver high quality patient education and engender behavior-changingcommunication among clinicians and patients.
All of these health information solutions, coupled with our expertise in near-patient diagnostics,enable us to offer a suite of health improvement programs, including accountable care programs, thataddress the three core objectives of value-driven healthcare:
• improving the patient’s care experience by raising levels of quality and satisfaction;
• reducing the per capita costs of healthcare while maintaining a focus on the individual needs ofeach patient; and
• improving the overall health of managed populations.
Our health improvement programs are designed to address the most prevalent, costly chronicconditions, deploying real-time diagnostics data, robust analytics, and advanced decision supportcapabilities to identify high-risk individuals and set personalized care plans. They are supported bytrained clinicians with expertise in health coaching and behavior change. Our data exchange solutionsalso help to ensure that clinicians who encounter a patient in the care pathway have real-time visibilityinto that patient’s health information, which helps to reduce fragmentation, create operational efficiencies,and improve care effectiveness. Our programs focused on health improvement and accountable careinclude:
Disease and Case Management. The Alere Disease Management (Chronic Care) Programprovides technology-enabled, evidence-based solutions for managing chronic and high-cost conditions,as well as improving clinical and financial outcomes. The Alere Disease Management Program enablesindividuals with chronic conditions to better manage their health through education about their illnesses,potential complications, and the importance of therapy compliance. Our highly-trained nurses proactivelycontact participants to monitor their progress and compliance with the care plans set by their physicians.They also work with participants to identify potential care gaps, which occur when individuals are nottreated in accordance with best practices or when they fail to follow their treatment plans.
Our personalized health support model differs from more traditional models in that it applies amore disciplined approach to defining which patients could benefit from particular interactions and thebest means of initiating these interactions. A second key differentiator is the use of biometric devicesfor participants in programs focused on higher-risk conditions. The Alere Disease ManagementProgram currently assists individuals with the following chronic diseases or conditions: asthma,coronary artery disease, chronic obstructive pulmonary disease, diabetes, heart failure, pain, weightmanagement and depression.
The Alere Oncology Case Management Program is the longest-running cancer managementprogram (since 1994) in the United States. Our program provides services for adults diagnosed withany cancer that requires treatment beyond a single surgery, and we have developed treatmentguidelines to support 42 different tumor types and more than 200 stages of cancer in a compassionate,cost-effective way.
Women’s & Children’s Health. Our Women’s and Children’s Health division delivers a widevariety of obstetrical care services that range from risk assessments focused on identifying womenwho may experience pregnancy complications to a neonatal program that supports early infant caremanagement. We offer home-based obstetrical monitoring for pregnant women with medical orpregnancy-related problems that could put their health or the health of their babies at risk. We alsodeliver telephonic and home-based nursing services that support improved clinical outcomes. We havedeveloped and refined these services over the years to accommodate physician care plans, with afocus on assessing patient data and providing education. Our high-risk pregnancy managementprogram revenues tend to be seasonal, decreasing with the onset of the holiday season starting onThanksgiving. Consequently, first and fourth quarter revenues each year tend to be lower than secondand third quarter revenues.
10

Wellness. We offer a suite of integrated wellness programs and resources that are designed toreduce participant health risks and healthcare-related costs. Our wellness programs include screeningfor risk factors associated with chronic disease, particularly tobacco use, poor nutrition, physicalinactivity, and chronic stress. After evaluating these risks, we deploy health coaching, administeredtelephonically or through web-based applications, to drive sustainable changes in behavior thatpromote better health.
Patient Self-testing Services. We offer services designed to support anticoagulationmanagement for patients who take warfarin to control their risk for stroke and clotting disorders. AlereHome Monitoring, our patient self-testing business, assists patients in acquiring home INR monitorsand with insurance coverage determinations and provides physicians with a comprehensive model thatallows them to incorporate patient self-testing into their practices. Our program has been developed toidentify candidates who will benefit from self-testing protocols and who will be able to follow themsuccessfully for a sustained period of time. The program is built around a sophisticated, web-basedapplication that delivers patient results and other information to healthcare providers on a real-timebasis, facilitating immediate therapy adjustments where appropriate and reducing the risk of seriousevents.
Consumer Diagnostics
In 2007, we and affiliates of The Procter & Gamble Company, or P&G, commenced a 50/50 jointventure for the development, manufacturing, marketing and sale of existing and to-be-developedconsumer diagnostic products, outside the cardiology, diabetes and oral care fields. As part of thisarrangement, we transferred essentially all of the assets of our consumer diagnostics business, otherthan our manufacturing and core intellectual property assets, to the joint venture, and P&G acquired itsinterest in the joint venture. Accordingly, substantially all of the consumer diagnostics businessconducted by us prior to the joint venture, including all of our products targeting the worldwide over-the-counter pregnancy and fertility/ovulation test market, are now sold by the joint venture, which is anunconsolidated entity operating primarily under the name SPD Swiss Precision Diagnostics GmbH, orSPD.
As part of the SPD joint venture, we entered into a finished product purchase agreement, pursuantto which we currently manufacture and sell to SPD substantially all of the consumer diagnosticproducts which it sells. We also entered into certain transition and long-term services agreements withSPD, pursuant to which we provide certain operational support services to the joint venture. Ourconsumer diagnostics segment recognizes the revenue and costs arising from these arrangements.
Our other current consumer diagnostic products consist of our market-leading First Check brand ofover-the-counter drug tests for at-home testing for up to seven illicit drugs and five prescription drugs,as well as First Check brand over-the-counter tests for cholesterol monitoring. Taking advantage of ourleadership in the field of women’s health, we also sell Balance Activ Vaginal Gel directly to consumersand healthcare professionals for the effective treatment of bacterial vaginosis without antibiotics.
Methods of Distribution and Customers
We distribute our professional diagnostic products to hospitals, reference laboratories, physicianoffices and other point-of-care settings through an extensive worldwide distribution network. We have ourown sales force in many countries, including most major markets. We also utilize third-party distributorsto sell our products. Our Alere Home Monitoring business facilitates the distribution of our Alere INRatioPT/INR coagulation monitors in the United States by contacting patients who have expressed an interestor have prescriptions from their physicians and facilitating the Medicare reimbursement process forphysicians and for patients monitoring at home. Our diabetes testing supplies business provides theseproducts via mail-order to patients in the United States.
We market our health information solutions primarily to health plans (both commercial andgovernmental), self-insured employers and, to a lesser extent, government and governmental programs,pharmaceutical companies and physicians, through our employee sales force and channel partners.
11

We market and sell our First Check consumer drug testing products in the United States throughretail drug stores, drug wholesalers, groceries and mass merchandisers. These products compete withother brand name drug testing products based on price, performance and brand awareness.
Manufacturing
Our primary manufacturing facilities are located in San Diego, California; Scarborough, Maine;Hangzhou and Shanghai, China; Matsudo, Japan; Oslo, Norway; Dundee, Scotland; and Yongin,South Korea. We also manufacture products at a number of other facilities in the United States,Australia, Germany, India, Israel, South Africa, Spain and the United Kingdom.
Our primary manufacturing facilities are ISO certified and registered with the FDA. Wemanufacture substantially all of our consumable diagnostic products at these facilities. We alsomanufacture the consumable diagnostic devices containing the diagnostic chemistry or otherproprietary diagnostic technology, which are used in conjunction with our diagnostic or monitoringsystems, including our Alere Triage system, our Alere Cholestech LDX monitoring devices, our AlereINRatio monitoring devices, and the digital pregnancy and ovulation prediction tests and fertilitymonitors that we supply to the SPD joint venture. We contract with third parties to supply the electronicreader portion of these diagnostic or monitoring systems and to supply various other products that wesell, including our Alere Triage BNP Test for use on Beckman Coulter systems, a majority of our IFAtests and our TECHLAB products.
Research and Development
Our primary research and development centers are in San Diego, California; Scarborough, Maine;Jena, Germany and Cambridge and Dundee, United Kingdom. We also conduct research anddevelopment at some of our other facilities, including facilities in the United States, theUnited Kingdom, China, Israel, Japan and South Korea. Our research and development programsfocus on the development of cardiology, infectious disease, toxicology, diabetes, oncology andwomen’s health products together with health information technologies that will facilitate connectivityand information and data management solutions. Information about research and developmentexpenses for the last three fiscal years is provided on page F-4 of the Consolidated FinancialStatements.
Global Operations
We are a global company with major manufacturing facilities in the United States, China, Japan,Norway, South Korea and the United Kingdom and significant research and development operations inthe United States, Germany and the United Kingdom. Our distribution network supporting ourprofessional diagnostics business includes offices in over 30 countries.
Our professional diagnostic products are sold throughout the world. Our health informationsolutions are sold almost exclusively in the United States but we now offer our health informationsolutions in Australia, Germany and the United Kingdom. During both 2012 and 2011, we generatedapproximately 61% of our net revenue from the United States, approximately 17% from Europe andapproximately 22% from other locations.
For further financial information about geographic areas, see Note 17 of the Notes to ConsolidatedFinancial Statements which are included elsewhere in this report.
Competition
Professional Diagnostics. Our professional diagnostics products are primarily point-of-care rapiddiagnostic testing products sold within the areas of cardiology, infectious disease, toxicology, diabetes,oncology and women’s health. Competition for rapid diagnostic products is intense and is primarily
12

based on price, quality, breadth of product line, technology and distribution capabilities. Somecompetitors in the market for professional rapid diagnostic products, such as BD, are large companieswith substantial resources, while numerous smaller, yet aggressive companies also compete with us.We believe that no competitor, small or large, offers a portfolio of professional rapid diagnosticproducts as broad as ours and, as a result, our competitors differ significantly within each of our areasof focus. Automated immunoassay systems also compete with our products, depending on governmentregulations or when labor shortages force laboratories to automate or when the unit costs of suchsystems are lower and other indirect costs are not taken into account. Such systems are provided byAbbott, Siemens, Beckman Coulter, Johnson & Johnson, Roche and other large diagnostic companies.
In cardiology, the majority of diagnostic immunoassays utilized by physicians and other healthcareproviders are performed by independent clinical reference laboratories and hospital-based laboratoriesusing automated analyzers for batch testing. As a result, the primary competitors for our Alere Triageand Alere Cholestech LDX point-of-care testing systems, which consist of rapid diagnostic devicesinterpreted by portable electronic readers, are the large diagnostic companies identified above thatproduce automated immunoassay systems. We expect these large companies to continue to competevigorously to maintain their significant market share of the cardiology testing market. Although we offerour Alere Triage BNP test for use on Beckman Coulter Immunoassay Systems, our other primarycardiology products are not currently designed for automated batch testing. Our Alere Triage products,as well as our epoc Blood Analysis System, face strong competition from Abbott’s i-Stat hand-heldsystem, and our Alere Cholestech LDX system also faces direct competition from Abaxis MedicalDiagnostics, which markets its point-of-care blood laboratory systems to physician office laboratoriesand from Polymer Technology Systems’ CardioChek test. The primary competitors for our AlereINRatio PT/INR monitoring system are Roche and International Technidyne Corporation, who togethercurrently account for a substantial majority of the domestic sales of PT/INR point-of-care and patientself-testing devices.
BD, Quidel and Meridian Bioscience are the largest competitors for our rapid diagnostic teststargeted at infectious disease and women’s health. Our HIV products, in particular, also compete withtests offered by OraSure Technologies. Newer technologies utilizing amplification techniques foranalyzing molecular DNA gene sequences, from companies such as Abbott, BD, Roche, Cepheid andGen-Probe, are making in-roads into the infectious disease market.
We also sell ELISA and multiplex immunoassay diagnostic testing products, as well as serology,IFA and microbiology tests, all primarily targeted at infectious and autoimmune diseases. Our ELISAtests compete against large diagnostics companies similar to those named above, which manufacturestate-of-the-art automated immunoassay systems and a wide array of diagnostic products designed forprocessing on those systems. Other competitors, including INOVA Diagnostics, DiaSorin, Qiagen andDiamedx, are smaller companies that compete based on quality and service. In the United States andCanada, we focus on matching the instrumentation and product testing requirements of our customersby offering a wide selection of diagnostic products and test equipment. The markets for our serology,IFA and microbiology products are mature and competition is based primarily on price and customerservice. Our main competitors in serology and microbiology testing include Remel and Biokit. Our maincompetitors in IFA testing are Bio-Rad Laboratories, INOVA Diagnostics, Immuno Concepts, TrinityBiotech, Meridian Biosciences and DiaSorin. However, products in these categories also compete to alarge extent against rapid membrane and ELISA products, whose tests are often easier to perform andread and can be more precise.
Competitors for our drugs-of-abuse tests include many of the large diagnostics companies namedabove, which manufacture instrumented drug tests, reagents or instruments sold in a variety of formatsto customers in the worldwide employment, transportation, government and clinical sectors.Additionally, in many markets in which the barriers to entry are low due to less stringent regulations, wecompete with dozens of privately-held, small and emerging low-cost manufacturers of lateral flow point-of-care drug tests. Our worldwide drug testing laboratory services compete with hundreds of multi-national and regional clinical, toxicology and forensic laboratories.
13

In the field of diabetes, the competitors for the Afinion Analyzer System and NycoCard Systeminclude Siemens, Bio-Rad Laboratories and Tosoh Corporation. Arriva, which is our mail orderdiabetes testing product supply business, primarily sells products which are covered by Medicare,Medicaid and other third-party payers. Our major competitors for the sale of these products are largeretail pharmacies, such as Walmart, Walgreens and CVS, independent pharmacies and a number ofmail order suppliers. Competition for reimbursed diabetes testing supplies, which represent themajority of our business, will change significantly as a result of CMS’ decision, based on a competitivebidding process, to reimburse only 15 selected suppliers willing to accept a fixed reimbursement rate.As a result of the competitive bidding process, CMS has offered Arriva a national mail-order contract.
Our Alere NMP22 diagnostic products aid in diagnosing and monitoring bladder cancer patients, inconjunction with standard diagnostic procedures, and are based on our proprietary nuclear matrixprotein technology. The Alere NMP22 BladderChek Test is currently the only in-office test approved bythe FDA as an aid in the diagnosis of bladder cancer. However, competition in the development andmarketing of cancer diagnostics and therapeutics, using a variety of other technologies, is intense.Competing diagnostic products based on other technologies may be introduced by other companiesand could adversely affect our competitive position. In a larger sense, our tests also compete withmore invasive or expensive procedures, such as surgery, bone scans, magnetic resonance imagingand other in vivo imaging techniques. In the market for urine-based diagnostic tests, our Alere NMP22tests also compete with existing cellular-based tests, such as the microscopic examination ofsuspicious cells, and UroVysion, which is a fluorescent in-situ hybridization test.
Generally, the competitive positions of our professional diagnostic products may be based on,among other things, being first to market with a novel product, product performance, accuracy,convenience, cost-effectiveness, the strength of our intellectual property and price, as well as on theeffectiveness of our sales force and our marketing and distribution partners. Where we facecompetition from large diagnostic companies, these competitors have greater resources than we do. Inaddition, certain competitors may have more favorable competitive positions than we do, particularly inmarkets outside the United States.
We believe that our dedication to research and development and our strong intellectual propertyportfolio, coupled with our manufacturing capabilities, diversified product positioning, global marketpresence and established distribution networks, provide us with a competitive advantage in the point-of-care markets in which we compete.
Health Information Solutions. Competition in the health information space is intense due to lowbarriers to entry. Athenahealth, Cerner Corporation, Allscripts Healthcare Solutions, Greenway MedicalTechnologies, and McKesson provide health information exchange, data management, and clinicalsupport solutions that compete directly with our health information solutions. Additionally, HealthDialog, Healthways, Optum Health, Active Health and a number of smaller service providers offerproducts that compete with our integrated care management solutions. Our competitors and potentialcompetitors also include health plans, self-insured employers, healthcare providers, pharmaceuticalcompanies, pharmacy benefit management companies, case management companies and otherorganizations that provide services to health plans, governments, governmental programs and self-insured employers. Some of these entities, particularly health plans and self-insured employers, maybe customers or potential customers and may own, acquire or establish health information serviceproviders or capabilities for the purpose of providing health information solutions in-house. Many ofthese competitors are considerably larger than we are and have access to greater resources. Webelieve that our ability to improve clinical and financial outcomes and our technology platforms,including our Apollo system, provide us with certain competitive advantages.
Consumer Diagnostics. Our First Check tests compete against over-the-counter diagnostic testssold primarily by Phamatech, but also by other smaller competitors. Essentially, all of our remainingconsumer diagnostic product sales are to SPD, our joint venture. These products are sold by SPD in
14

retail markets where competition is intense and based primarily on brand recognition and price. Ourrevenues, as well as our share of the profits from the sale of these products by SPD, are dependentupon SPD’s ability to effectively compete in these markets.
Patents and Proprietary Technology; Trademarks
We have built a strong intellectual property portfolio including an increasing number of patents,patent applications, copyrights, trade secrets and licensed intellectual property, which are intended toprotect our vision of the technologies, products and services of the future. Our intellectual propertyportfolio includes patents and other intellectual property that we own and, in some cases, patents orother intellectual property that we license from third parties, which may be limited with respect to termand in terms of field of use or transferability and may require royalty payments.
The medical device industry, including the diagnostic testing industry, historically has beencharacterized by extensive litigation regarding patents, licenses and other intellectual property rights.Litigation relating to intellectual property rights is also a risk to our health information solutions business,including our health information technologies.
We believe that our history of successfully enforcing our intellectual property rights in the UnitedStates and abroad demonstrates our resolve in enforcing our intellectual property rights, the strength ofour intellectual property portfolio and the competitive advantage that we have in this area. We haveincurred substantial costs, both in asserting infringement claims against others and in defendingourselves against patent infringement claims, and we expect to incur substantial litigation costs as wecontinue to aggressively protect our technology and defend our proprietary rights.
Finally, we believe that certain of our trademarks are valuable assets that are important to themarketing of both our products and services. We have applied for or obtained registration for many ofthese trademarks with the United States Patent and Trademark Office or comparable foreign agencies.
The medical device industry and the market for health information solutions, place considerableimportance on obtaining and enforcing patent and trade secret protection for new technologies,products, services and processes. Trademark protection is an important factor in the success of certainof our product lines and health information solutions. Our success therefore depends, in part, on ourability to obtain and enforce the patents and trademark registrations necessary to protect our products,to preserve our trade secrets and to avoid or neutralize threats to our proprietary rights from thirdparties. We cannot, however, guarantee our success in enforcing or maintaining our patent rights; inobtaining future patents or licensed patents in a timely manner or at all; or as to the breadth or degreeof protection that our patents or trademark registrations or other intellectual property rights might affordus. For more information regarding the risks associated with our reliance on intellectual property rights,see the discussion in Item 1A entitled “Risk Factors” on pages 17 through 36 of this report.
Government Regulation
Our businesses are subject to extensive and frequently changing federal, state, local and foreignlaws and regulations. Changes in applicable laws, changes in the interpretation or application of suchlaws, or any failure to comply with existing or future laws, regulations or standards could have a materialadverse effect on our results of operations, financial condition, business and prospects. We believe ourcurrent arrangements and practices are in material compliance with applicable laws and regulations.There can be no assurance that we are in compliance with all applicable laws and regulations or that wewill be able to comply with new laws or regulations.
Our research, development and clinical programs, as well as our manufacturing and marketingoperations, are subject to extensive regulation in the United States and other countries. Most notably,all of our diagnostic products, and certain of our health information technologies and solutions, sold in
15

the United States are subject to the Federal Food, Drug and Cosmetic Act, or the FDCA, asimplemented and enforced by the FDA. Our diagnostic products sold in the United States, includingany imbedded or stand-alone software which has been classified by the FDA as a Class II medicaldevice, generally require either FDA clearance to market under Section 510(k) of the FDCA, orPremarket Approval, or PMA, which may require pre-clinical and clinical trials. Certain of our healthinformation solutions are classified by the FDA as Medical Device Data Systems, or MDDS, which aresoftware systems distinct from Class II medical device software, that transfer, store, convert anddisplay medical device data. MDDS do not require FDA clearance or approval to be marketed andsold, but are subject to the FDA-mandated quality standards. Foreign countries may require similar ormore onerous approvals to manufacture or market these products. The marketing of our consumerdiagnostic products is also subject to regulation by the U.S. Federal Trade Commission, or the FTC. Inaddition, we are required to meet regulatory requirements in countries outside the United States, whichcan change rapidly with relatively short notice. We must also demonstrate to the FDA that ourdiagnostic tests intended for home use or for use by laboratories holding a Certificate of Waiver underthe Clinical Laboratory Improvement Act of 1967 and the Clinical Laboratory Amendments of 1988, orCLIA, including most physician office laboratories, are simple with a low risk of error. Foreign countriesmay require similar or more onerous approvals to manufacture or market our products.
CLIA extends federal oversight to many clinical laboratories, including certain of our drug testinglaboratories in the United States, by requiring that they be certified to meet quality assurance, qualitycontrol and personnel standards. Laboratories also must undergo proficiency testing and are subject toinspections. Certain of our drug testing laboratories perform drug testing on employees of federalgovernment contractors and certain other entities and are therefore regulated by SAMHSA, which hasestablished detailed performance and quality standards that laboratories must meet to be approved toperform drug testing on employees of federal government contractors and certain other entities.
Certain of our clinicians, such as nurses, must comply with individual licensing requirements. Webelieve that all of our clinicians who are subject to licensing requirements are licensed in the state in whichthey are physically present, such as the location of the call center from which they operate and, ifapplicable, states in which they visit or interact with patients, to the extent such licensure is required.
In 2013, we will assume reporting responsibilities under Section 6002 of the 2010 Affordable CareAct, which is commonly referred to as the Physician Payment Sunshine Act, or the Sunshine Act. We willbe required to collect data on and annually report to CMS certain payments or other transfers of value tophysicians and teaching hospitals and annually report certain ownership and investment interests held byphysicians or their immediate family members.
Many areas of our business, including but not limited to our health improvement, diabetes supplyand patient self-testing services are subject to unique licensing or permit requirements by state andlocal health agencies. In addition, these and other areas of our business are subject to HIPAA and theHITECH Act. We are also required to obtain certification to participate in certain governmental paymentprograms, such as various state or federal Medicare/Medicaid programs. Some states haveestablished Certificate of Need/Determination of Need, or CON/DON, programs regulating theexpansion of healthcare operations. The failure to obtain, renew or maintain any of the requiredlicenses, certifications or CON/DONs could adversely affect our business.
For more information about the governmental regulations to which our business is subject and therisk associated with non-compliance with those regulations, see the risk factors discussed in Item 1Aentitled “Risk Factors” on pages 17 through 36 of this report.
Employees
As of January 31, 2013, we had approximately 17,400 employees, including temporary andcontract employees, of which approximately 9,200 employees are located in the United States. Inaddition, we utilize consultants specializing in areas such as research and development, riskmanagement, regulatory compliance and marketing.
16

ITEM 1A. RISK FACTORS
The risks described below may materially impact your investment in our company or may in thefuture, and, in some cases already do, materially affect us and our business, financial condition andresults of operations. You should carefully consider these factors with respect to your investment in oursecurities.
We face intense competition and our failure to compete effectively may negatively affectsales of our products and services.
The markets in which we operate, including the markets for medical diagnostic products andhealth information solutions, are rapidly evolving, and developments are expected to continue at arapid pace. Competition in these markets is intense and expected to increase as new products,services and technologies become available and new competitors enter the market. Our competitors inthe United States and abroad are numerous and include, among others, diagnostic testing and medicalproducts companies, universities and other research institutions, health information solutions providers,healthcare providers and health insurers. Many of our existing or potential competitors havesubstantially greater research and development capabilities, clinical, manufacturing, regulatory andmarketing experience and financial and managerial resources than we do. Our sales and results ofoperations may be adversely affected by:
• customers’ perceptions of the comparative quality of our competitors’ products or services;
• our ability to manufacture, in a cost-effective way, sufficient quantities of our products to meetcustomer demand;
• the ability of our competitors to develop products, services and technologies that are moreeffective than ours or that render ours obsolete;
• our competitors’ ability to obtain patent protection or other intellectual property rights that wouldprevent us from offering competing products or services;
• the ability of our competitors to obtain regulatory approval for the commercialization of productsor services more rapidly or effectively than we do; and
• competitive pricing by our competitors, particularly in emerging markets.
In addition, as markets for our novel products become saturated with competing products, such asfor our meter-based Alere Triage BNP test, the growth rates of sales unit volume and average sellingprices for those products may decline, which may adversely impact our product sales, gross marginsand overall financial results. This may occur even if we are able to successfully introduce new productsin these markets, and achieve market acceptance of those products, in a timely manner.
We face risks and uncertainties relating to the FDA warning letter and OIG subpoena.
On October 9, 2012, we received a warning letter from the FDA referencing inspectionalobservations set forth in an FDA Form 483 that we received in June 2012. The observations were theresult of an inspection of our San Diego facility conducted earlier during 2012 relating to our AlereTriage products, which resulted in two recalls of certain Alere Triage products and revised releasespecifications for our Alere Triage meter-based products. On October 30, 2012, we responded to thewarning letter and submitted evidence of our completion of most of the actions previously detailed inour July 2012 response to the FDA Form 483. Since then we have worked diligently in an effort to fullyaddress each of the issues the FDA has identified, and we plan to continue to do so.
In May 2012, Alere San Diego, Inc. received a subpoena from the Office of Inspector General ofthe Department of Health and Human Services, or the OIG, seeking documents relating primarily to thequality control testing and performance characteristics of our Alere Triage cardiac marker devices and
17

the Triage TOX Drug Screen manufactured at Alere San Diego. We are in the process of responding tothe OIG subpoena and the investigation is ongoing.
We cannot assure you that the government will find our efforts to resolve the FDA warning letter orthe investigation initiated by the OIG subpoena to be satisfactory. We may be unable to implementcorrective actions within a timeframe or in a manner satisfactory to the FDA. Failure to do so can resultin enforcement proceedings by the government, which may include potential civil or criminal fines andpenalties, including disgorgement of amounts earned on any legally-adulterated products; injunctiverelief, which could limit, modify or constrain our ability to manufacture, market and sell our products;and exclusion from participation in government healthcare programs, such as Medicare and Medicaid.We have received inquiries from regulatory authorities outside the United States regarding the AlereTriage recalls in the United States and, in at least one case, remedial or corrective action was required.We cannot predict whether other governments’ regulatory authorities will require additional remedial orcorrective actions in the future. The investigation initiated by the OIG subpoena can result in civil orcriminal fines or penalties, increased supervision of our business operations by the OIG, or exclusionfrom participation in government healthcare programs, such as Medicare and Medicaid. We are unableto predict when these matters will be resolved or what action, if any, the government will take inconnection with these matters. The issues arising out of the FDA inspection and OIG subpoena maybe expanded to cover other matters. We can also face product liability, third-party payer, shareholder,or other litigation. Any of these risks and uncertainties can adversely affect our revenues, results ofoperations, cash flows and financial condition.
Also, except for increases in manufacturing costs and decreased profitability for our Alere Triageproducts, we are unable to predict what impact these matters or ensuing proceedings, if any, will have onour results of operations, cash flows or financial condition. Our related efforts to improve our productionand quality control processes in accordance with the revised release specifications for the Alere Triagemeter-based products and to increase production to offset lower yields have increased our manufacturingcosts, and we expect that our costs will continue to increase as we continue to implement the finalrelease specifications or other similar changes to enhance our quality control processes that we or theFDA may deem necessary. Because our efforts to improve our manufacturing processes at our SanDiego facility are ongoing and because we are continuing to seek to implement the remaining changes inaccordance with the timelines set forth in our response to the FDA, we cannot predict the continuingimpact of the final quality control release specifications on our manufacturing yields. We cannotguarantee that we will be able to manufacture all of the impacted products at cost-effective yield ratesunder the final release specifications, in which case, we may be required to, or we may opt to, ceaseproduction and sale of the impacted products. In any case, we expect that our ability to supply certainAlere Triage products will continue to be limited, which we expect to adversely affect revenues from salesof these products. We are unable to predict the scope or the duration of any product shortage. Ourrevenues and market share could continue to be adversely affected by customer decisions to switch tocompeting products due to product shortages or damage to our reputation resulting from these matters.
We may experience difficulties that delay or prevent our development, introduction ormarketing of new or enhanced products or services.
Our success depends on our ability to effectively introduce new and competitive products and services.The development of new or enhanced products or services is a complex, costly and uncertain process andis becoming increasingly complex and uncertain in the United States. Furthermore, developing andmanufacturing new products and services require us to anticipate customers’ and patients’ needs andemerging technology trends accurately. We may experience research and development, manufacturing,regulatory, marketing and other difficulties that could delay or prevent our introduction of new or enhancedproducts and services. The research and development process in the healthcare industry generally takes asignificant amount of time from design stage to product launch. This process is conducted in various stages,and each stage presents the risk that we will not achieve our goals. We may have to abandon a product inwhich we have invested substantial resources. We cannot be certain that:
18

• any of our products or services under development will prove to be safe and effective in clinicaltrials;
• we will be able to obtain, in a timely manner or at all, necessary regulatory approvals;
• the products and services we develop can be manufactured or provided at acceptable cost andwith appropriate quality; or
• these products and services, if and when approved, can be successfully marketed.
These factors, as well as manufacturing or distribution problems or other factors beyond ourcontrol, could delay the launch of new products or services. Any delay in the development, approval,production, marketing or distribution of a new product or service could materially and adversely affectour competitive position, our branding and our results of operations.
Our financial condition and results of operations may be adversely affected by internationalbusiness risks.
We generate a significant percentage of our net revenue from outside the United States, and asignificant number of our employees, including manufacturing, sales, support, and research anddevelopment personnel, are located in foreign countries, including Australia, Brazil, China, Germany,India, Israel, Japan, Norway, South Korea, and the United Kingdom. Conducting business outside theUnited States subjects us to numerous risks, including:
• lost revenues as a result of macroeconomic developments, such as the current Europeanbudgetary issues, debt crisis and related European financial restructuring efforts, which maycause European governments to reduce spending and cause the value of the Euro todeteriorate, thus reducing the purchasing power of European customers;
• decreased liquidity resulting from longer accounts receivable collection cycles typical of foreigncountries;
• lower productivity resulting from difficulties we encounter in staffing and managing sales,support, and research and development operations across many countries;
• lost revenues or unexpected expenses resulting from difficulties associated with enforcingagreements and collecting receivables through foreign legal systems;
• lost revenues or unexpected expenses resulting from disputes with third-party distributors of ourproducts or from third parties claiming distribution rights to our products under foreign laws orlegal systems;
• lost revenues or unexpected expenses resulting from the imposition by foreign governments oftrade barriers such as tariffs, quotas, preferential bidding, and import restrictions;
• higher cost of sales resulting from import or export licensing requirements;
• lost revenues or other adverse effects resulting from acts of war, terrorism, theft or other lawlessconduct or otherwise resulting from economic, social or political instability in or affecting foreigncountries in which we sell our products or operate;
• lost revenues or other adverse effects resulting from international sanctions regimes;
• adverse effects resulting from changes in foreign regulatory or other laws affecting sales of ourproducts or our foreign operations;
• greater tax liability resulting from international tax laws, including U.S. taxes on foreignsubsidiaries;
• increased financial accounting and reporting burdens and complexities;
• increased costs to comply with changes in legislative or regulatory requirements;
19

• lost revenues or increased expenses resulting from the failure of laws to protect our intellectualproperty rights; and
• lost revenues resulting from delays in obtaining import or export licenses, transportationdifficulties and delays resulting from inadequate local infrastructure.
Our international operations subject us to varied and complex domestic, foreign and internationallaws and regulations. Compliance with these laws and regulations often involves significant costs orrequires changes in our business practices that may reduce revenues and profitability. We could incuradditional legal compliance costs associated with our global operations and could become subject tolegal penalties if we do not comply with certain regulations. For example, we are subject to the UnitedStates Foreign Corrupt Practices Act which, among other restrictions, prohibits U.S. companies andtheir intermediaries from making payments to foreign officials for the purpose of obtaining or retainingbusiness or otherwise obtaining favorable treatment, as well as anti-bribery and anti-corruption laws ofother jurisdictions. In addition, our international activities are subject to compliance with United Stateseconomic and trade sanctions, which restrict or otherwise limit our ability to do business in certaindesignated countries. Our training and compliance program and our other internal control policies andprocedures may not always protect us from acts committed by our employees or agents.
Because our business relies heavily on foreign operations and revenues, changes inforeign currency exchange rates and our need to convert currencies may negatively affect ourfinancial condition and results of operations.
Our business relies heavily on our foreign operations. Six of our eight largest manufacturingoperations are located in China, Japan, Norway, South Korea and the United Kingdom, and we alsohave manufacturing operations in Australia, Germany, India, Israel, South Africa and Spain. We havesignificant research and development operations in Germany and the United Kingdom, and we conductadditional research and development activities in China, Israel, Japan and South Korea. In addition, forthe year ended December 31, 2012, approximately 39% of our net revenue was derived from salesoutside the United States. Because of the scope of our foreign operations and foreign sales, we facesignificant exposure to movements in foreign currency exchange rates. Our primary exposures arerelated to the operations of our European and Asia Pacific subsidiaries and our manufacturing facilitiesin China, Japan and South Korea. These exposures may change over time as our business practicesevolve and could result in increased costs or reduced revenue and could affect our actual cash flow.Changes in the relative values of currencies occur regularly and, in some instances, may have asignificant impact on our operating results. We cannot predict with any certainty changes in foreigncurrency exchange rates or the degree to which we can cost-effectively mitigate these risks.
Healthcare reform legislation could adversely affect our revenue and financial condition.
The Patient Protection and Affordable Care Act of 2010 (as amended by the Health Care andEducation Reconciliation Act of 2010), or the ACA, makes comprehensive reforms at the federal andstate level affecting the coverage and payment for healthcare services in the United States. Inparticular, the ACA significantly alters Medicare Advantage reimbursements by setting the federalbenchmark payment closer to the payments in the traditional fee-for-service Medicare program. Thischange could reduce our revenues from the Medicare Advantage plans for which we perform services,although the precise effect on any particular plan, much less the impact on us, is impossible to predict.Effective January 1, 2013, the ACA includes a 2.3% excise tax on the sale of certain medical devices,which will adversely affect our results of operations. Legislative provisions impose federal reportingrequirements regarding payments or relationships between manufacturers of covered drugs, devices orbiological or medical supplies, and physicians, among others.
The ACA requires that providers of health insurance plans maintain specified minimum medical lossratios. We believe that the majority of our health information solutions would qualify as “quality improving
20

activities”, but there have been no regulations specifically classifying our services in such a manner. If ourhealth information solutions are not classified as “quality improving activities” under the ACA, healthinsurance providers will not be permitted to count expenditures on those services toward the calculationof their medical loss ratios, which may have a material adverse effect on demand for our healthinformation solutions and the results of operations of our health information solutions business.
Additionally, revenues associated with our recently-acquired diabetes business will be impacted bythe Durable Medical Equipment, Prosthetics, Orthotics and Supplies, or the DMEPOS, CompetitiveBidding Program. Under this program, Medicare will no longer reimburse suppliers for certain productsand services, including mail-order diabetes testing supplies, based on the Medicare fee scheduleamount. Instead the Centers for Medicare and Medicaid Services, or CMS, will provide reimbursementfor those products and services based on a competitive bidding process. Our Arriva business has beenselected through the bidding process and offered a contract to have its products reimbursed byMedicare. However, the DMEPOS Competitive Bidding Program will require us to sell diabetessupplies subject to Medicare reimbursement at significantly lower prices, which will have a materialadverse effect on the profitability of these products.
Legislative and regulatory bodies are likely to continue to pursue healthcare reform initiatives andmay continue to reduce the funding of the Medicare and Medicaid programs, including MedicareAdvantage, in an effort to reduce overall healthcare spending. The ultimate impact of all of the reformsin the ACA, and its impact on us, is impossible to predict. If all of the reforms in the legislation areimplemented, or if other reforms in the United States or elsewhere are adopted, those reforms mayhave a material adverse effect on our financial condition and results of operations.
If the results of clinical studies required to gain regulatory approval to sell our products arenot available when expected, or do not demonstrate the safety and effectiveness of thoseproducts, we may be unable to sell those products.
Before we can sell certain of our products, we must conduct clinical studies intended todemonstrate that those products are safe and effective and perform as expected. The results of theseclinical studies are used to obtain regulatory approval from government authorities such as the FDA.Clinical studies are experiments involving human patients having the diseases or medical conditionsthat the product is trying to evaluate or diagnose. Conducting clinical studies is a complex, time-consuming and expensive process. In some cases, we may spend several years completing thenecessary clinical studies.
If we fail to adequately manage our clinical studies, those clinical studies and correspondingregulatory approvals may be delayed or we may fail to gain approval for our products altogether. Evenif we successfully manage our clinical studies, we may not obtain favorable results and may not obtainregulatory approval. If we are unable to market and sell our new products or are unable to obtainapprovals in the timeframe needed to execute our product strategies, our business and results ofoperations would be materially and adversely affected.
If we are unable to obtain required clearances or approvals for the commercialization of ourproducts in the United States, we would not be able to sell those products in the United States.
Our future performance depends on, among other matters, the timely receipt of necessaryregulatory approvals for new products. Regulatory approval can be a lengthy, expensive and uncertainprocess. In addition, regulatory processes are subject to change, and new or changed regulations canresult in increased costs and unanticipated delays.
In the United States, clearance or approval to commercially distribute new medical devices isreceived from the FDA through clearance of a Premarket Notification 510(k), or 510(k), or through aPremarket Approval, or PMA. The FDA may deny 510(k) clearance because, among other reasons, it
21

determines that our product is not substantially equivalent to another U.S. legally marketed device. TheFDA may deny a PMA because, among other reasons, it determines that our product is not sufficientlysafe or effective. As part of the clearance or approval process, if we intend to sell certain diagnostictests for home use or for use by laboratories holding a CLIA Certificate of Waiver, including mostphysician office laboratories, we must generally provide data, demonstrating to the FDA’s satisfaction,that the criteria for our tests are simple with a low risk of error. Failure to obtain FDA clearance orapproval would preclude commercialization in the U.S. and failure to obtain or maintain CLIA-waivedstatus for any product would preclude us from selling that product for home use or to CLIA-waivedlaboratories, which could materially and adversely affect our future results of operations.
Modifications or enhancements that could significantly affect safety or effectiveness, or thatconstitute a major change in the intended use of the device, require new 510(k) or PMA submissions.We have made modifications to some of our products since receipt of initial 510(k) clearance or PMA.With respect to several of these modifications, we filed new 510(k)s describing the modifications andreceived FDA 510(k) clearance. We have made other modifications to some of our products that webelieve do not require the submission of new 510(k)s or PMAs. The FDA may not agree with any of ourdeterminations not to submit a new 510(k) or PMA for any of these modifications made to our products.If the FDA requires us to submit a new 510(k) or PMA for any device modification, we may beprohibited from marketing the modified products until the new submission is cleared or approved by theFDA. As long as our San Diego facility remains subject to the FDA Warning Letter that we received inOctober 2012, that facility will be ineligible to receive PMA approvals. While no PMA submissions arecurrently pending for that facility and we do not plan any new submissions for that facility in 2013, if weare unable to resolve the Warning Letter in a timely manner, our ability to gain approval for new orenhanced products could be adversely impacted.
We are subject to regulatory approval requirements of the foreign countries in which wesell our products, and these requirements may prevent or delay us from marketing ourproducts in those countries.
We are subject to the regulatory approval requirements for each foreign country in which we sellour products. The process for complying with these approval requirements can be lengthy andexpensive. Any changes in foreign approval requirements and processes may cause us to incuradditional costs or lengthen review times of our products. We may not be able to obtain foreignregulatory approvals on a timely basis, if at all, and any failure to do so may cause us to incuradditional costs or prevent us from marketing our products in foreign countries, which may have amaterial adverse effect on our business, financial condition and results of operations.
Our business is subject to substantial regulatory oversight and our failure to comply withapplicable regulations may result in significant costs or, in certain circumstances, thesuspension or withdrawal of previously obtained clearances or approvals.
Our businesses are extensively regulated by the FDA and other federal, state and foreignregulatory agencies. These regulations impact many aspects of our operations, including development,manufacturing, labeling, packaging, adverse event reporting, storage, advertising, promotion, physicianinteraction and record-keeping.
The FDA and foreign regulatory agencies may require post-market testing and surveillance tomonitor the performance of approved products or may place conditions on any product approvals thatcould restrict the commercial applications of those products. The discovery of problems with a productmay result in restrictions on the product, including withdrawal of the product from the market. Inaddition, in some cases we may sell products or provide services which are reliant on the use orcommercial availability of products of third parties, including medical devices, equipment orpharmaceuticals, and regulatory restrictions placed upon any such third-party products could have amaterial adverse impact on the sales or commercial viability of our related products or services.
22

We are subject to routine inspection by the FDA and other agencies for compliance with theQuality System Regulation and Medical Device Reporting requirements in the United States and otherapplicable regulations worldwide. Our manufacturing facilities and those of our suppliers anddistributors also are, or can be, subject to periodic regulatory inspections.
Under CLIA, some of our drug testing laboratories in the United States are required to be certifiedto meet quality assurance, quality control and personnel standards. Laboratories also must undergoproficiency testing and are subject to inspections. Our laboratories that perform drug testing onemployees of federal government contractors and some other entities are regulated by the UnitedStates SAMHSA, which has established detailed performance and quality standards that laboratoriesmust meet in order to perform this work.
Portions of our health information solutions business are subject to unique licensing or permitrequirements. For example, we may be required to obtain certification to participate in governmentalpayment programs, such as state or federal Medicaid/Medicare programs. We may need an operatinglicense in some states, and some states have established Certificate of Need programs regulating theexpansion of healthcare operations. In addition, we believe that some of the health improvementprograms offered by our health information solutions are educational in nature, do not constitute thepractice of medicine or provision of healthcare and, thus, do not require that we maintain federal orstate licenses to provide these services. However, it is possible that federal or state laws regarding theprovision of “virtual” or telephonic medicine could be revised or interpreted to include our services, orthat other laws may be enacted which require licensure or otherwise relate to our health informationsolutions. In that event, we may incur significant costs to comply with such laws and regulations.
We are also subject to laws relating to matters such as privacy, safe working conditions,manufacturing practices, environmental protection, fire hazard control and disposal of hazardous orpotentially hazardous substances.
We may incur significant costs to comply with these laws and regulations. If we fail to comply withapplicable regulatory requirements, we may be subject to fines, suspension or withdrawal of regulatoryapprovals, product recalls, seizure of products or injunctions against our distribution of products,termination of our service agreements by our customers, disgorgement of money, operating restrictionsand criminal prosecution. Changes in applicable laws, changes in the interpretation or application ofsuch laws, or any failure to comply with existing or future laws, regulations or standards which couldhave a material adverse effect on our results of operations, financial condition, business andprospects. Moreover, new laws may be enacted, or regulatory agencies may impose new or enhancedstandards, that would increase our costs, as well as expose us to risks associated with non-compliance.
We are subject to healthcare fraud and abuse regulations that could result in significantliability, require us to change our business practices and restrict our operations in the future.
We are subject to laws regulating fraud and abuse in the healthcare industry, including anti-kickback and false claims laws. The Federal Anti-Kickback Statute prohibits persons from knowinglyand willfully soliciting, offering, receiving or providing remuneration, directly or indirectly, in exchangefor or to induce either the referral of an individual, or the furnishing or arranging for a good or service,for which payment may be made under a federal healthcare program, such as Medicare or Medicaid.Many states have also adopted laws similar to the Anti-Kickback Statute. Some of these stateprohibitions apply to the referral of patients for healthcare items or services reimbursed by any payer,not only the Medicare, Medicaid and Veterans Administration programs. These laws constrain thesales, marketing and other promotional activities of manufacturers of medical devices by limiting thekinds of financial arrangements, including sales programs, with hospitals, physicians, laboratories andother potential purchasers of medical devices and related services.
23

Other laws generally prohibit individuals or entities from knowingly presenting, or causing to bepresented, claims for payment from Medicare, Medicaid, or other third-party payers that are false orfraudulent, or are for items or services that were not provided as claimed. These laws may also betriggered by failure to return identified overpayments to a payer. Anti-kickback and false claims lawsprescribe civil and/or criminal penalties for noncompliance that can be substantial including, in someinstances, fines, imprisonment and, within the United States, exclusion from participation in governmenthealthcare programs. Furthermore, since we are reimbursed directly by federal healthcare programs forcertain goods and services and, given that many of our customers rely on reimbursement from Medicare,Medicaid and other governmental programs to cover a substantial portion of their expenditures, ourexclusion from such programs as a result of a violation of these laws could have a material adverse effecton our business, results of operations, financial condition and cash flows. The interpretation andenforcement of these laws and regulations are uncertain and subject to rapid change.
Billing and payment for healthcare services are highly regulated, and the failure to complywith applicable laws and regulations can result in civil or criminal sanctions, includingexclusion from federal and state healthcare programs.
A portion of our healthcare products and services are paid for by private and governmental third-party payers, such as Medicare and Medicaid. These third-party payers typically have different andcomplex billing and documentation requirements that we must satisfy in order to receive payment, andthey carefully audit and monitor our compliance with these requirements. We must also comply withnumerous other laws applicable to billing and payment for healthcare services, including privacy laws.Failure to comply with these requirements may result in non-payment, refunds, exclusion fromgovernment healthcare programs, and civil or criminal liabilities, any of which may have a materialadverse effect on our revenues and earnings. In addition, failure by third-party payers to properlyprocess our payment claims in a timely manner could delay our receipt of payment for our productsand services, which may have a material adverse effect on our cash flows.
The market for health information solutions is rapidly and continually evolving, and anysuch changes may impact our health information solutions business.
The market for health information solutions is rapidly and continually evolving due to factors suchas changes in federal and state regulations and cost reduction pressures. We cannot predict withcertainty the future growth rate or the ultimate size of the market. Our failure to manage any changesin this market may adversely affect the revenues and results of operations of our health informationsolutions business. The success of our health information solutions business, including our healthimprovement programs, depends on a number of factors. These factors include:
• our ability to differentiate our health information solutions from those of competitors;
• the extent and timing of the acceptance of our services as a replacement for, or supplement to,traditional managed-care offerings;
• the effectiveness of our sales and marketing efforts with customers and their participants,employees or constituents;
• our ability to devise new and additional products and services beneficial to health plans,employers and states and their respective participants, employees or constituents;
• our ability to obtain and retain all necessary licenses, permits and regulatory clearances andapprovals related to our services and any products used as part of our services, and to delivereffective, reliable and safe services to our customers and their participants, employees orconstituents;
• our ability to achieve, measure and effectively communicate cost savings for our customersthrough the use of our services; and
24

• our ability to obtain, retain and renew contracts with customers and potential customers withfavorable pricing as competition increases and to the extent that customers attempt to providehealth information solutions themselves.
Increasing health insurance premiums and co-payments or high deductible health plansmay cause individuals to forgo health insurance and avoid medical attention, either of whichmay reduce demand for our products and services.
Health insurance premiums, co-payments and deductibles have generally increased in recentyears. These increases may cause individuals to forgo health insurance, as well as medical attention.This behavior may reduce demand for our point-of-care diagnostic products and also reduce thenumber of lives managed by our health information solutions, including our health improvementprograms.
Continued high unemployment may negatively impact the collectability of uninsuredaccounts and patient due accounts and/or reduce total health plan populations.
Some of the contracts for our health information solutions provide reimbursement to us based ontotal relevant populations managed by health plans. If unemployment rates rise, our revenues underthese contracts may be reduced as managed lives may decrease. One of the primary collection risks ofour health information solutions business’ accounts receivable relates to uninsured patient accountsand patient accounts for which the primary insurance carrier has paid the amounts covered by theapplicable insurance policy, but patient responsibility amounts (deductibles and co-payments) remainoutstanding. If unemployment rates rise, these uninsured and patient due accounts could increase as apercentage of the health information solutions business’ accounts receivable. Deterioration in thecollectability of these accounts could adversely affect the health information solutions business’collection of accounts receivable, cash flows and results of operations. These financial pressures couldhave an adverse impact on our business.
A portion of our health information solutions fees are contingent upon performance.
Some of our existing health information solutions agreements contain savings or other guarantees,which provide that our revenues, or a portion of them, are contingent upon projected cost savings orother quality performance measures related to our health information solutions programs. There is noguarantee that we will accurately forecast cost savings and clinical outcome improvements under ourhealth information solutions agreements or meet the performance criteria necessary to recognizepotential revenues under the agreements. Additionally, untimely, incomplete or inaccurate data fromour customers, or flawed analysis of such data, could have a material adverse impact on our ability torecognize revenues.
If our costs of providing health information solutions increase, we may not be able to passthese cost increases on to our customers.
Many of our health information solutions are provided pursuant to long-term contracts that we maybe unable to re-negotiate. If our costs increase, we may be unable to increase our prices, which wouldadversely affect our overall profit margin and net income.
Demands of third-party payers, cost reduction pressures among our customers andrestrictive reimbursement practices may adversely affect our revenues.
Our ability to negotiate favorable contracts with non-governmental payers, including managed-care plans, significantly affects the revenues and operating results of our health information solutionsbusiness. Our customers continue to face cost reduction pressures that may cause them to curtail theiruse of, or reimbursement for, health information solutions, to negotiate reduced fees or other
25

concessions or to delay payment. Furthermore, the increasing leverage of organized buying groupsamong non-governmental payers may reduce market prices for our products and services, therebyreducing our profitability. Reductions in price increases or the amounts received from currentcustomers or lower pricing for our services to new customers could have a material adverse effect onthe financial position, cash flows and results of operations of our health information solutions business.
In addition, the ability of our customers to obtain appropriate reimbursement for products andservices from third-party payers is critical to the success of our business because it affects whichproducts customers purchase and the prices they are willing to pay. If we develop a new product butthe product is not approved for reimbursement by private and governmental third-party payers, theproduct may not be successful. Domestic and foreign healthcare reforms may further reducereimbursement levels and adversely affect demand for and profitability of our products and services.These reforms, along with other cost-containment initiatives, could have a material adverse effect onour business, results of operations and financing condition.
Future reductions in state spending on preventative care programs could reduce our netrevenues, net income and cash flows.
Due to budgetary shortfalls, many states are considering, or have enacted, cuts to existingpreventative care programs. These cuts have included, or may include, elimination or reduction ofcoverage for some or all of our preventative care programs. For example, in 2012, nearly half of AlereWellbeing’s state clients partially, or substantially, reduced their funding of smoking cessationprograms we provided. During 2012, approximately 62% of the net revenue of our Alere Wellbeingbusiness was derived from sales to state governments. Continued state budgetary pressures couldlead to further reductions in funding for our services which, in turn, could have a material adverse effecton our financial position and operating results.
In addition, some states may reduce current spending on preventative care programs in order toconserve funds for use in anticipated future programs, which may or may not occur. For example, theCenters for Disease Control and Prevention, or CDC, conducted a successful anti-smoking campaignin 2012. The CDC has announced that it is planning to implement another such campaign in 2013. Webelieve that, in anticipation of that campaign, many states are reducing spending on tobacco cessationprograms so that they will have funds available to spend in conjunction with the CDC’s expectedcampaign. If the CDC cancels, delays or substantially modifies its 2013 campaign, if states do notspend the expected funds in conjunction with that campaign, or if tobacco users are reluctant torespond to the campaign, funding for our services could be negatively impacted, which could have amaterial adverse effect on our financial position and operating results.
Our data management and information technology systems are critical to maintaining andgrowing our business.
Our business, particularly our health information solutions business, is dependent on the effectiveuse of information technology and, consequently, technology failure or obsolescence may negativelyimpact our business. In addition, data acquisition, data quality control, data privacy, data security anddata analysis, which are a cornerstone of our health information solutions programs, are intense andcomplex processes subject to error. Untimely, incomplete or inaccurate data, flawed analysis of data orour inability to properly integrate, implement, protect and update systems could have a materialadverse impact on our business and results of operations. In particular, we are relying on ourintegrated care management system, our health information exchange and our clinical decision-support software to provide the framework and supporting infrastructure for significantly enhancedfuture health information solutions programs and to provide a competitive advantage. These systemsand software are relatively new and may not provide these expected benefits or meet our needs or theneeds of our customers or program participants.
26

We expect that we will need to continue to improve and further integrate our informationtechnology systems on an ongoing basis in order to effectively run our business. If we fail tosuccessfully manage our information technology systems, our business and operating results could beadversely affected.
Our ability to protect our information systems and electronic transmissions of sensitivedata from data corruption, cyber-based attacks, security breaches or privacy violations iscritical to the success of our business.
We are highly dependent on information technology networks and systems, including the Internet,to securely process, transmit and store electronic information, including personal information of ourcustomers. Security breaches of this infrastructure, including physical or electronic break-ins, computerviruses, attacks by hackers and similar breaches, can create system disruptions, shutdowns orunauthorized disclosure of confidential information. In addition, a security breach or privacy violationthat leads to disclosure of consumer information (including personally identifiable information orprotected health information) could harm our reputation, compel us to comply with disparate statebreach notification laws and otherwise subject us to liability under laws that protect personal data,resulting in increased costs or loss of revenue. If we are unable to prevent such security breaches orprivacy violations or implement satisfactory remedial measures, our operations could be disrupted, orwe may suffer loss of reputation, financial loss and other regulatory penalties because of lost ormisappropriated information, including sensitive consumer data.
In addition, the interpretation and application of consumer and data protection laws in the UnitedStates, Europe and elsewhere are often uncertain, contradictory and in flux. It is possible that theselaws may be interpreted and applied in a manner that is inconsistent with our data practices. If so, thiscould result in government-imposed fines or orders requiring that we change our data practices, whichcould have an adverse effect on our business. Complying with these various laws could cause us toincur substantial costs or require us to change our business practices in a manner adverse to ourbusiness.
Poor economic conditions may negatively impact our toxicology business.
The high rates of unemployment currently affecting the United States and other countriesnegatively impact the demand for pre-employment drug testing. Additionally, reduced governmentfunding for drug screening programs negatively impacts the market for our toxicology tests. Finally, aportion of our domestic laboratory testing services is reimbursed by Medicare and private payers and issubject to continued downward price pressure. If any, or all, of these trends continue or accelerate,they may have a material adverse impact on the results of our toxicology business operations.
If we deliver products with defects, we may be subject to product recalls or negativepublicity, our credibility may be harmed, market acceptance of our products may decrease andwe may be exposed to liability.
The manufacturing and marketing of professional and consumer diagnostics involve an inherentrisk of product liability claims. For example, a defect in one of our diagnostic products could lead to afalse positive or false negative result, affecting the eventual diagnosis. Our product development andproduction are extremely complex and could expose our products to defects. Manufacturing anddesign defects could lead to recalls (either voluntary or required by the FDA or other governmentauthorities) and could result in the removal of a product from the market. Defects in our products couldalso harm our reputation, lead to negative publicity and decrease sales of our products.
In addition, our marketing of monitoring services may cause us to be subjected to various productliability or other claims, including, among others, claims that inaccurate monitoring results lead to injuryor death, or, in the case of our toxicology monitoring services, the imposition of criminal sanctions. Any
27

product liability or other claim brought against us, regardless of merit, could be costly to defend andcould result in an increase to our insurance premiums. If we are held liable for a claim, that claim couldmaterially damage our business and financial condition.
We may experience manufacturing problems or delays due to, among other reasons, ourvolume and specialized processes, which could result in decreased revenue or increasedcosts.
The global supply of our products depends on the uninterrupted efficient operation of ourmanufacturing facilities. Many of our manufacturing processes are complex and involve sensitivescientific processes, including unique and often proprietary antibodies which cannot be replicated oracquired through alternative sources without undue delay or expense. Other processes present difficulttechnical challenges to obtain the manufacturing yields necessary to operate profitably. In addition, ourmanufacturing processes may require complex and specialized equipment which can be expensive torepair or replace with required lead times of up to a year.
The manufacturing of certain of our products is concentrated in one or more of our plants, withlimited alternate facilities. Any event that negatively impacts our manufacturing facilities, ourmanufacturing systems or equipment, or our contract manufacturers or suppliers could delay orsuspend shipments of products or the release of new products or could result in the delivery of inferiorproducts. Our revenues from the affected products would decline and we could incur losses until suchtime as we or our contract manufacturers are able to restore our or their production processes or weare able to put in place alternative contract manufacturers or suppliers.
We rely on suppliers for raw materials and other products and services, and fluctuations inthe availability and price of such products and services may adversely affect our business orresults of operations.
We rely on numerous third parties to supply raw materials and other components for ourmanufacturing processes. In some cases, these raw materials and components are available only froma sole supplier. We also rely on a number of significant third-party manufacturers to produce some ofour professional diagnostics products. Stringent requirements of the FDA and other regulatoryauthorities regarding the manufacture of our products may prevent us from quickly establishingadditional or replacement sources for the raw materials, components or manufacturing services that weuse or from doing so without excessive cost. As a result, a reduction or interruption in supply or aninability to secure alternative sources of raw materials, components or manufacturing services couldhave a material adverse effect on our business, result of operations, financial condition and cash flows.
Compliance with the SEC’s new conflict minerals rules will increase our costs andadversely affect our results of operations.
We are subject to the SEC’s new disclosure requirements for public companies that manufacture, orcontract to manufacture, products for which certain minerals and their derivatives, namely tin, tantalum,tungsten and gold, known as “conflict minerals,” are necessary to the functionality or production of thoseproducts. These regulations will require us to determine which of our products contain conflict mineralsand, if so, to perform an extensive inquiry into our supply chain, in an effort to determine whether or notsuch conflict minerals originate from the Democratic Republic of Congo, or DRC, or an adjoining country.We expect to incur additional costs to comply with these disclosure requirements, including costs relatedto determining the source of any of the relevant minerals used in our products, which will adversely affectour results of operations. Because our supply chain is complex, the due diligence procedures that weimplement may not enable us to ascertain the origins of any conflict minerals that we use or determine thatthese minerals did not originate from the DRC or an adjoining country, which may harm our reputation. Wemay also face difficulties in satisfying customers who may require that our products be certified as DRCconflict-free, which could harm our relationships with these customers and lead to a loss of revenue.
28

These new requirements could also have the effect of limiting the pool of suppliers from which we sourcethese minerals, and we may be unable to obtain conflict-free minerals at competitive prices, which couldincrease our costs and adversely affect our manufacturing operations and our profitability.
We could suffer monetary damages, incur substantial costs or be prevented from usingtechnologies important to our products as a result of pending legal proceedings.
We are involved in various legal proceedings arising out of our business. Because of the nature ofour business, we may be subject at any particular time to commercial disputes, product liability claims,negligence claims or various other lawsuits arising in the ordinary course of our business, includinginfringement and other licensing and intellectual property claims, distributor disputes, employmentmatters or investor matters. The lawsuits we face generally seek damages, sometimes in substantialamounts, for commercial or personal injuries allegedly suffered and can include claims for punitive orother special damages. An adverse ruling or rulings in one or more such lawsuits could, individually orin the aggregate, substantially harm our sales, operations or financial performance.
The rights we rely upon to protect the intellectual property underlying our products maynot be adequate to prevent third parties from using our technology, which would reduce acompetitive advantage provided by our proprietary technology.
Our success depends in part on our ability to develop or acquire commercially valuable intellectualproperty rights and to enforce those rights. The degree of present and future protection for ourintellectual property is uncertain and may change. The risks and uncertainties that we face with respectto our patents and other proprietary rights include the following:
• pending patent applications we have filed, or to which we have exclusive rights, may not resultin issued patents or may take longer than we expect to result in issued patents;
• patents licensed or issued to us or our customers may not provide a competitive advantage;
• other parties may challenge patents or patent applications licensed or issued to us or ourcustomers;
• other companies may design around technologies we have patented, licensed or developed; and
• all patents have a limited life, meaning at some point valuable patents will expire and we willlose the competitive advantage they provide. For example, certain patents related to our lateralflow technology expire in 2014 and 2015.
In addition to patents, we rely on a combination of trade secrets, non-disclosure agreements andother contractual provisions and technical measures to protect our intellectual property rights.Nevertheless, these measures may not be adequate to safeguard the technology underlying ourproducts. If these measures do not protect our rights, third parties could access our technology and ourcompetitive advantage in the market would be reduced. In addition, employees, consultants and otherswho participate in the development of our products may breach their agreements with us regarding ourintellectual property, and we may not have adequate remedies for the breach. We also may not be ableto effectively protect our intellectual property rights in some foreign countries. For a variety of reasons,we may decide not to file for patent, copyright or trademark protection or prosecute potentialinfringements of our patents. Our trade secrets may also become known through other means notcurrently foreseen by us. Despite our efforts to protect our intellectual property, our competitors orcustomers may independently develop similar or alternative technologies or products that are equal orsuperior to our technology and products without infringing any of our intellectual property rights, ordesign around our proprietary technologies.
29

Claims by others that our products infringe their proprietary rights could adversely affectour ability to sell our products and services and could increase our costs.
Substantial litigation over intellectual property rights exists in the professional and consumerdiagnostics industries and in the health information solutions marketplace. We expect that our productsand services could be increasingly subject to third-party infringement claims as the number andfunctionality of our products grow and as we enter new and different industries and markets. Thirdparties may have or obtain patents which our products and services or technology may actually orallegedly infringe. Any of these third parties might assert infringement claims against us. Any litigationcould result in the expenditure of significant financial resources and the diversion of management’stime and resources. In addition, litigation in which we are accused of infringement may result innegative publicity, have an impact on prospective customers, cause product delays, or require us todevelop alternative technologies, make substantial payments to third parties or enter into royalty orlicense agreements, which may not be available on acceptable terms, or at all. If a successful claim ofinfringement were made against us and we could not develop non-infringing technology or licenserights to the infringed or similar technology on a timely and cost-effective basis, we may be forced tostop selling current products or abandon new products under development and we could be exposedto legal actions by our customers.
We may need to initiate lawsuits to protect or enforce our patents and other intellectualproperty rights, which could be expensive and, if we lose, could cause us to lose some of ourintellectual property rights, which would reduce our ability to compete.
In order to protect or enforce our patent and other intellectual property rights, we may initiatelitigation or other proceedings against, or enter into negotiations or settlement discussions with, thirdparties. Litigation may be necessary to:
• assert claims of infringement;
• enforce licensing terms and conditions;
• protect our trade secrets or know-how; or
• determine the enforceability, scope and validity of the proprietary rights of ourselves or others.
We have initiated a number of lawsuits against competitors whom we believe to be sellingproducts that infringe our proprietary rights. These lawsuits and any other lawsuits that we initiate inthe future could be expensive, take significant time and divert management’s attention from otherbusiness concerns. Litigation can also put our patents at risk of being invalidated or interpretednarrowly and our patent applications at risk of not issuing. Additionally, we may provoke third parties toassert claims against us.
Intellectual property law relating to the fields in which we operate is still evolving and,consequently, patent and other intellectual property positions in our industry are subject to change andoften uncertain. We may not prevail in any of these suits or other efforts to protect our technology, andthe damages or other remedies awarded, if any, may not be commercially valuable. During the courseof these suits, there may be public announcements of the results of hearings, motions and otherinterim proceedings or developments in the litigation. If securities analysts or investors perceive any ofthese results to be negative, the trading prices of our securities may decline.
Our future business prospects may be limited if our acquisition strategy is not successful.
As part of our business strategy, we seek to acquire or invest in businesses that offer products,services or technologies complementary to ours. If we are unable to identify and consummate acquisitionopportunities, we may not achieve our growth targets. We may lose acquisition opportunities tocompetitors who offer a higher purchase price or who reach agreement with the target company earlier
30

than we do. We may fail to complete acquisitions for many reasons, including failure to obtain antitrust orother regulatory clearances, failure to obtain requisite shareholder approval and failure to obtainnecessary financing, and we may incur significant expenses, including potentially the expense oflitigation, pursuing acquisitions, whether or not consummated.
Our business could be materially and adversely affected as a result of the risks associatedwith our acquisition strategy.
Since our inception, we have acquired numerous businesses, including Axis-Shield in 2011 andeScreen in 2012. The ultimate success of our acquisitions depends, in part, on our ability to realize theanticipated synergies, cost savings and growth opportunities from integrating newly-acquiredbusinesses or assets into our existing businesses. However, the acquisition and successful integrationof independent businesses or assets is a complex, costly and time-consuming process, and thebenefits we realize may not exceed the costs of the acquisition. The risk and difficulties associated withacquiring and integrating companies and other assets include, among others:
• the impact of the acquisition on our financial and strategic position and reputation;
• consolidating manufacturing, research and development operations and health information orother technology platforms, where appropriate;
• integrating newly-acquired businesses or product lines into a uniform financial reporting system;
• coordinating sales, distribution and marketing functions and strategies, including the integrationof our current health information solutions products and services;
• establishing or expanding manufacturing, sales, distribution and marketing functions in order toaccommodate newly-acquired businesses or product lines or rationalizing these functions totake advantage of synergies;
• preserving the important licensing, research and development, manufacturing and supply,distribution, marketing, customer and other relationships of acquired businesses;
• minimizing the diversion of management’s attention from ongoing business concerns;
• the potential loss of key employees of the acquired business;
• coordinating geographically separate operations; and
• regulatory and legal issues relating to the integration of legacy and newly-acquired businesses.
These factors could have a material adverse effect on our business, results of operations or financialcondition, and managing multiple acquisitions or investments at the same time could exacerbate theserisks. To the extent that we issue equity securities in connection with any acquisition or investment,existing shareholders may experience dilution. Additionally, regardless of the form of consideration wepay, acquisitions and investments could negatively impact our net income and earnings per share.
If goodwill or other intangible assets that we have recorded in connection with ouracquisitions of other businesses become impaired, we could have to take significant chargesagainst earnings.
As a result of our acquisitions, we have recorded, and may continue to record, a significant amount ofgoodwill and other intangible assets. Under current accounting guidelines, we must assess, at leastannually and potentially more frequently, whether the value of goodwill and other intangible assets has beenimpaired. For example, during the fourth quarters of 2011 and 2010, we determined that our goodwillrelated to our health information solutions business was impaired, resulting in non-cash impairment chargesin the amount of approximately $383.6 million and $1.0 billion, respectively. Any further reduction orimpairment of the value of goodwill or other intangible assets will result in additional charges againstearnings, which could materially reduce our reported results of operations in future periods.
31

We do not have complete control over the operations of SPD, our 50/50 joint venture withP&G.
Because SPD is a 50/50 joint venture, we do not have complete control over its operations,including business decisions, which may impact SPD’s profitability.
Additionally, certain subsidiaries of P&G have the right, at any time upon certain material breachesby us or our subsidiaries of our obligations under the joint venture documents, to acquire all of ourinterest in SPD at fair market value less any applicable damages.
Our business has substantial indebtedness.
We currently have, and will likely continue to have, a substantial amount of indebtedness. Ourindebtedness could, among other things, make it more difficult for us to satisfy our debt obligations,require us to use a large portion of our cash flow from operations to repay and service our debt orotherwise create liquidity problems, limit our flexibility to adjust to market conditions, place us at acompetitive disadvantage and expose us to interest rate fluctuations. As of December 31, 2012, wehad total debt outstanding of approximately $3.7 billion, which included approximately $2.3 billion inaggregate principal amount of indebtedness outstanding under our secured credit facility, consisting of“A” term loans (including “Delayed Draw” term loans) in the aggregate principal amount of $878.4million, “B” term loans in the aggregate principal amount of $913.4 million, “Incremental B-1” term loansin the aggregate principal amount of $247.5 million, “Incremental B-2” term loans in the aggregateprincipal amount of $196.7 million and revolving credit loans in the aggregate principal amount of $22.5million. Our secured credit facility has various final maturity dates occurring in 2016 and 2017, but ifcertain of our notes remain outstanding as of defined measurement dates in 2015, our secured creditfacility will mature on those dates. At December 31, 2012, we also had an aggregate of approximately$1.2 billion in aggregate principal amount of indebtedness outstanding under our senior and seniorsubordinated notes, all of which mature in 2016 or 2018, as well as $150.0 million in aggregateprincipal amount of indebtedness outstanding under our 3% convertible senior subordinated notes,which matures in 2016.
We expect to obtain the money to pay our expenses and pay the principal and interest on ourindebtedness from cash flow from our operations and potentially from other debt or equity offerings.Accordingly, our ability to meet our obligations depends on our future performance and capital raisingactivities, which will be affected by financial, business, economic and other factors, many of which arebeyond our control. If our cash flow and capital resources prove inadequate to allow us to pay theprincipal and interest on our debt and meet our other obligations, we could face substantial liquidityproblems and might be required to dispose of material assets or operations, restructure or refinanceour debt, which we may be unable to do on acceptable terms, and forego attractive businessopportunities. In addition, the terms of our existing or future debt agreements may restrict us frompursuing any of these alternatives.
The agreements governing our indebtedness subject us to various restrictions that maylimit our ability to pursue business opportunities.
The agreements governing our indebtedness subject us to various restrictions on our ability toengage in certain activities, including, among other things, our ability to:
• acquire other businesses or make investments;
• raise additional capital;
• incur additional debt or create liens on our assets;
• pay dividends or make distributions or repurchase or redeem our stock or senior orsubordinated debt;
32
• prepay indebtedness; and
• consolidate, merge or sell all or substantially all of our assets.
These restrictions may limit or restrict our cash flow and our ability to pursue businessopportunities or strategies that we would otherwise consider to be in our best interests.
Our secured credit facility contains certain financial and other restrictive covenants that wemay not satisfy, and that, if not satisfied, could result in the acceleration of the amounts dueunder our secured credit facility and the limitation of our ability to borrow additional funds inthe future.
The agreements governing our secured credit facility subject us to various financial and otherrestrictive covenants with which we must comply on an ongoing or periodic basis. These includecovenants pertaining to maximum consolidated secured leverage ratios, minimum consolidated interestcoverage ratios and limits on capital expenditures. If we violate any of these covenants, we may suffera material adverse effect. Most notably, our outstanding debt under our secured credit facility couldbecome immediately due and payable, our lenders could proceed against any collateral securing suchindebtedness, and our ability to borrow additional funds in the future could be limited or terminated.Alternatively, we could be forced to refinance or renegotiate the terms and conditions of our securedcredit facility, including the interest rates, financial and restrictive covenants and security requirementsof the secured credit facility, on terms that may be significantly less favorable to us.
A default under any of the agreements governing our indebtedness could result in a defaultand acceleration of indebtedness under other agreements.
The agreements governing our indebtedness contain cross-default provisions whereby a defaultunder one agreement could result in a default and acceleration of our repayment obligations underother agreements. If a cross-default were to occur, we may not be able to pay our debts or borrowsufficient funds to refinance them. Even if new financing were available, it may not be available onacceptable terms. If some or all of our indebtedness is in default for any reason, our business, financialcondition and results of operations could be materially and adversely affected.
We may not be able to satisfy our debt obligations upon a change of control orfundamental change, which could limit our opportunity to enter into a change of control orfundamental change transaction.
If we undergo a change of control, as provided in our secured credit facility, the senior notes or thesenior subordinated notes, or a fundamental change or termination of trading, as provided in the 3%convertible senior subordinated notes, we may be required to repay or repurchase some or all of suchindebtedness. We may not have sufficient financial resources to satisfy all of our repayment andrepurchase obligations. Our failure to purchase notes as required under the senior or seniorsubordinated notes or the 3% convertible senior subordinated notes would constitute a default underthe relevant indentures and under our secured credit facility and could have material adverseconsequences for us and our stakeholders.
We may not be able to collect all or a portion of amounts which we have loaned to a thirdparty which has filed for bankruptcy protection.
In December 2012, we made a $40.0 million secured loan to a third party in connection with apotential acquisition. In February 2013, the issuer of the note filed for protection under Chapter 11 ofthe U.S. Bankruptcy Code. The Bankruptcy Court subsequently granted us “continuing, valid, binding,enforceable and perfected first priority liens and security interests” in all of the post-petition collateral ofthe debtor to the “same extent, priority and enforceability” held on pre-petition collateral, in order to
33

secure any and all obligations of the debtor to us under the note, and other related agreements. Wehave assessed the note for impairment and determined that the note remains fully realizable and,accordingly, we have not recorded a reserve against the amount receivable as of December 31, 2012.The bankruptcy process is inherently complicated and subject to uncertainties and future changes incircumstances and there can be no certainty as to the outcome of these proceedings and that the notewill remain realizable.
Our operating results may fluctuate for various reasons and, as a result, period-to-periodcomparisons of our results of operations will not necessarily be meaningful.
Many factors relating to our business, such as those described elsewhere in this section, make ourfuture operating results uncertain and may cause them to fluctuate from period to period. Because ourrevenue and operating results are difficult to predict, we believe that period-to-period comparisons ofour results of operations are not a good indicator of our future performance. If revenue declines in aquarter, our results of operations will be harmed because many of our expenses are relatively fixed. Inparticular, research and development, sales and marketing and general and administrative expensesare not significantly affected by variations in revenue. If our quarterly operating results fail to meet orexceed the expectations of securities analysts or investors, our stock price could drop suddenly andsignificantly.
Our effective tax rate may fluctuate, and we may incur obligations in tax jurisdictions inexcess of amounts that have been accrued.
We are subject to income taxes in both the United States and various foreign jurisdictions, and wemay take certain income tax positions on our tax returns that tax authorities may disagree with. Weprovide reserves for potential payments of tax to various tax authorities related to uncertain taxpositions. However, the calculation of our tax liabilities involves the application of complex taxregulations to our global operations in many jurisdictions. Therefore, a dispute with a tax authority mayresult in a payment that is materially different from our current estimate of the tax liabilities associatedwith our returns.
Changes in tax laws or tax rulings could materially impact our effective tax rate. There are severalproposals to reform U.S. tax rules being considered by U.S. law makers, including proposals that mayreduce or eliminate the deferral of U.S. income tax on our unrepatriated earnings, potentially requiringthose earnings to be taxed at the U.S. federal income tax rate, reduce or eliminate our ability to claimforeign tax credits, and eliminate various tax deductions until foreign earnings are repatriated to theU.S. Our future reported financial results may be adversely affected by tax rule changes which restrictor eliminate our ability to claim foreign tax credits or deduct expenses attributable to foreign earnings,or otherwise affect the treatment of our unrepatriated earnings.
We may incur losses in excess of our insurance coverage.
Our insurance coverage includes product liability, property, healthcare professional and businessinterruption policies. Our insurance coverage contains policy limits, specifications and exclusions. Webelieve that our insurance coverage is consistent with general practices within our industry.Nonetheless, we may incur losses of a type for which we are not covered by insurance or whichexceed the limits of liability of our insurance policies. In that event, we could experience a significantloss which could have a material negative impact on our financial condition.
Our future success depends on our ability to recruit and retain key personnel.
Our future success depends on our continued ability to attract, hire and retain highly qualifiedpersonnel, including our executive officers and scientific, technical, sales and marketing employees,and their ability to manage growth successfully. Experienced personnel in our industry are in high
34

demand and competition for their talents is intense. If we are unable to attract and retain keypersonnel, our business may be harmed. In addition, the loss of any of our key personnel, particularlykey research and development personnel, could harm our business and prospects and could impedethe achievement of our research and development, operation or strategic objectives.
Future sales of our common stock, including shares issuable upon conversion of ourSeries B Convertible Perpetual Preferred Stock, or Series B Preferred Stock, or our 3%convertible senior subordinated notes, may adversely affect the market price of our commonstock.
Sales of a substantial number of shares of our common stock or other equity securities in thepublic market could depress the price of our common stock and impair our ability to raise capitalthrough the sale of additional equity securities. The price of our common stock could be affected bypossible sales of the substantial number of shares of our common stock potentially issuable uponconversion of our Series B Preferred Stock or our 3% convertible senior subordinated notes and byother hedging or arbitrage trading activity that may develop involving our common stock. If theconditions applicable to the conversion of our Series B Preferred Stock were satisfied, then subject toadjustment, each of the approximately 1.8 million shares of Series B Preferred Stock outstanding as ofDecember 31, 2012 could convert into 5.7703 shares of our common stock, or approximately10.2 million shares of our common stock. Upon certain extraordinary transactions, depending on themarket price of our common stock at that time, the conversion rate could increase such thatsignificantly more shares of common stock could be issued. Our $150.0 million in aggregate principalamount of 3% convertible senior subordinated notes is convertible into shares of our common stock ata conversion price of approximately $43.98 per share, or approximately 3.4 million shares.
The holders of our Series B Preferred Stock are entitled to receive liquidation payments inpreference to the holders of our common stock.
As of December 31, 2012, the outstanding shares of our Series B Preferred Stock had anaggregate stated liquidation preference of approximately $709.8 million. Dividends accrue on theshares of Series B Preferred Stock at a rate of 3% per annum, and we have the option to pay thesedividends in cash or in shares of common stock or additional shares of Series B Preferred Stock. If wepay these dividends in shares of common stock or additional shares of Series B Preferred Stock, thenumber of shares of common stock or Series B Preferred Stock issued will be based upon marketprices at the time of such payment. Upon a liquidation of our company, the holders of shares of SeriesB Preferred Stock will be entitled to receive a liquidation payment prior to the payment of any amountwith respect to the shares of our common stock. The amount of this preferential liquidation payment isthe aggregate stated liquidation preference, plus any accrued and unpaid dividends. Because of thesubstantial liquidation preference to which the holders of the Series B Preferred Stock are entitled, theamount available to be distributed to the holders of our common stock upon a liquidation of ourcompany could be substantially limited or reduced to zero.
The terms of the Series B Preferred Stock may limit our ability to raise additional capitalthrough subsequent issuances of preferred stock.
For so long as any shares of Series B Preferred Stock remain outstanding, we are not permitted,without the affirmative vote or written consent of the holders of at least two-thirds of the Series BPreferred Stock then outstanding, to authorize or designate any class or series of capital stock havingrights on liquidation or as to distributions (including dividends) senior to the Series B Preferred Stock.This restriction could limit our ability to plan for or react to market conditions or meet extraordinarycapital needs, which could have a material adverse impact on our business.
35

Anti-takeover provisions in our organizational documents and Delaware law may limit theability of our stockholders to control our policies and effect a change of control of our companyand may prevent attempts by our stockholders to replace or remove our current management,which may not be in your best interests.
Provisions of our certificate of incorporation and bylaws may discourage a third party from makinga proposal to acquire us, even if some of our stockholders might consider the proposal to be in theirbest interests, and may prevent attempts by our stockholders to replace or remove our currentmanagement. These provisions include the following:
• although we have amended our certificate of incorporation to declassify our board of directors ,under Delaware law certain continuing directors have terms ending in 2014 and 2015. Bypreventing stockholders from voting on the election of all of our directors at our annual meetingsof stockholders in 2013 and 2014, the longer terms of these continuing directors may have theeffect of keeping the current members of our board of directors in control for a longer period oftime than stockholders may desire; and
• subject to the rights of the holders of our Series B Preferred Stock, our certificate ofincorporation authorizes our board of directors to issue shares of preferred stock withoutstockholder approval and to establish the preferences and rights of any preferred stock issued,which would allow the board to issue one or more classes or series of preferred stock that coulddiscourage or delay a tender offer or change in control.
In addition, our board of directors may in the future adopt other protective measures, such as astockholder rights plan, which could delay, deter or prevent a change in control.
ITEM 1B. UNRESOLVED STAFF COMMENTS
None.
ITEM 2. PROPERTIES
Our corporate headquarters, together with the administrative office for our United States consumeroperations, is located at 51 Sawyer Road, Suite 200, Waltham, Massachusetts. From our office inGalway, Ireland, we oversee and conduct much of our professional diagnostic products business inEurope. We also operate a shared service center in Orlando, Florida, which houses certain criticalback-office and sales operations supporting our U.S. professional diagnostics operations. Our healthinformation solutions business is headquartered in Atlanta, Georgia. These key administrative facilitiesare leased from third parties.
We own approximately 18.8 acres of land in San Diego, California which houses one of our eightprimary manufacturing operations, as well as significant administrative and research and developmentoperations for our professional diagnostics business. Our buildings on this property total 336,000 squarefeet and include 167,000 square feet of manufacturing space for professional diagnostic products.
Our other primary manufacturing operations are in Scarborough, Maine; Hangzhou and Shanghai,China; Matsudo, Japan; Oslo, Norway; Dundee, Scotland and Yongin, South Korea. We manufacturesome of our consumer and professional diagnostic products in a manufacturing facility ofapproximately 448,000 square feet in Hangzhou, China, which we own. The majority of our consumerdiagnostic products are manufactured in a facility of approximately 133,000 square feet in Shanghai,China, which we lease. We manufacture our Determine products in a leased space of approximately35,000 square feet in Matsudo, Japan. Standard Diagnostics manufactures most of its professionaldiagnostic products in a 63,000 square foot facility in Yongin, South Korea, which we own. Axis-Shield,which we acquired in late 2011, manufactures the majority of our point-of-care products for patientswith diabetes in a leased space of approximately 47,500 square feet in Oslo, Norway and a leasedspace of approximately 51,000 square feet in Dundee, Scotland. We manufacture certain professionaldiagnostic products in a 64,000 square foot facility that we lease in Scarborough, Maine.
36

We increasingly rely on our network of toxicology laboratories to provide reliable drugs-of-abusetest results to customers. We own three SAMHSA certified laboratories in the United States, located inGretna, Louisiana; Santa Rosa, California and Richmond, Virginia. We also operate toxicologylaboratories in Austin, Texas; Clearwater, Florida; London, England and Abingdon, England, and weoperate an accredited forensic laboratory in Malvern, England.
Additionally, we have facilities, which are generally leased, in various locations worldwide,including smaller manufacturing operations and laboratories, as well as research and developmentoperations, administrative or sales offices, call centers and warehouses. We believe that adequatespace for our manufacturing, testing and other operations will be available as needed.
ITEM 3. LEGAL PROCEEDINGS
Matters Relating to our San Diego Facility
On October 9, 2012, we received a warning letter from the FDA referencing inspectionalobservations set forth in an FDA Form 483 received in June, 2012. The observations were the result ofan inspection of our San Diego facility conducted earlier during 2012 relating to our Alere Triageproducts, which resulted in two recalls of certain Alere Triage products and revised releasespecifications for our Alere Triage meter-based products. On October 30, 2012, we responded to thewarning letter and submitted evidence of our completion of most of the actions previously detailed inour prior response to the FDA Form 483. We have worked cooperatively with the FDA in an effort tofully address each of the inspectional observations and intend to continue to do so.
In May 2012, we also received a subpoena from the Office of Inspector General of the Departmentof Health and Human Services, or the OIG, seeking documents relating primarily to the quality controltesting and performance characteristics of Alere Triage products. We are cooperating with the OIG andcontinue to supply documents to the OIG under the subpoena.
We are unable to predict when these matters will be resolved or what further action, if any, thegovernment will take in connection with them. Except for increases in manufacturing costs anddecreased profitability for our Alere Triage products, we are unable to predict what impact, if any, thesematters or ensuing proceedings, if any, will have on our financial condition, results of operations orcash flows.
Class Action Litigation against Alere Home Monitoring
On January 24, 2013, a class action complaint was filed in the U.S. District Court for the NorthernDistrict of California against Alere Home Monitoring, or AHM, asserting claims for damages and otherrelief under California state law, including under California’s Confidentiality of Medical Information Act,relating to an inadvertent disclosure of personally identifiable information of approximately 116,000patients resulting from the theft of a laptop computer from an employee of AHM. The Office of CivilRights of the U.S. Department of Health and Human Services was notified of the inadvertent disclosurein accordance with the Breach Notification Rule under the HITECH Act, as were certain state agencies.We believe that AHM has strong defenses to the claims made in the complaint and AHM intends todefend this matter vigorously.
Claims in the Ordinary Course and Other Matters
Because of the nature of our business, we may be subject at any particular time to lawsuits orother claims arising in the ordinary course of our business, and we expect that this will continue to bethe case in the future. Such lawsuits often seek damages, sometimes in substantial amounts. Anadverse ruling in such a lawsuit could have a material adverse impact on our sales, operations orfinancial performance.
ITEM 4. MINE SAFETY DISCLOSURES
Not applicable.
37

PART II
ITEM 5. MARKET FOR REGISTRANT’S COMMON EQUITY, RELATED STOCKHOLDERMATTERS AND ISSUER PURCHASES OF EQUITY SECURITIES
Unregistered Sales of Equity Securities and Use of Proceeds
During the fourth quarter of 2012, we did not sell any of our equity securities in transactions thatwere not registered under the Securities Act of 1933, as amended, or the Securities Act.
Market Information
Our common stock trades on the New York Stock Exchange (NYSE) under the symbol “ALR.” Thefollowing table sets forth the high and low sales prices of our common stock for each quarter duringfiscal 2012 and 2011:
High Low
Fiscal 2012Fourth Quarter . . . . . . . . . . . . . . . . . . . . . . . . . . . . . . . . . . . . . . . $22.10 $17.20Third Quarter . . . . . . . . . . . . . . . . . . . . . . . . . . . . . . . . . . . . . . . . $20.54 $17.13Second Quarter . . . . . . . . . . . . . . . . . . . . . . . . . . . . . . . . . . . . . . $26.50 $17.62First Quarter . . . . . . . . . . . . . . . . . . . . . . . . . . . . . . . . . . . . . . . . . $27.22 $21.51
Fiscal 2011Fourth Quarter . . . . . . . . . . . . . . . . . . . . . . . . . . . . . . . . . . . . . . . $26.62 $17.82Third Quarter . . . . . . . . . . . . . . . . . . . . . . . . . . . . . . . . . . . . . . . . $38.53 $19.62Second Quarter . . . . . . . . . . . . . . . . . . . . . . . . . . . . . . . . . . . . . . $41.18 $33.83First Quarter . . . . . . . . . . . . . . . . . . . . . . . . . . . . . . . . . . . . . . . . . $40.55 $34.75
On February 25, 2013, there were 1,598 holders of record of our common stock.
Dividend Policy
We have never declared or paid any cash dividends on our common stock. We currently intend toretain earnings to support our growth strategy and do not anticipate paying cash dividends on ourcommon stock in the foreseeable future. Payment of future dividends, if any, on our common stock willbe at the discretion of our board of directors after taking into account various factors, including ourfinancial condition, operating results, current and anticipated cash needs and plans for expansion. Inaddition, restrictive covenants under our secured credit facility and the indentures governing the termsof our senior notes and our senior subordinated notes currently prohibit or limit the payment of cash orstock dividends.
Stock Performance Graph
The following line graph compares the cumulative total stockholder return on our common stockfrom December 31, 2007 through December 31, 2012 with the cumulative total return of a broad equitymarket index and a published industry index. This graph assumes an investment of $100.00 onDecember 31, 2007 in our common stock, and compares its performance with the NYSE CompositeIndex and the Dow Jones U.S. Healthcare Index (the “Current Indices”). We paid no dividends on ourcommon stock during the period covered by the graph. The Current Indices reflect a cumulative totalreturn based upon the reinvestment of dividends of the stocks included in those indices. Measurementpoints are December 31, 2007 and the last trading day of each subsequent year end throughDecember 31, 2012.
38

The comparisons shown in the graph below are based upon historical data. We caution that thestock price performance shown in the graph below is not necessarily indicative of, nor is it intended toforecast, the potential future performance of our common stock.
$0
$50
$75
$25
$100
$125
$150ALR
NYSE Composite Index
Dow Jones U.S. Healthcare Index
12/31/2007 12/31/2008 12/31/2009 12/31/2010 12/30/2011 12/31/2012
$175
Current Indices
Date ALRNYSE Composite
IndexDow Jones U.S.Healthcare Index
12/31/07 . . . . . . . . . . . . . . . . . . . . . . . $100.00 $100.00 $100.0012/31/08 . . . . . . . . . . . . . . . . . . . . . . . $ 33.66 $ 59.11 $ 75.9712/31/09 . . . . . . . . . . . . . . . . . . . . . . . $ 73.89 $ 73.77 $ 90.3112/31/10 . . . . . . . . . . . . . . . . . . . . . . . $ 65.15 $ 81.76 $ 92.5012/30/11 . . . . . . . . . . . . . . . . . . . . . . . $ 41.10 $ 76.76 $101.2712/31/12 . . . . . . . . . . . . . . . . . . . . . . . $ 32.93 $ 86.69 $118.17
The performance graph above shall not be deemed “filed” for purposes of Section 18 of theSecurities Exchange Act of 1934, as amended, or the Exchange Act, or otherwise subject to theliabilities of that section. This graph will not be deemed incorporated by reference into any filing underthe Securities Act, whether made before or after the date hereof, regardless of any generalincorporation language in such filing.
ITEM 6. SELECTED CONSOLIDATED FINANCIAL DATA
The following tables set forth selected consolidated financial data of our company as of and foreach of the years in the five-year period ended December 31, 2012 and should be read in conjunctionwith “Management’s Discussion and Analysis of Financial Condition and Results of Operations” andour Consolidated Financial Statements and notes thereto included elsewhere in this Annual Report onForm 10-K.
On January 15, 2010, we completed the sale of our vitamins and nutritional supplementsbusiness. The sale included our entire private label and branded nutritionals businesses andrepresents the complete divestiture of our entire vitamins and nutritional supplements businesssegment. The results of the vitamins and nutritional supplements business are included in income(loss) from discontinued operations, net of tax, for all periods presented in the statement of operationsdata below. The assets and liabilities associated with the vitamins and nutritional supplementsbusiness have been reclassified to current classifications as assets held for sale and liabilities relatedto assets held for sale and, as such, have impacted working capital amounts, which are reflected in thebalance sheet data section below, for all balance sheet dates presented.
39

For a discussion of certain factors that materially affect the comparability of the selectedconsolidated financial data or cause the data reflected herein not to be indicative of our future results ofoperations or financial condition, see Item 1A “Risk Factors,” Item 7 “Management’s Discussion andAnalysis of Financial Condition and Results of Operation” and Notes 2(v) and 4 of our ConsolidatedFinancial Statements included elsewhere in this report.
For the Year Ended December 31,
2012 2011 2010 2009 2008
(in thousands, except per share data)Statement of Operations Data:Net product sales . . . . . . . . . . . . . . . . . . . $1,913,731 $1,683,132 $ 1,472,403 $1,365,079 $1,151,265Services revenue . . . . . . . . . . . . . . . . . . . 876,518 679,922 662,185 528,487 405,462
Net product sales and servicesrevenue . . . . . . . . . . . . . . . . . . . . . . . 2,790,249 2,363,054 2,134,588 1,893,566 1,556,727
License and royalty revenue . . . . . . . . . . 28,576 23,473 20,759 29,075 25,826Net revenue . . . . . . . . . . . . . . . . . . . . . 2,818,825 2,386,527 2,155,347 1,922,641 1,582,553
Cost of net product sales . . . . . . . . . . . . 932,150 795,424 688,325 619,503 543,317Cost of services revenue . . . . . . . . . . . . 450,999 338,232 325,286 240,026 177,098Cost of net product sales and services
revenue . . . . . . . . . . . . . . . . . . . . . . . . . 1,383,149 1,133,656 1,013,611 859,529 720,415Cost of license and royalty revenue . . . . 7,354 7,036 7,149 8,890 8,620Cost of net revenue . . . . . . . . . . . . . . . . . 1,390,503 1,140,692 1,020,760 868,419 729,035
Gross profit . . . . . . . . . . . . . . . . . . . . . . 1,428,322 1,245,835 1,134,587 1,054,222 853,518Operating expenses:
Research and development . . . . . . . . 183,001 150,165 133,278 112,848 111,828Sales and marketing . . . . . . . . . . . . . . 643,423 565,583 499,124 441,646 381,939General and administrative . . . . . . . . . 492,766 399,330 446,917 357,033 295,059Goodwill impairment charge . . . . . . . . — 383,612 1,006,357 — —Gain on dispositions, net . . . . . . . . . . . — — — (3,355) —
Operating income (loss) . . . . . . . . . 109,132 (252,855) (951,089) 146,050 64,692Interest expense, including amortization
of original issue discounts and write-off of deferred financing costs andother income (expense), net . . . . . . . . (230,603) 86,808 (116,697) (105,802) (102,939)Income (loss) from continuing
operations before provision(benefit) for income taxes . . . . . . . . (121,471) (166,047) (1,067,786) 40,248 (38,247)
Provision (benefit) for income taxes . . . . (30,319) (24,214) (29,931) 15,627 (16,644)Income (loss) from continuing
operations before equity earnings ofunconsolidated entities, net of tax . . . (91,152) (141,833) (1,037,855) 24,621 (21,603)
Equity earnings of unconsolidatedentities, net of tax . . . . . . . . . . . . . . . . . 13,245 8,524 10,566 7,626 1,050
Income (loss) from continuingoperations . . . . . . . . . . . . . . . . . . . . . . . (77,907) (133,309) (1,027,289) 32,247 (20,553)
Income (loss) from discontinuedoperations, net of tax . . . . . . . . . . . . . . — — 11,397 1,934 (1,048)
Net income (loss) . . . . . . . . . . . . . . . . . . . (77,907) (133,309) (1,015,892) 34,181 (21,601)Less: Net income attributable to non-
controlling interests . . . . . . . . . . . . . . . 275 233 1,418 465 167Net income (loss) attributable to Alere
Inc. and Subsidiaries . . . . . . . . . . . . . . (78,182) (133,542) (1,017,310) 33,716 (21,768)Preferred stock dividends . . . . . . . . . . . . (21,293) (22,049) (24,235) (22,972) (13,989)Preferred stock repurchase . . . . . . . . . . — 23,936 — — —Net income (loss) available to common
stockholders(1) . . . . . . . . . . . . . . . . . . $ (99,475) $ (131,655) $(1,041,545) $ 10,744 $ (35,757)
40
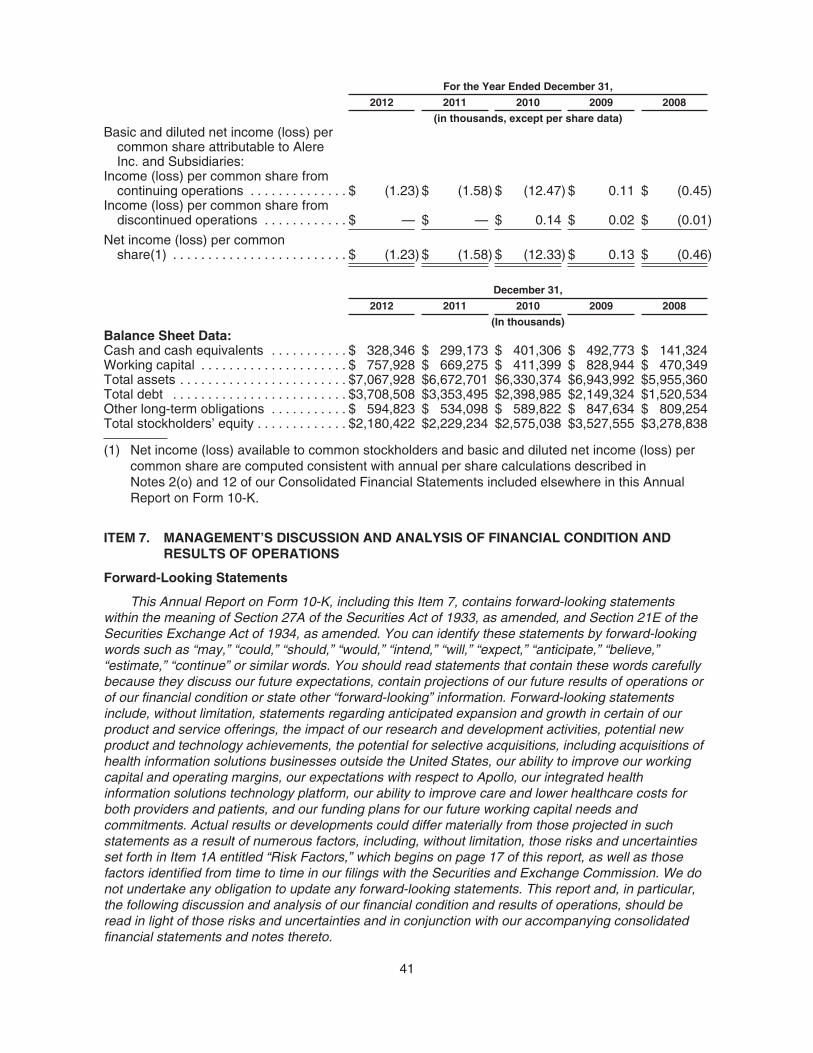
For the Year Ended December 31,
2012 2011 2010 2009 2008
(in thousands, except per share data)Basic and diluted net income (loss) per
common share attributable to AlereInc. and Subsidiaries:
Income (loss) per common share fromcontinuing operations . . . . . . . . . . . . . . $ (1.23) $ (1.58) $ (12.47) $ 0.11 $ (0.45)
Income (loss) per common share fromdiscontinued operations . . . . . . . . . . . . $ — $ — $ 0.14 $ 0.02 $ (0.01)
Net income (loss) per commonshare(1) . . . . . . . . . . . . . . . . . . . . . . . . . $ (1.23) $ (1.58) $ (12.33) $ 0.13 $ (0.46)
December 31,
2012 2011 2010 2009 2008
(In thousands)Balance Sheet Data:Cash and cash equivalents . . . . . . . . . . . $ 328,346 $ 299,173 $ 401,306 $ 492,773 $ 141,324Working capital . . . . . . . . . . . . . . . . . . . . . $ 757,928 $ 669,275 $ 411,399 $ 828,944 $ 470,349Total assets . . . . . . . . . . . . . . . . . . . . . . . . $7,067,928 $6,672,701 $6,330,374 $6,943,992 $5,955,360Total debt . . . . . . . . . . . . . . . . . . . . . . . . . $3,708,508 $3,353,495 $2,398,985 $2,149,324 $1,520,534Other long-term obligations . . . . . . . . . . . $ 594,823 $ 534,098 $ 589,822 $ 847,634 $ 809,254Total stockholders’ equity . . . . . . . . . . . . . $2,180,422 $2,229,234 $2,575,038 $3,527,555 $3,278,838
(1) Net income (loss) available to common stockholders and basic and diluted net income (loss) percommon share are computed consistent with annual per share calculations described inNotes 2(o) and 12 of our Consolidated Financial Statements included elsewhere in this AnnualReport on Form 10-K.
ITEM 7. MANAGEMENT’S DISCUSSION AND ANALYSIS OF FINANCIAL CONDITION ANDRESULTS OF OPERATIONS
Forward-Looking Statements
This Annual Report on Form 10-K, including this Item 7, contains forward-looking statementswithin the meaning of Section 27A of the Securities Act of 1933, as amended, and Section 21E of theSecurities Exchange Act of 1934, as amended. You can identify these statements by forward-lookingwords such as “may,” “could,” “should,” “would,” “intend,” “will,” “expect,” “anticipate,” “believe,”“estimate,” “continue” or similar words. You should read statements that contain these words carefullybecause they discuss our future expectations, contain projections of our future results of operations orof our financial condition or state other “forward-looking” information. Forward-looking statementsinclude, without limitation, statements regarding anticipated expansion and growth in certain of ourproduct and service offerings, the impact of our research and development activities, potential newproduct and technology achievements, the potential for selective acquisitions, including acquisitions ofhealth information solutions businesses outside the United States, our ability to improve our workingcapital and operating margins, our expectations with respect to Apollo, our integrated healthinformation solutions technology platform, our ability to improve care and lower healthcare costs forboth providers and patients, and our funding plans for our future working capital needs andcommitments. Actual results or developments could differ materially from those projected in suchstatements as a result of numerous factors, including, without limitation, those risks and uncertaintiesset forth in Item 1A entitled “Risk Factors,” which begins on page 17 of this report, as well as thosefactors identified from time to time in our filings with the Securities and Exchange Commission. We donot undertake any obligation to update any forward-looking statements. This report and, in particular,the following discussion and analysis of our financial condition and results of operations, should beread in light of those risks and uncertainties and in conjunction with our accompanying consolidatedfinancial statements and notes thereto.
41

Overview
We enable individuals to take greater control of their health at home, under the supervision of theirhealthcare providers, by combining near-patient diagnostics, health monitoring capabilities andinformation technology solutions. A leading global provider of point-of-care diagnostics and services,we have developed a strong commercial presence in cardiology, infectious disease, toxicology, anddiabetes. Our products and services help healthcare practitioners make earlier, more effectivetreatment decisions and improve outcomes for individuals living with chronic disease.
During 2012, we focused on completing the foundation for this business model, a process whichwe began during 2011. With our acquisitions of Avee Laboratories in October 2011, eScreen in April2012 and Branan Medical in December 2012, our toxicology group is now a full-service provider to abroad range of domestic and foreign employers from industries that require rigorous drug testing. Wealso built a strong presence in diabetes from the ground up. Following our November 2011 acquisitionsof Axis-Shield and Arriva Medical, which effectively established our diabetes business, we acquiredseveral mail-order, diabetes home-testing product supply businesses. Our diabetes revenues havegrown to over $144.0 million in 2012, and including the effect of acquisitions completed in early 2013,we now service more than 250,000 active diabetes customers. We believe that the strong foundationthat we have built in diabetes, specifically in our mail-order diabetes testing supply business, providesus with a competitive advantage in dealing with the impact that CMS’ competitive bidding program,which will significantly reduce current reimbursement rates starting in July 2013, will have oncompetition and pricing in the market for diabetes testing supplies.
Core to our strategy are health information technologies that enable diagnostic data to be feddirectly into an information exchange that integrates the diagnostic data with other patient-relatedinformation in a single health record. In the second half of 2011 and in 2012, we focused on acquiringhealth information technologies that would supplement our internally developed informationtechnologies, including Apollo, and improve our ability to execute our business strategy. Specifically:
• During the second half of 2011, we acquired RALS, the point-of-care industry’s leading datamanagement solution, and AegisPOC, the first web-based data management solution designedfor critical care settings, which we have since enhanced and renamed RALS Freedom. OurRALS systems provide bidirectional interfaces that connect a hospital’s glucose meters andother point-of-care devices measuring blood gases, prothrombin time, and cardiac parametersto its laboratory and health information systems.
• In December 2011, we acquired Wellogic, now Alere Accountable Care Solutions, or Alere ACS.Through Alere ACS, we deliver health information solutions that help provider organizationsmeet CMS “Meaningful Use” requirements and improve coordination across multiple venues ofcare. These solutions include the Alere Health Information Exchange, which harmonizesmultiple streams of data from disparate sources in a single patient-centered record, and ConsultEHR, which gives healthcare practitioners greater visibility into a patient’s health status.
• In July 2012, we acquired MedApps, now Alere Connect. Alere Connect develops and sellsremote health monitoring solutions designed to collect health readings from compatible medicalmonitors and transmit them to a user’s electronic health record, as well as web-basedapplications to help practitioners manage this data. Alere Connect’s comprehensive healthinformation platform and suite of cloud-based software tools enhance care for patients in bothwellness and chronic disease management programs.
• In July 2012, we also acquired DiagnosisOne, now Alere Analytics. Through Alere Analytics, weoffer a broad array of analytical and clinical decision support tools, which are delivered on oursmartPath platform.
As a result, we now offer a variety of software-based analytics, clinical decision support tools, andhealth improvement programs that enable healthcare providers to initiate earlier interventions,personalize treatment plans, lower costs by reducing hospital readmissions, and measureimprovements in outcomes at both a patient and population level.
42

During 2012, we also continued to build momentum behind our next generation of novel diagnosticplatforms that we expect to drive our growth in future years. Our CD4 platform continues to gaintraction and has expanded our global footprint as a leading provider of chronic HIV managementdiagnostics. We are currently developing expansions to this rapid molecular platform to addressadditional areas such as hepatitis C and tuberculosis. Our second near-patient molecular platform,which is focused on a broad spectrum of infectious disease targets, continues to progress through U.S.clinical trials. We anticipate that the first use of this cartridge-based system will be rapid flu testing, butapplications for additional targets such as group A Streptococcus, respiratory syncytial virus, or RSV,and C. difficile are planned. With our novel molecular diagnostic platforms launched, or in the latestages of development, we have now begun to refocus our research and development efforts awayfrom long-term projects towards product enhancements and menu expansion for our existing platforms.
2012 Financial Highlights
• Net revenue increased by $432.3 million, or 18%, to $2.8 billion in 2012, from $2.4 billion in 2011.
• Gross profit increased by $182.5 million, or 15%, to $1.4 billion in 2012, from $1.2 billion in 2011.
• For the year ended December 31, 2012, we generated a net loss available to commonstockholders of $99.5 million, or $1.23 per basic and diluted common share. For the year endedDecember 31, 2011, we generated a net loss available to common stockholders of$131.7 million, or $1.58 per basic and diluted common share. The 2011 net loss included a$383.6 million non-cash charge associated with the impairment of goodwill in our healthinformation solutions business segment and reporting unit.
Results of Operations
The following discussions of our results of continuing operations exclude the results related to thevitamins and nutritional supplements business segment, which was previously presented as a separateoperating segment prior to its divestiture in January 2010. The vitamins and nutritional supplementsbusiness segment has been segregated from continuing operations and is reflected as discontinuedoperations in our consolidated financial statements. See “Income from Discontinued Operations, Net ofTax” below. Where discussed, results excluding the impact of foreign currency translation arecalculated on the basis of local currency results, using foreign currency exchange rates applicable tothe earlier comparative period. We believe presenting information using the same foreign currencyexchange rates helps investors isolate the impact of changes in those rates from other trends. Ourresults of operations were as follows:
Year Ended December 31, 2012 Compared to Year Ended December 31, 2011
Net Product Sales and Services Revenue. Net product sales and services revenue increasedby $427.2 million, or 18%, to $2.8 billion in 2012, from $2.4 billion in 2011. Net product sales andservices revenue increased primarily as a result of our acquisitions which contributed an aggregate of$447.6 million of the increase. Excluding the impact of foreign currency translation, net product salesand services revenue in 2012 grew by approximately $460.0 million, or 19%, over 2011.
Net Product Sales and Services Revenue by Business Segment. Net product sales andservices revenue by business segment for 2012 and 2011 is as follows (in thousands):
2012 2011% Increase(Decrease)
Professional diagnostics . . . . . . . . . . . . . . . . $2,165,216 $1,736,172 25%Health information solutions . . . . . . . . . . . . . 535,422 534,514 —%Consumer diagnostics . . . . . . . . . . . . . . . . . . 89,611 92,368 (3)%
Net product sales and services revenue . . . . $2,790,249 $2,363,054 18%
43

Professional Diagnostics
The following table summarizes our net product sales and services revenue from our professionaldiagnostics business segment by groups of similar products and services for 2012 and 2011(in thousands):
2012 2011% Increase(Decrease)
Cardiology . . . . . . . . . . . . . . . . . . . . . . . . . . . . $ 503,534 $ 518,746 (3)%Infectious disease . . . . . . . . . . . . . . . . . . . . . . 615,950 564,983 9%Toxicology . . . . . . . . . . . . . . . . . . . . . . . . . . . . 587,261 387,209 52%Diabetes . . . . . . . . . . . . . . . . . . . . . . . . . . . . . 144,441 14,960 866%Other . . . . . . . . . . . . . . . . . . . . . . . . . . . . . . . . 314,030 250,274 25%
Professional diagnostics net product salesand services revenue . . . . . . . . . . . . . . . . . $2,165,216 $1,736,172 25%
Net product sales and services revenue from our professional diagnostics business segmentincreased by $429.0 million, or 25%, to $2.2 billion in 2012, from $1.7 billion in 2011. Excluding theimpact of foreign currency translation, net product sales and services revenue from our professionaldiagnostics business segment increased by $462.2 million, or 27%, comparing 2012 to 2011. Netproduct sales and services revenue increased primarily as a result of acquisitions, which contributedan aggregate of $441.4 million of the non-currency-adjusted increase. Net product sales from our NorthAmerican flu-related sales decreased approximately $2.5 million, from $46.1 in 2011 to $43.6 million2012. Net product sales and services revenue from our professional diagnostics business segmentwere negatively impacted by the FDA recall matters related to our Alere Triage meter-based products.Net product sales of meter-based Triage products in the U.S. totaled $150.3 million in 2012, ascompared to $199.2 million in 2011. Excluding the impact of acquisitions, the decrease in flu-relatedsales during the comparable periods and the impact of the reduction in net product sales from meter-based Triage products in the U.S., the currency-adjusted organic growth for our professionaldiagnostics net product sales and services revenue was approximately $73.7 million, or 5%, from 2011to 2012.
Within our professional diagnostics business segment, net product sales and services revenue forour cardiology business decreased by approximately $15.2 million, or 3%, to $503.5 million in 2012,from $518.7 million in 2011, primarily as a result of the FDA recall matters related to our Alere Triagemeter-based products. Net product sales of meter-based Triage products in the U.S. totaled $150.3million in 2012, as compared to $199.2 million in 2011. The decrease in sales of our meter-basedTriage products was partially offset by $19.3 million in sales contributed by the acquisition of Axis-Shield. Net product sales and services revenue for our infectious disease business increased byapproximately $51.0 million, or 9%, to $616.0 million in 2012, from $565.0 million in 2011, with ouracquisition of Axis-Shield contributing $27.4 million of such increase. Net product sales and servicesrevenue for our toxicology business increased by approximately $200.1 million, or 52%, to$587.3 million in 2012, from $387.2 million in 2011, with our recent acquisitions of Avee, eScreen andAmedica Biotech, Inc., or Amedica, contributing approximately $193.9 million of the increase. Ourdiabetes net product sales and services revenue increased by approximately $129.5 million, or 866%,to $144.4 million in 2012, from $15.0 million in 2011, with our recent acquisitions contributing nearly allof the increase.
44
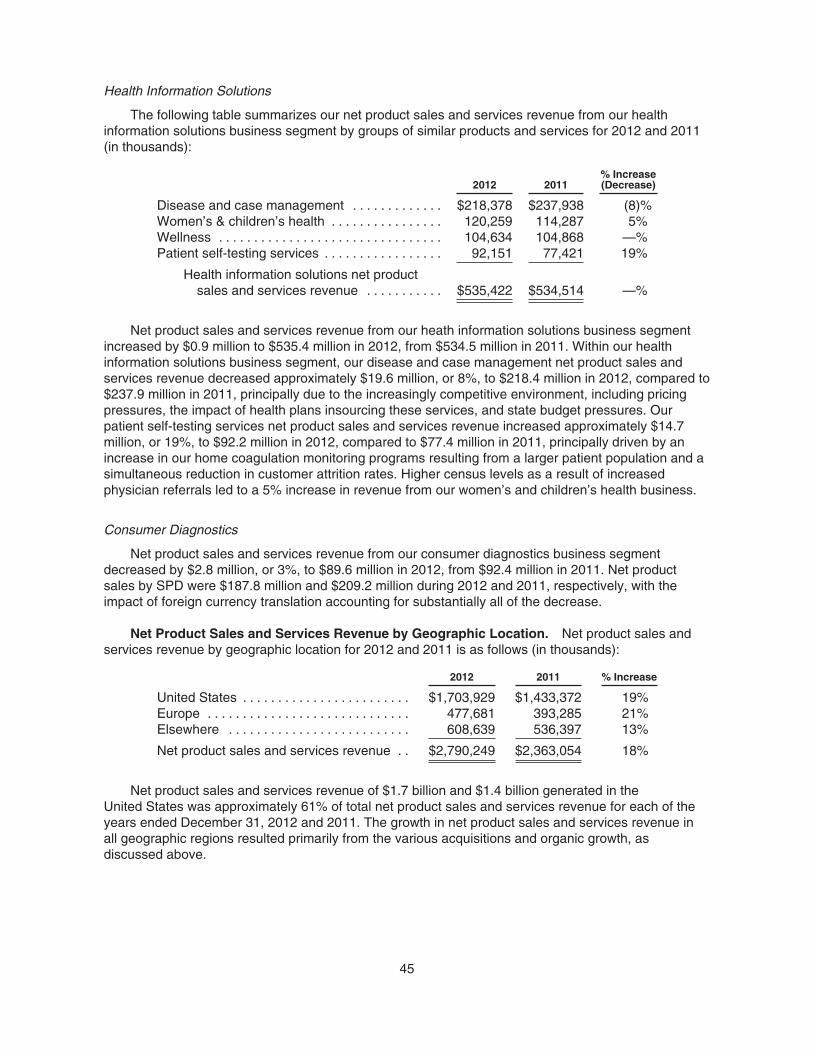
Health Information Solutions
The following table summarizes our net product sales and services revenue from our healthinformation solutions business segment by groups of similar products and services for 2012 and 2011(in thousands):
2012 2011% Increase(Decrease)
Disease and case management . . . . . . . . . . . . . $218,378 $237,938 (8)%Women’s & children’s health . . . . . . . . . . . . . . . . 120,259 114,287 5%Wellness . . . . . . . . . . . . . . . . . . . . . . . . . . . . . . . . 104,634 104,868 —%Patient self-testing services . . . . . . . . . . . . . . . . . 92,151 77,421 19%
Health information solutions net productsales and services revenue . . . . . . . . . . . $535,422 $534,514 —%
Net product sales and services revenue from our heath information solutions business segmentincreased by $0.9 million to $535.4 million in 2012, from $534.5 million in 2011. Within our healthinformation solutions business segment, our disease and case management net product sales andservices revenue decreased approximately $19.6 million, or 8%, to $218.4 million in 2012, compared to$237.9 million in 2011, principally due to the increasingly competitive environment, including pricingpressures, the impact of health plans insourcing these services, and state budget pressures. Ourpatient self-testing services net product sales and services revenue increased approximately $14.7million, or 19%, to $92.2 million in 2012, compared to $77.4 million in 2011, principally driven by anincrease in our home coagulation monitoring programs resulting from a larger patient population and asimultaneous reduction in customer attrition rates. Higher census levels as a result of increasedphysician referrals led to a 5% increase in revenue from our women’s and children’s health business.
Consumer Diagnostics
Net product sales and services revenue from our consumer diagnostics business segmentdecreased by $2.8 million, or 3%, to $89.6 million in 2012, from $92.4 million in 2011. Net productsales by SPD were $187.8 million and $209.2 million during 2012 and 2011, respectively, with theimpact of foreign currency translation accounting for substantially all of the decrease.
Net Product Sales and Services Revenue by Geographic Location. Net product sales andservices revenue by geographic location for 2012 and 2011 is as follows (in thousands):
2012 2011 % Increase
United States . . . . . . . . . . . . . . . . . . . . . . . . $1,703,929 $1,433,372 19%Europe . . . . . . . . . . . . . . . . . . . . . . . . . . . . . 477,681 393,285 21%Elsewhere . . . . . . . . . . . . . . . . . . . . . . . . . . 608,639 536,397 13%
Net product sales and services revenue . . $2,790,249 $2,363,054 18%
Net product sales and services revenue of $1.7 billion and $1.4 billion generated in theUnited States was approximately 61% of total net product sales and services revenue for each of theyears ended December 31, 2012 and 2011. The growth in net product sales and services revenue inall geographic regions resulted primarily from the various acquisitions and organic growth, asdiscussed above.
45

License and Royalty Revenue. License and royalty revenue represents license and royaltyfees from intellectual property license agreements with third parties. License and royalty revenueincreased by $5.1 million, or 22%, to $28.6 million in 2012, from $23.5 million in 2011. During 2012, wereceived an up-front royalty payment of $11.0 million related to a license of certain of our molecularintellectual property. We also received additional license and royalty revenue during 2012 as a result ofour acquisition of Axis-Shield, which contributed approximately $3.7 million of the increase. Theseincreases during 2012 were offset by an amendment to our license agreement with Quidel during 2011whereby the license agreement was converted to a fully paid-up license. As a result of the amendment,we did not record royalty revenue from Quidel during 2012, as opposed to $7.5 million of royaltyrevenue recorded from Quidel during 2011, and do not anticipate recording royalty revenue fromQuidel in the future.
Gross Profit and Margin Percentage. Gross profit increased by $182.5 million, or 15%, to$1.4 billion in 2012, from $1.2 billion in 2011. The increase in gross profit during 2012 was largelyattributed to the increase in net product sales and services revenue resulting from acquisitions. Cost ofnet revenue during 2012 and 2011 included amortization of $4.7 million and $6.0 million, respectively,relating to the write up of inventory to fair value in connection with certain acquisitions. Reducing grossprofit for 2012 and 2011 was $3.1 million and $2.9 million, respectively, in restructuring charges.
Cost of net revenue included amortization expense of $72.3 million and $63.2 million for 2012 and2011, respectively.
Overall gross margin percentage was 51% in 2012, compared to 52% in 2011.
Gross Profit from Net Product Sales and Services Revenue by Business Segment. Grossprofit from net product sales and services revenue increased by $177.7 million, or 14%, to $1.4 billionin 2012, from $1.2 billion in 2011. Gross profit from net product sales and services revenue bybusiness segment for 2012 and 2011 is as follows (in thousands):
2012 2011% Increase(Decrease)
Professional diagnostics . . . . . . . . . . . . . . . $1,151,325 $ 964,034 19%Health information solutions . . . . . . . . . . . . 236,470 245,753 (4)%Consumer diagnostics . . . . . . . . . . . . . . . . 19,305 19,611 (2)%
Gross profit from net product sales andservices revenue . . . . . . . . . . . . . . . . . . . $1,407,100 $1,229,398 14%
Professional Diagnostics
Gross profit from our professional diagnostics net product sales and services revenue increasedby $187.3 million, or 19%, to $1.2 billion during 2012, from $964.0 million in 2011, principally as aresult of gross profit earned on revenue from acquired businesses, as discussed above. Comparing2012 to 2011, gross profit was negatively impacted by a decrease in our meter-based Triage productsales, as discussed above. The FDA recall relating to our meter-based Triage products also resulted inincremental costs during 2012 principally due to costs of refunds made during the period, replacementproducts issued at no cost, unfavorable manufacturing variances and the lost margin on the reducedvolume of tests sold during 2012. Cost of professional diagnostics net product sales and servicesrevenue during 2012 and 2011 included amortization of $4.7 million and $6.0 million, respectively,relating to the write-up of inventory to fair value in connection with certain acquisitions. Reducing grossprofit for both 2012 and 2011 was $2.3 million in restructuring charges.
Cost of professional diagnostics net product sales and services revenue included amortizationexpense of $64.4 million and $55.1 million for 2012 and 2011, respectively.
46

As a percentage of our professional diagnostics net product sales and services revenue, grossprofit from our professional diagnostics business was 53% in 2012, compared to 56% in 2011.Increased revenue from our recently acquired toxicology businesses, which contribute lower-than-segment-average gross margins, and a decrease in our meter-based Triage product sales, whichcontribute higher-than-segment-average gross margins, contributed to the decrease in gross marginfor the respective periods.
Health Information Solutions
Gross profit from our health information solutions net product sales and services revenuedecreased by $9.3 million, or 4%, to $236.5 million during 2012, from $245.8 million in 2011, primarilyas a result of the increasingly competitive environment, including pricing pressures, the impact ofhealth plans insourcing less differentiated services, such as disease and case management, and statebudget pressures. Reducing gross profit for 2012 and 2011 was $0.8 million and $0.7 million,respectively, in restructuring charges.
Cost of health information solutions net product sales and services revenue included amortizationexpense of $6.7 million for both 2012 and 2011, respectively.
As a percentage of our health information solutions net product sales and services revenue, grossprofit from our health information solutions business was 44% in 2012, compared to 46% in 2011. Thelower margin percentage is primarily the result of the increasingly competitive environment, includingpricing pressures, the impact of health plans insourcing less differentiated services, such as diseaseand case management, and state budget pressures.
Consumer Diagnostics
Gross profit from our consumer diagnostics net product sales and services revenue decreased$0.3 million, or 2%, to $19.3 million during 2012, from $19.6 million in 2011.
Cost of consumer diagnostics net product sales and services revenue included amortizationexpense of $1.2 million and $1.4 million for 2012 and 2011, respectively.
As a percentage of our consumer diagnostics net product sales and services revenue, gross profitfrom our consumer diagnostics business was 22% for 2012, compared to 21% in 2011.
Research and Development Expense. Research and development expense increased by$32.8 million, or 22%, to $183.0 million in 2012, from $150.2 million in 2011. Restructuring chargesassociated with our various restructuring plans to integrate our newly-acquired businesses totaling$1.3 million and $0.4 million were included in research and development expense during 2012 and2011, respectively. Amortization expense of $26.9 million and $12.6 million was included in researchand development expense for 2012 and 2011, respectively. Included in the $26.9 million ofamortization expense for 2012 was $19.2 million related to the write off of certain in-process researchand development projects recorded in connection with the Axis-Shield acquisition during the fourthquarter of 2011. Included in the $12.6 million of amortization expense for 2011 was $7.2 million relatedto the write off of certain in-process research and development projects recorded in connection with theStandard Diagnostics acquisition during the first quarter of 2010.
Research and development expense as a percentage of net revenue was 6% for both 2012 and2011.
Sales and Marketing Expense. Sales and marketing expense increased by $77.8 million, or14%, to $643.4 million in 2012, from $565.6 million in 2011. The increase in sales and marketingexpense primarily relates to additional spending related to newly-acquired businesses. Amortization
47
expense of $239.9 million and $220.9 million was included in sales and marketing expense for 2012and 2011, respectively. Restructuring charges associated with our various restructuring plans tointegrate our newly-acquired businesses totaling $2.5 million and $5.0 million were included in salesand marketing expense during 2012 and 2011, respectively.
Sales and marketing expense as a percentage of net revenue was 23% and 24% for 2012 and2011, respectively.
General and Administrative Expense. General and administrative expense increased by$93.4 million, or 23%, to $492.8 million in 2012, from $399.3 million in 2011. The increase in generaland administrative expense primarily relates to additional spending related to newly-acquiredbusinesses. Acquisition-related costs of $9.7 million and $11.5 million were included in general andadministrative expense for 2012 and 2011, respectively. Included in general and administrativeexpense for 2012 and 2011 was $6.6 million and $14.1 million, respectively, of income recorded inconnection with fair value adjustments to acquisition-related contingent consideration obligations.Amortization expense of $8.0 million and $11.2 million was included in general and administrativeexpense for 2012 and 2011, respectively. Restructuring charges associated with our variousrestructuring plans to integrate our newly-acquired businesses totaling $13.4 million and $20.0 millionwere included in general and administrative expense during 2012 and 2011, respectively.
General and administrative expense as a percentage of net revenue was 17% for both 2012 and2011.
Impairment of Goodwill. We conduct our annual goodwill impairment analysis during the fourthquarter of each year. During the fourth quarter of 2011, when conducting Step 1 of the impairmentanalysis, as prescribed by ASC 350, Intangibles — Goodwill and Other, or ASC 350, the analysisindicated that the carrying value of the net assets of our health information solutions reporting unitexceeded the estimated fair value of the reporting unit. As a result, we were required to complete Step2 of the impairment analysis, as prescribed by ASC 350, to determine the amount of the goodwillimpairment charge. The Step 2 portion of the analysis indicated that we needed to record a goodwillimpairment charge of approximately $383.6 million, which was recorded during the fourth quarter of2011. Step 1 of the 2012 impairment analysis did not indicate that the carrying value of any of theassets exceeded the fair value of the applicable reporting unit and, accordingly, we did not record anygoodwill impairment charges during 2012. Further details of the goodwill impairment analysis aredisclosed in Note 2 of our Consolidated Financial Statements included elsewhere in this Annual Reporton Form 10-K.
Interest Expense. Interest expense includes interest charges and the amortization of deferredfinancing costs and original issue discounts associated with certain debt issuances. Interest expenseincreased by $36.6 million, or 18%, to $240.6 million in 2012, from $204.0 million in 2011. The increaseis principally due to higher interest expense recorded in connection with higher outstanding debtbalances and applicable interest rates in 2012, compared to the outstanding debt balances andapplicable interest rates in 2011. Interest expense in 2012 includes approximately $23.2 million ofexpense associated with the repurchase of substantially all of our 7.875% senior notes. Interestexpense for 2011 included interest expense and amortization of fees paid for certain debt modificationstotaling $32.5 million recorded in connection with the termination of our former secured credit facilityand related interest rate swap agreement in 2011.
48

Other Income (Expense), Net. Other income (expense), net includes interest income, realizedand unrealized foreign exchange gains and losses and other income and expense. The componentsand the respective amounts of other income (expense), net are summarized as follows (in thousands):
2012 2011Increase/(Decrease)
Interest income . . . . . . . . . . . . . . . . . . . . . . . . . . . . . . . . . $ 2,028 $ 2,570 $ (542)Foreign exchange gains (losses), net . . . . . . . . . . . . . . . (7,876) (22,870) 14,994Other . . . . . . . . . . . . . . . . . . . . . . . . . . . . . . . . . . . . . . . . . 15,805 22,183 (6,378)
Other income (expense), net . . . . . . . . . . . . . . . . . $ 9,957 $ 1,883 $ 8,074
The increase in foreign exchange gains (losses), net for 2012, compared to 2011, was primarilythe result of a $12.7 million realized foreign currency loss associated with a cash balance establishedin connection with the Axis-Shield acquisition in 2011 and a $1.9 million realized foreign currency lossassociated with the settlement of an acquisition-related contingent consideration obligation during2011.
Other income of $15.8 million for 2012 included $15.5 million of prior period royalty settlements,which included a $13.5 million final royalty termination payment received from Quidel, a net $4.2 milliongain recorded on the disposal of property, plant and equipment and $1.4 million of income associatedwith legal settlements related to intellectual property litigation. Partially offsetting the impact of theseevents was the settlement of a prior year dispute with a former distributor totaling approximately $3.9million.
Other income of $22.2 million for 2011 includes $13.8 million of income associated with anamendment of our license agreement with Quidel, which also includes a settlement of prior periodroyalties, $5.0 million of income associated with the settlement of a dispute over certain intellectualproperty rights, a $4.8 million reversal of a prior period legal settlement reserve no longer deemednecessary, partially offset by approximately $1.6 million of losses recorded on disposal of fixed assets.
Gain on Sale of Joint Venture Interest. In connection with the formation of SPD in May 2007,we entered into an option agreement with P&G, pursuant to which P&G had the right, for a period of 60days commencing on May 17, 2011, to require us to acquire all of P&G’s interest in SPD at fair marketvalue. No gain on the proceeds that we received from P&G through the formation of SPD wasrecognized in our financial statements until P&G’s option to require us to purchase its interest in SPDexpired. On July 16, 2011, P&G’s option to require us to acquire its interest in SPD at fair market valueexpired. In connection with the expiration of the option, the gain totaling approximately $288.9 millionwas recognized during the third quarter of 2011.
Benefit for Income Taxes. Benefit for income taxes increased by $6.1 million, to a $30.3 millionbenefit in 2012, from a $24.2 million benefit in 2011. The effective tax rate in 2012 was 25%, comparedto 15% in 2011. The increase in the benefit for income taxes, and the corresponding effective tax rate,from 2011 to 2012 is primarily related to the rate differential on foreign earnings and the recognition ofa tax benefit associated with the goodwill impairment charge recorded during 2011.
The primary components of the 2012 benefit for income taxes relate to U.S. federal and stateincome tax benefits, including favorable adjustments for revaluation on contingent consideration, offset bytax provisions on foreign income, increases in certain valuation allowances, increase in reserve foruncertain tax positions, and increase for other permanent adjustments. The primary components of the2011 benefit for income taxes relate to U.S. federal and state income tax benefits and the tax benefit onforeign income, offset by losses related to the 2011 goodwill impairment that were not tax benefitted.
Equity Earnings in Unconsolidated Entities, Net of Tax. Equity earnings in unconsolidatedentities are reported net of tax and include our share of earnings in entities that we account for underthe equity method of accounting. Equity earnings in unconsolidated entities, net of tax, for 2012
49

primarily reflect the following: (i) earnings from our 50% interest in SPD in the amount of $10.7 million,(ii) earnings from our 40% interest in Vedalab S.A., or Vedalab, in the amount of $0.4 million and(iii) earnings from our 49% interest in TechLab, Inc., or TechLab, in the amount of $2.3 million. Equityearnings in unconsolidated entities, net of tax, for 2011 primarily reflect the following: (i) earnings fromour 50% interest in SPD in the amount of $5.9 million, (ii) earnings from our 40% interest in Vedalab, inthe amount of $0.7 million and (iii) earnings from our 49% interest in TechLab, in the amount of$2.0 million.
Net Loss. For 2012, we generated a net loss available to common stockholders of $99.5 million,or $1.23 per basic and diluted common share, compared a net loss available to common stockholdersof $131.7 million, or $1.58 per basic and diluted common share for 2011. Net loss available to commonstockholders reflects $21.3 million and $22.0 million of preferred stock dividends paid during 2012 and2011, respectively, and $23.9 million of income associated with the repurchase of preferred stockduring 2011. The net loss in 2012 and 2011 resulted from the various factors discussed above. SeeNote 12 of our Consolidated Financial Statements included elsewhere in this Annual Report onForm 10-K for the calculation of net loss per common share.
Year Ended December 31, 2011 Compared to Year Ended December 31, 2010
Net Product Sales and Services Revenue. Net product sales and services revenue increasedby $228.5 million, or 11%, to $2.4 billion in 2011 from $2.1 billion in 2010. Net product sales andservices revenue increased primarily as a result of our health information solutions and professionaldiagnostics-related acquisitions which contributed an aggregate of $163.2 million of the non-currency-adjusted increase. Excluding the impact of foreign currency translation, net product sales and servicesrevenue in 2011 grew by approximately $199.9 million, or 9%, over 2010. Contributing to the increasein net product sales and services revenue was an increase in North American flu-related net productsales during 2011, which increased approximately $27.2 million, from $18.8 million in 2010 to$46.1 million in 2011, as a result of a more typical flu season in 2011 than the lower-than-normal flulevels observed in 2010. Net product sales and services revenue in our health information solutionssegment was adversely impacted by the increasingly competitive environment, including pricingpressures and the impact of health plans in-sourcing less differentiated services, such as diseasemanagement. Also contributing to the decrease was the loss of approximately $13.1 million of revenuerelated to the discontinuance of the administration of the drug therapy terbutalene, as a result of theFDA’s new warning against the use of terbutalene to treat preterm labor in certain situations, whichimpacted our women’s and children’s health business. Wellness net product sales and servicesrevenue from our Alere Wellbeing business, formerly known as Free & Clear, has been negativelyimpacted as a result of the continuation of decreased funding under certain states’ quitline programs.Additionally, our patient self-testing services business was adversely impacted by a reimbursementpolicy change from the CMS.
Net Product Sales and Services Revenue by Business Segment. Net product sales andservices revenue by business segment for 2011 and 2010 is as follows (in thousands):
2011 2010% Increase(Decrease)
Professional diagnostics . . . . . . . . . . . . . . . . . . . . $1,736,172 $1,440,718 21%Health information solutions . . . . . . . . . . . . . . . . . 534,514 598,819 (11)%Consumer diagnostics . . . . . . . . . . . . . . . . . . . . . . 92,368 95,051 (3)%
Net product sales and services revenue . . . . . . . $2,363,054 $2,134,588 11%
50

Professional Diagnostics
The following table summarizes our net product sales and services revenue from our professionaldiagnostics business segment by groups of similar products and services for 2011 and 2010(in thousands):
2011 2010 % Increase
Infectious disease . . . . . . . . . . . . . . . . . . . . $ 564,983 $ 437,709 29%Cardiology . . . . . . . . . . . . . . . . . . . . . . . . . . 518,746 488,497 6%Toxicology . . . . . . . . . . . . . . . . . . . . . . . . . . 387,209 300,125 29%Diabetes . . . . . . . . . . . . . . . . . . . . . . . . . . . . 14,960 — N/AOther . . . . . . . . . . . . . . . . . . . . . . . . . . . . . . 250,274 214,387 17%
Professional diagnostics net product salesand services revenue . . . . . . . . . . . . . . . $1,736,172 $1,440,718 21%
Net product sales and services revenue from our professional diagnostics business segmentincreased by $295.5 million, or 21%, to $1.7 billion in 2011, from $1.4 billion in 2010. Excluding theimpact of currency translation, net product sales and services revenue from our professional diagnosticsbusiness segment increased by $266.9 million, or 19%, comparing 2011 to 2010. Net product sales andservices revenue increased primarily as a result of acquisitions which contributed an aggregate of$161.1 million of the non-currency-adjusted increase. Contributing to the increase in net product salesand services revenue was an increase in North American flu-related net product sales during 2011, ascompared to 2010. Net product sales from our North American flu sales increased approximately$27.2 million, from $18.8 million in 2010 to $46.1 million in 2011, as a result of a more typical flu seasonin 2011 than the lower-than-normal flu levels observed in 2010. Excluding the impact of acquisitions andthe increase in flu-related sales during the comparable periods, the currency-adjusted organic growth forour professional diagnostics net product sales and services revenue was 6%.
Within our professional diagnostics business segment, net product sales and services revenue forour infectious disease business increased by approximately $127.3 million, or 29%, to $565.0 million in2011, from $437.7 million in 2010, driven by increased North American flu-related, HIV and malaria netproduct sales, coupled with the impact of two recent Brazilian acquisitions, which contributedapproximately $29.6 million of the increase, and our acquisition of Axis-Shield in November 2011,which contributed approximately $6.5 million of the increase. Net product sales and services revenuefor our cardiology business increased by approximately $30.2 million, or 6%, to $518.7 million in 2011,from $488.5 million in 2010, driven particularly by growth outside the U.S., growth in our domesticcholesterol and professional coagulation testing businesses and our acquisition of Axis-Shield, whichcontributed approximately $4.2 million of the increase, offset by continued softness in domestic BNPnet product sales, primarily related to issues with sales on the Beckman Coulter platform. Ourtoxicology business increased by approximately $87.1 million, or 29%, to $387.2 million in 2011, from$300.1 million in 2010, with our recent acquisitions contributing approximately $74.4 million of theincrease. Our diabetes net product sales and services revenue in 2011 relates to two acquisitionscompleted during the fourth quarter of 2011.
Health Information Solutions
The following table summarizes our net product sales and services revenue from our healthinformation solutions business segment by groups of similar products and services for 2011 and 2010(in thousands):
2011 2010% Increase(Decrease)
Disease and case management . . . . . . . . . . . . $237,938 $281,563 (15)%Women’s & children’s health . . . . . . . . . . . . . . 114,287 126,910 (10)%Wellness . . . . . . . . . . . . . . . . . . . . . . . . . . . . . . 104,868 103,343 1%Patient self-testing services . . . . . . . . . . . . . . . 77,421 87,003 (11)%
Health information solutions net productsales and services revenue . . . . . . . . . . $534,514 $598,819 (11)%
51

Net product sales and services revenue from our heath information solutions business segmentdecreased by $64.3 million, or 11%, to $534.5 million in 2011, from $598.8 million in 2010. Net productsales and services revenue in our health information solutions segment was adversely impacted by theincreasingly competitive environment, including pricing pressures and the impact of health plans in-sourcing less differentiated services, such as disease and case management. Also contributing to thedecrease was the loss of approximately $13.1 million of revenue related to the discontinuance of theadministration of the drug therapy terbutalene, as a result of the FDA’s new warning against the use ofterbutalene to treat preterm labor in certain situations, which impacted our women’s and children’shealth business. Additional revenue loss of approximately $2.8 million resulted from the closure of ourGeneCare business located in Chapel Hill, North Carolina during the first quarter of 2011. Wellness netproduct sales and services revenue from our Alere Wellbeing business has been negatively impactedas a result of the continuation of decreased funding under certain states’ quitline programs.Additionally, our patient self-testing services business was adversely impacted by a reimbursementchange from the CMS.
Consumer Diagnostics
Net product sales and services revenue from our consumer diagnostics business segmentdecreased by $2.7 million, or 3%, to $92.4 million in 2011, from $95.1 million in 2010. The decreasewas primarily driven by a decrease of our non-SPD related revenue totaling approximately $4.4 million,comparing 2011 to 2010. The decrease in our non-SPD related revenue primarily relates to the loss ofa distribution contract for certain products in the United Kingdom in late 2010. The decrease in ournon-SPD related revenue was partially offset by an increase in our SPD-related revenue, whichincreased approximately $1.8 million, comparing 2011 to 2010. Net product sales by SPD were$209.2 million and $193.8 million during 2011 and 2010, respectively.
Net Product Sales and Services Revenue by Geographic Location. Net product sales andservices revenue by geographic location for 2011 and 2010 is as follows (in thousands):
2011 2010 % Increase
United States . . . . . . . . . . . . . . . . . . . . . . . . $1,433,372 $1,363,145 5%Europe . . . . . . . . . . . . . . . . . . . . . . . . . . . . . 393,285 358,865 10%Elsewhere . . . . . . . . . . . . . . . . . . . . . . . . . . 536,397 412,578 30%
Net product sales and services revenue . . $2,363,054 $2,134,588 11%
Net product sales and services revenue of $1.4 billion and $1.4 billion generated in the UnitedStates were approximately 61% and 64%, respectively, of total net product sales and services revenuefor the year ended December 31, 2011 and 2010, respectively. The growth in net product sales andservices revenue in all geographic regions resulted primarily from the various acquisitions and organicgrowth, both discussed above.
License and Royalty Revenue. License and royalty revenue represents license and royaltyfees from intellectual property license agreements with third parties. License and royalty revenueincreased by $2.7 million, or 13%, to $23.5 million in 2011, from $20.8 million in 2010. The increase inlicense and royalty revenue during 2011 was largely driven by our acquisition of Axis-Shield, whichcontributed approximately $1.8 million of the increase.
Gross Profit and Margin Percentage. Gross profit increased by $111.2 million, or 10%, to$1.2 billion in 2011, from $1.1 billion in 2010. The increase in gross profit during 2011 was largelyattributed to the increase in net product sales and services revenue resulting from acquisitions, anincrease in North American flu-related net product sales and organic growth from our professionaldiagnostics business segment. Cost of net revenue during 2011 and 2010 included amortization of$6.0 million and $6.6 million, respectively, relating to the write up of inventory to fair value inconnection with certain acquisitions. Reducing gross profit for 2011 and 2010 was $2.9 million and$3.9 million in restructuring charges, respectively.
52

Cost of net revenue included amortization expense of $63.2 million and $63.0 million for 2011 and2010, respectively.
Overall gross margin percentage was 52% in 2011, compared to 53% in 2010.
Gross Profit from Net Product Sales and Services Revenue by Business Segment. Grossprofit from net product sales and services revenue increased by $108.4 million to $1.2 billion in 2011,from $1.1 billion in 2010. Gross profit from net product sales and services revenue by businesssegment for 2011 and 2010 is as follows (in thousands):
2011 2010% Increase(Decrease)
Professional diagnostics . . . . . . . . . . . . . . . $ 964,034 $ 801,745 20%Health information solutions . . . . . . . . . . . . 245,753 297,085 (17)%Consumer diagnostics . . . . . . . . . . . . . . . . 19,611 22,147 (11)%
Gross profit from net product sales andservices revenue . . . . . . . . . . . . . . . . . . . $1,229,398 $1,120,977 10%
Professional Diagnostics
Gross profit from our professional diagnostics net product sales and services revenue increasedby $162.3 million, or 20%, to $964.0 million during 2011, from $801.7 million in 2010, primarily as aresult of the increase in net product sales and services revenue, as discussed above. Cost ofprofessional diagnostics net product sales and services revenue during 2011 and 2010 includedamortization of $6.0 million and $6.6 million, respectively, relating to the write-up of inventory to fairvalue in connection with certain acquisitions. Reducing gross profit for 2011 and 2010 was $2.3 millionand $3.3 million in restructuring charges, respectively.
Cost of professional diagnostics net product sales and services revenue included amortizationexpense of $55.1 million and $53.7 million for 2011 and 2010, respectively.
As a percentage of our professional diagnostics net product sales and services revenue, grossprofit from our professional diagnostics business was 56% in both 2011 and 2010.
Health Information Solutions
Gross profit from our health information solutions net product sales and services revenuedecreased by $51.3 million, or 17%, to $245.8 million during 2011, from $297.1 million in 2010,primarily as a result of the decrease in net product sales and services revenue as discussed above.Reducing gross profit for 2011 and 2010 was $0.7 million and $0.6 million in restructuring charges,respectively.
Cost of health information solutions net product sales and services revenue included amortizationexpense of $6.7 million and $7.7 million for 2011 and 2010, respectively.
As a percentage of our health information solutions net product sales and services revenue, grossprofit from our health information solutions business was 46% in 2011, compared to 50% in 2010. Thelower margin percentage earned during 2011 is primarily a result of the decrease in net product salesand services revenue, as discussed above.
Consumer Diagnostics
Gross profit from our consumer diagnostics net product sales and services revenue decreased$2.5 million, or 11%, to $19.6 million during 2011, from $22.1 million in 2010. The decrease in grossprofit is primarily a result of changes in net product sales and services revenue mix during 2011, asdiscussed above.
Cost of consumer diagnostics net product sales and services revenue included amortizationexpense of $1.4 million and $1.5 million for 2011 and 2010, respectively.
53

As a percentage of our consumer diagnostics net product sales and services revenue, gross profitfrom our consumer diagnostics business was 21% for 2011, compared to 23% in 2010. The lowermargin percentage earned during 2011 is primarily a result of the change in net product sales andservices revenue, as discussed above.
Research and Development Expense. Research and development expense increased by$16.9 million, or 13%, to $150.2 million in 2011, from $133.3 million in 2010. Included in research anddevelopment expense in 2011 is $3.9 million of stock-based compensation expense, representing adecrease of approximately $3.2 million from 2010. Restructuring charges associated with our variousrestructuring plans to integrate our newly-acquired businesses totaling $0.4 million and $0.5 millionwere included in research and development expense during 2011 and 2010, respectively. Amortizationexpense of $12.6 million and $4.8 million was included in research and development expense for 2011and 2010, respectively.
Research and development expense as a percentage of net revenue was 6% for both 2011 and2010.
Sales and Marketing Expense. Sales and marketing expense increased by $66.5 million, or13%, to $565.6 million in 2011, from $499.1 million in 2010. The increase in sales and marketingexpense primarily relates to additional spending related to newly-acquired businesses along with anincrease in our global sales force in support of product launches. Amortization expense of$220.9 million and $212.3 million was included in sales and marketing expense for 2011 and 2010,respectively. Restructuring charges associated with our various restructuring plans to integrate ournewly-acquired businesses totaling $5.0 million and $1.5 million were included in sales and marketingexpense during 2011 and 2010, respectively.
Sales and marketing expense as a percentage of net revenue was 24% and 23% for 2011 and2010, respectively.
General and Administrative Expense. General and administrative expense decreased by$47.6 million, or 11%, to $399.3 million in 2011, from $446.9 million in 2010. General andadministrative expense in 2010 included $60.1 million of compensation expense recorded inconnection with purchasing the remaining shares of a minority shareholder of Standard Diagnostics.Excluding the impact of the $60.1 million of compensation expense recorded in 2010, general andadministrative expense increased approximately $12.5 million, or 3%, to $399.3 million in 2011, from$386.8 million in 2010. The increase in the adjusted general and administrative expense primarilyrelates to additional spending related to newly-acquired businesses. Acquisition-related costs of$11.5 million and $8.2 million were included in general and administrative expense for 2011 and 2010,respectively. Included in general and administrative expense for 2011 and 2010 was $14.1 million ofincome and $1.8 million of expense, respectively, recorded in connection with fair value adjustments toacquisition-related contingent consideration obligations. Amortization expense of $11.2 million and$18.4 million was included in general and administrative expense for 2011 and 2010, respectively.
General and administrative expense as a percentage of net revenue was 17% and 21% for 2011and 2010, respectively.
Impairment of Goodwill. We conducted our annual goodwill impairment analysis during thefourth quarter of 2011. When conducting Step 1 of the impairment analysis, as prescribed by ASC 350,Intangibles — Goodwill and Other, or ASC 350, the analysis indicated that the carrying value of the netassets of our health information solutions reporting unit exceeded the estimated fair value of thereporting unit. As a result, we were required to complete Step 2 of the impairment analysis, asprescribed by ASC 350, to determine the amount of the goodwill impairment charge. The Step 2portion of the analysis indicated that we needed to record a goodwill impairment charge ofapproximately $383.6 million, which was recorded during the fourth quarter of 2011. Any further
54
reduction or impairment of the value of goodwill or other intangible assets will result in additionalcharges against earnings, which could materially reduce our reported results of operations in futureperiods. Further details of the goodwill impairment analysis are disclosed in Note 2 of our consolidatedfinancial statements included elsewhere in this Annual Report on Form 10-K.
Interest Expense. Interest expense includes interest charges, and the amortization of deferredfinancing costs and original issue discounts associated with certain debt issuances. Interest expenseincreased by $64.5 million, or 46%, to $204.0 million in 2011, from $139.4 million in 2010. Thisincrease was partially due to interest expense of $32.5 million recorded in 2011, in connection with thetermination of our former secured credit facility and related interest rate swap agreement, coupled withthe amortization of fees paid for certain debt modifications. Contributing to the increase in interestexpense recorded in 2011, compared to 2010, was interest expense incurred on our 8.625% seniorsubordinated notes issued in September 2010, totaling approximately $36.4 million in 2011, comparedto $9.9 million in 2010. Additionally, higher outstanding debt balances during 2011, compared to 2010,contributed to the increase in interest expense during the respective periods.
Other Income (Expense), Net. Other income (expense), net includes interest income, realizedand unrealized foreign exchange gains and losses and other income and expense. The componentsand the respective amounts of other income (expense), net are summarized as follows (in thousands):
2011 2010Increase/
(Decrease)
Interest income . . . . . . . . . . . . . . . . . . . . . . . . . . . $ 2,570 $ 1,960 $ 610Foreign exchange gains (losses), net . . . . . . . . . (22,870) 9,752 (32,622)Other . . . . . . . . . . . . . . . . . . . . . . . . . . . . . . . . . . . 22,183 11,026 11,157
Other income (expense), net . . . . . . . . . . . . . . . . $ 1,883 $22,738 $(20,855)
The decrease in foreign exchange gains (losses), net for 2011, compared to 2010, was primarilythe result of a $12.7 million realized foreign currency loss associated with a cash balance establishedin connection with the Axis-Shield acquisition in 2011, a $1.9 million realized foreign currency lossassociated with the settlement of an acquisition-related contingent consideration obligation during2011, as well as additional net realized and unrealized foreign exchange losses associated withchanges in currency exchange rates during the respective periods.
Other income of $22.2 million for 2011 includes $13.8 million of income associated with anamendment of our license agreement with Quidel, which also includes a settlement of prior periodroyalties, $5.0 million of income associated with the settlement of a dispute over certain intellectualproperty rights, a $4.8 million reversal of a prior period legal settlement reserve no longer deemednecessary, partially offset by approximately $1.6 million of losses recorded on disposal of fixed assets.
Other income (expense), net for 2010 includes a $4.5 million gain on a sale of marketablesecurities, a net recovery of $3.3 million related to certain restructuring activities, a $3.1 million net gainassociated with legal settlements related to previously disclosed intellectual property litigation relatingto our health information solutions businesses and approximately $0.5 million of income associatedwith a settlement of prior years’ royalties during 2010, which were partially offset by a charge related toan accounts receivable reserve for a prior year’s sale.
Gain on Sale of Joint Venture Interest. In connection with the formation of SPD in May 2007,we entered into an option agreement with P&G, pursuant to which P&G had the right, for a period of 60days commencing on May 17, 2011, to require us to acquire all of P&G’s interest in SPD at fair marketvalue. No gain on the proceeds that we received from P&G through the formation of SPD wasrecognized in our financial statements until P&G’s option to require us to purchase its interest in SPDexpired. On July 16, 2011, P&G’s option to require us to acquire its interest in SPD at fair market valueexpired. In connection with the expiration of the option, the gain totaling approximately $288.9 millionwas recognized during the third quarter of 2011.
55

Benefit for Income Taxes. Benefit for income taxes decreased by $5.7 million, to a$24.2 million benefit in 2011, from a $29.9 million benefit in 2010. The effective tax rate in 2011 was15%, compared to 3% in 2010. The decrease in the benefit for income taxes from 2010 to 2011 isprimarily related to the tax provision associated with the taxes on foreign income. The increase in theeffective tax rate between the two years primarily results from the rate differential on foreign earningsand state income taxes.
The primary components of the 2011 benefit for income taxes relate to U.S. federal and stateincome taxes, taxes on foreign income and the recognition of a tax benefit associated with the goodwillimpairment charge recorded during 2011. The primary components of the 2010 benefit for incometaxes relate to U.S. federal and state income taxes, taxes on foreign income and the recognition of atax benefit associated with the goodwill impairment charge recorded during 2010.
Equity Earnings in Unconsolidated Entities, Net of Tax. Equity earnings in unconsolidatedentities are reported net of tax and include our share of earnings in entities that we account for underthe equity method of accounting. Equity earnings in unconsolidated entities, net of tax, for the yearended December 31, 2011 primarily reflect the following: (i) earnings from our 50% interest in SPD inthe amount of $5.9 million, (ii) earnings from our 40% interest in Vedalab, in the amount of $0.7 millionand (iii) earnings from our 49% interest in TechLab, in the amount of $2.0 million. Equity earnings inunconsolidated entities, net of tax, for the year ended December 31, 2010 reflect the following:(i) earnings from our 50% interest in SPD in the amount of $8.5 million, (ii) earnings from our 40%interest in Vedalab, in the amount of $0.2 million and (iii) earnings from our 49% interest in TechLab, inthe amount of $1.9 million.
Income from Discontinued Operations, Net of Tax. The results of the vitamins and nutritionalsupplements business are included in income from discontinued operations, net of tax, for all periodspresented. For the year ended December 31, 2010, the discontinued operations generated net incomeof approximately $11.4 million, which includes a gain of $18.7 million ($11.6 million, net of tax) on thesale of the vitamins and nutritional supplements business.
Net Loss. For the year ended December 31, 2011, we generated a net loss available tocommon stockholders of $131.7 million, or $1.58 per common share, compared to a net loss availableto common stockholders of $1.0 billion, or $12.33 per common share for the year ended December 31,2010. Net loss available to common stockholders reflects $22.0 million and $24.2 million of preferredstock dividends paid during the years ended December 31, 2011 and 2010, respectively, and $23.9million of income associated with the repurchase of preferred stock during the year endedDecember 31, 2011. The net loss in 2011 and 2010 resulted from the various factors as discussedabove. See Note 12 of our Consolidated Financial Statements included elsewhere in this AnnualReport on Form 10-K for the calculation of loss per common share.
Liquidity and Capital Resources
Based upon our current working capital position, current operating plans and expected businessconditions, we expect to fund our short- and long-term working capital needs primarily using existingcash and our operating cash flow, and we expect our working capital position to improve as weimprove our future operating margins and grow our business through new product and serviceofferings and by continuing to leverage our strong intellectual property position. As of December 31,2012, we had $328.3 million of cash and cash equivalents, of which $80.0 million was held by domesticsubsidiaries and $248.3 million was held by foreign entities. We do not plan to repatriate cash held byforeign entities due to adverse tax implications, including incremental U.S. tax liabilities and potentialforeign withholding tax liabilities.
We may also utilize our secured credit facility or other new sources of financing to fund a portion ofour capital needs and other commitments, including our contractual contingent consideration
56

obligations and future acquisitions. As of December 31, 2012, we had outstanding borrowings totaling$22.5 million under the $250.0 million revolving line of credit under our secured credit facility, leaving$227.5 million available to us for additional borrowings. Our ability to access the capital markets maybe impacted by the amount of our outstanding debt and equity and the extent to which our assets areencumbered by our outstanding secured debt. The terms and conditions of our outstanding debtinstruments also contain covenants which expressly restrict our ability to incur additional indebtednessand conduct other financings. As of December 31, 2012, we had $3.7 billion in outstandingindebtedness comprised of $2.3 billion under our secured credit facility, $450.0 million of 7.25% seniornotes due 2018, $1.8 million of 7.875% senior notes due 2016, $400.0 million of 8.625% seniorsubordinated notes due 2018, $392.9 million of 9% senior subordinated notes due 2016 and $150.0million of 3% convertible senior subordinated notes due 2016. In February 2013, we redeemed all ofthe outstanding 7.875% senior notes. See Note 6 of our Consolidated Financial Statements includedelsewhere in this Annual Report on Form 10-K for further information about our outstanding debtbalances.
If the capital and credit markets experience volatility or the availability of funds is limited, we mayincur increased costs associated with issuing debt instruments. In addition, it is possible that our abilityto access the capital and credit markets could be limited by these or other factors at a time when wewould like, or need, to do so, which could have an adverse impact on our ability to refinance maturingdebt and/or react to changing economic and business conditions.
Our funding plans for our working capital needs and other commitments may be adverselyimpacted by unexpected costs associated with integrating the operations of newly-acquiredcompanies, executing our cost-savings strategies and prosecuting and defending our existing lawsuitsand/or unforeseen lawsuits against us. We also cannot be certain that our underlying assumed levelsof revenues and expenses will be realized. In addition, we intend to continue to make investments inour research and development efforts related to the substantial intellectual property portfolio we own.We may also choose to further expand our research and development efforts and may pursue theacquisition of new products and technologies through licensing arrangements, business acquisitions,or otherwise. We may also choose to make significant investment to pursue legal remedies againstpotential infringers of our intellectual property rights. If we decide to engage in such activities, or if ouroperating results fail to meet our expectations, we could be required to seek additional funding throughpublic or private financings or other arrangements. In such event, adequate funds may not be availablewhen needed or may be available only on terms which could have a negative impact on our businessand results of operations. In addition, if we raise additional funds by issuing equity or convertiblesecurities, dilution to then- existing stockholders may result.
Cash Flow Summary
Year Ended December 31,
2012 2011
Net cash provided by operating activities . . . . . . . . . . . . . . $ 319,683 $ 271,253Net cash used in investing activities . . . . . . . . . . . . . . . . . . (574,191) (898,196)Net cash provided by financing activities . . . . . . . . . . . . . . 285,745 540,080Foreign exchange effect on cash and cash equivalents . . (2,064) (15,270)
Net increase (decrease) in cash and cash equivalents . . . 29,173 (102,133)Cash and cash equivalents, beginning of period . . . . . . . . 299,173 401,306
Cash and cash equivalents, end of period . . . . . . . . . . . . . $ 328,346 $ 299,173
Summary of Changes in Cash Position
As of December 31, 2012, we had cash and cash equivalents of $328.3 million; a $29.2 millionincrease from December 31, 2011. Our primary sources of cash during 2012 included $319.7 million
57

generated by our operating activities, $443.2 million of net proceeds received in connection with theissuance of our 7.25% senior notes, $198.0 million of net proceeds received in connection with the“Incremental B-2” term loans under our secured credit facility, $22.4 million of proceeds received fromthe sale of property, plant and equipment, $14.9 million from common stock issuances under employeestock option and stock purchase plans, $14.3 million of net proceeds under various revolving creditfacilities, $12.7 million return on investment from equity method investments and $3.1 million from thesales of marketable securities. Our primary uses of cash during 2012 related to $424.6 million net cashpaid for acquisitions, $311.6 million related to the repayment of long-term debt obligations,$137.4 million of capital expenditures, $56.3 million related to an increase in other assets, $21.3 millionfor cash dividends paid on our Series B Preferred Stock, $21.0 million related to payments ofacquisition-related contingent consideration obligations, $12.3 million related to a make-whole paymentincurred in connection with the repurchase of our 7.875% senior notes, $7.0 million for payment ofcapital lease obligations and $6.2 million related to the repayment of short-term debt obligations.Fluctuations in foreign currencies negatively impacted our cash balance by $2.1 million during the yearended December 31, 2012.
Operating Cash Flows
Net cash provided by operating activities during 2012 was $319.7 million, which resulted from anet loss from continuing operations of $77.9 million and $37.7 million of cash used to meet net workingcapital requirements during the period, offset by $435.3 million of non-cash items. The $435.3 million ofnon-cash items included, among other items, $456.8 million related to depreciation and amortization, a$30.6 million increase related to other non-cash items, $21.5 million of interest expense related to theamortization of deferred financing costs and original issue discounts, $15.7 million related to non-cashstock-based compensation and a $4.7 million non-cash charge related to the write-up of inventory tofair value in connection with the acquisition of Axis-Shield, partially offset by a $84.6 million decreaserelated to changes in our deferred tax assets and liabilities, which resulted in part from amortization ofintangible assets, and $13.2 million in equity earnings in unconsolidated entities.
Investing Cash Flows
Our investing activities during 2012 utilized $574.2 million of cash, including $424.6 million netcash paid for acquisitions, $137.4 million of capital expenditures and $56.3 million related to anincrease in other assets, which includes a $46.0 million note receivable and purchases of variouslicensing agreements totaling approximately $4.3 million, partially offset by $22.4 million of proceedsreceived from the sale of property, plant and equipment, a $12.7 million return on investment fromequity method investments, which included $11.2 million return of capital from SPD, a $5.9 milliondecrease in our restricted cash balance and $3.1 million received from the sales of marketablesecurities.
Financing Cash Flows
Net cash provided by financing activities during 2012 was $285.7 million. Financing activitiesduring 2012 primarily included approximately $648.5 million of net proceeds received in connectionwith long-term debt issuances, which included $443.2 million of net proceeds received in connectionwith the issuance of our 7.25% senior notes and $198.0 million of net proceeds received in connectionwith the “Incremental B-2” term loans entered under our secured credit facility, $14.3 million of netproceeds under various revolving credit facilities, which included $22.5 million borrowed against oursecured credit facility revolving line-of-credit, and $14.9 million of cash received from common stockissuances under employee stock option and stock purchase plans. The $443.2 million received inconnection with the issuance of the 7.25% senior notes was offset by $267.4 million of cash paymentsrelated to repurchases of our 7.875% senior notes and $170.0 million used to pay down a portion ofthe outstanding balance under our revolving line-of-credit. In addition, we utilized approximately $21.3million for dividend payments related to our Series B preferred stock, $21.0 million for payments of
58

acquisition-related contingent consideration obligations, $12.3 million related to a make-whole paymentincurred in connection with the repurchase of our 7.875% senior notes, $7.0 million for payment ofcapital lease obligations and $6.2 million related to the repayment of short-term debt obligations.
As of December 31, 2012, we had an aggregate of $19.6 million in outstanding capital leaseobligations which are payable through 2019.
Income Taxes
As of December 31, 2012, we had approximately $60.6 million of domestic NOL and domesticcapital loss carryforwards, approximately $981.1 million of state NOL carryforwards and $211.6 millionof foreign NOL and foreign capital loss carryforwards, which either expire on various dates through2032 or can be carried forward indefinitely. As of December 31, 2012, we had approximately$57.7 million of domestic research and development, foreign tax and alternative minimum tax creditswhich either expire on various dates through 2031 or can be carried forward indefinitely. These losscarryforwards and tax credits may be available to reduce future federal, state and foreign taxableincome, if any, and are subject to review and possible adjustment by the appropriate tax authorities.Effective January 1, 2009, we adopted a new accounting standard for business combinations. Prior toadoption of this standard, the pre-acquisition losses were applied first to reduce to zero any goodwilland other non-current intangible assets related to the acquisitions, prior to reducing our income taxexpense. Upon adoption of the new accounting standard, the reduction of a valuation allowance isgenerally recorded to reduce our income tax expense.
Furthermore, all domestic losses and credits are subject to the Internal Revenue Service CodeSection 382, and 383 limitation, respectively, and may be limited in the event of certain cumulativechanges in ownership interests of significant shareholders over a three-year period in excess of 50%.Section 382 and 383 imposes an annual limitation on the use of these losses or credits to an amountequal to the value of the company at the time of the ownership change multiplied by the long-term taxexempt rate. We have recorded a valuation allowance against a portion of the deferred tax assetsrelated to our NOLs and credits and certain of our other deferred tax assets to reflect uncertainties thatmight affect the realization of such deferred tax assets, as these assets can only be realized viaprofitable operations.
Off-Balance Sheet Arrangements
We had no material off-balance sheet arrangements as of December 31, 2012.
Contractual Obligations
The following table summarizes our principal contractual obligations as of December 31, 2012(in thousands):
Payments Due by Period
Contractual Obligations Total 2013 2014-2015 2016-2017 Thereafter
Long-term debt obligations(1) . . . . . . . . . $3,697,771 $ 60,232 $ 98,049 $2,685,239 $854,251Capital lease obligations(2) . . . . . . . . . . . 19,601 6,683 9,428 2,782 708Operating lease obligations(3) . . . . . . . . . 234,321 43,148 70,293 58,384 62,496Pension obligations . . . . . . . . . . . . . . . . . 5,805 893 1,786 1,786 1,340Acquisition-related obligations(4) . . . . . . 28,714 24,160 2,790 1,764 —Purchase obligations — capital
expenditure . . . . . . . . . . . . . . . . . . . . . . 30,254 29,424 830 — —Purchase obligations — other(5) . . . . . . . 60,475 58,535 1,940 — —Interest on debt(6) . . . . . . . . . . . . . . . . . . 530,374 109,918 215,972 153,894 50,590
Total . . . . . . . . . . . . . . . . . . . . . . . . . . . . . $4,607,315 $332,993 $401,088 $2,903,849 $969,385
59

(1) See the description of various financing arrangements in Note 6 of our Consolidated FinancialStatements included elsewhere in this Annual Report on Form 10-K.
(2) See Note 8 of our Consolidated Financial Statements included elsewhere in this Annual Report onForm 10-K.
(3) See Note 11(a) of our Consolidated Financial Statements included elsewhere in this AnnualReport on Form 10-K.
(4) Includes $4.7 million and $1.8 million in deferred payments associated with the acquisitions ofStandard Diagnostics and Bioeasy Diagnostica Ltda., or Bioeasy, respectively. In addition, thisbalance includes approximately $22.3 million of contingent consideration obligations that havebeen accrued as of December 31, 2012.
(5) Other purchase obligations relate to inventory purchases and other operating expensecommitments.
(6) Includes our non-variable interest-bearing debt. See the description of various financingarrangements in Note 6 of our Consolidated Financial Statements included elsewhere in thisAnnual Report on Form 10-K.
In addition to the contractual obligations detailed above, we have contractual contingentconsideration arrangements related to the following acquisitions:
• Ionian Technologies, Inc. has a maximum earn-out of $57.5 million that, if earned, is expected tobe paid during 2013.
• TwistDx, Inc. has a maximum earn-out of up to $125.0 million that, if earned, is expected to bepaid during an eight-year period ending on the eighth anniversary of the acquisition, but couldextend thereafter.
• AdnaGen has a maximum earn-out of $42.0 million that, if earned, is expected to be paid during2013 through 2016.
• Medlab Produtos Medicos Hospitalares Ltda, now known as Alere S.A., has a maximumremaining earn-out potential of $6.0 million that, if earned, is expected to be paid in annualamounts during 2014 through 2017.
• Bioeasy has a maximum remaining earn-out potential of approximately $2.5 million that, ifearned, is expected to be paid during 2014.
• Laboratory Data Systems, Inc., has a maximum remaining earn-out of approximately$7.5 million that, if earned, is expected to be paid during 2013 and 2014.
• Mologic Limited has a maximum remaining earn-out potential of $14.8 million that, if earned, isexpected to be paid in cash or shares of our common stock during 2014.
• Forensics Limited, or ROAR, has a maximum remaining earn-out of approximately £9.3 million(approximately $15.2 million at December 31, 2012) that, if earned, is expected to be paidduring 2013 and 2014.
• Standing Stone, Inc., has a maximum remaining earn-out of $2.8 million that, if earned, isexpected to be paid during 2014. The maximum amount of employee bonuses that we arerequired to make pursuant to the Standing Stone acquisition agreement is $0.1 million, which, ifearned, is also expected to be paid during 2014.
• Method Factory, Inc. (d/b/a Wellogic) has a maximum remaining earn-out potential of $49.8million based on operational targets and an earn-out with no maximum based on profit targetsthat, if earned, is expected to be paid during 2014 through 2020.
• eScreen has a maximum earn-out potential of $70.0 million that, if earned, is expected to bepaid during 2014 and 2015.
60
• MedApps has a maximum earn-out potential of $21.2 million that, if earned, is expected to bepaid during 2013 through 2015.
• Amedica has a maximum remaining amount potential of $8.1 million that, if earned, is expectedto be paid in 2014.
• DiagnosisOne has a maximum earn-out potential of $33.0 million that, if earned, is expected tobe paid during 2013 through 2015.
• Diagnostik Nord has a maximum earn-out potential of €1.4 million (approximately $1.9 million atDecember 31, 2012) that, if earned, is expected to be paid during 2013 and 2014.
• Healthcare Connections Limited has a maximum earn-out potential of £3.5 million(approximately $5.7 million at December 31, 2012) that, if earned, is expected to be paid in2014.
• NationsHealth, Inc., has a maximum earn-out potential of $8.0 million that, if earned, is expectedto be paid in 2013 and 2014.
• Branan has a maximum remaining amount potential of $3.0 million that, if earned, is expected tobe paid during 2013 through 2015.
For further information pertaining to our contractual contingent arrangements see Note 11 of ouraccompanying Consolidated Financial Statements.
Further, as of December 31, 2012, we had additional contractual obligations as follows:
• Agreements with Epocal
In November 2009, we entered into a definitive agreement to acquire all of the issued andoutstanding equity securities of Epocal, Inc. As amended as of December 31, 2012, that agreementprovided for a total potential purchase price of up to $263.0 million, including milestone payments of upto $90.5 million if Epocal achieves certain other milestones relating to its gross margin and productdevelopment efforts on or prior to October 31, 2014. The agreement contains a working capitaladjustment whereby the purchase price is increased or decreased to the extent that Epocal’s workingcapital at closing is more or less than a specified amount. We also agreed that, if the acquisition isconsummated, we will provide $12.5 million in management incentive arrangements, 25% of which willvest over three years and 75% of which will be payable only upon the achievement of certainmilestones.
In February 2013, we completed the acquisition of Epocal. After working capital and otheradjustments made at closing, we paid approximately $166.0 million in cash to acquire Epocal, whichincluded a $15.0 million payment for the achievement of the first two financial milestones specified inthe agreement. Additional earn-out payments of up to $75.5 million could be triggered if milestoneslinked to the delivery of additional product offerings on the Epocal platform are achieved.
Critical Accounting Policies
The Consolidated Financial Statements included elsewhere in this Annual Report on Form 10-Kare prepared in accordance with accounting principles generally accepted in the United States ofAmerica, or GAAP. The accounting policies discussed below are considered by our management andour audit committee to be critical to an understanding of our financial statements because theirapplication depends on management’s judgment, with financial reporting results relying on estimatesand assumptions about the effect of matters that are inherently uncertain. Specific risks for thesecritical accounting policies are described in the following paragraphs. For all of these policies,management cautions that future events rarely develop exactly as forecast and the best estimatesroutinely require adjustment. In addition, the notes to our audited Consolidated Financial Statementsfor the year ended December 31, 2012, included elsewhere in this Annual Report on Form 10-K,include a comprehensive summary of the significant accounting policies and methods used in thepreparation of our consolidated financial statements.
61

Revenue Recognition
We primarily recognize revenue when the following four basic criteria have been met:(1) persuasive evidence of an arrangement exists, (2) delivery has occurred or services rendered,(3) the fee is fixed or determinable and (4) collection is reasonably assured.
The majority of our revenue is derived from product sales. We recognize revenue upon titletransfer of the products to third-party customers, less a reserve for estimated product returns andallowances. Determination of the reserve for estimated product returns and allowances is based on ourmanagement’s analyses and judgments regarding certain conditions. Should future changes inconditions prove management’s conclusions and judgments on previous analyses to be incorrect,revenue recognized for any reporting period could be adversely affected.
For products that include installation, if the installation meets the criteria to be considered aseparate element, product revenue is recognized upon delivery, and installation revenue is recognizedwhen the installation is complete. For sales that include customer-specified acceptance criteria,revenue is recognized after the acceptance criteria have been met. Certain of our products requirespecialized installation. Revenue for these products is deferred until installation is completed. Revenuefrom services is deferred and recognized over the contractual period, or as services are rendered andaccepted by the customer. When arrangements include multiple elements, we use objective evidenceof fair value to allocate revenue to the elements, and recognize revenue when the criteria for revenuerecognition have been met for each element, in accordance with authoritative guidance on multiple-element arrangements.
Additionally, we generate services revenue in connection with contracts with health plans (bothcommercial and governmental) and self-insured employers, whereby we provide clinical expertisethrough fee-based arrangements. Revenue for fee-based arrangements is recognized over the periodin which the services are provided. Some contracts provide that a portion of our fees are at risk if ourcustomers do not achieve certain financial cost savings or we do not achieve certain other clinical andoperational metrics, over a period of time, typically one year. Revenue subject to refund is notrecognized if (i) sufficient information is not available to calculate performance measurements or(ii) interim performance measurements indicate that we are not meeting performance targets. If eitherof these two conditions exists, we record the amounts as other current liabilities in the consolidatedbalance sheet, deferring recognition of the revenue until we establish that we are meeting theperformance criteria. If we do not meet the performance targets at the end of the contractual period weare obligated under the contract to refund some or all of the at-risk fees.
We also receive license and royalty revenue from agreements with third-party licensees. Revenuefrom fixed-fee license and royalty agreements is recognized on a straight-line basis over the obligationperiod of the related license agreements. License and royalty fees that the licensees calculate basedon their sales, which we have the right to audit under most of our agreements, are generallyrecognized upon receipt of the license or royalty payments, unless we are able to reasonably estimatethe fees as they are earned. License and royalty fees that are determinable prior to the receipt thereofare recognized in the period they are earned.
Use of Estimates for Sales Returns and Other Allowances and Allowance for Doubtful Accounts
Certain sales arrangements require us to accept product returns. From time to time, we also enterinto sales incentive arrangements with our retail customers, which generally reduce the sale prices ofour products. As a result, we must establish allowances for potential future product returns and claimsresulting from our sales incentive arrangements against product revenue recognized in any reportingperiod. Calculation of these allowances requires significant judgments and estimates. When evaluatingthe adequacy of the sales returns and other allowances, our management analyzes historical returns,current economic trends and changes in customer and consumer demand and acceptance of our
62

products. When such analysis is not available and a right of return exists, we record revenue when theright of return is no longer applicable. Material differences in the amount and timing of our productrevenue for any reporting period may result if changes in conditions arise that would requiremanagement to make different judgments or utilize different estimates.
Our total provision for sales returns and other allowances related to sales incentive arrangementsamounted to $67.8 million, $47.5 million and $37.3 million, or 4%, 3% and 3%, respectively, of netproduct sales in 2012, 2011 and 2010, respectively, which have been recorded against product salesto derive our net product sales. Of these amounts, approximately $43.7 million, $23.6 million and$14.0 million for 2012, 2011 and 2010, respectively, represent allowances for future deductions whichhave been provided against our related accruals for such charges with the balance charged directlyagainst net sales.
Similarly, our management must make estimates regarding uncollectible accounts receivablebalances. When evaluating the adequacy of the allowance for doubtful accounts, managementanalyzes specific accounts receivable balances, historical bad debts, customer concentrations,customer credit-worthiness, current economic trends and changes in our customer payment terms andpatterns. Our accounts receivable balance was $524.3 million and $475.8 million, net of allowances fordoubtful accounts of $36.4 million and $24.6 million, as of December 31, 2012 and 2011, respectively.
Inventory
We state our inventories at the lower of the actual cost to purchase or manufacture the inventoryor the estimated current market value of the inventory, less cost to sell. In addition, we periodicallyreview the inventory quantities on hand and record a provision for excess and obsolete inventory. Thisprovision reduces the carrying value of our inventory and is calculated based primarily upon factorssuch as forecasts of our customers’ demands, shelf lives of our products in inventory, loss ofcustomers and manufacturing lead times. Evaluating these factors, particularly forecasting ourcustomers’ demands, requires management to make assumptions and estimates. Actual product andservices revenue may prove our forecasts to be inaccurate, in which case we may haveunderestimated or overestimated the provision required for excess and obsolete inventory. If, in futureperiods, our inventory is determined to be overvalued, we would be required to recognize the excessvalue as a charge to our cost of sales at the time of such determination. Likewise, if, in future periods,our inventory is determined to be undervalued, we would have over-reported our cost of sales, orunderstated our earnings, at the time we recorded the excess and obsolete provision. Our inventorybalance was $337.1 million and $320.3 million, net of a reserve for excess and obsolete inventory of$21.8 million and $13.6 million, as of December 31, 2012 and 2011, respectively.
Goodwill and Other Long-Lived and Intangible Assets
Our long-lived assets include property, plant and equipment, goodwill and other intangible assets.As of December 31, 2012, the balances of property, plant and equipment, goodwill and other intangibleassets, net of accumulated depreciation and amortization, were $534.5 million, $3.0 billion and$1.9 billion, respectively.
Goodwill relates to amounts that arose in connection with our various business combinations andrepresents the difference between the purchase price and the fair value of the identifiable tangible andintangible net assets when accounted for using the acquisition method of accounting. Goodwill is notamortized, but is subject to periodic review for impairment.
We test goodwill and other intangible assets with indefinite lives at the reporting unit level forimpairment on an annual basis and between annual tests, if events and circumstances indicate it ismore likely than not that the fair value of a reporting unit is less than its carrying value. Events thatwould indicate impairment and trigger an interim impairment assessment include, but are not limited to,
63
current economic and market conditions, including a decline in market capitalization, a significantadverse change in legal factors, business climate or operational performance of the business and anadverse action or assessment by a regulator.
In performing the impairment test, we utilize the two-step approach. The first step, or Step 1,requires a comparison of the carrying value of each reporting unit to its estimated fair value. Toestimate the fair value of our reporting units for Step 1, we use a combination of the income approachand the market approach. The income approach is based on a discounted cash flow analysis, or DCF,and calculates the fair value by estimating the after-tax cash flows attributable to a reporting unit andthen discounting the after-tax cash flows to a present value, using a risk-adjusted discount rate.Assumptions used in the DCF require the exercise of significant judgment, including judgment aboutappropriate discount rates and terminal values, growth rates and the amount and timing of expectedfuture cash flows. The forecasted cash flows are based on our most recent budget and for yearsbeyond the budget, our estimates are based on assumed growth rates. We believe our assumptionsare consistent with the plans and estimates used to manage the underlying businesses. The discountrates, which are intended to reflect the risks inherent in future cash flow projections, used in the DCFare based on estimates of the weighted-average cost of capital, or WACC, of market participantsrelative to each respective reporting unit. The market approach considers comparable market databased on multiples of revenue or earnings before interest, taxes, depreciation and amortization, orEBITDA.
If the carrying value of a reporting unit exceeds its estimated fair value, we are required to performthe second step, or Step 2, of the goodwill impairment test to measure the amount of impairment loss,if any. The second step of the goodwill impairment test compares the implied fair value of a reportingunit’s goodwill to its carrying value. The implied fair value of goodwill is calculated as the differencebetween the fair value of the reporting unit and the estimated fair value of its assets and liabilities. Tothe extent this amount is below the carrying value of goodwill, an impairment charge is recorded.
The estimate of fair value requires significant judgment. We based our fair value estimates onassumptions that we believe to be reasonable but that are unpredictable and inherently uncertain,including estimates of future growth rates and operating margins and assumptions about the overalleconomic climate and the competitive environment for our business units. There can be no assurancethat our estimates and assumptions made for purposes of our goodwill and identifiable intangible assettesting as of the time of testing will prove to be accurate predictions of the future. If our assumptionsregarding business plans, competitive environments or anticipated growth rates are not correct, wemay be required to record goodwill and/or intangible asset impairment charges in future periods,whether in connection with our next annual impairment testing or earlier, if an indicator of animpairment is present before our next annual evaluation.
Impairment charges related to goodwill have no impact on our cash balances or compliance withfinancial covenants under our Amended and Restated Credit Agreement.
2012 Annual Goodwill Impairment Test
We conducted our 2012 annual impairment test for our reporting units during the fourth quarter of2012. Key assumptions (which vary by reporting unit) used in determining fair value under thediscounted cash flow approach included discount rates ranging from 11.0% to 15.0%, projectedcompound average revenue growth rates of 3.0% to 8.1% and terminal value growth rates of 3.0% to4.0%. In determining the appropriate discount rate, we considered the WACC for each reporting unit,which among other factors considers the cost of common equity capital and the marginal cost of debtof market participants. Key assumptions (which again vary by reporting unit) used in determining fairvalue under the market approach were based on observed market multiples of enterprise value torevenue and EBITDA for both comparable publicly-traded companies and recent merger andacquisition transactions involving similar companies to estimate appropriate controlling basis multiples
64

to apply to each of the reporting units. Based on the multiples implied by this market data, we selectedmultiples of revenue of 0.9 to 2.4 times and multiples of EBITDA of 6.1 to 8.9 times. In assessing thereasonableness of our estimated fair values of the reporting units, management compared the resultsof the valuation analyses against our then-current market capitalization to imply a control premium.Based on this analysis, the implied control premium was within the range of comparable industrytransactions.
The Step 1 impairment analysis indicated the estimated fair value of the professional diagnostics,health information solutions and consumer diagnostics reporting units exceeded the carrying value oftheir reporting unit’s net assets by 7.9%, 9.4% and 27.2%, respectively.
2011 Annual Goodwill Impairment Test
We conducted our 2011 annual impairment test for our reporting units during the fourth quarter of2011. Key assumptions (which vary by reporting unit) used in determining fair value under thediscounted cash flow approach included discount rates ranging from 11.0% to 14.5%, projectedcompound average revenue growth rates of 4.9% to 10.0% and terminal value growth rates of 4.0%. Indetermining the appropriate discount rate, we considered the WACC for each reporting unit, whichamong other factors considers the cost of common equity capital and the marginal cost of debt ofmarket participants. Key assumptions (which again vary by reporting unit) used in determining fairvalue under the market approach were based on observed market multiples of enterprise value torevenue and EBITDA for both comparable publicly-traded companies and recent merger andacquisition transactions involving similar companies to estimate appropriate controlling basis multiplesto apply to each of the reporting units. Based on the multiples implied by this market data, we selectedmultiples of revenue of 0.8 to 2.6 times and multiples of EBITDA of 5.6 to 9.3 times. In assessing thereasonableness of our estimated fair values of the reporting units, management compared the resultsof the valuation analyses against our then-current market capitalization to imply a control premium.Based on this analysis, the implied control premium was within the range of comparable industrytransactions.
The Step 1 impairment analysis indicated that the carrying value of the net assets of our healthinformation solutions reporting unit exceeded the estimated fair value of the reporting unit. As a result,we were required to perform Step 2 of the goodwill impairment test to determine the amount, if any, ofgoodwill impairment charges for the health information solutions reporting unit. We completed Step 2,consistent with the procedures described above, and determined that a goodwill impairment charge inthe amount of approximately $383.6 million was required. The resulting goodwill impairment charge isreflected in operating income (loss) in our accompanying Consolidated Statements of Operations.
This impairment was primarily driven by reduced future cash flow expectations from the reportingunit principally as a result of an increasingly competitive business environment for services provided bythe reporting unit, including the insourcing of certain services by key customers and a reduction inspending by other customers as a result in part of the continuing difficult economic climate. Alsocontributing to the impairment charge was the lower valuations ascribed to similar comparablebusinesses in the public markets.
2010 Annual Goodwill Impairment Test
We conducted our 2010 annual impairment test for our reporting units during the fourth quarter of2010. Key assumptions (which vary by reporting unit) used in determining fair value under thediscounted cash flow approach included discount rates ranging from 12.5% to 13.0%, projectedcompound average revenue growth rates of 6.0% to 10.0% and terminal value growth rates of 4.0%. Indetermining the appropriate discount rate, we considered the WACC for each reporting unit, whichamong other factors considers the cost of common equity capital and the marginal cost of debt ofmarket participants. Key assumptions (which again vary by reporting unit) used in determining fair
65

value under the market approach were based on observed market multiples of enterprise value torevenue and EBITDA for both comparable publicly-traded companies and recent merger andacquisition transactions involving similar companies to estimate appropriate controlling basis multiplesto apply to each of the reporting units. Based on the multiples implied by this market data, we selectedmultiples of revenue of 1.0 to 2.8 times and multiples of EBITDA of 7.5 to 10.0 times. In assessing thereasonableness of our estimated fair values of the reporting units, management compared the resultsof the valuation analyses against our then-current market capitalization to imply a control premium.Based on this analysis, the implied control premium was within the range of comparable industrytransactions.
The Step 1 impairment analysis indicated that the carrying value of the net assets of our healthinformation solutions reporting unit exceeded the estimated fair value of the reporting unit. As a result,we were required to perform Step 2 of the goodwill impairment test to determine the amount, if any, ofgoodwill impairment charges for the health information solutions reporting unit. We completed Step 2,consistent with the procedures described above, and determined that a goodwill impairment charge inthe amount of approximately $1.0 billion was required. The resulting goodwill impairment charge isreflected in operating income (loss) in our accompanying Consolidated Statements of Operations.
This impairment was primarily driven by reduced future cash flow expectations from the reportingunit principally as a result of an increasingly competitive business environment for services provided bythe reporting unit, including the insourcing of certain services by key customers and a reduction inspending by other customers as a result in part of the continuing difficult economic climate. Alsocontributing to the impairment charge was the lower valuations ascribed to similar comparablebusinesses in the public markets.
Valuation of Other Long-Lived Tangible and Intangible Assets
Factors we generally consider important which could trigger an impairment review on the carryingvalue of other long-lived tangible and intangible assets include the following: (1) significantunderperformance relative to expected historical or projected future operating results, (2) significantchanges in the manner of our use of acquired assets or the strategy for our overall business,(3) underutilization of our tangible assets, (4) discontinuance of product lines by ourselves or ourcustomers, (5) significant negative industry or economic trends, (6) significant decline in our stock pricefor a sustained period, (7) significant decline in our market capitalization relative to net book value and(8) goodwill impairment identified during an impairment review.
We conduct our annual goodwill impairment test for our reporting units during the fourth quarter.The impairment tests conducted during 2011 and 2010 indicated there was an impairment of goodwillassociated with our health information solutions reporting unit, and thus, a potential impairment of ourlong-lived tangible and intangible assets associated with the same reporting unit. We conducted ananalysis as prescribed under ASC 360 Property, Plant and Equipment, utilizing an undiscounted cashflow model. The analysis conducted during 2011 and 2010 indicated there was no impairment of thelong-lived tangible or intangible assets associated with our health information solutions reporting unit.
Stock-Based Compensation
Stock-based compensation cost is measured at the grant date based on the fair value of theaward and is recognized as expense over the vesting period. Determining the fair value of stock-basedawards at the grant date requires judgment, including estimating our stock price volatility and employeestock option exercise behaviors. If actual results differ significantly from these estimates, stock-basedcompensation expense and our results of operations could be materially impacted.
Our expected volatility is based upon the historical volatility of our stock. The expected term isbased on the assumption that all outstanding options will be exercised at the midpoint of the vesting
66

date and the full contractual term, including data on experience to date. As stock-based compensationexpense is recognized in our consolidated statements of operations based on awards ultimatelyexpected to vest, the amount of expense has been reduced for estimated forfeitures. Forfeitures areestimated at the time of grant and revised, if necessary, in subsequent periods if actual forfeitures differfrom those estimates. Forfeitures were estimated based on historical experience. If factors change andwe employ different assumptions, the compensation expense that we record in future periods maydiffer significantly from what we have recorded in the current period.
Accounting for Income Taxes
As part of the process of preparing our consolidated financial statements, we are required toestimate our income taxes in each of the jurisdictions in which we operate. This process involvesestimating our actual current tax exposure and assessing temporary differences resulting from differingtreatment of items, such as reserves and accruals and lives assigned to long-lived and intangibleassets, for tax and accounting purposes. These differences result in deferred tax assets and liabilities.We must then assess the likelihood that our deferred tax assets will be recovered through futuretaxable income and, to the extent we believe that recovery is not more likely than not, we mustestablish a valuation allowance. To the extent we establish a valuation allowance or increase thisallowance in a period, we must include an expense within our tax provision.
Significant management judgment is required in determining our provision for income taxes, ourdeferred tax assets and liabilities and any valuation allowance recorded against our net deferred taxassets. We have recorded a valuation allowance of $68.6 million as of December 31, 2012, due touncertainties related to the future benefits, if any, from our deferred tax assets related primarily to ourforeign businesses and certain U.S. net operating losses, or NOLs, and tax credits. This is an increaseof $17.0 million from the valuation allowance of $51.6 million as of December 31, 2011. The increase isprimarily related to domestic state NOLs and certain foreign NOLs. The valuation allowance is basedon our estimates of taxable income by jurisdiction in which we operate and the period over which ourdeferred tax assets will be recoverable. In the event that actual results differ from these estimates orwe adjust these estimates in future periods, we may need to establish an additional valuationallowance or reduce our current valuation allowance which could materially impact our tax provision.
We established reserves for tax uncertainties that reflect the use of the comprehensive model forthe recognition and measurement of uncertain tax positions. We are currently undergoing routine taxexaminations by U.S. federal, various state and foreign jurisdictions. Tax authorities periodicallychallenge certain transactions and deductions we reported on our income tax returns. We do notexpect the outcome of these examinations, either individually or in the aggregate, to have a materialadverse effect on our financial position, results of operations or cash flows.
Loss Contingencies
In the section of this Annual Report on Form 10-K entitled “Part I, Item 3, Legal Proceedings,” wehave reported on material legal proceedings, if any. Because of the nature of our business, we may besubject at any particular time to lawsuits or other claims arising in the ordinary course of our business,and we expect that this will continue to be the case in the future.
We do not accrue for potential losses on legal proceedings where our company is the defendantwhen we are not able to reasonably estimate our potential liability, if any, due to uncertainty as to thenature, extent and validity of the claims against us, uncertainty as to the nature and extent of thedamages or other relief sought by the plaintiff and the complexity of the issues involved. Our potentialliability, if any, in a particular case may become reasonably estimable and probable as the caseprogresses, in which case we will begin accruing for the expected loss.
67

Recent Accounting Pronouncements
See Note 2(v) of the Consolidated Financial Statements included elsewhere in this Annual Reporton Form 10-K, regarding the impact of certain recent accounting pronouncements on our ConsolidatedFinancial Statements.
ITEM 7A. QUANTITATIVE AND QUALITATIVE DISCLOSURES ABOUT MARKET RISK
The following discussion about our market risk disclosures involves forward-looking statements.Actual results could differ materially from those discussed in the forward-looking statements. We areexposed to market risk related to changes in interest rates and foreign currency exchange rates. Wedo not use derivative financial instruments for speculative or trading purposes.
Interest Rate Risk
We are exposed to market risk from changes in interest rates primarily through our investing andfinancing activities. In addition, our ability to finance future acquisition transactions or fund workingcapital requirements may be impacted if we are not able to obtain appropriate financing at acceptablerates.
To manage our interest rate exposure, our strategy is to invest in short-term, highly-liquidinvestments. Our investment policy also requires investment in approved instruments with an initialmaximum allowable maturity of eighteen months and an average maturity of our portfolio that shouldnot exceed six months, with at least $500,000 cash available at all times. At December 31, 2012, ourshort-term investments consisted of money market funds with original maturities of 90 days or less. AtDecember 31, 2012, our short-term investments approximated market value.
At December 31, 2012, under the credit agreement for our secured credit facility we had (i) termloans in an aggregate outstanding principal amount of $2.3 billion (consisting of “A” term loans(including the “Delayed-Draw” term loans) in the aggregate principal amount of $878.4 million, “B” termloans in the aggregate principal amount of $913.4 million, “Incremental B-1” term loans in theaggregate principal amount of $247.5 million and “Incremental B-2” term loans in the aggregateprincipal amount of $196.7 million), (ii) $22.5 million of outstanding borrowings under our revolving lineof credit and (iii) subject to our continued compliance with the credit agreement, the ability to borrow amaximum of up to an additional $227.5 million under our revolving line of credit, which includes a$50.0 million sublimit for the issuance of letters of credit. Loans can be either Base Rate Loans orEurodollar Rate Loans at our election, and interest accrues on loans and our other Obligations underthe terms of the credit agreement as follows (with the terms referenced above and below in thisparagraph having the meanings given to them in the credit agreement): (i) in the case of loans that areBase Rate Loans, at a rate per annum equal to the sum of the Base Rate and the Applicable Margin,each as in effect from time to time, (ii) in the case of loans that are Eurodollar Rate Loans, at a rate perannum equal to the sum of the Eurodollar Rate and the Applicable Margin, each as in effect for theapplicable Interest Period, and (iii) in the case of other Obligations, at a rate per annum equal to thesum of the Base Rate and the Applicable Margin for Revolving Loans that are Base Rate Loans, eachas in effect from time to time. The Base Rate is a floating rate which approximates the U.S. prime rateas in effect from time to time. The Eurodollar Rate is equal to the LIBOR rate and is set for a period ofone, two, three or six months at our election. Applicable Margins for our “A” term loans (including the“Delayed-Draw” term loans) and revolving line of credit loans range from (i) with respect to such loansthat are Base Rate Loans, 1.75% to 2.50% and (ii) with respect to such loans that are Eurodollar RateLoans, 2.75% to 3.50%, in each case, depending upon our consolidated secured leverage ratio (asdetermined under the credit agreement). Applicable Margins for our “B” term loans, “Incremental B-1”term loans and “Incremental B-2” term loans range from (i) with respect to such loans that are BaseRate Loans, 2.50% to 3.25% and (ii) with respect to such loans that are Eurodollar Rate Loans, 3.50%to 4.25%, in each case, depending upon our consolidated secured leverage ratio. Interest on “B” term
68

loans, “Incremental B-1” term loans and “Incremental B-2” term loans based on the Eurodollar Rate issubject to a 1.00% floor with respect to the base Eurodollar Rate.
Assuming no changes in our consolidated secured leverage ratio, the effect of interest ratefluctuations on outstanding borrowings as of December 31, 2012 over the next twelve months isquantified and summarized as follows (in thousands):
Interest ExpenseIncrease
Interest rates payable by us increase by 100 basis points . . . . . . . . . . . . . . . . $22,586Interest rates payable by us increase by 200 basis points . . . . . . . . . . . . . . . . $45,172
Foreign Currency Risk
We face exposure to movements in foreign currency exchange rates whenever we, or any of oursubsidiaries, enter into transactions with third parties that are denominated in currencies other thanour, or its, functional currency. Intercompany transactions between entities that use different functionalcurrencies also expose us to foreign currency risk. During 2012, the net impact of foreign currencychanges on transactions was a loss of $7.9 million.
Gross margins of products we manufacture at our foreign plants and sell in U.S. dollars ormanufacture in our U.S. plants and sell in currencies other than the U.S. dollar are also affected byforeign currency exchange rate movements. Our gross margin on total net product sales was 51.3% in2012. If the U.S. dollar had been stronger by 1%, 5% or 10%, compared to the actual rates during2012, our gross margin on total net product sales would have been 51.4%, 51.7% and 52.1%,respectively.
In addition, because a substantial portion of our earnings is generated by our foreign subsidiaries,whose functional currencies are other than the U.S. dollar (in which we report our consolidatedfinancial results), our earnings could be materially impacted by movements in foreign currencyexchange rates upon the translation of the earnings of such subsidiaries into the U.S. dollar.
If the U.S. dollar had been uniformly stronger by 1%, 5% or 10%, compared to the actual averageexchange rates used to translate the financial results of our foreign subsidiaries, our net product salesand net income would have been impacted by approximately the following amounts (in thousands):
ApproximateDecrease inNet Revenue
ApproximateDecrease inNet Income
If, during 2012, the U.S. dollar was stronger by:1% . . . . . . . . . . . . . . . . . . . . . . . . . . . . . . . . . . . . . . . . . . . . . . . . . . . . . . . . . . . $ (8,810) $ (257)5% . . . . . . . . . . . . . . . . . . . . . . . . . . . . . . . . . . . . . . . . . . . . . . . . . . . . . . . . . . . $(45,670) $(1,285)10% . . . . . . . . . . . . . . . . . . . . . . . . . . . . . . . . . . . . . . . . . . . . . . . . . . . . . . . . . . $(91,746) $(2,570)
ITEM 8. FINANCIAL STATEMENTS AND SUPPLEMENTARY DATA
The financial statements and supplementary data, except for selected quarterly financial datawhich are summarized below, are listed under Item 15(a) and have been filed as part of this AnnualReport on Form 10-K on the pages indicated.
69

The following table presents selected quarterly financial data for each of the quarters in the yearsended December 31, 2012 and 2011 (in thousands, except per share data):
2012
FirstQuarter(2)
SecondQuarter(3)
ThirdQuarter(4)
FourthQuarter(5)
Net revenue . . . . . . . . . . . . . . . . . . . . . . . . . . . . . . . . . $671,129 $700,517 $691,416 $755,763Gross profit . . . . . . . . . . . . . . . . . . . . . . . . . . . . . . . . . $353,071 $355,608 $345,775 $373,868Income (loss) from continuing operations . . . . . . . . . $ 1,029 $ (12,879) $ (3,517) $ (62,540)Net loss available to common stockholders(1) . . . . . $ (4,095) $ (18,194) $ (9,155) $ (68,031)Basic — Loss per common share attributable to
Alere Inc. and Subsidiaries:Loss per common share from continuing
operations . . . . . . . . . . . . . . . . . . . . . . . . . . . . . . . $ (0.05) $ (0.23) $ (0.11) $ (0.84)Net loss per common share(1) . . . . . . . . . . . . . . . . $ (0.05) $ (0.23) $ (0.11) $ (0.84)
Diluted — Loss per common share attributable toAlere Inc. and Subsidiaries:Loss per common share from continuing
operations . . . . . . . . . . . . . . . . . . . . . . . . . . . . . . . $ (0.05) $ (0.23) $ (0.11) $ (0.84)Net loss per common share(1) . . . . . . . . . . . . . . . . $ (0.05) $ (0.23) $ (0.11) $ (0.84)
2011
FirstQuarter(6)(7)
SecondQuarter(8)
ThirdQuarter(9)
FourthQuarter(7)(10)
Net revenue . . . . . . . . . . . . . . . . . . . . . . . . . . . . . . . . . $582,464 $567,185 $585,769 $ 651,109Gross profit . . . . . . . . . . . . . . . . . . . . . . . . . . . . . . . . . $306,207 $292,728 $305,962 $ 340,938Income (loss) from continuing operations . . . . . . . . . $ 277 $ (9,442) $239,704 $(363,848)Net income (loss) available to common
stockholders(1) . . . . . . . . . . . . . . . . . . . . . . . . . . . . $ 8,094 $ (4,669) $234,208 $(369,288)Basic — Income (loss) per common share
attributable to Alere Inc. and Subsidiaries:Income (loss) per common share from continuing
operations . . . . . . . . . . . . . . . . . . . . . . . . . . . . . . . $ 0.09 $ (0.05) $ 2.84 $ (4.67)Net income (loss) per common share(1) . . . . . . . . $ 0.09 $ (0.05) $ 2.84 $ (4.67)
Diluted — Income (loss) per common shareattributable to Alere Inc. and Subsidiaries:Income (loss) per common share from continuing
operations . . . . . . . . . . . . . . . . . . . . . . . . . . . . . . . $ 0.09 $ (0.05) $ 2.48 $ (4.67)Net income (loss) per common share(1) . . . . . . . . $ 0.09 $ (0.05) $ 2.48 $ (4.67)
(1) Net income (loss) available to common stockholders and basic and diluted net income (loss) percommon share are computed consistent with the annual per share calculations described inNotes 2(o) and 12 of our Consolidated Financial Statements included elsewhere in this AnnualReport on Form 10-K.
(2) Included in net loss for the first quarter of 2012 is $5.6 million related to restructuring chargesassociated with the decision to close various facilities, a write-off in the amount of $4.7 millionrelating to an inventory write-up recorded in connection with an acquisition, acquisition-relatedcosts in the amount of $1.5 million recorded in accordance with ASC 805, Business Combinations,$5.0 million of expense recorded in connection with fair value adjustments to acquisition-relatedcontingent consideration obligations in accordance with ASC 805, Business Combinations, $1.3million of interest expense recorded in connection with fees paid for certain debt modifications andthe termination of our senior secured credit facility and $3.9 million of non-cash stock-basedcompensation expense.
(3) Included in net loss for the second quarter of 2012 is $1.4 million related to restructuring chargesassociated with the decision to close various facilities, acquisition-related costs in the amount of
70

$3.8 million recorded in accordance with ASC 805, Business Combinations, $6.7 million of incomerecorded in connection with fair value adjustments to acquisition-related contingent considerationobligations in accordance with ASC 805, Business Combinations, $1.3 million of interest expenserecorded in connection with fees paid for certain debt modifications and the termination of oursenior secured credit facility and $4.4 million of non-cash stock-based compensation expense.
(4) Included in net loss for the third quarter of 2012 is $3.3 million related to restructuring chargesassociated with the decision to close various facilities, acquisition-related costs in the amount of$0.8 million recorded in accordance with ASC 805, Business Combinations, $15.1 million of incomerecorded in connection with fair value adjustments to acquisition-related contingent considerationobligations in accordance with ASC 805, Business Combinations, $1.3 million of interest expenserecorded in connection with fees paid for certain debt modifications and the termination of our seniorsecured credit facility and $3.6 million of non-cash stock-based compensation expense.
(5) Included in net loss for the fourth quarter of 2012 is $10.3 million related to restructuring chargesassociated with the decision to close various facilities, acquisition-related costs in the amount of$3.6 million recorded in accordance with ASC 805, Business Combinations, $10.2 million ofexpense recorded in connection with fair value adjustments to acquisition-related contingentconsideration obligations in accordance with ASC 805, Business Combinations, $23.2 million ofexpense associated with the repurchase of substantially all of our 7.875% senior notes,$1.0 million of interest expense recorded in connection with fees paid for certain debtmodifications and the termination of our senior secured credit facility and $3.8 million of non-cashstock-based compensation expense.
(6) Included in net income for the first quarter of 2011 is $6.4 million related to restructuring chargesassociated with the decision to close various facilities, acquisition-related costs in the amount of$1.9 million recorded in accordance with ASC 805, Business Combinations, $1.4 million ofexpense recorded in connection with fair value adjustments to acquisition-related contingentconsideration obligations in accordance with ASC 805, Business Combinations, a $1.9 millionrealized foreign currency loss associated with the settlement of an acquisition-related contingentconsideration obligation and $5.8 million of non-cash stock-based compensation expense.
(7) The first and fourth quarters of 2011 include income tax benefits of $1.4 million and $5.6 million,respectively, to correct items related to periods between 2007 and 2010. We do not believe thatthe corrected items are material to the 2011 annual financial statements or any previously reportedquarterly or annual financial statements.
(8) Included in net loss for the second quarter of 2011 is $10.5 million related to restructuring chargesassociated with the decision to close various facilities, acquisition-related costs in the amount of$1.4 million recorded in accordance with ASC 805, Business Combinations, $7.2 million of incomerecorded in connection with fair value adjustments to acquisition-related contingent considerationobligations in accordance with ASC 805, Business Combinations, $29.9 million of interest expenserecorded in connection with fees paid for certain debt modifications and the termination of oursenior secured credit facility and related interest rate swap agreement and $6.2 million of non-cash stock-based compensation expense.
(9) Included in net income for the third quarter of 2011 is $3.4 million related to restructuring chargesassociated with the decision to close various facilities, acquisition-related costs in the amount of$2.9 million recorded in accordance with ASC 805, Business Combinations, $3.8 million of incomerecorded in connection with fair value adjustments to acquisition-related contingent considerationobligations in accordance with ASC 805, Business Combinations, $1.3 million of interest expenserecorded in connection with fees paid for certain debt modifications and the termination of oursenior secured credit facility, an $18.1 million unrealized foreign currency loss associated with abank account funded for the acquisition of Axis-Shield plc, recognition of a $288.9 million gainoriginally recorded in connection with the formation of SPD, our 50/50 joint venture with P&G, a$0.6 million fair value write-down recorded in connection with an idle facility and $4.3 million ofnon-cash stock-based compensation expense.
71

(10) Included in net loss for the fourth quarter of 2011 is a goodwill impairment charge in the amount ofapproximately $383.6 million related to our health information solutions reporting unit and businesssegment, $8.8 million related to restructuring charges associated with the decision to close variousfacilities, a write-off in the amount of $6.0 million relating to an inventory write-up recorded inconnection with acquisitions, acquisition-related costs in the amount of $5.3 million recorded inaccordance with ASC 805, Business Combinations, $4.4 million of income recorded in connectionwith fair value adjustments to acquisition-related contingent consideration obligations inaccordance with ASC 805, Business Combinations, $1.3 million of interest expense recorded inconnection with fees paid for certain debt modifications and the termination of our senior securedcredit facility, a $5.4 million realized foreign currency gain associated with a bank account fundedfor the acquisition of Axis-Shield plc, a $0.5 million gain related to previously-owned shares ofAxis-Shield plc recorded in connection with the completion of the acquisition and $4.9 million ofnon-cash stock-based compensation expense.
ITEM 9. CHANGES IN AND DISAGREEMENTS WITH ACCOUNTANTS ON ACCOUNTING ANDFINANCIAL DISCLOSURE
Not applicable.
ITEM 9A. CONTROLS AND PROCEDURES
Management’s Conclusions Regarding the Effectiveness of Our Disclosure Controls and Procedures
Our management evaluated, with the participation of our Chief Executive Officer (CEO) and ChiefFinancial Officer (CFO), the effectiveness of the design and operation of our disclosure controls andprocedures (as defined in Rule 13a-15(e) under the Securities Exchange Act of 1934, as amended) asof the end of the period covered by this Annual Report on Form 10-K. Based on this evaluation, ourCEO and CFO concluded that our disclosure controls and procedures were effective to providereasonable assurance that information required to be disclosed by the Company in reports that it filesor submits under the Exchange Act is recorded, processed, summarized and reported within therequired time periods and that such information is accumulated and communicated to ourmanagement, including the CEO and CFO, as appropriate to allow timely decisions regarding requireddisclosure.
Our management understands, nonetheless, that controls and procedures, no matter how welldesigned and operated, can provide only reasonable assurance of achieving the desired controlobjectives, and our management, necessarily, was required to apply its judgment in evaluating andimplementing controls and procedures.
Management’s Annual Report on Internal Control over Financial Reporting
Our management is responsible for establishing and maintaining adequate internal control overfinancial reporting as defined in Rule 13a-15(f) under the Securities Exchange Act of 1934, asamended. Our internal control over financial reporting is a process designed under the supervision ofour CEO and CFO to provide reasonable assurance regarding the reliability of financial reporting andthe preparation of financial statements for external purposes in accordance with generally acceptedaccounting principles. Our internal control over financial reporting includes those policies andprocedures that:
(i) pertain to the maintenance of records that, in reasonable detail, accurately and fairly reflectthe transactions and dispositions of our assets;
(ii) provide reasonable assurance that transactions are recorded as necessary to permitpreparation of financial statements in accordance with generally accepted accountingprinciples, and that our receipts and expenditures are being made only in accordance withauthorizations of our management and directors; and
72

(iii) provide reasonable assurance regarding prevention or timely detection of unauthorizedacquisition, use or disposition of assets that could have a material effect on our financialstatements.
Because of its inherent limitations, internal control over financial reporting may not prevent ordetect misstatements. Also, projections of any evaluation of effectiveness to future periods are subjectto the risk that controls may become inadequate because of changes in conditions, or that the degreeof compliance with the policies or procedures may deteriorate.
Management assessed the effectiveness of our internal control over financial reporting as ofDecember 31, 2012. In making this assessment, management used the criteria established in InternalControl — Integrated Framework issued by the Committee of Sponsoring Organizations of theTreadway Commission (COSO). Based on this evaluation, management determined that the Companymaintained effective internal control over financial reporting as of December 31, 2012.
In conducting management’s evaluation of the effectiveness of our internal control over financialreporting, management excluded 14 entities acquired in purchase business combinations during 2012from its assessment. The acquisitions represented approximately 1% and 5% of total assets and netrevenue, respectively, of the related consolidated financial statement amounts as of and for the yearended December 31, 2012. Refer to Note 4 of the accompanying Consolidated Financial Statementsfor a list of the 2012 acquisitions.
The effectiveness of our internal control over financial reporting as of December 31, 2012 hasbeen audited by PricewaterhouseCoopers LLP, an independent registered public accounting firm, asstated in their report which appears herein.
Changes in internal control over financial reporting
There was no change in our internal control over financial reporting that occurred during our fourthfiscal quarter of 2012 that has materially affected, or is reasonably likely to materially affect, ourinternal control over financial reporting.
ITEM 9B. OTHER INFORMATION
None.
73

PART III
ITEM 10. DIRECTORS, EXECUTIVE OFFICERS AND CORPORATE GOVERNANCE
The information regarding directors, executive officers and corporate governance included in ourdefinitive Proxy Statement to be filed pursuant to Regulation 14A in connection with our 2013 AnnualMeeting of Shareholders, or the Proxy Statement, is incorporated herein by reference.
ITEM 11. EXECUTIVE COMPENSATION
The information regarding executive compensation included in the Proxy Statement isincorporated herein by reference.
ITEM 12. SECURITY OWNERSHIP OF CERTAIN BENEFICIAL OWNERS AND MANAGEMENTAND RELATED STOCKHOLDER MATTERS
The information regarding security ownership of certain beneficial owners and management andrelated stockholder matters included in the Proxy Statement is incorporated herein by reference.
ITEM 13. CERTAIN RELATIONSHIPS AND RELATED TRANSACTIONS, AND DIRECTORINDEPENDENCE
The information regarding certain relationships and related transactions, and directorindependence included in the Proxy Statement is incorporated herein by reference.
ITEM 14. PRINCIPAL ACCOUNTING FEES AND SERVICES
The information regarding principal accounting fees and services included in the Proxy Statementis incorporated herein by reference.
PART IV
ITEM 15. EXHIBITS AND FINANCIAL STATEMENT SCHEDULES
1. Financial Statements.
The financial statements listed below have been filed as part of this report on the pages indicated:
Report of Independent Registered Public Accounting Firm . . . . . . . . . . . . . . . . . . . . . . . . . . . . . . . F-2Consolidated Statements of Operations for the Years Ended December 31, 2012, 2011 and
2010 . . . . . . . . . . . . . . . . . . . . . . . . . . . . . . . . . . . . . . . . . . . . . . . . . . . . . . . . . . . . . . . . . . . . . . . . . F-3Consolidated Statements of Comprehensive Income (Loss) for the Years Ended December 31,
2012, 2011 and 2010 . . . . . . . . . . . . . . . . . . . . . . . . . . . . . . . . . . . . . . . . . . . . . . . . . . . . . . . . . . . F-4Consolidated Balance Sheets as of December 31, 2012 and 2011 . . . . . . . . . . . . . . . . . . . . . . . . F-5Consolidated Statements of Equity for the Years Ended December 31, 2012, 2011 and 2010 . . F-6Consolidated Statements of Cash Flows for the Years Ended December 31, 2012, 2011 and
2010 . . . . . . . . . . . . . . . . . . . . . . . . . . . . . . . . . . . . . . . . . . . . . . . . . . . . . . . . . . . . . . . . . . . . . . . . . F-9Notes to Consolidated Financial Statements . . . . . . . . . . . . . . . . . . . . . . . . . . . . . . . . . . . . . . . . . . . F-10
2. Financial Statement Schedules.
All schedules for which provision is made in the applicable accounting regulations of the Securitiesand Exchange Commission have been omitted because they are inapplicable or the requiredinformation is shown in the Consolidated Financial Statements or the notes thereto included herein.
74

3. Exhibits.
Some of the agreements filed as exhibits to this Annual Report on Form 10-K containrepresentations and warranties that were made solely for the benefit of the parties to the agreement.These representations and warranties:
• may have been qualified by disclosures that were made to the other party or parties inconnection with the negotiation of the agreements, which disclosures are not necessarilyreflected in the agreements;
• may apply standards of materiality that differ from those of investors;
• may have constituted an allocation of risk and responsibility among the parties rather thanstatements of fact; and
• were made only as of specified dates contained in the agreements and are subject tosubsequent developments and changed circumstances.
Accordingly, these representations and warranties may not describe the actual state of affairs asof the date that these representations and warranties were made or at any other time. Investors shouldnot rely on them as statements of fact.
Exhibit No. Description
3.1 Amended and Restated Certificate of Incorporation of the Company (incorporated byreference to Exhibit 3.1 to the Company’s Quarterly Report on Form 10-Q for the quarterended June 30, 2012)
3.2 Amended and Restated By-laws of the Company (incorporated by reference toExhibit 3.3 to the Company’s Annual Report on Form 10-K, as amended, for the yearended December 31, 2001)
4.1 Indenture, dated May 14, 2007, between the Company and U.S. Bank Trust NationalAssociation (incorporated by reference to Exhibit 4.1 to the Company’s Current Reporton Form 8-K, event date May 9, 2007, filed on May 15, 2007)
4.2 Indenture dated as of May 12, 2009 between Inverness Medical Innovations, Inc., asissuer, and U.S. Bank National Association, as trustee (incorporated by reference toExhibit 4.1 to the Company’s Current Report on Form 8-K, event date May 12, 2009, filedon May 12, 2009)
4.3 First Supplemental Indenture dated as of May 12, 2009 to Indenture dated as of May 12,2009 among Inverness Medical Innovations, Inc., as issuer, the guarantor subsidiariesnamed therein, as guarantors, and U.S. Bank National Association, as trustee(incorporated by reference to Exhibit 4.2 to the Company’s Current Report on Form 8-K,event date May 12, 2009, filed on May 12, 2009)
4.4 Second Supplemental Indenture to Indenture dated as of May 12, 2009 (to add theguarantee of Matria of New York Inc.) dated as of June 9, 2009 among Matria of NewYork Inc., as guarantor, the Company, as issuer, the other guarantor subsidiaries namedtherein, as guarantors, and U.S. Bank National Association, as trustee (incorporated byreference to Exhibit 4.4 to Matria of New York Inc.’s Registration Statement on Form 8-Afiled on June 9, 2009)
4.5 Third Supplemental Indenture to Indenture dated as of May 12, 2009 (to add theguarantees of GeneCare Medical Genetics Center, Inc. and Alere CDM LLC) dated as ofAugust 4, 2009 among GeneCare Medical Genetics Center, Inc., as guarantor, AlereCDM LLC, as guarantor, the Company, as issuer, the other guarantor subsidiariesnamed therein, as guarantors and U.S. Bank National Association, as trustee(incorporated by reference to Exhibit 4.5 to GeneCare Medical Genetics Center, Inc. andAlere CDM LLC’s Registration Statement on Form 8-A filed on August 4, 2009)
75

Exhibit No. Description
4.6 Fourth Supplemental Indenture to Indenture dated as of May 12, 2009 (to add the guaranteeof ZyCare, Inc.) dated as of September 22, 2009 among ZyCare, Inc., as guarantor, theCompany, as issuer, the other guarantor subsidiaries named therein, as guarantors andU.S. Bank National Association, as trustee (incorporated by reference to Exhibit 4.6 toZyCare, Inc.’s Registration Statement on Form 8-A filed on September 24, 2009)
4.7 Fifth Supplemental Indenture to Indenture dated as of May 12, 2009 (to add theguarantees of Free & Clear, Inc. and Tapestry Medical, Inc.) dated as of November 25,2009 among Free & Clear, Inc., as guarantor, Tapestry Medical, Inc., as guarantor, theCompany, as issuer, the other guarantor subsidiaries named therein, as guarantors, andU.S. Bank National Association, as trustee (incorporated by reference to Exhibit 4.7 toFree & Clear, Inc. and Tapestry Medical, Inc.’s Registration Statement on Form 8-A, filedon November 25, 2009)
4.8 Sixth Supplemental Indenture to Indenture dated as of May 12, 2009 (to add theguarantee of RMD Networks, Inc.) dated as of February 1, 2010 among RMD Networks,Inc., as guarantor, the Company, as issuer, the other guarantor subsidiaries namedtherein, as guarantors, and U.S. Bank National Association, as trustee (incorporated byreference to Exhibit 4.8 to RMD Networks, Inc.’s Registration Statement on Form 8-A,filed on February 1, 2010)
4.9 Seventh Supplemental Indenture to Indenture dated as of May 12, 2009 (to add theguarantees of Laboratory Specialists of America, Inc., Kroll Laboratory Specialists, Inc.and Scientific Testing Laboratories, Inc.) dated as of March 1, 2010 among LaboratorySpecialists of America, Inc., Kroll Laboratory Specialists, Inc. and Scientific TestingLaboratories, Inc., as guarantors, the Company, as issuer, the other guarantorsubsidiaries named therein, as guarantors, and U.S. Bank National Association, astrustee (incorporated by reference to Exhibit 4.9 to Laboratory Specialists of America,Inc., Kroll Laboratory Specialists, Inc. and Scientific Testing Laboratories, Inc.’s,Registration Statement on Form 8-A, filed on March 2, 2010)
4.10 Eighth Supplemental Indenture to Indenture dated as of May 12, 2009 (to add theguarantees of Alere NewCo, Inc., Alere NewCo II, Inc., New Binax, Inc. and New Biosite,Inc.) dated as of March 19, 2010 among Alere NewCo, Inc., Alere NewCo II, Inc., NewBinax, Inc. and New Biosite, Inc., as guarantors, the Company, as issuer, the otherguarantor subsidiaries named therein, as guarantors, and U.S. Bank NationalAssociation, as trustee (incorporated by reference to Exhibit 4.10 to Alere NewCo, Inc.,Alere NewCo II, Inc., New Binax, Inc. and New Biosite, Inc.’s Registration Statement onForm 8-A, filed on March 19, 2010)
4.11 Ninth Supplemental Indenture dated September 21, 2010 to Indenture date as ofMay 12, 2009 among Alere Inc., as issuer, the subsidiary guarantors named therein, asguarantors, and U.S. Bank National Association, as trustee (incorporated by reference toExhibit 4.1 to the Company’s Current Report on Form 8-K, event date September 15,2010, filed with the SEC on September 21, 2010)
4.12 Tenth Supplemental Indenture to Indenture dated as of May 19, 2009 (relating to theRecord Date Amendments and Waivers) dated as of June 16, 2011, among theCompany, the subsidiary guarantors party thereto and U.S. Bank National Association,as trustee (incorporated by reference to Exhibit 4.1 to the Company’s Current Report onForm 8-K, event date June 16, 2011, filed on June 22, 2011)
4.13 Eleventh Supplemental Indenture to Indenture dated as of May 19, 2009 (relating to theRecord Date Amendments and Waivers) dated as of June 16, 2011, among theCompany, the subsidiary guarantors party thereto and U.S. Bank National Association,as trustee (incorporated by reference to Exhibit 4.3 to the Company’s Current Report onForm 8-K, event date June 16, 2011, filed on June 22, 2011)
76

Exhibit No. Description
4.14 Twelfth Supplemental Indenture to Indenture dated as of May 19, 2009 (relating to theRestricted Payments Amendments and Waivers) dated as of June 16, 2011, among theCompany, the subsidiary guarantors party thereto and U.S. Bank National Association,as trustee (incorporated by reference to Exhibit 4.2 to the Company’s Current Report onForm 8-K, event date June 16, 2011, filed on June 22, 2011)
4.15 Thirteenth Supplemental Indenture to Indenture dated as of May 19, 2009 (relating to theRestricted Payments Amendments and Waivers) dated as of June 16, 2011, among theCompany, the subsidiary guarantors party thereto and U.S. Bank National Association,as trustee (incorporated by reference to Exhibit 4.4 to the Company’s Current Report onForm 8-K, event date June 16, 2011, filed on June 22, 2011)
4.16 Indenture dated as of August 11, 2009 between Inverness Medical Innovations, Inc., asissuer, and The Bank of New York Mellon Trust Company, N.A., as trustee (incorporatedby reference to Exhibit 4.1 to the Company’s Current Report on Form 8-K, event dateAugust 11, 2009, filed on August 11, 2009)
4.17 Fifteenth Supplemental Indenture, dated as of December 11, 2012, by and among theCompany, the subsidiary guarantors named therein and Bank of New York Mellon TrustCompany, N.A., as trustee (incorporated by reference to Exhibit 4.2 to the Company’sCurrent Report on Form 8-K, event date December 11, 2012, filed on December 14,2012)
4.18 Registration Rights Agreement, dated as of December 11, 2012, by and among theCompany, the guarantors named therein, and Jefferies & Company, Inc., Goldman,Sachs & Co., and Credit Suisse Securities (USA) LLC, as representatives of the InitialPurchasers (incorporated by reference to Exhibit 4.4 to the Company’s Current Reporton Form 8-K, event date December 11, 2012, filed on December 14, 2012)
+10.1 BNP Assay Development, Manufacture and Supply Agreement between BiositeIncorporated and Beckman Coulter, Inc. effective June 24, 2003 (incorporated byreference to Exhibit 10.22 to Annual Report of Biosite Incorporated on Form 10-K, filedon March 12, 2007)
+10.2 Shareholder Agreement dated as of May 17, 2007 among Inverness Medical SwitzerlandGmbH, Procter & Gamble International Operations, SA and SPD Swiss PrecisionDiagnostics GmbH (incorporated by reference to Exhibit 10.12 to Company’s QuarterlyReport on Form 10-Q for the period ended June 30, 2007)
‡10.3 Inverness Medical Innovations, Inc. 2001 Stock Option and Incentive Plan, as amended(incorporated by reference to Appendix A to the Company’s Proxy Statement filed onSchedule 14A as filed with the SEC on April 30, 2009)
‡10.4 Alere Inc. 2010 Stock Option and Incentive Plan, as amended (incorporated by referenceto Appendix B to the Company’s Proxy Statement filed on Schedule 14A as filed with theSEC on June 1, 2012)
‡10.5 Rules of Alere Inc. HM Revenue and Customs Approved Share Option Plan (2007), asamended (authorized for use under the Alere Inc. 2001 Stock Option and Incentive Planand the Alere Inc. 2010 Stock Option and Incentive Plan) (incorporated by reference toExhibit 10.5 to the Company’s Quarterly Report on Form 10-Q for the period endedJune 30, 2010)
*‡10.6 Summary of Terms of Stock Option Agreements under Alere Inc. Stock Option andIncentive Plans
77
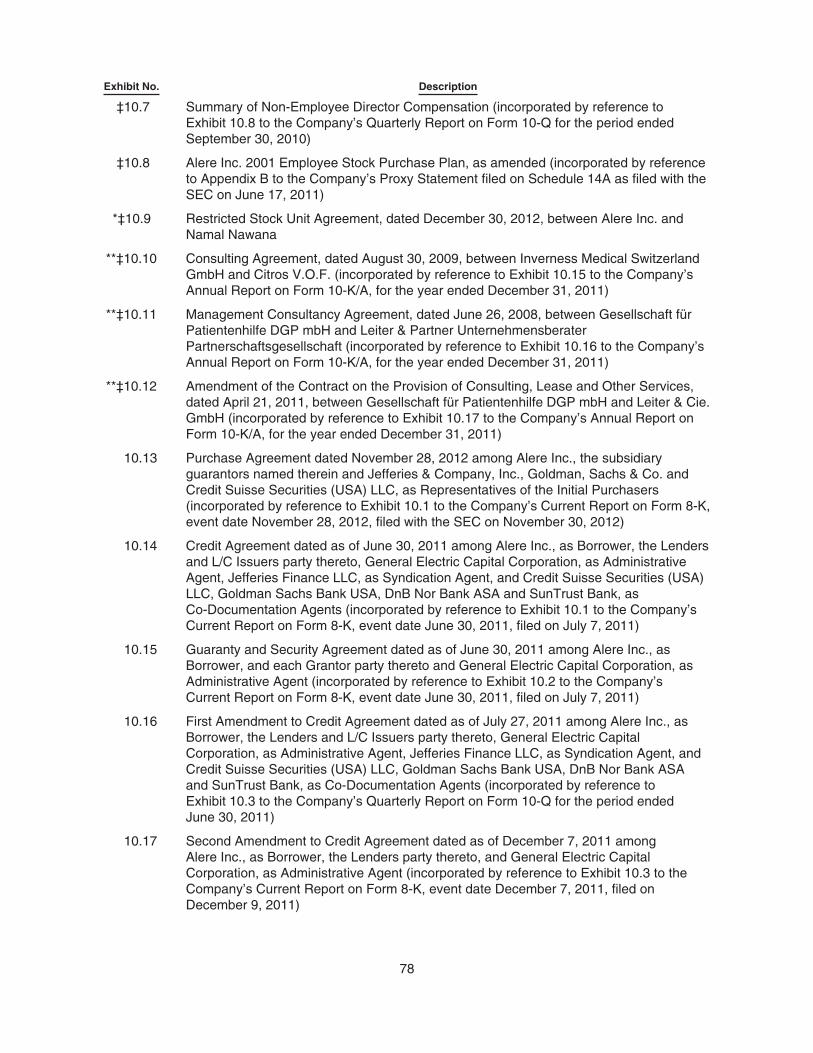
Exhibit No. Description
‡10.7 Summary of Non-Employee Director Compensation (incorporated by reference toExhibit 10.8 to the Company’s Quarterly Report on Form 10-Q for the period endedSeptember 30, 2010)
‡10.8 Alere Inc. 2001 Employee Stock Purchase Plan, as amended (incorporated by referenceto Appendix B to the Company’s Proxy Statement filed on Schedule 14A as filed with theSEC on June 17, 2011)
*‡10.9 Restricted Stock Unit Agreement, dated December 30, 2012, between Alere Inc. andNamal Nawana
**‡10.10 Consulting Agreement, dated August 30, 2009, between Inverness Medical SwitzerlandGmbH and Citros V.O.F. (incorporated by reference to Exhibit 10.15 to the Company’sAnnual Report on Form 10-K/A, for the year ended December 31, 2011)
**‡10.11 Management Consultancy Agreement, dated June 26, 2008, between Gesellschaft fürPatientenhilfe DGP mbH and Leiter & Partner UnternehmensberaterPartnerschaftsgesellschaft (incorporated by reference to Exhibit 10.16 to the Company’sAnnual Report on Form 10-K/A, for the year ended December 31, 2011)
**‡10.12 Amendment of the Contract on the Provision of Consulting, Lease and Other Services,dated April 21, 2011, between Gesellschaft für Patientenhilfe DGP mbH and Leiter & Cie.GmbH (incorporated by reference to Exhibit 10.17 to the Company’s Annual Report onForm 10-K/A, for the year ended December 31, 2011)
10.13 Purchase Agreement dated November 28, 2012 among Alere Inc., the subsidiaryguarantors named therein and Jefferies & Company, Inc., Goldman, Sachs & Co. andCredit Suisse Securities (USA) LLC, as Representatives of the Initial Purchasers(incorporated by reference to Exhibit 10.1 to the Company’s Current Report on Form 8-K,event date November 28, 2012, filed with the SEC on November 30, 2012)
10.14 Credit Agreement dated as of June 30, 2011 among Alere Inc., as Borrower, the Lendersand L/C Issuers party thereto, General Electric Capital Corporation, as AdministrativeAgent, Jefferies Finance LLC, as Syndication Agent, and Credit Suisse Securities (USA)LLC, Goldman Sachs Bank USA, DnB Nor Bank ASA and SunTrust Bank, asCo-Documentation Agents (incorporated by reference to Exhibit 10.1 to the Company’sCurrent Report on Form 8-K, event date June 30, 2011, filed on July 7, 2011)
10.15 Guaranty and Security Agreement dated as of June 30, 2011 among Alere Inc., asBorrower, and each Grantor party thereto and General Electric Capital Corporation, asAdministrative Agent (incorporated by reference to Exhibit 10.2 to the Company’sCurrent Report on Form 8-K, event date June 30, 2011, filed on July 7, 2011)
10.16 First Amendment to Credit Agreement dated as of July 27, 2011 among Alere Inc., asBorrower, the Lenders and L/C Issuers party thereto, General Electric CapitalCorporation, as Administrative Agent, Jefferies Finance LLC, as Syndication Agent, andCredit Suisse Securities (USA) LLC, Goldman Sachs Bank USA, DnB Nor Bank ASAand SunTrust Bank, as Co-Documentation Agents (incorporated by reference toExhibit 10.3 to the Company’s Quarterly Report on Form 10-Q for the period endedJune 30, 2011)
10.17 Second Amendment to Credit Agreement dated as of December 7, 2011 amongAlere Inc., as Borrower, the Lenders party thereto, and General Electric CapitalCorporation, as Administrative Agent (incorporated by reference to Exhibit 10.3 to theCompany’s Current Report on Form 8-K, event date December 7, 2011, filed onDecember 9, 2011)
78

Exhibit No. Description
10.18 Third Amendment to Credit Agreement dated as of March 28, 2012 among Alere Inc., asBorrower, the Lenders party thereto, and General Electric Capital Corporation, asAdministrative Agent (incorporated by reference to Exhibit 10.1 to the Company’sCurrent Report on Form 8-K, event date March 28, 2012, filed on April 2, 2012)
*21.1 List of Subsidiaries of the Company as of February 25, 2013
*23.1 Consent of PricewaterhouseCoopers LLP, Independent Registered Public AccountingFirm
*31.1 Certification by Chief Executive Officer Pursuant to Section 302 of the Sarbanes-OxleyAct
*31.2 Certification by Chief Financial Officer Pursuant to Section 302 of the Sarbanes-OxleyAct
*32.1 Certification Pursuant to 18 U.S.C. Section 1350, as Adopted Pursuant to Section 906 ofthe Sarbanes-Oxley Act
*101 Interactive Data Files regarding (a) our Consolidated Statements of Operations for theYears Ended December 31, 2012, 2011 and 2010, (b) our Consolidated Statements ofComprehensive Income (Loss) for the Years Ended December 31, 2012, 2011 and2010 (c) our Consolidated Balance Sheets as of December 31, 2012 and 2011, (d) ourConsolidated Statements of Equity for the Years Ended December 31, 2012, 2011 and2010, (e) our Consolidated Statements of Cash Flows for the Years EndedDecember 31, 2012, 2011 and 2010 and (f) the Notes to such Consolidated FinancialStatements.
* Filed herewith.** The Company agrees to furnish supplementally to the Securities and Exchange Commission (“the
Commission”) a copy of any omitted schedule or exhibit to this agreement upon request by theCommission.
+ We have omitted portions of this exhibit which have been granted confidential treatment.‡ Management contract or compensatory plan or arrangement, or amendment thereto.
79

SIGNATURES
Pursuant to the requirements of Section 13 or 15(d) of the Securities Exchange Act of 1934, theregistrant has duly caused this report to be signed on its behalf by the undersigned, thereunto dulyauthorized.
ALERE INC.
Date: March 1, 2013 By: /s/ Ron Zwanziger
Ron ZwanzigerChairman, Chief Executive Officer and President
Pursuant to the requirements of the Securities Exchange Act of 1934, this report has been signedbelow by the following persons on behalf of the Registrant and in the capacities and on the datesindicated.
Signature Title Date
/s/ Ron Zwanziger
Ron Zwanziger
Chief Executive Officer, President andDirector (Principal Executive Officer)
March 1, 2013
/s/ David Teitel
David Teitel
Chief Financial Officer (Principal FinancialOfficer and Principal Accounting Officer)
March 1, 2013
/s/ Eli Y. Adashi
Eli Y. Adashi, MD
Director March 1, 2013
/s/ Carol R. Goldberg
Carol R. Goldberg
Director March 1, 2013
/s/ Robert P. Khederian
Robert P. Khederian
Director March 1, 2013
/s/ John F. Levy
John F. Levy
Director March 1, 2013
/s/ Jerry McAleer
Jerry McAleer
Director March 1, 2013
/s/ John A. Quelch
John A. Quelch
Director March 1, 2013
/s/ James Roosevelt, Jr.
James Roosevelt, Jr.
Director March 1, 2013
/s/ David Scott
David Scott
Director March 1, 2013
/s/ Peter Townsend
Peter Townsend
Director March 1, 2013
80

ALERE INC. AND SUBSIDIARIES
CONSOLIDATED FINANCIAL STATEMENTS
Table of Contents
Page
Report of Independent Registered Public Accounting Firm . . . . . . . . . . . . . . . . . . . . . . . . . . . . . . . . F-2Consolidated Statements of Operations for the Years Ended December 31, 2012, 2011 and
2010 . . . . . . . . . . . . . . . . . . . . . . . . . . . . . . . . . . . . . . . . . . . . . . . . . . . . . . . . . . . . . . . . . . . . . . . . . . F-3Consolidated Statements of Comprehensive Income (Loss) for the Years Ended
December 31, 2012, 2011 and 2010 . . . . . . . . . . . . . . . . . . . . . . . . . . . . . . . . . . . . . . . . . . . . . . . . F-4Consolidated Balance Sheets as of December 31, 2012 and 2011 . . . . . . . . . . . . . . . . . . . . . . . . . F-5Consolidated Statements of Equity for the Years Ended December 31, 2012, 2011 and 2010 . . . . F-6Consolidated Statements of Cash Flows for the Years Ended December 31, 2012, 2011 and
2010 . . . . . . . . . . . . . . . . . . . . . . . . . . . . . . . . . . . . . . . . . . . . . . . . . . . . . . . . . . . . . . . . . . . . . . . . . . F-9Notes to Consolidated Financial Statements . . . . . . . . . . . . . . . . . . . . . . . . . . . . . . . . . . . . . . . . . . . F-10
F-1

Report of Independent Registered Public Accounting Firm
To the Board of Directors and Stockholders of Alere Inc.,
In our opinion, the accompanying consolidated balance sheets and the related consolidated statementsof operations, of equity, of comprehensive income (loss) and of cash flows present fairly, in all materialrespects, the financial position of Alere Inc. and its subsidiaries at December 31, 2012 and December 31,2011, and the results of their operations and their cash flows for each of the three years in the period endedDecember 31, 2012 in conformity with accounting principles generally accepted in the United States ofAmerica. Also in our opinion, the Company maintained, in all material respects, effective internal control overfinancial reporting as of December 31, 2012, based on criteria established in Internal Control—IntegratedFramework issued by the Committee of Sponsoring Organizations of the Treadway Commission (COSO).The Company’s management is responsible for these financial statements, for maintaining effective internalcontrol over financial reporting and for its assessment of the effectiveness of internal control over financialreporting, included in Management’s Annual Report on Internal Control over Financial Reporting appearingunder Item 9A. Our responsibility is to express opinions on these financial statements and on the Company’sinternal control over financial reporting based on our integrated audits. We conducted our audits inaccordance with the standards of the Public Company Accounting Oversight Board (United States). Thosestandards require that we plan and perform the audits to obtain reasonable assurance about whether thefinancial statements are free of material misstatement and whether effective internal control over financialreporting was maintained in all material respects. Our audits of the financial statements included examining,on a test basis, evidence supporting the amounts and disclosures in the financial statements, assessing theaccounting principles used and significant estimates made by management, and evaluating the overallfinancial statement presentation. Our audit of internal control over financial reporting included obtaining anunderstanding of internal control over financial reporting, assessing the risk that a material weakness exists,and testing and evaluating the design and operating effectiveness of internal control based on the assessedrisk. Our audits also included performing such other procedures as we considered necessary in thecircumstances. We believe that our audits provide a reasonable basis for our opinions.
A company’s internal control over financial reporting is a process designed to provide reasonableassurance regarding the reliability of financial reporting and the preparation of financial statements forexternal purposes in accordance with generally accepted accounting principles. A company’s internal controlover financial reporting includes those policies and procedures that (i) pertain to the maintenance of recordsthat, in reasonable detail, accurately and fairly reflect the transactions and dispositions of the assets of thecompany; (ii) provide reasonable assurance that transactions are recorded as necessary to permitpreparation of financial statements in accordance with generally accepted accounting principles, and thatreceipts and expenditures of the company are being made only in accordance with authorizations ofmanagement and directors of the company; and (iii) provide reasonable assurance regarding prevention ortimely detection of unauthorized acquisition, use, or disposition of the company’s assets that could have amaterial effect on the financial statements.
Because of its inherent limitations, internal control over financial reporting may not prevent or detectmisstatements. Also, projections of any evaluation of effectiveness to future periods are subject to the riskthat controls may become inadequate because of changes in conditions, or that the degree of compliancewith the policies or procedures may deteriorate.
As described in Management’s Annual Report on Internal Control over Financial Reporting,management has excluded 14 entities from its assessment of internal control over financial reporting as ofDecember 31, 2012 because they were acquired by the Company in purchase business combinationsduring 2012. We have also excluded these entities from our audit of internal control over financial reporting.The total assets and net revenue of these entities represented 1% and 5%, respectively, of the relatedconsolidated financial statement amounts as of and for the year ended December 31, 2012.
/s/ PricewaterhouseCoopers LLP
Boston, MassachusettsMarch 1, 2013
F-2

ALERE INC. AND SUBSIDIARIES
CONSOLIDATED STATEMENTS OF OPERATIONS
(in thousands, except per share amounts)
Year Ended December 31,
2012 2011 2010
Net product sales . . . . . . . . . . . . . . . . . . . . . . . . . . . . . . . . . . . . . . . . . . . . . $1,913,731 $1,683,132 $ 1,472,403Services revenue . . . . . . . . . . . . . . . . . . . . . . . . . . . . . . . . . . . . . . . . . . . . . . 876,518 679,922 662,185
Net product sales and services revenue . . . . . . . . . . . . . . . . . . . . . . . . . 2,790,249 2,363,054 2,134,588License and royalty revenue . . . . . . . . . . . . . . . . . . . . . . . . . . . . . . . . . . . . 28,576 23,473 20,759
Net revenue . . . . . . . . . . . . . . . . . . . . . . . . . . . . . . . . . . . . . . . . . . . . . . 2,818,825 2,386,527 2,155,347
Cost of net product sales . . . . . . . . . . . . . . . . . . . . . . . . . . . . . . . . . . . . . . . 932,150 795,424 688,325Cost of services revenue . . . . . . . . . . . . . . . . . . . . . . . . . . . . . . . . . . . . . . . 450,999 338,232 325,286
Cost of net product sales and services revenue . . . . . . . . . . . . . . . . . . . 1,383,149 1,133,656 1,013,611Cost of license and royalty revenue . . . . . . . . . . . . . . . . . . . . . . . . . . . . . . . 7,354 7,036 7,149
Cost of net revenue . . . . . . . . . . . . . . . . . . . . . . . . . . . . . . . . . . . . . . . 1,390,503 1,140,692 1,020,760
Gross profit . . . . . . . . . . . . . . . . . . . . . . . . . . . . . . . . . . . . . . . . . . . . 1,428,322 1,245,835 1,134,587Operating expenses:
Research and development . . . . . . . . . . . . . . . . . . . . . . . . . . . . . . . . . 183,001 150,165 133,278Sales and marketing . . . . . . . . . . . . . . . . . . . . . . . . . . . . . . . . . . . . . . . 643,423 565,583 499,124General and administrative . . . . . . . . . . . . . . . . . . . . . . . . . . . . . . . . . . 492,766 399,330 446,917Goodwill impairment charge . . . . . . . . . . . . . . . . . . . . . . . . . . . . . . . . . — 383,612 1,006,357
Operating income (loss) . . . . . . . . . . . . . . . . . . . . . . . . . . . . . . . 109,132 (252,855) (951,089)Interest expense, including amortization of original issue discounts and
deferred financing costs . . . . . . . . . . . . . . . . . . . . . . . . . . . . . . . . . . . . . . (240,560) (203,971) (139,435)Other income (expense), net . . . . . . . . . . . . . . . . . . . . . . . . . . . . . . . . . . . . 9,957 1,883 22,738Gain on sale of joint venture interest . . . . . . . . . . . . . . . . . . . . . . . . . . . . . . — 288,896 —
Loss from continuing operations before benefit for incometaxes . . . . . . . . . . . . . . . . . . . . . . . . . . . . . . . . . . . . . . . . . . . . . . . . . . . . . (121,471) (166,047) (1,067,786)
Benefit for income taxes . . . . . . . . . . . . . . . . . . . . . . . . . . . . . . . . . . . . . . . . (30,319) (24,214) (29,931)
Loss from continuing operations before equity earnings ofunconsolidated entities, net of tax . . . . . . . . . . . . . . . . . . . . . . . . . . . . (91,152) (141,833) (1,037,855)
Equity earnings of unconsolidated entities, net of tax . . . . . . . . . . . . . . . . 13,245 8,524 10,566
Loss from continuing operations . . . . . . . . . . . . . . . . . . . . . . . . . . . . . . (77,907) (133,309) (1,027,289)Income from discontinued operations, net of tax . . . . . . . . . . . . . . . . — — 11,397
Net loss . . . . . . . . . . . . . . . . . . . . . . . . . . . . . . . . . . . . . . . . . . . . . . . . . . . . . (77,907) (133,309) (1,015,892)Less: Net income attributable to non-controlling interests . . . . . . . . . . . 275 233 1,418
Net loss attributable to Alere Inc. and Subsidiaries . . . . . . . . . . . . . . . (78,182) (133,542) (1,017,310)Preferred stock dividends . . . . . . . . . . . . . . . . . . . . . . . . . . . . . . . . . . . (21,293) (22,049) (24,235)Preferred stock repurchase . . . . . . . . . . . . . . . . . . . . . . . . . . . . . . . . . . — 23,936 —
Net loss available to common stockholders . . . . . . . . . . . . . . . . . $ (99,475) $ (131,655) $(1,041,545)
Basic and diluted net loss per common share attributable to Alere Inc.and Subsidiaries:
Loss from continuing operations . . . . . . . . . . . . . . . . . . . . . . . . . . . . . . $ (1.23) $ (1.58) $ (12.47)Income from discontinued operations . . . . . . . . . . . . . . . . . . . . . . . . . — — 0.14
Net loss per common share . . . . . . . . . . . . . . . . . . . . . . . . . . . . . . . $ (1.23) $ (1.58) $ (12.33)
Weighted-average shares — basic and diluted . . . . . . . . . . . . . . . . . . . 80,587 83,128 84,445
The accompanying notes are an integral part of these consolidated financial statements.
F-3

ALERE INC. AND SUBSIDIARIES
CONSOLIDATED STATEMENTS OF COMPREHENSIVE INCOME (LOSS)
(in thousands)
Year Ended December 31,
2012 2011 2010
Net loss . . . . . . . . . . . . . . . . . . . . . . . . . . . . . . . . . . . . . . . . . . . . . . . $(77,907) $(133,309) $(1,015,892)
Other comprehensive income (loss), before tax:Changes in cumulative translation adjustment . . . . . . . . . . . . . . 54,642 (35,830) (210)Unrealized gains (losses) on available for sale securities . . . . . (216) (471) 1,151Unrealized gains on hedging instruments . . . . . . . . . . . . . . . . . . 388 11,504 3,965Minimum pension liability adjustment . . . . . . . . . . . . . . . . . . . . . (1,042) (3,070) (113)
Other comprehensive income (loss), before tax . . . . . . . . . . . 53,772 (27,867) 4,793Income tax provision (benefit) related to items of other
comprehensive income (loss) . . . . . . . . . . . . . . . . . . . . . . . . (372) 3,093 1,649
Other comprehensive income (loss), net of tax . . . . . . . . . . 54,144 (30,960) 3,144
Comprehensive loss . . . . . . . . . . . . . . . . . . . . . . . . . . . . . . . . . . . (23,763) (164,269) (1,012,748)Less: Comprehensive income attributable to non-controlling
interests . . . . . . . . . . . . . . . . . . . . . . . . . . . . . . . . . . . . . . . . . . . . . 275 233 1,418
Comprehensive loss attributable to Alere Inc. andSubsidiaries . . . . . . . . . . . . . . . . . . . . . . . . . . . . . . . . . . . . . . . . . $(24,038) $(164,502) $(1,014,166)
The accompanying notes are an integral part of these consolidated financial statements.
F-4

ALERE INC. AND SUBSIDIARIES
CONSOLIDATED BALANCE SHEETS
(in thousands, except par value amounts)
As of December 31,
2012 2011
ASSETSCurrent assets:
Cash and cash equivalents . . . . . . . . . . . . . . . . . . . . . . . . . . . . . . . . . . . . . . . . . . . . . . . . . . . . . . . . . . $ 328,346 $ 299,173Restricted cash . . . . . . . . . . . . . . . . . . . . . . . . . . . . . . . . . . . . . . . . . . . . . . . . . . . . . . . . . . . . . . . . . . . . 3,076 8,987Marketable securities . . . . . . . . . . . . . . . . . . . . . . . . . . . . . . . . . . . . . . . . . . . . . . . . . . . . . . . . . . . . . . . 904 1,086Accounts receivable, net of allowances of $36,396 and $24,577 at December 31, 2012 and
December 31, 2011, respectively . . . . . . . . . . . . . . . . . . . . . . . . . . . . . . . . . . . . . . . . . . . . . . . . . . . 524,332 475,824Inventories, net . . . . . . . . . . . . . . . . . . . . . . . . . . . . . . . . . . . . . . . . . . . . . . . . . . . . . . . . . . . . . . . . . . . . 337,121 320,269Deferred tax assets . . . . . . . . . . . . . . . . . . . . . . . . . . . . . . . . . . . . . . . . . . . . . . . . . . . . . . . . . . . . . . . . . 67,722 42,975Prepaid expenses and other current assets . . . . . . . . . . . . . . . . . . . . . . . . . . . . . . . . . . . . . . . . . . . . . 145,236 145,413
Total current assets . . . . . . . . . . . . . . . . . . . . . . . . . . . . . . . . . . . . . . . . . . . . . . . . . . . . . . . . . . . . . 1,406,737 1,293,727Property, plant and equipment, net . . . . . . . . . . . . . . . . . . . . . . . . . . . . . . . . . . . . . . . . . . . . . . . . . . . . . . 534,469 491,205Goodwill . . . . . . . . . . . . . . . . . . . . . . . . . . . . . . . . . . . . . . . . . . . . . . . . . . . . . . . . . . . . . . . . . . . . . . . . . . . . 3,048,405 2,821,271Other intangible assets with indefinite lives . . . . . . . . . . . . . . . . . . . . . . . . . . . . . . . . . . . . . . . . . . . . . . . 36,451 69,546Finite-lived intangible assets, net . . . . . . . . . . . . . . . . . . . . . . . . . . . . . . . . . . . . . . . . . . . . . . . . . . . . . . . 1,834,225 1,785,925Deferred financing costs, net, and other non-current assets . . . . . . . . . . . . . . . . . . . . . . . . . . . . . . . . . 108,857 113,241Investments in unconsolidated entities . . . . . . . . . . . . . . . . . . . . . . . . . . . . . . . . . . . . . . . . . . . . . . . . . . . 90,491 85,138Marketable securities . . . . . . . . . . . . . . . . . . . . . . . . . . . . . . . . . . . . . . . . . . . . . . . . . . . . . . . . . . . . . . . . . — 2,254Deferred tax assets . . . . . . . . . . . . . . . . . . . . . . . . . . . . . . . . . . . . . . . . . . . . . . . . . . . . . . . . . . . . . . . . . . . 8,293 10,394
Total assets . . . . . . . . . . . . . . . . . . . . . . . . . . . . . . . . . . . . . . . . . . . . . . . . . . . . . . . . . . . . . . . . . . . . $ 7,067,928 $ 6,672,701
LIABILITIES AND EQUITYCurrent liabilities:
Current portion of long-term debt . . . . . . . . . . . . . . . . . . . . . . . . . . . . . . . . . . . . . . . . . . . . . . . . . . . . . . $ 60,232 $ 61,092Current portion of capital lease obligations . . . . . . . . . . . . . . . . . . . . . . . . . . . . . . . . . . . . . . . . . . . . . . 6,684 6,083Short-term debt . . . . . . . . . . . . . . . . . . . . . . . . . . . . . . . . . . . . . . . . . . . . . . . . . . . . . . . . . . . . . . . . . . . . — 6,240Accounts payable . . . . . . . . . . . . . . . . . . . . . . . . . . . . . . . . . . . . . . . . . . . . . . . . . . . . . . . . . . . . . . . . . . 169,974 155,464Accrued expenses and other current liabilities . . . . . . . . . . . . . . . . . . . . . . . . . . . . . . . . . . . . . . . . . . . 411,919 395,573
Total current liabilities . . . . . . . . . . . . . . . . . . . . . . . . . . . . . . . . . . . . . . . . . . . . . . . . . . . . . . . . . . . 648,809 624,452
Long-term liabilities:Long-term debt, net of current portion . . . . . . . . . . . . . . . . . . . . . . . . . . . . . . . . . . . . . . . . . . . . . . . . . . 3,628,675 3,267,451Capital lease obligations, net of current portion . . . . . . . . . . . . . . . . . . . . . . . . . . . . . . . . . . . . . . . . . . 12,917 12,629Deferred tax liabilities . . . . . . . . . . . . . . . . . . . . . . . . . . . . . . . . . . . . . . . . . . . . . . . . . . . . . . . . . . . . . . . 428,188 380,700Other long-term liabilities . . . . . . . . . . . . . . . . . . . . . . . . . . . . . . . . . . . . . . . . . . . . . . . . . . . . . . . . . . . . 166,635 153,398
Total long-term liabilities . . . . . . . . . . . . . . . . . . . . . . . . . . . . . . . . . . . . . . . . . . . . . . . . . . . . . . . . . 4,236,415 3,814,178
Commitments and contingencies (Notes 8, 9 and 11)Redeemable non-controlling interest . . . . . . . . . . . . . . . . . . . . . . . . . . . . . . . . . . . . . . . . . . . . . . . . . . — 2,497
Stockholders’ equity:Series B preferred stock, $0.001 par value (liquidation preference: $709,763 at December 31,
2012 and 2011); Authorized: 2,300 shares; Issued: 2,065 shares at December 31, 2012 and2011; Outstanding: 1,774 shares at December 31, 2012 and 2011 . . . . . . . . . . . . . . . . . . . . . . . . 606,468 606,468
Common stock, $0.001 par value; Authorized: 200,000 shares; Issued: 88,576 shares atDecember 31, 2012 and 87,647 shares at December 31, 2011; Outstanding: 80,897 shares atDecember 31, 2011 and 79,968 shares at December 31, 2011 . . . . . . . . . . . . . . . . . . . . . . . . . . . 89 88
Additional paid-in capital . . . . . . . . . . . . . . . . . . . . . . . . . . . . . . . . . . . . . . . . . . . . . . . . . . . . . . . . . . . . 3,299,935 3,324,710Accumulated deficit . . . . . . . . . . . . . . . . . . . . . . . . . . . . . . . . . . . . . . . . . . . . . . . . . . . . . . . . . . . . . . . . . (1,564,973) (1,486,791)Treasury stock, at cost, 7,679 shares at December 31, 2012 and 2011 . . . . . . . . . . . . . . . . . . . . . . (184,971) (184,971)Accumulated other comprehensive income (loss) . . . . . . . . . . . . . . . . . . . . . . . . . . . . . . . . . . . . . . . . 23,874 (30,270)
Total stockholders’ equity . . . . . . . . . . . . . . . . . . . . . . . . . . . . . . . . . . . . . . . . . . . . . . . . . . . . . . . . 2,180,422 2,229,234Non-controlling interests . . . . . . . . . . . . . . . . . . . . . . . . . . . . . . . . . . . . . . . . . . . . . . . . . . . . . . . . . . . . . 2,282 2,340
Total equity . . . . . . . . . . . . . . . . . . . . . . . . . . . . . . . . . . . . . . . . . . . . . . . . . . . . . . . . . . . . . . . . . . . . . 2,182,704 2,231,574
Total liabilities and equity . . . . . . . . . . . . . . . . . . . . . . . . . . . . . . . . . . . . . . . . . . . . . . . . . . . . . . $ 7,067,928 $ 6,672,701
The accompanying notes are an integral part of these consolidated financial statements.
F-5

ALEREINC.A
NDSUBSIDIARIES
CONSOLIDATEDSTATEMENTSOFEQUITY
(inthousa
nds)
CommonStock
Additional
Paid-in
Cap
ital
Acc
umulated
Deficit
Acc
umulated
Other
Compre-
hen
sive
Inco
me
(Loss
)
Treas
ury
Stock
,at
cost
Total
Stock
holders’
Equity
Non-
controlling
Interest
TotalE
quity
Red
eemab
leNon-
controlling
Interest
Preferred
Stock
Number
of
Shares
$0.001
Par
Value
Number
of
Shares
Amount
Number
of
Shares
Value
BA
LAN
CE
,DE
CE
MB
ER
31,2
009
....
....
1,98
4$6
94,4
2783
,567
$84
$3,1
95,4
76$
(359
,874
)$(
2,45
4)21
$(10
4)$
3,52
7,55
5$
1,33
4$
3,52
8,88
9$
—Is
suan
ceof
com
mon
stoc
kan
dw
arra
nts
inco
nnec
tion
with
acqu
isiti
ons
....
....
...
——
536
—16
,276
——
——
16,2
76—
16,2
76—
Exe
rcis
eof
com
mon
stoc
kop
tions
,w
arra
nts
and
shar
esis
sued
unde
rem
ploy
eest
ock
purc
hase
plan
....
....
.—
—82
51
19,0
24—
——
—19
,025
—19
,025
—P
refe
rred
stoc
kdi
vide
nds
....
....
....
...
107
24,1
27—
—(2
4,27
9)—
——
—(1
52)
—(1
52)
—F
orfe
iture
ofre
stric
ted
stoc
kaw
ards
....
..—
——
——
——
3—
——
——
Sto
ck-b
ased
com
pens
atio
nre
late
dto
gran
tsof
com
mon
stoc
kop
tions
....
....
——
——
29,8
79—
——
—29
,879
—29
,879
—E
xces
sta
xbe
nefit
son
exer
cise
dst
ock
optio
ns..
....
....
....
....
....
....
...
——
——
789
——
——
789
—78
9—
Min
imum
pens
ion
liabi
lity
adju
stm
ent,
neto
fta
x..
....
....
....
....
....
....
....
..—
——
——
—(1
13)
——
(113
)—
(113
)—
Cha
nges
incu
mul
ativ
etr
ansl
atio
nad
just
men
t,ne
toft
ax..
....
....
....
...
——
——
——
(210
)—
—(2
10)
—(2
10)
—U
nrea
lized
gain
onin
tere
stra
tesw
ap,
neto
ftax
....
....
....
....
....
....
...
——
——
——
2,42
3—
—2,
423
—2,
423
—U
nrea
lized
gain
onav
aila
ble-
for-
sale
secu
ritie
s,ne
toft
ax..
....
....
....
....
——
——
——
1,04
4—
—1,
044
—1,
044
—A
cqui
sitio
nof
non-
cont
rolli
ngin
tere
sts
....
.—
——
—(4
,168
)—
——
—(4
,168
)1,
251
(2,9
17)
(1,3
15)
Red
eem
able
non-
cont
rolli
ngin
tere
stin
subs
idia
ries’
inco
me
....
....
....
....
..—
——
——
——
——
—(1
,315
)(1
,315
)1,
315
Net
inco
me
(loss
)..
....
....
....
....
....
——
——
—(1
,017
,310
)—
——
(1,0
17,3
10)
1,41
8(1
,015
,892
)—
BA
LAN
CE
,DE
CE
MB
ER
31,2
010
....
....
2,09
1$7
18,5
5484
,928
$85
$3,2
32,9
97$(
1,37
7,18
4)$
690
24$(
104)
$2,
575,
038
$2,
688
$2,
577,
726
$—
F-6

ALEREINC.A
NDSUBSIDIARIES
CONSOLIDATEDSTATEMENTSOFEQUITY(C
ontinued
)
(inthousa
nds)
Preferred
Stock
CommonStock
Additional
Paid-in
Cap
ital
Acc
umulated
Deficit
Acc
umulated
Other
Compre-
hen
sive
Inco
me
(Loss
)
Treas
ury
Stock
,at
cost
Total
Stock
holders’
Equity
Non-
controlling
Interest
TotalE
quity
Red
eemab
leNon-
controlling
Interest
Number
of
Shares
$0.001
Par
Value
Number
of
Shares
Amount
Number
of
Shares
Value
BA
LAN
CE
,DE
CE
MB
ER
31,2
010
...
2,09
1$
718,
554
84,9
28$8
5$3
,232
,997
$(1,
377,
184)
$69
024
$(1
04)
$2,5
75,0
38$
2,68
8$2
,577
,726
$—
Issu
ance
ofco
mm
onst
ock
inco
nnec
tion
with
acqu
isiti
ons
....
...
——
832
116
,183
——
——
16,1
84—
16,1
84—
Exe
rcis
eof
com
mon
stoc
kop
tions
,w
arra
nts
and
shar
esis
sued
unde
rem
ploy
eest
ock
purc
hase
plan
....
——
1,88
72
37,8
85—
——
—37
,887
—37
,887
—R
epur
chas
eof
com
mon
stoc
k..
....
.—
——
——
——
7,65
5(1
84,8
67)
(184
,867
)—
(184
,867
)—
Rep
urch
ase
ofpr
efer
red
stoc
k..
....
(358
)(1
23,0
05)
——
—23
,935
——
—(9
9,07
0)—
(99,
070)
—P
refe
rred
stoc
kdi
vide
nds
....
....
...
4110
,919
——
(21,
632)
——
——
(10,
713)
—(1
0,71
3)—
Sto
ck-b
ased
com
pens
atio
nre
late
dto
gran
tsof
com
mon
stoc
kop
tions
...
——
——
21,2
15—
——
—21
,215
—21
,215
—E
xces
sta
xbe
nefit
son
exer
cise
dst
ock
optio
ns..
....
....
....
....
.—
——
—3,
423
——
——
3,42
3—
3,42
3—
Min
imum
pens
ion
liabi
lity
adju
stm
ent,
neto
ftax
....
....
....
....
....
..—
——
——
—(1
,618
)—
—(1
,618
)—
(1,6
18)
—C
hang
esin
cum
ulat
ive
tran
slat
ion
adju
stm
ent,
neto
ftax
....
....
....
——
——
——
(35,
830)
——
(35,
830)
—(3
5,83
0)—
Unr
ealiz
edga
inon
hedg
ing
inst
rum
ents
,net
ofta
x..
....
....
.—
——
—(2
97)
—6,
855
——
6,55
8—
6,55
8—
Unr
ealiz
edlo
sson
avai
labl
e-fo
r-sa
lese
curit
ies,
neto
ftax
....
....
....
.—
——
——
—(3
67)
——
(367
)—
(367
)—
Acq
uisi
tion
ofno
n-co
ntro
lling
inte
rest
s..
....
....
....
....
....
.—
——
——
——
——
—34
,936
34,9
36—
Pur
chas
eof
subs
idia
rysh
ares
from
non-
cont
rolli
ngin
tere
st..
....
....
.—
——
—34
,936
——
——
34,9
36(3
4,93
6)—
2,50
0D
ivid
end
rela
ting
tono
n-co
ntro
lling
inte
rest
....
....
....
....
....
....
——
——
——
——
——
(584
)(5
84)
—R
edee
mab
leno
n-co
ntro
lling
inte
rest
insu
bsid
iarie
s’in
com
e..
....
....
.—
——
——
——
——
—3
3(3
)N
etin
com
e(lo
ss)
....
....
....
....
.—
——
——
(133
,542
)—
——
(133
,542
)23
3(1
33,3
09)
—
BA
LAN
CE
,DE
CE
MB
ER
31,2
011
...
1,77
4$
606,
468
87,6
47$8
8$3
,324
,710
$(1,
486,
791)
$(30
,270
)7,
679
$(18
4,97
1)$2
,229
,234
$2,
340
$2,2
31,5
74$2
,497
F-7

ALEREINC.A
NDSUBSIDIARIES
CONSOLIDATEDSTATEMENTSOFEQUITY(C
ontinued
)
(inthousa
nds)
Preferred
Stock
CommonStock
Additional
Paid-in
Cap
ital
Acc
umulated
Deficit
Acc
umulated
Other
Compre-
hen
sive
Inco
me
(Loss
)
Treas
ury
Stock
,at
cost
Total
Stock
holders’
Equity
Non-
controlling
Interest
TotalE
quity
Red
eemab
leNon-
controlling
Interest
Number
of
Shares
$0.001
Par
Value
Number
of
Shares
Amount
Number
of
Shares
Value
BA
LAN
CE
,DE
CE
MB
ER
31,2
011
....
....
...
1,77
4$6
06,4
6887
,647
$88
$3,3
24,7
10$(
1,48
6,79
1)$(
30,2
70)
7,67
9$(
184,
971)
$2,2
29,2
34$2
,340
$2,2
31,5
74$
2,49
7E
xerc
ise
ofco
mm
onst
ock
optio
ns,w
arra
nts
and
shar
esis
sued
unde
rem
ploy
eest
ock
purc
hase
plan
....
....
....
....
....
....
..—
—86
21
14,9
23—
——
—14
,924
—14
,924
—Is
suan
ceof
com
mon
stoc
kfo
rse
ttlem
ento
fan
acqu
isiti
on-r
elat
edco
ntin
gent
cons
ider
atio
nob
ligat
ion
....
....
....
....
....
....
....
..—
—67
—1,
243
——
——
1,24
3—
1,24
3—
Pre
ferr
edst
ock
divi
dend
s..
....
....
....
....
——
——
(21,
293)
——
——
(21,
293)
—(2
1,29
3)—
Sto
ck-b
ased
com
pens
atio
nre
late
dto
gran
tsof
com
mon
stoc
kop
tions
....
....
....
....
...
——
——
15,6
65—
——
—15
,665
—15
,665
—E
xces
sta
xbe
nefit
son
exer
cise
dst
ock
optio
ns..
....
....
....
....
....
....
....
..—
——
—(2
34)
——
——
(234
)—
(234
)—
Min
imum
pens
ion
liabi
lity
adju
stm
ent,
neto
fta
x..
....
....
....
....
....
....
....
....
..—
——
——
—(7
56)
——
(756
)—
(756
)—
Cha
nges
incu
mul
ativ
etr
ansl
atio
nad
just
men
t,ne
toft
ax..
....
....
....
....
....
....
....
——
——
——
54,6
42—
—54
,642
—54
,642
—U
nrea
lized
gain
onhe
dgin
gin
stru
men
ts,n
etof
tax
....
....
....
....
....
....
....
....
....
——
——
——
388
——
388
—38
8—
Unr
ealiz
edlo
sson
avai
labl
e-fo
r-sa
lese
curit
ies,
neto
ftax
....
....
....
....
....
....
....
..—
——
——
—(1
30)
——
(130
)—
(130
)—
Pur
chas
eof
subs
idia
rysh
ares
from
non-
cont
rolli
ngin
tere
st(N
ote
5)..
....
....
....
.—
——
—(3
5,07
9)—
——
—(3
5,07
9)—
(35,
079)
(2,4
33)
Div
iden
dre
latin
gto
non-
cont
rolli
ngin
tere
st..
..—
——
——
——
——
—(3
96)
(396
)—
Net
inco
me
(loss
)..
....
....
....
....
....
...
——
——
—(7
8,18
2)—
——
(78,
182)
338
(77,
844)
(64)
BA
LAN
CE
,DE
CE
MB
ER
31,2
012
....
....
...
1,77
4$6
06,4
6888
,576
$89
$3,2
99,9
35$(
1,56
4,97
3)$
23,8
747,
679
$(18
4,97
1)$2
,180
,422
$2,2
82$2
,182
,704
$—
F-8
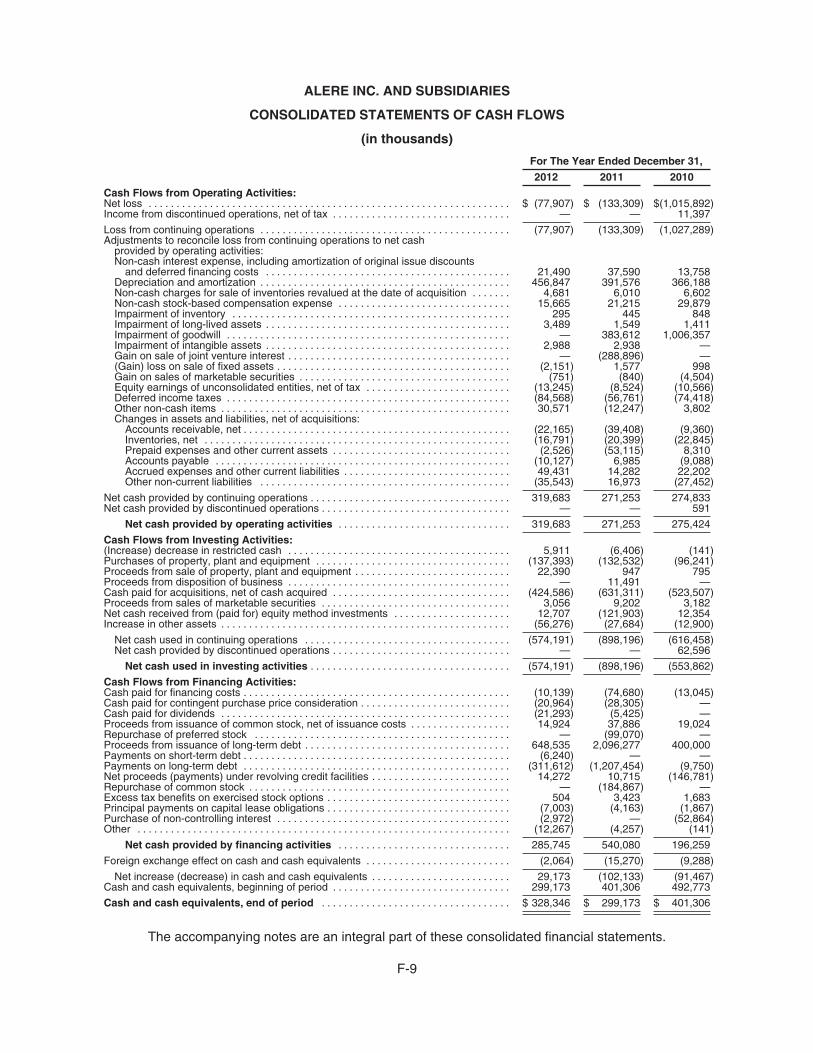
ALERE INC. AND SUBSIDIARIES
CONSOLIDATED STATEMENTS OF CASH FLOWS
(in thousands)
For The Year Ended December 31,
2012 2011 2010Cash Flows from Operating Activities:Net loss . . . . . . . . . . . . . . . . . . . . . . . . . . . . . . . . . . . . . . . . . . . . . . . . . . . . . . . . . . . . . . . . . $ (77,907) $ (133,309) $(1,015,892)Income from discontinued operations, net of tax . . . . . . . . . . . . . . . . . . . . . . . . . . . . . . . . — — 11,397
Loss from continuing operations . . . . . . . . . . . . . . . . . . . . . . . . . . . . . . . . . . . . . . . . . . . . . (77,907) (133,309) (1,027,289)Adjustments to reconcile loss from continuing operations to net cash
provided by operating activities:Non-cash interest expense, including amortization of original issue discounts
and deferred financing costs . . . . . . . . . . . . . . . . . . . . . . . . . . . . . . . . . . . . . . . . . . . . 21,490 37,590 13,758Depreciation and amortization . . . . . . . . . . . . . . . . . . . . . . . . . . . . . . . . . . . . . . . . . . . . . 456,847 391,576 366,188Non-cash charges for sale of inventories revalued at the date of acquisition . . . . . . . 4,681 6,010 6,602Non-cash stock-based compensation expense . . . . . . . . . . . . . . . . . . . . . . . . . . . . . . . 15,665 21,215 29,879Impairment of inventory . . . . . . . . . . . . . . . . . . . . . . . . . . . . . . . . . . . . . . . . . . . . . . . . . . 295 445 848Impairment of long-lived assets . . . . . . . . . . . . . . . . . . . . . . . . . . . . . . . . . . . . . . . . . . . . 3,489 1,549 1,411Impairment of goodwill . . . . . . . . . . . . . . . . . . . . . . . . . . . . . . . . . . . . . . . . . . . . . . . . . . . — 383,612 1,006,357Impairment of intangible assets . . . . . . . . . . . . . . . . . . . . . . . . . . . . . . . . . . . . . . . . . . . . 2,988 2,938 —Gain on sale of joint venture interest . . . . . . . . . . . . . . . . . . . . . . . . . . . . . . . . . . . . . . . . — (288,896) —(Gain) loss on sale of fixed assets . . . . . . . . . . . . . . . . . . . . . . . . . . . . . . . . . . . . . . . . . . (2,151) 1,577 998Gain on sales of marketable securities . . . . . . . . . . . . . . . . . . . . . . . . . . . . . . . . . . . . . . (751) (840) (4,504)Equity earnings of unconsolidated entities, net of tax . . . . . . . . . . . . . . . . . . . . . . . . . . (13,245) (8,524) (10,566)Deferred income taxes . . . . . . . . . . . . . . . . . . . . . . . . . . . . . . . . . . . . . . . . . . . . . . . . . . . (84,568) (56,761) (74,418)Other non-cash items . . . . . . . . . . . . . . . . . . . . . . . . . . . . . . . . . . . . . . . . . . . . . . . . . . . . 30,571 (12,247) 3,802Changes in assets and liabilities, net of acquisitions:
Accounts receivable, net . . . . . . . . . . . . . . . . . . . . . . . . . . . . . . . . . . . . . . . . . . . . . . . . (22,165) (39,408) (9,360)Inventories, net . . . . . . . . . . . . . . . . . . . . . . . . . . . . . . . . . . . . . . . . . . . . . . . . . . . . . . . (16,791) (20,399) (22,845)Prepaid expenses and other current assets . . . . . . . . . . . . . . . . . . . . . . . . . . . . . . . . (2,526) (53,115) 8,310Accounts payable . . . . . . . . . . . . . . . . . . . . . . . . . . . . . . . . . . . . . . . . . . . . . . . . . . . . . (10,127) 6,985 (9,088)Accrued expenses and other current liabilities . . . . . . . . . . . . . . . . . . . . . . . . . . . . . . 49,431 14,282 22,202Other non-current liabilities . . . . . . . . . . . . . . . . . . . . . . . . . . . . . . . . . . . . . . . . . . . . . (35,543) 16,973 (27,452)
Net cash provided by continuing operations . . . . . . . . . . . . . . . . . . . . . . . . . . . . . . . . . . . . 319,683 271,253 274,833Net cash provided by discontinued operations . . . . . . . . . . . . . . . . . . . . . . . . . . . . . . . . . . — — 591
Net cash provided by operating activities . . . . . . . . . . . . . . . . . . . . . . . . . . . . . . . 319,683 271,253 275,424
Cash Flows from Investing Activities:(Increase) decrease in restricted cash . . . . . . . . . . . . . . . . . . . . . . . . . . . . . . . . . . . . . . . . 5,911 (6,406) (141)Purchases of property, plant and equipment . . . . . . . . . . . . . . . . . . . . . . . . . . . . . . . . . . . (137,393) (132,532) (96,241)Proceeds from sale of property, plant and equipment . . . . . . . . . . . . . . . . . . . . . . . . . . . . 22,390 947 795Proceeds from disposition of business . . . . . . . . . . . . . . . . . . . . . . . . . . . . . . . . . . . . . . . . — 11,491 —Cash paid for acquisitions, net of cash acquired . . . . . . . . . . . . . . . . . . . . . . . . . . . . . . . . (424,586) (631,311) (523,507)Proceeds from sales of marketable securities . . . . . . . . . . . . . . . . . . . . . . . . . . . . . . . . . . 3,056 9,202 3,182Net cash received from (paid for) equity method investments . . . . . . . . . . . . . . . . . . . . . 12,707 (121,903) 12,354Increase in other assets . . . . . . . . . . . . . . . . . . . . . . . . . . . . . . . . . . . . . . . . . . . . . . . . . . . . (56,276) (27,684) (12,900)
Net cash used in continuing operations . . . . . . . . . . . . . . . . . . . . . . . . . . . . . . . . . . . . . (574,191) (898,196) (616,458)Net cash provided by discontinued operations . . . . . . . . . . . . . . . . . . . . . . . . . . . . . . . . — — 62,596
Net cash used in investing activities . . . . . . . . . . . . . . . . . . . . . . . . . . . . . . . . . . . . (574,191) (898,196) (553,862)
Cash Flows from Financing Activities:Cash paid for financing costs . . . . . . . . . . . . . . . . . . . . . . . . . . . . . . . . . . . . . . . . . . . . . . . . (10,139) (74,680) (13,045)Cash paid for contingent purchase price consideration . . . . . . . . . . . . . . . . . . . . . . . . . . . (20,964) (28,305) —Cash paid for dividends . . . . . . . . . . . . . . . . . . . . . . . . . . . . . . . . . . . . . . . . . . . . . . . . . . . . (21,293) (5,425) —Proceeds from issuance of common stock, net of issuance costs . . . . . . . . . . . . . . . . . . 14,924 37,886 19,024Repurchase of preferred stock . . . . . . . . . . . . . . . . . . . . . . . . . . . . . . . . . . . . . . . . . . . . . . — (99,070) —Proceeds from issuance of long-term debt . . . . . . . . . . . . . . . . . . . . . . . . . . . . . . . . . . . . . 648,535 2,096,277 400,000Payments on short-term debt . . . . . . . . . . . . . . . . . . . . . . . . . . . . . . . . . . . . . . . . . . . . . . . . (6,240) — —Payments on long-term debt . . . . . . . . . . . . . . . . . . . . . . . . . . . . . . . . . . . . . . . . . . . . . . . . (311,612) (1,207,454) (9,750)Net proceeds (payments) under revolving credit facilities . . . . . . . . . . . . . . . . . . . . . . . . . 14,272 10,715 (146,781)Repurchase of common stock . . . . . . . . . . . . . . . . . . . . . . . . . . . . . . . . . . . . . . . . . . . . . . . — (184,867) —Excess tax benefits on exercised stock options . . . . . . . . . . . . . . . . . . . . . . . . . . . . . . . . . 504 3,423 1,683Principal payments on capital lease obligations . . . . . . . . . . . . . . . . . . . . . . . . . . . . . . . . . (7,003) (4,163) (1,867)Purchase of non-controlling interest . . . . . . . . . . . . . . . . . . . . . . . . . . . . . . . . . . . . . . . . . . (2,972) — (52,864)Other . . . . . . . . . . . . . . . . . . . . . . . . . . . . . . . . . . . . . . . . . . . . . . . . . . . . . . . . . . . . . . . . . . . (12,267) (4,257) (141)
Net cash provided by financing activities . . . . . . . . . . . . . . . . . . . . . . . . . . . . . . . 285,745 540,080 196,259
Foreign exchange effect on cash and cash equivalents . . . . . . . . . . . . . . . . . . . . . . . . . . (2,064) (15,270) (9,288)
Net increase (decrease) in cash and cash equivalents . . . . . . . . . . . . . . . . . . . . . . . . . 29,173 (102,133) (91,467)Cash and cash equivalents, beginning of period . . . . . . . . . . . . . . . . . . . . . . . . . . . . . . . . 299,173 401,306 492,773
Cash and cash equivalents, end of period . . . . . . . . . . . . . . . . . . . . . . . . . . . . . . . . . . $ 328,346 $ 299,173 $ 401,306
The accompanying notes are an integral part of these consolidated financial statements.
F-9

ALERE INC. AND SUBSIDIARIES
NOTES TO CONSOLIDATED FINANCIAL STATEMENTS
(1) Description of Business and Basis of Presentation
Alere Inc. enables individuals to take greater control of their health at home, under the supervisionof their healthcare providers, by combining near-patient diagnostics, health monitoring capabilities, andinformation technology solutions. A leading global provider of point-of-care diagnostics and services,we have developed a strong commercial presence in cardiology, infectious disease, toxicology, anddiabetes.
Our business is organized into three operating segments: (i) professional diagnostics, (ii) healthinformation solutions (formerly health management) and (iii) consumer diagnostics. The professionaldiagnostics segment includes an array of innovative rapid diagnostic test products and other in vitrodiagnostic tests marketed to medical professionals and laboratories for detection of diseases andconditions within our areas of focus identified above. The health information solutions segment providescomprehensive, integrated programs and services focused on wellness, disease and conditionmanagement, productivity enhancement and informatics, all designed to reduce health-related costs andenhance the health and quality of life of the individuals we serve. The consumer diagnostics segmentconsists primarily of manufacturing operations related to our role as the exclusive manufacturer ofproducts for SPD Swiss Precision Diagnostics, or SPD, our 50/50 joint venture with The Procter &Gamble Company, or P&G. SPD has significant operations in the worldwide over-the-counter pregnancyand fertility/ovulation test market.
Acquisitions have been an important part of our growth strategy. When we acquire businesses, weseek to complement existing products and services, enhance or expand our product lines and/orexpand our customer base. We determine what we are willing to pay for each acquisition partiallybased upon our expectation that we can cost effectively integrate the products and services of theacquired companies into our existing infrastructure. In addition, we utilize existing infrastructure of theacquired companies to cost effectively introduce our products to new geographic areas. All of thesefactors contributed to the acquisition prices of acquired businesses that were in excess of the fair valueof net assets acquired, resulting in goodwill (Note 4).
The consolidated financial statements include the accounts of Alere Inc. and its subsidiaries.Intercompany transactions and balances are eliminated and net earnings are reduced by the portion ofthe net earnings of subsidiaries applicable to non-controlling interests. Equity investments in which weexercise significant influence but do not control and are not the primary beneficiary are accounted forusing the equity method. Investments in which we are not able to exercise significant influence over theinvestee and which do not have readily determinable fair values are accounted for under the costmethod.
Certain amounts for prior periods have been reclassified to conform to the current periodclassification.
(2) Summary of Significant Accounting Policies
(a) Use of Estimates
To prepare our financial statements in conformity with accounting principles generally accepted inthe United States of America, our management must make estimates, judgments and assumptions thatmay affect the reported amounts of assets and liabilities, disclosure of contingent assets and liabilitiesat the date of the financial statements and the reported amounts of revenue and expenses during thereporting period. Actual results could differ significantly from such estimates under differentassumptions or conditions.
F-10

ALERE INC. AND SUBSIDIARIES
NOTES TO CONSOLIDATED FINANCIAL STATEMENTS (Continued)
(2) Summary of Significant Accounting Policies (Continued)
(b) Foreign Currencies
In general, the functional currencies of our foreign subsidiaries are the local currencies. For thepurpose of consolidating the financial statements of our foreign subsidiaries, all assets and liabilities ofthe foreign subsidiaries are translated into U.S. dollars using the exchange rate at each balance sheetdate, while the stockholders’ equity accounts are translated at historical exchange rates. Translationgains and losses that result from the conversion of the balance sheets of the foreign subsidiaries intoU.S. dollars are recorded to cumulative translation adjustment, which is a component of accumulatedother comprehensive income (loss) (Note 15) within stockholders’ equity. The revenue and expensesof our foreign subsidiaries are translated using the average of the rates of exchange in effect duringeach fiscal month.
Net realized and unrealized foreign currency exchange transaction losses of $7.9 million and$22.9 million during 2012 and 2011, respectively, and gains of $9.8 million during 2010 are included asa component of other income (expense), net in the accompanying consolidated statements ofoperations.
(c) Cash and Cash Equivalents
We consider all highly-liquid investments purchased with original maturities of three months or lessat the date of acquisition to be cash equivalents. Cash equivalents consisted of money market funds atDecember 31, 2012 and 2011.
(d) Restricted Cash
We had restricted cash of $3.1 million and $9.0 million as of December 31, 2012 and 2011,respectively. Of the $9.0 million as of December 31, 2011, approximately $5.3 million was for thepurchase of the remaining outstanding shares of Axis-Shield plc, or Axis-Shield, which were acquiredprior to December 31, 2011, but settled in the first quarter of 2012.
(e) Marketable Securities
Securities classified as available-for-sale or trading are carried at fair value, as determined byquoted market prices at the balance sheet date. Realized gains and losses on securities are includedin other income (expense), net, on a specific identification basis. Unrealized holding gains and losses(except for other than temporary impairments) on securities classified as available-for-sale, arereported in accumulated other comprehensive income, net of related tax effects. Marketable securitiesthat are held indefinitely are classified in our accompanying consolidated balance sheets as long-termmarketable securities.
(f) Inventories
Inventories are stated at the lower of cost (first-in, first-out) or market and are made up of rawmaterial, work-in-process and finished goods. The cost elements of work-in-process and finishedgoods inventory consist of raw material, direct labor and manufacturing overhead. Where finishedgoods inventory is purchased from third-party manufacturers, the costs of finished goods inventoryrecorded in the financial statements represent the costs to acquire such inventory.
F-11

ALERE INC. AND SUBSIDIARIES
NOTES TO CONSOLIDATED FINANCIAL STATEMENTS (Continued)
(2) Summary of Significant Accounting Policies (Continued)
(g) Property, Plant and Equipment
We record property, plant and equipment at historical cost or, in the case of a businesscombination, at fair value on the date of the business combination. Depreciation is computed using thestraight-line method based on the following estimated useful lives of the related assets: machinery,laboratory equipment and tooling, 1-15 years; buildings, 7-61 years; leasehold improvements, lesser ofthe remaining term of the lease or estimated useful life of the asset; computer software and equipment,1-7 years and furniture and fixtures, 2-16 years. Land is not depreciated. Depreciation expense relatedto property, plant and equipment amounted to $109.7 million, $83.7 million and $67.7 million in 2012,2011 and 2010, respectively. Fully-depreciated property, plant and equipment that are still in useremain on the books until disposal or retirement. When property, plant and equipment are retired ordisposed of, the cost and respective accumulated depreciation are removed from the books. Any gainor loss on disposal is recorded in the income statement. Expenditures for repairs and maintenance areexpensed as incurred.
(h) Goodwill and Other Intangible Assets with Indefinite Lives
Goodwill relates to amounts that arose in connection with our various business combinations andrepresents the difference between the purchase price and the fair value of the identifiable tangible andintangible net assets when accounted for using the acquisition method of accounting. Goodwill is notamortized, but is subject to periodic review for impairment.
We test goodwill and other intangible assets with indefinite lives at the reporting unit level forimpairment on an annual basis, and between annual tests, if events and circumstances indicate it ismore likely than not that the fair value of a reporting unit is less than its carrying value. Events thatwould indicate impairment and trigger an interim impairment assessment include, but are not limited to,current economic and market conditions, including a decline in market capitalization, a significantadverse change in legal factors, business climate or operational performance of the business and anadverse action or assessment by a regulator.
In performing the impairment test, we utilize the two-step approach. The first step, or Step 1,requires a comparison of the carrying value of each reporting unit to its estimated fair value. Toestimate the fair value of our reporting units for Step 1, we use a combination of the income approachand the market approach. The income approach is based on a discounted cash flow analysis, or DCF,and calculates the fair value by estimating the after-tax cash flows attributable to a reporting unit andthen discounting the after-tax cash flows to a present value, using a risk-adjusted discount rate.Assumptions used in the DCF require the exercise of significant judgment, including judgment aboutappropriate discount rates and terminal values, growth rates and the amount and timing of expectedfuture cash flows. The forecasted cash flows are based on our most recent budget and for yearsbeyond the budget, our estimates are based on assumed growth rates. We believe our assumptionsare consistent with the plans and estimates used to manage the underlying businesses. The discountrates, which are intended to reflect the risks inherent in future cash flow projections, used in the DCFare based on estimates of the weighted-average cost of capital, or WACC, of market participantsrelative to each respective reporting unit. The market approach considers comparable market databased on multiples of revenue or earnings before interest, taxes, depreciation and amortization, orEBITDA.
If the carrying value of a reporting unit exceeds its estimated fair value, we are required to performthe second step, or Step 2, of the goodwill impairment test to measure the amount of impairment loss,
F-12

ALERE INC. AND SUBSIDIARIES
NOTES TO CONSOLIDATED FINANCIAL STATEMENTS (Continued)
(2) Summary of Significant Accounting Policies (Continued)
if any. The second step of the goodwill impairment test compares the implied fair value of a reportingunit’s goodwill to its carrying value. The implied fair value of goodwill is calculated as the differencebetween the fair value of the reporting unit and the estimated fair value of its assets and liabilities. Tothe extent this amount is below the carrying value of goodwill, an impairment charge is recorded.
The estimate of fair value requires significant judgment. We based our fair value estimates onassumptions that we believe to be reasonable but that are unpredictable and inherently uncertain,including estimates of future growth rates and operating margins and assumptions about the overalleconomic climate and the competitive environment for our business units. There can be no assurancethat our estimates and assumptions made for purposes of our goodwill and identifiable intangible assettesting as of the time of testing will prove to be accurate predictions of the future. If our assumptionsregarding business plans, competitive environment or anticipated growth rates are not correct, we maybe required to record goodwill and/or intangible asset impairment charges in future periods, whether inconnection with our next annual impairment testing or earlier, if an indicator of an impairment is presentbefore our next annual evaluation.
Impairment charges related to goodwill have no impact on our cash balances or on compliancewith financial covenants under our Amended and Restated Credit Agreement.
2012 Annual Goodwill Impairment Test
We conducted our 2012 annual impairment test for our reporting units during the fourth quarter of2012. Key assumptions (which vary by reporting unit) used in determining fair value under thediscounted cash flow approach included discount rates ranging from 11.0% to 15.0%, projectedcompound average revenue growth rates of 3.0% to 8.1% and terminal value growth rates of 3.0% to4.0%. In determining the appropriate discount rate, we considered the WACC for each reporting unit,which among other factors considers the cost of common equity capital and the marginal cost of debtof market participants. Key assumptions (which again vary by reporting unit) used in determining fairvalue under the market approach were based on observed market multiples of enterprise value torevenue and EBITDA for both comparable publicly-traded companies and recent merger andacquisition transactions involving similar companies to estimate appropriate controlling basis multiplesto apply to each of the reporting units. Based on the multiples implied by this market data, we selectedmultiples of revenue of 0.9 to 2.4 times and multiples of EBITDA of 6.1 to 8.9 times. In assessing thereasonableness of our estimated fair values of the reporting units, management compared the resultsof the valuation analyses against our then-current market capitalization to imply a control premium.Based on this analysis, the implied control premium was within the range of comparable industrytransactions.
The Step 1 impairment analysis indicated the estimated fair value of the professional diagnostics,health information solutions and consumer diagnostics reporting units exceeded the carrying value oftheir reporting unit’s net assets by 7.9%, 9.4% and 27.2%, respectively.
2011 Annual Goodwill Impairment Test
We conducted our 2011 annual impairment test for our reporting units during the fourth quarter of2011. Key assumptions (which vary by reporting unit) used in determining fair value under the discountedcash flow approach included discount rates ranging from 11.0% to 14.5%, projected compound averagerevenue growth rates of 4.9% to 10.0% and terminal value growth rates of 4.0%. In determining theappropriate discount rate, we considered the WACC for each reporting unit, which, among other factors,
F-13

ALERE INC. AND SUBSIDIARIES
NOTES TO CONSOLIDATED FINANCIAL STATEMENTS (Continued)
(2) Summary of Significant Accounting Policies (Continued)
considers the cost of common equity capital and the marginal cost of debt of market participants. Keyassumptions (which again vary by reporting unit) used in determining fair value under the marketapproach were based on observed market multiples of enterprise value to revenue and EBITDA for bothcomparable publicly-traded companies and recent merger and acquisition transactions involving similarcompanies to estimate appropriate controlling basis multiples to apply to each of the reporting units.Based on the multiples implied by this market data, we selected multiples of revenue of 0.8 to 2.6 timesand multiples of EBITDA of 5.6 to 9.3 times. In assessing the reasonableness of our estimated fair valuesof the reporting units, management compared the results of the valuation analyses against our then-current market capitalization to imply a control premium. Based on this analysis, the implied controlpremium was within the range of comparable industry transactions.
The Step 1 impairment analysis indicated that the carrying value of the net assets of our healthinformation solutions reporting unit exceeded the estimated fair value of the reporting unit. As a result,we were required to perform Step 2 of the goodwill impairment test to determine the amount, if any, ofgoodwill impairment charges for the health information solutions reporting unit. We completed Step 2,consistent with the procedures described above, and determined that a goodwill impairment charge inthe amount of approximately $383.6 million was required. The resulting goodwill impairment charge isreflected in operating income (loss) in our accompanying consolidated statements of operations.
This impairment was primarily driven by reduced future cash flow expectations from the reportingunit principally as a result of an increasingly competitive business environment for services provided bythe reporting unit, including the insourcing of certain services by key customers and a reduction inspending by other customers as a result in part of the continuing difficult economic climate. Alsocontributing to the impairment charge was the lower valuations ascribed to similar comparablebusinesses in the public markets.
2010 Annual Goodwill Impairment Test
We conducted our 2010 annual impairment test for our reporting units during the fourth quarter of2010. Key assumptions (which vary by reporting unit) used in determining fair value under the discountedcash flow approach included discount rates ranging from 12.5% to 13.0%, projected compound averagerevenue growth rates of 6.0% to 10.0% and terminal value growth rates of 4.0%. In determining theappropriate discount rate, we considered the WACC for each reporting unit, which, among other factors,considers the cost of common equity capital and the marginal cost of debt of market participants. Keyassumptions (which again vary by reporting unit) used in determining fair value under the marketapproach were based on observed market multiples of enterprise value to revenue and EBITDA for bothcomparable publicly-traded companies and recent merger and acquisition transactions involving similarcompanies to estimate appropriate controlling basis multiples to apply to each of the reporting units.Based on the multiples implied by this market data, we selected multiples of revenue of 1.0 to 2.8 timesand multiples of EBITDA of 7.5 to 10.0 times. In assessing the reasonableness of our estimated fairvalues of the reporting units, management compared the results of the valuation analyses against ourthen-current market capitalization to imply a control premium. Based on this analysis, the implied controlpremium was within the range of comparable industry transactions.
The Step 1 impairment analysis indicated that the carrying value of the net assets of our healthinformation solutions reporting unit exceeded the estimated fair value of the reporting unit. As a result,we were required to perform Step 2 of the goodwill impairment test to determine the amount, if any, ofgoodwill impairment charges for the health information solutions reporting unit. We completed Step 2,consistent with the procedures described above, and determined that a goodwill impairment charge in
F-14

ALERE INC. AND SUBSIDIARIES
NOTES TO CONSOLIDATED FINANCIAL STATEMENTS (Continued)
(2) Summary of Significant Accounting Policies (Continued)
the amount of approximately $1.0 billion was required. The resulting goodwill impairment charge isreflected in operating income (loss) in our accompanying consolidated statements of operations.
This impairment was primarily driven by reduced future cash flow expectations from the reportingunit principally as a result of an increasingly competitive business environment for services provided bythe reporting unit, including the insourcing of certain services by key customers and a reduction inspending by other customers as a result in part of the continuing difficult economic climate. Alsocontributing to the impairment charge was the lower valuations ascribed to similar comparablebusinesses in the public markets.
(i) Impairment of Other Long-Lived Tangible and Intangible Assets
Our intangible assets consist primarily of core technology, in-process research and development,patents, trademarks, trade names, customer relationships, distribution rights and non-competitionagreements. The majority of our intangible assets were recorded in connection with our variousbusiness combinations. Our intangible assets are recorded at fair value at the time of their acquisition.We amortize intangible assets over their estimated useful lives.
The estimated useful lives of the individual categories of intangible assets were based on thenature of the applicable intangible asset and the expected future cash flows to be derived from theintangible asset. Amortization of intangible assets with finite lives is recognized over the shorter of therespective lives of the agreement or the period of time the intangible assets are expected to contributeto future cash flows. We amortize our finite-lived intangible assets based on patterns on which therespective economic benefits are expected to be realized.
We evaluate long-lived tangible and intangible assets whenever events or changes incircumstances indicate that the carrying amount of an asset may not be recoverable. If indicators ofimpairment are present with respect to long-lived tangible and intangible assets used in operations andundiscounted future cash flows are not expected to be sufficient to recover the assets’ carryingamount, additional analysis is performed as appropriate and the carrying value of the long-lived assetsis reduced to the estimated fair value, if this is lower, and an impairment loss is charged to expense inthe period the impairment is identified.
We conduct our annual goodwill impairment test for our reporting units during the fourth quarter ofeach year. The impairment tests conducted during 2011 and 2010 indicated there was an impairmentof goodwill associated with our health information solutions reporting unit, and thus, a potentialimpairment of our long-lived tangible and intangible assets associated with the same reporting unit. Weconducted an analysis, utilizing an undiscounted cash flow model. The analyses conducted during2011 and 2010 indicated there was no impairment of the long-lived tangible or intangible assetsassociated with our health information solutions reporting unit.
(j) Acquired In-Process Research and Development (IPR&D)
Acquired IPR&D represents the fair value assigned to research and development assets that weacquire as part of business combinations, and which have not been completed at the date ofacquisition. The acquired IPR&D is capitalized as an intangible asset and tested for impairment at leastannually until commercialization, after which time the IPR&D is amortized over its estimated useful life.
(k) Business Acquisitions
Our business acquisitions have historically been made at prices above the fair value of the assetsacquired and liabilities assumed, resulting in goodwill, based on our expectations of synergies and
F-15

ALERE INC. AND SUBSIDIARIES
NOTES TO CONSOLIDATED FINANCIAL STATEMENTS (Continued)
(2) Summary of Significant Accounting Policies (Continued)
other benefits of combining the businesses. These synergies and benefits include elimination ofredundant facilities, functions and staffing; use of our existing commercial infrastructure to expandsales of the products of the acquired businesses; and use of the commercial infrastructure of theacquired businesses to expand product sales in a cost-efficient manner.
Significant judgment is required in estimating the fair value of intangible assets and in assigning theirrespective useful lives. The fair value estimates are based on available historical information and onfuture expectations and assumptions deemed reasonable by management, but are inherently uncertain.
We generally employ the income method to estimate the fair value of intangible assets, which isbased on forecasts of the expected future cash flows attributable to the respective assets. Significantestimates and assumptions inherent in the valuations reflect a consideration of other marketplaceparticipants, and include the amount and timing of future cash flows (including expected growth ratesand profitability), the underlying product life cycles, economic barriers to entry, a brand’s relativemarket position and the discount rate applied to the cash flows. Unanticipated market ormacroeconomic events and circumstances may occur, which could affect the accuracy or validity of theestimates and assumptions.
Net assets acquired are recorded at their fair value and are subject to adjustment upon finalizationof the fair value analysis. We are not aware of any information that indicates the final fair value analysiswill differ materially from the preliminary estimates.
During 2012, 2011, and 2010, we expensed acquisition-related costs of $9.7 million $11.5 millionand $8.2 million, respectively, in general and administrative expense.
(l) Income Taxes
Deferred tax assets and liabilities are recognized for the future tax consequences attributable todifferences between the financial statement carrying amounts of existing assets and liabilities and theirrespective tax bases. Deferred tax assets and liabilities are measured using enacted tax ratesexpected to apply to taxable income in the year in which those temporary differences are expected tobe recovered or settled. The effect on deferred tax assets and liabilities of a change in tax rates isrecognized in income in the period that includes the enactment date. Valuation allowances areestablished when necessary to reduce deferred tax assets to the amounts that are more likely than notto be realized in the future (Note 16).
We account for uncertain tax positions using a “more-likely-than-not” threshold for recognizing andresolving uncertain tax positions. We evaluate uncertain tax positions on a quarterly basis and considervarious factors, including, but not limited to, changes in tax law, the measurement of tax positionstaken or expected to be taken in tax returns, the effective settlement of matters subject to audit, newaudit activity and changes in facts or circumstances related to a tax position.
(m) Revenue Recognition
We primarily recognize revenue when the following four basic criteria have been met:(1) persuasive evidence of an arrangement exists, (2) delivery has occurred or services rendered,(3) the fee is fixed or determinable and (4) collection is reasonably assured.
The majority of our revenue is derived from product sales. We recognize revenue upon transfer ofthe title of the products to third-party customers, less a reserve for estimated product returns and
F-16
ALERE INC. AND SUBSIDIARIES
NOTES TO CONSOLIDATED FINANCIAL STATEMENTS (Continued)
(2) Summary of Significant Accounting Policies (Continued)
allowances. Determination of the reserve for estimated product returns and allowances is based on ourmanagement’s analyses and judgments regarding certain conditions. Should future changes inconditions prove management’s conclusions and judgments on previous analyses to be incorrect,revenue recognized for any reporting period could be adversely affected.
For products that include installation, and if the installation meets the criteria to be considered aseparate element, product revenue is recognized upon delivery, and installation revenue is recognizedwhen the installation is complete. For sales that include customer-specified acceptance criteria,revenue is recognized after the acceptance criteria have been met. Certain of our products requirespecialized installation. Revenue for these products is deferred until installation is completed. Revenuefrom services is deferred and recognized over the contractual period, or as services are rendered andaccepted by the customer. When arrangements include multiple elements, we use objective evidenceof fair value to allocate revenue to the elements, and recognize revenue when the criteria for revenuerecognition have been met for each element, in accordance with authoritative guidance onmultiple-element arrangements.
Additionally, we generate services revenue in connection with contracts with health plans (bothcommercial and governmental) and self-insured employers, whereby we provide clinical expertisethrough fee-based arrangements. Revenue for fee-based arrangements is recognized over theperiod in which the services are provided. Some contracts provide that a portion of our fees are atrisk if our customers do not achieve certain financial cost savings or we do not achieve certain otherclinical and operational metrics, over a period of time, typically one year. Revenue subject to refundis not recognized if (i) sufficient information is not available to calculate performance measurementsor (ii) interim performance measurements indicate that we are not meeting performance targets. Ifeither of these two conditions exists, we record the amounts as other current liabilities in theconsolidated balance sheet, deferring recognition of the revenue until we establish that we have metthe performance criteria. If we do not meet the performance targets at the end of the contractualperiod, we are obligated under the contract to refund some or all of the at-risk fees.
We also receive license and royalty revenue from agreements with third-party licensees. Revenuefrom license and royalty agreements is recognized on a straight-line basis over the obligation period ofthe related license agreements, or at the time when we have no further obligations. License and royaltyfees that the licensees calculate based on their sales, which we have the right to audit under most ofour agreements, are generally recognized upon receipt of the license or royalty payments unless weare able to reasonably estimate the fees as they are earned. License and royalty fees that aredeterminable prior to the receipt thereof are recognized in the period they are earned.
(n) Employee Stock-Based Compensation Arrangements
We account for share-based payments in accordance with Accounting Standards Codification, orASC 718, Compensation — Stock Compensation. Compensation expense associated with stockoptions includes amortization based on the grant-date fair value estimated in accordance with theprovisions of ASC 718. In addition, we record expense over the offering period in connection withshares issued under our employee stock purchase plan. Compensation expense for stock-basedcompensation awards includes an estimate for forfeitures and is recognized over the vesting period ofthe options using the straight-line method. It is our policy to recognize, through additional paid incapital, the excess or windfall tax benefits on stock option deductions, as those deductions arerecognized on tax returns.
Our stock option plans provide for grants of options to employees to purchase common stock at orabove the fair market value of such shares on the grant date of the award. The options generally vest
F-17

ALERE INC. AND SUBSIDIARIES
NOTES TO CONSOLIDATED FINANCIAL STATEMENTS (Continued)
(2) Summary of Significant Accounting Policies (Continued)
over a four-year period, beginning on the date of grant, with a graded vesting schedule of 25% at theend of each of the four years. The fair value of each option grant is estimated on the date of grantprimarily using a Black-Scholes option-pricing method. We use historical data to estimate the expectedprice volatility and the expected forfeiture rate. The contractual term of our stock option awards is tenyears. The risk-free rate is based on the U.S. Treasury yield curve in effect at the time of grant with aremaining term equal to the expected term of the option. We have not made any dividend payments tocommon shareholders nor do we have plans to pay dividends in the foreseeable future.
(o) Net Loss per Common Share
Net loss per common share is based upon the weighted-average number of outstanding commonshares and the dilutive effect of common share equivalents, such as options and warrants to purchasecommon stock, convertible preferred stock and convertible notes, if applicable, that are outstandingeach year (Note 12).
(p) Other Operating Expenses
We expense advertising costs as incurred. In 2012, 2011 and 2010, advertising costs amounted to$22.6 million, $9.9 million and $14.4 million, respectively, and are included in sales and marketingexpenses in the accompanying consolidated statements of operations.
Shipping and handling costs are included in cost of net revenue in the accompanying consolidatedstatements of operations. When we charge our customers for shipping and handling costs, these costsare recorded along with product revenues.
(q) Concentration of Credit Risk, Off-Balance Sheet Risks and Other Risks and Uncertainties
Financial instruments that potentially subject us to concentration of credit risk primarily consist ofcash and cash equivalents and accounts receivable. We invest our excess cash primarily in highquality securities and limit the amount of our credit exposure to any one financial institution. We do notrequire collateral or other securities to support customer receivables; however, we perform on-goingcredit evaluations of our customers and maintain allowances for potential credit losses.
At December 31, 2012 and 2011, no individual customer’s accounts receivable balance was inexcess of 10% of our aggregate accounts receivable. During 2012, 2011 and 2010, no one customerrepresented greater than 10% of our net revenue.
We rely on a number of third parties to manufacture certain of our products. If any of ourthird-party manufacturers cannot, or will not, manufacture our products in the required volumes, on acost-effective basis, in a timely manner, or at all, we will have to secure additional manufacturingcapacity. Any interruption or delay in manufacturing could have a material adverse effect on ourbusiness and operating results.
(r) Financial Instruments and Fair Value of Financial Instruments
Our primary financial instruments at December 31, 2012 and 2011 consisted of cash equivalents,restricted cash, marketable securities, accounts receivable, accounts payable and debt. We apply fair valuemeasurement accounting to value our financial assets and liabilities. Fair value is defined as the exchangeprice that would be received for an asset or paid to transfer a liability (an exit price) in the principal or most
F-18

ALERE INC. AND SUBSIDIARIES
NOTES TO CONSOLIDATED FINANCIAL STATEMENTS (Continued)
(2) Summary of Significant Accounting Policies (Continued)
advantageous market for the asset or liability in an orderly transaction between market participants on themeasurement date. A fair value hierarchy requires an entity to maximize the use of observable inputs,where available, and minimize the use of unobservable inputs when measuring fair value.
Described below are the three levels of inputs that may be used to measure fair value:
Level 1 Quoted prices in active markets for identical assets or liabilities.
Level 2 Observable inputs other than Level 1 prices, such as quoted prices for similar assets orliabilities; quoted prices in markets that are not active; or other inputs that are observable or can becorroborated by observable market data for substantially the full term of the assets or liabilities.
Level 3 Unobservable inputs that are supported by little or no market activity and that aresignificant to the fair value of the assets or liabilities.
(s) Software for Internal Use and for Resale
We may capitalize certain costs associated with the development of internal-use software,including direct materials and services. Capitalized software is amortized on a straight-line basis overits estimated useful life and is included in computer software and equipment within property, plant andequipment.
We also develop software for resale or lease to external parties and expense the costs ofdeveloping software for resale or lease incurred before establishment of technological feasibility of theunderlying software. The costs incurred from establishment of technological feasibility until generalrelease of the software are capitalized, and the capitalized software is amortized over its estimateduseful life. Capitalized software for resale or lease is included in computer software and equipmentwithin property, plant and equipment.
(t) Research and Development
Our research and development programs focus on the development of cardiology, infectiousdisease, toxicology, diabetes, oncology and women’s health products together with health informationtechnologies that will facilitate connectivity and information and data management solutions. Researchand development costs are expensed as incurred. Payments received from external parties to fund ourresearch and development activities reduce the recorded research and development expenses.
(u) Leases
We lease certain facilities and equipment from external parties under operating leases. Rentexpense related to operating leases is recorded in the income statement as incurred. We also leasemachinery, laboratory equipment, tooling and other equipment under capital leases. In determiningwhether a lease is a capital or an operating lease, we estimate the expected term of the lease, whichincludes certain renewable options as required by lease accounting guidance. Rent deferrals, landlordincentives and rent escalations are included in calculation of minimum lease payments whenperforming the capital lease tests and when calculating the rent expense for operating leases.
Leased property, plant and equipment that meet the capital lease criteria are capitalized at thelower of the present value of the minimum lease payments or the fair value of the underlying asset atthe inception date of the lease. Assets under capital leases are depreciated on a straight-line basisover the lease term.
F-19

ALERE INC. AND SUBSIDIARIES
NOTES TO CONSOLIDATED FINANCIAL STATEMENTS (Continued)
(2) Summary of Significant Accounting Policies (Continued)
Leasehold improvements are capitalized and amortized over the shorter of their estimated usefullives or the remainder of the expected term of the lease.
(v) Recent Accounting Pronouncements
Recently Issued Standards
In July 2012, the FASB issued Accounting Standards Update, or ASU, No. 2012-02,Intangibles — Goodwill and Other (Topic 350): Testing Indefinite-Lived Intangible Assets forImpairment, or ASU 2012-02. ASU 2012-02 allows an entity the option to first assess qualitative factorsto determine whether the existence of events and circumstances indicates that it is more likely than notthat the indefinite-lived intangible asset is impaired. If an entity concludes that it is not more likely thannot that the indefinite-lived intangible asset is impaired, then the entity is not required to take furtheraction. However, if an entity concludes otherwise, then it is required to determine the fair value of theindefinite-lived intangible asset and perform the quantitative impairment test by comparing the fairvalue with the carrying amount. An entity also has the option to bypass the qualitative assessment forany indefinite-lived intangible asset in any period and proceed directly to performing the quantitativeimpairment test. An entity will be able to resume performing the qualitative assessment in anysubsequent period. ASU 2012-02 is effective for annual and interim impairment tests for fiscal yearsbeginning after September 15, 2012. The adoption of this standard is not expected to have a materialimpact on our financial position, results of operations, comprehensive income or cash flows.
Recently Adopted Standards
Effective January 1, 2012, we adopted ASU No. 2011-08, Intangibles — Goodwill and Other(Topic 350): Testing for Goodwill Impairment, or ASU 2011-08. ASU 2011-08 allows an entity theoption to first assess qualitative factors to determine whether it is necessary to perform the currenttwo-step impairment test. If an entity believes, as a result of its qualitative assessment, that it is morelikely than not that the fair value of a reporting unit is less than its carrying amount, the quantitativetwo-step impairment test is required; otherwise, no further testing is required. This update does notchange the current guidance for testing other indefinite-lived intangible assets for impairment. Theadoption of this standard did not have an impact on our financial position, results of operations,comprehensive income or cash flows. Based upon a qualitative assessment, we performed Step 1 ofthe two-step impairment test on all of our reporting units in 2012.
Effective January 1, 2012, we adopted ASU No. 2011-05, Comprehensive Income (Topic 220):Presentation of Comprehensive Income, or ASU 2011-05. ASU 2011-05 (1) eliminates the option topresent the components of other comprehensive income as part of the statement of changes instockholders’ equity; (2) requires the consecutive presentation of the statement of net income andother comprehensive income; and (3) requires an entity to present reclassification adjustments on theface of the financial statements from other comprehensive income to net income. This update does notchange the items that must be reported in other comprehensive income or when an item of othercomprehensive income must be reclassified to net income. The amendments do not affect how theearnings per share amounts are calculated or presented. Effective January 1, 2012, the FASB issuedASU No. 2011-12, Comprehensive Income (Topic 220): Deferral of the Effective Date for Amendmentsto the Presentation of Reclassifications of Items Out of Accumulated Other Comprehensive Income inAccounting Standards Update No. 2011-05, or ASU 2011-12. As these accounting standards onlyrequire enhanced disclosure, the adoption of these standards did not impact our financial position,results of operations, comprehensive income or cash flows.
F-20

ALERE INC. AND SUBSIDIARIES
NOTES TO CONSOLIDATED FINANCIAL STATEMENTS (Continued)
(2) Summary of Significant Accounting Policies (Continued)
Effective January 1, 2012, we adopted ASU No. 2011-04, Fair Value Measurements (Topic 820):Amendments to Achieve Common Fair Value Measurement and Disclosure Requirements inU.S. GAAP and IFRSs, or ASU 2011-04. ASU 2011-04 provides common requirements for measuringfair value and disclosing information about fair value measurements in accordance with U.S. GAAP.
(3) Other Balance Sheet Information
(a) Components of selected captions in the consolidated balance sheets consist of (in thousands):
December 31,
2012 2011
Inventories, net:Raw materials . . . . . . . . . . . . . . . . . . . . . . . . . . . . . . . . . . $ 99,498 $ 92,844Work-in-process . . . . . . . . . . . . . . . . . . . . . . . . . . . . . . . . 89,895 72,939Finished goods . . . . . . . . . . . . . . . . . . . . . . . . . . . . . . . . . 147,728 154,486
$ 337,121 $ 320,269
Property, plant and equipment, net:Machinery, laboratory equipment and tooling . . . . . . . . . $ 416,311 $ 340,750Land and buildings . . . . . . . . . . . . . . . . . . . . . . . . . . . . . . 176,214 170,152Leasehold improvements . . . . . . . . . . . . . . . . . . . . . . . . . 45,654 38,767Computer software and equipment . . . . . . . . . . . . . . . . . 217,940 174,086Furniture and fixtures . . . . . . . . . . . . . . . . . . . . . . . . . . . . 33,022 28,117
889,141 751,872Less: Accumulated depreciation and amortization . . . . . (354,672) (260,667)
$ 534,469 $ 491,205
Accrued expenses and other current liabilities:Compensation and compensation-related . . . . . . . . . . . $ 93,467 $ 77,656Professional fees . . . . . . . . . . . . . . . . . . . . . . . . . . . . . . . 12,152 9,171Interest payable . . . . . . . . . . . . . . . . . . . . . . . . . . . . . . . . 18,074 27,137Royalty obligations . . . . . . . . . . . . . . . . . . . . . . . . . . . . . . 26,171 29,085Deferred revenue . . . . . . . . . . . . . . . . . . . . . . . . . . . . . . . 38,188 33,407Income taxes payable . . . . . . . . . . . . . . . . . . . . . . . . . . . . 29,733 50,134Other taxes payable . . . . . . . . . . . . . . . . . . . . . . . . . . . . . 23,038 29,245Acquisition-related obligations . . . . . . . . . . . . . . . . . . . . . 79,286 68,009Other . . . . . . . . . . . . . . . . . . . . . . . . . . . . . . . . . . . . . . . . . 91,810 71,729
$ 411,919 $ 395,573
(b) Note receivable from FGST Investments, Inc.
In December 2012, we entered into an arrangement whereby we issued a $40.0 million short-termnote to an unrelated party, FGST Investments, Inc., or FGST, for the primary purpose of providingfunding in connection with their acquisition of the Polymedica Corporation (“Liberty”) line of business, amedical supply business, from a subsidiary of Express Scripts Holding Company. The note bearsinterest at a rate of 3.25% per annum and is collateralized by substantially all of the assets of FGSTand its parent entity, ATLS. The $40.0 million short-term note is classified within prepaid expenses andother current assets on our Consolidated Balance Sheet as of December 31, 2012. In connection with
F-21

ALERE INC. AND SUBSIDIARIES
NOTES TO CONSOLIDATED FINANCIAL STATEMENTS (Continued)
(3) Other Balance Sheet Information (Continued)
the note, we obtained a call option on certain of the assets acquired by FGST, at a strike price of $40.0million. In lieu of repayment of the note, we may exercise the option by tendering the note to obtainthose assets. If we do not exercise the option, $10.0 million becomes repayable five days after theexpiration of the option and $30.0 million, plus accrued and unpaid interest, becomes repayable on the60th day following the expiration of the option.
Upon evaluation of the significant terms of the note arrangement and the call option, we haveconcluded that the note and option represent a variable interest in FGST and, therefore, FGST is avariable interest entity. Further, we assessed whether we are the primary beneficiary in relation toFGST and concluded that we do not have power over the most significant activities of FGST, primarilyoperating decision making and that our obligation to absorb losses or receive benefits from FGST islimited to our note receivable from them. Given such, we have concluded that we are not the primarybeneficiary and, therefore, we will not include the financial results of FGST in our consolidated financialstatements. See also Note 25.
(4) Business Combinations
(a) Acquisitions in 2012
(i) eScreen
On April 2, 2012, we acquired eScreen, Inc., or eScreen, headquartered in Overland Park,Kansas, a technology-enabled provider of employment drug screening solutions for hiring andmaintaining healthier and more efficient workforces. The preliminary aggregate purchase price wasapproximately $295.0 million, which consisted of $271.4 million in cash and a contingent considerationobligation with an aggregate acquisition date fair value of $23.6 million. Included in our consolidatedstatements of operations for the year ended December 31, 2012 is revenue totaling approximately$116.7 million related to eScreen. The operating results of eScreen are included in our professionaldiagnostics reporting unit and business segment. The amount allocated to goodwill from thisacquisition is not deductible for tax purposes.
(ii) Other acquisitions in 2012
During 2012, we acquired the following businesses for a preliminary aggregate purchase price of$199.4 million, which included cash payments totaling $147.4 million and contingent considerationobligations with aggregate acquisition date fair values of $52.0 million.
• Reatrol Comercializacao De Produtos De Saude, LDA, subsequently renamed Alere Lda,located in Vila Nova de Gaia, Portugal, a distributor of products for drugs of abuse testing(Acquired January 2012)
• Kullgren Holding AB, or Kullgren, located in Gensta, Sweden, a company that manufactures anddistributes high-quality intimacy and pharmaceutical products (Acquired February 2012)
• Wellogic ME FZ-LLC, or Wellogic UAE, located in Dubai, United Arab Emirates, a company thatprovides development services to Alere Wellogic, LLC, which acquired the assets of MethodFactory, Inc. (d/b/a Wellogic), or Wellogic, in December 2011 (Acquired February 2012)
• certain assets, primarily including customer and patient lists, of AmMed Direct LLC, or AmMed,located near Nashville, Tennessee, a privately-owned mail-order provider of home-diabetestesting products and supplies (Acquired March 2012)
F-22

ALERE INC. AND SUBSIDIARIES
NOTES TO CONSOLIDATED FINANCIAL STATEMENTS (Continued)
(4) Business Combinations (Continued)
• MedApps Holding Company, Inc., or MedApps, headquartered in Scottsdale, Arizona, adeveloper of innovative remote health monitoring solutions that deliver efficient cost-effectiveconnectivity between patient, care provider and electronic medical records (Acquired July 2012)
• Amedica Biotech, Inc., or Amedica, located in Hayward, California, a company focused on thedevelopment and manufacture of in vitro diagnostic tests (Acquired July 2012)
• DiagnosisOne, Inc., or DiagnosisOne, located in Lowell, Massachusetts, a software companythat provides clinical analytics technology and data-driven content to hospitals, physiciangroups, insurers and governments (Acquired July 2012)
• Seelen Care Laege-og & Hospitalsartikler ApS, or Seelen, located in Holstebro, Denmark, adistributor of consumables, instruments and equipment to doctors, specialists andphysiotherapists (Acquired August 2012)
• certain assets of Diagnostik Nord, or Diagnostik, located in Schwerin, Germany, a companyfocused on the sale of drug screening and in vitro diagnostic medical devices and a provider ofdiagnostic solutions (Acquired September 2012)
• Healthcare Connections Limited, or HCC, located in Buckinghamshire, United Kingdom, anoccupational health provider specializing in employment medical programs, preventative healthschemes and drug and alcohol sample collection services (Acquired November 2012)
• the diagnostic division of Medial spol. s.r.o., subsequently renamed Alere s.r.o., located inPrague, Czech Republic, a distributor of laboratory diagnostic devices, devices operating in thepoint-of-care testing regime, diagnostic kits and tests for biochemistry, hematology, andmicrobiology (Acquired November 2012)
• certain assets of Quantum Diagnostics, or Quantum Australia, located in Australia, an on-linemedical supply company that provides a range of affordable drug and alcohol tests for personal,business and professional medical use. (Acquired November 2012)
• certain assets of NationsHealth, Inc., or NationsHealth, headquartered in Sunrise, Florida, aprivately-owned mail-order provider of diabetes home-testing products and supplies, and ashare acquisition of NationsHealth’s subsidiary in the Philippines, or NationsHealth Philippines(Acquired December 2012)
• Branan Medical Corporation, or Branan, headquartered in Irvine, California, a manufacturer ofdrugs of abuse testing products (Acquired December 2012)
The operating results of Alere Lda, AmMed, MedApps, Amedica, Seelen, Diagnostik, HCC, Aleres.r.o., Quantum Australia, NationsHealth and Branan are included in our professional diagnosticsreporting unit and business segment. The operating results of Wellogic UAE and DiagnosisOne areincluded in our health information solutions reporting unit and business segment. The operating resultsof Kullgren are included in our consumer diagnostics reporting unit and business segment.
Our consolidated statements of operations for the year ended December 31, 2012 includedrevenue totaling approximately $44.6 million related to these businesses. Goodwill has beenrecognized in all of these acquisitions and amounted to approximately $102.9 million. Goodwill relatedto the acquisitions of AmMed, Diagnostik and the US-based assets of NationsHealth, which totaled$8.8 million, is deductible for tax purposes. The goodwill related to the remaining 2012 acquisitions isnot deductible for tax purposes.
F-23

ALERE INC. AND SUBSIDIARIES
NOTES TO CONSOLIDATED FINANCIAL STATEMENTS (Continued)
(4) Business Combinations (Continued)
A summary of the preliminary fair values of the net assets acquired for the acquisitionsconsummated in 2012 is as follows (in thousands):
eScreen Other Total
Current assets(1) . . . . . . . . . . . . . . . . . . . . . . . . . . . . . . . . . . . . . . . . . . $ 32,530 $ 13,304 $ 45,834Property, plant and equipment . . . . . . . . . . . . . . . . . . . . . . . . . . . . . . . 5,806 3,184 8,990Goodwill . . . . . . . . . . . . . . . . . . . . . . . . . . . . . . . . . . . . . . . . . . . . . . . . . 154,923 102,919 257,842Intangible assets . . . . . . . . . . . . . . . . . . . . . . . . . . . . . . . . . . . . . . . . . . 204,000 121,223 325,223Other non-current assets . . . . . . . . . . . . . . . . . . . . . . . . . . . . . . . . . . . 481 221 702
Total assets acquired . . . . . . . . . . . . . . . . . . . . . . . . . . . . . . . . . . . . 397,740 240,851 638,591
Current liabilities . . . . . . . . . . . . . . . . . . . . . . . . . . . . . . . . . . . . . . . . . . 22,805 4,885 27,690Non-current liabilities . . . . . . . . . . . . . . . . . . . . . . . . . . . . . . . . . . . . . . . 79,945 36,520 116,465
Total liabilities assumed . . . . . . . . . . . . . . . . . . . . . . . . . . . . . . . . . . 102,750 41,405 144,155
Net assets acquired . . . . . . . . . . . . . . . . . . . . . . . . . . . . . . . . . . . . . . . . 294,990 199,446 494,436Less:
Contingent consideration . . . . . . . . . . . . . . . . . . . . . . . . . . . . . . . . . . 23,600 52,020 75,620
Cash paid . . . . . . . . . . . . . . . . . . . . . . . . . . . . . . . . . . . . . . . . . . . . . . . . $271,390 $147,426 $418,816
(1) Includes approximately $4.0 million of acquired cash.
The following are the intangible assets acquired and their respective fair values and weighted-average useful lives (dollars in thousands):
eScreen Other Total
Weighted-average
Useful Life
Core technology and patents . . . . . . . . . . . . . . . . . . . . . $ 93,200 $ 54,903 $148,103 18.7 yearsTrademarks and trade names . . . . . . . . . . . . . . . . . . . . . 17,300 2,090 19,390 18.3 yearsCustomer relationships . . . . . . . . . . . . . . . . . . . . . . . . . . 79,600 56,885 136,485 18.1 yearsNon-competition agreements . . . . . . . . . . . . . . . . . . . . . — 1,118 1,118 5.1 yearsOther . . . . . . . . . . . . . . . . . . . . . . . . . . . . . . . . . . . . . . . . . 13,900 1,327 15,227 9.2 yearsIn-process research and development . . . . . . . . . . . . . . — 4,900 4,900 N/A
Total intangible assets . . . . . . . . . . . . . . . . . . . . . . . . . . . $204,000 $121,223 $325,223
(b) Acquisitions in 2011
(i) Arriva
On November 23, 2011, we acquired Arriva Medical LLC, or Arriva, located in Coral Springs,Florida, a privately-owned mail-order provider of diabetes home-testing products and supplies. Theaggregate purchase price was $79.5 million, which consisted of a cash payment totaling $64.4 millionand 806,452 shares of our common stock with an aggregate fair value of $15.2 million. Included in ourconsolidated statement of operations for the year ended December 31, 2011 is revenue totalingapproximately $5.3 million related to this acquired business. The operating results of Arriva areincluded in our professional diagnostics reporting unit and business segment. The amount allocated togoodwill from this acquisition is deductible for tax purposes.
F-24

ALERE INC. AND SUBSIDIARIES
NOTES TO CONSOLIDATED FINANCIAL STATEMENTS (Continued)
(4) Business Combinations (Continued)
(ii) Axis-Shield
On November 1, 2011, we acquired Axis-Shield, located in Dundee, Scotland, a U.K. publiclytraded company focused on the development and manufacture of in vitro diagnostic tests for use inclinical laboratories and at the point of care. The aggregate purchase price was $388.8 million, whichconsisted of cash payments totaling $279.6 million and the fair value of previously-held investmenttotaling $109.2 million. Included in our consolidated statement of operations for the year endedDecember 31, 2011 is revenue totaling approximately $36.7 million, including $1.8 million of licenseand royalty revenue, related to this acquired business. The operating results of Axis-Shield areincluded in our professional diagnostics reporting unit and business segment. We do not expect theamount allocated to goodwill to be deductible for tax purposes.
(iii) Avee
On October 3, 2011, we acquired Avee Laboratories Inc. and related companies, which we refer tocollectively as Avee, located in Tampa, Florida, a privately-owned provider of drug testing services inthe field of pain management. The aggregate purchase price was $120.5 million, which was paid incash. Included in our consolidated statement of operations for the year ended December 31, 2011 isrevenue totaling approximately $27.2 million related to this acquired business. The operating results ofAvee are included in our professional diagnostics reporting unit and business segment. The amountallocated to goodwill from this acquisition is deductible for tax purposes.
(iv) Other acquisitions in 2011
During 2011, we acquired the following businesses for an aggregate purchase price of $198.5million, which included cash payments totaling $139.3 million, a previously-held investment with a fairvalue totaling $3.9 million, 25,463 shares of our common stock with an acquisition date fair value of$1.0 million, contingent consideration obligations with an aggregate acquisition date fair value of $48.7million, deferred purchase price consideration with an acquisition date fair value of $4.2 million anddebt forgiveness with a fair value of $1.5 million.
• 90% interest in BioNote, Inc., or BioNote, headquartered in South Korea, a manufacturer ofdiagnostic products for the veterinary industry (Acquired January 2011). We previously owned a10% interest in BioNote.
• assets, including domain name, of Pregnancy.org, LLC, or Pregnancy.org, a U.S.-basedcompany providing a website for preconception, pregnancy and newborn care content, tools andsharing (Acquired January 2011)
• Home Telehealth Limited, subsequently renamed Alere Connected Health Limited, or AlereConnected Health, located in Cardiff, Wales, a company that focuses on delivering integrated,comprehensive services and programs to health and social care providers and insurers(Acquired February 2011)
• Bioeasy Diagnostica Ltda., or Bioeasy, located in Belo Horizonte, Brazil, a company thatmarkets and sells rapid diagnostic tests and systems for laboratory diagnosis, prevention andmonitoring of immunological diseases and fertility (Acquired March 2011)
• 80.92% interest in Standing Stone, Inc., or Standing Stone, located in Westport, Connecticut, acompany that focuses on disease state management by enhancing the quality of care providedto patients who require long-term therapy for chronic disease management (Acquired May 2011)
F-25
ALERE INC. AND SUBSIDIARIES
NOTES TO CONSOLIDATED FINANCIAL STATEMENTS (Continued)
(4) Business Combinations (Continued)
• certain assets, rights, liabilities and properties of Drug Detection Devices, Inc., or 3DL, locatedin Alpharetta, Georgia, a distributor that promotes, markets, distributes and sells drugs of abusediagnostic products, including consumables, point-of-care diagnostic kits and related productsand services (Acquired July 2011)
• Colibri Medical AB, or Colibri, located in Helsingborg, Sweden, a distributor of point-of-caredrugs of abuse diagnostic products primarily to the Scandinavian marketplace (Acquired July2011)
• Laboratory Data Systems, Inc., or LDS, located in Tampa, Florida, a provider of healthcaresoftware products, services, consulting and solutions (Acquired August 2011)
• certain assets, liabilities and properties of Abatek Medical LLC, or Abatek, located in Dover,New Hampshire, a distributor that promotes, markets, distributes and sells drugs of abusediagnostic products, including consumables, point-of-care diagnostic kits and related productsand services (Acquired September 2011)
• Forensics Limited, or ROAR, located in Worcestershire, England, a company that providesforensic quality toxicology services across the United Kingdom (Acquired September 2011)
• Mahsan Diagnostika Vertriebsgesellschaft mbH, or Mahsan, located in Reinbek, Germany, adistributor of in vitro diagnostic drugs of abuse products primarily to the German marketplace(Acquired October 2011)
• Medical Automation Systems Inc., or MAS, located in Charlottesville, Virginia, a provider ofnetwork-based software solutions for point-of-care testing (Acquired October 2011)
• certain assets and properties of 1 Medical Distribution, Inc., or 1 Medical, located inWorthington, Ohio, a distributor that promotes, markets, distributes and sells drugs of abusediagnostic products, including consumables, point-of-care diagnostic kits and related productsand services (Acquired November 2011)
• Method Factory, Inc. (d/b/a Wellogic), or Wellogic, headquartered in Waltham, Massachusetts, aprovider of software solutions designed to connect the healthcare community (AcquiredDecember 2011)
The operating results of BioNote, Bioeasy, 3DL, Colibri, LDS, Abatek, ROAR, Mahsan, MAS and 1Medical are included in our professional diagnostics reporting unit and business segment. Theoperating results of Pregnancy.org, Alere Connected Health, Standing Stone and Wellogic are includedin our health information solutions reporting unit and business segment.
Our consolidated statement of operations for the year ended December 31, 2011 includedrevenue totaling approximately $21.1 million related to these businesses. Goodwill has beenrecognized in all of the acquisitions, with the exception of 1 Medical, and amounted to approximately$131.3 million. Goodwill related to the acquisitions of Pregnancy.org, 3DL, Abatek, LDS and Wellogic,which totaled $32.8 million, is expected to be deductible for tax purposes. The goodwill related to theremaining 2011 acquisitions is not expected to be deductible for tax purposes.
F-26
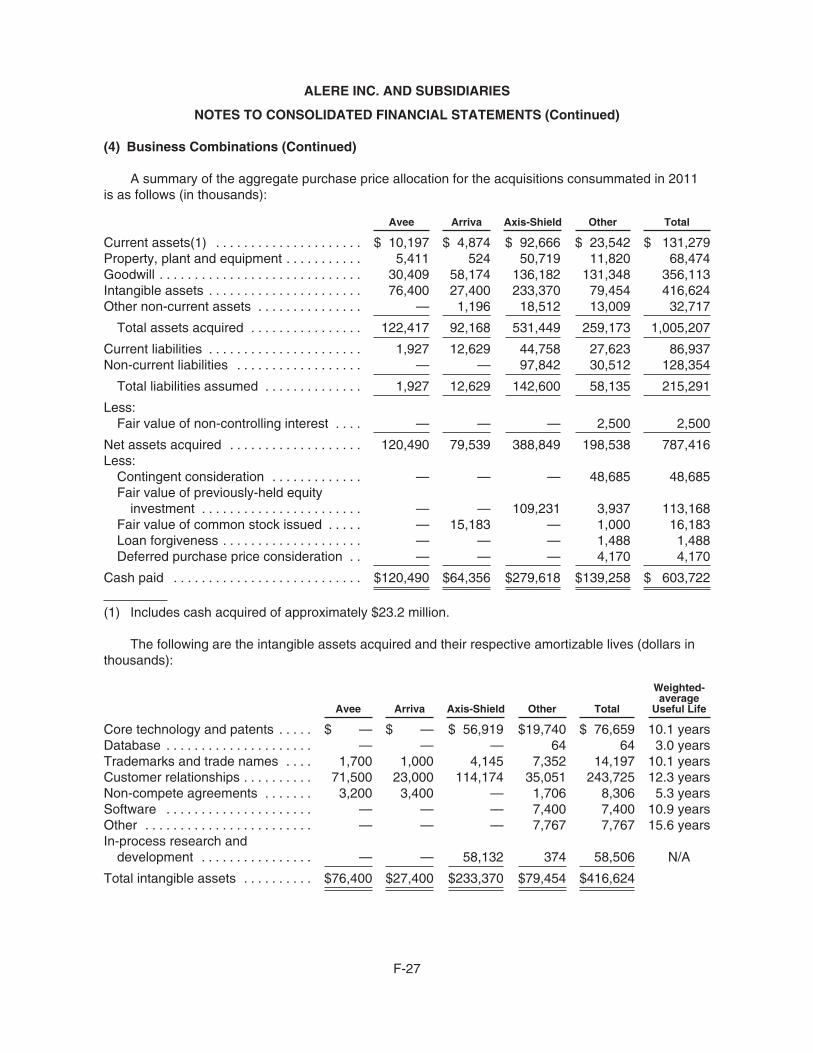
ALERE INC. AND SUBSIDIARIES
NOTES TO CONSOLIDATED FINANCIAL STATEMENTS (Continued)
(4) Business Combinations (Continued)
A summary of the aggregate purchase price allocation for the acquisitions consummated in 2011is as follows (in thousands):
Avee Arriva Axis-Shield Other Total
Current assets(1) . . . . . . . . . . . . . . . . . . . . . $ 10,197 $ 4,874 $ 92,666 $ 23,542 $ 131,279Property, plant and equipment . . . . . . . . . . . 5,411 524 50,719 11,820 68,474Goodwill . . . . . . . . . . . . . . . . . . . . . . . . . . . . . 30,409 58,174 136,182 131,348 356,113Intangible assets . . . . . . . . . . . . . . . . . . . . . . 76,400 27,400 233,370 79,454 416,624Other non-current assets . . . . . . . . . . . . . . . — 1,196 18,512 13,009 32,717
Total assets acquired . . . . . . . . . . . . . . . . 122,417 92,168 531,449 259,173 1,005,207
Current liabilities . . . . . . . . . . . . . . . . . . . . . . 1,927 12,629 44,758 27,623 86,937Non-current liabilities . . . . . . . . . . . . . . . . . . — — 97,842 30,512 128,354
Total liabilities assumed . . . . . . . . . . . . . . 1,927 12,629 142,600 58,135 215,291
Less:Fair value of non-controlling interest . . . . — — — 2,500 2,500
Net assets acquired . . . . . . . . . . . . . . . . . . . 120,490 79,539 388,849 198,538 787,416Less:
Contingent consideration . . . . . . . . . . . . . — — — 48,685 48,685Fair value of previously-held equity
investment . . . . . . . . . . . . . . . . . . . . . . . — — 109,231 3,937 113,168Fair value of common stock issued . . . . . — 15,183 — 1,000 16,183Loan forgiveness . . . . . . . . . . . . . . . . . . . . — — — 1,488 1,488Deferred purchase price consideration . . — — — 4,170 4,170
Cash paid . . . . . . . . . . . . . . . . . . . . . . . . . . . $120,490 $64,356 $279,618 $139,258 $ 603,722
(1) Includes cash acquired of approximately $23.2 million.
The following are the intangible assets acquired and their respective amortizable lives (dollars inthousands):
Avee Arriva Axis-Shield Other Total
Weighted-average
Useful Life
Core technology and patents . . . . . $ — $ — $ 56,919 $19,740 $ 76,659 10.1 yearsDatabase . . . . . . . . . . . . . . . . . . . . . — — — 64 64 3.0 yearsTrademarks and trade names . . . . 1,700 1,000 4,145 7,352 14,197 10.1 yearsCustomer relationships . . . . . . . . . . 71,500 23,000 114,174 35,051 243,725 12.3 yearsNon-compete agreements . . . . . . . 3,200 3,400 — 1,706 8,306 5.3 yearsSoftware . . . . . . . . . . . . . . . . . . . . . — — — 7,400 7,400 10.9 yearsOther . . . . . . . . . . . . . . . . . . . . . . . . — — — 7,767 7,767 15.6 yearsIn-process research and
development . . . . . . . . . . . . . . . . — — 58,132 374 58,506 N/A
Total intangible assets . . . . . . . . . . $76,400 $27,400 $233,370 $79,454 $416,624
F-27
ALERE INC. AND SUBSIDIARIES
NOTES TO CONSOLIDATED FINANCIAL STATEMENTS (Continued)
(4) Business Combinations (Continued)
(c) Acquisitions in 2010
(i) Immunalysis
On August 16, 2010, we acquired Diagnostixx of California, Corp. (d/b/a ImmunalysisCorporation), or Immunalysis, located in Pomona, California, a privately-owned manufacturer andmarketer of abused and prescription drug screening solutions used by clinical reference and forensic/crime laboratories. The aggregate purchase price was $56.2 million, which consisted of an initial cashpayment totaling $55.0 million and a contingent consideration obligation of up to $5.0 million with anacquisition date fair value of $1.2 million. Included in our consolidated statement of operations for theyear ended December 31, 2010 is revenue totaling approximately $7.9 million related to this acquiredbusiness. The operating results of this acquired operation are included in our professional diagnosticsreporting unit and business segment. The amount allocated to goodwill from this acquisition isdeductible for tax purposes.
(ii) Twist
On March 11, 2010, we acquired TwistDx, Inc., or Twist, headquartered in Cambridge,Massachusetts, a privately-owned research and development company with a research anddevelopment operation in the United Kingdom. The aggregate purchase price was $70.8 million, whichconsisted of an initial cash payment totaling $35.2 million and a contingent consideration obligation ofup to $125.0 million with an acquisition date fair value of $35.6 million. Included in our consolidatedstatement of operations for the year ended December 31, 2010 is revenue totaling approximately$0.2 million related to this acquired business. The operating results of this acquired operation areincluded in our professional diagnostics reporting unit and business segment. The amount allocated togoodwill from this acquisition is not deductible for tax purposes.
(iii) Alere Toxicology
On February 17, 2010, we acquired Kroll Laboratory Specialists, Inc., subsequently renamed AlereToxicology Services, or Alere Toxicology, headquartered in Gretna, Louisiana, which provides forensicquality substance abuse testing products and services across the United States. The aggregatepurchase price was $109.5 million, which was paid in cash. Included in our consolidated statement ofoperations for the year ended December 31, 2010 is revenue totaling approximately $31.3 millionrelated to this acquired business. The operating results of Alere Toxicology are included in ourprofessional diagnostics reporting unit and business segment. The amount allocated to goodwill fromthis acquisition is deductible for tax purposes.
(iv) Standard Diagnostics
On February 8, 2010, we acquired a 61.92% ownership interest in Standard Diagnostics via atender offer for approximately $162.1 million. On March 22, 2010, we acquired an incremental 13.37%ownership interest in Standard Diagnostics via a follow-on tender offer for approximately $36.2 million.In June 2010, we acquired an incremental 2.84% ownership interest for approximately $7.3 million,bringing our acquisition-related aggregate ownership interest in Standard Diagnostics to approximately78.13%. Standard Diagnostics specializes in the medical diagnostics industry. Its main product linesrelate to diagnostic reagents and devices for hepatitis, infectious diseases, tumor markers, fertility,drugs of abuse, urine strips and protein strips. The aggregate purchase price was $205.6 million incash. Included in our consolidated statement of operations for the year ended December 31, 2010 isrevenue totaling approximately $78.9 million related to Standard Diagnostics. The operating results of
F-28

ALERE INC. AND SUBSIDIARIES
NOTES TO CONSOLIDATED FINANCIAL STATEMENTS (Continued)
(4) Business Combinations (Continued)
Standard Diagnostics are included in our professional diagnostics reporting unit and businesssegment. The amount allocated to goodwill from this acquisition is not deductible for tax purposes.During the fourth quarter of 2010, we acquired the remaining outstanding minority interests in StandardDiagnostics bringing our aggregate ownership interest to approximately 100% as of December 31,2010. In connection with our purchase of shares from a certain minority shareholder, we incurred acompensation charge of $60.1 million, as a result of the transition of the day-to-day managementcontrol of the business to us.
(v) Other acquisitions in 2010
During 2010, we acquired the following businesses for an aggregate purchase price of$161.9 million, which consisted of initial cash payments totaling $108.3 million, contingentconsideration obligations with an acquisition date fair value of $52.9 million and deferred purchaseprice consideration with an acquisition date present value of $0.7 million.
• RMD Networks, Inc., or RMD, located in Denver, Colorado, a provider of clinical groupwaresoftware and services designed to improve communication and coordination of care amongproviders, patients, and payers in the healthcare environment (Acquired January 2010)
• certain assets of Streck, Inc., or Streck, located in Nebraska, a manufacturer of hematology,chemistry and immunology products for the clinical laboratory (Acquired January 2010)
• assets of the diagnostics division of Micropharm Ltd., or Micropharm, located in Wales, UnitedKingdom, an expert in high quality antibody production in sheep for both diagnostic andtherapeutic purposes, providing antisera on a contract basis for U.K. and overseas companiesand academic institutions, mainly for research, therapeutic and diagnostic uses (Acquired March2010)
• Quantum Diagnostics Group Limited, or Quantum, headquartered in Essex, England, anindependent provider of drug testing products and services to healthcare professionals acrossthe U.K. and Europe (Acquired April 2010)
• assets of the workplace health division of Good Health Solutions Pty Ltd., subsequentlyrenamed Alere Health Pty Ltd., located in East Sydney, Australia, an important player in theAustralian health and wellness market, focusing on health screenings, health related consultingservices, health coaching and fitness instruction (Acquired April 2010)
• certain assets of Unotech Diagnostics, Inc., or Unotech, located in California, a privately-ownedcompany engaged in the development, formulation, manufacture, packaging, supply anddistribution of our BladderCheck NMP22 lateral flow test and related lateral flow products(Acquired June 2010)
• Scipac Holdings Limited, or Scipac, headquartered in Kent, England, a diagnostic reagentcompany with an extensive product portfolio supplying purified human antigens, recombinantproteins and disease state plasma to a global customer base (Acquired June 2010)
• Ionian Technologies, Inc., or Ionian, located in San Diego, California (Acquired July 2010)
• AdnaGen AG, now known as AdnaGen GmbH, or AdnaGen, located in Langenhagen,Germany, a company that focuses on the development of innovative tumor diagnostics for thedetection of rare cells (Acquired November 2010)
F-29

ALERE INC. AND SUBSIDIARIES
NOTES TO CONSOLIDATED FINANCIAL STATEMENTS (Continued)
(4) Business Combinations (Continued)
• Medlab Produtos Medicos Hospitalares Ltda, now known as Alere S.A., located in San Paulo,Brazil, a distributor of medical instruments and reagents to public and private laboratoriesthroughout Brazil and Uruguay (Acquired December 2010)
• Capital Toxicology, LLC, or Capital Toxicology, located in Austin, Texas, a privately-heldtoxicology business specializing in pain management services (Acquired December 2010)
The operating results of the acquired businesses mentioned above, except for RMD and AlereHealth Pty Ltd., are included in our professional diagnostics reporting unit and business segment. Theoperating results of RMD and Alere Health Pty Ltd. are included in our health information solutionsreporting unit and business segment. Our consolidated statement of operations for the year endedDecember 31, 2010 included revenue totaling approximately $12.6 million related to these businesses.Goodwill has been recognized in all of the acquisitions, with the exception of Unotech and Micropharm,and amounted to approximately $116.2 million. Goodwill related to the acquisition of CapitalToxicology, which totaled $11.6 million, is deductible for tax purposes. Goodwill related to all otheracquisitions is not deductible for tax purposes.
A summary of the aggregate purchase price allocation for the acquisitions consummated in 2010is as follows (in thousands):
Immunalysis TwistAlere
ToxicologyStandard
Diagnostics Other Total
Current assets(1) . . . . . . . . . . . . . . . . . $ 6,933 $ 373 $ 6,044 $ 51,056 $ 20,829 $ 85,235Property, plant and equipment . . . . . . 1,076 152 3,300 18,580 13,149 36,257Goodwill . . . . . . . . . . . . . . . . . . . . . . . . 18,234 61,463 53,435 33,798 116,186 283,116Intangible assets . . . . . . . . . . . . . . . . . . 30,600 15,700 48,400 131,179 57,976 283,855Other non-current assets . . . . . . . . . . . — — — 16,426 562 16,988
Total assets acquired . . . . . . . . . . . . 56,843 77,688 111,179 251,039 208,702 705,451
Current liabilities . . . . . . . . . . . . . . . . . . 569 731 1,640 13,389 14,749 31,078Non-current liabilities . . . . . . . . . . . . . . 50 6,107 — 32,088 32,024 70,269
Total liabilities assumed . . . . . . . . . . 619 6,838 1,640 45,477 46,773 101,347
Net assets acquired . . . . . . . . . . . . . . . 56,224 70,850 109,539 205,562 161,929 604,104Less:
Contingent consideration . . . . . . . . . 1,200 35,600 — — 52,908 89,708Present value of deferred purchase
price consideration . . . . . . . . . . . . — — — — 688 688
Cash paid . . . . . . . . . . . . . . . . . . . . . . . $55,024 $35,250 $109,539 $205,562 $108,333 $513,708
(1) Includes cash acquired of approximately $22.9 million.
F-30

ALERE INC. AND SUBSIDIARIES
NOTES TO CONSOLIDATED FINANCIAL STATEMENTS (Continued)
(4) Business Combinations (Continued)
The following are the intangible assets acquired and their respective amortizable lives (dollars inthousands):
Immunalysis TwistAlere
ToxicologyStandard
Diagnostics Other Total
Weighted-average
Useful Life
Core technology and patents . . . $ 8,800 $ 8,600 $13,300 $ 62,135 $14,050 $106,885 12.4 yearsQuality systems . . . . . . . . . . . . . . — — — — 153 153 5 yearsDatabase . . . . . . . . . . . . . . . . . . . — — — — 654 654 3 yearsTrademarks and trade names . . 800 — — 9,350 1,504 11,654 6.3 yearsLicense agreements . . . . . . . . . . — — — — 459 459 5 yearsCustomer relationships . . . . . . . . 19,900 — 35,100 45,754 24,578 125,332 14.3 yearsNon-compete agreements . . . . . 300 — — 255 2,095 2,650 4.2 yearsSoftware . . . . . . . . . . . . . . . . . . . . — — — — 5,000 5,000 7 yearsDistribution agreement . . . . . . . . 800 — — — — 800 14 yearsManufacturing know-how . . . . . . — — — — 3,683 3,683 10.5 yearsIn-process research and
development . . . . . . . . . . . . . . — 7,100 — 13,685 5,800 26,585 N/A
Total intangible assets . . . . . . $30,600 $15,700 $48,400 $131,179 $57,976 $283,855
(5) Goodwill and Other Intangible Assets
The following is a summary of goodwill and other intangible assets as of December 31, 2012(dollars in thousands):
GrossCarryingAmount
AccumulatedAmortization andImpairment Losses
NetCarryingValue
Weighted-average
Useful Life
Amortized intangible assets:Core technology and patents . . . . . . . . . . . . . . . . . $ 941,940 $ 326,044 $ 615,896 14.12 years
Other intangible assets:Supplier relationships . . . . . . . . . . . . . . . . . . . . . 18,629 15,862 2,767 9.25 yearsTrademarks and trade names . . . . . . . . . . . . . . 252,028 116,571 135,457 10.30 yearsLicense agreements . . . . . . . . . . . . . . . . . . . . . . 17,507 11,126 6,381 4.47 yearsCustomer relationships . . . . . . . . . . . . . . . . . . . . 1,910,752 930,542 980,210 15.76 yearsManufacturing know-how . . . . . . . . . . . . . . . . . . 15,332 9,607 5,725 12.21 yearsOther . . . . . . . . . . . . . . . . . . . . . . . . . . . . . . . . . . 199,880 112,091 87,789 7.41 years
Total other intangible assets . . . . . . . . . . . . . 2,414,128 1,195,799 1,218,329
Total intangible assets with finite lives . . . . . . $3,356,068 $1,521,843 $1,834,225
Intangible assets with indefinite lives:Goodwill . . . . . . . . . . . . . . . . . . . . . . . . . . . . . . . . $4,438,374 $1,389,969 $3,048,405Other intangible assets(1) . . . . . . . . . . . . . . . . . 62,935 26,484 36,451
Total intangible assets with indefinite lives . . $4,501,309 $1,416,453 $3,084,856
(1) Primarily includes an in-process research and development asset recorded in connection withcertain acquisitions.
F-31

ALERE INC. AND SUBSIDIARIES
NOTES TO CONSOLIDATED FINANCIAL STATEMENTS (Continued)
(5) Goodwill and Other Intangible Assets (Continued)
The following is a summary of goodwill and other intangible assets as of December 31, 2011(dollars in thousands):
GrossCarryingAmount
AccumulatedAmortization andImpairment Losses
NetCarryingValue
Weighted-average
Useful Life
Amortized intangible assets:Core technology and patents . . . . . . . . . . . . . . . . . $ 756,835 $ 253,266 $ 503,569 13.16 years
Other intangible assets:Supplier relationships . . . . . . . . . . . . . . . . . . . . . 18,652 14,709 3,943 9.19 yearsTrademarks and trade names . . . . . . . . . . . . . . 232,938 86,932 146,006 9.73 yearsLicense agreements . . . . . . . . . . . . . . . . . . . . . . 17,429 10,714 6,715 4.47 yearsCustomer relationships . . . . . . . . . . . . . . . . . . . . 1,753,985 717,826 1,036,159 15.55 yearsManufacturing know-how . . . . . . . . . . . . . . . . . . 10,996 6,139 4,857 12.70 yearsOther . . . . . . . . . . . . . . . . . . . . . . . . . . . . . . . . . . 168,005 83,329 84,676 7.90 years
Total other intangible assets . . . . . . . . . . . . . 2,202,005 919,649 1,282,356
Total intangible assets with finite lives . . . . . . $2,958,840 $1,172,915 $1,785,925
Intangible assets with indefinite lives:Goodwill . . . . . . . . . . . . . . . . . . . . . . . . . . . . . . . . $4,211,240 $1,389,969 $2,821,271Other intangible assets(1) . . . . . . . . . . . . . . . . . 76,686 7,140 69,546
Total intangible assets with indefinite lives . . $4,287,926 $1,397,109 $2,890,817
(1) Primarily includes an in-process research and development asset recorded in connection withcertain acquisitions.
The estimated useful lives of the individual categories of intangible assets were based on thenature of the applicable intangible assets and the expected future cash flows to be derived from thoseintangible assets. Amortization of intangible assets with finite lives is recognized over the shorter of therespective lives of the underlying license agreements, if applicable, or the period of time the assets areexpected to contribute to future cash flows. We amortize our finite-lived intangible assets on patterns inwhich the economic benefits are expected to be realized. Amortization expense of intangible assets,which in the aggregate amounted to $346.9 million, $307.7 million and $298.1 million in 2012, 2011and 2010, respectively, is included in cost of net revenue, research and development, sales andmarketing and general and administrative expenses in the accompanying consolidated statements ofoperations. The allocation of amortization expense to the expense categories is based on the intendedusage and the expected benefits of the intangible assets in relation to the expense categories.
The following is a summary of estimated aggregate amortization expense of intangible assets foreach of the five succeeding fiscal years as of December 31, 2012 (in thousands):
2013 . . . . . . . . . . . . . . . . . . . . . . . . . . . . . . . . . . . . . . . . . . . . . . . . . . . . . . . . $299,4732014 . . . . . . . . . . . . . . . . . . . . . . . . . . . . . . . . . . . . . . . . . . . . . . . . . . . . . . . . $256,9072015 . . . . . . . . . . . . . . . . . . . . . . . . . . . . . . . . . . . . . . . . . . . . . . . . . . . . . . . . $232,4892016 . . . . . . . . . . . . . . . . . . . . . . . . . . . . . . . . . . . . . . . . . . . . . . . . . . . . . . . . $204,6392017 . . . . . . . . . . . . . . . . . . . . . . . . . . . . . . . . . . . . . . . . . . . . . . . . . . . . . . . . $163,382
During the fourth quarter, we perform our annual impairment tests of the carrying value of ourgoodwill by reporting unit. Our annual impairment review conducted during the fourth quarters of 2011and 2010 indicated that a goodwill impairment charge was required in our health information solutionsbusiness segment and reporting unit. For further discussion see Note 2(h).
F-32

ALERE INC. AND SUBSIDIARIES
NOTES TO CONSOLIDATED FINANCIAL STATEMENTS (Continued)
(5) Goodwill and Other Intangible Assets (Continued)
Goodwill amounts for our professional diagnostics, health information solutions and consumerdiagnostics reporting units are summarized as follows (in thousands):
ProfessionalDiagnostics
HealthInformationSolutions
ConsumerDiagnostics Total
Goodwill at December 31, 2010 . . . . . . . . . . . . . . . . $2,326,114 $ 452,962 $52,224 $2,831,300Acquisitions(1) . . . . . . . . . . . . . . . . . . . . . . . . . . . . 352,986 31,043 — 384,029Goodwill impairment charge(2) . . . . . . . . . . . . . . . — (383,612) — (383,612)Other(3) . . . . . . . . . . . . . . . . . . . . . . . . . . . . . . . . . (9,499) (634) (313) (10,446)
Goodwill at December 31, 2011 . . . . . . . . . . . . . . . . $2,669,601 $ 99,759 $51,911 $2,821,271Acquisitions(1) . . . . . . . . . . . . . . . . . . . . . . . . . . . . 222,306 24,604 — 246,910Fair value of non-controlling interest(4) . . . . . . . . (36,040) — — (36,040)Other(3) . . . . . . . . . . . . . . . . . . . . . . . . . . . . . . . . . 10,370 680 5,214 16,264
Goodwill at December 31, 2012 . . . . . . . . . . . . . . . . $2,866,237 $ 125,043 $57,125 $3,048,405
(1) Includes initial purchase price allocation, purchase accounting adjustments recorded to theacquired entities’ opening balance sheet and additional payments made for earn-outs andmilestones achieved.
(2) We recorded a goodwill impairment charge of approximately $383.6 million during 2011 related toour health information solutions business segment and reporting unit. Any further reduction orimpairment of the value of goodwill or other intangible assets will result in additional chargesagainst earnings, which could materially reduce our reported results of operations in futureperiods.
(3) These amounts relate primarily to adjustments resulting from fluctuations in foreign currencyexchange rates.
(4) This is the correction of a prior period balance sheet classification error which we do not believe ismaterial to our 2011 or 2012 annual financial statements, or any previously reported quarterlyfinancial statements, and represents the fair value of the non-controlling interest as of December31, 2011 related to our acquisition of Axis-Shield.
We generally expense costs incurred for the internal development of intangible assets, except forcosts that are incurred to establish patents and trademarks, such as legal fees for initiating, filing andobtaining the patents and trademarks. As of December 31, 2012 and 2011, we had approximately $9.7million and $9.2 million, respectively, of costs capitalized, net of amortization, in connection withestablishing patents and trademarks which are included in other intangible assets, net, in theaccompanying consolidated balance sheets. Upon the initial filing of the patents and trademarks, wecommence amortization of such intangible assets over their estimated useful lives. Costs incurred tomaintain the patents and trademarks are expensed as incurred.
F-33

ALERE INC. AND SUBSIDIARIES
NOTES TO CONSOLIDATED FINANCIAL STATEMENTS (Continued)
(6) Long-term Debt
We had the following long-term debt balances outstanding (in thousands):
December 31,2012
December 31,2011
A term loans(1)(2) . . . . . . . . . . . . . . . . . . . . . . . . . . . . . $ 878,438 $ 917,188B term loans(1) . . . . . . . . . . . . . . . . . . . . . . . . . . . . . . . 913,438 922,688Incremental B-1 term loans(1) . . . . . . . . . . . . . . . . . . . 247,500 250,000Incremental B-2 term loans(1) . . . . . . . . . . . . . . . . . . . 196,739 —Revolving line of credit(1) . . . . . . . . . . . . . . . . . . . . . . . 22,500 —7.25% Senior notes . . . . . . . . . . . . . . . . . . . . . . . . . . . . 450,000 —7.875% Senior notes . . . . . . . . . . . . . . . . . . . . . . . . . . . 1,809 245,6219% Senior subordinated notes . . . . . . . . . . . . . . . . . . . 392,933 391,2338.625% Senior subordinated notes . . . . . . . . . . . . . . . 400,000 400,0003% Convertible senior subordinated notes . . . . . . . . . 150,000 150,000Other lines of credit . . . . . . . . . . . . . . . . . . . . . . . . . . . . 31,957 19,603Other . . . . . . . . . . . . . . . . . . . . . . . . . . . . . . . . . . . . . . . . 3,593 32,210
3,688,907 3,328,543Less: Current portion . . . . . . . . . . . . . . . . . . . . . . . . . . . (60,232) (61,092)
$3,628,675 $3,267,451
(1) Incurred under our secured credit facility.
(2) Includes “A” term loans and “Delayed Draw” term loans under our secured credit facility.
In connection with our significant long-term debt issuances, we recorded interest expense,including amortization and write-offs of deferred financing costs and original issue discounts, in ourconsolidated statements of operations for the years ended December 31, 2012, 2011 and 2010,respectively, as follows (in thousands):
2012 2011 2010
Secured credit facility(1) . . . . . . . . . . . . . . . . . . . . . . . . . . . . . . . . . . $104,916 $ 41,478 $ —Former secured credit facility(2) . . . . . . . . . . . . . . . . . . . . . . . . . . . . — 53,841(3) 60,5947.25% Senior notes . . . . . . . . . . . . . . . . . . . . . . . . . . . . . . . . . . . . . . 1,994 — —7.875% Senior notes . . . . . . . . . . . . . . . . . . . . . . . . . . . . . . . . . . . . . 44,994(4) 22,291 21,3009% Senior subordinated notes . . . . . . . . . . . . . . . . . . . . . . . . . . . . . 41,474 40,248 38,3378.625% Senior subordinated notes . . . . . . . . . . . . . . . . . . . . . . . . . 37,096 36,437 9,8923% Convertible senior subordinated notes . . . . . . . . . . . . . . . . . . . 4,984 4,988 4,986
$235,458 $199,283 $135,109
(1) Includes “A” term loans, including the “Delayed-Draw” term loans; “B” term loans; “IncrementalB-1” term loans; “Incremental B-2” term loans; and revolving line-of-credit loans. The amountincludes $5.0 million and $2.9 million in 2012 and 2011, respectively, related to the amortization offees paid for certain debt modifications.
(2) Consists of loans under our former First Lien Credit Agreement and Second Lien CreditAgreement.
(3) Amount includes approximately $29.7 million recorded in connection with the termination of ourformer secured credit facility and related interest rate swap agreement, coupled with theamortization of fees paid for certain debt modifications.
F-34

ALERE INC. AND SUBSIDIARIES
NOTES TO CONSOLIDATED FINANCIAL STATEMENTS (Continued)
(6) Long-term Debt (Continued)
(4) Amount includes approximately $23.2 million loss recorded in connection with the repurchase ofsubstantially all of our 7.875% senior notes. Included in the $23.2 million is a $12.3 million make-whole payment which has been classified within cash flow from financing activities in ourconsolidated statement of cash flows.
The following describes each of the debt instruments listed above:
(a) Secured Credit Facility
On June 30, 2011, we entered into a Credit Agreement, or secured credit facility, with certainlenders, General Electric Capital Corporation as administrative agent and collateral agent, and certainother agents and arrangers, and, along with certain of our subsidiaries, a related guaranty and securityagreement. On December 7, 2011, we entered into an amendment to our secured credit facility toprovide an additional term loan facility for the “Incremental B-1” term loans described below (all of whichwe borrowed on that date). On March 28, 2012, we entered into a further amendment to our securedcredit facility to provide an additional term loan facility for the “Incremental B-2” term loans describedbelow (all of which we borrowed on that date). The secured credit facility, as amended, provides for creditfacilities totaling $2.55 billion in the aggregate, consisting of term loans in the aggregate principal amountof $2.3 billion (consisting of “A” term loans (including “Delayed Draw” term loans) in the aggregateprincipal amount of $925.0 million, “B” term loans in the aggregate principal amount of $925.0 million,“Incremental B-1” term loans in the aggregate principal amount of $250.0 million and “Incremental B-2”term loans in the aggregate principal amount of $200.0 million), all of which we have fully drawn, and,subject to our continued compliance with the secured credit facility, a $250.0 million revolving line ofcredit (which includes a $50.0 million sublimit for the issuance of letters of credit).
We must repay the “A” term loans (excluding the “Delayed Draw” term loans) in eighteenconsecutive quarterly installments, which began on December 31, 2011 and continue throughMarch 31, 2016, in the amount of $7,812,500 each, and a final installment on June 30, 2016, in theamount of $484,375,000; we must repay the “Delayed-Draw” term loans included within the “A” termloans in fifteen consecutive quarterly installments, which began on September 30, 2012 and continuethrough March 31, 2016, in the amount of $3,750,000 each, and a final installment on June 30, 2016,in the amount of $243,750,000. We must repay the “B” term loans in twenty-two consecutive quarterlyinstallments, which began on December 31, 2011 and continue through March 31, 2017, in the amountof $2,312,500 each, and a final installment on June 30, 2017, in the amount of $874,125,000. We mustrepay the “Incremental B-1” term loans in twenty-one consecutive quarterly installments, which beganon March 31, 2012 and continue through March 31, 2017, in the amount of $625,000 each, and a finalinstallment on June 30, 2017, in the amount of $236,875,000. We must repay the “Incremental B-2”term loans in twenty consecutive quarterly installments, which began on June 30, 2012 and continuethrough March 31, 2017, in the amount of $500,000 each, and a final installment on June 30, 2017, inthe amount of $190,000,000. We have paid in full all installments of all term loans due on or beforeDecember 31, 2012. We may repay any borrowings under the revolving line of credit at any timewithout premium or penalty, but we must repay all such borrowings in no event later than June 30,2016. Notwithstanding the foregoing, and subject to certain exceptions provided for in the CreditAgreement, in the event that any of our existing 9% senior subordinated notes or existing 3%convertible senior subordinated notes remain outstanding on the date that is six months prior to therelevant maturity date thereof, respectively, then all of the term loans and revolving credit loans underthe secured credit facility shall instead mature in full on the relevant prior date.
The “A” term loans (including the “Delayed Draw” term loans) and our borrowings under therevolving credit facility bear interest at a rate per annum of, at our option, either (i) the Base Rate, as
F-35

ALERE INC. AND SUBSIDIARIES
NOTES TO CONSOLIDATED FINANCIAL STATEMENTS (Continued)
(6) Long-term Debt (Continued)
defined in the Credit Agreement, plus an applicable margin, which varies between 1.75% and 2.50%depending on our consolidated secured leverage ratio, or (ii) the Eurodollar Rate, as defined in theCredit Agreement, plus an applicable margin, which varies between 2.75% and 3.50% depending onour consolidated secured leverage ratio. The “B” term loans, the “Incremental B-1” term loans and the“Incremental B-2” term loans bear interest at a rate per annum of, at our option, either (i) the BaseRate, as defined in the Credit Agreement, plus an applicable margin, which varies between 2.50% and3.25% depending on our consolidated secured leverage ratio, or (ii) the Eurodollar Rate, as defined inthe Credit Agreement, plus an applicable margin, which varies between 3.50% and 4.25% dependingon our consolidated secured leverage ratio. Interest on “B” term loans, “Incremental B-1” term loansand “Incremental B-2” term loans based on the Eurodollar Rate is subject to a 1.00% floor with respectto the base Eurodollar Rate. We are required to pay a fee on the unused portion of the revolving creditfacility at a rate per annum of 0.50%. As of December 31, 2012, the “A” term loans (including the“Delayed-Draw” term loans), the “B” term loans, the “Incremental B-1” term loans, the “IncrementalB-2” term loans and the revolving line of credit loans bore interest at rates of 3.21%, 4.75%, 4.75%,4.75% and 3.21%, respectively, per annum.
As of December 31, 2012, we were in compliance with all financial covenants related to the abovedebt, which consisted principally of a maximum consolidated secured leverage ratio, a minimumconsolidated interest coverage ratio and a limit on capital expenditures.
As of December 31, 2012, accrued interest related to the secured credit facility amounted to$1.4 million.
(b) First Lien Credit Agreement and Second Lien Credit Agreement
In connection with entering into the secured credit facility on June 30, 2011, we repaid in full alloutstanding indebtedness under and terminated our First Lien Credit Agreement, or senior securedcredit facility, and our Second Lien Credit Agreement, or junior secured credit facility (and, collectivelywith the senior secured credit facility, our former secured credit facility), each dated June 26, 2007,with certain lenders, General Electric Capital Corporation, as administrative agent and collateral agent,and certain other agents and arrangers, and certain related guaranty and security agreements. Theaggregate outstanding principal amount of the loans repaid under our former secured credit facility inconnection with the termination thereof was approximately $1.2 billion.
In August 2007, we entered into interest rate swap contracts, with an effective date ofSeptember 28, 2007, that had a total notional value of $350.0 million and an original maturity date ofSeptember 28, 2010. These interest rate swap contracts paid us variable interest at the three-monthLIBOR rate, and we paid the counterparties a fixed rate of 4.85%. In March 2009, we extended ourAugust 2007 interest rate hedge for an additional two-year period commencing in September 2010 at aone-month LIBOR rate of 2.54%. These interest rate swap contracts were entered into to convert$350.0 million of the $1.2 billion variable rate term loans under our former secured credit facility intofixed rate debt. In connection with entering into the secured credit facility on June 30, 2011, we paid$10.1 million to terminate these interest rate swap contracts which was recorded in interest expense,including amortization of original issue discounts and deferred financing costs, in our consolidatedstatements of operations.
In January 2009, we entered into interest rate swap contracts, with an effective date ofJanuary 14, 2009, that had a total notional value of $500.0 million and a maturity date of January 5,2011. These interest rate swap contracts paid us variable interest at the one-month LIBOR rate, and
F-36
ALERE INC. AND SUBSIDIARIES
NOTES TO CONSOLIDATED FINANCIAL STATEMENTS (Continued)
(6) Long-term Debt (Continued)
we paid the counterparties a fixed rate of 1.195%. These interest rate swap contracts were entered intoto convert $500.0 million of the $1.2 billion variable rate term loan under our former secured creditfacility into fixed rate debt. We did not extend the terms of these interest rate swap contracts afterJanuary 5, 2011.
(c) 7.25% Senior Notes
On December 11, 2012, we sold a total of $450.0 million aggregate principal amount of7.25% senior notes due 2018, or the 7.25% senior notes, in a private placement to initial purchasers,who agreed to resell the notes only to qualified institutional buyers and to persons outside the UnitedStates; we sold the 7.25% senior notes at an initial offering price of 100%. Net proceeds from thisoffering amounted to $443.2 million, which was net of the underwriters’ commissions and offeringexpenses totaling $6.8 million. We used $267.4 million of the net proceeds to purchase $248.2 millionoutstanding principal amount of the 7.875% senior notes as described below and $170.0 million to paydown a portion of the outstanding balance under our revolving line of credit.
The 7.25% senior notes were issued under an indenture dated August 11, 2009, as amended orsupplemented, the 7.25% Indenture. The 7.25% senior notes accrue interest at the rate of 7.25% perannum. Interest on the 7.25% senior notes is payable semi-annually on June 15 and December 15,beginning on June 15, 2013. The 7.25% senior notes mature on July 1, 2018, unless earlier redeemed.
We may redeem the 7.25% senior notes, in whole or part, at any time on or after December 15,2015, by paying the principal amount of the notes being redeemed plus a declining premium, plusaccrued and unpaid interest to, but excluding, the redemption date. The premium declines from3.625% during the twelve months on and after December 15, 2015 to 1.813% during the six months onand after December 15, 2016 to zero on and after June 15, 2017. At any time prior to December 15,2015, we may redeem up to 35% of the aggregate principal amount of the 7.25% senior notes withmoney that we raise in certain equity offerings, so long as (i) we pay 107.25% of the principal amountof the notes being redeemed, plus accrued and unpaid interest to, but excluding, the redemption date;(ii) we redeem the notes within 90 days of completing such equity offering; and (iii) at least 65% of theaggregate principal amount of the 7.25% senior notes remains outstanding afterwards. In addition, atany time prior to December 15, 2015, we may redeem some or all of the 7.25% senior notes by payingthe principal amount of the notes being redeemed plus a make-whole premium, plus accrued andunpaid interest to, but excluding, the redemption date.
If a change of control occurs, subject to specified conditions, we must give holders of the7.25% senior notes an opportunity to sell their notes to us at a purchase price of 101% of the principalamount of the notes, plus accrued and unpaid interest to, but excluding, the date of the purchase.
If we, or our subsidiaries, engage in asset sales, we, or they, generally must either invest the netcash proceeds from such sales in our or their businesses within a specified period of time, prepaycertain indebtedness or make an offer to purchase a principal amount of the 7.25% senior notes equalto the excess net cash proceeds, subject to certain exceptions. The purchase price of the notes wouldbe 100% of their principal amount, plus accrued and unpaid interest.
The 7.25% senior notes are unsecured and are equal in right of payment to all of our existing andfuture senior debt, including our borrowings under our secured credit facility. Our obligations under the7.25% senior notes and the 7.25% Indenture are fully and unconditionally guaranteed, jointly and
F-37

ALERE INC. AND SUBSIDIARIES
NOTES TO CONSOLIDATED FINANCIAL STATEMENTS (Continued)
(6) Long-term Debt (Continued)
severally, on an unsecured senior basis by certain of our domestic subsidiaries, and the obligations ofsuch domestic subsidiaries under their guarantees are equal in right of payment to all of their existingand future senior debt. See Note 24 for guarantor financial information.
The 7.25% Indenture contains covenants that limit our ability, and the ability of our subsidiaries, to,among other things, incur additional debt; pay dividends on capital stock or redeem, repurchase orretire capital stock or subordinated debt; make certain investments; create liens on assets; transfer orsell assets; engage in transactions with affiliates; create restrictions on our or their ability pay dividendsor make loans, asset transfers or other payments to us or them; issue capital stock; engage in anybusiness, other than our or their existing businesses and related businesses; enter into sale andleaseback transactions; incur layered indebtedness; and consolidate, merge or transfer all orsubstantially all of our, or their, assets, taken as a whole. These covenants are subject to certainexceptions and qualifications. The 7.25% Indenture contains customary events of default entitling thetrustee or the holders of the 7.25% senior notes to declare all amounts owed pursuant to the 7.25%senior notes immediately payable if we violate certain of our obligations.
As of December 31, 2012, accrued interest related to the 7.25% senior notes amounted to$1.9 million.
(d) 7.875% Senior Notes
During the third quarter of 2009, we sold a total of $250.0 million aggregate principal amount of7.875% senior notes due 2016, or the 7.875% senior notes, in two separate transactions on August 11,2009 and September 28, 2009. Net proceeds from these offerings amounted to approximately$240.0 million, which was net of underwriters’ commissions totaling $3.7 million and original issuediscount totaling $6.3 million. The 7.875% senior notes were issued under an indenture datedAugust 11, 2009, as amended or supplemented, the 7.875% Indenture. The 7.875% senior notesaccrued interest from the dates of their respective issuances at the rate of 7.875% per annum. Intereston the notes was payable semi-annually on February 1 and August 1, commencing on February 1,2010. The terms of the notes provided that they matured on February 1, 2016, unless earlierredeemed.
In December 2012, we used $267.4 million of the net proceeds of our sale of the 7.25% seniornotes to purchase $248.2 million outstanding principal amount of the 7.875% senior notes. Thepurchased 7.875% senior notes represented 99.3% of the total then-outstanding principal amount ofthe 7.875% senior notes.
On February 13, 2013, we redeemed the remaining $1.8 million outstanding principal amount ofthe 7.875% senior notes pursuant to our optional redemption right under the 7.875% Indenture, and wesubsequently terminated the 7.875% Indenture.
As of December 31, 2012, accrued interest related to the 7.875% senior notes amounted to$0.1 million.
(e) Senior Subordinated Notes
On May 12, 2009, we sold $400.0 million aggregate principal amount of 9% senior subordinatednotes due 2016, or the 9% subordinated notes, in a public offering at an initial offering price of96.865%. Net proceeds from this offering amounted to $379.5 million, which was net of underwriters’commissions totaling $8.0 million and original issue discount totaling $12.5 million.
F-38

ALERE INC. AND SUBSIDIARIES
NOTES TO CONSOLIDATED FINANCIAL STATEMENTS (Continued)
(6) Long-term Debt (Continued)
On September 21, 2010, we sold $400.0 million aggregate principal amount of 8.625% seniorsubordinated notes due 2018, or the 8.625% subordinated notes, in a private placement to initialpurchasers, who agreed to resell the notes only to qualified institutional buyers and to persons outsidethe United States; we sold the 8.625% subordinated notes at an initial offering price of 100%. Netproceeds from this offering amounted to $393.0 million, which was net of underwriters’ commissionstotaling $7.0 million. These notes were subsequently exchanged for new notes having substantially thesame terms in an exchange offer registered under the Securities Act. We refer to the 9% subordinatednotes and the 8.625% subordinated notes collectively as our senior subordinated notes.
The 9% subordinated notes, which were issued under an indenture dated May 12, 2009, asamended or supplemented, accrue interest from the date of their issuance, or May 12, 2009, at therate of 9% per annum. Interest on the 9% subordinated notes is payable semi-annually on May 15 andNovember 15, beginning on November 15, 2009. The 9% subordinated notes mature on May 15, 2016,unless earlier redeemed. The 8.625% subordinated notes, which were issued under a supplementalindenture dated September 21, 2010, as amended or supplemented, accrue interest from the date oftheir issuance, or September 21, 2010, at the rate of 8.625% per annum. Interest on the 8.625% notesis payable semi-annually on April 1 and October 1, beginning on April 1, 2011. The 8.625%subordinated notes mature on October 1, 2018, unless earlier redeemed.
We may redeem the 9% subordinated notes, in whole or part, at any time (which may be morethan once) on or after May 15, 2013, by paying the principal amount of the notes being redeemed plusa declining premium, plus accrued and unpaid interest to, but excluding, the redemption date. Thepremium declines from 4.50% during the twelve months after May 15, 2013 to 2.25% during the twelvemonths after May 15, 2014 to zero on and after May 15, 2015. In addition, at any time prior to May 15,2013, we may redeem some or all of the 9% subordinated notes by paying the principal amount of thenotes being redeemed plus a make-whole premium, plus accrued and unpaid interest to, but excluding,the redemption date.
We may redeem the 8.625% subordinated notes, in whole or part, at any time (which may be morethan once) on or after October 1, 2014, by paying the principal amount of the notes being redeemedplus a declining premium, plus accrued and unpaid interest to, but excluding, the redemption date. Thepremium declines from 4.313% during the twelve months on and after October 1, 2014 to 2.156%during the twelve months on and after October 1, 2015 to zero on and after October 1, 2016. Prior toOctober 1, 2013, we may redeem, in whole or part, at any time (which may be more than once), up to35% of the aggregate principal amount of the 8.625% subordinated notes with money that we raise incertain equity offerings so long as (i) we pay 108.625% of the principal amount of the notes beingredeemed, plus accrued and unpaid interest to, but excluding, the redemption date; (ii) we redeem thenotes within 90 days of completing such equity offering; and (iii) at least 65% of the aggregate principalamount of the 8.625% subordinated notes, including any 8.625% subordinated notes issued afterSeptember 21, 2010, remains outstanding afterwards. In addition, at any time prior to October 1, 2014,we may redeem some or all of the 8.625% subordinated notes by paying the principal amount of thenotes being redeemed plus a make-whole premium, plus accrued and unpaid interest to, but excluding,the redemption date.
If a change of control occurs, subject to specified conditions, we must give holders of the seniorsubordinated notes an opportunity to sell their notes to us at a purchase price of 101% of the principalamount of the notes, plus accrued and unpaid interest to, but excluding, the date of the purchase.
F-39
ALERE INC. AND SUBSIDIARIES
NOTES TO CONSOLIDATED FINANCIAL STATEMENTS (Continued)
(6) Long-term Debt (Continued)
If we, or our subsidiaries, engage in asset sales, we, or they, generally must either invest the netcash proceeds from such sales in our or their businesses within a specified period of time, prepaysenior debt or make an offer to purchase a principal amount of the senior subordinated notes (on a prorata basis with respect to the 9% subordinated notes and the 8.625% subordinated notes) equal to theexcess net cash proceeds, subject to certain exceptions. The purchase price of the seniorsubordinated notes would be 100% of their principal amount, plus accrued and unpaid interest.
The senior subordinated notes are unsecured and are subordinated in right of payment to all ofour existing and future senior debt, including our borrowings under our secured credit facility and oursenior notes, and equal in right of payment to our 3% convertible senior subordinated notes. Ourobligations under the senior subordinated notes and the indentures under which they were issued arefully and unconditionally guaranteed, jointly and severally, on an unsecured senior subordinated basisby certain of our domestic subsidiaries, and the obligations of such domestic subsidiaries under theirguarantees are subordinated in right of payment to all of their existing and future senior debt, includingtheir guarantees with respect to our secured credit facility and our senior notes. See Note 24 forguarantor financial information.
The indentures under which the senior subordinated notes were issued contain covenants thatlimit our ability, and the ability of our subsidiaries, to, among other things, incur additional debt; paydividends on capital stock or redeem, repurchase or retire capital stock or subordinated debt; makecertain investments; create liens on assets; transfer or sell assets; engage in transactions withaffiliates; create restrictions on our or their ability pay dividends or make loans, asset transfers or otherpayments to us or them; issue capital stock; engage in any business, other than our or their existingbusinesses and related businesses; enter into sale and leaseback transactions; incur layeredindebtedness; and consolidate, merge or transfer all or substantially all of our, or their, assets, taken asa whole. These covenants are subject to certain exceptions and qualifications. These indenturescontain customary events of default entitling the trustee or the holders of the relevant seniorsubordinated notes to declare all amounts owed pursuant the relevant senior subordinated notesimmediately payable if we violate certain of our obligations with respect thereto.
As of December 31, 2012, accrued interest related to the 9% subordinated notes and the 8.625%subordinated notes amounted to $4.5 million and $8.6 million, respectively.
(f) 3% Convertible Senior Subordinated Notes
On May 14, 2007, we sold $150.0 million principal amount of 3% convertible senior subordinatednotes due 2016, or the 3% convertible senior subordinated notes, in a private placement to qualifiedinstitutional buyers, at an initial offering price of 100%. At the initial conversion price of $52.30, the 3%convertible senior subordinated notes were convertible into an aggregate of 2.9 million shares of ourcommon stock. The conversion price was subject to adjustment one year from the date of sale. Basedupon the daily volume-weighted price per share of our common stock for the thirty consecutive tradingdays ending May 9, 2008, the conversion price decreased from $52.30 to $43.98 in May 2008. Thedecrease in conversion price resulted in additional shares of our common stock becoming issuableupon conversion of the 3% convertible senior subordinated notes. The 3% convertible seniorsubordinated notes are now convertible into 3.4 million shares of our common stock at a conversionprice of $43.98. Interest accrues at 3% per annum, compounded daily, on the outstanding principalamount of the 3% convertible senior subordinated notes and is payable in arrears on May 15th andNovember 15th of each year, beginning on November 15, 2007. We have paid in full all installments ofinterest on the 3% convertible senior subordinated notes due on or before December 31, 2012.
F-40
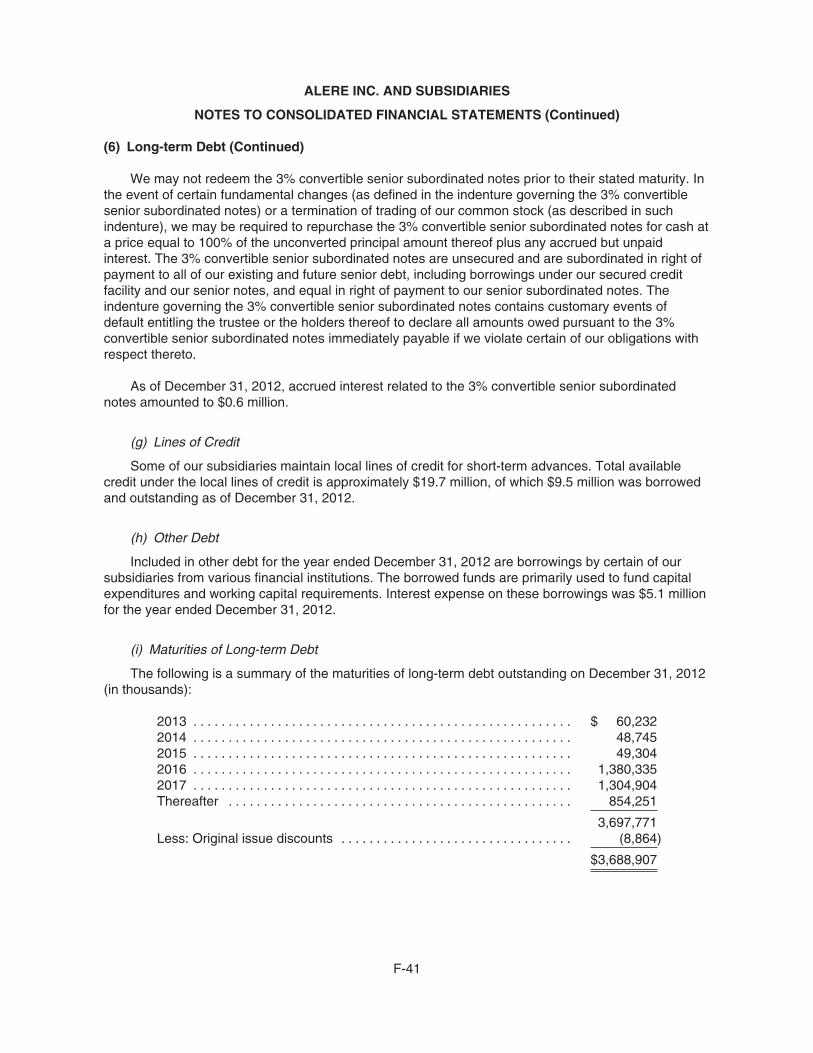
ALERE INC. AND SUBSIDIARIES
NOTES TO CONSOLIDATED FINANCIAL STATEMENTS (Continued)
(6) Long-term Debt (Continued)
We may not redeem the 3% convertible senior subordinated notes prior to their stated maturity. Inthe event of certain fundamental changes (as defined in the indenture governing the 3% convertiblesenior subordinated notes) or a termination of trading of our common stock (as described in suchindenture), we may be required to repurchase the 3% convertible senior subordinated notes for cash ata price equal to 100% of the unconverted principal amount thereof plus any accrued but unpaidinterest. The 3% convertible senior subordinated notes are unsecured and are subordinated in right ofpayment to all of our existing and future senior debt, including borrowings under our secured creditfacility and our senior notes, and equal in right of payment to our senior subordinated notes. Theindenture governing the 3% convertible senior subordinated notes contains customary events ofdefault entitling the trustee or the holders thereof to declare all amounts owed pursuant to the 3%convertible senior subordinated notes immediately payable if we violate certain of our obligations withrespect thereto.
As of December 31, 2012, accrued interest related to the 3% convertible senior subordinatednotes amounted to $0.6 million.
(g) Lines of Credit
Some of our subsidiaries maintain local lines of credit for short-term advances. Total availablecredit under the local lines of credit is approximately $19.7 million, of which $9.5 million was borrowedand outstanding as of December 31, 2012.
(h) Other Debt
Included in other debt for the year ended December 31, 2012 are borrowings by certain of oursubsidiaries from various financial institutions. The borrowed funds are primarily used to fund capitalexpenditures and working capital requirements. Interest expense on these borrowings was $5.1 millionfor the year ended December 31, 2012.
(i) Maturities of Long-term Debt
The following is a summary of the maturities of long-term debt outstanding on December 31, 2012(in thousands):
2013 . . . . . . . . . . . . . . . . . . . . . . . . . . . . . . . . . . . . . . . . . . . . . . . . . . . . . . $ 60,2322014 . . . . . . . . . . . . . . . . . . . . . . . . . . . . . . . . . . . . . . . . . . . . . . . . . . . . . . 48,7452015 . . . . . . . . . . . . . . . . . . . . . . . . . . . . . . . . . . . . . . . . . . . . . . . . . . . . . . 49,3042016 . . . . . . . . . . . . . . . . . . . . . . . . . . . . . . . . . . . . . . . . . . . . . . . . . . . . . . 1,380,3352017 . . . . . . . . . . . . . . . . . . . . . . . . . . . . . . . . . . . . . . . . . . . . . . . . . . . . . . 1,304,904Thereafter . . . . . . . . . . . . . . . . . . . . . . . . . . . . . . . . . . . . . . . . . . . . . . . . . 854,251
3,697,771Less: Original issue discounts . . . . . . . . . . . . . . . . . . . . . . . . . . . . . . . . . (8,864)
$3,688,907
F-41

ALERE INC. AND SUBSIDIARIES
NOTES TO CONSOLIDATED FINANCIAL STATEMENTS (Continued)
(7) Fair Value Measurements
The following tables present information about our assets and liabilities that are measured at fairvalue on a recurring basis as of December 31, 2012 and 2011, and indicates the fair value hierarchy ofthe valuation techniques we utilized to determine such fair value (in thousands):
DescriptionDecember 31,
2012
Quoted Prices inActive Markets
(Level 1)
Significant OtherObservable Inputs
(Level 2)
UnobservableInputs
(Level 3)
Assets:Marketable securities . . . . . . . . . . . . . . . . . . $ 904 $ 904 $ — $ —
Total assets . . . . . . . . . . . . . . . . . . . . . . . . $ 904 $ 904 $ — $ —
Liabilities:Contingent consideration obligations(1) . . . $176,172 $ — $ — $176,172
Total liabilities . . . . . . . . . . . . . . . . . . . . . . $176,172 $ — $ — $176,172
DescriptionDecember 31,
2011
Quoted Prices inActive Markets
(Level 1)
Significant OtherObservable Inputs
(Level 2)
UnobservableInputs
(Level 3)
Assets:Marketable securities . . . . . . . . . . . . . . . . . . $ 3,340 $ 3,340 $ — $ —
Total assets . . . . . . . . . . . . . . . . . . . . . . . . $ 3,340 $ 3,340 $ — $ —
Liabilities:Contingent consideration obligations(1) . . . $140,047 $ — $ — $140,047Foreign exchange forward contracts(2) . . . . 447 — 447 —
Total liabilities . . . . . . . . . . . . . . . . . . . . . . $140,494 $ — $ 447 $140,047
(1) We determine the fair value of the contingent consideration obligations based on a probability-weighted approach derived from earn-out criteria estimates and a probability assessment withrespect to the likelihood of achieving the various earn-out criteria. The measurement is basedupon significant inputs not observable in the market. Significant increases or decreases in any ofthese inputs could result in a significantly higher or lower fair value measurement. Changes in thefair value of these contingent consideration obligations are recorded as income or expense withinoperating income in our consolidated statements of operations. See Note 11 for additionalinformation on the valuation of our contingent consideration obligations.
(2) The fair value of the foreign exchange forward contracts was measured using readily observablemarket inputs, such as quotations on forward foreign exchange points and foreign interest rates.
Changes in the fair value of our Level 3 contingent consideration obligations during the year endedDecember 31, 2012 were as follows (in thousands):
Fair value of contingent consideration obligations, January 1, 2012 . . . . . . . . . . . . . . . . . . . . $140,047Acquisition date fair value of contingent consideration obligations recorded . . . . . . . . . . . . . . 75,620Foreign currency adjustments . . . . . . . . . . . . . . . . . . . . . . . . . . . . . . . . . . . . . . . . . . . . . . . . . . . 395Payments . . . . . . . . . . . . . . . . . . . . . . . . . . . . . . . . . . . . . . . . . . . . . . . . . . . . . . . . . . . . . . . . . . . (33,211)Present value accretion . . . . . . . . . . . . . . . . . . . . . . . . . . . . . . . . . . . . . . . . . . . . . . . . . . . . . . . . 19,230Adjustments, net (income) expense . . . . . . . . . . . . . . . . . . . . . . . . . . . . . . . . . . . . . . . . . . . . . . (25,909)
Fair value of contingent consideration obligations, December 31, 2012 . . . . . . . . . . . . . . . . . $176,172
F-42

ALERE INC. AND SUBSIDIARIES
NOTES TO CONSOLIDATED FINANCIAL STATEMENTS (Continued)
(7) Fair Value Measurements (Continued)
At December 31, 2012 and 2011, the carrying amounts of cash and cash equivalents, restrictedcash, receivables, accounts payable and other current liabilities approximated their estimated fair values.
The carrying amount and estimated fair value of our long-term debt were $3.7 billion atDecember 31, 2012. The carrying amount and estimated fair value of our long-term debt were $3.3billion at December 31, 2011. The estimated fair value of our long-term debt was determined usinginformation derived from available market sources (Level 2 in the fair value hierarchy) and may not berepresentative of actual values that could have been or will be realized in the future.
(8) Capital Leases
The following is a schedule of the future minimum lease payments under capital leases, togetherwith the present value of such payments as of December 31, 2012 (in thousands):
2013 . . . . . . . . . . . . . . . . . . . . . . . . . . . . . . . . . . . . . . . . . . . . . . . . . . . . . . . . . $ 6,6832014 . . . . . . . . . . . . . . . . . . . . . . . . . . . . . . . . . . . . . . . . . . . . . . . . . . . . . . . . . 5,0962015 . . . . . . . . . . . . . . . . . . . . . . . . . . . . . . . . . . . . . . . . . . . . . . . . . . . . . . . . . 4,3322016 . . . . . . . . . . . . . . . . . . . . . . . . . . . . . . . . . . . . . . . . . . . . . . . . . . . . . . . . . 1,9442017 . . . . . . . . . . . . . . . . . . . . . . . . . . . . . . . . . . . . . . . . . . . . . . . . . . . . . . . . . 838Thereafter . . . . . . . . . . . . . . . . . . . . . . . . . . . . . . . . . . . . . . . . . . . . . . . . . . . . 708
Total future minimum lease payments . . . . . . . . . . . . . . . . . . . . . . . . . . . . . 19,601Less: Imputed interest . . . . . . . . . . . . . . . . . . . . . . . . . . . . . . . . . . . . . . . . . . —
Present value of future minimum lease payments . . . . . . . . . . . . . . . . . . . . 19,601Less: Current portion . . . . . . . . . . . . . . . . . . . . . . . . . . . . . . . . . . . . . . . . . . . (6,684)
$12,917
At December 31, 2012, the capitalized amounts of the building, machinery and equipment andcomputer equipment under capital leases were as follows (in thousands):
Machinery, laboratory equipment and tooling . . . . . . . . . . . . . . . . . . . . . . . . $33,096Computer equipment . . . . . . . . . . . . . . . . . . . . . . . . . . . . . . . . . . . . . . . . . . . 633Furniture and fixtures . . . . . . . . . . . . . . . . . . . . . . . . . . . . . . . . . . . . . . . . . . . 210Vehicles . . . . . . . . . . . . . . . . . . . . . . . . . . . . . . . . . . . . . . . . . . . . . . . . . . . . . . 39Leasehold improvements . . . . . . . . . . . . . . . . . . . . . . . . . . . . . . . . . . . . . . . . —
33,978Less: Accumulated amortization . . . . . . . . . . . . . . . . . . . . . . . . . . . . . . . . . . (4,351)
$29,627
The amortization expense of assets recorded under capital leases is included in depreciation andamortization expense of property, plant and equipment.
(9) Postretirement Benefit Plans
(a) Employee Savings Plans
Our company and several of our U.S.-based subsidiaries sponsor various 401(k) savings plans, towhich eligible domestic employees may voluntarily contribute a portion of their income, subject to
F-43

ALERE INC. AND SUBSIDIARIES
NOTES TO CONSOLIDATED FINANCIAL STATEMENTS (Continued)
(9) Postretirement Benefit Plans (Continued)
statutory limitations. In addition to the participants’ own contributions to these 401(k) savings plans, wematch such contributions up to a designated level. Total matching contributions related to employeesavings plans were $8.8 million, $7.6 million and $6.9 million in 2012, 2011 and 2010, respectively.
(b) U.K. Pension Plans
Changes in benefit obligations, plan assets, funded status and amounts recognized on theaccompanying balance sheet as of and for the years ended December 31, 2012 and 2011, for ourDefined Benefit Plan were as follows (in thousands):
2012 2011
Change in projected benefit obligationBenefit obligation at beginning of year . . . . . . . . . . . . . . . . . . . . . . . . . . . . . . . . . . . $14,966 $14,391Interest cost . . . . . . . . . . . . . . . . . . . . . . . . . . . . . . . . . . . . . . . . . . . . . . . . . . . . . . . . 742 773Actuarial loss . . . . . . . . . . . . . . . . . . . . . . . . . . . . . . . . . . . . . . . . . . . . . . . . . . . . . . . 2,211 274Benefits paid . . . . . . . . . . . . . . . . . . . . . . . . . . . . . . . . . . . . . . . . . . . . . . . . . . . . . . . (417) (260)Foreign exchange impact . . . . . . . . . . . . . . . . . . . . . . . . . . . . . . . . . . . . . . . . . . . . . 838 (212)
Benefit obligation at end of year . . . . . . . . . . . . . . . . . . . . . . . . . . . . . . . . . . . . . . $18,340 $14,966Change in plan assets
Fair value of plan assets at beginning of year . . . . . . . . . . . . . . . . . . . . . . . . . . . . . $11,272 $10,855Actual return on plan assets . . . . . . . . . . . . . . . . . . . . . . . . . . . . . . . . . . . . . . . . . . . 1,634 (90)Employer contribution . . . . . . . . . . . . . . . . . . . . . . . . . . . . . . . . . . . . . . . . . . . . . . . . 916 927Benefits paid . . . . . . . . . . . . . . . . . . . . . . . . . . . . . . . . . . . . . . . . . . . . . . . . . . . . . . . (417) (260)Foreign exchange impact . . . . . . . . . . . . . . . . . . . . . . . . . . . . . . . . . . . . . . . . . . . . . 638 (160)
Fair value of plan assets at end of year . . . . . . . . . . . . . . . . . . . . . . . . . . . . . . . . $14,043 $11,272Funded status . . . . . . . . . . . . . . . . . . . . . . . . . . . . . . . . . . . . . . . . . . . . . . . . . . . . . . . $ (4,297) $ (3,694)
Accumulated benefit obligation . . . . . . . . . . . . . . . . . . . . . . . . . . . . . . . . . . . . . . . . $18,340 $14,966
The net amounts recognized in the accompanying consolidated balance sheets are shown incurrent liabilities and were $4.3 million and $3.7 million for the years ended December 31, 2012 and2011, respectively.
The following represents the amounts recognized in other comprehensive income (loss) for theyear ended December 31, 2012:
Amortization of net loss . . . . . . . . . . . . . . . . . . . . . . . . . . . . . . . . . . . . . . . . . . . . . . . . . . (114)Amortization of prior service cost . . . . . . . . . . . . . . . . . . . . . . . . . . . . . . . . . . . . . . . . . . (422)New actuarial gains . . . . . . . . . . . . . . . . . . . . . . . . . . . . . . . . . . . . . . . . . . . . . . . . . . . . . 1,212Foreign exchange impact . . . . . . . . . . . . . . . . . . . . . . . . . . . . . . . . . . . . . . . . . . . . . . . . 419Total . . . . . . . . . . . . . . . . . . . . . . . . . . . . . . . . . . . . . . . . . . . . . . . . . . . . . . . . . . . . . . . . . $1,095
The amortization of prior service cost is expected to be approximately $0.4 million in 2013.
Amounts recognized in accumulated other comprehensive income (loss) for the years endingDecember 31, 2012 and 2011 are as follows:
2012 2011
Net actuarial loss . . . . . . . . . . . . . . . . . . . . . . . . . . . . . . . . . . . . . . . . . . . . . . . . . . . . . . . . $4,098 $2,825Prior service costs . . . . . . . . . . . . . . . . . . . . . . . . . . . . . . . . . . . . . . . . . . . . . . . . . . . . . . . 4,754 4,932Net amount recognized . . . . . . . . . . . . . . . . . . . . . . . . . . . . . . . . . . . . . . . . . . . . . . . . . . . $8,852 $7,757
F-44
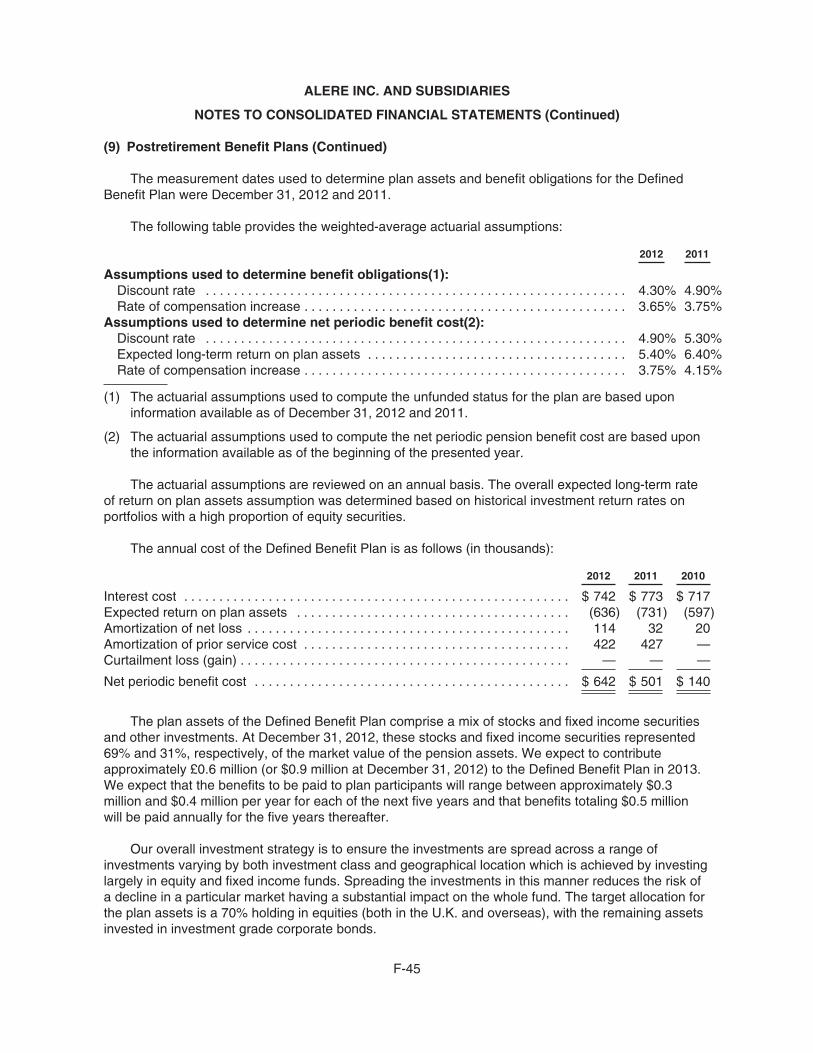
ALERE INC. AND SUBSIDIARIES
NOTES TO CONSOLIDATED FINANCIAL STATEMENTS (Continued)
(9) Postretirement Benefit Plans (Continued)
The measurement dates used to determine plan assets and benefit obligations for the DefinedBenefit Plan were December 31, 2012 and 2011.
The following table provides the weighted-average actuarial assumptions:
2012 2011
Assumptions used to determine benefit obligations(1):Discount rate . . . . . . . . . . . . . . . . . . . . . . . . . . . . . . . . . . . . . . . . . . . . . . . . . . . . . . . . . . . . 4.30% 4.90%Rate of compensation increase . . . . . . . . . . . . . . . . . . . . . . . . . . . . . . . . . . . . . . . . . . . . . . 3.65% 3.75%
Assumptions used to determine net periodic benefit cost(2):Discount rate . . . . . . . . . . . . . . . . . . . . . . . . . . . . . . . . . . . . . . . . . . . . . . . . . . . . . . . . . . . . 4.90% 5.30%Expected long-term return on plan assets . . . . . . . . . . . . . . . . . . . . . . . . . . . . . . . . . . . . . 5.40% 6.40%Rate of compensation increase . . . . . . . . . . . . . . . . . . . . . . . . . . . . . . . . . . . . . . . . . . . . . . 3.75% 4.15%
(1) The actuarial assumptions used to compute the unfunded status for the plan are based uponinformation available as of December 31, 2012 and 2011.
(2) The actuarial assumptions used to compute the net periodic pension benefit cost are based uponthe information available as of the beginning of the presented year.
The actuarial assumptions are reviewed on an annual basis. The overall expected long-term rateof return on plan assets assumption was determined based on historical investment return rates onportfolios with a high proportion of equity securities.
The annual cost of the Defined Benefit Plan is as follows (in thousands):
2012 2011 2010
Interest cost . . . . . . . . . . . . . . . . . . . . . . . . . . . . . . . . . . . . . . . . . . . . . . . . . . . . . . . $ 742 $ 773 $ 717Expected return on plan assets . . . . . . . . . . . . . . . . . . . . . . . . . . . . . . . . . . . . . . . (636) (731) (597)Amortization of net loss . . . . . . . . . . . . . . . . . . . . . . . . . . . . . . . . . . . . . . . . . . . . . . 114 32 20Amortization of prior service cost . . . . . . . . . . . . . . . . . . . . . . . . . . . . . . . . . . . . . . 422 427 —Curtailment loss (gain) . . . . . . . . . . . . . . . . . . . . . . . . . . . . . . . . . . . . . . . . . . . . . . . — — —
Net periodic benefit cost . . . . . . . . . . . . . . . . . . . . . . . . . . . . . . . . . . . . . . . . . . . . . $ 642 $ 501 $ 140
The plan assets of the Defined Benefit Plan comprise a mix of stocks and fixed income securitiesand other investments. At December 31, 2012, these stocks and fixed income securities represented69% and 31%, respectively, of the market value of the pension assets. We expect to contributeapproximately £0.6 million (or $0.9 million at December 31, 2012) to the Defined Benefit Plan in 2013.We expect that the benefits to be paid to plan participants will range between approximately $0.3million and $0.4 million per year for each of the next five years and that benefits totaling $0.5 millionwill be paid annually for the five years thereafter.
Our overall investment strategy is to ensure the investments are spread across a range ofinvestments varying by both investment class and geographical location which is achieved by investinglargely in equity and fixed income funds. Spreading the investments in this manner reduces the risk ofa decline in a particular market having a substantial impact on the whole fund. The target allocation forthe plan assets is a 70% holding in equities (both in the U.K. and overseas), with the remaining assetsinvested in investment grade corporate bonds.
F-45

ALERE INC. AND SUBSIDIARIES
NOTES TO CONSOLIDATED FINANCIAL STATEMENTS (Continued)
(9) Postretirement Benefit Plans (Continued)
The fair values of our pension plan assets at December 31, 2012 and 2011 by asset category arepresented in the following table (Level 2 in the fair value hierarchy).
Plan Assets atDecember 31,
Asset Category 2012 2011
Equity securities:U.K. equities . . . . . . . . . . . . . . . . . . . . . . . . . . . . . . . . . . . . . . . . . . . . . . . . . . . . . . . . $ 4,807 $ 3,805Overseas equities . . . . . . . . . . . . . . . . . . . . . . . . . . . . . . . . . . . . . . . . . . . . . . . . . . . 2,532 1,993U.S. equities . . . . . . . . . . . . . . . . . . . . . . . . . . . . . . . . . . . . . . . . . . . . . . . . . . . . . . . . 2,219 1,789
Debt securities — corporate bonds . . . . . . . . . . . . . . . . . . . . . . . . . . . . . . . . . . . . . . . 4,286 3,450Other — cash . . . . . . . . . . . . . . . . . . . . . . . . . . . . . . . . . . . . . . . . . . . . . . . . . . . . . . . . 198 235
Total plan assets . . . . . . . . . . . . . . . . . . . . . . . . . . . . . . . . . . . . . . . . . . . . . . . . . . $14,042 $11,272
The table above presents the fair value of our plan’s assets in accordance with the fair valuehierarchy. The pension plan assets are measured using net asset value per share (or its equivalent)and are reported as a Level 2 investment above due to our ability to redeem the investment either atthe balance sheet date or within limited time restrictions.
Unipath Limited, or Unipath, contributed $0.4 million in 2012, $0.3 million in 2011 and $0.4 millionin 2010 to a Defined Contribution Plan, which was recognized as an expense in the accompanyingconsolidated statement of operations.
(10) Derivative Financial Instruments
We may manage our economic and transaction exposure to certain market-based risks throughthe use of derivative instruments. Our objective for holding derivative instruments has been to reducevolatility of net earnings and cash flows associated with changes in interest rates and foreign currencyexchange rates. We do not hold or issue derivative financial instruments for speculative purposes.
(a) Interest Rate Risk
We used interest rate swap contracts from time to time in the management of our interest rateexposure related to our former secured credit facility. On June 30, 2011, we entered into a newsecured credit facility and, in connection therewith, repaid in full all outstanding indebtedness underand terminated our former secured credit facility and related interest rate swaps.
(b) Foreign Currency Risk
In connection with our acquisition of Axis-Shield, we acquired a number of foreign currencyforward contracts. The specific risk hedged in these contracts was the undiscounted foreign currencyspot rate risk on forecasted foreign currency revenue. As of December 31, 2012, all of the acquiredforeign currency forward contracts were settled. As of December 31, 2011, the notional value of thesecontracts was $16.6 million and CHF 5.4 million. We report the effective portion of the gain or loss on acash flow hedge as a component of other comprehensive income, and it was subsequently reclassifiedinto net earnings in the period in which the hedged transaction affected net earnings or the forecastedtransaction was no longer probable of occurring.
F-46

ALERE INC. AND SUBSIDIARIES
NOTES TO CONSOLIDATED FINANCIAL STATEMENTS (Continued)
(10) Derivative Financial Instruments (Continued)
The following tables summarize the fair value of our derivative instruments and the effect of thederivative instruments on/in our accompanying consolidated balance sheets and consolidatedstatements of operations (in thousands):
Derivative Instruments Balance Sheet Caption
Fair Value atDecember 31,
2012
Fair Value atDecember 31,
2011
Foreign currency forwardcontracts . . . . . . . . . . . . . . . . . .
Accrued expenses and othercurrent liabilities $ — $ 447
Derivative InstrumentsLocation of Gain (Loss)Recognized in Income
Amount of Gain(Loss) RecognizedDuring the Year
EndedDecember 31,
2012
Amount of LossRecognized
During the YearEnded
December 31,2011
Foreign currency forwardcontracts . . . . . . . . . . . . . . . . . .
Other comprehensive income(loss) $ — $(1,187)
Total loss . . . . . . . . . . . . . . . . . . . . Other comprehensive income(loss) $ — $(1,187)
(11) Commitments and Contingencies
(a) Operating Leases
We have operating lease commitments for certain of our facilities and equipment that expire onvarious dates through 2019. The following schedule outlines future minimum annual rental paymentsunder these leases at December 31, 2012 (in thousands):
2013 . . . . . . . . . . . . . . . . . . . . . . . . . . . . . . . . . . . . . . . . . . . . . . . . . . . . . . . . $ 43,1482014 . . . . . . . . . . . . . . . . . . . . . . . . . . . . . . . . . . . . . . . . . . . . . . . . . . . . . . . . 37,3502015 . . . . . . . . . . . . . . . . . . . . . . . . . . . . . . . . . . . . . . . . . . . . . . . . . . . . . . . . 32,9432016 . . . . . . . . . . . . . . . . . . . . . . . . . . . . . . . . . . . . . . . . . . . . . . . . . . . . . . . . 30,9352017 . . . . . . . . . . . . . . . . . . . . . . . . . . . . . . . . . . . . . . . . . . . . . . . . . . . . . . . . 27,449Thereafter . . . . . . . . . . . . . . . . . . . . . . . . . . . . . . . . . . . . . . . . . . . . . . . . . . . 62,496
$234,321
Rent expense relating to operating leases was approximately $51.2 million, $42.3 million and$39.0 million during 2012, 2011 and 2010, respectively.
(b) Contingent Consideration Obligations
We determine the acquisition date fair value of the contingent consideration obligations based ona probability-weighted approach derived from the overall likelihood of achieving the targets before thecorresponding delivery dates. The fair value measurement is based on significant inputs notobservable in the market and thus represents a Level 3 measurement, as defined in fair valuemeasurement accounting. The resultant probability-weighted milestone payments are discounted usinga discount rate based upon the weighted-average cost of capital. At each reporting date, we revaluethe contingent consideration obligations to the reporting date fair values and record increases anddecreases in the fair values as income or expense in our consolidated statements of operations.
F-47

ALERE INC. AND SUBSIDIARIES
NOTES TO CONSOLIDATED FINANCIAL STATEMENTS (Continued)
(11) Commitments and Contingencies (Continued)
Increases or decreases in the fair values of the contingent consideration obligations may resultfrom changes in discount periods and rates, changes in the timing and amount of earn-out criteria andchanges in probability assumptions with respect to the likelihood of achieving the various earn-outcriteria.
We have contractual contingent consideration obligations related to our acquisitions of Accordant,AdnaGen, Alere Healthcare, Alere S.A., Amedica, Bioeasy, Branan, Capital Toxicology, DiagnosisOne,Diagnostik, eScreen, HCC, Immunalysis, Ionian, LDS, MedApps, Mologic, NationsHealth, ROAR,Standing Stone, Twist, Wellogic and certain other small businesses.
• Accordant
With respect to Accordant, the terms of the acquisition agreement require us to pay an earn-outupon successfully meeting certain revenue and cash collection targets starting after the secondanniversary of the acquisition date and completed prior to the third anniversary date of the acquisition.The maximum amount of the earn-out totaling $6.0 million was achieved in 2012. A payment of $1.5million was made during the fourth quarter of 2012 and the remaining payments will be made inquarterly installments of $1.5 million during 2013.
• AdnaGen
With respect to AdnaGen, the terms of the acquisition agreement require us to pay earn-outs uponsuccessfully (i) meeting certain financial performance targets during the two years following theacquisition, (ii) achieving multiple product development milestones during the three years following theacquisition and (iii) creating pharmaceutical alliances during the six years following the acquisition. Themaximum remaining amount of the earn-out payments is approximately $42.0 million.
• Alere Healthcare
With respect to Alere Healthcare, the terms of the acquisition agreement require us to pay anearn-out upon successfully meeting certain revenue and operating income targets during each of thecalendar years 2010 through 2012. The 2012 portion of the earn-out totaling approximately $0.3 millionwas earned and accrued as of December 31, 2012. Payment of the 2012 earn-out is expected to bemade during the second quarter of 2013.
• Alere S.A.
With respect to Alere S.A., the terms of the acquisition agreement require us to pay an earn-outupon successfully meeting certain revenue and EBITDA targets during each of the calendar years2011 through 2016. The conditions of the 2012 and 2011 earn-outs were not achieved. The maximumremaining amount of the earn-out payments is approximately $6.0 million.
• Amedica
With respect to Amedica, the terms of the acquisition agreement require us to make earn-outpayments upon successfully meeting certain financial targets during each of the calendar years 2012and 2013. The 2012 portion of the earn-out totaling approximately $6.9 million was earned andaccrued as of December 31, 2012. Payment of the 2012 earn-out is expected to be made during thesecond quarter of 2013. The maximum remaining amount of the earn-out payments is $8.1 million.
F-48

ALERE INC. AND SUBSIDIARIES
NOTES TO CONSOLIDATED FINANCIAL STATEMENTS (Continued)
(11) Commitments and Contingencies (Continued)
• Bioeasy
With respect to Bioeasy, the terms of the acquisition agreement require us to pay earn-outs uponsuccessfully meeting certain revenue and EBITDA targets during each of the calendar years 2011through 2013. The 2011 and 2012 earn-outs were not achieved. The maximum remaining amount ofthe earn-out payments is approximately $2.5 million.
• Branan
With respect to Branan, the terms of the acquisition agreement require us to pay earn-outs uponsuccessfully achieving various regulatory product approval milestones by the second anniversary ofthe acquisition date. Four milestones were achieved during 2012 resulting in an accrual totalingapproximately $2.0 million as of December 31, 2012. Payment of the 2012 milestones is expected tobe made during the first quarter of 2013. The maximum remaining amount of the earn-out payments is$3.0 million.
• Capital Toxicology
The initial terms of the acquisition agreement for Capital Toxicology provided for an earn-outcalculated based on the amount, if any, by which EBITDA derived from the acquired businessexceeded specified targets during each of the calendar years 2011 and 2012. A portion of the earn-outfor the 2011 calendar year totaling approximately $2.1 million was earned and accrued as ofDecember 31, 2011. During the first quarter of 2012, the acquisition agreement was modified to basethe earn-out on the excess of actual cash collections from 2011 sales over 2011 expenses rather thanEBITDA. This new criterion resulted in an incremental $2.9 million accrual related to the earn-out forthe 2011 calendar year based on cash collections through March 31, 2012. $4.1 million was paid inrespect of the earn-out for the 2011 calendar year during the second quarter of 2012. An additionalpayment of approximately $1.5 million was made in the fourth quarter of 2012 for the incremental cashcollections from 2011 sales received prior to August 31, 2012. The 2012 earn-out totaling $5.0 millionwas achieved in 2012 and paid in the fourth quarter of 2012. No further contingent considerationobligations related to this acquisition exist as of December 31, 2012.
• DiagnosisOne
With respect to DiagnosisOne, the terms of the acquisition agreement require us to pay earn-outsupon successfully meeting certain financial targets within five years of the acquisition date. Themaximum amount of the earn-out payments is $33.0 million.
• Diagnostik
With respect to Diagnostik, the terms of the acquisition agreement require us to pay earn-outsupon successfully meeting certain financial targets within two years of the acquisition date. Themaximum amount of the earn-out payments is approximately €1.4 million (approximately $1.9 million atDecember 31, 2012).
• eScreen
With respect to eScreen, the terms of the acquisition agreement require us to pay earn-outs uponsuccessfully meeting certain financial targets during calendar years 2012 through 2014. The 2012portion of the earn-out was not achieved. The maximum remaining amount of the earn-out payments is$70.0 million.
F-49
ALERE INC. AND SUBSIDIARIES
NOTES TO CONSOLIDATED FINANCIAL STATEMENTS (Continued)
(11) Commitments and Contingencies (Continued)
• HCC
With respect to HCC, the terms of the acquisition agreement require us to pay an earn-out uponsuccessfully meeting certain EBITDA targets during calendar year 2013. The maximum amount of theearn-out payments is £3.5 million (approximately $5.7 million at December 31, 2012).
• Immunalysis
With respect to Immunalysis, the terms of the acquisition agreement require us to pay earn-outsupon successfully meeting certain gross profit targets during each of the calendar years 2010 through2012. Payment of the 2011 portion of the earn-out totaling approximately $0.9 million was paid duringthe second quarter of 2012. The 2012 portion of the earn-out totaling approximately $1.9 million wasearned and accrued as of December 31, 2012, with payment expected to be made during the secondquarter of 2013.
Additionally, we have a contractual contingent obligation to pay up to a total of $3.0 million incompensation to certain executives of Immunalysis in accordance with the acquisition agreement that,if earned, will be paid out in connection with the contingent consideration payable to the formershareholders of Immunalysis, for each of the calendar years 2010, 2011 and 2012. Payment of the2011 compensation totaling approximately $1.0 million was made during the second quarter of 2012.The 2012 portion of the compensation totaling approximately $1.0 million was earned and accrued asof December 31, 2012, with payment expected to be made during the second quarter of 2013.
• Ionian
With respect to our acquisition of Ionian, the terms of the acquisition agreement require us to payearn-outs upon successfully meeting multiple product development milestones during the five yearsfollowing the acquisition. The maximum amount of the earn-out payments is $57.5 million.
• LDS
With respect to LDS, the terms of the acquisition agreement require us to pay an earn-out uponsuccessfully meeting certain revenue and operating income targets during each of the twelve-monthperiods ending June 30, 2012 and 2013. During the third quarter of 2012, the acquisition agreementwas modified to base the earn-out criteria on: revenue and operating income targets for the twelve-month period ending June 30, 2012, certain integration milestones to be achieved during 2012, andvarious product milestones to be achieved during 2012 and 2013. The portion of the earn-out related torevenue and operating income targets, totaling $10.0 million was earned and paid during 2012. Theportion of the earn-out related to the integration milestones and certain 2012 product milestones,totaling $3.5 million, was earned and accrued as of December 31, 2012. The maximum remainingamount of the earn-out payments is $7.5 million.
• MedApps
With respect to MedApps, the terms of the acquisition agreement require us to make earn-outpayments upon achievement of certain technological and product development milestones throughJanuary 15, 2015. A portion of the earn-out, totaling $0.8 million was earned and paid during the fourthquarter of 2012. The maximum remaining amount of the earn-out payments is $21.2 million.
• Mologic
With respect to Mologic, the terms of the acquisition agreement require us to pay earn-outs, inshares of our common stock or cash, at our election, upon successfully meeting nine research anddevelopment project milestones during the five years following the acquisition. During 2012, a portion
F-50

ALERE INC. AND SUBSIDIARIES
NOTES TO CONSOLIDATED FINANCIAL STATEMENTS (Continued)
(11) Commitments and Contingencies (Continued)
of the earn-out totaling approximately $1.2 million was determined to have been achieved and wassettled in shares of our common stock. The maximum remaining amount of the earn-out payments is$14.8 million.
• NationsHealth
With respect to NationsHealth, the terms of the acquisition agreement require us to pay an earn-out upon successfully meeting certain operational targets within one year of the acquisition date. Themaximum amount of the earn-out payment is $8.0 million.
• ROAR
With respect to ROAR, the terms of the acquisition agreement require us to pay an earn-out uponsuccessfully meeting certain EBITDA targets during 2012 through 2014. ROAR achievedapproximately £1.2 million (approximately $1.9 million at December 31, 2012) of earn-out payments in2012 which were accrued for at December 31, 2012. Payment of this earn-out is expected to be madein the first quarter of 2013. The maximum remaining amount of the earn-out payments is £9.3 million(approximately $15.2 million at December 31, 2012).
• Standing Stone
With respect to Standing Stone, the terms of the acquisition agreement require us to pay earn-outsand employee bonuses upon successfully meeting certain operational, product development andrevenue targets during the period from the date of acquisition through calendar year 2013. An earn-outpayment totaling approximately $8.2 million and employee bonus payments totaling approximately $0.4million for the achievement of milestones were made during 2012. The maximum remaining amount ofthe earn-out payments is approximately $2.8 million. The maximum remaining amount of the employeebonuses is $0.1 million.
• Twist
With respect to our acquisition of Twist, the terms of the acquisition agreement require us to payan earn-out upon successfully meeting certain revenue and product development targets.Approximately $0.3 million in earn-out payments was paid during 2012. The maximum amount of theearn-out payments is $125.0 million and, if earned, payments are expected to be made during theeight-year period following the acquisition date, but could extend thereafter.
• Wellogic
With respect to Wellogic, the terms of the acquisition agreement require us to pay an earn-outupon successfully meeting certain operational and profit targets during 2012 through 2019. Themaximum remaining amount of the earn-out payments based upon operational targets is approximately$49.8 million. The earn-out based on financial targets has no maximum.
(c) Legal Proceedings
(i) Matters Relating to our San Diego Facility
On October 9, 2012, we received a warning letter from the FDA referencing inspectionalobservations set forth in an FDA Form 483 received in June 2012. The observations were the result ofan inspection of our San Diego facility conducted earlier during 2012 relating to our Alere Triage
F-51

ALERE INC. AND SUBSIDIARIES
NOTES TO CONSOLIDATED FINANCIAL STATEMENTS (Continued)
(11) Commitments and Contingencies (Continued)
products, which resulted in two recalls of certain Alere Triage products and revised releasespecifications for our Alere Triage meter-based products. On October 30, 2012, we responded to thewarning letter and submitted evidence of our completion of most of the actions previously detailed inour prior response to the FDA Form 483. We have worked cooperatively with the FDA in an effort tofully address each of the inspectional observations and intend to continue to do so.
In May 2012, we also received a subpoena from the Office of Inspector General of the Departmentof Health and Human Services, or the OIG, seeking documents relating primarily to the quality controltesting and performance characteristics of Alere Triage products. We are cooperating with the OIG andcontinue to supply documents to the OIG under the subpoena.
We are unable to predict when these matters will be resolved or what further action, if any, thegovernment will take in connection with them. Except for increases in manufacturing costs anddecreased profitability for our Alere Triage products, we are unable to predict what impact, if any, thesematters or ensuing proceedings, if any, will have on our financial condition, results of operations orcash flows.
(ii) Class Action Litigation against Alere Home Monitoring
On January 24, 2013, a class action complaint was filed in the U.S. District Court for the NorthernDistrict of California against Alere Home Monitoring, or AHM, asserting claims for damages and otherrelief under California state law, including under California’s Confidentiality of Medical Information Act,relating to an inadvertent disclosure of personally identifiable information of approximately 116,000patients resulting from the theft of a laptop computer from an employee of AHM. The Office of CivilRights of the U.S. Department of Health and Human Services was notified of the inadvertent disclosurein accordance with the Breach Notification Rule under the HITECH Act, as were certain state agencies.
(iii) Claims in the Ordinary Course and Other Matters
Because of the nature of our business, we may be subject at any particular time to lawsuits orother claims arising in the ordinary course of our business, and we expect that this will continue to bethe case in the future. Such lawsuits often seek damages, sometimes in substantial amounts.
F-52
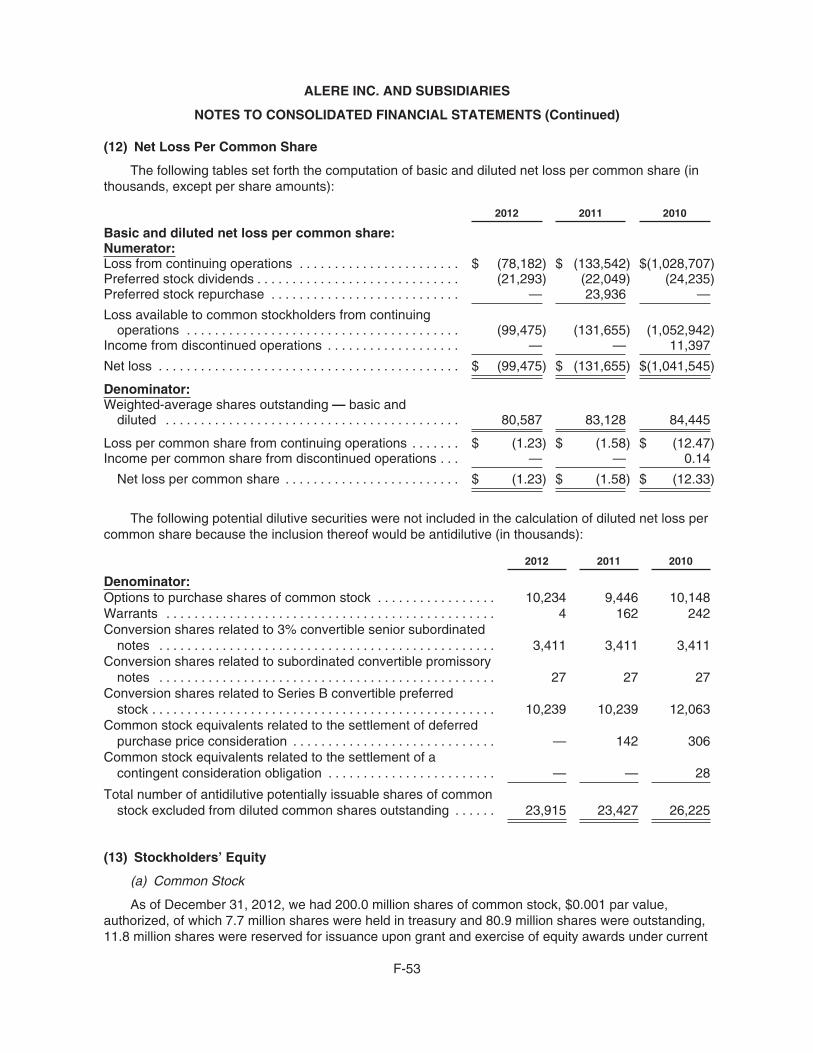
ALERE INC. AND SUBSIDIARIES
NOTES TO CONSOLIDATED FINANCIAL STATEMENTS (Continued)
(12) Net Loss Per Common Share
The following tables set forth the computation of basic and diluted net loss per common share (inthousands, except per share amounts):
2012 2011 2010
Basic and diluted net loss per common share:Numerator:Loss from continuing operations . . . . . . . . . . . . . . . . . . . . . . . $ (78,182) $ (133,542) $(1,028,707)Preferred stock dividends . . . . . . . . . . . . . . . . . . . . . . . . . . . . . (21,293) (22,049) (24,235)Preferred stock repurchase . . . . . . . . . . . . . . . . . . . . . . . . . . . — 23,936 —
Loss available to common stockholders from continuingoperations . . . . . . . . . . . . . . . . . . . . . . . . . . . . . . . . . . . . . . . (99,475) (131,655) (1,052,942)
Income from discontinued operations . . . . . . . . . . . . . . . . . . . — — 11,397
Net loss . . . . . . . . . . . . . . . . . . . . . . . . . . . . . . . . . . . . . . . . . . . $ (99,475) $ (131,655) $(1,041,545)
Denominator:Weighted-average shares outstanding — basic and
diluted . . . . . . . . . . . . . . . . . . . . . . . . . . . . . . . . . . . . . . . . . . 80,587 83,128 84,445
Loss per common share from continuing operations . . . . . . . $ (1.23) $ (1.58) $ (12.47)Income per common share from discontinued operations . . . — — 0.14
Net loss per common share . . . . . . . . . . . . . . . . . . . . . . . . . $ (1.23) $ (1.58) $ (12.33)
The following potential dilutive securities were not included in the calculation of diluted net loss percommon share because the inclusion thereof would be antidilutive (in thousands):
2012 2011 2010
Denominator:Options to purchase shares of common stock . . . . . . . . . . . . . . . . . 10,234 9,446 10,148Warrants . . . . . . . . . . . . . . . . . . . . . . . . . . . . . . . . . . . . . . . . . . . . . . . 4 162 242Conversion shares related to 3% convertible senior subordinated
notes . . . . . . . . . . . . . . . . . . . . . . . . . . . . . . . . . . . . . . . . . . . . . . . . 3,411 3,411 3,411Conversion shares related to subordinated convertible promissory
notes . . . . . . . . . . . . . . . . . . . . . . . . . . . . . . . . . . . . . . . . . . . . . . . . 27 27 27Conversion shares related to Series B convertible preferred
stock . . . . . . . . . . . . . . . . . . . . . . . . . . . . . . . . . . . . . . . . . . . . . . . . . 10,239 10,239 12,063Common stock equivalents related to the settlement of deferred
purchase price consideration . . . . . . . . . . . . . . . . . . . . . . . . . . . . . — 142 306Common stock equivalents related to the settlement of a
contingent consideration obligation . . . . . . . . . . . . . . . . . . . . . . . . — — 28
Total number of antidilutive potentially issuable shares of commonstock excluded from diluted common shares outstanding . . . . . . 23,915 23,427 26,225
(13) Stockholders’ Equity
(a) Common Stock
As of December 31, 2012, we had 200.0 million shares of common stock, $0.001 par value,authorized, of which 7.7 million shares were held in treasury and 80.9 million shares were outstanding,11.8 million shares were reserved for issuance upon grant and exercise of equity awards under current
F-53

ALERE INC. AND SUBSIDIARIES
NOTES TO CONSOLIDATED FINANCIAL STATEMENTS (Continued)
(13) Stockholders’ Equity (Continued)
equity compensation plans, 1.0 million shares were reserved for issuance under our employee stockpurchase plan and 4,000 shares were reserved for issuance upon exercise of outstanding warrants.We also had shares of common stock reserved for issuance upon conversion of the following securitiesoutstanding on December 31, 2012: $150.0 million in the aggregate principal amount of 3% convertiblesenior subordinated notes, convertible at $43.98 per share into 3.4 million shares of our commonstock; $1.7 million of subordinated convertible promissory notes, convertible at $61.49 per share into27,647 shares of our common stock; and 1.8 million shares of our Series B convertible preferred stock,with an aggregate liquidation preference of approximately $709.8 million, convertible under certaincircumstances at $69.32 per share into 10.2 million shares of our common stock.
(b) Preferred Stock
As of December 31, 2012, we had 5.0 million shares of preferred stock, $0.001 par value,authorized, of which 2.3 million shares were designated as Series B Convertible Perpetual PreferredStock, or Series B preferred stock. In connection with our acquisition of Matria, we issued shares of theSeries B preferred stock and through June 30, 2011 paid all dividends on outstanding shares ofSeries B preferred stock in additional shares of Series B preferred stock. Subsequent to June 30, 2011all dividends on outstanding shares of Series B preferred stock were paid in cash. At December 31,2012, there were 1.8 million shares of Series B preferred stock outstanding with a fair value ofapproximately $328.5 million.
Each share of Series B preferred stock, which has a liquidation preference of $400.00 per share,is convertible, at the option of the holder and only upon certain circumstances, into 5.7703 shares ofour common stock, plus cash in lieu of fractional shares. The initial conversion price is $69.32 pershare, subject to adjustment upon the occurrence of certain events, but will not be adjusted foraccumulated and unpaid dividends. Upon a conversion of shares of the Series B preferred stock, wemay, at our option, satisfy the entire conversion obligation in cash or through a combination of cashand common stock. Series B preferred stock outstanding at December 31, 2012 would convert into10.2 million shares of our common stock, which are reserved. There were no conversions as ofDecember 31, 2012.
Generally, the shares of Series B preferred stock are convertible, at the option of the holder, ifduring any calendar quarter beginning with the second calendar quarter after the issuance date of theSeries B preferred stock, if the closing sale price of our common stock for each of 20 or more tradingdays within any period of 30 consecutive trading days ending on the last trading day of the immediatelypreceding calendar quarter exceeds 130% of the conversion price per share of common stock in effecton the last trading day of the immediately preceding calendar quarter. In addition, the shares ofSeries B preferred stock are convertible, at the option of the holder, in certain other circumstances,including those relating to the trading price of the Series B preferred stock and upon the occurrence ofcertain fundamental changes or major corporate transactions. We also have the right, under certaincircumstances relating to the trading price of our common stock, to force conversion of the Series Bpreferred stock. Depending on the timing of any such forced conversion, we may have to make certainpayments relating to foregone dividends, which payments we can make, at our option, in the form ofcash, shares of our common stock, or a combination of cash and shares of our common stock.
Each share of Series B preferred stock accrues dividends at $12.00, or 3%, per annum, payablequarterly on January 15, April 15, July 15 and October 15 of each year, commencing following the firstfull calendar quarter after the issuance date. Dividends on the Series B preferred stock are cumulative
F-54

ALERE INC. AND SUBSIDIARIES
NOTES TO CONSOLIDATED FINANCIAL STATEMENTS (Continued)
(13) Stockholders’ Equity (Continued)
from the date of issuance. For the year ended December 31, 2012, Series B preferred stock dividendsamounted to $21.3 million, which reduced earnings available to common stockholders for purposes ofcalculating net loss per common share in 2011 (Note 12). Accrued dividends are payable only ifdeclared by our board of directors and, upon conversion by the Series B preferred stockholder, holderswill not receive any cash payment representing accumulated dividends. If our board of directorsdeclares a dividend payable, we have the right to pay the dividends in cash, shares of common stock,additional shares of Series B preferred stock or a similar convertible preferred stock or anycombination thereof.
The holders of Series B preferred stock have liquidation preferences over the holders of ourcommon stock and other classes of stock, if any, outstanding at the time of liquidation. Uponliquidation, the holders of outstanding Series B preferred stock would receive an amount equal to$400.00 per share of Series B preferred stock, plus any accumulated and unpaid dividends. As ofDecember 31, 2012, the liquidation preference of the outstanding Series B preferred stock was$709.8 million. The holders of the Series B preferred stock have no voting rights, except with respect tomatters affecting the Series B preferred stock (including the creation of a senior preferred stock).
We evaluated the terms and provisions of our Series B preferred stock to determine if it qualifiedfor derivative accounting treatment. Based on our evaluation, these securities do not qualify forderivative accounting.
(c) Share Repurchases
During the first quarter of 2011, we repurchased in the open market and privately-negotiatedtransactions 183,000 shares of our Series B preferred stock, which were convertible into approximately1.1 million shares of our common stock, at a cost of approximately $49.4 million, which we paid incash. The repurchase of the preferred stock at an average cost of $269.84 per preferred share, anamount less than the weighted-average fair value of the preferred shares at issuance, resulted in theallocation of $13.7 million of income attributable to common stockholders. Also during the first quarterof 2011, and pursuant to the same repurchase program, we repurchased 16,700 shares of ourcommon stock at a cost of approximately $0.6 million, which we paid in cash.
During the second quarter of 2011, we repurchased in the open market and privately-negotiatedtransactions, 174,788 shares of our Series B preferred stock, which were convertible intoapproximately 1.0 million shares of our common stock, at a cost of approximately $49.7 million, whichwe paid in cash. The repurchase of the preferred stock at an average cost of $284.28 per preferredshare, an amount less than the weighted-average fair value of the preferred shares at issuance,resulted in the allocation of $10.2 million of income attributable to common stockholders. Also duringthe second quarter of 2011, and pursuant to the same repurchase program, we repurchased 8,300shares of our common stock at a cost of approximately $0.3 million, which we paid in cash.
During the third quarter of 2011, we repurchased approximately 7.6 million shares of our commonstock at a cost of approximately $183.9 million, which we paid in cash.
(d) Stock Options and Awards
In 2010, we adopted the Alere Inc. 2010 Stock Option and Incentive Plan, or the 2010 Plan, whichreplaced our 2001 Stock Option and Incentive Plan, or the 2001 Plan. The 2010 Plan currently allows
F-55

ALERE INC. AND SUBSIDIARIES
NOTES TO CONSOLIDATED FINANCIAL STATEMENTS (Continued)
(13) Stockholders’ Equity (Continued)
for the issuance of up to 5.2 million shares of common stock and other awards. The 2010 Plan isadministered by the Compensation Committee of the Board of Directors, which selects the individualseligible to receive awards, determines or modifies the terms and conditions of the awards granted,accelerates the vesting schedule of any award and generally administers and interprets the 2010 Plan.The 2010 Plan permits the granting of incentive and nonqualified stock options with terms of up to tenyears and the granting of stock appreciation rights, restricted stock awards, unrestricted stock awards,performance share awards and dividend equivalent rights. The 2010 Plan also provides for optiongrants to non-employee directors and automatic vesting acceleration of all options and stockappreciation rights upon a change in control, as defined by the 2010 Plan. As of December 31, 2012and 2011, there were 1.0 million and 1.1 million shares respectively, available for future grant underthe 2010 Plan.
The following summarizes all stock option activity during the year ended December 31, 2012 (inthousands, except exercise price):
Options
Weighted-average
Exercise Price
Outstanding at January 1,2012 . . . . . . . . . . . . . . . . . . . . . . . . . . . . . . . . . . . . . . . 9,446 $36.84Granted . . . . . . . . . . . . . . . . . . . . . . . . . . . . . . . . . . . . . . . . . . . . . . . . . . . . . . . . . 2,314 $31.84Exercised . . . . . . . . . . . . . . . . . . . . . . . . . . . . . . . . . . . . . . . . . . . . . . . . . . . . . . . (297) $18.79Canceled/expired/forfeited. . . . . . . . . . . . . . . . . . . . . . . . . . . . . . . . . . . . . . . . . . (813) $33.80
Outstanding at December 31, 2012 . . . . . . . . . . . . . . . . . . . . . . . . . . . . . . . . . . . . 10,650 $36.51
Exercisable at December 31, 2012 . . . . . . . . . . . . . . . . . . . . . . . . . . . . . . . . . . . . 6,760 $38.66
The aggregate intrinsic value of the options outstanding at December 31, 2012 was $0.6 million.The aggregate intrinsic value of the options exercisable at December 31, 2012 was $0.6 million. Theaggregate intrinsic value of stock options exercised during 2012, 2011 and 2010 was $1.3 million,$17.1 million, and $6.9 million, respectively.
In addition, on December 30, 2012, we granted a restricted stock unit, or RSU, award to one of ourexecutive employees in the amount of 110,000 units. The RSU award vests over a three-year period,however, if the executive’s employment is involuntarily terminated, without cause, within three years,the RSU award will accelerate and fully vest. The RSU award will also accelerate and fully vest if theexecutive terminates his employment voluntarily after one year, other than in the presence of facts orcircumstances which would constitute cause for termination by us. The fair value of the RSU award is$18.37 per unit, calculated based on the closing market price of our common stock on the date ofgrant. The aggregate fair value of the RSU award is expensed on a straight-line basis over therecipient’s service requirement completion period of one year. None of the units underlying the RSUaward have vested or have been released as of December 31, 2012.
Based on equity awards outstanding as of December 31, 2012, there was $29.6 million ofunrecognized compensation costs related to unvested share-based compensation arrangements thatare expected to vest. Such costs are expected to be recognized over a weighted-average period of1.91 years.
F-56

ALERE INC. AND SUBSIDIARIES
NOTES TO CONSOLIDATED FINANCIAL STATEMENTS (Continued)
(13) Stockholders’ Equity (Continued)
(e) Warrants
The following is a summary of all warrant activity during the three years ended December 31:
Number ofShares Exercise Price
Weighted-average
Exercise Price
(in thousands)Warrants outstanding and exercisable, December 31, 2009 . . 461 $ 3.81 - $50.00 $21.09Exercised . . . . . . . . . . . . . . . . . . . . . . . . . . . . . . . . . . . . . . . . . . . . (105) $ 3.81 - $29.78 $23.66Cancelled . . . . . . . . . . . . . . . . . . . . . . . . . . . . . . . . . . . . . . . . . . . . (113) $20.06 - $29.78 $29.62
Warrants outstanding and exercisable, December 31, 2010 . . 243 $13.54 - $50.00 $16.00Exercised . . . . . . . . . . . . . . . . . . . . . . . . . . . . . . . . . . . . . . . . . . . . (81) $13.54 - $24.00 $19.15
Warrants outstanding and exercisable, December 31, 2011 . . 162 $13.54 - $50.00 $14.44Exercised . . . . . . . . . . . . . . . . . . . . . . . . . . . . . . . . . . . . . . . . . . . . (158) $13.54 $13.54
Warrants outstanding and exercisable, December 31, 2012 . . 4 $50.00 $50.00
The following table presents additional information related to warrants outstanding and exercisableat December 31, 2012:
Outstanding and Exercisable
Exercise PriceNumber ofShares
Weighted-average
RemainingContract Life
Weighted-average
Exercise Price
(in thousands)$50.00 . . . . . . . . . . . . . . . . . . . . . . . . . 4 3.50 $50.00
4 3.50 $50.00
The warrants included in the table above were issued in connection with the acquisition ofGeneCare. There were no warrants to purchase shares of our common stock outstanding that wereissued to officers and directors of our company or entities controlled by these officers and directors atDecember 31, 2012. All outstanding warrants have been classified in equity.
(f) Employee Stock Purchase Plan
In 2001, we adopted the 2001 Employee Stock Purchase Plan, under which eligible employeesare allowed to purchase shares of our common stock at a discount through periodic payroll deductions.Purchases may occur at the end of every six-month offering period at a purchase price equal to 85% ofthe market value of our common stock at either the beginning or end of the offering period, whicheveris lower. We may issue up to 3.0 million shares of common stock under this plan. At December 31,2012, 2.0 million shares had been issued under this plan.
F-57
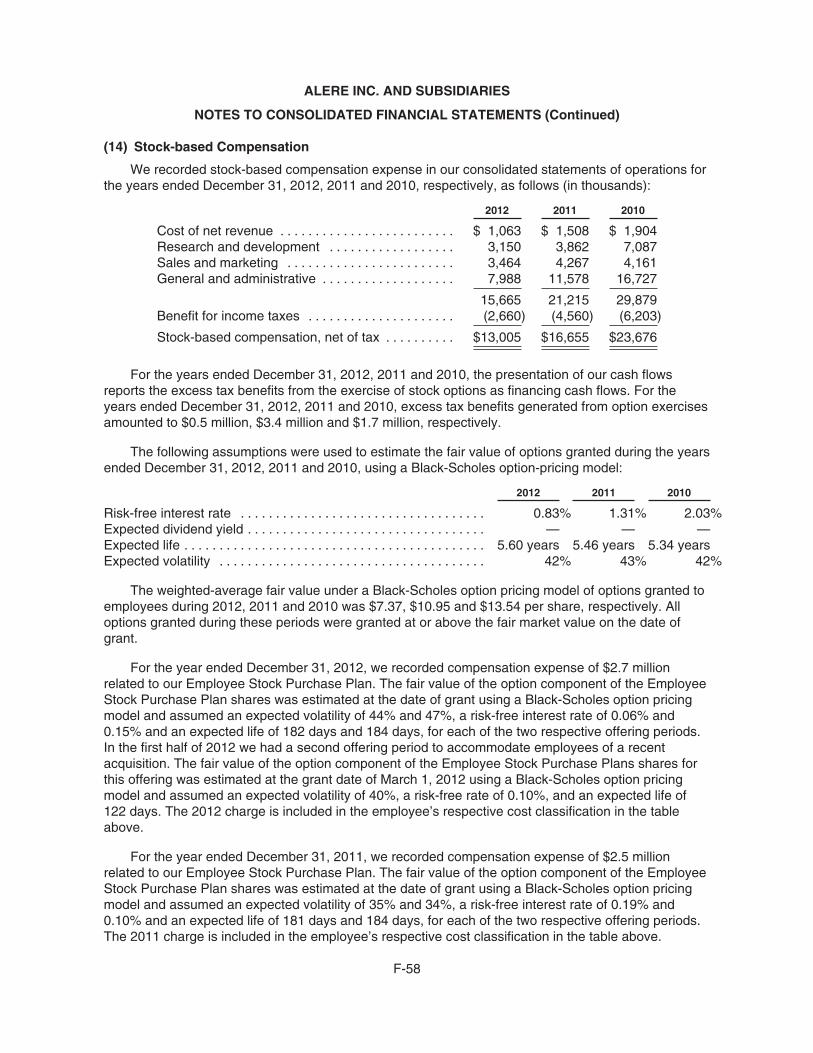
ALERE INC. AND SUBSIDIARIES
NOTES TO CONSOLIDATED FINANCIAL STATEMENTS (Continued)
(14) Stock-based Compensation
We recorded stock-based compensation expense in our consolidated statements of operations forthe years ended December 31, 2012, 2011 and 2010, respectively, as follows (in thousands):
2012 2011 2010
Cost of net revenue . . . . . . . . . . . . . . . . . . . . . . . . . $ 1,063 $ 1,508 $ 1,904Research and development . . . . . . . . . . . . . . . . . . 3,150 3,862 7,087Sales and marketing . . . . . . . . . . . . . . . . . . . . . . . . 3,464 4,267 4,161General and administrative . . . . . . . . . . . . . . . . . . . 7,988 11,578 16,727
15,665 21,215 29,879Benefit for income taxes . . . . . . . . . . . . . . . . . . . . . (2,660) (4,560) (6,203)
Stock-based compensation, net of tax . . . . . . . . . . $13,005 $16,655 $23,676
For the years ended December 31, 2012, 2011 and 2010, the presentation of our cash flowsreports the excess tax benefits from the exercise of stock options as financing cash flows. For theyears ended December 31, 2012, 2011 and 2010, excess tax benefits generated from option exercisesamounted to $0.5 million, $3.4 million and $1.7 million, respectively.
The following assumptions were used to estimate the fair value of options granted during the yearsended December 31, 2012, 2011 and 2010, using a Black-Scholes option-pricing model:
2012 2011 2010
Risk-free interest rate . . . . . . . . . . . . . . . . . . . . . . . . . . . . . . . . . . . 0.83% 1.31% 2.03%Expected dividend yield . . . . . . . . . . . . . . . . . . . . . . . . . . . . . . . . . . — — —Expected life . . . . . . . . . . . . . . . . . . . . . . . . . . . . . . . . . . . . . . . . . . . 5.60 years 5.46 years 5.34 yearsExpected volatility . . . . . . . . . . . . . . . . . . . . . . . . . . . . . . . . . . . . . . 42% 43% 42%
The weighted-average fair value under a Black-Scholes option pricing model of options granted toemployees during 2012, 2011 and 2010 was $7.37, $10.95 and $13.54 per share, respectively. Alloptions granted during these periods were granted at or above the fair market value on the date ofgrant.
For the year ended December 31, 2012, we recorded compensation expense of $2.7 millionrelated to our Employee Stock Purchase Plan. The fair value of the option component of the EmployeeStock Purchase Plan shares was estimated at the date of grant using a Black-Scholes option pricingmodel and assumed an expected volatility of 44% and 47%, a risk-free interest rate of 0.06% and0.15% and an expected life of 182 days and 184 days, for each of the two respective offering periods.In the first half of 2012 we had a second offering period to accommodate employees of a recentacquisition. The fair value of the option component of the Employee Stock Purchase Plans shares forthis offering was estimated at the grant date of March 1, 2012 using a Black-Scholes option pricingmodel and assumed an expected volatility of 40%, a risk-free rate of 0.10%, and an expected life of122 days. The 2012 charge is included in the employee’s respective cost classification in the tableabove.
For the year ended December 31, 2011, we recorded compensation expense of $2.5 millionrelated to our Employee Stock Purchase Plan. The fair value of the option component of the EmployeeStock Purchase Plan shares was estimated at the date of grant using a Black-Scholes option pricingmodel and assumed an expected volatility of 35% and 34%, a risk-free interest rate of 0.19% and0.10% and an expected life of 181 days and 184 days, for each of the two respective offering periods.The 2011 charge is included in the employee’s respective cost classification in the table above.
F-58

ALERE INC. AND SUBSIDIARIES
NOTES TO CONSOLIDATED FINANCIAL STATEMENTS (Continued)
(14) Stock-based Compensation (Continued)
For the year ended December 31, 2010, we recorded compensation expense of $2.7 millionrelated to our Employee Stock Purchase Plan. The fair value of the option component of the EmployeeStock Purchase Plan shares was estimated at the date of grant using a Black-Scholes option pricingmodel and assumed an expected volatility of 39% and 45%, a risk-free interest rate of 0.18% and0.22% and an expected life of 181 days and 184 days, for each of the two respective offering periods.The 2010 charge is included in general and administrative expense in the table above.
(15) Accumulated Other Comprehensive Income (Loss)
Accumulated other comprehensive income (loss) consisted of the following (in thousands):
CumulativeTranslationAdjustment(Note 2(b))
PensionLiability
Adjustment(Note 9(b)) Other(1)
AccumulatedOther
ComprehensiveIncome (Loss)
Balance at December 31, 2009 . . . . . . . . . . . . . . . $ 12,915 $(5,096) $(10,273) $ (2,454)Period change . . . . . . . . . . . . . . . . . . . . . . . . . . . (210) (113) 3,467 3,144
Balance at December 31, 2010 . . . . . . . . . . . . . . . 12,705 (5,209) (6,806) 690Period change . . . . . . . . . . . . . . . . . . . . . . . . . . . (35,830) (1,618) 6,488 (30,960)
Balance at December 31, 2011 . . . . . . . . . . . . . . . (23,125) (6,827) (318) (30,270)Period change . . . . . . . . . . . . . . . . . . . . . . . . . . . 54,642 (756) 258 54,144
Balance at December 31, 2012 . . . . . . . . . . . . . . . $ 31,517 $(7,583) $ (60) $ 23,874
(1) Other represents unrealized gains (losses) on available-for-sale securities and hedginginstruments.
(16) Income Taxes
Income (loss) before provision (benefit) for income taxes consists of the following (in thousands):
Continuing Operations:
2012 2011 2010
United States . . . . . . . . . . . . . . . . . . . . . . . . . . . . . . . . . . . . . . $ (158,635) $ (493,073) $(1,078,981)Foreign . . . . . . . . . . . . . . . . . . . . . . . . . . . . . . . . . . . . . . . . . . . 37,164 327,026 11,195
$ (121,471) $ (166,047) $(1,067,786)
Discontinued Operations:
2012 2011 2010
United States . . . . . . . . . . . . . . . . . . . . . . . . . . . . . . . . . . . . . . $ — $ — $ 16,973Foreign . . . . . . . . . . . . . . . . . . . . . . . . . . . . . . . . . . . . . . . . . . . — — 1,514
$ — $ — $ 18,487
F-59
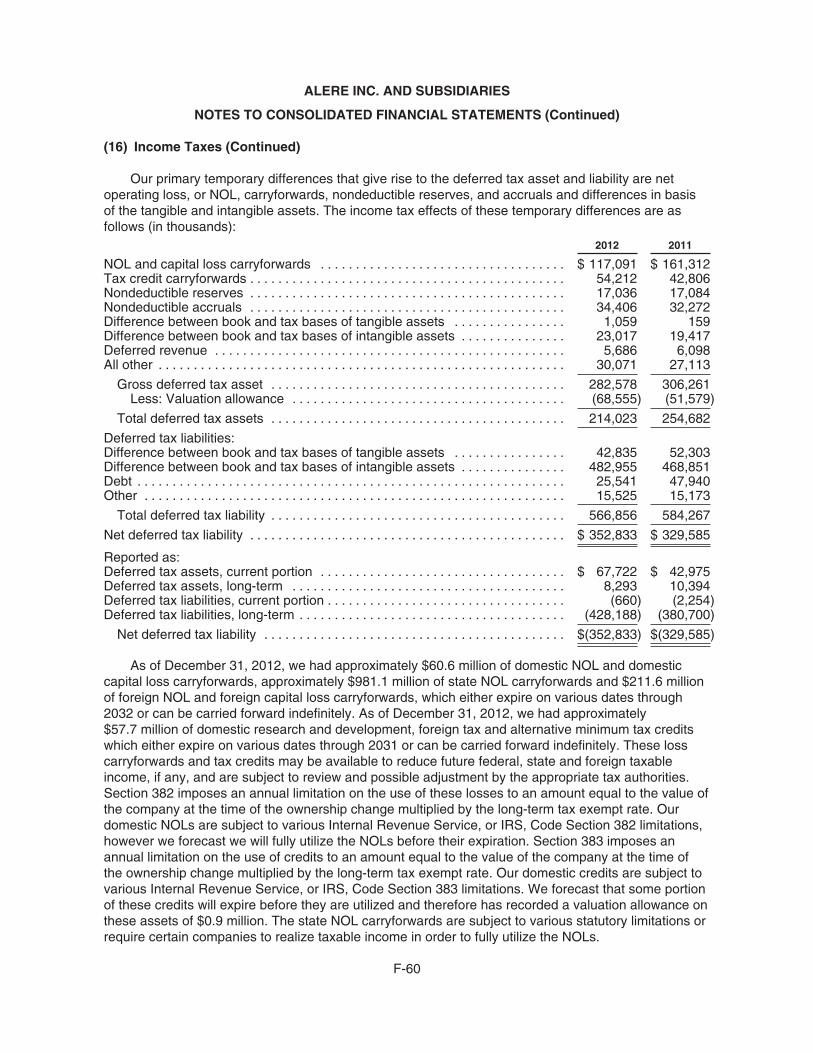
ALERE INC. AND SUBSIDIARIES
NOTES TO CONSOLIDATED FINANCIAL STATEMENTS (Continued)
(16) Income Taxes (Continued)
Our primary temporary differences that give rise to the deferred tax asset and liability are netoperating loss, or NOL, carryforwards, nondeductible reserves, and accruals and differences in basisof the tangible and intangible assets. The income tax effects of these temporary differences are asfollows (in thousands):
2012 2011
NOL and capital loss carryforwards . . . . . . . . . . . . . . . . . . . . . . . . . . . . . . . . . . . $ 117,091 $ 161,312Tax credit carryforwards . . . . . . . . . . . . . . . . . . . . . . . . . . . . . . . . . . . . . . . . . . . . . 54,212 42,806Nondeductible reserves . . . . . . . . . . . . . . . . . . . . . . . . . . . . . . . . . . . . . . . . . . . . . 17,036 17,084Nondeductible accruals . . . . . . . . . . . . . . . . . . . . . . . . . . . . . . . . . . . . . . . . . . . . . 34,406 32,272Difference between book and tax bases of tangible assets . . . . . . . . . . . . . . . . 1,059 159Difference between book and tax bases of intangible assets . . . . . . . . . . . . . . . 23,017 19,417Deferred revenue . . . . . . . . . . . . . . . . . . . . . . . . . . . . . . . . . . . . . . . . . . . . . . . . . . 5,686 6,098All other . . . . . . . . . . . . . . . . . . . . . . . . . . . . . . . . . . . . . . . . . . . . . . . . . . . . . . . . . . 30,071 27,113
Gross deferred tax asset . . . . . . . . . . . . . . . . . . . . . . . . . . . . . . . . . . . . . . . . . . 282,578 306,261Less: Valuation allowance . . . . . . . . . . . . . . . . . . . . . . . . . . . . . . . . . . . . . . . (68,555) (51,579)
Total deferred tax assets . . . . . . . . . . . . . . . . . . . . . . . . . . . . . . . . . . . . . . . . . . 214,023 254,682
Deferred tax liabilities:Difference between book and tax bases of tangible assets . . . . . . . . . . . . . . . . 42,835 52,303Difference between book and tax bases of intangible assets . . . . . . . . . . . . . . . 482,955 468,851Debt . . . . . . . . . . . . . . . . . . . . . . . . . . . . . . . . . . . . . . . . . . . . . . . . . . . . . . . . . . . . . 25,541 47,940Other . . . . . . . . . . . . . . . . . . . . . . . . . . . . . . . . . . . . . . . . . . . . . . . . . . . . . . . . . . . . 15,525 15,173
Total deferred tax liability . . . . . . . . . . . . . . . . . . . . . . . . . . . . . . . . . . . . . . . . . . 566,856 584,267
Net deferred tax liability . . . . . . . . . . . . . . . . . . . . . . . . . . . . . . . . . . . . . . . . . . . . . $ 352,833 $ 329,585
Reported as:Deferred tax assets, current portion . . . . . . . . . . . . . . . . . . . . . . . . . . . . . . . . . . . $ 67,722 $ 42,975Deferred tax assets, long-term . . . . . . . . . . . . . . . . . . . . . . . . . . . . . . . . . . . . . . . 8,293 10,394Deferred tax liabilities, current portion . . . . . . . . . . . . . . . . . . . . . . . . . . . . . . . . . . (660) (2,254)Deferred tax liabilities, long-term . . . . . . . . . . . . . . . . . . . . . . . . . . . . . . . . . . . . . . (428,188) (380,700)
Net deferred tax liability . . . . . . . . . . . . . . . . . . . . . . . . . . . . . . . . . . . . . . . . . . . $(352,833) $(329,585)
As of December 31, 2012, we had approximately $60.6 million of domestic NOL and domesticcapital loss carryforwards, approximately $981.1 million of state NOL carryforwards and $211.6 millionof foreign NOL and foreign capital loss carryforwards, which either expire on various dates through2032 or can be carried forward indefinitely. As of December 31, 2012, we had approximately$57.7 million of domestic research and development, foreign tax and alternative minimum tax creditswhich either expire on various dates through 2031 or can be carried forward indefinitely. These losscarryforwards and tax credits may be available to reduce future federal, state and foreign taxableincome, if any, and are subject to review and possible adjustment by the appropriate tax authorities.Section 382 imposes an annual limitation on the use of these losses to an amount equal to the value ofthe company at the time of the ownership change multiplied by the long-term tax exempt rate. Ourdomestic NOLs are subject to various Internal Revenue Service, or IRS, Code Section 382 limitations,however we forecast we will fully utilize the NOLs before their expiration. Section 383 imposes anannual limitation on the use of credits to an amount equal to the value of the company at the time ofthe ownership change multiplied by the long-term tax exempt rate. Our domestic credits are subject tovarious Internal Revenue Service, or IRS, Code Section 383 limitations. We forecast that some portionof these credits will expire before they are utilized and therefore has recorded a valuation allowance onthese assets of $0.9 million. The state NOL carryforwards are subject to various statutory limitations orrequire certain companies to realize taxable income in order to fully utilize the NOLs.
F-60

ALERE INC. AND SUBSIDIARIES
NOTES TO CONSOLIDATED FINANCIAL STATEMENTS (Continued)
(16) Income Taxes (Continued)
We have recorded a valuation allowance of $68.6 million as of December 31, 2012 due touncertainties related to the future benefits, if any, from our deferred tax assets related primarily to ourforeign businesses and certain U.S. net operating losses and tax credits. This is an increase of$17.0 million from the valuation allowance of $51.6 million as of December 31, 2011. The increase isprimarily related to foreign and state NOLs. The valuation allowance is based on our estimates oftaxable income by the jurisdictions in which we operate and the period over which our deferred taxassets will be recoverable. In the event that actual results differ from these estimates or we adjustthese estimates in future periods, we may need to establish an additional valuation allowance orreduce our current valuation allowance, which could materially impact our tax provision.
Our two China-based manufacturing subsidiaries qualify for a reduced income tax rate in 2012,2011 and 2010. Both Chinese entities qualify as high technology status companies and the status isdue to expire for one in 2013 and the other in 2014. The companies intend to file for a renewal of thisstatus. The prescribed statutory rate for 2012 and 2011 is 25% and the reduced rate under the hightechnology status is 15%. In 2010, the companies qualified under the China Tax Reform Act and theincome tax rate for one of the subsidiaries was 12.5% and 11% for the other. The reduced tax rateproduced a tax expense of approximately $1.0 million in 2012. In the absence of the reduced tax ratefor 2012 a tax rate of 25% would have applied and would have resulted in a tax expense ofapproximately $1.7 million in 2012. The earnings per common share effect of the reduced tax rate is$0.01 for 2012. The reduced tax rate produced a tax expense of approximately $0.5 million in 2011. Inthe absence of the reduced tax rate for 2011 a tax rate of 25% would have applied and would haveresulted in a tax expense of approximately $0.8 million in 2011. The earnings per common share effectof the reduced tax rate was $0.01 for 2011. The reduced tax rate produced a tax expense ofapproximately $1.3 million in 2010. In the absence of the reduced tax rate for 2010 a tax rate of 25%would have applied and would have resulted in a tax expense of approximately $2.9 million in 2010.The earnings per common share effect of the reduced tax rate is $0.02 for 2010.
The estimated amount of undistributed earnings of our foreign subsidiaries is $654.2 million atDecember 31, 2012. No amount for U.S. income tax has been provided on undistributed earnings ofour foreign subsidiaries because we consider such earnings to be indefinitely reinvested. In the eventof distribution of those earnings we would be subject to both U.S. income tax and foreign withholdingtaxes, subject to possible offset by U.S. foreign tax credits. Determination of the amount ofU.S. income tax liability that would be incurred is not practicable because of the complexitiesassociated with this hypothetical calculation.
The following table presents the components of our benefit for income taxes (in thousands) forcontinuing operations:
2012 2011 2010
Current:Federal . . . . . . . . . . . . . . . . . . . . . . . . . . . . . . . $ 11,794 $ (1,229) $ (2,350)State . . . . . . . . . . . . . . . . . . . . . . . . . . . . . . . . . 9,500 4,193 5,285Foreign . . . . . . . . . . . . . . . . . . . . . . . . . . . . . . . 32,955 29,583 41,552
54,249 32,547 44,487
Deferred:Federal . . . . . . . . . . . . . . . . . . . . . . . . . . . . . . . (58,292) (27,109) (40,154)State . . . . . . . . . . . . . . . . . . . . . . . . . . . . . . . . . (15,087) (23,720) (12,695)Foreign . . . . . . . . . . . . . . . . . . . . . . . . . . . . . . . (11,189) (5,932) (21,569)
(84,568) (56,761) (74,418)
Total benefit for income taxes . . . . . . . . . . . . . . . $(30,319) $(24,214) $(29,931)
F-61

ALERE INC. AND SUBSIDIARIES
NOTES TO CONSOLIDATED FINANCIAL STATEMENTS (Continued)
(16) Income Taxes (Continued)
Benefit for income taxes in 2011 includes a benefit of $7.0 million to correct items related toperiods between 2007 and 2010. We do not believe that the corrected items are material to 2011 orany previously reported quarterly or annual financial statements. As a result, we have not restated ourpreviously issued annual or quarterly financial statements.
The following table presents the components of our provision for income taxes (in thousands) fordiscontinued operations:
2012 2011 2010
Current:Federal . . . . . . . . . . . . . . . . . . . . . . . . . . . . . . . $ — $ — $ —State . . . . . . . . . . . . . . . . . . . . . . . . . . . . . . . . . — — (73)Foreign . . . . . . . . . . . . . . . . . . . . . . . . . . . . . . . — — —
— — (73)
Deferred:Federal . . . . . . . . . . . . . . . . . . . . . . . . . . . . . . . $ — $ — 5,644State . . . . . . . . . . . . . . . . . . . . . . . . . . . . . . . . . — — 1,095Foreign . . . . . . . . . . . . . . . . . . . . . . . . . . . . . . . — — 424
— — 7,163
Total provision for income taxes . . . . . . . . . . . . . $ — $ — $ 7,090
The following table presents a reconciliation from the U.S. statutory tax rate to our effective taxrate:
2012 2011 2010
Statutory rate . . . . . . . . . . . . . . . . . . . . . . . . . . . . . . . . . . . . . . . . . . . . . 35% 35% 35%Effect of goodwill impairment charge . . . . . . . . . . . . . . . . . . . . . . . . . . — (75) (31)Stock-based compensation . . . . . . . . . . . . . . . . . . . . . . . . . . . . . . . . . . (2) (2) —Rate differential on foreign earnings . . . . . . . . . . . . . . . . . . . . . . . . . . . (2) 42 —Research and development . . . . . . . . . . . . . . . . . . . . . . . . . . . . . . . . . . — 1 —State income taxes, net of federal benefit . . . . . . . . . . . . . . . . . . . . . . 3 8 1Acquisition costs . . . . . . . . . . . . . . . . . . . . . . . . . . . . . . . . . . . . . . . . . . . (2) (2) (2)Contingent consideration . . . . . . . . . . . . . . . . . . . . . . . . . . . . . . . . . . . . 6 4 —Rate changes . . . . . . . . . . . . . . . . . . . . . . . . . . . . . . . . . . . . . . . . . . . . . (2) 3 —Other permanent items . . . . . . . . . . . . . . . . . . . . . . . . . . . . . . . . . . . . . 1 3 —Change in valuation allowance . . . . . . . . . . . . . . . . . . . . . . . . . . . . . . . (9) (2) —Uncertain tax positions . . . . . . . . . . . . . . . . . . . . . . . . . . . . . . . . . . . . . . (3) — —
Effective tax rate . . . . . . . . . . . . . . . . . . . . . . . . . . . . . . . . . . . . . . . . . 25% 15% 3%
The goodwill impairment charge created a deferred tax impact due to the existence of goodwilldeductible for tax purposes. The deferred tax is calculated based on a methodology which allocatesthe goodwill impairment loss proportionally to the goodwill deductible for tax purposes compared tototal goodwill. The goodwill impairment allocated to goodwill deductible for tax purposes created adeferred tax asset of $35.3 million as of December 31, 2011. There has been no change to thegoodwill impairment charge or the deferred tax asset in 2012.
F-62

ALERE INC. AND SUBSIDIARIES
NOTES TO CONSOLIDATED FINANCIAL STATEMENTS (Continued)
(16) Income Taxes (Continued)
During the year ended December 31, 2012, we increased the liability for income taxes associatedwith uncertain tax positions by $3.2 million to a total of $19.0 million at December 31, 2012. Theprimary reasons for the increase are foreign tax exposures associated with certain restructurings whichincreased the liability for income taxes associated with uncertain tax positions by $4.8 million anddecreased that liability by $1.5 million primarily related to the reversal of domestic reserves no longerrequired due to audit settlements. We classify $12.6 million of income tax liabilities as non-currentincome tax liabilities, $0.9 million as income taxes payable and $5.5 million of income tax liabilities asreserves net of long-term deferred tax assets which is not anticipated to be paid within one year of thebalance sheet date. These non-current income tax liabilities are recorded in other long-term liabilities inour consolidated balance sheet at December 31, 2012. We anticipate an increase every quarter to thetotal amount of unrecognized tax benefits. We do not anticipate a significant increase or decrease ofthe total amount of unrecognized tax benefits within twelve months of the reporting date.
A reconciliation of the beginning and ending amount of unrecognized tax benefits is as follows(in thousands):
Amount
Balances as of January 1, 2010 . . . . . . . . . . . . . . . . . . . . . . . . . . . . . . . . . . $ 4,905Additions for tax positions in current and prior year acquisitions . . . . . . . . 2,070Additions for tax positions taken during current year . . . . . . . . . . . . . . . . . . 263Expiration of statutes of limitations or closure of tax audits . . . . . . . . . . . . . (1,078)
Balances as of December 31, 2010 . . . . . . . . . . . . . . . . . . . . . . . . . . . . . . . 6,160Additions for tax positions in current and prior year acquisitions . . . . . . . . 189Additions for tax positions taken during current year . . . . . . . . . . . . . . . . . . 5,814Reductions for tax positions taken during prior years . . . . . . . . . . . . . . . . . (26)Reductions for tax positions in current and prior year acquisitions . . . . . . . (1,922)Expiration of statutes of limitations or closure of tax audits . . . . . . . . . . . . . (684)
Balance as of December 31, 2011 . . . . . . . . . . . . . . . . . . . . . . . . . . . . . . . . 9,531Previously recorded tax reserves not included in disclosure . . . . . . . . . . . . 6,236Additions for tax positions in current and prior year acquisitions . . . . . . . . 1,852Additions for tax positions taken during current year . . . . . . . . . . . . . . . . . . 2,922Reductions for tax positions taken during prior years . . . . . . . . . . . . . . . . . (208)Reductions for tax positions in current and prior year acquisitions . . . . . . . —Expiration of statutes of limitations or closure of tax audits . . . . . . . . . . . . . (1,328)
Balance as of December 31, 2012 . . . . . . . . . . . . . . . . . . . . . . . . . . . . . . . . $19,005
Interest and penalties related to income tax liabilities are included in income tax expense. Theinterest and penalties recorded in 2012 amounted to $0.5 million of income due to a reduction in therequired accrual for interest. The balance of accrued interest and penalties recorded on theconsolidated balance sheet at December 31, 2012 was $0.4 million.
With limited exceptions, we are subject to U.S. federal, state and local or non-U.S. income taxaudits by tax authorities for 2006 through 2011. We are currently under income tax examination by theIRS and a number of state and foreign tax authorities and anticipate these audits will be completed bythe end of 2013. We cannot currently estimate the impact of these audits due to the uncertaintiesassociated with tax examinations.
F-63

ALERE INC. AND SUBSIDIARIES
NOTES TO CONSOLIDATED FINANCIAL STATEMENTS (Continued)
(17) Financial Information by Segment
Operating segments are defined as components of an enterprise about which separate financialinformation is available that is evaluated regularly by the chief operating decision maker, or decision-making group, in deciding how to allocate resources and in assessing performance. Our chiefoperating decision-making group is composed of the chief executive officer and members of seniormanagement. Our reportable operating segments are professional diagnostics, health informationsolutions, consumer diagnostics and corporate and other. Our operating results include license androyalty revenue which are allocated to Professional Diagnostics and Consumer Diagnostics on thebasis of the original license or royalty agreement.
On January 15, 2010, we completed the sale of our vitamins and nutritional supplements business(Note 22). The sale included our private label and branded nutritionals businesses and represents thecomplete divestiture of our entire vitamins and nutritional supplements business segment. The resultsof the entire vitamins and nutritional supplements business are included in income from discontinuedoperations, net of tax, in our consolidated financial statements.
The accounting policies of the segments are the same as those described in the summary ofsignificant accounting policies. We evaluate performance of our operating segments based on revenueand operating income (loss). Revenues are attributed to geographic areas based on where thecustomer is located. Segment information for 2012, 2011 and 2010 is as follows (in thousands):
2012ProfessionalDiagnostics
HealthInformationSolutions
ConsumerDiagnostics
CorporateandOther Total
Net revenue . . . . . . . . . . . . . . . . . . . . . . . $2,189,892 $535,422 $ 93,511 $ — $2,818,825Operating income (loss) . . . . . . . . . . . . . $ 243,080 $ (73,432) $ 12,707 $(73,223) $ 109,132Depreciation and amortization . . . . . . . . $ 355,957 $ 96,427 $ 3,455 $ 1,008 $ 456,847Restructuring charge . . . . . . . . . . . . . . . $ 11,124 $ 9,203 $ — $ (2) $ 20,325Stock-based compensation . . . . . . . . . . $ — $ — $ — $ 15,665 $ 15,665Assets . . . . . . . . . . . . . . . . . . . . . . . . . . . $6,214,847 $593,172 $192,748 $ 67,161 $7,067,928Expenditures for property, plant and
equipment . . . . . . . . . . . . . . . . . . . . . . $ 100,147 $ 41,775 $ 2,823 $ 1,201 $ 145,946
2011ProfessionalDiagnostics
HealthInformationSolutions
ConsumerDiagnostics
CorporateandOther Total
Net revenue . . . . . . . . . . . . . . . . . . . . . . $1,756,509 $ 534,514 $ 95,504 $ — $2,386,527Operating income (loss) . . . . . . . . . . . . . $ 248,097 $(439,872) $ 10,442 $(71,522) $ (252,855)Goodwill impairment charge . . . . . . . . . $ — $ 383,612 $ — $ — $ 383,612Depreciation and amortization . . . . . . . . $ 283,112 $ 108,383 $ 5,375 $ 716 $ 397,586Restructuring charge . . . . . . . . . . . . . . . $ 13,949 $ 13,194 $ (57) $ 1,196 $ 28,282Stock-based compensation . . . . . . . . . . $ — $ — $ — $ 21,215 $ 21,215Assets . . . . . . . . . . . . . . . . . . . . . . . . . . . $5,826,756 $ 624,305 $199,422 $ 22,218 $6,672,701Expenditures for property, plant and
equipment . . . . . . . . . . . . . . . . . . . . . . $ 81,774 $ 46,850 $ 2,676 $ 1,232 $ 132,532
F-64

ALERE INC. AND SUBSIDIARIES
NOTES TO CONSOLIDATED FINANCIAL STATEMENTS (Continued)
(17) Financial Information by Segment (Continued)
2010ProfessionalDiagnostics
HealthInformationSolutions
ConsumerDiagnostics
CorporateandOther Total
Net revenue . . . . . . . . . . . . . . . . . . . . $1,459,492 $ 598,819 $ 97,036 $ — $2,155,347Operating income (loss) . . . . . . . . . . . $ 134,687 $(1,024,809) $ 11,310 $ (72,277) $ (951,089)Goodwill impairment charge . . . . . . . $ — $ 1,006,357 $ — $ — $1,006,357Depreciation and amortization . . . . . . $ 246,080 $ 120,617 $ 5,439 $ 654 $ 372,790Restructuring charge . . . . . . . . . . . . . $ 7,941 $ 7,249 $ 77 $ — $ 15,267Stock-based compensation . . . . . . . . $ — $ — $ — $ 29,879 $ 29,879Assets . . . . . . . . . . . . . . . . . . . . . . . . . $4,913,491 $ 1,011,183 $207,795 $197,905 $6,330,374Expenditures for property, plant and
equipment . . . . . . . . . . . . . . . . . . . . $ 43,364 $ 48,410 $ 4,314 $ 153 $ 96,241
The following tables summarize our net revenue from the professional diagnostics and healthinformation solutions reporting segments by groups of similar products and services for 2012, 2011and 2010 (in thousands):
Professional Diagnostics Segment
2012 2011 2010
Cardiology . . . . . . . . . . . . . . . . . . . . . . . . . . . . $ 503,534 $ 518,746 $ 488,497Infectious disease . . . . . . . . . . . . . . . . . . . . . . 615,950 564,983 437,709Toxicology . . . . . . . . . . . . . . . . . . . . . . . . . . . . 587,261 387,209 300,125Diabetes . . . . . . . . . . . . . . . . . . . . . . . . . . . . . 144,441 14,960 —Other . . . . . . . . . . . . . . . . . . . . . . . . . . . . . . . . 314,030 250,274 214,387
Net product sales and services revenue . . . . 2,165,216 1,736,172 1,440,718License and royalty revenue . . . . . . . . . . . . . 24,676 20,337 18,774
Professional diagnostics net revenue . . . . . . $2,189,892 $1,756,509 $1,459,492
Health Information Solutions Segment
2012 2011 2010
Disease and case management . . . . . . . . . . $ 218,378 $ 237,938 $ 281,563Women’s & children’s health . . . . . . . . . . . . . 120,259 114,287 126,910Wellness . . . . . . . . . . . . . . . . . . . . . . . . . . . . . 104,634 104,868 103,343Patient self-testing services . . . . . . . . . . . . . . 92,151 77,421 87,003
Health information solutions net revenue . . . $ 535,422 $ 534,514 $ 598,819
The following tables summarize our net revenue by geographic area for 2012, 2011 and 2010,respectively, and our long-lived tangible assets by geographic area as of December 31, 2012 and2011, respectively (in thousands):
2012 2011 2010
Revenue by Geographic Area:United States . . . . . . . . . . . . . . . . . . . . . . . . . . $1,724,704 $1,453,160 $1,380,314Europe . . . . . . . . . . . . . . . . . . . . . . . . . . . . . . . 483,857 396,480 361,810Elsewhere . . . . . . . . . . . . . . . . . . . . . . . . . . . . 610,264 536,887 413,223
$2,818,825 $2,386,527 $2,155,347
F-65

ALERE INC. AND SUBSIDIARIES
NOTES TO CONSOLIDATED FINANCIAL STATEMENTS (Continued)
(17) Financial Information by Segment (Continued)
December 31,
2012 2011
Long-lived Tangible Assets by Geographic Area:United States . . . . . . . . . . . . . . . . . . . . . . . . . . . . . . . . . . . . $ 295,786 $ 290,708United Kingdom . . . . . . . . . . . . . . . . . . . . . . . . . . . . . . . . . . 37,928 27,515China . . . . . . . . . . . . . . . . . . . . . . . . . . . . . . . . . . . . . . . . . . . 31,277 29,563Elsewhere . . . . . . . . . . . . . . . . . . . . . . . . . . . . . . . . . . . . . . . 169,478 143,419
$ 534,469 $ 491,205
(18) Related Party Transactions
In November 2008, the Zwanziger Family Trust, a trust established for the benefit of the children ofRon Zwanziger, our Chairman, Chief Executive Officer and President, and the trustee of which isMr. Zwanziger’s sister, purchased certain of our securities from third parties in market transactions.The purchase consisted of approximately $1.0 million of each of the following of our outstandingsecurities: our common stock, our Series B Preferred Stock and our convertible notes. To the extentwe make principal and interest payments under the convertible notes in accordance with their terms,the Zwanziger Family Trust, as a holder of convertible notes, will receive its proportionate share.
In May 2007, we completed the formation of SPD, our 50/50 joint venture with P&G, for thedevelopment, manufacturing, marketing and sale of existing and to-be-developed consumer diagnosticproducts, outside the cardiology, diabetes and oral care fields. Upon completion of the arrangement toform the joint venture, we ceased to consolidate the operating results of our consumer diagnosticproducts business related to the joint venture and instead account for our 50% interest in the results ofthe joint venture under the equity method of accounting.
At December 31, 2012 and 2011, we had a net receivable from the joint venture of $2.3 millionand $2.5 million, respectively. Included in the $2.3 million receivable balance as of December 31, 2012is approximately $1.6 million of costs incurred in connection with our 2008 SPD-related restructuringplans. Included in the $2.5 million receivable balance as of December 31, 2011 is approximately $1.5million of costs incurred in connection with our 2008 SPD-related restructuring plans. We have alsorecorded a long-term receivable totaling approximately $14.6 million and $15.5 million as ofDecember 31, 2012 and December 31, 2011, respectively, related to the 2008 SPD-relatedrestructuring plans. Additionally, customer receivables associated with revenue earned after theformation of the joint venture was completed have been classified as other receivables within prepaidexpenses and other current assets on our accompanying consolidated balance sheets in the amount of$6.9 million and $7.3 million as of December 31, 2012 and 2011, respectively. In connection with thejoint venture arrangement, the joint venture bears the collection risk associated with these receivables.Sales to the joint venture under our manufacturing agreement totaled $63.6 million, $71.2 million and$68.1 million during the years ended December 31, 2012, 2011 and 2010, respectively. Additionally,services revenue generated pursuant to the long-term services agreement with the joint venture totaled$1.1 million, $1.1 million and $1.2 million during the years ended December 31, 2012, 2011 and 2010,respectively. Sales under our manufacturing agreement and long-term services agreement areincluded in net product sales and services revenue, respectively, in our accompanying consolidatedstatements of operations.
Under the terms of our product supply agreement, SPD purchases products from ourmanufacturing facilities in the U.K. and China. SPD in turn sells a portion of those tests back to us for
F-66

ALERE INC. AND SUBSIDIARIES
NOTES TO CONSOLIDATED FINANCIAL STATEMENTS (Continued)
(18) Related Party Transactions (Continued)
final assembly and packaging. Once packaged, the tests are sold to P&G for distribution to third-partycustomers in North America. As a result of these related transactions, we have recorded $7.3 millionand $8.9 million of trade receivables which are included in accounts receivable on our accompanyingconsolidated balance sheets as of December 31, 2012 and 2011, respectively, and $21.3 million and$19.3 million of trade accounts payable which are included in accounts payable on our accompanyingconsolidated balance sheets as of December 31, 2012 and 2011, respectively. During 2012 and 2010,we received $11.2 million and $8.8 million, respectively, in cash from SPD as a return on ourinvestment.
The following table summarizes our related party balances with SPD within our consolidatedbalance sheets (in thousands):
Balance Sheet Caption
As of December 31,
2012 2011
Accounts receivable, net of allowances . . . . . . . . . . . . . . . . . . . . . . . . . . . . . . . . . . . . $ 7,317 $ 8,931Prepaid expenses and other current assets . . . . . . . . . . . . . . . . . . . . . . . . . . . . . . . . $ 9,161 $ 9,775Deferred financing costs, net, and other non-current assets . . . . . . . . . . . . . . . . . . . $14,629 $15,455Accounts payable . . . . . . . . . . . . . . . . . . . . . . . . . . . . . . . . . . . . . . . . . . . . . . . . . . . . . $21,258 $19,273
In connection with the formation of SPD in May 2007, we entered into an option agreement withP&G, pursuant to which P&G had the right, for a period of 60 days commencing on May 17, 2011, torequire us to acquire all of P&G’s interest in SPD at fair market value, and P&G had the right, uponcertain material breaches by us of our obligations to SPD, to acquire all of our interest in SPD at fairmarket value. On July 16, 2011, P&G’s option to require us to acquire its interest in SPD at fair marketvalue expired. In connection with the expiration of the option, we recognized a gain in the amount ofapproximately $288.9 million during the third quarter of 2011.
(19) Valuation and Qualifying Accounts
We have established reserves against accounts receivable for doubtful accounts, product returns,discounts and other allowances. The activity in the table below includes all accounts receivablereserves. Provisions for doubtful accounts are recorded as a component of general and administrativeexpenses. Provisions for returns, discounts and other allowances are charged against net productsales. The following table sets forth activities in our accounts receivable reserve accounts (inthousands):
Balance atBeginning of
Period Provision
AmountsChargedAgainstReserves
Balance atEnd ofPeriod
Year ended December 31, 2010 . . . . . . . . . $12,462 $14,021 $ (6,102) $20,381Year ended December 31, 2011 . . . . . . . . . $20,381 $23,614 $(19,418) $24,577Year ended December 31, 2012 . . . . . . . . . $24,577 $43,731 $(31,912) $36,396
F-67

ALERE INC. AND SUBSIDIARIES
NOTES TO CONSOLIDATED FINANCIAL STATEMENTS (Continued)
(19) Valuation and Qualifying Accounts (Continued)
We have established reserves against obsolete and slow-moving inventories. The activity in thetable below includes all inventory reserves. Provisions for obsolete and slow-moving inventories arerecorded as a component of cost of net product sales. The following table sets forth activities in ourinventory reserve accounts (in thousands):
Balance atBeginning of
Period Provision
AmountsChargedAgainstReserves
Balance atEnd ofPeriod
Year ended December 31, 2010 . . . . . . . . . $12,632 $ 6,269 $(6,593) $12,308Year ended December 31, 2011 . . . . . . . . . $12,308 $ 6,144 $(4,843) $13,609Year ended December 31, 2012 . . . . . . . . . $13,609 $13,587 $(5,374) $21,822
(20) Restructuring Activities
The following table sets forth aggregate restructuring charges recorded in our consolidatedstatements of operations for the years ended December 31, 2012, 2011 and 2010 (in thousands):
Statement of Operations Caption 2012 2011 2010
Cost of net revenue . . . . . . . . . . . . . . . . . . . . . . . . . . . . . . . . . . . . . . . . . . . $ 3,113 $ 2,915 $ 3,896Research and development . . . . . . . . . . . . . . . . . . . . . . . . . . . . . . . . . . . . 1,278 433 488Sales and marketing . . . . . . . . . . . . . . . . . . . . . . . . . . . . . . . . . . . . . . . . . . 2,504 4,954 1,539General and administrative . . . . . . . . . . . . . . . . . . . . . . . . . . . . . . . . . . . . . 13,430 19,980 9,344
Total operating expenses . . . . . . . . . . . . . . . . . . . . . . . . . . . . . . . . . . . . 20,325 28,282 15,267Interest expense, including amortization of original issue discounts and
deferred financing costs . . . . . . . . . . . . . . . . . . . . . . . . . . . . . . . . . . . . . . 277 280 348Other income, net . . . . . . . . . . . . . . . . . . . . . . . . . . . . . . . . . . . . . . . . . . . . — — (3,494)Equity earnings of unconsolidated entities, net of tax . . . . . . . . . . . . . . . . — 580 3,009
Total charges . . . . . . . . . . . . . . . . . . . . . . . . . . . . . . . . . . . . . . . . . . . . . . $20,602 $29,142 $15,130
(a) 2012 Restructuring Plans
In 2012, management developed cost reduction plans within our professional diagnostics businesssegment, including the integration of our business in Brazil, Europe and the United States. Additionally,management developed new plans to continue our efforts to reduce costs within our health informationsolutions business segment, including the impairment of fixed assets and intangibles associated withterminated projects. The following table summarizes the restructuring activities related to our 2012restructuring plans for the year ended December 31, 2012 (in thousands):
ProfessionalDiagnostics
HealthInformationSolutions Total
Severance-related costs . . . . . . . . . . . . . . . . . $4,732 $3,045 $ 7,777Facility and transition costs . . . . . . . . . . . . . . . 119 1,234 1,353Other exit costs . . . . . . . . . . . . . . . . . . . . . . . . . — 15 15
Cash charges . . . . . . . . . . . . . . . . . . . . . . . . 4,851 4,294 9,145Fixed asset and inventory impairments . . . . . . 304 2,689 2,993Intangible asset impairments . . . . . . . . . . . . . . — 2,988 2,988Other non-cash charges . . . . . . . . . . . . . . . . . . — (31) (31)
Total charges . . . . . . . . . . . . . . . . . . . . . . . . $5,155 $9,940 $15,095
F-68

ALERE INC. AND SUBSIDIARIES
NOTES TO CONSOLIDATED FINANCIAL STATEMENTS (Continued)
(20) Restructuring Activities (Continued)
We anticipate incurring approximately $2.2 million in additional severance and facility costs underthese plans related to our health information solutions business segment through 2014, as well as $0.3million in additional severance and facility costs under these plans related to our professionaldiagnostics business segment in 2013. As of December 31, 2012, $3.4 million in severance and exitcosts under these plans remain unpaid.
(b) 2011 Restructuring Plans
In 2011, management executed a company-wide cost reduction plan, which impacted our corporateand other business segment, as well as the health information solutions and professional diagnosticsbusiness segments. Management also developed plans within our professional diagnostics businesssegment to consolidate operating activities among certain of our U.S., European and Asia Pacificsubsidiaries, including transferring the manufacturing of our Panbio products from Australia to ourStandard Diagnostics facility in South Korea and eliminating redundant costs among our newly acquiredAxis-Shield subsidiaries. Additionally, within our health information solutions business segment,management executed plans to further reduce costs and improve efficiencies, as well as ceaseoperations at our GeneCare Medical Genetics Center, Inc., or GeneCare, facility in Chapel Hill, NorthCarolina and transfer the majority of our Quality Assured Services, Inc. operation in Orlando, Florida toour facility in Livermore, California. The following table summarizes the restructuring activities related toour 2011 restructuring plans for the years ended December 31, 2012 and 2011 (in thousands):
Professional Diagnostics
2012 2011Since
Inception
Severance-related costs . . . . . . . . . . . . . . . . . . . . . . . . $ 3,161 $12,047 $15,208Facility and transition costs . . . . . . . . . . . . . . . . . . . . . 1,599 361 1,960
Cash charges . . . . . . . . . . . . . . . . . . . . . . . . . . . . . . 4,760 12,408 17,168Fixed asset and inventory impairments . . . . . . . . . . . . 704 659 1,363
Total charges . . . . . . . . . . . . . . . . . . . . . . . . . . . . . . . $ 5,464 $13,067 $18,531
Health Information Solutions
2012 2011Since
Inception
Severance-related costs . . . . . . . . . . . . . . . . . . . . . . . . $ — $ 2,254 $ 2,254Facility and transition costs . . . . . . . . . . . . . . . . . . . . . . (723) 6,341 5,618Other exit costs . . . . . . . . . . . . . . . . . . . . . . . . . . . . . . . 78 94 172
Cash charges . . . . . . . . . . . . . . . . . . . . . . . . . . . . . . . (645) 8,689 8,044Fixed asset and inventory impairments . . . . . . . . . . . . 85 864 949Intangible asset impairments . . . . . . . . . . . . . . . . . . . . — 2,935 2,935Other non-cash charges . . . . . . . . . . . . . . . . . . . . . . . . — 761 761
Total charges . . . . . . . . . . . . . . . . . . . . . . . . . . . . . . . $ (560) $13,249 $12,689
Corporate and Other
2012 2011Since
Inception
Severance-related costs . . . . . . . . . . . . . . . . . . . . . . . $ (3) $ 1,193 $ 1,190
Cash charges . . . . . . . . . . . . . . . . . . . . . . . . . . . . . . (3) 1,193 1,190Fixed asset and inventory impairments . . . . . . . . . . . — 3 3
Total charges . . . . . . . . . . . . . . . . . . . . . . . . . . . . . . $ (3) $ 1,196 $ 1,193
F-69

ALERE INC. AND SUBSIDIARIES
NOTES TO CONSOLIDATED FINANCIAL STATEMENTS (Continued)
(20) Restructuring Activities (Continued)
We anticipate incurring approximately $1.8 million in additional costs under these plans related toour professional diagnostics business segment, primarily related to severance and facility exit costs,and may also incur impairment charges on assets as plans are finalized. We anticipate incurringminimal additional costs under these plans related to our health information solutions businesssegment, primarily related to imputed interest on facility lease obligations. As of December 31, 2012,$1.5 million in cash charges remain unpaid.
(c) 2010 Restructuring Plans
In 2010, management developed several plans to reduce costs and improve efficiencies within ourhealth information solutions and professional diagnostics business segments. The following tablesummarizes the restructuring activities related to the 2010 restructuring plans for the years endedDecember 31, 2012, 2011 and 2010 and since inception (in thousands):
Professional Diagnostics
2012 2011 2010Since
Inception
Severance-related costs . . . . . . . . . . . . . . . . . . $ — $ 74 $2,406 $2,480Facility and transition costs . . . . . . . . . . . . . . . . — 174 812 986Other exit costs . . . . . . . . . . . . . . . . . . . . . . . . . — — 10 10
Cash charges . . . . . . . . . . . . . . . . . . . . . . . . . — 248 3,228 3,476Fixed asset and inventory impairments . . . . . . — — 126 126
Total charges . . . . . . . . . . . . . . . . . . . . . . . . . $ — $ 248 $3,354 $3,602
Health Information Solutions
2012 2011 2010Since
Inception
Severance-related costs . . . . . . . . . . . . . . . . . . $ — $ — $4,647 $4,647Facility and transition costs (recoveries) . . . . . (84) 40 2,436 2,392Other exit costs . . . . . . . . . . . . . . . . . . . . . . . . . 52 98 190 340
Cash charges (recoveries) . . . . . . . . . . . . . . (32) 138 7,273 7,379Fixed asset and inventory impairments . . . . . . — — 165 165
Total charges (recoveries) . . . . . . . . . . . . . . . $ (32) $ 138 $7,438 $7,544
We do not anticipate incurring significant additional charges under these plans. As ofDecember 31, 2012, $0.7 million in facility-related costs remain unpaid.
F-70

ALERE INC. AND SUBSIDIARIES
NOTES TO CONSOLIDATED FINANCIAL STATEMENTS (Continued)
(20) Restructuring Activities (Continued)
(d) 2008 Restructuring Plans
In May 2008, management decided to close our facility located in Bedford, England and initiatedsteps to cease operations at this facility and transition the manufacturing operations principally to ourmanufacturing facilities in Shanghai and Hangzhou, China. The following table summarizes therestructuring activities under this plan for the years ended December 31, 2012, 2011 and 2010 andsince inception (in thousands):
2012 2011 2010Since
Inception
Severance-related costs (recoveries) . . . . . $ (16) $ (74) $ 154 $ 3,364Facility and transition costs (recoveries) . . . (32) 577 1,644 4,180Other exit costs (recoveries) . . . . . . . . . . . . — — (3,443) 3,842
Cash charges (recoveries) . . . . . . . . . . . . (48) 503 (1,645) 11,386Fixed asset and inventory impairments
(recoveries) . . . . . . . . . . . . . . . . . . . . . . . . — (125) 399 5,796
Total charges (recoveries) . . . . . . . . . . . . $ (48) $ 378 $(1,246) $17,182
During the year ended December 31, 2010, we recorded net recoveries of $3.4 million in other exitcosts as a result of a settlement of the facility restoration and lease costs with the landlord of theBedford facility. The costs incurred for the years ended December 31, 2012, 2011 and 2010 wereincluded in our professional diagnostics business segment.
In addition to the restructuring charges discussed above, certain charges associated with theBedford facility closure were borne by SPD, our 50/50 joint venture with P&G. Of the restructuringcharges recorded by SPD, 50% has been included in equity earnings of unconsolidated entities, net oftax, in our consolidated statements of operations. The following table summarizes the 50% portion ofthe restructuring charges borne by SPD and included in equity earnings of unconsolidated entities, netof tax, for the years ended December 31, 2011 and 2010 and since inception (in thousands):
2011 2010Since
Inception
Severance-related costs . . . . . . . . . . . . . . . . . . . . . . . . . . $ 30 $ 747 $ 5,797Facility and transition costs . . . . . . . . . . . . . . . . . . . . . . . . 479 2,364 5,396Other exit costs . . . . . . . . . . . . . . . . . . . . . . . . . . . . . . . . . — 145 283
Cash charges . . . . . . . . . . . . . . . . . . . . . . . . . . . . . . . . . 509 3,256 11,476Fixed asset and inventory impairments (recoveries) . . . 71 (247) 4,635
Total charges included in equity earnings ofunconsolidated entities, net of tax . . . . . . . . . . . . . . . . $ 580 $3,009 $16,111
As of December 31, 2012, all cash charges have been paid and we do not anticipate incurringsignificant additional restructuring charges under this plan.
F-71
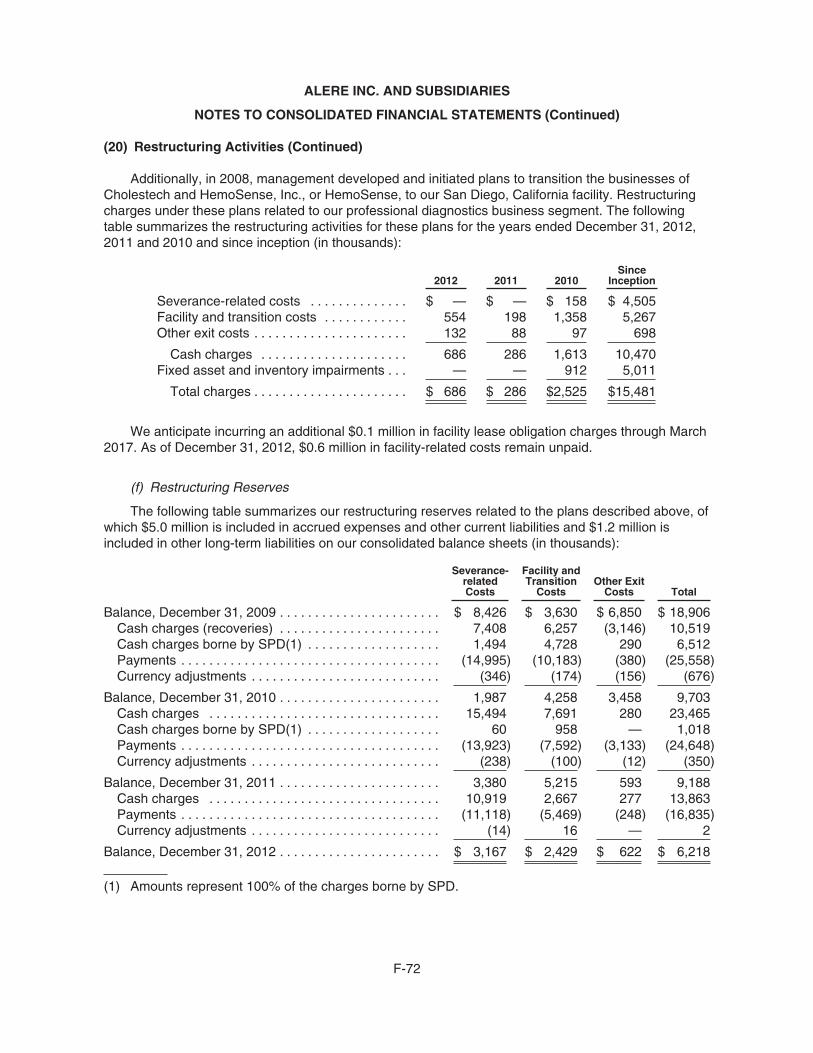
ALERE INC. AND SUBSIDIARIES
NOTES TO CONSOLIDATED FINANCIAL STATEMENTS (Continued)
(20) Restructuring Activities (Continued)
Additionally, in 2008, management developed and initiated plans to transition the businesses ofCholestech and HemoSense, Inc., or HemoSense, to our San Diego, California facility. Restructuringcharges under these plans related to our professional diagnostics business segment. The followingtable summarizes the restructuring activities for these plans for the years ended December 31, 2012,2011 and 2010 and since inception (in thousands):
2012 2011 2010Since
Inception
Severance-related costs . . . . . . . . . . . . . . $ — $ — $ 158 $ 4,505Facility and transition costs . . . . . . . . . . . . 554 198 1,358 5,267Other exit costs . . . . . . . . . . . . . . . . . . . . . . 132 88 97 698
Cash charges . . . . . . . . . . . . . . . . . . . . . 686 286 1,613 10,470Fixed asset and inventory impairments . . . — — 912 5,011
Total charges . . . . . . . . . . . . . . . . . . . . . . $ 686 $ 286 $2,525 $15,481
We anticipate incurring an additional $0.1 million in facility lease obligation charges through March2017. As of December 31, 2012, $0.6 million in facility-related costs remain unpaid.
(f) Restructuring Reserves
The following table summarizes our restructuring reserves related to the plans described above, ofwhich $5.0 million is included in accrued expenses and other current liabilities and $1.2 million isincluded in other long-term liabilities on our consolidated balance sheets (in thousands):
Severance-relatedCosts
Facility andTransition
CostsOther ExitCosts Total
Balance, December 31, 2009 . . . . . . . . . . . . . . . . . . . . . . . $ 8,426 $ 3,630 $ 6,850 $ 18,906Cash charges (recoveries) . . . . . . . . . . . . . . . . . . . . . . . 7,408 6,257 (3,146) 10,519Cash charges borne by SPD(1) . . . . . . . . . . . . . . . . . . . 1,494 4,728 290 6,512Payments . . . . . . . . . . . . . . . . . . . . . . . . . . . . . . . . . . . . . (14,995) (10,183) (380) (25,558)Currency adjustments . . . . . . . . . . . . . . . . . . . . . . . . . . . (346) (174) (156) (676)
Balance, December 31, 2010 . . . . . . . . . . . . . . . . . . . . . . . 1,987 4,258 3,458 9,703Cash charges . . . . . . . . . . . . . . . . . . . . . . . . . . . . . . . . . 15,494 7,691 280 23,465Cash charges borne by SPD(1) . . . . . . . . . . . . . . . . . . . 60 958 — 1,018Payments . . . . . . . . . . . . . . . . . . . . . . . . . . . . . . . . . . . . . (13,923) (7,592) (3,133) (24,648)Currency adjustments . . . . . . . . . . . . . . . . . . . . . . . . . . . (238) (100) (12) (350)
Balance, December 31, 2011 . . . . . . . . . . . . . . . . . . . . . . . 3,380 5,215 593 9,188Cash charges . . . . . . . . . . . . . . . . . . . . . . . . . . . . . . . . . 10,919 2,667 277 13,863Payments . . . . . . . . . . . . . . . . . . . . . . . . . . . . . . . . . . . . . (11,118) (5,469) (248) (16,835)Currency adjustments . . . . . . . . . . . . . . . . . . . . . . . . . . . (14) 16 — 2
Balance, December 31, 2012 . . . . . . . . . . . . . . . . . . . . . . . $ 3,167 $ 2,429 $ 622 $ 6,218
(1) Amounts represent 100% of the charges borne by SPD.
F-72

ALERE INC. AND SUBSIDIARIES
NOTES TO CONSOLIDATED FINANCIAL STATEMENTS (Continued)
(21) Equity Investments
We account for the results from our equity investments under the equity method of accounting inaccordance with ASC 323 Investments — Equity Method and Joint Ventures, based on the percentageof our ownership interest in the business. Our equity investments primarily include the following:
(i) Axis-Shield
During the third quarter of 2011, we acquired, in various transactions, approximately 15.0 millionshares of Axis-Shield, which represented a 29.9% ownership interest in Axis-Shield as ofSeptember 30, 2011. During the fourth quarter of 2011, we acquired a controlling interest of Axis-Shield (Note 4). Our equity earnings attributable to this investment during 2011 were immaterial.
(ii) SPD
In May 2007, we completed the formation of SPD, our 50/50 joint venture with P&G for thedevelopment, manufacturing, marketing and sale of existing and to-be-developed consumer diagnosticproducts, outside the cardiology, diabetes and oral care fields. Upon completion of the arrangement toform SPD, we ceased to consolidate the operating results of our consumer diagnostics businessrelated to SPD. For the years ended December 31, 2012, 2011 and 2010, we recorded earnings of$10.7 million, $5.9 million and $8.5 million, respectively, in equity earnings of unconsolidated entities,net of tax, in our accompanying consolidated statements of operations, which represented our 50%share of SPD’s net income for the respective periods.
(iii) TechLab
In May 2006, we acquired 49% of TechLab, Inc., or TechLab, a privately-held developer,manufacturer and distributor of rapid non-invasive intestinal diagnostics tests in the areas of intestinalinflammation, antibiotic-associated diarrhea and parasitology. For the years ended December 31,2012, 2011 and 2010, we recorded earnings of $2.3 million, $2.0 million and $1.9 million, respectively,in equity earnings of unconsolidated entities, net of tax, in our accompanying consolidated statementsof operations, which represented our minority share of TechLab’s net income for the respective period.
Summarized financial information for the P&G joint venture and TechLab on a combined basis isas follows (in thousands):
Combined condensed results of operations:
For The Years Ended December 31,
2012 2011 2010
Net revenue . . . . . . . . . . . . . . . . . . . . . . . . . . . . $212,955 $232,857 $224,193
Gross profit . . . . . . . . . . . . . . . . . . . . . . . . . . . . . $139,694 $146,466 $142,159
Net income after taxes . . . . . . . . . . . . . . . . . . . $ 26,056 $ 15,922 $ 20,913
F-73

ALERE INC. AND SUBSIDIARIES
NOTES TO CONSOLIDATED FINANCIAL STATEMENTS (Continued)
(21) Equity Investments (Continued)
Combined condensed balance sheets:
As of December 31,
2012 2011
Current assets . . . . . . . . . . . . . . . . . . . . . . . . . . . . . . . . . . . . . $ 79,842 $ 84,376Non-current assets . . . . . . . . . . . . . . . . . . . . . . . . . . . . . . . . . 38,991 37,659
Total assets . . . . . . . . . . . . . . . . . . . . . . . . . . . . . . . . . . . . . $118,833 $122,035
Current liabilities . . . . . . . . . . . . . . . . . . . . . . . . . . . . . . . . . . . $ 45,084 $ 49,453Non-current liabilities . . . . . . . . . . . . . . . . . . . . . . . . . . . . . . . 6,791 6,326
Total liabilities . . . . . . . . . . . . . . . . . . . . . . . . . . . . . . . . . . . $ 51,875 $ 55,779
(22) Discontinued Operations
On January 15, 2010, we completed the sale of our vitamins and nutritional supplements businessfor a purchase price of approximately $62.6 million in cash, which is net of the final working capitaladjustment. The sale included our entire private label and branded nutritional businesses andrepresents the complete divestiture of our entire vitamins and nutritional supplements businesssegment. We recognized a gain of approximately $18.7 million ($11.6 million, net of tax) during 2010.The results of the vitamins and nutritional supplements business, which represents our entire vitaminsand nutritional supplements business segment, are included in income from discontinued operations,net of tax, in our consolidated financial statements.
The following summarized financial information related to the vitamins and nutritional supplementsbusinesses has been segregated from continuing operations and reported as discontinued operationsthrough the date of disposition (in thousands).
For The Year EndedDecember 31, 2010
Net revenue . . . . . . . . . . . . . . . . . . . . . . . . . . . . . . . . . . . . . . . . . . . $ 4,362Income from discontinued operations before income taxes . . . . . $18,487Provision for income taxes . . . . . . . . . . . . . . . . . . . . . . . . . . . . . . . $ 7,090Net income from discontinued operations . . . . . . . . . . . . . . . . . . . $11,397
(23) Supplemental Cash Flow Information
Cash Paid for Interest and Income Taxes:
During 2012, 2011 and 2010, we made cash payments for interest totaling $205.0 million,$164.7 million and $117.1 million, respectively.
During 2012, 2011 and 2010, total net cash paid for income taxes was $31.9 million, $47.8 millionand $31.1 million, respectively.
F-74

ALERE INC. AND SUBSIDIARIES
NOTES TO CONSOLIDATED FINANCIAL STATEMENTS (Continued)
(23) Supplemental Cash Flow Information (Continued)
Non-cash Investing Activities:
During 2011, we issued shares of our common stock in connection with certain acquisitions(dollars in thousands):
Date of Acquisition
Common Stock Issued
Company AcquiredNumber ofShares
Fair Value ofShares
Arriva Medical LLC . . . . . . . . . . . . . November 23, 2011 806,452 $15,183Pregnancy.org, LLC . . . . . . . . . . . . January 28, 2011 25,463 $ 1,000
Non-Cash Financing Activities:
During 2011 and 2010, we recorded non-cash income (expense) to accumulated othercomprehensive income (loss) of $7.3 million and $2.4 million, respectively, representing the change infair market value of our interest rate swap agreement.
During 2012, we issued shares of our common stock in connection with the settlement of anacquisition-related contingent consideration obligation (dollars in thousands):
Common Stock Issued
Contingent Consideration ObligationNumber ofShares
Fair Value ofShares
Mologic . . . . . . . . . . . . . . . . . . . . . . . . . . . . . . . . . . . . . . . . . . 66,666 $1,243
(24) Guarantor Financial Information
Our 7.25% senior notes due 2018, our 7.875% senior notes due 2016, our 9% senior subordinatednotes due 2018, and our 8.625% senior subordinated notes due 2018 are guaranteed by certain of ourconsolidated wholly owned subsidiaries, or the Guarantor Subsidiaries. The guarantees are full andunconditional and joint and several. The following supplemental financial information sets forth, on aconsolidating basis, audited balance sheets as of December 31, 2012 and 2011, the relatedstatements of operations, statements of comprehensive income (loss) and cash flows for each of thethree years in the period ended December 31, 2012, respectively, for Alere Inc., the GuarantorSubsidiaries and our other subsidiaries, or the Non-Guarantor Subsidiaries. The supplemental financialinformation reflects the investments of Alere Inc. and the Guarantor Subsidiaries in the Guarantor andNon-Guarantor Subsidiaries using the equity method of accounting.
We have extensive transactions and relationships between various members of the consolidatedgroup. These transactions and relationships include intercompany pricing agreements, intellectualproperty royalty agreements and general and administrative and research and development cost-sharing agreements. Because of these relationships, it is possible that the terms of these transactionsare not the same as those that would result from transactions among wholly unrelated parties.
For comparative purposes, certain amounts for prior periods have been reclassified to conform tothe current period classification.
F-75

ALERE INC. AND SUBSIDIARIES
NOTES TO CONSOLIDATED FINANCIAL STATEMENTS (Continued)
(24) Guarantor Financial Information (Continued)
CONSOLIDATING STATEMENT OF OPERATIONSFor the Year Ended December 31, 2012
IssuerGuarantor
Subsidiaries
Non-Guarantor
Subsidiaries Eliminations Consolidated
Net product sales . . . . . . . . . . . . . . . . . . . . . . $ — $ 849,786 $1,207,822 $(143,877)$1,913,731Services revenue . . . . . . . . . . . . . . . . . . . . . . — 592,511 284,007 — 876,518
Net product sales and servicesrevenue . . . . . . . . . . . . . . . . . . . . . . . . . . — 1,442,297 1,491,829 (143,877) 2,790,249
License and royalty revenue . . . . . . . . . . . . . — 18,629 18,177 (8,230) 28,576
Net revenue . . . . . . . . . . . . . . . . . . . . . . — 1,460,926 1,510,006 (152,107) 2,818,825
Cost of net product sales . . . . . . . . . . . . . . . 6,040 405,685 654,921 (134,496) 932,150Cost of services revenue . . . . . . . . . . . . . . . — 320,148 136,910 (6,059) 450,999
Cost of net product sales and servicesrevenue . . . . . . . . . . . . . . . . . . . . . . . . . . 6,040 725,833 791,831 (140,555) 1,383,149
Cost of license and royalty revenue . . . . . . . — — 15,583 (8,229) 7,354
Cost of net revenue . . . . . . . . . . . . . . . . . 6,040 725,833 807,414 (148,784) 1,390,503
Gross profit (loss) . . . . . . . . . . . . . . . . (6,040) 735,093 702,592 (3,323) 1,428,322Operating expenses:
Research and development . . . . . . . . . . . 24,593 66,929 91,479 — 183,001Sales and marketing . . . . . . . . . . . . . . . . . 4,414 304,548 334,461 — 643,423General and administrative . . . . . . . . . . . . 52,079 208,981 231,706 — 492,766
Operating income (loss) . . . . . . . . . (87,126) 154,635 44,946 (3,323) 109,132Interest expense, including amortization of
original issue discounts and deferredfinancing costs . . . . . . . . . . . . . . . . . . . . . . (236,320) (39,292) (13,362) 48,414 (240,560)
Other income (expense), net . . . . . . . . . . . . (16,655) 40,476 34,550 (48,414) 9,957
Income (loss) before provision (benefit)for income taxes . . . . . . . . . . . . . . . . . . . (340,101) 155,819 66,134 (3,323) (121,471)
Provision (benefit) for income taxes . . . . . . . (111,595) 48,904 33,327 (955) (30,319)
Income (loss) before equity earnings ofunconsolidated entities, net of tax . . . . (228,506) 106,915 32,807 (2,368) (91,152)
Equity in earnings (losses) of subsidiaries,net of tax . . . . . . . . . . . . . . . . . . . . . . . . . . . 148,394 (1,574) — (146,820) —
Equity earnings of unconsolidated entities,net of tax . . . . . . . . . . . . . . . . . . . . . . . . . . . 2,205 — 10,952 88 13,245
Net income (loss) . . . . . . . . . . . . . . . . . (77,907) 105,341 43,759 (149,100) (77,907)Less: Net income attributable to non-
controlling interests . . . . . . . . . . . . . . . . — — 275 — 275
Net income (loss) attributable to AlereInc. and Subsidiaries . . . . . . . . . . . . . . . (77,907) 105,341 43,484 (149,100) (78,182)
Preferred stock dividends . . . . . . . . . . . . . . . (21,293) — — — (21,293)
Net income (loss) available to commonstockholders . . . . . . . . . . . . . . . . . . . . . . . $ (99,200)$ 105,341 $ 43,484 $(149,100)$ (99,475)
F-76

ALERE INC. AND SUBSIDIARIES
NOTES TO CONSOLIDATED FINANCIAL STATEMENTS (Continued)
(24) Guarantor Financial Information (Continued)
CONSOLIDATING STATEMENT OF OPERATIONSFor the Year Ended December 31, 2011
(in thousands)
IssuerGuarantor
SubsidiariesNon-GuarantorSubsidiaries Eliminations Consolidated
Net product sales . . . . . . . . . . . . . . . . . . . . . . . $ — $ 896,069 $ 914,885 $(127,822) $1,683,132Services revenue . . . . . . . . . . . . . . . . . . . . . . . — 582,924 96,998 — 679,922
Net product sales and services revenue . . . — 1,478,993 1,011,883 (127,822) 2,363,054License and royalty revenue . . . . . . . . . . . . . . — 9,504 19,928 (5,959) 23,473
Net revenue . . . . . . . . . . . . . . . . . . . . . . . — 1,488,497 1,031,811 (133,781) 2,386,527
Cost of net product sales . . . . . . . . . . . . . . . . . 3,651 408,742 512,712 (129,681) 795,424Cost of services revenue . . . . . . . . . . . . . . . . . — 306,635 31,597 — 338,232
Cost of net product sales and servicesrevenue . . . . . . . . . . . . . . . . . . . . . . . . . . . 3,651 715,377 544,309 (129,681) 1,133,656
Cost of license and royalty revenue . . . . . . . . — — 12,995 (5,959) 7,036
Cost of net revenue . . . . . . . . . . . . . . . . . 3,651 715,377 557,304 (135,640) 1,140,692
Gross profit (loss) . . . . . . . . . . . . . . . . (3,651) 773,120 474,507 1,859 1,245,835Operating expenses:
Research and development . . . . . . . . . . . 20,182 66,283 63,700 — 150,165Sales and marketing . . . . . . . . . . . . . . . . . 4,091 325,022 236,470 — 565,583General and administrative . . . . . . . . . . . . 48,891 222,958 127,481 — 399,330Goodwill impairment charge . . . . . . . . . . . — 383,612 — — 383,612
Operating income (loss) . . . . . . . . . . . (76,815) (224,755) 46,856 1,859 (252,855)Interest expense, including amortization of
original issue discounts and deferredfinancing costs . . . . . . . . . . . . . . . . . . . . . . . . (156,948) (100,575) (8,795) 62,347 (203,971)
Other income (expense), net . . . . . . . . . . . . . . (8,813) 54,197 18,846 (62,347) 1,883Gain on sale of joint venture interest . . . . . . . . 16,309 — 272,587 — 288,896
Income (loss) from continuing operationsbefore provision (benefit) for incometaxes . . . . . . . . . . . . . . . . . . . . . . . . . . . . . . . (226,267) (271,133) 329,494 1,859 (166,047)
Provision (benefit) for income taxes . . . . . . . . (67,482) 17,411 27,813 (1,956) (24,214)
Income (loss) from continuing operationsbefore equity earnings ofunconsolidated entities, net of tax . . . . . . (158,785) (288,544) 301,681 3,815 (141,833)
Equity in earnings of subsidiaries, net oftax . . . . . . . . . . . . . . . . . . . . . . . . . . . . . . . . . . 23,524 1,530 — (25,054) —
Equity earnings of unconsolidated entities,net of tax . . . . . . . . . . . . . . . . . . . . . . . . . . . . 1,952 — 6,503 69 8,524
Net income (loss) . . . . . . . . . . . . . . . . . . . (133,309) (287,014) 308,184 (21,170) (133,309)Less: Net income attributable to non-
controlling interests . . . . . . . . . . . . . . . . . . — — 233 — 233
Net income (loss) attributable to Alere Inc.and Subsidiaries . . . . . . . . . . . . . . . . . . . . . (133,309) (287,014) 307,951 (21,170) (133,542)
Preferred stock dividends . . . . . . . . . . . . . . . . . (22,049) — — — (22,049)Preferred stock repurchase . . . . . . . . . . . . . . . 23,936 — — — 23,936
Net income (loss) available to commonstockholders . . . . . . . . . . . . . . . . . . . . . . . . $(131,422) $ (287,014) $ 307,951 $ (21,170) $ (131,655)
F-77

ALERE INC. AND SUBSIDIARIES
NOTES TO CONSOLIDATED FINANCIAL STATEMENTS (Continued)
(24) Guarantor Financial Information (Continued)
CONSOLIDATING STATEMENT OF OPERATIONSFor the Year Ended December 31, 2010
(in thousands)
IssuerGuarantor
SubsidiariesNon-GuarantorSubsidiaries Eliminations Consolidated
Net product sales . . . . . . . . . . . . . . . . . . . . . . . $ — $ 843,542 $740,371 $(111,510) $ 1,472,403Services revenue . . . . . . . . . . . . . . . . . . . . . . . — 608,482 53,703 — 662,185
Net product sales and services revenue . . — 1,452,024 794,074 (111,510) 2,134,588License and royalty revenue . . . . . . . . . . . . . . — 9,032 17,138 (5,411) 20,759
Net revenue . . . . . . . . . . . . . . . . . . . . . . . — 1,461,056 811,212 (116,921) 2,155,347
Cost of net product sales . . . . . . . . . . . . . . . . . 166 396,325 403,098 (111,264) 688,325Cost of services revenue . . . . . . . . . . . . . . . . . — 304,269 21,017 — 325,286
Cost of net product sales and servicesrevenue . . . . . . . . . . . . . . . . . . . . . . . . . . . 166 700,594 424,115 (111,264) 1,013,611
Cost of license and royalty revenue . . . . . . . . — 66 12,494 (5,411) 7,149
Cost of net revenue . . . . . . . . . . . . . . . . 166 700,660 436,609 (116,675) 1,020,760
Gross profit (loss) . . . . . . . . . . . . . . . (166) 760,396 374,603 (246) 1,134,587Operating expenses:
Research and development . . . . . . . . . . . 20,936 67,438 44,904 — 133,278Sales and marketing . . . . . . . . . . . . . . . . 3,001 316,884 179,239 — 499,124General and administrative . . . . . . . . . . . 46,982 233,978 165,957 — 446,917Goodwill impairment charge . . . . . . . . . . — 1,006,357 — — 1,006,357
Operating loss . . . . . . . . . . . . . . . . . . . (71,085) (864,261) (15,497) (246) (951,089)Interest expense, including amortization of
original issue discounts and deferredfinancing costs . . . . . . . . . . . . . . . . . . . . . . . (76,179) (135,312) (10,430) 82,486 (139,435)
Other income (expense), net . . . . . . . . . . . . . 10,304 69,938 24,982 (82,486) 22,738
Loss from continuing operations beforeprovision (benefit) for income taxes . . . (136,960) (929,635) (945) (246) (1,067,786)
Provision (benefit) for income taxes . . . . . . . . (58,592) 9,363 19,298 — (29,931)
Loss from continuing operations beforeequity earnings of unconsolidatedentities, net of tax . . . . . . . . . . . . . . . . . . . (78,368) (938,998) (20,243) (246) (1,037,855)
Equity in losses of subsidiaries, net of tax . . . (940,121) — — 940,121 —Equity earnings of unconsolidated entities,
net of tax . . . . . . . . . . . . . . . . . . . . . . . . . . . . 2,023 — 8,680 (137) 10,566
Loss from continuing operations . . . . . . . . . (1,016,466) (938,998) (11,563) 939,738 (1,027,289)Income from discontinued operations, net
of tax . . . . . . . . . . . . . . . . . . . . . . . . . . . . . 574 9,727 1,096 — 11,397
Net loss . . . . . . . . . . . . . . . . . . . . . . . . . . (1,015,892) (929,271) (10,467) 939,738 (1,015,892)Less: Net income attributable to non-
controlling interests . . . . . . . . . . . . . . . . . . . — — 1,418 — 1,418
Net loss attributable to Alere Inc. andSubsidiaries . . . . . . . . . . . . . . . . . . . . . . . . (1,015,892) (929,271) (11,885) 939,738 (1,017,310)
Preferred stock dividends . . . . . . . . . . . . . . . . (24,235) — — — (24,235)
Net loss available to commonstockholders . . . . . . . . . . . . . . . . . . . . . . . . $(1,040,127) $ (929,271) $ (11,885) $ 939,738 $(1,041,545)
F-78

ALERE INC. AND SUBSIDIARIES
NOTES TO CONSOLIDATED FINANCIAL STATEMENTS (Continued)
(24) Guarantor Financial Information (Continued)
CONSOLIDATING STATEMENT OF COMPREHENSIVE INCOME (LOSS)For the Year Ended December 31, 2012
(in thousands)
IssuerGuarantor
SubsidiariesNon-GuarantorSubsidiaries Eliminations Consolidated
Net income (loss) . . . . . . . . . . . . . . . . . . . . . $(77,907) $105,341 $43,759 $(149,100) $(77,907)
Other comprehensive income, before tax:Changes in cumulative translation
adjustment . . . . . . . . . . . . . . . . . . . . . . . . (834) (302) 53,654 2,124 54,642Unrealized gains (losses) on available for
sale securities . . . . . . . . . . . . . . . . . . . . . (221) — 5 — (216)Unrealized gains on hedging
instruments . . . . . . . . . . . . . . . . . . . . . . . . 16 — 372 — 388Minimum pension liability adjustment . . . . — — (1,042) — (1,042)
Other comprehensive income (loss),before tax . . . . . . . . . . . . . . . . . . . . . . . (1,039) (302) 52,989 2,124 53,772
Income tax benefit related to items ofother comprehensive income(loss) . . . . . . . . . . . . . . . . . . . . . . . . . . . (86) — (286) — (372)
Other comprehensive income (loss),net of tax . . . . . . . . . . . . . . . . . . . . . . (953) (302) 53,275 2,124 54,144
Comprehensive income (loss) . . . . . . . . . . (78,860) 105,039 97,034 (146,976) (23,763)Less: Comprehensive income attributable to
non-controlling interests . . . . . . . . . . . . . . . — — 275 — 275
Comprehensive income (loss)attributable to Alere Inc. andSubsidiaries . . . . . . . . . . . . . . . . . . . . . . . . $(78,860) $105,039 $96,759 $(146,976) $(24,038)
F-79

ALERE INC. AND SUBSIDIARIES
NOTES TO CONSOLIDATED FINANCIAL STATEMENTS (Continued)
(24) Guarantor Financial Information (Continued)
CONSOLIDATING STATEMENT OF COMPREHENSIVE INCOME (LOSS)For the Year Ended December 31, 2011
(in thousands)
IssuerGuarantor
SubsidiariesNon-GuarantorSubsidiaries Eliminations Consolidated
Net income (loss) . . . . . . . . . . . . . . . . . . . . $(133,309)$(287,014) $308,184 $(21,170) $(133,309)
Other comprehensive income (loss), beforetax:Changes in cumulative translation
adjustment . . . . . . . . . . . . . . . . . . . . . . . (417) 342 (37,825) 2,070 (35,830)Unrealized losses on available for sale
securities . . . . . . . . . . . . . . . . . . . . . . . . (33) — (438) — (471)Unrealized gains (losses) on hedging
instruments . . . . . . . . . . . . . . . . . . . . . . 11,952 — (448) — 11,504Minimum pension liability adjustment . . . — — (3,070) — (3,070)
Other comprehensive income (loss),before tax . . . . . . . . . . . . . . . . . . . . . . 11,502 342 (41,781) 2,070 (27,867)
Income tax provision (benefit) relatedto items of other comprehensiveincome (loss) . . . . . . . . . . . . . . . . . . . 4,650 — (1,557) — 3,093
Other comprehensive income (loss),net of tax . . . . . . . . . . . . . . . . . . . . . 6,852 342 (40,224) 2,070 (30,960)
Comprehensive income (loss) . . . . . . . . . (126,457) (286,672) 267,960 (19,100) (164,269)Less: Comprehensive income attributable
to non-controlling interests . . . . . . . . . . . . — — 233 — 233
Comprehensive income (loss)attributable to Alere Inc. andSubsidiaries . . . . . . . . . . . . . . . . . . . . . . . $(126,457)$(286,672) $267,727 $(19,100) $(164,502)
F–80

ALERE INC. AND SUBSIDIARIES
NOTES TO CONSOLIDATED FINANCIAL STATEMENTS (Continued)
(24) Guarantor Financial Information (Continued)
CONSOLIDATING STATEMENT OF COMPREHENSIVE INCOME (LOSS)For the Year Ended December 31, 2010
(in thousands)
IssuerGuarantor
SubsidiariesNon-GuarantorSubsidiaries Eliminations Consolidated
Net loss . . . . . . . . . . . . . . . . . . . . . . . . . . . $(1,015,892)$(929,271) $(10,467) $939,738 $(1,015,892)
Other comprehensive income (loss),before tax:Changes in cumulative translation
adjustment . . . . . . . . . . . . . . . . . . . . . (1,553) (160) 3,632 (2,129) (210)Unrealized gains on available for sale
securities . . . . . . . . . . . . . . . . . . . . . . 804 — 347 — 1,151Unrealized gains on hedging
instruments . . . . . . . . . . . . . . . . . . . . 3,965 — — — 3,965Minimum pension liability
adjustment . . . . . . . . . . . . . . . . . . . . . — — (113) — (113)
Other comprehensive income (loss),before tax . . . . . . . . . . . . . . . . . . . . 3,216 (160) 3,866 (2,129) 4,793
Income tax provision related toitems of other comprehensiveincome (loss) . . . . . . . . . . . . . . . . . 1,649 — — — 1,649
Other comprehensive income(loss), net of tax . . . . . . . . . . . . . 1,567 (160) 3,866 (2,129) 3,144
Comprehensive loss . . . . . . . . . . . . . . . (1,014,325) (929,431) (6,601) 937,609 (1,012,748)Less: Comprehensive income
attributable to non-controllinginterests . . . . . . . . . . . . . . . . . . . . . . . . . — — 1,418 — 1,418
Comprehensive loss attributable toAlere Inc. and Subsidiaries . . . . . . . . $(1,014,325)$(929,431) $ (8,019) $937,609 $(1,014,166)
F-81

ALERE INC. AND SUBSIDIARIES
NOTES TO CONSOLIDATED FINANCIAL STATEMENTS (Continued)
(24) Guarantor Financial Information (Continued)
CONSOLIDATING BALANCE SHEETDecember 31, 2012
(in thousands)
IssuerGuarantor
SubsidiariesNon-GuarantorSubsidiaries Eliminations Consolidated
ASSETSCurrent assets:
Cash and cash equivalents . . . . . . . . . . . . . . . . . . $ 3,623 $ 60,385 $ 264,338 $ — $ 328,346Restricted cash . . . . . . . . . . . . . . . . . . . . . . . . . . . — 1,579 1,497 — 3,076Marketable securities . . . . . . . . . . . . . . . . . . . . . . . — 787 117 — 904Accounts receivable, net of allowances . . . . . . . . — 193,598 330,734 — 524,332Inventories, net . . . . . . . . . . . . . . . . . . . . . . . . . . . . — 140,840 204,803 (8,522) 337,121Deferred tax assets . . . . . . . . . . . . . . . . . . . . . . . . 12,193 39,003 13,736 2,790 67,722Prepaid expenses and other current assets . . . . (20,636) 86,562 79,343 (33) 145,236Intercompany receivables . . . . . . . . . . . . . . . . . . . 298,812 1,205,509 119,762 (1,624,083) —
Total current assets . . . . . . . . . . . . . . . . . . . 293,992 1,728,263 1,014,330 (1,629,848) 1,406,737Property, plant and equipment, net . . . . . . . . . . . . . . . 2,679 267,466 264,876 (552) 534,469Goodwill . . . . . . . . . . . . . . . . . . . . . . . . . . . . . . . . . . . . . — 1,522,226 1,526,179 — 3,048,405Other intangible assets with indefinite lives . . . . . . . . — 7,100 29,351 — 36,451Finite-lived intangible assets, net . . . . . . . . . . . . . . . . . 24,701 851,278 958,246 — 1,834,225Deferred financing costs, net and other non-current
assets . . . . . . . . . . . . . . . . . . . . . . . . . . . . . . . . . . . . . 78,522 6,369 24,037 (71) 108,857Investments in subsidiaries . . . . . . . . . . . . . . . . . . . . . 4,114,478 142,768 3,813 (4,261,059) —Investments in unconsolidated entities . . . . . . . . . . . . 33,979 — 56,512 — 90,491Deferred tax assets . . . . . . . . . . . . . . . . . . . . . . . . . . . . — 782 7,511 — 8,293Intercompany notes receivable . . . . . . . . . . . . . . . . . . 1,724,650 722,552 1,278 (2,448,480) —
Total assets . . . . . . . . . . . . . . . . . . . . . . . . . . $6,273,001 $5,248,804 $3,886,133 $(8,340,010) $7,067,928
LIABILITIES AND EQUITYCurrent liabilities:
Current portion of long-term debt . . . . . . . . . . . . . $ 45,000 $ — $ 15,232 $ — $ 60,232Current portion of capital lease obligations . . . . . — 2,787 3,897 — 6,684Accounts payable . . . . . . . . . . . . . . . . . . . . . . . . . . 7,993 65,878 96,103 — 169,974Accrued expenses and other current liabilities . . (388,830) 519,914 280,861 (26) 411,919Intercompany payables . . . . . . . . . . . . . . . . . . . . . 557,578 814,111 252,394 (1,624,083) —
Total current liabilities . . . . . . . . . . . . . . . . 221,741 1,402,690 648,487 (1,624,109) 648,809
Long-term liabilities:Long-term debt, net of current portion . . . . . . . . . 3,617,068 — 11,607 — 3,628,675Capital lease obligations, net of current
portion . . . . . . . . . . . . . . . . . . . . . . . . . . . . . . . . . — 4,399 8,518 — 12,917Deferred tax liabilities . . . . . . . . . . . . . . . . . . . . . . (5,329) 250,962 182,642 (87) 428,188Other long-term liabilities . . . . . . . . . . . . . . . . . . . 17,678 40,346 108,682 (71) 166,635Intercompany notes payables . . . . . . . . . . . . . . . . 241,421 1,498,342 708,717 (2,448,480) —
Total long-term liabilities . . . . . . . . . . . . . . 3,870,838 1,794,049 1,020,166 (2,448,638) 4,236,415
Stockholders’ equity . . . . . . . . . . . . . . . . . . . . . . . . . . 2,180,422 2,052,065 2,215,198 (4,267,263) 2,180,422Non-controlling interests . . . . . . . . . . . . . . . . . . . . . . . . — — 2,282 — 2,282
Total equity . . . . . . . . . . . . . . . . . . . . . . . . . . . . . . 2,180,422 2,052,065 2,217,480 (4,267,263) 2,182,704
Total liabilities and equity . . . . . . . . . . . . . $6,273,001 $5,248,804 $3,886,133 $(8,340,010) $7,067,928
F-82
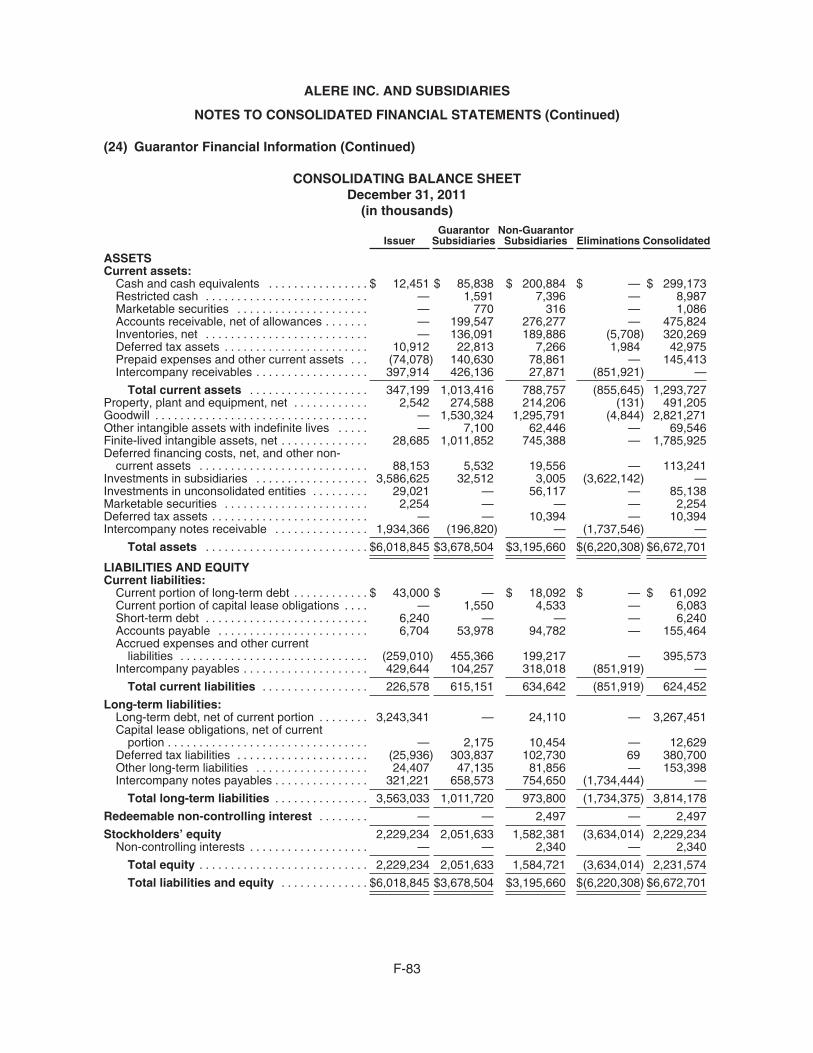
ALERE INC. AND SUBSIDIARIES
NOTES TO CONSOLIDATED FINANCIAL STATEMENTS (Continued)
(24) Guarantor Financial Information (Continued)
CONSOLIDATING BALANCE SHEETDecember 31, 2011
(in thousands)
IssuerGuarantor
SubsidiariesNon-GuarantorSubsidiaries Eliminations Consolidated
ASSETSCurrent assets:
Cash and cash equivalents . . . . . . . . . . . . . . . . $ 12,451 $ 85,838 $ 200,884 $ — $ 299,173Restricted cash . . . . . . . . . . . . . . . . . . . . . . . . . . — 1,591 7,396 — 8,987Marketable securities . . . . . . . . . . . . . . . . . . . . . — 770 316 — 1,086Accounts receivable, net of allowances . . . . . . . — 199,547 276,277 — 475,824Inventories, net . . . . . . . . . . . . . . . . . . . . . . . . . . — 136,091 189,886 (5,708) 320,269Deferred tax assets . . . . . . . . . . . . . . . . . . . . . . . 10,912 22,813 7,266 1,984 42,975Prepaid expenses and other current assets . . . (74,078) 140,630 78,861 — 145,413Intercompany receivables . . . . . . . . . . . . . . . . . . 397,914 426,136 27,871 (851,921) —
Total current assets . . . . . . . . . . . . . . . . . . . 347,199 1,013,416 788,757 (855,645) 1,293,727Property, plant and equipment, net . . . . . . . . . . . . 2,542 274,588 214,206 (131) 491,205Goodwill . . . . . . . . . . . . . . . . . . . . . . . . . . . . . . . . . . — 1,530,324 1,295,791 (4,844) 2,821,271Other intangible assets with indefinite lives . . . . . — 7,100 62,446 — 69,546Finite-lived intangible assets, net . . . . . . . . . . . . . . 28,685 1,011,852 745,388 — 1,785,925Deferred financing costs, net, and other non-
current assets . . . . . . . . . . . . . . . . . . . . . . . . . . . 88,153 5,532 19,556 — 113,241Investments in subsidiaries . . . . . . . . . . . . . . . . . . 3,586,625 32,512 3,005 (3,622,142) —Investments in unconsolidated entities . . . . . . . . . 29,021 — 56,117 — 85,138Marketable securities . . . . . . . . . . . . . . . . . . . . . . . 2,254 — — — 2,254Deferred tax assets . . . . . . . . . . . . . . . . . . . . . . . . . — — 10,394 — 10,394Intercompany notes receivable . . . . . . . . . . . . . . . 1,934,366 (196,820) — (1,737,546) —
Total assets . . . . . . . . . . . . . . . . . . . . . . . . . . $6,018,845 $3,678,504 $3,195,660 $(6,220,308) $6,672,701
LIABILITIES AND EQUITYCurrent liabilities:
Current portion of long-term debt . . . . . . . . . . . . $ 43,000 $ — $ 18,092 $ — $ 61,092Current portion of capital lease obligations . . . . — 1,550 4,533 — 6,083Short-term debt . . . . . . . . . . . . . . . . . . . . . . . . . . 6,240 — — — 6,240Accounts payable . . . . . . . . . . . . . . . . . . . . . . . . 6,704 53,978 94,782 — 155,464Accrued expenses and other current
liabilities . . . . . . . . . . . . . . . . . . . . . . . . . . . . . . (259,010) 455,366 199,217 — 395,573Intercompany payables . . . . . . . . . . . . . . . . . . . . 429,644 104,257 318,018 (851,919) —
Total current liabilities . . . . . . . . . . . . . . . . . 226,578 615,151 634,642 (851,919) 624,452
Long-term liabilities:Long-term debt, net of current portion . . . . . . . . 3,243,341 — 24,110 — 3,267,451Capital lease obligations, net of current
portion . . . . . . . . . . . . . . . . . . . . . . . . . . . . . . . . — 2,175 10,454 — 12,629Deferred tax liabilities . . . . . . . . . . . . . . . . . . . . . (25,936) 303,837 102,730 69 380,700Other long-term liabilities . . . . . . . . . . . . . . . . . . 24,407 47,135 81,856 — 153,398Intercompany notes payables . . . . . . . . . . . . . . . 321,221 658,573 754,650 (1,734,444) —
Total long-term liabilities . . . . . . . . . . . . . . . 3,563,033 1,011,720 973,800 (1,734,375) 3,814,178
Redeemable non-controlling interest . . . . . . . . — — 2,497 — 2,497
Stockholders’ equity 2,229,234 2,051,633 1,582,381 (3,634,014) 2,229,234Non-controlling interests . . . . . . . . . . . . . . . . . . . — — 2,340 — 2,340
Total equity . . . . . . . . . . . . . . . . . . . . . . . . . . . 2,229,234 2,051,633 1,584,721 (3,634,014) 2,231,574
Total liabilities and equity . . . . . . . . . . . . . . $6,018,845 $3,678,504 $3,195,660 $(6,220,308) $6,672,701
F-83

ALERE INC. AND SUBSIDIARIES
NOTES TO CONSOLIDATED FINANCIAL STATEMENTS (Continued)
(24) Guarantor Financial Information (Continued)
CONSOLIDATING STATEMENT OF CASH FLOWSFor the Year Ended December 31, 2012
(in thousands)
IssuerGuarantor
SubsidiariesNon-GuarantorSubsidiaries Eliminations Consolidated
Cash Flows from Operating Activities:Net income (loss) . . . . . . . . . . . . . . . . . . . . . . . . . . . . . . . . . . $ (77,907) $ 105,341 $ 43,759 $(149,100) $ (77,907)Adjustments to reconcile net income (loss) to net cash
provided by operating activities:Equity in earnings (losses) of subsidiaries, net of tax . . . (148,394) 1,574 — 146,820 —Non-cash interest expense, including amortization of
original issue discounts and deferred financingcosts . . . . . . . . . . . . . . . . . . . . . . . . . . . . . . . . . . . . . . . . . 21,213 277 — — 21,490
Depreciation and amortization . . . . . . . . . . . . . . . . . . . . . . 7,961 225,845 223,062 (21) 456,847Non-cash charges for sale of inventories revalued at the
date of acquisition . . . . . . . . . . . . . . . . . . . . . . . . . . . . . . — 1,400 3,281 — 4,681Non-cash stock-based compensation expense . . . . . . . . 4,247 5,486 5,932 — 15,665Impairment of inventory . . . . . . . . . . . . . . . . . . . . . . . . . . . — 5 290 — 295Impairment of long-lived assets . . . . . . . . . . . . . . . . . . . . . — 2,903 586 — 3,489Impairment of intangible assets . . . . . . . . . . . . . . . . . . . . . — 2,988 — — 2,988(Gain) loss on sale of fixed assets . . . . . . . . . . . . . . . . . . 4 (2,664) 509 — (2,151)Gain on sales of marketable securities . . . . . . . . . . . . . . . (751) — — — (751)Equity earnings of unconsolidated entities, net of tax . . . (2,205) — (10,952) (88) (13,245)Deferred income taxes . . . . . . . . . . . . . . . . . . . . . . . . . . . . 20,500 (71,531) (32,575) (962) (84,568)Other non-cash items . . . . . . . . . . . . . . . . . . . . . . . . . . . . . 22,234 908 7,429 — 30,571Changes in assets and liabilities, net of acquisitions:
Accounts receivable, net . . . . . . . . . . . . . . . . . . . . . . . . — 5,949 (28,114) — (22,165)Inventories, net . . . . . . . . . . . . . . . . . . . . . . . . . . . . . . . . — (6,604) (13,089) 2,902 (16,791)Prepaid expenses and other current assets . . . . . . . . . (454,780) 367,746 (10,579) 95,087 (2,526)Accounts payable . . . . . . . . . . . . . . . . . . . . . . . . . . . . . . 1,289 14,429 (25,845) — (10,127)Accrued expenses and other current liabilities . . . . . . . 335,600 (247,710) 56,622 (95,081) 49,431Other non-current liabilities . . . . . . . . . . . . . . . . . . . . . . (12,373) (3,080) (20,020) (70) (35,543)Intercompany payable (receivable) . . . . . . . . . . . . . . . . 413,479 (368,161) (44,156) (1,162) —
Net cash provided by operating activities . . . . . . . . . . . . 130,117 35,101 156,140 (1,675) 319,683
Cash Flows from Investing Activities:Decrease in restricted cash . . . . . . . . . . . . . . . . . . . . . . . . . . — 12 5,899 — 5,911Purchases of property, plant and equipment . . . . . . . . . . . . (2,061) (78,295) (122,999) 65,962 (137,393)Proceeds from sale of property, plant and equipment . . . . . — 22,330 66,277 (66,217) 22,390Cash paid for acquisitions, net of cash acquired . . . . . . . . . (403,552) — (21,034) — (424,586)Proceeds from sales of marketable securities . . . . . . . . . . . 2,784 58 214 — 3,056Net cash received from equity method investments . . . . . . 1,470 — 11,237 — 12,707Decrease in other assets . . . . . . . . . . . . . . . . . . . . . . . . . . . . (53,189) (2,516) (641) 70 (56,276)
Net cash used in investing activities . . . . . . . . . . . . . . (454,548) (58,411) (61,047) (185) (574,191)
Cash Flows from Financing Activities:Cash paid for financing costs . . . . . . . . . . . . . . . . . . . . . . . . (10,139) — — — (10,139)Cash paid for contingent purchase price consideration . . . (20,116) (788) (60) — (20,964)Cash paid for dividends . . . . . . . . . . . . . . . . . . . . . . . . . . . . . (21,293) — — — (21,293)Proceeds from issuance of common stock, net of issuance
costs . . . . . . . . . . . . . . . . . . . . . . . . . . . . . . . . . . . . . . . . . . . 14,924 — — — 14,924Proceeds from issuance of long-term debt . . . . . . . . . . . . . . 648,000 — 535 — 648,535Payments on short-term debt . . . . . . . . . . . . . . . . . . . . . . . . (6,240) — — — (6,240)Payments on long-term debt . . . . . . . . . . . . . . . . . . . . . . . . . (300,155) — (11,457) — (311,612)Net proceeds (payments) under revolving credit facilities . . . 22,500 — (8,228) — 14,272Excess tax benefits on exercised stock options . . . . . . . . . . 176 303 25 — 504Principal payments on capital lease obligations . . . . . . . . . — (2,132) (4,871) — (7,003)Purchase of non-controlling interest . . . . . . . . . . . . . . . . . . . — — (2,972) — (2,972)Other . . . . . . . . . . . . . . . . . . . . . . . . . . . . . . . . . . . . . . . . . . . . (12,267) — — — (12,267)
Net cash provided by (used in) financing activities . . . 315,390 (2,617) (27,028) — 285,745
Foreign exchange effect on cash and cash equivalents . . . 213 474 (4,611) 1,860 (2,064)
Net increase (decrease) in cash and cash equivalents . . . . (8,828) (25,453) 63,454 — 29,173Cash and cash equivalents, beginning of period . . . . . . . 12,451 85,838 200,884 — 299,173
Cash and cash equivalents, end of period . . . . . . . . . . . $ 3,623 $ 60,385 $ 264,338 $ — $ 328,346
F-84

ALERE INC. AND SUBSIDIARIES
NOTES TO CONSOLIDATED FINANCIAL STATEMENTS (Continued)
(24) Guarantor Financial Information (Continued)
CONSOLIDATING STATEMENT OF CASH FLOWSFor the Year Ended December 31, 2011
(in thousands)
IssuerGuarantor
SubsidiariesNon-GuarantorSubsidiaries Eliminations Consolidated
Cash Flows from Operating Activities:Net income (loss) . . . . . . . . . . . . . . . . . . . . . . . . . . . . . . . . . . . . $ (133,309) $ (287,014) $ 308,184 $(21,170) $ (133,309)Adjustments to reconcile net income (loss) to net cash
provided by (used in) operating activities:Equity in earnings of subsidiaries, net of tax . . . . . . . . . . . . (23,524) (1,530) — 25,054 —Non-cash interest expense, including amortization of
original issue discounts and deferred financing costs . . . 13,671 23,473 446 — 37,590Depreciation and amortization . . . . . . . . . . . . . . . . . . . . . . . . 3,842 250,832 137,340 (438) 391,576Non-cash charges for sale of inventories revalued at date
of acquisition . . . . . . . . . . . . . . . . . . . . . . . . . . . . . . . . . . . . — — 6,010 — 6,010Non-cash stock-based compensation expense . . . . . . . . . . 5,776 8,390 7,049 — 21,215Impairment of inventory . . . . . . . . . . . . . . . . . . . . . . . . . . . . . — 172 273 — 445Impairment of long-lived assets . . . . . . . . . . . . . . . . . . . . . . . 3 1,331 215 — 1,549Impairment of goodwill . . . . . . . . . . . . . . . . . . . . . . . . . . . . . . — 383,612 — — 383,612Impairment of intangible assets . . . . . . . . . . . . . . . . . . . . . . . — 2,935 3 — 2,938Gain on sale of joint venture interest . . . . . . . . . . . . . . . . . . . (16,309) — (272,587) — (288,896)(Gain) loss on sale of fixed assets . . . . . . . . . . . . . . . . . . . . . 75 1,655 (153) — 1,577Gain on sales of marketable securities . . . . . . . . . . . . . . . . . — — (840) — (840)Equity earnings of unconsolidated entities, net of tax . . . . . (1,952) — (6,503) (69) (8,524)Deferred income taxes . . . . . . . . . . . . . . . . . . . . . . . . . . . . . . 35,012 (78,248) (11,569) (1,956) (56,761)Other non-cash items . . . . . . . . . . . . . . . . . . . . . . . . . . . . . . . (4,286) 3,971 (11,932) — (12,247)Changes in assets and liabilities, net of acquisitions:
Accounts receivable, net . . . . . . . . . . . . . . . . . . . . . . . . . . . — 2,143 (41,551) — (39,408)Inventories, net . . . . . . . . . . . . . . . . . . . . . . . . . . . . . . . . . . — (9,490) (9,002) (1,907) (20,399)Prepaid expenses and other current assets . . . . . . . . . . . 72,955 (109,813) (16,257) — (53,115)Accounts payable . . . . . . . . . . . . . . . . . . . . . . . . . . . . . . . . (233) (10,278) 17,496 — 6,985Accrued expenses and other current liabilities . . . . . . . . . (231,949) 199,110 47,121 — 14,282Other non-current liabilities . . . . . . . . . . . . . . . . . . . . . . . . . 35,109 4,301 (22,437) — 16,973Intercompany payable (receivable) . . . . . . . . . . . . . . . . . . (1,512,567) 857,634 654,933 — —
Net cash provided by (used in) operating activities . . . . (1,757,686) 1,243,186 786,239 (486) 271,253
Cash Flows from Investing Activities:(Increase) decrease in restricted cash . . . . . . . . . . . . . . . . . . . — 148 (6,554) — (6,406)Purchases of property, plant and equipment . . . . . . . . . . . . . . 20 (63,369) (69,614) 431 (132,532)Proceeds from sale of property, plant and equipment . . . . . . . — 292 655 — 947Proceeds from disposition of business . . . . . . . . . . . . . . . . . . . — — 11,491 — 11,491Cash paid for acquisitions, net of cash acquired . . . . . . . . . . . (37,644) (8,688) (584,979) — (631,311)Proceeds from sales of marketable securities . . . . . . . . . . . . . — 145 9,057 — 9,202Net cash paid for equity method investments . . . . . . . . . . . . . . (2,430) — (119,473) — (121,903)(Increase) decrease in other assets . . . . . . . . . . . . . . . . . . . . . (24,997) (7,781) 6,248 (1,154) (27,684)
Net cash used in investing activities . . . . . . . . . . . . . . . . (65,051) (79,253) (753,169) (723) (898,196)
Cash Flows from Financing Activities:Cash paid for financing costs . . . . . . . . . . . . . . . . . . . . . . . . . . . (73,876) (804) — — (74,680)Cash paid for contingent purchase price consideration . . . . . . (28,305) — — — (28,305)Cash paid for dividends . . . . . . . . . . . . . . . . . . . . . . . . . . . . . . . (5,425) — — — (5,425)Proceeds from issuance of common stock, net of issuance
costs . . . . . . . . . . . . . . . . . . . . . . . . . . . . . . . . . . . . . . . . . . . . . 37,886 — — — 37,886Repurchase of preferred stock . . . . . . . . . . . . . . . . . . . . . . . . . (99,070) — — — (99,070)Proceeds from issuance of long-term debt . . . . . . . . . . . . . . . . 2,100,000 937 (4,660) — 2,096,277Payments on long-term debt . . . . . . . . . . . . . . . . . . . . . . . . . . . (10,125) (1,192,344) (4,985) — (1,207,454)Net proceeds under revolving credit facilities . . . . . . . . . . . . . . — — 10,715 — 10,715Repurchase of common stock . . . . . . . . . . . . . . . . . . . . . . . . . . (184,867) — — — (184,867)Excess tax benefits on exercised stock options . . . . . . . . . . . . 1,357 414 1,652 — 3,423Principal payments on capital lease obligations . . . . . . . . . . . . — (2,372) (1,791) — (4,163)Other . . . . . . . . . . . . . . . . . . . . . . . . . . . . . . . . . . . . . . . . . . . . . . (4,053) — (204) — (4,257)
Net cash provided by (used in) financing activities . . . . 1,733,522 (1,194,169) 727 — 540,080
Foreign exchange effect on cash and cash equivalents . . . . . — (38) (16,441) 1,209 (15,270)
Net increase (decrease) in cash and cash equivalents . . . . (89,215) (30,274) 17,356 — (102,133)Cash and cash equivalents, beginning of period . . . . . . . . . 101,666 116,112 183,528 — 401,306
Cash and cash equivalents, end of period . . . . . . . . . . . . . $ 12,451 $ 85,838 $ 200,884 $ — $ 299,173
F-85

ALERE INC. AND SUBSIDIARIES
NOTES TO CONSOLIDATED FINANCIAL STATEMENTS (Continued)
(24) Guarantor Financial Information (Continued)
CONSOLIDATING STATEMENT OF CASH FLOWSFor the Year Ended December 31, 2010
(in thousands)
IssuerGuarantor
SubsidiariesNon-GuarantorSubsidiaries Eliminations Consolidated
Cash Flows from Operating Activities:Net loss . . . . . . . . . . . . . . . . . . . . . . . . . . . . . . . . . . . . . . . . . . . . . . . . . . . . . . . $(1,015,892) $ (929,271) $ (10,467) $ 939,738 $(1,015,892)Income from discontinued operations, net of tax . . . . . . . . . . . . . . . . . . . . . . 574 9,727 1,096 — 11,397
Loss from continuing operations . . . . . . . . . . . . . . . . . . . . . . . . . . . . . . . . . . . (1,016,466) (938,998) (11,563) 939,738 (1,027,289)Adjustments to reconcile loss from continuing operations to net cash
provided by (used in) operating activities:Equity in earnings of subsidiaries, net of tax . . . . . . . . . . . . . . . . . . . . . . . 940,121 — — (940,121) —Non-cash interest expense, including amortization of original issue
discounts and write-off of deferred financing costs . . . . . . . . . . . . . . . . 6,311 6,279 1,168 — 13,758Depreciation and amortization . . . . . . . . . . . . . . . . . . . . . . . . . . . . . . . . . . 663 266,152 99,852 (479) 366,188Non-cash charges for sale of inventories revalued at date of
acquisition . . . . . . . . . . . . . . . . . . . . . . . . . . . . . . . . . . . . . . . . . . . . . . . . . — — 6,602 — 6,602Non-cash stock-based compensation expense . . . . . . . . . . . . . . . . . . . . . 9,498 9,648 10,733 — 29,879Impairment of inventory . . . . . . . . . . . . . . . . . . . . . . . . . . . . . . . . . . . . . . . . — 261 587 — 848Impairment of long-lived assets . . . . . . . . . . . . . . . . . . . . . . . . . . . . . . . . . — 1,473 (62) — 1,411Impairment of goodwill . . . . . . . . . . . . . . . . . . . . . . . . . . . . . . . . . . . . . . . . . — 1,006,357 — — 1,006,357Loss on sale of fixed assets . . . . . . . . . . . . . . . . . . . . . . . . . . . . . . . . . . . . — 719 279 — 998Gain on sale of marketable securities . . . . . . . . . . . . . . . . . . . . . . . . . . . . (4,190) — (314) — (4,504)Equity earnings of unconsolidated entities, net of tax . . . . . . . . . . . . . . . . (2,023) — (8,680) 137 (10,566)Deferred income taxes . . . . . . . . . . . . . . . . . . . . . . . . . . . . . . . . . . . . . . . . . 3,340 (55,333) (22,425) — (74,418)Other non-cash items . . . . . . . . . . . . . . . . . . . . . . . . . . . . . . . . . . . . . . . . . (981) 3,608 1,175 — 3,802Changes in assets and liabilities, net of acquisitions:
Accounts receivable, net . . . . . . . . . . . . . . . . . . . . . . . . . . . . . . . . . . . . . — (4,281) (5,079) — (9,360)Inventories, net . . . . . . . . . . . . . . . . . . . . . . . . . . . . . . . . . . . . . . . . . . . . . — (2,012) (21,297) 464 (22,845)Prepaid expenses and other current assets . . . . . . . . . . . . . . . . . . . . . (80) 4,473 3,917 — 8,310Accounts payable . . . . . . . . . . . . . . . . . . . . . . . . . . . . . . . . . . . . . . . . . . . 4,358 (1,548) (11,898) — (9,088)Accrued expenses and other current liabilities . . . . . . . . . . . . . . . . . . . (60,601) 64,708 18,095 — 22,202Other non-current liabilities . . . . . . . . . . . . . . . . . . . . . . . . . . . . . . . . . . . (5) (269) (27,178) — (27,452)Intercompany payable (receivable) . . . . . . . . . . . . . . . . . . . . . . . . . . . . . (296,816) (140,254) 437,070 — —
Net cash provided by (used in) continuing operations . . . . . . . . . . . . . . . (416,871) 220,983 470,982 (261) 274,833Net cash provided by (used in) discontinued operations . . . . . . . . . . . . . 849 (258) — — 591
Net cash provided by (used in) operating activities . . . . . . . . . . . . . . (416,022) 220,725 470,982 (261) 275,424
Cash Flows from Investing Activities:(Increase) decrease in restricted cash . . . . . . . . . . . . . . . . . . . . . . . . . . . . . . — (163) 22 — (141)Purchases of property, plant and equipment . . . . . . . . . . . . . . . . . . . . . . . . . (82) (56,922) (39,498) 261 (96,241)Proceeds from sale of property, plant and equipment . . . . . . . . . . . . . . . . . — 73 722 — 795Cash paid for acquisitions, net of cash acquired . . . . . . . . . . . . . . . . . . . . . . (184,975) (33,146) (305,386) — (523,507)Proceeds from (purchases) of marketable securities . . . . . . . . . . . . . . . . . . 4,190 — (1,008) — 3,182Net cash received from equity method investments . . . . . . . . . . . . . . . . . . . 1,316 44 10,994 — 12,354Increase in other assets . . . . . . . . . . . . . . . . . . . . . . . . . . . . . . . . . . . . . . . . . (5,600) (695) (6,605) — (12,900)
Net cash used in continuing operations . . . . . . . . . . . . . . . . . . . . . . . . . . . (185,151) (90,809) (340,759) 261 (616,458)Net cash provided by (used in) discontinued operations . . . . . . . . . . . . . (849) 61,445 2,000 — 62,596
Net cash used in investing activities . . . . . . . . . . . . . . . . . . . . . . . . . . . (186,000) (29,364) (338,759) 261 (553,862)
Cash Flows from Financing Activities:Cash paid for financing costs . . . . . . . . . . . . . . . . . . . . . . . . . . . . . . . . . . . . . (9,552) (3,493) — — (13,045)Proceeds from issuance of common stock, net of issuance costs . . . . . . . 19,024 — — — 19,024Proceeds from issuance of long-term debt . . . . . . . . . . . . . . . . . . . . . . . . . . 400,000 — — — 400,000Payments on long-term debt . . . . . . . . . . . . . . . . . . . . . . . . . . . . . . . . . . . . . . — (9,750) — — (9,750)Net payments under revolving credit facilities . . . . . . . . . . . . . . . . . . . . . . . . — (144,181) (2,600) — (146,781)Excess tax benefits on exercised stock options . . . . . . . . . . . . . . . . . . . . . . 1,030 264 389 — 1,683Principal payments on capital lease obligations . . . . . . . . . . . . . . . . . . . . . . — (1,501) (366) — (1,867)Purchase of non-controlling interest . . . . . . . . . . . . . . . . . . . . . . . . . . . . . . . . — — (52,864) — (52,864)Other . . . . . . . . . . . . . . . . . . . . . . . . . . . . . . . . . . . . . . . . . . . . . . . . . . . . . . . . . (141) — — — (141)
Net cash provided by (used in) financing activities . . . . . . . . . . . . . . 410,361 (158,661) (55,441) — 196,259
Foreign exchange effect on cash and cash equivalents . . . . . . . . . . . . . . . . — — (9,288) — (9,288)
Net increase (decrease) in cash and cash equivalents . . . . . . . . . . . . . . (191,661) 32,700 67,494 — (91,467)Cash and cash equivalents, beginning of period . . . . . . . . . . . . . . . . . . . . 293,327 83,412 116,034 — 492,773
Cash and cash equivalents, end of period . . . . . . . . . . . . . . . . . . . . . . . . $ 101,666 $ 116,112 $ 183,528 $ — $ 401,306
F-86

ALERE INC. AND SUBSIDIARIES
NOTES TO CONSOLIDATED FINANCIAL STATEMENTS (Continued)
(25) Subsequent Events
(a) Epocal
In November 2009, we entered into a definitive agreement to acquire all of the issued andoutstanding equity securities of Epocal, Inc. As amended as of December 31, 2012, that agreementprovided for a total potential purchase price of up to $263.0 million, including milestone payments of upto $90.5 million if Epocal achieves certain milestones relating to its gross margin and productdevelopment efforts on or prior to October 31, 2014. The agreement contains a working capitaladjustment whereby the purchase price is increased or decreased to the extent that Epocal’s workingcapital at closing is more or less than a specified amount. We also agreed that, if the acquisition isconsummated, we will provide $12.5 million in management incentive arrangements, 25% of which willvest over three years and 75% of which will be payable only upon the achievement of certainmilestones.
In February 2013, we completed the acquisition of Epocal. After working capital and otheradjustments made at closing, we paid approximately $166.0 million in cash to acquire Epocal, whichincluded a $15.0 million payment for the achievement of the first two financial milestones specified inthe agreement. Additional earn-out payments of up to $75.5 million could be triggered if milestoneslinked to the delivery of additional product offerings on the Epocal platform are achieved.
(b) Short-Term Note
In December 2012, we made a $40.0 million secured loan to a third party (the Short-Term Note)(Note 3 (b)) in connection with a potential acquisition. As of December 31, 2012, the loan is included atface value in prepaid expenses and other current assets on our Consolidated Balance Sheet. InFebruary 2013, the issuer of the Short-Term Note filed for protection under Chapter 11 of the U.S.Bankruptcy Code. The Bankruptcy Court subsequently granted us “continuing, valid, binding,enforceable and perfected first priority liens and security interests” in all of the post-petition collateral ofthe debtor to the “same extent, priority and enforceability” held on pre-petition collateral, in order tosecure any and all obligations of the debtor to us under the Short-Term Note, and other relatedagreements. The Bankruptcy Court further directed the debtor to pay us post-petition interest at thecontractual default rate and at the times set forth in the Short-Term Note.
We have assessed our Short-Term Note for impairment and considered the following factors: wehave a perfected first priority lien in all of the post-petition collateral of the debtor, and the value of theavailable collateral, as represented by the debtor to the Bankruptcy Court, significantly exceeds theamount that is owed to us under the Short-Term Note. Based on these factors, along with theprotections afforded to us as a secured creditor under bankruptcy law, we have determined that theShort-Term Note is fully realizable and, accordingly, we have not recorded a reserve against theamount receivable as of December 31, 2012. The bankruptcy process is inherently complicated andsubject to uncertainties and future changes in circumstances and there can be no certainty as to theoutcome of these proceedings.
F-87

NOTES

NOTES

NOTES

MANAGEMENT
Ron ZwanzigerChairman of the Board,Chief Executive Offi cer and President
David Scott, Ph.D. Chief Scientifi c Offi cer
Jerry McAleer, Ph.D. Senior Vice President, Research and Development
Namal NawanaChief Operating Offi cer
John Bridgen, Ph.D. Senior Vice President, Business Development
David TeitelChief Financial Offi cer,Vice President and Treasurer
John O’RourkeChief Information Offi cer
Hilde Eylenbosch, M.D. President, Alere International Limited
Robert Hargadon Vice President, Human Resources
Nigel LindnerVice President,Research and Development
Robert Di Tullio Vice President, Global Regulatory and Clinical Affairs
Paul T. Hempel Senior Vice President, Chief Ethics and Compliance Offi cer,Assistant Secretary
Ellen Chiniara Vice President, General Counsel and Secretary
Melissa GuerdanVice President,Global Quality Assurance
James PostGlobal President,Acute Care
Sanjay MalkaniGlobal President,Toxicology
Michael CottonGlobal President,Health InformationSolutions
Daniella CrampGlobal President,Chronic Care
Avi PelossofGlobal President,Infectious Disease
Kate Torchilin, Ph.D.Vice President and General Manager,Connected Health
DIRECTORS
Eli Y. Adashi, M.D., M.S., CPE, F.A.C.O.G.1 Professor of Medical Science, The Warren Alpert Medical School,Brown University
Carol R. Goldberg 1
President, The AVCAR Group, Ltd.
Robert P. Khederian 1,2
Chairman, Belmont Capital
John F. Levy 2,3
formerly President and Chief Executive Offi cer, Waban, Inc.
Jerry McAleer, Ph.D. Senior Vice President, Research and Development, Alere Inc.
John A. Quelch, D.B.A.3 Professor of Business Administration,Harvard Business School
James Roosevelt, Jr. 3 President and Chief Executive Offi cer, Tufts Health Plan
David Scott, Ph.D. Chief Scientifi c Offi cer, Alere Inc.
Peter Townsend 2 formerly Chief Executive Offi cer, Enviromed plc
Ron Zwanziger Chairman of the Board, Chief Executive Offi cer and President, Alere Inc.
SHAREHOLDER INFORMATION
INDEPENDENT REGISTEREDPUBLIC ACCOUNTING FIRM
PricewaterhouseCoopers 125 High Street Boston, MA 02110
TRANSFER AGENT
Computershare P.O. Box 43078 Providence, RI 02940-3078 1-877-282-1168
LEGAL COUNSEL
Foley Hoag LLP Seaport West 155 Seaport Boulevard Boston, MA 02210-2600
ANNUAL MEETING
Wednesday, August 7, 2013At 12:30 P.M.
Emerging Enterprise Center at Foley Hoag LLP1000 Winter StreetSuite 4000Waltham, Massachusetts 02451
1 Member of the Compensation Committee
2 Member of the Audit Committee
3 Member of the Nominating and Corporate Governance Committee
LLP
43271_Cvr.indd 4-5 6/21/13 9:16 AM

Notes & Disclaimers ©2013 Alere. All rights reserved.The Alere Logo and Alere are trademarks of the Alere group of companies.All trademarks referenced are trademarks of their respective owners.
The Company’s common stock is traded on the New York Stock Exchange under the symbol ALR.
Please visit the Company website at www.alere.com for current news and information.
This Annual Report and the attached Annual Report on Form 10-K contain forward-looking statements within the meaning of Section 27A of the Securities Act of 1933, as amended, and Section 21E of the Securities Exchange Act of 1934, as amended. Readers can identify these statements by forward-looking words such as “may,” “could,” “should,” “would,” “intend,” “will,” “expect,” “anticipate,” “believe,” “estimate,” “continue” or similar words. A number of important factors could cause actual results of Alere Inc. and its subsidiaries to differ materially from those indicated by such forward-looking statements. These factors include, but are not limited to, our ability to successfully acquire and integrate our acquisitions and to recognize the expected benefi ts of restructuring and new business activities; our exposure to changes in interest rates and foreign currency exchange rates; our ability to successfully develop and commercialize products and services; our ability to develop enhanced health information solutions through the integrated use of innovative diagnostic and monitoring devices and to recognize the expected benefi ts of this strategy; the impact of healthcare reform legislation, as well as future initiatives; the content and timing of regulatory decisions and actions, including the impact of the FDA warning letter and the OIG subpoena, as well as the impact of changes in reimbursement policy, and budgetary constraints, both in the United States and abroad; the effect of pending and future legal proceedings on our fi nancial performance, as well as other risk factors detailed in the attached Annual Report on Form 10-K and other risk factors identi-fi ed from time to time in our periodic fi lings with the Securities and Exchange Commission. Readers should carefully review the factors discussed in the section entitled “Risk Factors” beginning on page 17 in the attached Annual Report on Form 10-K and should not place un-due reliance on our forward-looking statements. These forward-looking statements were based on information, plans and estimates at the date of this report. We undertake no obliga-tion to update any forward-looking statements to refl ect changes in underlying assumptions or factors, new information, future events or other changes.
Shareholder Relations – Alere Inc.51 Sawyer Road, Suite 200, Waltham, MA 02453Telephone: 781-647-3900 Fax: 781-647-3939
43271_Cvr.indd 2-3 6/20/13 2:14 PM