Annual Report 2012
32
Year Ended March 31, 2012
-
Upload
khangminh22 -
Category
Documents
-
view
5 -
download
0
Transcript of Annual Report 2012

1-1-1, Kidamotomiya, Neyagawa-shi, Osaka, 572-8570, JapanTel: 81-72-824-6933 Fax: 81-72-821-7913URL http://www.exedy.com
Mission Statement
The Shape of Our Future: “Creation of Fulfillment”
Each employee, with a good conscience and hope for the future,will create fulfillment for our society.
Through advanced technology and scrupulous attention to detail,we will create fulfillment for our customers.
With pride and a desire to grow, we will create fulfillmentfor the EXEDY family.
2012.7.1,000. 361 ○ Printed in JapanH
Year Ended March 31, 2012

Consolidated Financial HighlightsEXEDY CORPORATION AND CONSOLIDATED SUBSIDIARIESAs of March 31, 2011 and 2012
Note : Dollar figures are translated, for convenience only, at the rate of \82.19 to U.S. $1.00.
11,658
Net Sales
2010
2009
180,000160,000140,000120,000100,00080,00060,00040,00020,0000 200,000
187,303
166,750
152,671
(Millions of yen)
196,452
2008
2011
201,9322012
Net Income Per Share of Common Stock
2010
2009
0 28026024022020018016014012010080604020
239.95
112.00
113.72
(Yen)
268.32
191.21
2008
2011
2012
Net Income
2010
2009
0 14,00012,00010,0008,0006,0004,0002,000
5,441
5,524
(Millions of yen)
13,024
9,222
2008
2011
2012
Net Assets Per Share of Common Stock
2010
2009
0 2,4002,2002,0001,8001,6001,4001,2001,000800600400200
2,102.64
1,999.38
2,115.38
(Yen)
2,279.57
2,386.53
2008
2011
2012
Annual Report 20121
For the year:
Net sales
Net income
At year-end:
Total assets
Net assets
Per share data:
Net income
Net assets
Cash dividends
\
\
\201,932
9,222
176,038
122,042
\ 191,21
2,386.53
50.00
+2.8%
-29.2%
+7.1%
+4.5%
-28.7%
+4.7%
-
$2,456,893
112,203
2,141,842
1,484,876
$ 2.33
29.04
0.61
Japanese yen(millions)
Japanese yen
%Charge
U.S. dollars(thousands)
U.S. dollars
2012
196,452
13,024
164,417
116,820
268.32
2,279.57
50.00
2011 2012 2011/2012

Business Operations
Review of Fiscal Year 2011 Throughout the negative repercussions of the earthquake experienced in east Japan of last year, we had seen the recovery of orders in the second half of the 1st quarter, especially within AT products. Sales in Asia have maintained high growth, especially as the orders in China are expanding steadily within our group companies. In regards to costs within production, factors such as the price of steel which has risen and the strong value of yen has put pressure on our profit margins. The consolidated financial results of the fiscal year are listed as following: Sales 201.9 billion yen (increase of 2.8%), Operating Profit 16,700 million yen (21.6% decrease), Ordinary Profit 16,100 million yen (22.4% decrease), Current Term Net Profit changed to 9,200 million yen (29.2% decrease).
Outlook of Fiscal Year 2012Review of Fiscal Year 2011 Outlook of Fiscal Year 2012 Within the next term, the amount of orders from our overseas firms is expected to increase sales. In order to be able to fulfill the overseas demand and enter new markets, resources to fund the developments will be acquired from profits in order to build the expansion of facilities and factories. Below lists the financial expectations ending in March, 2013. Sales 210 billion yen (an increase of 4.0% from the previous fiscal year), Operating Profit 16,500 million yen (1.7% decrease), Ordinary Profit 6 billion yen (1.1% decrease) and Current Term Net Profit 9 billion yen (2.4% decrease).
July, 2012
Haruo Shimizu
President and Chief Exective Officer
From left to right: Katsumi Shintou (Director), Masayuki Matsuda (Director),Hidehito Hisakawa (Director), Haruo Shimizu (President and Chief Executive Officer),Etsuji Terada (Director), Hisayasu Masaoka (Director), Hideki Miura (Director)
Annual Report 2012 2

Consolidated Sales (Unit : \100 million)
201,931 MT AT TS, Motorcycle
196,451
152,671
166,749
187,302
FY2011
FY2010
FY2009
FY2008
FY2007
500 1,000 2,0001,500
Annual Report 2012 Annual Report 20123 4

Consolidated Sales (Unit : \100 million)
201,931 MT AT TS, Motorcycle
196,451
152,671
166,749
187,302
FY2011
FY2010
FY2009
FY2008
FY2007
500 1,000 2,0001,500
Annual Report 2012 Annual Report 20123 4

New Headquarters
As the construction of the new headquarters had been completed on February 28th 2012, employees had started operation within the new facility as of March 26th 2012.
The new building consists of 11 floors, standing 56.6 meters tall with 12,500 square meters of floor space. Efforts to lower our dependency on outside energy sources and CO2 consumption, numerous solar and wind powered fixtures have been installed throughout the building and landscape.
Hall with accommodationfor 250 people.
Ease of functionality has been a top priority considered during the construction of the offices.
Energy efficient solar panels.
Quality
Manufacturing
EXEDY received the Daihatsu Special Quality Award for the 12th consecutive year. (Awarded April 5, 2012)
EXEDY Clutch India Private Limited
EXEDY DYNAX Mexico S.A. de C.V.
In order to strengthen the participation within the automobile and motorcycle market in India, EXEDY Clutch India will begin the development of a third factory.
As the production of automobiles continues to flourish in Mexico, we have begun our plans to expand and establish a new factory to meet the growing demand.
Annual Report 20125

6Annual Report 2012
Consolidated Five-Year SummaryEXEDY CORPORATION AND CONSOLIDATED SUBSIDIARIESYears ended March 31
Financial Section
For the year:
Net sales
Net income
At year-end:
Total assets
Current assets
Property, plant and equipment
Current liabilities
Long-term debt
Net assets
Net assets / Total assets
Retained earnings
Per share data:
Net income
Net income - diluted
Net assets
Consolidated Five-Year Summary
Consolidated Balance Sheets
Consolidated Statements of Income
Consolidated Statements of Comprehensive Income
Consolidated Statements of Changes in Net Assets
Consolidated Statements of Cash Flows
Notes to Consolidated Financial Statements
Independent Auditors' Report
Corporate Data
6
7
9
10
11
12
13
29
30
\ 187,303
11,658
\ 158,147
82,000
68,220
37,207
2,966
110,033
64.6 %
84,934
\ 239.95
-
2,102.64
\ 166,750
5,441
\ 136,907
59,871
70,140
24,115
2,627
103,249
70.9 %
87,588
\ 112.00
-
1,999.38
\ 152,671
5,524
\ 153,426
81,478
64,986
32,911
3,099
109,096
67.0 %
92,140
\ 113.72
-
2,115.38
\ 196,452
13,024
\ 164,417
91,136
65,395
36,156
4,200
116,820
67.0 %
102,979
\ 268.32
-
2,279.57
\ 201,932
9,222
\ 176,038
96,138
71,092
37,487
9,838
122,042
65.3 %
109,607
\ 191.21
-
2,386.53
$ 2,456,893
112,203
$ 2,141,842
1,169,704
864,971
456,102
119,698
1,484,876
65.3 %
1,333,580
$ 2.33
-
29.04
Japanese yen(millions)
Japanese yen
Note : Dollar figures are translated, for convenience only, at the rate of \ 82.19 to U.S. $1.00.
U.S. dollars(thousands)
U.S. dollars
2008 2009 2010 2011 2012 2012

7 Annual Report 2012
Consolidated Balance SheetsEXEDY CORPORATION AND CONSOLIDATED SUBSIDIARIESAs of March 31, 2011 and 2012
Current Assets:
Cash and cash equivalents (Note 16)
Time deposits
Notes and accounts receivable (Notes 4, 16 and 18) -
Trade
Non-consolidated subsidiaries and affiliates
Allowance for doubtful accounts
Inventories (Notes 2 and 4)
Deferred tax assets (Note 8)
Short-term loans
Other current assets
Total current assets
Property, Plant and Equipment (Note 4 ) :
Land
Buildings and structures
Machinery and vehicles
Tools and furniture
Construction in progress
Less - accumulated depreciation
Total property, plant and equipment
Investments and Other Assets:
Investments in securities (Notes 3 and 16)
Investments in and loans to
non-consolidated subsidiaries and affiliates
Long-term loans
Deferred tax assets (Note 8)
Other assets
Total investments and other assets
Total Assets
\ 30,038
283
33,229
8
(82)
21,232
2,819
463
3,146
91,136
8,166
42,105
107,490
38,741
6,367
202,869
(137,474)
65,395
1,494
703
141
2,144
3,404
7,886
\ 164,417
$ 339,737
1,010
480,874
170
(1,083)
266,273
33,934
6,911
41,878
1,169,704
103,711
571,882
1,362,124
491,544
91,374
2,620,635
(1,755,663)
864,972
19,309
11,230
1,497
22,509
52,621
107,166
$ 2,141,842
\ 27,923
83
39,523
14
(89)
21,885
2,789
568
3,442
96,138
8,524
47,003
111,953
40,400
7,510
215,390
(144,298)
71,092
1,587
923
123
1,850
4,325
8,808
\ 176,038
ASSETS
Japanese yen(millions)
The accompanying notes to the consolidated financial statements are an integral part of these statements.
U.S. dollars(thousands)
2011 2012 2012

8Annual Report 2012
The accompanying notes to the consolidated financial statements are an integral part of these statements.
2011 2012 2012
Current Liabilities: Short-term borrowings including
current portion of long-term debt (Notes 4, 6 and 17)
Notes and accounts payable (Note 16) -
Trade
Construction
Non-consolidated subsidiaries and affiliates
Accrued expenses (Note 16)
Accrued income taxes
Other current liabilities
Total current liabilities
Long-term Liabilities:
Long-term debt (Notes 4, 6 and 16)
Deferred tax liabilities (Note 8)
Employees' severance and retirement benefits (Note 9)
Retirement benefits for directors and corporate auditors
Other long-term liabilities
Total long-term liabilities
Contingent Liabilities (Note 18) Net Assets Shareholders' Equity (Note 17): Common stock
Authorized - 168,000 thousand shares in 2011 and 2012
Issued - 48,594 thousand shares in 2011 and 2012
Capital surplus
Retained earnings
Treasury stock
288 thousand shares in 2011 and 432 thousand shares in 2011
Total shareholders' equity
Accumulated Other Comprehensive Income
Valuation difference on available-for-sale securities
Foreign currency translation adjustments
Total accumulated other comprehensive income
Minority Interests
Total net assets
Total Liabilities and Net Assets
\ 3,465
19,358
1,591
33
7,126
3,844
739
36,156
4,200
1,145
5,044
9
1,043
11,441
8,284
7,541
102,979
(804)
118,000
357
(8,240)
(7,883)
6,703
116,820
\ 164,417
\ 5,701 19,258 2,230 264 7,196 1,700 1,138 37,487 9,838 1,204 4,525 4 938 16,509 8,284 7,541 109,607 (1,180) 124,252 436 (9,749) (9,313) 7,103 122,042 \ 176,038
$ 69,364 234,311 27,132 3,212 87,553 20,684 13,846 456,102 119,698 14,649 55,055 49 11,413 200,864 100,791 91,751 1,333,580 (14,357) 1,511,765 5,305 (118,616) (113,311) 86,422 1,484,876 $ 2,141,842
LIABILITIES AND NET ASSETS
Japanese yen(millions)
U.S. dollars(thousands)

9 Annual Report 2012
Consolidated Statements of IncomeEXEDY CORPORATION AND CONSOLIDATED SUBSIDIARIESYears ended March 31, 2011 and 2012
Net Sales
Cost of Sales
Gross profit
Selling, General and Administrative Expenses (Note 10)
Operating income
Other Income (Expenses) :
Interest and dividend income
Interest expense
Losses on sale or disposal of property, plant and equipment
Equity in gains of non-consolidated subsidiaries and affiliates
Foreign exchange gains (losses), net
Gains on reversal of allowance for doubtful accounts
Gains on reversal of reserve for warranty
Impairment loss on goodwill (Note 5)
Other, net
Income before income taxes and minority interests
Income Taxes (Note 8)
Current
Deferred
Income before Minority Interests
Minority Interests in Net Income of Consolidated Subsidiaries
Net Income
Per Share Data (Note 14) :
Net income
Net income - diluted
Cash dividends
\ 196,452
152,344
44,108
22,712
21,396
78
(323)
(32)
59
(860)
4
178
-
511
(385)
21,011
6,504
225
14,282
1,258
\ 13,024
\ 268.32
-
50.00
\ 201,932
161,524
40,408
23,625
16,783
181
(409)
(195)
4
(895)
18
-
(515)
690
(1,121)
15,662
4,966
361
10,335
1,113
\ 9,222
\ 191.21
-
50.00
$ 2,456,893
1,965,252
491,641
287,443
204,198
2,202
(4,976)
(2,373)
49
(10,889)
219
-
(6,266)
8,394
(13,640)
190,558
60,421
4,392
125,745
13,542
$ 112,203
$ 2.33
-
0.61
Japanese yen(millions)
Japanese yen
The accompanying notes to the consolidated financial statements are an integral part of these statements.
U.S. dollars(thousands)
U.S. dollars
2011 2012 2012

10Annual Report 2012
Consolidated Statements of Comprehensive IncomeEXEDY CORPORATION AND CONSOLIDATED SUBSIDIARIESYears ended March 31, 2011 and 2012
Income before Minority Interests
Other Comprehensive Income
Valuation difference on available-for-sale securities
Foreign currency translation adjustments
Share of other comprehensive income of associates accounted for using equity method
Total other comprehensive income (Note19)
Comprehensive Income
Comprehensive Income attribute to:
Owners of the parent
Minority interests
\ 14,282
38
(3,122)
1
(3,083)
\ 11,199
10,299
900
\ 10,335
79
(1,951)
-
(1,872)
\ 8,463
7,795
668
125,745
961
(23,737)
-
(22,776)
$ 102,969
94,841
8,128
Japanese yen(millions)
The accompanying notes to the consolidated financial statements are an integral part of these statements.
U.S. dollars(thousands)
2011 2012 2012
11 Annual Report 2012
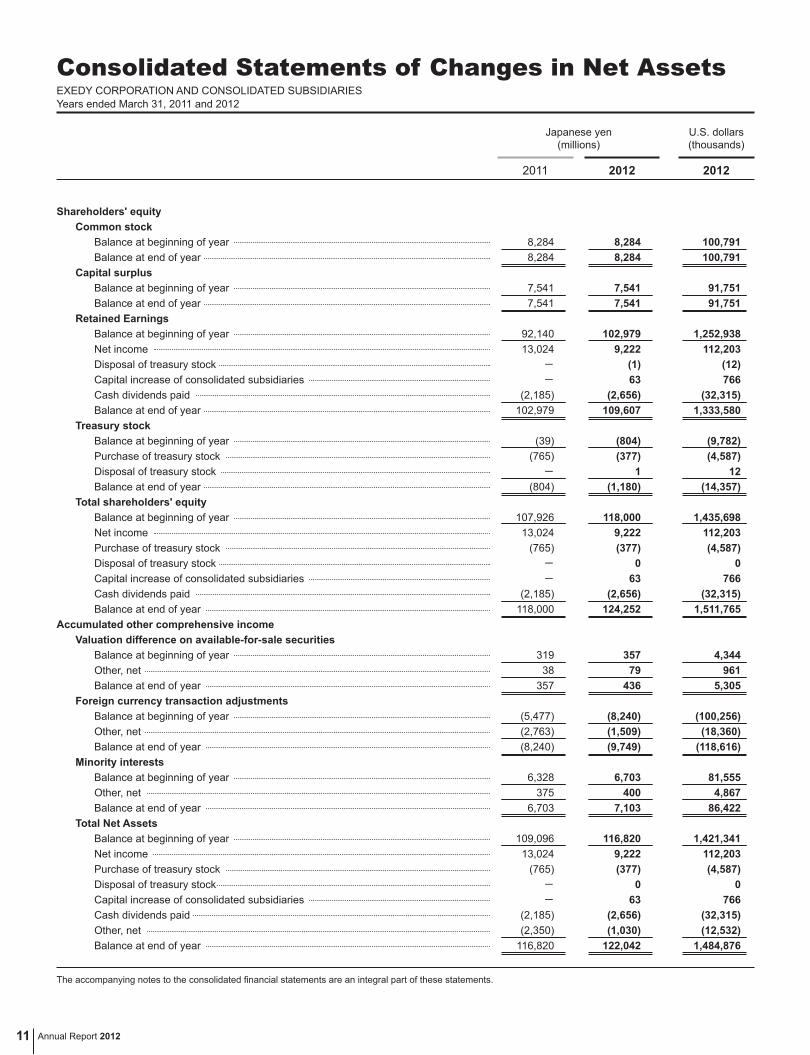
Consolidated Statements of Changes in Net AssetsEXEDY CORPORATION AND CONSOLIDATED SUBSIDIARIESYears ended March 31, 2011 and 2012
Shareholders' equity Common stock Balance at beginning of year Balance at end of year Capital surplus Balance at beginning of year Balance at end of year Retained Earnings Balance at beginning of year Net income Disposal of treasury stock Capital increase of consolidated subsidiaries Cash dividends paid Balance at end of year Treasury stock Balance at beginning of year Purchase of treasury stock Disposal of treasury stock Balance at end of year Total shareholders' equity Balance at beginning of year Net income Purchase of treasury stock Disposal of treasury stock Capital increase of consolidated subsidiaries Cash dividends paid Balance at end of year Accumulated other comprehensive income Valuation difference on available-for-sale securities Balance at beginning of year Other, net Balance at end of year Foreign currency transaction adjustments Balance at beginning of year Other, net Balance at end of year Minority interests Balance at beginning of year Other, net Balance at end of year Total Net Assets Balance at beginning of year Net income Purchase of treasury stock Disposal of treasury stock Capital increase of consolidated subsidiaries Cash dividends paid Other, net Balance at end of year
8,284 8,284 7,541 7,541 92,140 13,024 -
- (2,185) 102,979 (39) (765) - (804) 107,926 13,024 (765) - - (2,185) 118,000 319 38 357 (5,477) (2,763) (8,240) 6,328 375 6,703 109,096 13,024 (765) - - (2,185) (2,350) 116,820
8,284 8,284 7,541 7,541 102,979 9,222 (1) 63 (2,656) 109,607 (804) (377) 1 (1,180) 118,000 9,222 (377) 0 63 (2,656) 124,252 357 79 436 (8,240) (1,509) (9,749) 6,703 400 7,103 116,820 9,222 (377) 0 63 (2,656) (1,030) 122,042
100,791 100,791 91,751 91,751 1,252,938 112,203 (12) 766 (32,315) 1,333,580 (9,782) (4,587) 12 (14,357) 1,435,698 112,203 (4,587) 0 766 (32,315) 1,511,765 4,344 961 5,305 (100,256) (18,360) (118,616) 81,555 4,867 86,422 1,421,341 112,203 (4,587) 0 766 (32,315) (12,532) 1,484,876
Japanese yen(millions)
The accompanying notes to the consolidated financial statements are an integral part of these statements.
U.S. dollars(thousands)
2011 2012 2012

12Annual Report 2012
EXEDY CORPORATION AND CONSOLIDATED SUBSIDIARIESYears ended March 31, 2011 and 2012
Cash Flows from Operating Activities: Income before income taxes and minority interests Adjustments for : Depreciation and amortization Losses on sale or disposal of property, plant and equipment Impairment loss on goodwill Decrease in allowance for doubtful accounts Increase (decrease) in employees' severance and retirement benefits Interest and dividend income Interest expense Decrease (increase) in notes and accounts receivables Increase in inventories Increase (decrease) in notes and accounts payables Other, net Subtotal Interest and dividend income received Interest paid Income taxes paid Net cash provided by operating activities Cash Flows from Investing Activities: Increase in time deposits Decrease in time deposits Payments for purchases of property, plant and equipment Proceeds from sales of property, plant and equipment Payments for acquisitions of intangible assets Payments for purchases of investment in securities Payments for additional portions of consolidated subsidiaries Additions to loans receivable Collection of loans receivable Other, net Net cash used in investing activities Cash Flows from Financing Activities: Increase (decrease) in short-term borrowings, net Proceeds from long-term loans payable Repayments of long-term loans payable Payments for acquisitions of treasury stock Cash dividends paid Cash dividends paid to minority shareholders Other, net Net cash provided (used) in financing activities Effect of Exchange Rate Changes on Cash and Cash EquivalentsNet Increase in Cash and Cash EquivalentsCash and Cash Equivalents at Beginning of YearCash and Cash Equivalents at End of Year
\ 21,011 11,754 2 - (0) (1,062) (78) 323 (814) (5,644) 3,453 524 29,469 104 (316) (6,449) 22,808 (460) 809 (13,965) 354 (826) (286) (439) (52) 210 (58) (14,713) (420) 2,018 (1,153) (765) (2,186) (368) (6) (2,880) (774) 4,441 25,597 \ 30,038
\ 15,662 11,677 158 515 (11) (518) (181) 409 (6,953) (1,318) 697 407 20,544 203 (412) (7,392) 12,943 (9) 204 (17,928) 67 (1,950) (14) (134) (199) 111 53 (19,799) 185 1,652 (614) (377) (2,656) (460) 7,232 4,962 (221) (2,115) 30,038 \ 27,923
$ 190,558 142,073 1,922 6,266 (134) (6,302) (2,202) 4,976 (84,597) (16,036) 8,480 4,953 249,957 2,470 (5,012) (89,938) 157,477 (110) 2,482 (218,129) 815 (23,726) (170) (1,630) (2,421) 1,351 645 (240,893) 2,251 20,100 (7,470) (4,587) (32,315) (5,597) 87,990 60,372 (2,689) (25,733) 365,470 $ 339,737
Japanese yen(millions)
The accompanying notes to the consolidated financial statements are an integral part of these statements.
U.S. dollars(thousands)
2011 2012 2012
Consolidated Statements of Cash Flows

13 Annual Report 2012
Notes to Consolidated Financial StatementsEXEDY CORPORATION AND CONSOLIDATED SUBSIDIARIES
(a) Basis of presenting the consolidated financial statementsThe accompanying consolidated financial statements of Exedy Corporation (“the Company") and its consolidated subsidiaries have been prepared in accordance with the provisions set forth in the Financial Instruments and Exchange Law in Japan and its related accounting regulations, and in conformity with accounting principles generally accepted in Japan (“Japanese GAAP”), which are different in certain respects as to application and disclosure requirements from International Financial Reporting Standards.
The accounts of the Company’s overseas subsidiaries are prepared in accordance with either International Financial Reporting Standards or U.S. generally accepted accounting principles, and partially reflect the adjustments which are necessary to confirm with Japanese GAAP. The accompanying consolidated financial statements have been restructured and translated into English from the consolidated financial statements of the Company prepared in accordance with Japanese GAAP and filed with the appropriate Local Finance Bureau of the Ministry of Finance as required by the Financial Instruments and Exchange Law in Japan. Certain supplementary information included in the statutory Japanese language consolidated financial statements, but not required for fair presentation, is not presented in the accompanying consolidated financial statements.
The translation of the Japanese yen amounts into U.S. dollar amounts is included solely for the convenience of readers outside Japan, using the prevailing exchange rate at March 31, 2012, which was ¥82.19 to U.S. $1.00. The convenience translation should not be construed as representation that the Japanese yen amounts have been, could have been, or could in the future be, converted into U.S. dollars at this or any other rate of exchange.
(b) Principles of consolidationThe accompanying consolidated financial statements include the accounts of the Company and significant companies over which the Company has power of control through majority voting rights or the existence of certain conditions evidencing control by the Company. The consolidated financial statements include the accounts of the Company and its 29 and 30 significant majority owned subsidiaries as of March 31, 2011 and 2012, respectively.
Investments in non-consolidated subsidiaries and affiliates over which the Company has the ability to exercise significant influence over operating and financial policies of the investees, are accounted for using the equity method. Investments in 5 and 4 non-consolidated subsidiaries as of March 31, 2011 and 2012 and 1 and 1 affiliate as of March 31, 2011 and 2012 are accounted for using the equity method.
In the elimination of investments in consolidated subsidiaries, the assets and liabilities of the subsidiaries, including the portion attributable to minority shareholders, are valued using the fair value at the time the Company acquired control of the respective subsidiary. Material intercompany balances, transactions and profits have been eliminated in consolidation. All the overseas subsidiaries except for 2 consolidated subsidiaries, are consolidated using a fiscal period ending December 31. Significant transactions occurring from January 1 to March 31, the Company’s fiscal year-end, are adjusted for in the consolidated financial statements.
1. Summary of Significant Accounting and Reporting Policies
(c) Translation of foreign currenciesMonetary assets and liabilities denominated in foreign currency are translated into Japanese yen at current rates at each balance sheet date and the resulting translation gains or losses are charged to income for the current period.
The balance sheets of consolidated overseas subsidiaries are translated into Japanese yen at the year-end rates except for shareholders' equity accounts, which are translated at historical rates. Income statements of consolidated overseas subsidiaries are translated at the average rates during the year. Translation adjustments resulting from translating financial statements whose accounts are denominated in foreign currencies are not included in the determination of net income but are reported as “Foreign currency translation adjustments” in a component of net assets and minority interests.
(d) SecuritiesSecurities consist principally of marketable and nonmarketable equity securities.Other securities with available fair market value are stated at fair market value. Valuation difference on available-for-sale securities are reported, net of applicable income taxes, as a separate component of net assets. Realized gains and losses on the sale of such securities are computed using the moving average cost method.Other securities with no available fair market value are stated at moving average cost, net of the amount considered uncollectible.If the fair market value of other securities declines significantly, such securities are stated at fair market value and the difference between the fair market value and the carrying amount is recognized as a loss in the period of decline. If the net asset value of other securities with no available fair market value declines significantly, such securities should be written down to the net asset value by charging to income.
(e) DerivativesAll derivatives are stated at fair value.
(f) InventoriesInventories possessed for selling except for supplies are mainly stated at the lower of cost (first-in, first-out) or net realizable value at the balance sheet date. Supplies are mainly stated at cost determined by the last purchase cost method.
(g) Property, plant and equipmentThe Company and its domestic consolidated subsidiaries compute the depreciation of property, plant and equipment by using the declining-balance method and its overseas consolidated subsidiaries mainly by using the straight-line method. The depreciation of buildings acquired by the Company and its domestic consolidated subsidiaries on and after April 1, 1998 is computed by using the straight-line method.Estimated useful lives of property, plant and equipment are as follows:Buildings and structures ........... 3 - 50 yearsMachinery and vehicles …........ 2 - 15 yearsTools and furniture ………. 2 - 20 years
Maintenance and repairs including minor renewals and betterments are charged to income as incurred.

14Annual Report 2012
(h) SoftwareSoftware is amortized using the straight-line method over the useful lives (3-5 years) of the software.
(i) LeasesFinance leases, except for certain immaterial leases, are capitalized and depreciated over lease terms, as applicable. However, as permitted, the Company and consolidated domestic subsidiaries account for finance leases commencing prior to April 1, 2008 which do not transfer ownership of the leased property to the lessee as operating lease with disclosure of certain “as if capitalized” information in Note 7.
(j) Income taxesThe Company and its consolidated subsidiaries recognize the tax effects of temporary differences between the carrying amounts of assets and liabilities for tax and financial reporting purposes.The asset and liability approach is used to recognize deferred tax assets and liabilities for the expected future tax consequences of temporary differences between the carrying amounts of assets and liabilities for financial reporting purposes and the amounts used for income tax purposes.
(k) Allowance for doubtful accountsThe Company and its consolidated subsidiaries provide for doubtful accounts principally at an amount computed based on the historical bad debt ratio during a certain reference period plus the estimated uncollectible amount based on the analysis of individual accounts.
(l) Allowance for product warrantiesThe Company and its consolidated subsidiaries provide for warranty claim costs relating to quality of products. The provision is estimated based on historical warranty claims ratio during a certain reference period.
(m) Employees' severance and retirement benefitsThe Company and its consolidated subsidiaries provide for employees' severance and retirement benefits at the end of the fiscal year based on the estimated amounts of projected benefit obligation and the fair value of the plan assets at that date.
Actuarial differences are fully amortized in the following year after when the actuarial differences are recognized. Prior service costs are recognized in expenses in the year in which they are incurred.
(n) Retirement benefits for directors and corporate auditorsDomestic consolidated subsidiaries have unfunded retirement allowance plans for directors and corporate auditors. The amounts required under the plans have been fully accrued.
(o) Accounting for consumption taxes
Consumption taxes withheld upon sale and consumption taxes paid by the Companies on their purchases of goods and services are not included in the amounts of respective revenue or cost or expense items in the accompanying consolidated statements of income.
(p) Per share dataThe computation of net income per share is based on the weighted average number of shares outstanding during each year, excluding the Company’s treasury stock, and based on net income attributed to ordinary shareholders, excluding bonuses to directors and corporate auditors, etc. The computation of net assets per share is based on the number of shares of common stock outstanding at the year-end, excluding the Company’s treasury stock, and based on net assets attributed to ordinary shareholders, excluding minority interests.
Cash dividends per share shown in the statements of income are the amounts applicable to the respective years.
(q) GoodwillGoodwill, except for minor goodwill is amortized by the straight-line method over five years. Minor goodwill is expensed as incurred.
(r) Cash and cash equivalentsCash and cash equivalents include cash on hand, demand deposits and short-term investments which have maturities of three months or less when purchased, are easily convertible into cash and have few risks of fluctuation in value.
(s) ReclassificationCertain comparative figures have been reclassified to conform to the current year’s presentation.
(t) Additional InformationChange in Accounting Policies – Accounting Standards for Accounting Changes and Error CorrectionsThe Company and its consolidated domestic subsidiaries adopted “Accounting Standard for Accounting Changes and Error Corrections” (Accounting Standards Board of Japan (“ASBJ”) Statement No.24 issued on December 4, 2009) and “Guidance on Accounting Standard for Accounting Changes and Error Corrections” (ASBJ Guidance No. 24, issued on December 4, 2009) for accounting changes and corrections of prior period errors which are made from the fiscal year beginning on April 1, 2011.
Accounting method for disposal of treasury stock under Employee Stock Ownership PlanAt the board of directors’ meeting held on April 27, 2012, a resolution was made to introduce a trust-type employee incentive plan called “ESOP investing stock” and to dispose of treasury stock through third-party allotment to the trust account. The purpose for the disposal is to promote employee’s motivation and provide positive effects of employee ownership and participation of the Company’s operation, and to boost the Company’s value in the medium to long term by accelerating management style focusing on increasing corporate value. Accordingly, the Company sold 100,000 shares of treasury stock to Mitsubishi UFJ Trust and Banking Corporation (“ESOP Trust Account”) on May 17, 2012.
The Company’s stock held by the ESOP Trust Account is treated as treasury stock held by the Company from the perspective of an economic substance. Accordingly, the Company’s stock held in the ESOP Trust Account is recorded under treasury stock in the Company’s consolidated financial statements.
As of March 31, 2012, the number of Company’s stock held in the ESOP Trust Account amounted to 99,600 shares.

15 Annual Report 2012
3. SecuritiesOther securities with book values (fair values) exceeding acquisition costs as of March 31, 2011 and 2012 were as follows:
Other securities with book values (fair values) not exceeding acquisition costs as of March 31, 2011 and 2012 were as follows:
The book value of securities with no available fair values as of March 31, 2011 and 2012 were as follows:
Other securities with no fair value Non-listed equity securities
Equity securitiesInterest-bearing securitiesOthers
Equity securitiesInterest-bearing securitiesOthers
Equity securitiesInterest-bearing securitiesOthers
Equity securitiesInterest-bearing securitiesOthers
\ 68
\ 644 - -\ 644
\ 174 - -\ 174
\ 374 - -\ 374
\ 453 - -\ 453
\ 72
\ 1,286 - -\ 1,286
\ 140 - -\ 140
\ 1,145 - -\ 1,145
\ 370 - -\ 370
\ 642 - -\ 642
\ (34) - -\ (34)
\ 771 - -\ 771
\ (83) - -\ (83)
$ 876
$ 9,381 - - $ 9,381
$ (1,010) - - $ (1,010)
$ 13,931 - - $ 13,931
$ 4,502 - - $ 4,502
$ 4,550 - - $ 4,550
$ 5,512 - - $ 5,512
Japanese yen(millions)
Japanese yen (millions)
Japanese yen (millions)
U.S. dollars (thousands)
U.S. dollars (thousands)
Japanese yen (millions)
Japanese yen (millions)
U.S. dollars(thousands)
2011
Acquisition cost
Acquisition cost
Acquisition cost
Acquisition cost
Acquisition cost
Acquisition cost
2012
Book value
Book value
Book value
Book value
Book value
Book value
2012
Difference
Difference
Difference
Difference
Difference
Difference
March 31, 2011
March 31, 2011
March 31, 2012
March 31, 2012
2. InventoriesInventories as of March 31, 2011 and 2012 were as follows:
The ending inventory balance represents after write-down of book value when their carrying amounts become unrecoverable, and the write-down recognized at cost of sales were \260 million and \212 million ($2,579 thousand) as of March 31, 2011 and 2012, respectively.
Finished goodsWork-in processRaw materialsSupplies
\ 9,665 5,047 5,548 1,625 \ 21,885
\ 10,227 4,082 5,678 1,245 \ 21,232
$ 117,593 61,407 67,502 19,771$ 266,273
Japanese yen(millions)
U.S. dollars(thousands)
2011 2012 2012
16Annual Report 2012
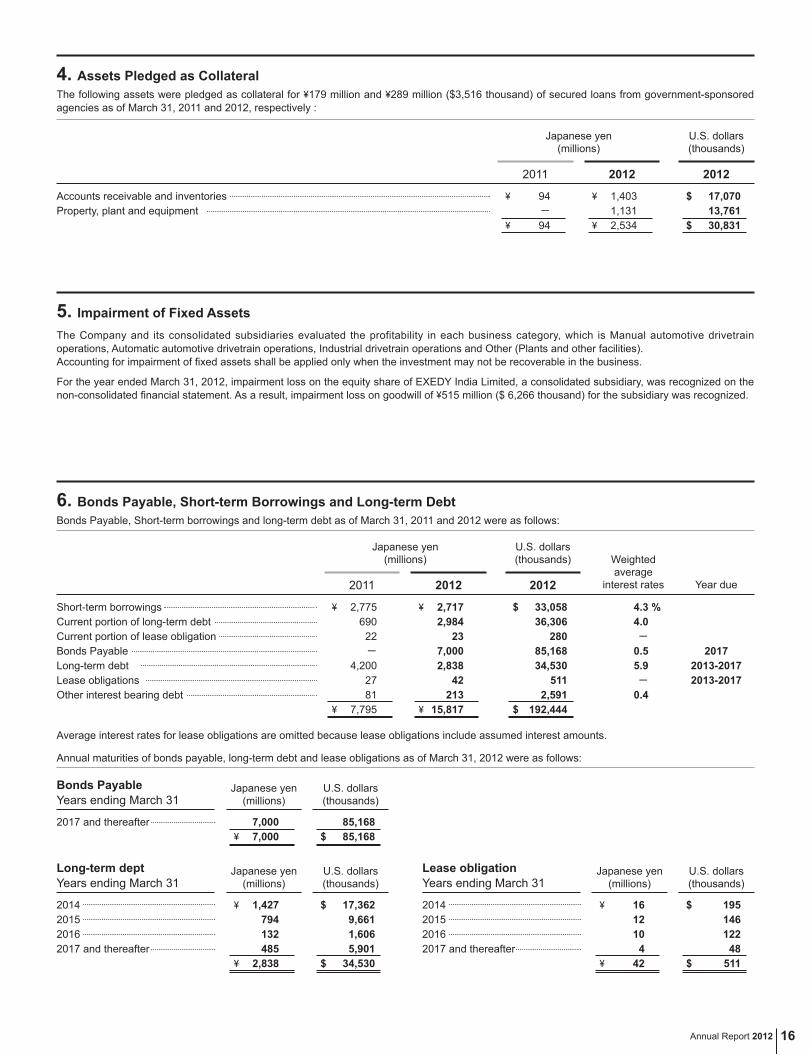
4. Assets Pledged as CollateralThe following assets were pledged as collateral for \179 million and \289 million ($3,516 thousand) of secured loans from government-sponsored agencies as of March 31, 2011 and 2012, respectively :
Accounts receivable and inventoriesProperty, plant and equipment
\ 94 - \ 94
\ 1,403 1,131 \ 2,534
$ 17,070 13,761 $ 30,831
Japanese yen(millions)
U.S. dollars(thousands)
2011 2012 2012
5. Impairment of Fixed AssetsThe Company and its consolidated subsidiaries evaluated the profitability in each business category, which is Manual automotive drivetrain operations, Automatic automotive drivetrain operations, Industrial drivetrain operations and Other (Plants and other facilities). Accounting for impairment of fixed assets shall be applied only when the investment may not be recoverable in the business.
For the year ended March 31, 2012, impairment loss on the equity share of EXEDY India Limited, a consolidated subsidiary, was recognized on the non-consolidated financial statement. As a result, impairment loss on goodwill of \515 million ($ 6,266 thousand) for the subsidiary was recognized.
6. Bonds Payable, Short-term Borrowings and Long-term DebtBonds Payable, Short-term borrowings and long-term debt as of March 31, 2011 and 2012 were as follows:
Average interest rates for lease obligations are omitted because lease obligations include assumed interest amounts.
Short-term borrowingsCurrent portion of long-term debtCurrent portion of lease obligationBonds PayableLong-term debtLease obligationsOther interest bearing debt
\ 2,775 690 22 - 4,200 27 81 \ 7,795
4.3 % 4.0 - 0.5 5.9 - 0.4
\ 2,717 2,984 23 7,000 2,838 42 213 \ 15,817
20172013-20172013-2017
$ 33,058 36,306 280 85,168 34,530 511 2,591 $ 192,444
Japanese yen(millions) Weighted
averageinterest rates Year due
U.S. dollars(thousands)
2011 2012 2012
2014201520162017 and thereafter
2017 and thereafter
2014201520162017 and thereafter
\ 1,427 794 132 485 \ 2,838
7,000 \ 7,000
\ 16 12 10 4 \ 42
$ 17,362 9,661 1,606 5,901 $ 34,530
85,168 $ 85,168
$ 195 146 122 48 $ 511
Japanese yen(millions)
Japanese yen(millions)
Japanese yen(millions)
U.S. dollars(thousands)
U.S. dollars(thousands)
U.S. dollars(thousands)
Annual maturities of bonds payable, long-term debt and lease obligations as of March 31, 2012 were as follows:
Years ending March 31
Years ending March 31
Years ending March 31Long-term dept
Bonds Payable
Lease obligation

17 Annual Report 2012
Machinery and vehicles Tools and furniture
Machinery and vehicles Tools and furniture
$ 61 414$ 475
$ - - $ -
$ 414 693$ 1,107
$ 475 1,107$ 1,582
\ 5 34\ 39
\ 23 48\ 71
\ - - \ -
\ - - \ -
\ 34 57\ 91
\ 57 48 \ 105
\ 39 91 \ 130
\ 80 96 \ 176
Japanese yen (millions)
Japanese yen (millions)
U.S. dollars (thousands)
Acquisitioncost
Acquisitioncost
Acquisitioncost
Accumulateddepreciation
Accumulateddepreciation
Accumulateddepreciation
Balance
Balance Balance
Accumulatedlosses on
impairment
Accumulatedlosses on
impairment
Accumulatedlosses on
impairmentMarch 31, 2012
March 31, 2011
7. Leases(a) Finance leasesAs discussed in Note 1 (i), finance leases commenced prior to April 1, 2008 which do not transfer ownership of leased assets to lessees are accounted for as operating leases.Information relating to finance leases, except those leases for which the ownership of the leased assets is considered to be transferred to the lessee, is described below.
Pro forma information regarding leased property such as acquisition cost, accumulated depreciation, accumulated losses on impairment and future minimum lease payments under finance leases that do not transfer the ownership of the leased property to the lessee for the years ended March 31, 2011 and 2012 were as follows:
Due within one year Due over one year
Lease payments for the year
\ 16 23 \ 39
\ 19
\ 26 45 \ 71
\ 30
$ 195 280$ 475
$ 231
Japanese yen(millions)
U.S. dollars(thousands)
2011 2012 2012
The scheduled maturities of future lease payments, on such lease contracts for the years ended March 31, 2011 and 2012 were as follows:
The amounts of acquisition costs and future minimum lease payments under finance leases included the interest expense portions.
Depreciation expenses, which are not reflected in the accompanying consolidated statements of income, calculated by the straight-line method, were \30 million and \19 million ($ 231thousand) for the years ended March 31, 2011 and 2012, respectively.
The Company had no leased assets on which impairment should have been recognized for the years ended March 31, 2011 and 2012.
(b) Operating leasesThe scheduled maturities of future lease payments under non-cancelable operating leases as of March 31, 2010 and 2011, were as follows:
Due within one year Due over one year
\ 10 30 \ 40
\ 8 22 \ 30
$ 122 365 $ 487
Japanese yen(millions)
U.S. dollars(thousands)
2011 2012 2012

18Annual Report 2012
Deferred tax assets: Employees' severance and retirement benefits Net operating losses carried forward Accrued bonuses to employees Impairment losses on property, plant and equipment Unrealized profit eliminated in consolidation (inventories) Losses on devaluation of inventories Unrealized profit eliminated in consolidation (fixed assets) Accrued warranty costs Accrued enterprise tax Retirement benefits for directors and corporate auditors OtherTotal deferred tax assets Valuation allowanceDeferred tax assets
Deferred tax liabilities: Depreciation and amortization Retained earnings of overseas subsidiaries Reserve for advanced depreciation Net unrealized holding gains on other securities OtherTotal deferred tax liabilities Valuation allowanceDeferred tax liabilities
Net deferred tax assets
Statutory tax rate Adjustments for: Different tax rates applied to overseas subsidiaries Adjustment for write-down of investment on subsidiaries Tax credit for research and development expenses Increase (decrease) in valuation allowance Per capital inhabitants tax Increase(decrease) of retained earnings of overseas subsidiaries Non-deductible expenses Foreign withholding tax Impairment loss on goodwill Correction due to tax-rate change OtherEffective tax rate
\ 2,038 1,169 1,079 659 492 471 374 328 258 218 976 8,062 (1,509) 6,553
(1,038) (1,001) (329) (251) (119) (2,738) - (2,738)
\ 3,815
40.4 % (5.3) - (1.5) (1.9) 0.1 1.0 0.2 0.3 - - (1.3) 32.0 %
\ 1,679 1,169 882 514 535 573 399 209 97 172 971 7,200 (674) 6,526
(1,291) (1,024) (332) (252) (195) (3,094) - (3,094)
\ 3,432
40.4 % (4.5) (2.8) (1.9) (1.6) 0.1 0.1 0.4 0.7 1.3 1.5 0.3 34.0 %
$ 20,428 14,223 10,731 6,254 6,509 6,972 4,855 2,543 1,180 2,093 11,814 87,602 (8,201) 79,401
(15,708) (12,459) (4,039) (3,066) (2,372) (37,644) - (37,644)
$ 41,757
Japanese yen(millions)
U.S. dollars(thousands)
2011
2011
2012
2012
2012
8. Income TaxesSignificant components of the Company and consolidated subsidiaries' deferred tax assets and liabilities as of March 31, 2011 and 2012 were as follows:
The Company and its consolidated subsidiaries are subject to a number of taxes based on income, which, in the aggregate, indicate a statutory tax rate in Japan of approximately 40.4% for the years ended March 31, 2011 and 2012.The following table summarizes the significant differences between the statutory tax rate and the Company's effective tax rate for financial statement purposes for the years ended March 31, 2011 and 2012:
On December 2, 2011, amendments to the Japanese tax regulations were enacted into law. Due to this change in statutory income tax rates, net deferred tax assets decreased by JPY 199 million as of March 31, 2012 and deferred income tax expense recognized for the year ended March 31, 2012 increased by JPY 238 million.
Adjustment of deferred tax assets and liabilities for enacted changes in tax laws and rates

19 Annual Report 2012
Projected benefit obligation Fair value of plan assets Unrecognized actuarial differences Employees' severance and retirement benefits
\ (11,679) 6,446 (5,233) 189 \ (5,044)
\ (11,621) 7,035 (4,586) 61 \ (4,525)
$ (141,392) 85,594 (55,798) 743 $ (55,055)
Japanese yen(millions)
U.S. dollars(thousands)
2011 2012 2012
9. Employees' Severance and Retirement BenefitsThe Company and its domestic consolidated subsidiaries have adopted defined benefit retirement plans: cash balance plans and lump-sum payment plans, as well as defined contribution pension plans.
The liability for employees' severance and retirement benefits included in the liabilities section of the consolidated balance sheets as of March 31, 2011 and 2012 consisted of the following:
Included in the consolidated statements of income for the years ended March 31, 2011 and 2012 were employees' severance and retirement benefit expenses comprised of the following:
Assumptions used in the calculation of the above information were as follows:
Service costs Interest costs Expected return on plan assets Amortization of actuarial differences Employees' severance and retirement benefit expenses Others
Method of attributing the projected benefits to periods of service Discount rate Expected rate of return on plan assets Amortization of prior service costsAmortization of actuarial differences
\ 496 231 (128) 222 821 189 \ 1,010
Straight-line basis 2.0% 2.0% 1 year 1 year
\ 535 231 (119) (473) 174 190 \ 364
Straight-line basis 2.0% 2.0% 1 year 1 year
$ 6,035 2,810 (1,557) 2,701 9,989 2,300 $ 12,289
Japanese yen(millions)
U.S. dollars(thousands)
2011
2011
2012
2012
2012
Note : "Others" represents the payments to defined contribution pension plans.

20Annual Report 2012
10. Research and development expensesResearch and development expenses are charged to income as incurred. Research and development expenses for the years ended March 31, 2011 and 2012 were as follows:
Research and development expenses \ 4,596 \ 4,412 $ 53,680
Japanese yen(millions)
U.S. dollars(thousands)
2011 2012 2012
11. DerivativesThe following table provides information on derivative instruments as of March 31, 2011 and 2012.
Forward exchange contracts: To sell U.S. dollars To sell Euro To sell New zealand dollars To sell Japanese Yen To buy Euro To buy Japanese Yen
Forward exchange contracts: To sell U.S. dollars To sell Euro To buy U.S. dollars To buy Thai bahts To buy Japanese Yen
$ (219) (171) (12) 0 0 (0)$ (402)
$ (219) (171) (12) 0 0 (0)$ (402)
$ 4,843 2,141 170 377 195 61 $ 7,787
\ (18) (14) (1) 0 0 (0)\ (33)
\ (4) (4) (4) (1) (0)\ (13)
\ (18) (14) (1) 0 0 (0)\ (33)
\ (4) (4) (4) (1) (0)\ (13)
\ 398 176 14 31 16 5 \ 640
\ 672 116 203 73 17 \ 1,081
Japanese yen (millions)
Japanese yen (millions)
U.S. dollars (thousands)
Gain(Loss)
Gain(Loss)
Fairvalue
Fairvalue
Contractamount
Contractamount
Contractamount
Fairvalue
Gain(Loss)March 31, 2012
March 31, 2011

21 Annual Report 2012
Operating Costs and Expenses: Manual automotive drivetrain operations Automatic automotive drivetrain operations Reporting segment total Other operations Sub Total Non-allocated operating expenses and eliminations Operating Income: Manual automotive drivetrain operations Automatic automotive drivetrain operations Reporting segment total Other operations Sub Total Non-allocated operating expenses and eliminations Assets: Manual automotive drivetrain operations Automatic automotive drivetrain operations Reporting segment total Other operations Sub Total Corporate and eliminations Depreciation and Amortization: Manual automotive drivetrain operations Automatic automotive drivetrain operations Reporting segment total Other operations Sub Total Corporate and eliminations
\ 49,434 116,463 165,897 29,438 195,335 (10,186)\ 185,149 \ 8,640 6,814 15,454 2,163 17,617 (834)\ 16,783 \ 46,675 87,550 134,225 23,173 157,398 18,640 \ 176,038 \ 2,701 8,060 10,761 1,083 11,844 (167)\ 11,677
\ 47,916 110,574 158,490 25,432 183,922 (8,866)\ 175,056 \ 9,433 10,182 19,615 2,532 22,147 (751)\ 21,396 \ 43,033 78,937 121,970 20,990 142,960 21,457 \ 164,417 \ 2,861 7,820 10,681 1,067 11,748 6 \ 11,754
$ 601,460 1,416,997 2,018,457 358,170 2,376,627 (123,932)$ 2,252,695 $ 105,122 82,906 188,028 26,317 214,345 (10,147)$ 204,198 $ 567,891 1,065,215 1,633,106 281,944 1,915,050 226,792 $ 2,141,842 $ 32,863 98,065 130,928 13,177 144,105 (2,032)$ 142,073
Sales: Manual automotive drivetrain operations Automatic automotive drivetrain operations Reporting segment total Other operations Sub Total Eliminations (inter-segment net sales)
\ 58,074 123,277 181,351 31,601 212,952 (11,020)\ 201,932
\ 57,349 120,756 178,105 27,964 206,069 (9,617)\ 196,452
$ 706,582 1,499,903 2,206,485 384,487 2,590,972 (134,079)$ 2,456,893
Japanese yen(millions)
U.S. dollars(thousands)
2011 2012 2012
12. Segment Information(a) General information about reportable segmentsThe Company and its consolidated subsidiaries are mainly engaged in the manufacture and sale of automotive parts.From the aspects of function, technological specification and productive structure, the product lines of the Company are classified roughly into 2 group, "Manual Transmission Parts" and "Automatic Transmission Parts". The Company in cooperation with its consolidated subsidiaries design business strategy and conduct business for these 2 product lines inside Japan and overseas. And concerning these 2 product lines,separate financial information is accessible among the constituent units of the Company and that are subject to periodical examination, in order for the Board of Directors of the Company to determine the allocation of management resources. Accordingly, the reportable segments of the Company are composed of 2 segments, "MT (Manual automotive drivetrain related business)" which manufactures and sells Manual Transmission Parts and "AT (Automatic automotive drivetrain related business)" which manufactures and sells Automatic Transmission Parts.
(b) Basis of measurement about reported segment profit or loss, segment assets, segment liabilities and other material itemsThe accounting policies of the reportable segment are mainly consistent to what described in Note 1 "Summary of Significant Accounting and Reporting Policies". The segment profit (loss) is based on operating income before amortization of goodwill. The prices of the goods traded or transferred among the segments are mainly determined considering market prices of the goods.
(c) Information about reported segment profit or loss, segment assets, segment liabilities and other material itemsReported segment information for the years ended 31, 2011 and 2012 were as follows :

22Annual Report 2012
Capital Expenditures: Manual automotive drivetrain operations Automatic automotive drivetrain operations Reporting segment total Other operations Sub Total Corporate and eliminations
\ 4,487 13,936 18,423 3,098 21,521 (180)\ 21,341
\ 4,266 9,218 13,484 2,291 15,775 (62)\ 15,713
$ 54,593 169,558 224,151 37,694 261,845 (2,191)$ 259,654
Note : 1.
2.
3.
"Other operations" is the business segment which doesn't attribute to any reportable segments, and contain industrial machine drivetrain operation, clutches for motorcycle operation, transport operation, etc. The contents of Adjustments are as follows :(a) "Non-allocated operating expenses and eliminations" of Operationg Income \(834) million($(10,147) thousand) consists of "Elimination of intersegment
transactions" \237 million($2,884 thousand), "Amortization of goodwill" \(136) million($(1,655) thousand), "Company-wide expense" which is not allocated to reportable segments \(861) million($(10,476) thousand) and "other adjstments" \(74) million($(900) thousand).
"Company-wide expense" mainly consists general and administrative expenses and expence for new-product development not attributable to any reportable segments.
(b) "Corporate and eliminations" of Assets \18,640 million($226,792 thousand) consists of "Company-wide assets" which is not allocated to reportable segments \20,989 million($255,372 thousand), "Elimination of intersegment transaction" \(2,136) million($(25,989) thousand) and "other adjstments" \(213) million($(2,591) thousand)."Company-wide assets" mainly consists of the cash and cash equivalents and securities that are not attributable to any reportable segments.
(c) "Corporate and eliminations" of Depreciation and Amortization \(167) million($(2,032) thousand) consists of "Adjustment of unrealized gain for intersegmnet transaction of fixed assets" \(167) million($(2,032) thousand).
(d) "Corporate and eliminations" of Capital Expenditures \(180) million($(2,191) thousand) consists of "Adjustment of unrealized gain for intersegmnet transaction of fixed assets" \(180) million($(2,191) thousand).
The segment income is adjusted to accord with operating income of "consolidated statement of income".
(1) Information about products and services Due to the segment of products and services are same as the reportable segment, description of this item is omitted.
(2) Information about geographic areas for the years ended March 31, 2011and 2012 were as follows :
Sales: Japan America Asia-Oceania Other Tangible Assets: Japan America Asia-Oceania Other
\ 102,196 33,972 57,166 8,598 \ 201,932 \ 39,667 9,310 21,791 324 \ 71,092
\ 32,236
\ 89,646 36,994 60,400 9,412 \ 196,452 \ 38,098 7,816 19,091 390 \ 65,395
\ 29,892
$ 1,243,412 413,335 695,535 104,611 $ 2,456,893 $ 482,626 113,274 265,130 3,941 $ 864,971
$ 392,213
Japanese yen(millions)
Japanese yen(millions)
U.S. dollars(thousands)
U.S. dollars(thousands)
2011
2011
2012
2012
2012
2012
The Company's operations are classified into geographical areas as follows: Japan, America (including Mexico), Asia-Oceania (Thailand, Malaysia, China, Korea, Indonesia, Vietnam, Australia, United Arab Emirates, New Zealand and India) and Other (Europe).
(3) Information about major customer for the years ended March 31 2011 and 2012 were as follows :
Company Name Sales Segment
JATCO Corporation AT and MT

23 Annual Report 2012
Subjects Categories Name Address
CapitalJapanese yen
(millions) U.S. dollars(thousands)
Operation Voting rights(%)
RelationshipBusiness
relationshipTrade
AmountJapanese yen
(millions) U.S. dollars(thousands)
Accounts
BalanceJapanese yen
(millions) U.S. dollars(thousands)
The Company
Other relatedcompany'ssubsidiary
Aisin AWCo., Ltd.
Anjo CityAichi pref.
\ 26,480 $ 322,180
Manufacturingautomotive
parts-
Sale ofproducts
Sale ofproducts
Concurrently serving
as directors
\ 6,140 $ 74,705
Accountsreceivable
\ 1,232 $ 14,990
Advancedreceived
\ 12 $ 146
DynaxCorporation
Other relatedcompany'ssubsidiary
Aisin AWCo., Ltd.
Anjo CityAichi pref.
\ 26,480 $ 322,180
Manufacturingautomotive
parts-
Sale ofproducts
Sale ofproducts
\ 3,258 $ 39,640
Accountsreceivable
\ 769 $ 9,356
ExedyAmerica
Corporation
Other relatedcompany'ssubsidiary
Aisin Holdings
of America, Inc.
IndianaU.S.A. $ 282,290
Administration of overall
North American
operations
40% (directly held)
Dept Interest expense
\ 10 $ 122
Long-termdebt
\ 1,306 $ 15,890
March 31, 2012
(Transaction terms and policy determination thereof)With regard to sale of products and debt, prices and other transaction terms are determined by negotiation in consideration of market situations.
Consumption taxes are included in the balance, but not in the trade amounts.
13. Related Party TransactionsFor the years ended March 31, 2011 and 2012, the Company and its consolidated subsidiaries had operational transactions with Aisin AW Co., Ltd and Aisin Holdings of America, Inc., which are subsidiaries of Aisin Seiki Co., Ltd. which holds 33.4% of the Company's voting rights.
A summary of the significant transactions between the Company and its consolidated subsidiaries and such companies for the years ended March 31, 2011 and 2012 were as follows:
Subjects Categories Name AddressCapital
Japanese yen(millions)
Operation Voting rights(%)
RelationshipBusiness
relationshipTrade
AmountJapanese yen
(millions)Accounts
BalanceJapanese yen
(millions)
The Company
Other relatedcompany'ssubsidiary
Aisin AWCo., Ltd.
Anjo CityAichi pref. \ 26,480
Manufacturingautomotive
parts-
Sale ofproducts
Sale ofproducts
Concurrently serving
as directors
\ 5,693
Accountsreceivable \ 1,239
Advancedreceived \ 8
DynaxCorporation
Other relatedcompany'ssubsidiary
Aisin AWCo., Ltd.
Anjo CityAichi pref. \ 26,480
Manufacturingautomotive
parts-
Sale ofproducts
Sale ofproducts \ 2,941 Accounts
receivable \ 609
ExedyAmerica
Corporation
Other relatedcompany'ssubsidiary
Aisin Holdings
of America, Inc.
IndianaU.S.A. $ 282,290
Administration of overall
North American
operations
40% (directly held)
Dept Interest expense \ 12 Long-term
debt \ 1,369
March 31, 2011

24Annual Report 2012
14. Per Share DataPer share data for the years ended March 31, 2011 and 2012 were as follows :
The information on which per share data was calculated for the years ended March 31, 2011 and 2012 were as follows:
Net income Net income - diluted Net assets
Net income per share of common stock Net income Amounts not attributed to ordinary shareholders Net income attributed to ordinary shareholders
The weighted average number of shares (thousands)
\ 191.21 - 2,386.53
\ 9,222 - \ 9,222
48,228
\ 268.32 - 2,279.57
\ 13,024 - \ 13,024
48,539
$ 2.33 - 29.04
$ 112,203 - $ 112,203
Japanese yen(millions)
Japanese yen(millions)
U.S. dollars(thousands)
U.S. dollars(thousands)
2011
2011
2012
2012
2012
2012
Diluted net income per share is not disclosed because potentially dilutive securities have not been issued.
15. Changes in Net Assets(a) Shares issued / Treasury stock
The increase of treasury stock - common stock 275 thousand is due to open-market purchase of treasury stock pursuant to a resolution of the board of directors’ meeting held on January 27, 2011The increase of treasury stock - common stock 1 thousand is due to purchase of the stocks less than standard unit 6 hundred.
Shares issued: Common stock (thousands) Treasury stock: Common stock (thousands)
- - 276 276
48,594 48,594 12 12
48,594 48,594 288 288
- - - -
Number of sharesas of March 31, 2010
Number of sharesas of March 31, 2011DecreaseIncreaseMarch 31, 2011
The increase of treasury stock - common stock 144 thousand is due to open-market purchase of treasury stock pursuant to a resolution of the board of directors’ meeting held on August 29, 2011.The decrease of treasury stock-common stock 0 thousand is due to investing stock from Mitsubishi UFJ Trust and Banking Corporation (ESOP Trust Account) in employees who become beneficiaries of the ESOP based on the Company’s policy of investing stock.The number of treasury stock as of March 31, 2012 includes the Company’s stock amounted to 99 thousand shares held by The Master Trust Bank of Japan ,Ltd. (ESOP Trust Account)The increase of treasury stock - common stock 0 thousand is due to purchase of the stocks less than standard unit 2 hundred.
Shares issued: Common stock (thousands) Treasury stock: Common stock (thousands)
- - 144 144
48,594 48,594 288 288
48,594 48,594 432 432
- - - -
Number of sharesas of March 31, 2011
Number of sharesas of March 31, 2012DecreaseIncreaseMarch 31, 2012

25 Annual Report 2012
(b) Dividends
Resolution Type of shares Cash dividends paidJapanese yen (millions)
Dividends per share(Japanese yen) Cut-off date Effective date
Ordinary generalmeeting of the
shareholders on June 24, 2010
Common stock \ 1,215 \ 25.0 March 31, 2010 June 25, 2010
Board of Directors' meeting on
October 28, 2010Common stock \ 972 \ 20.0 September 30, 2010 November 26, 2010
Resolution Type of sharesCash dividends paidJapanese yen (millions) U.S. dollars (thousands)
Cash dividends paid(Japanese yen) (U.S. dollars)
Cut-off date Effective date
Ordinary generalmeeting of the
shareholders on June 28, 2011
Common stock \ 1,449$ 17,630
\ 30.0 $ 0.37 March 31, 2011 June 29, 2011
Board of Directors' meeting on
October 27, 2011Common stock \ 1,207
$ 14,685\ 25.0 $ 0.30 September 30, 2011 November 25, 2011
Resolution Type of sharesCash dividends paidJapanese yen (millions) U.S. dollars (thousands)
Source ofdividends
Cash dividends paid(Japanese yen) (U.S. dollars)
Cut-off date Effective date
Ordinary generalmeeting of the
shareholders onJune 22, 2012
Common stock \ 1,207 $ 14,685
Retained earnings
\ 25.0 $ 0.30 March 31, 2012 June 25, 2012
March 31, 2011
March 31, 2012
(2) Dividends, of which cut-off date was in the year ended March 31, 2012, and effective date of which will be in the year ending March 31, 2013
(1) Dividends

26Annual Report 2012
16. Financial instrumentsThe Company and its consolidated subsidiaries manage funds only in short-term deposits, raise funds by bonds or loans and engage in derivative transactions for the purpose of avoiding the risk of foreign exchange rate fluctuation and ensuring steady cash flow, not for trading or speculativepurposes. Hedging accounting through derivative transactions was not applied as the necessary conditions were not met.
Notes and accounts receivable have exposure to the credit risk of customers. The Company and its consolidated subsidiaries are managing such arisk by controlling the due date and balance of receivables from customers and watching their credit risk conditions in accordance with the Groupcredit regulations. Furthermore, to avoid the risk and ensure steady cash flow of accounts receivable in foreign currency, the Company and its consolidated subsidiaries engage in derivative transactions (forward currency exchange contracts).
Certain securities include exposure to market risk. The Company and its consolidated subsidiaries have such securities for the purpose of maintaining relationships with customers or suppliers not for trading purposes. The fair values of the securities are periodically reported to the Board of Directors of the board meeting of the Company.
Due dates of notes and accounts payable are mainly within one year.
Short-term borrowings are mainly for the purpose of working capital and bonds payable and long-term debt is mainly for the purpose of payment for investment in equipment. Derivative transactions are entered and controlled by the financial department with approval of the financial manager under the rules of each company, which provide the details such as the department in charge and the maximum transaction amount. To reduce credit risk, transactio
Notes and accounts payable and borrowings have exposure to liquidity risk. The Company and its consolidated subsidiaries are controlling suchrisk by planning monthly budgets of payment.
The book values of the financial instruments included in the consolidated balance sheet and their fair values at March 31, 2011 and 2012 were as follows.
The methods used to determine the fair value of financial instruments and derivative transactions are as follows:
Cash and time deposit, notes and accounts receivable, notes and accounts payable, short-term borrowings and accrued expenses are settled in the short term and the fair values are considered to be equal to book values. Therefore, fair values are stated at book values.
Investments in securities (Other securities) are stated at fair market value. Information regarding investments in securities classified by the purposes for which they are held is noted in the relevant section of this report.
Bonds payable is stated at carrying amount which approximates fair value because the date of issue is close to March 31, 2012.
Long-term debt is stated at fair value based on the method in which total amount of principal and interest is discounted at the interest rate that would be applied if each company borrowed the same, but new, principal amount.
Derivative information is noted in the relevant section of this report.
Cash and time depositNotes and accounts receivableInvestments in securities Other securitiesNotes and accounts payableShort-term borrowingsAccrued expenses Long-term debtDerivative transactions
Japanese yen (millions)
March 31, 2011
\ 30,321 33,235 1,426 (17,178) (2,775) (6,223) (4,890) (13)
\ 30,321 33,235 1,426 (17,178) (2,775) (6,223) (4,817) (13)
\ - - - - - - ( △ 73) -
Cash and time depositNotes and accounts receivableInvestments in securities Other securitiesNotes and accounts payableShort-term borrowingsAccrued expenses Bonds payableLong-term debtDerivative transactions
Japanese yen (millions) U.S. dollars (thousands)
Difference
Difference
DifferenceFair
value
Fairvalue
Fairvalue
Book value
Book value
Book valueMarch 31, 2012
\ 28,006 39,534 1,515 (17,236) (2,717) (6,600) (7,000) (5,822) (33)
$ 340,747 481,007 18,433 (209,709) (33,058) (80,302) (85,169) (70,836) (402)
\ 28,006 39,534 1,515 (17,236) (2,717) (6,600) (7,000) (5,771) (33)
$ 340,747 481,007 18,433 (209,709) (33,058) (80,302) (85,169) (70,215) (402)
\ - - - - - - - ( △ 51) -
$ - - - - - - - ( △ 621) -
1.

27 Annual Report 2012
17. Net AssetsNet assets section comprises three subsections, which are shareholders’ equity, valuation and translation adjustments and minority interests. Under the Japanese Corporate Law ("the Law"), the entire amount paid for new shares is required to be designated as common stock. However, a company may, by a resolution of the Board of Directors, designate an amount not exceeding one-half of the price of the new shares as additional paid-in-capital, which is included in capital surplus.Under the Law, in cases where a dividend distribution of surplus is made, the smaller of an amount equal to 10% of the dividend or the excess, if any, of 25% of common stock over the total of additional paid-in-capital and legal earnings reserve must be set aside as additional paid-in-capital or legal earnings reserve. Additional paid-in-capital is included in capital surplus and legal earnings reserve is included in retained earnings in the accompanying consolidated balance sheets. Under the Law, legal earnings reserve and additional paid-in capital could be used to eliminate or reduce a deficit and could be capitalized by a resolutionof the shareholders' meeting. Under the Law, additional paid-in capital and legal earnings reserve may not be distributed as dividends. However, by a resolution of the shareholders' meeting, all additional paid-in-capital and all legal earnings reserve may be transferred to other capital surplus and retained earnings, respectively, which are potentially available for dividends.The maximum amount that the Company can distribute as dividends is calculated based on the non-consolidated financial statements of the Company in accordance with Japanese laws and regulations.
Refund schedule for current credit after consolidated date
Payment schedule for long-term debt after consolidated date
3.
4.
Cash and time depositNotes and accounts receivable
Long-term debt
$ 340,747 481,007 $ 821,754
$ 36,306
$ - - $ -
$ 115,379
$ - - $ -
$ 4,320
$ - - $ -
$ -
\ - - \ -
\ -
\ - -\ -
\ 355
\ - - \ -
\ 9,483
\ 28,006 39,534 \ 67,540
\ 2,984
Japanese yen (millions)
Japanese yen (millions)
U.S. dollars (thousands)
U.S. dollars (thousands)
2013
2013
2013
2013
2014~2017
2014~2017
2014~2017
2014~2017
2018~2022
2018~2022
2018~2022
2018~2022
2023 and thereafter
2023 and thereafter
2023 and thereafter
2023 and thereafter
18. Contingent LiabilitiesContingent liabilities as of March 31, 2011 and 2012 were as follows :
Trade notes receivable discountedTrade notes receivable endorsed
\ 297 15
\ 125 -
$ 3,614 183
Japanese yen(millions)
U.S. dollars(thousands)
2011 2012 2012
Financial instruments for which the fair value is considered difficult to determine
Non-listed equity securities and investments in non-consolidated subsidiaries and affiliates (book value \995 million ($12,107 thousand)) have no market price available and are considered to be financial instruments for which the fair market value is difficult to determine.Therefore, these instruments are not included in "Investment insecurities (Other securities)" in the table above.
2.

28Annual Report 2012
19. Comprehensive IncomeAmounts reclassified to net income (loss) in the current period that were recognized in other comprehensive income in the current or previous periods and tax effects for each component of other comprehensive income were as follows
Valuation difference on available-for-sale securities Increase(decrease) during the year Reclassification adjustments Sub-total, before tax Tax (expense) or benefit Sub-total, net of tax
Deferred gains or losses on hedges Increase(decrease) during the year Sub-total, net of tax
Share of other comprehensive income of associates accounted for using equity method Increase(decrease) during the year Reclassification adjustments Sub-total, net of tax
Total other comprehensive income
\ 79 - 79 (0) 79 (1,951) (1,951) (3) 3 -
(1,872)
$ 961 - 961 (0) 961 (23,737) (23,737)
(37) 37 -
(22,776)
Japanese yen(millions)
U.S. dollars(thousands)
2012 2012

29 Annual Report 2012
Indepnedent Auditors' ReportEXEDY CORPORATION AND CONSOLIDATED SUBSIDIARIES

Annual Report 20125 Annual Report 2012 30
Corporate Data
BOARD OF DIRECTORSAND CORPORATE AUDITORS OUTLINE OF COMPANY
As of March 31, 2012
48,594 thousand shares
8,400
6,494 shares
EXEDY Corporation
July 1, 1950
2,541
168,000 thousand shares
¥8,284 million
Name:
Established:
Paid-in Capital:
Number of Employees:
Number of Authorized Shares:
Number of Issued Shares:
Number of Shareholders:
Average number of sharesheld by one Shareholder:
Listed on First Sections,Tokyo/Osaka Stock Exchange
EXECUTIVE OFFICERSAs of June 30, 2012
Etsuji Terada Hidehito HisakawaHisayasu Masaoka Masayuki Matsuda
Shogo Okamura
Koji Akita Yoshio KatayamaMakoto Ichikawa Katsumi Shinto
Tadashi Nakahara Hiroshi ToyoharaMasahito Baba Mitsugu YamaguchiTetsuya Yoshinaga Keizo NishigakiKenji Matsuda Akira HiraiYoshihiro Yamamura Shinji FujimotoShigeo Tabata Yoshihiro Kojima
Senior Executive Managing Officer :
Executive Managing Officer :
Senior Executive Officer :
Executive Officer :
As of June 30, 2012
Haruo ShimizuEtsuji TeradaHidehito HisakawaHisayasu MasaokaMasayuki MatsudaTadashi NakaharaHiroshi ToyoharaKagenori FukumuraFumio FujimoriShigeru SugiyamaKanshiro ToyodaKoji OkadaTakenori Yamasaki
President and Chief Executive Officer :
Director :
Auditors :
DOMESTIC JAPANESE NETWORKHead Office Chubu Sales Office
EXEDY Hiroshima Co., Ltd.
EXEDY Logistics Co., Ltd.
EXEDY Trading Co., Ltd.
EXEDY Electric Facilities Co., Ltd.
Nippon Retarder System Co., Ltd.
Tokyo Sales Office
Saitama Sales Office
Shizuoka Sales Office
Hamamatsu Sales Office
1-1-1 Kidamotomiya, Neyagawa-shi, Osaka, 572-8570Tel: 81-72-824-6933 Fax: 81-72-821-7913
Tosho Bldg., 2nd Floor, 1-16-5 Mikawaanjo-cho, Anjo-shi, Aichi, 446-0056Tel: 81-566-71-2750 Fax: 81-566-72-7015
6-11 Taguchi Kenkyu Danchi, Higashi Hiroshima-shi, Hiroshima, 739-0038Tel: 81-82-425-3434/5 Fax: 81-82-425-3436
EXEDY Sun Co., Ltd.1-16-5 Kidamotomiya, Neyagawa-shi, Osaka, 572-0822Tel: 81-72-822-1147 Fax: 81-72-824-3871
1-30-1 Kidamotomiya, Neyagawa-shi, Osaka, 572-0822Tel: 81-72-822-1462 Fax: 81-72-822-1174
1-1-33 Kidamotomiya, Neyagawa-shi, Osaka, 572-0822Tel: 81-72-824-7633 Fax: 81-72-822-1016
6-17, Kamiki-cho, Moriguchi-shi, Osaka,570-0024Tel: 81-6-6997-3131 Fax: 81-6-6997-3150
1-1-33 Kidamotomiya, Neyagawa-shi, Osaka, 572-0822Tel: 81-72-820-0911 Fax: 81-72-824-1035
EXEDY Kyoto Co., Ltd.
EXEDY Precision Co., Ltd.
Hiroshima Sales Office
Ueno Division
Kawagoe Plant
DYNAX Corporation
EXEDY Casting Co., Ltd.
EXEDY Trading Bldg., Room202, 6-6 Sakaemachi, Kaita-cho, Aki-gun, Hiroshima, 736-0043 Tel: 81-82-821-0021 Fax: 81-82-823-6620
15 Kizuogawa, Kizugawa-shi, Kyoto, 619-0214Tel: 81-774-73-0631 Fax: 81-774-73-2147
104-1 Joden, Mimasaka-shi, Okayama, 701-2625Tel: 81-868-74-3501 Fax: 81-868-74-3503
2418 Ota-cho, Iga-shi, Mie, 518-0825Tel: 81-595-23-8101 Fax: 81-595-24-5521
1-103-25 Yoshinodai, Kawagoe-shi, Saitama, 350-0833Tel: 81-49-225-0601 Fax: 81-49-225-0600
1053-1 Kamiosatsu, Chitose-shi, Hokkaido, 066-8585Tel: 81-123-24-3247 Fax: 81-123-49-2050
112 Haishi, Fukuchiyama-shi, Kyoto, 620-0955Tel: 81-773-22-1156 Fax:81-773-23-8477
EXEDY Trading Bldg., 5th Floor, 2-17-2 Iwamoto-cho, Chiyoda-ku, Tokyo, 101-0032Tel: 81-3-3862-2771 Fax: 81-3-3864-1547
RICOH Solutions Higashi Shizuoka Bldg., 2nd Floor, 6-20 Aratajima-cho, Fuji-shi, Shizuoka, 417-0043Tel: 81-545-54-0861 Fax: 81-545-54-0862
CITY21 Bldg., 6th Floor, 320-4 Sunayama-cho, Naka-ku,Hamamatsu-shi, Shizuoka, 430-0926 Tel: 81-53-413-6011 Fax: 81-53-413-6012
Oomiyanakacho AK Bldg., 6th Floor, 1-104 Naka-cho, Oomiya-ku, Saitama-shi, Saitama, 330-0845 Tel: 81-48-650-4441/2 Fax: 81-48-650-4443< Utsunomiya Office >Data Service Utsunomiya Bldg. 5th Floor, 4-8-22 Motoimaizumi,Utsunomiya-shi, Tochigi, 321-0954Tel: 81-28-614-3620 Fax: 81-28-614-3680
OVERSEAS NETWORK
DYNAX America Corporation (DXA)
EXEDY New Zealand Ltd. (ENZ) EXEDY Guangzhou Co., Ltd. (EGC)
EXEDY Clutch Europe Ltd. (ECE)
EXEDY America Corporation (EAC)
EXEDY Globalparts Corporation (EGP)
EXEDY Holdings of America Corporation (EHA)
EXEDY-DYNAX America Corporation (EDA)
EXEDY Australia Pty. Ltd. (EAP)
568 East Park Drive, Roanoke, VA 24019, U.S.A.Tel: 1-540-966-6010 Fax: 1-540-966-6011
151 Wairau Road Glenfield Auckland, NEW ZEALANDTel: 64-9-444-0901 Fax: 64-9-444-0903
EXEDY DYNAX Mexico S.A. de C.V. (EDM)Av. Estados Unidos de America 114, Parque Industrial San Francisco,San Francisco de Los Romo, Aguascalientes C.P. 20300, MEXICOTel: 52-449-929-2104 Fax: 52-449-139-4904
Unit2, Rokeby Court, Manor Park, Runcorn, Cheshire, WA7 1RW, U.K.Tel: 44-1928-571850 Fax: 44-1928-571852< Moscow Representative Office >Room No. 657, Smolensky Passage, Smolenskaya sq. 3, 121099,Moscow, RUSSIATel: 7-495-937-8301 Fax: 7-495-937-8200
EXEDY DYNAX Europe Ltd. (EDE)2800 Tatabanya, Szarkalab UT6, HUNGARYTel: 36-34-311-117 Fax: 36-34-311-122
No.406 E-Area, Longfu Car Accessories Centre, Hengfu Road,Guangzhou, CHINATel: 86-20-83489166 Fax: 86-20-83489370
EXEDY (Malaysia) Sdn.Bhd. (EXM)
EXEDY Corporation Asean Regional Office (EAR)
EXEDY Friction Material Co., Ltd. (EFM)
EXEDY Thailand Co., Ltd. (EXT)
EXEDY Vietnam Co., Ltd. (EXV)
P.T. EXEDY Indonesia (EXI)
P.T. EXEDY Motorcycle Indonesia (EMI)
PT 16748, Jalan Permata 1/5, Arab-Malaysian Industrial Park71800 Nilai, Negeri Sembilan, MALAYSIATel: 60-6-7992988 Fax: 60-6-7996388
700/359 Moo 6, Bangna-Trad Road, Tumbon Don Hua Roh,Amphur Muang, Chonburi 20000, THAILANDTel: 66-38-743-923 Fax: 66-38-743-927
700/316 Moo 6, Bangna-Trad Road, Tumbon Don Hua Roh,Amphur Muang, Chonburi 20000, THAILANDTel: 66-38-214-423 Fax: 66-38-214-422
Khai Quang Industrial Zone, Vinh Yen City, Vinh Phuc Province,Socialist Republic of VIETNAMTel: 84-211-3721252 Fax: 84-211-3721253
EXEDY Chongqing Co., Ltd. (EXC)No.4 Longjing Road, North New Economic Development Zone,Chongqing, 401122, CHINATel: 86-23-62924439 Fax: 86-23-62900348
EXEDY (Shanghai) Co., Ltd. (ESC)1399 Chengqiao Road, Fengxian District, Shanghai, 201400, CHINATel: 86-21-67109075 Fax: 86-21-37565209
Jl. Permata V Lot EE 3 Kawasan Industri KIIC Karawang 41361Jawa Barat, INDONESIATel: 62-21-89114666 Fax: 62-21-89114568
Jl. Permata V Lot EE 3 Kawasan Industri KIIC Karawang 41361Jawa Barat, INDONESIATel: 62-21-89114573 Fax: 62-21-89114574
2121 Holston Bend Drive, Mascot, TN 37806, U.S.A.Tel: 1-865-932-3700 Fax: 1-865-932-2230
8601 Haggerty Road South, Belleville, MI 48111, U.S.A.Tel: 1-734-397-3333 Fax: 1-734-397-7300
8601 Haggerty Road South, Belleville, MI 48111, U.S.A.Tel: 1-734-397-3333 Fax: 1-734-397-9567
8601 Haggerty Road South, Belleville, MI 48111, U.S.A.Tel: 1-734-397-6556 Fax: 1-734-397-6566
21 Fiveways Boulevard, Keysborough,Victoria 3173, AUSTRALIATel: 61-3-9701-5556 Fax: 61-3-9701-5684
DYNAX Industry (Shanghai) Co., Ltd. (DXS)
Shanghai DYNAX Corporation (DXC)
EXEDY India Ltd. (EIL)
EXEDY Middle East FZCO (EME)
No.350 Rongxiang Road, Songjiang Export Processing Zone, Shanghai 201613,CHINATel: 86-21-57748388 Fax: 86-21-57748389
No.2 plant 1399 Chengqiao Road, Fengxian District, Shanghai,201400, CHINATel: 86-21-57437465 Fax: 86-21-57437458
EXEDY Clutch India Private Limited (ECI)No60/1, Ground Floor Miyajima House Residency Road 2nd Cross,Bangalore-560025 Karnataka, INDIATel: 91-80-4173-9891 Fax: 91-80-4173-9891
< Aurangabad Plant >Plot No.L-4, M.I.D.C. Industrial Area, Chikalthana, Aurangabad431 210, Maharashtra, not M.H.INDIATel: 91-240-2484014 Fax: 91-240-2484403< Greater Noida Plant >Plot No.9, Udyog Kendra Industrial Area, Greater Noida, 201 304,U.P., INDIATel: 91-750-3131000 Fax: 91-120-2397086
P.O.BOX 18199, Warehouse No. ZE5 & ZE6 Jebel Ali FreeZone, Jebel Ali Dubai, U.A.E.Tel: 971-4-883-2244 Fax: 971-4-883-2500< Amman Representative Office >Room No.103, 1st Floor, AI Housanie Bldg. #6 Salem Moh'd AI-Ekdhah Street Sweifieh, Wadi AI-Saier, Amman, JORDANTel: 962-658-13215 Fax: 962-658-13015< Nairobi Representative Office >International House, 1st Floor, Room No.12, Mama Ngina Street, P.O. Box 41931-00100, Nairobi, KENYATel: 254-20-221-1214 Fax: 254-20-221-5700< Riyadh Representative Office >Room #1 AI Edressi Bldg, Price Fahed Bin Ibrahim St. In front of AL-Majal Centre, Riyadh, Kingdom SAUDI ARABIATel: 966-121-48431 Fax: 966-121-48728

1-1-1, Kidamotomiya, Neyagawa-shi, Osaka, 572-8570, JapanTel: 81-72-824-6933 Fax: 81-72-821-7913URL http://www.exedy.com
Mission Statement
The Shape of Our Future: “Creation of Fulfillment”
Each employee, with a good conscience and hope for the future,will create fulfillment for our society.
Through advanced technology and scrupulous attention to detail,we will create fulfillment for our customers.
With pride and a desire to grow, we will create fulfillmentfor the EXEDY family.
2012.7.1,000. 361 ○ Printed in JapanH
Year Ended March 31, 2012