Annual report 2012 - Pak Brunei
80
PAK BRUNEI INVESTMENT COMPANY Annual report 2012 Design: Creative Unit
-
Upload
khangminh22 -
Category
Documents
-
view
4 -
download
0
Transcript of Annual report 2012 - Pak Brunei

PAK BRUNEI INVESTMENT COMPANY
Annua l report 2012
De
sig
n: C
rea
tive
Un
it

PAK BRUNEIINVESTMENT
COMPANYAnnual report 2012

Ann
ual R
epor
t 201
2Pa
k Br
unei
Inve
stm
ent C
ompa
ny L
td.
3
04 Corporate Information
16 Code of Ethics and Business Practices
20 Management Profiles
24 Chairman’s Review
26 Directors’ Report
32 6 Years Performance at a Glance
33 Review Report to the members on Statement of Compliance with Best Practices of Code of Corporate Governance
34 Statement of Compliance with the Code of Corporate Governance
36 Statement of Internal Control
Unconsolidated Financial Statements
37 Auditors’ Report to the Members
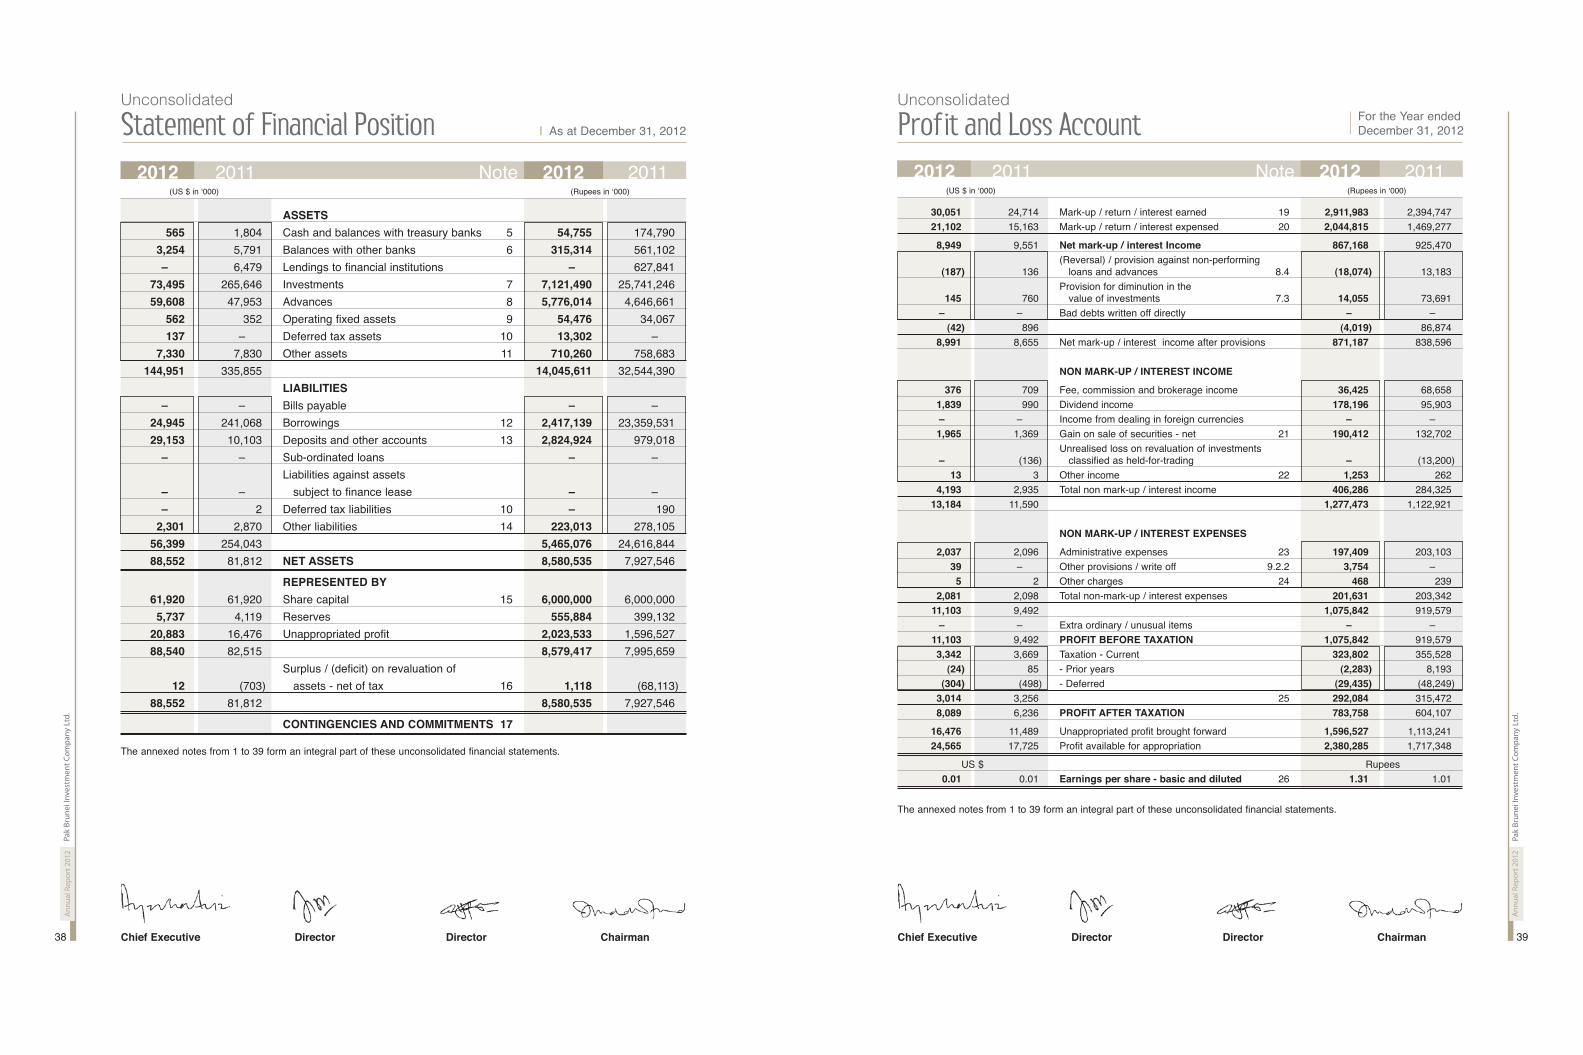
38 Statement of Financial Position
39 Profit and Loss Account
40 Statement of Comprehensive Income
41 Cashflow Statement
42 Statement of Changes in Equity
43 Notes to the Financial Statements
Contents

54
Board of DirectorsMr. Khairuddin Abdul Hamid Chairman
Mr. Mohammad Younus Dagha Director
Mr. Junaidi bin Haji Masri Director
Ms. Ayesha Aziz Managing Director
Audit CommitteeMr. Khairuddin Abdul Hamid Chairman
Mr. Mohammad Younus Dagha Member
Mr. Junaidi bin Haji Masri Member
Human Resource CommitteeMr. Junaidi bin Haji Masri Chairman
Mr. Mohammad Younus Dagha Member
Ms. Ayesha Aziz Member
Company SecretaryMr. Abdul Hafeez
Statutory AuditorsErnst & Young Ford Rhodes Sidat Hyder Chartered Accountants
Tax ConsultantM. Yousuf Adil Saleem & Company (A member firm of Deloitte Touche Tohmatsu Ltd.)
Chartered Accountants
Legal AdvisorLiaquat Merchant & Associates Advocate and Corporate Legal Consultants
Registered Head OfficeHorizon Vista, Commercial 10,
Scheme No. 5, Block-4, Clifton, Karachi.
Tel: (+92-21) 35361215-19, (+92-21) 35839917
Fax: +9221-35361213
Websitewww.pakbrunei.com.pk
CorporateInformation

Ann
ual R
epor
t 201
2Pa
k Br
unei
Inve
stm
ent C
ompa
ny L
td.
6
v i s ionPak Brunei will play a role in the
economic progress and development
of Pakistan by providing an entire
range of advisory services as well as
financial support to viable projects in
high growth sectors of the economy.
mis
sion
Pak Brunei aims to be at the
vanguard of innovation in
Merchant Banking, offering the
best solutions to our clients,
value to our shareholders and a
challenging, equal-opportunity
environment to our employers.
core values Team work
Have shared goalsand objectives
Customer FocusUnderstand our customers’
needs and try to exceedexpectations
IntegrityBe honest, professional andfair in all our dealings with
all our stakeholders
PerformanceBe result oriented and
establish a competitiveenvironment
InnovationLook beyond
conventional wisdom
Ann
ual R
epor
t 201
2Pa
k Br
unei
Inve
stm
ent C
ompa
ny L
td.
7
Ann
ual R
epor
t 201
2Pa
k Br
unei
Inve
stm
ent C
ompa
ny L
td.
9
Ann
ual R
epor
t 201
2Pa
k Br
unei
Inve
stm
ent C
ompa
ny L
td.
8
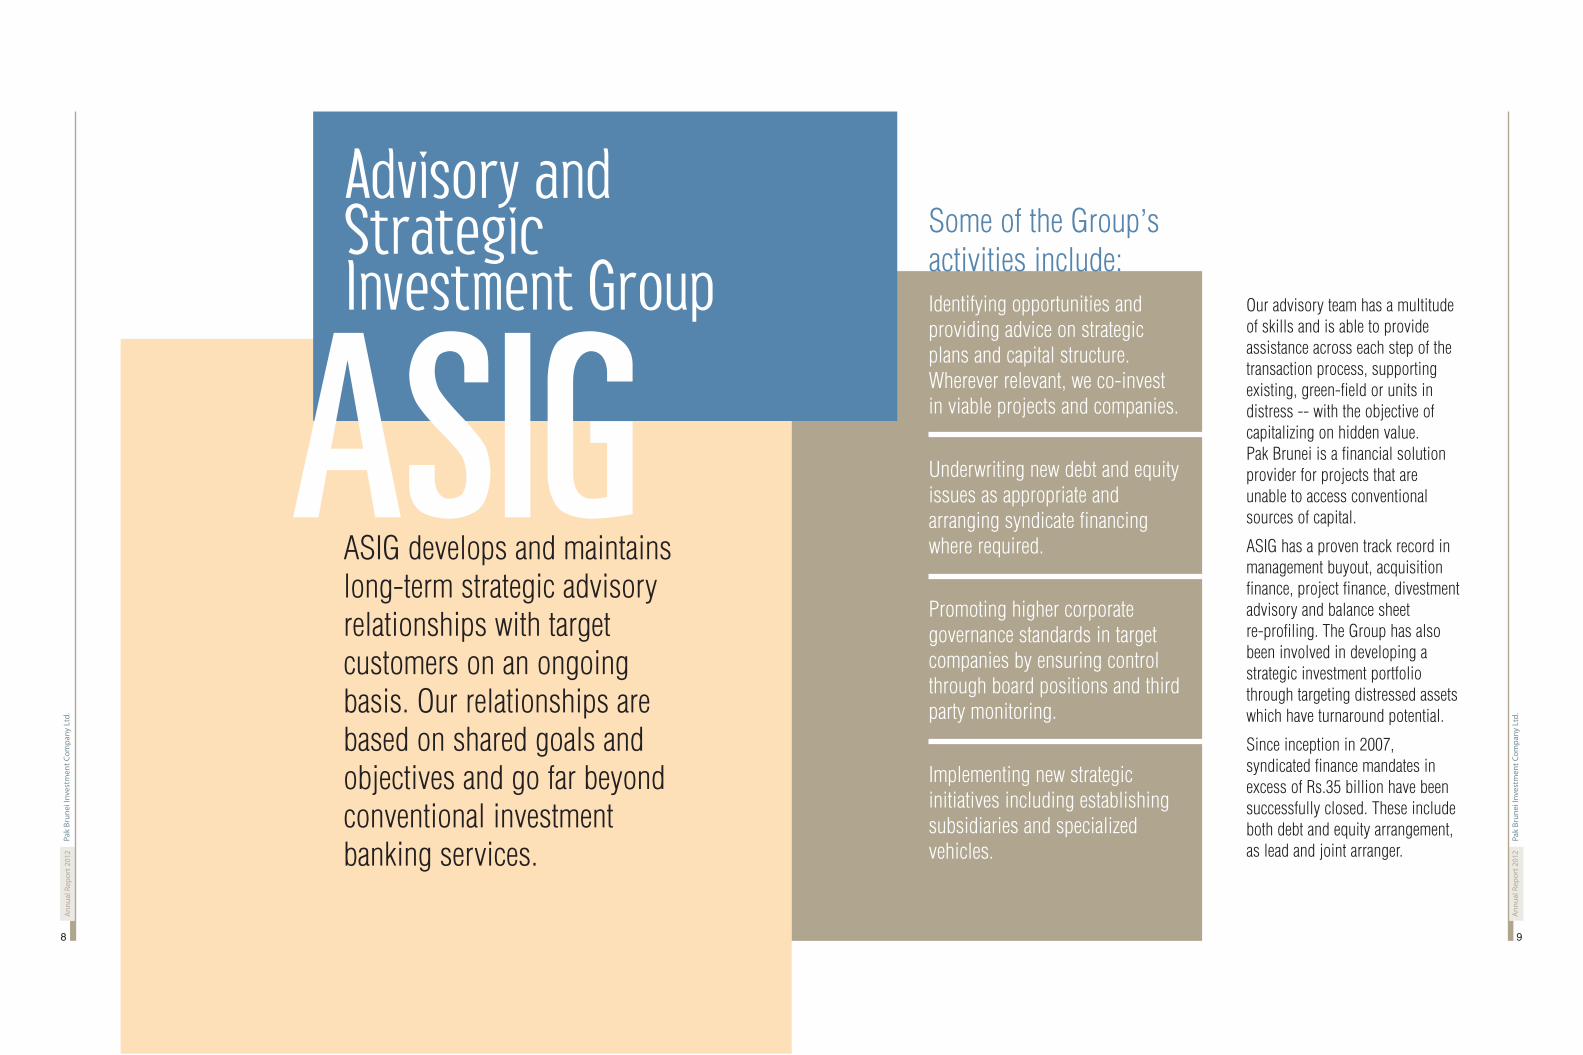
Advisory andStrategicInvestment Group
Some of the Group’s
activities include:
Identifying opportunities andproviding advice on strategicplans and capital structure.Wherever relevant, we co-investin viable projects and companies.
Underwriting new debt and equityissues as appropriate andarranging syndicate financingwhere required.
Promoting higher corporategovernance standards in targetcompanies by ensuring controlthrough board positions and thirdparty monitoring.
Implementing new strategicinitiatives including establishingsubsidiaries and specializedvehicles.
Our advisory team has a multitude
of skills and is able to provide
assistance across each step of the
transaction process, supporting
existing, green-field or units in
distress -- with the objective of
capitalizing on hidden value.
Pak Brunei is a financial solution
provider for projects that are
unable to access conventional
sources of capital.
ASIG has a proven track record in
management buyout, acquisition
finance, project finance, divestment
advisory and balance sheet
re-profiling. The Group has also
been involved in developing a
strategic investment portfolio
through targeting distressed assets
which have turnaround potential.
Since inception in 2007,
syndicated finance mandates in
excess of Rs.35 billion have been
successfully closed. These include
both debt and equity arrangement,
as lead and joint arranger.
ASIG develops and maintainslong-term strategic advisoryrelationships with targetcustomers on an ongoingbasis. Our relationships arebased on shared goals andobjectives and go far beyondconventional investmentbanking services.
ASIG

Ann
ual R
epor
t 201
2Pa
k Br
unei
Inve
stm
ent C
ompa
ny L
td.
11
Ann
ual R
epor
t 201
2Pa
k Br
unei
Inve
stm
ent C
ompa
ny L
td.
10
Funding projects inpreferred sectors byproviding short and medium term financing.
Building a high-quality long-term advances portfolioincluding loans, leases andmarketable debt instrumentsto meet the requirements oftarget companies.
CSG follows a more cautious approach inbuilding advances portfolio and alsomaximizes use of LTFF-EOP line from SBP forlong-term financing to export-oriented projects.Some of the Group's activities include:
In 2012, new corporate clients in
pharmaceutical, steel, textile, energy,
sugar, food and engineering sectors were
added to our growing portfolio. The SME
division was added to the corporate
banking group in 2012. Started to fill the
void left by a shrinking leasing industry,
the objective is to become a market
leader in this segment. SME exposures
already booked are in packaging,
entertainment and transportation sectors.
Projects in the pipeline include stone
crushing, marble export, medical care
and cotton ginning units.
Corporateand SME Group
CSG offers a range ofproducts and services tomeet the demands of ourCorporate and SMEcustomers through longand short-term financefacilities, lease financing,SBLC and repaymentguarantees.
CSG

Key activities include:
Developing debt market throughinvestment, distribution andmarket making for corporate bond / sukuk and commercialpaper issues.
Sourcing short and medium termfunds to fulfill internal liquidityrequirements.
Supporting ASIG transactions.
Managing liquidity and durationthrough sale / securitization ofmarketable debt instruments.
Treasury safeguards ourbalance sheet fromadverse interest ratemovements in addition togenerating high returns bycapitalizing on interestrate volatility.
The Company is thedesignated market markerfor specific TFC issues,and also marketsinstruments structured by ASIG. In addition,Treasury generates activityin assets available at deepdiscounts or defaultcategory bonds that haverevival / upside potential.
Treasury trades in fixed income securities and is responsible formaintaining optimal levels of liquidity. Strong distribution abilitieshelp to sell down credit exposures to manage risk.
Our corporate trading desk is fully involved in developing debtcapital markets. The Group invests in government and corporatedebt instruments and makes use of arbitrage opportunities to turnour investment positions into meaningful gains.
Treasury Group
Key activities include:
Managing long-term equityinvestment portfolio to earn high-risk adjusted dividend and capital gains.
Identifying and timing the marketto generate maximum returns.
Supporting ASIG transactions in capital markets.
CMG's investmentexposure remains wellcontrolled with anemphasis on dividendyielding stocks. Theportfolio is also diversifiedacross sectors. Constantmonitoring ensures risksare identified andhighlighted. With a highlyqualified team and a tilttowards technical tradingstrategies, reliance onoutside sources ofinformation is minimal.
CMG follows a disciplined approach in trading/investment in equitymarkets within conservative portfolio limits; the Group has regularlyoutperformed benchmark returns while maintaining exposure to alimited universe of securities. The objective is to preserve capital,while earning adequate risk adjusted returns.
Capital Markets Group (CMG)

Ann
ual R
epor
t 201
2Pa
k Br
unei
Inve
stm
ent C
ompa
ny L
td.
14
A Professional Well-Balanced TeamPak Brunei has a highly
qualified team of
professionals from foreign
and local banks, rating
agencies, regulatory bodies,
audit firms and brokerage
houses. Our team consists of
experienced and motivated
professionals including
MBAs, CAs, CFAs, FRMs,
and civil and mechanical
engineers. To ensure
employee retention,
engagement and satisfaction,
the Company boasts of a
performance oriented, merit
based environment. To help
employees achieve their
career aspirations,
appropriate training
opportunities are provided in
each area and supervisors
are rated on the training
hours their team members
utilized during the year.
The cultural framework of any organization defines a company's vision and the guidelines it has established to achieve that vision.Our organizational culture is apparent through a number of indicators:
Trustee / Agency departmentimproves vigilance overtransactions that have achievedfinancial close. Thereafter, alltransactions originated by ASIG are taken over by this department.This ensures that PBIC remainsfully involved in monitoringoperational and financialperformance of the borrowerwhether it is for the Company’s
own exposure or on behalf of allfinancers in syndicatedtransactions.
All covenants, particularly cashcollection mechanisms, arediligently monitored. This ensuresthat problems are identified andresolved. Over a very shortperiod, the department has beenassigned new mandates by otherfinancial institutions due to itsprofessional and transparentservice delivery.
Strong Control EnvironmentPACRA and JCR VIS, our external ratingagencies, have rated Pak Brunei higher thanpeer group companies that beganoperations at the same time. The Companyattained this position due to its strongsystems and controls; Risk, Compliance,Audit and IT, together with the strength ofour management team.
Equal Opportunity EnvironmentPak Brunei Investment Company is anequal opportunity organization andwelcomes people from all backgroundsirrespective of class, gender and ethnicity.The Company prides itself on the culturaldiversity and gender mix of its workforce.In an environment that encourages healthycompetition and fair practices above allother considerations, the Company hasconsistently surpassed qualitative as wellas quantitative performance targets sincecommencement of operations in 2007.
Our Cultural FrameworkTrustee /Agency Services

Ann
ual R
epor
t 201
2Pa
k Br
unei
Inve
stm
ent C
ompa
ny L
td.
17
Code of Ethicsand BusinessPractices
Pak Brunei seeks to maintain high standards of service andethics enabling it to be perceived as impartial, ethical andindependent. In addition to the general guidelines, the followingare the salient features of the Company’s code of ethics and
business practices.
Integrity Employees shall:
Perform our work with honestly, diligence andresponsibility;
Not knowingly be a party to any illegal activity or engagein any acts that are discreditable to the Company;
Not participate in any activity or relationship that mayimpair or be presumed to impair our unbiasedassessment. This participation includes thoseactivities or relationships that may be in conflict withthe Interests of the Company;
Not accept any gift or consideration that may impair orbe presumed to impair our professional judgment;
Exercise maximum caution in making sure thatinformation given to customers is free of errors,making it as truthful and honest as can be.
Objectivity Employees shall:
Ensure that alloperational activitiesand decision makingprocesses focus onachievements of theCompany’sobjectives and are inline with the missionstatement of theCompany;
Disclose all materialfacts known to us ifnot disclosed, maydistort the reportingof business proposalunder review.
Recording and Reporting ofthe Company Employees shall:
Ensure that all business relatedinformation/transaction arerecorded and reported accurately,honestly and in a timely manner.Accuracy of all Company recordsextends to financial statement, loandocuments, regulatory bodies andother government agencies;
Ensure that no funds or accountsshould be established for a purposethat is not fully reflected in the booksand records of Pak Brunei whetherpertaining to receipts ordisbursements.
Compliance with Laws,Rules and Regulations Employees shall:
Comply with all applicable laws,rules and regulations.
Protectoin and Proper use ofCompany Assets Employees shall:
Ensure that all the Company’sassets are used for authorized andlegitimate business purposes;
Protect the Company’s assets e.g.,computer equipment and software,intellectual property, etc., and ensurethat those assets are efficiently andproperly used in respect of allCompany related activities.
Unfair Business Practices Employees shall:
Refrain from unfair and deceptive businesspractices e.g., unauthorized and counterproductiveuse of the Company’s resources, the misuse ofproprietary information or the misrepresentationand concealment of material facts.
Insider Trading Employees shall:
Prohibit from disclosing “Inside Information” toothers or use for our own benefits;
Abide by the “Insider trading” laws that prohibit frombuying and selling stock with advance knowledge ofimportant Company information that is unavailableto the general public. Such Information may includeproposed mergers or acquisitions, new equity ordebt offering.
Confidential and Proprietary Information Employees shall:
Protect against the disclosure of sensitive and confidentialinformation about our customers and employees unlessdisclosure is authorized and within law;
Safeguard against the disclosure of sensitive andconfidential information about our fellow employee andthe Company as a whole unless authorized to do so.
Improper Influence Employees shall:
Strictly prohibit from giving, soliciting or acceptingbusiness courtesies or gifts intended to influencebusiness decision;
Make all business decisions on the merit of thetransaction and in compliance with any legal andregulatory requirements.

Ann
ual R
epor
t 201
2Pa
k Br
unei
Inve
stm
ent C
ompa
ny L
td.
19
Pak Brunei's objective is to be aleading commercial entity with ahigh-risk absorption capacity,offering innovative financialsolutions. We specialize in projectand structured finance, corporatefinance and advisory services,strategic investments, trustservices, capital marketoperations and fixed incometrading, as well as distributionactivities. We aspire to facilitatechange in the economic andfinancial landscape of the country,particularly in segments withlimited access to capital.
Through the years, theCompany has been successfulin establishing its credentialsand developing a reputation forbeing a one-stop solutionprovider, particularly forprojects in or near distress.
In addition to conventionalfinancing, particularly forprojects that are export-oriented or result in importsubstitution, Pak Brunei hassuccessfully structured andfinanced transactions involvingrevival of sick units, managingbuy-outs and financing green-field projects.
In 2011, Pak Brunei establishedits wholly-owned assetmanagement subsidiary,Primus InvestmentManagement Limited. In linewith our long-termdevelopment goals, we set up aseparate department for SMEfinancing in 2012. We also planon establishing specializedvehicles for private equity andventure capital.
Beginn ingFormed in collaboration betweenGovernment of Pakistan and theBrunei Investment Agency, PakBrunei Investment Company startedoperations in August 2007. TheCompany is a vibrant, market-oriented institution serving a varietyof industrial sectors through a widerange of services.
The

Ann
ual R
epor
t 201
2Pa
k Br
unei
Inve
stm
ent C
ompa
ny L
td.
21
Khairuddin bin Abd HamidMr. Khairuddin bin Abd Hamid, the acting Managing
Director of Brunei Investment Agency, is the
Chairman of the Board of Directors of Pak Brunei
Investment Company.
Mr Khairuddin has served as head of department /
deputy general manager for the Agency External
Fund Management, and as the investment officer
for BIA UK operations.
Mr. Hamid gained his BA (Hons) in management
studies from the University Brunei Darussalam and a
diploma in social sciences from the University of
Canterbury (UK). He has also taken part in advance
management programmes at the Henley Business
School, University of Reading (UK).
Management Profiles
Mohammad Younus DaghaMohammad Younus Dagha, member of the Board of
Directors at Pak Brunei Investment Company, is the
Additional Secretary External Finance, Ministry of
Finance. Prior to that, Mr. Dagha was a Special
Assistant to the Finance Minister, Government of
Pakistan. His areas of expertise involve finance,
investment, mining, energy and media management.
Mr. Dagha has also served as Secretary, Coal and
Energy and Managing Director at the Thar Coal and
Energy Board. His earlier roles, amongst others,
involved working as Secretary, Sindh Board of
Investment, Secretary Information, Project Director at
the National Programme for Improvement of
Watercourses, Director General at the Environmental
Protection Agency and Deputy Commissioner in
various districts in the country.
Mr. Dagha acquired his Masters degree in
Economics and a Bachelors of Law from the
University of Karachi. He also completed his MBA
from the Institute of Business Administration in
Karachi, and was doing his ACMA in the Institute of
Cost and Management Accountants in Pakistan,
before joining the Civil Services.
Junaidi bin Haji MasriJunaidi bin Haji Masri serves as a director of the Pak
Brunei Investment Company. Mr. Masri joined the
Brunei Investment Agency in 1991. As senior
assistant managing director, he heads the alternative
investments -- managing the agency’s investments
across several countries.
He has a thorough understanding of international
markets and asset classes. Serving on the board of
directors of a number of companies, both in and
outside Brunei Darussalam, Mr. Masri brings an
international perspective to the company. Mr. Marsi
holds a B.Sc degree in computer and management
sciences from Keele University (UK).
Ayesha AzizMs. Aziz was responsible for setting up Pak Brunei
Investment Company and succeeded in positioning
it at the forefront amongst its
larger and more established peers, in terms of size
and profitability.
Ms. Aziz has rich and diverse experience in
investment banking including project finance, asset
management, corporate finance advisory and
treasury operations. She was associated with the
ANZ Banking Group for over ten years where,
amongst other assignments, she worked on the
Financial Engineering desk in ANZ London.
Subsequently, Ms. Aziz was involved in establishing
and managing business operations and subsidiaries
of Pak Oman Investment Company, including a
microfinance bank and an asset management
company, where she acted as a member on the
board and CEO, respectively. She was also
responsible for developing a regional investor base
comprising private and public sector institutions,
successfully raising equity for telecom, energy and
financial sector transactions in Pakistan.
Ms. Aziz has an MBA degree from the Institute
of Business Administration and is a
CFA Charter holder.

Timeline of Cale ndar of EventsCompanystartedoperations inSeptember2007
Platform forturnaroundfinancingestablished
20082007
1st subsidiaryPrimus InvestmentManagementLimited (Primus)commencesoperations
2011
Primus launchesits first fund
Platform forSME financinglaunched
20122009Successful closure oftransactions involving revivalof sick units, ManagementBuyout and green-fieldproject finance total volumePKR 4 bln
Turnover on Fixed incomeTreasury book exceedingPKR 127.0 bln. One of themost active marketparticipant in corporate bond market.
Hybrid debt and equitydeals completedincluding equity linkeddebt structures andpreference issues.
Private Equity arrangedfor companies in stressincluding an autovendor and a poultryfeed mill amongstothers.
Even
tsM
ilest
ones
Achi
eved
Key
Fina
ncia
lIn
dica
tors
Systems & controlsstrengthened
ASIG arrangesfinancing of PKR 10.5 bln
Treasury turnover infixed income reachesPKR 13.2 bln
Credit rating remainshigher than peers
First BusinessPlan approved
Core teaminducted
OperationalPlatformestablished
Team recruitmentcompleted
ASIG, Treasury,CBG and CMG turnin excellent firstyear performance
Mandatedtransactionsamounting to ~PKR 9.0 blncompleted
4.49% 5.28% 7.72% 8.52% 7.91% 9.50%ROE
0.75 0.52 0.89 0.98 1.01 1.31EPS (PKR)
PBT (PKR ’000)
186,541 373,465 667,174 881,658 919,579 1,075,842
2010Platform for turnaroundfinancing strengthened.Revival projects taken on
Risk sold down throughactive distribution desktotal fixed income turnoverexceeding PKR 29.0 bln
Window for default ratedbonds opened
Credit rating remainshigher than peers

Ann
ual R
epor
t 201
2Pa
k Br
unei
Inve
stm
ent C
ompa
ny L
td.
25
Ann
ual R
epor
t 201
2Pa
k Br
unei
Inve
stm
ent C
ompa
ny L
td.
24
Chairman’sReview
Despite some positive developments, 2012remained a challenging year for Pakistan’seconomy. Pak Brunei remained pro-activein managing its credit portfolio, sellingdown exposures where appropriate tomake full use of market arbitrages. Despitea strategy that leans towards higher risktaking through revival financing of distressunits, the Company maintained its recordof the highest recovery ratios, whilerecording a significant increase inprofitability.
There were some set backs towards theend of the year relating to constitution of theBoard of Directors. The issue waseventually resolved, and while there was aslowdown in business activity in the last twomonths of the year, strong momentumhelped the Company surpass its annualtargets with a comfortable margin. Duringthis year, the Company broadened itscorporate domain through its wholly ownedsubsidiary, Primus Investment ManagementLimited. Two open-end funds weresuccessfully launched in 2012 by Primuswhile other innovative investment solutionsare also planned to reach out to a broaderinvestor base and complement the productoffering of its parent. Another milestoneachieved by Pak Brunei in 2012 wasestablishment of its SME financing division.This carefully planned initiative will help usreach out to a fund-starved sector of theeconomy, as part of the Company’scommitment towards uplifting Pakistan’sdevelopment profile.
On the economic front, Pakistan’s fiscalposition remained under stress due to lackof resource mobilization. In addition, tax toGDP ratio remains weak and a significantportion of the economy is still un-documented. Growing expenditurerequirements forced the government toresort to increased borrowing resulting infragile fiscal-monetary coordination.Pakistan posted an alarming deficit to GDPratio of 8.5% compared to 6.6% in theprevious fiscal year, whereas public
I am pleased to present Pak Brunei
Investment Company’s results for 2012 that
reflect our focus on sustainable corporate
growth. The Company’s strong performance
record, since inception in 2007, is the result
of a culture that promotes innovation,
decision making and risk ownership. Equal
importance is placed on accurate
measurement of risk and regulatory
compliance to ensure that financial
performance is supported by strong controls.
The Company enjoys a leadership position
amongst its larger and older peers and has a
clear road map for future positioning.
investment to GDP ratio remained at 3% in both successive yearsindicating inadequate financing for infrastructure development inthe country.
The external sector is another area that continues to facechallenges. Pakistan’s current account balance posted a surplus of0.1% of GDP in FY11, turning into a deficit of 2.0% in FY12. Thetrade gap is continuously widening and stood close to 7% of GDPin FY12 compared to 5% in FY11. This led to 4% depreciation inexchange rates between the years under review, and 30% year-on-year decline in SBP’s holding of foreign exchange reserves.Such a situation may eventually result in greater reliance oninternational funding, with a high probability that Pakistan will resortto another IMF Standby Arrangement (SBA) program in 2013.
As regards energy shortages, long term corrective measuresremain elusive. Structural reforms are needed to end thecontinuing menace of circular debt that threatens the entiresystem.
On a more positive note, headline inflation declined from 13.7% inFY11 to 11% in FY12 and justified the decrease of 200 bps inpolicy rate during the year. For the first eight months of FY13,average inflation clocked in at 8% but remains vulnerable due tothe dependence on raw material and food imports.
Another positive development relates to performance of capitalmarkets. The uptick in KSE-100 index that began in January2012carried the market up to 16,905 points, posting 49% return in2012. Unlike 2008, absence of leveraged buying in the marketalso helped reduce downside risk.
Overriding all other factors, law and order situation in the countryremains a serious concern and it is hoped a coherent strategy willbe implemented to counter this threat.
We realize that maintaining momentum will be challenging,particularly as the Company remained inactive till resolution ofshareholder issues in 2013. Nevertheless, we remain confidentthat its core strengths will help the Company achieve many newmilestones. The Company’s entry into asset management andSME / leasing should enhance its footprint in chosen markets.Future objectives include strengthening our role in the area ofrevival financing, where returns are also commensurate withhigher risk.
We remain committed to Pakistan’s long-term development. PakBrunei’s dynamic team is well positioned to meet that objectivewhile identifying and making use of the many opportunitiesavailable in the market.
Khairuddin binAbd HamidChairman
Khairuddin bin Abd HamidChairman May 9, 2013

Ann
ual R
epor
t 201
2Pa
k Br
unei
Inve
stm
ent C
ompa
ny L
td.
27
Ann
ual R
epor
t 201
2Pa
k Br
unei
Inve
stm
ent C
ompa
ny L
td.
26
Income MixFigures in PKR million
Cumulative income given above each bar
Selected Financial Indicators2007* 2008 2009 2010 2011 2012
Total Assets PKR million 4,362 5,529 12,131 14,369 32,544 14,046
Net Assets PKR million 3,136 5,281 6,306 7,343 7,928 8,581
Mark up income PKR million 178 672 971 1,698 2,395 2,912
Non mark up income PKR million 67 86 254 212 284 406
Profit before tax PKR million 187 373 667 882 920 1,076
Profit after tax PKR million 141 222 447 581 604 784
Earning per share PKR 0.75 0.52 0.89 0.98 1.01 1.31
Return on assets - 3.2% 4.5% 5.1% 4.4% 2.6% 3.4%
Return on equity - 4.5% 5.3% 7.7% 8.5% 7.9% 9.5%
* four months of operations
Financial Highlights2012 2011
PKR in '000 PKR in '000
Net Markup Income 871,187 838,596
Non-markup income 406,286 284,325
Fee, Commission and Brokerage Income 36,425 68,658
Dividend Income 178,196 95,903
Capital Gains 190,412 132,702
Other Income/unrealized loss 1,253 (12,938)
Profit before Taxation 1,075,842 919,579
Profit after Taxation 783,758 604,107
EPS 1.31 1.01
The primary focus in 2012 remained build-up of core credit portfolio inselected sectors and niches. Considering our basic objectives, weincreasingly serve customers who are close to financial distress andprovide advice along with financing to revive / expand operations. Itwas a source of great satisfaction to see customers inch closer to theirtrue potential as was the fact that repayment history in this nicheremained excellent. The model fits well with our higher risk appetiteand strong structuring ability. Moreover, appropriate risk pricingcontinued to keep our spreads healthy.
During the year, we were able to time the market well and ouropportunistic entry and exit from money markets provided us windfallgains. The trading and distribution desk has always been of keyimportance to the Company as it helps to generate additional bufferfor external shocks. As in the past, the lion’s share in total capitalgains booked by the Company originated from our fixed incomeportfolio where we also remained an active market maker forcorporate debt instruments. We closed the year with a 43% increasein non-markup income that eventually translated into a 30% increasein Pak Brunei’s after tax profits.
n Gross Mark-upIncome
n Capital Gain-Fixed Income
n Unrealizedgain/(loss) onsecurities
n Fee, commission& Brokerage
n Dividend income
n Capital Gains-Equity
n Other Income
757
245
1,225
1,910
2,679
3,318
Ayesha AzizManaging Director
CY11 CY12CY10CY09CY084MCY07
Directors’Report
On behalf of the Board ofDirectors, I am pleased topresent the audited financialresults of Pak BruneiInvestment CompanyLimited for the year endedDecember 31, 2012.
Entering its sixth year of operations, Pak Brunei has acquired a hardwon reputation for being one of the most dynamic investmentbanking institutions in the country. Our success markers includesustained profitability, quality asset-holdings, vigorous risk controlsand a highly qualified team of professionals. Under the guidance ofthe Board of Directors, the institution has achieved yet another yearof strong performance from core activities.
n Credit Portfolio*
n Tbills
n PIBs
n Others**
n Lending to FIs
* Inculding Advances and Corporate Debt Instruments
** Inculding Investment in Shares, Mutual Funds andBalances with Other Banks
5,4813,948
12,12714,093
31,851
13,224
Asset MixFigures in PKR million
Cumulative base given above each bar
4MCY07 CY08 CY09 CY10 CY11 CY12

Ann
ual R
epor
t 201
2Pa
k Br
unei
Inve
stm
ent C
ompa
ny L
td.
29
Ann
ual R
epor
t 201
2Pa
k Br
unei
Inve
stm
ent C
ompa
ny L
td.
28 n CBG Porfolio (RHS) n CBG Income (LHS)
ADVISORY AND STRATEGIC INVESTMENTS GROUP (ASIG)ASIG’s corporate philosophy is geared towards picking high risk-reward transactions that also have a development aspect. The roleinvolves unlocking value in cases that are suffering from financial oradministrative distress and requires going beyond conventionalinvestment banking. The aim is to be a financial solution provider,particularly for companies that are relatively smaller in size and lackaccess to specialized skills. Spread across different sectors, ASIG hasmultiple turnaround stories to its credit that have involved capitalinjection, strategic advice as well as streamlining governancestructure. This has helped us diversify our exposure beyond traditionaland overleveraged sectors and we have almost completely missed thebus of large syndicated corporate loan defaults that hit the bankingsector in 2012.
CORPORATE & SME GROUP (CSG)CSG continued its practice of cautiously building its core asset portfolioof high-quality advances. These defensive assets provide an ultimatehedge against risk assets booked through ASIG.
Over the course of the year, we strengthened existing relationshipsthat include a large range of companies encompassing a wide riskprofile. In 2012, lease financing to the SME sector was also added tothe Group’s product offering and we hope this will be a major catalystfor future growth.
Pak Brunei is also a Participating Financing Institution (PFI) forfinancing export-oriented projects under the SBP scheme.
TREASURY AND FUND MANAGEMENTPak Brunei places a high priority on balance sheet management.During the year, Treasury played a pivotal role in liquidity managementand helped us accumulate attractive investment returns throughaccurate forecasting and trading decisions. Treasury also worked hardto extend the tenor of borrowed funds, successfully narrowing asset-liability gaps. We remained active participants in debt and moneymarkets, with cumulative trading turnover in fixed income instrumentsexceeding PKR 115 billion over the past two years. Another key area iscorporate deposit mobilization, which also registered a significantincrease during the year. We are confident that if approved by the StateBank, Pak Brunei can play an active and positive role as a PrimaryDealer and plan to apply for the same in 2013.
CAPITAL MARKETS GROUP (CMG)2012 was a highly profitable year for equity markets. After decliningby 5.6% on year-on-year basis in 2011, KSE-100 index witnessed areturn of 49% in 2012. Even in USD terms, KSE-100 (up 37%)outperformed most regional and global markets.
Our primary objective has never been to outperform the broadermarket index. CMG’s investment strategy revolves around capitalpreservation, while making adequate risk adjusted returns on
Transactions ofAdvisory & StrategicInvestments GroupSince inception (PKR 34.9 billion)
CBG Portolio & IncomeFigures in PKR million
Corporate Banking GroupPortfolio As on Dec, 31, 2012
investment. Our universe of shares is tightly monitored on thebasis of volatility/earnings at risk. Nonetheless, CMG took fulladvantage of a rising market, exploited opportunities whereverpossible and posted an attractive return of 30% in 2012, thehighest in the last three years. Simultaneously, CMG continued tokeep its core exposure in defensive and high-dividend yieldingstocks for a consistent stream of income. Average portfolio sizeremained modest at PKR 330 mln.
STRATEGIC INITIATIVES
Primus Investment Management Limited (PIML)Established in 2011, our wholly-owned subsidiary, PrimusInvestment Management Limited (PIML), became fullyfunctional in 2012. PIML launched its first fund in Augustfollowed closely by a second launch in December carryinga new benchmark for management fee in the market. Anumber of funds ranging from shariah compliantinvestment solutions to alternative asset classes are atapproval stage.
In the fund management sphere, our advantage lies in adynamic parent-subsidiary relationship. Instead of running inisolation, PIML makes full use of synergies that exist betweena merchant banking outfit and an asset managementcompany. Our future plans also include leveraging, on armslength basis, PIML’s corporate and retail network to marketsecuritized assets.
Small and Medium Enterprise (SME) Financing In an economy where SMEs constitute close to 30% of GDPand employ over 75% of the non-farm labor force, funding tothe SME sector is critical. In 2012, we achieved yet anothermilestone in this area. In line with our long-term developmentgoals, Pak Brunei successfully set up an SME financingdepartment under the Corporate Banking Group.
We understand that success in this area requires goingbeyond a traditional banking mindset. CBG was thereforestrengthened to include resources with adequate experiencein SME financing. Our start is through provision of leasingservices since this is an important and affordable alternativeto traditional loans in a large, untapped market.
RISK MANAGEMENTRisk management and controls have been substantiallystrengthened to safeguard the Company’s interests in a volatileenvironment. We monitor credit, market and operational risks ona company-wide basis across all product classes. During theyear, the Company went through two months of slow down inbusiness activity while the Managing Director was out of office.However, strong operational risk framework in place ensured theCompany suffered minimal financial or reputational loss duringthis period.
n Own participation - PKR 4.7 billion
n Finances arranged from otherinstitutions - PKR 30.2 billion
n TFCs n T-Bills n PIBs
Trading Turnover inFixed Income
Figures in PKR million
1,000
900
800
700
600
500
400
300
200
100
7,000
6,000
5,000
4,000
3,000
2,000
1,000
140,000
120,000
100,000
80,000
60,000
40,000
20,000
0
* Treasury Portfolio includes T-Bills, TFCs, PIBs,Bank Balance and Lending to FIs
30,000
25,000
20,000
15,000
10,000
5,000
2,500
2,000
1,800
1,600
1,400
1,200
1,000
500
Treasury Portfolio & IncomeFigures in PKR million
n Treasury Portfolio (LHS)* n Treasury Income (RHS)
2011 2012201020092008
33%
11%
3%
-58%
44%
60%
31%
49%
26%28%
2%
-6%
n CMG Return on Investments n KSE-100 Return
Return on Equity Investment
vs. Market ReturnFigures in PKR million
80%
60%
40%
20%
0%
-20%
-40%
-60%
n Food 8%
n Electronics 5%
n Pharma 6%
n Chemicals 4%
n Cement 5%
n Real Estate 2%
n Transport 4%
n Entertainment 1%
n Poultry Feed 4%
n Paper & Board 2%
n Steel 2%
n Telecom 5%
n Engineering 1%
n Packaging 1%
n Oil & Gas 2%
n Hotel 1%
n Fertilizer 7%
n Energy 11%
n Sugar 13%
n Textile 17%
2007 2008 2009 2010 2011 2012
2007 2008 2009 2010 2011 2012
2007 2008 2009 2010 2011 2012

Ann
ual R
epor
t 201
2Pa
k Br
unei
Inve
stm
ent C
ompa
ny L
td.
31
Ann
ual R
epor
t 201
2Pa
k Br
unei
Inve
stm
ent C
ompa
ny L
td.
30
We have also continued to improve our systems, focusing on refining internalrisk assessment models and streamlining risk reporting. A major achievementinvolved developing the SME rating model to cater to the Company’sexpansion plans in this sector.
ENTITY RATINGDuring a rating review process in 2012, PACRA assigned ‘AA’ long-termrating to Pak Brunei with a positive outlook. The AA rating signifies a veryhigh credit quality and a very low expectation of credit risk, indicating a verystrong capacity of timely payment of financial commitments. JCR-VISassigned ‘AA+’ long-term rating to Pak Brunei. The AA+ rating signals highcredit quality. Risk is modest but may vary slightly from time to time as aresult of economic situations. Both ratings demonstrate the Company'sstrong financial health.
CORPORATE AND FINANCIAL REPORTING FRAMEWORKThe Directors declare that:
v Financial statements prepared by Pak Brunei Investment Company'smanagement present the state of affairs fairly. These include the resultsof its operations, cash flows and statement of changes in equity
v Proper books of accounts of Pak Brunei are maintained
v Appropriate accounting policies are consistently applied in preparingfinancial statements, and accounting estimates are based onreasonable and prudent judgment
v International Financial Reporting Standards, as applicable in Pakistan,are followed when preparing financial statements. Any deviations fromthese standards should be disclosed and explained
v The internal control system is sound in design and is effectivelyimplemented and monitored
v There are no doubts about Pak Brunei’s ability to continue as a goingconcern
v There be no deviation from best practices highlighted in the Code ofCorporate Governance except as disclosed in the Statement ofCompliance with the Code of Corporate Governance
v No statutory payments on account of taxes, duties, levies, and chargesare outstanding as of December 31, 2012 except as disclosed in thefinancial statements
The Board of Directors of the Company held three meetings during the yearended December 31, 2012.
The following directors attended the meetings:
Name Meetings Attended
Hjh Hartini binti Haji Abdullah 3
Ms. Sumaira K. Aslam 3
Mr. Junaidi bin Haji Masri 3
Ms. Ayesha Aziz, CFA 3
Mr. Abdul Razak Su – Alternate Director 3
The Audit Committee of Board held two meetings during the year ended December 31, 2012.
Name Meetings Attended
Hjh Hartini binti Haji Abdullah 2
Ms. Sumaira K. Aslam 2
Mr. Junaidi bin Haji Masri 2
Mr. Abdul Razak Su – Alternate Director 2
The HR Committee of Board held one meeting during the year ended December 31, 2012.
The following members attended the meetings:
Name Meetings Attended
Mr. Junaidi bin Haji Masri 1
Ms. Sumaira K. Aslam 1
Ms. Ayesha Aziz, CFA 1
CHANGE IN DIRECTORSThere has been a change in the Board of Directors of the Company during the year endedDecember 31, 2012. Brunei Investment Agency (BIA) has nominated Mr. Khairuddin AbdulHamid as the Chairman, replacing Hjh Hartini binti Haji Abdullah.
STATEMENT OF INVESTMENT OF PROVIDENT FUNDInvestments of provident fund as of June 30, 2012 according to audited financial statements
amounted to PKR 28.410 million (2011: PKR 19.245 million).
APPOINTMENT OF AUDITORSThe Board on the proposal of the Audit Committee recommends the appointment of M/s. Ernst& Young, Ford, Rhodes, Sidat Hyder, Chartered Accountants as statutory auditors for 2013.
PATTERN OF SHAREHOLDINGShareholder Shareholding (%)
Ministry of Finance – Govt. of Pakistan 49.99933%
Brunei Investment Agency 50.00000%
Secretary, Economic Affairs Division-Govt. of Pakistan 0.00067%
ACKNOWLEDGEMENTSWe are hopeful that the Company, with its sovereign shareholders, dynamic Board of Directors,professional Management team and a culture that fosters merit and fair play has a bright andexciting future in Pakistan. The support and encouragement of our shareholders and regulatorswill remain pivotal for achieving the objectives for which this Company was established.
Ayesha AzizManaging Director May 9, 2013

Ann
ual R
epor
t 201
2Pa
k Br
unei
Inve
stm
ent C
ompa
ny L
td.
33
Ann
ual R
epor
t 201
2Pa
k Br
unei
Inve
stm
ent C
ompa
ny L
td.
32
We have reviewed the Statement of Compliance with the best practices (the Statement) contained in theCode of Corporate Governance (the Code) for the year ended 31 December 2012 prepared by the Boardof Directors of Pak Brunei Investment Company Limited (the Company) to comply with regulation G-1 ofthe Prudential Regulations for Corporate / Commercial Banking issued by the State Bank of Pakistan.
The responsibility for compliance with the Code is that of the Board of Directors of the Company. Ourresponsibility is to review, to the extent where such compliance can be objectively verified, whether theStatement reflects the status of the Company’s compliance with the provisions of the Code and report if itdoes not. A review is limited primarily to inquiries of the Company’s personnel and review of variousdocuments prepared by the Company to comply with the Code.
As part of our audit of financial statements, we are required to obtain an understanding of the accountingand internal control systems sufficient to plan the audit and develop an effective audit approach. We are notrequired to consider whether the Board’s statement on internal control covers all risks and controls, or toform an opinion on the effectiveness of such internal controls, the Company’s corporate governanceprocedures and risks.
Further, the Code requires the Company to place before the Board of Directors for their consideration andapproval related party transactions distinguishing between transactions carried out on terms equivalent tothose that prevail in arm’s length transactions and transactions which are not executed at arm’s length pricerecording proper justification for using such alternate pricing mechanism. Further, all such transactions arealso required to be separately placed before the audit committee. We are only required and have ensuredcompliance of requirement to the extent of approval of related party transactions by the Board of Directorsand placement of such transactions before the audit committee. We have not carried out any procedures todetermine whether the related party transactions were undertaken at arm’s length price or not.
Based on our review, nothing has come to our attention which causes us to believe that the Statement doesnot appropriately reflect the Company’s compliance, in all material respects, with the best practicescontained in the Code as applicable to the Company for the year ended 31 December 2012.
We draw attention to the clauses 8, 16 and 17 of the Statement which describe the non-compliances withthe requirements of the Code of Corporate Governance.
Our conclusion is not qualified in respect of the above.
Chartered AccountantsAudit Engagement Partner: Shabbir YunusDate: 09 May 2013Karachi
6 Years Performance at a Glance
Review Report to the Members on the Statement of Compliancewith the Best Practices of the Code of Corporate Governance
(Rupees in ’000)
Balance Sheet
Lendings to financial institutions – –– 627,841 1,222,727 1,507,910 1,519,299 1,464,299
Investments 7,121,490 25,741,246 9,868,363 8,415,996 2,687,585 1,956,095
Advances 5,776,014 4,646,661 2,467,643 1,732,493 1,062,744 254,444
Borrowings 2,417,139 23,359,531 5,943,385 5,296,808 186,154 1,150,000
Deposits and other accounts 2,824,924 979,018 844,000 395,000 – –– – ––
Total Assets 14,045,611 32,544,390 14,368,611 12,130,979 5,528,893 4,362,474
Net Assets 8,580,535 7,927,546 7,342,559 6,305,979 5,281,160 3,136,278
Paid up Capital 6,000,000 6,000,000 6,000,000 5,000,000 5,000,000 3,000,000
Profit & Loss
Mark up income 2,911,983 2,394,747 1,698,132 971,221 672,254 177,507
Mark up expense 2,044,815 1,469,277 777,987 207,450 131,801 630
Non mark up income 406,286 284,325 211,963 254,064 85,608 67,299
Non mark up expense 201,163 203,342 165,145 132,740 118,675 57,635
Gross income 3,318,269 2,679,072 1,910,095 1,225,285 757,862 244,806
Profit before provision and tax 1,071,823 1,006,453 963,002 885,092 507,386 186,541
Provisions (4,019) 86,874 81,344 217,918 133,921 – ––
Profit before tax 1,075,842 919,579 881,658 667,174 373,465 186,541
Profit after tax 783,758 604,107 581,090 447,453 222,266 140,743
Investors information
Profit before tax ratio % 32.42% 34.32% 46.16% 54.45% 49.28% 76.20%
Gross spread ratio % 29.75% 38.65% 54.19% 78.64% 80.39% 99.65%
Return on assets % 3.36% 2.58% 4.39% 5.07% 4.49% 3.23%
Return on equity % 9.50% 7.91% 8.52% 7.72% 5.28% 4.49%
Earning asset to total asset ratio % 94.14% 97.03% 95.27% 97.67% 95.58% 90.34%
EPS (Earning per share) PKR 1.31 1.01 0.98 0.89 0.52 0.75
Capital Adequacy Ratio (CAR) % 59.76% 58.47% 84.61% 81.00% 138.00% 114.00%
Summary of cash flow statement
Cash flow from operating activities (11,783,984) 9,315,187 1,076,382 5,487,232 (1,218,859) (852,802)
Cash flow from investing activities 11,618,161 (8,740,067) (1,615,121) (5,786,148) (1,025,606) (1,879,809)
Cash flow from financing activities (200,000) – –– 483,727 495,563 1,995,881 3,000,332
Cash & cash equivalent at the beginning of the year 735,892 160,772 215,784 19,137 267,721 – ––
Cash & cash equivalent at the end of the year 370,069 735,892 160,772 215,784 19,137 267,721
*four months of operations
2012 2011 2010 2009 2008 2007*
Ernst & Young Ford Rhodes Sidat HyderChartered AccountantsProgressive Plaza, Beaumont RoadP.O. Box 15541, Karachi 75530, Pakistan
Tel: +9221 3565 0007Fax: +9221 3568 1965www.ey.com
A member firm of Ernst & Young Global Limited

Ann
ual R
epor
t 201
2Pa
k Br
unei
Inve
stm
ent C
ompa
ny L
td.
35
Ann
ual R
epor
t 201
2Pa
k Br
unei
Inve
stm
ent C
ompa
ny L
td.
34
for period ended September 30, 2012 and for the year ended December 31, 2012, the Board meetingis held on May 09, 2013. Extension for the submission of the said financial statements has beenapproved by the SBP vide its letter No. OSED/FRDU/563/2013/5372 dated April 12, 2013.
9. Directors are conversant with the relevant laws applicable to the Company, its policies and proceduresand provisions of memorandum and articles of association and are aware of their duties andresponsibilities. The Directors have also discussed the revised Code of Corporate Governance 2012requirements in the Board meeting. Pakistani directors completed Corporate Governance LeadershipSkills (CGLS) program offered by the Pakistan Institute of Corporate Governance (PICG) in 2011.
10. The directors’ report for this year has been prepared in compliance with the requirements of the CCGand fully describes the salient matters required to be disclosed.
11. In terms of the revised Code of Corporate Governance 2012, the Board is yet to ratify theremuneration and terms and conditions of employment of CFO, the Company Secretary and Headof Internal Audit which will be done in its upcoming meeting to approve the financial statements ofthe Company as referred to in 8 above.
12. The financial statements of the Company were duly endorsed by CEO and CFO before approval ofthe board.
13. The directors, CEO and executives do not hold any interest in the shares of the Company other thanthat disclosed in the pattern of shareholding.
14. The Company has complied with all the corporate and financial reporting requirements of the CCG.
15. The Board has formed an audit committee consisting of three non-executive directors, including theChairman.
16. Two meetings of the audit committee were held for approval of December 31, 2011 and quarterlyaccounts for the period ended March 31, 2012. The terms of reference of the committee have beenformed and advised to the committee for compliance. To review the financial statements for the halfyear ended June 30, 2012, period ended September 30, 2012 and for the year ended December 31,2012, the Audit Committee meeting is held on May 09, 2013.
17. The board has formed an HR and Compensation Committee. It comprises of three members, ofwhom two are non-executive directors. The Chairman of the committee is a non-executive director.The Committee was formed in 2009 and has been performing its functions under the terms ofreference approved by the Board. The amendments to the terms of reference including theresponsibilities of HR and Compensation Committee as suggested by the revised Code will beapproved by the Board in its upcoming meeting.
18. The board has set up an effective internal audit function who is considered suitably qualified andexperienced for the purpose and are conversant with the policies and procedures of the Company.
19. The statutory auditors of the Company have confirmed that they have been given a satisfactoryrating under the quality control review program of the ICAP, that they or any of the partners of thefirm, their spouses and minor children do not hold shares of the Company and that the firm and allits partners are in compliance with International Federation of Accountants (IFAC) guidelines on codeof ethics as adopted by the ICAP.
20. The statutory auditors or the persons associated with them have not been appointed to provide otherservices except in accordance with the listing regulations and the auditors have confirmed that theyhave observed IFAC guidelines in this regard.
21. We confirm that all other material principles enshrined in the CCG have been complied with.
Ayesha AzizManaging Director 09 May 2013
This Statement is being presented to comply with the revised Code of Corporate Governance 2012 (theCCG) framed by the Securities and Exchange Commission of Pakistan, which was made applicable to theCompany through regulation G-1 of the Prudential Regulations for Corporate / Commercial Banking issuedby the State Bank of Pakistan.
The Company has applied the principles contained in the CCG in the following manner:
1. As per the joint venture arrangement between Government of Pakistan (GoP) and Government ofBrunei, the Company’s board of directors comprises of four directors and all directors are nominatedby both the Governments. The Company encourages representation of non-executive directors onits board of directors (the board). At present the Board includes:
Category Name/(s) Particulars
Executive Directors Ms. Ayesha Aziz Government of Pakistan
Non-Executive Directors Mr. Khairuddin Abdul Hamid Government of Brunei
Mr. Junaidi bin Haji Masri Government of Brunei
Mr. Mohammad Younus Dagha Government of Pakistan
On March 06, 2013 GOP nominated Mr. Mohammad Younus Dagha in place of Ms. Sumaira K. Aslam.
2. The directors have confirmed that none of them is serving as a director on more than seven listedcompanies, including this Company (excluding the listed subsidiaries of listed holding companieswhere applicable).
3. All the resident directors of the Company are registered as taxpayers and none of them hasdefaulted in payment of any loan to a banking Company, a DFI or an NBFI or, being a member of astock exchange, has been declared as a defaulter by that stock exchange.
4. No casual vacancy occurred on the board during the year. However, the Brunei Investment Agency(BIA) nominated Mr. Khairuddin Abdul Hamid on August 01, 2012 in place of Hjh Hartini binti HajiAbdullah. The Ministry of Finance, Government of Pakistan had nominated Mr. ShahnawazMahmood on October 09, 2012 as Director/Managing Director. The Board of Directors did notapprove this appointment. Subsequently on March 16, 2013, the Ministry of Finance, Government ofPakistan accepted the resignation of Mr. Shahnawaz Mahmood and on April 17, 2013 confirmed thatMs. Ayesha Aziz would continue to serve as Managing Director/ Director until March 28, 2014.
5. The Company has prepared a “Code of Conduct” and has ensured that appropriate steps have beentaken to disseminate it throughout the Company along with its supporting policies and procedures.
6. The board has developed a vision/mission statement, overall corporate strategy and significantpolicies of the Company. A complete record of particulars of significant policies along with the dateson which they were approved or amended has been maintained.
7. All the powers of the board have been duly exercised and decisions on material transactions,including appointment and determination of remuneration and terms and conditions of employmentof the CEO, and non-executive directors, have been taken by the board/shareholders.
8. The meetings of the board were presided over by the Chairperson and the board met three timesduring the year. Written notices of the board meetings, along with agenda and working papers, werecirculated at least seven days before the meetings. The minutes of the meetings were appropriatelyrecorded and circulated. To approve the financial statements for the half year ended June 30, 2012,
Statement of Compliance with the Code ofCorporate Governance For The Year Ended December 31, 2012

Ernst & Young Ford Rhodes Sidat HyderChartered AccountantsProgressive Plaza, Beaumont RoadP.O. Box 15541, Karachi 75530, Pakistan
Tel: +9221 3565 0007Fax: +9221 3568 1965www.ey.com
A member firm of Ernst & Young Global Limited
Ann
ual R
epor
t 201
2Pa
k Br
unei
Inve
stm
ent C
ompa
ny L
td.
37
Ann
ual R
epor
t 201
2Pa
k Br
unei
Inve
stm
ent C
ompa
ny L
td.
36
It is the responsibility of Company’s management to:
v Establish and maintain an adequate and effective system of internal controls and procedures for anefficient working environment for obtaining desired objectives.
v Evaluate the effectiveness of the Company’s internal control system that encompasses material mattersby identifying control objective, reviewing significant policies and procedures and establishing relevantcontrol procedures.
The control activities are being closely monitored across the Company through Audit Department, workingindependent of line management. In addition, Compliance Department is also in place to monitor controlactivities related to regulatory compliance. Internal Audit Department covers all activities in general and keyrisks areas in particular. The Audit Committee of the Board regularly reviews audit reports both internal andexternal where significant violations to the local regulations, prescribed policies and procedures haveoccurred. Regular follow up reporting upon the audit reports is done by Compliance Department to the AuditCommittee which ensures timely implementations of audit/inspection reports to mitigate identified risks tosafeguard the interest of the Company.
The Company’s internal control system has been designed to provide reasonable assurance to theCompany’s management and Board of Directors. All internal control systems, no matter how well designed,have inherent limitations that they may not prevent or detect misstatements. Also, projections of anyevaluation of effectiveness to future periods are subject to the risk that controls may become inadequatebecause of changes in conditions or that the degree of compliance with the policies or procedures maydeteriorate. However, control activities are ongoing process that includes identification, evaluation andmanagement of significant risks faced by the Company.
In an effort to implement the Internal Control Guidelines as spelled out by the State Bank of Pakistan in BSDCircular No. 7 of 2004, “particularly with reference to Internal Control Over Financial Reporting (ICFR)” theCompany is in the process of carrying out a detailed exercise through a well established firm of CharteredAccountants including documentation and benchmarking of existing processes and controls relating tofinancial reporting on internationally accepted standards. This project will help in further improving thequality of internal controls across the Company and in ensuring compliance with the SBP requirement forexternal auditors’ attestation on Internal Control over Financial Reporting.
The Board of Directors is ultimately responsible for the internal control system and the Board endorses theabove management evaluation.
For and on behalf of the Board
Ayesha AzizManaging Director 09 May 2013
We have audited the annexed unconsolidated statement of financial position of Pak Brunei InvestmentCompany Limited (the Company) as at 31 December 2012 and the related unconsolidated profit and lossaccount, unconsolidated statement of comprehensive income, unconsolidated cash flow statement andunconsolidated statement of changes in equity together with the notes forming part thereof, for the year thenended and we state that we have obtained all the information and explanations which, to the best of ourknowledge and belief, were necessary for the purposes of our audit.
It is the responsibility of the Company’s management to establish and maintain a system of internal control,and prepare and present the above said statements in conformity with the approved accounting standardsand the requirements of the Companies Ordinance, 1984. Our responsibility is to express an opinion onthese statements based on our audit.
We conducted our audit in accordance with the auditing standards as applicable in Pakistan. Thesestandards require that we plan and perform the audit to obtain reasonable assurance about whether theabove said statements are free of any material misstatement. An audit includes examining on a test basis,evidence supporting the amounts and disclosures in the above said statements. An audit also includesassessing the accounting policies and significant estimates made by management, as well as, evaluatingthe overall presentation of the above said statements. We believe that our audit provides a reasonable basisfor our opinion and, after due verification, we report that:
(a) in our opinion, proper books of account have been kept by the Company as required by the CompaniesOrdinance, 1984;
(b) in our opinion:
(i) the unconsolidated statement of financial position and unconsolidated profit and loss accounttogether with the notes thereon have been drawn up in conformity with the Companies Ordinance,1984, and are in agreement with the books of account and are further in accordance with accountingpolicies consistently applied except for the changes as stated in note 4.1 with which we concur;
(ii) the expenditure incurred during the year was for the purpose of the Company’s business; and
(iii) the business conducted, investments made and the expenditure incurred during the year were inaccordance with the objects of the Company.
(c) in our opinion and to the best of our information and according to the explanations given to us, theunconsolidated statement of financial position, unconsolidated profit and loss account, unconsolidatedstatement of comprehensive income, unconsolidated statement of cash flows and unconsolidatedstatement of changes in equity together with the notes forming part thereof conform with approvedaccounting standards as applicable in Pakistan, and, give the information required by the CompaniesOrdinance, 1984, in the manner so required and respectively give a true and fair view of the state ofthe Company’s affairs as at 31 December 2012 and of the profit, its comprehensive income, cash flowsand changes in equity for the year then ended; and
(d) in our opinion, no Zakat was deductible at source under the Zakat and Ushr Ordinance, 1980 (XVIII of 1980).
The financial statements of the Company for the year ended 31 December 2011 were audited by another firmof Chartered Accountants whose report dated 28 March 2012 expressed an unqualified opinion thereon.
Chartered AccountantsAudit Engagement Partner: Shabbir YunusDate: 09 May 2013Karachi
Auditors' Report to the MembersStatement of Internal Control For The Year Ended December 31, 2012
Ann
ual R
epor
t 201
2Pa
k Br
unei
Inve
stm
ent C
ompa
ny L
td.
39
Ann
ual R
epor
t 201
2Pa
k Br
unei
Inve
stm
ent C
ompa
ny L
td.
38
2012 2011 Note 2012 2011(US $ in ‘000) (Rupees in ‘000)
30,051 24,714 Mark-up / return / interest earned 19 2,911,983 2,394,74721,102 15,163 Mark-up / return / interest expensed 20 2,044,815 1,469,277
8,949 9,551 Net mark-up / interest Income 867,168 925,470(Reversal) / provision against non-performing
(187) 136 loans and advances 8.4 (18,074) 13,183Provision for diminution in the
145 760 value of investments 7.3 14,055 73,691– –– – –– Bad debts written off directly – –– – ––
(42) 896 (4,019) 86,8748,991 8,655 Net mark-up / interest income after provisions 871,187 838,596
NON MARK-UP / INTEREST INCOME
376 709 Fee, commission and brokerage income 36,425 68,6581,839 990 Dividend income 178,196 95,903– –– – –– Income from dealing in foreign currencies – –– – ––1,965 1,369 Gain on sale of securities - net 21 190,412 132,702
Unrealised loss on revaluation of investments– –– (136) classified as held-for-trading – –– (13,200)
13 3 Other income 22 1,253 2624,193 2,935 Total non mark-up / interest income 406,286 284,325
13,184 11,590 1,277,473 1,122,921
NON MARK-UP / INTEREST EXPENSES
2,037 2,096 Administrative expenses 23 197,409 203,10339 – –– Other provisions / write off 9.2.2 3,754 – ––5 2 Other charges 24 468 239
2,081 2,098 Total non-mark-up / interest expenses 201,631 203,34211,103 9,492 1,075,842 919,579
– –– – –– Extra ordinary / unusual items – –– – ––11,103 9,492 PROFIT BEFORE TAXATION 1,075,842 919,5793,342 3,669 Taxation - Current 323,802 355,528
(24) 85 - Prior years (2,283) 8,193(304) (498) - Deferred (29,435) (48,249)
3,014 3,256 25 292,084 315,4728,089 6,236 PROFIT AFTER TAXATION 783,758 604,107
16,476 11,489 Unappropriated profit brought forward 1,596,527 1,113,24124,565 17,725 Profit available for appropriation 2,380,285 1,717,348
US $ Rupees0.01 0.01 Earnings per share - basic and diluted 26 1.31 1.01
The annexed notes from 1 to 39 form an integral part of these unconsolidated financial statements.
2012 2011 Note 2012 2011
I As at December 31, 2012Statement of Financial Position Profit and Loss Account
(US $ in ‘000) (Rupees in ‘000)
ASSETS
565 1,804 Cash and balances with treasury banks 5 54,755 174,790
3,254 5,791 Balances with other banks 6 315,314 561,102
– –– 6,479 Lendings to financial institutions – –– 627,841
73,495 265,646 Investments 7 7,121,490 25,741,246
59,608 47,953 Advances 8 5,776,014 4,646,661
562 352 Operating fixed assets 9 54,476 34,067
137 – –– Deferred tax assets 10 13,302 – ––
7,330 7,830 Other assets 11 710,260 758,683
144,951 335,855 14,045,611 32,544,390
LIABILITIES
– –– – –– Bills payable – –– – ––
24,945 241,068 Borrowings 12 2,417,139 23,359,531
29,153 10,103 Deposits and other accounts 13 2,824,924 979,018
– –– – –– Sub-ordinated loans – –– – ––
Liabilities against assets
– –– – –– subject to finance lease – –– – ––
– –– 2 Deferred tax liabilities 10 – –– 190
2,301 2,870 Other liabilities 14 223,013 278,105
56,399 254,043 5,465,076 24,616,844
88,552 81,812 NET ASSETS 8,580,535 7,927,546
REPRESENTED BY
61,920 61,920 Share capital 15 6,000,000 6,000,000
5,737 4,119 Reserves 555,884 399,132
20,883 16,476 Unappropriated profit 2,023,533 1,596,527
88,540 82,515 8,579,417 7,995,659
Surplus / (deficit) on revaluation of
12 (703) assets - net of tax 16 1,118 (68,113)
88,552 81,812 8,580,535 7,927,546
CONTINGENCIES AND COMMITMENTS 17
The annexed notes from 1 to 39 form an integral part of these unconsolidated financial statements.
Unconsolidated Unconsolidated
For the Year endedDecember 31, 2012
Chief Executive Director Director Chairman Chief Executive Director Director Chairman

Ann
ual R
epor
t 201
2Pa
k Br
unei
Inve
stm
ent C
ompa
ny L
td.
41
Ann
ual R
epor
t 201
2Pa
k Br
unei
Inve
stm
ent C
ompa
ny L
td.
40
2012 2011 2012 2011(US $ in ‘000) (Rupees in ‘000)
8,089 6,236 Profit after taxation for the year 783,758 604,107
– –– – –– Other comprehensive income – –– – ––
Total comprehensive income
8,089 6,236 for the year 783,758 604,107
Surplus / (deficit) arising on revaluation of assets has been reported in accordance with the directives of the State
Bank of Pakistan in a separate account below equity.
The annexed notes from 1 to 39 form an integral part of these unconsolidated financial statements.
2012 2011 Note 2012 2011
Statement Of Comprehensive Income For the Year endedDecember 31, 2012 Cash Flow Statement For the Year ended
December 31, 2012
Unconsolidated Unconsolidated
(US $ in ‘000) (Rupees in ‘000)
CASH FLOWS FROM OPERATING ACTIVITIES11,103 9,492 Profit before taxation 1,075,842 919,5791,839 990 Less: Dividend income 178,196 95,9039,264 8,502 897,646 823,676
Adjustments for non-cash charges and other items
146 78 Depreciation 23 14,115 7,54411 17 Amortisation 23 1,043 1,633
(Reversal) / provision against non-performing(187) 136 loans and advances (18,074) 13,183
Provision for diminution in the 145 760 value of investments 7.3 14,055 73,69139 – –– Other provisions / write off 9.2.2 3,754 – ––
– –– (1) Gain on sale of property and equipment 22 (5) (69)Unrealised loss on revaluation of investments
– –– 136 classified as held-for-trading – –– 13,200Unrealised loss on revaluation of
– –– 2 interest rate swap contracts – –– 239154 1,128 14,888 109,421
9,418 9,630 912,534 933,097
Decrease / (increase) in operating assets 6,479 6,139 Lendings to financial institutions 627,841 594,886
74,055 (74,190) Held-for-trading securities 7,175,900 (7,189,100)(11,468) (22,623) Advances (1,111,279) (2,192,201)
1,222 (970) Others assets (excluding current taxation) 118,406 (93,947)70,288 (91,644) 6,810,868 (8,880,362)
(Decrease) / increase in operating liabilities(216,124) 179,733 Borrowings (20,942,392) 17,416,146
19,050 1,393 Deposits and other accounts 1,845,906 135,018(569) 920 Other liabilities (excluding current taxation) (55,092) 89,105
(197,643) 182,046 (19,151,578) 17,640,269(117,937) 100,032 (11,428,176) 9,693,004
(3,668) (3,899) Income tax paid (355,407) (377,817)Net cash (used in) / generated from
(121,605) 96,133 operating activities (11,783,583) 9,315,187
CASH FLOWS FROM INVESTING ACTIVITIES149,710 (88,136) Net investment in available-for-sale securities 14,506,932 (8,540,366)
(9) (7) Net investment in held-to-maturity securities (824) (654)– –– (2,580) Investment in subsidiary – –– (250,000)
(30,868) – –– Investment in associates (2,991,134) – ––1,466 755 Dividend income received 142,102 73,116(406) (245) Investments in operating fixed assets (39,387) (23,744)
1 16 Sale proceeds from disposal of property and equipment 71 1,581119,894 (90,197) Net cash generated from / (used in) investing activities 11,617,760 (8,740,067)
CASH FLOWS FROM FINANCING ACTIVITIES(2,064) – –– Dividend paid (200,000) – ––(2,064) – –– Net cash used in financing activities (200,000) – ––(3,775) 5,936 (Decrease) / increase in cash and cash equivalents (365,823) 575,120
Cash and cash equivalents at the 7,594 1,659 beginning of the year 735,892 160,772
Cash and cash equivalents at 3,819 7,595 the end of the year 27 370,069 735,892
The annexed notes from 1 to 39 form an integral part of these unconsolidated financial statements.
Chief Executive Director Director Chairman Chief Executive Director Director Chairman

Ann
ual R
epor
t 201
2Pa
k Br
unei
Inve
stm
ent C
ompa
ny L
td.
43
Ann
ual R
epor
t 201
2Pa
k Br
unei
Inve
stm
ent C
ompa
ny L
td.
42
Share Statutory Unappropriated capital reserve profit Total 1. STATUS AND NATURE OF BUSINESS
Pak Brunei Investment Company Limited (the Company) is incorporated as an un-listed public limitedcompany under the Companies Ordinance, 1984. The State Bank of Pakistan (the SBP) granted theapproval for commencement of business with effect from August 20, 2007. The Company is a jointventure between the Government of Pakistan and the Brunei Investment Agency. The Company’sobjective interalia includes making investments in the industrial and agro based industrial fields inPakistan on commercial basis through carrying out of industrial and agro based industrial projects andmaking of their products in Pakistan and abroad and to undertake other feasible business and toestablish and acquire companies to conduct various businesses. The registered office of the Companyis situated at Horizon Vista, Plot No. Comm-10, Block No. 4, Scheme No. 5, Clifton, Karachi, Pakistan.
2. BASIS OF PRESENTATION
2.1 Basis of Measurement
These unconsolidated financial statements have been prepared under the historical cost conventionexcept that certain investments have been stated at revalued amounts in accordance with thedirectives of the State Bank of Pakistan (SBP).
2.2 US Dollar equivalent
The US dollar amounts shown in the unconsolidated statement of financial position, unconsolidatedprofit and loss account, unconsolidated statement of comprehensive income and unconsolidatedcash flow statement are stated as additional information solely for the convenience of readers. Forthis purpose of conversion to US Dollars, the rate of Rs. 96.90 to US Dollars has been used for both2012 and 2011, as it was the prevalent rate as on December 31, 2012.
2.3 Separate financial statements
These unconsolidated financial statements represent the separate financial statements of theCompany. The consolidated financial statements of the Company and its subsidiary company arepresented separately.
3. STATEMENT OF COMPLIANCE
3.1 These unconsolidated financial statements have been prepared in accordance with approvedaccounting standards as applicable in Pakistan. Approved accounting standards comprise of suchInternational Financial Reporting Standards (IFRSs) issued by the International Accounting StandardsBoard (IASB) as are notified under the Companies Ordinance, 1984, the provisions of and directivesissued under the Companies Ordinance, 1984 and the directives issued by the State Bank of Pakistan.Wherever the requirements of the Companies Ordinance, 1984 or directives issued under theCompanies Ordinance, 1984 and the State Bank of Pakistan differ with the requirements of IFRS, therequirements of the Companies Ordinance, 1984 or the requirements of the said directives shall prevail.
3.2 The SBP has deferred the applicability of International Accounting Standard (IAS) 39, ‘FinancialInstruments: Recognition and Measurement’ and IAS 40, ‘Investment Property’ for DFIs throughBSD Circular Letter No. 11 dated September 11, 2002 till further instructions. Further, according tothe notification of the SECP dated April 28, 2008, the IFRS - 7 "Financial Instruments: Disclosures"has not been made applicable to DFIs. Accordingly, the requirements of these standards have notbeen considered in the preparation of these unconsolidated financial statements. However,investments have been classified and valued in accordance with the requirements of variouscirculars issued by the SBP.
(Rupees in ‘000)
Balance as at January 01, 2011 6,000,000 278,311 1,113,241 7,391,552
Total comprehensive income for the year
Profit after tax for the year ended
December 31, 2011 – –– – –– 604,107 604,107
Other comprehensive income – –– – –– – –– – ––
Total comprehensive income for the year
ended December 31, 2011 – –– – –– 604,107 604,107
Transfers
Transfer to statutory reserve – –– 120,821 (120,821) – ––
Balance as at December 31, 2011 6,000,000 399,132 1,596,527 7,995,659
Total comprehensive income for the year
Profit after tax for the year ended
December 31, 2012 – –– – –– 783,758 783,758
Other comprehensive income – –– – –– – –– – ––
Total comprehensive income for the year
ended December 31, 2012 – –– – –– 783,758 783,758
Transfers
Transfer to statutory reserve – –– 156,752 (156,752) – ––
Transaction with owners recorded
directly in equity during the year
ended December 31, 2012
Final cash dividend - December 31, 2011
declared subsequent to year
end @ Re. 0.33 per share – –– – –– (200,000) (200,000)
Balance as at December 31, 2012 6,000,000 555,884 2,023,533 8,579,417
The annexed notes from 1 to 39 form an integral part of these unconsolidated financial statements.
Notes to the Financial StatementsFor the Year endedDecember 31, 2012
For the Year endedDecember 31, 2012
Unconsolidated Unconsolidated
Statement of Changes in Equity
Chief Executive Director Director Chairman

Ann
ual R
epor
t 201
2Pa
k Br
unei
Inve
stm
ent C
ompa
ny L
td.
45
Ann
ual R
epor
t 201
2Pa
k Br
unei
Inve
stm
ent C
ompa
ny L
td.
44
3.3 Standards, interpretations and amendments to approved accounting standards that are not yeteffective
The following revised standards, amendments and interpretations with respect to the approvedaccounting standards as applicable in Pakistan would be effective from the dates mentioned belowagainst the respective standard or interpretation:
Standards or Interpretation Effective date (annualperiods beginning on or after)
IAS 1 - Presentation of Financial Statements - Presentation of Items of Other Comprehensive Income July 01, 2012
IAS 19 - Employee Benefits (Revised) January 01, 2013
IAS 32 - Offsetting Financial Assets andFinancial Liabilities - (Amendment) January 01, 2014
The Company expects that the adoption of the above revisions, amendments and interpretations ofthe standards will not affect the Company’s financial statements in the period of initial application.
In addition to the above amendments, improvements to various accounting standards have also beenissued by the IASB. Such improvements are generally effective for accounting periods beginning onor after January 01, 2013. The Company expects that such improvements to the standards will nothave any material impact on the Company’s financial statements in the period of initial application.
The following new standards have been issued by the IASB, but have not yet been notified by theSECP for application in Pakistan.
Standards or Interpretation IASB Effective date (annual periods beginning on or after)
IFRS 9 – Financial Instruments: Classification and Measurement January 01, 2015
IFRS 10 – Consolidated Financial Statements January 01, 2013
IFRS 11 – Joint Arrangements January 01, 2013
IFRS 12 – Disclosure of Interests in Other Entities January 01, 2013
IFRS 13 – Fair Value Measurement January 01, 2013
4. SUMMARY OF SIGNIFICANT ACCOUNTING POLICIES
4.1 New and amended standards and interpretations
The Company has adopted the following amendements to IFRSs which became effective during thecurrent year:
IAS 12- Income Taxes-Recovery of Underlying Assets (Amendement)
The adoption of the above amendments did not have any effect on the financial statements.
4.2 Cash and cash equivalents
Cash and cash equivalents include cash and balances with treasury banks and balances with otherbanks in current and deposit accounts.
4.3 Revenue recognition
Mark-up / return / interest income on advances and investments is recognised on time proportionbasis taking into account effective yield on the instrument except in case of advances andinvestments classified under the SBP’s Prudential Regulations on which mark-up / return / interestis recognised on receipt basis.
Dividend income is recognised when the Company’s right to receive income is established.
Fee, commission and brokerage income and remuneration for trustee and advisory services arerecognised at the time of performance of services.
Premium or discount on debt securities classified as "available-for-sale" and "held-to-maturity" securitiesis amortised using the effective interest method and taken to unconsolidated profit and loss account.
Gains and losses on disposal of investments are dealt with through profit and loss account in theyear in which they arise.
Return on bank deposits is recognised on time proportion basis using the effective interest rates.
4.4 Advances
Advances are stated net of specific and general provisions. Specific provisions are made inaccordance with the requirements of the Prudential Regulations issued by SBP and charged to theunconsolidated profit and loss account. These regulations prescribe an age based criteria (assupplemented by subjective evaluation of advances) for classification of non-performing loans andadvances and computing provision / allowance thereagainst. Advances are written off where thereare no realistic prospects of recovery.
Leases are classified as finance leases, when the Company transfers substantially all the risks andrewards incidental to the ownership of an asset to the lessee. A receivable is recognised at anamount equal to the present value of the minimum lease payments, including guaranteed residualvalue, if any. Finance lease receivables are included in advances to customers.
4.5 Investments
Investments other than those categorised as held-for-trading are initially recognised at fair valuewhich includes transaction costs associated with the acquisition of investments. Investmentsclassified as held-for-trading are initially recognised at fair value, and transaction costs are expensedin the unconsolidated profit and loss account. The Company has classified its investment portfoliointo ‘held-for-trading’, ‘held-to-maturity’ and ‘available-for-sale’ portfolios as follows:
Held-for-tradingThese are investments, which are either acquired for generating a profit from short-term fluctuationsin market prices, interest rate movements, dealer’s margin or are securities included in a portfolio inwhich a pattern of short-term profit taking exists and are to be sold within 90 days of acquisition.These are carried at market value, with the related surplus / deficit being taken to unconsolidatedprofit and loss account.
Held-to-maturityThese are securities with fixed or determinable payments and fixed maturity in respect of which theCompany has the positive intent and ability to hold till maturity. These are carried at amortised costusing the effective interest rate method.
Available-for-saleThese are investments that do not fall under the ‘held-for-trading’ or ‘held-to-maturity’categories. These are carried at market value with the ‘surplus / deficit taken to surplus / deficiton revaluation of assets’ account below equity. Provision for diminution in the value ofinvestments in respect of unquoted shares is calculated with reference to break-up value.Provision for unquoted debt securities is calculated with reference to the time-based criteria asper the SBP’s Prudential Regulations.
On derecognition or impairment in quoted available-for-sale investments, the cumulative gain or losspreviously reported as ‘surplus / (deficit) on revaluation of assets’ below equity is included in theunconsolidated profit and loss account for the year.

Ann
ual R
epor
t 201
2Pa
k Br
unei
Inve
stm
ent C
ompa
ny L
td.
47
Ann
ual R
epor
t 201
2Pa
k Br
unei
Inve
stm
ent C
ompa
ny L
td.
46
Held-for-trading and quoted available-for-sale securities are marked to market with reference toready quotes on Reuters page (PKRV) or the Stock Exchanges.
Unquoted equity securities are valued at the lower of cost and break-up value. The break-up valueof these securities is calculated with reference to the net assets of the investee company as per thelatest available audited financial statements. A decline in the carrying value is charged to theunconsolidated profit and loss account. A subsequent increase in the carrying value, upto the costof the investment, is credited to unconsolidated profit and loss account. Investments in otherunquoted securities are valued at cost less impairment, if any.
The carrying values of investments are reviewed for impairment at each reporting date. Where anysuch indications exist that the carrying values exceed the estimated recoverable amounts, provisionfor impairment is made through the unconsolidated profit and loss account.
Investment in subsidiaries and associatesInvestment in subsidiaries and associates are valued at cost less impairment, if any. A reversal of animpairment loss on subsidiaries and associates is recognised as it arises provided the increasedcarrying value does not exceed cost.
Gain or losses on disposal of investments in subsidiaries and associates is included in the profit andloss account.
4.6 Repurchase and resale agreements
Securities sold with a simultaneous commitment to repurchase at a specified future date (repos)continue to be recognised in the unconsolidated financial statements and are measured inaccordance with accounting policies for investment securities. The counterparty liability for amountsreceived under these agreements is included in borrowings. The difference between sale andrepurchase price is treated as mark-up / return / interest expense and accrued over the life of therepo agreement using effective interest rate method.
Securities purchased with a corresponding commitment to resell at a specified future date (reverserepos) are not recognised in the unconsolidated financial statements, as the Company does not obtaincontrol over the securities. Amounts paid under these agreements are included in lendings to financialinstitutions. The difference between purchase and resale price is treated as mark-up / return / interestincome and accrued over the life of the reverse repo agreement using effective interest rate method.
4.7 Derivative financial instruments
Derivative financial instruments are initially recognised at fair value on the date on which thederivative contract is entered into and are subsequently re-measured at fair value using appropriatevaluation techniques. All derivative financial instruments are carried as assets when fair value ispositive and liabilities when fair value is negative. Any change in the fair value of derivativeinstruments is taken to the unconsolidated profit and loss account.
4.8 Trade date accounting
All regular way purchases / sales of investment are recognised on the trade date, i.e. the date the Companycommits to purchase / sell the investments. Regular way purchases or sales of investment require deliveryof securities within time frame generally established by regulations or convention in market place.
4.9 Financial instruments
Financial assets and liabilities are recognised at the time when the Company becomes party to thecontractual provision of the instrument. Financial assets are de-recognised when the contractualright to future cash flows from the asset expires or is transferred along with the risk and reward ofthe asset. Financial liabilities are de-recognised when obligation specific in the contract isdischarged, cancelled or expired. Any gain or loss on de-recognition of the financial asset and liabilityis recognised in the unconsolidated profit and loss account of the current period. The particularrecognition and subsequent measurement method for significant financial assets and financialliabilities are disclosed in the individual policy statements associated with them.
4.10 Taxation
4.10.1 Current
The charge for current taxation is based on taxable income at the current rates of taxation aftertaking into account the tax credits and tax rebates available, if any. The charge for current tax alsoincludes adjustments whenever considered necessary relating to prior year, arising fromassessments framed during the year.
4.10.2 Deferred
Deferred income tax is provided, using the balance sheet liability method, on all temporarydifferences at the statement of financial position date between the tax bases of assets and liabilitiesand their carrying amounts for financial reporting purposes.
Deferred income tax assets are recognised for all deductible temporary differences, carry forward ofunused tax assets and any unused tax losses, to the extent that it is probable that taxable profits willbe available against which the deductible temporary differences, carry forward of unused tax assetsand unused tax losses can be utilised.
The carrying amount of deferred income tax assets are reviewed at each reporting date and reducedto the extent that it is no longer probable that sufficient taxable profit will be available to allow all orpart of the deferred income tax asset to be utilised.
Deferred income tax assets and liabilities are measured at the tax rates that are expected to applyto the period when the asset is realised or the liability is settled, based on tax rates (and tax laws)that have been enacted or substantively enacted at the reporting date.
Deferred tax relating to gain / loss recognised in surplus / deficit on revaluation of assets is charged/ credited to such account.
4.11 Operating fixed assets
4.11.1 Property and equipment
4.11.1.1 Owned assets
Operating fixed assets are stated at cost less accumulated depreciation and impairment losses, ifany. Depreciation is charged to the unconsolidated profit and loss account using the straight linemethod at the rates stated in note 9.2. Depreciation is charged from the date when the asset isavailable for use and no depreciation is charged from the date when the asset is disposed off.
Subsequent costs are included in the asset’s carrying amount or recognised as a separate asset, asappropriate, only when it is probable that future economic benefits associated with the asset will flowto the Company and the cost of the asset can be measured reliably. The carrying amount of thereplaced part is derecognised. All other repairs and maintenance are charged to the unconsolidatedprofit and loss account during the financial period in which they are incurred.
Residual values and useful lives are reviewed at each reporting date and adjusted if the impact ondepreciation is considered significant.
Gain / loss on sale or disposal of fixed assets is recognised in the unconsolidated profit and loss account.
4.11.1.2 Leased assetsAssets held under finance lease are accounted for by recording the assets and the related liability.These are recorded at lower of fair value and the present value of minimum lease payments at theinception of lease and are subsequently stated net of accumulated depreciation.
Financial charges are allocated over the period of lease term so as to provide a constant periodicrate of financial charge on the outstanding finance lease liability.
Depreciation is charged on leased assets on a basis similar to that of owned assets.

Ann
ual R
epor
t 201
2Pa
k Br
unei
Inve
stm
ent C
ompa
ny L
td.
49
Ann
ual R
epor
t 201
2Pa
k Br
unei
Inve
stm
ent C
ompa
ny L
td.
48
4.11.2 Intangibles
Intangible assets are stated at cost less accumulated amortisation and impairment losses, if any.Intangible assets are amortised using the straight line method at the rate stated in note 9.3. The residual values and useful life are reviewed and adjusted, if appropriate at each reporting date.
Amortisation on addition and deletion of intangible assets during the year is charged in proportion tothe period of use.
4.11.3 Capital work-in-progress
Capital work-in-progress is stated at cost. These are transferred to specific assets as and whenassets are available for use.
4.11.4 Impairment
The carrying values of operating fixed assets are reviewed for impairment when events or changesin circumstances indicate that the carrying values may not be recoverable. If any such indicationexists and where the carrying values exceed the estimated recoverable amounts, fixed assets arewritten down to their recoverable amounts.
The resulting impairment loss is taken to unconsolidated profit and loss account. Where impairmentloss subsequently reverses, the carrying amount of the asset is increased to the revised recoverableamount but limited to the extent of the amount which would have been determined had there beenno impairment. Reversal of impairment loss is recognised as income.
4.12 Provisions
Provision is made when the Company has a legal or constructive obligation as a result of pastevents, it is probable that an outflow of resources will be required to settle the obligation and areliable estimate of amount can be made. Provisions are reviewed at each reporting date and areadjusted to reflect the current best estimates.
4.13 Borrowings / deposits
a) Borrowings / deposits are recorded at the proceeds received.
b) The cost of borrowings / deposits is recognised as an expense in the period in which it is incurred.Any difference between the proceeds and the redemption value is recognised in the unconsolidatedprofit and loss account over the period of the borrowings / deposits using the effective interestmethod.
4.14 Offsetting
Financial assets and financial liabilities are only set off and the net amount is reported in theunconsolidated financial statements when there is a legally enforceable right to set off and theCompany intends either to settle on a net basis, or to realize the assets and to settle the liabilitiessimultaneously.
4.15 Assets acquired in satisfaction of claims
The Company occasionally acquires assets in settlement of certain advances. These are stated atlower of the net realizable value of the related advances or the fair value of such assets.
4.16 Staff retirement benefits
4.16.1 Defined contribution plan
4.16.1.1 Staff provident fund
The Company operates a provident fund scheme for its employees. Equal monthly contributions aremade both by the Company and the employees to the fund at the rate of 10% of basic salary.
4.16.1.2 Compensated absences
Compensated absences of employees are accounted for in the period in which these absences areearned. During the year, the Company has terminated its compensated absences policy.Accordingly, no provision in respect of compensated absences have been made in the current yearfinancial statements.
4.17 Foreign currency translation
Foreign currency transactions are converted into Rupees by applying the exchange rate at the dateof the respective transactions. Monetary assets and liabilities in foreign currencies are translated intoRupees at the rates of exchange prevailing at the reporting date. Exchange gains and losses areincluded in income.
The Company’s unconsolidated financial statements are presented in Pak Rupees (Rs.) which is theCompany’s functional and presentation currency.
4.18 Dividend distribution
Dividend is recognised as a liability in the year in which it is approved by shareholders / directors asappropriate.
4.19 Distributions of bonus shares and other appropriations to reserves
The Company recognises all appropriations, other than statutory appropriations, to reservesincluding those in respect of bonus shares, in the year in which such appropriations are approvedby shareholders / directors as appropriate.
4.20 Earnings per share
The Company presents basic and diluted earnings per share (EPS) for its shareholders. Basic EPSis calculated by dividing the profit or loss attributable to ordinary shareholders of the Company bythe weighted average number of ordinary shares outstanding during the year. Diluted EPS isdetermined by adjusting the profit or loss attributable to ordinary shareholders and the weightedaverage number of ordinary shares outstanding for the effects of all dilutive potential ordinary shares,if any. There were no convertible dilutive potential ordinary shares in issue at December 31, 2012.
4.21 Segment Reporting
A segment is a distinguishable component of the Company that is engaged either in providingproduct or services (business segment) or in providing products or services within a particulareconomic environment (geographical segment), which is subject to risks and rewards that aredifferent from those of other segments.
4.21.1 Business Segments
Corporate financeCorporate finance includes services provided in connection with mergers and acquisitions,underwriting, privatization, securitization, research, debts (government, high yield), equity,syndication, IPO and secondary private placements.
Trading and salesIt includes fixed income, equity, foreign exchange, commodities, credit, funding, lending and repos,brokerage activities.
Commercial BankingCommercial banking includes project finance, real estate, export finance, trade finance, factoring,leasing, lending, guarantees, bill of exchange and deposits.
4.21.2 Geographical segments
The Company operates in Pakistan only.

Ann
ual R
epor
t 201
2Pa
k Br
unei
Inve
stm
ent C
ompa
ny L
td.
51
Ann
ual R
epor
t 201
2Pa
k Br
unei
Inve
stm
ent C
ompa
ny L
td.
50
4.22 Accounting estimates and judgments
The preparation of unconsolidated financial statements in conformity with the approvedaccounting standards requires the use of certain critical accounting estimates. It also requires themanagement to exercise its judgment in the process of applying the Company’s accountingpolicies. Estimates and judgments are continually evaluated and are based on historicalexperience, including expectations of future events that are believed to be reasonable under thecircumstances. The key areas where various assumptions and estimates are significant to theCompany’s unconsolidated financial statements or where judgment was exercised in applicationof accounting policies are as follows:
4.22.1 Classification of investments
i In classifying investments as ‘held-for-trading’, the Company has determined securities which areacquired with an intention to trade by taking advantage of short term market / interest ratemovements and are to be sold within 90 days.
ii In classifying investments as ‘held-to-maturity’, the Company follows the guidance provided in theSBP circulars on classifying non-derivative financial assets with fixed or determinable paymentsand fixed maturity. In making this judgment, the Company evaluates its intention and ability tohold such investment till maturity.
iii The investments which are not classified as ‘held-for-trading’ or ‘held-to-maturity’ are classifiedas ‘available-for-sale’.
4.22.2 Provision against non-performing loans and advances
The Company reviews its loan portfolio to assess amount of non-performing loans and advancesand determine provision required there against. While assessing this requirement various factorsincluding the past dues, delinquency in the account, financial position of the borrower andrequirements of Prudential Regulations are considered.
4.22.3 Impairment of available-for-sale equity investments
The Company determines that available-for-sale equity investments are impaired when there hasbeen a significant or prolonged decline in the fair value below its cost. The determination of what is"significant or prolonged" requires judgment. In making this judgment, the Company evaluatesamong other factors, the normal volatility in share price. In addition, impairment may be appropriatewhen there is evidence of deterioration in the financial health of the investee, industry and sectorperformance, changes in technology, and operational and financing cash flows.
4.22.4 Taxation
In making the estimates for income taxes currently payable by the Company, the managementconsiders the current income tax laws and the decisions of appellate authorities on certain issues inthe past.
4.22.5 Fair value of derivatives
The fair values of derivatives which are not quoted in active markets are determined by usingvaluation techniques. The valuation techniques take into account the relevant interest rates andexchange rates over the term of contract.
4.22.6 Fixed assets, depreciation and amortization
In making estimates of the depreciation / amortization method, the management uses the methodwhich reflects the pattern in which economic benefits are expected to be consumed by the Company.The method applied is reviewed at each financial year end and if there is a change in the expectedpattern of consumption of the future economic benefits embodied in the assets, the method ischanged to reflect the changed pattern.
December 31 December 31
(Rupees in ‘000)
Note 2012 2011
December 31 December 31
(Rupees in ‘000)
Note 2012 2011
5. CASH AND BALANCES WITH TREASURY BANKS
With State Bank of Pakistan inLocal currency current account 5.1 54,739 174,784
With National Bank of Pakistan inLocal currency current account 16 6
54,755 174,790
5.1 This represents the minimum cash reserve required to be maintained with the SBP in accordancewith the requirement of BSD Circular No. 04 dated May 22, 2004.
6. BALANCES WITH OTHER BANKS
In PakistanOn current accounts – –– – ––On deposit accounts 6.1 315,314 561,102
315,314 561,102
6.1 These carry mark-up at rates ranging from 5.00% to 10.30% per annum (2011: 5.00% to 10.00% per annum).
7. INVESTMENTS7.1 Investment by types
(Rupees in ‘000)
December 31, 2012 December 31, 2011
Held by Given as Held by Given asNote company collateral Total company collateral Total
Held-for-trading securities
Market Treasury Bills – –– – –– – –– 9,314 6,977,094 6,986,408Pakistan Investment Bonds – –– – –– – –– 194,855 – –– 194,855Ordinary shares of listed companies – –– – –– – –– 7,837 – –– 7,837
– –– – –– – –– 212,006 6,977,094 7,189,100
Available-for-sale securities 7.4Market Treasury Bills 7.5.1 880,117 – –– 880,117 255,771 12,985,868 13,241,639Pakistan Investment Bonds – –– – –– – –– 340,549 – –– 340,549Ordinary shares of listed companies 7.6 319,707 – –– 319,707 620,040 – –– 620,040Ordinary shares of unlisted companies 7.7 121,375 – –– 121,375 100,000 – –– 100,000Units of mutual funds 7.8 28,835 – –– 28,835 978,890 – –– 978,890Term Finance Certificates and Sukuks 7.12 2,511,797 – –– 2,511,797 3,312,763 – –– 3,312,763Preference shares 7.9 85,625 – –– 85,625 21,500 – –– 21,500
3,947,456 – –– 3,947,456 5,629,513 12,985,868 18,615,381
Held-to-maturity securities
Term Finance Certificates and Sukuks 7.12 191,230 – –– 191,230 190,406 – –– 190,406Investment in associates 7.11 2,991,134 – –– 2,991,134 – –– – –– – –– Investment in subsidiary 7.10 250,000 – –– 250,000 250,000 – –– 250,000Investments at cost 7,379,820 – –– 7,379,820 6,281,925 19,962,962 26,244,887Less: Provision for diminution in
value of Investments 7.3 (262,815) – –– (262,815) (409,752) – –– (409,752)Investments (net of provisions) 7,117,005 – –– 7,117,005 5,872,173 19,962,962 25,835,135Deficit on revaluation of
held-for-trading securities - net – –– – –– – –– (3,371) (9,829) (13,200)Surplus / (deficit) on revaluation of
available-for-sale securities - net 16.1 4,485 – –– 4,485 (68,090) (12,599) (80,689)Total investments at market value 7,121,490 – –– 7,121,490 5,800,712 19,940,534 25,741,246

Ann
ual R
epor
t 201
2Pa
k Br
unei
Inve
stm
ent C
ompa
ny L
td.
53
Ann
ual R
epor
t 201
2Pa
k Br
unei
Inve
stm
ent C
ompa
ny L
td.
52
December 31 December 31
(Rupees in ‘000)
7.2 Investments by Segments
Federal Government Securities:
Market Treasury Bills 7.5 880,117 20,228,047Pakistan Investment Bonds – –– 535,404
Fully Paid up Ordinary Shares:
Listed Companies 7.6 319,707 627,877Unlisted Companies (including subsidiary company) 7.7 & 7.10 371,375 350,000
Term Finance Certificates and Sukuks:
Listed 7.12 801,742 1,179,472Unlisted 7.12 1,901,285 2,323,697
Units of mutual funds (including associates) 7.8 & 7.11 3,019,969 978,890
Preference shares 7.9 85,625 21,500
Total investments at cost 7,379,820 26,244,887
Less: Provision for diminution in value of investments 7.3 (262,815) (409,752)
Investments (net of provisions) 7,117,005 25,835,135
Deficit on revaluation of held-for-trading securities - net – –– (13,200)Surplus / (deficit) on revaluation of available-for-sale securities - net 16.1 4,485 (80,689)Total investments at market value 7,121,490 25,741,246
7.3 Particulars of Provision
Opening balance 409,752 336,061
Charge for the year 50,899 73,691Reversal during the year (36,844) – ––
14,055 73,691Impairment on equity securities transferred
to profit and loss account on disposal (160,992) – ––Closing balance 7.3.1 262,815 409,752
7.3.1 Particulars of Provision in respect of Type and Segment
Available-for-sale securities
Ordinary shares of listed companies 29,578 184,965Units of mutual funds 3,576 3,576Preference shares 6,500 5,081Term finance certificates and sukuks 223,161 216,130
262,815 409,752
7.3.2 Investments include certain government securities which are kept with the SBP to meet StatutoryLiquidity Requirements determined on the basis of Company's demand and time liabilities.
Note 2012 20117.4 Quality of Available-for-Sale Securities
(Rupees in ‘000)
December 31, 2012 December 31, 2011Market value / Carrying value Market value / Carrying value
for unlisted investments Rating for unlisted investments Rating
Market Treasury Bills ( T - bills )
1 Year T-bills 881,769 Government 13,127,672 Government 6 month T-bills – –– Securities 101,262 Securities
881,769 13,228,934
Pakistan Investment Bonds (PIBs)
10 year PIBs – –– Government 47,291 Government 5 year PIBs – –– Securities 192,618 Securities3 year PIBs – –– 98,568
– –– 338,477
Ordinary shares of listed companies
Oil & Gas marketing /
exploration companies
Pakistan State Oil Company Limited 32,293 AA+ 20,651 AA+Pakistan Petroleum Limited 3,430 Unrated – –– –
Commercial banks
JS Bank Limited – –– – 3,524 AUnited Bank Limited 44,387 AA+ – –– –
NBFCs
KASB Securities Limited – –– – 6,720 A
Communication
Pakistan Telecommunication Company Limited 11,304 Unrated – –– –
Power generation and distribution
Kot Addu Power Company Limited 10,298 AA+ 38,059 AA+Nishat Chunian Power Limited – –– – 8,925 AA-Nishat Power Limited – –– – 1,583 AA-The Hub Power Company Limited 20,856 AA+ 133,860 AA+
Cement
D.G Khan Cement Company Limited – –– – 39,376 UnratedGharibwal Cement Limited 71,440 Unrated 45,400 D
Chemicals
Engro Corporation Limited 24,207 A 33,372 AANimir Industrial Chemicals Limited,
a related party 14,050 Unrated 11,683 Unrated
Fertilizers
Fauji Fertilizers Company Limited 40,999 Unrated – –– –Agritech Limited 14,695 D – –– –
Personal goods
Nishat Mills Limited – –– – 30,094 AA-287,959 373,247
Ordinary shares of unlisted companies
Faruki Pulp Mills Limited 100,000 Unrated 100,000 UnratedOmer Jibran Engineering Industries Limited 21,375 Unrated – –– –
121,375 100,000
Preference shares
Pakistan Mercantile Exchange Limited 15,000 BBB 15,000 BBBOmer Jibran Engineering Industries Limited 64,125 Unrated – –– –Trust Investment Bank Limited – –– Unrated 1,419 Unrated
79,125 16,419

Ann
ual R
epor
t 201
2Pa
k Br
unei
Inve
stm
ent C
ompa
ny L
td.
55
Ann
ual R
epor
t 201
2Pa
k Br
unei
Inve
stm
ent C
ompa
ny L
td.
54
(Rupees in ‘000)
December 31, 2012 December 31, 2011Market value / Carrying value Market value / Carrying value
for unlisted investments Rating for unlisted investments Rating
Units of mutual funds
ABL Cash Fund – –– – 243,535 AA+ (f)Askari Sovereign Cash Fund – –– – 243,247 AA+ (f)UBL Government Securities Fund – –– – 145,421 AA- (f)UBL Liquidity Plus Fund – –– – 243,908 AA+ (f)BMA Empress Cash Fund – –– – 50,111 AA+ (f)Pak Oman Advantage Fund 26,643 AA- (f) 26,356 AA- (f)
26,643 952,578
Term Finance Certificates (TFCs) and Sukuks
Listed TFCs
Commercial banks
Allied Bank Limited - 1st Issue 50,435 AA 50,455 AA-Allied Bank Limited - 2nd Issue 25,195 AA 25,054 AA-Askari Bank Limited - 1st Issue 581 AA- 575 AA-Askari Bank Limited - 2nd Issue 30,335 AA- 30,018 AA-Askari Bank Limited - 4th Issue 104,410 AA- 108,392 AA-Bank Al Falah Limited - 2nd Issue – –– – 9,338 AA-Bank Al Falah Limited - 3rd Issue 6,715 AA- 10,007 AA-Bank Al Habib Limited - 1st Issue – –– – 26,399 AA-Bank Al Habib Limited - 2nd Issue – –– – 15,566 AAFaysal Bank Limited - 1st Issue 5,209 AA- 4,852 AA-Faysal Bank Limited - 3rd Issue 4,940 AA- 10,170 AA-NIB Bank Limited 131,095 A+ 321,372 A+Soneri Bank Limited 2,500 A+ 7,494 A+Standard Chartered Bank
(Pakistan) Limited - 3rd Issue 2,552 AAA 7,158 AAASummit Bank Limited 89,366 A(SO) 200,000 A(SO)United Bank Limited - 1st Issue – –– – 87,650 AAUnited Bank Limited - 2nd Issue 69,744 AA 70,784 AAUnited Bank Limited - 3rd Issue 3,375 AA 5,063 AAUnited Bank Limited - 4th Issue 83,559 AA 81,635 AA
Fertilizer
Engro Chemical Limited 2,342 A+ 2,382 AAEngro Fertilizer Limited - 3rd Issue 164 A+ 185 AAPak Arab Fertilizer Limited – –– – 37,566 AA
Real estate developers
Pace Pakistan Limited – –– – 433 D
NBFCs
Saudi Pak Leasing Company Limited – –– – 25,508 D
Telecommunication
World Call Telecom Limited 21,630 D 28,562 APakistan Mobile Communication Limited 141,499 AA- – –– –
775,646 1,166,618
Unlisted TFCs and Sukuks
Commercial banks
Askari Bank Limited - 4th Issue – –– – 150,000 AA-Bank Al Habib Limited - PPTFC 2 – –– – 261,188 AA
Fertilizer
Agritech Limited - 1st Issue 2,242 D 3,293 DAgritech Limited - 4th Issue 26,361 D 42,127 DAgritech Limited - 5th Issue 5,584 D – –– –Engro Fertilizer Limited - 1st Issue 453,180 A+ 275,773 AEngro Fertilizer Limited - 2nd Issue 63,902 A+ 63,888 A
(Rupees in ‘000)
December 31, 2012 December 31, 2011Market value / Carrying value Market value / Carrying value
for unlisted investments Rating for unlisted investments Rating
Sugar
Al Abbas Sugar Mills Limited - 2nd Issue 43,718 A+ 87,046 A+JDW Sugar Mills Limited - 2nd Issue 40,769 A+ 66,593 A+
Pharmaceutical
Martin Dow Pharmaceutical Pakistan Limited 267,060 A 331,700 A
Cement
Kohat Cement Company Limited 5,738 D 17,650 UnratedMaple Leaf Cement Factory Limited - 1st Issue 337,643 D 304,133 DMaple Leaf Cement Factory Limited - 2nd Issue 2,825 D 7,628 D
NBFCs
Jahangir Siddiqui & Co. Limited 92,212 AA+ 91,715 AA
Personal goods
Azgard Nine Limited I 7,793 D – –– –Azgard Nine Limited II 4,370 D 24,980 DAzgard Nine Limited III 11,079 D – –– –
Real estate developers
Eden Housing (Private) Limited 143,363 D 208,759 D
Consumer electronics
New Allied Electronics (Private) Limited – –– D – –– DPak Elektron Limited - 3rd Issue 200,000 D 200,000 A
Oil and gas
Sui Southern Gas Company Limited – –– – 2,600 AA2,483,485 3,305,6913,880,356 18,315,346
7.5 Particulars of investments in Federal Government Securities
7.5.1 Available-for-sale
Market Treasury Bills 880,117 13,241,639Pakistan Investment Bonds – –– 340,549Carrying value (before revaluation) of investments in
federal government securities 880,117 13,582,188Surplus / (deficit) on revaluation of securities 1,652 (14,777)Market value as at December 31, 2012 881,769 13,567,411
December 31 December 31
(Rupees in ‘000)
Note 2012 2011

Ann
ual R
epor
t 201
2Pa
k Br
unei
Inve
stm
ent C
ompa
ny L
td.
57
Ann
ual R
epor
t 201
2Pa
k Br
unei
Inve
stm
ent C
ompa
ny L
td.
56
7.6 Particulars of investments in ordinary shares of listed companies - available-for-sale
Cost as at Cost as at Name of investee company December 31, December 31, December 31 December 31,
2012 2011 2012 2011
No. of shares held (Rupees in 000)
Oil and gas marketing / exploration companies
Pakistan State Oil Company Limited 139,069 90,891 33,141 26,547Pakistan Petroleum Limited 19,400 – –– 3,474 – ––
Commercial banks
JS Bank Limited – –– 2,136,000 – –– 48,242United Bank Limited 530,500 – –– 47,165 – ––
NBFCs
KASB Securities Limited – –– 2,921,617 – –– 122,968
Communication
Pakistan Telecommunication Company Limited 651,500 – –– 13,002 – ––
Power generation and distribution
Kot Addu Power Company Limited 208,500 921,079 10,324 39,665Nishat Chunian Power Limited – –– 700,000 – –– 10,764Nishat Power Limited – –– 122,204 – –– 1,911The Hub Power Company Limited 461,000 3,914,022 21,076 149,254
Cement
D.G. Khan Cement Company Limited – –– 2,069,142 – –– 53,329Gharibwal Cement Limited 8,000,000 8,136,192 66,640 67,360
Chemicals
Engro Corporation Limited 263,001 360,000 30,056 45,794Nimir Industrial Chemicals Limited, a related party 3,678,008 5,014,100 9,494 12,937
Fertilizers
Fauji Fertilizers Company Limited 350,000 – –– 41,258 – ––
Agritech Limited (see note 7.6.1) 1,259,337 – –– 44,077 – ––
Personal goods
Nishat Mills Limited – –– 743,976 – –– 41,269
Carrying value (before revaluation and provision)of listed shares 'available-for-sale' 319,707 620,040
Provision for diminution in value of investments (29,578) (184,965)Deficit on revaluation of securities - net (2,170) (61,828)Market value as at December 31, 2012 287,959 373,247
7.6.1 The SBP, vide Letter No. BPRD / BRD-(Policy) / 2013-1857 dated February 15, 2013, has permittedbanks / DFIs to maintain provision equal to 10% of the deficit on revaluation of Ordinary shares ofAgritech Limited. Accordingly, provision for diminution in value of investment includes Rs.2.938million (2011: Rs.Nil) against Ordinary shares of Agritech Limited. The required provision againstexposure amounting to Rs.26.442 million on Ordinary shares of Agritech Limited has not beenrecorded in these financial statements based upon the above relaxation from SBP.
7.7 Particulars of investments in ordinary shares of unlisted companies - available-for-sale
(Rupees in '000)
Name of December December Cost as at Cost as at Chief Executive 31, 2012 31, 2011 December December
Name of investee company Number of shares held 31, 2012 31, 2011
Faruki Pulp Mills Limited Mr. Shahid Saleem 6,666,667 6,666,667 100,000 100,000Omer Jibran Engineering
Industries Limited Mr. Feroz Khan 2,137,500 – –– 21,375 – ––
121,375 100,000
7.8 Particulars of investment in units of mutual funds - available-for-sale
Cost as at Cost as at Name of investee company December 31, December 31, December 31 December 31,
2012 2011 2012 2011
No. of units held (Rupees in 000)
Closed-end mutual fund
Pak Oman Advantage Fund 2,883,499 2,889,899 28,835 28,890
Open-end mutual funds
Askari Sovereign Cash Fund – –– 2,420,464 – –– 250,000ABL Cash Fund – –– 24,307,680 – –– 250,000BMA Express Cash Fund – –– 4,834,702 – –– 50,000UBL Government Securities Fund – –– 1,448,945 – –– 150,000UBL Liquidity Plus Fund – –– 2,427,321 – –– 250,000
Carrying value (before revaluation and provision)of mutual funds units 'available-for-sale' 28,835 978,890
Provision for diminution in value of investments (3,576) (3,576)Surplus / (deficit) on revaluation of securities - net 1,384 (22,736)Market value as at December 31, 2012 26,643 952,578
7.9 Particulars of investment in unlisted preference shares - available-for-sale
Cost as at Cost as at Name of investee company December 31, December 31, December 31 December 31,
2012 2011 2012 2011
No. of shares held (Rupees in 000)
Pakistan Mercantile Exchange Limited 7.9.1 1,500,000 1,500,000 15,000 15,000Omer Jibran Engineering Industries Limited 7.9.2 6,412,500 – –– 64,125 – ––
Trust Investment Bank Limited 7.9.3 650,000 650,000 6,500 6,500Carrying value (before revaluation
and provision) of preference shares 'available-for-sale' 85,625 21,500
Provision for diminution in value of investments (6,500) (5,081)
Market value as at December 31, 2012 79,125 16,419
7.9.1 These are cumulative, convertible, redeemable and non-participatory preference shares, carryingdividend at the rate of one year Kibor + 250 basis points per annum, of the face value of Rs.10 each.These carry call option exercisable at any time between the period of two years commencing fromsubscription date i.e. June 30, 2011.
7.9.2 These are cumulative, convertible, redeemable and non-participatory preference shares, carryingdividend at the rate of 10% per annum applicable after two years from the date of investment i.e.July 06, 2012, of the face value of Rs.10 each.These shares carry call option exercisable at any timeafter subscription date till termination of this agreement.
7.9.3 These are cumulative, convertible, redeemable and non-participatory preference shares, carryingdividend at the rate of 1 year Kibor + 1% per annum, of the face value of Rs.10 each. These sharescarry call option exercisable by the issuer between 3 to 5 years from the date of allotment i.e. May05, 2010.
Note

Ann
ual R
epor
t 201
2Pa
k Br
unei
Inve
stm
ent C
ompa
ny L
td.
59
Ann
ual R
epor
t 201
2Pa
k Br
unei
Inve
stm
ent C
ompa
ny L
td.
58
Unlisted TFCs
Fertilizer
Agritech Limited - 1st Issue * 6 Months KIBOR+1.75% Half Yearly 29-Nov-17 1,000 5,000 5,000 3,637 Mr. Ahmed Jaudet Bilal
Agritech Limited - 4th Issue * 3 Months KIBOR+3.25% Quarterly 1-Dec-17 9,000 5,000 45,000 42,766 Mr. Ahmed Jaudet Bilal
Agritech Limited - 5th Issue * 0% Coupon Half Yearly 1-Jan-15 1,672 5,000 8,360 8,360 Mr. Ahmed Jaudet Bilal
Engro Fertilizer Limited - 1st Issue 6 Months KIBOR+1.70% Half Yearly 18-Mar-18 93,450 5,000 467,250 453,180 Mr. Muhammad Ali Uddin Ansari
Engro Fertilizer Limited - 2nd Issue 6 Months KIBOR+1.25% Half Yearly 18-Mar-18 13,000 5,000 65,000 63,902 Mr. Muhammad Ali Uddin Ansari
Sugar
Al-Abbas Sugar Mills Limited - 2nd Issue 6 Months KIBOR+1.75% Half Yearly 21-Nov-13 44,000 5,000 220,000 43,718 Mr. Shunaid Qureshi
JDW Sugar Mills Limited 3 Months KIBOR+1.25% Quarterly 23-Jun-14 24,754 5,000 123,770 40,769 Mr. Jahangir Khan Tareen
Pharmaceuticals
Martin Dow Pharmaceutical (Pak) Limited - PPTFC 3 Months KIBOR+3% Monthly 31-May-15 100,000 5,000 500,000 267,060 Mr. Muhammad Javaid Akhai
NBFCs
Jahangir Siddiqui & Company Limited 6 Months KIBOR+1.70% Half Yearly 4-Jul-13 18,500 5,000 92,500 92,212 Mr. Sueman Lalani
Textiles
Azgard Nine Limited - 1st Issue * 3 Months KIBOR+1.25% Quarterly 18-Nov-15 15,000 5,000 75,000,000 7,793 Mr. Ahmed H Shaikh
Azgard Nine Limited - 2nd Issue * 6 Months KIBOR+2.20% Half Yearly 4-Dec-17 5,000 5,000 25,000,000 10,838 Mr. Ahmed H Shaikh
Azgard Nine Limited - 3rd Issue * 0% Coupon Quarterly 28-Jun-17 5,496 5,000 27,480,000 27,480 Mr. Ahmed H Shaikh
1,061,715
Unlisted sukuks
Cement
Maple Leaf Cement Factory - 1st issue 3 Months KIBOR+1.00% Quarterly 3-Dec-18 100,200 5000 501,000,000 337,643 Mr. Sayeed Tariq Saigol
Maple Leaf Cement Factory - 2nd issue 3 Months KIBOR+1.00% Quarterly 31-Mar-12 1,695 5,000 8,475,000 2,825 Mr. Sayeed Tariq Saigol
Kohat Cement Limited - Sukkuk 6 Months KIBOR+2.50% Half Yearly 20-Dec-15 5,000 5,000 25,000,000 5,738 Mr. Aizaz Mansoor Sheikh
Consumer electronics
New Allied Electronics (Private) Limited * 3 Months KIBOR+2.20% Quarterly 3-Dec-12 30,000 5,000 150,000 150,000 Mr. Mian Parvaiz Akhtar
Pak Elektron Limited 3 Months KIBOR+1.00% Quarterly 31-Mar-15 40,000 5,000 200,000 200,000 Mr. Naseem Saigol
Real estate developers
Eden Housing (Private) Limited 3 Months KIBOR+2.50% Half Yearly 29-Jun-14 66,526 5,000 332,630 143,364 Dr. Muhammad Amjad
839,570
Carrying value (before revaluation and provision) of TFCs and Sukuks 'available-for-sale' 2,703,027
Provision for diminution in value of investments (223,161)
Surplus on revaluation of securities - net 3,619
Market value as at December 31, 2012 2,483,485
* This represents non-performing term finance certificates and provision thereagainst as per the Prudential Regulations and the directivesissued by the SBP.
(Rupees) (Rupees in ‘000)
Name of the investee Rate of interest Profit Maturity Number of Paid-up Total Paid up Balance as at Name of payment certificates value per value (before December Chief
held certificate redemption) 31, 2012 Executive
7.10 Investment in subsidiary - strategic investment
(Rupees) (Rupees in ‘000)
Name of investee company Percentage Name of Breakup Number Cost as at Cost as at of holding % Chief Value of shares December December
Executive per share held 31, 2012 31, 2011
Primus Investment Mr. AhmedManagement Limited 100 Ateeq 10 24,999,997 250,000 250,000
7.11 Investment in associates
(Rupees in ‘000)
Name of investee company Percentage Number Cost as at Cost as at of holding of units December December
% held 31, 2012 31, 2011
Primus Cash Fund 96.25 29,640,508 2,991,134 – ––
7.12 Particulars of investments in Term Finance Certificates (TFCs) and Sukuks
(Rupees) (Rupees in ‘000)
Name of the investee Rate of interest Profit Maturity Number of Paid-up Total Paid up Balance as at Name of payment certificates value per value (before December Chief
held certificate redemption) 31, 2012 Executive
Listed TFCs
Commercial banks
Allied Bank Limited - 1st Issue 6 Months KIBOR+1.90% Half Yearly 6-Dec-14 10,000 5,000 50,000 49,907 Mr. Khalid Ahmed Sherwani
Allied Bank Limited - 2nd Issue 6 Months KIBOR+0.85% Half Yearly 28-Aug-19 5,000 5,000 25,000 24,298 Mr. Khalid Ahmed Sherwani
Askari Bank Limited - 4th Issue 6 Months KIBOR+2.50% Half Yearly 18-Nov-19 20,700 5,000 103,500 104,076 Mr. M.R Mehkari
Askari Bank Limited - 1st issue 6 Months KIBOR+1.50% Half Yearly 4-Feb-13 115 5,000 575 593 Mr. M.R Mehkari
Askari Bank Limited - 2nd Issue 6 Months KIBOR+1.50% Half Yearly 31-Oct-13 6,000 5,000 30,000 29,893 Mr. M.R Mehkari
Bank Alfalah Limited - 3rd Issue 6 Months KIBOR+1.50% Half Yearly 25-Nov-13 2,000 5,000 10,000 6,627 Mr. Atif Bajwa
Faysal Bank Limited 6 Months KIBOR+1.40% Half Yearly 12-Nov-14 1,031 5,000 5,153 5,137 Mr. Naved A. Khan
Faysal Bank Limited - 3rd issue 6 Months KIBOR+1.90% Half Yearly 10-Feb-13 3,946 5,000 19,730 4,928 Mr. Naved A. Khan
Summit Bank Limited 6 Months KIBOR+3.25% Half Yearly 27-Oct-18 18,200 5,000 90,975 90,958 Mr. Hussain Lawai
NIB Bank Limited 6 Months KIBOR+1.15% Half Yearly 5-Mar-16 26,410 5,000 132,050 131,016 Mr. Badar Kazmi
Standard Chartered Bank - 3rd Issue 6 Months KIBOR+2.00% Half Yearly 1-Feb-13 2,000 5,000 10,000 2,506 Mr. Mohsin Ali Nathani
Soneri Bank Limited 6 Months KIBOR+1.60% Half Yearly 5-May-13 2,000 5,000 10,000 2,499 Mr. Aftab Manzoor
United Bank Limited - 2nd Issue 9.49% Fixed Half Yearly 15-Mar-13 14,023 5,000 70,115 69,456 Mr. Atif R. Bokhari
United Bank Limited - 3rd issue 6 Months KIBOR+1.70% Half Yearly 8-Sep-14 1,000 5,000 5,000 3,332 Mr. Atif R. Bokhari
United Bank Limited - 4th issue 6 Months KIBOR+0.85% Half Yearly 14-Feb-18 16,400 5,000 82,000 81,800 Mr. Atif R. Bokhari
Fertilizer
Engro Fertilizer Limited - 3rd issue 6 Months KIBOR+2.40% Half Yearly 17-Dec-16 37 5,000 185 170 Mr. Muhammad Ali Uddin Ansari
Engro Fertilizer Limited - 2nd issue 6 Months KIBOR+1.55% Half Yearly 30-Nov-15 481 5,000 2,405 2,389 Mr. Muhammad Ali Uddin Ansari
Real estate developers
Pace Pakistan Limited * 6 Months KIBOR+1.50% Half Yearly 15-Feb-17 115 5,000 575 574 Ms. Aamna Ali Taseer
NBFCs
Saudi Pak Leasing Company Limited - 3rd Issue 6.00% Fixed Monthly 13-Mar-17 9,099 5,000 45,495 29,142 Mr. Nayyar Alam Ilyas
Telecommunication
World Call Telecom Limited 6 Months KIBOR+1.60% Half Yearly 7-Oct-13 10,000 5,000 50,000 19,941 Mr. Babar Ali Syed
Pakistan Mobile Communication Limited 3 Months KIBOR+2.65% Quarterly 18-Apr-16 1,500 100,000 150,000 142,500 Mr. Rashid Khan
801,742
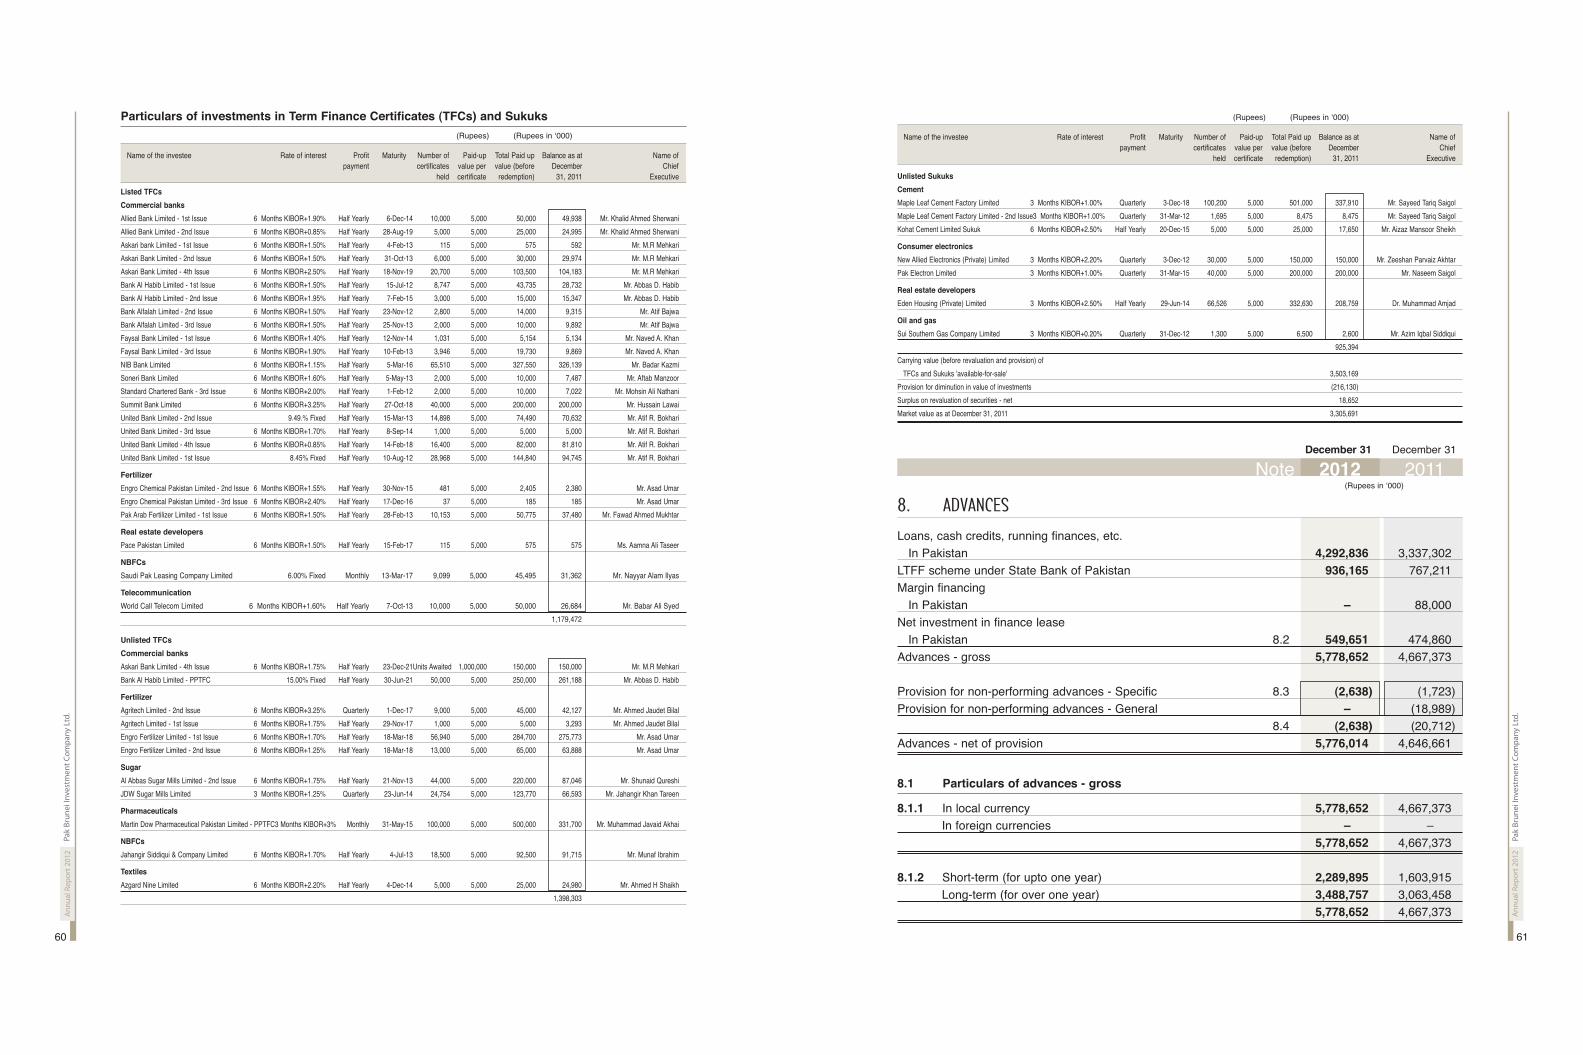
Ann
ual R
epor
t 201
2Pa
k Br
unei
Inve
stm
ent C
ompa
ny L
td.
61
Ann
ual R
epor
t 201
2Pa
k Br
unei
Inve
stm
ent C
ompa
ny L
td.
60
Particulars of investments in Term Finance Certificates (TFCs) and Sukuks
(Rupees) (Rupees in ‘000)
Name of the investee Rate of interest Profit Maturity Number of Paid-up Total Paid up Balance as at Name of payment certificates value per value (before December Chief
held certificate redemption) 31, 2011 Executive
Listed TFCs
Commercial banks
Allied Bank Limited - 1st Issue 6 Months KIBOR+1.90% Half Yearly 6-Dec-14 10,000 5,000 50,000 49,938 Mr. Khalid Ahmed Sherwani
Allied Bank Limited - 2nd Issue 6 Months KIBOR+0.85% Half Yearly 28-Aug-19 5,000 5,000 25,000 24,995 Mr. Khalid Ahmed Sherwani
Askari bank Limited - 1st Issue 6 Months KIBOR+1.50% Half Yearly 4-Feb-13 115 5,000 575 592 Mr. M.R Mehkari
Askari Bank Limited - 2nd Issue 6 Months KIBOR+1.50% Half Yearly 31-Oct-13 6,000 5,000 30,000 29,974 Mr. M.R Mehkari
Askari Bank Limited - 4th Issue 6 Months KIBOR+2.50% Half Yearly 18-Nov-19 20,700 5,000 103,500 104,183 Mr. M.R Mehkari
Bank Al Habib Limited - 1st Issue 6 Months KIBOR+1.50% Half Yearly 15-Jul-12 8,747 5,000 43,735 28,732 Mr. Abbas D. Habib
Bank Al Habib Limited - 2nd Issue 6 Months KIBOR+1.95% Half Yearly 7-Feb-15 3,000 5,000 15,000 15,347 Mr. Abbas D. Habib
Bank Alfalah Limited - 2nd Issue 6 Months KIBOR+1.50% Half Yearly 23-Nov-12 2,800 5,000 14,000 9,315 Mr. Atif Bajwa
Bank Alfalah Limited - 3rd Issue 6 Months KIBOR+1.50% Half Yearly 25-Nov-13 2,000 5,000 10,000 9,892 Mr. Atif Bajwa
Faysal Bank Limited - 1st Issue 6 Months KIBOR+1.40% Half Yearly 12-Nov-14 1,031 5,000 5,154 5,134 Mr. Naved A. Khan
Faysal Bank Limited - 3rd Issue 6 Months KIBOR+1.90% Half Yearly 10-Feb-13 3,946 5,000 19,730 9,869 Mr. Naved A. Khan
NIB Bank Limited 6 Months KIBOR+1.15% Half Yearly 5-Mar-16 65,510 5,000 327,550 326,139 Mr. Badar Kazmi
Soneri Bank Limited 6 Months KIBOR+1.60% Half Yearly 5-May-13 2,000 5,000 10,000 7,487 Mr. Aftab Manzoor
Standard Chartered Bank - 3rd Issue 6 Months KIBOR+2.00% Half Yearly 1-Feb-12 2,000 5,000 10,000 7,022 Mr. Mohsin Ali Nathani
Summit Bank Limited 6 Months KIBOR+3.25% Half Yearly 27-Oct-18 40,000 5,000 200,000 200,000 Mr. Hussain Lawai
United Bank Limited - 2nd Issue 9.49.% Fixed Half Yearly 15-Mar-13 14,898 5,000 74,490 70,632 Mr. Atif R. Bokhari
United Bank Limited - 3rd Issue 6 Months KIBOR+1.70% Half Yearly 8-Sep-14 1,000 5,000 5,000 5,000 Mr. Atif R. Bokhari
United Bank Limited - 4th Issue 6 Months KIBOR+0.85% Half Yearly 14-Feb-18 16,400 5,000 82,000 81,810 Mr. Atif R. Bokhari
United Bank Limited - 1st Issue 8.45% Fixed Half Yearly 10-Aug-12 28,968 5,000 144,840 94,745 Mr. Atif R. Bokhari
Fertilizer
Engro Chemical Pakistan Limited - 2nd Issue 6 Months KIBOR+1.55% Half Yearly 30-Nov-15 481 5,000 2,405 2,380 Mr. Asad Umar
Engro Chemical Pakistan Limited - 3rd Issue 6 Months KIBOR+2.40% Half Yearly 17-Dec-16 37 5,000 185 185 Mr. Asad Umar
Pak Arab Fertilizer Limited - 1st Issue 6 Months KIBOR+1.50% Half Yearly 28-Feb-13 10,153 5,000 50,775 37,480 Mr. Fawad Ahmed Mukhtar
Real estate developers
Pace Pakistan Limited 6 Months KIBOR+1.50% Half Yearly 15-Feb-17 115 5,000 575 575 Ms. Aamna Ali Taseer
NBFCs
Saudi Pak Leasing Company Limited 6.00% Fixed Monthly 13-Mar-17 9,099 5,000 45,495 31,362 Mr. Nayyar Alam Ilyas
Telecommunication
World Call Telecom Limited 6 Months KIBOR+1.60% Half Yearly 7-Oct-13 10,000 5,000 50,000 26,684 Mr. Babar Ali Syed
1,179,472
Unlisted TFCs
Commercial banks
Askari Bank Limited - 4th Issue 6 Months KIBOR+1.75% Half Yearly 23-Dec-21Units Awaited 1,000,000 150,000 150,000 Mr. M.R Mehkari
Bank Al Habib Limited - PPTFC 15.00% Fixed Half Yearly 30-Jun-21 50,000 5,000 250,000 261,188 Mr. Abbas D. Habib
Fertilizer
Agritech Limited - 2nd Issue 6 Months KIBOR+3.25% Quarterly 1-Dec-17 9,000 5,000 45,000 42,127 Mr. Ahmed Jaudet Bilal
Agritech Limited - 1st Issue 6 Months KIBOR+1.75% Half Yearly 29-Nov-17 1,000 5,000 5,000 3,293 Mr. Ahmed Jaudet Bilal
Engro Fertilizer Limited - 1st Issue 6 Months KIBOR+1.70% Half Yearly 18-Mar-18 56,940 5,000 284,700 275,773 Mr. Asad Umar
Engro Fertilizer Limited - 2nd Issue 6 Months KIBOR+1.25% Half Yearly 18-Mar-18 13,000 5,000 65,000 63,888 Mr. Asad Umar
Sugar
Al Abbas Sugar Mills Limited - 2nd Issue 6 Months KIBOR+1.75% Half Yearly 21-Nov-13 44,000 5,000 220,000 87,046 Mr. Shunaid Qureshi
JDW Sugar Mills Limited 3 Months KIBOR+1.25% Quarterly 23-Jun-14 24,754 5,000 123,770 66,593 Mr. Jahangir Khan Tareen
Pharmaceuticals
Martin Dow Pharmaceutical Pakistan Limited - PPTFC3 Months KIBOR+3% Monthly 31-May-15 100,000 5,000 500,000 331,700 Mr. Muhammad Javaid Akhai
NBFCs
Jahangir Siddiqui & Company Limited 6 Months KIBOR+1.70% Half Yearly 4-Jul-13 18,500 5,000 92,500 91,715 Mr. Munaf Ibrahim
Textiles
Azgard Nine Limited 6 Months KIBOR+2.20% Half Yearly 4-Dec-14 5,000 5,000 25,000 24,980 Mr. Ahmed H Shaikh
1,398,303
Unlisted Sukuks
Cement
Maple Leaf Cement Factory Limited 3 Months KIBOR+1.00% Quarterly 3-Dec-18 100,200 5,000 501,000 337,910 Mr. Sayeed Tariq Saigol
Maple Leaf Cement Factory Limited - 2nd Issue3 Months KIBOR+1.00% Quarterly 31-Mar-12 1,695 5,000 8,475 8,475 Mr. Sayeed Tariq Saigol
Kohat Cement Limited Sukuk 6 Months KIBOR+2.50% Half Yearly 20-Dec-15 5,000 5,000 25,000 17,650 Mr. Aizaz Mansoor Sheikh
Consumer electronics
New Allied Electronics (Private) Limited 3 Months KIBOR+2.20% Quarterly 3-Dec-12 30,000 5,000 150,000 150,000 Mr. Zeeshan Parvaiz Akhtar
Pak Electron Limited 3 Months KIBOR+1.00% Quarterly 31-Mar-15 40,000 5,000 200,000 200,000 Mr. Naseem Saigol
Real estate developers
Eden Housing (Private) Limited 3 Months KIBOR+2.50% Half Yearly 29-Jun-14 66,526 5,000 332,630 208,759 Dr. Muhammad Amjad
Oil and gas
Sui Southern Gas Company Limited 3 Months KIBOR+0.20% Quarterly 31-Dec-12 1,300 5,000 6,500 2,600 Mr. Azim Iqbal Siddiqui
925,394
Carrying value (before revaluation and provision) of
TFCs and Sukuks 'available-for-sale' 3,503,169
Provision for diminution in value of investments (216,130)
Surplus on revaluation of securities - net 18,652
Market value as at December 31, 2011 3,305,691
(Rupees) (Rupees in ‘000)
Name of the investee Rate of interest Profit Maturity Number of Paid-up Total Paid up Balance as at Name of payment certificates value per value (before December Chief
held certificate redemption) 31, 2011 Executive
8. ADVANCES
Loans, cash credits, running finances, etc.In Pakistan 4,292,836 3,337,302
LTFF scheme under State Bank of Pakistan 936,165 767,211Margin financing
In Pakistan – –– 88,000Net investment in finance lease
In Pakistan 8.2 549,651 474,860Advances - gross 5,778,652 4,667,373
Provision for non-performing advances - Specific 8.3 (2,638) (1,723)Provision for non-performing advances - General – –– (18,989)
8.4 (2,638) (20,712)Advances - net of provision 5,776,014 4,646,661
8.1 Particulars of advances - gross
8.1.1 In local currency 5,778,652 4,667,373In foreign currencies – –– – ––
5,778,652 4,667,373
8.1.2 Short-term (for upto one year) 2,289,895 1,603,915Long-term (for over one year) 3,488,757 3,063,458
5,778,652 4,667,373
December 31 December 31
(Rupees in ‘000)
Note 2012 2011

Ann
ual R
epor
t 201
2Pa
k Br
unei
Inve
stm
ent C
ompa
ny L
td.
63
Ann
ual R
epor
t 201
2Pa
k Br
unei
Inve
stm
ent C
ompa
ny L
td.
62
8.2 Net Investment in Finance Lease
(Rupees in ‘000)
2012 2011Not later Later than Total Not later Later than Totalthan one one year than one one yea
year and less than year and less thanfive years five years
Lease rentals receivable 210,581 334,411 544,992 180,713 315,038 495,751
Residual value 12,264 81,423 93,687 – –– 72,874 72,874
Minimum lease payments 222,845 415,834 638,679 180,713 387,912 568,625
Financial charges for future periods (49,437) (39,591) (89,028) (56,490) (37,275) (93,765)
Present value of minimum lease payments 173,408 376,243 549,651 124,223 350,637 474,860
8.2.1 These leases are executed for a term of 3 to 5 years. Security deposit has been obtained within arange of 10% to 20% of the cost of investment at the time of disbursement and has been recordedin other liabilities. The rate of return ranges from 12.40% to 20.16% per annum (2011: 14.68% to21.18% per annum). Lease rentals are receivable in monthly / quarterly installments. The assets areinsured in favour of the Company.
8.3 Advances include Rs.2.638 million (2011: Rs.2.992 million) which have been placed under non-performing status as detailed below:
(Rupees in ‘000)
2012
Classified advances Provision required Provision held
Domestic Overseas Total Domestic Overseas Total Domestic Overseas Total
Category of
Classification
Other assets especially mentioned – –– – –– – –– – –– – –– – –– – –– – –– – ––
Substandard – –– – –– – –– – –– – –– – –– – –– – –– – ––
Doubtful – –– – –– – –– – –– – –– – –– – –– – –– – ––
Loss 2,638 – –– 2,638 2,638 – –– 2,638 2,638 – –– 2,638
2,638 – –– 2,638 2,638 – –– 2,638 2,638 – –– 2,638
2011
Classified advances Provision required Provision held
Domestic Overseas Total Domestic Overseas Total Domestic Overseas Total
Category of
Classification
Other assets especially
mentioned – –– – –– – –– – –– – –– – –– – –– – –– – ––Substandard – –– – –– – –– – –– – –– – –– – –– – –– – ––Doubtful 2,537 – –– 2,537 1,268 – –– 1,268 1,268 – –– 1,268Loss 455 – –– 455 455 – –– 455 455 – –– 455
2,992 – –– 2,992 1,723 – –– 1,723 1,723 – –– 1,723
8.4 Particulars of provision against non-performing advances
(Rupees in ‘000)
2012 2011
Specific General Total Specific General Total
Opening balance 1,723 18,989 20,712 1,684 5,845 7,529
Charge for the year 1,268 – –– 1,268 1,089 13,144 14,233
Reversal (353) (18,989) (19,342) (1,050) – –– (1,050)
915 (18,989) (18,074) 39 13,144 13,183
Closing balance 2,638 – –– 2,638 1,723 18,989 20,712
8.4.1 Particulars of provisions against non-performing advances
(Rupees in ‘000)
2012 2011
Specific General Total Specific General Total
In local currency 2,638 – –– 2,638 1,723 18,989 20,712
In foreign currencies – –– – –– – –– – –– – –– – ––
2,638 – –– 2,638 1,723 18,989 20,712
8.5 Particulars of Loans and Advances to Directors,
Associated Companies, etc.
Debts due by directors, executives or officers of the Company or any of them either severally or jointly with any other persons:
Balance at beginning of the year 44,416 38,429Loans granted during the year 13,761 18,224Repayments (13,763) (12,237)Balance at end of the year 44,414 44,416
8.6 Details of loans written offs of Rs.500,000 and above
The detail is given in Annexure-I.
9. OPERATING FIXED ASSETS
Capital work-in-progress 9.1 – –– 14,049Property and equipment 9.2 52,520 18,727Intangible assets 9.3 1,956 1,291
54,476 34,067
9.1 Capital work-in-progress
Advance to supplier – –– 14,049
December 31 December 31
(Rupees in ‘000)
Note 2012 2011

Ann
ual R
epor
t 201
2Pa
k Br
unei
Inve
stm
ent C
ompa
ny L
td.
65
Ann
ual R
epor
t 201
2Pa
k Br
unei
Inve
stm
ent C
ompa
ny L
td.
64
9.2 Property and equipment
(Rupees in ‘000)
December 31, 2012
COST DEPRECIATION Book value
As at Additions / Written As at As at Charge Written As at as at Rate ofJanuary (Disposals) off December January for the off December December depreciation
01, 2012 31, 2012 01, 2012 year 31, 2012 31, 2012
Owned
Furniture and fixture 8,066 5,453 – – 13,519 4,678 2,472 – – 7,150 6,369 20%
– – – –
Leasehold improvement 10,446 42,321 (10,446) 42,321 6,246 7,119 (6,692) 6,673 35,648 20%
– – – –
Office equipment 2,735 1,106 – – 3,841 1,753 694 – – 2,447 1,394 20%
– – – –
Computers 9,355 2,739 – – 12,037 7,582 1,748 – – 9,315 2,722 33.33%
(57) (15)
Vehicles 10,276 42 – – 10,318 2,025 1,986 – – 4,011 6,307 25%
– – – –
Mobile sets 241 67 – – 256 108 96 – – 176 80 50%
(52) (28)
41,119 51,728 (10,446) 82,292 22,392 14,115 (6,692) 29,772 52,520
(109) (43)
December 31, 2011
COST DEPRECIATION Book value
As at Additions / Transfers As at As at Charge Transfers As at as at Rate ofJanuary (Disposals) December January for the December December depreciation
01, 2011 31, 2011 01, 2011 year 31, 2011 31, 2011
Owned
Furniture and fixture 8,047 19 – 8,066 3,066 1,612 – 4,678 3,388 20%– – – –
Leasehold improvement 10,661 – – – 10,446 4,257 2,122 – 6,246 4,200 20%(215) (133)
Office equipment 2,706 42 (13) 2,735 1,220 536 (3) 1,753 982 20%– – – –
Computers 8,528 919 13 9,355 6,092 1,592 3 7,582 1,773 33.33%(105) (105) –
Vehicles 6,901 7,875 – 10,276 3,489 1,605 – 2,025 8,251 25%(4,500) (3,069)
Mobile sets 187 167 – 241 144 77 – 108 133 50%(113) (113)
37,030 9,022 – 41,119 18,268 7,544 – 22,392 18,727(4,933) (3,420)
9.2.1 Assets having cost of Rs.15.221 million (2011: Rs.12.834 million) are fully depreciated.
9.2.2 Details of disposal of fixed assets
Details of assets whose original cost or the book value exceeds rupees one million or two hundredand fifty thousand, whichever is lower are given below:
Rupees in ‘000)
Cost Net Book Sale Gain Mode of Particulars ofParticulars Value proceeds Disposal Purchaser
Property and equipment
(having book value of less than Rs.250,000 Various Employees / or cost of less than Rs.1,000,000) 109 66 71 5 Insurance
Company
2012 109 66 71 5
2011 4,932 1,512 1,581 (69)
Details of write offsLeasehold improvement 10,446 3,754 – –– (3,754)
9.3 Intangible assets
(Rupees in ‘000)
December 31, 2012
COST AMORTIZATION Book valueAs at Additions As at As at Charge for As at as at Rate of
January December January the year December December Amortization01, 2012 31, 2012 01, 2012 31, 2012 31, 2012
Computer software 8,772 1,708 10,480 7,481 1,043 8,524 1,956 33.33%
December 31, 2011
COST AMORTIZATION Book valueAs at Additions As at As at Charge for As at as at Rate of
January December January the year December December Amortization01, 2011 31, 2011 01, 2011 31, 2011 31, 2011
Computer software 7,998 774 8,772 5,848 1,633 7,481 1,291 33.33%
10. DEFERRED TAX LIABILITIES - NET
Deductible temporary differences
Provision for compensated absences and bonus 8,400 8,003Unrealised loss on revaluation of held-for-trading securities – –– 4,340Deficit on revaluation of securities - net – –– 12,576Provision for diminution in the value of investments 69,981 66,397Provision against non-performing loans and advances 923 7,249Provision against other assets 17,500 17,458
Taxable temporary differences
Difference between accounting book value of fixed assets and tax base (7,247) (2,303)Amortisation of discount on investments (27,196) (86,972)Net investment in finance lease (45,692) (25,270)Amortisation of transaction cost – –– (1,668)Surplus on revaluation of securities - net (3,367) – ––
13,302 (190)
December 31 December 31
(Rupees in ‘000)
2012 2011

Ann
ual R
epor
t 201
2Pa
k Br
unei
Inve
stm
ent C
ompa
ny L
td.
67
Ann
ual R
epor
t 201
2Pa
k Br
unei
Inve
stm
ent C
ompa
ny L
td.
66
10.1 Movement in temporary differences during the year(Rupees in ‘000)
Balance Recognised Recognised in Balance Recognised Recognised in Balance as as at in profit (surplus)/deficit as at in profit (surplus)/deficit as at
January 01, and loss in revaluation of December 31, and loss in revaluation of December 31,2011 account assets account 2011 account assets account 2012
Deductible temporary differencesProvision for compensated
absences and bonus 5,030 2,973 – – 8,003 397 – – 8,400Unrealised loss on revaluation of
held-for-trading securities – – 4,340 – – 4,340 (4,340) – – – –(Surplus) / Deficit on revaluation of
securities - net 11,348 – – 1,228 12,576 – – (15,943) (3,367)Provision for diminution
in the value of investments 60,030 6,367 – – 66,397 3,584 – – 69,981Provision against non-performing
loans and advances 2,635 4,614 – – 7,249 (6,326) – – 923Provision against other assets 17,625 (167) – – 17,458 42 – – 17,500
Taxable temporary differenceDifference between accounting
book value of fixed assets and tax base (1,649) (654) – – (2,303) (4,944) – – (7,247)
Amortisation of discount on investments (136,221) 49,249 – – (86,972) 59,777 – – (27,196)
Net investment in finance lease (8,465) (16,805) – – (25,270) (20,422) – – (45,692)Amortisation of transaction cost – – (1,668) – – (1,668) 1,668 – – – –
(49,667) 48,249 1,228 (190) 29,435 (15,943) 13,302
December 31 December 31
(Rupees in ‘000)
Note 2012 2011
December 31 December 31
(Rupees in ‘000)
2012 2011
December 31 December 31
(Rupees in ‘000)
Note 2012 2011
11. OTHER ASSETS
Income / mark-up accrued in local currency 278,490 353,588Assets acquired in satisfaction of claims - non-banking assets 11.1 209,652 209,652Advances, deposits and other prepayments 73,195 86,315Unrealised gain on interest rate swap contracts – –– 119Advance tax (payment less provision) 139,007 105,118Dividend receivable 59,281 23,187Receivable from Subsidiary - Primus Investment Management Limited 635 2,948Receivable against sale of shares – –– 27,756
760,260 808,683Less: Provision held against advances, deposits and
other prepayments 11.2 & 11.3 (50,000) (50,000)Other assets (net of provisions) 710,260 758,683
11.1 This represents properties acquired in satisfaction of claims. The market value of properties as perthe valuation report dated December 31, 2012 amounted to Rs.224 million (2011: Rs.220 million).
11.2 This represents Rs.50 million (2011: Rs.50 million) advance against Pre-IPO placement of TermFinance Certificates.
11.3 Provision against other assets
Opening balance 50,000 50,000Charge for the year – –– – ––Closing balance 50,000 50,000
12. BORROWINGS
In Pakistan 2,417,139 23,359,531Outside Pakistan – –– – ––
2,417,139 23,359,531
12.1 Particulars of borrowings with respect to Currencies
In local currency 2,417,139 23,359,531In foreign currencies – –– – ––
2,417,139 23,359,531
12.2 Details of borrowings secured / unsecured
Secured
Borrowing from SBP under LTFF Scheme 12.3 937,139 767,209Repurchase agreement borrowings (Repo) – –– 20,350,655Borrowing from Banks 12.4 1,100,000 1,666,667
2,037,139 22,784,531Unsecured
Letters of placement 12.5 380,000 575,0002,417,139 23,359,531
12.3 The Company has entered into agreements for financing with the SBP for Long Term Financing underExport Oriented Projects to customers. According to the terms of the respective agreements, the SBPhas the right to receive the outstanding amount from the Company at the due date by directly debitingthe current account maintained by the Company with SBP. The rate of return ranges from 7.25% to9.70% per annum (2011: 7.25% to 9.70% per annum). This is repayable within 7 years (2011: 8 years).
12.4 These represent borrowings secured against hypothecation of receivables and floating charge overterm finance certificates. These carry mark-up at rate ranging from 9.94% to 10.18% per annum(2011: 12.43% to 14.42% per annum) and are repayable within 2 years (2011: 3 years).
12.5 These carry mark-up at rate ranging from 9.40% to 12.00% per annum (2011: 11.65% to 12.00% perannum) and are repayable within 2 months (2011: 1 month).
13. DEPOSITS AND OTHER ACCOUNTS
Customers
Certificates of investment- remunerative 13.1 2,824,924 979,018
13.1 These carry mark-up at rates ranging from 9.70% to 12.00% per annum (2011: 11.50% to 13.85%per annum) and are repayable within 1 month to 11 months (2011: 1 month to 10 months).
13.2 Particulars of deposits
In local currency 2,824,924 979,018In foreign currencies – –– – ––
2,824,924 979,018
December 31 December 31
(Rupees in ‘000)
Note 2012 2011

Ann
ual R
epor
t 201
2Pa
k Br
unei
Inve
stm
ent C
ompa
ny L
td.
69
Ann
ual R
epor
t 201
2Pa
k Br
unei
Inve
stm
ent C
ompa
ny L
td.
68
14. OTHER LIABILITIES
Mark-up / return / interest payable in local currency 67,096 96,793Accrued expenses 26,833 32,491Advance against Certificates of Investment – –– 26,971Payable against purchase of shares – –– 5,862Brokerage commission payable 63 1,609Unearned commission 4,786 2,904Security deposit against lease 93,688 72,874Others 30,547 38,601
223,013 278,105
15. SHARE CAPITAL
15.1 Authorised Capital
16. SURPLUS / (DEFICIT) ON REVALUATION OF ASSETS - NET OF TAX
16.1 Surplus / (deficit) on revaluation ofavailable-for-sale securities - net of tax
Market Treasury Bills 1,652 (12,705)Pakistan Investment Bonds – –– (2,072)Listed securities
- Term finance certificates 3,619 18,652- Units of open-ended mutual funds – –– (23,779)- Units of closed-end mutual funds 1,384 1,043- Ordinary shares of listed companies (2,170) (61,828)
4,485 (80,689)Deferred tax (liability) / asset recognised (3,367) 12,576
1,118 (68,113)
December 31 December 31
(Rupees in ‘000)
2012 2011
2012 2011 2012 2011Number of shares (Rupees in ‘000)
600,000,000 600,000,000 Ordinary shares of Rs. 10/- each. 6,000,000 6,000,000
15.2 Issued, subscribed and paid up capital
600,000,000 600,000,000 Ordinary shares fully paid in cash 6,000,000 6,000,000
15.3 The Ministry of Finance and Secretary Economic Affairs Division holds 299,995,999 and 4,001 shares(2011: 299,995,999 and 4,001 shares) respectively on behalf of the Government of Pakistan andremaining 300,000,000 shares (2011: 300,000,000 shares) are held by the Brunei Investment Agency.
December 31 December 31
(Rupees in ‘000)
2012 2011
17. CONTINGENCIES AND COMMITMENTS
17.1 Transaction related contingent liability
Letters of credit 152,293 158,884
17.2 In the year 2009, Burj Bank Limited (formerly Dawood Islamic Bank Limited) filed a legal suit amountingto Rs.200 million for damages against the Company for alleged non performance of underwritingcommitment to issue shares at a premium. Legal advisors of the Company are of the opinion that thepossibility of the Company being subject to any liability in relation to the suit is negligible.
17.3 Tax contingencies have been discussed in note 25.2 to these unconsolidated financial statements.
17.4 Commitments in respect of capital expenditure – –– 28,134
17.5 Commitments to extend credit 716,013 392,750
17.6 Commitments in respect of government securities
Purchase (reverse repo) – –– 464,944
Sale – –– 20,502,275
18. DERIVATIVE INSTRUMENTS
The Company is involved in derivative transactions comprising of Interest Rate Swaps with acommercial bank. Accounting policies in respect of derivative financial instruments are mentionedin note 4.7.
18.1 Product Analysis
(Rupees in ‘000)
December 31, 2012 December 31, 2011Interest Rate Swaps Interest Rate Swaps
Counter parties with banks for No. of contracts Notional Principal No. of contracts Notional Principal
Hedging – –– – –– – – ––
Market Making – –– – –– 2 200,000
– –– – –– 2 200,000
December 31 December 31
(Rupees in ‘000)
2012 2011
December 31 December 31
(Rupees in ‘000)
2012 2011

Ann
ual R
epor
t 201
2Pa
k Br
unei
Inve
stm
ent C
ompa
ny L
td.
71
Ann
ual R
epor
t 201
2Pa
k Br
unei
Inve
stm
ent C
ompa
ny L
td.
70
18.2 Maturity analysis
(Rupees in ‘000)
December 31, 2012Mark to Market
Remaining maturity No. of contracts Notional Principal Negative Positive Net
Within 1 year – – – – –
(Rupees in ‘000)
December 31, 2011Mark to Market
Remaining maturity No. of contracts Notional Principal Negative Positive Net
1 to 2 years 2 200,000 (5,984) 6,103 119
19. MARK-UP / RETURN / INTEREST EARNED
On Loans and advances to:
Customers 685,225 511,800Financial institutions 32,619 19,232
On Investments in:
Available-for-sale securities 2,015,636 1,764,451Held-to-maturity securities 26,442 29,577Held-for-trading securities 120,700 2,328
On Deposits with financial institutions 12,725 17,833On Securities purchased under resale agreements 18,636 49,517On Interest rate swap contracts – –– 9
2,911,983 2,394,747
20. MARK-UP / RETURN / INTEREST EXPENSED
Deposits 310,203 234,292Short-term borrowings 103,108 111,994Long-term borrowings 209,945 72,268Securities sold under repurchase agreements 1,421,559 1,050,723
2,044,815 1,469,277
21. GAIN ON SALE OF SECURITIES - NET
Federal Government Securities- Market Treasury Bills 62,368 90,374- Pakistan Investment Bonds 41,354 (684)Ordinary shares of listed companies 67,733 2,079Term finance certificates 6,469 35,802Units of mutual funds 12,488 5,131
190,412 132,702
22. OTHER INCOME
Profit on sale of property and equipment 5 69Rent income 750 – –Income from sale of scrap items 468 – –Others 30 193
1,253 262
23. ADMINISTRATIVE EXPENSES
Salaries and allowances 96,796 106,710Contribution to defined contribution plan 29 4,423 4,512Non-executive directors' fees, allowances and other expenses 1,607 3,234Rent, taxes, insurance, electricity, etc. 19,554 16,362Legal and professional charges 9,365 5,879Travelling and accommodation 1,975 3,574Communications 2,147 2,050Repairs and maintenance 5,392 3,544Brokerage commission 13,620 12,759Stationery and printing 1,619 1,899Advertisement and publicity 574 641Donation 23.1 & 23.2 1,100 4,120Auditors' remuneration 23.3 767 2,500Depreciation 9.2 14,115 7,544Amortisation 9.3 1,043 1,633Vehicle maintenance and fuel expense 17,794 16,002Medical expense 2,056 2,625Fee and subscription 792 4,915Bank charges 391 236Others 2,279 2,364
197,409 203,103
23.1 Donations were not made to any donee in which a director or his / her spouse had any interest atany time during the year.
23.2 Donations made in excess of Rs. 100,000 to a single donee are as follows:
Institute of Business Administration 1,000 1,000Prime Minister's Flood Relief Fund – –– 3,000Citizen's Foundation – –– 120
Donations not exceeding Rs.100,000 - others 100 – –1,100 4,120
December 31 December 31
(Rupees in ‘000)
2012 2011
December 31 December 31
(Rupees in ‘000)
Note 2012 2011
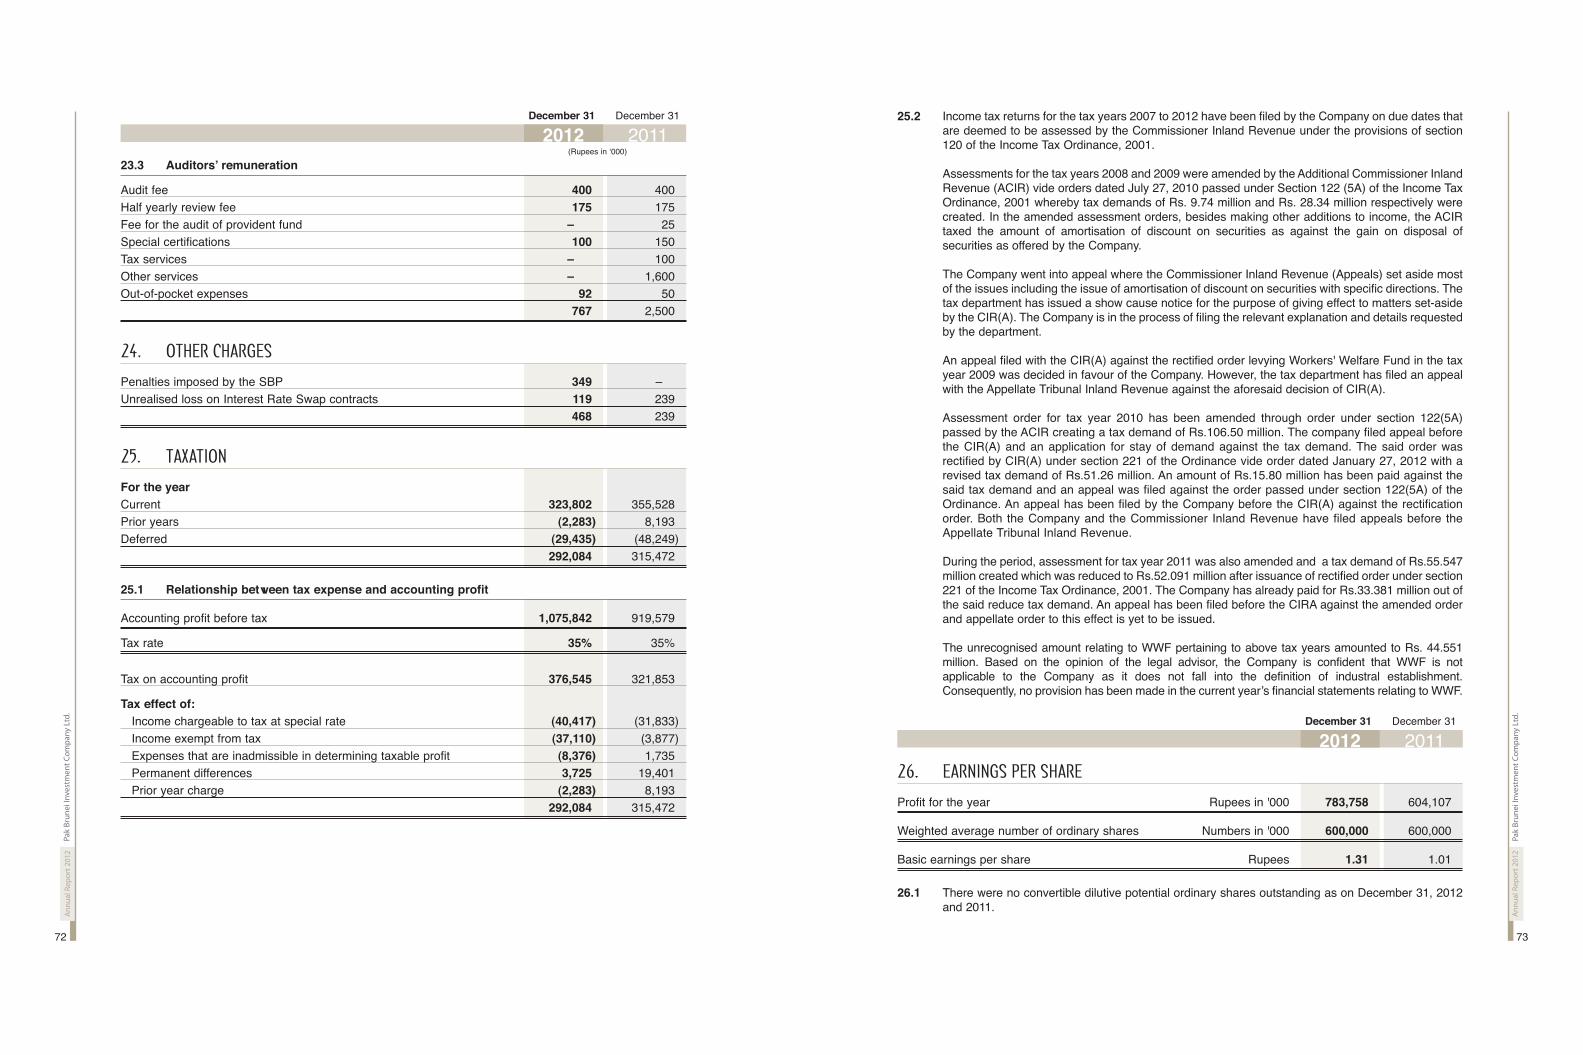
Ann
ual R
epor
t 201
2Pa
k Br
unei
Inve
stm
ent C
ompa
ny L
td.
73
Ann
ual R
epor
t 201
2Pa
k Br
unei
Inve
stm
ent C
ompa
ny L
td.
72
December 31 December 31
(Rupees in ‘000)
2012 201123.3 Auditors’ remuneration
Audit fee 400 400Half yearly review fee 175 175Fee for the audit of provident fund – –– 25Special certifications 100 150Tax services – –– 100Other services – –– 1,600Out-of-pocket expenses 92 50
767 2,500
24. OTHER CHARGES
Penalties imposed by the SBP 349 – –Unrealised loss on Interest Rate Swap contracts 119 239
468 239
25. TAXATION
For the year
Current 323,802 355,528Prior years (2,283) 8,193Deferred (29,435) (48,249)
292,084 315,472
25.1 Relationship between tax expense and accounting profit
Accounting profit before tax 1,075,842 919,579
Tax rate 35% 35%
Tax on accounting profit 376,545 321,853
Tax effect of:
Income chargeable to tax at special rate (40,417) (31,833)Income exempt from tax (37,110) (3,877)Expenses that are inadmissible in determining taxable profit (8,376) 1,735Permanent differences 3,725 19,401Prior year charge (2,283) 8,193
292,084 315,472
25.2 Income tax returns for the tax years 2007 to 2012 have been filed by the Company on due dates thatare deemed to be assessed by the Commissioner Inland Revenue under the provisions of section120 of the Income Tax Ordinance, 2001.
Assessments for the tax years 2008 and 2009 were amended by the Additional Commissioner InlandRevenue (ACIR) vide orders dated July 27, 2010 passed under Section 122 (5A) of the Income TaxOrdinance, 2001 whereby tax demands of Rs. 9.74 million and Rs. 28.34 million respectively werecreated. In the amended assessment orders, besides making other additions to income, the ACIRtaxed the amount of amortisation of discount on securities as against the gain on disposal ofsecurities as offered by the Company.
The Company went into appeal where the Commissioner Inland Revenue (Appeals) set aside mostof the issues including the issue of amortisation of discount on securities with specific directions. Thetax department has issued a show cause notice for the purpose of giving effect to matters set-asideby the CIR(A). The Company is in the process of filing the relevant explanation and details requestedby the department.
An appeal filed with the CIR(A) against the rectified order levying Workers' Welfare Fund in the taxyear 2009 was decided in favour of the Company. However, the tax department has filed an appealwith the Appellate Tribunal Inland Revenue against the aforesaid decision of CIR(A).
Assessment order for tax year 2010 has been amended through order under section 122(5A)passed by the ACIR creating a tax demand of Rs.106.50 million. The company filed appeal beforethe CIR(A) and an application for stay of demand against the tax demand. The said order wasrectified by CIR(A) under section 221 of the Ordinance vide order dated January 27, 2012 with arevised tax demand of Rs.51.26 million. An amount of Rs.15.80 million has been paid against thesaid tax demand and an appeal was filed against the order passed under section 122(5A) of theOrdinance. An appeal has been filed by the Company before the CIR(A) against the rectificationorder. Both the Company and the Commissioner Inland Revenue have filed appeals before theAppellate Tribunal Inland Revenue.
During the period, assessment for tax year 2011 was also amended and a tax demand of Rs.55.547million created which was reduced to Rs.52.091 million after issuance of rectified order under section221 of the Income Tax Ordinance, 2001. The Company has already paid for Rs.33.381 million out ofthe said reduce tax demand. An appeal has been filed before the CIRA against the amended orderand appellate order to this effect is yet to be issued.
The unrecognised amount relating to WWF pertaining to above tax years amounted to Rs. 44.551million. Based on the opinion of the legal advisor, the Company is confident that WWF is notapplicable to the Company as it does not fall into the definition of industral establishment.Consequently, no provision has been made in the current year’s financial statements relating to WWF.
26. EARNINGS PER SHARE
Profit for the year Rupees in '000 783,758 604,107
Weighted average number of ordinary shares Numbers in '000 600,000 600,000
Basic earnings per share Rupees 1.31 1.01
26.1 There were no convertible dilutive potential ordinary shares outstanding as on December 31, 2012and 2011.
December 31 December 31
2012 2011
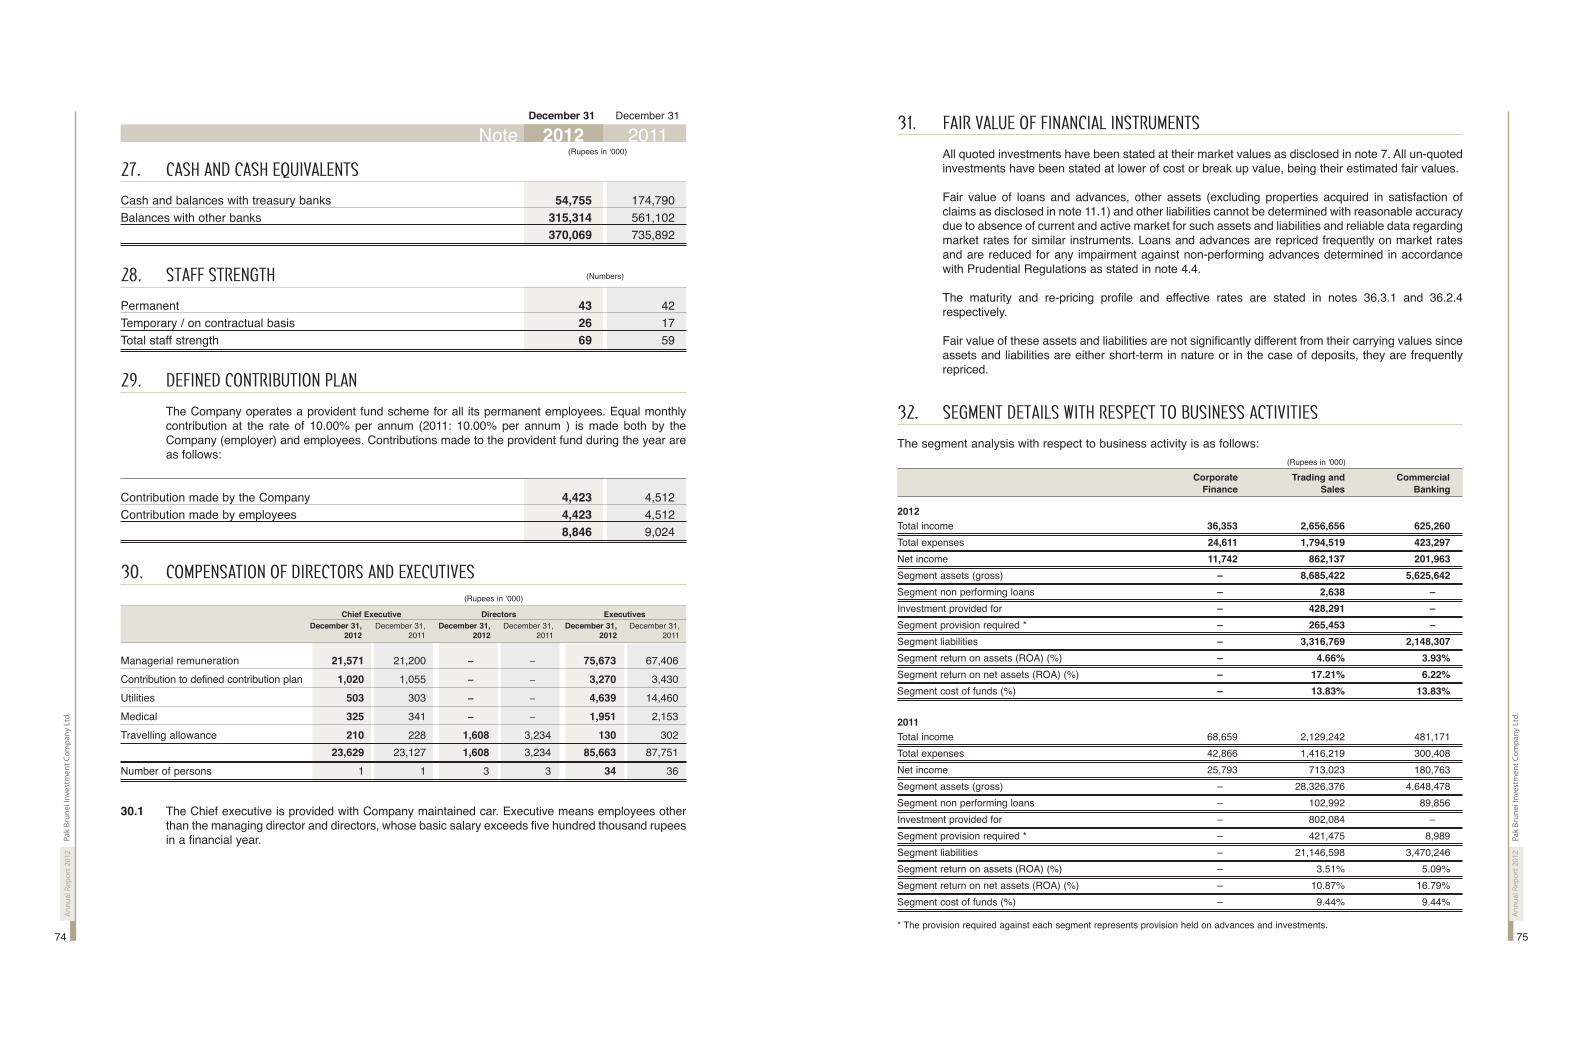
Ann
ual R
epor
t 201
2Pa
k Br
unei
Inve
stm
ent C
ompa
ny L
td.
75
Ann
ual R
epor
t 201
2Pa
k Br
unei
Inve
stm
ent C
ompa
ny L
td.
74
December 31 December 31
(Rupees in ‘000)
Note 2012 2011
27. CASH AND CASH EQUIVALENTS
Cash and balances with treasury banks 54,755 174,790Balances with other banks 315,314 561,102
370,069 735,892
28. STAFF STRENGTH
Permanent 43 42Temporary / on contractual basis 26 17Total staff strength 69 59
29. DEFINED CONTRIBUTION PLAN
The Company operates a provident fund scheme for all its permanent employees. Equal monthlycontribution at the rate of 10.00% per annum (2011: 10.00% per annum ) is made both by theCompany (employer) and employees. Contributions made to the provident fund during the year areas follows:
Contribution made by the Company 4,423 4,512Contribution made by employees 4,423 4,512
8,846 9,024
30. COMPENSATION OF DIRECTORS AND EXECUTIVES(Rupees in ‘000)
Chief Executive Directors Executives
December 31, December 31, December 31, December 31, December 31, December 31,2012 2011 2012 2011 2012 2011
Managerial remuneration 21,571 21,200 – –– – –– 75,673 67,406
Contribution to defined contribution plan 1,020 1,055 – –– – –– 3,270 3,430
Utilities 503 303 – –– – –– 4,639 14,460
Medical 325 341 – –– – –– 1,951 2,153
Travelling allowance 210 228 1,608 3,234 130 302
23,629 23,127 1,608 3,234 85,663 87,751
Number of persons 1 1 3 3 34 36
30.1 The Chief executive is provided with Company maintained car. Executive means employees otherthan the managing director and directors, whose basic salary exceeds five hundred thousand rupeesin a financial year.
(Numbers)
31. FAIR VALUE OF FINANCIAL INSTRUMENTS
All quoted investments have been stated at their market values as disclosed in note 7. All un-quotedinvestments have been stated at lower of cost or break up value, being their estimated fair values.
Fair value of loans and advances, other assets (excluding properties acquired in satisfaction ofclaims as disclosed in note 11.1) and other liabilities cannot be determined with reasonable accuracydue to absence of current and active market for such assets and liabilities and reliable data regardingmarket rates for similar instruments. Loans and advances are repriced frequently on market ratesand are reduced for any impairment against non-performing advances determined in accordancewith Prudential Regulations as stated in note 4.4.
The maturity and re-pricing profile and effective rates are stated in notes 36.3.1 and 36.2.4respectively.
Fair value of these assets and liabilities are not significantly different from their carrying values sinceassets and liabilities are either short-term in nature or in the case of deposits, they are frequentlyrepriced.
32. SEGMENT DETAILS WITH RESPECT TO BUSINESS ACTIVITIES
The segment analysis with respect to business activity is as follows:(Rupees in '000)
Corporate Trading and Commercial
Finance Sales Banking
2012
Total income 36,353 2,656,656 625,260
Total expenses 24,611 1,794,519 423,297
Net income 11,742 862,137 201,963
Segment assets (gross) – –– 8,685,422 5,625,642
Segment non performing loans – –– 2,638 – ––
Investment provided for – –– 428,291 – ––
Segment provision required * – –– 265,453 – ––
Segment liabilities – –– 3,316,769 2,148,307
Segment return on assets (ROA) (%) – –– 4.66% 3.93%
Segment return on net assets (ROA) (%) – –– 17.21% 6.22%
Segment cost of funds (%) – –– 13.83% 13.83%
2011
Total income 68,659 2,129,242 481,171
Total expenses 42,866 1,416,219 300,408
Net income 25,793 713,023 180,763
Segment assets (gross) – –– 28,326,376 4,648,478
Segment non performing loans – –– 102,992 89,856
Investment provided for – –– 802,084 – ––
Segment provision required * – –– 421,475 8,989
Segment liabilities – –– 21,146,598 3,470,246
Segment return on assets (ROA) (%) – –– 3.51% 5.09%
Segment return on net assets (ROA) (%) – –– 10.87% 16.79%
Segment cost of funds (%) – –– 9.44% 9.44%
* The provision required against each segment represents provision held on advances and investments.

Ann
ual R
epor
t 201
2Pa
k Br
unei
Inve
stm
ent C
ompa
ny L
td.
77
Ann
ual R
epor
t 201
2Pa
k Br
unei
Inve
stm
ent C
ompa
ny L
td.
76
(Rupees in '000)
2012 2011Key Other Subsidiary Associates Key Other Subsidiary Associates
management related management related personnel parties personnel parties
Advances
As at beginning of the year 23,286 474,000 – –– – –– 20,063 – –– – –– – ––
Given during the period 8,634 300,000 – –– – –– 8,263 479,000 – –– – ––
Transfer * (8,106) 8,106 – –– – –– – –– – –– – –– – ––
Repaid during the period (8,294) (80,435) – –– – –– (5,040) (5,000) – –– – ––
As at end of the year 15,520 701,671 – –– – –– 23,286 474,000 – –– – ––
Borrowings
As at beginning of the year – –– – –– – –– – –– – –– – –– – –– – ––
Given during the period – –– 500,000 – –– – –– – –– – –– – –– – ––
Repaid during the period – –– (500,000) – –– – –– – –– – –– – –– – ––
As at end of the year – –– – –– – –– – –– – –– – –– – –– – ––
Placements
As at beginning of the year – –– – –– – –– – –– – –– – –– – –– – ––
Placements made during the year – –– – –– – –– – –– – –– – –– – –– – ––
Placements matured during the year – –– – –– – –– – –– – –– – –– – –– – ––
As at end of the year – –– – –– – –– – –– – –– – –– – –– – ––
Investments
As at beginning of the year – –– 15,000 250,000 – –– – –– – –– – –– – ––
Investments made during the year – –– 98,437 – –– 3,975,000 – –– 15,000 250,000 – ––
Transfer – –– (15,000) – –– – –– – –– – –– – –– – ––
Redemption during the year – –– (3,462) – –– (983,866) – –– – –– – –– – ––
As at end of the year – –– 94,975 250,000 2,991,134 – –– 15,000 250,000 – ––
Mark-up / return / interest earned 681 83,205 – –– – –– 642 36,966 – –– – ––
Mark-up / return / interest expensed – –– 1,342 – –– – –– – –– – –– – –– – ––
Gain on sale of securities - net – –– 1,862 – –– 16,133 – –– – –– – –– – ––
Fee income – –– 20,250 – –– – –– – –– – –– – –– – ––
Dividend income – –– – –– – –– 99,522 – –– – –– – –– – ––
Salaries and other benefits 66,032 – –– – –– – –– 64,880 – –– – –– – ––
Reimbursement of expenses 4,036 – –– – –– – –– 10,013 – –– – –– – ––
Expenses charged to thesubsidiary company 34.1 & 34.2 – –– – –– 1,526 – –– – –– – –– – –– – ––
* This represents advance given to key management person of the Company. During the year, the said key management person wasappointed as a Chief Executive Officer of the Subsidiary Company.
34.1 The transactions with related parties during the year include costs (administrative expenses)charged by the Company under the cost sharing agreement entered into between the Company andits Subsidiary.
34.2 During the year, the Company has provided certain administrative and management services to itsSubsidiary free of charge.
33. TRUST ACTIVITIES
The Company has assumed the role of Trustee to certain issues of Term Finance Certificates (TFCs)/ Sukuks and is holding the trust properties in fiduciary capacity on behalf of the relevant beneficiaries.In this behalf, the Company is fulfilling all its obligations and duties in accordance with the provisionsof the respective trust documents. During the year, the Company has been registered as DebtSecurities Trustee (DST) under the Debt Securities Trustee Regulations 2012 issued by the SECP.
The Company is acting as trustee to Term Finance Certificates issued by Agritech Limited, Al AbbasSugar Mills Limited, Askari Bank Limited–IV, Azgard Nine Limited, Bank Alfalah Limited–IV, BankAlfalah Limited–V, Bank Al-Habib Limited–IV, Faysal Bank Limited, Martin Dow PharmaceuticalsLimited, Soneri Bank Limited, United Bank Limited–IV, and Sukuk Issue of Agritech Limited, AishaSteel Mills Limited and Maple Leaf Cement Factory Limited. The combined value of these TFCs asat December 31, 2012 amounted to PKR 45,050 million (2011: PKR 28,442 million).
34. RELATED PARTY TRANSACTIONS
The Company has related party relationship with:l subsidiary company (Primus Investment Management Limited)
l associated company (collective investment schemes of Primus Investment Management Limited)
l its employee defined contribution plan;
l its key management personnel;
l other related parties include OK Feed Mills (Pvt) Limited, Omer Jibran Engineering IndustriesLimited, Nimir Industrial Chemicals Limited and Haq Bahu Sugar Mills (Pvt) Limited due tocommon directorship.
Details of loans and advances to the executives are given in note 8.5 to these unconsolidatedfinancial statements. There are no transactions with key management personnel other than undertheir terms of employment. Contribution to approved defined contribution plan are disclosed in note29 to these unconsolidated financial statements. Remuneration to the executives is disclosed in note30 to the unconsolidated financial statements. Transactions with owners have been disclosed in'Unconsolidated Statement of Changes in Equity'. All other transactions between the Company andits related parties are carried out under normal course of business except employee staff loans thatare as per terms of employment.
Details of transactions with related parties during the year, other than those which have beendisclosed elsewhere in these unconsolidated financial statements, are as follows:
Notes

Ann
ual R
epor
t 201
2Pa
k Br
unei
Inve
stm
ent C
ompa
ny L
td.
79
Ann
ual R
epor
t 201
2Pa
k Br
unei
Inve
stm
ent C
ompa
ny L
td.
78
Tier II CapitalGeneral Provisions subject to 1.25% of Total Risk Weighted Assets – –– – ––
– –– – ––
Less: Other deductions (50% of investments in equity and other regulatory capital of majority owned securities or other financial subsidiaries not consolidated in the statement of financial position) 125,000 125,000Total Tier II Capital (125,000) (125,000)
Eligible Tier III Capital – –– – ––
Total Regulatory Capital Base 8,327,461 7,663,679
35.3 Risk Weighted Exposures
(Rupees in ‘000)
Capital Requirements Risk Weighted Assets
December 31, 2012 December 31, 2011 December 31, 2012 December 31, 2011
Credit risk
Portfolios subject to standardised approachOn balance sheet exposuresClaims
On Public sector entities in Pakistan 3,107 12,514 31,067 125,142On Banks 6,307 14,533 63,066 145,333On Corporates 901,250 592,157 9,012,505 5,921,570Categorised as retail portfolio 1,168 943 11,684 9,428Fully secured by residential property 1,009 1,115 10,092 11,146Unlisted equity investments 30,075 15,000 300,750 150,000On Listed equity investments and
regulatory capital instruments 64,155 152,234 641,553 1,522,340Past due loans – –– 127 – –– 1,268On investments in fixed assets 5,252 3,278 52,520 32,775On all other assets 45,676 27,577 456,756 275,765
1,057,999 819,478 10,579,993 8,194,767
Off balance sheet exposuresNon-market related 74,124 43,323 741,243 433,230Market related – –– 2 – –– 24
74,124 43,325 741,243 433,2541,132,123 862,803 11,321,236 8,628,021
Market risk
Capital requirement for portfolios subject to standardised approach
Interest rate risk 1,764 146,145 22,050 1,826,813Equity position risk 47,984 65,010 599,800 812,625Foreign exchange risk – –– – –– – –– – ––
49,748 211,155 621,850 2,639,438Operational risk
Capital requirement for operational risks 159,375 147,124 1,992,188 1,839,050Total 1,341,246 1,221,082 13,935,274 13,106,509
Capital adequacy ratio
Total eligible regulatory capital held (note: 36.2) (a) 8,327,461 7,663,679
Total risk weighted assets (b) 13,935,274 13,106,509
Capital adequacy ratio (a) / (b) 59.76% 58.47%
35. CAPITAL - ASSESSMENT AND ADEQUACY
35.1 Scope of Application and Capital StructureThe Basel II Framework is applicable to the Company for determining Capital Adequacy both atconsolidated level (comprising of fully owned subsidiary - Primus Investment Management Limited)and also on stand alone basis. The purpose of this legislation is to provide a modern prudentialframework for credit institutions and investment firms across the globe, improving on the previousBasel I Framework through greater risk sensitivity and reflecting more modern approaches andimprovements in the risk management practices of credit institutions and investment firms. Thedifferent tiers of regulatory capital recognised by SBP are as follows:
Tier I capital, includes fully paid-up capital, balance in share premium account, general reserves as perthe financial statements and net un-appropriated profits after deduction of book value of goodwill /intangibles, deficit on revaluation of available-for-sale investments and 50% of investments in equityand other regulatory capital of majority owned securities or other financial subsidiaries not consolidatedin the statement of financial position as per the guidelines laid under the Basel II Framework.
Tier II capital includes general provisions for loan losses, reserves on the revaluation of fixed assetsand equity investments, foreign exchange translation reserves and subordinated debts (uptomaximum of 50% of total eligible tier I capital) after deduction of 50% of investments in equity andother regulatory capital of majority owned securities or other financial subsidiaries not consolidatedin the statement of financial position as per the guidelines laid under the Basel II Framework.
Tier III capital has also been prescribed by the SBP for managing market risk. However theCompany does not have any Tier III capital.
The required capital adequacy is achieved by the Company through:
a) enhancement in the risk profile of asset mix at the existing volume level;b) ensuring better recovery management; andc) maintaining acceptable profit margins.
35.2 Capital Adequacy
The risk weighted assets to capital ratio is calculated in accordance with the State Bank's guidelineson capital adequacy. Details of Company's eligible capital on an unconsolidated basis is as follows:
Regulatory Capital Base
Tier I Capital
Shareholders equity / assigned capital 6,000,000 6,000,000Reserves 555,884 399,132Unappropriated profits 2,023,533 1,596,527
8,579,417 7,995,659
Less: Goodwill, other intangible assets and deficit on account ofrevaluation of available-for-sale portfolio etc. 1,956 1,291
Shortfall in provisions required against classified assets irrespectiveof any relaxation allowed – –– – ––
Deficit on account of revaluation of investments held in AFS category – –– 80,689
Other deductions (50% of investments in equity and other regulatory capitalof majority owned securities or other financial subsidiaries notconsolidated in the statement of financial position) 125,000 125,000
126,956 206,980Total Tier I Capital 8,452,461 7,788,679
December 31 December 31
(Rupees in ‘000)
2012 2011
December 31 December 31
(Rupees in ‘000)
2012 2011

Ann
ual R
epor
t 201
2Pa
k Br
unei
Inve
stm
ent C
ompa
ny L
td.
81
Ann
ual R
epor
t 201
2Pa
k Br
unei
Inve
stm
ent C
ompa
ny L
td.
80
35.3.1 Credit risk approach
The Company is following standardised approach for all its Credit Risk Exposures. Understandardised approach, the capital requirement is based on the credit rating assigned to the counterparties by the External Credit Assessment Institutions (ECAIs) duly recognised by SBP for capitaladequacy purposes. In this connection, the Company utilises the credit ratings assigned by ECAIsand has recognised agencies such as PACRA (Pakistan Credit Rating Agency), JCR-VIS (JapanCredit Rating Company – Vital Information Systems), Fitch, Moody’s and Standard & Poors whichare also recognised by the SBP.
The Standardised Approach to credit risk sets out fixed risk weights corresponding, whereappropriate, to external credit assessment levels or for unrated claims.
35.3.1.1 Selection of ECAIsThe Company selects particular ECAI(s) for each type of claim. Amongst the ECAIs that have beenrecognised as eligible by SBP, the following are being used against each respective claim type.
Exposures to Public Sector Entities (PSEs): For PSE exposures, ratings of PACRA and JCR-VIS areused to arrive at risk weights.
Bank Exposures: For foreign banks (i.e., incorporated outside Pakistan), ratings of Moody’s, S&Pand Fitch is being used to arrive at risk weights. However, for local banks (i.e., incorporated inPakistan) ratings of PACRA and JCR-VIS are used.
Corporate Exposures: Ratings assigned by PACRA and JCR-VIS are used for claims on Corporates(excluding equity exposures).
35.3.1.2 Use of ECAI RatingsThe Company prefers solicited ratings over unsolicited ratings at all times, owing to the greaterdegree of accuracy (in general) associated with solicited ratings as compared to unsolicited ratings.Unsolicited ratings may only be used in cases where a solicited rating is not available.
35.3.1.3 Mapping to SBP Rating GradesThe selected final ratings (after application of the principles stated above) for all exposures need tobe translated to the standard rating grades given by the SBP.
35.3.1.4 Types of exposures and ECAI's used
Exposures JCR-VIS PACRA MOODY's FITCH S & P
Corporate √ √ - - -
Banks √ √ - - -
SME’s N/A N/A N/A N/A N/A
Sovereigns N/A N/A N/A N/A N/A
Securitisation N/A N/A N/A N/A N/A
Others N/A N/A N/A N/A N/A
35.3.1.5 Credit exposures subject to Standardized Approach
(Rupees in ‘000)
December 31, 2012
Rating Rating Amount Deduction Risk weighted
Exposures category No. risk weighted outstanding CRM* Net amount asset
Cash and Cash Equivalents 0% ––– ––– ––– –––
Corporate 0 0% ––– ––– ––– –––
1 20% 1,305,591 ––– 1,305,591 261,118
2 50% 2,427,106 ––– 2,427,106 1,213,553
3,4 100% 204,376 ––– 204,376 204,376
5,6 150% 1,159,391 ––– 1,159,391 1,739,087
Unrated 100% 5,594,371 ––– 5,594,371 5,594,371
10,690,835 ––– 10,690,835 9,012,505
Retail 0% ––– ––– ––– –––
20% ––– ––– ––– –––
50% ––– ––– ––– –––
75% 15,579 ––– 15,579 11,684
15,579 ––– 15,579 11,684
Banks
- Over 3 Months 0% ––– ––– ––– –––
1 20% ––– ––– ––– –––
2,3 50% ––– ––– ––– –––
4,5 100% ––– ––– ––– –––
6 150% ––– ––– ––– –––
Unrated 50% ––– ––– ––– –––
––– ––– ––– –––
- Maturity upto and under 3 Months in FCY 0% ––– ––– ––– –––
1,2,3 20% ––– ––– ––– –––
4,5 50% ––– ––– ––– –––
6 150% ––– ––– ––– –––
Unrated 20% ––– ––– ––– –––
––– ––– ––– –––
- Maturity upto and under 3 Months in PKR 0% ––– ––– ––– –––
20% 315,330 ––– 315,330 63,066
315,330 ––– 315,330 63,066
Residential mortgage finance 35% 28,835 ––– 28,835 10,092
Public Sector Entity 0% ––– ––– ––– –––
1 20% 155,335 ––– 155,335 31,067
2,3 50% ––– ––– ––– –––
4,5 100% ––– ––– ––– –––
6 150% ––– ––– ––– –––
Unrated 50% ––– ––– ––– –––
155,335 ––– 155,335 31,067
Sovereigns (SBP / GoP) 0% 54,739 ––– 54,739 –––
Equity Investments - Listed 100% 641,553 ––– 641,553 641,553
- Unlisted 150% 200,500 ––– 200,500 300,750
842,053 ––– 842,053 942,303
Past Due Loans
(Not Secured by Residential Mortgages) S.P less than 20% 150% ––– ––– ––– –––
S.P upto 20% 100% ––– ––– ––– –––
S.P greater than 50% 50% ––– ––– ––– –––
––– ––– ––– –––
Investment in fixed assets 100% 52,520 ––– 52,520 52,520
Other assets 100% 456,756 ––– 456,756 456,756
Total 12,611,982 ––– 12,611,982 10,579,993
* Credit Risk Mitigation (CRM)

Ann
ual R
epor
t 201
2Pa
k Br
unei
Inve
stm
ent C
ompa
ny L
td.
83
Ann
ual R
epor
t 201
2Pa
k Br
unei
Inve
stm
ent C
ompa
ny L
td.
82
Credit exposures and comparative figures subject to the standardised approach(Rupees in ‘000)
December 31, 2011
Rating Rating Amount Deduction Risk weightedExposures category No. risk weighted outstanding CRM* Net amount asset
Cash and Cash Equivalents 0% ––– ––– ––– –––
Corporate 0 0% ––– ––– ––– –––
1 20% 1,500,436 ––– 1,500,436 300,087
2 50% 1,614,216 ––– 1,614,216 807,108
3,4 100% 238,216 ––– 238,216 238,216
5,6 150% 814,474 ––– 814,474 1,221,711
Unrated 100% 3,354,448 ––– 3,354,448 3,354,448
7,521,790 ––– 7,521,790 5,921,570
Retail 0% ––– ––– ––– –––
20% ––– ––– ––– –––
50% ––– ––– ––– –––
75% 12,571 ––– 12,571 9,428
12,571 ––– 12,571 9,428
Banks
- Over 3 Months 0% ––– ––– ––– –––
1 20% ––– ––– ––– –––
2,3 50% ––– ––– ––– –––
4,5 100% ––– ––– ––– –––
6 150% ––– ––– ––– –––
Unrated 50% ––– ––– ––– –––
––– ––– ––– –––
- Maturity upto and under 3 Months in FCY 0% ––– ––– ––– –––
1,2,3 20% ––– ––– ––– –––
4,5 50% ––– ––– ––– –––
6 150% ––– ––– ––– –––
Unrated 20% ––– ––– ––– –––
––– ––– ––– –––
- Maturity upto and under 3 Months in PKR 0% ––– ––– ––– –––
20% 726,667 ––– 726,667 145,333
726,667 ––– 726,667 145,333
Residential Mortgage Finance 35% 31,845 ––– 31,845 11,146
Public Sector Entity 0% ––– ––– ––– –––
1 20% 613,163 ––– 613,163 122,633
2,3 50% ––– ––– ––– –––
4,5 100% ––– ––– ––– –––
6 150% ––– ––– ––– –––
Unrated 50% 5,018 ––– 5,018 2,509
618,181 ––– 618,181 125,142
Sovereigns (SBP / GoP) 0% 306,859 ––– 306,859 –––
Equity Investments - Listed 100% 1,522,340 ––– 1,522,340 1,522,340
- Unlisted 150% 100,000 ––– 100,000 150,000
1,622,340 ––– 1,622,340 1,672,340
Past Due Loans
(Not Secured by Residential Mortgages) S.P less than 20% 150% ––– ––– ––– –––
S.P upto 20% 100% 1,268 ––– 1,268 1,268
S.P greater than 50% 50% ––– ––– ––– –––
1,268 ––– 1,268 1,268
Investment in fixed assets 100% 32,775 ––– 32,775 32,775
Other assets 100% 275,765 ––– 275,765 275,765
Total 11,150,061 ––– 11,150,061 8,194,767
* Credit Risk Mitigation (CRM)
35.4 Capital management
Objectives of managing capital
Capital Management aims to ensure that there is sufficient capital to meet the capital requirements ofthe Company as determined by the underlying business strategy and the minimum requirements ofthe SBP. The Capital Management process is governed by the Company’s Asset and LiabilityCommittee (ALCO). ALCO is responsible for managing the Company’s capital position vis-à-visinternal as well as regulatory requirements. ALCO also reviews the volume and mix of the Company’sassets, liabilities and funding sources in light of liquidity, capital, risk and profitability considerations.
Company's capital management seeks:l to comply with the capital requirements set by the regulators and the capital is comparable to
the peers;
l to increase strategic and tactical flexibility in the deployment of capital to allow for the timelyreallocation of capital;
l to improve the liquidity of the Company’s assets to allow for an optimal deployment of theCompany’s resources;
l to protect the Company against unexpected events and maintain strong ratings;
l to safeguard the Company's ability to continue as a going concern so that it can continue toprovide adequate return to shareholders;
l availability of adequate capital (including the quantum) at a reasonable cost so as to enable theCompany to expand; and
l to achieve overall low cost of capital with appropriate mix of capital elements.
Externally Imposed Capital Requirements
The paid-up capital and CAR of the Company stands at Rs.6 billion and 59.76% of its risk weightedexposure as at December 31, 2012 respectively.
36. RISK MANAGEMENT
The Risk Management Framework (the Framework) provides principles for identifying, assessing,and monitoring risk within the Company. The Framework specifies the key elements of the riskmanagement process in order to maximise opportunities, to minimise adversity and to achieveimproved outcomes and outputs based on informed decision making.
Categories of Risk
The Company generates most of its revenues by accepting Credit, Liquidity and Market Risk.Effective management of these risks is the decisive factor in our profitability. In addition, theCompany is subject to certain consequential risks that are common to all business undertakings.These risks are grouped under two headings: Operational and Reputational Risk. The Framework isorganized with reference to these five risk categories, as detailed below:
Credit Risk This risk is defined as the possibility of loss due to unexpected default or adeterioration of credit worthiness of a counter party.
Market Risk The risk of loss generated by adverse changes in the price of assets or contractscurrently held by the Company (this risk is also known as price risk).
Liquidity Risk The risk that the Company is unable to meet its payment obligations or fundincreases in assets when they fall due without incurring an unacceptable cost; theconsequences of which may be the failure to meet obligations to repay investorsand fulfill commitments to lend.

Ann
ual R
epor
t 201
2Pa
k Br
unei
Inve
stm
ent C
ompa
ny L
td.
85
Ann
ual R
epor
t 201
2Pa
k Br
unei
Inve
stm
ent C
ompa
ny L
td.
84
Operational Risk Operational risk is the risk of loss resulting from inadequate or failed internalprocesses, people, and systems or from external events. The definition includeslegal risk.
Reputational Risk The risk of failing to meet the standards of performance or behavior required orexpected by stakeholders in commercial activities or the way in which businessis conducted.
Risk responsibilities
The Board of Directors (the Board) is accountable for overall supervision of the risk managementprocess. The Board is responsible for approval of all risk policies and ensuring that these areproperly implemented. Further, the Board appoints the senior management personnel who arecapable of managing the risk activities conducted by the Company.
A separate unit has been set up for credit risk management. Risk Management comprises of twoareas; Credit Risk Management (CRM) and Middle Office and Operational Risk (MOOR). CRMoversees credit risk taken by the Company while MOOR function overviews market, interest rate,liquidity and operational risks of the Company. The functions of both of these units are subject tothe policies and manuals approved by the Board, Prudential Regulations and additional regulatorydirectives issued from time to time. These units are independent of business generation and risktaking. CRM monitors the credit portfolio of the Company on a regular basis to ensure prudentlending. Moreover, this department will also set parameters for various risks including i) sectoralconcentration, ii) exposure limits for single and group clients, and iii) monitoring watch list accountsand the entire portfolio. The risk management philosophy is to identify and monitor risk on portfoliobasis and assess the risk taking capacity of the balance sheet as a whole.
Different Management Committees have been set up to review different kinds of risks; mainly beingthe Assets and Liabilities Committee (ALCO), Credit Committee (CC) and Risk ManagementCommittee (RMC). Comprehensive risk management manuals have been designed which cover allsignificant risks including credit, liquidity, market and operational risks and provides guidance tomanagement on risk controls, limits, risk measurement tools and a reporting framework.
36.1 Credit risk
Credit risk, the potential default of one or more debtors, is the largest source of risk for the Company.The Company is exposed to credit risk through its lending and investment activities. The credit riskarising from exposure to corporates is governed by the Credit Risk Management Policy and CreditAdministration Frameworks. The counter party credit risk arising from interbank lines are addressedin the Treasury policy framework.
The Company manages 3 principal sources of credit risk:
i) Sovereign credit risk on its public sector advances.ii) Non-sovereign credit risk on its private sector advances.iii) Counterparty credit risk on interbank limits.
Sovereign credit risk
When the Company lends to public sector borrowers, it prefers obtaining a full sovereignguarantee or the equivalent from the Government of Pakistan (GoP). However, certainpublic sector enterprises have a well defined cash flow stream and appropriate businessmodel, based on which the lending is secured through collaterals other than GoP guarantee.
Non-Sovereign Credit Risk
When the Company lends to private sector borrowers it does not benefit from sovereignguarantees or the equivalent. Consequently, each borrower’s credit worthiness is analyzed ona stand alone basis. A new internal rating model to rate corporate and commercial customershas been designed and its framework has been approved by the Board in July, 2011. The newmodel has been running under parallel testing with the old model in December, 2012.
Counter Party Credit Risk on Interbank Limits
In the normal course of its business, the Company’s Treasury utilizes products such asReverse Repo and call lending to meet the needs of the borrowers and manage itsexposure to fluctuations in market interest rates and to temporarily invest its liquidity priorto disbursement. All of these financial instruments involve, to varying degrees, the risk thatthe counterparty in the transaction may be unable to meet its obligation to the Company.
Reflecting a preference for minimizing exposure to counterparty credit risk, the Companymaintains eligibility criteria that link the exposure limits to counterparty credit ratings byexternal rating agencies. For example, the minimum rating for counterparties to be eligiblefor a financing relationship with the Company is BBB.
Credit administration
Credit Administration Department is involved in minimizing losses that could arise due to securityand documentation deficiencies.
Risk analytics
To ensure a prudent distribution of asset portfolio, the Company manages its lending and investmentactivities within a framework of Borrower, Group, Product, Geographical and Sector exposure limitsand risk profile benchmarks.
Stress testing
The Company also conducts stress testing of its existing portfolio, which includes all assets, i.e.,advances as well as investments. This exercise is conducted on a semi-annual basis throughassigning shocks to distressed / non performing assets of the Company and assessing its resultingaffect on capital adequacy.
Regular monitoring
Regular monitoring of the advances portfolio is carried out which focuses on early problemrecognition and influences the front office to carry out an assessment of the borrower's ability torectify the identified problem / weakness within a reasonable time-frame, consider tighter structuringof facilities, confirm that there are no critical deficiencies in the existing security position and, ifpossible, arrange for strengthening of the same through obtaining additional collateral. It shouldhowever, be noted that these actions are taken prior to incurring overdues on the facility.
Portfolio diversification
While expanding the advances and the investment (TFCs) portfolio, efficient portfolio diversificationhas been a key consideration despite the relatively small size of operations.
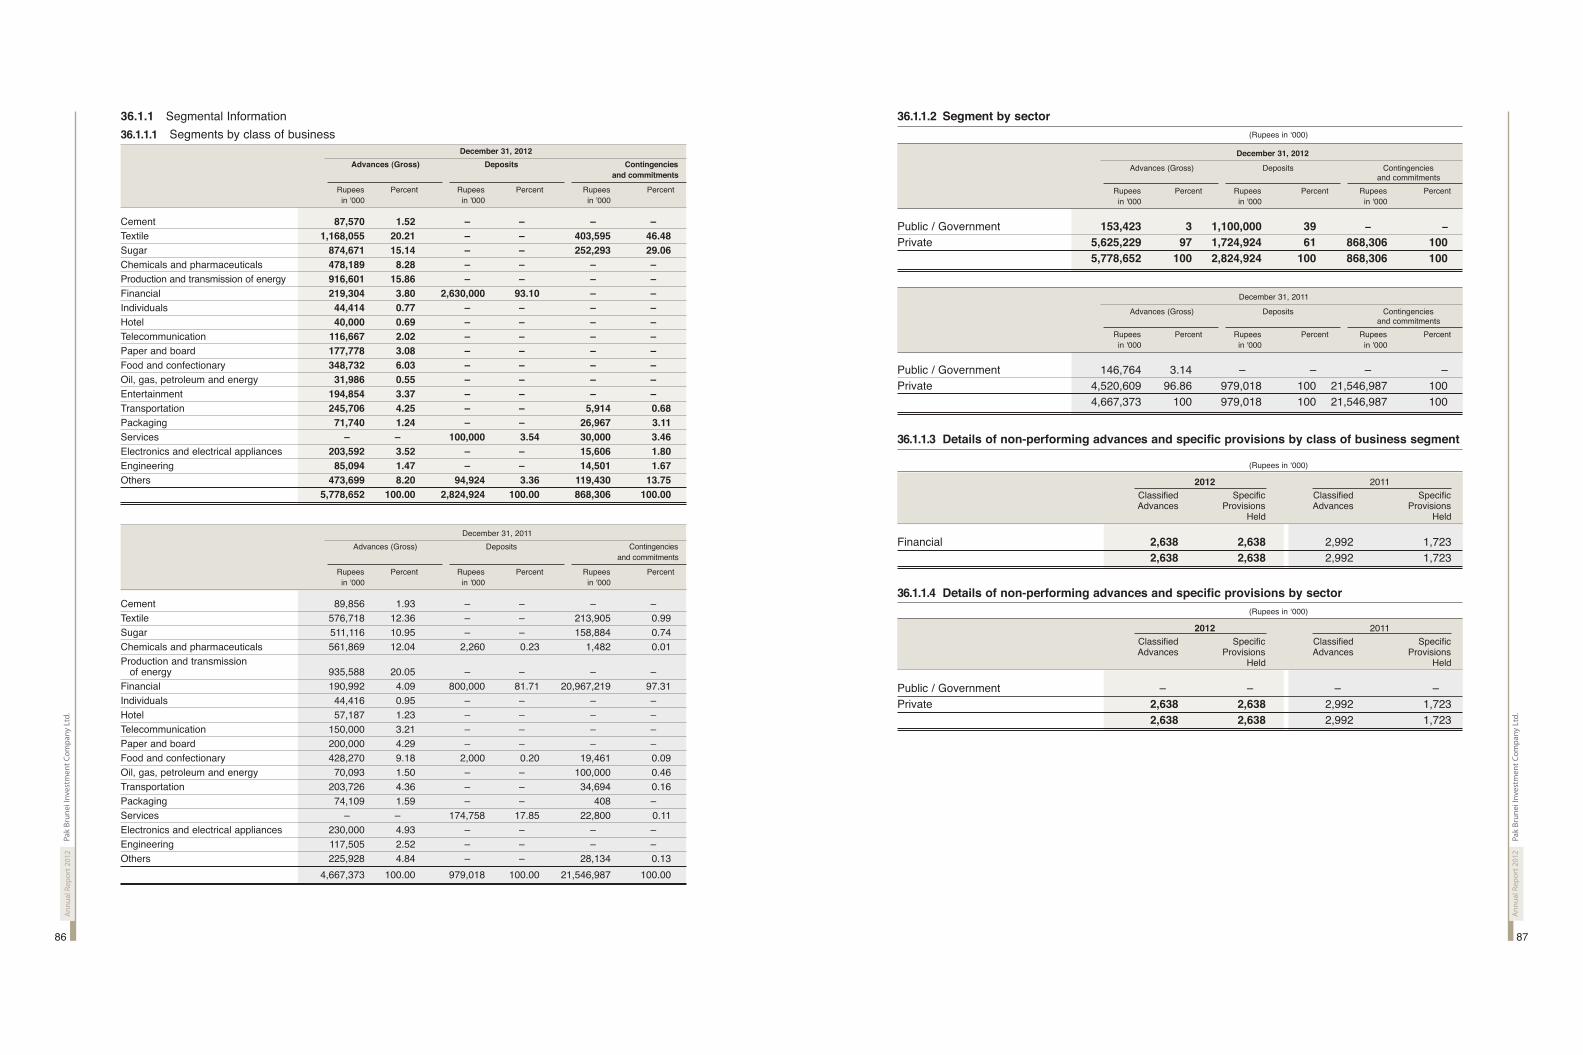
Ann
ual R
epor
t 201
2Pa
k Br
unei
Inve
stm
ent C
ompa
ny L
td.
87
Ann
ual R
epor
t 201
2Pa
k Br
unei
Inve
stm
ent C
ompa
ny L
td.
86
36.1.1 Segmental Information
36.1.1.1 Segments by class of businessDecember 31, 2012
Advances (Gross) Deposits Contingencies
and commitments
Rupees Percent Rupees Percent Rupees Percent in '000 in '000 in '000
Cement 87,570 1.52 – –– – –– – –– – ––
Textile 1,168,055 20.21 – –– – –– 403,595 46.48
Sugar 874,671 15.14 – –– – –– 252,293 29.06
Chemicals and pharmaceuticals 478,189 8.28 – –– – –– – –– – ––
Production and transmission of energy 916,601 15.86 – –– – –– – –– – ––
Financial 219,304 3.80 2,630,000 93.10 – –– – ––
Individuals 44,414 0.77 – –– – –– – –– – ––
Hotel 40,000 0.69 – –– – –– – –– – ––
Telecommunication 116,667 2.02 – –– – –– – –– – ––
Paper and board 177,778 3.08 – –– – –– – –– – ––
Food and confectionary 348,732 6.03 – –– – –– – –– – ––
Oil, gas, petroleum and energy 31,986 0.55 – –– – –– – –– – ––
Entertainment 194,854 3.37 – –– – –– – –– – ––
Transportation 245,706 4.25 – –– – –– 5,914 0.68
Packaging 71,740 1.24 – –– – –– 26,967 3.11
Services – –– – –– 100,000 3.54 30,000 3.46
Electronics and electrical appliances 203,592 3.52 – –– – –– 15,606 1.80
Engineering 85,094 1.47 – –– – –– 14,501 1.67
Others 473,699 8.20 94,924 3.36 119,430 13.75
5,778,652 100.00 2,824,924 100.00 868,306 100.00
December 31, 2011
Advances (Gross) Deposits Contingenciesand commitments
Rupees Percent Rupees Percent Rupees Percent in '000 in '000 in '000
Cement 89,856 1.93 – –– – –– – –– – ––Textile 576,718 12.36 – –– – –– 213,905 0.99Sugar 511,116 10.95 – –– – –– 158,884 0.74Chemicals and pharmaceuticals 561,869 12.04 2,260 0.23 1,482 0.01Production and transmission
of energy 935,588 20.05 – –– – –– – –– – ––Financial 190,992 4.09 800,000 81.71 20,967,219 97.31Individuals 44,416 0.95 – –– – –– – –– – ––Hotel 57,187 1.23 – –– – –– – –– – ––Telecommunication 150,000 3.21 – –– – –– – –– – ––Paper and board 200,000 4.29 – –– – –– – –– – ––Food and confectionary 428,270 9.18 2,000 0.20 19,461 0.09Oil, gas, petroleum and energy 70,093 1.50 – –– – –– 100,000 0.46Transportation 203,726 4.36 – –– – –– 34,694 0.16Packaging 74,109 1.59 – –– – –– 408 – ––Services – –– – –– 174,758 17.85 22,800 0.11Electronics and electrical appliances 230,000 4.93 – –– – –– – –– – ––Engineering 117,505 2.52 – –– – –– – –– – ––Others 225,928 4.84 – –– – –– 28,134 0.13
4,667,373 100.00 979,018 100.00 21,546,987 100.00
36.1.1.2 Segment by sector
(Rupees in ‘000)
December 31, 2012
Advances (Gross) Deposits Contingencies and commitments
Rupees Percent Rupees Percent Rupees Percent in '000 in '000 in '000
Public / Government 153,423 3 1,100,000 39 – –– –
Private 5,625,229 97 1,724,924 61 868,306 100
5,778,652 100 2,824,924 100 868,306 100
December 31, 2011
Advances (Gross) Deposits Contingencies and commitments
Rupees Percent Rupees Percent Rupees Percent in '000 in '000 in '000
Public / Government 146,764 3.14 – –– – – –– –Private 4,520,609 96.86 979,018 100 21,546,987 100
4,667,373 100 979,018 100 21,546,987 100
36.1.1.3 Details of non-performing advances and specific provisions by class of business segment
(Rupees in ‘000)
2012 2011Classified Specific Classified Specific Advances Provisions Advances Provisions
Held Held
Financial 2,638 2,638 2,992 1,7232,638 2,638 2,992 1,723
36.1.1.4 Details of non-performing advances and specific provisions by sector
(Rupees in ‘000)
2012 2011Classified Specific Classified Specific Advances Provisions Advances Provisions
Held Held
Public / Government ––– ––– ––– –––Private 2,638 2,638 2,992 1,723
2,638 2,638 2,992 1,723

Ann
ual R
epor
t 201
2Pa
k Br
unei
Inve
stm
ent C
ompa
ny L
td.
89
Ann
ual R
epor
t 201
2Pa
k Br
unei
Inve
stm
ent C
ompa
ny L
td.
88
36.2.1 Interest rate riskInterest rate risk is the uncertainty resulting from changes in interest rates, including changes in theshape of yield curves. Interest rate risk arises from factors such as mismatches between contractualmaturities or re-pricing of on and off balance sheet assets and liabilities. The objective of yield /interest rate risk management is to minimize adverse variances in the Company's profitability.
Government securities (PIBs and T-Bills), investment in TFCs and Sukuks, loans and advances andother money market investments are subject to interest rate risk classified under ‘Held-for-Trading’as well as ‘Available-for-Sale’ category if they meet the SBP criteria. Duration analysis is carried outto capture the risk associated with these securities. Stress testing is also in place to capture thesensitivity of the portfolio to adverse movement in interest rates. For prudent risk management, allmoney market investments are marked to market to assess changes in the market value ofinvestments due to interest rate movements.
36.2.2 Foreign exchange risk
Foreign Exchange Risk is the risk of loss arising from fluctuations of exchange rates. The Companyis not exposed to any significant funded or non-funded foreign exchange exposure.
(Rupees in ‘000)
December 31, 2012
Assets Liabilities Off-balance Net foreignsheet items currency
exposure
Pakistani Rupee 14,045,607 5,465,076 –––– 8,580,531
United States Dollar 4 –––– –––– 4
14,045,611 5,465,076 –––– 8,580,535
December 31, 2011
Assets Liabilities Off-balance Net foreignsheet items currency
exposure
Pakistani Rupee 32,544,386 24,616,844 –––– 7,927,542
United States Dollar 4 –––– –––– 4
32,544,390 24,616,844 –––– 7,927,546
36.2.3 Equity position risk
The Company is exposed to equity position risk on its investments in equity capital markets. TheBoard with the recommendations of ALCO approves exposure limits applicable to investments intrading book.
Equity investments in Company's trading book are subject to limits and controls imposed by riskmanagement policy to reduce the risk. The risk is managed by applying trading limit, scrip–wise andportfolio wise nominal limits, stop-loss limits and volatility limits. Stress test and value-at-risk figuresare also reported to the management for timely decisions.
The Equity Investment Committee is responsible for making investment decisions in the capitalmarket.
36.1.1.5 Geographical Segment Analysis
(Rupees in ‘000)
December 31, 2012
Profit before Total assets Net assets Contingencies taxation employed employed and
commitments
Pakistan 1,075,842 14,045,611 8,580,535 868,306
December 31, 2011
Profit before Total assets Net assets Contingencies taxation employed employed and
commitments
Pakistan 919,579 32,544,390 7,927,546 21,546,987
36.2 Market Risk
The market risk is the risk of reductions in earnings, value and / or reserves arising from changes inmarket rates (such as interest rates, exchange rates, credit spreads) and market prices (such ascommodities, equities, property etc) as well as their correlations and volatilities. The Company isexposed to market risk primarily through its trading activities, which are centered in the Treasury andCapital market groups.
The Company classifies its assets in banking and trading books as per instructions from SBP.Company's trading book comprises positions in financial instruments held with trading intent or inorder to hedge other elements of the trading book and free of any restrictive covenants on theirtradability. In addition, positions need to be frequently and accurately valued and the portfolio shouldbe actively managed. The positions which do not fulfill the criteria of trading book falls under thebanking Book and are treated as per SBP requirements.
The Company actively measures, controls and manages market risk on day-to-day basis. Controlsare applied to all investment portfolios by setting limits to the exposures taken. This includes stoploss limits on shares in ‘Held-for-Trading’ portfolio, individual and sectoral concentration limits,volatility and value-at-risk limits etc.
The Company measures market risk using various techniques like duration analysis for interest ratesensitivity, Value-at-Risk for adverse price movement and stress testing etc. The results arecommunicated to ALCO and Risk Management Committee on monthly and quarterly basisrespectively. Market risk is effectively managed at portfolio level.
Policies, valuation and accounting of equity investments
In accordance with the requirements of the SBP, valuation and accounting of equity investments isdone as per the accounting policy of investment mentioned in note 4.5 to these financial statements.Further, composition of equity investments is available in note 7 of these financial statements.

Ann
ual R
epor
t 201
2Pa
k Br
unei
Inve
stm
ent C
ompa
ny L
td.
91
Ann
ual R
epor
t 201
2Pa
k Br
unei
Inve
stm
ent C
ompa
ny L
td.
90
36.2.4 Mismatch of Interest Rate Sensitive Assets and LiabilitiesInterest rate risk can arise on account of rising interest rates causing a fall in the value of assets orfalling interest rates causing an increase in the value of liabilities. While the Company is largelyengaged in transactions on a floating rate basis in both borrowings and lendings, rate resetfrequency, ceilings and floors and choice of base rate can translate into interest rate risk.
Interest rate risk is monitored through regular reports on interest rate matching and durationestimates. Furthermore stress techniques are also used to estimate maximum losses in case ofadverse movements in interest rates.
(Rupees in ‘000)
December 31, 2012
Effective Exposed to yield/interest risk Non-interestyield/ Total Upto 1 Over 1 to Over 3 to Over 6 Over 1 to Over 2 to Over 3 to Over 5 to Above 10 Bearing
interest rate month 3 months 6 months months 2 years 3 years 5 years 10 years years Financialto 1 year Instruments
On-balance sheet financial instruments
Asset
Cash and balances with treasury banks –– – 54,755 –– – –– – –– – –– – –– – –– – –– – –– – –– – 54,755
Balances with other banks 10.30% 315,314 78,828 236,482 –– – 4 –– – –– – –– – –– – –– – –– –
Investments 13.00% 7,121,490 253,288 2,729,758 372,024 2,787 2,786 –– – 4,612 –– – –– – 3,756,235
Advances 13.91% 5,776,014 2,368,515 1,657,771 545,077 130,974 441,314 191,385 330,707 82,613 12,079 15,579
Other assets –– – 288,813 –– – –– – –– – –– – –– – –– – –– – –– – –– – 288,813
13,556,386 2,700,631 4,624,011 917,101 133,765 444,100 191,385 335,319 82,613 12,079 4,115,382
Liabilities
Borrowings 11.38% 2,417,139 40,354 390,787 26,049 79,336 1,289,894 189,894 327,491 73,334 –– – –– –
Deposits and other accounts 12.22% 2,824,924 25,000 2,307,400 192,524 300,000 –– – –– – –– – –– – –– – –– –
Other liabilities –– – 218,227 –– – –– – –– – –– – –– – –– – –– – –– – –– – 218,227
5,460,290 65,354 2,698,187 218,573 379,336 1,289,894 189,894 327,491 73,334 –– – 218,227
On-balance sheet gap 8,096,096 2,635,277 1,925,824 698,528 (245,571) (845,794) 1,491 7,828 9,279 12,079 3,897,155
Off–balance sheet financial instruments
Forward purchase of Government Securities –– – –– – –– – –– – –– – –– – –– – –– – –– – –– – –– –
Forward Sale of Government Securities –– – –– – –– – –– – –– – –– – –– – –– – –– – –– – –– –
Interest Rate Derivatives – Short position –– – –– – –– – –– – –– – –– – –– – –– – –– – –– – –– –
Interest Rate Derivatives – Long position –– – –– – –– – –– – –– – –– – –– – –– – –– – –– – –– –
Off–balance sheet gap –– – –– – –– – –– – –– – –– – –– – –– – –– – –– – –– –
Total Yield / Interest Risk Sensitivity Gap 8,096,096 2,635,277 1,925,824 698,528 (245,571) (845,794) 1,491 7,828 9,279 12,079 3,897,155
Cumulative Yield / Interest Risk Sensitivity Gap 2,635,277 4,561,101 5,259,629 5,014,058 4,168,264 4,169,755 4,177,583 4,186,862 4,198,941 8,096,096
(Rupees in ‘000)
December 31, 2011
Effective Exposed to yield/interest risk Non-interestyield/ Total Upto 1 Over 1 to Over 3 to Over 6 Over 1 to Over 2 to Over 3 to Over 5 to Above 10 Bearing
interest rate month 3 months 6 months months 2 years 3 years 5 years 10 years years Financialto 1 year Instruments
On-balance sheetfinancial instruments
Assets
Cash and balanceswith treasury banks – –– 174,790 – –– – –– – –– – –– – –– – –– – –– – –– – –– 174,790
Balances with other banks 7.37% 561,102 561,102 – –– – –– – –– – –– – –– – –– – –– – –– – ––
Lendings to financial institutions 12.66% 627,841 627,841 – –– – –– – –– – –– – –– – –– – –– – –– – ––
Investments 14.38% 25,741,246 339,439 10,424,120 811,785 12,696,777 169,352 – –– 192,618 360,403 – –– 746,752
Advances 15.14% 4,646,661 1,468,118 1,413,809 902,672 165,713 119,077 133,941 268,094 149,564 13,101 12,572
Other assets – –– 407,479 – –– – –– – –– – –– – –– – –– – –– – –– – –– 407,479
32,159,119 2,996,500 11,837,929 1,714,457 12,862,490 288,429 133,941 460,712 509,967 13,101 1,341,593
Liabilities
Borrowings 12.06% 23,359,531 19,168,992 2,276,265 45,831 51,144 674,543 704,139 274,944 163,673 – –– – ––
Deposits and other accounts 12.74% 979,018 325,000 2,000 149,758 502,260 – –– – –– – –– – –– – –– – ––
Other liabilities – –– 275,201 – –– – –– – –– – –– – –– – –– – –– – –– – –– 275,201
24,613,750 19,493,992 2,278,265 195,589 553,404 674,543 704,139 274,944 163,673 – 275,201
On-balance sheet gap 7,545,369 (16,497,492) 9,559,664 1,518,868 12,309,086 (386,114) (570,198) 185,768 346,294 13,101 1,066,392
Off–balance sheet financial instruments
Forward purchase of Government Securities (464,944) (464,944) – –– – –– – –– – –– – –– – –– – –– – –– – ––
Forward Sale of Government Securities 20,502,275 19,573,343 457,252 471,680 – –– – –– – –– – –– – –– – –– – ––
Interest Rate Derivatives – Short position (5,984) – –– (5,984) – –– – –– – –– – –– – –– – –– – –– – ––
Interest Rate Derivatives – Long position 6,103 – –– 6,103 – –– – –– – –– – –– – –– – –– – –– – ––
Off–balance sheet gap 20,037,450 19,108,399 457,371 471,680 – –– – –– – –– – –– – –– – –– – ––
Total Yield / Interest Risk Sensitivity Gap 27,582,819 2,610,907 10,017,035 1,990,548 12,309,086 (386,114) (570,198) 185,768 346,294 13,101 1,066,392
Cumulative Yield / Interest Risk Sensitivity Gap 2,610,907 12,627,942 14,618,490 26,927,576 26,541,462 25,971,264 26,157,032 26,503,326 26,516,427 27,582,819
36.3 Liquidity Risk
Liquidity risk is the risk that the Company is unable to fund its current obligations and operations inthe most cost efficient manner. ALCO is the forum to oversee liquidity management.
Liquidity risk can arise from the Company’s activities and can be grouped into three categories:
l Inflows / outflows from on-balance sheet items (other than marketable securities and wholesaleborrowings) and off-balance sheet items;
l Marketability of trading securities; andl Capacity to borrow from the wholesale markets for funding as well as trading activities.
The Company’s main funding source is the inter-bank money market. Change in the Governmentmonetary policy and market expectations of interest rate are all important factors that can adverselyaffect our key funding source. Efficient and accurate planning plays a critical role in liquiditymanagement. Company's MIS provides information on expected cash inflows / out flows which allowthe Company to take timely decisions based on the future requirements. Company monitors all thepossible sources from which liquidity risk can emanate including market reputation, borrowing terms,deterioration in quality of credit portfolio etc. Other sources are also identified for which early warningindicators have been created and being monitored for early intervention of management sensing apotential liquidity crunch.
Gap analysis and stress testing is done on periodic basis to capture any adverse effect of marketmovements on liquidity position. Based on the results produced, ALCO devises the liquiditymanagement strategy to maintain sufficient liquidity to deal with any related catastrophe.

Ann
ual R
epor
t 201
2Pa
k Br
unei
Inve
stm
ent C
ompa
ny L
td.
93
Ann
ual R
epor
t 201
2Pa
k Br
unei
Inve
stm
ent C
ompa
ny L
td.
92
36.3.1 Maturities of assets and liabilities - on the basis approved by the Assets and LiabilitiesManagement Committee (ALCO) of the Company
(Rupees in ‘000)
December 31, 2012
Total Upto 1 Over 1 to Over 3 to Over 6 Over 1 to Over 2 to Over 3 to Over 5 to Above 10month 3 months 6 months months 2 years 3 years 5 years 10 years years
to 1 year
Assets
Cash and balances with treasury banks 54,755 6,800 47,955 – –– – –– – –– – –– – –– – –– – ––
Balances with other banks 315,314 78,828 236,482 – –– 4 – –– – –– – –– – –– – ––
Investments 7,121,490 236,475 1,018,242 389,426 1,823,563 1,959,547 275,834 228,859 939,544 250,000
Advances 5,776,014 341,640 488,031 816,917 599,757 1,004,865 900,564 1,163,427 448,734 12,079
Operating fixed assets 54,476 1,996 3,992 5,988 9,102 16,177 13,232 3,989 – –– – ––
Deferred tax assests 13,302 (2,624) (2,092) 7,111 (7,314) (21,531) 51,831 (12,079) – –– – ––
Other assets 710,260 101,094 296,417 87,482 4,265 4,349 216,653 – –– – –– – ––
14,045,611 764,209 2,089,027 1,306,924 2,429,377 2,963,407 1,458,114 1,384,196 1,388,278 262,079
Liabilities
Borrowings 2,417,139 25,390 392,057 307,661 346,081 723,555 190,222 334,726 97,446 – ––
Deposits and other accounts 2,824,924 25,000 2,307,400 192,524 300,000 – –– – –– – –– – –– – ––
Other liabilities 223,013 28,380 66,156 15,660 30,427 16,734 42,720 22,936 – –– – ––
5,465,076 78,770 2,765,613 515,845 676,508 740,289 232,942 357,662 97,446 – ––
Net assets 8,580,535 685,439 (676,586) 791,079 1,752,869 2,223,118 1,225,172 1,026,534 1,290,832 262,079
Share capital 6,000,000
Reserves 555,884
Unappropriated profit 2,023,533
Surplus on revaluation of assets - net of tax 1,118
8,580,535
December 31, 2011
Total Upto 1 Over 1 to Over 3 to Over 6 Over 1 to Over 2 to Over 3 to Over 5 to Above 10month 3 months 6 months months 2 years 3 years 5 years 10 years years
to 1 year
Assets
Cash and balances with treasury banks 174,790 174,790 – –– – –– – –– – –– – –– – –– – –– – ––
Balances with other banks 561,102 561,102 – –– – –– – –– – –– – –– – –– – –– – ––
Lendings to financial institutions 627,841 627,841 – –– – –– – –– – –– – –– – –– – –– – ––
Investments 25,741,246 257,876 8,552,335 461,097 12,887,649 755,997 406,326 635,139 1,534,827 250,000
Advances 4,646,661 150,004 362,452 642,763 447,609 793,096 699,683 909,062 628,891 13,101
Operating fixed assets 34,067 1,058 2,116 17,051 3,540 6,435 2,468 1,399 – –– – ––
Other assets 758,683 301,200 199,178 22,053 7,603 224,371 4,278 – –– – –– – ––
32,544,390 2,073,871 9,116,081 1,142,964 13,346,401 1,779,899 1,112,755 1,545,600 2,163,718 263,101
Liabilities
Borrowings 23,359,531 19,168,991 2,276,265 45,831 51,144 674,543 704,139 274,944 163,674 – ––
Deposits and other accounts 979,018 325,000 2,000 149,758 502,260 – –– – –– – –– – –– – ––
Deferred tax liabilities 190 4 37 50 9 18 21 51 – –– – ––
Other liabilities 278,105 127,183 68,471 3,134 6,444 12,264 16,735 43,874 – –– – ––
24,616,844 19,621,178 2,346,773 198,773 559,857 686,825 720,895 318,869 163,674 – ––
Net assets 7,927,546 (17,547,307) 6,769,308 944,191 12,786,544 1,093,074 391,860 1,226,731 2,000,044 263,101
Share capital 6,000,000
Reserves 399,132
Unappropriated profit 1,596,527
Deficit on revaluation of assets - net (68,113)
7,927,546
36.3.2 Maturities of assets and liabilities - based on contractual maturity of the assets and liabilities of the Company
(Rupees in ‘000)
December 31, 2012
Total Upto 1 Over 1 to Over 3 to Over 6 Over 1 to Over 2 to Over 3 to Over 5 to Above 10month 3 months 6 months months 2 years 3 years 5 years 10 years years
to 1 year
Assets
Cash and balances with treasury banks 54,755 6,800 47,955 – –– – –– – –– – –– – –– – –– – ––
Balances with other banks 315,314 78,828 236,482 – –– 4 – –– – –– – –– – –– – ––
Investments 7,121,490 236,475 1,018,242 389,426 1,823,563 1,959,547 275,834 228,859 939,544 250,000
Advances 5,776,014 341,640 488,031 816,917 599,757 1,004,865 900,564 1,163,427 448,734 12,079
Operating fixed assets 54,476 1,996 3,992 5,988 9,102 16,177 13,232 3,989 – –– – ––
Deferred tax assests 13,302 (2,624) (2,092) 7,111 (7,314) (21,531) 51,831 (12,079) – –– – ––
Other assets 710,260 101,094 296,417 87,482 4,265 4,349 216,653 – –– – –– – ––
14,045,611 764,209 2,089,027 1,306,924 2,429,377 2,963,407 1,458,114 1,384,196 1,388,278 262,079
Liabilities
Borrowings 2,417,139 25,390 392,057 307,661 346,081 723,555 190,222 334,726 97,446 – ––
Deposits and other accounts 2,824,924 25,000 2,307,400 192,524 300,000 – –– – –– – –– – –– – ––
Other liabilities 223,013 28,380 66,156 15,660 30,427 16,734 42,720 22,936 – –– – ––
5,465,076 78,770 2,765,613 515,845 676,508 740,289 232,942 357,662 97,446 – ––
Net assets 8,580,535 685,439 (676,586) 791,079 1,752,869 2,223,118 1,225,172 1,026,534 1,290,832 262,079
Share capital 6,000,000
Reserves 555,884
Unappropriated profit 2,023,533
Surplus on revaluation of assets - net of tax 1,118
8,580,535
December 31, 2011
Total Upto 1 Over 1 to Over 3 to Over 6 Over 1 to Over 2 to Over 3 to Over 5 to Above 10month 3 months 6 months months 2 years 3 years 5 years 10 years years
to 1 year
Assets
Cash and balances with treasury banks 174,790 174,790 – –– – –– – –– – –– – –– – –– – –– – ––
Balances with other banks 561,102 561,102 – –– – –– – –– – –– – –– – –– – –– – ––
Lendings to financial institutions 627,841 627,841 – –– – –– – –– – –– – –– – –– – –– – ––
Investments 25,741,246 257,876 8,552,335 461,097 12,887,649 755,997 406,326 635,139 1,534,827 250,000
Advances 4,646,661 150,004 362,452 642,763 447,609 793,096 699,683 909,062 628,891 13,101
Operating fixed assets 34,067 1,058 2,116 17,051 3,540 6,435 2,468 1,399 – –– – ––
Other assets 758,683 301,200 199,178 22,053 7,603 224,371 4,278 – –– – –– – ––
32,544,390 2,073,871 9,116,081 1,142,964 13,346,401 1,779,899 1,112,755 1,545,600 2,163,718 263,101
Liabilities
Borrowings 23,359,531 19,168,991 2,276,265 45,831 51,144 674,543 704,139 274,944 163,674 – ––
Deposits and other accounts 979,018 325,000 2,000 149,758 502,260 – –– – –– – –– – –– – ––
Deferred tax liabilities 190 4 37 50 9 18 21 51 – –– – ––
Other liabilities 278,105 127,183 68,471 3,134 6,444 12,264 16,735 43,874 – –– – ––
24,616,844 19,621,178 2,346,773 198,773 559,857 686,825 720,895 318,869 163,674 – ––
Net assets 7,927,546 (17,547,307) 6,769,308 944,191 12,786,544 1,093,074 391,860 1,226,731 2,000,044 263,101
Share capital 6,000,000
Reserves 399,132
Unappropriated profit 1,596,527
Deficit on revaluation of assets - net (68,113)
7,927,546

Ann
ual R
epor
t 201
2Pa
k Br
unei
Inve
stm
ent C
ompa
ny L
td.
95
Ann
ual R
epor
t 201
2Pa
k Br
unei
Inve
stm
ent C
ompa
ny L
td.
94
36.4 Operational risk
The Company, like all financial institutions, is exposed to many types of operational risks, includingthe potential losses arising from internal activities or external events caused by breakdowns ininformation, communication, physical safeguards, business continuity, supervision, transactionprocessing, settlement systems and procedures and the execution of legal, fiduciary and agencyresponsibilities.
The Company maintains a system of internal controls designed to keep operational risk atappropriate levels, in view of the Company’s financial strength and the characteristics of the activitiesand market in which it operates. These internal controls are periodically updated to conform toindustry best practice. The Company has developed a Business Continuity Plan applicable to all itsfunctional areas. Currently the Company uses the Basic Indicator Approach for assessing itsoperational risk capital charge.
37. NON ADJUSTING EVENT AFTER THE REPORTING DATE
The Board of Directors have proposed a final dividend for the year ended December 31, 2012 of Rs. 1.67 per share (2011: Re.0.33 per share), amounting to Rs. 1,000 million (2011: Rs.200million) at their meeting held on May 09, 2013 , for approval of the members at the annual generalmeeting to be held on May 30, 2013 . The unconsolidated financial statements for the year endedDecember 31, 2012 do not include the effect of these appropriations which will be accounted for inthe unconsolidated financial statements for the year ending December 31, 2013.
38. GENERAL
38.1 Credit rating
The Company has been assigned credit rating of ‘AA+’ (Double A plus) in the medium to long termand A1+ (A One Plus) in the short-term by JCR-VIS Credit Rating Agency Limited, SBP approvedrating agency. Outlook on the assigned rating is "Stable".
38.2 Figures have been rounded off to the nearest thousand rupees.
39. DATE OF AUTHORISATION FOR ISSUE
These unconsolidated financial statements were authorised for issue on May 09, 2013 by the Board of Directors of the Company.
Annexure - I
As referred in note 9.6 of the unconsolidated financial statements
Statement showing written-off loans on any other financial relief of Rs. 500,000 or above provided duringthe year ended December 31, 2012
S. No. Name and address Name of individual/ Father's /Husband's Outstanding Liabilities at the
of the borrowers partner/director name beginning of the year Amount written-off
and CNIC No.
Principal Mark-up Others Total Principal Mark-up Others Total
Nil Nil Nil Nil Nil Nil Nil Nil Nil Nil Nil
Chief Executive Director Director Chairman
Ann
ual R
epor
t 201
2Pa
k Br
unei
Inve
stm
ent C
ompa
ny L
td.
97
99 Auditors’ Report to the Members
100 Statement of Financial Position
101 Profit and Loss Account
102 Statement of Comprehensive Income
103 Cashflow Statement
104 Statement of Changes in Equity
105 Notes to the Financial Statements
Consolidated Financial Statements
Ernst & Young Ford Rhodes Sidat HyderChartered AccountantsProgressive Plaza, Beaumont RoadP.O. Box 15541, Karachi 75530, Pakistan
Tel: +9221 3565 0007Fax: +9221 3568 1965www.ey.com
A member firm of Ernst & Young Global Limited
Ann
ual R
epor
t 201
2Pa
k Br
unei
Inve
stm
ent C
ompa
ny L
td.
99
We have audited the annexed consolidated financial statements comprising consolidated statement offinancial position of Pak Brunei Investment Company Limited (the Holding Company) and its subsidiarycompany (Primus Investment Management Limited), here-in-after referred to as the Group, as at 31 December 2012 and the related consolidated profit and loss account, consolidated statement ofcomprehensive income, consolidated cash flow statement and consolidated statement of changes in equitytogether with the notes forming part thereof, for the year then ended. We have also expressed separateopinion on the financial statements of the Holding Company and its subsidiary company. Theseconsolidated financial statements are the responsibility of the Holding Company’s management. Ourresponsibility is to express an opinion on these consolidated financial statements based on our audit.
Our audit was conducted in accordance with the International Standards on Auditing and accordinglyincluded such tests of accounting records and such other auditing procedures as we considered necessaryin the circumstances.
In our opinion, the consolidated financial statements present fairly the financial position of Pak BruneiInvestment Company Limited and its subsidiary company as at 31 December 2012 and the results of theiroperations for the year then ended.
The consolidated financial statements of the Group for the year ended 31 December 2011 were audited byanother firm of Chartered Accountants, whose report dated 28 March 2012 expressed an unqualifiedopinion thereon.
Chartered AccountantsAudit Engagement Partner: Shabbir YunusDate: 09 May 2013Karachi
Auditors' Report to the Members

Ann
ual R
epor
t 201
2Pa
k Br
unei
Inve
stm
ent C
ompa
ny L
td.
101
Ann
ual R
epor
t 201
2Pa
k Br
unei
Inve
stm
ent C
ompa
ny L
td.
100
2012 2011 Note 2012 2011(US $ in ‘000) (Rupees in ‘000)
30,240 24,739 Mark-up / return / interest earned 19 2,930,250 2,397,22321,102 15,163 Mark-up / return / interest expensed 20 2,044,815 1,469,277
9,138 9,576 Net mark-up / interest Income 885,435 927,946(Reversal) / provision against non-performing
(187) 136 loans and advances 8.4 (18,074) 13,183Provision for diminution in the
145 760 value of investments 7.3 14,055 73,691– –– – –– Bad debts written off directly – –– – ––
(42) 896 (4,019) 86,8749,180 8,680 Net mark-up / interest income after provisions 889,454 841,072
NON MARK-UP / INTEREST INCOME
527 709 Fee, commission and brokerage income 51,073 68,6581,839 990 Dividend income 178,196 95,903– –– – –– Income from dealing in foreign currencies – –– – ––2,049 1,369 Gain on sale of securities - net 21 198,550 132,702
Unrealised loss on revaluation of investments– –– (140) classified as held-for-trading – –– (13,560)
13 3 Other income 22 1,273 2624,428 2,931 Total non mark-up / interest income 429,092 283,965
13,608 11,611 1,318,546 1,125,037
NON MARK-UP / INTEREST EXPENSES
2,190 2,112 Administrative expenses 23 212,181 204,66939 – –– Other provisions / write off 9.2.2 3,754 – ––10 2 Other charges 24 983 239
2,239 2,114 Total non-mark-up / interest expenses 216,918 204,90811,369 9,497 1,101,628 920,129
– –– – –– Share of loss of associates 7.10.1 (20,684) – ––11,369 9,497 PROFIT BEFORE TAXATION 1,080,944 920,1293,411 3,669 Taxation - Current 330,556 355,528
(24) 85 - Prior years (2,283) 8,193(307) (496) - Deferred (29,728) (48,056)
3,080 3,258 25 298,545 315,6658,289 6,239 PROFIT AFTER TAXATION 782,399 604,464
Attributable to:8,289 6,239 Equity shareholders of the Company 782,399 604,464– –– – –– Non-controlling interest – –– – ––8,289 6,239 782,399 604,464
US $ Rupees0.01 0.01 Earnings per share - basic and diluted 26 1.30 1.01
The annexed notes from 1 to 39 form an integral part of these consolidated financial statements.
2012 2011 Note 2012 2011
I As at December 31, 2012Statement of Financial Position Profit and Loss Account
(US $ in ‘000) (Rupees in ‘000)
ASSETS
565 1,804 Cash and balances with treasury banks 5 54,763 174,790
3,274 5,801 Balances with other banks 6 317,222 562,085
– –– 6,479 Lendings to financial institutions – –– 627,841
73,280 265,659 Investments 7 7,100,816 25,742,364
59,643 47,953 Advances 8 5,779,397 4,646,661
623 352 Operating fixed assets 9 60,329 34,067
138 – –– Deferred tax assets 10 13,403 – ––
7,436 7,814 Other assets 11 720,507 757,208
144,959 335,862 14,046,437 32,545,016
LIABILITIES
– –– – –– Bills payable – –– – ––
24,945 241,068 Borrowings 12 2,417,139 23,359,531
29,153 10,103 Deposits and other accounts 13 2,824,924 979,018
– –– – –– Sub-ordinated loans – –– – ––
Liabilities against assets
– –– – –– subject to finance lease – –– – ––
– –– 4 Deferred tax liabilities 10 – –– 383
2,320 2,871 Other liabilities 14 224,841 278,181
56,418 254,046 5,466,904 24,617,113
88,541 81,816 NET ASSETS 8,579,533 7,927,903
REPRESENTED BY
61,920 61,920 Share capital 15 6,000,000 6,000,000
5,737 4,120 Reserves 555,884 399,204
20,872 16,479 Unappropriated profit 2,022,531 1,596,812
88,529 82,519 8,578,415 7,996,016
Surplus / (deficit) on revaluation of
12 (703) assets - net of tax 16 1,118 (68,113)
88,541 81,816 8,579,533 7,927,903
CONTINGENCIES AND COMMITMENTS 17
The annexed notes from 1 to 39 form an integral part of these consolidated financial statements.
Consolidated Consolidated
For the Year endedDecember 31, 2012
Chief Executive Director Director Chairman Chief Executive Director Director Chairman

Ann
ual R
epor
t 201
2Pa
k Br
unei
Inve
stm
ent C
ompa
ny L
td.
103
Ann
ual R
epor
t 201
2Pa
k Br
unei
Inve
stm
ent C
ompa
ny L
td.
102
2012 2011 2012 2011(US $ in ‘000) (Rupees in ‘000)
8,289 6,239 Profit after taxation for the year 782,399 604,464
– –– – –– Other comprehensive income – –– – ––
Total comprehensive income
8,289 6,239 for the year 782,399 604,464
Attributable to:
8,289 6,239 Equity shareholders of the Company 782,399 604,464
– –– – –– Non-controlling interest – –– – ––
8,289 6,239 782,399 604,464
Surplus / (deficit) arising on revaluation of assets has been reported in accordance with the directives of the State
Bank of Pakistan in a separate account below equity.
The annexed notes from 1 to 39 form an integral part of these consolidated financial statements.
2012 2011 Note 2012 2011
Statement Of Comprehensive Income For the Year endedDecember 31, 2012 Cash Flow Statement For the Year ended
December 31, 2012
Consolidated Consolidated
(US $ in ‘000) (Rupees in ‘000)
CASH FLOWS FROM OPERATING ACTIVITIES11,369 9,497 Profit before taxation 1,080,944 920,1291,839 990 Less: Dividend income 178,196 95,9039,530 8,507 902,748 824,226
Adjustments for non-cash charges and other items
150 78 Depreciation 23 14,491 7,54420 17 Amortisation 23 1,919 1,633
(Reversal) / provision against non-performing(187) 136 loans and advances (18,074) 13,183
Provision for diminution in the 145 760 value of investments 7.3 14,055 73,69139 – –– Other provisions / write off 9.2.2 3,754 – ––
– –– (1) Gain on sale of property and equipment 22 (5) (69)Unrealised loss on revaluation of investments
– –– 140 classified as held-for-trading – –– 13,560Unrealised loss on revaluation of
– –– 2 interest rate swap contracts – –– 239213 – –– Share of loss of associates 20,684 – ––380 1,130 36,824 109,781
9,910 9,637 939,572 934,007
Decrease / (increase) in operating assets 6,479 6,139 Lendings to financial institutions 627,841 594,886
74,055 (76,785) Held-for-trading securities 7,175,900 (7,440,578)(11,503) (22,623) Advances (1,114,662) (2,192,201)
1,125 (954) Others assets (excluding current taxation) 109,008 (92,472)70,156 (94,223) 6,798,087 (9,130,365)
(Decrease) / increase in operating liabilities(216,124) 179,733 Borrowings (20,942,392) 17,416,146
19,050 1,393 Deposits and other accounts 1,845,906 135,018(563) 920 Other liabilities (excluding current taxation) (54,561) 89,181
(197,637) 182,046 (19,151,047) 17,640,345(117,571) 97,460 (11,413,388) 9,443,987
(3,749) (3,898) Income tax paid (363,266) (377,817)Net cash (used in) / generated from
(121,320) 93,562 operating activities (11,776,654) 9,066,170
CASH FLOWS FROM INVESTING ACTIVITIES
149,722 (88,136) Net investment in available-for-sale securities 14,508,040 (8,540,366)(9) (7) Net investment in held-to-maturity securities (824) (654)
(30,868) – –– Investment in associates (2,991,134) – ––1,466 755 Dividend income received 142,102 73,116(480) (245) Investments in operating fixed assets (46,491) (23,744)
1 17 Sale proceeds from disposal of property and equipment 71 1,581119,832 (87,616) Net cash generated from / (used in) investing activities 11,611,764 (8,490,067)
CASH FLOWS FROM FINANCING ACTIVITIES(2,064) – –– Dividend paid (200,000) – ––(2,064) – –– Net cash used in financing activities (200,000) – ––(3,552) 5,946 (Decrease) / increase in cash and cash equivalents (364,890) 576,103
Cash and cash equivalents at the 7,604 1,659 beginning of the year 736,875 160,772
Cash and cash equivalents at 4,052 7,605 the end of the year 27 371,985 736,875
The annexed notes from 1 to 39 form an integral part of these consolidated financial statements.
Chief Executive Director Director Chairman Chief Executive Director Director Chairman

Ann
ual R
epor
t 201
2Pa
k Br
unei
Inve
stm
ent C
ompa
ny L
td.
105
Ann
ual R
epor
t 201
2Pa
k Br
unei
Inve
stm
ent C
ompa
ny L
td.
104
Share Statutory Unappropriated capital reserve profit Total
1. STATUS AND NATURE OF BUSINESS
The Group comprises of Pak Brunei Investment Company Limited (the “Holding Company” or“parent” ) and a subsidiary, Primus Investment Management Limited. Brief profile of the HoldingCompany and its subsidiary is as follows:
1.1 Holding Company
Pak Brunei Investment Company Limited (the “Holding Company” or “parent” ) is incorporated as anun-listed public limited company under the Companies Ordinance, 1984. The State Bank of Pakistan(the SBP) granted the approval for commencement of business with effect from August 20, 2007.The Holding Company is a joint venture between the Government of Pakistan and the BruneiInvestment Agency. The Holding Company's objective interalia includes making investments in theindustrial and agro based industrial fields in Pakistan on commercial basis through carrying out ofindustrial and agro based industrial projects and making of their products in Pakistan and abroadand to undertake other feasible business and to establish and acquire companies to conduct variousbusinesses. The registered office of the Company is situated at Horizon Vista, Plot No. Comm-10,Block No. 4, Scheme No. 5, Clifton, Karachi, Pakistan.
1.2 Subsidiary Company
Primus Investment Management Limited is a public unlisted company incorporated in Pakistan onAugust 10, 2011 under the Companies Ordinance, 1984. The registered office of the Company issituated at 4th Floor, Horizon Vista, Plot No. Comm-10, Block No. 4, Scheme No. 5, Clifton, Karachi,Pakistan. The Company has obtained the license of an “Investment Advisor” and “AssetManagement Company” (AMC) under the Non-Banking Finance Companies (Establishment andRegulation) Rules, 2003 (the NBFC Rules) and the Non-Banking Finance Companies and NotifiedEntities Regulations, 2008 (the NBFC Regulations).
2. BASIS OF PRESENTATION
2.1 Basis of Measurement
These consolidated financial statements have been prepared under the historical cost conventionexcept that certain investments have been stated at revalued amounts in accordance with thedirectives of the State Bank of Pakistan (SBP).
2.2 US Dollar equivalent
The US dollar amounts shown in the consolidated statement of financial position, consolidated profitand loss account, consolidated statement of comprehensive income and consolidated cash flowstatement are stated as additional information solely for the convenience of readers. For thispurpose of conversion to US Dollars, the rate of Rs.96.90 to US Dollars has been used for both 2012and 2011, as it was the prevalent rate as on December 31, 2012.
3. STATEMENT OF COMPLIANCE
3.1 These consolidated financial statements have been prepared in accordance with approved accountingstandards as applicable in Pakistan. Approved accounting standards comprise of such InternationalFinancial Reporting Standards (IFRSs) issued by the International Accounting Standards Board (IASB)as are notified under the Companies Ordinance, 1984, the provisions of and directives issued underthe Companies Ordinance, 1984 and the directives issued by the State Bank of Pakistan. Whereverthe requirements of the Companies Ordinance, 1984 or directives issued under the CompaniesOrdinance, 1984 and the State Bank of Pakistan differ with the requirements of IFRS, the requirementsof the Companies Ordinance, 1984 or the requirements of the said directives shall prevail.
(Rupees in ‘000)
Balance as at January 01, 2011 6,000,000 278,311 1,113,241 7,391,552
Total comprehensive income for the year
Profit after tax for the year ended
December 31, 2011 – –– – –– 604,464 604,464
Other comprehensive income – –– – –– – –– – ––
Total comprehensive income for the year
ended December 31, 2011 – –– – –– 604,464 604,464
Transfers
Transfer to statutory reserve – –– 120,893 (120,893) – ––
Balance as at December 31, 2011 6,000,000 399,204 1,596,812 7,996,016
Total comprehensive income for the year
Profit after tax for the year ended
December 31, 2012 – –– – –– 782,399 782,399
Other comprehensive income – –– – –– – –– – ––
Total comprehensive income for the year
ended December 31, 2012 – –– – –– 782,399 782,399
Transfers
Transfer to statutory reserve – –– 156,752 (156,752) – ––
Transfers to unappropriated profit – –– (72) 72 – ––
Transaction with owners recorded
directly in equity during the year
ended December 31, 2012
Final cash dividend - December 31, 2011
declared subsequent to year
end @ Re. 0.33 per share – –– – –– (200,000) (200,000)
Balance as at December 31, 2012 6,000,000 555,884 2,022,531 8,578,415
The annexed notes from 1 to 39 form an integral part of these consolidated financial statements.
Notes to the Financial StatementsFor the Year endedDecember 31, 2012
For the Year endedDecember 31, 2012
Consolidated Consolidated
Statement of Changes in Equity
Chief Executive Director Director Chairman

Ann
ual R
epor
t 201
2Pa
k Br
unei
Inve
stm
ent C
ompa
ny L
td.
107
Ann
ual R
epor
t 201
2Pa
k Br
unei
Inve
stm
ent C
ompa
ny L
td.
106
3.2 The SBP has deferred the applicability of International Accounting Standard (IAS) 39, 'FinancialInstruments: Recognition and Measurement' and IAS 40, 'Investment Property' for DFIs throughBSD Circular Letter No. 11 dated September 11, 2002 till further instructions. Further, according tothe notification of the SECP dated April 28, 2008, the IFRS - 7 “Financial Instruments: Disclosures”has not been made applicable to Banks / DFIs. Accordingly, the requirements of these standardshave not been considered in the preparation of these consolidated financial statements. However,investments have been classified and valued in accordance with the requirements of variouscirculars issued by the SBP.
3.3 Standards, interpretations and amendments to approved accounting standards that arenot yet effective
During the year, the following revised standards, amendments and interpretations with respect to theapproved accounting standards as applicable in Pakistan would be effective from the datesmentioned below against the respective standard or interpretation:
Standards or Interpretation Effective date (annualperiods beginning on or after)
IAS 1 - Presentation of Financial Statements - Presentation of Items of Other Comprehensive Income July 01, 2012
IAS 19 - Employee Benefits (Revised) January 01, 2013
IAS 32 - Offsetting Financial Assets andFinancial Liabilities - (Amendment) January 01, 2014
The Group expects that the adoption of the above revisions, amendments and interpretations of thestandards will not affect the Group's financial statements in the period of initial application.
In addition to the above amendments, improvements to various accounting standards have also beenissued by the IASB. Such improvements are generally effective for accounting periods beginning on orafter January 01, 2013. The Group expects that such improvements to the standards will not have anymaterial impact on the Group's consolidated financial statements in the period of initial application.
The following new standards have been issued by the IASB, but have not yet been notified by theSECP for application in Pakistan.
Standards or Interpretation IASB Effective date (annual periods beginning on or after)
IFRS 9 – Financial Instruments: Classification and Measurement January 01, 2015
IFRS 10 – Consolidated Financial Statements January 01, 2013
IFRS 11 – Joint Arrangements January 01, 2013
IFRS 12 – Disclosure of Interests in Other Entities January 01, 2013
IFRS 13 – Fair Value Measurement January 01, 2013
4. SUMMARY OF SIGNIFICANT ACCOUNTING POLICIES
4.1 New and amended standards and interpretations
The Group has adopted the following amendments to IFRSs which became effective during thecurrent year:
IAS 12 – Income Taxes - Recovery of Underlying Assets (Amendment)
The adoption of the above amendments did not have any effect on the financial statements.
4.2 Basis of consolidation
Subsidiary is the enterprise in which the Group directly or indirectly controls, beneficially owns orholds more than 50 percent of its voting securities or otherwise has power to elect and appoint morethan 50 percent of its directors.
Subsidiary company is consolidated from the date on which more than 50 percent of voting rightsare transferred to the Group or power to control the Company is established and excluded fromconsolidation from the date of disposal or when the control is lost.
The financial statements of the subsidiary are prepared for the same reporting year as the Group forthe purpose of consolidation, using consistent accounting policies except, as disclosed in note 4.6.
The assets, liabilities, income and expenses of subsidiary have been consolidated on a line by linebasis and the carrying value of investment in subsidiary held by the Group is eliminated against theshareholders' equity in the consolidated financial statements.
Non-Controlling Interest in equity of the Subsidiary Company is measured at proportionate share ofnet assets of the acquiree.
Material intra-group balances and transactions have been eliminated.
4.3 Cash and cash equivalents
Cash and cash equivalents include cash and balances with treasury banks and balances with otherbanks in current and deposit accounts.
4.4 Revenue recognition
Mark-up / return / interest income on advances and investments is recognised on time proportionatebasis taking into account effective yield on the instrument except in case of advances andinvestments classified under the SBP's Prudential Regulations on which mark-up / return / interestis recognised on receipt basis.
Dividend income is recognised when the Group's right to receive income is established.
Fee, commission and brokerage income, management fee and remuneration for trustee andadvisory services are recognised at the time of performance of services.
Premium or discount on debt securities classified as “available-for-sale” and “held-to-maturity” securitiesis amortised using the effective interest method and taken to consolidated profit and loss account.
Gains and losses on disposal of investments are dealt with through profit and loss account in theyear in which they arise.
Return on bank deposits is recognised on time proportionate basis using the effective interest rates.
4.5 Advances
Advances are stated net of specific and general provisions. Specific provisions are made inaccordance with the requirements of the Prudential Regulations issued by SBP and charged to theconsolidated profit and loss account. These regulations prescribe an age based criteria (assupplemented by subjective evaluation of advances) for classification of non-performing loans andadvances and computing provision / allowance thereagainst. Advances are written off where thereare no realistic prospects of recovery.
Leases are classified as finance leases, when the Group transfers substantially all the risks andrewards incidental to the ownership of an asset to the lessee. A receivable is recognised at anamount equal to the present value of the minimum lease payments, including guaranteed residualvalue, if any. Finance lease receivables are included in advances to customers.
4.6 Investments
Investments other than those categorised as held-for-trading are initially recognised at fair valuewhich includes transaction costs associated with the acquisition of investments. Investmentsclassified as held-for-trading are initially recognised at fair value, and transaction costs are expensedin the consolidated profit and loss account. The Group has classified its investment portfolio into‘held-for-trading’, ‘held-to-maturity’ and ‘available-for-sale’ portfolios as follows:
Held-for-tradingThese are investments, which are either acquired for generating a profit from short-term fluctuations inmarket prices, interest rate movements, dealer's margin or are securities included in a portfolio in which a

Ann
ual R
epor
t 201
2Pa
k Br
unei
Inve
stm
ent C
ompa
ny L
td.
109
Ann
ual R
epor
t 201
2Pa
k Br
unei
Inve
stm
ent C
ompa
ny L
td.
108
pattern of short-term profit taking exists and are to be sold within 90 days of acquisition. These are carriedat market value, with the related surplus / deficit being taken to consolidated profit and loss account.
Held-to-maturityThese are securities with fixed or determinable payments and fixed maturity in respect of which theGroup has the positive intent and ability to hold till maturity. These are carried at amortised cost usingthe effective interest rate method.
Available-for-saleThese are investments that do not fall under the ‘held-for-trading’ or ‘held-to-maturity’ categories.These are carried at market value with the surplus / deficit taken to ‘surplus / deficit on revaluation ofassets’ account below equity. Provision for diminution in the value of investments in respect ofunquoted shares is calculated with reference to break-up value. Provision for unquoted debt securitiesis calculated with reference to the time-based criteria as per the SBP's Prudential Regulations.
On derecognition or impairment in quoted available-for-sale investments, the cumulative gain or losspreviously reported as 'surplus / (deficit) on revaluation of assets' below equity is included in theconsolidated profit and loss account for the year.
Held-for-trading and quoted available-for-sale securities are marked to market with reference toready quotes on Reuters page (PKRV) or the Stock Exchanges.
Unquoted equity securities are valued at the lower of cost and break-up value. The break-up valueof these securities is calculated with reference to the net assets of the investee company as per thelatest available audited financial statements. A decline in the carrying value is charged to theconsolidated profit and loss account. A subsequent increase in the carrying value, upto the cost ofthe investment, is credited to consolidated profit and loss account. Investments in other unquotedsecurities are valued at cost less impairment, if any.
The carrying values of investments are reviewed for impairment at each reporting date. Where anysuch indications exist that the carrying values exceed the estimated recoverable amounts, provisionfor impairment is made through the consolidated profit and loss account.
Investments in associatesAssociates are entities over which the Group has a significant influence, but control does not exist.
Investments in associates are accounted for using the equity method of accounting. Under the equitymethod, the investment in the associate is initially recognised at cost and the carrying amount isincreased or decreased to recognise the investor's share of the profit or loss of the investeesubsequent to the date of acquisition. The increase / decrease in the share of profit or loss ofassociates is accounted for in the consolidated profit and loss account. The Group applies equityaccounting for its own investment in mutual funds managed by its Subsidiary Company.
4.7 Repurchase and resale agreements
Securities sold with a simultaneous commitment to repurchase at a specified future date (repos)continue to be recognised in the consolidated financial statements and are measured in accordancewith accounting policies for investment securities. The counterparty liability for amounts receivedunder these agreements is included in borrowings. The difference between sale and repurchaseprice is treated as mark-up / return / interest expense and accrued over the life of the repoagreement using effective interest rate method.
Securities purchased with a corresponding commitment to resell at a specified future date (reverserepos) are not recognised in the consolidated financial statements, as the Group does not obtaincontrol over the securities. Amounts paid under these agreements are included in lendings to financialinstitutions. The difference between purchase and resale price is treated as mark-up / return / interestincome and accrued over the life of the reverse repo agreement using effective interest rate method.
4.8 Derivative financial instruments
Derivative financial instruments are initially recognised at fair value on the date on which thederivative contract is entered into and are subsequently re-measured at fair value using appropriate
valuation techniques. All derivative financial instruments are carried as assets when fair value ispositive and liabilities when fair value is negative. Any change in the fair value of derivativeinstruments is taken to the consolidated profit and loss account.
4.9 Trade date accounting
All regular way purchases / sales of investment are recognised on the trade date, i.e. the date theGroup commits to purchase / sell the investments. Regular way purchases or sales of investmentrequire delivery of securities within time frame generally established by regulations or convention inmarket place.
4.10 Financial instruments
Financial assets and liabilities are recognised at the time when the Group becomes party to thecontractual provision of the instrument. Financial assets are de-recognised when the contractualright to future cash flows from the asset expires or is transferred along with the risk and reward ofthe asset. Financial liabilities are de-recognised when obligation specific in the contract isdischarged, cancelled or expired. Any gain or loss on de-recognition of the financial asset and liabilityis recognised in the consolidated profit and loss account of the current period. The particularrecognition and subsequent measurement method for significant financial assets and financialliabilities are disclosed in the individual policy statements associated with them.
4.11 Taxation
4.11.1 CurrentThe charge for current taxation is based on taxable income at the current rates of taxation aftertaking into account the tax credits and tax rebates available, if any. The charge for current tax alsoincludes adjustments whenever considered necessary relating to prior year, arising fromassessments framed during the year.
4.11.2 DeferredDeferred income tax is provided, using the balance sheet liability method, on all temporarydifferences at the statement of financial position date between the tax bases of assets and liabilitiesand their carrying amounts for financial reporting purposes.
Deferred income tax assets are recognised for all deductible temporary differences, carry forward ofunused tax assets and any unused tax losses, to the extent that it is probable that taxable profits willbe available against which the deductible temporary differences, carry forward of unused tax assetsand unused tax losses can be utilised.
The carrying amount of deferred income tax assets are reviewed at each reporting date and reducedto the extent that it is no longer probable that sufficient taxable profit will be available to allow all orpart of the deferred income tax asset to be utilised.
Deferred income tax assets and liabilities are measured at the tax rates that are expected to applyto the period when the asset is realised or the liability is settled, based on tax rates (and tax laws)that have been enacted or substantively enacted at the reporting date.
Deferred tax relating to gain / loss recognised in surplus / deficit on revaluation of assets is charged/ credited to such account.
4.12 Operating fixed assets
4.12.1 Property and equipment
4.12.1.1 Owned assetsOperating fixed assets are stated at cost less accumulated depreciation and impairment losses, ifany. Depreciation is charged to the consolidated profit and loss account using the straight linemethod at the rates stated in note 9.2. Depreciation is charged from the date when the asset isavailable for use and no depreciation is charged from the date when the asset is disposed off.
Subsequent costs are included in the asset’s carrying amount or recognised as a separate asset, asappropriate, only when it is probable that future economic benefits associated with the asset will flow
Ann
ual R
epor
t 201
2Pa
k Br
unei
Inve
stm
ent C
ompa
ny L
td.
111
Ann
ual R
epor
t 201
2Pa
k Br
unei
Inve
stm
ent C
ompa
ny L
td.
110
to the Group and the cost of the asset can be measured reliably. The carrying amount of the replacedpart is derecognised. All other repairs and maintenance are charged to the consolidated profit andloss account during the financial period in which they are incurred.
Residual values and useful lives are reviewed at each reporting date and adjusted if the impact ondepreciation is considered significant.
Gain / loss on sale or disposal of fixed assets is recognised in the consolidated profit and loss account.
4.12.1.2 Leased assets
Assets held under finance lease are accounted for by recording the assets and the related liability.These are recorded at lower of fair value and the present value of minimum lease payments at theinception of lease and are subsequently stated net of accumulated depreciation.
Financial charges are allocated over the period of lease term so as to provide a constant periodicrate of financial charge on the outstanding finance lease liability.
Depreciation is charged on leased assets on a basis similar to that of owned assets.
4.12.2 Intangibles
Intangible assets are stated at cost less accumulated amortisation and impairment losses, if any.Intangible assets are amortised using the straight line method at the rate stated in note 9.3. Theresidual values and useful life are reviewed and adjusted, if appropriate at each reporting date.
Amortisation on addition and deletion of intangible assets during the year is charged in proportion tothe period of use.
4.12.3 Capital work-in-progress
Capital work-in-progress is stated at cost. These are transferred to specific assets as and whenassets are available for use.
4.12.4 Impairment
The carrying values of operating fixed assets are reviewed for impairment when events or changesin circumstances indicate that the carrying values may not be recoverable. If any such indicationexists and where the carrying values exceed the estimated recoverable amounts, fixed assets arewritten down to their recoverable amounts.
The resulting impairment loss is taken to consolidated profit and loss account. Where impairmentloss subsequently reverses, the carrying amount of the asset is increased to the revised recoverableamount but limited to the extent of the amount which would have been determined had there beenno impairment. Reversal of impairment loss is recognised as income.
4.13 Provisions
Provision is made when the Group has a legal or constructive obligation as a result of past events,it is probable that an outflow of resources will be required to settle the obligation and a reliableestimate of amount can be made. Provisions are reviewed at each reporting date and are adjustedto reflect the current best estimates.
4.14 Borrowings / deposits
a) Borrowings / deposits are recorded when the proceeds are received.
b) The cost of borrowings / deposits is recognised as an expense in the period in which it isincurred. Any difference between the proceeds and the redemption value is recognised in theconsolidated profit and loss account over the period of the borrowings / deposits using theeffective interest method.
4.15 Offsetting
Financial assets and financial liabilities are only set off and the net amount is reported in theconsolidated financial statements when there is a legally enforceable right to set off and the Group
intends either to settle on a net basis, or to realize the assets and to settle the liabilitiessimultaneously.
4.16 Assets acquired in satisfaction of claims
The Group occasionally acquires assets in settlement of certain advances. These are stated at lowerof the net realizable value of the related advances or the fair value of such assets.
4.17 Staff retirement benefits
4.17.1 Defined contribution plan
4.17.1.1 Staff provident fund
The Group operates a provident fund scheme for its employees. Equal monthly contributions aremade both by the Group and the employees to the fund at the rate of 10% of basic salary.
4.17.1.2 Compensated absences
Compensated absences of employees are accounted for in the period in which these absences areearned. During the year, the Group has terminated its compensated absences policy. Accordingly, noprovision in respect of compensated absences have been made in the current year financial statements.
4.18 Foreign currency translation
Foreign currency transactions are converted into Rupees by applying the exchange rate at the date of therespective transactions. Monetary assets and liabilities in foreign currencies are translated into Rupees atthe rates of exchange prevailing at the reporting date. Exchange gains and losses are included in income.
The Group's consolidated financial statements are presented in Pak Rupees (Rs.) which is theGroup's functional and presentation currency.
4.19 Dividend distribution
Dividend is recognised as a liability in the year in which it is approved by shareholders / directors asappropriate.
4.20 Distributions of bonus shares and other appropriations to reserves
The Group recognises all appropriations, other than statutory appropriations, to reserves includingthose in respect of bonus shares, in the year in which such appropriations are approved byshareholders / directors as appropriate.
4.21 Earnings per share
The Group presents basic and diluted earnings per share (EPS) for its shareholders. Basic EPS iscalculated by dividing the profit or loss attributable to ordinary shareholders of the Group by theweighted average number of ordinary shares outstanding during the year. Diluted EPS is determinedby adjusting the profit or loss attributable to ordinary shareholders and the weighted average numberof ordinary shares outstanding for the effects of all dilutive potential ordinary shares, if any. Therewere no convertible dilutive potential ordinary shares in issue at December 31, 2012.
4.22 Segment Reporting
A segment is a distinguishable component of the Group that is engaged either in providing productor services (business segment) or in providing products or services within a particular economicenvironment (geographical segment), which is subject to risks and rewards that are different fromthose of other segments.
4.22.1 Business Segments
Corporate finance
Corporate finance includes services provided in connection with mergers and acquisitions,underwriting, privatization, securitization, research, debts (government, high yield), equity,syndication, IPO and secondary private placements.

Ann
ual R
epor
t 201
2Pa
k Br
unei
Inve
stm
ent C
ompa
ny L
td.
113
Ann
ual R
epor
t 201
2Pa
k Br
unei
Inve
stm
ent C
ompa
ny L
td.
112
Trading and salesIt includes fixed income, equity, foreign exchange, commodities, credit, funding, lending and repos,brokerage debt and prime brokerage.
Commercial BankingCommercial banking includes project finance, real estate, export finance, trade finance, factoring,leasing, lending, guarantees, bill of exchange and deposits.
4.22.2 Geographical segmentsThe Group operates in Pakistan only.
4.23 Accounting estimates and judgments
The preparation of consolidated financial statements in conformity with the approved accountingstandards requires the use of certain critical accounting estimates. It also requires the managementto exercise its judgment in the process of applying the Group's accounting policies. Estimates andjudgments are continually evaluated and are based on historical experience, including expectationsof future events that are believed to be reasonable under the circumstances. The key areas wherevarious assumptions and estimates are significant to the Group's consolidated financial statementsor where judgment was exercised in application of accounting policies are as follows:
4.23.1 Classification of investmentsi In classifying investments as 'held-for-trading', the Group has determined securities which are
acquired with an intention to trade by taking advantage of short term market / interest ratemovements and are to be sold within 90 days.
ii In classifying investments as 'held-to-maturity', the Group follows the guidance provided in theSBP circulars on classifying non-derivative financial assets with fixed or determinable paymentsand fixed maturity. In making this judgment, the Group evaluates its intention and ability to holdsuch investment till maturity.
iii The investments which are not classified as 'held-for-trading' or 'held-to-maturity' are classifiedas 'available-for-sale'.
4.23.2 Provision against non-performing loans and advancesThe Group reviews its loan portfolio to assess amount of non-performing loans and advances anddetermine provision required there against. While assessing this requirement various factorsincluding the past dues, delinquency in the account, financial position of the borrower andrequirements of Prudential Regulations are considered.
4.23.3 Impairment of available-for-sale equity investmentsThe Group determines that available-for-sale equity investments are impaired when there has beena significant or prolonged decline in the fair value below its cost. The determination of what is“significant or prolonged” requires judgment. In making this judgment, the Group evaluates amongother factors, the normal volatility in share price. In addition, impairment may be appropriate whenthere is evidence of deterioration in the financial health of the investee, industry and sectorperformance, changes in technology, and operational and financing cash flows.
4.23.4 TaxationIn making the estimates for income taxes currently payable by the Group, the management considersthe current income tax laws and the decisions of appellate authorities on certain issues in the past.
4.23.5 Fair value of derivativesThe fair values of derivatives which are not quoted in active markets are determined by usingvaluation techniques. The valuation techniques take into account the relevant interest rates andexchange rates over the term of contract.
4.23.6 Fixed assets, depreciation and amortizationIn making estimates of the depreciation / amortization method, the management uses the methodwhich reflects the pattern in which economic benefits are expected to be consumed by the Group.The method applied is reviewed at each financial year end and if there is a change in the expectedpattern of consumption of the future economic benefits embodied in the assets, the method ischanged to reflect the changed pattern.
December 31 December 31
(Rupees in ‘000)
Note 2012 2011
December 31 December 31
(Rupees in ‘000)
Note 2012 2011
5. CASH AND BALANCES WITH TREASURY BANKSIn hand 8 – ––With State Bank of Pakistan in
Local currency current account 5.1 54,739 174,784With National Bank of Pakistan in
Local currency current account 16 654,763 174,790
5.1 This represents the minimum cash reserve required to be maintained with the SBP in accordancewith the requirement of BSD Circular No. 04 dated May 22, 2004.
6. BALANCES WITH OTHER BANKS
In PakistanOn current accounts – –– – ––On deposit accounts 6.1 317,222 562,085
317,222 562,085
6.1 These carry mark-up at rates ranging from 5.00% to 10.30% per annum (2011: 5.00% to 10.00% per annum).
7. INVESTMENTS7.1 Investment by types
(Rupees in ‘000)
December 31, 2012 December 31, 2011
Held by Given as Held by Given asNote Group collateral Total Group collateral Total
Held-for-trading securities
Market Treasury Bills – –– – –– – –– 260,792 6,977,094 7,237,886Pakistan Investment Bonds – –– – –– – –– 194,855 – –– 194,855Ordinary shares of listed companies – –– – –– – –– 7,837 – –– 7,837
– –– – –– – –– 463,484 6,977,094 7,440,578
Available-for-sale securities 7.4Market Treasury Bills 7.5.1 880,117 – –– 880,117 255,771 12,985,868 13,241,639Pakistan Investment Bonds – –– – –– – –– 340,549 – –– 340,549Ordinary shares of listed companies 7.6 319,707 – –– 319,707 620,040 – –– 620,040Ordinary shares of unlisted companies 7.7 121,375 – –– 121,375 100,000 – –– 100,000Units of mutual funds 7.8 28,835 – –– 28,835 978,890 – –– 978,890Term Finance Certificates and Sukuks 7.11 2,511,797 – –– 2,511,797 3,312,763 – –– 3,312,763Preference shares 7.9 85,625 – –– 85,625 21,500 – –– 21,500
3,947,456 – –– 3,947,456 5,629,513 12,985,868 18,615,381
Held-to-maturity securities
Term Finance Certificates and Sukuks 7.11 191,230 – –– 191,230 190,406 – –– 190,406Investment in associates 7.10 3,220,460 – –– 3,220,460 – –– – –– – –– Investments at cost 7,359,146 – –– 7,359,146 6,283,403 19,962,962 26,246,365Less: Provision for diminution in
value of Investments 7.3 (262,815) – –– (262,815) (409,752) – –– (409,752)Investments (net of provisions) 7,096,331 – –– 7,096,331 5,873,651 19,962,962 25,836,613Deficit on revaluation of
held-for-trading securities - net – –– – –– – –– (3,731) (9,829) (13,560)Surplus / (deficit) on revaluation of
available-for-sale securities - net 16.1 4,485 – –– 4,485 (68,090) (12,599) (80,689)Total investments at market value 7,100,816 – –– 7,100,816 5,801,830 19,940,534 25,742,364

Ann
ual R
epor
t 201
2Pa
k Br
unei
Inve
stm
ent C
ompa
ny L
td.
115
Ann
ual R
epor
t 201
2Pa
k Br
unei
Inve
stm
ent C
ompa
ny L
td.
114
December 31 December 31
(Rupees in ‘000)
7.2 Investments by Segments
Federal Government Securities:
Market Treasury Bills 7.5 880,117 20,479,525Pakistan Investment Bonds – –– 535,404
Fully Paid up Ordinary Shares:
Listed Companies 7.6 319,707 627,877Unlisted Companies 7.7 121,375 100,000
Term Finance Certificates and Sukuks:
Listed 7.11 801,742 1,179,472Unlisted 7.11 1,901,285 2,323,697
Units of mutual funds (including associates) 7.8 & 7.10 3,249,295 978,890
Preference shares 7.9 85,625 21,500
Total investments at cost 7,359,146 26,246,365
Less: Provision for diminution in value of investments 7.3 (262,815) (409,752)
Investments (net of provisions) 7,096,331 25,836,613
Deficit on revaluation of held-for-trading securities - net – –– (13,560)Surplus / (deficit) on revaluation of available-for-sale securities - net 16.1 4,485 (80,689)Total investments at market value 7,100,816 25,742,364
7.3 Particulars of Provision
Opening balance 409,752 336,061
Charge for the year 50,899 73,691Reversal during the year (36,844) – ––
14,055 73,691Impairment on equity securities transferred
to profit and loss account on disposal (160,992) – ––Closing balance 7.3.1 262,815 409,752
7.3.1 Particulars of Provision in respect of Type and Segment
Available-for-sale securities
Ordinary shares of listed companies 29,578 184,965Units of mutual funds 3,576 3,576Preference shares 6,500 5,081Term finance certificates and sukuks 223,161 216,130
262,815 409,752
7.3.2 Investments include certain government securities which are kept with the SBP to meet Statutory Liquidity Requirements determined on the basis of Holding Company’s demand and timeliabilities.
Note 2012 20117.4 Quality of Available-for-Sale Securities
(Rupees in ‘000)
December 31, 2012 December 31, 2011Market value / Carrying value Market value / Carrying value
for unlisted investments Rating for unlisted investments Rating
Market Treasury Bills ( T - bills )
1 Year T-bills 881,769 Government 13,127,672 Government 6 month T-bills – –– Securities 101,262 Securities
881,769 13,228,934
Pakistan Investment Bonds (PIBs)
10 year PIBs – –– Government 47,291 Government 5 year PIBs – –– Securities 192,618 Securities3 year PIBs – –– 98,568
– –– 338,477
Ordinary shares of listed companies
Oil & Gas marketing /
exploration companies
Pakistan State Oil Company Limited 32,293 AA+ 20,651 AA+Pakistan Petroleum Limited 3,430 Unrated – –– –
Commercial banks
JS Bank Limited – –– – 3,524 AUnited Bank Limited 44,387 AA+ – –– –
NBFCs
KASB Securities Limited – –– – 6,720 A
Communication
Pakistan Telecommunication Company Limited 11,304 Unrated – –– –
Power generation and distribution
Kot Addu Power Company Limited 10,298 AA+ 38,059 AA+Nishat Chunian Power Limited – –– – 8,925 AA-Nishat Power Limited – –– – 1,583 AA-The Hub Power Company Limited 20,856 AA+ 133,860 AA+
Cement
D.G Khan Cement Company Limited – –– – 39,376 UnratedGharibwal Cement Limited 71,440 Unrated 45,400 D
Chemicals
Engro Corporation Limited 24,207 A 33,372 AANimir Industrial Chemicals Limited,
a related party 14,050 Unrated 11,683 Unrated
Fertilizers
Fauji Fertilizers Company Limited 40,999 Unrated – –– –Agritech Limited 14,695 D – –– –
Personal goods
Nishat Mills Limited – –– – 30,094 AA-287,959 373,247
Ordinary shares of unlisted companies
Faruki Pulp Mills Limited 100,000 Unrated 100,000 UnratedOmer Jibran Engineering Industries Limited 21,375 Unrated – –– –
121,375 100,000
Preference shares
Pakistan Mercantile Exchange Limited 15,000 BBB 15,000 BBBOmer Jibran Engineering Industries Limited 64,125 Unrated – –– –Trust Investment Bank Limited – –– Unrated 1,419 Unrated
79,125 16,419

Ann
ual R
epor
t 201
2Pa
k Br
unei
Inve
stm
ent C
ompa
ny L
td.
117
Ann
ual R
epor
t 201
2Pa
k Br
unei
Inve
stm
ent C
ompa
ny L
td.
116
(Rupees in ‘000)
December 31, 2012 December 31, 2011Market value / Carrying value Market value / Carrying value
for unlisted investments Rating for unlisted investments Rating
Units of mutual funds
ABL Cash Fund – –– – 243,535 AA+ (f)Askari Sovereign Cash Fund – –– – 243,247 AA+ (f)UBL Government Securities Fund – –– – 145,421 AA- (f)UBL Liquidity Plus Fund – –– – 243,908 AA+ (f)BMA Empress Cash Fund – –– – 50,111 AA+ (f)Pak Oman Advantage Fund 26,643 AA- (f) 26,356 AA- (f)
26,643 952,578
Term Finance Certificates (TFCs) and Sukuks
Listed TFCs
Commercial banks
Allied Bank Limited - 1st Issue 50,435 AA 50,455 AA-Allied Bank Limited - 2nd Issue 25,195 AA 25,054 AA-Askari Bank Limited - 1st Issue 581 AA- 575 AA-Askari Bank Limited - 2nd Issue 30,335 AA- 30,018 AA-Askari Bank Limited - 4th Issue 104,410 AA- 108,392 AA-Bank Al Falah Limited - 2nd Issue – –– – 9,338 AA-Bank Al Falah Limited - 3rd Issue 6,715 AA- 10,007 AA-Bank Al Habib Limited - 1st Issue – –– – 26,399 AA-Bank Al Habib Limited - 2nd Issue – –– – 15,566 AAFaysal Bank Limited - 1st Issue 5,209 AA- 4,852 AA-Faysal Bank Limited - 3rd Issue 4,940 AA- 10,170 AA-NIB Bank Limited 131,095 A+ 321,372 A+Soneri Bank Limited 2,500 A+ 7,494 A+Standard Chartered Bank
(Pakistan) Limited - 3rd Issue 2,552 AAA 7,158 AAASummit Bank Limited 89,366 A(SO) 200,000 A(SO)United Bank Limited - 1st Issue – –– – 87,650 AAUnited Bank Limited - 2nd Issue 69,744 AA 70,784 AAUnited Bank Limited - 3rd Issue 3,375 AA 5,063 AAUnited Bank Limited - 4th Issue 83,559 AA 81,635 AA
Fertilizer
Engro Chemical Limited 2,342 A+ 2,382 AAEngro Fertilizer Limited - 3rd Issue 164 A+ 185 AAPak Arab Fertilizer Limited – –– – 37,566 AA
Real estate developers
Pace Pakistan Limited – –– – 433 D
NBFCs
Saudi Pak Leasing Company Limited – –– – 25,508 D
Telecommunication
World Call Telecom Limited 21,630 D 28,562 APakistan Mobile Communication Limited 141,499 AA- – –– –
775,646 1,166,618
Unlisted TFCs and Sukuks
Commercial banks
Askari Bank Limited - 4th Issue – –– – 150,000 AA-Bank Al Habib Limited - PPTFC 2 – –– – 261,188 AA
Fertilizer
Agritech Limited - 1st Issue 2,242 D 3,293 DAgritech Limited - 4th Issue 26,361 D 42,127 DAgritech Limited - 5th Issue 5,584 D – –– –Engro Fertilizer Limited - 1st Issue 453,180 A+ 275,773 AEngro Fertilizer Limited - 2nd Issue 63,902 A+ 63,888 A
(Rupees in ‘000)
December 31, 2012 December 31, 2011Market value / Carrying value Market value / Carrying value
for unlisted investments Rating for unlisted investments Rating
Sugar
Al Abbas Sugar Mills Limited - 2nd Issue 43,718 A+ 87,046 A+JDW Sugar Mills Limited - 2nd Issue 40,769 A+ 66,593 A+
Pharmaceutical
Martin Dow Pharmaceutical Pakistan Limited 267,060 A 331,700 A
Cement
Kohat Cement Company Limited 5,738 D 17,650 UnratedMaple Leaf Cement Factory Limited - 1st Issue 337,643 D 304,133 DMaple Leaf Cement Factory Limited - 2nd Issue 2,825 D 7,628 D
NBFCs
Jahangir Siddiqui & Co. Limited 92,212 AA+ 91,715 AA
Personal goods
Azgard Nine Limited I 7,793 D – –– –Azgard Nine Limited II 4,370 D 24,980 DAzgard Nine Limited III 11,079 D – –– –
Real estate developers
Eden Housing (Private) Limited 143,363 D 208,759 D
Consumer electronics
New Allied Electronics (Private) Limited – –– D – –– DPak Elektron Limited - 3rd Issue 200,000 D 200,000 A
Oil and gas
Sui Southern Gas Company Limited – –– – 2,600 AA2,483,485 3,305,6913,880,356 18,315,346
7.5 Particulars of investments in Federal Government Securities
7.5.1 Available-for-sale
Market Treasury Bills 880,117 13,241,639Pakistan Investment Bonds – –– 340,549Carrying value (before revaluation) of investments in
federal government securities 880,117 13,582,188Surplus / (deficit) on revaluation of securities 1,652 (14,777)Market value as at December 31, 2012 881,769 13,567,411
December 31 December 31
(Rupees in ‘000)
Note 2012 2011

Ann
ual R
epor
t 201
2Pa
k Br
unei
Inve
stm
ent C
ompa
ny L
td.
119
Ann
ual R
epor
t 201
2Pa
k Br
unei
Inve
stm
ent C
ompa
ny L
td.
118
7.6 Particulars of investments in ordinary shares of listed companies - available-for-sale
Cost as at Cost as at Name of investee company December 31, December 31, December 31 December 31,
2012 2011 2012 2011
No. of shares held (Rupees in 000)
Oil and gas marketing / exploration companies
Pakistan State Oil Company Limited 139,069 90,891 33,141 26,547Pakistan Petroleum Limited 19,400 – –– 3,474 – ––
Commercial banks
JS Bank Limited – –– 2,136,000 – –– 48,242United Bank Limited 530,500 – –– 47,165 – ––
NBFCs
KASB Securities Limited – –– 2,921,617 – –– 122,968
Communication
Pakistan Telecommunication Company Limited 651,500 – –– 13,002 – ––
Power generation and distribution
Kot Addu Power Company Limited 208,500 921,079 10,324 39,665Nishat Chunian Power Limited – –– 700,000 – –– 10,764Nishat Power Limited – –– 122,204 – –– 1,911The Hub Power Company Limited 461,000 3,914,022 21,076 149,254
Cement
D.G. Khan Cement Company Limited – –– 2,069,142 – –– 53,329Gharibwal Cement Limited 8,000,000 8,136,192 66,640 67,360
Chemicals
Engro Corporation Limited 263,001 360,000 30,056 45,794Nimir Industrial Chemicals Limited, a related party 3,678,008 5,014,100 9,494 12,937
Fertilizers
Fauji Fertilizers Company Limited 350,000 – –– 41,258 – ––
Agritech Limited (see note 7.6.1) 1,259,337 – –– 44,077 – ––
Personal goods
Nishat Mills Limited – –– 743,976 – –– 41,269
Carrying value (before revaluation and provision)of listed shares 'available-for-sale' 319,707 620,040
Provision for diminution in value of investments (29,578) (184,965)Deficit on revaluation of securities - net (2,170) (61,828)Market value as at December 31, 2012 287,959 373,247
7.6.1 The SBP, vide Letter No. BPRD / BRD-(Policy) / 2013-1857 dated February 15, 2013, has permittedbanks / DFIs to maintain provision equal to 10% of the deficit on revaluation of Ordinary shares ofAgritech Limited. Accordingly, provision for diminution in value of investment includes Rs.2.938million (2011: Rs.Nil) against Ordinary shares of Agritech Limited. The required provision againstexposure amounting to Rs.26.442 million on Ordinary shares of Agritech Limited has not beenrecorded in these financial statements based upon the above relaxation from SBP.
7.7 Particulars of investments in ordinary shares of unlisted companies - available-for-sale
(Rupees in '000)
Name of December December Cost as at Cost as at Chief Executive 31, 2012 31, 2011 December December
Name of investee company Number of shares held 31, 2012 31, 2011
Faruki Pulp Mills Limited Mr. Shahid Saleem 6,666,667 6,666,667 100,000 100,000Omer Jibran Engineering
Industries Limited Mr. Feroz Khan 2,137,500 – –– 21,375 – ––
121,375 100,000
7.8 Particulars of investment in units of mutual funds - available-for-sale
Cost as at Cost as at Name of investee company December 31, December 31, December 31 December 31,
2012 2011 2012 2011
No. of units held (Rupees in 000)
Closed-end mutual fundPak Oman Advantage Fund 2,883,499 2,889,899 28,835 28,890
Open-end mutual fundsAskari Sovereign Cash Fund – –– 2,420,464 – –– 250,000ABL Cash Fund – –– 24,307,680 – –– 250,000BMA Express Cash Fund – –– 4,834,702 – –– 50,000UBL Government Securities Fund – –– 1,448,945 – –– 150,000UBL Liquidity Plus Fund – –– 2,427,321 – –– 250,000
Carrying value (before revaluation and provision)of mutual funds units 'available-for-sale' 28,835 978,890
Provision for diminution in value of investments (3,576) (3,576)Surplus / (deficit) on revaluation of securities - net 1,384 (22,736)Market value as at December 31, 2012 26,643 952,578
7.9 Particulars of investment in unlisted preference shares - available-for-sale
Cost as at Cost as at Name of investee company December 31, December 31, December 31 December 31,
2012 2011 2012 2011
No. of shares held (Rupees in 000)
Pakistan Mercantile Exchange Limited 7.9.1 1,500,000 1,500,000 15,000 15,000Omer Jibran Engineering Industries Limited 7.9.2 6,412,500 – –– 64,125 – ––
Trust Investment Bank Limited 7.9.3 650,000 650,000 6,500 6,500Carrying value (before revaluation
and provision) of preference shares 'available-for-sale' 85,625 21,500
Provision for diminution in value of investments (6,500) (5,081)Market value as at December 31, 2012 79,125 16,419
7.9.1 These are cumulative, convertible, redeemable and non-participatory preference shares, carryingdividend at the rate of one year Kibor + 250 basis points per annum, of the face value of Rs.10 each.These carry call option exercisable at any time between the period of two years commencing fromsubscription date i.e. June 30, 2011.
7.9.2 These are cumulative, convertible, redeemable and non-participatory preference shares, carryingdividend at the rate of 10% per annum applicable after two years from the date of investment i.e.July 06, 2012, of the face value of Rs.10 each. These shares carry call option exercisable at anytime after subscription date till termination of this agreement.
7.9.3 These are cumulative, convertible, redeemable and non-participatory preference shares, carryingdividend at the rate of 1 year Kibor + 1% per annum, of the face value of Rs.10 each. These shares carrycall option exercisable by the issuer between 3 to 5 years from the date of allotment i.e. May 05, 2010.
7.10 Investment in associates
Primus Cash Fund 7.10.1 2,970,460 – ––Primus Daily Reserve Fund 7.10.2 250,000 – ––
3,220,460 – ––
Note
December 31 December 31
(Rupees in ‘000)
Note 2012 2011

Ann
ual R
epor
t 201
2Pa
k Br
unei
Inve
stm
ent C
ompa
ny L
td.
121
Ann
ual R
epor
t 201
2Pa
k Br
unei
Inve
stm
ent C
ompa
ny L
td.
120
Unlisted TFCs
Fertilizer
Agritech Limited - 1st Issue 6 Months KIBOR+1.75% Half Yearly 29-Nov-17 1,000 5,000 5,000 3,637 Mr. Ahmed Jaudet Bilal
Agritech Limited - 4th Issue 3 Months KIBOR+3.25% Quarterly 1-Dec-17 9,000 5,000 45,000 42,766 Mr. Ahmed Jaudet Bilal
Agritech Limited - 5th Issue 0% Coupon Half Yearly 1-Jan-15 1,672 5,000 8,360 8,360 Mr. Ahmed Jaudet Bilal
Engro Fertilizer Limited - 1st Issue 6 Months KIBOR+1.70% Half Yearly 18-Mar-18 93,450 5,000 467,250 453,180 Mr. Muhammad Ali Uddin Ansari
Engro Fertilizer Limited - 2nd Issue 6 Months KIBOR+1.25% Half Yearly 18-Mar-18 13,000 5,000 65,000 63,902 Mr. Muhammad Ali Uddin Ansari
Sugar
Al-Abbas Sugar Mills Limited - 2nd Issue 6 Months KIBOR+1.75% Half Yearly 21-Nov-13 44,000 5,000 220,000 43,718 Mr. Shunaid Qureshi
JDW Sugar Mills Limited 3 Months KIBOR+1.25% Quarterly 23-Jun-14 24,754 5,000 123,770 40,769 Mr. Jahangir Khan Tareen
Pharmaceuticals
Martin Dow Pharmaceutical (Pak) Limited - PPTFC 3 Months KIBOR+3% Monthly 31-May-15 100,000 5,000 500,000 267,060 Mr. Muhammad Javaid Akhai
NBFCs
Jahangir Siddiqui & Company Limited 6 Months KIBOR+1.70% Half Yearly 4-Jul-13 18,500 5,000 92,500 92,212 Mr. Sueman Lalani
Textiles
Azgard Nine Limited - 1st Issue 3 Months KIBOR+1.25% Quarterly 18-Nov-15 15,000 5,000 75,000,000 7,793 Mr. Ahmed H Shaikh
Azgard Nine Limited - 2nd Issue 6 Months KIBOR+2.20% Half Yearly 4-Dec-17 5,000 5,000 25,000,000 10,838 Mr. Ahmed H Shaikh
Azgard Nine Limited - 3rd Issue 0% Coupon Quarterly 28-Jun-17 5,496 5,000 27,480,000 27,480 Mr. Ahmed H Shaikh
1,061,715
Unlisted sukuks
Cement
Maple Leaf Cement Factory - 1st issue 3 Months KIBOR+1.00% Quarterly 3-Dec-18 100,200 5000 501,000,000 337,643 Mr. Sayeed Tariq Saigol
Maple Leaf Cement Factory - 2nd issue 3 Months KIBOR+1.00% Quarterly 31-Mar-12 1,695 5,000 8,475,000 2,825 Mr. Sayeed Tariq Saigol
Kohat Cement Limited - Sukkuk 6 Months KIBOR+2.50% Half Yearly 20-Dec-15 5,000 5,000 25,000,000 5,738 Mr. Aizaz Mansoor Sheikh
Consumer electronics
New Allied Electronics (Private) Limited 3 Months KIBOR+2.20% Quarterly 3-Dec-12 30,000 5,000 150,000 150,000 Mr. Mian Parvaiz Akhtar
Pak Elektron Limited 3 Months KIBOR+1.00% Quarterly 31-Mar-15 40,000 5,000 200,000 200,000 Mr. Naseem Saigol
Real estate developers
Eden Housing (Private) Limited 3 Months KIBOR+2.50% Half Yearly 29-Jun-14 66,526 5,000 332,630 143,364 Dr. Muhammad Amjad
839,570
Carrying value (before revaluation and provision) of TFCs and Sukuks 'available-for-sale' 2,703,027
Provision for diminution in value of investments (223,161)
Surplus on revaluation of securities - net 3,619
Market value as at December 31, 2012 2,483,485
Real estate developers
Pace Pakistan Limited 6 Months KIBOR+1.50% Half Yearly 15-Feb-17 115 5,000 575 574 Ms. Aamna Ali Taseer
NBFCs
Saudi Pak Leasing Company Limited - 3rd Issue 6.00% Fixed Monthly 13-Mar-17 9,099 5,000 45,495 29,142 Mr. Nayyar Alam Ilyas
Telecommunication
World Call Telecom Limited 6 Months KIBOR+1.60% Half Yearly 7-Oct-13 10,000 5,000 50,000 19,941 Mr. Babar Ali Syed
Pakistan Mobile Communication Limited 3 Months KIBOR+2.65% Quarterly 18-Apr-16 1,500 100,000 150,000 142,500 Mr. Rashid Khan
801,742
(Rupees) (Rupees in ‘000)
Name of the investee Rate of interest Profit Maturity Number of Paid-up Total Paid up Balance as at Name of payment certificates value per value (before December Chief
held certificate redemption) 31, 2012 Executive7.10.1 Primus Cash Fund
Investment as at January 01, 2012 – –– – ––Investment made during the year 4,215,000 – ––Redemption during the year (1,223,856) – ––Share of loss for the year (20,684) – ––Balance as at December 31, 2012 2,970,460 – ––
Percentage holding as at December 31, 2012 96.25% – ––
7.10.1.1 Primus Cash Fund is an open ended mutual fund, listed on the Karachi Stock Exchange. Being anopen ended mutual fund, the fund offers units for public subscription on a continuous basis.
7.10.1.2 The details of assets, liabilities, revenues and profits of the Fund as of December 31, 2012 basedon unaudited financial statements are as follows:
Assets Liabilities Revenue Profit
Primus Cash Fund 2012 3,154,653 68,592 128,483 106,469
2011 – –– – –– – –– – ––
7.10.2 Primus Daily Reserve FundThis represents amount paid on account of subscription money as part of the Initial Public Offering(IPO) of Primus Daily Reserve Fund - an open ended mutual fund under the management of theGroup. The IPO subsequently closed on January 01, 2013 and units were made available fortrading on January 02, 2013.
7.11 Particulars of investments in Term Finance Certificates (TFCs) and Sukuks
(Rupees) (Rupees in ‘000)
Name of the investee Rate of interest Profit Maturity Number of Paid-up Total Paid up Balance as at Name of payment certificates value per value (before December Chief
held certificate redemption) 31, 2012 Executive
Listed TFCs
Commercial banks
Allied Bank Limited - 1st Issue 6 Months KIBOR+1.90% Half Yearly 6-Dec-14 10,000 5,000 50,000 49,907 Mr. Khalid Ahmed Sherwani
Allied Bank Limited - 2nd Issue 6 Months KIBOR+0.85% Half Yearly 28-Aug-19 5,000 5,000 25,000 24,298 Mr. Khalid Ahmed Sherwani
Askari Bank Limited - 4th Issue 6 Months KIBOR+2.50% Half Yearly 18-Nov-19 20,700 5,000 103,500 104,076 Mr. M.R Mehkari
Askari Bank Limited - 1st issue 6 Months KIBOR+1.50% Half Yearly 4-Feb-13 115 5,000 575 593 Mr. M.R Mehkari
Askari Bank Limited - 2nd Issue 6 Months KIBOR+1.50% Half Yearly 31-Oct-13 6,000 5,000 30,000 29,893 Mr. M.R Mehkari
Bank Alfalah Limited - 3rd Issue 6 Months KIBOR+1.50% Half Yearly 25-Nov-13 2,000 5,000 10,000 6,627 Mr. Atif Bajwa
Faysal Bank Limited 6 Months KIBOR+1.40% Half Yearly 12-Nov-14 1,031 5,000 5,153 5,137 Mr. Naved A. Khan
Faysal Bank Limited - 3rd issue 6 Months KIBOR+1.90% Half Yearly 10-Feb-13 3,946 5,000 19,730 4,928 Mr. Naved A. Khan
Summit Bank Limited 6 Months KIBOR+3.25% Half Yearly 27-Oct-18 18,200 5,000 90,975 90,958 Mr. Hussain Lawai
NIB Bank Limited 6 Months KIBOR+1.15% Half Yearly 5-Mar-16 26,410 5,000 132,050 131,016 Mr. Badar Kazmi
Standard Chartered Bank - 3rd Issue 6 Months KIBOR+2.00% Half Yearly 1-Feb-13 2,000 5,000 10,000 2,506 Mr. Mohsin Ali Nathani
Soneri Bank Limited 6 Months KIBOR+1.60% Half Yearly 5-May-13 2,000 5,000 10,000 2,499 Mr. Aftab Manzoor
United Bank Limited - 2nd Issue 9.49% Fixed Half Yearly 15-Mar-13 14,023 5,000 70,115 69,456 Mr. Atif R. Bokhari
United Bank Limited - 3rd issue 6 Months KIBOR+1.70% Half Yearly 8-Sep-14 1,000 5,000 5,000 3,332 Mr. Atif R. Bokhari
United Bank Limited - 4th issue 6 Months KIBOR+0.85% Half Yearly 14-Feb-18 16,400 5,000 82,000 81,800 Mr. Atif R. Bokhari
Fertilizer
Engro Fertilizer Limited - 3rd issue 6 Months KIBOR+2.40% Half Yearly 17-Dec-16 37 5,000 185 170 Mr. Muhammad Ali Uddin Ansari
Engro Fertilizer Limited - 2nd issue 6 Months KIBOR+1.55% Half Yearly 30-Nov-15 481 5,000 2,405 2,389 Mr. Muhammad Ali Uddin Ansari
December 31 December 31
(Rupees in ‘000)
(Rupees in ‘000)
Note 2012 2011

Ann
ual R
epor
t 201
2Pa
k Br
unei
Inve
stm
ent C
ompa
ny L
td.
123
Ann
ual R
epor
t 201
2Pa
k Br
unei
Inve
stm
ent C
ompa
ny L
td.
122
Particulars of investments in Term Finance Certificates (TFCs) and Sukuks
(Rupees) (Rupees in ‘000)
Name of the investee Rate of interest Profit Maturity Number of Paid-up Total Paid up Balance as at Name of payment certificates value per value (before December Chief
held certificate redemption) 31, 2011 Executive
Listed TFCs
Commercial banks
Allied Bank Limited - 1st Issue 6 Months KIBOR+1.90% Half Yearly 6-Dec-14 10,000 5,000 50,000 49,938 Mr. Khalid Ahmed Sherwani
Allied Bank Limited - 2nd Issue 6 Months KIBOR+0.85% Half Yearly 28-Aug-19 5,000 5,000 25,000 24,995 Mr. Khalid Ahmed Sherwani
Askari bank Limited - 1st Issue 6 Months KIBOR+1.50% Half Yearly 4-Feb-13 115 5,000 575 592 Mr. M.R Mehkari
Askari Bank Limited - 2nd Issue 6 Months KIBOR+1.50% Half Yearly 31-Oct-13 6,000 5,000 30,000 29,974 Mr. M.R Mehkari
Askari Bank Limited - 4th Issue 6 Months KIBOR+2.50% Half Yearly 18-Nov-19 20,700 5,000 103,500 104,183 Mr. M.R Mehkari
Bank Al Habib Limited - 1st Issue 6 Months KIBOR+1.50% Half Yearly 15-Jul-12 8,747 5,000 43,735 28,732 Mr. Abbas D. Habib
Bank Al Habib Limited - 2nd Issue 6 Months KIBOR+1.95% Half Yearly 7-Feb-15 3,000 5,000 15,000 15,347 Mr. Abbas D. Habib
Bank Alfalah Limited - 2nd Issue 6 Months KIBOR+1.50% Half Yearly 23-Nov-12 2,800 5,000 14,000 9,315 Mr. Atif Bajwa
Bank Alfalah Limited - 3rd Issue 6 Months KIBOR+1.50% Half Yearly 25-Nov-13 2,000 5,000 10,000 9,892 Mr. Atif Bajwa
Faysal Bank Limited - 1st Issue 6 Months KIBOR+1.40% Half Yearly 12-Nov-14 1,031 5,000 5,154 5,134 Mr. Naved A. Khan
Faysal Bank Limited - 3rd Issue 6 Months KIBOR+1.90% Half Yearly 10-Feb-13 3,946 5,000 19,730 9,869 Mr. Naved A. Khan
NIB Bank Limited 6 Months KIBOR+1.15% Half Yearly 5-Mar-16 65,510 5,000 327,550 326,139 Mr. Badar Kazmi
Soneri Bank Limited 6 Months KIBOR+1.60% Half Yearly 5-May-13 2,000 5,000 10,000 7,487 Mr. Aftab Manzoor
Standard Chartered Bank - 3rd Issue 6 Months KIBOR+2.00% Half Yearly 1-Feb-12 2,000 5,000 10,000 7,022 Mr. Mohsin Ali Nathani
Summit Bank Limited 6 Months KIBOR+3.25% Half Yearly 27-Oct-18 40,000 5,000 200,000 200,000 Mr. Hussain Lawai
United Bank Limited - 2nd Issue 9.49.% Fixed Half Yearly 15-Mar-13 14,898 5,000 74,490 70,632 Mr. Atif R. Bokhari
United Bank Limited - 3rd Issue 6 Months KIBOR+1.70% Half Yearly 8-Sep-14 1,000 5,000 5,000 5,000 Mr. Atif R. Bokhari
United Bank Limited - 4th Issue 6 Months KIBOR+0.85% Half Yearly 14-Feb-18 16,400 5,000 82,000 81,810 Mr. Atif R. Bokhari
United Bank Limited - 1st Issue 8.45% Fixed Half Yearly 10-Aug-12 28,968 5,000 144,840 94,745 Mr. Atif R. Bokhari
Fertilizer
Engro Chemical Pakistan Limited - 2nd Issue 6 Months KIBOR+1.55% Half Yearly 30-Nov-15 481 5,000 2,405 2,380 Mr. Asad Umar
Engro Chemical Pakistan Limited - 3rd Issue 6 Months KIBOR+2.40% Half Yearly 17-Dec-16 37 5,000 185 185 Mr. Asad Umar
Pak Arab Fertilizer Limited - 1st Issue 6 Months KIBOR+1.50% Half Yearly 28-Feb-13 10,153 5,000 50,775 37,480 Mr. Fawad Ahmed Mukhtar
Real estate developers
Pace Pakistan Limited 6 Months KIBOR+1.50% Half Yearly 15-Feb-17 115 5,000 575 575 Ms. Aamna Ali Taseer
NBFCs
Saudi Pak Leasing Company Limited 6.00% Fixed Monthly 13-Mar-17 9,099 5,000 45,495 31,362 Mr. Nayyar Alam Ilyas
Telecommunication
World Call Telecom Limited 6 Months KIBOR+1.60% Half Yearly 7-Oct-13 10,000 5,000 50,000 26,684 Mr. Babar Ali Syed
1,179,472
Unlisted TFCs
Commercial banks
Askari Bank Limited - 4th Issue 6 Months KIBOR+1.75% Half Yearly 23-Dec-21 Units Awaited 1,000,000 150,000 150,000 Mr. M.R Mehkari
Bank Al Habib Limited - PPTFC 15.00% Fixed Half Yearly 30-Jun-21 50,000 5,000 250,000 261,188 Mr. Abbas D. Habib
Fertilizer
Agritech Limited - 2nd Issue 6 Months KIBOR+3.25% Quarterly 1-Dec-17 9,000 5,000 45,000 42,127 Mr. Ahmed Jaudet Bilal
Agritech Limited - 1st Issue 6 Months KIBOR+1.75% Half Yearly 29-Nov-17 1,000 5,000 5,000 3,293 Mr. Ahmed Jaudet Bilal
Engro Fertilizer Limited - 1st Issue 6 Months KIBOR+1.70% Half Yearly 18-Mar-18 56,940 5,000 284,700 275,773 Mr. Asad Umar
Engro Fertilizer Limited - 2nd Issue 6 Months KIBOR+1.25% Half Yearly 18-Mar-18 13,000 5,000 65,000 63,888 Mr. Asad Umar
Sugar
Al Abbas Sugar Mills Limited - 2nd Issue 6 Months KIBOR+1.75% Half Yearly 21-Nov-13 44,000 5,000 220,000 87,046 Mr. Shunaid Qureshi
JDW Sugar Mills Limited 3 Months KIBOR+1.25% Quarterly 23-Jun-14 24,754 5,000 123,770 66,593 Mr. Jahangir Khan Tareen
Pharmaceuticals
Martin Dow Pharmaceutical Pakistan Limited - PPTFC3 Months KIBOR+3% Monthly 31-May-15 100,000 5,000 500,000 331,700 Mr. Muhammad Javaid Akhai
NBFCs
Jahangir Siddiqui & Company Limited 6 Months KIBOR+1.70% Half Yearly 4-Jul-13 18,500 5,000 92,500 91,715 Mr. Munaf Ibrahim
Textiles
Azgard Nine Limited 6 Months KIBOR+2.20% Half Yearly 4-Dec-14 5,000 5,000 25,000 24,980 Mr. Ahmed H Shaikh
1,398,303
Unlisted Sukuks
Cement
Maple Leaf Cement Factory Limited 3 Months KIBOR+1.00% Quarterly 3-Dec-18 100,200 5,000 501,000 337,910 Mr. Sayeed Tariq Saigol
Maple Leaf Cement Factory Limited - 2nd Issue3 Months KIBOR+1.00% Quarterly 31-Mar-12 1,695 5,000 8,475 8,475 Mr. Sayeed Tariq Saigol
Kohat Cement Limited Sukuk 6 Months KIBOR+2.50% Half Yearly 20-Dec-15 5,000 5,000 25,000 17,650 Mr. Aizaz Mansoor Sheikh
Consumer electronics
New Allied Electronics (Private) Limited 3 Months KIBOR+2.20% Quarterly 3-Dec-12 30,000 5,000 150,000 150,000 Mr. Zeeshan Parvaiz Akhtar
Pak Electron Limited 3 Months KIBOR+1.00% Quarterly 31-Mar-15 40,000 5,000 200,000 200,000 Mr. Naseem Saigol
Real estate developers
Eden Housing (Private) Limited 3 Months KIBOR+2.50% Half Yearly 29-Jun-14 66,526 5,000 332,630 208,759 Dr. Muhammad Amjad
Oil and gas
Sui Southern Gas Company Limited 3 Months KIBOR+0.20% Quarterly 31-Dec-12 1,300 5,000 6,500 2,600 Mr. Azim Iqbal Siddiqui
925,394
Carrying value (before revaluation and provision) of
TFCs and Sukuks 'available-for-sale' 3,503,169
Provision for diminution in value of investments (216,130)
Surplus on revaluation of securities - net 18,652
Market value as at December 31, 2011 3,305,691
(Rupees) (Rupees in ‘000)
Name of the investee Rate of interest Profit Maturity Number of Paid-up Total Paid up Balance as at Name of payment certificates value per value (before December Chief
held certificate redemption) 31, 2011 Executive
8. ADVANCES
Loans, cash credits, running finances, etc.In Pakistan 4,296,219 3,337,302
LTFF scheme under State Bank of Pakistan 936,165 767,211Margin financing
In Pakistan – –– 88,000Net investment in finance lease
In Pakistan 8.2 549,651 474,860Advances - gross 5,782,035 4,667,373
Provision for non-performing advances - specific 8.3 (2,638) (1,723)Provision for non-performing advances - General – –– (18,989)
8.4 (2,638) (20,712)Advances - net of provision 5,779,397 4,646,661
8.1 Particulars of advances - gross
8.1.1 In local currency 5,782,035 4,667,373In foreign currencies – –– – ––
5,782,035 4,667,373
8.1.2 Short-term (for upto one year) 2,292,588 1,603,915Long-term (for over one year) 3,489,447 3,063,458
5,782,035 4,667,373
December 31 December 31
(Rupees in ‘000)
Note 2012 2011

Ann
ual R
epor
t 201
2Pa
k Br
unei
Inve
stm
ent C
ompa
ny L
td.
125
Ann
ual R
epor
t 201
2Pa
k Br
unei
Inve
stm
ent C
ompa
ny L
td.
124
8.2 Net Investment in Finance Lease
(Rupees in ‘000)
2012 2011Not later Later than Total Not later Later than Totalthan one one year than one one year
year and less than year and less thanfive years five years
Lease rentals receivable 210,581 334,411 544,992 180,713 315,038 495,751
Residual value 12,264 81,423 93,687 – –– 72,874 72,874
Minimum lease payments 222,845 415,834 638,679 180,713 387,912 568,625
Financial charges for future periods (49,437) (39,591) (89,028) (56,490) (37,275) (93,765)
Present value of minimum lease payments 173,408 376,243 549,651 124,223 350,637 474,860
8.2.1 These leases are executed for a term of 3 to 5 years. Security deposit has been obtained within arange of 10% to 20% of the cost of investment at the time of disbursement and has been recordedin other liabilities. The rate of return ranges from 12.40% to 20.16% per annum (2011: 14.68% to21.18% per annum). Lease rentals are receivable in monthly / quarterly installments. The assets areinsured in favour of the Group.
8.3 Advances include Rs.2.638 million (2011: Rs.2.992 million) which have been placed under non-performing status as detailed below:
(Rupees in ‘000)
2012
Classified advances Provision required Provision held
Domestic Overseas Total Domestic Overseas Total Domestic Overseas Total
Category of
Classification
Other assets especially mentioned – –– – –– – –– – –– – –– – –– – –– – –– – ––
Substandard – –– – –– – –– – –– – –– – –– – –– – –– – ––
Doubtful – –– – –– – –– – –– – –– – –– – –– – –– – ––
Loss 2,638 – –– 2,638 2,638 – –– 2,638 2,638 – –– 2,638
2,638 – –– 2,638 2,638 – –– 2,638 2,638 – –– 2,638
2011
Classified advances Provision required Provision held
Domestic Overseas Total Domestic Overseas Total Domestic Overseas Total
Category of
Classification
Other assets especially
mentioned – –– – –– – –– – –– – –– – –– – –– – –– – ––Substandard – –– – –– – –– – –– – –– – –– – –– – –– – ––Doubtful 2,537 – –– 2,537 1,268 – –– 1,268 1,268 – –– 1,268Loss 455 – –– 455 455 – –– 455 455 – –– 455
2,992 – –– 2,992 1,723 – –– 1,723 1,723 – –– 1,723
8.4 Particulars of provision against non-performing advances
(Rupees in ‘000)
2012 2011
Specific General Total Specific General Total
Opening balance 1,723 18,989 20,712 1,684 5,845 7,529
Charge for the year 1,268 – –– 1,268 1,089 13,144 14,233
Reversal (353) (18,989) (19,342) (1,050) – –– (1,050)
915 (18,989) (18,074) 39 13,144 13,183
Closing balance 2,638 – –– 2,638 1,723 18,989 20,712
8.4.1 Particulars of provisions against non-performing advances
(Rupees in ‘000)
2012 2011
Specific General Total Specific General Total
In local currency 2,638 – –– 2,638 1,723 18,989 20,712
In foreign currencies – –– – –– – –– – –– – –– – ––
2,638 – –– 2,638 1,723 18,989 20,712
8.5 Particulars of Loans and Advances to Directors,
Associated Companies, etc.
Debts due by directors, executives or officers of the Company or any of them either severally or jointly with any other persons:
Balance at beginning of the year 44,416 38,429Loans granted during the year 17,211 18,224Repayments (13,830) (12,237)Balance at end of the year 47,797 44,416
8.6 Details of loans written offs of Rs.500,000 and above
The detail is given in Annexure-I.
9. OPERATING FIXED ASSETS
Capital work-in-progress 9.1 18 14,049Property and equipment 9.2 55,287 18,727Intangible assets 9.3 5,024 1,291
60,329 34,067
9.1 Capital work-in-progress
Advance to supplier for purchase of furniture and fixtures 18 14,049
December 31 December 31
(Rupees in ‘000)
Note 2012 2011

Ann
ual R
epor
t 201
2Pa
k Br
unei
Inve
stm
ent C
ompa
ny L
td.
127
Ann
ual R
epor
t 201
2Pa
k Br
unei
Inve
stm
ent C
ompa
ny L
td.
126
9.2 Property and equipment
(Rupees in ‘000)
December 31, 2012
COST DEPRECIATION Book value
As at Additions / Written As at As at Charge Written As at as at Rate ofJanuary (Disposals) off December January for the off December December depreciation
01, 2012 31, 2012 01, 2012 year 31, 2012 31, 2012
Owned
Furniture and fixture 8,066 7,592 – – 15,658 4,678 2,687 – – 7,365 8,293 20%
– – – –
Leasehold improvement 10,446 42,321 (10,446) 42,321 6,246 7,119 (6,692) 6,673 35,648 20%
– – – –
Office equipment 2,735 1,557 – – 4,292 1,753 748 – – 2,501 1,791 20%
– – – –
Computers 9,355 3,292 – – 12,590 7,582 1,855 – – 9,422 3,168 33.33%
(57) (15)
Vehicles 10,276 42 – – 10,318 2,025 1,986 – – 4,011 6,307 25%
– – – –
Mobile sets 241 67 – – 256 108 96 – – 176 80 50%
(52) (28)
41,119 54,871 (10,446) 85,435 22,392 14,491 (6,692) 30,148 55,287
(109) (43)
December 31, 2011
COST DEPRECIATION Book value
As at Additions / Transfers As at As at Charge Transfers As at as at Rate ofJanuary (Disposals) December January for the December December depreciation
01, 2011 31, 2011 01, 2011 year 31, 2011 31, 2011
Owned
Furniture and fixture 8,047 19 – 8,066 3,066 1,612 – 4,678 3,388 20%– – – –
Leasehold improvement 10,661 – – – 10,446 4,257 2,122 – 6,246 4,200 20%(215) (133)
Office equipment 2,706 42 (13) 2,735 1,220 536 (3) 1,753 982 20%– – – –
Computers 8,528 919 13 9,355 6,092 1,592 3 7,582 1,773 33.33%(105) (105) –
Vehicles 6,901 7,875 – 10,276 3,489 1,605 – 2,025 8,251 25%(4,500) (3,069)
Mobile sets 187 167 – 241 144 77 – 108 133 50%(113) (113)
37,030 9,022 – 41,119 18,268 7,544 – 22,392 18,727(4,933) (3,420)
9.2.1 Assets having cost of Rs.15.221 million (2011: Rs.12.834 million) are fully depreciated.
9.2.2 Details of disposal of fixed assets
Details of assets whose original cost or the book value exceeds rupees one million or two hundredand fifty thousand, whichever is lower are given below:
Rupees in ‘000)
Cost Net Book Sale Gain Mode of Particulars ofParticulars Value proceeds Disposal Purchaser
Property and equipment
(having book value of less than Rs.250,000 Various Employees / or cost of less than Rs.1,000,000) 109 66 71 5 Insurance
Company
2012 109 66 71 5
2011 4,932 1,512 1,581 (69)
Details of write offsLeasehold improvement 10,446 3,754 – –– (3,754)
9.3 Intangible assets
(Rupees in ‘000)
December 31, 2012
COST AMORTIZATION Book valueAs at Additions As at As at Charge for As at as at Rate of
January December January the year December December Amortization01, 2012 31, 2012 01, 2012 31, 2012 31, 2012
Computer software 8,772 5,652 14,424 7,481 1,919 9,400 5,024 33.33%
December 31, 2011
COST AMORTIZATION Book valueAs at Additions As at As at Charge for As at as at Rate of
January December January the year December December Amortization01, 2011 31, 2011 01, 2011 31, 2011 31, 2011
Computer software 7,998 774 8,772 5,848 1,633 7,481 1,291 33.33%
10. DEFERRED TAX LIABILITIES - NET
Deductible temporary differences
Provision for compensated absences and bonus 8,400 8,003Unrealised loss on revaluation of held-for-trading securities – –– 4,466Deficit on revaluation of securities - net – –– 12,576Provision for diminution in the value of investments 69,981 66,397Provision against non-performing loans and advances 923 7,249Provision against other assets 17,500 17,458Pre-incorporation expenses 301 401Unused tax losses carried forward – –– 90
Taxable temporary differences
Difference between accounting book value of fixed assets and tax base (7,448) (2,303)Amortisation of discount on investments (27,195) (87,782)Net investment in finance lease (45,692) (25,270)Amortisation of transaction cost – –– (1,668)Surplus on revaluation of securities - net (3,367) – ––
13,403 (383)
December 31 December 31
(Rupees in ‘000)
2012 2011

Ann
ual R
epor
t 201
2Pa
k Br
unei
Inve
stm
ent C
ompa
ny L
td.
129
Ann
ual R
epor
t 201
2Pa
k Br
unei
Inve
stm
ent C
ompa
ny L
td.
128
10.1 Movement in temporary differences during the year(Rupees in ‘000)
Balance Recognised Recognised in Balance Recognised Recognised in Balance as as at in profit (surplus)/deficit as at in profit (surplus)/deficit as at
January 01, and loss in revaluation of December 31, and loss in revaluation of December 31,2011 account assets account 2011 account assets account 2012
Deductible temporary differencesProvision for compensated
absences and bonus 5,030 2,973 – – 8,003 397 – – 8,400Unrealised loss on revaluation of
held-for-trading securities – – 4,466 – – 4,466 (4,466) – – – –Provision for diminution
in the value of investments 60,030 6,367 – – 66,397 3,584 – – 69,981Provision against non-performing
loans and advances 2,635 4,614 – – 7,249 (6,326) – – 923Provision against other assets 17,625 (167) – – 17,458 42 – – 17,500Pre-incorporation expenses – – 401 – – 401 (100) – – 301Unused tax losses carried forward – – 90 – – 90 (90) – – – –
Taxable temporary differenceDifference between accounting
book value of fixed assets and tax base (1,649) (654) – – (2,303) (5,145) – – (7,448)
Amortisation of discount on investments (136,221) 48,439 – – (87,782) 60,587 – – (27,195)
Net investment in finance lease (8,465) (16,805) – – (25,270) (20,422) – – (45,692)Amortisation of transaction cost – – (1,668) – – (1,668) 1,668 – – – –(Surplus) / deficit on revaluation
of securities - net 11,348 – – 1,228 12,576 – – (15,943) (3,367)
(49,667) 48,056 1,228 (383) 29,729 (15,943) 13,403
December 31 December 31
(Rupees in ‘000)
Note 2012 2011
December 31 December 31
(Rupees in ‘000)
Note 2012 2011
11. OTHER ASSETSIncome / mark-up accrued in local currency 11.1 279,491 353,988Assets acquired in satisfaction of claims - non-banking assets 11.2 209,652 209,652Advances, deposits and other prepayments 75,041 87,773Unrealised gain on interest rate swap contracts – –– 119Advance tax (payment less provision) 140,125 105,118Dividend receivable 59,281 22,787Receivable against sale of shares – –– 27,756Receivable from associates 11.3 & 11.4 6,917 – ––Others – –– 15
770,507 807,208Less: Provision held against advances, deposits and
other prepayments 11.5 & 11.6 (50,000) (50,000)Other assets (net of provisions) 720,507 757,208
11.1 Included herein is a sum of Rs.0.77 million (2011: Rs.Nil) representing mark-up receivable on Pre-IPO investment in Primus Daily Reserve Fund (an associate).
11.2 This represents properties acquired in satisfaction of claims. The market value of properties as perthe valuation report dated December 31, 2012 amounted to Rs.224 million (2011: Rs.220 million).
11.3 These include Rs.2.08 million (2011: Rs.Nil) representing legal, professional, marketing andadvertisement expenses incurred for the purpose of incorporation and floatation of Funds by theGroup in accordance with the NBFC Regulations. These expenses are recoverable from the Fundssubject to the audit of the expenses.
11.4 This includes Rs.3.32 million (2011: Rs.Nil) management fee receivable from Primus CashManagement Fund.
11.5 This represents Rs.50 million (2011: Rs.50 million) advance against Pre-IPO placement of TermFinance Certificates.
12. BORROWINGS
In Pakistan 2,417,139 23,359,531Outside Pakistan – –– – ––
2,417,139 23,359,531
12.1 Particulars of borrowings with respect to Currencies
In local currency 2,417,139 23,359,531In foreign currencies – –– – ––
2,417,139 23,359,531
12.2 Details of borrowings secured / unsecured
Secured
Borrowing from SBP under LTFF Scheme 12.3 937,139 767,209Repurchase agreement borrowings (Repo) – –– 20,350,655Borrowing from Banks 12.4 1,100,000 1,666,667
2,037,139 22,784,531Unsecured
Letters of placement 12.5 380,000 575,0002,417,139 23,359,531
12.3 The Group has entered into agreements for financing with the SBP for Long-Term Financing underExport Oriented Projects to customers. According to the terms of the respective agreements, the SBPhas the right to receive the outstanding amount from the Group at the due date by directly debiting thecurrent account maintained by the Group with SBP. The rate of return ranges from 7.25% to 9.70% perannum (2011: 7.25% to 9.70% per annum). This is repayable within 7 years (2011: 8 years).
12.4 These represent borrowings secured against hypothecation of receivables and floating charge overterm finance certificates. These carry mark-up at rate ranging from 9.94% to 10.18% per annum (2011:12.43% to 14.42% per annum) and are repayable within 2 years (2011: 3 years).
12.5 These carry mark-up at rate ranging from 9.40% to 12.00% per annum (2011: 11.65% to 12.00% perannum) and are repayable within 2 months (2011: 1 month).
11.6 Provision against other assets
Opening balance 50,000 50,000Charge for the year – –– – ––Closing balance 50,000 50,000

Ann
ual R
epor
t 201
2Pa
k Br
unei
Inve
stm
ent C
ompa
ny L
td.
131
Ann
ual R
epor
t 201
2Pa
k Br
unei
Inve
stm
ent C
ompa
ny L
td.
130
14. OTHER LIABILITIES
Mark-up / return / interest payable in local currency 67,096 96,793Accrued expenses 27,432 32,566Advance against Certificates of Investment – –– 26,971Payable against purchase of shares – –– 5,862Brokerage commission payable 63 1,609Unearned commission 4,786 2,904Security deposit against lease 93,688 72,874Payable to tax authorities 1,138 – ––Others 30,638 38,602
224,841 278,181
15. SHARE CAPITAL
15.1 Authorised Capital
16. SURPLUS / (DEFICIT) ON REVALUATION OF ASSETS - NET OF TAX
16.1 Surplus / (deficit) on revaluation ofavailable-for-sale securities - net of tax
Market Treasury Bills 1,652 (12,705)Pakistan Investment Bonds – –– (2,072)Listed securities
- Term finance certificates 3,619 18,652- Units of open-ended mutual funds – –– (23,779)- Units of closed-end mutual funds 1,384 1,043- Ordinary shares of listed companies (2,170) (61,828)
4,485 (80,689)Deferred tax (liability) / asset recognised (3,367) 12,576
1,118 (68,113)
2012 2011 2012 2011Number of shares (Rupees in ‘000)
600,000,000 600,000,000 Ordinary shares of Rs. 10/- each. 6,000,000 6,000,000
15.2 Issued, subscribed and paid up capital
600,000,000 600,000,000 Ordinary shares fully paid in cash 6,000,000 6,000,000
15.3 The Ministry of Finance and Secretary Economic Affairs Division holds 299,995,999 and 4,001shares (2011: 299,995,999 and 4,001 shares) respectively on behalf of the Government of Pakistanand remaining 300,000,000 shares (2011: 300,000,000 shares) are held by the Brunei InvestmentAgency.
17. CONTINGENCIES AND COMMITMENTS
17.1 Transaction related contingent liability
Letters of credit 152,293 158,884
17.2 In the year 2009, Burj Bank Limited (formerly Dawood Islamic Bank Limited) filed a legal suit amountingto Rs.200 million for damages against the Group for alleged non performance of underwritingcommitment to issue shares at a premium. Legal advisors of the Group are of the opinion that thepossibility of the Group being subject to any liability in relation to the suit is negligible.
17.3 Tax contingencies have been discussed in note 25.2 to these consolidated financial statements.
17.4 Commitments in respect of capital expenditure – –– 28,134
17.5 Commitments to extend credit 716,013 392,750
17.6 Commitments in respect of government securities
Purchase (reverse repo) – –– 464,944
Sale – –– 20,502,275
18. DERIVATIVE INSTRUMENTS
The Group is involved in derivative transactions comprising of Interest Rate Swaps with acommercial bank. Accounting policies in respect of derivative financial instruments are mentionedin note 4.8.
December 31 December 31
(Rupees in ‘000)
2012 2011
December 31 December 31
(Rupees in ‘000)
2012 2011
December 31 December 31
(Rupees in ‘000)
Note 2012 2011
13. DEPOSITS AND OTHER ACCOUNTS
Customers
Certificates of investment- remunerative 13.1 2,824,924 979,018
13.1 These carry mark-up at rates ranging from 9.70% to 12.00% per annum (2011: 11.50% to 13.85%per annum) and are repayable within 1 month to 11 months (2011: 1 month to 10 months).
13.2 Particulars of deposits
In local currency 2,824,924 979,018In foreign currencies – –– – ––
2,824,924 979,018

Ann
ual R
epor
t 201
2Pa
k Br
unei
Inve
stm
ent C
ompa
ny L
td.
133
Ann
ual R
epor
t 201
2Pa
k Br
unei
Inve
stm
ent C
ompa
ny L
td.
132
18.2 Maturity analysis
(Rupees in ‘000)
December 31, 2012Mark to Market
Remaining maturity No. of contracts Notional Principal Negative Positive Net
Within 1 year – – – – –
(Rupees in ‘000)
December 31, 2011Mark to Market
Remaining maturity No. of contracts Notional Principal Negative Positive Net
1 to 2 years 2 200,000 (5,984) 6,103 119
19. MARK-UP / RETURN / INTEREST EARNED
On Loans and advances to:
Customers 684,792 511,800Financial institutions 32,619 19,232
On Investments in:
Available-for-sale securities 2,032,458 1,764,451Held-to-maturity securities 26,442 29,577Held-for-trading securities 120,700 4,658
On Deposits with financial institutions 14,603 17,979On Securities purchased under resale agreements 18,636 49,517On Interest rate swap contracts – –– 9
2,930,250 2,397,223
20. MARK-UP / RETURN / INTEREST EXPENSED
Deposits 310,203 234,292Short-term borrowings 103,108 111,994Long-term borrowings 209,945 72,268Securities sold under repurchase agreements 1,421,559 1,050,723
2,044,815 1,469,277
18.1 Product Analysis
(Rupees in ‘000)
December 31, 2012 December 31, 2011Interest Rate Swaps Interest Rate Swaps
Counter parties with banks for No. of contracts Notional Principal No. of contracts Notional Principal
Hedging – –– – –– – – ––
Market Making – –– – –– 2 200,000
– –– – –– 2 200,000
21. GAIN ON SALE OF SECURITIES - NET
Federal Government Securities- Market Treasury Bills 63,211 90,374- Pakistan Investment Bonds 41,354 (684)Ordinary shares of listed companies 67,733 2,079Term finance certificates 6,469 35,802Units of mutual funds 19,783 5,131
198,550 132,702
22. OTHER INCOME
Profit on sale of property and equipment 5 69Rent income 750 – –Income from sale of scrap items 468 – –Others 50 193
1,273 262
23. ADMINISTRATIVE EXPENSES
Salaries and allowances 105,462 106,710Contribution to defined contribution plan 29 4,423 4,512Non-executive directors' fees, allowances and other expenses 1,797 3,234Rent, taxes, insurance, electricity, etc. 19,606 16,362Legal and professional charges 10,633 7,360Travelling and accommodation 2,466 3,574Communications 2,326 2,050Repairs and maintenance 5,537 3,544Brokerage commission 13,620 12,759Stationery and printing 1,767 1,908Advertisement and publicity 1,074 641Donation 23.1 & 23.2 1,100 4,120Auditors' remuneration 23.3 979 2,575Depreciation 9.2 14,491 7,544Amortisation 9.3 1,919 1,633Vehicle maintenance and fuel expense 18,151 16,002Medical expense 2,056 2,625Fee and subscription 1,974 4,915Bank charges 394 236Others 2,406 2,365
212,181 204,669
23.1 Donations were not made to any donee in which a director or his / her spouse had any interest atany time during the year.
23.2 Donations made in excess of Rs. 100,000 to a single donee are as follows:
Institute of Business Administration 1,000 1,000Prime Minister's Flood Relief Fund – –– 3,000Citizen's Foundation – –– 120
Donations not exceeding Rs.100,000 - others 100 – –1,100 4,120
December 31 December 31
(Rupees in ‘000)
2012 2011
December 31 December 31
(Rupees in ‘000)
Note 2012 2011

Ann
ual R
epor
t 201
2Pa
k Br
unei
Inve
stm
ent C
ompa
ny L
td.
135
Ann
ual R
epor
t 201
2Pa
k Br
unei
Inve
stm
ent C
ompa
ny L
td.
134
December 31 December 31
(Rupees in ‘000)
2012 201123.3 Auditors’ remuneration
Audit fee 525 470Half yearly review fee 225 175Fee for the audit of provident fund –– 25Special certifications 125 150Tax services –– 100Other services –– 1,600Out-of-pocket expenses 104 55
979 2,575
24. OTHER CHARGES
Penalties imposed by the SBP 349 ––Unrealised loss on Interest Rate Swap contracts 119 239Workers' Welfare Fund 515 ––
983 239
25. TAXATION
For the year
Current 330,556 355,528Prior years (2,283) 8,193Deferred (29,728) (48,056)
298,545 315,665
25.1 Relationship between tax expense and accounting profit
Accounting profit before tax 1,080,944 920,129
Tax rate 35% 35%
Tax on accounting profit 385,187 322,045
Tax effect of:
Income chargeable to tax at special rate including FTR (42,606) (31,858)Income exempt from tax (37,110) (3,877)Expenses that are inadmissible in determining taxable profit (8,368) 1,735Permanent differences 3,725 19,427Prior year charge (2,283) 8,193
298,545 315,665
25.2 Income tax returns for the tax years 2007 to 2012 have been filed by the Holding Company on duedates that are deemed to be assessed by the Commissioner Inland Revenue under the provisionsof section 120 of the Income Tax Ordinance, 2001.
Assessments for the tax years 2008 and 2009 were amended by the Additional Commissioner InlandRevenue (ACIR) vide orders dated July 27, 2010 passed under Section 122(5A) of the Income TaxOrdinance, 2001 whereby tax demands of Rs.9.74 million and Rs.28.34 million respectively werecreated. In the amended assessment orders, besides making other additions to income, the ACIRtaxed the amount of amortisation of discount on securities as against the gain on disposal ofsecurities as offered by the Holding Company.
The Holding Company went into appeal where the Commissioner Inland Revenue (Appeals) setaside most of the issues including the issue of amortisation of discount on securities with specificdirections. The tax department has issued a notice for the purpose of giving effect to matters set-aside by the CIR(A). The Holding Company is in the process of filing the relevant explanation anddetails requested by the department.
An appeal filed with the CIR(A) against the rectified order levying Workers' Welfare Fund in the taxyear 2009 was decided in favour of the Holding Company. However, the tax department has filed anappeal with the Appellate Tribunal Inland Revenue against the aforesaid decision of CIR(A).
Assessment order for tax year 2010 has been amended through order under section 122(5A)passed by the ACIR creating a tax demand of Rs.106.50 million. The Holding Company filed appealbefore the CIR(A) and an application for stay of demand against the tax demand. The said order wasrectified by CIR(A) under section 221 of the Ordinance vide order dated January 27, 2012 with arevised tax demand of Rs.51.26 million. An amount of Rs.15.80 million has been paid against thesaid tax demand and an appeal was filed against the order passed under section 122(5A) of theOrdinance. An appeal has been filed by the Holding Company before the CIR(A) against therectification order. Both the Holding Company and the Commissioner Inland Revenue have filedappeals before the Appellate Tribunal Inland Revenue.
During the period, assessment for tax year 2011 was also amended and a tax demand of Rs.55.547million created which was reduced to Rs.52.091 million after issuance of rectified order under section221 of the Income Tax Ordinance, 2001. The Holding Company has already paid for Rs.33.381million out of the said reduce tax demand. An appeal has been filed before the CIRA against theamended order and appellate order to this effect is yet to be issued.
The unrecognised amount relating to WWF pertaining to above tax years amounted to Rs.44.551million. Based on the opinion of the legal advisor, the Holding Company is confident that WWF is notapplicable to the Holding Company as it does not fall into the definition of industrial establishment.Consequently, no provision has been made in the current year's financial statements relating to WWF.
26. EARNINGS PER SHARE
Profit for the year Rupees in '000 782,399 604,464
Weighted average number of ordinary shares Numbers in '000 600,000 600,000
Basic earnings per share Rupees 1.30 1.01
26.1 There were no convertible dilutive potential ordinary shares outstanding as on December 31, 2012and 2011.
December 31 December 31
2012 2011

Ann
ual R
epor
t 201
2Pa
k Br
unei
Inve
stm
ent C
ompa
ny L
td.
137
Ann
ual R
epor
t 201
2Pa
k Br
unei
Inve
stm
ent C
ompa
ny L
td.
136
December 31 December 31
(Rupees in ‘000)
Note 2012 2011
27. CASH AND CASH EQUIVALENTS
Cash and balances with treasury banks 54,763 174,790Balances with other banks 317,222 562,085
371,985 736,875
28. STAFF STRENGTH
Permanent 54 42Temporary / on contractual basis 27 17Total staff strength 81 59
29. DEFINED CONTRIBUTION PLAN
The Group operates a provident fund scheme for all its permanent employees. Equal monthlycontribution at the rate of 10.00% per annum (2011: 10.00% per annum ) is made both by theGroup (employer) and employees. Contributions made to the provident fund during the year areas follows:
Contribution made by the Company 4,423 4,512Contribution made by employees 4,423 4,512
8,846 9,024
30. COMPENSATION OF DIRECTORS AND EXECUTIVES(Rupees in ‘000)
Chief Executive Directors Executives
December 31, December 31, December 31, December 31, December 31, December 31,2012 2011 2012 2011 2012 2011
Managerial remuneration 24,739 21,200 – –– – –– 77,904 67,406
Contribution to defined contribution plan 1,020 1,055 – –– – –– 3,270 3,430
Utilities 503 303 – –– – –– 4,639 14,460
Medical 465 341 – –– – –– 1,986 2,153
Travelling allowance 210 228 1,608 3,234 130 302
Fee for attending Board meetings – –– – –– 190 – –– – –– – ––
Other benefits 303 – –– – –– – –– 691 – ––
27,240 23,127 1,798 3,234 88,620 87,751
Number of persons 2 1 6 3 38 36
30.1 The Chief executive is provided with Group maintained car. Executive means employees other thanthe managing director and directors, whose basic salary exceeds five hundred thousand rupees ina financial year.
(Numbers)
31. FAIR VALUE OF FINANCIAL INSTRUMENTS
All quoted investments have been stated at their market values as disclosed in note 7. All un-quotedinvestments have been stated at lower of cost or break up value, being their estimated fair values.
Fair value of loans and advances, other assets (excluding properties acquired in satisfaction ofclaims as disclosed in note 10.1) and other liabilities cannot be determined with reasonable accuracydue to absence of current and active market for such assets and liabilities and reliable data regardingmarket rates for similar instruments. Loans and advances are repriced frequently on market ratesand are reduced for any impairment against non-performing advances determined in accordancewith Prudential Regulations as stated in note 4.5.
The maturity and re-pricing profile and effective rates are stated in notes 36.3.1 and 36.2.4respectively.
Fair value of these assets and liabilities are not significantly different from their carrying values sinceassets and liabilities are either short-term in nature or in the case of deposits, they are frequentlyrepriced.
32. SEGMENT DETAILS WITH RESPECT TO BUSINESS ACTIVITIES
The segment analysis with respect to business activity is as follows:(Rupees in '000)
Corporate Trading and Commercial
Finance Sales Banking
2012
Total income 50,921 2,683,161 625,260
Total expenses 30,533 1,803,885 423,296
Net income 20,388 858,592 201,964
Segment assets (gross) – –– 8,686,248 5,625,642
Segment non performing loans – –– 2,638 – ––
Investment provided for – –– 428,291 – ––
Segment provision required * – –– 265,453 – ––
Segment liabilities – –– 3,318,597 2,148,307
Segment return on assets (ROA) (%) – –– 4.88% 3.93%
Segment return on net assets (ROA) (%) – –– 17.21% 6.22%
Segment cost of funds (%) – –– 13.83% 13.83%
2011
Total income 68,659 2,131,719 481,171
Total expenses 42,866 1,418,146 300,408
Net income 25,793 713,573 180,763
Segment assets (gross) – –– 28,580,310 4,648,478
Segment non performing loans – –– 102,992 89,856
Investment provided for – –– 802,084 – ––
Segment provision required * – –– 421,476 8,989
Segment liabilities – –– 21,146,867 3,470,246
Segment return on assets (ROA) (%) – –– 3.49% 5.09%
Segment return on net assets (ROA) (%) – –– 11.09% 16.79%
Segment cost of funds (%) – –– 9.44% 9.44%
* The provision required against each segment represents provision held on advances and investments.

Ann
ual R
epor
t 201
2Pa
k Br
unei
Inve
stm
ent C
ompa
ny L
td.
139
Ann
ual R
epor
t 201
2Pa
k Br
unei
Inve
stm
ent C
ompa
ny L
td.
138
(Rupees in '000)
2012 2011Key Other Associates Key Other Associates
management related management related personnel parties personnel parties
Advances
As at beginning of the year 23,286 474,000 – –– 20,063 – –– – ––
Given during the period 8,634 300,000 – –– 8,263 479,000 – ––
Repaid during the period (8,294) (80,435) – –– (5,040) (5,000) – ––
As at end of the year 23,626 693,565 – –– 23,286 474,000 – ––
Borrowings
As at beginning of the year – –– – –– – –– – –– – –– – ––
Given during the period – –– 500,000 – –– – –– – –– – ––
Repaid during the period – –– (500,000) – –– – –– – –– – ––
As at end of the year – –– – –– – –– – –– – –– – ––
Placements
As at beginning of the year – –– – –– – –– – –– – –– – ––
Placements made during the year – –– – –– – –– – –– – –– – ––
Placements matured during the year – –– – –– – –– – –– – –– – ––
As at end of the year – –– – –– – –– – –– – –– – ––
Investments
As at beginning of the year – –– 15,000 – –– – –– – –– – ––
Investments made during the year – –– 98,437 4,465,000 – –– 15,000 – ––
Transfer – –– (15,000) – –– – –– – –– – ––
Redemption during the year – –– 236,528 (1,223,856) – –– – –– – ––
As at end of the year – –– 334,965 3,241,144 – –– 15,000 – ––
Mark-up / return / interest earned 681 83,205 848 642 36,966 – ––
Mark-up / return / interest expensed – –– 1,342 – –– – –– – –– – ––
Gain on sale of securities - net – –– 1,862 23,428 – –– – –– – ––
Fee income – –– 20,250 14,648 – –– – –– – ––
Dividend income – –– 99,522 – –– – –– – –– – ––
Salaries and other benefits 71,431 – –– – –– 64,880 – –– – ––
Reimbursement of expenses 4,036 – –– – –– 10,013 – –– – ––
Formation cost paid by the Group – –– – –– 2,086 – –– – –– – ––
Annual rating fee paid – –– – –– 400 – –– – –– – ––
Others – –– – –– 2,363 – –– – –– – ––
33. TRUST ACTIVITIES
The Holding Company has assumed the role of Trustee to certain issues of Term Finance Certificates(TFCs) / Sukuks and is holding the trust properties in fiduciary capacity on behalf of the relevantbeneficiaries. In this behalf, the Holding Company is fulfilling all its obligations and duties inaccordance with the provisions of the respective trust documents. During the year, the HoldingCompany has been registered as Debt Securities Trustee (DST) under the Debt Securities TrusteeRegulations 2012 issued by the SECP.
The Holding Company is acting as trustee to Term Finance Certificates issued by Agritech Limited, AlAbbas Sugar Mills Limited, Askari Bank Limited–IV, Azgard Nine Limited, Bank Alfalah Limited–IV,Bank Alfalah Limited–V, Bank Al-Habib Limited–IV, Faysal Bank Limited, Martin Dow PharmaceuticalsLimited, Soneri Bank Limited, United Bank Limited–IV, and Sukuk Issue of Agritech Limited, AishaSteel Mills Limited and Maple Leaf Cement Factory Limited. The combined value of these TFCs asat December 31, 2012 amounted to PKR 45,050 million (2011: PKR 28,442 million).
34. RELATED PARTY TRANSACTIONS
The Group has related party relationship with:
l associated company (collective investment schemes of Primus Investment ManagementLimited)
l its employee defined contribution plan;
l its key management personnel;
l other related parties include OK Feed Mills (Pvt) Limited, Omer Jibran Engineering IndustriesLtd., Nimir Industrial Chemicals Limited and Haq Bahu Sugar Mills (Pvt) Limited due to commondirectorship.
Details of loans and advances to the executives are given in note 8.5 to these unconsolidatedfinancial statements. There are no transactions with key management personnel other than undertheir terms of employment. Contribution to approved defined contribution plan are disclosed in note29 to these consolidated financial statements. Remuneration to the executives is disclosed in note30 to the consolidated financial statements. Transactions with owners have been disclosed in'Consolidated Statement of Changes in Equity'. All other transactions between the Group and itsrelated parties are carried out under normal course of business except employee staff loans that areas per terms of employment.
Details of transactions with related parties during the year, other than those which have beendisclosed elsewhere in these unconsolidated financial statements, are as follows:
Notes

Ann
ual R
epor
t 201
2Pa
k Br
unei
Inve
stm
ent C
ompa
ny L
td.
141
Ann
ual R
epor
t 201
2Pa
k Br
unei
Inve
stm
ent C
ompa
ny L
td.
140
Tier II CapitalGeneral Provisions subject to 1.25% of Total Risk Weighted Assets – –– – ––
– –– – ––
Less: Other deductions (50% of investments in equity and other regulatory capital of majority owned securities or other financial subsidiaries not consolidated in the statement of financial position) – –– – ––Total Tier II Capital – –– – ––
Eligible Tier III Capital – –– – ––
Total Regulatory Capital Base 8,573,391 7,914,036
35.3 Risk Weighted Exposures
(Rupees in ‘000)
Capital Requirements Risk Weighted Assets
December 31, 2012 December 31, 2011 December 31, 2012 December 31, 2011
Credit risk
Portfolios subject to standardised approachOn balance sheet exposuresClaims
On Public sector entities in Pakistan 3,107 12,514 31,067 125,142On Banks 6,344 14,553 63,444 145,530On Corporates 926,251 591,862 9,262,515 5,918,621Categorised as retail portfolio 1,422 943 14,222 9,428Fully secured by residential property 1,009 1,115 10,092 11,146Unlisted equity investments 30,075 15,000 300,750 150,000On Listed equity investments and
regulatory capital instruments 64,155 152,234 641,553 1,522,340Past due loans – –– 127 – –– 1,268On investments in fixed assets 5,531 3,278 55,305 32,775On all other assets 46,764 27,724 467,638 277,239
1,084,658 819,350 10,846,586 8,193,489
Off balance sheet exposuresNon-market related 74,124 43,323 741,243 433,230Market related – –– 2 – –– 24
74,124 43,325 741,243 433,2541,158,782 862,675 11,587,829 8,626,743
Market risk
Capital requirement for portfolios subject to standardised approach
Interest rate risk 1,764 147,759 22,050 1,846,988Equity position risk 47,984 65,010 599,800 812,625Foreign exchange risk – –– – –– – –– – ––
49,748 212,769 621,850 2,659,613Operational risk
Capital requirement for operational risks 161,485 147,230 2,018,565 1,840,375Total 1,370,015 1,222,674 14,228,243 13,126,731
Capital adequacy ratio
Total eligible regulatory capital held (note: 36.2) (a) 8,573,391 7,914,036
Total risk weighted assets (b) 14,228,243 13,126,731
Capital adequacy ratio (a) / (b) 60.26% 60.29%
35. CAPITAL - ASSESSMENT AND ADEQUACY
35.1 Scope of Application and Capital StructureThe Basel II Framework is applicable to the Group for determining Capital Adequacy both atconsolidated level (comprising of fully owned subsidiary - Primus Investment Management Limited)and also on stand alone basis. The purpose of this legislation is to provide a modern prudentialframework for credit institutions and investment firms across the globe, improving on the previousBasel I Framework through greater risk sensitivity and reflecting more modern approaches andimprovements in the risk management practices of credit institutions and investment firms. Thedifferent tiers of regulatory capital recognised by SBP are as follows:
Tier I capital, includes fully paid-up capital, balance in share premium account, general reserves as perthe financial statements and net un-appropriated profits after deduction of book value of goodwill /intangibles, deficit on revaluation of available for sale investments and 50% of investments in equityand other regulatory capital of majority owned securities or other financial subsidiaries not consolidatedin the statement of financial position as per the guidelines laid under the Basel II Framework.
Tier II capital includes general provisions for loan losses, reserves on the revaluation of fixed assetsand equity investments, foreign exchange translation reserves and subordinated debts (uptomaximum of 50% of total eligible tier I capital) after deduction of 50% of investments in equity andother regulatory capital of majority owned securities or other financial subsidiaries not consolidatedin the statement of financial position as per the guidelines laid under the Basel II Framework.
Tier III capital has also been prescribed by the SBP for managing market risk. However the Groupdoes not have any Tier III capital.
The required capital adequacy is achieved by the Group through:
a) enhancement in the risk profile of asset mix at the existing volume level;b) ensuring better recovery management; andc) maintaining acceptable profit margins.
35.2 Capital Adequacy
The risk weighted assets to capital ratio is calculated in accordance with the State Bank’s guidelineson capital adequacy. Details of Group's eligible capital on an consolidated basis is as follows:
Regulatory Capital Base
Tier I Capital
Shareholders equity / assigned capital 6,000,000 6,000,000Reserves 555,884 399,204Unappropriated profits 2,022,531 1,596,812
8,578,415 7,996,016
Less: Goodwill, other intangible assets and deficit on account ofrevaluation of available-for-sale portfolio etc. 5,024 1,291
Shortfall in provisions required against classified assets irrespectiveof any relaxation allowed – –– – ––
Deficit on account of revaluation of investments held in AFS category – –– 80,689
Other deductions (50% of investments in equity and other regulatory capitalof majority owned securities or other financial subsidiaries notconsolidated in the statement of financial position) – –– – ––
5,024 81,980Total Tier I Capital 8,573,391 7,914,036
December 31 December 31
(Rupees in ‘000)
2012 2011
December 31 December 31
(Rupees in ‘000)
2012 2011

Ann
ual R
epor
t 201
2Pa
k Br
unei
Inve
stm
ent C
ompa
ny L
td.
143
Ann
ual R
epor
t 201
2Pa
k Br
unei
Inve
stm
ent C
ompa
ny L
td.
142
35.3.1 Credit risk approach
The Group is following standardised approach for all its Credit Risk Exposures. Under standardisedapproach, the capital requirement is based on the credit rating assigned to the counter parties by theExternal Credit Assessment Institutions (ECAIs) duly recognised by SBP for capital adequacypurposes. In this connection, the Group utilises the credit ratings assigned by ECAIs and hasrecognised agencies such as PACRA (Pakistan Credit Rating Agency), JCR-VIS (Japan CreditRating Company – Vital Information Systems), Fitch, Moody’s and Standard & Poors which are alsorecognised by the SBP.
The Standardised Approach to credit risk sets out fixed risk weights corresponding, whereappropriate, to external credit assessment levels or for unrated claims.
35.3.1.1 Selection of ECAIsThe Group selects particular ECAI(s) for each type of claim. Amongst the ECAIs that have beenrecognised as eligible by SBP, the following are being used against each respective claim type.
Exposures to Public Sector Entities (PSEs): For PSE exposures, ratings of PACRA and JCR-VIS areused to arrive at risk weights.
Bank Exposures: For foreign banks (i.e., incorporated outside Pakistan), ratings of Moody’s, S&Pand Fitch is being used to arrive at risk weights. However, for local banks (i.e., incorporated inPakistan) ratings of PACRA and JCR-VIS are used.
Corporate Exposures: Ratings assigned by PACRA and JCR-VIS are used for claims on Corporates(excluding equity exposures).
35.3.1.2 Use of ECAI RatingsThe Group prefers solicited ratings over unsolicited ratings at all times, owing to the greater degreeof accuracy (in general) associated with solicited ratings as compared to unsolicited ratings.Unsolicited ratings may only be used in cases where a solicited rating is not available.
35.3.1.3 Mapping to SBP Rating GradesThe selected final ratings (after application of the principles stated above) for all exposures need tobe translated to the standard rating grades given by the SBP.
35.3.1.4 Types of exposures and ECAI’s used
Exposures JCR-VIS PACRA MOODY’s FITCH S & P
Corporate √ √ - - -
Banks √ √ - - -
SME’s N/A N/A N/A N/A N/A
Sovereigns N/A N/A N/A N/A N/A
Securitisation N/A N/A N/A N/A N/A
Others N/A N/A N/A N/A N/A
35.3.1.5 Credit exposures subject to Standardized Approach
(Rupees in ‘000)
December 31, 2012
Rating Rating Amount Deduction Risk weighted
Exposures category No. risk weighted outstanding CRM* Net amount asset
Cash and Cash Equivalents 0% ––– ––– ––– –––
Corporate 0 0% ––– ––– ––– –––
1 20% 1,305,591 ––– 1,305,591 261,118
2 50% 2,427,106 ––– 2,427,106 1,213,553
3,4 100% 204,376 ––– 204,376 204,376
5,6 150% 1,159,391 ––– 1,159,391 1,739,087
Unrated 100% 5,844,381 ––– 5,844,381 5,844,381
10,940,845 ––– 10,940,845 9,262,515
Retail 0% ––– ––– ––– –––
20% ––– ––– ––– –––
50% ––– ––– ––– –––
75% 18,962 ––– 18,962 14,222
18,962 ––– 18,962 14,222
Banks
- Over 3 Months 0% ––– ––– ––– –––
1 20% ––– ––– ––– –––
2,3 50% ––– ––– ––– –––
4,5 100% ––– ––– ––– –––
6 150% ––– ––– ––– –––
Unrated 50% ––– ––– ––– –––
––– ––– ––– –––
- Maturity upto and under 3 Months in FCY 0% ––– ––– ––– –––
1,2,3 20% ––– ––– ––– –––
4,5 50% ––– ––– ––– –––
6 150% ––– ––– ––– –––
Unrated 20% ––– ––– ––– –––
––– ––– ––– –––
- Maturity upto and under 3 Months in PKR 0% ––– ––– ––– –––
20% 317,222 ––– 317,222 63,444
317,222 ––– 317,222 63,444
Residential mortgage finance 35% 28,835 ––– 28,835 10,092
Public Sector Entity 0% ––– ––– ––– –––
1 20% 155,335 ––– 155,335 31,067
2,3 50% ––– ––– ––– –––
4,5 100% ––– ––– ––– –––
6 150% ––– ––– ––– –––
Unrated 50% ––– ––– ––– –––
155,335 ––– 155,335 31,067
Sovereigns (SBP / GoP) 0% 54,747 ––– 54,747 –––
Equity Investments - Listed 100% 641,553 ––– 641,553 641,553
- Unlisted 150% 200,500 ––– 200,500 300,750
842,053 ––– 842,053 942,303
Past Due Loans
(Not Secured by Residential Mortgages) S.P less than 20% 150% ––– ––– ––– –––
S.P upto 20% 100% ––– ––– ––– –––
S.P greater than 50% 50% ––– ––– ––– –––
––– ––– ––– –––
Investment in fixed assets 100% 55,305 ––– 55,305 55,305
Other assets 100% 467,638 ––– 467,638 467,638
Total 12,880,942 ––– 12,880,942 10,846,586
* Credit Risk Mitigation (CRM)

Ann
ual R
epor
t 201
2Pa
k Br
unei
Inve
stm
ent C
ompa
ny L
td.
145
Ann
ual R
epor
t 201
2Pa
k Br
unei
Inve
stm
ent C
ompa
ny L
td.
144
Credit exposures and comparative figures subject to the standardised approach(Rupees in ‘000)
December 31, 2011
Rating Rating Amount Deduction Risk weightedExposures category No. risk weighted outstanding CRM* Net amount asset
Cash and Cash Equivalents 0% ––– ––– ––– –––
Corporate 0 0% ––– ––– ––– –––
1 20% 1,500,437 ––– 1,500,437 300,087
2 50% 1,614,216 ––– 1,614,216 807,108
3,4 100% 238,216 ––– 238,216 238,216
5,6 150% 814,474 ––– 814,474 1,221,711
Unrated 100% 3,351,499 ––– 3,351,499 3,351,499
7,518,842 ––– 7,518,842 5,918,621
Retail 0% ––– ––– ––– –––
20% ––– ––– ––– –––
50% ––– ––– ––– –––
75% 12,571 ––– 12,571 9,428
12,571 ––– 12,571 9,428
Banks
- Over 3 Months 0% ––– ––– ––– –––
1 20% ––– ––– ––– –––
2,3 50% ––– ––– ––– –––
4,5 100% ––– ––– ––– –––
6 150% ––– ––– ––– –––
Unrated 50% ––– ––– ––– –––
––– ––– ––– –––
- Maturity upto and under 3 Months in FCY 0% ––– ––– ––– –––
1,2,3 20% ––– ––– ––– –––
4,5 50% ––– ––– ––– –––
6 150% ––– ––– ––– –––
Unrated 20% ––– ––– ––– –––
––– ––– ––– –––
- Maturity upto and under 3 Months in PKR 0% ––– ––– ––– –––
20% 727,650 ––– 727,650 145,530
727,650 ––– 727,650 145,530
Residential Mortgage Finance 35% 31,845 ––– 31,845 11,146
Public Sector Entity 0% ––– ––– ––– –––
1 20% 613,163 ––– 613,163 122,633
2,3 50% ––– ––– ––– –––
4,5 100% ––– ––– ––– –––
6 150% ––– ––– ––– –––
Unrated 50% 5,018 ––– 5,018 2,509
618,181 ––– 618,181 125,142
Sovereigns (SBP / GoP) 0% 306,859 ––– 306,859 –––
Equity Investments - Listed 100% 1,522,340 ––– 1,522,340 1,522,340
- Unlisted 150% 100,000 ––– 100,000 150,000
1,622,340 ––– 1,622,340 1,672,340
Past Due Loans
(Not Secured by Residential Mortgages) S.P less than 20% 150% ––– ––– ––– –––
S.P upto 20% 100% 1,268 ––– 1,268 1,268
S.P greater than 50% 50% ––– ––– ––– –––
1,268 ––– 1,268 1,268
Investment in fixed assets 100% 32,775 ––– 32,775 32,775
Other assets 100% 277,239 ––– 277,239 277,239
Total 11,149,570 ––– 11,149,570 8,193,489
* Credit Risk Mitigation (CRM)
35.4 Capital management
Objectives of managing capital
Capital Management aims to ensure that there is sufficient capital to meet the capital requirements ofthe Group as determined by the underlying business strategy and the minimum requirements of theSBP. The Capital Management process is governed by the Group’s Asset and Liability Committee(ALCO). ALCO is responsible for managing the Group’s capital position vis-à-vis internal as well asregulatory requirements. ALCO also reviews the volume and mix of the Group’s assets, liabilities andfunding sources in light of liquidity, capital, risk and profitability considerations.
Group’s capital management seeks:
l to comply with the capital requirements set by the regulators and the capital is comparable tothe peers;
l to increase strategic and tactical flexibility in the deployment of capital to allow for the timelyreallocation of capital;
l to improve the liquidity of the Group’s assets to allow for an optimal deployment of the Group’sresources;
l to protect the Group against unexpected events and maintain strong ratings;
l to safeguard the Group's ability to continue as a going concern so that it can continue to provideadequate return to shareholders;
l availability of adequate capital (including the quantum) at a reasonable cost so as to enable theGroup to expand; and
l to achieve overall low cost of capital with appropriate mix of capital elements.
Externally Imposed Capital Requirements
The paid-up capital and CAR of the Group stands at Rs.6 billion and 60.26% of its risk weightedexposure as at December 31, 2012 respectively.
36. RISK MANAGEMENT
The Risk Management Framework (the Framework) provides principles for identifying, assessing,and monitoring risk within the Group. The Framework specifies the key elements of the riskmanagement process in order to maximise opportunities, to minimise adversity and to achieveimproved outcomes and outputs based on informed decision making.
Categories of Risk
The Group generates most of its revenues by accepting Credit, Liquidity and Market Risk. Effectivemanagement of these risks is the decisive factor in our profitability. In addition, the Group is subjectto certain consequential risks that are common to all business undertakings. These risks aregrouped under two headings: Operational and Reputational Risk. The Framework is organized withreference to these five risk categories, as detailed below:
Credit Risk This risk is defined as the possibility of loss due to unexpected default or adeterioration of credit worthiness of a counter party.
Market Risk The risk of loss generated by adverse changes in the price of assets or contractscurrently held by the Group (this risk is also known as price risk).
Liquidity Risk The risk that the Group is unable to meet its payment obligations or fund increasesin assets when they fall due without incurring an unacceptable cost; theconsequences of which may be the failure to meet obligations to repay investorsand fulfil commitments to lend.

Ann
ual R
epor
t 201
2Pa
k Br
unei
Inve
stm
ent C
ompa
ny L
td.
147
Ann
ual R
epor
t 201
2Pa
k Br
unei
Inve
stm
ent C
ompa
ny L
td.
146
Operational Risk Operational risk is the risk of loss resulting from inadequate or failed internalprocesses, people, and systems or from external events. The definition includeslegal risk.
Reputational Risk The risk of failing to meet the standards of performance or behavior required orexpected by stakeholders in commercial activities or the way in which businessis conducted.
Risk responsibilities
The Board of Directors (the Board) is accountable for overall supervision of the risk managementprocess. The Board is responsible for approval of all risk policies and ensuring that these areproperly implemented. Further, the Board appoints the senior management personnel who arecapable of managing the risk activities conducted by the Group.
A separate unit has been set up for credit risk management. Risk Management comprises of twoareas; Credit Risk Management (CRM) and Middle Office and Operational Risk (MOOR). CRMoversees credit risk taken by the Group while MOOR function overviews market, interest rate,liquidity and operational risks of the Group. The functions of both of these units are subject to thepolicies and manuals approved by the Board, Prudential Regulations and additional regulatorydirectives issued from time to time. These units are independent of business generation and risktaking. CRM monitors the credit portfolio of the Group on a regular basis to ensure prudent lending.Moreover, this department will also set parameters for various risks including i) sectoralconcentration, ii) exposure limits for single and group clients, and iii) monitoring watch list accountsand the entire portfolio. The risk management philosophy is to identify and monitor risk on portfoliobasis and assess the risk taking capacity of the balance sheet as a whole.
Different Management Committees have been set up to review different kinds of risks; mainly beingthe Assets and Liabilities Committee (ALCO), Credit Committee (CC) and Risk ManagementCommittee (RMC). Comprehensive risk management manuals have been designed which cover allsignificant risks including credit, liquidity, market and operational risks and provides guidance tomanagement on risk controls, limits, risk measurement tools and a reporting framework.
36.1 Credit risk
Credit risk, the potential default of one or more debtors, is the largest source of risk for the Group.The Group is exposed to credit risk through its lending and investment activities. The credit riskarising from exposure to corporates is governed by the Credit Risk Management Policy and CreditAdministration Frameworks. The counter party credit risk arising from interbank lines are addressedin the Treasury policy framework.
The Group manages 3 principal sources of credit risk:
i) Sovereign credit risk on its public sector advances.ii) Non-sovereign credit risk on its private sector advances.iii) Counterparty credit risk on interbank limits.
Sovereign credit risk
When the Group lends to public sector borrowers, it prefers obtaining a full sovereignguarantee or the equivalent from the Government of Pakistan (GoP). However, certainpublic sector enterprises have a well defined cash flow stream and appropriate businessmodel, based on which the lending is secured through collaterals other than GoP guarantee.
Non-Sovereign Credit Risk
When the Group lends to private sector borrowers it does not benefit from sovereignguarantees or the equivalent. Consequently, each borrower’s credit worthiness is analyzed ona stand alone basis. A new internal rating model to rate corporate and commercial customershas been designed and its framework has been approved by the Board in July, 2011. The newmodel has been running under parallel testing with the old model in December, 2012.
Counter Party Credit Risk on Interbank Limits
In the normal course of its business, the Group’s Treasury utilizes products such asReverse Repo and call lending to meet the needs of the borrowers and manage itsexposure to fluctuations in market interest rates and to temporarily invest its liquidity priorto disbursement. All of these financial instruments involve, to varying degrees, the risk thatthe counterparty in the transaction may be unable to meet its obligation to the Group.
Reflecting a preference for minimizing exposure to counterparty credit risk, the Groupmaintains eligibility criteria that link the exposure limits to counterparty credit ratings byexternal rating agencies. For example, the minimum rating for counterparties to be eligiblefor a financing relationship with the Group is BBB.
Credit administration
Credit Administration Department is involved in minimizing losses that could arise due to securityand documentation deficiencies.
Risk analytics
To ensure a prudent distribution of asset portfolio, the Group manages its lending and investmentactivities within a framework of Borrower, Group, Product, Geographical and Sector exposure limitsand risk profile benchmarks.
Stress testing
The Group also conducts stress testing of its existing portfolio, which includes all assets, i.e.,advances as well as investments. This exercise is conducted on a semi-annual basis throughassigning shocks to distressed / non performing assets of the Group and assessing its resultingaffect on capital adequacy.
Regular monitoring
Regular monitoring of the advances portfolio is carried out which focuses on early problemrecognition and influences the front office to carry out an assessment of the borrower's ability torectify the identified problem / weakness within a reasonable time-frame, consider tighter structuringof facilities, confirm that there are no critical deficiencies in the existing security position and, ifpossible, arrange for strengthening of the same through obtaining additional collateral. It shouldhowever, be noted that these actions are taken prior to incurring overdues on the facility.
Portfolio diversification
While expanding the advances and the investment (TFCs) portfolio, efficient portfolio diversificationhas been a key consideration despite the relatively small size of operations.

Ann
ual R
epor
t 201
2Pa
k Br
unei
Inve
stm
ent C
ompa
ny L
td.
149
Ann
ual R
epor
t 201
2Pa
k Br
unei
Inve
stm
ent C
ompa
ny L
td.
148
36.1.1 Segmental Information
36.1.1.1 Segments by class of businessDecember 31, 2012
Advances (Gross) Deposits Contingencies
and commitments
Rupees Percent Rupees Percent Rupees Percent in '000 in '000 in '000
Cement 87,570 1.51 – –– – –– – –– – ––
Textile 1,168,055 20.20 – –– – –– 403,595 46.48
Sugar 874,671 15.13 – –– – –– 252,293 29.06
Chemicals and pharmaceuticals 478,189 8.27 – –– – –– – –– – ––
Production and transmission of energy 916,601 15.85 – –– – –– – –– – ––
Financial 219,304 3.79 2,630,000 93.10 – –– – ––
Individuals 44,414 0.77 – –– – –– – –– – ––
Hotel 40,000 0.69 – –– – –– – –– – ––
Telecommunication 116,667 2.02 – –– – –– – –– – ––
Paper and board 177,778 3.07 – –– – –– – –– – ––
Food and confectionary 348,732 6.03 – –– – –– – –– – ––
Oil, gas, petroleum and energy 31,986 0.55 – –– – –– – –– – ––
Entertainment 194,854 3.37 – –– – –– – –– – ––
Transportation 245,706 4.25 – –– – –– 5,914 0.68
Packaging 71,740 1.24 – –– – –– 26,967 3.11
Services – –– – –– 100,000 3.54 30,000 3.46
Electronics and electrical appliances 203,592 3.52 – –– – –– 15,606 1.80
Engineering 85,094 1.47 – –– – –– 14,501 1.67
Others 477,082 8.25 94,924 3.36 119,430 13.75
5,782,035 100.00 2,824,924 100.00 868,306 100.00
December 31, 2011
Advances (Gross) Deposits Contingenciesand commitments
Rupees Percent Rupees Percent Rupees Percent in '000 in '000 in '000
Cement 89,856 1.93 – –– – –– – –– – ––
Textile 576,718 12.36 – –– – –– 213,905 0.99
Sugar 511,116 10.95 – –– – –– 158,884 0.74
Chemicals and pharmaceuticals 561,869 12.04 2,260 0.23 1,482 0.01
Production and transmission of energy 935,588 20.05 – –– – –– – –– – ––
Financial 190,992 4.09 800,000 81.71 20,967,219 97.31
Individuals 44,416 0.95 – –– – –– – –– – ––
Hotel 57,187 1.23 – –– – –– – –– – ––
Telecommunication 150,000 3.21 – –– – –– – –– – ––
Paper and board 200,000 4.29 – –– – –– – –– – ––
Food and confectionary 428,270 9.18 2,000 0.20 19,461 0.09
Oil, gas, petroleum and energy 70,093 1.50 – –– – –– 100,000 0.46
Transportation 203,726 4.36 – –– – –– 34,694 0.16
Packaging 74,109 1.59 – –– – –– 408 – ––
Services – –– – –– 174,758 17.85 22,800 0.11
Electronics and electrical appliances 230,000 4.93 – –– – –– – –– – ––
Engineering 117,505 2.52 – –– – –– – –– – ––
Others 225,928 4.84 – –– – –– 28,134 0.13
4,667,373 100.00 979,018 100.00 21,546,987 100.00
36.1.1.2 Segment by sector
(Rupees in ‘000)
December 31, 2012
Advances (Gross) Deposits Contingencies and commitments
Rupees Percent Rupees Percent Rupees Percent in '000 in '000 in '000
Public / Government 153,423 3 1,100,000 39 – –– –
Private 5,628,612 97 1,724,924 61 868,306 100
5,782,035 100 2,824,924 100 868,306 100
December 31, 2011
Advances (Gross) Deposits Contingencies and commitments
Rupees Percent Rupees Percent Rupees Percent in '000 in '000 in '000
Public / Government 146,764 3.14 – –– – – –– –Private 4,520,609 96.86 979,018 100 21,546,987 100
4,667,373 100 979,018 100 21,546,987 100
36.1.1.3 Details of non-performing advances and specific provisions by class of business segment
(Rupees in ‘000)
2012 2011Classified Specific Classified Specific Advances Provisions Advances Provisions
Held Held
Financial 2,638 2,638 2,992 1,7232,638 2,638 2,992 1,723
36.1.1.4 Details of non-performing advances and specific provisions by sector
(Rupees in ‘000)
2012 2011Classified Specific Classified Specific Advances Provisions Advances Provisions
Held Held
Public / Government ––– ––– ––– –––Private 2,638 2,638 2,992 1,723
2,638 2,638 2,992 1,723

Ann
ual R
epor
t 201
2Pa
k Br
unei
Inve
stm
ent C
ompa
ny L
td.
151
Ann
ual R
epor
t 201
2Pa
k Br
unei
Inve
stm
ent C
ompa
ny L
td.
150
36.2.1 Interest rate riskInterest rate risk is the uncertainty resulting from changes in interest rates, including changes in theshape of yield curves. Interest rate risk arises from factors such as mismatches between contractualmaturities or re-pricing of on and off balance sheet assets and liabilities. The objective of yield /interest rate risk management is to minimize adverse variances in the Group's profitability.
Government securities (PIBs and T-Bills), investment in TFCs and Sukuks, loans and advances andother money market investments are subject to interest rate risk classified under 'Held for Trading'as well as 'Available-for-Sale' category if they meet the SBP criteria. Duration analysis is carried outto capture the risk associated with these securities. Stress testing is also in place to capture thesensitivity of the portfolio to adverse movement in interest rates. For prudent risk management, allmoney market investments are marked to market to assess changes in the market value ofinvestments due to interest rate movements.
36.2.2 Foreign exchange risk
Foreign Exchange Risk is the risk of loss arising from fluctuations of exchange rates. The Group isnot exposed to any significant funded or non-funded foreign exchange exposure.
(Rupees in ‘000)
December 31, 2012
Assets Liabilities Off-balance Net foreignsheet items currency
exposure
Pakistani Rupee 14,046,433 5,466,904 –––– 8,579,529
United States Dollar 4 –––– –––– 4
14,046,437 5,466,904 –––– 8,579,533
December 31, 2011
Assets Liabilities Off-balance Net foreignsheet items currency
exposure
Pakistani Rupee 32,545,012 24,617,113 –––– 7,927,899
United States Dollar 4 –––– –––– 4
32,545,016 24,617,113 –––– 7,927,903
36.2.3 Equity position risk
The Group is exposed to equity position risk on its investments in equity capital markets. TheBoard with the recommendations of ALCO approves exposure limits applicable to investments intrading book.
Equity investments in Group’s trading book are subject to limits and controls imposed by riskmanagement policy to reduce the risk. The risk is managed by applying trading limit, scrip–wise andportfolio wise nominal limits, stop-loss limits and volatility limits. Stress test and value-at-risk figuresare also reported to the management for timely decisions.
The Equity Investment Committee is responsible for making investment decisions in the capitalmarket.
36.1.1.5 Geographical Segment Analysis
(Rupees in ‘000)
December 31, 2012
Profit before Total assets Net assets Contingencies taxation employed employed and
commitments
Pakistan 1,080,944 14,046,437 8,579,533 868,306
December 31, 2011
Profit before Total assets Net assets Contingencies taxation employed employed and
commitments
Pakistan 920,129 32,545,016 7,927,903 21,546,987
36.2 Market Risk
The market risk is the risk of reductions in earnings, value and / or reserves arising from changes inmarket rates (such as interest rates, exchange rates, credit spreads) and market prices (such ascommodities, equities, property etc.) as well as their correlations and volatilities. The Group isexposed to market risk primarily through its trading activities, which are centered in the Treasury andCapital market groups.
The Group classifies its assets in banking and trading books as per instructions from SBP. TheGroup's trading book comprises positions in financial instruments held with trading intent or in orderto hedge other elements of the trading book and free of any restrictive covenants on their tradability.In addition, positions need to be frequently and accurately valued and the portfolio should be activelymanaged. The positions which do not fulfil the criteria of trading book falls under the banking Bookand are treated as per SBP requirements.
The Group actively measures, controls and manages market risk on day-to-day basis. Controls areapplied to all investment portfolios by setting limits to the exposures taken. This includes stop losslimits on shares in 'Held for Trading' portfolio, individual and sectoral concentration limits, volatilityand value-at-risk limits etc.
The Group measures market risk using various techniques like duration analysis for interest ratesensitivity, Value-at-Risk for adverse price movement and stress testing etc. The results arecommunicated to ALCO and Risk Management Committee on monthly and quarterly basisrespectively. Market risk is effectively managed at portfolio level.
Policies, valuation and accounting of equity investments
In accordance with the requirements of the SBP, valuation and accounting of equity investments isdone as per the accounting policy of investment mentioned in note 4.6 to these financial statements.Further, composition of equity investments is available in note 7 of these financial statements.

Ann
ual R
epor
t 201
2Pa
k Br
unei
Inve
stm
ent C
ompa
ny L
td.
153
Ann
ual R
epor
t 201
2Pa
k Br
unei
Inve
stm
ent C
ompa
ny L
td.
152
36.2.4 Mismatch of Interest Rate Sensitive Assets and LiabilitiesInterest rate risk can arise on account of rising interest rates causing a fall in the value of assets orfalling interest rates causing an increase in the value of liabilities. While the Company is largelyengaged in transactions on a floating rate basis in both borrowings and lendings, rate resetfrequency, ceilings and floors and choice of base rate can translate into interest rate risk.
Interest rate risk is monitored through regular reports on interest rate matching and durationestimates. Furthermore stress techniques are also used to estimate maximum losses in case ofadverse movements in interest rates.
(Rupees in ‘000)
December 31, 2012
Effective Exposed to yield/interest risk Non-interestyield/ Total Upto 1 Over 1 to Over 3 to Over 6 Over 1 to Over 2 to Over 3 to Over 5 to Above 10 Bearing
interest rate month 3 months 6 months months 2 years 3 years 5 years 10 years years Financialto 1 year Instruments
On-balance sheet financial instruments
Asset
Cash and balances with treasury banks –– – 54,763 –– – –– – –– – –– – –– – –– – –– – –– – –– – 54,763
Balances with other banks 10.30% 317,222 78,828 238,390 –– – 4 –– – –– – –– – –– – –– – –– –
Investments 13.00% 7,100,816 253,288 2,729,758 372,024 2,787 2,786 –– – 4,612 –– – –– – 3,735,561
Advances 13.91% 5,779,397 2,368,572 1,657,885 545,248 131,316 441,998 192,069 332,038 82,613 12,079 15,579
Other assets –– – 338,772 –– – –– – –– – –– – –– – –– – –– – –– – –– – 338,772
13,590,970 2,700,688 4,626,033 917,272 134,107 444,784 192,069 336,650 82,613 12,079 4,144,675
Liabilities
Borrowings 12.06% 2,417,139 40,354 390,787 26,049 79,336 1,289,894 189,894 327,491 73,334 –– – –– –
Deposits and other accounts 12.74% 2,824,924 25,000 2,307,400 192,524 300,000 –– – –– – –– – –– – –– – –– –
Other liabilities –– – 220,055 –– – –– – –– – –– – –– – –– – –– – –– – –– – 220,055
5,462,118 65,354 2,698,187 218,573 379,336 1,289,894 189,894 327,491 73,334 –– – 220,055
On-balance sheet gap 8,128,852 2,635,334 1,927,846 698,699 (245,229) (845,110) 2,175 9,159 9,279 12,079 3,924,620
Off–balance sheet financial instruments
Forward purchase of Government Securities –– – –– – –– – –– – –– – –– – –– – –– – –– – –– – –– –
Forward Sale of Government Securities –– – –– – –– – –– – –– – –– – –– – –– – –– – –– – –– –
Interest Rate Derivatives – Short position –– – –– – –– – –– – –– – –– – –– – –– – –– – –– – –– –
Interest Rate Derivatives – Long position –– – –– – –– – –– – –– – –– – –– – –– – –– – –– – –– –
Off–balance sheet gap –– – –– – –– – –– – –– – –– – –– – –– – –– – –– – –– –
Total Yield / Interest Risk Sensitivity Gap 8,128,852 2,635,334 1,927,846 698,699 (245,229) (845,110) 2,175 9,159 9,279 12,079 3,924,620
Cumulative Yield / Interest Risk Sensitivity Gap 2,635,334 4,563,180 5,261,879 5,016,650 4,171,540 4,173,715 4,182,874 4,192,153 4,204,232 8,128,852
(Rupees in ‘000)
December 31, 2011
Effective Exposed to yield/interest risk Non-interestyield/ Total Upto 1 Over 1 to Over 3 to Over 6 Over 1 to Over 2 to Over 3 to Over 5 to Above 10 Bearing
interest rate month 3 months 6 months months 2 years 3 years 5 years 10 years years Financialto 1 year Instruments
On-balance sheetfinancial instruments
Assets
Cash and balanceswith treasury banks – –– 174,790 – –– – –– – –– – –– – –– – –– – –– – –– – –– 174,790
Balances with other banks 7.37% 562,085 562,085 – –– – –– – –– – –– – –– – –– – –– – –– – ––
Lendings to financial institutions 12.66% 627,841 627,841 – –– – –– – –– – –– – –– – –– – –– – –– – ––
Investments 14.38% 25,742,364 339,439 10,424,120 811,785 12,696,777 169,352 – –– 192,618 360,403 – –– 747,870
Advances 15.14% 4,646,661 1,468,118 1,413,809 902,672 165,713 119,077 133,941 268,094 149,564 13,101 12,572
Other assets – –– 376,790 – –– – –– – –– – –– – –– – –– – –– – –– – –– 376,790
32,130,531 2,997,483 11,837,929 1,714,457 12,862,490 288,429 133,941 460,712 509,967 13,101 1,312,022
Liabilities
Borrowings 12.06% 23,359,531 19,168,992 2,276,265 45,831 51,144 674,543 704,139 274,944 163,673 – –– – ––
Deposits and other accounts 12.74% 979,018 325,000 2,000 149,758 502,260 – –– – –– – –– – –– – –– – ––
Other liabilities – –– 275,277 – –– – –– – –– – –– – –– – –– – –– – –– – –– 275,277
24,613,826 19,493,992 2,278,265 195,589 553,404 674,543 704,139 274,944 163,673 – –– 275,277
On-balance sheet gap 7,516,705 (16,496,509) 9,559,664 1,518,868 12,309,086 (386,114) (570,198) 185,768 346,294 13,101 1,036,745
Off–balance sheet financial instruments
Forward purchase of Government Securities (464,944) (464,944) – –– – –– – –– – –– – –– – –– – –– – –– – ––
Forward Sale of Government Securities 20,502,275 19,573,343 457,252 471,680 – –– – –– – –– – –– – –– – –– – ––
Interest Rate Derivatives – Short position (5,984) – –– (5,984) – –– – –– – –– – –– – –– – –– – –– – ––
Interest Rate Derivatives – Long position 6,103 – –– 6,103 – –– – –– – –– – –– – –– – –– – –– – ––
Off–balance sheet gap 20,037,450 19,108,399 457,371 471,680 – –– – –– – –– – –– – –– – –– – ––
Total Yield / Interest Risk Sensitivity Gap 27,554,155 2,611,890 10,017,035 1,990,548 12,309,086 (386,114) (570,198) 185,768 346,294 13,101 1,036,745
Cumulative Yield / Interest Risk Sensitivity Gap 2,611,890 12,628,925 14,619,473 26,928,559 26,542,445 25,972,247 26,158,015 26,504,309 26,517,410 27,554,155
36.3 Liquidity Risk
Liquidity risk is the risk that the Group is unable to fund its current obligations and operations in themost cost efficient manner. ALCO is the forum to oversee liquidity management.
Liquidity risk can arise from the Group’s activities and can be grouped into three categories:
l Inflows / outflows from on-balance sheet items (other than marketable securities and wholesaleborrowings) and off-balance sheet items;
l Marketability of trading securities; andl Capacity to borrow from the wholesale markets for funding as well as trading activities.
The Group’s main funding source is the inter-bank money market. Change in the Government monetarypolicy and market expectations of interest rate are all important factors that can adversely affect our keyfunding source. Efficient and accurate planning plays a critical role in liquidity management. Group's MISprovides information on expected cash inflows / out flows which allow the Group to take timely decisionsbased on the future requirements. Group monitors all the possible sources from which liquidity risk canemanate including market reputation, borrowing terms, deterioration in quality of credit portfolio etc.Other sources are also identified for which early warning indicators have been created and beingmonitored for early intervention of management sensing a potential liquidity crunch.
Gap analysis and stress testing is done on periodic basis to capture any adverse effect of marketmovements on liquidity position. Based on the results produced, ALCO devises the liquiditymanagement strategy to maintain sufficient liquidity to deal with any related catastrophe.

Ann
ual R
epor
t 201
2Pa
k Br
unei
Inve
stm
ent C
ompa
ny L
td.
155
Ann
ual R
epor
t 201
2Pa
k Br
unei
Inve
stm
ent C
ompa
ny L
td.
154
36.3.1 Maturities of assets and liabilities - on the basis approved by the Assets and LiabilitiesManagement Committee (ALCO) of the Group
(Rupees in ‘000)
December 31, 2012
Total Upto 1 Over 1 to Over 3 to Over 6 Over 1 to Over 2 to Over 3 to Over 5 to Above 10month 3 months 6 months months 2 years 3 years 5 years 10 years years
to 1 year
Assets
Cash and balances with treasury banks 54,763 6,808 47,955 – –– – –– – –– – –– – –– – –– – ––
Balances with other banks 317,222 78,828 238,390 – –– 4 – –– – –– – –– – –– – ––
Investments 7,100,816 236,475 997,568 389,426 1,823,563 1,959,547 275,834 228,859 939,544 250,000
Advances 5,779,397 341,697 488,145 817,088 600,099 1,005,549 901,248 1,164,758 448,734 12,079
Operating fixed assets 60,329 2,132 4,265 6,397 9,920 17,813 14,868 4,934 – –– – ––
Deferred tax assets 13,403 (2,624) (2,092) 7,111 (7,314) (21,531) 51,831 (12,079) – –– – ––
Other assets 720,507 108,519 296,501 87,608 6,423 4,803 216,653 – –– – –– – ––
14,046,437 771,835 2,070,732 1,307,630 2,432,695 2,966,181 1,460,434 1,386,472 1,388,278 262,079
Liabilities
Borrowings 2,417,139 25,390 392,057 307,661 346,081 723,555 190,222 334,726 97,446 – ––
Deposits and other accounts 2,824,924 25,000 2,307,400 192,524 300,000 – –– – –– – –– – –– – ––
Other liabilities 224,841 30,208 66,156 15,660 30,427 16,734 42,720 22,936 – –– – ––
5,466,904 80,598 2,765,613 515,845 676,508 740,289 232,942 357,662 97,446 – ––
Net assets 8,579,533 691,237 (694,881) 791,785 1,756,187 2,225,892 1,227,492 1,028,810 1,290,832 262,079
Share capital 6,000,000
Reserves 555,884
Unappropriated profit 2,022,531
Surplus on revaluation of assets - net of tax 1,118
8,579,533
December 31, 2011
Total Upto 1 Over 1 to Over 3 to Over 6 Over 1 to Over 2 to Over 3 to Over 5 to Above 10month 3 months 6 months months 2 years 3 years 5 years 10 years years
to 1 year
Assets
Cash and balances with treasury banks 174,790 174,790 – –– – –– – –– – –– – –– – –– – –– – ––
Balances with other banks 562,085 562,085 – –– – –– – –– – –– – –– – –– – –– – ––
Lendings to financial institutions 627,841 627,841 – –– – –– – –– – –– – –– – –– – –– – ––
Investments 25,742,364 257,876 8,552,335 462,215 12,887,649 755,997 406,326 635,139 1,534,827 250,000
Advances 4,646,661 150,004 362,452 642,763 447,609 793,096 699,683 909,062 628,891 13,101
Operating fixed assets 34,067 1,058 2,116 17,051 3,540 6,435 2,468 1,399 – –– – ––
Other assets 757,208 299,725 199,178 22,053 7,603 224,371 4,278 – –– – –– – ––
32,545,016 2,073,379 9,116,081 1,144,082 13,346,401 1,779,899 1,112,755 1,545,600 2,163,718 263,101
Liabilities
Borrowings 23,359,531 19,168,991 2,276,265 45,831 51,144 674,543 704,139 274,944 163,674 – ––
Deposits and other accounts 979,018 325,000 2,000 149,758 502,260 – –– – –– – –– – –– – ––
Deferred tax liabilities 383 8 75 100 17 36 43 72 32 – ––
Other liabilities 278,181 127,258 68,471 3,134 6,444 12,264 16,735 43,875 – –– – ––
24,617,113 19,621,257 2,346,811 198,823 559,865 686,843 720,917 318,891 163,706 – ––
Net assets 7,927,903 (17,547,878) 6,769,270 945,259 12,786,536 1,093,056 391,838 1,226,709 2,000,012 263,101
Share capital 6,000,000
Reserves 399,204
Unappropriated profit 1,596,812
Deficit on revaluation of assets - net (68,113)
7,927,903
36.3.2 Maturities of assets and liabilities - based on contractual maturity of the assets and liabilities ofthe Group
(Rupees in ‘000)
December 31, 2012
Total Upto 1 Over 1 to Over 3 to Over 6 Over 1 to Over 2 to Over 3 to Over 5 to Above 10month 3 months 6 months months 2 years 3 years 5 years 10 years years
to 1 year
Assets
Cash and balances with treasury banks 54,763 6,808 47,955 – –– – –– – –– – –– – –– – –– – ––
Balances with other banks 317,222 78,828 238,390 – –– 4 – –– – –– – –– – –– – ––
Investments 7,100,816 236,475 997,568 389,426 1,823,563 1,959,547 275,834 228,859 939,544 250,000
Advances 5,779,397 341,697 488,145 817,088 600,099 1,005,549 901,248 1,164,758 448,734 12,079
Operating fixed assets 60,329 2,132 4,265 6,397 9,920 17,813 14,868 4,934 – –– – ––
Deferred tax assets 13,403 (2,624) (2,092) 7,111 (7,314) (21,531) 51,831 (12,079) – –– – ––
Other assets 720,507 108,519 296,501 87,608 6,423 4,803 216,653 – –– – –– – ––
14,046,437 771,835 2,070,732 1,307,630 2,432,695 2,966,181 1,460,434 1,386,472 1,388,278 262,079
Liabilities
Borrowings 2,417,139 25,390 392,057 307,661 346,081 723,555 190,222 334,726 97,446 – ––
Deposits and other accounts 2,824,924 25,000 2,307,400 192,524 300,000 – –– – –– – –– – –– – ––
Other liabilities 224,841 30,208 66,156 15,660 30,427 16,734 42,720 22,936 – –– – ––
5,466,904 80,598 2,765,613 515,845 676,508 740,289 232,942 357,662 97,446 – ––
Net assets 8,579,533 691,237 (694,881) 791,785 1,756,187 2,225,892 1,227,492 1,028,810 1,290,832 262,079
Share capital 6,000,000
Reserves 555,884
Unappropriated profit 2,022,531
Surplus on revaluation of assets - net of tax 1,118
8,579,533
December 31, 2011
Total Upto 1 Over 1 to Over 3 to Over 6 Over 1 to Over 2 to Over 3 to Over 5 to Above 10month 3 months 6 months months 2 years 3 years 5 years 10 years years
to 1 year
Assets
Cash and balances with treasury banks 174,790 174,790 – –– – –– – –– – –– – –– – –– – –– – ––
Balances with other banks 562,085 562,085 – –– – –– – –– – –– – –– – –– – –– – ––
Lendings to financial institutions 627,841 627,841 – –– – –– – –– – –– – –– – –– – –– – ––
Investments 25,742,364 257,876 8,552,335 462,215 12,887,649 755,997 406,326 635,139 1,534,827 250,000
Advances 4,646,661 150,004 362,452 642,763 447,609 793,096 699,683 909,062 628,891 13,101
Operating fixed assets 34,067 1,058 2,116 17,051 3,540 6,435 2,468 1,399 – –– – ––
Other assets 757,208 299,725 199,178 22,053 7,603 224,371 4,278 – –– – –– – ––
32,545,016 2,073,379 9,116,081 1,144,082 13,346,401 1,779,899 1,112,755 1,545,600 2,163,718 263,101
Liabilities
Borrowings 23,359,531 19,168,991 2,276,265 45,831 51,144 674,543 704,139 274,944 163,674 – ––
Deposits and other accounts 979,018 325,000 2,000 149,758 502,260 – –– – –– – –– – –– – ––
Deferred tax liabilities 383 8 75 100 17 36 43 72 32 – ––
Other liabilities 278,181 127,258 68,471 3,134 6,444 12,264 16,735 43,875 – –– – ––
24,617,113 19,621,257 2,346,811 198,823 559,865 686,843 720,917 318,891 163,706 – ––
Net assets 7,927,903 (17,547,878) 6,769,270 945,259 12,786,536 1,093,056 391,838 1,226,709 2,000,012 263,101
Share capital 6,000,000
Reserves 399,204
Unappropriated profit 1,596,812
Deficit on revaluation of assets - net (68,113)
7,927,903

Ann
ual R
epor
t 201
2Pa
k Br
unei
Inve
stm
ent C
ompa
ny L
td.
157
Ann
ual R
epor
t 201
2Pa
k Br
unei
Inve
stm
ent C
ompa
ny L
td.
156
36.4 Operational risk
The Group, like all financial institutions, is exposed to many types of operational risks, including thepotential losses arising from internal activities or external events caused by breakdowns ininformation, communication, physical safeguards, business continuity, supervision, transactionprocessing, settlement systems and procedures and the execution of legal, fiduciary and agencyresponsibilities.
The Group maintains a system of internal controls designed to keep operational risk at appropriatelevels, in view of the Group’s financial strength and the characteristics of the activities and marketin which it operates. These internal controls are periodically updated to conform to industry bestpractice. The Group has developed a Business Continuity Plan applicable to all its functionalareas. Currently the Group uses the Basic Indicator Approach for assessing its operational riskcapital charge.
37. NON ADJUSTING EVENT AFTER THE REPORTING DATE
The Board of Directors have proposed a final dividend for the year ended December 31, 2012 of Rs. 1.67 per share (2011: Re.0.33 per share), amounting to Rs. 1,000 million (2011: Rs.200million) at their meeting held on May 09, 201 3 , for approval of the members at the annual generalmeeting to be held on May 30, 2013 . The consolidated financial statements for the year endedDecember 31, 2012 do not include the effect of these appropriations which will be accounted for inthe consolidated financial statements for the year ending December 31, 2013.
38. GENERAL
38.1 Credit rating
The Group has been assigned credit rating of ‘AA+’ (Double A plus) in the medium to long term andA1+ (A One Plus) in the short-term by JCR-VIS Credit Rating Agency Limited, SBP approved ratingagency. Outlook on the assigned rating is “Stable”.
38.2 Figures have been rounded off to the nearest thousand rupees.
39. DATE OF AUTHORISATION FOR ISSUE
These consolidated financial statements were authorised for issue on May 09, 2013 by the Board of Directors of the Group.
Annexure - I
As referred in note 9.6 of the unconsolidated financial statements
Statement showing written-off loans on any other financial relief of Rs. 500,000 or above provided duringthe year ended December 31, 2012
S. No. Name and address Name of individual/ Father's /Husband's Outstanding Liabilities at the
of the borrowers partner/director name beginning of the year Amount written-off
and CNIC No.
Principal Mark-up Others Total Principal Mark-up Others Total
Nil Nil Nil Nil Nil Nil Nil Nil Nil Nil Nil
Chief Executive Director Director Chairman