Investor and Analyst Conference Call Q1 2022 - Volkswagen AG
Upload
khangminh22Category
view
0download
0
Experience D[r]iversity.A N N U A L R E P O R T 2 0 1 2
AN
NU
AL
RE
PO
RT
20
12
AN
NU
AL
RE
PO
RT
20
12
18 0 m m 212 ,5 m m 27,5 m m 212 ,5 m m 19 0 m m
29
7 m
m
ge
sc
hä
ft
sb
er
ich
t 2
01
2v
ol
ks
wa
ge
n a
kt
ien
ge
se
ll
sc
ha
ft
Messen
7. – 17. M ä r z
Internationa ler Automobilsa lon, Genf
28 . M ä r z – 7. a pril
New York International Auto Show, New York
8 . – 12 . a pril
Hannover Messe, Hannover
23. – 29. a pril
Auto Shanghai, Shanghai
11 . – 19. M a i
Sa lón Internaciona l del Automóvil, Barcelona
12 . – 22 . sep teMB er
Internationa le Automobilausstellung, Frankfurt
21 . – 30. n ov eMB er
Los A ngeles Auto Show, Los A ngeles
23. n ov eMB er – 1 . D ezeMB er
Tokyo Motor Show, Tokio
7. – 15. D ezeMB er
Motor Show Bologna, Bologna
finanzk alen Der
14 . M ä r z
Jahrespressekonferenz und Investorenkonferenz der Volkswagen AG
25. a pril
Hauptversammlung der Volkswagen AG(Messegelände Hannover)
29. a pril
Zwischenbericht Januar – März
31 . Juli
Ha lbjahresfinanzbericht
31 . o k to B er
Zwischenbericht Januar – September
g e s c h ä f t sg e s c h ä f t s BB e r i c h te r i c h t 2 0 1 2 2 0 1 2
Der Volkswagen Konzern ist einer der führenden Automobilhersteller welt - weit und größter Automobilproduzent Europas. Mit zwölf faszinierenden Marken bieten wir Mobilität in jeder Größenklasse, für alle Ansprüche, rund um den Globus. Vielfalt ist unsere große Stärke und treibt uns weiter voran.
Termine 2013
VOL-GB12_Umschlag_D_130226_Aussen.indd 1-5 27.02.13 16:39

Experience D[r]iversity.A N N U A L R E P O R T 2 0 1 2
AN
NU
AL
RE
PO
RT
20
12
AN
NU
AL
RE
PO
RT
20
12

Key Figures
VO L K SWAG E N G rO u p
Volume Data 1 2012 2011 %
Vehicle sales (units) 9,344,559 8,361,294 +11.8
Production (units) 9,255,384 8,494,280 +9.0
Employees at Dec. 31 549,763 501,956 +9.5
Financial Data (IFrSs), € million 2012 2011 %
Sales revenue 192,676 159,337 +20.9
Operating profit 11,510 11,271 +2.1
Profit before tax 25,492 18,926 +34.7
Profit after tax 21,884 15,799 +38.5
Profit attributable to shareholders of Volkswagen AG 21,717 15,409 +40.9
Cash flows from operating activities 7,209 8,500 –15.2
Cash flows from investing activities attributable to operating activities 16,840 16,002 +5.2
Automotive Division 2
EBITDA 3 19,906 17,815 +11.7
Cash flows from operating activities 16,232 17,109 –5.1
Cash flows from investing activities attributable to operating activities 4 16,455 15,998 +2.9
of which: investments in property, plant and equipment 10,271 7,929 +29.5
as a percentage of sales revenue 5.9 5.6
capitalized development costs 2,615 1,666 +56.9
as a percentage of sales revenue 1.5 1.2
Net cash flow –223 1,112 x
Net liquidity at Dec. 31 10,573 16,951 –37.6
return ratios in % 2012 2011
Return on sales before tax 13.2 11.9
Return on investment after tax (Automotive Division) 16.6 17.7
Return on equity before tax (Financial Services Division) 5 13.1 14.0
1 Volume data including the unconsolidated Chinese joint ventures.2 Including allocation of consolidation adjustments between the Automotive and Financial Services divisions.3 Operating profit plus net depreciation/amortization and impairment losses/reversals of impairment losses on property, plant and equipment,
capitalized development costs, leasing and rental assets, goodwill and financial assets as reported in the cash flow statement.4 Excluding acquisition and disposal of equity investments: €12,528 million (€9,371 million).5 Profit before tax as a percentage of average equity.
VO L K SWAG E N AG
Volume Data 2012 2011 %
Vehicle sales (units) 2,580,266 2,661,327 –3.0
Production (units) 1,148,774 1,215,058 –5.5
Employees at Dec. 31 101,794 97,691 +4.2
Financial Data (HGB), € million 2012 2011 %
Sales 68,361 67,178 +1.8
Net income for the year 6,380 3,418 +86.7
Dividends (€)
per ordinary share 3.50 3.00
per preferred share 3.56 3.06
This version of the annual report is a translation of the German original. The German takes precedence.

Mobility with a global appeal
2010 3,5622011 3,9912012 4,053
EuropE / rEm aining m arkEts
2010 5492011 6672012 842
north a mErica*
+26.2%
+1.6%
2010
2010
888
2,141
2011
2011
9332012
2012
1,010
south a mErica
asia-pacific
+8.2%
+23.3%
* Overall market includes passenger cars and light trucks.
pa ss E n g E r c a r a n D L i g ht com m E rci a L V E h i cL E D E L i V E r i Es – i n th o usa n D u n it s
2,5703,170
kE
y f
igu
rE
s
| m
ob
iLit
y w
ith
a g
Lo
ba
L a
pp
Ea
L

S t r at e G y.
14 Report of the Supervisory Board
22 Letter to our Shareholders
24 The Board of Management of Volkswagen Aktiengesellschaft
e x p e r I e N C e D [ r ] I V e r S I t y. D e D I C at I O N .
28 Dedication. 6 questions / 6 ref lections. Talking to Prof. Dr. Martin Winterkorn.
30 Berlin meets the Golf. Urban encounter: taking the new Golf to the streets
of Berlin.
38 Step by step. A model of sustainability: the Volkswagen Group is
committed to protecting scarce resources in its plants
around the world.
40 Samba do Brasil. Volkswagen is an engine for Brazil in its boom years.
A first-hand look on location.
46 S N a p S H O t Surrendering yourself to something. When Armin Mueller-Stahl plays the violin.
48 Piccadilly Rendezvous. In the heart of London, Audi demonstrates how cars
will be sold in the future.
54 The future makers. In the Volkswagen Group many young people are working
on their diploma or doctoral thesis. A profile of four young
researchers.
58 Lightweight DNA . Every Porsche automatically inherits the lightweight gene
from its predecessors. The new Boxster shows just what is
possible.
62 Passione. Supercar meets superbike – Lamborghini and Ducati test
drivers discuss what the two brands have in common.
66 Family Business. Respect for Bentley’s great heritage is something that is
shared by all generations of employees.
70 S N a p S H O t Seeing the person. Handicap swimmer Kirsten Bruhn shows how to do it.
72 The bus. The VW Bus workshop in Hanover puts the shine back into
vintage vehicles – and a smile on their owners’ faces.
76 Culture management. At Scania in Södertälje, it is clear that soft factors make
all the difference.
82 The transformation. At the ŠKODA motorsport workshop in Mladá Boleslav, the
Fabia is being transformed into a high-performance rally car.
CON T E N T S Experience D[r]iversity.

This annual report was published on the occasion of the Annual Media Conference on March 14, 2013.
D I V I S I O N S
104 Brands and Business Fields106 Volkswagen Passenger Cars108 Audi110 ŠKODA112 SE AT114 Bentley116 Porsche118 Volkswagen Commercial Vehicles120 Scania122 MA N124 Volkswagen Group in China126 Volkswagen Financial Services
C O r p O r at e G O V e r N a N C e
131 Corporate Governance Report (Part of the Management Report)137 Remuneration Report (Part of the Management Report)143 Structure and Business Activities (Part of the Management Report)147 Executive Bodies (Part of the Notes to the Consolidated Financial Statements)
M a N a G e M e N t r e p O r t
153 Business Development166 Shares and Bonds174 Results of Operations, Financial Position
and Net Assets 188 Volkswagen AG (condensed, according to
the German Commercial Code)192 Value-Enhancing Factors226 Risk Report237 Report on Expected Developments
C O N S O L I D at e D F I N a N C I a L S tat e M e N t S
250 Income Statement251 Statement of Comprehensive Income253 Balance Sheet254 Statement of Changes in Equity 256 Cash Flow Statement257 Notes 351 Responsibility Statement352 Auditors’ Report
a D D I t I O N a L I N F O r M at I O N
354 Consumption and Emission Data357 Glossary358 Index359 List of Tables360 Contact Information
86 Power On! Clean energy for a clean world: MAN turbomachinery
converts solar energy into electricity.
90 Taking responsibility. Dual vocational training at SEAT has many advantages –
and not just for the young people involved.
96 Working for the neighborhood. Toolboxes and elbow grease: Volkswagen Credit employees
roll up their sleeves to help out social projects in the USA.
98 S N a p S H O t Pure beauty and grandeur. Artwork Bugatti – staged by Bernar Venet.
Experience the new Volkswagen AG Annual Report as iPad App. Exciting articles, films, sounds and animations will steer you through the “D[r]iversity” of the Volkswagen Group.
Facts and Figures2012

Our drive for the future is called
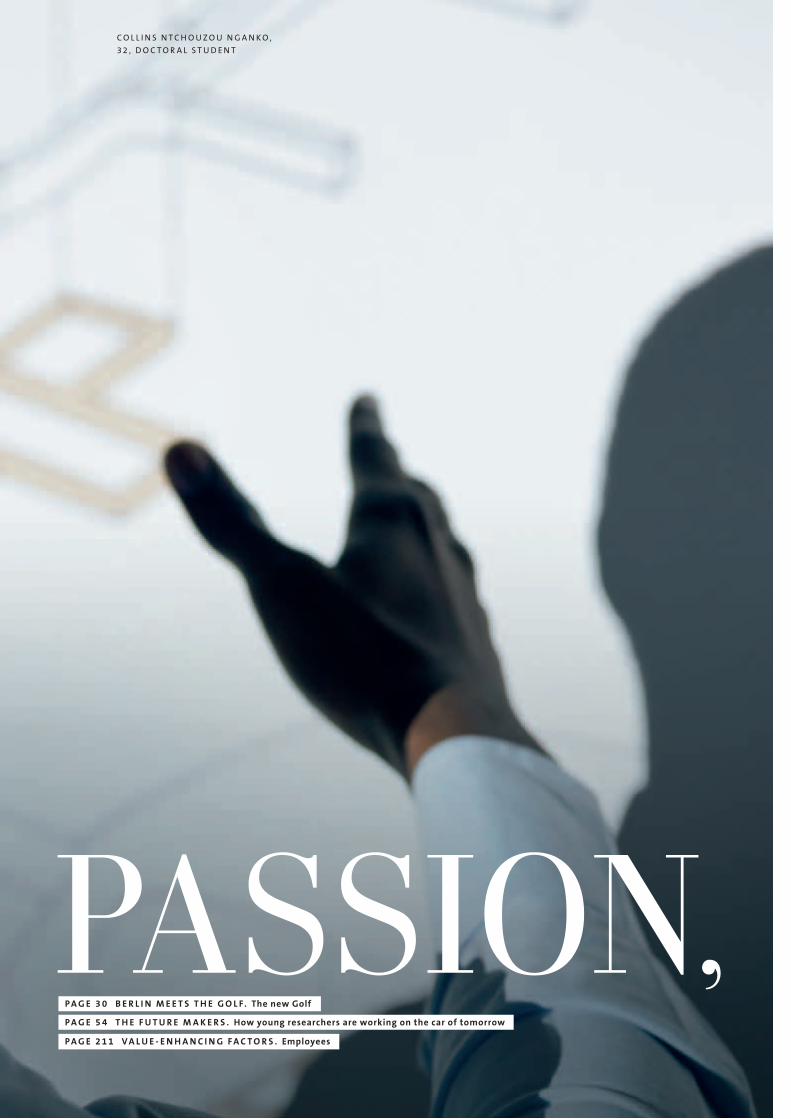
PASSION,p a G e 5 4 t H e F u t u r e M a k e r S . How young researchers are working on the car of tomorrow
p a G e 2 1 1 V a L u e - e N H a N C I N G F a C t O r S . employees
p a G e 3 0 B e r L I N M e e t S t H e G O L F. the new Golf
C O L L I N S N T C H O U Z O U N G A N K O ,
3 2 , D O C T O R A L S T U D E N T

the energy we need along the way

DISCIPLINE,comes from
J A N K O P E C K ý,
3 1 , R A L LY D R I V E R
p a G e 8 2 t H e t r a N S F O r M a t I O N . ŠkODa Fabia for rally driving
p a G e 2 4 3 r e p O r t O N e x p e C t e D D e V e L O p M e N t S . Investment planning
p a G e 4 8 p I C C a D I L Ly r e N D e z V O u S . audi City in London

from CURIOSITYp a G e 9 0 t a k I N G r e S p O N S I B I L I t y. Dual vocational training at Seat
p a G e 2 4 0 r e p O r t O N e x p e C t e D D e V e L O p M e N t S . New modells, planned product measures
p a G e 4 0 S a M B a D O B r a S I L . 60 years of Volkswagen in Brazil

and in-depth knowledge,
D É B O R A O C A Ñ A ,
2 1 , V O C A T I O N A L T R A I N E E

because PERFECTION p a G e 1 9 5 V a L u e - e N H a N C I N G F a C t O r S . research and development
p a G e 5 8 L I G H t w e I G H t D N a . the new porsche Boxster lightweight design
p a G e 7 2 t H e B u S . keeping the legend alive in the Vw Bus workshop

is our ultimate destination.
V E I T R A S C H K E ,
3 3 , V E H I C L E M E C H A N I C

“Our pursuit of innovation and perfection and our responsible approach will help to make us the world’s leading automaker by 2018 – both economically and ecologically.”prOF. Dr. M artIN wINterkOrN, CHaIr M aN OF tHe BOarD OF M aNaGeMeNt OF VOLkSwaGeN ak tIeNGeSeLLSCHaFt

2018
Strategy

Ladies and Gentlemen,
In fiscal year 2012, the Supervisory Board of Volkswagen AG addressed the Company’s position and development regularly and in detail. We supported the Board of Management in its running of the business and advised it on issues relating to the management of the Company, in compliance with the legal requirements and the suggestions and recommendations of the German Corporate Governance Code. The Supervisory Board was directly involved in all decisions of fundamental importance to the Group. In addition, we discussed current strategic considerations with the Board of Management at regular intervals.
The Board of Management reported to the Supervisory Board regularly, promptly and compre-hensively in both written and oral form on the development of the business and the Company’s planning and position, including the risk situation and risk management. This also applied to all key questions in connection with the creation of the integrated automotive group with Porsche and to the Company’s restructuring at an organizational and management level. In addition, the Board of Management informed us on an ongoing basis of compliance-related topics and other topical issues. In all cases we received the documents relevant to our decisions in good time for our meetings. The Supervisory Board received a detailed monthly report from the Board of Management on the current business position and the forecast for the current year. Any variances in performance as against the plans and targets previously drawn up were explained by the Board of Management in detail, either orally or in writing. We analyzed the reasons for the variances together with the Board of Management so that countermeasures could then be derived from this.
In addition, the Chairman of the Supervisory Board held regular discussions with the Chairman of the Board of Management in the periods between the meetings; among other things, the matters discussed included the Volkswagen Group’s strategy, business development and risk management.
Report of the Supervisory Board(in accordance with section 171(2) of the AktG)
14

15
The Supervisory Board held a total of six meetings in fiscal year 2012. All Supervisory Board members attended more than half of the meetings; the average attendance rate was 94%. In addition, resolutions on urgent matters were adopted in writing or using electronic communi-cations media.
COM M It t e e aC t I V It I eS
The Supervisory Board had established a total of six committees in order to perform the duties entrusted to it: the Executive Committee, the Committee for Major Shareholder Business Relation-ships (Ausschuss für Geschäfte mit Großaktionären – AfGG), the Nomination Committee, the Mediation Committee in accordance with section 27(3) of the Mitbestimmungsgesetz (MitbestG – German Codetermination Act), the Audit Committee and the Integrated Automotive Group Committee (I A K ). The AfGG and the I A K were dissolved on September 21, 2012. The AfGG’s remaining tasks were assumed by the Executive Committee. In line with its rules of procedure, the Executive Committee consists of three shareholder representatives and three employee representatives, while the AfGG comprised four shareholder representatives and four employee representatives. The members of the Nomination Committee are the shareholder representatives in the Executive Committee; the remaining three committees are/were each composed of two shareholder representatives and two employee representatives. The members of the committees as of December 31, 2012 and as of the reporting date are given on page 150 of this annual report.
The Executive Committee of the Supervisory Board met eight times during the period under review. These meetings mainly served to prepare in detail the resolutions by the Supervisory Board and to deal with contractual issues concerning the Board of Management other than those relating to members’ remuneration. In its meeting on November 5, 2012, the Executive Committee discussed and approved the final terms and conditions for the issuance of a manda-tory convertible note. The Executive Committee was authorized to do so by a resolution of the Supervisory Board of Volkswagen AG dated November 5, 2012, which was adopted by circulating written documents.
The AfGG met once in the period under review before being dissolved on September 21, 2012.
The Nomination Committee is responsible for proposing suitable candidates for the Supervisory Board to recommend for election to the Annual General Meeting. The Committee met once during the past fiscal year.
The Mediation Committee did not have to be convened in 2012.
The Audit Committee met four times during the reporting period. It focused primarily on the consolidated financial statements, risk management (including the internal control system), and the work performed by the Company’s compliance organization. In addition, the Audit Committee addressed the quarterly reports and the half-yearly financial report of the Group, as well as current financial reporting issues and their examination by the auditors.
Report of the Supervisory BoardStr ateGy 15

The I A K adopted resolutions relating to the creation of the integrated automotive group with Porsche. The Committee met twice during the past fiscal year before being dissolved on Septem-ber 21, 2012.
In addition, the shareholder and employee representatives met for separate preliminary discus-sions before each of the Supervisory Board meetings.
tO pI CS D I S CuSS e D By t H e Su pe rV I S O ry B Oa r D
At the Supervisory Board meeting on February 27, 2012 we approved, after a detailed examina-tion, the consolidated financial statements prepared by the Board of Management and the annual financial statements of Volkswagen AG for 2011, as well as the combined management report. Furthermore, we examined the dependent company report submitted by the Board of Management and came to the conclusion that there were no objections to be raised to the con-cluding declaration by the Board of Management in the report. Another topic on the agenda was issuing a modified declaration of conformity with the German Corporate Governance Code. We also addressed the plan presented by the Board of Management for creating the integrated auto-motive group by way of the contribution of the operating business of Porsche Automobil Holding SE to Volkswagen AG and authorized the I A K to adopt all further resolutions required in this context, including the final approval of its implementation.
Our meetings on April 18 and 19, 2012 were mainly devoted to strategic issues. Among other things, we approved the Board of Management’s plans to increase the Group’s capacity in China and North America and to acquire Ducati, the motorcycle manufacturer. In addition, we prepared for, and performed a follow-up evaluation of, the 52nd Annual General Meeting of Volkswagen AG on April 19, 2012. Among other things, we elected the Chairman and Deputy Chairman of the Supervisory Board as scheduled and also resolved the composition of the Executive Committee and the other Supervisory Board committees.
The plans for the extensive restructuring of the Group at an organizational and management level were presented in the meeting on June 1, 2012. These called for the reorganization of the Commercial Vehicles function and the creation of the China function, among other things. We approved the plans after a detailed examination. In addition, we were provided with a detailed status report on the creation of the integrated automotive group with Porsche and authorized the Board of Management to increase the stake in M A N SE to more than 75%.
On September 21, 2012, the Supervisory Board held another meeting, which primarily addressed strategic issues. Among other things, the decision was taken to dissolve the AfGG and the I A K .
The Supervisory Board meeting on November 23, 2012 addressed in detail the Volkswagen Group’s investment and financial planning for the 2013 to 2015 period, and approved the Board of Management’s plans in this area. Another topic discussed during the meeting was the revised version of the declaration of conformity with the German Corporate Governance Code.
16

Detailed information on the remuneration system for the Board of Management and the Super-visory Board, together with the remuneration actually paid to the members of the boards in the reporting period, can be found in the remuneration report on pages 137 to 142 of this annual report.
CO N F L I C t S O F I N t e r eSt
Due to the legal uncertainty surrounding the scope of reporting on conf licts of interest and their treatment, the Board of Management and the Supervisory Board of Volkswagen AG have, as a precautionary measure, declared in the declaration of conformity with the German Corporate Governance Code required by section 161 of the Aktiengesetz (AktG – German Stock Corporation Act) that article 5.5.3 sentence 1 of the German Corporate Governance Code (report to the Annual General Meeting about conf licts of interest that have arisen and their treatment) was not complied with. Further details and references can be found in the following section, “Corporate Governance and Declaration of Conformity”. Conf licts of interest that have arisen and their treatment are nevertheless reported in the same scope as in the past in the following:
Dr. Hans Michel Piëch and Dr. Wolfgang Porsche, who are members of both the Supervisory Board of Volkswagen AG and the Supervisory Board of Porsche Automobil Holding SE , and were members of the latter’s Integrated Automotive Group Committee, abstained on the resolution concerning the I A K on February 27, 2012. Prof. Dr. Ferdinand K. Piëch and Dr. Ferdinand Oliver Porsche, who are also members of the Supervisory Board of Porsche Automobil Holding SE , but were not members of its Integrated Automotive Group Committee, took part in the resolution.
In its meeting on April 18, 2012, the Supervisory Board resolved that the Board of Management of Volkswagen AG was to vote at the Annual General Meeting of AU DI AG to elect Dr. Christine Hawighorst, Head of the Lower Saxony State Chancellery, and Dr. Wolfgang Porsche to the Supervisory Board. Dr. Wolfgang Porsche did not vote on this resolution. The Supervisory Board members appointed by the State of Lower Saxony took part in the vote.
In its meeting on September 21, 2012, the Supervisory Board approved the formation of a strategic partnership between Volkswagen Financial Services AG and Allianz SE, which provides vehicle insurance. A nnika Fa lkengren, who is a lso a member of the Supervisory Board of Münchener Rückversicherungs-Gesellschaft AG, abstained from voting as a precautionary measure.
In its meetings on November 5 and 22, 2012, the Executive Committee of the Supervisory Board addressed topics previously dealt with by the AfGG, which was dissolved on September 21, 2012. In this context, the Executive Committee granted individual approvals to transactions with Porsche Automobil Holding SE and the State of Lower Saxony. The Chairman of the Executive Committee, Prof. Dr. Ferdinand K. Piëch, and Executive Committee member Dr. Wolfgang Porsche are also members of the Supervisory Board of Porsche Automobil Holding SE . Executive
Report of the Supervisory BoardStr ateGy 17

Committee member David McAllister was the Minister-President of the State of Lower Saxony. No material conf licts of interest were discernible in this respect. All approvals were granted unanimously.
In its meeting on September 20, 2012, the Executive Committee confirmed its existing consent to the Executive Board appointments of Prof. Dr. Martin Winterkorn and Hans Dieter Pötsch exercised at Porsche Automobil Holding SE .
The AfGG, which was dissolved on September 21, 2012, also granted individual approvals to transactions with Dr. Ing. h.c. F. Porsche AG, as well as a number of subsidiaries and the State of Lower Saxony on February 27, 2012. A number of members of the AfGG are also members of the Supervisory Boards of Porsche Automobil Holding SE and Dr. Ing. h.c. F. Porsche AG. Jörg Bode was the Minister of Economic Affairs, Labor and Transport for the Federal State of Lower Saxony. No material conf licts of interest were discernible in this respect. All approvals were granted unanimously.
On July 4, 2012, the I A K , which was chaired by Prof. Dr. Ferdinand K. Piëch until its dissolution on September 21, 2012, approved the implementation of the plan for the contribution of the operating business of Porsche Automobil Holding SE to Volkswagen AG. On July 29, 2012, it approved the increase of Volkswagen AG’s share capital by one ordinary share in connection with the contribution of Porsche Automobil Holding SE’s operating business to Volkswagen AG. Further information is provided on page 144 of this financial report. Prof. Dr. Ferdinand K. Piëch took part in the resolutions.
No other discernible conf licts of interest were reported or arose in the reporting period.
CO r p O r at e G OV e r N a N Ce a N D D eCL a r at I O N O F CO N F O r M It y
The Supervisory Board addressed the implementation of the German Corporate Governance Code at the Volkswagen Group at its meetings on February 27 and November 23, 2012. In February’s meeting, we dealt in particular with changes required to be made in the course of the year to the declaration of conformity, whose subject matter is presented in the corporate governance report on page 131 of this annual report. The November meeting primarily dis-cussed the amendments to the Code published by the Government Commission on the German Corporate Governance Code on June 15, 2012. The Board of Management and Supervisory Board issued declarations on the recommendations contained in the Code in accordance with section 161 of the Aktiengesetz (AktG – German Stock Corporation Act) on February 27 and November 23, 2012 respectively.
18

The joint declarations of conformity by the Board of Management and the Supervisory Board are permanently available on the Volkswagen AG website at www.volkswagenag.com/ir. Further information on the implementation of the recommendations and suggestions contained in the German Corporate Governance Code can be found in the corporate governance report starting on page 131 and in the notes to the consolidated financial statements on page 349.
M eM B e r S O F t H e Su pe rV I S O ry B Oa r D a N D B Oa r D O F M a N aG eM e N t
As part of the election of the employee representatives on the Supervisory Board on March 22, 2012, Mr. Uwe Fritsch, Chairman of the Works Council at the Braunschweig plant, was elected as a member of the Supervisory Board of Volkswagen AG for the first time to succeed Mr. Peter Jacobs. The other existing employee representatives on the Supervisory Board were re-elected for a further term of office.
The 52nd Annual General Meeting elected Ms. Ursula Piëch and Prof. Dr. Ferdinand K. Piëch to the Supervisory Board for a full term of office. Subsequently, the Supervisory Board of Volkswagen AG elected Prof. Dr. Ferdinand K. Piëch as Chairman of the Supervisory Board and Berthold Huber as Deputy Chairman at its constituent meeting on April 19, 2012.
Mr. Wolfgang Ritmeier, Mr. Jürgen Stumpf and Mr. Bernd Wehlauer stepped down from the Supervisory Board at the end of 2012 since they have retired/will retire from the Company for reasons of age. We would like to thank them for their hard work for the Supervisory Board. Effective January 1, 2013, Dr. Hans-Peter Fischer, Chairman of the Board of Management of the Volkswagen Management Association, Mr. Jürgen Dorn, Chairman of the Group Works Council of M A N SE and Mr. Stephan Wolf, Deputy Chairman of the General Works Council of Volkswagen AG, were appointed by the court to the Supervisory Board of Volkswagen AG as their successors.
As part of the restructuring of the Volkswagen Group, Prof. Dr. Jochem Heizmann assumed re-sponsibility for the newly created China function on the Board of Management. Dr. Leif Östling, formerly the CEO of Scania, took over Prof. Heizmann’s previous job as head of the Commercial Vehicles function effective September 1, 2012.
Mr. Erich Küpker, a former minister and former member of the Supervisory Board, died on March 15, 2012 aged 78. As Lower Saxony’s Minister of Economic Affairs and Transport, Mr. Küpker served on the Supervisory Board from 1974 to 1978, where his hard work and commitment helped drive forward the Company’s successful development during this period.
Report of the Supervisory BoardStr ateGy 19

Mr. Walter Häfner, a former member of the Supervisory Board, died on June 19, 2012 aged 101. Mr. Häfner served on the Supervisory Board of Volkswagen AG from 1951 to 1974 and his extensive knowledge of the automotive industry made him a consistent source of expert advice.
Mr. Karl-Heinz Briam, our former Labor Relations Director, died on August 17, 2012 aged 89. Mr. Briam made a significant contribution to the Volkswagen Group’s successful development, displaying considerable initiative and exemplary commitment.
We shall honor their memory.
au D It O F a N N ua L a N D CO N S O L I Dat e D F I N a N CI a L Stat eM e N t S
The Annual General Meeting on April 19, 2012 elected PricewaterhouseCoopers Aktiengesell-schaft Wirtschaftsprüfungsgesellschaft as auditors for fiscal year 2012. The auditors audited the annual financial statements of Volkswagen AG, the consolidated financial statements of the Volkswagen Group and the combined management report, and issued unqualified audit reports on all of these documents. In addition, they analyzed the internal control and risk management system, concluding that the Board of Management had taken the measures required by section 91(2) of the AktG to ensure early detection of any risks endangering the continued existence of the Company. The Report by Volkswagen AG on Relationships with Affiliated Companies in Accordance with Section 312 of the AktG for the period from January 1 to December 31, 2012 (dependent company report) submitted by the Board of Management was also audited by the auditors, who issued the following opinion: “In our opinion and in accordance with our statu-tory audit, we certify that the factual disclosures provided in the report are correct and that the Company’s consideration concerning legal transactions referred to in the report was not unduly high.”
The documentation relating to the annual financial statements, including the dependent com-pany report, and the audit reports prepared by the auditors were provided to the members of the Audit Committee and the Supervisory Board in good time for their meetings on February 21, 2013 and February 22, 2013 respectively. The auditors reported extensively at both meetings on the material findings of their audit and were available to provide additional information.
Taking into consideration the audit reports and the discussion with the auditors as well as their own conclusions, the Audit Committee prepared the documents for our own examination of the consolidated financial statements, the annual financial statements of Volkswagen AG, the combined management report and the dependent company report and reported on these at the Supervisory Board meeting on February 22, 2013. Following this, the Audit Committee recommended that we approve the annual financial statements. We examined the documents in depth in the knowledge and on the basis of the report by the Audit Committee and the audit report as well as in talks and discussions with the auditors. We came to the conclusion that they are due and proper and that the assessment of the position of the Company and the Group presented by the Board of Management in the management report corresponds to the assessment by the Supervisory Board. We therefore concurred with the auditors’ findings and approved the annual financial statements prepared by the Board of Management and the
20

consolidated financial statements at our meeting on February 22, 2013. The annual financial statements are thus adopted. Our examination of the dependent company report did not result in any objections to the concluding declaration by the Board of Management in the dependent company report. We reviewed the proposal on the appropriation of net profit submitted by the Board of Management, taking into account in particular the interests of the Company and its shareholders, and endorsed the proposal.
We would like to express our thanks and appreciation to the members of the Board of Management, the Works Council, the management and all the employees of Volkswagen AG and its affiliated companies for their work in 2012. Their dedication helped the Volkswagen Group to continue its positive development despite the difficult market environment.
Wolfsburg, February 22, 2013
Prof. Dr. Ferdinand K. PiëchChairman of the Supervisory Board
Report of the Supervisory BoardStr ateGy 21

2012 was a challenging year in the automotive world. The debt crisis in Europe hit our industry hard. Nevertheless, we can say that 2012 was a good – in fact a very good – year for the Volkswagen Group.
We delivered 9.3 million vehicles worldwide – once again topping our prior-year figure by a million. Sales revenue increased by approximately 21 percent to €193 billion. We also did more than keep our promise for our operating profit, despite the economic headwinds: at €11.5 billion, we exceeded last year’s record figure.
The strength of our operations is also paying off on the stock exchange: Volkswagen’s shares clearly outperformed both the automotive sector and the DA X as a whole. You, our shareholders,
22

have benefited from this above-average performance. However, we also want your confidence in us to pay off at another level, too, which is why the Board of Management and the Supervisory Board are proposing a clearly increased dividend of €3.50 per ordinary share and €3.56 per preferred share.
2012 was more than just a year of strong financial figures for Volkswagen. We also established key strategic milestones for the future. Among other things, we gave our Strategy 2018 additional momentum through a comprehensive structural and management realignment. Since August 1, 2012, the Porsche brand has been a fully-f ledged member of the Volkswagen Group – a historic step for both companies. In addition, the purchase of Ducati has expanded our range to include a legendary and valuable motorcycle brand. And the alliance between MA N, Scania and Volkswagen Commercial Vehicles has laid the groundwork for us to reach for the top in the cyclical but high-margin commercial vehicles business in the future.
A key event in the passenger cars area in 2012 was the introduction of the Modular Transverse Toolkit. The seventh generation of the Golf, the Audi A3, the SEAT Leon and now also the ŠKODA Octavia give a taste of the versatility, innovative power and economic potentials associated with this technical system. We are proud of these vehicles – not least because they set new standards in fuel consumption and emissions. In line with this, we established another key milestone: in early 2012, we launched the most extensive ecological reorganization in the Group’s history. We are systematically focusing our vehicles and our plants on being environmentally friendly and efficient. You can see just how serious we are about this from the fact that the Volkswagen Group is the first carmaker to commit to the extremely ambitious European CO2 target of 95g/km by 2020.
All in all, Volkswagen has proven to be extremely resilient, robust and forward-looking, despite the difficult environment. This is due first and foremost to the 550,000 people now working for our Group, all of whom put their skills and their entire energy at the service of our Company. My colleagues and I on the Board of Management are proud of this team – and we would like to thank them for their hard work and passionate commitment over the past twelve months.
Macroeconomic uncertainties, the ongoing weakness of the European market and ever-increas-ing competition will continue to create a testing environment for the automotive industry in 2013. I am convinced that Volkswagen is well prepared for this, not least because of the unrivalled global positioning and versatility offered by our twelve brands, 280 models and 100 plants. And because our Group brands and vehicles provide customers with exactly the solidity and enduring value that are more important than ever in times like these.
Regardless of whether there is an upturn or a downturn going on, our goal is to ensure the Volkswagen Group reaches the top of the automotive industry by 2018 – in both economic and ecological terms. We are focusing all our efforts and energy on achieving this goal. I promise you that, in the process, we are keeping our sights firmly on all those who – rightly – expect a lot from us: our customers and employees, our business partners, society, and of course you, our shareholders.
Together, and with your ongoing trust and support, we can continue our successful course with all our strength and vigor.
Sincerely,
Prof. Dr. Martin Winterkorn
STR ATEGy Letter to our Shareholders 23

CH R I ST I A N K L I N G L E RSales and Marketing
D R . H .C . L E I F Ö ST L I N GCommercial Vehicles
PRO F. D R . R E R . P O L . D R .- I N G . E . H . J O CH EM H E IZ M A N NChina
PRO F. D R . R E R . P O L . H O R ST N EUM A N NHuman Resources and Organization
(from left to right)
The Board of Management of Volkswagen Aktiengesellschaft
24

D R . R E R . P O L . H .C . F R A N CI S CO JAV I E R G A RCI A SA NZProcurement
PRO F. D R . D R . H .C . MU LT. M A R T I N WI N T E R KO R N Chairman of the Board of Management of Volkswagen Aktiengesellschaft
Research and Development
H A N S D I E T E R P ÖT S CHFinance and Controlling
PRO F. RU PE R T STA D L E RChairman of the Board of Management of AUDI AG
D R .- I N G . E . H . M I CH A E L M ACH TProduction
CU R R I CU L U M V I TA E www.volkswagenag.com > The Group > Senior Management
Str ategy The Board of Management of Volkswagen Aktiengesellschaft 25

E xPE RI E N CE D [R] I V E R SIT y. D E D I C ATI O N .
28 Dedication. 6 questions / 6 reflections.
30 Berlin meets the Golf.
38 Step by step.
40 Samba do Brasil.
46 Sn A P SH OT Surrendering yourself to something.
48 Piccadilly Rendezvous.
54 The future makers.
58 Lightweight DnA.
62 Passione.
66 Family Business.
70 Sn A P SH OT Seeing the person.
72 The bus.
76 Culture management.
82 The transformation.
86 Power On!
90 Taking responsibility.
96 Working for the neighborhood.
98 Sn A P SH OT Pure beauty and grandeur.

Experience D[r]iversity. Dedication
Ex
pE
riE
nc
E D
[r]i
vE
rs
ity
.
The best cars, the most environmentally compatible production facilities, the most innovative technology, the most customer-friendly service. Top performance comes from people giving their best. When they are never satisfied. When they are dedicated to becoming better and better. Just like over half a million Volkswagen employees. Their dedication is the key to achieving the ambitious targets set out in our Strategy 2018.

Prof. Dr. Martin Winterkorn, Chairman of the Board of Management of Volkswagen AG and awarded
Manager of the Year 2012 by the business magazine “manager magazin”, talks about dedication as
a driving force behind business success and its importance for personal fulfillment.
Dedication.6 questions / 6 reflections.
28

Professor Winterkorn, what does the term “dedication” mean to you?I discovered early on that it is only possible to achieve great things with genuine dedication and passion. Dedication is first and foremost an attitude: it means giving your all, whether you are an athlete, a scientist or an engineer. I have the utmost respect for people who show such dedication.
How can you tell if someone is truly dedicated to their work?People whose heart is not truly in their work tend to settle for less. Dedication makes people go the extra mile, encourages them to consider how to make things even better. Dedication is a relentless driving force, it’s not an easy option – but it does leave you with a profound feeling of contentment.
Dedication invariably involves reaching a goal. How did you discover that your goal is to build perfect cars?When I was a boy growing up in southwest Germany, I used to see Porsche test drivers whizzing by in their 911s. Those images are still etched in my mind. Later on, as a young quality assurer at Audi, I learned that there are two crucial factors in carmaking. First of all, there is the big idea – the concept behind the car. But a car can only be truly great if every seemingly insignificant detail is perfect in design and execution. So secondly, you need perseverance – it is the only way to achieve perfection.
Why is dedication so typical of the Volkswagen Group?Because carmaking is more than a business for us. We love our cars. And we do our utmost to make them more visually appealing, efficient and perfect – the new Golf is a case in point. This goal is shared by everyone in the Company, from production line workers to the Board of Management. Only in this way can we ensure the best possible performance: the best car, the most innovative technology, the most environmentally compatible plant and the best training for our employees. Because of this, dedication is the key to achieving the targets that we have set out in our Strategy 2018.
Psychologists tell us that dedication requires concentrating fully on the task at hand. When do you experience moments like this?During test drives, when we put the cars through their paces shortly before they go into series production. I shut out everything else and concentrate entirely on the moment. I try to really feel the vehicle, its qualities and materials, I discuss the details of the engine, transmission and suspension with my col-leagues, and I try to envisage whether they fit the specific brand and its vision. Those are very intense sessions.
Environmental compatibility is increasingly becoming a success factor in automotive production. Is it possible to be as dedicated to reducing CO2 emissions as to developing a twelve-cylinder engine?I don’t see why not. Whether we’re talking about a one-liter car or a Bugatti Veyron – at the end of the day, it’s a question of overcoming apparent limitations. And that is only possible with complete dedication – and, of course, with the technical expertise of a Group that has over 40,000 researchers and developers in its ranks. Dedication and ability go hand-in-hand. And both are essential for people to reach their full potential.
1
2
3
4
5
6
p h o to g r a p h E r Hartmut Nägele
29EXPERIENCE D[R] IVERSIT Y. Dedication. 6 questions / 6 reflections.

A new face on the streets of Berlin doesn’t usually attract much attention. Locals go about their business or
soak up the autumn sun in a sidewalk café. But the new, bright red Golf turns heads as it waits for an important
date. Can the car win over young urbanites?
Berlin meets
ThE Golf.
30

“It drives really well. It’s as though I’ve been here behind the wheel forever.”
ag ata Wo J c i E c h oWs K i , F r i E D r i c h s h a i n , B E r l i n
E n E rg y t E c h n o l o g y st U D E n t at t E c h n i s c h E U n i v E r s i tÄt B E r l i n
Berlin meets the Golf.ExpEriEncE D[r] ivErsit y. 31

Driving in a major city? Isn’t it better to take public transport? Do young urbanites even need a car? You can have a preconceived opinion – or you can simply check it out for yourself. Five young Berliners test the seventh generation of the Volkswagen Golf 1 for city-friendliness ahead of its market launch.
B E r l i n - K r EUz B E rg , s ch ö n E B E rg E r st r a ss E , 9:21 a . m .
Agata has taken the morning off for her first encounter with the new Golf. The industrial engineer is currently studying for her master’s degree in energy technology and wants to find out more about Wolfsburg’s latest. The car and the student meet for the first time under the Gleisdreieck railway bridge. Agata casts a critical eye over the vehicle. She gets in and starts by asking what exactly is new in the Golf VII: adaptive cruise control, the city emergency braking function, a parking and lane-keeping assistant, as well as road sign and fatigue detection.
Her professional interest in resource conservation and sustain-able mobility is piqued as talk turns to fuel consumption. The Golf has never been more efficient, with consumption and emissions reduced by up to 23 percent compared with its predecessor. A large part of this is due to its intelligent lightweight construction – it weighs in at up to 100 kilos lighter than the previous model. Her boyfriend’s V W Bus, which is over 20 years old, cannot keep up with that. While the classic vehicle with a rear-mounted engine has won a place in her heart, she dreams of a first-generation V W Bus, “the one with the split front windscreen”. Ideally to travel the world in.
The blonde student chats about more travel plans as she drives around in the new Golf. “It drives really well”, she says suddenly, after a short pause. “It’s as though I’ve been here behind the wheel forever.” She skillfully navigates past double-parked vans, cyclists and Berlin’s ever-present roadworks. Agata has
32

“Street art is to Berlin what bread rolls are to a bakery.”
at t i l a sz a m o s i o F a r t i st D U o “ p E ac h B E ac h ”, n E U Kö l l n , B E r l i n
t h E n E W g o l F
lighter than its predecessor
more economical than its predecessor
best fuel consumption per 100 km in the Golf BlueMotion
up to
up to
Illustration: Peachbeach
33EXPERIENCE D[R] IVERSIT Y. Berlin meets the Golf.

just switched to “sport” mode, one of five driving modes that determine handling characteristics and steering, among other things. “I would usually stick with the eco program in the city, but this is a test drive after all, isn’t it?” She laughs and glances at the fuel gauge, just to be sure. The 1.6 liter turbodiesel engine (105 PS/77 kW) consumes an average of 3.8 liters of fuel per 100 kilometers2. That will take you far on the streets of Berlin.
At the next red light, she runs her hand over the dashboard and the fine stitching on the leather steering wheel. “It feels great.” As she gets out, Agata turns around, leans over the top of the car and asks about the T DI engine’s emission levels. “Only 99 grams per kilometer?”
B E r l i n - K r EUz B E rg , Fa lcK E n st E i n st r a ss E , 11:50 a . m .
Max grins. He has found the impossible – a parking space in Friedrichshain-Kreuzberg. This “Kiez”, as Berliners call their part of town, is particularly popular among young people. Max opens the back of his V W Lupo to unload. The compact vehicle is perfect for downtown Berlin, but not quite so perfect when Max is out and about with his girlfriend and child. “Then space gets a bit tight.”
Max knows from experience that the Golf traditionally has plenty of room. His first car was a 73 Passat, followed by a Golf I I and
Golf I I I. Max needs a car with space, and not just for personal use. For the last two years, the qualified architect has run a café called “New Deli Yoga” together with Maria, a yoga teacher from Cologne with Greek roots. He parks the red Golf in front of the café.
Both of them immediately start inspecting the new model’s load capacity. After all, the Golf VII offers 30 liters more interior storage space than its predecessor, with a capacity of 380 liters behind the back seats. At the same time, the exterior dimensions have remained almost exactly the same – a real plus in city traffic. “The loading space is as f lat as a pancake”, says Max. He folds the back seats down and starts stacking empty plastic crates into the car. Maria sits on the sill. “It’s so low even I can lift boxes over it without a problem.”
Max heads off towards the wholesale market: “Plenty of space behind the steering wheel. And the seat is nowhere near as far back as it can go.” On the road, Max tells of his café and everyday life in Kreuzberg. He is aware of the problems and does a great deal for his district. Maria and Max introduced “social rates” at their café. This means that those with not much money pay a little less at “New Deli Yoga”.
“Plenty of space behind the steering wheel. And the seat is nowhere
near as far back as it can go.”
m a x a ss Fa lg , oW n E r o F t h E “ n E W D E l i yo g a” c a F É i n F r i E D r i c h s h a i n - K r E Uz B E rg , B E r l i n
34

35EXPERIENCE D[R] IVERSIT Y. Berlin meets the Golf.

B E r l i n - n EU Kö l l n , s o n n E n a l l E E , 2: 45 p. m .
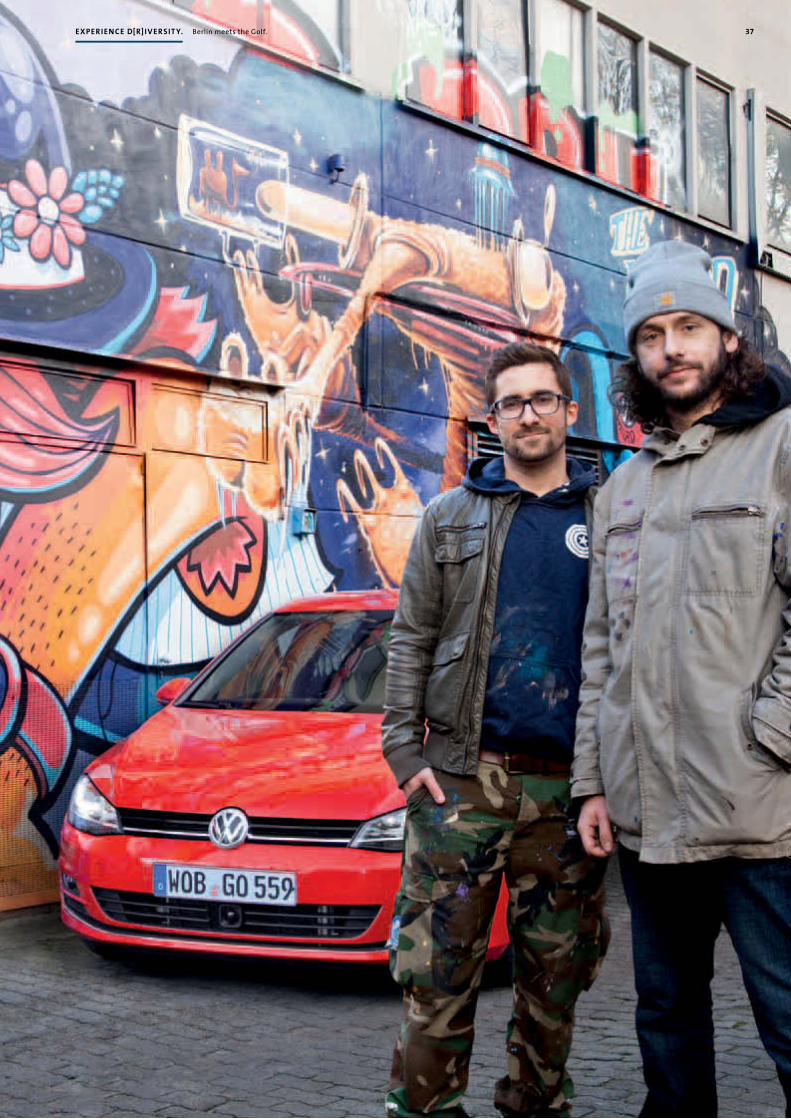
Young creative types are increasingly being drawn to the neigh-boring district of Neukölln as a result of the boom in Kreuz-berg over the past few years. This is where the red Golf is now headed, to today’s third and last destination. As the door is opened, the aroma of ground coffee which still lingered after the visit to the wholesale market gives way to the smell of fresh paint. “Peachbeach” – as the artist duo Attila and Lars call themselves – are hard at work. The two met while studying graphic design and decided to create street art together. “Street art is to Berlin what bread rolls are to a bakery”, explains Attila. The city on the Spree River is considered the center of street art culture, which is globally linked via the Internet. “Peachbeach” are professionals. Their work has been featured at exhibitions in Vienna, Amsterdam, Paris and London. They are in demand as illustrators and demonstrate their talents at live painting events.
The Golf V I I parks in front of the nearly finished wall mural and appears to blend in with the image. The Golf effortlessly passes muster with the young design professionals. “Genius”, says Lars. “The Golf is a Golf is a Golf. You have to first come up with such a timeless design.”
Lars is impatient to get in; he rode to the test drive on his bicycle. “I’m a bit cold. Does the Golf have heated seats?” It does. Inside, Attila immediately checks out the infotainment system. The
large touchscreen works together with a proximity sensor and switches from display to operating mode without having to be touched. Attila plugs in his smartphone, f lips through the CD covers in the multimedia library and scrolls through his playlists. His verdict? “Cool touchscreen technology.” Everything else he says is drowned out by the 400 watt sound system. He then drives around the block, the bright-as-day rays of the xenon headlights illuminating the houses. Night comes early on this fall day in the German capital city.
One thing is clear from these three encounters between young urbanites and the new Golf: cars and cities certainly do go together. But young people don’t just want a safe vehicle that is easy on resources but still fun to drive – they also want plenty of interior space and exterior dimensions that are as compact as possible. And the onboard infotainment has to be as intuitive and easy to use as a smartphone. The new Golf ticks all the boxes. It is a compelling car – in any situation.
“The Golf is a Golf is a Golf.
You have to first come up with such a timeless design.”
l a r s W U n D E r l i c h o F a r t i st D U o “ p E ac h B E ac h ”, n E U Kö l l n , B E r l i n
aU t h o r Andreas Kessler
p h o to g r a p h E r Marcus Pietrek
a D D i t i o n a l i n F o r m at i o n www.volkswagen.com > Product World > Models > The Golf
1 Golf VII fuel consumption in l/100 km: combined from 5.2 to 3.8; CO2 emissions in g/km: combined from 122 to 99.
2 Golf VII 77kW, fuel consumption in l/100 km: urban 4.6/extra-urban 3.3/combined 3.8; CO2 emissions in g/km: combined 99.
36
37EXPERIENCE D[R] IVERSIT Y. Berlin meets the Golf.

Environmentally friendly vehicles and sustainable production are two sides of the same coin. That is why the
Volkswagen Group has set itself the ambitious target of making production at all Group locations 25 percent
more environmentally friendly by 2018. Over the coming years, the Group is set to invest €600 million for
the sole purpose of producing renewable solar, wind and hydroelectric energy. Join us for a closer look at the
blue and green world of Volkswagen.
a n h a n gU E r a , B r a z i l: h y D ro E l Ec t r i c p oWE r a n D s pEci Es co n s E rvat i o n –The Anhanguera hydroelectric power station stands
on the Sapucaí river at Guará, 500 kilometers in-
land in the northeast of São Paulo state. Volkswagen
do Brasil connected this station to the grid in 2010.
An artificial lake has been created in the surround-
ing area, a new forest planted further up the
river, and a green belt created stretching almost
six kilometers. The intact ecosystem is home
to a colorful variety of plants and animals. Today,
Anhanguera meets 18 percent of the energy re-
quirements of all four Volkswagen brand plants in
Brazil. Plans are currently being made for another
hydroelectric power station.
ch at ta n o o g a , Usa: pl at i n Um aWa r D F o r vo l K sWag E n – Volkswagen
in Chattanooga is the first and only automotive
production facility in the world to be awarded
platinum LEED certification (LEED = Leadership in
Energy and Environmental Design). In Chattanooga,
new painting processes have brought about a
substantial reduction in CO2 emissions. The build-
ings are well insulated, thus saving energy. Where
artificial light is needed, this is provided by energy-
efficient LED lamps. Cooling systems are fed with
rainwater. And the Group’s commitment to protect-
ing the environment extends well beyond the plant
itself – the surrounding site is a model of environ-
mentally sound landscaping.
i n g o l sta Dt, g E r m a n y: “g r E E n Data cE n tE r ” at aU D i – After a three-year con-
struction period, the new heart of Audi IT can
be found in Ingolstadt, hidden away on two under-
ground stories. Here, an area of 2,000 square
meters will house up to 6,000 servers and IT com-
ponents. Thanks to state-of-the-art technology –
for instance by air conditioning the data center
using natural outside air – it will be possible to
cut the CO2 footprint by between 6,000 and
16,000 tonnes every year, depending on the
project stage.
Step by STEp.38

aU t h o r Tina Rumpelt
a D D i t i o n a l i n F o r m at i o n www.volkswagenag.com > Sustainability and Responsibility > CSR worldwide
EmDEn, gErmany: “thinK BlUE.Factory.” –“Think Blue.Factory.” is the name of a program
launched with a view to making the production of
Volkswagen vehicles sustainable. The objectives
are to increase resource efficiency, reduce emissions
and make more extensive use of renewable ener-
gies. In Germany, the expansion of the Emden plant
is one of the largest projects. A new body shop
facility is currently being built on 5,000 piles in the
earth. About 3,300 of these will serve as “energy
piles”: they are designed to cool water that will
initially be used for cooling the welding machines.
Waste heat from this process will produce hot
water for heating the produc tion facility before
the water is cooled down again through the energy
piles.
m l a DÁ B o l Es l av, c z Ech r E pU B l i c: Biom a ss poWEr at ŠKoDa – Biomass is the
key to a green future at Mladá Boleslav. ŠKODA sub-
sidiary Ško-Energo, which operates the local com-
bined heat and power plant, aims to continually in-
crease the proportion of energy generated using
biomass, thus reducing CO2 emissions by a quarter
by 2015. The combined heat and power plant
produces electricity for vehicle and subassembly
production. The resulting heat is then used in the
city and in the plant.
mExico: trEEs For thE lovE oF thE pl anEt – “Por amor al planeta” (“For the love of
the planet”) is the name of Volkswagen’s nature
conservation program in Mexico. This program fo-
cuses primarily on promoting species conservation
and protecting woods and forests. The long-term
water supply in the region has been improved by
means of a reforestation program in the national
park surrounding the Popocatépetl volcano. A total of
420,000 mountain conifers have already been plant-
ed, while soakaways and dams collect the precious
water. This project is increasing the volume of ground -
water by an estimated 2.6 million cubic meters a
year – substantially more than the amount consumed
at the Volkswagen plant 40 kilometers away in
Puebla.
F o s h a n , ch i n a: co n s E rv i n g pr Eci o U s WatE r – At the end of 2012, one of the most
modern wastewater treatment facilities in China
went into operation at the new Volkswagen plant
at Foshan. Here, the wastewater is recycled by envi-
ronmentally friendly processes in one of the Group’s
largest membrane bioreactor facilities. 100 percent of
the purified wastewater is fed back into the plant,
where it is used, among other things, for rain tests in
the assembly facility and for replenishing cooling
water, thus cutting fresh water consumption by
around 30 percent.
l E i pz i g , g E r m a n y: sUsta i n a B l E h E at i n g at p o r s ch E – The new paintshop
at Porsche in Leipzig, which is scheduled to go into
operation at the end of 2013, makes use of waste
heat from a nearby wood chip heating plant. This
ensures that the automotive production facility
is supplied with heat that is 80 percent carbon-
neutral.
39ExpEriEncE D[r] ivErsit y. Step by step.

Brazil is Latin America’s “economic wonderland”. It ranks as one of the countries with the most promising growth
potential and has jumped to sixth place among the world’s largest economies. Volkswagen do Brasil is one of
the driving forces behind this trend. The company is celebrating its 60th anniversary in 2013 – and has its eyes
focused firmly on the future.
Samba do
Bra Sil.
40

41EXPERIENCE D[R] IVERSIT Y. Samba do Brasil.
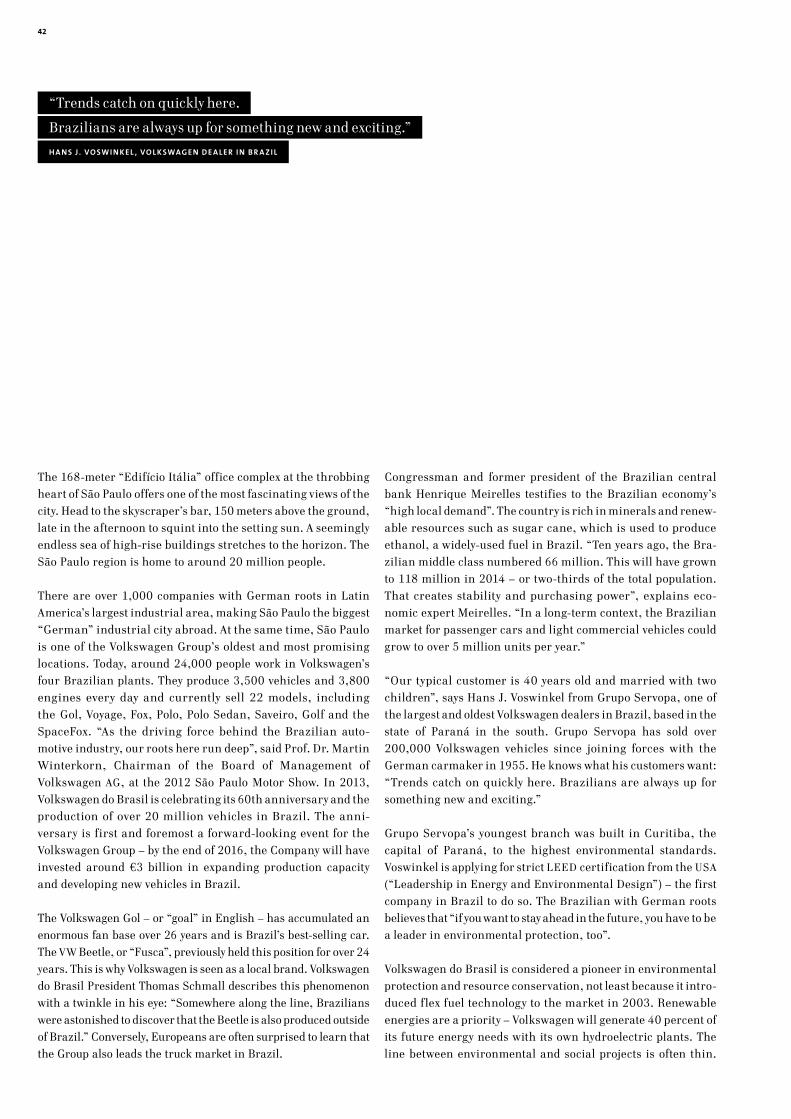
Congressman and former president of the Brazilian central bank Henrique Meirelles testifies to the Brazilian economy’s “high local demand”. The country is rich in minerals and renew-able resources such as sugar cane, which is used to produce ethanol, a widely-used fuel in Brazil. “Ten years ago, the Bra-zilian middle class numbered 66 million. This will have grown to 118 million in 2014 – or two-thirds of the total population. That creates stability and purchasing power”, explains eco-nomic expert Meirelles. “In a long-term context, the Brazilian market for passenger cars and light commercial vehicles could grow to over 5 million units per year.”
“Our typical customer is 40 years old and married with two children”, says Hans J. Voswinkel from Grupo Servopa, one of the largest and oldest Volkswagen dealers in Brazil, based in the state of Paraná in the south. Grupo Servopa has sold over 200,000 Volkswagen vehicles since joining forces with the German carmaker in 1955. He knows what his customers want: “Trends catch on quickly here. Brazilians are always up for something new and exciting.”
Grupo Servopa’s youngest branch was built in Curitiba, the capital of Paraná, to the highest environmental standards. Voswinkel is applying for strict L EED certification from the USA (“Leadership in Energy and Environmental Design”) – the first company in Brazil to do so. The Brazilian with German roots believes that “if you want to stay ahead in the future, you have to be a leader in environmental protection, too”.
Volkswagen do Brasil is considered a pioneer in environmental protection and resource conservation, not least because it intro-duced f lex fuel technology to the market in 2003. Renewable energies are a priority – Volkswagen will generate 40 percent of its future energy needs with its own hydroelectric plants. The line between environmental and social projects is often thin.
The 168-meter “Edifício Itália” office complex at the throbbing heart of São Paulo offers one of the most fascinating views of the city. Head to the skyscraper’s bar, 150 meters above the ground, late in the afternoon to squint into the setting sun. A seemingly endless sea of high-rise buildings stretches to the horizon. The São Paulo region is home to around 20 million people.
There are over 1,000 companies with German roots in Latin America’s largest industrial area, making São Paulo the biggest “German” industrial city abroad. At the same time, São Paulo is one of the Volkswagen Group’s oldest and most promising locations. Today, around 24,000 people work in Volkswagen’s four Brazilian plants. They produce 3,500 vehicles and 3,800 engines every day and currently sell 22 models, including the Gol, Voyage, Fox, Polo, Polo Sedan, Saveiro, Golf and the SpaceFox. “As the driving force behind the Brazilian auto-motive industry, our roots here run deep”, said Prof. Dr. Martin Winterkorn, Chairman of the Board of Management of Volkswagen AG, at the 2012 São Paulo Motor Show. In 2013, Volkswagen do Brasil is celebrating its 60th anniversary and the production of over 20 million vehicles in Brazil. The anni-versary is first and foremost a forward-looking event for the Volkswagen Group – by the end of 2016, the Company will have invested around €3 billion in expanding production capacity and developing new vehicles in Brazil.
The Volkswagen Gol – or “goal” in English – has accumulated an enormous fan base over 26 years and is Brazil’s best-selling car. The VW Beetle, or “Fusca”, previously held this position for over 24 years. This is why Volkswagen is seen as a local brand. Volkswagen do Brasil President Thomas Schmall describes this phenomenon with a twinkle in his eye: “Somewhere along the line, Brazilians were astonished to discover that the Beetle is also produced outside of Brazil.” Conversely, Europeans are often surprised to learn that the Group also leads the truck market in Brazil.
“Trends catch on quickly here.
Brazilians are always up for something new and exciting.”
h a n s J . vo sW i n K E l , vo l K sWag E n D E a l E r i n B r a z i l
42

43EXPERIENCE D[R] IVERSIT Y. Samba do Brasil.

vo l K sWag E n sU pp o r t s t h E U p- a n D - co m i n g F o o t Ba l l E r s at F c s a n to s – A good education is always part of the game plan for the most talented players.
44

Visitors to the Anchieta plant are intrigued by the enormous hand-operated f lywheel on display – a simple water pump that does great good. It gives thousands of people in dry regionsaccess to free, clean water. The Brazilian foundation “FundaçãoVolkswagen” also supports a wide range of social and educational projects and has invested almost €20 million in the last ten years alone.
Anyone involved in the community in Brazil cannot ignore soc-cer – the country is set to host the 2014 World Cup. Volkswagen will be on board as the partner of the Brazilian national soccer team, “Seleção Brasileira”. The automobile manufacturer already supports social projects such as “A chance to play”, as well as the work with young people that takes place at the soccer club in Santos – a port city in the Brazilian state of São Paulo. FC Santos is famous. Pelé started his career here, as did Neymar. The 21-year-old is already a superstar and is considered the next Pelé.
“For millions of people, making it big in soccer is the great Brazilian dream”, says Bruno Amodio from FC Santos. A good education is always part of the game plan for the most talented players. Even today, going to school is still not a given for many Brazilian children. The weather doesn’t help, either – in the rainy season, school buses often get stuck in the mud. Following a government tender, thousands of all-terrain “Ônibus Escolar” are now in service all around the country – developed and pro-duced by Volkswagen.
pE o pl E call Brazil home
194 million
24,000E m pl oy E E s at four Volkswagen locations
3,500v E h i cl E s produced per day
vo l K sWag E n i n B r a z i l
60y E a r s o F vo l K sWag E n in Brazil
B r a z i l
AnchietaSão Carlos
AnchietaAnchietaSão Carlos
Taubat éSão CarlosSão CarlosSão Carlos
Taubat éTaubat é
Curitiba
aU t h o r Dirk Maxeiner
p h o to g r a p h E r Andreas Mader
a D D i t i o n a l i n F o r m at i o n www.volkswagenag.com > The Group > Production Plants
45ExpEriEncE D[r] ivErsit y. Samba do Brasil.

46

For me, surrendering yourself is about the passion and dedica-tion you bring to something. It is a precondition for work of a very personal nature, where you want to do the best you can. When I retreat to my studio and paint, time and place completely lose their meaning. I am free. Creativity becomes automatic, and I can focus on one thing.
A particularly vivid snapshot of your surroundings can also be a moment of surrender. In the past, this was driving across the Alps with my brother in a “pretzel” Beetle. We soaked it all up – seeing the mountains for the first time, driving over the high passes, then Italy and the sea.
Images like these secretly leave their mark and resurface every now and then. Like some time ago, when I visited the church my father died in towards the end of the war. As I entered the church, the organ began to play a song from my childhood, “The Moon Has Risen”. My father’s favorite song. It was a very intense, deeply personal moment.
Last year, I was filming in the US with Terrence Malick, a one-of-a-kind director who is known for his improvisations. My scene
was set in an enormous church. Just me and Natalie Portman, who played the lead role. Terrence had seen my violin in my trailer beforehand. Towards the end of the scene, he had the violin brought to me and asked me to play. I stood in the church holding my violin. All of a sudden, this old melody from my childhood came to me. I don’t know how long I played for. My surroundings disappeared. I cannot describe what I felt in that moment. After the scene, Natalie Portman kissed my hand in thanks and Terrence Malick’s wife had tears in her eyes.
It’s the same with surrendering yourself – old images reveal their inner strength.
Surrendering yourself to something.
D E D i c a t i o n ⁄⁄ a r m i n m U E l l E r - s t a h l , 8 2 , g E r m a n a c t o r , m U s i c i a n , p a i n t E r a n D a U t h o r
p h o to g r a p h E r Andreas Mühe
The Kunsthaus Lübeck gallery showcases the paintings of Armin Mueller-Stahl.
47ExpEriEncE D[r] ivErsit y. Snapshot.

Piccadilly
rEnDEzVouS.
48

In the world’s first Audi City in London, the brand with the four rings is showcasing its entire range of
models using virtual technology – something that has never been done before. At the same time, customer
relationship managers like Michelle Mensah provide a one-to-one service for visitors. A look at Audi’s first
digital showroom.
49ExpEriEncE D[r] ivErsit y. Piccadilly Rendezvous.

With a swipe of her finger, Vanessa Simeonidis switches off the virtual engine and takes another close look at the all-black leather trim. “Yes, that’s the way I want it”, she nods contentedly. The customer, an insurance lawyer by profession, has opted for a sporty, elegant exterior with ibis white bodywork and silver alu-minum rims. Even though her new Audi A31 has yet to be built, she has already examined it from all angles, inside and out. The images are projected onto a f loor-to-ceiling multimedia screen in the world’s first Audi City, which opened in summer 2012 near London’s world-famous Piccadilly Circus.
Seventeen high-performance computers visualize the Audi model on a 1:1 scale, just as it was configured by Vanessa Simeonidis on one of the seven multitouch tables in the showroom. Thanks to the two million pixels in the L ED projection screens, every single interior detail looks exactly as if she were actually sitting behind the wheel of her future car. The sound of the engine from the 90-speaker surround system is impressively authentic, as is the satisfying sound that the door makes when Vanessa Simeonidis swipes it shut.
Four of these large-format screens – known as powerwalls – extend along almost the entire length of the Audi City show-room, which measures 420 square meters in size. All colors, equipment lines and options for Audi’s current range of 40 or so models can be displayed here and mixed and matched at will. This means that, depending on customers’ preferences, there are several hundred million configuration possibilities. Now, for the first time ever, it is possible for an automobile manufac-turer to bring the entire diversity of its product range to life in a single showroom. A handful of real exhibits bridge the gap between virtual models and physical driving pleasure.
p oW E rWa l l s extend along almost the entire length of the digital showroom
4
42017
s Q Ua r E m E t E r s is the size of the new “Audi City” in the heart of London
h i g h - pE r F o r m a n cE co m p U t E r s visualize each of the 36 Audi models on
a 1:1 scale – in all variants
50
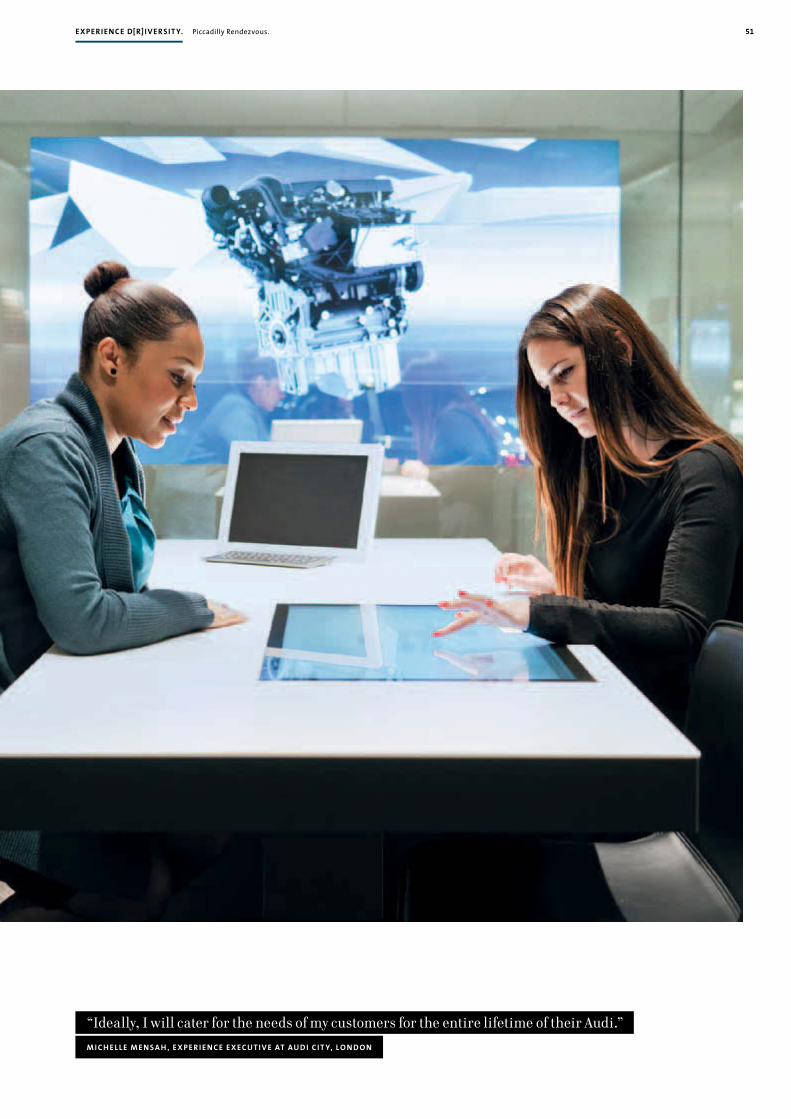
“Ideally, I will cater for the needs of my customers for the entire lifetime of their Audi.”
m i c h E l l E m E n s a h , E x p E r i E n c E E x E cU t i v E at aU D i c i t y, l o n D o n
51ExpEriEncE D[r] ivErsit y. Piccadilly Rendezvous.

52

Although the carmaker is breaking new ground with the high-tech concept behind Audi City, it is by no means the only innova-tion here. Michelle Mensah’s role at London’s Audi City – as a customer relationship manager – is also a whole new departure. Although she has just helped Vanessa Simeonidis to configure her dream car, her job extends well beyond advising customers and organizing test drives. She will also remain the customer’s personal contact – for example, it is Michelle that Vanessa Simeonidis will contact when she wants to bring her Audi A3 in for servicing. The young Briton describes her varied role as follows: “Ideally, I will cater for the needs of my customers for the entire lifetime of their Audi.”
This special approach to customer management is also a welcome development for David Parker, a 45-year-old management con-sultant who recently took delivery of his new Audi Q52 at Audi City and ordered a new A13 to boot. He did not even feel the need to take a test drive: “The powerwall visualization and Michelle’s advice were enough for me. Besides, Audi and I go back a long way and I have great faith in the brand.”
Modern communications technology such as that used in Audi’s new venture in London is becoming a firm fixture in the lives of more and more people. Nine out of ten customers who are inter-ested in buying a new car consult the Internet for information beforehand. Similarly, two out of three use social networks to draw on the experiences of others in their decision-making pro-cess. Inevitably, this has not left dealers unscathed: ten years ago, customers still paid an average of seven visits or so to the dealer before signing the purchase agreement; these days, the average number of visits is just two. “Web technologies are a part of our customers’ everyday lives. That is something we will be ref lecting more and more in our brand profile in future”, confirms Sven Schuwirth, Head of Brand and Sales Develop-ment.
Trends such as these are emerging fast, particularly in booming cities like the U K capital. This, as Schuwirth explains, is why
Audi “aims to promote real interaction with our customers at such locations”. There will be plenty of opportunities to do so in future: at exhibitions, lectures and discussions on topics from the realms of art, architecture and social issues.
“Networking” is the watchword. It is no coincidence that trans-port hub Green Park was chosen as the location for Audi City – after all, six bus and three Underground lines converge here, while Pic-cadilly Circus is just one stop away. As marketing and sales expert Sven Schuwirth explains: “Here we can come into contact with people in their everyday environment – on their way to the office, picking up a few groceries after work, or going shopping at the weekend.” Right across the road is the famous Ritz Hotel with its international guests. “Around a thousand existing and potential customers visit us on average every week”, reports Michelle Mensah. Her sales manager is also very happy: nine out of ten Audi City customers are buying an Audi model for the first time.
The London venture is just the beginning of a new era of virtual showrooms. At the end of January 2013, the second one opened its doors in Beijing – inviting Chinese customers to a rendezvous in cyberspace.
aU t h o r Wilhelm Missler
p h o to g r a p h E r Hartmut Nägele
a D D i t i o n a l i n F o r m at i o n www.audi.com > Experience > Audi City
1 Audi A3 fuel consumption in l/100 km: combined from 6.6 to 3.8; CO2 emissions in g/km: combined from 152 to 99.
2 Audi Q5 fuel consumption in l/100 km: combined from 8.5 to 5.3; CO2 emissions in g/km: combined from 199 to 139.
3 Audi A1 fuel consumption in l/100 km: combined from 5.9 to 3.8; CO2 emissions in g/km: combined from139 to 99.
4 (p. 52) Audi S8 382 kW, fuel consumption in l/100 km: urban 14.4/extra-urban 7.6/ combined 10,1; CO2 emissions in g/km: combined 235.
53ExpEriEncE D[r] ivErsit y. Piccadilly Rendezvous.

In the Volkswagen Group young people around the world
are working on their dissertation or thesis. They research
new materials and develop innovative engineering concepts.
They give driver assistance systems a voice or figure out
what drives progress. They all have one goal in common –
to create the car of the future.
c a ro li n E rU Dzi n sK i , 34 , a n Eco n om i cs g r a D UatE ,
is researching the wisdom of the crowd – are groups un-usually intelligent and perhaps smarter than the experts from their midst? Can crowdsourcing function as a source of infor-mation for strategic business decisions, such as the devel-opment of technologies and trends? Caroline is approaching her doctorate on the topic pragmatically, testing the theory under practical conditions in a virtual “information market” to obtain concrete results. “Developing and trying out new approaches in a global company like Volkswagen is a fasci-nating task.” Swedish-born Caroline believes in the wisdom of the crowd: “Addressing something on a large scale increases companies’ awareness of strategically relevant topics.”
The future maKErS.
54

co lli n s ntch o Uzo U n g a n Ko, 32 , i s com plE ti n g
h i s sEco n D D Eg rE E i n m Ech a n i c a l E n g i n E E ri n g .
“I love tinkering”, says the Cameroonian. But he is even more passionate about “thinking ahead”. He is a keen chess player. A good match – his dissertation also requires fore-sight. His topic: a contribution to the methodological design of lightweight floor structures with an integrated battery system for electric vehicles. This involves wall thicknesses and vibrational behavior, innovative lightweight construction and efficient engineering design processes. “The fascinating part is bringing together a wide range of knowledge from various disciplines”, says Collins. His findings are helping to make the car of the future more intelligent and more sus-tainable. This vision is his inspiration. He wants to continue researching and developing new ideas in this field. “Wher-e ver I am in the world, the most important thing is that I am at Volkswagen.”
55ExpEriEncE D[r] ivErsit y. The future makers.

ch E n -y U n g sU, 36, stU D i E D p sych o lo g y i n ta iWa n
B E Fo rE mov i n g to g E r m a n y i n 20 0 4 . His dream job? “Research, research, research”, says Chen-Yung Su without skipping a beat. He stumbled across the field of transportation psychology during his studies. This led him to Volkswagen. In his dissertation, Chen-Yung is examining verbal communi-cation between the car and the driver. Or more precisely, the question of how assistance systems best make themselves heard – and most quickly – in terms of the type of message and how it is phrased. To find this out, he spent a year with the automated driving experts at the Volkswagen Group of America’s Electronics Research Laboratory (ERL) in California. What motivates Chen-Yung? “Finding and then stretching the limits of human knowledge.” And what does he want from the mobility of tomorrow? “Zero emissions, zero accidents, zero stress and plenty of driving pleasure.”
56

Ja n i n E K rE Bs, 28 , i s stU Dy i n g m a n ag Em E nt
E n g i n E E ri n g , spEci a liz i n g i n m Ech a n i c a l
E n g i n E E ri n g . She values the “space for free thinking and ideas” offered by research and development in the Volkswagen Group. “Inspiration is what drives science forward”, she says. Her interest in math, chemistry and physics started at school. This led to a passion for technology. She wrote her diploma thesis on reducing friction in combustion engines. In her doctoral thesis, she is investigating tool coating for an innovative manufacturing process for high-quality plastic components. At the same time, Janine is looking at new materials to simplify thermal management in the vehicle of the future. You only have to listen to her to find out a great deal about the new materials that are driving progress in automotive con-struction: “They will shape the car of tomorrow in many different ways – in terms of safety and comfort, but they will equally play an important role in resource conservation.”
aU t h o r Tina Rumpelt
p h o to g r a p h E r Hartmut Nägele
a D D i t i o n a l i n F o r m at i o n www.volkswagenag.com > Innovation
57ExpEriEncE D[r] ivErsit y. The future makers.

58

Every Porsche carries the lightweight gene. This applies equally to the 550 Spyder, the forerunner of all
Porsche racing cars, and the new Boxster. Both feature a pioneering steel/aluminum mixed construction
for a lightness previously unheard of in the automotive industry.
liGhTweight DNA.
Lightweight DNA.ExpEriEncE D[r] ivErsit y. 59

At first glance, it was a David and Goliath-style battle. Umberto Maglioli took to the starting line in 1956 in a Porsche 550 Spyder, powered by a four-cylinder boxer engine with a capacity of only 1.5 liters, contesting the apparent superiority of eight and twelve-cylinder engines. The Ita lian won the “Targa Florio” long-distance road race in Sicily at the first attempt – Porsche’s first major motor sport success. The secret? The car weighed little more than 500 kilos. Less weight to move meant that a small engine sufficed – and mounting it in the center ensured that the weight was evenly distributed between the front and back axles. Porsche engineers had reworked the already light model 550 in the run-up to the race, cladding the three-dimensional tubular frame with the kind of aluminum shell seen in aircraft con-struction. This reduced the body weight by 27 to 63 kilos.
“This approach was very modern”, explains Dr. Werner Tietz, Director Body Engineering at Porsche in Weissach. “These days, our engineers still put a great deal of thought into how we can shed extra pounds in each new model generation.” The results can be seen in the consistently lightweight construction of the new Porsche Boxster1, an open two-seater with a mid-mounted engine, just like its ancestor. The latest generation weighs 40 kilos less than its predecessor, which was launched in 2004, despite meeting significantly higher safety standards. Alongside the lightweight body, the revamped engines also help to make the new Boxster particularly fuel-efficient. The technology behind it is the same as in its big brother, the Porsche 911 – it is half steel, half aluminum.
This construction, groundbreaking in the automotive industry, is based on the experience that each material has particular strengths. “Modern types of steel enable us to apply high levels of strength to very small areas”, explains Tietz. High-tensile steel, for example, is used for the windscreen frame to protect passengers if the vehicle rolls over. By contrast, aluminum is characterized by a low unit weight. The light metal can also be cast into extremely complex shapes. The new Boxster has a large aluminum element integrated into the rear side frame that is not only two kilos lighter than the steel version in its predecessor, but also replaces six individual components and thus the same number of steps in the production process.
Tietz and his team have long been working on the next vehicle generation. He wants to reduce body weight by a further 30 kilos, with magnesium playing a key role. “It’s just like on the race-track – if you stand still, you get left behind.”
aU t h o r Johannes Winterhagen
p h o to g r a p h E r Rüdiger Nehmzow
a D D i t i o n a l i n F o r m at i o n www.porsche.com
1 Porsche Boxster fuel consumption in l/100 km: combined from 8.8 to 7.7; CO2 emissions in g/km: combined from 206 to 180.
p o r s ch E’ s l i g h t W E i g h t co n st rU c t i o n h i sto ry i n a m o D E r n a m B i E n cE – Dr. Werner Tietz, Director Body Engineering, at the Porsche Museum in Stuttgart-Zuffenhausen.
60
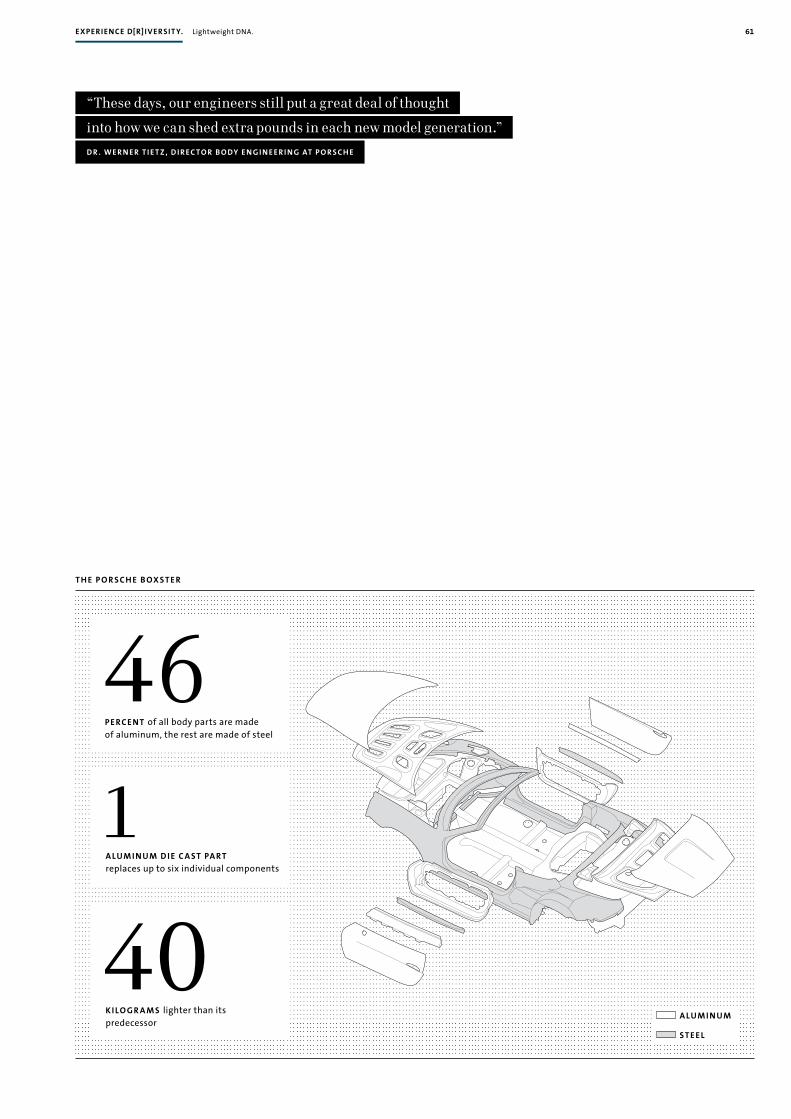
“These days, our engineers still put a great deal of thought
into how we can shed extra pounds in each new model generation.”
D r . W E r n E r t i E t z , D i r E c to r B o Dy E n g i n E E r i n g at p o r s c h E
a lUm i n Um
st E E l
46pE rcE n t of all body parts are made of aluminum, the rest are made of steel
40K i l o g r a m s lighter than its predecessor
1a lUm i n Um D i E c a st pa r t
replaces up to six individual components
t h E p o r s ch E B ox st E r
61ExpEriEncE D[r] ivErsit y. Lightweight DNA.

Lamborghini and Ducati – two brands, two synonyms for high performance and unique design. Their north
Italian home plays host to a meeting of superlatives: the Lamborghini Aventador and the Ducati 1199 Panigale.
Supercar meets superbike. The two brands’ chief test drivers quickly discover the similarities between their
technical worlds: performance, lightweight construction – and a passion for the unusual.
Passione.
62

ExpEriEncE D[r] ivErsit y. Passione. 63

A crowd of people and two high-performance machines at the market square in Rivabella, Emilia Romagna. Passers-by surround the Lamborghini Aventador 1 and the Ducati Panigale. The two models are among the most extreme street-legal vehicles engineers have ever put on wheels.
Only a few meters away, two young Italians talk shop over an espresso. “How long do you need to change gears?” asks Giorgio Sanna. “50 milliseconds”, replies Alessandro Valia. “50 milli-seconds? Same for us. Then it’s a tie”, says Giorgio with a grin. The two are deep in discussion and bat technical jargon back and forth across the table.
Both are chief test drivers: Giorgio Sanna for Lamborghini and Alessandro Valia for Ducati. Lamborghini’s headquarters in Sant’Agata Bolognese and Ducati’s base in the Panigale district of Bologna are only 20 minutes’ drive away from each other. The region is affectionately called “Terra dei Motori”, or “Motor Valley” by the Italians. If you ask Giorgio and Alessandro what is so special about their car and bike-crazy homeland, the answer comes like a shot: “Passione” – passion! Both brands live this passion under the Audi umbrella. A fitting match. No one has to explain Audi’s “Vorsprung durch Technik” philosophy to its Italian subsidiaries.
There is a long list of technical similarities between the super-car and the superbike. “Both vehicles have their weight concen-trated as centrally as possible, with the engine as close to the ground as it can go”, explains the Lamborghini test driver. Another shared interest is lightweight construction. “Our engi-neers fight for every gram”, says Alessandro. “In the Panigale, for example, the airbox doubles as part of the chassis.” Giorgio tells him of the Aventador’s carbon-fiber monocoque, which Lamborghini experts developed together with aircraft manu-facturer Boeing.
“Both vehicles have their weight concentrated as centrally as possible,
with the engine as close to the ground as it can go.”
g i o rg i o s a n n a , c h i E F t E st D r i v E r l a m B o rg h i n i
64

“This motorcycle works like a computer”, says Giorgio approv-ingly of the Ducati with its sophisticated electronic controls. Even the Panigale’s throttle is no longer mechanical – it is digi-tal, just like in an airplane. The engines of the sports car and the motorcycle both unite formidable power and vanguard technol-ogy with an incomparable sound. The strapping twelve-cylinder mid-engine has been a part of Lamborghini’s DNA since the legendary Miura. The exceptionally efficient two-cylinder engine, with four valves per cylinder and no valve springs, is an integral part of the Ducati legend. Looking ahead, both brands face the challenge of making their drivetrains even more efficient and lowering emissions even further, without compromising their original character – a task the companies’ engineers are now cooperating on.
The time has come for Giorgio and Alessandro to get going. There are some more test miles on their schedules for today. Would they ever swap vehicles for a test drive? It’s clear that the two professional drivers are itching to do just that. “Next time for sure.” After all, cooperation in the “Motor Valley” is set to become even closer in the future.
“Our engineers fight for every gram.”
a l E ss a n D ro va l i a , c h i E F t E st D r i v E r D U c at i
aU t h o r Dirk Maxeiner
p h o to g r a p h E r Peter Vann
a D D i t i o n a l i n F o r m at i o n www.ducati.com > Bikes > 1199 Panigale www.lamborghini.com > Models > Aventador
1 Lamborghini Aventador LP 700-4 515 kW, fuel consumption in l/100km: urban 24.7/ extra-urban 10.7/combined 16.0; CO2 emissions in g/km: combined 370.
65EXPERIENCE D[R] IVERSIT Y. Passione.

Bentley marries tradition and modernity, innovative technologies and impeccable craftsmanship. That is not
only true for the cars from Crewe, but also for the approximately 4,000 employees at the main production facility
in North West England. They are the people leading the brand into the future with passion and enormous
respect for its great heritage. Just like their fathers and grandfathers before them. Bentley is a family business –
with some families already in their fourth generation.
family Business.
66

t E a l E Fa m i ly – Julia Teale has brought with her an old newspaper cutting. A yellowed photo shows her grand-father at his send-off from Bentley. The year is 1961. Today, she is joined by her father Leslie, her sister Amanda and her nephew Dan. The 20-year-old completed his apprenticeship as a Junior Engineer at Bentley and now works in seat testing. He is fascinated: “Bentley brings
together seeming opposites – cutting-edge technology and impeccable crafts-manship. Experiencing this and helping to create this on a daily basis is the
most interesting job in the world.” 1 Leslie Teale (79) worked at the Crewe plant from 1950 to 1992. 2 Julia Teale (44) is responsible for Bentley’s apprenticeship program. 3 Engineer Dan Butler (20) works in seat testing. 4 Amanda Teale (47) coordinates factory visits.
2
1 3 4
67ExpEriEncE D[r] ivErsit y. Family Business.

c a m m Fa m i ly – “Not many girls can say they drive a Bentley every day.” 20-year-old Jessika Camm can. Conducting test drives on factory grounds is all part of the job for the electrical technician-in-training. She is looking forward to her future at Bentley, a “good future” as her father says. He has also witnessed hard times in the almost 40 years he has worked at
the Crewe plant. The turning point came in 1998. “The Volkswagen Group supported Bentley in everything that makes us so strong today –
from developing new, attractive models to creating efficient struc-tures and processes in development and production. We held on to the things that make Bentley so special – our uniqueness and great atten-tion to detail.” 1 Dave Camm (55) is a maintenance manager. 2 Jessika Camm (20) is an electrical craft apprentice.
21
68

cl i F F E Fa m i ly – “I once drove one of the Queen’s Bentleys. From one side of the hall to the other”, recounts Ken Cliffe with a chuckle. He started at Crewe as a precision engineering apprentice when he was 16. Today, he over-sees an engine production zone. The 55-year-old is happy to talk about his “calling” at Bentley. For example, how the engine for the Continental GT Speed1, with an
output of up to 625 PS, is manufactured and “not just assembled”. His sons Alex and Jon are listening; they nod unanimously. “They have Bentley blood in their veins”, says Ken of his sons. Even outside work, the com-pany is never far from their minds. “Bentley is like one big family”, says Alex. 1 Alex Cliffe (21) works in body shell production. 2 Jon Cliffe (28) is a tool-making and prototyping technician. 3 Ken Cliffe (55) is a zone manager on the Mulsanne engine line.
21 3
aU t h o r Tina Rumpelt p h o to g r a p h E r Hartmut Nägele a D D i t i o n a l i n F o r m at i o n www.bentleymotors.com
1 Bentley Continental GT Speed 460 kW, fuel consumption in l/100km: urban 22.4/extra-urban 9.9/combined 14.5; CO2 emissions in g/km: combined 338.
69EXPERIENCE D[R] IVERSIT Y. Family Business.

70

For one year, a camera filmed me and my life for the documentary “Gold – You can do more than you think”. Looking back on it all was emotionally exhausting. My accident in 1991, the diagnosis – paraplegia. The realization that nothing would be the same again. I relived everything. But today, I don’t see the day of my accident as the turning point in my life – that came eleven years later on the day I took the decision to return to competitive swimming. Despite my disability. Or perhaps I should say, because of my disability.
The first few meters in the pool were an emotional rollercoaster. It felt so good to compete in water again. But is this where I belong? With disabled people? One second I just wanted to get out of there, the next I felt better than I had in a long time.
I swam the second-best time. It was fantastic. I realized just how much I had missed competitive sport, which had been part of my life before the accident. I was suddenly alive again. Coming to terms with the fact that you have a handicap is one thing. But being proud and passionate about sport even though you have a disability is completely different. I learnt how to do this – very quickly, in fact – because our sport is no different from “normal”
sport. It is about people, not about their disabilities. It is about passion and achievement, the challenges and goals you set your-self and want to reach, whatever it takes. The more I trained, the better I felt. I won my first gold medal at the 2004 Paralympic Games in Athens. And more were to follow.
“Gold” starts in cinemas in February 2013. The film also fol-lows the careers of blind marathon runner Henry Wanyoike from Kenya and Australian wheelchair racer Kurt Fearnley. We are successful athletes with a handicap; we have won gold. We are happy with our lives. This is the message that unites us and that we want to tell the world. Life with a disability is not bad. Just different.
Seeing the person.
D E D i c a t i o n ⁄⁄ K i r s t E n B r U h n , 4 3 , F a s t E s t g E r m a n F E m a l E p a r a ly m p i c s W i m m E r
p h o to g r a p h E r Andreas Mühe
71ExpEriEncE D[r] ivErsit y. Snapshot.

The VW Bus is not just a vehicle. It’s a cult object – a legend on four wheels. And it has returned to its origins.
Since 1954, Volkswagen Buses have been built in Hanover: this is also where the VW Bus workshop is now
putting the shine back into vintage vehicles – and a smile on their owners’ faces.
The BuS.
72

The bus.ExpEriEncE D[r] ivErsit y. 73

“It’s back to its spick-and-span self ”, says a delighted Mario Petrusso. He runs his hand fondly over the shiny, polished Volkswagen emblem and the fine chrome headlamp rims of the 1950s vintage red and white V W Bus. The Volkswagen Commer-cial Vehicles workshop manager is adamant that visitors climb in and take a closer look at the interior with its cream seats and painted red dashboard. The T1 is so perfectly restored with original parts that it could have just rolled off the production line. “We put our heart into each and every detail of this car. We are all thrilled to see it here in the workshop, finished.”
T1? What sounds like an airport terminal is the official name of the first generation of VW Buses. It was launched over 60 years ago and rolled off the Hanover production line in its millions as a pick-up, delivery van and minibus from 1956. Now in its fifth generation, the all-rounder is today produced by Volkswagen Commercial Vehicles in Hanover.
Petrusso’s association with the V W Bus started in 1973 when he trained as a vehicle mechanic at Volkswagen. Exactly 35 years later, a separate classic vehicles division was established at Volkswagen Commercial Vehicles – in a way bringing the V W Bus back home. This was inspired not least by the first inter-national V W Bus meet at the Hanover Expo grounds in 2007. Over 8,000 buses and more than 60,000 fans turned up – including British rock band The Who, whose hit “The Magic Bus” is a testament to guitarist Pete Townsend’s love of the V W Bus. The V W Bus was and is a cult object – there is no doubt about that.
These days, the experts in Hanover look after over 100 working vehicles from the T1 to the T4. Craftsmanship is what is needed. “In the early days, we recreated a lot of things because we didn’t have the original parts.” They even reconstructed a large bull bar by hand based on a drawing. Vehicles that will be fully restored are completely disassembled, acid-washed, re-paneled –
with some panels fashioned by hand using a sheet metal press – immersed in a primer bath, sealed and powder-coated. An enor-mous amount of work. “A V W Bus restored in this way is as good as new and can be driven for another 40 to 50 years”, assures Petrusso.
The workshop team started by collecting and restoring the Group’s own classic vehicles. Since spring 2012, they have also been accepting the prized possessions of other V W Bus owners into their care. Today, customer orders come from as far away as Canada and Japan, closely followed by a shipping container with a V W Bus in need of restoration.
The workshop manager follows the progress of all of his charges carefully. “We photograph every step of the process. Every detail is documented”, explains the 55-year-old. When customers come to collect their vehicles, Petrusso presents them with compre-hensive records detailing each step of the restoration process.
Petrusso walks through the rows of V W Buses in every color and design, past meters and meters of well-stocked shelves of spare parts. Volkswagen Classic Parts in Wolfsburg supplies the V W Bus workshop with original parts. “We had to search high and low for some parts.” Such as new frames for the opening front windscreen on a Type 1 Deluxe Microbus. Petrusso eventually found one with a V W Bus collector in the USA , who promised to visit Hanover in the near future.
aU t h o r Jo Clahsen
p h o to g r a p h E r Kai-Uwe Knoth
a D D i t i o n a l i n F o r m at i o n www.volkswagen-commercial-vehicles.com
“A V W Bus restored in this way is as good as
new and can be driven for another 40 to 50 years.”
m a r i o p E t rU ss o, s E n i o r E x p E r t vo l K sWag E n co m m E rc i a l v E h i c l E s
74

1.8 millionv E h i cl E s of the T1 – the first VW Bus generation – were built between 1950 and 1967
7,000s Q Ua r E m E t E r s is the size of the new “VW Bus World” in Hanover
t h E v W B U s
75ExpEriEncE D[r] ivErsit y. The bus.


Can you measure corporate culture? You can certainly feel it. Like at Scania in Södertälje, Sweden, where the
commercial vehicle producer’s remarkably open atmosphere is based on its employees’ motivation and wealth
of ideas. An insight into an extraordinary workplace.
Culture manaGEmEnT.
Elin Engström puts on her thick jacket and lined gloves. It is cold in Södertälje, half an hour’s drive from Stockholm in Sweden. The 22-year-old is a truck driver for the “transport laboratory” at Scania’s headquarters. The young woman works in a team with four other colleagues responsible for delivering goods to the Swedish truck and bus manufacturer’s European plants. She also tests out new technologies in real working conditions along the way. “We try out a lot here”, says Engström, “sometimes it’s a new driver assistance system, sometimes it’s new technology to reduce fuel consumption. Or f leet management systems, which our customers use to maximize the capacity utilization of their vehicles.”
Before working at Scania, Elin Engström hauled dangerous goods. “It’s not easy to be taken seriously as a woman in the transportation industry. That’s not an issue at Scania. My col-leagues accepted and supported me from the start.” The small
team regularly analyzes the results of their trips together with the development department. “Our suggestions are welcomed – and are incorporated into the development of new vehicles and services.”
Engström is one of 35,000 employees worldwide who benefit from Scania’s exceptional corporate culture. One of the company’s three core values is “respect for the individual”. This is not just written on large boards all around the facility – it is tangible. “Our employees are the basis for the success of our company. That’s why we invest in their expertise and in a positive working environment”, says Kent Conradson, Head of Human Resources. “Scania stands for f lat hierarchies, a great deal of teamwork and a vibrant, open culture of dialog. Perhaps this is typically Swedish. In any case, it ensures that we have a highly motivated team.”
77ExpEriEncE D[r] ivErsit y. Culture management.

“Our employees are the basis for the success of our company.
That’s why we invest in their expertise and in a positive working environment.”
K E n t co n r a D s o n , h E a D o F h U m a n r E s o U rc E s at s c a n i a
A glimpse into Conradson’s office is all it takes to reveal that some things are different at Scania. The 54-year-old shares the open-plan office with parquet f looring and oil paintings on the wall with his seven executive board colleagues. Conradson, who started at Scania 33 years ago as a young engineer, speaks much of the “cooperative leadership” in his company: “We want every employee to take responsibility, concentrate on the details and at the same time, understand the big picture. Everyone should focus on the here and now, but also have the future of the com-pany in sight.”
While “soft” factors are a key emphasis at Scania, the company has also developed tools to measure well-being such as the SHE – or safety, health and environment – standard. Scania collects and analyzes key figures on attendance or employee turnover. This data is used to understand the causes of absence from work or for changing to a different employer, and to identify improvements. Conradson is proud of what has been achieved so far. “We have a high attendance rate, for example, with workplace attendance surpassing 96 percent, and a high level of loyalty to the company – the average length of service is currently twelve years.”
Production is dominated by the spirit of lean manufacturing. The Scania production system tracks the ongoing improvement of products and processes. “It’s important to get to the root of problems”, says Conradson. “That is the only way we can elimi-nate them.” You need dedicated, motivated employees for this, explains the Head of Human Resources.
One of them is Daniel Dyrenius. The 22-year-old is responsible for a team of four in assembly that mounts attachment brackets onto truck frames. “Functional inspectors should not be the first to notice discrepancies. Our goal is to keep on getting better by discovering these ourselves”, says the young man in the orange Scania T-shirt. Workf low standards are not just dictated by production engineers. “We discuss these in our team meetings and fine-tune them ourselves. The company has a lot of faith and confidence in us”, explains Dyrenius. He brings a folder out of the cupboard that illustrates each step of the process. “This shows why we mount components in this particular way. We as a team are reminded what we are doing and why – time and again.”
Dyrenius completed his technical school-leaving certificate at the company’s own college. His brother also works at the Södertälje plant. “Scania is a good, secure employer”, says the young man on the reason for his choice. In the evening, he attends continuing professional development courses offered by the commercial vehicle producer for particularly committed employees.
Scania supports its employees, encourages exchange between all staff levels, and offers a wide choice of career paths. Anna Pernestål is a good example of this. The 34-year-old was named “Technical Woman of the Year 2011” – a prestigious award for female Swedish engineers. She started at Scania as a trainee after university, writing her diploma thesis with the support of
78

79ExpEriEncE D[r] ivErsit y. Culture management.

80

the company. Today, the physical engineer works in customer service on ideas to further improve workshops and their diag-nostic instruments and repair equipment.
Pernestål is responsible for “preventive maintenance”. “Starter batteries only used to be changed when they failed. This often meant longer downtimes. Now, we make sure that trucks stay on the road with well-timed maintenance intervals. Our ideas help the customer save money.”
The young engineer talks of the increasing complexity of tasks in the transportation sector, rising cost pressures and growing vehicle f leets. She finds the transportation industry fascinating, and not just from a technical point of view. “Environmentally compatible mobility and transportation are becoming more and more important in a global world. Providing the right equip-ment for our customers to achieve this is motivating.”
Anna Pernestål, Elin Engström and Daniel Dyrenius work in different areas on completely different tasks. Yet they all say the same thing independently of each other: “Here, we always have the feeling that anyone can get ahead if they want to.” Typically Scania.
aU t h o r Marc-Stefan Andres
p h o to g r a p h E r Andreas Mader
a D D i t i o n a l i n F o r m at i o n www.scania.com > Scania Group > Strategies
cl o s E - K n i t D i s cU ss i o n – Kent Conradson, Head of Human Resources (second from left), and his team.
81ExpEriEncE D[r] ivErsit y. Culture management.

The TranSformaTion.
The practical ŠKODA Fabia1 has won many hearts in the small car segment since it was launched over twelve
years ago. Since 2009, it has also been a fixture in the international rally scene. At the motorsport workshop in
Mladá Boleslav, the Fabia is being transformed into a high-performance machine.
82

83ExpEriEncE D[r] ivErsit y. The transformation.

Jan Kopecký’s face is alive with anticipation. On the hydraulic lift behind him, his “workhorse” for the coming year – a ŠKODA Fabia Super 2000 – is being primed for action. “You know, I always wanted to be a Formula One driver when I was a kid. I was suc-cessful enough, but the money just wasn’t there”, he recalls. In 2001, he tried his hand at driving a rally car for the first time: “After that, I never wanted to go back to racing on the circuit, going around the same bends again and again.” The Czech driver is currently paying a visit to the ŠKODA motorsport workshop, his tall frame allowing him to peer over the mechanics’ shoulders. Kopecký chats and jokes with the workshop team in a relaxed atmosphere.
Although he is one of the most popular rally drivers in the Czech Republic, his feet have remained firmly on the ground. The races are held on closed-off tracks where spectators can get far closer to their favorite drivers than they can at traditional racetracks. The teams race against the clock and the tough track conditions. Faced with slippery tracks or rough gravel trails, rally drivers are forced to improvise at every turn. It is not uncommon for the top stars to cover up to 250 kilometers in time trials on a single weekend with just a few seconds between them when they cross the finishing line. Start crashes and spectacular overtaking maneuvers have no place in rally driving. Nonetheless, this rustic motorsport form is more popular than Formula One in
many countries, including the Czech Republic. This is due in no small part to Jan Kopecký, whose career is inextricably linked with the ŠKODA brand. At the tender age of 22, he was the youngest national rally champion ever. Since 2008, Kopecký – now 31 years of age – has been the official test driver for the ŠKODA motorsport team. Motorsport has been a permanent fixture at ŠKODA ever since the brand’s earliest days – first on two wheels and then, since 1906, on four as well. By the 1930s, ŠKODA was already taking part in the legendary Monte Carlo Rally.
However, ŠKODA’s motorsport department also caters for the needs of customer teams. Over the past four years, the specialists at Mladá Boleslav have delivered more than 40 rally Fabias to customers with racing ambitions. In 2012, ŠKODA drivers were on the podium in 13 national championships, winning a total of six national titles in the Czech Republic, Germany and elsewhere.The life of a rally Fabia begins, just like that of any other ŠKODA, on the production line at Mladá Boleslav. However, a normal series-produced car would not be able to withstand the rigors of rally racing for more than a few kilometers. This means that rally models need to be strengthened and modified. The first step is to fit a stable roll cage to protect the driver and co-driver in the event of an accident. After that, it all comes down to technology. The special rally suspension was developed
a W i n n i n g t E a m – 2012 was the ŠKODA Team’s most successful year to date – they won all the major international rally events.
84

by ŠKODA engineers, as were many other individual components that transform the compact small car into an all-wheel drive super sports car. A number of parts, such as special brakes or lightweight components for rally cars, are sourced from spe-cialist suppliers.
Beneath the Super 2000’s bonnet, a modified two-liter four-valve engine packs a powerful punch with 203 kW (276 PS). The engine block and cylinder head are the same as in the produc-tion models. The ra lly Fabia’s doors and bonnet are made of ultra-light carbon fiber materials – as are the powerful wing extensions. However, in spite of its “chubby cheeks” and various aprons and spoilers, the sports racer is still instantly recog-nizable as a Fabia. “This is a deliberate move”, says Michal Hrabánek, who has been at the helm of the motorsport depart-ment since 2007, “after all, our racing cars are ambassadors for the ŠKODA brand”. Hrabánek has a team of some 80 people working under him. As he explains: “We have the highest expec-tations as regards the performance of our vehicles and the use of innovative technology, but also with regard to the cars’ robust-ness in the rough-and-tumble of rally racing. This allows us to learn a lot that we can take on board for our series production.” The motorsport head sought out specialists from Slovakia, Germany, Austria, Italy, France and the U K for his team. As he puts it: “To be successful in a globalized world, you need to think
internationally.” Today, Juho Hänninen and his co-driver Mikko Markkula have arrived from Finland and are paying a f lying visit to Mladá Boleslav. In September 2012, the duo won the European Ra lly Championship with a Fabia Super 2000. Hänninen is full of praise for the motorsport team: “In the last 50 rallies, I didn’t once drop out owing to a technical fault.” Hrabánek is also justly proud of his team of mechanics: “We see our work not only as a job, but also as a passion.” The mechanics travel all over the world with their teams, frequently spending more time on tour than at home.
At this point, all that is missing on Kopecký’s car are the wheel suspensions. The suspension screws are lined up neatly on the shelf like tin soldiers. Throughout the well-lit, friendly work-shop, everything is in perfect order. In fact, the only clutter is to be found in the trophy cabinet, a problem that, as Hrábanek declares with a laugh, “gladdens my heart every day”.
“In the rough-and-tumble of rally racing we learn a lot for our series production.”
m i c h a l h r a B Á n E K , h E a D o F Š Ko Da m o to r s p o r t
aU t h o r Markus Stier
p h o to g r a p h E r Andreas Mader
a D D i t i o n a l i n F o r m at i o n www.skoda-auto.com > Motorsport
1 ŠKODA Fabia fuel consumption in l/100 km: combined from 6.2 to 3.4; CO2 emissions in g/km: combined from 148 to 89.
85ExpEriEncE D[r] ivErsit y. The transformation.

o n!o n!Power
86

Abu Dhabi is the site of the first solar thermal power plant ever to be built
on the Arabian Peninsula. In the near future, the facility is expected to
produce electricity for more than 20,000 households – environmentally
friendly energy courtesy of the sun. The heart of the operation: a MAN
steam turbine.
o n!87ExpEriEncE D[r] ivErsit y. Power ON!

We are just outside the small town of Madinat Zayed. It would be 55 degrees in the shade if there were anything to offer shade – but there are no buildings or trees for miles around and not a cloud in the sky. Ideal conditions for harnessing the sun’s energy. Here, 150 kilometers southeast of Abu Dhabi, the sun shines with full force for more than 3,000 hours a year, com-pared with 900 to 1,100 in the various regions of Germany.
Anyone who thinks that solar cells are being used here in the desert should stop and think again. The “Shams” power plant (Arabic for “sun”) uses an innovative technology called solar thermal energy, which is ideal for regions with intense sun-shine. The sun’s rays are captured using mirrors and – like a magnifying glass – focused on a single point, which heats up to a high temperature. A total of 260,000 of these half-cylinder mirrors are used in the Shams plant, where they are spread over an area measuring two square kilometers. Glass tubes are positioned at the exact burning point of the mirrors; these are filled with a special oil that is heated to almost 400 degrees by
the sun’s rays. The oil f lows through a heat exchanger in which specially prepared water is vaporized. This steam then expands in a turbine to two thousand times its original volume and drives the turbine – a similar process to the one used in coal power plants.
In the middle of the desert, the turbine – as tall as two men and longer than a heavy duty truck – generates electricity for 20,000 households. The turbine comes from Germany, from the M A N Diesel & Turbo plant in Oberhausen. Although M A N is known first and foremost as a manufacturer of commercial vehicles, large-bore diesel engines for ships or power plants and com-pressors and turbines account for around 20 percent of its sales revenue worldwide. “Solar thermal power plants are just one of many different ways in which turbo machinery can be used”, explains Thomas Witt, who is in charge of large-scale customer projects at M A N. “The market for solar thermal energy is ex-tremely promising. We have already secured a large number of orders in this area. Several facilities we worked on have already
“The market for solar thermal energy is extremely promising.
We have already secured a large number of orders in this area.”
t h o m a s W i t t, p ro J E c t m a n ag E r m a n D i E s E l & t U r B o
88

gone into operation – in Spain, for example.” Every year, as part of its broad product range, the company sells between 30 and 40 of these machines – each of which costs several million euros – for generating electricity and also for use as mechanical drives in large compressors, etc.
MA N turbines are custom-built for each application and are based on a modular system. The turbine is the core of the power plant and must be adapted exactly to the plant’s f low conditions. For instance, the design of the steam-driven paddles must be calculated separately for each individual machine. In the case of the Shams power plant, a special insulation layer was also required. This is because it is extremely cold in the Arabian desert at night, when the turbine is not in operation; without heat insulation, the turbine would take too long to reach the required temperature when it goes into operation again in the morning. In the case of large turbines, it can take several months from ordering to shipping. For project manager Thomas Witt, supplying the product itself is only part of the work – he also
oversees the transport, on-site installation and the commis-sioning process. The first tests are scheduled to take place in spring 2013. If all goes according to plan, the power plant will save 175,000 tonnes of carbon dioxide every year. And then Thomas Witt will have to bid adieu to his “baby”, as he affec-tionately calls his turbine. However, with new orders coming in not just from the Arab region, but also from China, India, South Africa and other sun-baked regions, that is something that he will just have to get used to.
aU t h o r Johannes Winterhagen
p h o to g r a p h s Shams Power Company; Jorge Ferrari
a D D i t i o n a l i n F o r m at i o n www.mandieselturbo.com
s h a m s s o l a r F i E l D 1
125 mW g ro ss o U t pU t
is generated by the MAN steam turbine
89ExpEriEncE D[r] ivErsit y. Power ON!

90

“Doing something yourself is motivating”, agree Débora, Iván and Javier. They are among the first trainees in
Spain to benefit from the introduction of the dual system of vocational training and education at SEAT. The
combination of theory and practice has many advantages – and not just for the young people in the company.
TakingrESponSiBiliTy.
91EXPERIENCE D[R] IVERSIT Y. Taking responsibility.

Iván Vendrell quickly crosses the workshop at the SE AT voca-tional school in Martorell. He is off to meet Javier Sánchez. The two have arranged to go to class together. In the hall next door, Débora Ocaña stands in front of the machine tool she has just programmed, tracking the machine’s movements and making notes. “Perfect. Exactly how I wanted it to work.” The spark in her eyes shows just how pleased she is. You only need to watch Débora, Iván and Javier on this completely ordinary Wednesday morning to see the pleasure and passion they bring to their work. They are proud to be learning their trade at SE AT.
This applies in particular to 16-year-old Iván, who is training to be a motor vehicle mechatronics technician. He is one of the first young people to have started a German-style dual voca-tional traineeship at SE AT. The carmaker is the first major com-pany in Spain to have introduced this successful model, which combines theory and plenty of practice. In the past, the standard three-year vocational traineeship at SE AT included 600 hours
of practical instruction. Now, training involves 1,700 hours of work at the company. This allows Iván and the other trainees to gain experience in their future careers at an early stage.
SE AT ’s new program also gives trainees more time to try things out – and that is motivating. Electronics technician trainee Débora is fascinated by the technology involved in automobile production today. She likes to tinker and wants to know exactly how everything works. “Although I know in theory how robotic welding works, I only really understood it here on the shop floor.”
Iván, too, is most at home in the workshop. He proudly points out the small metal stairs he milled in the third week of his trainee-ship. They are a testament to the meticulousness and dedication with which Iván is preparing for his career. He approaches his second great passion – breakdancing – in the same way. Each step, each turn has to be perfect. He regularly meets friends after work to learn new moves and styles.
E ach st E p, E ach t U r n h a s to B E pE r F Ec t – Iván Vendrell breakdances regularly with friends. He applies the same passion and commitment to his hobby as to his vocational training as a motor vehicle mechatronics technician at SEAT.
92

“Although I know in theory how robotic welding
works, I only really understood it here on the shop f loor.”
D É B o r a o c a Ñ a , t r a i n E E i n s E at ’ s D Ua l s yst E m
93EXPERIENCE D[R] IVERSIT Y. Taking responsibility.

o U t a n D a B o U t W i t h F r i E n D s i n Ba rcE l o n a’ s o l D ci t y – Javier Sánchez is training to become an industrial and tools mechanic. SEAT is his future. “We learn faster because we specialize earlier than other trainees – that is an unbeatable advantage in the working world.”
94
Many of his friends wish they had a traineeship like Iván’s. Spain has the second-highest youth unemployment rate in Europe. The Spanish government is supporting the new training model by allowing the vocational trainees to be integrated into business operations. This was previously not possible – students at voca-tional schools could only gain on-the-job experience in the form of internships. Today, SE AT ’s vocational trainees create special parts for models, for example.
For SE AT and the Volkswagen Group, sound qualifications are first and foremost an investment in competitiveness. That is why the carmaker is exporting the dual vocational training and education system to all of its locations around the world – China, India and the USA will join the twelve European countries that have already rolled out the program. At SE AT in Spain, a total of 146 young people started their traineeship under the new pro-gram in fall 2012.
For Débora and Javier, memories of their first exciting days as trainees are not quite as fresh. Débora – a confident 21-year-old – is already in her second traineeship year and about to start work on the plant’s production line. Since she is slightly nervous about her first hands-on deployment, she is glad to have the guidance and support of a mentor, like all trainees at SE AT.
19-year-old Javier values the extra time the new training pro-gram gives him with the automated milling machine. He will complete his traineeship as an industrial and tools mechanic this year. He sometimes gives going out with friends in Barcelona’s old town a miss for the chance to learn more. SE AT is his future. “We learn faster because we specialize earlier than other train-ees – that is an unbeatable advantage in the working world.”
The smart young man brings with him technical experience from home. His father runs a small machine shop and taught him how to handle tools as a boy. These days, though, it is Javier giving his father tips and talking shop with him about tool qual-ity – and sometimes even helping out in purchasing. Thanks to his vocational trainee’s salary he can contribute to the family budget. The introduction of the dual training and education sys-tem also saw the adoption of a graduated pay scale, as is common in Germany. That is another first in Spain.
SE AT plans to offer all vocational trainees who successfully complete the program a permanent position with the company. “The dual vocational training and education system is a real boon for us. The close link between theory and hands-on practice ensures that our future employees have a high level of expertise”, says Manuel Moreno, who is responsible for training and voca-tional education at SE AT Human Resources. But it’s not just SE AT that benefits – qualified vocational training for its young people ultimately also strengthens Spain’s industry as a whole.
aU t h o r Julia Macher
p h o to g r a p h E r Andreas Mader
a D D i t i o n a l i n F o r m at i o n www.seat.com
1,700h o U r s of hands-on experience in the company are included in the three-year curriculum
146yo U n g pE o pl E are currently undertaking dual vocational training at SEAT
95EXPERIENCE D[R] IVERSIT Y. Taking responsibility.

Once the saddle has been screwed on tightly, the small purple bicycle is good to go. For the last hour or so, manager Joanna Sherry and her team have been busying themselves with Allen wrenches and pliers and she is now carrying out a final check to make sure that everything is safe and secure. For Sherry and her 130 colleagues from VCI, assembling bicycles is a far cry from their everyday work; in fact, they even interrupted their annual management get-together in Phoenix, Arizona, specially for the project.
As the teams put the finishing touches to their handiwork, a swarm of children is gathering outside. Here, a total of 23,000 people live on the land of their Native American ancestors. Andrew Stuart, Chief Executive Officer and President of VCI, has no wish to keep the 24 girls and boys on tenterhooks – the bikes are now theirs to take home. Bursting with excitement, all the chil-dren want to do now is get on the bikes and ride. As this is the first time that many of the six- to nine-year-olds have owned a bicycle, it goes without saying they need an occasional helping hand to keep their balance on two wheels.
“The fact that we are involved in activities like these during the most important management event of the year shows how much we care about helping our community”, declares Stuart. “Here in the USA , we are not just a business partner and employer but also see ourselves as part of society – as a good neighbor and a good corporate citizen.”
Eight-year-old Aaliyah can scarcely believe her luck as she care-fully reaches for the handlebars: “Is this bike really for me?” One year her senior, Marco is already up on the saddle and riding about, beaming from ear to ear. “With our bicycle project, we want to show kids that exercise and healthy living can also be a lot of fun”, explains Stuart.
This is just one of a great many projects in which the Volkswagen Group is involved. Volkswagen Group of America finances large nationwide campaigns through its own foundation and together with partner organizations. For instance, the Volkswagen of
What better than 24 smiling children’s faces to show that a gift has well and truly hit the spot? Today, the employees
at financial services provider Volkswagen Credit Inc. (VCI) have set aside their strategy papers and business plans
in favor of wrenches and elbow grease – assembling new bicycles for children in the Gila River Indian Community in
Arizona. This is just one of the many examples illustrating the Volkswagen Group’s social involvement.
Working for the
nEiGhBorhooD.
96

aU t h o r Tina Rumpelt
a D D i t i o n a l i n F o r m at i o n www.vwfsag.com
America Foundation donated half a million dollars towards the reconstruction efforts following Hurricane Sandy in fall 2012.
VCI prefers to focus on a wide range of small-scale activities. “We help out in places where we are based, where we work and where our employees live”, says Andrew Stuart. In addition to its headquarters in Herndon, Virginia, the company has eight dif-ferent locations in the USA .
Andrew Stuart cites various examples of the company’s nation-wide activities: employees undertaking voluntary work for envi-ronmental organizations, organizing charity events and making donations to aid programs, particularly those aimed at helping young people. For instance, VCI puts its weight behind founda-tions researching cancer and diabetes among small children, but also behind school and sports programs.
With a workforce of some 1,100 people, VCI is the Volkswagen Group’s largest financial services company outside Germany. It currently manages over a million leasing and financing agreements, a figure that is rising by the day – not least since the Volkswagen Passat, which is built at the new plant in Chattanooga, Tennessee, was voted Car of the Year 2012 in the USA . “90 per-cent of US car buyers either lease or finance their vehicles”, explains Stuart, who is clearly optimistic about the future, “and we will continue to grow – and to increase our commitment to society at the same time”.
Aaliyah has since got the better of her initial apprehension and is pedaling her new bicycle cautiously as Joanna Sherry holds onto her shoulders. After a few meters, the little girl stops and looks up at her: “Can Volkswagen build a bike for my brother, too?”
97ExpEriEncE D[r] ivErsit y. Working for the neighborhood.

98

Pure beauty and grandeur.
It’s as though it were only yesterday – an encounter in Berlin in the summer of 2009 that was to add a completely new dimension to my perception of what is commonly known as a “supercar”.
At first, I only saw the mass of people pressed against the win-dow of the store on that famous street called “Unter den Linden”. I pushed through the crowd and saw an object that captivated me right then and there – the exceptional, perfectly captured in physical form. Beauty and grandeur fashioned in aluminum and carbon. 1001 PS, 16 cylinders, four turbochargers, a top speed of over 400 km/h. Breathtaking.
Two years later, Bugatti approached me with the idea of designing an “automobile artwork”. My first encounter with the Bugatti Veyron immediately came to mind. The task of adding some-thing to this perfect design seemed impossible – after all, you don’t add paint to a Michelangelo sculpture!
But then I was struck by the idea of reproducing the Veyron’s construction plans on its body. It appealed to my interest in equations and scientific formulas. I saw this unusual artistic challenge as the manifestation of my extraordinary fascination
for this car. All of my sculptures and paintings refer to nothing but the piece itself. Just like the Bugatti Veyron.
Working together with the Bugatti team, I experienced their extremely high standards first-hand. I saw the kind of commit-ment and the kind of technical expertise needed to reproduce mathematical formulas on the body of a car. These formulas were continued in the interior as embroidery. The result was like an haute couture creation.
Ultimately, my first encounter with the Bugatti Veyron in Berlin gave me the courage to totally immerse myself in this artistic experiment. This encounter was only a brief moment in my life. What it led to was a fascination – a personal passion even – for Bugatti.
D E D i c a t i o n ⁄⁄ B E r n a r v E n E t , 7 1 , F r E n c h s c U l p t o r
p h o to g r a p h E r Andreas Mühe
99EXPERIENCE D[R] IVERSIT Y. Snapshot.


The Volkswagen Group increased unit sales in 2012 by 11.8% year-on-year, to 9,344,559 vehicles worldwide. We recorded the highest growth rates in the markets of North America (+32.2%) and the Asia-Pacific region (+19.5%).
Divisions
EuropE/rEm aining m arkEts
asia-pacific
north a mErica
south a mErica
Div
isio
ns
U n i t sa l es by m a r k e t, 2 0 12 vs . 2 0 11 (as percent)
+19.5
+2.8 +32.2
+13.9

D i v i si o n s
104 BrandsandBusinessFields
106 VolkswagenPassengerCars
108 Audi
110 ŠkodA
112 SEAT
114 Bentley
116 Porsche
118 VolkswagenCommercialVehicles
120 Scania
122 MAN
124 VolkswagenGroupinChina
126 VolkswagenFinancialServices

VO L K S WA G E N G R O U PVO L K S WA G E N G R O U P
F I N A N C I A L S E R V I C E S D I V I S I O NF I N A N C I A L S E R V I C E S D I V I S I O NAU T O M O T I V E D I V I S I O NAU T O M O T I V E D I V I S I O N
D E A L E R A N D C U S T O M E RD E A L E R A N D C U S T O M E R
F I N A N C I N GF I N A N C I N G
L E A S I N GL E A S I N G
D I R E C T B A N KD I R E C T B A N K
I N S U R A N C E I N S U R A N C E
F L E E T B U S I N E S SF L E E T B U S I N E S S
M O B I L I T Y O F F E R I N G SM O B I L I T Y O F F E R I N G S

104
GROU P STRUCTU RE
As of August 1, 2012, Porsche SE’s operating automotive
business was contributed in full to the Volkswagen Group.
Since then, Porsche has been consolidated in the Group as
another successful brand. AUDI AG acquired Italian sports
motorcycle manufacturer Ducati as of July 19, 2012. Ducati
is a well-known international manufacturer of premium
motorcycles.
The Volkswagen Group consists of two divisions: the
Automotive Division and the Financial Services Division.
The Automotive Division, in turn, comprises two business
areas: “Passenger Cars and Light Commercial Vehicles”
and “Trucks and Buses, Power Engineering”. The Passen-
ger Cars and Light Commercial Vehicles segment and the
reconciliation are combined to form the Passenger Cars
and Light Commercial Vehicles Business Area. We report
on the Trucks and Buses and Power Engineering segments
under the Trucks and Buses, Power Engineering Business
Area. The activities of the Automotive Division are centered
on the development of vehicles and engines, the production
and sale of passenger cars, commercial vehicles, trucks
and buses, as well as the genuine parts, large-bore diesel
engines, turbomachinery, special gear units, propulsion
components and testing systems businesses. The acqui-
sition of Ducati has expanded this to include motorcycles.
The Financial Services Division, which corresponds to the
Financial Services segment, combines dealer and customer
financing, leasing, banking and insurance activities, fleet
management and mobility offerings.
In this chapter, we present the key volume and finan-
cial data relating to the Group brands and to Volkswagen
Financial Services. Owing to the ongoing positive develop-
ment of our business in China and the continuing growth
in the importance of the Chinese market, we also report on
business developments and the results of our activities in
China in this chapter.
The production figures and deliveries to customers are
presented by product line. Unit sales figures refer to
models sold by the various brand companies, including
vehicles of other Group brands. There are sometimes
marked differences between delivery figures and unit sales
as a result of the positive growth of our business in China.
In addition, we explain unit sales and sales revenue in
our markets: Europe/Remaining markets, North America,
South America and Asia-Pacific.
KEY FIGU RES BY M ARKET
The Volkswagen Group turned in a positive performance in
fiscal year 2012 despite difficult conditions, increasing
unit sales by 11.8% year-on-year to 9.3 million vehicles.
Sales revenue rose by 20.9% to €192.7 billion.
In the Europe/Remaining markets region, Group unit
sales increased by 2.8% to 4.2 million vehicles in the
reporting period. Sales revenue increased by 11.1% to
€115.4 billion, primarily due to volume-related factors and
the consolidation of Porsche and MAN.
With an increase of 32.2% to 0.9 million units, the
Group again outperformed the market as a whole in North
America. Volume improvements, the integration of Porsche
and favorable exchange rates lifted sales revenue by 42.7%
to €25.0 billion.
VOLKSWAGEN GROU P
Division A U T O M O T I V E F I N A N C IA L S ERV I C E S
Brand/
Business Field
Volkswagen
Passenger
Cars
Audi ŠKODA SEAT Bentley Porsche Volkswagen
Commercial
Vehicles
Scania MAN Other Dealer and customer
financing
Leasing
Direct bank
Insurance
Fleet business
Mobility offerings
Brands and Business Fields Successful performance amid difficult conditions

105DIVISIONS
Brands and Business Fields Volkswagen Passenger Cars Audi ŠKODA SEAT Bentley Porsche Volkswagen Commercial Vehicles Scania MAN China Volkswagen Financial Services
In South America, sales rose by 13.9% to 1.1 million
vehicles. As a result of volume-related and exchange rate
factors, sales revenue was up 22.8% to €18.3 billion. The
inclusion in full of MAN as from November 9, 2011 should
be taken into account when comparing the previous year’s
figures.
Demand for Group models remained strong on the
markets in the Asia-Pacific region. Including the Chinese
joint ventures, we sold a total of 3.2 million vehicles in this
area in the period from January to December 2012, 19.5%
more than in 2011. Sales revenue rose by a dispro-
portionately high 47.7% to €33.9 billion, mainly due to
positive mix and exchange rate effects. These figures do
not include the sales revenue generated by our Chinese
joint ventures, since these are accounted for using the
equity method.
KEY FIGU RES BY BRAN D AN D BUSI N ESS F I ELD 1
V E H I C L E S A L E S S A L E S R E V E N U E
S A L E S T O T H I R D
PA R T I E S O P E R AT I N G P R O F I T
thousand vehicles/€ million 2012 2011 2012 2011 2012 2011 2012 2011
Volkswagen Passenger Cars 4,850 4,450 103,942 94,690 77,110 71,504 3,640 3,796
Audi 1,299 1,543 48,771 44,096 33,461 30,496 5,380 5,348
ŠKODA 727 690 10,438 10,266 5,633 6,212 712 743
SEAT 429 362 6,485 5,393 2,785 3,284 –156 –225
Bentley 9 7 1,453 1,119 1,274 1,060 100 8
Porsche2 62 – 5,879 – 5,442 – 946 –
Volkswagen Commercial Vehicles 437 441 9,450 8,985 4,920 5,199 421 449
Scania2 67 80 9,314 10,064 9,314 10,064 930 1,372
MAN2 134 25 15,999 2,652 15,900 2,652 808 193
VW China3 2,609 2,201 – – – – – –
Other4 –1,279 –1,438 –36,929 –33,768 20,516 14,474 –2,6825 –1,6175
Volkswagen Financial Services – – 17,872 15,840 16,322 14,392 1,410 1,203
Volkswagen Group 9,345 8,361 192,676 159,337 192,676 159,337 11,510 11,271
Automotive Division 9,345 8,361 172,822 142,092 174,525 143,620 9,923 9,973
of which: Passenger Cars and
Light Commercial Vehicles
Business Area 9,143 8,256 148,021 129,706 150,042 131,428 9,405 9,042
Trucks and Buses, Power
Engineering Business Area 202 105 24,801 12,386 24,483 12,192 519 931
Financial Services Division – – 19,854 17,244 18,151 15,717 1,586 1,298
1 All figures shown are rounded, so minor discrepancies may arise from addition of these amounts.
2 Including financial services; Porsche as from August 1, 2012; MAN as from November 9, 2011.
3 The sales revenue and operating profit of the joint venture companies in China are not included in the figures for the Group. The Chinese companies are accounted
for using the equity method and recorded an operating profit (proportionate) of €3,678 million (€2,616 million).
4 Including Porsche Holding Salzburg as from March 1, 2011.
5 Mainly intragroup items recognized in profit or loss, in particular from the elimination of intercompany profits; the figure includes depreciation and amortization of
identifiable assets as part of the purchase price allocation for Scania, Porsche Holding Salzburg, MAN and Porsche.
KEY FIGU RES BY MARKET
V E H I C L E S A L E S 1 S A L E S R E V E N U E
thousand vehicles/€ million 2012 2011 2012 2011
Europe/Remaining markets 4,179 4,066 115,384 103,890
North America 896 678 25,046 17,553
South America 1,075 943 18,311 14,910
Asia-Pacific2 3,194 2,674 33,936 22,983
Volkswagen Group2 9,345 8,361 192,676 159,337
1 All figures shown are rounded, so minor discrepancies may arise from addition of these amounts.
2 The sales revenue of the joint venture companies in China is not included in the figures for the Group and the Asia-Pacific market.

106
VOLKSWAGEN PASSENGER CARS BRAND 2012 2011 %
Deliveries (thousand units) 5,738 5,091 +12.7
Vehicle sales 4,850 4,450 +9.0
Production 5,772 5,272 +9.5
Sales revenue (€ million) 103,942 94,690 +9.8
Operating profit 3,640 3,796 –4.1
as % of sales revenue 3.5 4.0
BUSIN ESS DEVELOPMENT
The most important event for the Volkswagen Passenger Cars
brand in fiscal year 2012 was the market launch of the
seventh generation of the Golf. The new model is considerably
lighter than its predecessor, despite being slightly larger
and better equipped. A large number of assistance systems
for greater comfort and safety round off the package. The
brand also started selling the natural gas-fueled eco up!.
Its low consumption levels and CO2 emissions make it the
overall 2012/2013 winner in the environmental vehicle
list published by Verkehrsclub Deutschland (VCD), the
German association for sustainable mobility. In addition,
the third generation of the Beetle Convertible celebrated
its world premiere at the end of the year.
The Volkswagen Passenger Cars brand ended 2012
with deliveries at a new all-time high: at 5.7 million
vehicles, it delivered 12.7% more cars than in 2011. The
brand recorded particularly high growth rates in Russia
(+39.6%), the USA (+35.1%) and China (+24.8%).
Unit sales by the Volkswagen Passenger Cars brand
were up 9.0% year-on-year to 4.9 million vehicles in the
reporting period. There was strong demand in particular for
the Touareg, Tiguan, Golf Cabriolet and Fox models, as well
as for the US version of the Passat. The new Golf, up! and
Beetle models also met with a positive market reception.
The difference between deliveries and unit sales is
primarily due to the fact that the vehicle-producing joint
ventures in China are not counted as Volkswagen Passenger
Cars brand companies.
Volkswagen Passenger Cars brand Bestseller relaunched – the new Golf
The Volkswagen Passenger Cars brand unveiled the seventh generation of its bestseller
– the new Golf – in fiscal year 2012. The eco up!, which was also launched on the
market, took pole position in Verkehrsclub Deutschland’s environmental vehicle list.
Despite the challenging environment, the brand achieved a new sales record.
up!
VII SEVENTH GENERATION OF THE GOLF

107
Brands and Business Fields Volkswagen Passenger Cars Audi ŠKODA SEAT Bentley Porsche Volkswagen Commercial Vehicles Scania MAN China Volkswagen Financial Services
DIVISIONS
The Volkswagen Passenger Cars brand increased its
production by 9.5% to 5.8 million vehicles in fiscal year
2012; apart from the new production facilities, the plants
in Mexico and Slovakia recorded the highest growth rates.
SALES REVENUE AN D EARN INGS
The Volkswagen Passenger Cars brand generated sales
revenue of €103.9 billion in fiscal 2012, an increase of 9.8%
year-on-year that was due mainly to increased volumes.
Operating profit amounted to €3.6 billion (€3.8 billion). It
was impacted by upfront expenditures for the Modular
Transverse Toolkit and startup costs for the new Golf. The
operating return on sales was 3.5% (4.0%).
Our success in 2012 has allowed us to make further
significant progress towards achieving our Strategy 2018
objectives, i.e. to increase worldwide sales to 6.6 million
vehicles per year in approximately six years and to lift our
global market share to 9%.
F U RTH E R I N F OR M AT I O N www.volkswagen.com
PRODUCTION
Units 2012 2011
Passat/Santana 1,309,618 1,148,625
Jetta/Bora 1,060,824 900,440
Golf 825,591 913,693
Polo 711,519 809,549
Gol 502,486 512,543
Tiguan 453,081 356,187
Fox 197,823 160,751
Touran 152,683 160,936
up! 141,515 12,612
Beetle 107,939 21,496
Touareg 77,635 79,986
CC 68,481 –
Sharan 48,399 49,969
Suran 37,602 48,473
Scirocco 33,620 42,481
Polo Classic/Sedan 15,265 12,850
Eos 11,138 22,511
Phaeton 10,190 11,166
Parati 6,380 7,508
5,771,789 5,271,776
Golf

108
AU DI B RAN D 2012 2011 %
Deliveries (thousand units) 1,457 1,304 +11.7
Vehicle sales 1,299 1,543 –15.9
Production 1,468 1,345 +9.2
Sales revenue (€ million) 48,771 44,096 +10.6
Operating profit 5,380 5,348 +0.6
as % of sales revenue 11.0 12.1
BUSI N ESS DEVELOPMENT
In fiscal year 2012, AUDI AG entered the premium two-
wheeler segment with its purchase of Italian motorcycle
manufacturer Ducati via a subsidiary. Audi is laying the
foundations for future growth in America with its decision
to construct a new plant in San José Chiapa, Mexico. An
additional highlight was the market launch of the third
generation of the successful A3, the first Group model to be
based on the Modular Transverse Toolkit. The A3 range is
being successively expanded with derivatives; next in line
after the A3 Sportback are an S3 and a TCNG version,
among other things. The unveiling of the new RS4 Avant
marks the return of a true sports car for day-to-day use to
Audi’s portfolio. The new A1 Sportback was also launched
on the markets.
Audi began producing the Q7 in India in the reporting
period. This is the fourth model to be manufactured locally
following the A4, A6 and Q5.
The Audi brand delivered 1.5 million vehicles to
customers worldwide in the reporting period, exceeding
the record prior-year level by 11.7%. The rise was mainly
due to strong increases in Asia (+28.1%) and North
America (+18.5%). Up-and-coming growth markets such
as South Korea, South Africa and India are gaining in
significance for the brand.
Unit sales by the Audi brand in fiscal year 2012
amounted to 1.3 million vehicles (of which 1.1 million
were Audi and Lamborghini models); in addition, the
Chinese joint venture FAW-Volkswagen sold a further 329
Audi brand Continuing its growth path with attractive models
The past fiscal year was another record year for Audi. Highlights were the launch of the A3,
the first model based on the Modular Transverse Toolkit, the acquisition of Ducati
and the decision to build a new plant in Mexico.
Audi Q7
10.6% INCREASE IN SALES REVENUE IN 2012

109
Brands and Business Fields Volkswagen Passenger Cars Audi ŠKODA SEAT Bentley Porsche Volkswagen Commercial Vehicles Scania MAN China Volkswagen Financial Services
DIVISIONS
thousand Audi vehicles. The A6, A5 Sportback, A8, Q5 and
Q7 models were the main growth drivers. The new A1
Sportback and Q3 models were also highly popular. Unit
sales by Automobili Lamborghini S.p.A. amounted to 2,120
vehicles, an increase of 32.2% on the prior-year period.
At 1.5 million units in fiscal 2012, the production of
Audi models exceeded the prior-year figure by 9.1%.
Lamborghini produced 2,197 vehicles, 28.4% more than
in the previous year.
SALES REVEN U E AN D EARN I NGS
At €48.8 billion, sales revenue for the Audi brand was
10.6% higher than in the prior year. This significant
increase was mainly attributable to larger volumes of
vehicles and parts. Operating profit rose slightly on the
back of the increased volume to €5.4 billion as a result of
more favorable exchange rates and product cost optimi-
zation measures, despite increasingly difficult economic
conditions. The operating return on sales was 11.0%
(12.1%). The key figures for the Lamborghini and Ducati
brands are included in the figures for the Audi brand.
F U RTH E R I N F OR M AT I O N www.audi.com
PRODUCTION
Units 2012 2011
Audi
A4 329,759 321,045
A6 284,888 241,862
Q5 209,799 183,678
A3 164,666 189,068
A1 123,111 117,566
Q3 106,918 19,613
A5 103,357 111,758
Q7 54,558 53,703
A8 35,932 38,542
A7 28,950 37,301
TT 21,880 25,508
R8 2,241 3,551
1,466,059 1,343,195
Lamborghini
Aventador 976 447
Gallardo 822 944
Gallardo Spyder 399 320
2,197 1,711
Audi brand 1,468,256 1,344,906
Ducati, motorcycles* 15,734 –
* Starting in July 2012.
Audi A3 Sportback

110
ŠKODA B RAN D 2012 2011 %
Deliveries (thousand units) 939 879 +6.8
Vehicle sales 727 690 +5.2
Production 943 902 +4.6
Sales revenue (€ million) 10,438 10,266 +1.7
Operating profit 712 743 –4.1
as % of sales revenue 6.8 7.2
BUSI N ESS DEVELOPMENT
The ŠKODA brand systematically continued its growth
trajectory in 2012, which is underpinned by a large number
of model rollouts. It introduced the Rapid – which has
been available on the Indian market since 2011 – onto the
European market in 2012. Positioned between the Fabia
and the Octavia, the Rapid is a core component of the
brand’s growth strategy. ŠKODA also presented the four-
door version of the Citigo. In December 2012, the main
production facility in Mladá Boleslav started producing the
third generation of the bestselling Octavia – the heart of
the brand.
The ŠKODA brand delivered 939 thousand vehicles to
customers in the reporting period, surpassing the prior-
year figure by 6.8%. The brand recorded substantial
growth rates in Russia (+33.7%), India (+14.2%) and
China (+7.1%) in particular.
At 727 thousand vehicles, unit sales for the ŠKODA
brand were up 5.2% year-on-year. Growth in demand was
particularly high for the Citigo and Yeti models, as well as
for the Rapid in India.
ŠKODA brand On target worldwide despite difficult market situation in Europe
The European launch of ŠKODA’s new Rapid compact saloon was the highlight
of its fiscal year 2012. The Czech brand aims to launch a new model on average
every six months until 2015.
ŠKODA Citigo
727 thousand VEHICLES SOLD IN 2012

111
Brands and Business Fields Volkswagen Passenger Cars Audi ŠKODA SEAT Bentley Porsche Volkswagen Commercial Vehicles Scania MAN China Volkswagen Financial Services
DIVISIONS
The considerable difference between deliveries and unit
sales is mainly due to the fact that the vehicle-producing
joint ventures in China are not counted as ŠKODA brand
companies.
The ŠKODA brand produced 943 thousand units world-
wide in the reporting period, 4.6% more than in the previous
year.
SALES REVEN U E AN D EARN I NGS
The ŠKODA brand generated sales revenue of €10.4 billion
in fiscal 2012, a year-on-year increase of 1.7%. At €712
million, operating profit was 4.1% or €30 million lower
than the prior-year figure. The increased volume and lower
product costs were unable to offset negative mix effects and
higher marketing costs. The operating return on sales was
6.8%, compared with 7.2% in the previous year.
F U RTH E R I N F OR M AT I O N www.skoda-auto.com
PRODUCTION
Units 2012 2011
Octavia 406,360 402,281
Fabia 255,025 262,497
Superb 106,847 119,732
Yeti 90,952 77,142
Roomster 39,249 36,427
Citigo 36,687 1,027
Rapid 8,292 2,559
943,412 901,665
ŠKODA Rapid

112
SEAT BRAN D 2012 2011 %
Deliveries (thousand units) 321 350 –8.3
Vehicle sales 429 362 +18.8
Production 321 353 –9.0
Sales revenue (€ million) 6,485 5,393 +20.2
Operating result –156 –225 +30.7
as % of sales revenue –2.4 –4.2
BUSI N ESS DEVELOPMENT
The SEAT brand started its largest product rollout to date at
the beginning of 2012 with the revamped Ibiza. The four-
door version of the Mii also made its debut. The successful
Toledo was back in the vehicle range after a three-year
break. The unveiling of the new Leon marked the first time
that SEAT’s new design language was applied to a series
model. The Leon is the brand’s first vehicle to be based on
the Modular Transverse Toolkit and introduces equipment
features from the premium class into the compact segment
for the first time. In 2013, SEAT will expand the Leon
series to include a three-door version and an estate
version. In addition, the new Ibiza Cupra will be launched
on the market.
The SEAT brand delivered 321 thousand vehicles to
customers in fiscal year 2012, down 8.3% on the prior-
year figure. The brand was hard hit by the difficult market
conditions in Western and Southern Europe. The markets
in Spain, Italy and France in particular saw significant
declines in demand as against 2011. By contrast, the
markets in Germany, the United Kingdom and Mexico
recorded encouraging increases.
SEAT brand Most extensive product initiative in the company’s history
SEAT started an unparalleled product initiative in fiscal year 2012 with the goal
of acquiring new customer groups for the Spanish brand. The third generation
of the SEAT Leon was successfully launched on the market.
SEAT Toledo
€6.5 billion SALES REVENUE IN 2012

113
Brands and Business Fields Volkswagen Passenger Cars Audi ŠKODA SEAT Bentley Porsche Volkswagen Commercial Vehicles Scania MAN China Volkswagen Financial Services
DIVISIONS
In the reporting period, the SEAT brand sold 429 thousand
vehicles, 18.8% more than in the previous year. This
includes the Q3 manufactured for Audi.
The SEAT brand produced 321 thousand units in the
reporting period, a decline of 9.0% year-on-year.
SALES REVEN U E AN D EARN I NGS
At €6.5 billion, the sales revenue generated by the SEAT
brand in fiscal 2012 was 20.2% higher than in the prior
year. The operating loss narrowed from €–225 million to
€–156 million; the operating return on sales was –2.4%
(–4.2%). Earnings were positively impacted by cost cutting
and the increased volume – due to the inclusion of the Q3
produced for Audi – as well as exchange rate effects, while
the continued sharp fall in demand on the domestic Spanish
passenger car market had a negative effect.
F U RTH E R I N F OR M AT I O N www.seat.com
PRODUCTION
Units 2012 2011
Ibiza 160,887 191,183
Leon 71,295 80,736
Altea/Toledo 32,478 42,329
Mii 26,409 990
Alhambra 19,393 18,139
Exeo 10,854 19,559
321,316 352,936
SEAT Leon FR

114
BENTLEY BRAN D 2012 2011 %
Deliveries (units) 8,510 7,003 +21.5
Vehicle sales 9,186 7,402 +24.1
Production 9,107 7,593 +19.9
Sales revenue (€ million) 1,453 1,119 +29.9
Operating profit 100 8 x
as % of sales revenue 6.9 0.7
BUSI N ESS DEVELOPMENT
In fiscal year 2012, Bentley looked back on ten years of
success for its Continental GT premium coupé. This was
the first model that the luxury British brand developed as a
member of the Volkswagen family. It also made Bentley the
largest manufacturer of vehicles with twelve-cylinder
engines.
In the reporting period, Bentley launched an energy-
efficient alternative to the twelve-cylinder version: the V8
engine. This was used in the new version of the
Continental GT launched in 2010 and the Continental GTC
that made its debut in 2011. The Continental GT Speed was
relaunched as the series’ sporty top-of-the-range model
and launched on the market in fiscal year 2012. Its top
speed of 330 km/h makes it the fastest street-legal sports
car ever built by Bentley. The brand also created waves in
the reporting period with its Continental GT3 concept
racer, which marks the brand’s return to the motorsport
scene.
The Bentley brand increased deliveries to customers by
21.5% year-on-year to 8,510 vehicles, defending its
position as one of the world’s leading producers of luxury
vehicles.
Bentley brand Ten years of the Continental GT: the twelve-cylinder bestseller
Following its return to profit in 2011, Bentley continued its positive performance
in the reporting period. The Continental GT celebrated its ten-year anniversary;
the Continental GT Speed was launched as the top-of-the-range model.
Bentley Continental GT V8
€100 million OPERATING PROFIT IN 2012

115
Brands and Business Fields Volkswagen Passenger Cars Audi ŠKODA SEAT Bentley Porsche Volkswagen Commercial Vehicles Scania MAN China Volkswagen Financial Services
DIVISIONS
The US market, which increased by 23.3%, remained
Bentley’s largest market, closely followed by China with an
increase of 23.5%. The brand also recorded strong demand
in the Europe (+9.9%) and Middle East (+51.6%) regions.
Unit sales by the Bentley brand in fiscal year 2012 rose
by 24.1% to 9,186 vehicles. The Continental GT and
Mulsanne models were particularly successful.
The Bentley brand produced a total of 9,107 vehicles in
the reporting period, a year-on-year increase of 19.9%.
SALES REVEN U E AN D EARN I NGS
The Bentley brand generated sales revenue of €1.5 billion
in the period from January to December 2012, 29.9%
more than in the previous year. Operating profit increased
by €92 million to €100 million, with the higher volume and
mix improvements having a positive impact. The operating
return on sales increased to 6.9% (0.7%).
F U RTH E R I N F OR M AT I O N www.bentleymotors.com
PRODUCTION
Units 2012 2011
Continental GT Coupé 3,536 3,416
Continental GT Cabriolet 2,638 677
Continental Flying Spur 1,764 2,354
Mulsanne 1,169 1,146
9,107 7,593
Bentley Mulsanne

116
PORSCH E BRAN D 2012*
Deliveries (thousand units) 60
Vehicle sales 62
Production 64
Sales revenue (€ million) 5,879
Operating profit 946
as % of sales revenue 16.1
* August 1 to December 31, 2012.
BUSIN ESS DEVELOPMENT
Porsche’s roots date back to 1931, when Ferdinand Porsche
established a design office in Stuttgart, laying the
foundations for the sports car manufacturer. The exciting
sports car brand stands for the legendary Porsche 911 and
for spectacular racing successes. Today, Porsche is a
successful company whose 17,500 employees produce
approximately 152,000 vehicles a year.
As of August 1, 2012, Volkswagen acquired the remaining
50.1% of Porsche SE’s sports car business, consolidating
Porsche as the Group’s twelfth successful brand. The key
figures presented in this chapter cover the Automotive and
Financial Services businesses and relate to the period from
August 1 to December 31, 2012.
The Porsche brand delivered 60 thousand sports cars
to customers. The USA remained the largest single market,
with 16 thousand customers choosing a Porsche model. It was
followed by China, where sales figures were also encouraging
(13 thousand vehicles). Porsche delivered six thousand
models to customers in its home market of Germany.
Porsche brand Integration of the Stuttgart-based sports car manufacturer with the Volkswagen Group successfully completed
The contribution in full of Porsche SE’s operating automotive business to the Volkswagen Group
was completed effective August 1, 2012. Porsche AG has been consolidated as part of the Group
since that date. In fiscal 2012, the Porsche brand recorded ongoing high demand and reiterated
its plans to expand its model range.
Porsche Cayenne Turbo S
911 A LEGEND AMONG SPORTS CARS

117
Brands and Business Fields Volkswagen Passenger Cars Audi ŠKODA SEAT Bentley Porsche Volkswagen Commercial Vehicles Scania MAN China Volkswagen Financial Services
DIVISIONS
The Porsche brand produced 64 thousand vehicles between
August 1 and December 31 of the reporting period. In
September 2012, Volkswagen’s Osnabrück plant started
production of the new Boxster series, as capacity at the
main plant in Stuttgart-Zuffenhausen could not handle the
entire production of both the 911 and the Boxster sports
car series, which also includes the Cayman.
SALES REVENUE AN D EARN INGS
The Porsche brand recorded a successful performance in
the reporting period. Sales revenue was €5.9 billion during
the consolidation period. Operating profit amounted to
€946 million, while the operating return on sales was
16.1%.
F U RTH E R I N F OR M AT I O N www.porsche.com
PRODUCTION
Units 2012*
Cayenne 36,664
911 Coupé/Cabriolet 11,409
Panamera 8,772
Boxster/Cayman 6,839
63,684
* August 1 to December 31, 2012.
Porsche 911 Carrera 4S Coupé

118
VOLKSWAGEN COMMERCIAL VEH ICLES 2012 2011 %
Deliveries (thousand units) 550 529 +4.1
Vehicle sales 437 441 –0.8
Production 487 508 –4.1
Sales revenue (€ million) 9,450 8,985 +5.2
Operating profit 421 449 –6.1
as % of sales revenue 4.5 5.0
BUSI N ESS DEVELOPMENT
Volkswagen Commercial Vehicles celebrated the start of
production of the Amarok at the brand’s main production
facility in Hanover in the reporting period. Adding
Hanover as a second production location for the Amarok
will significantly improve availability and delivery times for
customers in Europe. The brand also celebrated the 65th
and 30th anniversaries of the Transporter and the Caddy.
Volkswagen Commercial Vehicles showcased its large
range of vehicles at the IAA Commercial Vehicles fair in
Hanover in September 2012. It also debuted two new
special models. One was the Amarok Canyon – a high-
quality off-road vehicle that again highlights the brand’s
all-wheel drive technology. The other was the Cross Caddy
with its individualized exterior design, which expands the
range of Volkswagen Cross models.
At 550 thousand vehicle deliveries worldwide, Volks-
wagen Commercial Vehicles surpassed its prior-year record
figure by 4.1%. The brand recorded significant growth in
Central and Eastern Europe, South America and the Asia-
Pacific region.
Unit sales to the dealer organization decreased slightly
by 0.8% year-on-year to 437 thousand vehicles in fiscal
2012. The Amarok was particularly popular, while demand
for the Crafter and Multivan/Transporter series also
increased.
Volkswagen Commercial Vehicles Extensive model offering provides “Diversity for every job”
Volkswagen Commercial Vehicles presented its wide range of models at the IAA Commercial Vehicles 2012
under the motto “Diversity for every job”. The focus was on its BlueMotion and all-wheel drive technology,
as well as the large number of upgrade and modification options.
Cross Caddy
550 thousand VEHICLES DELIVERED IN 2012
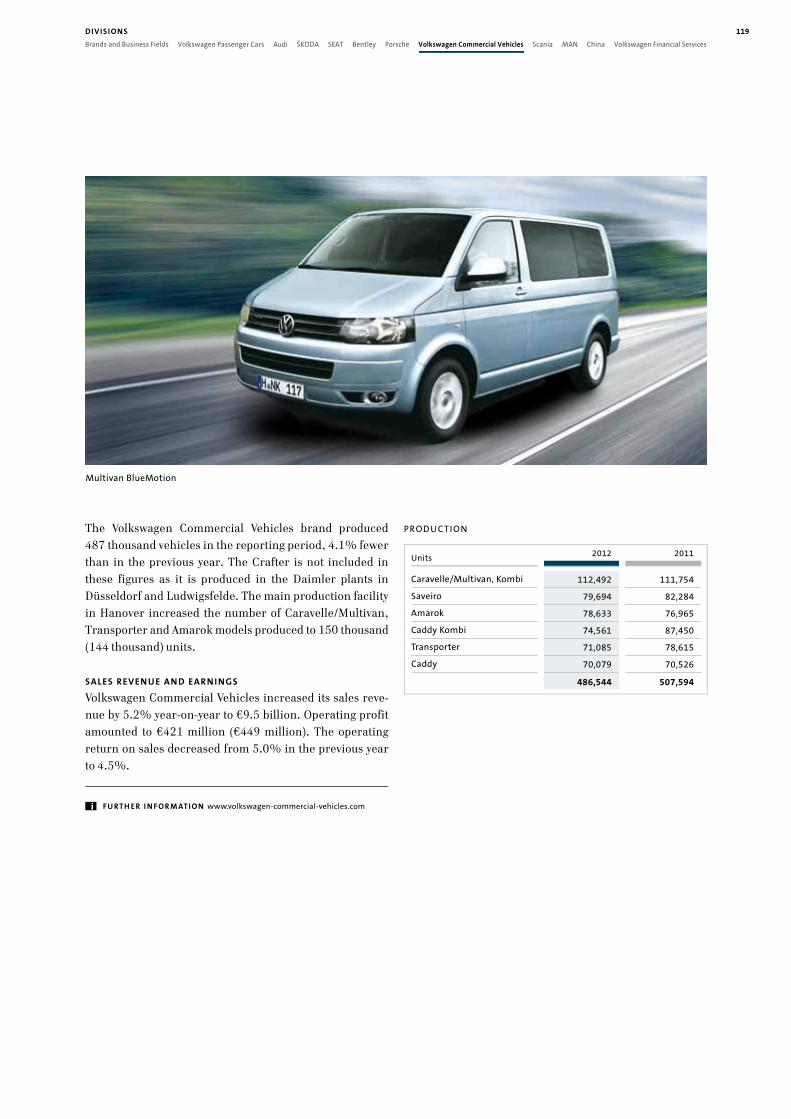
119
Brands and Business Fields Volkswagen Passenger Cars Audi ŠKODA SEAT Bentley Porsche Volkswagen Commercial Vehicles Scania MAN China Volkswagen Financial Services
DIVISIONS
The Volkswagen Commercial Vehicles brand produced
487 thousand vehicles in the reporting period, 4.1% fewer
than in the previous year. The Crafter is not included in
these figures as it is produced in the Daimler plants in
Düsseldorf and Ludwigsfelde. The main production facility
in Hanover increased the number of Caravelle/Multivan,
Transporter and Amarok models produced to 150 thousand
(144 thousand) units.
SALES REVEN U E AN D EARN I NGS
Volkswagen Commercial Vehicles increased its sales reve-
nue by 5.2% year-on-year to €9.5 billion. Operating profit
amounted to €421 million (€449 million). The operating
return on sales decreased from 5.0% in the previous year
to 4.5%.
F U RTH E R I N F OR M AT I O N www.volkswagen-commercial-vehicles.com
PRODUCTION
Units 2012 2011
Caravelle/Multivan, Kombi 112,492 111,754
Saveiro 79,694 82,284
Amarok 78,633 76,965
Caddy Kombi 74,561 87,450
Transporter 71,085 78,615
Caddy 70,079 70,526
486,544 507,594
Multivan BlueMotion

120
SCAN IA B RAN D 2012 2011 %
Orders received (thousand units) 72 77 –6.4
Deliveries 67 80 –15.9
Vehicle sales 67 80 –15.9
Production 67 84 –20.4
Sales revenue (€ million) 9,314 10,064 –7.4
Operating profit 930 1,372 –32.2
as % of sales revenue 10.0 13.6
BUSI N ESS DEVELOPMENT
In the reporting period, the time-honored Swedish brand
showcased additional Euro 6 engines, including two new
high-performance gas engines at the IAA Commercial
Vehicles fair in Hanover. Scania’s numerous customer-
specific transport solutions and pioneering driver assistance
technologies, which help to reduce fuel consumption,
were also well received.
The slump in demand in the European truck markets
had a negative impact on the Scania brand in fiscal year 2012,
which sells almost half of all its vehicles there. The Swedish
commercial vehicles manufacturer’s global deliveries to
customers were down 15.9% to 67 thousand vehicles.
Demand in the Western European (–13.9%) and South
American (–14.7%) markets declined noticeably compared
with the previous year. Bus deliveries were 20.5% lower
year-on-year, at six thousand. By contrast, the service and
genuine parts business performed well.
The Scania brand produced 67 thousand vehicles in
2012, 20.4% fewer than in the previous year. This figure
includes the number of buses produced (six thousand).
Scania brand Lower fuel consumption thanks to environmentally friendly solutions
Swedish truck manufacturer Scania presented its wide range of Euro 6 engines for trucks and buses at
the IAA Commercial Vehicles fair in 2012. Scania demonstrated opportunities for fuel efficiency with
individual transport solutions for a very wide range of uses and enhanced assistance systems.
Scania OmniExpress
10.0% RETURN ON SALES IN 2012

121
Brands and Business Fields Volkswagen Passenger Cars Audi ŠKODA SEAT Bentley Porsche Volkswagen Commercial Vehicles Scania MAN China Volkswagen Financial Services
DIVISIONS
Scania started to build a new CKD plant in Narasapura in
India, which is scheduled to start assembling trucks and
buses for the Indian market in 2013.
SALES REVEN U E AN D EARN I NGS
Declining volumes led to a 7.4% reduction in the Scania
brand’s sales revenue to €9.3 billion. Operating profit
declined by €442 million to €930 million. This was due to
increased competition, lower capacity utilization and
increased costs as well as lower volumes. The operating
return on sales was 10.0%, compared with 13.6% in the
previous year.
F U RTH E R I N F OR M AT I O N www.scania.com
PRODUCTION
Units 2012 2011
Trucks 60,647 75,349
Buses 6,283 8,708
66,930 84,057
Scania G 420 4x2

122
MAN BRAN D 2012 2011*
Orders received (thousand units) 135 23
Deliveries 134 25
Vehicle sales 134 25
Production 124 24
Sales revenue (€ million) 15,999 2,652
Operating profit 808 193
as % of sales revenue 5.0 7.3
* November 9 to December 31, 2011.
BUSI N ESS DEVELOPMENT
The new MAN TG family of trucks celebrated their world
premiere at the IAA Commercial Vehicles fair in Hanover
in September 2012. They already meet the requirements of
the future Euro 6 emission standard and offer powerful
performance combined with low fuel consumption, excellent
dynamic handling and a high level of driving comfort. The
Munich-based commercial vehicles manufacturer and
engineering company also showcased its efficient MAN
Concept S truck study plus a matching aerodynamic trailer
at the IAA. This cuts fuel consumption and emissions by up
to 25% for the same load capacity. Also in September 2012,
MAN showcased technical innovations to increase efficiency
and reduce emissions for marine propulsion units at the
SMM fair in Hamburg, the world’s most important ship-
building trade show.
The key figures presented in this chapter comprise the
Trucks and Buses, Power Engineering and Financial Services
businesses. The prior-year figures relate to the period
since MAN was consolidated, i.e. from November 9, 2011.
The MAN brand’s deliveries to customers amounted to
134 thousand trucks and buses in fiscal 2012. The sovereign
debt crisis in Western Europe had a negative impact,
MAN brand MAN’s stand at the IAA Commercial Vehicles fair draws in the crowds
MAN presented a wide range of innovations from the trucks, buses, engines and services areas at
the IAA Commercial Vehicles fair in Hanover. The highlight was the new TG family of vehicles,
which are virtually pollutant-free to drive. MAN showcased new technologies for cleaner and
more efficient shipping at the SMM shipping fair in Hamburg.
MAN TG family with Euro 6
135 thousand ORDERS RECEIVED FOR COMMERCIAL VEHICLES IN 2012

123
Brands and Business Fields Volkswagen Passenger Cars Audi ŠKODA SEAT Bentley Porsche Volkswagen Commercial Vehicles Scania MAN China Volkswagen Financial Services
DIVISIONS
while the introduction of the new Euro 5 emission standard
put a damper on demand in the key Brazilian market. The
sales figures for the MAN brand include 15 thousand buses.
The MAN brand produced 124 thousand commercial
vehicles in the reporting period, 16 thousand of which
were buses. The company adjusted its production to match
the decline in demand.
SALES REVEN U E AN D EARN I NGS
MAN was faced with a difficult economic environment for
the commercial vehicles industry in fiscal year 2012. The
brand generated sales revenue of €16.0 billion, roughly a
quarter of which was attributable to the Power Engineering
segment. Operating profit amounted to €808 million; the
operating return on sales was 5.0%.
F U RTH E R I N F OR M AT I O N www.man.eu
PRODUCTION
Units 2012 2011*
Trucks 108,417 20,571
Buses 15,887 3,146
124,304 23,717
* November 9 to December 31, 2011.
MAN TGM all-wheel drive tipper

124
VOLKSWAGEN GROU P I N CH I NA 2012 2011 %
Deliveries (thousand units) 2,815 2,260 +24.6
Vehicle sales 2,609 2,201 +18.5
Production 2,643 2,202 +20.0
BUSI N ESS DEVELOPMENT
Volkswagen has been cooperating with its partners in the
Chinese automotive market for around 29 years. The
Group now has twelve vehicle production facilities or
component sites in China. The Shanghai-Volkswagen joint
venture and the joint venture between FAW (First
Automotive Works) and Volkswagen in Changchun are
accounted for using the equity method in the consolidated
financial statements.
The Volkswagen Group’s presence on the Chinese
passenger car market comprises over 60 models from its
Volkswagen Passenger Cars, Volkswagen Commercial
Vehicles, Audi, ŠKODA, Lamborghini, Bentley, Porsche and
Bugatti brands. The SEAT brand entered the market in
2012. In fiscal 2012, our joint ventures sold 2.6 million
locally produced vehicles, up 18.5% year-on-year.
In addition to established Group models and models
that have been modified for the Chinese market (with a
longer wheelbase, for example), vehicles specially designed
for Chinese customers are also produced; examples of
these include the Volkswagen Lavida, New Bora and
Santana models. The new Santana celebrated its world
premiere in the past fiscal year; its predecessor was one of
the most successful models in China, with almost 4 million
units sold. The new Lavida and Bora were also launched in
the reporting period and were well received by the market.
Volkswagen Group in China Renewed record highs thanks to above-average growth
Fiscal year 2012 was another record year for the Volkswagen Group in its largest
market: China. With 2.8 million vehicles sold, growth by our joint ventures
significantly outperformed the Chinese passenger car market as a whole.
Measures have been taken to further increase capacity.
New Santana
24.6% INCREASE IN DELIVERIES TO CUSTOMERS

125
Brands and Business Fields Volkswagen Passenger Cars Audi ŠKODA SEAT Bentley Porsche Volkswagen Commercial Vehicles Scania MAN China Volkswagen Financial Services
DIVISIONS
At 2.8 million vehicles, the Volkswagen Group delivered
24.6% more cars in China in fiscal year 2012 than in the
prior-year period. The Volkswagen Passenger Cars brand
recorded a 24.8% increase in the Chinese market, selling
2.2 million vehicles. The Audi brand generated growth of
29.6% and the ŠKODA brand 7.1%. The Magotan, Jetta,
New Bora, Tiguan, Sagitar, New Passat, ŠKODA Octavia,
Audi A6 and Audi Q5 models were particularly popular
with Chinese customers. The Volkswagen Group lifted its
market share from 18.2% in the previous year to 20.8% at
the end of 2012, thereby extending its leadership of the
Chinese market.
The joint ventures produced a total of 2.6 million
vehicles in fiscal year 2012, a year-on-year increase of
20.0%. A new vehicle plant in Yizheng with an annual
capacity of 300,000 vehicles was opened in the reporting
period. In addition, a decision was taken to construct
additional production facilities in Ningbo and Urumqi. The
new vehicle plants in Foshan and Urumqi will start
production in 2013. The goal is to increase Volkswagen’s
annual capacity in China to four million vehicles by 2018.
The Group is expected to invest a total of around €9.8
billion in new production facilities and products in China
in the period up to and including 2015. These initiatives
will be financed entirely by cash flows from the Chinese
joint ventures.
LOCAL PRODUCTION
Units 2012 2011
Volkswagen Passenger Cars 2,082,580 1,720,346
Audi 333,556 258,557
ŠKODA 226,653 222,984
Total 2,642,789 2,201,887
EARN I NGS
€ million 2012 2011
Operating profit (100%) 8,424 6,134
Operating profit (proportionate) 3,678 2,616
The joint ventures generated an operating profit (propor-
tionate) of €3.7 billion in fiscal year 2012, an increase of
€1.1 billion on the prior-year figure. The rise is due to
volume and mix improvements, positive exchange rate
effects and savings gained from lower material costs.
The joint venture companies in China are accounted
for using the equity method. Their figures are not included
in the Group’s operating profit. Their profits are included
solely in the Group’s financial result on a proportionate
basis.
Audi Q5

126
STRUCTU RE OF VOLKSWAGEN FI NANCIAL SERVIC ES
Volkswagen Financial Services’ portfolio of services covers
dealer and customer financing, leasing, banking and
insurance activities, fleet management and mobility
offerings. Volkswagen Financial Services AG coordinates
the global financial services activities of the Volkswagen
Group, with the exception of the Scania, MAN and Porsche
brands and the financial services business of Porsche
Holding Salzburg. The principal companies in this
division in Europe are Volkswagen Bank GmbH, Volks-
wagen Leasing GmbH and Volkswagen Versicherungsdienst
GmbH. Financial Services activities in North America are
performed by VW CREDIT, INC.
Volkswagen Leasing GmbH acquired the dealer-owned
rental company Euromobil on January 1, 2012. The
acquisition expanded Volkswagen Financial Services AG’s
mobility offering to include the classic short-term car
rental business.
BUSI N ESS DEVELOPMENT
Volkswagen Financial Services continued its positive trend
in fiscal year 2012. Total assets exceeded €100 billion for
the first time. The combination of its innovative projects
and the Volkswagen Group brands allowed it to leverage
additional potential along the automotive value chain. The
integration of its financial services with the Volkswagen
Group brands’ sales activities was accelerated in 2012.
This contributed to the Volkswagen Group’s strong
earnings and unit sales.
In Germany, Volkswagen Financial Services AG took
first place in the well-known employer competition,
“Great Place to Work”, in the 2,001–5,000 employees size
range. Volkswagen Leasing GmbH was honored for its
sustainable fleet management program in the Germany-
wide “365 Orte im Land der Ideen” competition. Together
with the German Nature and Biodiversity Conservation
Union (NABU), Volkswagen Leasing encourages fleet
managers to make their fleets “greener” and use them in
line with this, and presents the “DIE GRÜNE FLOTTE”
environmental award for ecologically responsible fleet
management. In addition, Volkswagen Leasing makes a
contribution to a NABU project every time an environ-
mentally friendly car is registered.
Volkswagen Financial Services On its way to becoming the best automotive financial services provider
Volkswagen Financial Services generated strong growth in all
business areas in fiscal year 2012. The division continued its
international expansion.
9.6 million CONTRACTS AS OF DECEMBER 31, 2012

127
Brands and Business Fields Volkswagen Passenger Cars Audi ŠKODA SEAT Bentley Porsche Volkswagen Commercial Vehicles Scania MAN China Volkswagen Financial Services
DIVISIONS
Volkswagen Financial Services AG was highly successful
with asset-backed securities (ABS) issues in 2012.
Receivables amounting to a total of €5.7 billion were
securitized on the capital market worldwide via a total of
seven ABS transactions. In the first quarter of 2012,
Volkswagen Financial Services AG marketed Japanese
loan receivables for the first time in the Driver Japan One
transaction. This was the first public securitization
transaction using receivables from a European auto-
mobile manufacturer in Japan. The Driver Brazil One
securitization transaction followed in July 2012; this
makes Brazil the fifth country after Germany, the United
Kingdom, Spain and Japan in which Volkswagen Financial
Services is active on the capital market with its Driver
platform.
Volkswagen Financial Services continued to expand its
international footprint in the reporting period. In order to
strengthen its sales activities in Poland, it acquired the
remaining shares in VOLKSWAGEN BANK POLSKA S.A. and
Volkswagen Leasing Polska Sp.z o.o. and consolidated the
companies. In Portugal, a bank branch offering financing
started operation. In China, the Volkswagen Finance Co.
affiliate was consolidated for the first time due to its
sustained growth. In addition, the establishment of Volks-
wagen New Mobility Services Investment Co., Ltd. specif-
ically expanded the Group’s product offering beyond
classic consumer credit. In Belgium, Volkswagen Financial
Services AG entered the financial services business by
establishing the Volkswagen D´Ieteren Finance S.A. joint
venture together with its Belgian importer. Volkswagen
Financial Services AG is planning to enter into a new
strategic partnership with Allianz SE in 2013 to boost its
car insurance activities. The aim is to pave the way to
becoming a direct insurer in the area of car insurance.
The number of new finance, leasing and service/
insurance contracts signed in fiscal 2012 amounted to 3.8
million, a 21.0% increase on the prior-year figure. The
number of contracts in the Customer Financing/Leasing
area was up 14.5% on the previous year to 6.4 million as of
December 31, 2012. The number of contracts in the
Service/Insurance area rose to 3.3 million, up 21.9% on
the previous year. The total number of contracts reached a
new record of 9.6 million (+16.9%). Based on unchanged
credit eligibility criteria, the share of financed or leased
vehicles was 27.5% (36.3%) of total Group delivery
volumes. This decline was due to the inclusion of the
Chinese market since the beginning of 2012. In China,
the share of leased or financed vehicles is significantly
Volkswagen Financial Services AG’s conference and financial center

128
below the average in other automotive markets. Volkswagen
Bank direkt was managing 1,438 thousand accounts at the
end of the reporting period (previous year: 1,442 thousand).
The number of contracts in our fleet management
business at the end of 2012 was up 1.5% on year-end
2011; our joint venture LeasePlan Corporation N.V.
managed around 1.4 million vehicles.
Volkswagen Financial Services employed 10,133 people
as of the reporting date.
SALES REVENUE AN D EARN INGS
Volkswagen Financial Services’ sales revenue increased by
12.8% in fiscal year 2012 to €17.9 billion. Higher volumes,
stable margin trends and lower risk provisions increased
the operating profit to €1.4 billion (€1.2 billion). Volks-
wagen Financial Services once again made a significant
contribution to the Volkswagen Group’s earnings.
F U RTH E R I N F OR M AT I O N www.vwfsag.com
VOLKSWAGEN FI NANCIAL SERVICES 2012 2011 %
Number of contracts thousands 9,640 8,245 +16.9
Customer financing 4,551 3,930 +15.8
Leasing 1,808 1,623 +11.4
Service/Insurance 3,281 2,691 +21.9
Receivables from € million
Customer financing 48,779 42,979 +13.5
Dealer financing 12,942 11,942 +8.4
Leasing agreements 15,476 14,407 +7.4
Direct banking deposits € million 22,004 21,373 +3.0
Total assets € million 111,053 97,455 +14.0
Equity € million 11,312 9,785 +15.6
Liabilities1 € million 95,630 84,290 +13.5
Equity ratio % 10.2 10.0
Return on equity before tax2 % 13.4 14.2
Leverage3 8.5 8.6
Operating profit € million 1,410 1,203 +17.1
Profit before tax € million 1,415 1,309 +8.1
Employees at Dec. 31 10,133 8,335 +21.6
1 Excluding provisions and deferred tax liabilities.
2 Profit before tax as a % of average equity (continuing operations).
3 Liabilities as a % of equity.

Corporate Governance
We are convinced that long-term economic success can only be achieved by complying with statutory provisions, internal company policies and ethical principles. We drove for-ward the creation of a positive compliance culture in fiscal year 2012.
Co
rp
or
at
e G
ov
er
na
nC
e
Integrity Protection
Prevention
ComplianCe
Cr e at i n G a p o S i t i v e Co m pl i a n Ce CU lt U r e

Co rp o r ate Gov e rn a n Ce
131 CorporateGovernanceReport(PartoftheManagementReport)
137 RemunerationReport(PartoftheManagementReport)
143 StructureandBusinessActivities(PartoftheManagementReport)
147 ExecutiveBodies(PartoftheNotestotheConsolidatedFinancialStatements)

131
Corporate Governance Report Remuneration Report Structure and Business Activities Executive Bodies
COR PORATE GOVERNANC E
SUCCESSFUL CORPORATE GOVERNANCE BASED ON THE
RECOMMEN DATIONS AN D SUGGESTIONS OF THE GERMAN
CORPORATE GOVERNANCE CODE
The German Corporate Governance Code contains recom-
mendations and suggestions for good corporate governance.
It was prepared by the responsible government com-
mission on the basis of the material statutory provisions
and nationally and internationally recognized standards of
corporate governance. The government commission reviews
the German Corporate Governance Code on an annual
basis and amends or updates it as necessary. The recommen-
dations and suggestions of the Code underpin the work of
the Board of Management and Supervisory Board of Volks-
wagen AG, as responsible and transparent corporate gover-
nance helps us to strengthen the trust of our customers
and investors in our work. It also allows us to meet the
steadily increasing demand for information from national
and international stakeholders. These are fundamental
conditions for continuously increasing our Company’s value.
DECLARATIONS OF CON FORMITY (AS OF THE DATE OF THE
RELEVANT DECLARATION)
On February 27, 2012 the Board of Management and the
Supervisory Board of Volkswagen AG issued a declaration
of conformity with the German Corporate Governance Code.
This became necessary due to changes in its application
since the previous declaration of conformity was submitted
on November 18, 2011. In this document, the Board of
Management and Supervisory Board declare that, since
the last declaration of conformity was submitted on Novem-
ber 18, 2011, the recommendations of the Government
Commission on the German Corporate Governance Code
in the version dated May 26, 2010 published by the
German Federal Ministry of Justice on July 2, 2010 have
been complied with, with the exception of article 4.2.3(4)
(severance payment cap). They further state that, as of the
declaration of February 27, 2012, all recommendations
were fully complied with, with the exception of article
4.2.3(4) (severance payment cap), 5.1.2 (age limit for
members of the Board of Management) and 5.5.3 sentence 1
(report to the Annual General Meeting about conflicts of
interest that have arisen and how they are being handled).
The reasons for these exceptions can be found in the
declarations of conformity, which are published on our
website, www.volkswagenag.com/ir, under the heading
“Corporate Governance”, menu item “Declarations”.
The annual declaration of conformity with the German
Corporate Governance Code as required by section 161 of
the Aktiengesetz (AktG – German Stock Corporation Act)
was issued by the Board of Management and the Super-
visory Board of Volkswagen AG on November 23, 2012. In
this document, they declare that, since the last declaration
of conformity was submitted on February 27, 2012, the
recommendations in the version dated May 26, 2010
published on July 2, 2010 were complied with, with the
exception of article 4.2.3(4) (severance payment cap),
5.1.2 (age limit for members of the Board of Management)
and 5.5.3 sentence 1 (report to the Annual General Meeting
about conflicts of interest that have arisen and how they
are being handled), up to the publication of the new
version dated May 15, 2012 published on June 15, 2012.
From June 15, 2012 until the current declaration of
conformity was submitted on November 23, 2012, the
recommendations of May 15, 2012 published on June 15,
2012 were complied with, with the following exceptions:
articles 4.2.3(4) (severance payment cap), 5.1.2 (age limit
for members of the Board of Management), 5.3.2 sentence 3
(independence of the Chairman of the Audit Committee),
Corporate Governance Report (Part of the Management Report) Responsible, transparent and value-enhancing corporate governance
The future of the Volkswagen Group depends on our ability to continually increase the Company’s value.
Strengthening the trust of our customers and investors is fundamental to this. Transparent and responsible
corporate governance therefore takes the highest priority in our daily work. The Board of Management and
the Supervisory Board of Volkswagen AG comply with the recommendations of the current German
Corporate Governance Code as issued on May 15, 2012 with a few justified exceptions.

132
5.4.1(2) (specification of concrete objectives regarding the
composition of the Supervisory Board), 5.4.1(4 to 6) (dis-
closure regarding election recommendations), 5.4.6(2)
(performance-related remuneration of members of the
Supervisory Board) and 5.5.3 sentence 1 (report to the
Annual General Meeting about conflicts of interest that
have arisen and how they are being handled).
In this document, the Board of Management and
Supervisory Board also declare that, as of the declaration
of November 23, 2012, the recommendations of May 15,
2012 published on June 15, 2012 have been and will
continue to be complied with, with the exception of articles
4.2.3(4) (severance payment cap), 5.1.2 (age limit for
members of the Board of Management), 5.3.2 sentence 3
(independence of the Chairman of the Audit Committee),
5.4.1(4 to 6) (disclosure regarding election recommen-
dations), 5.4.6(2) (performance-related remuneration of
members of the Supervisory Board) and 5.5.3 sentence 1
(report to the Annual General Meeting about conflicts of
interest that have arisen and how they are being handled).
The reasons for these exceptions can be found in the
declarations of conformity, which are published on our
website, www.volkswagenag.com/ir, under the heading
“Corporate Governance”, menu item “Declarations”.
The suggestions of the current version of the German
Corporate Governance Code have been complied with in
full since June 15, 2012. With regard to the previous version
of the Code, a deviation from the recommendation in
article 5.4.6(2) sentence 2 was declared as a precautionary
measure until June 15, 2012. It was unclear whether the
remuneration of members of the Supervisory Board,
which is regulated by the shareholders in article 17(1) of
the Volkswagen AG Articles of Association by means of a
link to dividend distribution among other things, repre-
sented a variable compensation component in line with
the provisions of article 5.4.6(2) of the German Corporate
Governance Code.
Our listed subsidiaries AUDI AG, MAN SE and Renk AG
have also issued declarations of conformity with the
German Corporate Governance Code.
The annual declaration of conformity with the German
Corporate Governance Code was issued by the Board of
Management and the Supervisory Board of AUDI AG on
November 29, 2012. In this document, the two Boards
declare that the recommendations of the Government
Commission on the German Corporate Governance Code
in the version dated May 26, 2010 published on July 2,
2010 were complied with up to the publication of the new
version dated May 15, 2012 on June 15, 2012. However,
there were qualifications: the Supervisory Board has not
formed a Nomination Committee (article 5.3.3 of the Code)
and members are not elected to the Supervisory Board on
an individual basis (article 5.4.3 sentence 1 of the Code).
The two Boards furthermore declared that the recommen-
dations of the version dated May 15, 2012 published on
June 15, 2012 were and will continue to be complied with,
with the exception of articles 5.1.2(2) sentence 3, and
5.4.1(2) sentence 1 (age limit for Board of Management and
Supervisory Board members), 5.3.2 sentence 3 (indepen-
dence of the Audit Committee Chairman), 5.3.3 (nomination
committee), 5.4.1 (4 to 6) (disclosure regarding election
recommendations), 5.4.2 (no more than two former Board
of Management members to sit on the Supervisory Board),
5.4.3 sentence 1 (election to the Supervisory Board on an
individual basis), 5.4.6(2) sentence 2 (performance-related
remuneration of members of the Supervisory Board), 5.5.3
sentence 1 (report to the Annual General Meeting about
conflicts of interest that have arisen and how they are
being handled).
The reasons for these exceptions are explained in
the declaration of conformity, which is published at
www.audi.com/cgk-declaration.
AUDI AG complies with the suggestions of the German
Corporate Governance Code without exception.
In their declaration of conformity with the German
Corporate Governance Code in December 2012, the
Executive Board and Supervisory Board of MAN SE declared
that the recommendations of the German Corporate Gover-
nance Code in the version dated May 26, 2010 published
on July 2, 2010 were complied with up to June 15, 2012 in
accordance with MAN SE’s declaration of conformity of
December 2011.
The recommendations of the German Corporate Gover-
nance Code in the version dated May 15, 2012 published
on June 15, 2012 were complied with, with the exception
of articles 5.3.2 sentence 3 (independence of the Chairman
of the Audit Committee) and 5.4.6(2) (performance-related
remuneration of members of the Supervisory Board), from
June 15, 2012 until the date of submission of the current
declaration of conformity. Following the necessary consulta-
tions and the corresponding decision by the Supervisory
Board, article 5.4.1(2) (specification of concrete objectives
regarding the composition of the Supervisory Board) has
been complied with since December 12, 2012.
D EC L A R AT I ON OF CO N F O R M I T Y OF VOL KSWAG E N AG www.volkswagenag.com/ir D EC L A R AT I ON OF CO N F O R M I T Y OF AU D I AG www.audi.com/cgk-declaration D EC L A R AT I ON OF CO N F O R M I T Y OF M A N S E www.man.eu/en D EC L A R AT I ON OF CO N F O R M I T Y OF R EN K AG www.renk.biz/corporated-governance.html CO R P O R AT E G OV ER N A N C E AT SC A N I A A B www.scania.com/scania-group/corporate-governance

133
Corporate Governance Report Remuneration Report Structure and Business Activities Executive Bodies
COR PORATE GOVERNANC E
The Executive Board and Supervisory Board of MAN SE also
declare that, from the date of issue of the current decla-
ration in December 2012, the recommendations of the
German Corporate Governance Code in the version of May
15, 2012 published on June 15, 2012 have been complied
with, with the exception of articles 5.3.2 sentence 3
(independence of the Chairman of the Audit Committee),
5.4.6(2) (performance-related remuneration of members
of the Supervisory Board) and 5.5.3 sentence 1 (report to
the Annual General Meeting about conflicts of interest that
have arisen and how they are being handled).
The reasons for these exceptions are explained in
the declaration of conformity, which is available at
www.man.eu/en under the heading “Company”.
At Scania AB, the management and supervisory functions
are split between the Annual General Meeting, the Board
of Directors and the President and CEO. They are governed
by the articles of association, Swedish company law, the
stock exchange admission criteria and other laws and
regulations to be complied with, such as the Swedish Corpo-
rate Governance Code. Additional details on Scania AB’s
corporate governance and the relevant declaration of
conformity with the Swedish Corporate Governance Code
are available at www.scania.com/scania-group/corporate-
governance.
COMPOSITION OF THE SUPERVISORY BOARD
In view of the purpose of the Company, its size and the
extent of its international activities, the Supervisory Board
of Volkswagen AG strives to take the following criteria into
account in its composition:
> At least three members of the Supervisory Board should be
persons who embody in particular the characteristic of
internationality.
> Among the shareholder representatives, at least four
members of the Supervisory Board should be persons who
do not represent potential conflicts of interest, particu-
larly those that could arise through a position as a consultant
or member of the governing bodies of customers, suppliers,
lenders, or other third parties.
> In addition, at least four of the shareholder represen-
tatives must be persons who are independent as defined
by article 5.4.2 of the German Corporate Governance Code.
> At least three Supervisory Board members should be
women, and at least two female members should represent
the shareholders.
> In addition, proposals for elections should not normally
include persons who will have reached the age of 70 by
the time the election takes place.
The first four objectives have already been met. As a rule,
individuals will also not be proposed for election to the
Supervisory Board if they are 70 years old at the time of the
election.
COOPERATION BETWEEN THE BOARD OF M ANAGEMENT AN D
THE SU PERVISORY BOARD
The Board of Management and Supervisory Board of Volks-
wagen AG decide on the strategic orientation of the Volks-
wagen Group in close consultation. The two Boards discuss
the progress of the strategy implementation at regular inter-
vals. The Board of Management provides the Supervisory
Board with regular, complete and prompt written and verbal
reports on all relevant issues concerning business develop-
ment, planning and the Company’s situation, including the
risk situation, risk management and compliance.
More information on the cooperation between the
Board of Management and the Supervisory Board of
Volkswagen AG and on the work and structure of the
committees of the Supervisory Board can be found in the
Report of the Supervisory Board on pages 14 to 21 of this
annual report. Information on the membership of the
Board of Management and Supervisory Board, as well as
its committees, may be found on pages 147 to 150.
REMU NERATION REPORT
Extensive explanations of the remuneration system and the
individual remuneration of the members of the Board of
Management and the Supervisory Board may be found in
the Remuneration Report on pages 137 to 142 of this
annual report.
CORPORATE GOVERNANCE DECLARATION
The corporate governance declaration is permanently
available on our website at www.volkswagenag.com/ir,
under the heading “Mandatory Publications”.

134
COMPLIANCE
Compliance with international rules and the fair treatment
of our business partners and competitors are among the
guiding principles followed by our Company. Volkswagen’s
sense of commitment has always gone beyond statutory
and internal requirements; obligations undertaken and
ethical principles accepted voluntarily also form an integral
part of our corporate culture.
The Volkswagen Group also endeavors to fight corruption
and other illegal economic activity outside of the Company.
Since 2002, we have been a member of the United Nations
Global Compact, working with around 7,000 participating
companies in more than 135 countries to create a more
sustainable and fair global economy.
Consciously implementing core values like integrity
and fairness, rather than simply defining them, has been
and will continue to be actively promoted by our corporate
governance. Speaking to more than 3,900 managers in
March 2012, Chairman of the Board of Management of
Volkswagen AG, Prof. Dr. Martin Winterkorn, stressed that
there is no leeway when it comes to the issue of compliance
to safeguard the Company’s reputation. Clear declarations
of commitment to compliance were also made to the work-
force by other members of the Group Board of Manage-
ment and brand boards of management during the year.
Volkswagen embraces a preventive compliance approach
and aims to create a corporate culture that stops potential
breaches before they occur, through raising awareness
and educating employees. The necessary investigative
measures are regularly performed by Group Internal Audit
and Group Security. Both departments systematically
monitor compliance and perform reviews on a test basis
irrespective of whether any breaches are suspected, as well
as investigating specific suspected breaches. Responses
are implemented by the Human Resources and Group
Legal departments. These processes are closely interrelated
as part of a comprehensive compliance management system.
In addition, a large number of governing bodies belong to
the compliance organization at Group and brand level.
These include the Compliance Board at senior executive
level and other expert committees, such as the Core Com-
pliance Team.
The Group Chief Compliance Officer is currently supported
by 13 Chief Compliance Officers, who are responsible for
the brands. The number of Compliance Officers in the
Group companies has risen by 35 to 100. In total, more
than 400 employees are involved in the Governance, Risk
and Compliance organization in some 39 countries.
The organization provided information on various com-
pliance issues to the brands and companies over the year,
using a wide range of traditional communication channels,
such as reports in different employee magazines produced
by the brands, companies and locations. Websites, smart-
phone applications, blogs and electronic newsletters are
also frequently used to provide compliance information.
The Compliance intranet site registered more than 17,000
clicks in the space of just three days following a works
meeting at the Wolfsburg site, which clearly shows that
initiatives like the series of films on compliance are gen-
erating a favorable response. The communication measures
also include speaking to employees personally at infor-
mation stands at works and other employee meetings. Our
compliance communication has not only been well received
internally, as the Volkswagen Group’s communication cam-
paigns and media received numerous external awards during
the year.
The prevention of active corruption was the main focus
in 2012. In particular, we pushed ahead integration with
the compliance organization in key strategic markets such
as Brazil, Russia, India, China, Malaysia, Argentina and
Mexico.
In November 2012, we also published anti-corruption
guidelines and distributed them throughout the compliance
organization, sending them to more than 5,700 Volks-
wagen AG managers. Prof. Dr. Martin Winterkorn took this
opportunity to again emphasize the importance of com-
pliance. The guidelines use real examples to raise awareness,
provide corruption risk checklists and demonstrate measures
for successfully avoiding corruption. Among other things,
the guidelines expressly forbid facilitation payments. They
are available to all Volkswagen AG employees in electronic
form via the Volkswagen portal.

135
Corporate Governance Report Remuneration Report Structure and Business Activities Executive Bodies
COR PORATE GOVERNANC E
There are Group-wide directives on dealing with gifts and
invitations, as well as making donations.
We have now provided the Code of Conduct to all
consolidated brand companies and established it as a
fundamental part of our corporate culture. Brochures on the
Code of Conduct have been widely distributed and are
available to employees via the Volkswagen portal, for example.
The Code of Conduct has also been further integrated into
operational processes. Since 2010, new employment con-
tracts with Volkswagen AG make reference to the Code of
Conduct and the requirement to comply with it.
Further progress was also made in the area of compe-
tition and antitrust law – the focal point of the 2011 com-
pliance program – during the reporting period.
Information events for employees at all levels are still a
core component of our compliance work. Across the Group,
a total of 45,000 employees worldwide attended events on
the topics of compliance, the Code of Conduct, competition
and antitrust law, and anti-corruption in 2012. E-learning
programs are also an established means of providing
employee training. Around 20,000 employees successfully
completed the e-learning program on avoiding conflicts of
interest and corruption in 2012. A training program on the
Group’s Code of Conduct was added to the e-learning offering
in the year. Since July 1, 2012 participation has been
compulsory for new Volkswagen AG employees. More than
70,000 employees have taken the opportunity to further
their professional development by participating in
e-learning programs on the subject of compliance since
2009.
For the Volkswagen Group, the excellent reputation
enjoyed by the Company in the business world and among
the public is a precious asset. To safeguard its reputation,
Volkswagen verifies the integrity of new business partners.
The aim is to find out about potential business partners
before entering into a relationship with them, in order to
reduce the risk of starting a cooperation that could be
damaging to business or the Company.
In 2012, the compliance organization’s advisory services
were significantly expanded. All brands and a large number
of companies now offer their employees the opportunity to
receive personal advice, usually by contacting the com-
pliance organization via an e-mail address. At Volkswagen
AG’s German sites, an IT-based information and advisory
tool was launched in March 2012.
An anti-money laundering concept was also developed
in 2012. This tool is based on the identified risks and is
structured according to business area. It meets the new
requirements of the Geldwäschegesetz (GwG – German
Money Laundering Act) that came into force in the reporting
period.
Any breaches or suspicions (particularly regarding
corruption) can be reported to two external lawyers appointed
by the Group via the ombudsman system in place since
2006. In 2012, the ombudsmen passed on 46 reports
provided by persons, whose details remained confidential
if requested, to Volkswagen AG’s Anti-Corruption Officer.
Information on a further 64 cases was provided directly to
the Anti-Corruption Officer or the head of Group Internal
Audit. All information is followed up. All breaches of the
law or internal regulations are appropriately punished and
may lead to consequences under employment law, including
dismissal.
We review the effectiveness of the compliance measures
on an annual basis through an integrated survey of the
Volkswagen Group’s brands and companies. The effec-
tiveness of selected management controls to manage
compliance risks is also checked. Detailed compliance risk
assessments were carried out across the Group in 2012.
The findings were factored into the risk analyses of the
Volkswagen Group, the brands and the companies and are
therefore subject to a continuous improvement process.
Based on the risk analysis, the compliance activities in
2013 will focus on expanding the compliance organization
within the Volkswagen Group and preventing corruption in
China, in addition to strengthening the existing structures.

136
During the reporting period, independent experts were
engaged to assess the compliance management system
concept. They concluded that Volkswagen has established
“an effective and efficient compliance management system”.
RISK MANAGEMENT
We place great importance on carefully managing potential
risks to the Company in our daily work. Our risk manage-
ment system is oriented toward identifying risks and
optimizing existing risk positions. We continually adapt
this system to changes in the operating environment.
A detailed description of the risk management system and
our accounting-related internal control system may be
found in the Risk Report on pages 226 to 228 of this annual
report.
The Audit Committee established by the Supervisory
Board monitors the financial reporting process, the
effectiveness of the internal control and internal audit
systems, and compliance, in particular. It also supervises
the audit of financial statements, particularly the required
independence of the auditors, the additional services
performed by the auditors, the engagement of the auditors,
the definition of areas of emphasis of the audit and the
agreed fee. As recommended in article 5.3.2 of the German
Corporate Governance Code, the Chairman of the Audit
Committee, Dr. Ferdinand Oliver Porsche, has particular
expertise and experience in the application of financial
reporting principles and internal control systems.
COMMU NICATION AN D TRANSPARENCY
In its annual report, in the interim reports and on its
website at www.volkswagenag.com/ir, the Volkswagen
Group publishes a financial calendar listing all the
important dates for its shareholders. The invitations to and
the agendas for the shareholders’ meetings and any
countermotions received are also available on this website.
At the shareholders’ meetings, shareholders may exercise
their voting rights themselves, have this right exercised on
their behalf by a third-party proxy who has been granted
power of attorney, or by a proxy designated by the Company
who will vote on their behalf in accordance with their
voting instructions. In addition, we offer our shareholders
the opportunity to watch the Annual General Meeting in
full on the Internet.
News and information on the Volkswagen Group is
available on our website at www.volkswagenag.com/ir. All
releases and other information are published in both
English and German.
Immediately after their publication in line with legal
requirements, the Company’s ad hoc releases are also
published on our website at www.volkswagenag.com/ir
under the heading “Mandatory Publications”, menu item
“Ad-hoc releases”.
We publish directors’ dealings (section 15a of the WpHG)
at www.volkswagenag.com/ir under the heading “Mandatory
Publications”, menu item “Directors’ Dealings”.
In addition, details of the notifications filed in compli-
ance with sections 21 ff. of the Wertpapierhandelsgesetz
(WpHG – German Securities Trading Act) during the reporting
period can be found on this website under the heading
“Mandatory Publications”, menu item “Reporting of voting
rights according to WpHG”. Notifications relating to other
legal issues may be downloaded there under the heading
“Mandatory Publications”, menu item “Other legal issues”.
The supervisory body offices held by Board of
Management members and Supervisory Board members
can be found on pages 147 to 150 of this annual report.
M A N DATORY P U B L IC AT I ON S OF VO LKSWAG EN AG www.volkswagenag.com/ir

137
Corporate Governance Report Remuneration Report Structure and Business Activities Executive Bodies
COR PORATE GOVERNANC E
PRI NCI PLES OF AN D CHANGES TO BOARD OF M ANAGEMENT
REMU NERATION
The full Supervisory Board resolves on the remuneration
system and the total remuneration for each individual
member of the Board of Management on the basis of the
Executive Committee’s recommendations. The remu-
neration of current members of the Board of Management
complies with the requirements of the Aktiengesetz (AktG
– German Stock Corporation Act) and, subject to any
retroactive effect for 2012, the recommendations of the
German Corporate Governance Code. In particular, the
remuneration structure is focused on ensuring sustainable
business growth in accordance with the Gesetz zur
Angemessenheit der Vorstandsvergütung (VorstAG – German
Act on the Appropriateness of Executive Board Remu-
neration) (section 87(1) of the AktG).
The remuneration system of the members of the Board
of Management applicable to date was approved by the
50th Annual General Meeting on April 22, 2010 by
99.44% of the votes cast. At the same time, the Volkswagen
Group’s positive business performance over the past two
years in particular made it necessary to modify and realign
Board of Management remuneration and the comparative
parameters on which it is based. The remuneration of the
Board of Management was modified with the assistance of
a remuneration consultant, whose independence was
assured by the Board of Management and by the Company.
Material changes to the remuneration system relate to
the bonus, the calculation of which will be realigned to
reflect business development. It now also explicitly takes
into account the individual performance of members of
the Board of Management.
The retroactive adjustment of the comparative para-
meters for the bonus requires a departure from the recom-
mendation in article 4.2.3(3) sentence 3 of the German
Corporate Governance Code, which precludes the retro-
active adjustment of performance targets or comparative
parameters. This recommendation will be complied with
again in the future.
The level of Board of Management remuneration should
be appropriate and attractive in the context of the
Company’s national and international peer group. Criteria
include the tasks of the individual Board of Management
member, their personal performance, the economic
situation, the performance of and outlook for the
Company, as well as how customary the remuneration is
when measured against its peer group and the remu-
neration structure that applies to other areas of Volkswagen.
In this context, comparative studies on remuneration are
conducted on a regular basis.
COMPONENTS OF BOARD OF MANAGEMENT REMU NERATION
The remuneration of the Board of Management comprises
fixed and variable components. The fixed components of
the package ensure firstly a basic level of remuneration
enabling the individual members of the Board of
Management to perform their duties in the interests of the
Company and to fulfill their obligation to act with proper
business prudence without needing to focus on merely
short-term performance targets. On the other hand,
variable components, dependent among other criteria on
the financial performance of the Company, serve to ensure
the long-term impact of behavioral incentives.
FIXED REMU N ERATION
In fiscal year 2012, the members of the Board of Manage-
ment received fixed remuneration totaling €9,506,343
(previous year: €9,031,491). The fixed remuneration also
includes differing levels of remuneration for appointments
assumed at Group companies as well as the cost or cash
equivalent of noncash and other benefits, such as the use
of company cars and the payment of insurance premiums.
Taxes due on the noncash benefits were mainly borne by
Volkswagen AG.
The basic remuneration is reviewed regularly and
adjusted if necessary.
Remuneration Report (Part of the Management Report)
The Remuneration Report details the individualized remuneration of the Board of Management and the
Supervisory Board of Volkswagen AG, broken down into components, as well as individualized pension
provision disclosures for the members of the Board of Management. In addition, we explain in this
chapter the main elements of the variable remuneration system for the Board of Management.

138
VARIABLE REMU N ERATION
The variable remuneration comprises a bonus, which relates
to business performance over the preceding two years, and,
since 2010, a Long-Term Incentive (LTI) plan, which is
based on the previous four fiscal years, subject to an intro-
ductory phase. Both components of variable remuneration
are therefore calculated on a multiyear basis and reflect
both positive and negative developments.
Bonus
The bonus rewards the positive business development of
the Volkswagen Group. The basis for calculating the bonus
is adjusted to reflect the positive business development in
recent years in connection with the changes to Board of
Management remuneration. The bonus is calculated on
the basis of the average operating profit, including the
share of the operating profit in China, over a period of two
years. A significant change was the introduction of a
calculation floor below which no bonus will be paid. This
floor was set at €5.0 billion for 2012 and 2013. In addition,
a cap for extraordinary developments is explicitly provided
for by limiting the maximum theoretical bonus. The
theoretical cap for 2012 and 2013 is €6.75 million for the
Chairman of the Board of Management and €2.5 million
for the other members of the Board of Management. The
system and the cap are regularly reviewed by the
Supervisory Board to establish whether any adjustments
are necessary.
R EMU N ERATION OF TH E MEMBERS OF TH E BOAR D OF MANAGEMENT I N 2012 (PRIOR-YEAR FIGU RES I N B RACKETS)*
BONUS
€
Fixed remuneration
Special remuneration
Individual performance-related bonus LTI
LTI additional payment 2010 Total
Martin Winterkorn 1,916,276 5,770,000 2,885,000 3,940,000 – 14,511,276
(1,886,206) (11,040,000) (3,670,000) (860,000) (17,456,206)
Francisco Javier Garcia Sanz 1,102,278 2,150,000 860,000 1,750,000 – 5,862,278
(1,093,154) (4,600,000) (1,630,000) (380,000) (7,703,154)
Jochem Heizmann 1,100,204 2,150,000 645,000 1,750,000 – 5,645,204
(1,101,878) (4,100,000) (1,630,000) (380,000) (7,211,878)
Christian Klingler 999,756 2,150,000 860,000 1,750,000 – 5,759,756
(964,336) (4,600,000) (1,630,000) (380,000) (7,574,336)
Michael Macht 995,277 2,150,000 430,000 1,750,000 – 5,325,277
(958,878) (4,600,000) (1,630,000) (95,000) (7,283,878)
Horst Neumann 1,062,771 2,150,000 860,000 1,750,000 – 5,822,771
(1,042,151) (4,600,000) (1,630,000) (380,000) (7,652,151)
Leif Östling 319,952 716,667 215,000 583,333 – 1,834,952
– – – – –
Hans Dieter Pötsch 1,025,047 2,150,000 1,075,000 1,750,000 – 6,000,047
(1,015,613) (5,100,000) (1,630,000) (380,000) (8,125,613)
Rupert Stadler 984,782 2,150,000 860,000 1,750,000 – 5,744,782
(969,273) (4,600,000) (1,630,000) (380,000) (7,579,273)
Total 9,506,343 21,536,667 8,690,000 16,773,333 – 56,506,343
(9,031,491) (43,240,000) (15,080,000) (3,235,000) (70,586,491)
* All figures shown are rounded, so minor discrepancies may arise from addition of these amounts.

139
Corporate Governance Report Remuneration Report Structure and Business Activities Executive Bodies
COR PORATE GOVERNANC E
Another material change relates to the Supervisory
Board’s ability to increase the theoretical bonus, which is
calculated on the basis of average operating profit, by up to
50% by applying individual adjustment factors that are not
linked to the theoretical cap so as to reward members of
the Board of Management for extraordinary individual
performance. This can be adjusted by the Supervisory
Board in the event of extraordinary individual perfor-
mance by a member of the Board of Management that
strengthens the Company’s long-term growth. This may
take into account extraordinary performance in the area of
integration, or the successful implementation of special
projects, for example.
Long-Term Incentive (LTI)
The existing Long-Term Incentive plan, which is still in the
introductory phase, was not adjusted in connection with
changes to the Board of Management remuneration. The
amount of the LTI depends on the achievement of the
targets laid down in the Strategy 2018. The target areas are:
> Top customer satisfaction, measured using the Customer
Satisfaction Index,
> Top employer, measured using the Employee Index,
> Unit sales growth, measured using the Growth Index and
> Increase in the return on sales, measured using the
Return Index.
The Customer Satisfaction Index is calculated using
indicators that quantify the overall satisfaction of our
customers with the delivering dealers, new vehicles and
the service operations based on the previous workshop
visit.
The Employee Index is determined using the
“employment” and “productivity” indicators as well as the
participation rate and results of employee surveys
(“opinion surveys”, see also the Employees section on page
215 of this report).
The Growth Index is calculated using the “deliveries to
customers” and “market share” indicators.
The Return Index is derived from the return on sales
and the dividend per ordinary share.
The indices on customer satisfaction, employees and unit
sales are aggregated and the result is multiplied by the
Return Index. This method ensures that the LTI is only paid
out if the Group is also financially successful. If the 1.5%
threshold for the return on sales is not exceeded, the
Return Index is zero. This would mean that the overall
index for the fiscal year concerned is also zero.
Each fiscal year, the Supervisory Board can set a new
LTI target on the basis of the four-year average of the
overall indices. During the reporting period, the LTI target
was €2.25 million for the Chairman of the Board of
Management and €1.0 million for each of the other
members of the Board of Management. The maximum
amounts payable to the Chairman of the Board of
Management and the other members are €4.5 million and
€2.0 million each respectively.
The LTI was calculated and paid to the Board of
Management for the first time in 2011 for fiscal year 2010
using an introductory scenario and on the basis of the
likely performance for 2011. The performance for fiscal
years 2010 and 2011 was reflected in the calculation in
2012, and the performance for 2010 to 2012 will be
reflected in the calculation in 2013. From 2014 onwards,
the previous four years will be used as a basis for analysis.
The Supervisory Board may cap the total of variable
remuneration components in the event of extraordinary
business developments.
Members of the Board of Management with contracts
entered into on or after January 1, 2010 are entitled to
payment of their normal remuneration for twelve months
in the event of illness. Contracts entered into before that
date grant remuneration for six months. In the event of
disability, they are entitled to the retirement pension.
Surviving dependents receive a widows’ pension of 66 2/3%
and orphans’ benefits of 20% of the former member of the
Board of Management’s pension.
There were no changes to existing contracts in fiscal
year 2012.

140
POST-EMPLOYMENT BENEFITS
In the event of regular termination of their service on the
Board of Management, the members of the Board of
Management are entitled to a pension, including a surviving
dependents’ pension as well as the use of company cars for
the period in which they receive their pension. The agreed
benefits are paid or made available on reaching the age
of 63.
The retirement pension is calculated as a percentage of
the fixed basic salary, which accounts for most of the fixed
individual remuneration of the Board of Management
shown in the table on page 138. Starting at 50%, the
individual percentage increases by two percentage points
for each year of service. In specific cases, credit is given for
previous employment periods and retirement pensions
earned. The Executive Committee of the Supervisory Board
has defined a maximum of 70%. These benefits are not
broken down any further into performance-related compo-
nents and long-term incentive components. Mr. Winterkorn,
Mr. Garcia Sanz, Mr. Heizmann, Mr. Macht, Mr. Neumann
and Mr. Pötsch have a retirement pension entitlement of
70%, and Mr. Klingler and Mr. Stadler of 56% of their
fixed basic salaries as of the end of 2012.
Mr. Östling has a pension entitlement based on the
deferred compensation regulations administered by Volks-
wagen Pension Trust e.V. The benefits include a retirement
pension on reaching the age of 70 and a surviving depen-
dents’ pension. Volkswagen AG provides an annual remu-
neration-linked company contribution for Mr. Östling,
which goes toward a pension module at the end of each
year.
On December 31, 2012 the pension obligations for
members of the Board of Management in accordance
with IAS 19 amounted to €103,535,287 (previous year:
€78,627,844); €7,870,299 (previous year: €7,945,505)
was added to the provision in the reporting period in
accordance with IAS 19. Other benefits such as surviving
dependents’ pension and the use of company cars are also
factored into the measurement of pension provisions.
The pension obligations measured in accordance with
German GAAP amounted to €75,445,501 (previous year:
71,818,192); €3,627,309 (previous year: €16,970,145)
was added to the provision in the reporting period in
accordance with German GAAP. Current pensions are
index-linked in accordance with the index-linking of the
highest collectively agreed salary insofar as the application
of section 16 of the Gesetz zur Verbesserung der betrieb-
lichen Altersversorgung (BetrAVG – German Company
Pension Act) does not lead to a larger increase.
Retired members of the Board of Management and
their surviving dependents received €8,797,230 in 2012
(previous year: €8,618,915). Obligations for pensions for
this group of persons measured in accordance with IAS 19
amounted to €146,501,307 (previous year: €109,452,277),
or €122,324,853 (previous year: €104,212,838) measured
in accordance with German GAAP.
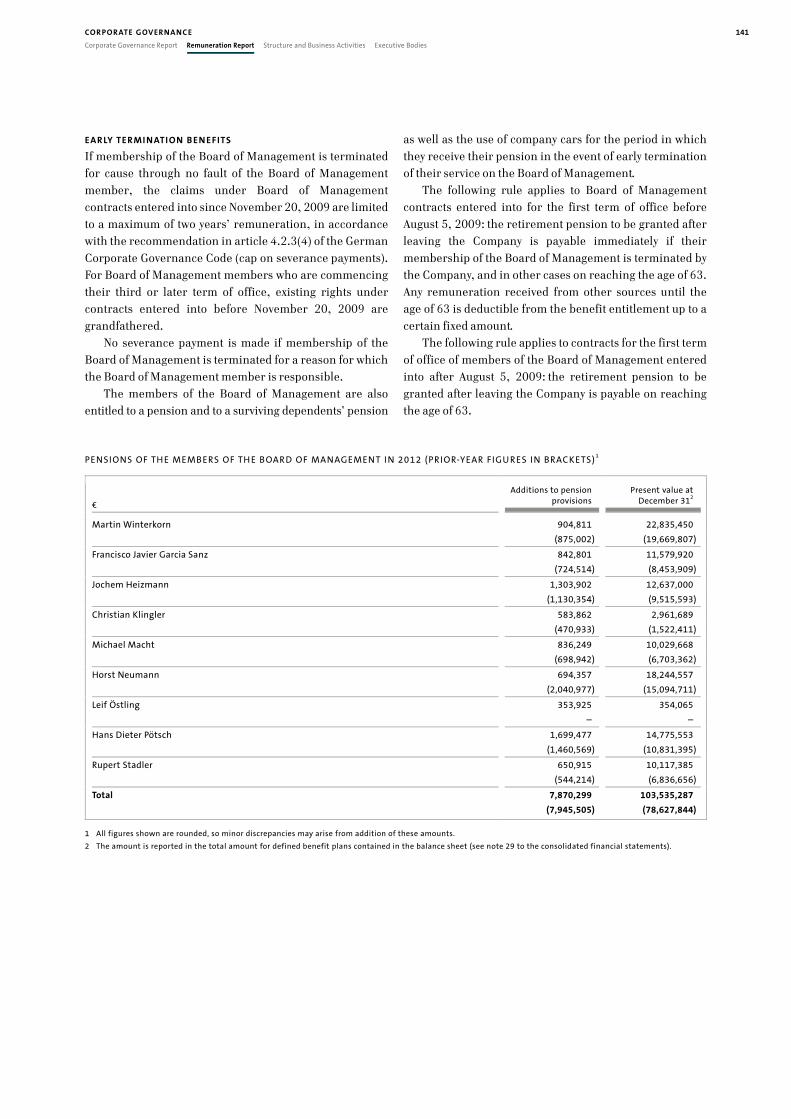
141
Corporate Governance Report Remuneration Report Structure and Business Activities Executive Bodies
COR PORATE GOVERNANC E
EARLY TERMI NATION B EN EFITS
If membership of the Board of Management is terminated
for cause through no fault of the Board of Management
member, the claims under Board of Management
contracts entered into since November 20, 2009 are limited
to a maximum of two years’ remuneration, in accordance
with the recommendation in article 4.2.3(4) of the German
Corporate Governance Code (cap on severance payments).
For Board of Management members who are commencing
their third or later term of office, existing rights under
contracts entered into before November 20, 2009 are
grandfathered.
No severance payment is made if membership of the
Board of Management is terminated for a reason for which
the Board of Management member is responsible.
The members of the Board of Management are also
entitled to a pension and to a surviving dependents’ pension
as well as the use of company cars for the period in which
they receive their pension in the event of early termination
of their service on the Board of Management.
The following rule applies to Board of Management
contracts entered into for the first term of office before
August 5, 2009: the retirement pension to be granted after
leaving the Company is payable immediately if their
membership of the Board of Management is terminated by
the Company, and in other cases on reaching the age of 63.
Any remuneration received from other sources until the
age of 63 is deductible from the benefit entitlement up to a
certain fixed amount.
The following rule applies to contracts for the first term
of office of members of the Board of Management entered
into after August 5, 2009: the retirement pension to be
granted after leaving the Company is payable on reaching
the age of 63.
PENSIONS OF THE MEMBERS OF TH E BOARD OF MANAGEMENT I N 2012 (PRIOR-YEAR FIGU RES IN BRACKETS)
1
€
Additions to pension provisions
Present value at December 312
Martin Winterkorn 904,811 22,835,450
(875,002) (19,669,807)
Francisco Javier Garcia Sanz 842,801 11,579,920
(724,514) (8,453,909)
Jochem Heizmann 1,303,902 12,637,000
(1,130,354) (9,515,593)
Christian Klingler 583,862 2,961,689
(470,933) (1,522,411)
Michael Macht 836,249 10,029,668
(698,942) (6,703,362)
Horst Neumann 694,357 18,244,557
(2,040,977) (15,094,711)
Leif Östling 353,925 354,065
– –
Hans Dieter Pötsch 1,699,477 14,775,553
(1,460,569) (10,831,395)
Rupert Stadler 650,915 10,117,385
(544,214) (6,836,656)
Total 7,870,299 103,535,287
(7,945,505) (78,627,844)
1 All figures shown are rounded, so minor discrepancies may arise from addition of these amounts.
2 The amount is reported in the total amount for defined benefit plans contained in the balance sheet (see note 29 to the consolidated financial statements).

142
SU PERVISORY BOARD REMU N ERATION
Under Article 17 of Volkswagen AG’s Articles of Association,
the remuneration of Volkswagen AG’s Supervisory Board is
composed of a fixed component (plus attendance fees) and
a variable component that depends on the amount of the
dividend paid. The duties performed by the respective
member on the Supervisory Board are also taken into
account. Several members of the Supervisory Board are
also members of the supervisory boards of subsidiaries.
The remuneration received there is based on the provisions
of the relevant Articles of Association and also comprises a
fixed component and a variable component that is linked
to the amount of the dividend paid. In fiscal year 2012, the
members of the Supervisory Board received €8,777,511
(previous year: €7,376,151). €651,625 of this figure
(previous year: €380,521) related to the fixed remu-
neration components (including attendance fees) and
€8,125,886 (previous year: €6,995,630) to the variable
remuneration components.
R EMU N ERATION OF TH E MEMBERS OF TH E SU PERVISORY BOAR D 1
F I X E D VA R I A B L E T O TA L T O TA L
€ 2012 2011
Ferdinand K. Piëch 179,500 928,600 1,108,100 850,222
Berthold Huber2 36,000 647,133 683,133 589,000
Hussain Ali Al-Abdulla 9,000 279,167 288,167 248,500
Jassim Al Kuwari 10,000 279,167 289,167 163,642
Jörg Bode3 14,175 380,365 394,540 370,250
Annika Falkengren 14,096 376,681 390,777 163,642
Michael Frenzel (until April 19, 2012) 3,713 126,207 129,919 371,250
Uwe Fritsch (since April 19, 2012)2 8,192 195,029 203,221 –
Babette Fröhlich2 15,000 418,750 433,750 371,250
Peter Jacobs (until April 19, 2012)2 3,808 84,138 87,946 249,500
David McAllister3 15,000 418,750 433,750 371,250
Hartmut Meine2 12,000 279,167 291,167 249,500
Peter Mosch2 25,500 345,767 371,267 322,000
Bernd Osterloh2 15,000 418,750 433,750 371,250
Hans Michel Piëch 67,000 323,567 390,567 298,500
Ursula Piëch (since April 19, 2012) 8,192 195,029 203,221 –
Ferdinand Oliver Porsche 62,500 624,933 687,433 565,500
Wolfgang Porsche 100,775 447,240 548,015 369,250
Wolfgang Ritmeier 12,000 279,167 291,167 249,500
Jürgen Stumpf2 13,175 380,365 393,540 371,250
Bernd Wehlauer2 15,000 418,750 433,750 371,250
Thomas Zwiebler2 12,000 279,167 291,167 249,500
Supervisory Board members who retired in the prior year – – – 210,144
Total 651,625 8,125,886 8,777,511 7,376,151
1 All figures shown are rounded, so minor discrepancies may arise from addition of these amounts.
2 These employee representatives have stated that they will transfer their Supervisory Board remuneration to the Hans Böckler Foundation in accordance with the
guidelines issued by the German Confederation of Trade Unions (DGB).
3 Under section 5(3) of the Niedersächsisches Ministergesetz (Act Governing Ministers of the State of Lower Saxony), these members of the Supervisory Board are
obliged to transfer their Supervisory Board remuneration to the State of Lower Saxony as soon as and to the extent that it exceeds €6,200 per annum. Remuneration
is defined for this purpose as Supervisory Board remuneration and attendance fees exceeding the amount of €200.

143
Corporate Governance Report Remuneration Report Structure and Business Activities Executive Bodies
COR PORATE GOVERNANC E
OUTLI NE OF THE LEGAL STRUCTU RE OF THE GROU P
Volkswagen AG is the parent company of the Volkswagen
Group. It develops vehicles and components for the Group’s
brands, but also produces and sells vehicles, in particular
Volkswagen brand passenger cars and light commercial
vehicles. In its function as parent company, Volkswagen AG
holds direct and indirect interests in AUDI AG, SEAT S.A.,
ŠKODA AUTO a.s., Scania AB, MAN SE, Dr. Ing. h.c. F.
Porsche AG, Volkswagen Financial Services AG and numerous
other companies in Germany and abroad. More detailed
disclosures are contained in the list of shareholdings in
accordance with sections 285 and 313 of the Handels-
gesetzbuch (HGB – German Commercial Code), which can
be accessed at www.volkswagenag.com/ir and is part of the
annual financial statements.
Volkswagen AG is a vertically integrated energy company
within the meaning of section 3 no. 38 of the Energiewirt-
schaftsgesetz (EnWG – German Energy Industry Act) and is
therefore subject to the provisions of the EnWG. In the
electricity sector, Volkswagen AG performs electricity
generation, sales and distribution together with a Group
subsidiary.
Volkswagen AG’s Board of Management is the ultimate
body responsible for managing the Group. The Supervisory
Board appoints, monitors and advises the Board of Manage-
ment; it is consulted directly on decisions that are of
fundamental significance for the Company.
Information on the remuneration structure for the
Board of Management and the Supervisory Board can be
found in the Remuneration Report on pages 137 to 142, in
the notes to the consolidated financial statements of
Volkswagen AG on page 350 and on page 42 of the notes to
the annual financial statements of Volkswagen AG.
L I ST OF SH A R EH O L D I N G S I N VO L KSWAG EN AG www.volkswagenag.com/ir
ORGANIZATIONAL STRUCTURE OF THE GROU P
Volkswagen AG and the Volkswagen Group are managed by
Volkswagen AG’s Board of Management in accordance
with the Volkswagen AG Articles of Association and the
rules of procedure for Volkswagen AG’s Board of Manage-
ment issued by the Supervisory Board. The Group Board of
Management, which was formed to support the work of the
Board of Management, ensures that Group interests are
taken into account in decisions relating to the Group’s
brands and companies within the framework laid down by
law. This body consists of Board members, the chairmen of
the larger brands and selected top managers with Group
management functions. Each brand in the Volkswagen
Group is managed by a board of management. The Group
targets and requirements laid down by the Board of
Management of Volkswagen AG or the Group Board of
Management must be complied with to the extent permitted
by law. Matters that are of importance to the Group as a
whole are submitted to the Group Board of Management in
order – to the extent permitted by law – to reach agreement
between the parties involved. The rights and obligations of
the statutory bodies of the relevant brand companies
remain unaffected.
The companies of the Volkswagen Group are managed
separately by their respective managements. In addition to
the interests of their own companies, each individual
company management takes into account the interests of
the Group and of the individual brands in accordance with
the framework laid down by law.
Structure and Business Activities (Part of the Management Report)
This chapter describes the legal and organizational structure of the Volkswagen Group and explains the
material changes in 2012 with respect to equity investments. This is followed by the disclosures relating
to takeover law in accordance with sections 289(4) and 315(4) of the HGB.

144
MATERIAL CHANGES I N EQU ITY INVESTMENTS
Effective June 6, 2012, Volkswagen increased its share of
voting rights in MAN SE, Munich, to 75.03%, thus strength-
ening the alliance between MAN, Scania and Volkswagen
Commercial Vehicles. MAN will continue to operate its
business in the Volkswagen Group, while maintaining its
brand-specific characteristics and business fields.
As of July 19, 2012, the Volkswagen Group acquired
100% of the voting rights of motorcycle manufacturer
Ducati Motor Holding S.p.A., Bologna, Italy, against payment
of a purchase price of €747 million, via Automobili
Lamborghini S.p.A., Sant’Agata Bolognese, Italy, a sub-
sidiary of AUDI AG. The acquisition of Ducati – a leading
international manufacturer of premium motorcycles with
extensive expertise in high-performance engines and
lightweight construction – has seen the Group move into
the growth market for high-quality motorcycles.
The integrated automotive group with Porsche was
created on August 1, 2012 with the contribution in full of
Dr. Ing. h.c. F. Porsche AG (Porsche AG) to the Volkswagen
Group. The accelerated integration allows the imple-
mentation of Volkswagen AG’s and Porsche AG’s joint
strategy to go ahead sooner. Porsche will be integrated
under Volkswagen’s multibrand strategy, retaining its own
identity and operational independence.
LEGAL FACTORS IN FLU ENCING BUSI NESS
Volkswagen companies are affected – as are other inter-
national companies – by numerous laws in Germany and
abroad. In particular, there are legal requirements relating
to development, production and distribution, but that also
include tax, company, commercial and capital market law,
as well as labor, banking, state aid, energy and insurance
regulations.
DISCLOSU RES REQUI RED U N DER TAKEOVER LAW
The disclosures required under takeover law as specified
by sections 289(4) and 315(4) of the HGB are presented in
the following.
Capital structure
On December 31, 2012, the share capital of Volkswagen
AG amounted to €1,190,995,445.76 (previous year:
€1,190,995,443.20); it was composed of 295,089,818
ordinary shares and 170,142,778 preferred shares. This
includes the one new ordinary bearer share issued in the
reporting period as part of the creation of the integrated
automotive group with Porsche (see also page 262). Each
share conveys a notional interest of €2.56 in the share
capital.
In November 2012, Volkswagen successfully placed a
mandatory convertible note in the amount of €2.5 billion
via a subsidiary, which entitles and obliges holders to sub-
scribe for Volkswagen preferred shares. The minimum and
maximum conversion prices were initially set at €154.50
and €185.40 respectively; this represents a maximum
conversion premium of 20% (see also pages 169 and 172).
Shareholder rights and obligations
The shares convey pecuniary and administrative rights.
The pecuniary rights include in particular the share-
holders’ right to participate in profits (section 58(4) of the
Aktiengesetz (AktG – German Stock Corporation Act)), in
the right to participate in liquidation proceeds (section 271
of the AktG) and preemptive rights to shares in the event of
capital increases (section 186 of the AktG) that can be
disapplied at the Annual General Meeting with the approval
of the Special Meeting of Preferred Shareholders if appro-
priate. Administrative rights include the right to attend the
Annual General Meeting and the right to speak there, to ask
questions, to propose motions and to exercise voting rights.
Shareholders can enforce these rights in particular through
actions seeking disclosure and actions for avoidance.
Each ordinary share grants the holder one vote at the
Annual General Meeting. The Annual General Meeting
elects shareholder representatives to the Supervisory Board
and elects the auditors; in particular, it resolves the appro-
priation of net profit, formally approves the actions of the
Board of Management and the Supervisory Board, resolves
amendments to the Articles of Association, capitalization
measures, authorizations to purchase treasury shares and, if
required, the conduct of a special audit; it also resolves the
removal before the end of their term of office of Super-
visory Board members elected at the Annual General
Meeting and the winding-up of the Company.
Preferred shareholders generally have no voting rights.
However, in the exceptional case that preferred share-
holders are granted voting rights by law (for example, when
preferred share dividends were not paid in one year and
not compensated for in full in the following year), each
preferred share also grants the holder one vote at the
Annual General Meeting. Furthermore, preferred shares
entitle the holder to a €0.06 higher dividend than ordinary
shares (further details on this right to preferred and
additional dividends are specified in Article 27(2) of the
Articles of Association).

145
Corporate Governance Report Remuneration Report Structure and Business Activities Executive Bodies
COR PORATE GOVERNANC E
The Gesetz über die Überführung der Anteilsrechte an der
Volkswagenwerk Gesellschaft mit beschränkter Haftung in
private Hand (VW-Gesetz – Act on the Privatization of
Shares of Volkswagenwerk Gesellschaft mit beschränkter
Haftung) of July 21, 1960, as amended on July 30, 2009,
includes various provisions in derogation of the German
Stock Corporation Act, for example on exercising voting
rights by proxy (section 3 of the VW-Gesetz) and on
majority voting requirements (section 4(3) of the VW-
Gesetz). The European Commission brought an action
against Volkswagen at the European Court of Justice
because it is of the opinion that this majority requirement
does not comply with the Treaty on the Functioning of the
European Union (TFEU, formerly the EU Treaty).
In accordance with the Volkswagen AG Articles of
Association (Article 11(1) of the Articles of Association),
the State of Lower Saxony is entitled to appoint two
members of the Supervisory Board of Volkswagen AG for as
long as it directly or indirectly holds at least 15 percent of
Volkswagen AG’s ordinary shares. In addition, resolutions
by the General Meeting that are required by law to be
adopted by a qualified majority, again notwithstanding the
provisions of the VW-Gesetz, require a majority of more
than 80 percent of the share capital of the Company
represented when the resolution is adopted (Article 25(2)
of the Articles of Association). The European Commission
also considers this provision of the Articles of Association
to be incompatible with the TFEU and brought an action
against Volkswagen at the European Court of Justice in
connection with this.
Shareholdings exceeding 10% of voting rights
Shareholdings in Volkswagen AG that exceed 10% of
voting rights are shown in the notes to the annual financial
statements of Volkswagen AG and in the notes to the Volks-
wagen consolidated financial statements on pages 342 to
349 of this annual report.
Composition of the Supervisory Board
The Supervisory Board consists of 20 members, half of
whom are shareholder representatives. In accordance
with Article 11(1) of the Articles of Association, the State of
Lower Saxony is entitled to appoint two of these share-
holder representatives for as long as it directly or indirectly
holds at least 15% of the Company’s ordinary shares. The
remaining shareholder representatives on the Supervisory
Board are elected by the Annual General Meeting.
The other half of the Supervisory Board consists of
employee representatives elected by the employees in
accordance with the Mitbestimmungsgesetz (German Code-
termination Act). A total of seven of these employee repre-
sentatives are Company employees elected by the workforce;
the other three employee representatives are represen-
tatives of the trade unions elected by the workforce.
The Chairman of the Supervisory Board is generally a
shareholder representative on the Supervisory Board. In the
event of an equality of votes in the Supervisory Board, he has
a casting vote in accordance with the Mitbestimmungsgesetz.
Information about the composition of the Supervisory
Board can be found on pages 148 to 150 of this annual report.
Statutory requirements and requirements of the Articles of
Association with regard to the appointment and removal of
Board of Management members and to amendments to the
Articles of Association
The appointment and removal of members of the Board of
Management are governed by sections 84 and 85 of the
AktG, whereby members of the Board of Management are
appointed by the Supervisory Board for a maximum of five
years. Board of Management members may be reappointed
or have their term of office extended for a maximum of five
years in each case. In addition, Article 6 of the Articles of
Association states that the number of Board of Management
members is stipulated by the Supervisory Board and that
the Board of Management must consist of at least three
persons.
The Annual General Meeting resolves amendments to
the Articles of Association (section 119(1) of the AktG). In
accordance with section 4(3) of the VW-Gesetz as amended
on July 30, 2009 and Article 25(2) of the Articles of Asso-
ciation, Annual General Meeting resolutions to amend the
Articles of Association require a majority of more than
four-fifths of the share capital represented (see also the
information on the European Commission’s opinion on the
compatibility of these provisions with the TFEU on this page).
Powers of the Board of Management, in particular
concerning the issue of new shares and the repurchase
of treasury shares
According to German stock corporation law, the Annual
General Meeting can, for a maximum of five years, authorize
the Board of Management to issue new shares. It can also
authorize the Board of Management, for a maximum of
five years, to issue bonds on the basis of which new shares
are to be issued. The Annual General Meeting also decides
the extent to which shareholders have preemptive rights to
the new shares or bonds. The highest amount of authorized
share capital or contingent capital available for these
purposes is determined by Article 4 of the Articles of
Association of Volkswagen AG, as amended.

146
The Annual General Meeting on April 19, 2012 resolved to
authorize the Board of Management, with the consent of
the Supervisory Board, to increase the share capital by a
total of up to €110.0 million (corresponding to approxi-
mately 43 million shares) on one or more occasions up to
April 18, 2017 by issuing new ordinary and/or nonvoting
preferred bearer shares – including with shareholders’
preemptive rights disapplied – against cash and/or noncash
contributions. This authorization was exercised in August
2012 with the issuance of one new ordinary bearer share
with a notional value of €2.56 as part of the creation of the
integrated automotive group with Porsche. Additionally,
the Board of Management is authorized to increase the
share capital by up to a total of €179.4 million on one or
more occasions up to December 2, 2014 by issuing new
nonvoting preferred shares against cash contributions.
Furthermore, the share capital can be increased by up to
€102.4 million by issuing nonvoting preferred shares, in
order to settle the conversion or option rights of holders or
creditors of convertible bonds or bonds with warrants to be
issued before April 21, 2015. This authorization was
partially exercised in November 2012 with the issuance of a
mandatory convertible note in the amount of €2.5 billion.
Further details on the authorization to issue new shares
and their permitted uses may be found in the notes to the
consolidated financial statements on page 308.
Opportunities to acquire treasury shares are governed
by section 71 of the AktG. At the Annual General Meeting on
April 19, 2012, the Board of Management was most recently
authorized to acquire treasury shares up to a maximum of
10% of the share capital. This authorization applies until
April 18, 2017 and has not so far been exercised.
Material agreements of the parent company in the event of
a change of control following a takeover bid
A banking syndicate granted Volkswagen AG a syndicated
credit line amounting to approximately €5.0 billion that
runs until July 2017, with the option to extend this by
another year.
The syndicate members have the right to call their
portion of the syndicated credit line if Volkswagen AG is
merged with a third party or a subsidiary of another
company. However, this call right does not apply in the
event of a merger by absorption of Porsche Holding SE, one
of its subsidiaries, or one of its holding companies and
Volkswagen AG in which Volkswagen AG is the acquiring
legal entity.
Restrictions on the transfer of shares
Volkswagen AG and Suzuki Motor Corporation have agreed
mutual approval and preemptive tender rights if the shares
held by the other contracting party are to be sold. As of the
reporting date, Volkswagen held a 19.89% stake in Suzuki.

147
Corporate Governance Report Remuneration Report Structure and Business Activities Executive Bodies
COR PORATE GOVERNANC E
Members of the Board of Management and their Appointments
APPOINTMENTS: AS OF DECEMBER 31, 2012
PROF. DR. DR. H.C. MULT.
MARTIN WINTERKORN (65)
Chairman (since January 1, 2007),
Research and Development
July 1, 2000*
Chairman of the Executive Board
of Porsche Automobil Holding SE
November 25, 2009*
Appointments:
FC Bayern München AG, Munich
Salzgitter AG, Salzgitter
DR. RER. POL. H.C.
FRANCISCO JAVIER
GARCIA SANZ (55)
Procurement
July 1, 2001*
Appointments:
Hochtief AG, Essen
Criteria CaixaHolding S.A., Barcelona
PROF. DR. RER. POL. DR.-ING. E.H.
JOCHEM HEIZMANN (61)
China
January 11, 2007*
Appointments:
Lufthansa Technik AG, Hamburg
OBO Bettermann GmbH, Menden
CHRISTIAN KLINGLER (44)
Sales and Marketing
January 1, 2010*
Appointments:
Messe Frankfurt GmbH, Frankfurt am Main
DR.-ING. E.H. MICHAEL MACHT (52)
Production
October 1, 2010*
PROF. DR. RER. POL.
HORST NEUMANN (63)
Human Resources and Organization
December 1, 2005*
Appointments:
Wolfsburg AG, Wolfsburg
DR. H.C. LEIF ÖSTLING (67)
Commercial Vehicles
September 1, 2012*
Appointments:
AB SKF, Gothenburg
ISS A/S, Copenhagen
HANS DIETER PÖTSCH (61)
Finance and Controlling
January 1, 2003*
Chief Financial Officer of
Porsche Automobil Holding SE
November 25, 2009*
Appointments:
Bertelsmann SE & Co. KGaA, Gütersloh
PROF. RUPERT STADLER (49)
Chairman of the Board of
Management of AUDI AG
January 1, 2010*
Appointments:
FC Bayern München AG, Munich
Executive Bodies (Part of the Notes to the Consolidated Financial Statements)
As part of their duty to manage and supervise the
Group’s business, the members of the Board of
Management hold other offices on the supervisory
boards of consolidated Group companies and other
significant investees.
Membership of statutory supervisory boards in
Germany.
Comparable appointments in Germany and abroad.
* The date signifies the beginning or period of
membership of the Board of Management.

148
Members of the Supervisory Board and their Appointments
APPOINTMENTS: AS OF DECEMBER 31, 2012
HON.-PROF. DR. TECHN. H.C.
DIPL.-ING. ETH
FERDINAND K. PIËCH (75)
Chairman
April 16, 2002*
Appointments:
AUDI AG, Ingolstadt
Dr. Ing. h.c. F. Porsche AG, Stuttgart
MAN SE, Munich (Chairman)
Porsche Automobil Holding SE, Stuttgart
Ducati Motor Holding S.p.A., Bologna
Porsche Gesellschaft m.b.H., Salzburg
Porsche Holding Gesellschaft m.b.H.,
Salzburg
Porsche Piech Holding GmbH, Salzburg
Scania AB, Södertälje
Scania CV AB, Södertälje
BERTHOLD HUBER (62)
Deputy Chairman
First Chairman of IG Metall
May 25, 2010*
Appointments:
AUDI AG, Ingolstadt (Deputy Chairman)
Porsche Automobil Holding SE, Stuttgart
Siemens AG, Munich (Deputy Chairman)
DR. JUR. KLAUS LIESEN (81)
July 2, 1987 – May 3, 2006*
Honorary Chairman of the Supervisory Board
of Volkswagen AG (since May 3, 2006)
DR. HUSSAIN ALI AL-ABDULLA (56)
Vice Chairman of Qatar Holding LLC
April 22, 2010*
Appointments:
Gulf Investment Corporation, Safat/Kuwait
Masraf Al Rayan, Doha (Chairman)
Qatar Airways, Doha
Qatar Exchange, Doha (Chairman)
Qatar Holding, Doha (Deputy Chairman)
Qatar Investment Authority, Doha
KHALIFA JASSIM AL-KUWARI (36)
Adviser to the CEO of Qatar Holding LLC
May 3, 2011*
Appointments:
Islamic Bank of Britain, London (Chairman)
Katara Hospitality, Doha
Mowasalat (Karwa), Doha
Qatar Exchange, Doha
Songbird Estates plc, London
JÖRG BODE (42)
Minister of Economic Affairs, Labor and
Transport for the Federal State of Lower
Saxony
November 4, 2009*
Appointments:
Deutsche Messe AG, Hanover
JÜRGEN DORN (46)
Chairman of the Group Works Council
of MAN SE
January 1, 2013*
Appointments (as of January 31, 2013):
MAN SE, Munich
MAN Truck & Bus AG, Munich
(Deputy Chairman)
ANNIKA FALKENGREN (50)
President and Group Chief Executive
of Skandinaviska Enskilda Banken AB
May 3, 2011*
Appointments:
Münchener Rückversicherungs-
Gesellschaft AG, Munich
Securitas AB, Stockholm
DR. JUR. HANS-PETER FISCHER (53)
Chairman of the Board of Management of
Volkswagen Management Association
(since January 1, 2013)
January 1, 2013*
Appointments (as of January 31, 2013):
Volkswagen Pension Trust e.V.,
Wolfsburg
DR. JUR. MICHAEL FRENZEL (65)
June 7, 2001 – April 19, 2012*
UWE FRITSCH (56)
Chairman of the Works Council at the
Volkswagen AG Braunschweig plant
April 19, 2012*
Appointments:
Eintracht Braunschweig GmbH & Co KGaA,
Braunschweig
Eintracht Braunschweig Management
GmbH, Braunschweig
Phantoms Basketball Braunschweig GmbH,
Braunschweig
Volkswagen Coaching GmbH, Wolfsburg
Membership of statutory supervisory boards in
Germany.
● Group appointments to statutory supervisory
boards.
Comparable appointments in Germany and abroad.
* The date signifies the beginning or period of
membership of the Supervisory Board.

149
Corporate Governance Report Remuneration Report Structure and Business Activities Executive Bodies
COR PORATE GOVERNANC E
BABETTE FRÖHLICH (47)
IG Metall,
Department head for coordination of
Executive Board duties and planning
October 25, 2007*
Appointments:
MTU Aero Engines Holding AG, Munich
PETER JACOBS (55)
April 19, 2007 – April 19, 2012*
DAVID MCALLISTER (42)
Minister-President of the Federal State
of Lower Saxony
July 1, 2010*
HARTMUT MEINE (60)
Director of the Lower Saxony and Saxony-
Anhalt Regional Office of IG Metall
December 30, 2008*
Appointments:
Continental AG, Hanover
KME Germany GmbH & Co KG, Osnabrück
PETER MOSCH (41)
Chairman of the General Works Council
of AUDI AG
January 18, 2006*
Appointments:
AUDI AG, Ingolstadt
Porsche Automobil Holding SE, Stuttgart
BERND OSTERLOH (56)
Chairman of the General and Group Works
Councils of Volkswagen AG
January 1, 2005*
Appointments:
Autostadt GmbH, Wolfsburg
Porsche Automobil Holding SE, Stuttgart
Wolfsburg AG, Wolfsburg
Porsche Holding Gesellschaft m.b.H.,
Salzburg
Projekt Region Braunschweig GmbH,
Braunschweig
VfL Wolfsburg-Fußball GmbH, Wolfsburg
Volkswagen Coaching GmbH, Wolfsburg
DR. JUR. HANS MICHEL PIËCH (71)
Lawyer in private practice
August 7, 2009*
Appointments:
AUDI AG, Ingolstadt
Dr. Ing. h.c. F. Porsche AG, Stuttgart
Porsche Automobil Holding SE, Stuttgart
Porsche Cars Great Britain Ltd., Reading
Porsche Cars North America Inc.,
Wilmington
Porsche Gesellschaft m.b.H.,
Salzburg (Chairman)
Porsche Holding Gesellschaft m.b.H.,
Salzburg
Porsche Ibérica S.A., Madrid
Porsche Italia S.p.A., Padua
Porsche Piech Holding GmbH, Salzburg
(Chairman)
Schmittenhöhebahn AG, Zell am See
Volksoper Wien GmbH, Vienna
URSULA PIËCH (56)
Kindergarten teacher with additional
qualifications in Business and Law
April 19, 2012*
DR. JUR. FERDINAND OLIVER PORSCHE (51)
Member of the Board of Management of
Familie Porsche AG Beteiligungsgesellschaft
August 7, 2009*
Appointments:
AUDI AG, Ingolstadt
Dr. Ing. h.c. F. Porsche AG, Stuttgart
Porsche Automobil Holding SE, Stuttgart
PGA S.A., Paris
Porsche Holding Gesellschaft m.b.H.,
Salzburg
Porsche Lizenz- und
Handelsgesellschaft mbH & Co. KG,
Bietigheim-Bissingen
Voith GmbH, Heidenheim
DR. RER. COMM. WOLFGANG PORSCHE (69)
Chairman of the Supervisory Board of Porsche
Automobil Holding SE;
Chairman of the Supervisory Board of
Dr. Ing. h.c. F. Porsche AG
April 24, 2008*
Appointments:
AUDI AG, Ingolstadt
Dr. Ing. h.c. F. Porsche AG, Stuttgart
(Chairman)
Porsche Automobil Holding SE,
Stuttgart (Chairman)
Familie Porsche AG Beteiligungsgesellschaft,
Salzburg (Chairman)
Porsche Cars Great Britain Ltd., Reading
Porsche Cars North America Inc.,
Wilmington
Porsche Gesellschaft m.b.H., Salzburg
(Deputy Chairman)
Porsche Holding Gesellschaft m.b.H.,
Salzburg
Porsche Ibérica S.A., Madrid
Porsche Italia S.p.A., Padua
Porsche Piech Holding GmbH, Salzburg
(Deputy Chairman)
Schmittenhöhebahn AG, Zell am See

150
WOLFGANG RITMEIER (64)
Chairman of the Board of Management of
Volkswagen Management Association
(until December 31, 2012)
April 19, 2007 – December 31, 2012*
Appointments:
Volkswagen Pension Trust e.V.,
Wolfsburg
JÜRGEN STUMPF (58)
Chairman of the Work Council
at the Volkswagen AG Kassel plant
(until November 14, 2012)
January 1, 2005 – December 31, 2012*
BERND WEHLAUER (58)
Deputy Chairman of the General and
Group Works Councils of Volkswagen AG
(until December 10, 2012)
September 1, 2005 – December 31, 2012*
Appointments:
Wolfsburg AG, Wolfsburg
Sitech Sitztechnik GmbH, Wolfsburg
Volkswagen Immobilien GmbH, Wolfsburg
Volkswagen Pension Trust e.V., Wolfsburg
STEPHAN WOLF (46)
Deputy Chairman of the General Works
Council of Volkswagen AG
(since December 10, 2012)
January 1, 2013*
Appointments (as of January 31, 2013):
Wolfsburg AG, Wolfsburg
Sitech Sitztechnik GmbH, Wolfsburg
Volkswagen Pension Trust e.V.,
Wolfsburg
THOMAS ZWIEBLER (47)
Chairman of the Works Council
Volkswagen Commercial Vehicles
May 15, 2010*
COMMITTEES OF THE SUPERVISORY BOARD
As of December 31, 2012
Members of the Executive Committee
Hon.-Prof. Dr. techn. h.c. Dipl.-Ing. ETH
Ferdinand K. Piëch (Chairman)
Berthold Huber (Deputy Chairman)
David McAllister
Bernd Osterloh
Dr. Wolfgang Porsche
Bernd Wehlauer (until December 31, 2012)
Stephan Wolf (since January 25, 2013)
Members of the Mediation Committee in
accordance with section 27(3) of the
Mitbestimmungsgesetz (German
Codetermination Act)
Hon.-Prof. Dr. techn. h.c. Dipl.-Ing. ETH
Ferdinand K. Piëch (Chairman)
Berthold Huber (Deputy Chairman)
David McAllister
Bernd Osterloh
Members of the Audit Committee
Dr. Ferdinand Oliver Porsche (Chairman)
Bernd Wehlauer (Deputy Chairman,
until December 31, 2012)
Babette Fröhlich
Dr. jur. Michael Frenzel (until April 19, 2012)
Annika Falkengren (since April 19, 2012)
Peter Mosch (Deputy Chairman,
since January 25, 2013)
Members of the Nomination Committee
Hon.-Prof. Dr. techn. h.c. Dipl.-Ing. ETH
Ferdinand K. Piëch (Chairman)
David McAllister
Dr. Wolfgang Porsche
Members of the Committee for Major
Shareholder Business Relationships
(until September 21, 2012)
Hon.-Prof. Dr. techn. h.c. Dipl.-Ing. ETH
Ferdinand K. Piëch (Chairman)
Berthold Huber (Deputy Chairman)
Jörg Bode
Dr. Michael Frenzel (until April 19, 2012)
Bernd Osterloh
Dr. Wolfgang Porsche
Jürgen Stumpf
Bernd Wehlauer
Members of the Integrated Automotive
Group Committee
(until September 21, 2012)
Hon.-Prof. Dr. techn. h.c. Dipl.-Ing. ETH
Ferdinand K. Piëch (Chairman)
Bernd Osterloh (Deputy Chairman)
David McAllister
Bernd Wehlauer
Membership of statutory supervisory boards in
Germany.
● Group appointments to statutory supervisory
boards.
Comparable appointments in Germany and abroad.
* The date signifies the beginning or period of
membership of the Supervisory Board.

Management Report
Ma
na
ge
Me
nt
Re
po
Rt
t h e Vo l k swag e n g Ro u p ’ s s h a R e o f t h e g l o ba l pa ss e n g e R c a R M a R k e t (as percent)
12.812.3
11.3
20112010 2012
The Volkswagen Group again lifted vehicle deliveries year-on-year in the reporting period despite the challenging market envi-ronment, expanding its strong position in the global markets; its share of the passenger car market increased from 12.3% to 12.8%.

M a n ag eM e nt Re p o Rt
153 Business Development
166 Shares and Bonds
174 Results of Operations, Financial Position and Net Assets
188 Volkswagen AG (condensed, according to the German Commercial Code)
192 Value-Enhancing Factors
226 Risk Report
237 Report on Expected Developments

153MANAGEMENT REPORT
Business Development Shares and Bonds Results of Operations, Financial Position and Net Assets Volkswagen AG (HGB) Value-Enhancing Factors Risk Report Report on Expected Developments
GLOBAL ECONOMY LOSES MOMENTUM
During the reporting period, the global economy
registered slower growth than in the previous year.
Industrialized nations achieved only low levels of growth
as a result of structural obstacles, particularly due to the
overburdened budgets of some countries. Emerging market
economies continued to perform better than average, but
growth rates were still lower. Inflation was moderate
despite the expansionary monetary policies of many central
banks. The global economy expanded by 2.6% in 2012,
down from 3.0% in the previous year.
Europe/Remaining markets
In Western Europe, GDP declined by an average of 0.2%
compared with a 1.5% rise in the previous year. A few
northern European countries joined the southern
European EU countries in recording negative growth rates.
The overall unemployment rate in Europe rose to 11.8%
(previous year: 10.6%), but the figure in Greece, Ireland,
Portugal and Spain was much higher than this average.
Average GDP growth in Central and Eastern Europe declined
to 2.5% (previous year: 4.8%).
The South African economy grew by 2.5% (previous
year: 3.5%), but unemployment remained at a high level.
Germany
The weaker global economy and ongoing eurozone crisis
meant that Germany’s rate of economic expansion in the
year under review also fell short of the prior-year figure.
The positive labor market trend continued in 2012 and the
ensuing rise in incomes stimulated private consumption
and stabilized the economy. Nevertheless, the German
economy grew by an average of just 0.9% during the year
(previous year: 3.1%).
North America
The US economy recorded growth of 2.2% in 2012
compared with 1.8% in the previous year. Unemployment
declined only slightly in spite of the continued extremely
expansionary monetary policy. The US dollar was volatile
against the euro during the period, but ended the year at
roughly its starting level. Canada’s GDP rose by 2.0%
(previous year: 2.6%) and the Mexican economy expanded
by 3.8% (previous year: 3.9%).
South America
GDP growth declined to 1.0% in Brazil (previous year:
2.7%), and dropped sharply in Argentina to 1.7% (previous
year: 8.9%). Brazil saw a slight decline in inflation, while
Argentina’s inflation rate remained extremely elevated.
Asia-Pacific
Asia’s emerging economies continued to register very
positive, albeit less dynamic, growth in 2012. At 7.8%,
China’s economic growth was slower than in the previous
year (9.3%), but was still above the central government’s
target rate of 7.5%. The Indian economy expanded by 5.1%
(previous year: 6.9%). The Japanese economy expanded
by 2.0% (previous year: –0.5%), as it recovered from the
natural disasters in 2011.
Business Development Volkswagen Group delivers more than nine million vehicles for the first time
The global economic climate deteriorated significantly in fiscal year 2012. This had a clearly negative
impact on parts of the automotive industry. In spite of this, the Volkswagen Group further strengthened
its market position: for the first time, the number of vehicles delivered to customers passed the nine
million mark. This corresponds to an increase of 12.2% compared with the previous year.

154
EXCHANGE RATE MOVEMENTS FROM DECEMBER 2011 TO DECEMBER 2012
Index based on month- end pr ices: December 31, 2011 = 100
D J F M A M J J A S O N D
EUR to USD
EUR to JPY
EUR to GBP
115
110
105
100
95
90
120
DEMAN D FOR PASSENGER CARS AN D LIGHT COMMERCIAL
VEHICLES REAC HES N EW RECORD H IGH
Global passenger car sales rose by 7.2% to 66.6 million
vehicles in 2012, exceeding the previous record achieved
in 2011. All regions contributed to this success, with the
exception of Western Europe. In particular, double-digit
growth rates in the markets of North America and in the
Asia-Pacific region bolstered this development. Demand in
South America reached an all-time high. New vehicle sales
also rose in Central and Eastern Europe, but did not reach
the levels seen in 2007 and 2008. South Africa continued
the upward trend of the past two years. Global passenger
car production rose by 6.0% to 70.5 million units in the
reporting period.
Sector-specific environment
The established passenger car markets turned in a mixed
performance in fiscal year 2012. While some industri-
alized countries were negatively affected by the debt crisis
and its repercussions, others – including Germany – profited
from the still robust demand in some growth markets in
the first half of the year.
The extensive development of the major markets in
China and Brazil, the expansion of activities in India and
the ability to meet demand in Russia are becoming increas-
ingly important for the automotive industry.
Many Asian and African markets are showing signs of
further easing in trade. However, it cannot be ruled out
that these countries will fall back on protectionist measures
in the event of another global economic slump.
Europe/Remaining markets
As expected, new passenger car registrations in Western
Europe declined year-on-year to 11.7 million vehicles
(–8.2%), the lowest overall market volume recorded since
1993. The sharp market declines, particularly in the
Southern European markets, were mainly attributable to
the effects of the sovereign debt crisis, the weak state of the
economy, rising unemployment and the ensuing uncer-
tainty among market participants. Demand slumped in the
volume markets of Italy (–19.9%), France (–14.1%) and
Spain (–13.4%). By contrast, in the United Kingdom, high
demand from private customers led to market growth of
5.3%. At 54.9%, the market share of diesel vehicles
(passenger cars) in Western Europe in 2012 nearly reached
the previous year’s record high.
The passenger car markets in Central and Eastern
Europe continued their recovery in the reporting period,
with an increase of 5.9% to 3.9 million units. As in the
previous two years, the main growth driver was the Russian
market, where vehicle sales fell only slightly short of the
record level seen in 2008, rising 10.9% to 2.7 million
units. After the government support measures came to an
end, the main beneficiaries were foreign suppliers with
Russian production facilities. At 0.7 million passenger cars,
the Central European EU states recorded a lower market
volume (–3.7%). The passenger car markets developed
positively in Hungary (+6.7%), the Baltic States (+2.4%),
Slovakia (+2.0%) and the Czech Republic (+0.4%). By
contrast, new passenger car registrations were down in
part significantly year-on-year in Romania (–25.6%),
Slovenia (–16.8%), Bulgaria (–4.3%) and Poland (–0.4%).

155MANAGEMENT REPORT
Business Development Shares and Bonds Results of Operations, Financial Position and Net Assets Volkswagen AG (HGB) Value-Enhancing Factors Risk Report Report on Expected Developments
ECONOMIC GROWTH
Percentage change in GDP
2008 2009 2010 2011 2012
4
2
0
-6
Global economy
USA
Western Europe
Germany
6
-2
-4
In Turkey, vehicle sales declined to 549 thousand (–7.4%)
in 2012, largely due to weaker demand in the first half of
the year.
New registrations in the South African market rose
11.0% to 443 thousand units in the reporting period. This
trend was positively impacted by better financing options.
Germany
In Germany, new passenger car registrations were down
slightly year-on-year. The 2.9% decline to 3.1 million
vehicles is entirely attributable to buyer reluctance among
private customers. The rising uncertainty about global eco-
nomic developments affected demand in the second half of
the year, in particular. The market volume for light com-
mercial vehicles also failed to reach the previous year’s
level. Overall, new registrations declined by 6.2% to 226
thousand vehicles. The 2012 domestic production and export
figures were also lower than in the prior-year period.
Passenger car production declined by 3.7% to 5.4 million
vehicles, while passenger car exports decreased by 2.6%
to 4.1 million units. This was mainly due to substantially
lower exports to the eurozone as a result of the ongoing
recessionary trends.
North America
In the North American market, demand for passenger cars
and light commercial vehicles (up to 6.35 tonnes) rose
sharply in the reporting period. The 12.4% increase to
17.2 million units led to the best sales figures for the past
five years. In the USA, sales rose by 13.4% to 14.5 million
vehicles, largely due to higher replacement demand and
favorable lending conditions. The US market registered
the highest absolute increases in unit sales worldwide in
2012, but was still well below the pre-crisis levels achieved
in 2007. In Canada, the overall market volume was higher
than in the previous year, up 5.7% to 1.7 million vehicles
in the reporting period. The Mexican market recorded
10.4% growth in new registrations to approximately 1.0
million units.
South America
During the reporting period, demand for passenger cars in
South America exceeded the previous all-time high recorded
in 2011. In Brazil, new passenger car registrations rose
7.7% to 2.9 million vehicles. The new record figure is
mainly attributable to a temporary tax cut. Only vehicles
produced in Brazil benefited from this measure, so the con-
tribution made by imports declined sharply in the second
half of 2012. At 442 thousand units, Brazil’s vehicle
exports were much lower than in the previous year (–20.1%).
This decline was mainly caused by the lower exports to
Argentina.
In the Argentinian automotive market, demand was
down 5.4% on the previous year’s record, at 587 thousand
units. This is primarily attributable to the import restric-
tions imposed by the Argentinian government to protect
domestic industry, which made imports considerably more
difficult and caused them to decline steeply.
Asia-Pacific
Alongside North America, the Asia-Pacific region was the
main driver of global demand for cars in 2012. The
number of new passenger car registrations in the region
rose by 13.3% to an all-time high of 25.7 million vehicles.
In China, the market volume amounted to 13.5 million
passenger cars in 2012. The high growth rate of 9.3% was
largely due to foreign brands.

156
Growth in the Indian passenger car market again accel-
erated in the reporting period, up 11.1% to 2.5 million
vehicles. This new high was recorded despite high interest
rates, rising fuel costs and weaker economic growth than
in the previous year. The Indian automotive industry bene-
fited in particular from the much wider range of diesel
models on offer.
The Japanese passenger car market recorded a partic-
ularly large increase in new registrations, which rose
29.5% to 4.6 million vehicles. The positive development is
attributable in particular to the previous year’s weak overall
market as a consequence of the natural disasters, as well as
government subsidy programs for energy efficient vehicles.
DEMAN D FOR TRUCKS DECLI N ES, BUSES EXCEED PRIOR-YEAR
FIGU RE
As industrial goods, commercial vehicles are influenced by
the general economic environment, which means that the
market is highly cyclical. Although volumes are significantly
lower, the complexity of the trucks and buses range even
exceeds that of passenger cars, since they are produced in
accordance with the customers’ requirements. The prior-
ities for commercial vehicle customers are overall running
costs, vehicle reliability and the service provided.
In fiscal year 2012, global demand for mid-sized and
heavy trucks with a gross weight of more than six tonnes
declined overall. A total of 2.5 million vehicles were sold
worldwide, representing a decrease of 8.9%. The growth
markets of China, Brazil and India fell significantly short
of the previous year’s level in some areas due to the general
economic and regulatory conditions. In Europe, the
continuing sovereign debt crisis and weak economic situ-
ation negatively impacted demand for trucks and buses. In
contrast to the global trend, sales in the USA and Russia
were up significantly year-on-year.
In Western Europe, vehicle sales declined by 10.1% to
a total of 236 thousand units due to the uncertainty caused
by the sovereign debt crisis and the weak state of the
economy.
Central and Eastern Europe recorded extremely high
growth in the mid-sized and heavy trucks segments. A total
of 175 thousand new vehicles were sold in the reporting
period, surpassing the prior-year figure by 23.9%. The
strong economic situation in Russia, the largest market in
Eastern Europe, led to a 23.3% rise in demand. However,
the market there slowed down in the second half of the
year after the introduction of a new recycling fee for
vehicles.
The sales figures for mid-sized and heavy trucks in North
America rose by 11.9% to 427 thousand units in 2012. Of
this figure, 340 thousand vehicles were sold in the US
market. Despite the economic uncertainty that took hold in
the second half of the year and the ensuing decline in
incoming orders, the truck market grew 10.9% year-on-
year.
Vehicle sales in South America declined in 2012. At
183 thousand units, vehicle sales were down 18.0% on the
previous year. Brazil, the continent’s largest market,
declined considerably compared with 2011 due to the
introduction of the new Euro 5 emission standard and the
weak economic performance. Truck sales recorded a
19.6% decline to 133 thousand vehicles.
With the exception of the Chinese market, the Asia-
Pacific region almost matched the prior-year sales levels in
fiscal year 2012. New registrations amounted to 533 thousand
vehicles.
The world’s largest truck market, China, significantly
underperformed the previous year’s figure in 2012 due to
weaker economic growth, a slower rise in investments and
lower consumer demand. A total of 916 thousand units
were delivered, 22.0% fewer than in 2011.
In India, the high level of the previous year was not
matched in 2012 due to the slowdown in economic growth.
At 265 thousand units, sales of mid-sized and heavy trucks
were 15.3% lower year-on-year.
In fiscal year 2012, the global market for buses
recorded an increase against the previous year. Western
Europe was the only region to see a decline in bus sales in
2012. By contrast, China, the world’s largest bus market,
registered significant growth mainly as a result of the rising
demand for coaches.
TREN DS I N TH E M ARKETS FOR POWER ENGI N EERI NG
The markets for power engineering are subject to differing
regional and economic influences. Consequently, their busi-
ness growth trends are generally independent of each other.
In the area of shipbuilding, the high, albeit declining
number of deliveries further increased the excess capac-
ities in the merchant fleet. The resulting decline in shipping
rates combined with high operating and fuel costs led to
lower orders for new merchant ships. Ongoing difficulties
in ship financing exacerbated this trend. By contrast,
orders for offshore and special ships remained buoyant.
The special market for government vessels also performed
well.

157MANAGEMENT REPORT
Business Development Shares and Bonds Results of Operations, Financial Position and Net Assets Volkswagen AG (HGB) Value-Enhancing Factors Risk Report Report on Expected Developments
With moderate economic growth and global demand for
energy still high, the market for decentralized diesel and
gas engine power plants slowed down slightly in 2012,
although growth remained relatively high. While there was
a slowdown in the diesel and oil fired power plants market,
as expected, orders for gas fired power plants increased,
confirming the trend towards this type of power plant.
Orders for new compressors and turbines declined
slightly due to the weaker economic growth. Although there
was a high level of interest from customers, economic uncer-
tainties and difficult financing conditions led to order place-
ment delays.
Industrial facilities where turbomachinery, turbo gear
units and slide bearings are used still have a significant
investment requirement. Oil and gas investments remained
high due to the rise in oil prices.
The development of offshore wind energy has fallen well
short of expectations so far. Technical problems, partic-
ularly as regards transmission of power to the mainland,
and difficult financing conditions have delayed the construc-
tion of new wind farms.
DEMAN D FOR FI NANCIAL SERVICES
Global demand for automotive-related financial services
remained high in the reporting period. Customers are
paying closer attention to the total cost of mobility and are
increasingly deciding just to use a car, rather than actually
buying one. In view of this, new mobility services such as
car sharing are gaining in importance.
The European markets experienced higher demand for
captive automotive-related financial services in 2012,
despite a decline in new car sales. The close cooperation
between vehicle manufacturers and their financial service
providers, which produced attractive, customer-oriented
campaigns, proved an effective growth driver.
The leasing sector in Germany continued to expand in
both the commercial vehicle and passenger car segments
in fiscal year 2012.
In North America, demand for financial services stabi-
lized at a high level. In the USA, the market for financing
and leasing was well diversified: demand for new vehicle
financing from captive financial service providers was still
high despite intense competition from noncaptive banks.
Demand for financial services continued to rise in Mexico.
This was mainly driven by the stable lending conditions
and interest rates, as well as growing interest in modular
mobility products.
The Brazilian market continued its growth trajectory in
the reporting period, strengthened by an increase in retail
lending. As in the previous year, the rise in individual
mobility needs led to substantial sales growth of Consorcio,
a lottery-style financing product. In Argentina, demand for
automotive financial services increased amid the weaker
economic growth.
The market for financial services in the Asia-Pacific
region performed very well in 2012. In China, there is fur-
ther potential to acquire new customers for automotive-
related financing, as at the moment only around 15% of
vehicle purchases are loan-financed. Higher domestic
demand in Japan positively impacted financial services
sales volumes. Demand for automotive financial services
continued to rise in India.
N EW GROUP MODELS I N 2012
The Volkswagen Group selectively expanded its model
portfolio in key segments in 2012. The first products based
on the Modular Transverse Toolkit (MQB) were also
introduced. This will form the basis for many other new
models in the coming years. With the new Group brands,
Porsche and Ducati, the Group’s range now comprises
around 280 passenger car, commercial vehicle and motor-
cycle models and their derivatives. The Group covers almost
all key segments and body types, with offerings from small
cars to super sports cars in the passenger car sector, and
from small pickups to heavy trucks and buses in the
commercial vehicles sector, as well as motorcycles. We will
continue to resolutely move into open market segments that
offer profitable opportunities for us.
The Volkswagen Passenger Cars brand premiered a
large number of new vehicles in 2012. As the highest-
volume Group model and one of the biggest-selling cars
worldwide, the focal point was the new, seventh generation
Golf, which is still setting new standards in the compact
segment. We moved into key volume and niche segments
with the four-door up! and the Passat Alltrack offroad
estate model. The Polo GTI, the new Beetle Convertible and
the upgrade to the CC further strengthened Volkswagen’s
brand image. Volkswagen took account of special customer

158
and market requirements in key regions outside Europe
through product upgrades and country-specific models.
The biggest selling model in Brazil overall, the Gol, and its
notchback derivative, the Voyage, were upgraded in 2012.
In China, the compact notchback saloons Sagitar and New
Lavida and the upgraded New Bora were launched. In
addition, a successor to the Santana – the first Group model
to be sold in China – was introduced after almost 30 years.
Looking to the future, Volkswagen drove forward the electri-
fication of its product range with the launch of the Jetta
Hybrid – the Group’s first hybrid model in the compact class.
Another highlight was the eco-up!, the most economical gas-
powered series-produced car, which generates just 79 g/km
of CO2.
The Audi brand put its technical and sporting expertise
to the test in 2012 and again met its own high standards. In
the premium compact segment, the popular Audi A3 was
updated to be the first Group vehicle based on the MQB.
Additional derivatives were launched in the form of the
Audi A4 allroad, RS 4 Avant, A6 allroad quattro, S6 saloon
and Avant, S7 Sportback and S8 models, which occupy
different premium segments. Key volume models, including
the Audi A4 saloon and Avant, the Audi Q5, and the
versions of the Audi A4 and Audi A6 specially adapted with
longer wheelbases for markets such as China, were
upgraded or modernized. The Audi RS5 Coupé was also
upgraded. The Audi brand demonstrated its growing
electrical expertise with the launch of the Audi A6 hybrid
and Audi A8 hybrid.
With the new Rapid, a locally produced version of which
was launched on the Indian market in 2011, the ŠKODA
brand presented a compact notchback saloon, specially
designed for international growth markets like China and
Russia, as well as price-sensitive customer segments in
Europe. Like the up! at Volkswagen, the four-door Citigo
supplements the offering in the expanding small car
segment.
Spanish brand SEAT updated the Leon – again based on
the MQB. Its sporty appearance stands out in the compact,
everyday hatchback segment. As a sister model to the ŠKODA
Rapid, the Toledo will open up new market segments for
SEAT. The upgrades of the high-volume Ibiza product
family and the launch of the four-door version of the Mii
small car were also significant.
New Group brand Porsche emphasized its dominance
of the global premium and sports segment with its new
models. The relaunch of the iconic 911 Carrera was a high-
light. The updated Porsche Boxster and Porsche Boxster S
roadsters with mid-mounted engines, now in their third
generation, boast improved dimensions and significantly
reduced weight and fuel consumption. With GTS versions
of the Panamera and Cayenne, Porsche expanded its offering
in these two ranges with particularly sporty derivatives.
The Group’s luxury brands also introduced fascinating
new models and derivatives in the market in the reporting
period. Bentley debuted the V8-powered Continental GT
and Continental GTC models, as well as the Continental GT
Speed with a W12 engine. Lamborghini presented a new,
even more striking design of its most successful super sports
car ever, the Gallardo LP 560-4 as a Coupé and Spyder.
Bugatti confirmed its unique position by launching the
Veyron Grand Sport Vitesse, the fastest roadster of all time
with a top speed of 431 km/h.
Volkswagen Commercial Vehicles introduced two new
special models – the Caddy Edition 30 and the Multivan
Edition 25 – and thus confirmed its decades-long dominance
of the light commercial vehicles market. The California
Edition Beach strengthened the brand’s presence in the
camper van market. Another fuel-efficient commercial
vehicle was launched in the form of the BlueTDI Crafter
panel van.
In 2012, the first Scania trucks whose engines meet the
new Euro 6 emissions standard were registered.
MAN launched the new premium NEOPLAN Jetliner,
which can be used as both a public service bus and coach.

159MANAGEMENT REPORT
Business Development Shares and Bonds Results of Operations, Financial Position and Net Assets Volkswagen AG (HGB) Value-Enhancing Factors Risk Report Report on Expected Developments
VOLKSWAGEN GROU P DELIVERI ES BY MONTH
Vehicles in thousands
900
800
700
600
J F M A M J J A S O N D
1,000
500
2012
2011
VOLKSWAGEN GROU P DELIVERI ES
The Volkswagen Group delivered more than 9,275,909
vehicles to customers worldwide in 2012. This corresponds
to an increase of 1,010,643 or 12.2% compared with the
previous year. The chart on this page shows that the
delivery figures were higher in all twelve months of the
reporting period than in the same months of the previous
year. Details for deliveries of passenger cars and light
commercial vehicles, and of trucks and buses, are provided
separately in the following.
VOLKSWAGEN GROU P DELIVERI ES* 2012 2011 %
Passenger cars and
light commercial
vehicles 9,074,283 8,160,408 +11.2
Trucks and buses 201,626 104,858 +92.3
Total 9,275,909 8,265,266 +12.2
* Deliveries for 2011 have been updated to reflect subsequent statistical trends.
PASSENGER CAR AN D L IGHT COMMERCIAL VEHICLE DELIVERI ES
With its brands, the Volkswagen Group has a presence in
all relevant automotive markets around the world. Western
Europe, China, Brazil, the USA, Russia, Argentina and
Mexico are currently the key sales markets for the Group.
The Group continued to extend its strong competitive
position in the reporting period thanks to its wide range of
attractive and environmentally friendly models. We have
increased our market share in key core markets and again
recorded an encouraging global increase in demand.
The Volkswagen Group delivered 9,074,283 passenger
cars and light commercial vehicles to customers in 2012.
Since August 1, 2012, these figures also include Porsche
brand vehicles. The previous year’s record figure was
exceeded by 11.2%. With the exception of the SEAT brand,
which was hit particularly hard by the difficult market
conditions in Western Europe, and Bugatti, all Group brands
surpassed their 2011 sales figures. Volkswagen Passenger
Cars, Audi, ŠKODA and Volkswagen Commercial Vehicles
all recorded their best ever delivery figures. Bentley and
Lamborghini also registered strong growth rates. Demand
for Volkswagen Group models was higher than in the
prior-year period in virtually all markets outside Western
Europe. The table on page 161 gives an overview of deliveries
to customers in the different markets and of the respective
passenger car market shares held by the Volkswagen
Group. We describe the demand trends for Group models
in the individual markets in the following sections.

160
WORLDWI DE DELIVERI ES OF TH E GROU P’S MOST SUCCESSFU L MODELS I N 2012
Vehicles in thousands
324
836
809
784
760
508
449
410
Golf
Passat
Tiguan
ŠKODA Octavia
Gol
Jetta
Polo
Audi A4
Deliveries in Europe/Remaining markets
The overall market slowdown in Western Europe in 2012
resulted in our deliveries to customers in this region
declining year-on-year. Our sales figures were down on the
previous year in all major markets here, apart from
Germany and the United Kingdom. Vehicles sold in Western
Europe accounted for 33.3% (previous year: 38.4%) of the
Group’s total delivery volumes. Except for SEAT, all volume
brands sold more vehicles in the reporting period than in
the previous year. The Tiguan, Audi A6, ŠKODA Roomster,
ŠKODA Yeti, SEAT Alhambra, Amarok and Crafter models
all registered positive growth rates. The new up!, Beetle,
Golf Cabriolet, Audi Q3, ŠKODA Citigo and SEAT Mii models
were also very popular. The Volkswagen Group’s share of
the overall passenger car market in Western Europe rose to
24.4% (23.0%).
The Volkswagen Group’s sales figures in Central and
Eastern Europe surpassed the prior-year level by 17.6%.
We recorded the highest growth rates in Russia (+38.8%)
and the Ukraine (+29.6%). The Polo Sedan, Tiguan, Passat,
CC, Touareg, the Audi A3, A6 and Q7, the ŠKODA Octavia
and all Volkswagen Commercial Vehicles models experienced
higher demand in Central and Eastern Europe than in the
previous year. The new Jetta, Audi Q3 and ŠKODA Citigo
models were also very popular.
The Volkswagen Group’s deliveries in the South African
market increased by 10.0%. Our entry-level models were
particularly sought-after. The Group’s market share of
22.7% remained unchanged.
Demand for Group vehicles in the Middle East region
grew by 17.6% compared with 2011.
Deliveries in Germany
Group deliveries to customers in the German market
increased by 1.9% in fiscal year 2012 compared with the
previous year. By contrast, the overall passenger car market
volume declined by 2.9%. The Tiguan, CC, Touareg, Audi
A1, Audi A6, ŠKODA Roomster, ŠKODA Yeti, SEAT Ibiza,
SEAT Leon and Crafter models experienced the highest
growth rates. The new up!, Beetle, Golf Cabriolet, Audi Q3,
ŠKODA Citigo and SEAT Mii models were also very popular.
At the end of the reporting period, eight Volkswagen Group
models led the Kraftfahrtbundesamt (KBA – German Federal
Motor Transport Authority) registration statistics in their
respective segments: the up!, Polo, Golf, Passat, Touran,
Tiguan, Audi A6/A7 and Caddy. The Golf continued to top
the list of the most frequently registered passenger cars in
Germany. We lifted the Volkswagen Group’s market share
in the German passenger car market to 37.7% in the
reporting period (previous year: 35.9%), further cementing
our market leadership.
Deliveries in North America
Demand for Group vehicles in the US market grew by
34.2% year-on-year, outperforming the positive trend in
the overall market (+13.4%). The Golf, Tiguan, Passat,
Audi Q5, Audi A6 and Audi Q7 models recorded the highest
growth rates. In Canada we recorded year-on-year growth
of 15.7%. Demand for the Passat, Touareg, Audi A4, Audi
Q5 and Audi A7 models was encouraging there. The Group’s
sales figures in Mexico surpassed the prior-year level by
7.8%. Demand increased for the Voyage, Beetle, Passat,
Audi A1 and SEAT Ibiza models.

161MANAGEMENT REPORT
Business Development Shares and Bonds Results of Operations, Financial Position and Net Assets Volkswagen AG (HGB) Value-Enhancing Factors Risk Report Report on Expected Developments
Deliveries in South America
The Volkswagen Group’s deliveries in the South America
region rose 8.2% in the reporting period. After declining
slightly in 2011, our sales figures in Brazil were again
positive in 2012 (+10.7%). This was attributable to a
temporary tax cut for new vehicles as well as the market
launch of the new generations of the Gol and the Voyage.
The Fox was also highly popular and sales of the Amarok
almost doubled.
Demand for Volkswagen Group vehicles declined by
5.1% in Argentina. However, the Fox, Audi A3 and Saveiro
models recorded stronger demand than in 2011. With a
market share of 25.0% (previous year: 25.1%), the Volks-
wagen Group maintained its market leadership.
PASSENGER CAR AN D LIGHT COMMERCIAL VEH ICLE DELIVERI ES TO CUSTOMERS BY MARKET 1
D E L I V E R I E S
( U N I T S ) C H A N G E
S H A R E O F PA S S E N G E R C A R
M A R K E T ( % )
2012 2011 (%) 2012 2011
Europe/Remaining markets 4,053,038 3,990,679 +1.6
Western Europe 3,023,366 3,130,072 –3.4 24.4 23.0
of which: Germany 1,175,514 1,153,070 +1.9 37.7 35.9
United Kingdom 434,798 408,869 +6.3 19.8 19.3
France 279,127 299,330 –6.7 14.2 12.8
Italy 196,964 244,953 –19.6 13.2 13.1
Spain 175,810 212,549 –17.3 24.0 24.7
Central and Eastern Europe 644,347 547,779 +17.6 15.4 13.9
of which: Russia 317,735 228,977 +38.8 11.1 8.9
Czech Republic 85,347 82,874 +3.0 46.3 45.4
Poland 74,569 73,391 +1.6 25.4 24.8
Remaining markets 385,325 312,828 +23.2
of which: Turkey 123,811 107,913 +14.7 17.6 13.7
South Africa 109,396 99,427 +10.0 22.7 22.7
North America2 841,540 666,827 +26.2 4.9 4.3
of which: USA 596,078 444,187 +34.2 4.1 3.5
Mexico 164,890 153,023 +7.8 16.7 16.9
Canada 80,572 69,617 +15.7 4.8 4.4
South America 1,010,112 933,133 +8.2 19.6 18.9
of which: Brazil 780,195 704,726 +10.7 23.0 22.3
Argentina 169,043 178,170 –5.1 25.0 25.1
Asia-Pacific 3,169,593 2,569,769 +23.3 12.2 11.3
of which: China 2,812,051 2,258,614 +24.5 20.8 18.2
India 114,084 111,689 +2.1 4.5 4.9
Japan 82,078 71,729 +14.4 1.8 2.0
Worldwide 9,074,283 8,160,408 +11.2 12.8 12.3
Volkswagen Passenger Cars 5,738,449 5,091,035 +12.7
Audi 1,455,123 1,302,659 +11.7
ŠKODA 939,202 879,184 +6.8
SEAT 321,002 350,009 –8.3
Bentley 8,510 7,003 +21.5
Lamborghini 2,083 1,602 +30.0
Porsche 59,513 – –
Volkswagen Commercial Vehicles 550,370 528,878 +4.1
Bugatti 31 38 –18.4
1 Deliveries and market shares for 2011 have been updated to reflect subsequent statistical trends. The Porsche brand’s deliveries are included as from August 1, 2012.
2 Overall markets in the USA, Mexico and Canada include passenger cars and light trucks.

162
Deliveries in the Asia-Pacific region
The Volkswagen Group increased sales in the Asia-Pacific
region by 23.3% compared with the prior-year figure, out-
performing the passenger car market as a whole (+13.3%).
Growth in the region was again driven by the Chinese
market, which saw demand for Group vehicles rise by
24.5%. Virtually all models contributed to this positive
result. We extended our leadership of the Chinese market
with a market share of 20.8% (previous year: 18.2%).
Deliveries to customers in the Indian market increased
by 2.1%. The Passat, Audi A4, Audi A6 and ŠKODA Rapid
models recorded the highest growth rates.
In Japan, our sales figures were up 14.4% year-on-year.
The Beetle, Passat and Audi A6 models were particularly
popular.
Deliveries to customers continued to develop positively
in the other markets in the Asia-Pacific region.
DELIVERI ES OF TRUC KS AN D BUSES
In fiscal year 2012, the Volkswagen Group delivered 201,626
trucks and buses to customers worldwide, with trucks
accounting for 180,055 units. In any comparison with the
previous year, it should be noted that the MAN brand’s
sales figures are included as from November 9, 2011. The
Scania brand registered a 15.9% decline in deliveries
year-on-year to 67,401 units.
Demand for Volkswagen Group trucks and buses in Western
Europe amounted to 68,557 units, of which 64,544 were
trucks. The Western European market continues to be domi-
nated by the ongoing sovereign debt crisis and the uncer-
tainty associated with it.
In Central and Eastern Europe, we delivered 27,502
vehicles, of which 26,887 were trucks. In Russia, the positive
trend in the relevant economic sectors, such as the construc-
tion industry and the consumer goods market, continued to
have a positive impact on market growth and thus on our
Group brands. However, the market slowed down in the
second half of the year after the introduction of a new
recycling fee for all vehicles.
In the Remaining markets, we sold 21,052 vehicles, of
which 18,626 units were trucks.
In the North American markets we delivered 410 trucks
and 1,381 buses in the reporting period.
In South America, the Volkswagen Group sold 71,750
vehicles, of which 60,294 were trucks. We delivered 51,137
trucks and 8,833 buses to customers in the Brazilian market.
The implementation of the Euro 5 emission standard had a
dampening effect.
Sales to customers in the markets of the Asia-Pacific
region comprised 10,974 units, 9,294 of which were trucks.
The Group delivered 2,983 trucks and 196 buses in the
Chinese market.
TRUCK AN D BUS DELIVERI ES TO CUSTOMERS BY MAR KET*
D E L I V E R I E S
( U N I T S ) C H A N G E
2012 2011 (%)
Europe/Remaining markets 117,111 67,526 +73.4
Western Europe 68,557 38,073 +80.1
Central and Eastern Europe 27,502 15,194 +81.0
Remaining markets 21,052 14,259 +47.6
North America 1,791 813 x
South America 71,750 29,709 x
of which: Brazil 59,970 23,497 x
Asia-Pacific 10,974 6,810 +61.1
of which: China 3,179 1,672 +90.1
Worldwide 201,626 104,858 +92.3
Scania 67,401 80,108 –15.9
MAN 134,225 24,750 x
* The MAN brand’s deliveries are included as from November 9, 2011.

163MANAGEMENT REPORT
Business Development Shares and Bonds Results of Operations, Financial Position and Net Assets Volkswagen AG (HGB) Value-Enhancing Factors Risk Report Report on Expected Developments
DELIVERIES IN THE POWER ENGIN EERING SEGMENT
Orders in the Power Engineering segment are usually part
of major investment projects. Lead times typically range
from just under one year to several years and partial deliv-
eries as construction progresses are common. Accordingly,
there is a time lag between incoming orders and sales
revenue from the new construction business.
Sales revenue in the Power Engineering segment was
largely driven by Engines & Marine Systems and Turbo-
machinery, which generated about three-quarters of the
overall revenue volume.
ORDERS RECEIVED I N THE PASSENGER CARS AN D LIGHT
COMMERCIAL VEHICLES SEGMENT IN WESTERN EUROPE
Demand for Group models in Western Europe was down
compared with 2011 due to the declining markets (including
Germany). This development was also reflected in the level
of orders received in Western Europe as a whole, which
decreased by 6.6%. In Western Europe excluding Germany,
the number of orders received was 6.7% lower than in the
previous year.
At December 31, 2012, the Volkswagen Group held
orders for 234,200 vehicles within Germany and for 261,000
units from the rest of Western Europe. Orders were down
20.6% on the prior-year figure due to the effects of the
sovereign debt crisis, the weak economy, rising unemploy-
ment and the ensuing uncertainty among market partic-
ipants.
ORDER I NTAKE IN THE TRUCKS AN D BUSES SEGMENT
Orders for trucks and buses were impacted by the difficult
industry environment in 2012. This had a particularly
negative effect on the order intake in our key sales markets,
especially Western Europe and South America. Overall, we
received orders for 206,445 vehicles in the reporting
period.
ORDER I NTAKE IN THE POWER ENGI NEERING SEGMENT
The long-term performance of the Power Engineering
business is determined by the macroeconomic environment.
Major individual orders lead to fluctuations in incoming
orders during the year that do not correlate with these long-
term trends.
The Power Engineering segment’s incoming orders
amounted to €4,016 million in fiscal year 2012. Engines &
Marine Systems and Turbomachinery generated the most
new orders.
GROU P FI NANCIAL SERVICES
Products and services from Volkswagen Financial Services
were very popular with customers in the reporting period.
3.8 million new financing, leasing and service/insurance
contracts were signed worldwide, a 21.0% increase on the
prior-year figure. At 9.6 million, the total number of
contracts at December 31, 2012 exceeded the number at
the end of 2011 by 16.9%. The number of contracts in the
Customer Financing/Leasing area was up 14.5% to 6.4
million and the number of contracts in the Service/
Insurance area increased by 21.9%. Based on unchanged
credit eligibility criteria, financed or leased vehicles
amounted to 27.5% (36.3%) of total Group delivery volumes.
The decrease reflects the inclusion of the Chinese market
as of the beginning of 2012. The share of leased or financed
vehicles in China is much lower than the average for other
markets.
In Europe, the number of new contracts signed increased
to 2.6 million (2.3 million), increasing the number of
contracts to 7.0 million (6.2 million) as of December 31,
2012. The number of financing and leasing contracts was
4.0 million (3.7 million) at the end of the reporting period,
an increase on the prior-year figure. The proportion of leased
or financed vehicles in this region increased to 41.9%
(36.8%).
Germany remained a stabilizing factor and a growth
driver in the eurozone in fiscal 2012. The Volkswagen
Group’s automotive and financial services business also per-
formed well in this region. The number of financing and
leasing contracts for new and used vehicles increased by
5.3% to 2.4 million. The penetration rate rose to 53.1%
(50.3%). In Germany, more than every second vehicle from
the Volkswagen Group is financed by or leased through
Volkswagen Financial Services.
In North America, a total of 661 thousand new contracts
were signed, surpassing the prior-year figure by 32.4%.
The total number of contracts grew to 1.5 million, 18.4%
higher than at the end of 2011. In the Customer Financing/
Leasing area, the number of contracts increased by 12.6%
year-on-year to 1.3 million (1.1 million). 54.4% (51.2%) of
all vehicles delivered in North America were leased or
financed.
In South America, the total number of contracts was
697 thousand in the reporting period, 15.3% higher than
in the prior-year period. These were almost exclusively
attributable to the Customer Financing/Leasing area. The
proportion of leased or financed vehicles in this region
amounted to 27.8% (25.1%).
164
In the Asia-Pacific region, a total of 226 thousand new
contracts were signed, more than tripling the prior-year
figure. The total number of contracts doubled, increasing
to 464 thousand. In the Customer Financing/Leasing area,
the number of contracts almost tripled and rose to 371
thousand. A total of 6.5% (30.6%) of all vehicles delivered
in the Asia-Pacific region in fiscal 2012 were leased or
financed. The decrease is attributable to the inclusion of
the Chinese market.
SALES TO TH E DEALER ORGAN IZATION
In the reporting period, the Volkswagen Group (including
the Chinese joint ventures) sold 9,344,559 vehicles to the
dealer organization worldwide, an increase of 11.8%
compared with the prior-year figure. Thanks to high
demand for Group models in China, the USA and Russia,
sales outside Germany rose 13.8% year-on-year. Our
domestic sales were on a level with the previous year.
Vehicles sold in Germany accounted for 12.9% (previous
year: 14.5%) of the Group’s overall sales.
With 870,474 vehicles sold worldwide, the Golf was once
again our biggest seller in 2012, accounting for 9.3% of the
Group’s unit sales. The US version of the Passat, the Tiguan,
Fox, Audi Q3, Audi Q5, Audi A6, ŠKODA Rapid and Amarok
models recorded significant growth, as did the new Beetle,
up!, Audi A1 Sportback, ŠKODA Citigo and SEAT Mii
models. In addition, very healthy demand was seen in China
for the Passat, Jetta and Santana model versions available
there.
PRODUCTION
The Volkswagen Group produced 9,255,384 vehicles
worldwide in the 2012 reporting period. This corresponds
to an increase of 9.0% compared with the prior year. Thanks
to the positive development in China, our Chinese joint
ventures expanded their production volume by 20.0%. Our
manufacturing facilities in Slovakia, the USA, Mexico and
Russia also increased their production figures considerably.
Germany accounted for 25.1% (previous year: 27.8%) of
the Group’s total production. Our plants worldwide produced
an average of 37,749 vehicles per working day, an increase
of 9.6% year-on-year. These production figures do not
include the highly successful Crafter models produced in the
Daimler plants in Düsseldorf and Ludwigsfelde, or the
Routan, which is manufactured in cooperation with Chrysler
in North America.
I NVENTORI ES
We significantly increased our production volumes again
in the reporting period in response to ongoing positive
demand in the global automotive markets. Thanks to our
strict working capital management, the increase in
inventories of raw materials, consumables and supplies as
well as of work in progress was primarily attributable to
the consolidation of Porsche. Global vehicle inventories at
Group companies and in the dealer organization were
higher on December 31, 2012 than a year earlier.
N UMBER OF EMPLOYEES
Including the Chinese joint ventures, the Volkswagen
Group employed an average of 533,469 people in fiscal
year 2012, an increase of 17.5% year-on-year. Our com-
panies in Germany employed 237,080 people on average
in 2012; their share of the total headcount increased
slightly to 44.4% (previous year: 43.1%) due to the inte-
gration of Porsche. The Volkswagen Group had 525,245
active employees (+8.9%) as of the 2012 reporting date. In
addition, 7,804 employees were in the passive phase of
their partial retirement and 16,714 young persons were in
vocational traineeships (+11.3%). The Volkswagen Group’s
total headcount was 549,763 employees (+9.5%) at the end
of the reporting period. In addition to the expanded pro-
duction volumes abroad, this increase can be attributed
primarily to the consolidation of Porsche and motorcycle
manufacturer Ducati in the reporting period. A total of
249,470 people were employed in Germany (+10.9%),
while 300,293 were employed abroad (+8.4%).

165MANAGEMENT REPORT
Business Development Shares and Bonds Results of Operations, Financial Position and Net Assets Volkswagen AG (HGB) Value-Enhancing Factors Risk Report Report on Expected Developments
SUMM ARY OF BUSI N ESS DEVELOPMENT
The Board of Management of Volkswagen AG considers
business development in the reporting period to have been
positive. In an increasingly challenging market environ-
ment, the Volkswagen Group exceeded its forecast delivery
volumes, sales revenue and operating profit for 2012 – in
certain areas significantly – and hence further strengthened
its market position. Due to the marked increase in sales
revenue, the ratio of capital expenditure to sales in the
Automotive Division was in line with the forecast, despite
the higher investments in property, plant and equipment.
Deliveries were at a new all-time high of 9.3 million vehicles,
beating last year’s record by 12.2%. We recorded our
strongest absolute growth in China, the USA, Brazil, Russia
and Germany. Since growth in sales to customers outper-
formed that of the markets as a whole, we were able to
further increase our share of the global passenger car
market.
This positive performance is due above all to our
attractive and environmentally friendly model portfolio,
which impresses customers around the globe. In addition,
our high quality and efficiency standards helped us meet
and even exceed our financial targets.
The following table shows an overview of the targets set
for the reporting period and the figures actually achieved.
Detailed information on the financial key performance
indicators can be found in the “Results of Operations, Finan-
cial Position and Net Assets” chapter starting on page 174.
FORECAST VERSUS ACTUAL F IGU R ES Measure Forecast for 2012 Actual 2012
Deliveries > 8.3 million 9.3 million
Global market share > 12.3% 12.8%
Sales revenue > €159.3 billion €192.7 billion
Operating profit ~ €11.3 billion €11.5 billion
Capex/sales revenue in the Automotive Division approx. 6% 5.9%
166
EQU ITY MARKETS
Fiscal year 2012 was dominated by the debt crisis in
Europe, the elections in the United States and the change of
government in China. The year started significantly better
on the capital markets than had been expected at the end
of 2011. The threat of the crisis in Greece spreading to
other members of the eurozone was mitigated by the
negotiations on the second recovery package for Greece.
The additional liquidity injection by the European Central
Bank (ECB), together with positive economic indicators
and optimistic company forecasts, prompted a rise in
share prices on financial markets around the world.
In the second quarter of the year, indications of a
deepening debt crisis in Europe put the markets under
pressure. More cautious forecasts of economic growth in
China as well as uncertainty about the future composition
of the government in Greece led to the DAX temporarily
falling to an annual low of under 6,000 points. Market
sentiment brightened in the wake of the expansion of the
European rescue fund and the agreement reached by the
EU member states on the European fiscal pact in mid-
June.
The DAX started to regain some of the lost ground at the
beginning of the second half of the year when the rescue
package for Spanish banks was approved and the ECB cut
its key interest rates to the lowest level in its history. This
trend was given a further boost by unexpectedly strong
economic data from China and the United States as well as
healthy corporate results for the first half-year. The
ratification of the European Stability Mechanism and the
resolution on unlimited bond-buying by the ECB lifted the
DAX at the end of the third quarter to a preliminary high
for the year of over 7,400 points.
In the closing quarter, uncertainty about a long-term
solution to the problems in Greece and other countries on
the periphery of the eurozone initially put a damper on the
uptrend, as a result of which Germany’s leading index
mainly moved sideways. Particularly the doubts about the
ability to reform the eurozone prevented the DAX from
rising further and led to several sharp price fluctuations.
Furthermore, the elections and the automatic budget
freezes and tax increases planned for the New Year (the
fiscal cliff) impacted price trends in the United States
during the fourth quarter of the year. By contrast, the
seamless changeover in China’s political leadership
bolstered the markets. Hopes of a speedy end to the US
budget dispute then pushed the DAX up to new annual
highs in the last few weeks of trading.
At the end of 2012, the DAX had reached 7,612 points, a
significant increase on the previous year’s figure (+29.1%).
The EURO STOXX Automobile & Parts closed the year at 338
points, 35.3% higher than at the end of the previous year.
DEVELOPMENT OF THE VOLKSWAGEN SHARE PRICE
On the whole, Volkswagen AG’s ordinary and preferred
shares performed very positively during the year in spite of
volatile market trends. The securities not only increased in
value year-on-year, but also outperformed the overall
market and the sector.
Shares and Bonds A successful year for Volkswagen AG on the stock markets
The performance of ordinary and preferred shares was unequivocally positive in fiscal 2012. However, for
Volkswagen AG shareholders the year was also marked by pronounced volatility on the stock markets
precipitated by the European debt crisis. Volkswagen further strengthened its liquidity and capital base
through the successful issue of a €2.5 billion mandatory convertible note.

167
Business Development Shares and Bonds Results of Operations, Financial Position and Net Assets Volkswagen AG (HGB) Value-Enhancing Factors Risk Report Report on Expected Developments
MANAGEMENT REPORT
SHARE PRICE DEVELOPMENT FROM DECEMBER 2011 TO DECEMBER 2012
Index based on month- end prices: December 31, 2011 = 100
D J F M A M J J A S O N D
125
100
150
175
75
Volkswagen ordinary shares
Volkswagen preferred shares
DAX
EURO STOXX Automobile & Parts
200
In the first quarter of 2012, Volkswagen AG’s preferred
and ordinary share prices participated in the upturn on the
equity markets and initially recorded significant increases.
The share prices then moved sideways amid substantial
volatility from the beginning of February to the middle of
March. Following the announcement of the results for
fiscal year 2011, which were largely in line with the market
expectations, both share classes lost ground for a short
while, before trending upwards slightly again for several
days. However, reports of demand weakening in the
Chinese passenger car market, the smoldering nuclear
dispute with Iran and the associated rises in oil prices
unsettled investors, causing automotive share prices to
retreat towards the end of March 2012.
In the second quarter of 2012, both of Volkswagen’s
share classes outperformed the market as a whole. The
share prices initially declined slightly until mid-April in a
market environment that was also deteriorating. Volkswagen
share prices rose considerably until the beginning of May
in response to the positive reception for the Company’s
figures for the first quarter of 2012. However, the price
gains were lost again by the end of June, reflecting the
trend in the market as a whole.
The prices of preferred and ordinary shares surged in a
positive environment in the third quarter. The announce-
ment that the integrated automotive group with Porsche
would be implemented as early as August 1, 2012, together
with the Company’s figures for the first half of 2012 and
the strong monthly sales figures, all supported an upward
trend that continued until the beginning of August. The
share prices then moved sideways amid substantial volatility.
Price gains led to new highs for the year in mid-September,
although they were lost again by the end of the third quarter.
In the face of considerable volatility, Volkswagen shares
sustained their strong uptrend in the fourth quarter,
hitting fresh highs after the publication of the Group’s
results for the first three quarters of 2012 at the end of
October. The issue of a mandatory convertible note at the
beginning of November had only a fleeting impact on
Volkswagen’s share price. As the year went on, the stock was
given a boost by solid sales figures in a favorable trading
environment.
Volkswagen AG’s preferred shares recorded their
highest daily closing price for the year of €172.70 on
December 20, 2012. They recorded their low for the year
of €118.00 on June 28, 2012. At the end of 2012, the
preferred shares closed at €172.15, 48.7% higher than in
the previous year.
Volkswagen’s ordinary shares closed on December 28,
2012, the last trading day of the year, at €162.75. This was
the highest closing price and 57.0% higher than at the end
of 2011. The shares traded at their lowest daily closing
price for the year of €106.20 on January 2, 2012.

168
SHAREHOLDER STRUCTURE AT DECEMBER 31, 2012
as a percentage of subscribed capital
16.4
12.7
9.3
3.0
1.5
Qatar Holding LLC
German institutional investors
Porsche GmbH, Salzburg
Private shareholders/Others
State of Lower Saxony
0 10 20 30 40 50 60 70 80 90 100
Porsche Automobil Holding SE
Foreign institutional investors
32.2
24.9
DIVIDEN D POLICY
Our dividend policy matches our financial strategy. In the
interests of all stakeholders, we are pursuing continuous
dividend growth so that our shareholders can participate
appropriately in our business success. The proposed divi-
dend amount reflects our financial management objectives
– in particular, ensuring a solid financial foundation as part
of the implementation of our Strategy 2018.
The dividend for ordinary and preferred shares pro-
posed by the Board of Management and the Supervisory
Board of Volkswagen AG is €0.50 (around 16%) higher
than the previous year. On this basis, the total dividend for
fiscal year 2012 is €1.6 billion (2011: €1.4 billion). The
distribution ratio is based on the Group’s profit after tax,
attributable to the shareholders of Volkswagen AG and is
7.5% for the reporting period (2011: 9.1%). After account-
ing for noncash income mainly from the updated measure-
ment of the put/call rights relating to the acquisition of the
stake in Porsche AG indirectly held by Porsche SE, as well
as the remeasurement of the existing stake held at the
contribution date, the adjusted distribution ratio amounts
to 17.8% (2011: 15.7%). The Group is aiming to achieve a
distribution ratio of 30% in the medium term.
DIVIDEN D YI ELD
Based on the dividend proposal for the reporting period,
the dividend yield on Volkswagen ordinary shares is 2.2%,
measured by the closing price on the last trading day in
2012. The dividend yield on preferred shares is 2.1%.
The current dividend proposal can be found in the chapter
entitled Volkswagen AG (condensed, according to the Ger-
man Commercial Code), on page 189 of this annual report.
EARNI NGS PER SHARE
Basic earnings per ordinary share were €46.42 in fiscal
year 2012 (2011: €33.10). Basic earnings per preferred
share were €46.48 (2011: €33.16). In accordance with IAS
33, the calculation is based on the weighted average number
of ordinary and preferred shares outstanding in the fiscal
year.
The calculation of earnings per share for fiscal year
2012 must also make allowance for the effect of the €2.5
billion mandatory convertible note issued in November.
IAS 33.23 sets out that all potential shares that will be
issued upon the conversion of the mandatory convertible
note must be accounted for as issued shares and included
in the calculation of basic and diluted earnings per share.
The number of new preferred shares to be included is based
on the most advantageous conversion rate resulting from
the minimum conversion price of €154.50. In line with IAS
33.19f., these shares are calculated using the weighted
average. Since the number of basic and diluted shares is
identical, basic earnings per share correspond to diluted
earnings per share.
See also note 11 to the Volkswagen consolidated financial
statements for the calculation of earnings per share.
F U RTH E R I N F OR M AT I O N O N VO L KSWAG E N SH A R E S www.volkswagenag.com/ir

169
Business Development Shares and Bonds Results of Operations, Financial Position and Net Assets Volkswagen AG (HGB) Value-Enhancing Factors Risk Report Report on Expected Developments
MANAGEMENT REPORT
SHAREHOLDER STRUCTU RE AT DECEMBER 31, 2012
The shareholder structure of Volkswagen AG as of
December 31, 2012 is shown in the chart on page 168.
Volkswagen AG’s subscribed capital amounted to
€1,190,995,445.76 at the end of the reporting period.
The distribution of voting rights was as follows at the
reporting date: Porsche Automobil Holding SE, Stuttgart,
held 50.73% of the voting rights. The second-largest share-
holder was the State of Lower Saxony, which held 20.0% of
the voting rights. Qatar Holding LLC was the third-largest
shareholder, with 17.0%; Porsche GmbH, Salzburg, held a
2.37% share of the voting rights. The remaining 9.9% of
the 295,089,818 ordinary shares were attributable to other
shareholders.
Notifications of changes in voting rights in accordance
with the Wertpapierhandelsgesetz (WpHG – German
Securities Trading Act) are published on our website at
www.volkswagenag.com/ir.
MAN DATORY CONVERTI BLE NOTE
In November 2012, Volkswagen successfully placed a manda-
tory convertible note in the amount of €2.5 billion, which
entitles and obliges holders to subscribe for Volkswagen
preferred shares. The note is backed by a subordinated
guarantee from Volkswagen AG and was issued by Volks-
wagen International Finance N.V. The preemptive rights of
existing shareholders were disapplied. By issuing the manda-
tory convertible note, Volkswagen has further strength-
ened its capital base in light of the outflow of funds for the
acquisitions made in the second half of the year and the
implementation of the strategic growth and investment
program.
AN NUAL GENERAL MEETI NG
Volkswagen AG’s 52nd Annual General Meeting and the
11th Special Meeting of Preferred Shareholders were held
at the Congress Center Hamburg on April 19, 2012. With
91.9% of the voting capital present, the ordinary share-
holders formally approved the actions of the Board of
Management and the Supervisory Board for fiscal year 2011,
the creation of authorized capital and the corresponding
amendment to the Articles of Association, as well as the
authorization to acquire and use treasury shares.
The scheduled terms of office of Prof. Dr. Ferdinand
K. Piëch and Dr. Michael Frenzel as members of the Super-
visory Board expired at the end of the Annual General
Meeting. The Annual General Meeting elected Ms. Ursula
M. Piëch to the Supervisory Board for a full term of office
as a shareholder representative. Prof. Dr. Ferdinand K. Piëch
was reelected to the Supervisory Board, likewise for a full
term of office. At the constituent meeting of the Supervisory
Board, which was held after the Annual General Meeting,
the members of the Supervisory Board reelected Prof. Dr.
Ferdinand K. Piëch as Chairman of the Supervisory Board.
The Annual General Meeting also resolved to distribute
a dividend of €3.00 per ordinary share and €3.06 per
preferred share for fiscal year 2011.
At the Special Meeting of Preferred Shareholders, the
preferred shareholders, with 36.5% of the voting capital
present, approved the authorizing resolution on the creation
of authorized capital and the corresponding amendment
to the Articles of Association.
In connection with the Annual General Meeting on
April 23, 2009, Verbraucherzentrale für Kapitalanleger e.V.
(VzfK – German Protection Agency for Investors), Berlin,
had filed an action for avoidance with regard to approval of
the actions for fiscal year 2008. After this action had been
dismissed in full by the Hanover Regional Court on May 24,
2011, the Celle Higher Regional Court backed this decision
on January 25, 2012. This decision cannot now be appealed
further. The Federal Court of Justice rejected the plaintiff ’s
appeal against denial of leave to appeal on October 9, 2012.
In connection with the Annual General Meeting on
April 22, 2010, Verbraucherzentrale für Kapitalanleger
e.V., Berlin, filed an action for disclosure and an action for
avoidance with regard to approval of the actions for fiscal
year 2009. Both actions were dismissed in full by the
Hanover Regional Court on January 25, 2011. No appeal
was permitted regarding the action for disclosure. The
plaintiff filed an appeal for the action for avoidance. This
appeal was also dismissed in full by the Celle Higher
Regional Court on August 24, 2011. This decision cannot
now be appealed further. The Federal Court of Justice
rejected the plaintiff ’s appeal against denial of leave to
appeal on March 6, 2012.
The last legal disputes arising from past Annual General
Meetings have thus been concluded with binding legal effect.
VOLKSWAGEN I N SUSTAI NABI LITY IN DICES
Volkswagen confirmed its solid prior-year results in the
assessment performed by the Swiss company Sustainable
Asset Management (SAM) commissioned by Dow Jones and
has once more been included in the automotive section of the
prominent Dow Jones Sustainability World Index. Details
are provided in the Value-Enhancing Factors section of this
report, on page 194.
F U RTH E R I N F OR M AT I O N O N S U STA I N A B I L IT Y www.volkswagenag.com/sustainability

170
VOLKSWAGEN SHARE KEY FIGU RES Dividend development 2012 2011 2010 2009 2008 Number of no-par value shares at Dec. 31
Ordinary shares thousands 295,090 295,090 295,046 295,005 294,920
Preferred shares thousands 170,143 170,143 170,143 105,238 105,238
Dividend
per ordinary share € 3.50 3.00 2.20 1.60 1.93
per preferred share € 3.56 3.06 2.26 1.66 1.99
Dividend paid1 € million 1,639 1,406 1,034 754 778
on ordinary shares € million 1,033 885 649 472 569
on preferred shares € million 606 521 385 282 209
Share price development2 2012 2011 2010 2009 2008 Ordinary shares
Closing € 162.75 103.65 105.90 77.00 250.00
Price performance % +57.0 –2.1 +37.5 –69.2 +60.2
Annual high € 162.75 136.95 118.50 298.85 945.00
Annual low € 106.20 84.50 62.30 72.41 148.43
Preferred shares
Closing € 172.15 115.75 121.40 65.74 38.02
Price performance % +48.7 –4.7 +84.7 +72.9 –62.0
Annual high € 172.70 151.00 136.90 81.72 108.30
Annual low € 118.00 88.54 55.83 30.24 29.30
Beta factor3 factor 1.26 1.09 0.99 0.87 0.89
Market capitalization at Dec. 31 € billion 77.3 50.3 51.9 29.6 77.7
Equity attributable to shareholders of Volkswagen AG at Dec. 31 € billion 77.5 57.5 46.0 35.3 35.0
Ratio of market capitalization to equity factor 1.00 0.87 1.13 0.84 2.22
Key figures per share 2012 2011 2010 2009 2008 Earnings per ordinary share4
basic € 46.42 33.10 15.17 2.37 11.92
diluted € 46.42 33.10 15.17 2.37 11.88
Operating profit5 € 24.62 24.23 15.87 4.64 15.91
Cash flows from operating activities5 € 15.42 18.27 25.46 31.84 27.13
Equity6 € 166.62 123.68 98.84 88.15 87.49
Price/earnings ratio
ordinary share factor 3.5 3.1 7.0 32.5 21.0
preferred share factor 3.7 3.5 8.0 26.9 3.2
Price/cash flow ratio7 factor 10.6 5.7 4.2 2.4 9.2
Dividend yield
ordinary share % 2.2 2.9 2.1 2.1 0.8
preferred share % 2.1 2.6 1.9 2.5 5.2
Stock exchange turnover8 2012 2011 2010 2009 2008
Turnover of Volkswagen ordinary shares € billion 3.5 5.1 6.0 23.2 133.7
million shares 26.8 46.4 79.2 128.1 554.9
Turnover of Volkswagen preferred shares € billion 40.9 44.2 23.5 8.3 9.8
million shares 293.3 369.1 305.4 145.0 118.8
Volkswagen share of total DAX turnover % 5.39 4.69 2.99 3.19 8.2 1 Figures for the years 2008 to 2011 relate to dividends paid in the following
year. For 2012, the figures relate to the proposed dividend.
2 Xetra prices.
3 See page 186 for the calculation.
4 See note 11 to the consolidated financial statements (Earnings per share) for
the calculation.
5 Based on the weighted average number of ordinary and preferred shares
outstanding (basic).
6 Based on the total number of ordinary and preferred shares on December 31
(excluding potential shares from the mandatory convertible note).
7 Using closing prices of the ordinary shares.
8 Order book turnover on the Xetra electronic trading platform (Deutsche Börse).
9 Preferred shares replaced ordinary shares in the DAX as of December 23, 2009.

171
Business Development Shares and Bonds Results of Operations, Financial Position and Net Assets Volkswagen AG (HGB) Value-Enhancing Factors Risk Report Report on Expected Developments
MANAGEMENT REPORT
VOLKSWAGEN SHARE DATA
Securities identification codes
Ordinary shares
ISIN: DE0007664005
WKN: 766400
Deutsche Börse/Bloomberg: VOW
Reuters: VOWG.DE
Preferred shares
ISIN: DE0007664039
WKN: 766403
Deutsche Börse/Bloomberg: VOW3
Reuters: VOWG_p.DE
Market indices:ordinary shares
CDAX, Prime All Share,
Prime Automobile,
FTSE Eurotop 100 Index,
MSCI Euro,
S&P Global 100 Index
Market indices: preferred shares
DAX, CDAX, EURO STOXX,
EURO STOXX 50, EURO STOXX
Automobile & Parts, Prime All
Share, Prime Automobile,
Classic All Share,
FTSE Eurotop 100 Index, MSCI
Euro, Advanced Sustainability
Performance Eurozone Index,
DJ Sustainability World Index,
FTSE4Good
Exchanges
Berlin, Düsseldorf,
Frankfurt, Hamburg,
Hanover, Munich,
Stuttgart, Xetra,
London, Luxembourg,
New York*, SIX Swiss Exchange
* Traded in the form of “sponsored unlisted American Depositary Receipts” (ADRs).
Five ADRs correspond to one underlying Volkswagen ordinary or preferred share.
I NVESTOR RELATIONS ACTIVITI ES
International analysts and investors maintained their level
of interest in the business development of the Volkswagen
Group during the past fiscal year. The Investor Relations
team provided extensive information at more than 650
roadshows, conferences and one-on-one discussions at all
key financial centers worldwide about the strategic focus,
current business performance and future prospects of the
Volkswagen Group and its brands. Many of these discussions
involved a direct exchange of ideas between capital market
participants and members of the Board of Management
and Group senior executives.
The Investor Relations team has made the focus of its
activities even more international. In addition to the existing
sites in Wolfsburg, London and Herndon, an investor
relations office was opened in Beijing at the beginning of
2012 to cope with the sharp rise in interest among inter-
national capital market participants in the Chinese oper-
ations of the Volkswagen Group, as well as the growing
significance of investors in the region.
The Investor Relations team also briefed Volkswagen’s
private shareholders on the Company’s development at
numerous events and was available to answer questions in
many personal discussions; among other things, it had its
own stand at the Annual General Meeting. As in previous
years, Investor Relations also provided support for Group
Treasury’s extensive capital market activities.
Investors and analysts were supplied with the latest
news and publications not only through direct dialog, but
also online. Our website recorded 3.4 million hits, around
18% more than in 2011, which underlines the importance
of digital media as an information channel for investors.
This is the reason the Annual Media and Investor Conference
held in March 2012, the shareholder meetings and the
conference calls of the Volkswagen Group on the quarterly
results for 2012 were additionally broadcast live on the
Internet.
We also promptly published all presentations given
in connection with events that were relevant for
investors online on our investor relations website at
www.volkswagenag.com/ir.
HIGHLIGHTS I N THE I NVESTOR RELATIONS CALEN DAR
At the Annual Media and Investor Conference, which was
held in Wolfsburg on March 12, 2012, the Group’s Board
of Management looked back on a successful fiscal year in
2011 and gave its outlook for the Company and the industry.
One week before, on March 5, in the Audi forum at
Munich airport, members of the Board of Management of
AUDI AG presented analysts and investors with information
on the premium brand’s performance and strategy.
July 4, 2012 was another high point in the investor
relations calendar. On this day, Volkswagen AG and
Porsche Automobil Holding SE announced the creation of
the integrated automotive group through the contribution
in full of Porsche’s automotive business to the Volkswagen
Group, with the move already expected to take effect as of
August 1, 2012. At a conference call the next day, CFO Hans
Dieter Pötsch explained the details of this transaction to
analysts and investors and outlined the strategic impor-
tance and the advantages of accelerated integration of the
sports car manufacturer.

172
REFINANCING STRUCTURE OF THE VOLKSWAGEN GROU P
as of December 31, 2012
Money and capitalmarket instruments
Maturities
Bonds66%
Asset-backed securities26%
15%< 1 year
21%≥ 5 years
64%1 – 5 years
0 10 20 30 40 50 60 70 80 90 100
Commercial paper8%
The new Golf was unveiled for the first time at the Paris
Motor Show in September 2012. Investors and analysts
were able to get an impression of this model and other
product innovations by the Group at the Volkswagen Group
Night on the evening before the event opened and by visiting
the stands at the motor show. In addition, members of the
Group Board of Management and other members of
management supplied information about the Company’s
current development.
The new Golf also dominated an event for investors and
analysts held in Sardinia at the beginning of October 2012.
Volkswagen’s CEO, Prof. Dr. Martin Winterkorn, presented
the Group’s strategic focus to the capital market experts
and explained the challenges the automotive industry is
currently facing. The main topics in the presentation given
by Hans Dieter Pötsch were the importance of the new Golf
for Volkswagen’s profitable growth course as well as the
cost benefits and efficiency gains afforded by the Modular
Transverse Toolkit. Afterwards, the two Board members
were available for in-depth discussions and to answer
questions. Many of those present also took the opportunity
to test drive the new model and discover its merits for
themselves. Product experts from Volkswagen additionally
provided detailed insights into the topics of lightweight
construction, powertrains and design.
At the end of the year, the Investor Relations team
invited investors to Wolfsburg, where Dr. h.c. Leif Östling
presented the Commercial Vehicles Business Area, which
he has headed up since September 1, 2012, and the
prospects for closer cooperation between MAN, Scania and
Volkswagen Commercial Vehicles. Hans Dieter Pötsch
explained the robust positioning and strategy of the Volks-
wagen Group in the difficult economic environment.
REFINANCI NG
In light of the Volkswagen Group’s sustained growth, we
further diversified our refinancing activities in 2012. Last
year, Volkswagen refinanced the equivalent of €25 billion
through the issue of bonds, tapping into additional finan-
cial markets in the process. Around half of the bonds placed
in 2012 were denominated in euros.
As in previous years, our refinancing activities were
concentrated on the Financial Services Division.
In the growth markets of the Volkswagen Group, we
expanded our activities through bond placements, placing
two issues totaling USD 6.0 billion on the US market and a
bond of CNY 1.0 billion on the Hong Kong refinancing
market. We also executed transactions in the Brazilian and
Indian capital markets for the first time.
In November 2012 Volkswagen successfully placed a
mandatory convertible note in the amount of €2.5 billion,
which entitles and obliges holders to subscribe for Volks-
wagen preferred shares. It has a coupon of 5.50% and
expires on November 9, 2015, though the note terms and
conditions provide for early conversion.

173MANAGEMENT REPORT
Business Development Shares and Bonds Results of Operations, Financial Position and Net Assets Volkswagen AG (HGB) Value-Enhancing Factors Risk Report Report on Expected Developments
Volkswagen also broadened its investor base through the
use of different capital market instruments and varying
terms. Its breakdown is shown in the chart on the previous
page.
We generally eliminate interest rate and foreign cur-
rency risk in all our financing transactions by entering into
derivatives contracts at the same time.
The table below shows how our money and capital
market programs were utilized as of December 31, 2012
and illustrates the financial flexibility of the Volkswagen
Group:
Programs
Authorized volume
€ billion
Amount utilized on Dec. 31, 2012
€ billion
Commercial paper 25.7 5.3
Medium-term notes 68.1 36.9
Other capital market programs 21.3 10.1
Asset-backed securities 43.9 18.4
The syndicated credit line of €5.0 billion agreed in July
2011 including two options for extension by a year in each
case was extended for the first time by one year to July
2017 (from July 2016 to July 2017 with a reduced amount
of €4.916 billion). A second option allows the credit line to
be extended by a further year in 2013. The credit line
remains unused.
Syndicated credit lines worth a total of €4.7 billion at
other Group companies have also not been drawn down. In
addition, Group companies arranged bilateral credit lines
with national and international banks in various other
countries for a total of €39.2 billion, of which €19.1 billion
has not been drawn down. These extensive financing
measures ensure the solvency of the Volkswagen Group at
all times.
RATI NGS
In 2012, rating agencies Standard & Poor’s and Moody’s
Investors Service performed their regular update of their
credit ratings for Volkswagen AG, Volkswagen Financial
Services AG and Volkswagen Bank GmbH. Standard &
Poor’s confirmed its short-term and long-term ratings of
A–2 and A– respectively for Volkswagen AG, Volkswagen
Financial Services AG and Volkswagen Bank GmbH. The
outlook for all three companies was raised to “positive”
due to the solid business development.
Moody’s Investors Service confirmed its short-term
and long-term ratings for Volkswagen AG, Volkswagen
Financial Services AG and Volkswagen Bank GmbH at P–2
and A3 respectively and left the outlook for all three
companies unchanged at “positive”.
O U R I N V ESTO R R EL ATI O N S T EA M I S AVA I L A B L E F OR QU ER I E S A N D COM M E N TS : WO L F S B U RG O F F I C E ( VO L KSWAG E N AG ) Phone +49 5361 9-86622 IR Hotline Fax +49 5361 9-30411 E-mail [email protected] Internet www.volkswagenag.com/ir LO N D O N OF F I C E Phone +44 20 7290 7820 B E I J I N G OF F I C E Phone +86 10 6531 3000 I N V ESTOR R EL ATI ON S L IA I S O N OF F I C E ( VOL KSWAG EN G RO U P O F A M ER I CA , I N C . ) (Questions relating to American Depositary Receipts) Phone +1 703 364 7000
RATINGS
V O L K S WA G E N A G
V O L K S WA G E N F I N A N C I A L
S E R V I C E S A G V O L K S WA G E N B A N K G M B H
2012 2011 2010 2012 2011 2010 2012 2011 2010
Standard & Poor’s
short-term A –2 A –2 A –2 A –2 A –2 A –2 A –2 A –2 A –2
long-term A – A – A – A – A – A – A – A – A –
Outlook positive stable negative positive stable negative positive stable stable
Moody’s Investors
Service
short-term P –2 P –2 P –2 P –2 P –2 P –2 P –2 P –2 P –1
long-term A3 A3 A3 A3 A3 A3 A3 A3 A2
Outlook positive positive stable positive positive stable positive positive stable

174
The Volkswagen Group’s segment reporting in compliance
with IFRS 8 comprises the four reportable segments
Passenger Cars and Light Commercial Vehicles, Trucks
and Buses, Power Engineering, and Financial Services, in
line with the Group’s internal reporting and management.
At Volkswagen, segment profit or loss is measured on
the basis of operating profit or loss.
The reconciliation contains activities and other oper-
ations that do not by definition constitute segments. These
include the unallocated Group financing activities. Consol-
idation adjustments between the segments (including the
holding company functions) are also contained in the recon-
ciliation. Purchase price allocation for Porsche Holding
Salzburg and Porsche, as well as for Scania and MAN, is in
line with their accounting treatment in the segments.
The Automotive Division comprises the Passenger Cars
and Light Commercial Vehicles, Trucks and Buses, and
Power Engineering segments, as well as the figures from
the reconciliation. The Passenger Cars and Light Com-
mercial Vehicles segment and the reconciliation are
combined to find the Passenger Cars and Light Com-
mercial Vehicles Business Area. We report on the Trucks
and Buses and Power Engineering segments under the
Trucks and Buses, Power Engineering Business Area. The
Financial Services Division corresponds to the Financial
Services segment.
The activities of the Passenger Cars and Light Com-
mercial Vehicles segment cover the development of vehicles
and engines, the production and sale of passenger cars and
light commercial vehicles, and the genuine parts business.
This segment is composed of the Volkswagen Group’s indi-
vidual passenger car brands and light commercial vehicles
on a consolidated basis. It also includes the Ducati brand’s
motorcycle business.
The Trucks and Buses segment primarily comprises the
development, production and sale of trucks and buses from
the Scania and MAN brands, the corresponding genuine
parts business and related services.
The Power Engineering segment combines the large-
bore diesel engines, turbomachinery, special gear units,
propulsion components and testing systems businesses.
The Financial Services segment comprises dealer and
customer financing, leasing, banking and insurance activ-
ities, as well as fleet management.
KEY FIGU RES BY SEGMENT
€ million
Passenger Cars and Light
Commercial Vehicles
Trucks and Buses
Power Engineering
Financial Services
Total segments Reconciliation
Volkswagen Group
Sales revenue 158,074 20,567 4,234 19,854 202,728 –10,052 192,676
Segment profit or loss
(operating profit or loss) 10,778 358 161 1,586 12,883 –1,373 11,510
as % of sales revenue 6.8 1.7 3.8 8.0 6.0
Results of Operations, Financial Position and Net Assets Volkswagen Group continues successful course and again generates excellent results
The integrated automotive group was created in 2012 with the contribution in full of
Dr. Ing. h.c. F. Porsche AG to the Volkswagen Group. Sales revenue and earnings exceeded
the record 2011 levels.
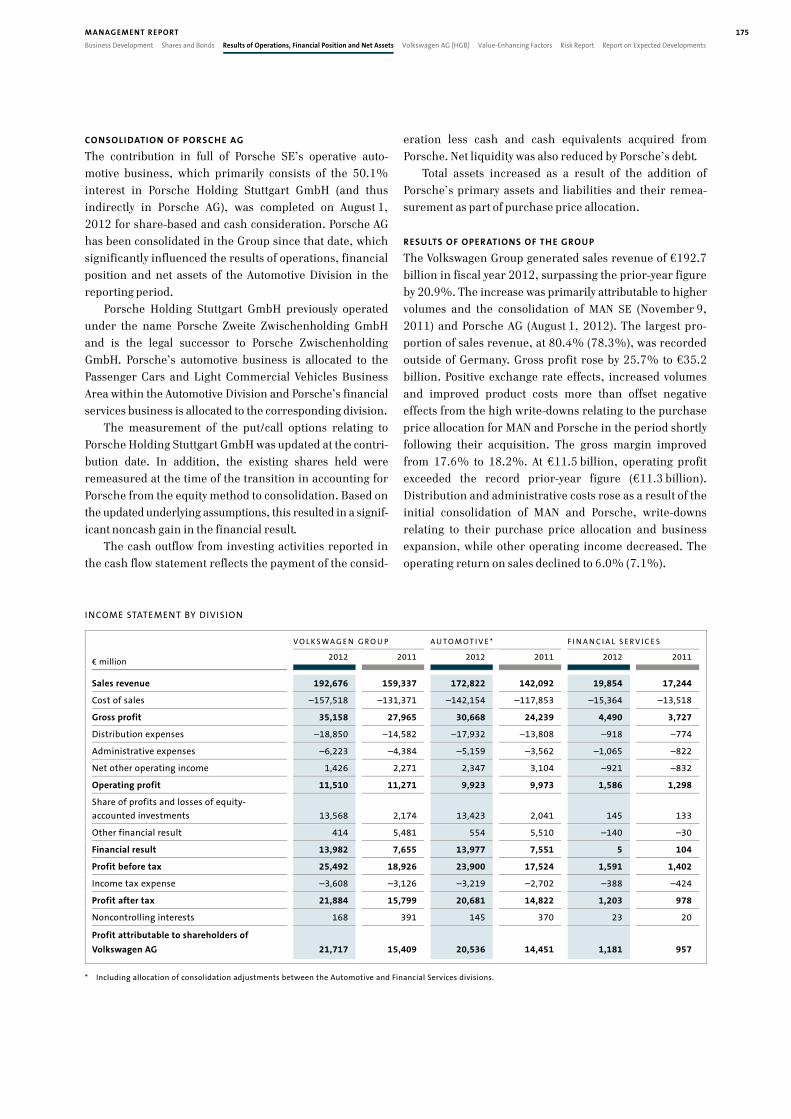
175MANAGEMENT REPORT
Business Development Shares and Bonds Results of Operations, Financial Position and Net Assets Volkswagen AG (HGB) Value-Enhancing Factors Risk Report Report on Expected Developments
CONSOLI DATION OF PORSC HE AG
The contribution in full of Porsche SE’s operative auto-
motive business, which primarily consists of the 50.1%
interest in Porsche Holding Stuttgart GmbH (and thus
indirectly in Porsche AG), was completed on August 1,
2012 for share-based and cash consideration. Porsche AG
has been consolidated in the Group since that date, which
significantly influenced the results of operations, financial
position and net assets of the Automotive Division in the
reporting period.
Porsche Holding Stuttgart GmbH previously operated
under the name Porsche Zweite Zwischenholding GmbH
and is the legal successor to Porsche Zwischenholding
GmbH. Porsche’s automotive business is allocated to the
Passenger Cars and Light Commercial Vehicles Business
Area within the Automotive Division and Porsche’s financial
services business is allocated to the corresponding division.
The measurement of the put/call options relating to
Porsche Holding Stuttgart GmbH was updated at the contri-
bution date. In addition, the existing shares held were
remeasured at the time of the transition in accounting for
Porsche from the equity method to consolidation. Based on
the updated underlying assumptions, this resulted in a signif-
icant noncash gain in the financial result.
The cash outflow from investing activities reported in
the cash flow statement reflects the payment of the consid-
eration less cash and cash equivalents acquired from
Porsche. Net liquidity was also reduced by Porsche’s debt.
Total assets increased as a result of the addition of
Porsche’s primary assets and liabilities and their remea-
surement as part of purchase price allocation.
RESU LTS OF OPERATIONS OF THE GROU P
The Volkswagen Group generated sales revenue of €192.7
billion in fiscal year 2012, surpassing the prior-year figure
by 20.9%. The increase was primarily attributable to higher
volumes and the consolidation of MAN SE (November 9,
2011) and Porsche AG (August 1, 2012). The largest pro-
portion of sales revenue, at 80.4% (78.3%), was recorded
outside of Germany. Gross profit rose by 25.7% to €35.2
billion. Positive exchange rate effects, increased volumes
and improved product costs more than offset negative
effects from the high write-downs relating to the purchase
price allocation for MAN and Porsche in the period shortly
following their acquisition. The gross margin improved
from 17.6% to 18.2%. At €11.5 billion, operating profit
exceeded the record prior-year figure (€11.3 billion).
Distribution and administrative costs rose as a result of the
initial consolidation of MAN and Porsche, write-downs
relating to their purchase price allocation and business
expansion, while other operating income decreased. The
operating return on sales declined to 6.0% (7.1%).
I NCOME STATEMENT BY DIVISION
V O L K S WA G E N G R O U P A U T O M O T I V E * F I N A N C I A L S E R V I C E S
€ million 2012 2011 2012 2011 2012 2011
Sales revenue 192,676 159,337 172,822 142,092 19,854 17,244
Cost of sales –157,518 –131,371 –142,154 –117,853 –15,364 –13,518
Gross profit 35,158 27,965 30,668 24,239 4,490 3,727
Distribution expenses –18,850 –14,582 –17,932 –13,808 –918 –774
Administrative expenses –6,223 –4,384 –5,159 –3,562 –1,065 –822
Net other operating income 1,426 2,271 2,347 3,104 –921 –832
Operating profit 11,510 11,271 9,923 9,973 1,586 1,298
Share of profits and losses of equity-
accounted investments 13,568 2,174 13,423 2,041 145 133
Other financial result 414 5,481 554 5,510 –140 –30
Financial result 13,982 7,655 13,977 7,551 5 104
Profit before tax 25,492 18,926 23,900 17,524 1,591 1,402
Income tax expense –3,608 –3,126 –3,219 –2,702 –388 –424
Profit after tax 21,884 15,799 20,681 14,822 1,203 978
Noncontrolling interests 168 391 145 370 23 20
Profit attributable to shareholders of
Volkswagen AG 21,717 15,409 20,536 14,451 1,181 957
* Including allocation of consolidation adjustments between the Automotive and Financial Services divisions.

176
SEGMENT REPORTI NG – SHARE OF SALES REVENUE BY MARKET 2012
as percent
Europe (excluding Germany)and other regions
North America
Asia/Oceania
Germany
South America
0 10 20 30 40 50 60 70 80 90 100
40.3
13.0
9.5
17.6
19.6
CONSOLI DATED PROFIT
At €25.5 billion, the Volkswagen Group’s profit before tax
in the reporting period was significantly higher than in
2011 (€18.9 billion) due to positive measurement effects in
the financial result. The return on sales before tax rose
from 11.9% in the previous year to 13.2%. At €21.9
billion, the Volkswagen Group’s profit after tax exceeded
the prior-year figure by €6.1 billion. The tax rate was
14.2%; effects from the updated measurement of options
relating to Porsche Holding Stuttgart GmbH and the remea-
surement of the existing shares held in the amount of
€12.3 billion did not have any impact on the tax expense.
RESU LTS OF OPERATIONS IN THE AUTOMOTIVE DIVISION
The Automotive Division generated sales revenue of
€172.8 billion in fiscal year 2012, up 21.6% on the prior-
year figure. In addition to higher volumes, this was
primarily buoyed up by favorable exchange rates. The
increase in sales revenue was also significantly influenced
by the consolidation of Porsche and MAN. As our Chinese
joint ventures are accounted for using the equity method,
the Group’s positive business growth in the Chinese
passenger car market is mainly reflected in the Group’s
sales revenue only by deliveries of vehicles and vehicle
parts. The cost of sales rose more slowly than sales revenue
(+20.6%). As a result, operating profit improved to €30.7
billion (€24.2 billion) in the reporting period. The gross
margin increased to 17.7% (17.1%).
Distribution and administrative expenses rose by 29.9%
and 44.8% respectively. The ratio of both distribution and
administrative expenses to sales revenue was also higher
than in 2011. The consolidation effects outlined above,
increased business volumes and greater competition – par-
ticularly in Western Europe – had a significant effect on the
prior-year comparison. Other operating income declined by
€0.8 billion to €2.3 billion as a result of exchange rate
factors.
The Automotive Division generated an operating profit of
€9.9 billion (€10.0 billion) in 2012. The negative effects of
purchase price allocation for MAN and Porsche, as well as
from the switch to the Modular Transverse Toolkit, were
offset by higher volumes, optimized product costs and
positive exchange rate effects in particular. The extremely
strong business performance of our Chinese joint ventures
is not reflected in the operating profit, as these are accounted
for using the equity method. The ratio of operating profit to
sales revenue was 5.7% (7.0%).
At €14.0 billion, the financial result for the Automotive
Division was almost twice as high as in the previous year
(€7.6 billion). This is primarily attributable to the updating
of the underlying assumptions used in the valuation
models for measuring the put/call rights relating to Porsche
Holding Stuttgart GmbH in the amount of €1.9 billion
(previous year €6.6 billion), as well as the remeasurement
of existing shares held at the contribution date in the amount
of €10.4 billion (€– billion). Improved income from the
equity-accounted Chinese joint ventures included in the
consolidated financial statements also had a positive effect.
The measurement of derivative financial instruments and
higher financing costs had a negative effect. These
increased as a result of the refinancing of higher business
volumes and the unwinding of discounts on provisions,
which was made necessary by lower interest rates.
Results of operations in the Passenger Cars and Light
Commercial Vehicles Business Area
The Passenger Cars and Light Commercial Vehicles
Business Area generated sales revenue of €148.0 billion in
the reporting period (€129.7 billion). The year-on-year
€ million 2012 2011
Sales revenue 148,021 129,706
Gross profit 26,811 22,108
Operating profit 9,405 9,042

177MANAGEMENT REPORT
Business Development Shares and Bonds Results of Operations, Financial Position and Net Assets Volkswagen AG (HGB) Value-Enhancing Factors Risk Report Report on Expected Developments
increase was due to volume growth, positive exchange rate
and model mix effects, as well as the consolidation of
Porsche and Porsche Holding Salzburg (March 1, 2011).
Gross profit amounted to €26.8 billion (€22.1 billion).
Operating profit in the Passenger Cars and Light Com-
mercial Vehicles Business Area rose by 4.0% to €9.4 billion
(€9.0 billion). Porsche made a positive contribution to
earnings despite the high initial write-downs from
purchase price allocation.
Results of operations in the Trucks and Buses, Power
Engineering Business Area € million 2012 2011
Sales revenue 24,801 12,386
Gross profit 3,856 2,131
Operating profit 519 931
At €24.8 billion (€12.4 billion), sales revenue in the Trucks
and Buses, Power Engineering Business Area was signif-
icantly higher than in the previous year due to the consol-
idation of MAN on November 9, 2011. As a result, gross
profit rose by €1.7 billion to €3.9 billion. Operating profit
was down on the previous year at €0.5 billion (€0.9 billion).
In addition to the write-downs relating to purchase price
allocation for MAN and Scania, this was negatively impacted
by a year-on-year contraction in the markets and increased
competition.
RESU LTS OF OPERATIONS IN THE FI NANCIAL SERVICES DIVISI0N
The Financial Services Division lifted its sales revenue by
15.1% to €19.9 billion in fiscal year 2012. In addition to
increased volumes, in particular the expansion of the
consolidated Group including Porsche and MAN, had a
positive effect compared with the previous year’s figures.
Gross profit improved to €4.5 billion (€3.7 billion). Higher
volumes and the consolidation effects outlined above, as well
as upfront expenditures for new projects and additional
expenses to comply with stricter banking supervision require-
ments saw both distribution and administrative expenses
rise as against 2011. Other operating income amounted to
€–0.9 billion (€–0.8 billion). The Financial Services Division
once again made a significant contribution to the Group’s
earnings with an operating profit of €1.6 billion (€1.3
billion). Return on equity before tax was lower than in the
previous year at 13.1% (14.0%).
PRINCI PLES AND GOALS OF FINANCIAL MANAGEMENT
Financial management at the Volkswagen Group covers
liquidity management, currency, interest rate and com-
modity risk management, as well as credit and country
risk management. It is performed centrally for all Group
companies by Group Treasury, based on internal directives
and risk parameters. The Scania and MAN subgroups are
not coordinated centrally for reasons of timing and legal
restrictions related to stock exchange law. The integration
process for Porsche AG and Porsche Holding Salzburg has not
yet been fully completed.
With regard to liquidity, the goals of financial manage-
ment are to ensure that the Volkswagen Group remains
solvent at all times and to achieve an adequate return from
the investment of surplus funds. Currency, interest rate
and commodity risk management is designed to hedge the
prices on which investment, production and sales plans are
based using derivative financial instruments. Credit and
country risk management aims to use diversification to
avoid exposing the Volkswagen Group to the risk of loss or
default. To achieve this, internal limits are defined for the
volume of business per counterparty when entering into
financial transactions. Various rating criteria are taken
into account when setting these limits, including the ratings
awarded by independent agencies and the capital resources
of potential counterparties. The relevant risk limits and
the authorized financial instruments, hedging methods
and hedging horizons are approved by the Executive
Committee for Liquidity and Foreign Currency.
For more information on the principles and goals of
financial management, please refer to pages 234 and 235
and to the notes to the 2012 consolidated financial
statements on pages 324 to 332.
FI NANCIAL POSITION AN D CASH AN D CASH EQUIVALENTS IN
THE GROU P
The Volkswagen Group’s financial position in fiscal year
2012 was affected by the contribution in full of Porsche’s
operating automotive business, the further increase in the
equity interest in MAN SE, the acquisition of Ducati and the
successful placement of the mandatory convertible note.
The following sections provide an overview of the Group’s
liquidity development and outline the drivers by division.
The Volkswagen Group’s gross cash flow in the reporting
period amounted to €20.1 billion, €1.2 billion more than
in the previous year. Funds tied up in working capital
increased by €2.5 billion to €12.9 billion, which resulted
in a year-on-year decline in cash flows from operating
activities to €7.2 billion (€8.5 billion).
At €16.8 billion, investing activities attributable to the
Volkswagen Group’s operating activities were up 5.2% on
the prior-year figure in 2012. Of this figure, €10.5 billion
(€8.1 billion) was attributable to investments in property,
plant and equipment. Net cash flow declined by €2.1 billion
to €–9.6 billion.

178
CASH FLOW STATEMENT BY DIVISION
V O L K S WA G E N G R O U P A U T O M O T I V E 1 F I N A N C I A L S E R V I C E S
€ million 2012 2011 2012 2011 2012 2011
Cash and cash equivalents at beginning of period 16,495 18,228 12,668 17,002 3,827 1,226
Profit before tax 25,492 18,926 23,900 17,524 1,591 1,402
Income taxes paid –5,056 –3,269 –4,514 –2,784 –542 –484
Depreciation and amortization expense 13,135 10,346 9,982 7,843 3,152 2,503
Change in pension provisions 95 13 87 8 7 6
Other noncash income/expense and
reclassifications2 –13,575 –7,164 –13,678 –7,208 103 44
Gross cash flow 20,090 18,853 15,778 15,382 4,312 3,471
Change in working capital –12,881 –10,353 454 1,728 –13,335 –12,080
Change in inventories 460 –4,234 1,044 –3,594 –584 –640
Change in receivables –56 –2,241 114 –944 –171 –1,297
Change in liabilities –236 3,077 –627 2,698 391 379
Change in other provisions 370 3,946 57 3,712 313 234
Change in leasing and rental assets
(excluding depreciation) –5,606 –4,090 –232 –394 –5,374 –3,695
Change in financial services receivables –7,814 –6,811 96 249 –7,910 –7,061
Cash flows from operating activities 7,209 8,500 16,2323 17,1093 –9,023 –8,609
Cash flows from investing activities attributable
to operating activities –16,840 –16,002 –16,455 –15,998 –385 –4
of which: acquisition of property, plant and
equipment –10,493 –8,087 –10,271 –7,929 –222 –158
capitalized development costs –2,615 –1,666 –2,615 –1,666 – –
acquisition and disposal of equity
investments4 –4,105 –6,388 –3,927 –6,626 –179 238
Net cash flow5 –9,631 –7,502 –223 1,112 –9,408 –8,613
Change in investments in securities and loans –2,643 –2,629 –111 –1,285 –2,532 –1,344
Cash flows from investing acitivities –19,482 –18,631 –16,565 –17,283 –2,917 –1,348
Cash flows from financing activities 13,712 8,316 2,551 –4,267 11,161 12,583
of which: capital transactions with noncontrolling
interests –2,101 335 –2,101 335 – –
mandatory convertible note 2,048 – 2,048 – – –
Changes in cash and cash equivalents due to
exchange rate changes –141 82 –98 106 –43 –24
Net change in cash and cash equivalents 1,298 –1,733 2,120 –4,334 –822 2,601
Cash and cash equivalents at Dec. 316 17,794 16,495 14,788 12,668 3,005 3,827
Securities, loans and time deposits 14,352 12,163 8,110 8,966 6,242 3,197
Gross liquidity 32,146 28,658 22,898 21,634 9,248 7,024
Total third-party borrowings –117,663 –93,533 –12,324 –4,683 –105,338 –88,849
Net liquidity –85,517 –64,875 10,573 16,951 –96,090 –81,826
1 Including allocation of consolidation adjustments between the Automotive and Financial Services divisions.
2 These relate mainly to the fair value measurement of financial instruments, application of the equity method and reclassification of gains/losses on disposal of
noncurrent assets to investing activities.
3 Before consolidation of intragroup transactions: €17,029 million (€17,868 million).
4 These relate mainly to the acquisition of the holding company operating business of Porsche Automobil Holding SE for €4,495 million and the acquisition of the
shares in Ducati Motor Holding S.p.A. for €747 million, shares in KPI Polska Sp.z.o.o., Poznan/Poland, and related financial services companies for a total of €254
million, and the shares in MAN TRUCKS India Private Limited, Akurdi/India (formerly: MAN FORCE TRUCKS Private Limited), for €150 million, in each case net of cash
and cash equivalents acquired.
5 Net cash flow: cash flows from operating activities, net of cash flows from investing activities attributable to operating activities.
6 Cash and cash equivalents comprise cash at banks, checks, cash-in-hand and call deposits.
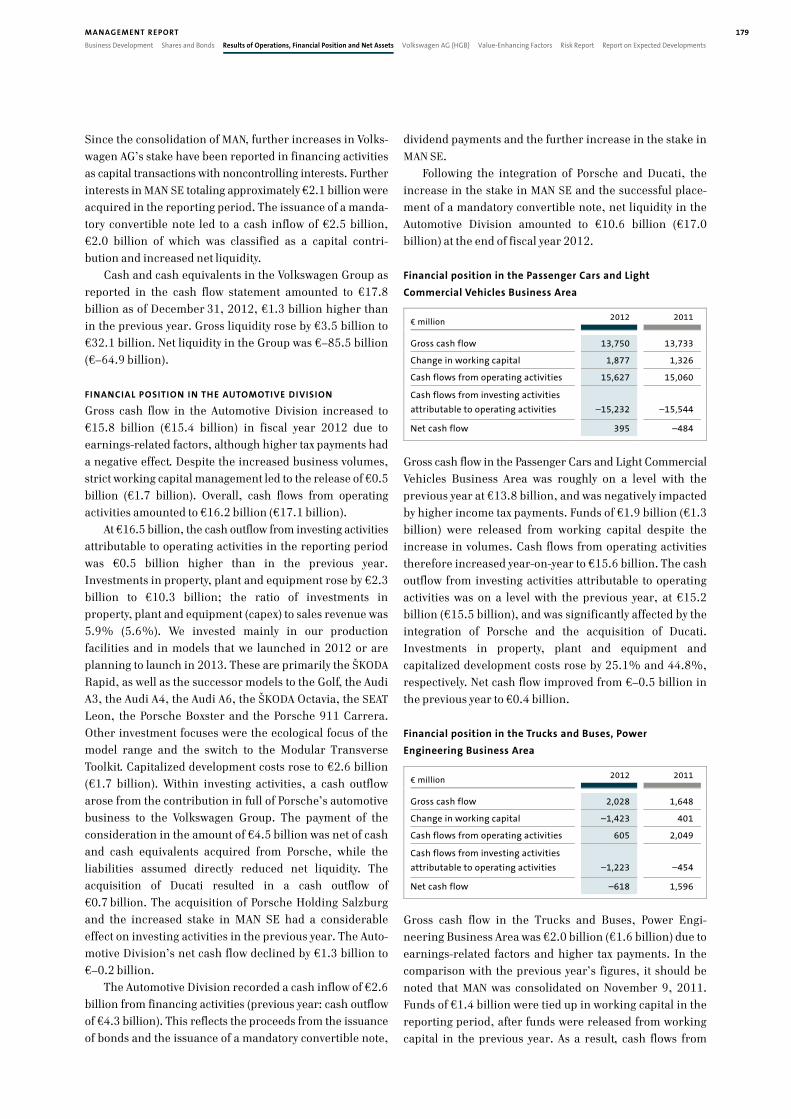
179MANAGEMENT REPORT
Business Development Shares and Bonds Results of Operations, Financial Position and Net Assets Volkswagen AG (HGB) Value-Enhancing Factors Risk Report Report on Expected Developments
Since the consolidation of MAN, further increases in Volks-
wagen AG’s stake have been reported in financing activities
as capital transactions with noncontrolling interests. Further
interests in MAN SE totaling approximately €2.1 billion were
acquired in the reporting period. The issuance of a manda-
tory convertible note led to a cash inflow of €2.5 billion,
€2.0 billion of which was classified as a capital contri-
bution and increased net liquidity.
Cash and cash equivalents in the Volkswagen Group as
reported in the cash flow statement amounted to €17.8
billion as of December 31, 2012, €1.3 billion higher than
in the previous year. Gross liquidity rose by €3.5 billion to
€32.1 billion. Net liquidity in the Group was €–85.5 billion
(€–64.9 billion).
FI NANCIAL POSITION IN THE AUTOMOTIVE DIVISION
Gross cash flow in the Automotive Division increased to
€15.8 billion (€15.4 billion) in fiscal year 2012 due to
earnings-related factors, although higher tax payments had
a negative effect. Despite the increased business volumes,
strict working capital management led to the release of €0.5
billion (€1.7 billion). Overall, cash flows from operating
activities amounted to €16.2 billion (€17.1 billion).
At €16.5 billion, the cash outflow from investing activities
attributable to operating activities in the reporting period
was €0.5 billion higher than in the previous year.
Investments in property, plant and equipment rose by €2.3
billion to €10.3 billion; the ratio of investments in
property, plant and equipment (capex) to sales revenue was
5.9% (5.6%). We invested mainly in our production
facilities and in models that we launched in 2012 or are
planning to launch in 2013. These are primarily the ŠKODA
Rapid, as well as the successor models to the Golf, the Audi
A3, the Audi A4, the Audi A6, the ŠKODA Octavia, the SEAT
Leon, the Porsche Boxster and the Porsche 911 Carrera.
Other investment focuses were the ecological focus of the
model range and the switch to the Modular Transverse
Toolkit. Capitalized development costs rose to €2.6 billion
(€1.7 billion). Within investing activities, a cash outflow
arose from the contribution in full of Porsche’s automotive
business to the Volkswagen Group. The payment of the
consideration in the amount of €4.5 billion was net of cash
and cash equivalents acquired from Porsche, while the
liabilities assumed directly reduced net liquidity. The
acquisition of Ducati resulted in a cash outflow of
€0.7 billion. The acquisition of Porsche Holding Salzburg
and the increased stake in MAN SE had a considerable
effect on investing activities in the previous year. The Auto-
motive Division’s net cash flow declined by €1.3 billion to
€–0.2 billion.
The Automotive Division recorded a cash inflow of €2.6
billion from financing activities (previous year: cash outflow
of €4.3 billion). This reflects the proceeds from the issuance
of bonds and the issuance of a mandatory convertible note,
dividend payments and the further increase in the stake in
MAN SE.
Following the integration of Porsche and Ducati, the
increase in the stake in MAN SE and the successful place-
ment of a mandatory convertible note, net liquidity in the
Automotive Division amounted to €10.6 billion (€17.0
billion) at the end of fiscal year 2012.
Financial position in the Passenger Cars and Light
Commercial Vehicles Business Area
€ million 2012 2011
Gross cash flow 13,750 13,733
Change in working capital 1,877 1,326
Cash flows from operating activities 15,627 15,060
Cash flows from investing activities
attributable to operating activities –15,232 –15,544
Net cash flow 395 –484
Gross cash flow in the Passenger Cars and Light Commercial
Vehicles Business Area was roughly on a level with the
previous year at €13.8 billion, and was negatively impacted
by higher income tax payments. Funds of €1.9 billion (€1.3
billion) were released from working capital despite the
increase in volumes. Cash flows from operating activities
therefore increased year-on-year to €15.6 billion. The cash
outflow from investing activities attributable to operating
activities was on a level with the previous year, at €15.2
billion (€15.5 billion), and was significantly affected by the
integration of Porsche and the acquisition of Ducati.
Investments in property, plant and equipment and
capitalized development costs rose by 25.1% and 44.8%,
respectively. Net cash flow improved from €–0.5 billion in
the previous year to €0.4 billion.
Financial position in the Trucks and Buses, Power
Engineering Business Area
€ million 2012 2011
Gross cash flow 2,028 1,648
Change in working capital –1,423 401
Cash flows from operating activities 605 2,049
Cash flows from investing activities
attributable to operating activities –1,223 –454
Net cash flow –618 1,596
Gross cash flow in the Trucks and Buses, Power Engi-
neering Business Area was €2.0 billion (€1.6 billion) due to
earnings-related factors and higher tax payments. In the
comparison with the previous year’s figures, it should be
noted that MAN was consolidated on November 9, 2011.
Funds of €1.4 billion were tied up in working capital in the
reporting period, after funds were released from working
capital in the previous year. As a result, cash flows from

180
operating activities declined to €0.6 billion (€2.0 billion).
At €1.2 billion, the cash outflow from investing activities
attributable to operating activities was higher than in the
previous year (€0.5 billion) and includes the acquisition of
MAN TRUCKS India Private Limited. Net cash flow declined
sharply by €2.2 billion to €–0.6 billion.
FI NANCIAL POSITION IN THE FI NANCIAL SERVICES DIVISION
The Financial Services Division’s gross cash flow was €4.3
billion in 2012, up 24.2% on the previous year due to
earnings-related factors. Funds tied up in working capital
increased to €13.3 billion (€12.1 billion) as a result of
volume growth and the resulting higher financial services
receivables, as well as changes to leasing and rental assets.
The cash outflow from investing activities attributable to
operating activities rose to €0.4 billion. A cash inflow of
€11.2 billion (€12.6 billion) was recorded from financing
activities as a result of the increased business volume,
including from the issuance of bonds. The Financial Services
CONSOLI DATED BALANCE SHEET BY DIVISION AS OF DECEMBER 31
V O L K S WA G E N G R O U P A U T O M O T I V E 1 F I N A N C I A L S E R V I C E S
€ million 2012 20112 2012 20112 2012 2011
Assets
Noncurrent assets 196,582 148,129 119,776 86,421 76,806 61,708
Intangible assets 59,158 22,176 58,936 22,044 222 131
Property, plant and equipment 39,424 31,876 38,004 31,414 1,420 462
Leasing and rental assets 20,034 16,626 2,667 3,278 17,367 13,348
Financial services receivables 49,785 42,450 –602 –600 50,387 43,050
Other receivables and financial assets3 28,181 35,002 20,771 30,286 7,410 4,717
Current assets 113,061 105,640 61,282 59,755 51,779 45,885
Inventories 28,674 27,551 25,868 25,378 2,806 2,173
Financial services receivables 36,911 33,754 –911 –816 37,822 34,570
Other receivables and financial assets 21,555 19,897 15,166 15,494 6,389 4,404
Marketable securities 7,433 6,146 5,697 5,235 1,736 911
Cash, cash equivalents and time deposits 18,488 18,291 15,462 14,464 3,026 3,827
Total assets 309,644 253,769 181,059 146,176 128,585 107,593
Equity and Liabilities
Equity 81,825 63,354 68,458 52,488 13,367 10,865
Equity attributable to shareholders of
Volkswagen AG 77,515 57,539 64,542 46,891 12,973 10,647
Noncontrolling interests 4,310 5,815 3,916 5,597 394 218
Noncurrent liabilities 122,306 89,179 68,909 49,037 53,397 40,142
Noncurrent financial liabilities 63,603 44,442 15,069 7,661 48,534 36,780
Provisions for pensions 23,969 16,787 23,658 16,592 312 194
Other noncurrent liabilities4 34,733 27,951 30,183 24,783 4,550 3,167
Current liabilities 105,513 101,237 43,691 44,651 61,822 56,586
Current financial liabilities 54,060 49,090 –2,544 –2,979 56,604 52,069
Trade payables 17,268 16,325 15,663 15,245 1,606 1,081
Other current liabilities 34,185 35,821 30,573 32,385 3,612 3,436
Total equity and liabilities 309,644 253,769 181,059 146,176 128,585 107,593
1 Including allocation of consolidation adjustments between the Automotive and Financial Services divisions, primarily intragroup loans.
2 Adjusted
3 Including equity-accounted investments and deferred taxes.
4 Including deferred taxes.

181MANAGEMENT REPORT
Business Development Shares and Bonds Results of Operations, Financial Position and Net Assets Volkswagen AG (HGB) Value-Enhancing Factors Risk Report Report on Expected Developments
CONSOLI DATED BALANCE SHEET STRUCTU RE 2012
as percent
Total assets
Total equityand liabilities
Noncurrent assets63.5 (58.4)
Current assets36.5 (41.6)
26.4 (25.0)Equity
34.1 (39.9)Current liabilities
39.5 (35.1)Noncurrent liabilities
0 10 20 30 40 50 60 70 80 90 100
Division’s negative net liquidity, which is common in the
industry, widened by €–14.3 billion as against the previous
year to €–96.1 billion (€–81.8 billion) as of December 31,
2012. This was mainly due to the expansion of business
activities and the enlargement of the consolidated Group.
CONSOLI DATED BALANCE SHEET STRUCTURE
The Volkswagen Group’s total assets were €309.6 billion at
the end of the reporting period, 22.0% higher than at
December 31, 2011. This increase was largely the result of
the integration of Porsche (Automotive and Financial
Services) and organic Group growth. Purchase price
allocation for the assets acquired and liabilities assumed
from Porsche Automotive is provisional as of the reporting
date. The structure of the consolidated balance sheet as of
December 31, 2012 can be seen from the chart on this
page. The Volkswagen Group’s equity ratio was 26.4%
(25.0%).
AUTOMOTIVE DIVISION BALANCE SHEET STRUCTURE
The Automotive Division’s noncurrent assets as of
December 31, 2012 were 38.6% higher than at year-end
2011, primarily due to the integration of Porsche. Intangible
assets more than doubled compared with the previous
year, lifted in particular by the goodwill and brand value of
Porsche, which were determined as part of purchase price
allocation. The value of equity-accounted investments
declined with the transition in accounting for Porsche from
the equity method to consolidation. Other noncurrent assets
decreased as a result of the disposal of the options relating
to Porsche Holding Stuttgart GmbH. Property, plant and
equipment increased by 21.0%. Current assets rose by
2.6%; within this item, inventories increased as a result of
the addition of Porsche. At €15.5 billion, cash and cash
equivalents exceeded the prior-year figure (€14.5 billion).
The Automotive Division’s equity attributable to share-
holders of Volkswagen AG amounted to €64.5 billion at the
end of 2012, a year-on-year increase of 37.6%. The earnings
performance – including the remeasurement of the put/call
options and the existing shares – as well as net gains from
the fair value remeasurement of derivative financial instru-
ments recognized directly in equity, and the issuance of a
mandatory convertible note had a particularly positive effect.
This was offset in part by actuarial losses from the measure-
ment of pension provisions and the dividend payments.
Equity attributable to noncontrolling interests, which chiefly
relates to noncontrolling interests in Scania and MAN,
declined as a result of the increase in the stake in MAN SE.
Including noncontrolling interests, equity amounted to
€68.5 billion, up €16.0 billion on the prior-year reporting
date. The division’s equity ratio rose to 37.8% (35.9%).
Noncurrent liabilities increased by 40.5%, primarily due
to the inclusion of Porsche, the actuarial valuation of pension
provisions and business expansion, while current liabilities
were on a level with the end of 2011. The figures for the
Automotive Division also contain the elimination of intra-
group transactions between the Automotive and Financial
Services divisions. As the current financial liabilities for
the primary Automotive Division were lower than the loans
granted to the Financial Services Division, a negative amount
was disclosed for the reporting period.
The Automotive Division’s total assets amounted to
€181.1 billion at the end of the reporting period, 23.9%
higher than at December 31, 2011.

182
Passenger Cars and Light Commercial Vehicles Business Area
balance sheet structure € million 2012 2011
Noncurrent assets 92,381 60,505
Current assets 46,660 45,597
Total assets 139,041 106,102
Equity 49,274 32,411
Noncurrent liabilities 57,704 41,030
Current liabilities 32,063 32,661
At €92.4 billion, noncurrent assets in the Passenger Cars
and Light Commercial Vehicles Business Area were €31.9
billion higher than at the prior-year reporting date due to
the inclusion of Porsche. Current assets were up slightly on
the 2011 figure at €46.7 billion. Total assets amounted to
€139.0 billion (€106.1 billion) at the end of the reporting
period. Equity rose by 52.0% to €49.3 billion. This was
largely influenced by the earnings performance, including
the remeasurement of the put/call options and the existing
shares. Noncurrent liabilities rose by 40.6%, while current
liabilities declined by 1.8%.
Trucks and Buses, Power Engineering Business Area balance
sheet structure € million 2012 2011*
Noncurrent assets 27,396 25,917
Current assets 14,622 14,157
Total assets 42,017 40,074
Equity 19,184 20,078
Noncurrent liabilities 11,205 8,007
Current liabilities 11,628 11,990
* Adjusted
Noncurrent and current assets in the Trucks and Buses,
Power Engineering Business Area were higher than in the
previous year as of December 31, 2012. Total assets rose to
€42.0 billion (€40.1 billion). Equity was on a level with the
previous year. Noncontrolling interests in the equity of the
Volkswagen Group are attributable primarily to the Trucks
and Buses, Power Engineering Business Area.
FI NANCIAL SERVICES DIVISION BALANCE SHEET STRUCTU RE
At the end of fiscal year 2012, the Financial Services
Division’s total assets amounted to €128.6 billion, €21.0
billion higher than at December 31, 2011.
Leasing and rental assets, as well as noncurrent and
current financial services receivables increased due to
volume-related factors and the expansion of the consolidated
Group (including Porsche Financial Services). Leasing and
rental assets were up 30.1% on the previous year, at €17.4
billion. Overall, noncurrent assets grew by 24.5%; current
assets rose by 12.8% as against year-end 2011. Cash and
cash equivalents amounted to €3.0 billion (€3.8 billion).
The Financial Services Division accounted for
approximately 42% of the Volkswagen Group’s assets as of
the reporting date.
Equity in the Financial Services Division amounted to
€13.4 billion (€10.9 billion) as of the reporting date. The
earnings position and capital increases by Volkswagen AG
had a particularly positive effect here. The division’s equity
ratio rose to 10.4% (10.1%). Financial liabilities increased
in both the noncurrent liabilities item, which grew by
33.0%, and the current liabilities item, which was up
9.3% on the prior-year figure. The increase is attributable
to the refinancing of increased business volumes and the
expansion of the consolidated Group. Deposits from direct
banking business amounted to €23.9 billion (€23.1 billion)
as of December 31, 2012, of which €22.0 billion was
attributable to Volkswagen Bank direct. The debt/equity
ratio remained unchanged at 8:1.

183MANAGEMENT REPORT
Business Development Shares and Bonds Results of Operations, Financial Position and Net Assets Volkswagen AG (HGB) Value-Enhancing Factors Risk Report Report on Expected Developments
FINANCIAL KEY PERFORMANCE I NDICATORS % 2012 2011 2010 2009 2008
Volkswagen Group
Gross margin 18.2 17.6 16.9 12.9 15.1
Personnel expense ratio 15.3 15.0 15.0 15.2 13.9
Return on sales before tax 13.2 11.9 7.1 1.2 5.8
Return on sales after tax 11.4 9.9 5.7 0.9 4.1
Equity ratio 26.4 25.0 24.4 21.1 22.3
Dynamic gearing1 (years) 0.1 0.1 0.1 0.2 0.2
Automotive Division2
Change in unit sales3 +11.8 +14.9 +15.4 +0.6 +1.3
Change in sales revenue +21.6 +26.0 +21.2 –9.3 +3.9
Operating profit as a percentage of sales revenue 5.7 7.0 5.5 1.4 5.3
EBITDA (in € million)4 19,906 17,815 13,940 8,005 12,108
Return on investment after tax5 16.6 17.7 13.5 3.8 10.9
Cash flows from operating activities as a percentage of sales
revenue6 9.4 12.0 12.3 13.8 8.6
Cash flows from investing activities as a percentage of sales
revenue6 9.5 11.3 8.1 11.0 11.2
Investments in property, plant and equipment as a percentage of
sales revenue 5.9 5.6 5.0 6.2 6.6
Ratio of noncurrent assets to total assets7 21.0 21.5 22.8 24.9 26.2
Ratio of current assets to total assets8 14.3 17.4 14.7 13.8 19.2
Inventory turnover 6.4 6.9 7.4 6.0 6.3
Equity ratio 37.8 35.9 35.5 30.2 32.6
Financial Services Division
Increase in total assets 19.5 22.5 9.2 1.6 15.4
Return on equity before tax9 13.1 14.0 12.9 7.9 12.1
Equity ratio 10.4 10.1 10.4 10.2 10.6
1 Ratio of cash flows from operating activities to current and noncurrent financial liabilities.
2 Including allocation of consolidation adjustments between the Automotive and Financial Services divisions.
3 Including the Shanghai-Volkswagen Automotive Company Ltd. and FAW-Volkswagen Automotive Company Ltd. vehicle-production investments. These companies are
accounted for using the equity method.
4 Operating profit plus net depreciation/amortization and impairment losses/reversals of impairment losses on property, plant and equipment, capitalized
development costs, leasing and rental assets, goodwill and financial assets as reported in the cash flow statement.
5 For details, see Value-based management on page 186.
6 2008 adjusted.
7 Ratio of property, plant and equipment to total assets.
8 Ratio of inventories to total assets.
9 Profit before tax as a percentage of average equity.

184
SUMMARY OF ECONOMIC POSITION
The Board of Management of Volkswagen AG believes that
the Group’s economic position is positive. The integrated
automotive group with Porsche was created as of August 1,
2012 with the contribution in full of Dr. Ing. h.c. F. Porsche
AG to the Volkswagen Group. Alongside the consolidation
of MAN as of November 9, 2011 and organic growth, this
helped us to exceed the previous year’s record sales
revenue and earnings and thus maintain our profitable
growth trajectory. We continued to pursue disciplined cost
and investment management and the continuous optimi-
zation of our processes.
The integration of Porsche, the acquisition of Ducati
Motor Holding S.p.A. and the increased stake in MAN SE
had a significant influence on the Volkswagen Group’s
financial position in the reporting period. We strengthened
our capital base with the successful placement of a manda-
tory convertible note. The Automotive Division’s strong
liquidity position at the end of fiscal year 2012 gives us
financial stability and flexibility.
An overview of the development of the Volkswagen Group
over the past five years can be found in the tables on pages
183 and 185. More information on the economic position
of the Volkswagen Group by brand and business field can
be found in the Divisions chapter starting on page 104.
VALU E ADDED STATEMENT
The value added statement indicates the added value
generated by a company in the past fiscal year as its
contribution to the gross domestic product of its home
country, and how it is appropriated. In fiscal year 2012, the
value added generated by the Volkswagen Group was
25.1% higher than in the previous year. Added value per
employee in the reporting period was €127.1 thousand
(+5.4%). Employees in the passive phase of their partial
retirement are not included in the calculation.
VALUE ADDED GENERATED BY THE VOLKSWAGEN GROU P Source of funds in € million 2012 2011
Sales revenue 192,676 159,337
Other income 24,652 13,125
Cost of materials –122,450 –104,648
Depreciation and amortization –13,135 –10,346
Other upfront expenditures –22,077 –9,759
Value added 59,666 47,709
Appropriation of funds in € million 2012 % 2011 %
to shareholders (dividend) 1,639 2.8 1,406 2.9
to employees (wages, salaries, benefits) 29,503 49.5 23,854 50.0
to the state (taxes, duties) 4,322 7.2 4,525 9.5
to creditors (interest expense) 3,957 6.6 3,530 7.4
to the Company (reserves) 20,246 33.9 14,393 30.2
Value added 59,666 100.0 47,709 100.0

185MANAGEMENT REPORT
Business Development Shares and Bonds Results of Operations, Financial Position and Net Assets Volkswagen AG (HGB) Value-Enhancing Factors Risk Report Report on Expected Developments
FIVE-YEAR REVI EW 2012 2011* 2010 2009 2008*
Volume Data (thousands)
Vehicle sales (units) 9,345 8,361 7,278 6,310 6,272
Germany 1,207 1,211 1,059 1,288 1,013
Abroad 8,137 7,150 6,219 5,022 5,259
Production (units) 9,255 8,494 7,358 6,055 6,347
Germany 2,321 2,640 2,115 1,938 2,146
Abroad 6,934 5,854 5,243 4,117 4,201
Employees (yearly average) 533 454 389 367 357
Germany 237 196 178 173 178
Abroad 296 258 210 194 179
Financial Data in € million
Income Statement
Sales revenue 192,676 159,337 126,875 105,187 113,808
Cost of sales 157,518 131,371 105,431 91,608 96,612
Gross profit 35,158 27,965 21,444 13,579 17,196
Distribution expenses 18,850 14,582 12,213 10,537 10,552
Administrative expenses 6,223 4,384 3,287 2,739 2,742
Net other operating expense/income 1,426 2,271 1,197 1,553 2,431
Operating profit 11,510 11,271 7,141 1,855 6,333
Financial result 13,982 7,655 1,852 –595 275
Profit before tax 25,492 18,926 8,994 1,261 6,608
Income tax expense 3,608 3,126 1,767 349 1,920
Profit after tax 21,884 15,799 7,226 911 4,688
Cost of materials 122,450 104,648 79,394 67,925 75,954
Personnel expenses 29,503 23,854 19,027 16,027 15,784
Balance Sheet at December 31
Noncurrent assets 196,582 148,129 113,457 99,402 91,756
Current assets 113,061 105,640 85,936 77,776 76,163
Total assets 309,644 253,769 199,393 177,178 167,919
Equity 81,825 63,354 48,712 37,430 37,388
of which: noncontrolling interests 4,310 5,815 2,734 2,149 2,377
Noncurrent liabilities 122,306 89,179 73,781 70,215 65,729
Current liabilities 105,513 101,237 76,900 69,534 64,802
Total equity and liabilities 309,644 253,769 199,393 177,178 167,919
Cash flows from operating activities 7,209 8,500 11,455 12,741 2,702
Cash flows from investing activities attributable
to operating activities 16,840 16,002 9,278 10,428 11,613
Cash flows from financing activities 13,712 8,316 –852 5,536 8,123
* Adjusted

186
VALU E CONTRIBUTION AS A CONTROL VARIABLE
The Volkswagen Group’s financial target system centers on
continuously and sustainably increasing the value of the
Company. We have been using value contribution*, a
control variable linked to the cost of capital, for a number
of years, in order to use resources in the Automotive
Division efficiently and to measure the success of this.
The concept of value-based management allows the
success of our innovative, environmentally oriented
product portfolio to be evaluated. This concept also
enables the earnings strength of individual business units
and projects, such as the new plants in India, Russia and
North America, to be measured.
Components of value contribution
Value contribution is calculated using operating profit
after tax and the opportunity cost of invested capital.
Operating profit shows the economic performance of the
Automotive Division and is initially a pre-tax figure.
Using the various international income tax rates of the
relevant companies, we assume an overall average tax rate
of 30% when calculating the operating profit after tax.
The cost of capital is multiplied by the invested capital
to give the opportunity cost of capital. Invested capital is
calculated as total operating assets (property, plant and
equipment, intangible assets, inventories and receivables)
less non-interest-bearing liabilities (trade payables and
payments on account received).
As the concept of value-based management only covers
our operating activities, assets relating to investments in
subsidiaries and associates and the investment of cash
funds are not included when calculating invested capital.
Interest charged on these assets is reported in the
financial result.
Determining the current cost of capital
The cost of capital is the weighted average of the required
rates of return on equity and debt. The cost of equity is
determined using the Capital Asset Pricing Model (CAPM).
This model uses the yield on long-term risk-free
Bunds, increased by the risk premium attaching to
investments in the equity market. The risk premium
comprises a general market risk and a specific business
risk.
The general risk premium, which reflects the general risk
of a capital investment in the equity market and is oriented
on the Morgan Stanley Capital International (MSCI) World
Index, was raised from 5.5% to 6.5% due to the continued
uncertainty in the capital market.
Since 2010, the specific business risk – price fluctuations
in Volkswagen preferred shares – has been modeled when
calculating the beta factor in comparison to the MSCI
World Index.
The switch in benchmark index from the DAX to the MSCI
World Index was necessary because Volkswagen shares
experienced considerable price fluctuations in 2008 and
2009, and the share class in the DAX was changed to
preferred shares in 2010. The MSCI World Index sets a
standard that reflects a global capital market benchmark
for investors.
The analysis period for the beta factor calculation spans
five years with annual beta figures on a daily basis and an
average subsequently being calculated. A beta factor of
1.26 was determined for 2012 (previous year: 1.09).
COST OF CAPITAL AFTER TAX
AUTOMOTIVE DIVISION
% 2012 2011
Risk-free rate 2.2 2.7
MSCI World Index market risk
premium 6.5 5.5
Volkswagen-specific risk premium 1.7 0.5
(Volkswagen beta factor) (1.26) (1.09)
Cost of equity after tax 10.4 8.7
Cost of debt 3.7 5.2
Tax –1.1 –1.5
Cost of debt after tax 2.6 3.6
Proportion of equity 66.7 66.7
Proportion of debt 33.3 33.3
Cost of capital after tax 7.8 7.0
The cost of debt is based on the average yield for long-term
debt. As borrowing costs are tax-deductible, the cost of debt
is adjusted to account for the tax rate of 30%.
A weighting on the basis of a fixed ratio for the fair
values of equity and debt gives an effective cost of capital
for the Automotive Division of 7.8% (7.0%) for 2012.
* The value contribution corresponds to the Economic Value Added (EVA®).
EVA® is a registered trademark of Stern Stewart & Co.
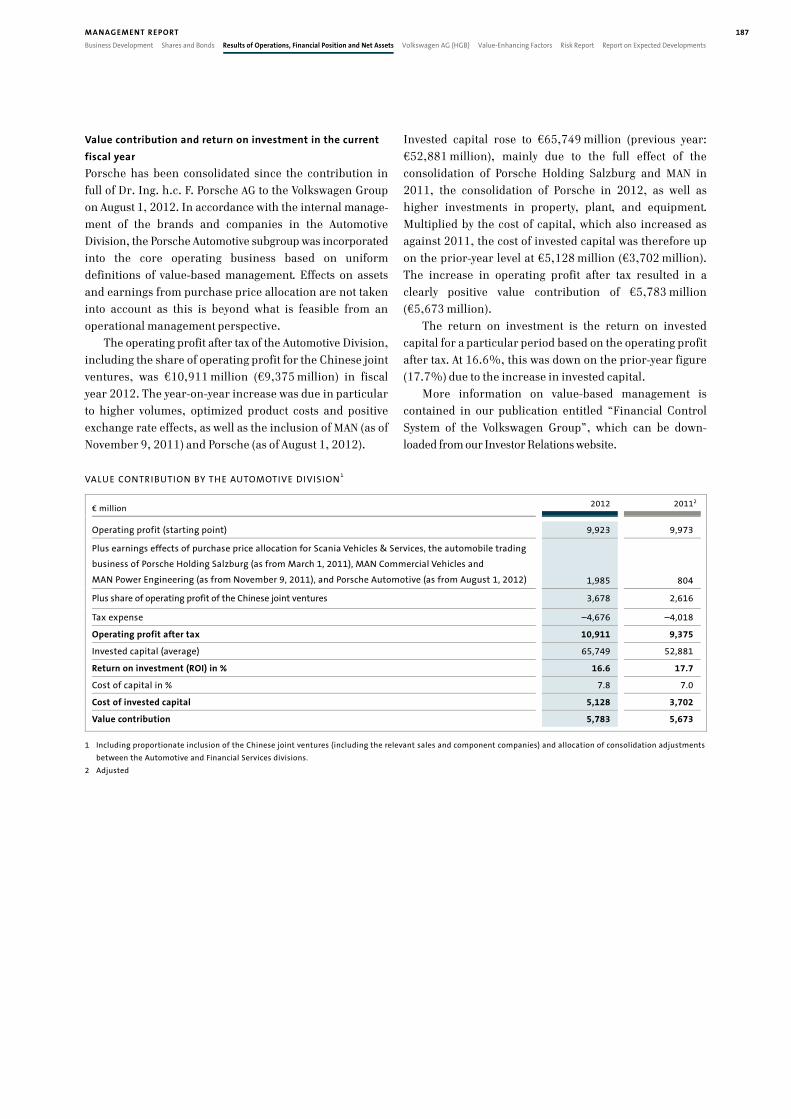
187MANAGEMENT REPORT
Business Development Shares and Bonds Results of Operations, Financial Position and Net Assets Volkswagen AG (HGB) Value-Enhancing Factors Risk Report Report on Expected Developments
Value contribution and return on investment in the current
fiscal year
Porsche has been consolidated since the contribution in
full of Dr. Ing. h.c. F. Porsche AG to the Volkswagen Group
on August 1, 2012. In accordance with the internal manage-
ment of the brands and companies in the Automotive
Division, the Porsche Automotive subgroup was incorporated
into the core operating business based on uniform
definitions of value-based management. Effects on assets
and earnings from purchase price allocation are not taken
into account as this is beyond what is feasible from an
operational management perspective.
The operating profit after tax of the Automotive Division,
including the share of operating profit for the Chinese joint
ventures, was €10,911 million (€9,375 million) in fiscal
year 2012. The year-on-year increase was due in particular
to higher volumes, optimized product costs and positive
exchange rate effects, as well as the inclusion of MAN (as of
November 9, 2011) and Porsche (as of August 1, 2012).
Invested capital rose to €65,749 million (previous year:
€52,881 million), mainly due to the full effect of the
consolidation of Porsche Holding Salzburg and MAN in
2011, the consolidation of Porsche in 2012, as well as
higher investments in property, plant, and equipment.
Multiplied by the cost of capital, which also increased as
against 2011, the cost of invested capital was therefore up
on the prior-year level at €5,128 million (€3,702 million).
The increase in operating profit after tax resulted in a
clearly positive value contribution of €5,783 million
(€5,673 million).
The return on investment is the return on invested
capital for a particular period based on the operating profit
after tax. At 16.6%, this was down on the prior-year figure
(17.7%) due to the increase in invested capital.
More information on value-based management is
contained in our publication entitled “Financial Control
System of the Volkswagen Group”, which can be down-
loaded from our Investor Relations website.
VALUE CONTRIBUTION BY THE AUTOMOTIVE DIVISION1
€ million 2012 20112
Operating profit (starting point) 9,923 9,973
Plus earnings effects of purchase price allocation for Scania Vehicles & Services, the automobile trading
business of Porsche Holding Salzburg (as from March 1, 2011), MAN Commercial Vehicles and
MAN Power Engineering (as from November 9, 2011), and Porsche Automotive (as from August 1, 2012) 1,985 804
Plus share of operating profit of the Chinese joint ventures 3,678 2,616
Tax expense –4,676 –4,018
Operating profit after tax 10,911 9,375
Invested capital (average) 65,749 52,881
Return on investment (ROI) in % 16.6 17.7
Cost of capital in % 7.8 7.0
Cost of invested capital 5,128 3,702
Value contribution 5,783 5,673
1 Including proportionate inclusion of the Chinese joint ventures (including the relevant sales and component companies) and allocation of consolidation adjustments
between the Automotive and Financial Services divisions.
2 Adjusted

188
N ET INCOME FOR THE YEAR
Volkswagen AG’s sales rose by 1.8% year-on-year to
€68.4 billion in fiscal year 2012, with 63.5% (62.9%) of
this figure being generated outside of Germany. Cost of
sales increased disproportionately to €63.5 billion. As a
result, gross profit declined to €4.9 billion (€5.4 billion).
The expansion in the volume of business led to higher
selling, general and administrative expenses than in 2011;
the ratio of selling, general and administrative expenses to
sales rose to 8.8% (8.3%). Other operating income
improved to €1.3 billion (€1.1 billion).
The financial result rose by 26.7% to €7.9 billion, due in
particular to higher income from investments.
The increase in the financial result improved Volks-
wagen AG’s result from ordinary activities by 13.2% year-
on-year to €8.1 billion. The negative effects from the
revaluation of pension provisions as a result of the transi-
tion to the Bilanzrechtsmodernisierungsgesetz (BilMoG –
German Accounting Law Modernization Act) are only
included in the previous year’s extraordinary result. After
deducting income taxes, net income in fiscal year 2012
rose to €6.4 billion (€3.4 billion).
I NCOME STATEMENT OF VOLKSWAGEN AG € million 2012 2011
Sales 68,361 67,178
Cost of sales 63,458 61,789
Gross profit on sales +4,903 +5,389
Selling, general and
administrative expenses 5,986 5,567
Other operating result +1,264 +1,082
Financial result* +7,904 +6,239
Result from ordinary
activities +8,084 +7,143
Extraordinary result – –1,095
Taxes on income 1,704 2,630
Net income for the year 6,380 3,418
Retained profits brought
forward 10 6
Appropriations to revenue
reserves 3,190 1,708
Net retained profits 3,200 1,715
* Including write-downs of financial assets.
BALANCE SHEET OF VOLKSWAGEN AG AS OF DECEMBER 31
€ million 2012 2011
Fixed assets 61,096 52,543
Inventories 3,795 3,799
Receivables 19,347 13,919
Cash and bank balances 6,880 5,405
Total assets 91,118 75,666
Equity 24,434 19,459
Special tax-allowable
reserves 47 53
Long-term debt 14,102 10,172
Medium-term debt 26,222 19,250
Short-term debt 26,312 26,732
Volkswagen AG (condensed, according to the German Commercial Code) Vehicle sales remain high, earnings up

189MANAGEMENT REPORT
Business Development Shares and Bonds Results of Operations, Financial Position and Net Assets Volkswagen AG (HGB) Value-Enhancing Factors Risk Report Report on Expected Developments
N ET ASSETS AN D FINANCIAL POSITION
Total assets amounted to €91.1 billion at December 31,
2012, €15.5 billion higher than in the previous year.
Investments in tangible and intangible assets rose by €0.5
billion year-on-year to €2.5 billion. This increase was
mainly due to the necessary increase in product and
engine capacities. Investments in financial assets
amounting to €9.7 billion (€10.1 billion) include the
contribution of Porsche SE’s operating automotive
business and the acquisition of additional shares of MAN
SE. At €61.1 billion, fixed assets exceeded the prior-year
figure by 16.3% on December 31, 2012.
Current assets were up €6.9 billion on the previous
year at €30.0 billion, mainly due to the increase in
receivables from affiliated companies and higher liquid
assets.
Equity amounted to €24.4 billion at year-end 2012. The
25.6% increase was largely the result of the significantly
higher net income.
The equity ratio was 26.8% (25.7%). Provisions
decreased by a total of €1.1 billion on the previous year.
This is primarily attributable to lower provisions for taxes.
The €0.6 billion decline in other provisions to €10.9
billion was offset by a €0.6 billion increase in pension
provisions, to €12.0 billion. Higher liabilities to affiliated
companies in particular saw liabilities rise by 42.3% as
against 2011 to €38.9 billion. The interest-bearing portion
of debt rose to €33.1 billion (€20.8 billion).
In our assessment, the economic position of Volkswagen
AG is just as positive as that of the Volkswagen Group.
DIVIDEN D PROPOSAL
In accordance with section 58(2) of the Aktiengesetz (AktG
– German Stock Corporation Act), €3,190 million of the
net income for the year was appropriated to other revenue
reserves. The Board of Management and Supervisory
Board are proposing to the Annual General Meeting to pay
a dividend of €1.6 billion from net retained profits,
i.e. €3.50 per ordinary share and €3.56 per preferred
share, and to appropriate a further €1.6 billion to other
revenue reserves.
PROPOSAL ON TH E APPROPRIATION OF NET PROFIT
€ 2012
Dividend distribution on subscribed
capital (€1,191 million) 1,638,522,652.68
of which on: ordinary shares 1,032,814,363.00
preferred shares 605,708,289.68
Appropriation to other revenue reserves 1,555,000,000.00
Balance (carried forward to new account) 6,285,232.92
Net retained profits 3,199,807,885.60
EMPLOYEE PAY AN D BENEFITS AT VOLKSWAGEN AG € million 2012 % 2011 %
Direct pay including cash benefits 6,481 70.4 5,960 73.1
Social security contributions 1,073 11.7 1,022 12.5
Compensated absence 868 9.4 774 9.5
Post-employment benefits 778 8.5 401 4.9
Total expense 9,200 100.0 8,156 100.0

190
SALES TO THE DEALER ORGAN IZATION
Volkswagen AG sold a total of 2,580,266 vehicles to the
dealer organization in fiscal year 2012, roughly on a level
with the previous year (–3.0%). The proportion of vehicles
sold outside Germany was 70.0% (69.9%).
PRODUCTION
Volkswagen AG produced 1,148,774 vehicles at its vehicle
production plants in Emden, Hanover and Wolfsburg in
the reporting period, 5.5% fewer than in 2011. Average
daily production declined slightly compared with the
previous year to 5,026 units.
N UMBER OF EMPLOYEES
As of December 31, 2012, a total of 101,794 people were
employed at the sites of Volkswagen AG, excluding staff
employed at subsidiaries. Of this figure, 4,838 were
vocational trainees. 4,392 employees were in the passive
phase of their partial retirement. The workforce grew by
4.2% as against the prior-year reporting date.
Female employees accounted for 15.4% of the total
headcount. Volkswagen AG employed 3,328 part-time
workers (3.3%). The percentage of foreign employees was
5.8%. The proportion of employees in the production area
who have completed vocational training relevant for Volks-
wagen was 81.3%. 16.6% of the employees were graduates.
The average age of Volkswagen employees in 2012 was
42.6 years.
RESEARCH AN D DEVELOPMENT
Research and development costs for Volkswagen AG under
the German Commercial Code amounted to €3.8 billion in
2012 (€3.2 billion). 10,869 people were employed in this
area at the end of the reporting period.
PU RCHASING VOLUME
The purchasing volume across the six Volkswagen AG sites
in Germany amounted to €26.6 billion in fiscal year 2012
(€24.5 billion); the proportion attributable to German
suppliers was 68.4% (69.9%). Of the total purchasing
volume, €21.9 billion was spent on production materials
and €4.7 billion on capital goods and services.
EXPEN DITURE ON ENVI RONMENTAL PROTECTION
Expenditure on environmental protection is split between
investments and operating costs. Of our total investments,
those that are spent exclusively or primarily on environ-
mental protection are included in environmental protection
investments. We distinguish here between additive and
integrated investments. Additive environmental protection
measures are separate investments that are independent
of other investments relating to the production process.
They can be upstream or downstream of the production
process. In contrast to additive environmental protection
measures, the environmental impact is already reduced
during production in the case of integrated measures. Our
focus in 2012 was on water pollution control.
Operating costs for environmental protection relate
exclusively to production-related measures that protect the
environment against harmful factors by avoiding, reducing,
or eliminating emissions by the Company, or conserving
resources. These entail both expenses associated with the
operation of equipment that protects the environment as
well as expenditures for measures not relating to such
equipment. Our focus in 2012 was on water pollution
control, waste management and air pollution control.
VOLKSWAGEN AG EXPEN DITU RE ON ENVIRONMENTAL PROTECTION € million 2012 2011 2010 2009 2008
Investments 9 18 12 10 8
Operating costs 216 200 197 180 185
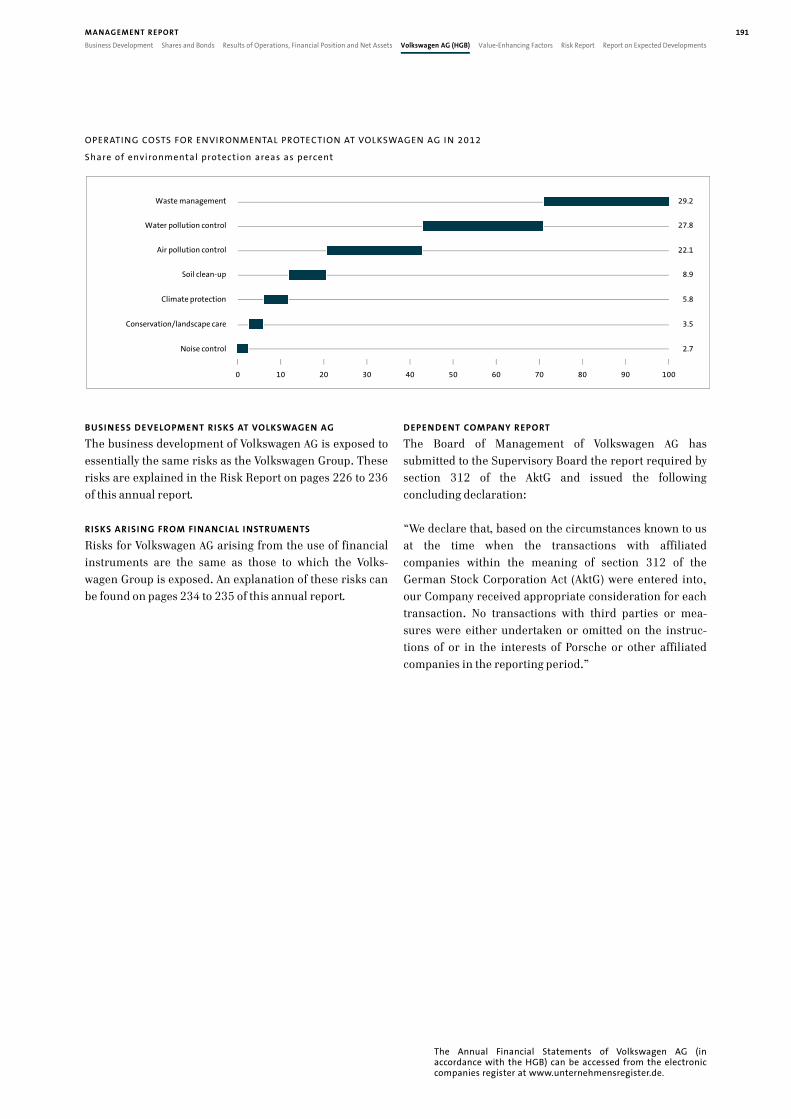
191MANAGEMENT REPORT
Business Development Shares and Bonds Results of Operations, Financial Position and Net Assets Volkswagen AG (HGB) Value-Enhancing Factors Risk Report Report on Expected Developments
OPERATING COSTS FOR ENVIRONMENTAL PROTECTION AT VOLKSWAGEN AG I N 2012
Share of environmental protection areas as percent
29.2
27.8
22.1
8.9
5.8
3.5
2.7
Waste management
Air pollution control
Conservation/landscape care
Noise control
Climate protection
Water pollution control
Soil clean-up
0 10 20 30 40 50 60 70 80 90 100
BUSIN ESS DEVELOPMENT RISKS AT VOLKSWAGEN AG
The business development of Volkswagen AG is exposed to
essentially the same risks as the Volkswagen Group. These
risks are explained in the Risk Report on pages 226 to 236
of this annual report.
RISKS ARISI NG FROM FINANCIAL I NSTRUMENTS
Risks for Volkswagen AG arising from the use of financial
instruments are the same as those to which the Volks-
wagen Group is exposed. An explanation of these risks can
be found on pages 234 to 235 of this annual report.
DEPEN DENT COMPANY REPORT
The Board of Management of Volkswagen AG has
submitted to the Supervisory Board the report required by
section 312 of the AktG and issued the following
concluding declaration:
“We declare that, based on the circumstances known to us
at the time when the transactions with affiliated
companies within the meaning of section 312 of the
German Stock Corporation Act (AktG) were entered into,
our Company received appropriate consideration for each
transaction. No transactions with third parties or mea-
sures were either undertaken or omitted on the instruc-
tions of or in the interests of Porsche or other affiliated
companies in the reporting period.”
The Annual Financial Statements of Volkswagen AG (in accordance with the HGB) can be accessed from the electronic companies register at www.unternehmensregister.de.

192
The financial key performance indicators for the Volkswagen
Group are described in the “Results of Operations, Finan-
cial Position and Net Assets” chapter. Nonfinancial key
performance indicators also attest to the effectiveness of
our Company’s value drivers. These include our processes in
the areas of research and development, procurement, pro-
duction, sales and marketing, information technology and
quality assurance. Above all, we are always aware of our
responsibility towards our employees, society and the
environment. In this chapter, we show how we increase the
enterprise value of Volkswagen in a sustainable way with
examples from the various areas.
CORPORATE SOCIAL RESPONSI BI LITY AN D SUSTAI NABI LITY
Volkswagen is unlike any other company thanks to its
corporate culture, which combines a modern understanding
of responsibility and sustainability with the traditional
values of running a business. As a global company, Volks-
wagen’s worldwide commitment and corporate giving
policy support social projects and help those in need. At
the same time, it integrates this concept with a modern
vision that is focused on strategically anchoring corporate
social responsibility (CSR) and sustainability in the value
chain. The challenges of the 21st century, particularly
resource and climate conservation as well as fairness within
and between generations, are reflected in our vision of
responsibility and sustainability. Sustainability requires a
commitment to balancing economic, ecological and social
dimensions. Our CSR concept is aimed at ensuring that we
avoid risks at every step along the value chain, identify
opportunities for development early on and improve our
reputation. CSR therefore makes a necessary contribution
to increasing the value of the Company and safeguarding it
in the long term.
Key challenges of doing business sustainably
Together with our stakeholder groups, we use our Strategy
2018 to work out which topics are important for Volks-
wagen’s long-term viability. In this analytically based
process, we evaluate current international sustainability
studies and engage in comprehensive dialog with our
stakeholders. These include analysts, politicians and civil
authorities, scientists, nongovernmental organizations
and, not least, our employees. We discuss important chal-
lenges for our Company and the automotive industry in
detail at both brand and Group level. The materiality
matrix is an ongoing process during which the internal
bodies discuss and evaluate the identified topics. The
result is the roadmap for our sustainability strategy: a
matrix with the key issues. It is shown on the next page.
Sustainability management
The Group Board of Management is also the supreme
sustainability board in the Company. It receives regular
updates from the Group CSR & Sustainability steering
group about the issues of responsibility and sustainability.
Senior executives from central Board of Management
business areas, the Group Works Council and repre-
sentatives of the brands and regions are members of this
steering group. It resolves the sustainability strategy,
which aims to help the Group achieve its goal of becoming
the most sustainable automaker in the world in 2018.
Since 2006, the CSR office has coordinated all activities
within the Group and the brands, using standardized
structures, processes and reports. It strategically aligns all
CSR activities and acts as a guidance unit for internal
management processes and dialog with stakeholders. Our
CSR project teams work on current topics across business
areas, such as sustainability in supplier relationships. An
Value-Enhancing Factors Responsibility and sustainability along the entire value chain
Our outstanding team is dedicated to developing and manufacturing first-class automobiles that
captivate customers around the world. The focus of our business is on ensuring responsibility and
sustainability in respect of our employees, society and the environment along the entire value chain.

193
Business Development Shares and Bonds Results of Operations, Financial Position and Net Assets Volkswagen AG (HGB) Value-Enhancing Factors Risk Report Report on Expected Developments
MANAGEMENT REPORT
KEY ISSUES (RESU LTS OF THE MATERIALITY ANALYSIS)
international interchange between the CSR coordinators
of all brands and regions has been taking place regularly
since 2009. There is also a Group environmental conference
and a Group environmental strategy group to coordinate
environmental officers throughout the Group. We have set
the course for an ecological reorganization of the Volks-
wagen Group by appointing a Group Chief Officer for the
Environment, Energy and New Business Areas.
With the introduction of the IT-based sustainability
management system and the further integration of the KPI
(key performance indicator) systems, we have created the
basis for comprehensive and timely CSR and sustainability
reporting in the Group. The improved control efficiency
and transparency of the KPI system allow Volkswagen to
meet the increasing expectations of its stakeholders for an
up-to-date, differentiated presentation of the Company’s
CSR and sustainability performance.
Code of Conduct and guidelines
Our Code of Conduct, which is applicable throughout the
Group, provides our employees with guidance on how to
manage legal and ethical challenges in their daily work.
These principles include the Group values of closeness to
customers, maximum performance, creating value, renew-
ability, respect, responsibility and sustainability. All employees
are equally responsible for adhering to these principles.
International conventions, laws and internal rules are also
key guidelines for our conduct. We also acknowledge our
commitment to the “Declaration on Social Rights and
Industrial Relationships at Volkswagen” (Volkswagen Social
Charter), the Temporary Work Charter and the Charter on
Labor Relations, all of which address fundamental social
rights and principles.
Strategic dialog with stakeholders
For Volkswagen, the ability to help shape national and
international corporate networks is an important component
of the permanent dialog with key social groups and actors.
We contribute our technical and social capability here and
support numerous projects. The Group is represented on
the board of the leading European business network for
corporate social responsibility, CSR Europe. At a national
level, we are represented on the board of econsense, the
Forum for Sustainable Development of German Business.
Along with numerous other companies, Volkswagen has
signed the “Code of Responsible Conduct for Business”
initiative.
Since 2002, we have been committed to the largest and
most important CSR initiative in the world, the Global
Compact. The 7,000 participating companies from over
135 countries work together to shape a more sustainable
and equitable world economy. Volkswagen makes a significant
ST
AK
EH
OLD
ER
EX
PE
CT
AT
ION
S
I M P O R TA N C E F O R B U S I N E SS S U CC E SS
> Food
> Health
> Land take
> Urbanization
> Segment shifts> Market shifts
> Employment> Diversity
> Human rights
> Noise reduction
> Compliance
> Efficient products and production
> Customer satisfaction
> Economic stability
> Climateprotection
> Sustainablesupplier relations
> Social responsibility
> Biodiversity
> e-mobility> Sustainable mobility

194
RESULTS OF THE SAM 2012 ASSESSMENT
as percent
Volkswagen AG
Industryaverage
Economicdimension
Environmentaldimension
0 10 20 30 40 50 60
Total
70
Socialdimension
80 90 100
contribution to this initiative. Ten principles governing
human rights, labor standards, environmental protection
and the fight against corruption describe the values of the
Global Compact. In 2012, we again achieved the “Global
Compact Advanced Level” and guided our business activities
at all locations of our Company by the Global Compact
principles. With our expertise, we also help other companies
in the Global Compact to embrace their global responsibility.
An example of this is our active participation on the
advisory board for the “Sustainable Supplier Chain” project.
Volkswagen is also involved in the campaigns of the Rio+20
United Nations Conference on Sustainable Development.
Volkswagen and the German Nature and Biodiversity
Conservation Union (NABU) – the largest environmental
protection organization in Germany – have been working
together for more than ten years. This unique cooperation
works because both sides take into account the other’s
different interests. The cooperation is composed of three
elements: advice, dialog and projects. As part of this, we
are raising public awareness about issues regarding the
environment and sustainability.
The fleet management project with Volkswagen Leasing
GmbH is an ecological and economic success. We are
reducing both CO2 emissions and costs on the part of fleet
operators by deploying our most efficient vehicles. The
project is also a particularly effective form of climate
protection, since part of the project involves us providing
funds for the protection of moors in Germany, which are
important CO2 reservoirs.
The Volkswagen brand’s “Think Blue.” motto is a good
example of its ecologically end-to-end concept. This means
that ecological sustainability represents a core element
– over the overall lifecycle of the products. Environ-
mentally relevant considerations such as climate protection
and resource conservation are integrated into our
technical development at an early stage. “Think Blue.” also
gives concrete advice on how to act, so that each of us can
do our part by adopting environmentally conscious behavior.
The brand aims to use its “Think Blue. Factory.” environ-
mental program to reduce the most important environ-
mental indicators, such as demand for energy, waste,
water consumption, CO2 and solvent emissions by 25% in
the period up to 2018. To do this, uniform measuring and
reporting methods are being implemented in all plants
around the world. Supporting ecological projects and
getting involved in cooperative projects are also core
components of “Think Blue.”. A good example of this was
the “Think Blue. World Championship 2012.” fuel-saving
competition, in which 18 teams from 17 countries showed
that driving in a fuel-saving way is fun and that people’s
personal driving habits positively influence fuel consumption.
Volkswagen in sustainability rankings and indices
As analysts and investors view CSR and sustainability
performance as leading indicators of forward-looking
corporate leadership, they also increasingly base their
recommendations and decisions on companies’ CSR and
sustainability profile. Sustainability ratings are particularly
well suited to evaluating a company’s environmental, social
and economic performance. If a company achieves the
highest scores in these ratings, it not only sends a clear
signal to its stakeholders, but also raises its attractiveness
as an employer and the motivation of its existing employees.
As in the previous years, Volkswagen was again able to
take its position among the leaders in its sector in the most
important international ratings and indices in 2012. We
are one of only three automobile companies listed in the
Dow Jones Sustainability World Index, which is based on
the assessment performed by Swiss company Sustainable
Asset Management (SAM). MAN is the only German company
in the industrial engineering sector to be represented in
the Dow Jones Sustainability World and the Dow Jones
Sustainability Europe indices. Norwegian insurance
company Storebrand also selected Volkswagen as an invest-
ment for its new Trippel Smart and SPP Global Topp 100
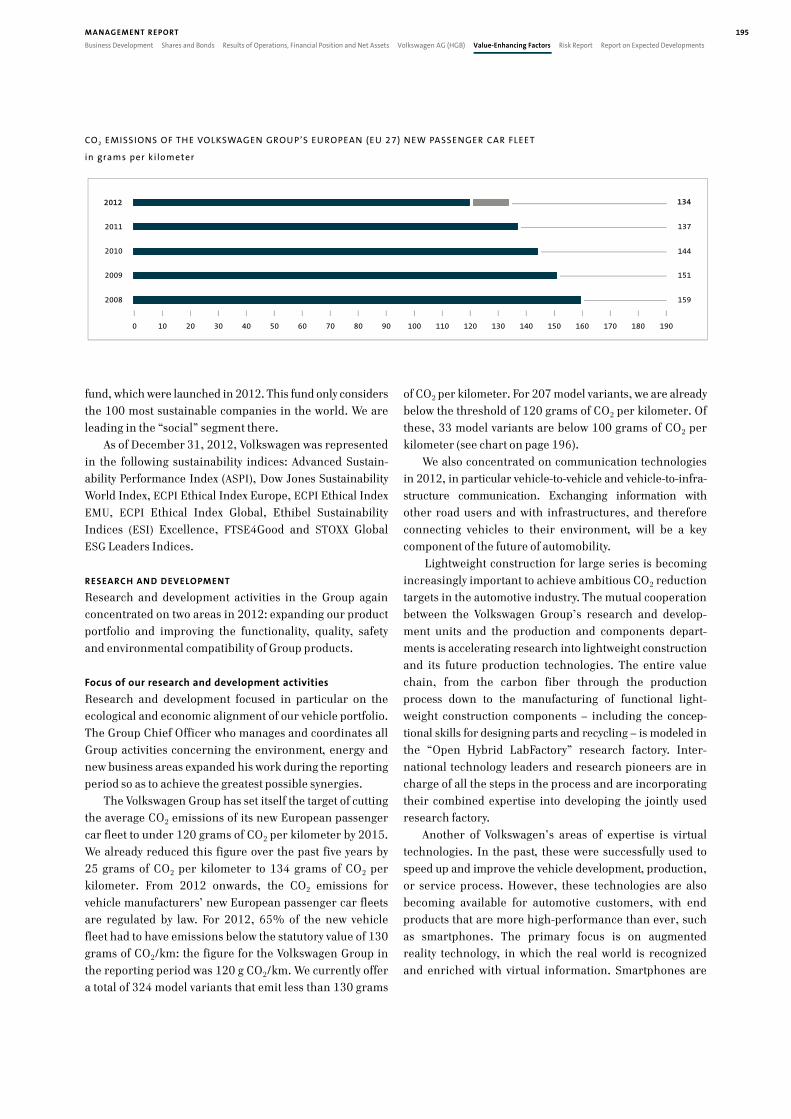
195
Business Development Shares and Bonds Results of Operations, Financial Position and Net Assets Volkswagen AG (HGB) Value-Enhancing Factors Risk Report Report on Expected Developments
MANAGEMENT REPORT
CO 2 EMISSIONS OF THE VOLKSWAGEN GROU P’S EU ROPEAN (EU 27) NEW PASSENGER CAR FLEET
in grams per ki lometer
134
137
144
151
159
0 50 100 150 19040302010 60 70 80 90 110 120 130 140 160 170 180
2012
2010
2008
2011
2009
fund, which were launched in 2012. This fund only considers
the 100 most sustainable companies in the world. We are
leading in the “social” segment there.
As of December 31, 2012, Volkswagen was represented
in the following sustainability indices: Advanced Sustain-
ability Performance Index (ASPI), Dow Jones Sustainability
World Index, ECPI Ethical Index Europe, ECPI Ethical Index
EMU, ECPI Ethical Index Global, Ethibel Sustainability
Indices (ESI) Excellence, FTSE4Good and STOXX Global
ESG Leaders Indices.
RESEARCH AN D DEVELOPMENT
Research and development activities in the Group again
concentrated on two areas in 2012: expanding our product
portfolio and improving the functionality, quality, safety
and environmental compatibility of Group products.
Focus of our research and development activities
Research and development focused in particular on the
ecological and economic alignment of our vehicle portfolio.
The Group Chief Officer who manages and coordinates all
Group activities concerning the environment, energy and
new business areas expanded his work during the reporting
period so as to achieve the greatest possible synergies.
The Volkswagen Group has set itself the target of cutting
the average CO2 emissions of its new European passenger
car fleet to under 120 grams of CO2 per kilometer by 2015.
We already reduced this figure over the past five years by
25 grams of CO2 per kilometer to 134 grams of CO2 per
kilometer. From 2012 onwards, the CO2 emissions for
vehicle manufacturers’ new European passenger car fleets
are regulated by law. For 2012, 65% of the new vehicle
fleet had to have emissions below the statutory value of 130
grams of CO2/km: the figure for the Volkswagen Group in
the reporting period was 120 g CO2/km. We currently offer
a total of 324 model variants that emit less than 130 grams
of CO2 per kilometer. For 207 model variants, we are already
below the threshold of 120 grams of CO2 per kilometer. Of
these, 33 model variants are below 100 grams of CO2 per
kilometer (see chart on page 196).
We also concentrated on communication technologies
in 2012, in particular vehicle-to-vehicle and vehicle-to-infra-
structure communication. Exchanging information with
other road users and with infrastructures, and therefore
connecting vehicles to their environment, will be a key
component of the future of automobility.
Lightweight construction for large series is becoming
increasingly important to achieve ambitious CO2 reduction
targets in the automotive industry. The mutual cooperation
between the Volkswagen Group’s research and develop-
ment units and the production and components depart-
ments is accelerating research into lightweight construction
and its future production technologies. The entire value
chain, from the carbon fiber through the production
process down to the manufacturing of functional light-
weight construction components – including the concep-
tional skills for designing parts and recycling – is modeled in
the “Open Hybrid LabFactory” research factory. Inter-
national technology leaders and research pioneers are in
charge of all the steps in the process and are incorporating
their combined expertise into developing the jointly used
research factory.
Another of Volkswagen’s areas of expertise is virtual
technologies. In the past, these were successfully used to
speed up and improve the vehicle development, production,
or service process. However, these technologies are also
becoming available for automotive customers, with end
products that are more high-performance than ever, such
as smartphones. The primary focus is on augmented
reality technology, in which the real world is recognized
and enriched with virtual information. Smartphones are

196
CO 2 EMISSIONS – STATUS QUO
Number of vehicles
0 20 40 60 80 100 120 160 200
33
207
324
100 g CO2/km<_
120 g CO2/km<_
130 g CO2/km<_
220180140 240 260 280 300 320 340
using this technology to become innovative owner manuals:
customers can film a part of the vehicle on their smart-
phone and receive multimedia information about how to
use it. The Audi brand is the first to put this technology into
the “Audi A1 eKurzinfo” series smartphone application.
The Volkswagen Group’s research and development team
are working on other applications for comparable uses in
order to safeguard our leading position in this area.
In August 2012, the Volkswagen Group of America opened
a state-of-the-art research and development center in
California. Drive technologies and vehicles from several
Group brands will be tested and optimized here. At the
heart of this complex is the climate-controlled emissions
lab, which tests exhaust emissions and performance at
extreme temperatures. Porsche is expanding its research
and development center in Weissach, near Stuttgart, with a
state-of-the-art wind tunnel and a design studio, among
other things. ŠKODA is adding 21 new engine and component
test beds to its technology and development center in
Česana, near the corporate headquarters in Mladá Boleslav
– one of the largest investments currently being made in
development in the Czech Republic.
Innovative products captivate our customers
The “Automotive INNOVATIONS Awards” are presented every
year to vehicle manufacturers by the Center of Automotive
Management, an independent organization that conducts
empirical research on automobiles and mobility. The
Volkswagen Group underlined its lead with wins in the
categories “Most Innovative Automotive Company”, “Best
Manufacturer: Conventional Drives” and “Best Manu-
facturer: Vehicle Concepts” in fiscal year 2012.
In the following paragraphs we present selected inno-
vations – new models, powertrains and systems launched
during the past fiscal year.
Cylinder deactivation was used in a four-cylinder turbo
engine for the first time in the new Polo BlueGT. This
technology automatically deactivates the second and third
cylinders under light and medium load conditions without
the driver noticing. This significantly reduces the 1.4 TSI
engine’s fuel consumption. The sporty Polo BlueGT’s
strong engine and seven-speed direct shift gearbox use an
average of only 4.5 l of fuel per 100 km and produce
105 g/km of CO2 per kilometer.
Following the Touareg Hybrid, the Jetta Hybrid was the
second Volkswagen in 2012 to have a drivetrain module
with both a petrol engine and an electric motor under its
bonnet. The combination of a 1.4 TSI engine (110 kW/150
PS), an electric motor (20 kW) and a seven-speed direct
shift gearbox makes driving both dynamic and economical.
After the up! was first introduced in 2011, the Volks-
wagen Passenger Cars brand presented two more versions
of the small car in the reporting period. The four-door up!
lets even very tall people get in and out of the vehicle
comfortably thanks to its wide-opening doors. An optional
extra is a panoramic roof, something which is unusual for
this vehicle segment. The eco up! – powered by a CNG engine
with 50 kW (68 PS) – leads the pack with CO2 emissions of
79 g/km.
The Volkswagen Passenger Cars brand’s innovative
highlight in the reporting period was the all-new Golf,
which is based on the Modular Transverse Toolkit (MQB).
It is up to 100 kg lighter and 23% more efficient than its
predecessor.
The newly developed generations of petrol and diesel
motors ranging from 63 kW (85 PS) to 169 kW (230 PS)
make it fun to drive. Among other things, they feature a
start-stop system and battery regeneration mode to
recuperate brake energy as standard and are therefore
particularly fuel-efficient. For example, active cylinder
management helps the 1.4 TSI petrol engine to use an
average of 4.7 l per 100 km. The new air conditioning
system design also helps to reduce fuel consumption. A
large number of new safety and assistance systems are also
available for the Golf. Some examples are the Front Assist
with an integrated city emergency braking function,
fatigue detection, an electronic differential lock as standard,
the Lane Assist lane keeping assistant, road sign
recognition and the latest generation of the Park Assist
automatic parking assistant, which warns against obstacles
with a graphical 360 degree display. The multi-collision
brake, which comes as standard and was awarded a

197
Business Development Shares and Bonds Results of Operations, Financial Position and Net Assets Volkswagen AG (HGB) Value-Enhancing Factors Risk Report Report on Expected Developments
MANAGEMENT REPORT
“Golden Angel” in 2012 from German automobile club
ADAC, slows the vehicle down after an accident so as to
reduce the remaining energy and thus avoid typical
secondary accidents. Additional technologies such as the
progressive steering system, a driver profile selection with
five programs and the new information and entertainment
system with a display that reacts to hand movements via a
proximity sensor round off the specification package. On
the outside, the Golf features timeless design cues with
horizontal front lines, a pronounced C-pillar and perfectly
formed, minimalist styling.
Audi celebrated the world premiere of the third-gener-
ation Audi A3 in fiscal year 2012. It was the first vehicle in
the Volkswagen Group to be based on the Modular Trans-
verse Toolkit and has benefited from the associated
reduction in complexity, costs and time required for
development. The new A3 Sportback is up to 90 kg lighter
than its predecessor and, as a vehicle in the premium
compact class, can be fitted with a range of driver assistance
systems such as Audi’s adaptive cruise control. This
maintains a preset distance between the car and the
vehicle ahead up to a speed of 200 km/h by autonomously
accelerating and decelerating.
Audi expanded its ranges in 2012 with the new A6
hybrid and A8 hybrid models. Both models have a 2.0 TFSI
engine and an electric motor and can be powered by both
the combustion engine and electric motor, as well as in
hybrid mode. During the lag phases, the vehicles recu-
perate energy while strong acceleration activates both
engines. With a total output of 180 kW (245 PS), the A6
hybrid only uses 6.2 l of super grade fuel, while CO2
emissions are only 145 g/km.
The new SEAT Leon is the first vehicle in the A segment
to use full LED headlight technology. This supports the
vehicle’s exceptional design while increasing its functionality.
The Leon represents a revolution for the SEAT brand in
terms of quality and appeal – particularly in its interior.
The Leon is also based on the Modular Transverse Toolkit.
The resulting 90 kg weight saving compared with the
previous model gives it more dynamic handling and has a
positive impact on fuel consumption. The optimized and
finely tuned chassis combines comfort and a sporty design,
in line with the SEAT brand image. A comprehensive
assistance and information system rounds off the entire
package.
Scania presented its newly developed, innovative 9 and
13 liter diesel engines as well as two new high-perfor-
mance gas engines in fiscal year 2012. These efficient
engines meet all the requirements of the future Euro 6
emission standard.
In fiscal 2012, MAN celebrated the world premiere of
the new TG family of trucks, which comply with the future
Euro 6 emission standard. These boast fuel consumption
just as low as their particularly efficient predecessors.
Studies and concept vehicles show the way into the future
In this section, we describe selected concept vehicles and
studies that we presented in 2012 alongside the numerous
series vehicles.
In 2012, the Volkswagen Passenger Cars brand presented
the advanced Cross Coupé concept car, a compact SUV
with an innovative four-wheel drive and a plug-in hybrid
drive. Its progressive and dynamic presence gives a fore-
taste of the design of future SUV models. The vehicle has
three engines that work together efficiently as a hybrid
system: a TDI engine with 140 kW (190 PS) and an electric
motor with an output of 40 kW drive the front axle. To run
the Cross Coupé in four-wheel drive or solely on electric
power, an additional electric motor (85 kW) is activated for
the rear axle. The Cross Coupé received the “eCar Award
2012” from readers of “AUTO BILD” and “AUTOTEST” for its
winning combination of a powerful design and environ-
mentally friendly drive.
As part of the launch of the new Golf, the Volkswagen
Passenger Cars brand also presented the new Golf
BlueMotion concept car. With an average fuel consumption
of 3.2 l of diesel per 100 km and CO2 emissions of only
85 g/km, it is scoring top marks and setting new bench-
marks in its vehicle class.
The technology of the Taigun, a compact SUV concept
car, is based heavily on the New Small Family. Powered by a
new 1.0 l three-cylinder TSI engine with 81 kW (110 PS),
the four-seater has an average fuel consumption of
approximately 4.5 l per 100 km. Its external appearance is
dominated by a practical roof railing system with integrated
LED spotlights. The interior features rotating dials in the
control panel’s air vents for the first time, which can be
used to control the temperature and blower speed as well
as to read the settings.
In the design and vehicle and drive concept areas, Audi
is showing the way to the future with its crosslane coupé
concept study. The combination of technology, construction
and design hint at the design language of Audi’s forth-
coming Q models. The vehicle concept is entering entirely
new territory with its multimaterial space frame – with
positive effects on weight, costs and the overall energy

198
balance – and is another evolutionary step for lightweight
construction at Audi. An innovative and efficient plug-in
hybrid drive, based on a specially developed 1.5 three-
cylinder TFSI engine and two electric motors, is setting
new benchmarks as it only uses 1.1 l of fuel per 100 km
and only emits 26 grams of CO2 per kilometer.
The Audi A6 L e-tron concept, which was designed
specifically for the Chinese market, is the first hybrid
technology concept for the premium class. The plug-in
hybrid features a 2.0 TFSI engine with 155 kW (211 PS)
and a 70 kW electric motor and can cover a distance of
80 km running solely on electric power.
The Porsche Panamera Sport Turismo e-hybrid concept
car combines the next generation of hybrid drives with
new ideas for an evolutionary, sporty body concept. It
combines the performance of a Porsche with comprehensive
suitability for daily use. The plug-in hybrid drive with an
output of up to 306 kW (416 PS) takes the Panamera Sport
Turismo from 0 to 100 km/h in less than six seconds. The
large central TFT color display allows the driver to call up
and display a wide range of information – from the tachom-
eter to driving data and navigation.
Bentley and Lamborghini revealed the potential for
additional series at the two brands by showcasing the
Bentley EXP 9 F and Lamborghini Urus SUV studies in the
reporting period. With their compelling muscular design
and powerful drive, the two four-wheel drive models offer
completely new interpretations for the vehicle segment.
In 2012, Volkswagen Commercial Vehicles showcased
an extreme version of the Amarok, the Amarok Canyon.
This concept car is significantly taller and wider than the
series model and is powered by a high-torque 2.0 TDI
biturbo engine with 132 kW/180 PS for maximum offroad
performance. The 4MOTION four-wheel drive can be engaged
for offroad use.
MAN showcased the Metropolis heavy truck, a hybrid
research vehicle that can be powered solely by electricity in
urban areas for quiet, emission-free transport and delivery
tasks.
In the reporting period, MAN presented the prototypes
of the 20V35/44G Otto gas engine, which were developed
for stationary use in power plants. The single-charged 10.6
MW engine is the highest performing in its segment. It is
extremely effective and complies with all emission limits
that are currently known thanks to a large number of
innovative technological components.
Leveraging synergies to increase efficiency
For new vehicle projects, the individual brands of the
Volkswagen Group have access to “modular toolkits”. These
ensure that the synergy effects that exist both between
models in one series and across all series and brands can
be optimized and increased at the same time. Leveraging
them allows vehicles for both existing and still to be
developed markets to be planned more efficiently.
The Modular Longitudinal Toolkit (MLB), which was
primarily developed by the Audi brand, and its evolu-
tionary step MLB evo are the basis for vehicles whose
engine is mounted longitudinally to the direction of travel.
We are pushing forward with MLB development in partic-
ular with a view to topics such as lightweight construction
and electrification. At Audi, vehicles based on the MLB
have already been rolling off the production line since
2007. By employing the Modular Transverse Toolkit
(MQB), the Volkswagen Group has made a quantum leap in
the enhancement of the cross-brand platform and modular
strategy in 2012. The MQB allows vehicles to be designed
whose architecture permits a transverse arrangement of
the engine components. This enables us to produce
vehicles with differing lengths, widths and wheelbases,
and thus to meet growing customer wishes for a variety of
models, equipment features and design. At the same time,
the MQB reduces the complexity, unit costs and time
required for development. We take advantage of the
savings gained to further improve our vehicles’ equipment
features, among other things. In spring 2012, the first
vehicle to be based on the MQB – the Audi A3 – was
introduced to the market. The Volkswagen Passenger Cars
brand’s most important model – the new Golf – followed
over the course of the year. In the future, the MQB will
form the technical foundation for a large number of
models under the Volkswagen Passenger Cars, Audi, SEAT
and ŠKODA brands. This means that innovations in the
areas of infotainment and driver assistance systems, for
example, will be widely available.
Under the leadership of the Porsche brand, the Group
is taking the next step in the enhancement of this strategy
with the Modular Standard Toolkit (MSB). The MSB is the
basis for vehicles whose engine is installed in a longi-
tudinal direction and that feature rear-wheel drive in the
base version.
We are also systematically transferring this modular
concept to other areas of automotive production. The
Modular Infotainment System (MIB) provides a variable
hardware platform across brands and vehicle classes for a
wide variety of infotainment features and individual designs.
The Modular Diesel System (MDB), which forms the basis
for our new, efficient and dynamic generation of three-
and four-cylinder diesel engines, debuted in 2012 in the
new Audi A3.
Pooling strengths with strategic alliances
Volkswagen continued the existing cooperation arrange-
ment with Daimler AG in fiscal year 2012.
We are systematically pressing ahead with the further
research and development of high-voltage battery systems
for plug-in hybrid drives and electric vehicles, while

199
Business Development Shares and Bonds Results of Operations, Financial Position and Net Assets Volkswagen AG (HGB) Value-Enhancing Factors Risk Report Report on Expected Developments
MANAGEMENT REPORT
entering into alliances with expert battery manufacturers;
we intensified these in 2012. VOLKSWAGEN VARTA Micro-
battery Forschungsgesellschaft mbH & Co. KG, which we
established in 2010 with our partner VARTA Microbattery
GmbH in Ellwangen, ramped up its activities and started
seeing very positive results in the reporting period. It aims
to research and develop battery cells suitable for cars as
well as the associated production technology. We are
expanding our expertise in the field of electric traction by
cooperating with a large number of universities.
Integration of external R&D expertise
In addition to our own internal resources, the expertise of
our suppliers plays a key role in the development process
and will help us to systematically advance our new model
rollout in the coming years. The early-stage, close collab-
oration between our internal and external resources
guarantees that we can successfully complete projects with
the quality we expect in reduced development times. We
are able to draw on external expertise primarily in creative
processes, as well as in the area of virtual technologies and
megatrends.
We also use external capacity for support services,
downstream processes such as series management, and
activities that are not customer-facing but generate improve-
ments. In addition, we are expanding our cooperation with
subsequent series suppliers, as their expertise in the
development phase of modules and components is partic-
ularly important.
Numerous patents submitted by employees
The large number and technical quality of the ideas sub-
mitted in 2012 demonstrate once again that our employees
are an enormous source of innovation. In the reporting
period, they applied for 4,313 patents – 2,128 in Germany
and 2,185 abroad. The main focus of these innovations
was on the areas of modular infotainment, driver assistance
systems, electric drive technology and lightweight steel
design.
Key R&D figures
Total research and development costs for fiscal year 2012
in the Automotive Division increased by 32.1% year-on-
year. Alongside new models, the main focus was on the
electrification of our vehicle portfolio and increasing the
efficiency of our range of engines, among other things,
whereas alternative drive technologies accounted for an
increasing proportion. The capitalization ratio increased
to 27.5% (23.1%). Research and development costs recog-
nized in the income statement in accordance with IFRSs
were higher than in 2011, at €8.9 billion (€7.2 billion).
This meant that their ratio to sales revenue in the Auto-
motive Division remained unchanged at 5.1% (5.1%).
On December 31, 2012, the Research and Development
function – including the equity-accounted joint venture
companies in China – employed 42,089 people Group-wide
(+21.1%), corresponding to 7.7% of the total headcount.
RESEARCH AN D DEVELOPMENT COSTS I N THE AUTOMOTIVE DIVISION € million 2012 2011 2010 2009 2008
Total research and development costs 9,515 7,203 6,257 5,790 5,926
of which capitalized development costs 2,615 1,666 1,667 1,947 2,216
Capitalization ratio in % 27.5 23.1 26.6 33.6 37.4
Amortization of capitalized development costs 1,951 1,697 2,276 1,586 1,392
Research and development costs recognized in the income
statement 8,851 7,234 6,866 5,429 5,102

200
PROCU REMENT
Procurement focused its work in the reporting period on
safeguarding new vehicle start-ups, particularly with a view
to the Modular Transverse Toolkit (MQB), developing new
procurement markets and preemptively assuring quality
in the supply chains.
Procurement strategy
The four procurement goals derived from the Group Strategy
2018 were also relevant in the reporting period: first, to
provide market-centric premium quality and innovations
at competitive prices; second, to meet cost targets and
ensure the profitability of our products over their entire
lifecycle; third, to safeguard global volume growth through
the permanent availability and consistently high quality of
procured components; and fourth, to continue to raise
employee satisfaction and the attractiveness of the pro-
curement function.
We have assigned action areas to each of these goals.
Currently, 30 programs with precisely defined measures
and responsibilities for all brands and regions ensure that
these goals are achieved. The uniform procurement strategy
that covers all brands and all regions enables us to take
advantage of opportunities throughout the Group, pool
strengths and minimize weaknesses and risks at the same
time.
Expanding the process optimization program
Process optimization has become a core component of
work in the procurement function. Experts are working on
standardizing processes and continuously improving them
in all brands and all regions of the Volkswagen Group. We
added the procurement organizations of Volkswagen
Group of America, Volkswagen India, Volkswagen Group
Rus, Porsche, Scania and MAN to the procurement process
optimization program in 2012. The Porsche brand, for
example, was integrated with the Group’s core procurement
processes within four months. This means that joint deci-
sions about procurement issues were already made in 2012.
We are specifically examining on an ongoing basis
whether introducing new or optimizing existing processes
will deliver the expected advantages in terms of time and
quality. This is how we ensure that the measures taken are
effective for the long term.
Stable supply situation for procured components and raw
materials
In the reporting period, the supply situation was dominated
by growing vehicle sales in China, North and South
America, as well as the further increase in demand in all
segments for vehicles with high-quality equipment features.
Because of this, the need for procured components grew
and changed. Supplies to all component and vehicle plants
were nevertheless guaranteed at all times. Particularly
noteworthy is the fact that we successfully safeguarded
new vehicle start-ups based on the Modular Transverse
Toolkit (MQB) at the Audi, Volkswagen and SEAT brands.
In addition, there were unplanned events in 2012 that
led to production shortfalls at our raw materials suppliers,
among other things. The effectiveness of our processes and
safety mechanisms that we had installed and embedded as
a fundamental part of the organization after the lessons
learned from the natural disasters in Japan in 2011 became
clear in these situations. In addition to working together
with suppliers, a cross-business task force, which is an
established part of our crisis management, helps to guarantee
the security of supplies at all times.
Continuously integrating our suppliers to the demand
and capacity management systems is a key tool for safe-
guarding supplies. The integrated capacity management
system INCA offers the suppliers involved the ability to
manage their capacities online. They also receive an insight
into the requirement forecasts for their parts for a planning
horizon of up to 24 months.
Most input and raw materials saw declining prices on
the spot markets in 2012 because of the ongoing crisis in
the eurozone. However, despite this trend, prices remained
at a high level and were subject to pronounced volatility.

201
Business Development Shares and Bonds Results of Operations, Financial Position and Net Assets Volkswagen AG (HGB) Value-Enhancing Factors Risk Report Report on Expected Developments
MANAGEMENT REPORT
Overall, the markets were very strained and nervous, and
crude oil prices in particular were extremely volatile and
highly sensitive in relation to political uncertainties and
the impact of speculation.
The economic effects also impacted prices for rare
earths. In comparison to the historical high prices reached
in 2011, they declined on the Chinese-dominated market.
However, they remained at a comparatively high level.
Procured component and supplier management to assure
quality within the supply process
As part of our growth strategy, both we and our partners
are faced with enormous challenges in the global procure-
ment of components. Procured components management
is procurement’s “technical arm”. Tool and process experts
on the ground preemptively ensure the preparation of
tools and the development of suppliers’ new production
sites for new vehicle start-ups. Procured components
management also supports line procurement to safeguard
the supply of components. New technological fields have
been added to the functional portfolio to reflect the volatile
environment and technical complexity. Against this back-
ground, procured components management is a core com-
ponent for safeguarding global volumes.
Subcontractors are a particular focus for procured
components management. Volkswagen’s direct suppliers
normally use a high number of subcontractors, whose value
creation processes represent an additional challenge. For
this reason, the entire value creation process is already
analyzed shortly before contracting in a goal agreement
discussion with the supplier by looking at all business
areas and adapted accordingly.
Developing new procurement markets
We defined measures to achieve the cost targets set as part of
the Group Strategy 2018, and these were also systematically
implemented in 2012. One of these measures is imple-
menting the C3 Sourcing (Cost-Competitive Country Sourc-
ing) program to develop affordable procurement markets.
The objective of this program is to use competitive
procurement markets to not only produce localized vehicle
projects there, but also to use them for vehicle projects in
other countries. Components from the C3 regions are also
being exported without us having to lower our quality
standards.
We further developed our regional offices worldwide at
a cross-business area level so as to guarantee the share of
C3 contracts in the flow of goods for the long term. These
offices identify new suppliers and guide them until the
contract award decision, while procured components
management at the regional offices subsequently ensures
the ability of the suppliers to deliver.
Southeast Asia is one example of where we have success-
fully developed new markets. Via the regional office in Kuala
Lumpur, which opened in 2010, more than 250 suppliers
from the whole of Southeast Asia have already been linked to
the Volkswagen systems environment. These local suppliers
have been awarded a significant purchasing volume.
Sustainability in supplier relationships
Since 2006, the “sustainability in supplier relationships”
concept has ensured that our business partners are also
complying with the environmental and social standards
that apply throughout the Group. The concept’s main
pillars are: the sustainability standards signed by the
member of the Group Board of Management responsible
for Procurement and by the Group Chief Compliance
Officer, an early warning system to minimize risks, trans-
parency in the procurement process, and supplier moni-
toring and development. Optimizing sustainability aspects
together with our business partners and safeguarding our
volume flows for the long term are at the forefront here.
We intensified and stabilized our suppliers’ cooperation
with the Group’s brands and regions in the reporting
period. Among other things, we held a large number of
information events and made an Internet-based training

202
module available on the Group Business Platform. All
suppliers who are registered on the platform have been
asked to complete this training module with a final
performance review. The tool can also be used by all of
Volkswagen’s procurement employees in order to expand
their knowledge of sustainability in supplier relationships.
Furthermore, all business partners have been asked to
fill out a questionnaire on our sustainability standards. A
central Group office is monitoring the results in order to
develop areas for improvement and action plans for these
measures together with our suppliers. In the reporting
period, this resulted not only in increased awareness at
our suppliers, but also in optimization in the value chain,
for example, by minimizing supply risks.
Purchasing volume
The Volkswagen Group’s purchasing volume mainly
comprises production materials, services and investments.
In the reporting period – including the Chinese joint
venture companies – it saw an increase of 16.8% to €128.7
billion. The proportion attributable to German suppliers
was 38.8% (39.3%).
PU RCHASING VOLUME BY BRAN D AN D MARKET € billion 2012 2011 %
Volkswagen Passenger Cars 77.0 69.7 +10.5
Audi1 22.7 21.0 +7.9
ŠKODA 6.6 6.6 +0.2
SEAT 3.7 3.4 +9.7
Bentley 0.6 0.5 +11.2
Porsche2 1.4 – –
Volkswagen Commercial Vehicles 2.4 2.4 –1.4
Scania 5.2 5.1 +2.4
MAN2 9.1 1.5 x
Volkswagen Group 128.7 110.2 +16.8
Europe/Remaining markets 88.1 75.4 +16.9
North America 6.2 4.7 +32.2
South America 8.0 8.1 –1.7
Asia-Pacific 26.4 22.0 +20.0
1 Audi includes Lamborghini and Ducati (from August 2012).
2 Porsche from August 2012, MAN from November 2011.
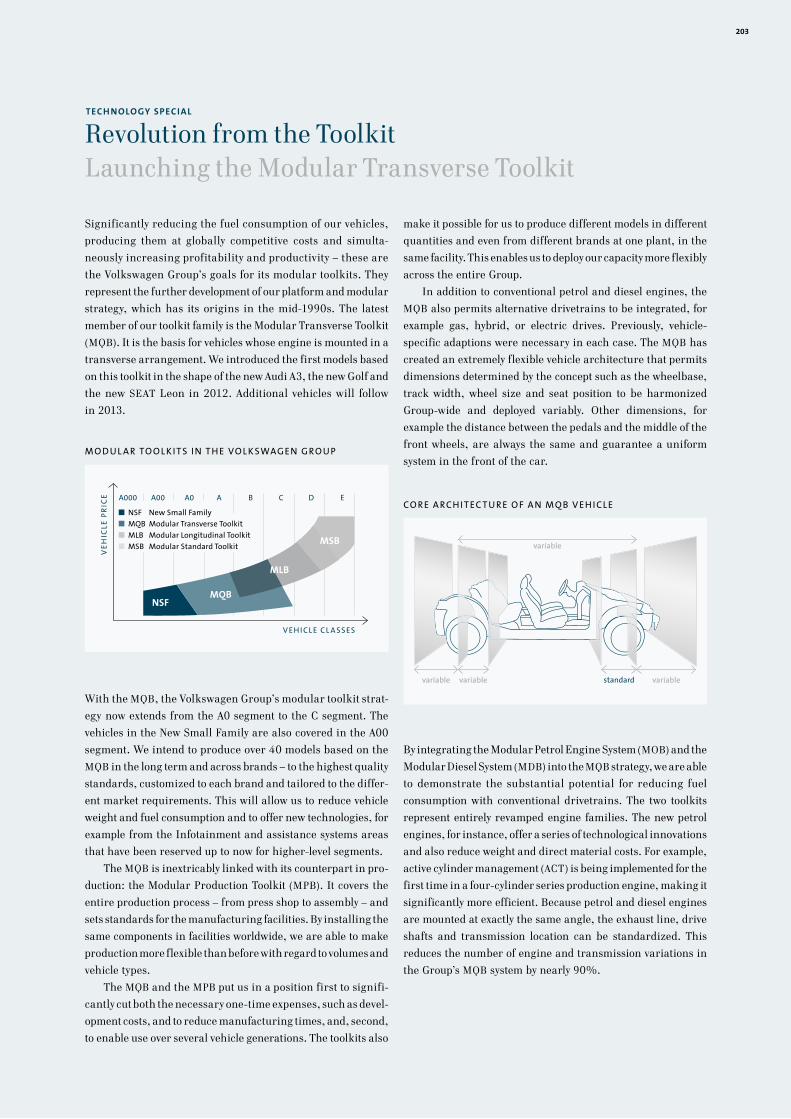
Significantly reducing the fuel consumption of our vehicles,
producing them at globally competitive costs and simulta-
neously increasing profitability and productivity – these are
the Volks wagen Group’s goals for its modular toolkits. They
re present the further development of our platform and modular
strategy, which has its origins in the mid-1990s. The latest
member of our toolkit family is the Modular Transverse Toolkit
(MQB). It is the basis for vehicles whose engine is mounted in a
transverse arrangement. We introduced the first models based
on this toolkit in the shape of the new Audi A3, the new Golf and
the new SE AT Leon in 2012. Additional vehicles will follow
in 2013.
With the MQB, the Volkswagen Group’s modular toolkit strat-
e gy now extends from the A0 segment to the C segment. The
vehicles in the New Small Family are also covered in the A00
segment. We intend to produce over 40 models based on the
MQB in the long term and across brands – to the highest quality
standards, customized to each brand and tailored to the differ-
ent market requirements. This will allow us to reduce vehicle
weight and fuel consumption and to offer new technologies, for
example from the Infotainment and assistance systems areas
that have been reserved up to now for higher-level segments.
The MQB is inextricably linked with its counterpart in pro-
duction: the Modular Production Toolkit (MPB). It covers the
entire production process – from press shop to assembly – and
sets standards for the manufacturing facilities. By installing the
same components in facilities worldwide, we are able to make
production more flexible than before with regard to volumes and
vehicle types.
The MQB and the MPB put us in a position first to signifi-
cantly cut both the necessary one-time expenses, such as devel-
opment costs, and to reduce manufacturing times, and, second,
to enable use over several vehicle generations. The toolkits also
make it possible for us to produce different models in different
quantities and even from different brands at one plant, in the
same facility. This enables us to deploy our capacity more flexibly
across the entire Group.
In addition to conventional petrol and diesel engines, the
MQB also permits alternative drivetrains to be integrated, for
example gas, hybrid, or electric drives. Previously, vehicle-
specific adaptions were necessary in each case. The MQB has
created an extremely flexible vehicle architecture that permits
dimensions determined by the concept such as the wheelbase,
track width, wheel size and seat position to be harmonized
Group-wide and deployed variably. Other dimensions, for
example the distance between the pedals and the middle of the
front wheels, are always the same and guarantee a uniform
system in the front of the car.
By integrating the Modular Petrol Engine System (MOB) and the
Modular Diesel System (MDB) into the MQB strategy, we are able
to demonstrate the substantial potential for reducing fuel
consumption with conventional drivetrains. The two toolkits
represent entirely revamped engine families. The new petrol
engines, for instance, offer a series of technological innovations
and also reduce weight and direct material costs. For example,
active cylinder management (ACT) is being implemented for the
first time in a four-cylinder series production engine, making it
significantly more efficient. Because petrol and diesel engines
are mounted at exactly the same angle, the exhaust line, drive
shafts and transmission location can be standardized. This
reduces the number of engine and transmission variations in
the Group’s MQB system by nearly 90%.
TECH NOLOGY SPECIAL
Revolution from the ToolkitLaunching the Modular Transverse ToolkitLaunching the Modular Transverse Toolkit
CO RE A RCH I T EC T URE O F A N M Q B V EH I CL E
variablevariablevariablevariable variablevariable standard
variablevariable
M O D UL A R TO O L K I T S I N T H E VO L K SWAGEN GRO UP
V EH I CL E CL A SSES
VE
HIC
LE P
RIC
E A000 A00 A0 A B C D E
NSF New Small Family MQB Modular Transverse Toolkit MLB Modular Longitudinal Toolkit MSB Modular Standard Toolkit
NSFMQB
MSB
MLB
203

204
PRODUCTION
In 2012, the Volkswagen Group again expanded its pro-
duction network and produced over nine million vehicles
worldwide for the first time in its history. The Group’s
growth goes hand-in-hand with increased production
requirements. In order to manage these requirements,
the Production function, together with all the brands and
regions, prepared the “Production 2018” strategy. Its core
objectives comprise enthusiastic customers, a higher
earnings contribution, increasing production capacity as
well as attractiveness for employees. These objectives were
assigned 13 action areas. Members of the Board of Manage-
ment, senior production management as well as project
teams from all the brands and regions assumed sponsor-
ships, which are designed to ensure that the measures in the
action areas are implemented in a timely manner. The goal
is to build the world’s most powerful and most fascinating
automotive production.
Production locations
The Volkswagen Group’s production network was extended
by five locations in 2012, and consisted of a total of 99
production facilities worldwide at the end of the reporting
period. It comprises 58 automobile, commercial vehicle
and motorcycle factories as well as 41 component plants.
For the first time, motorcycle plants are part of the
production network due to the integration of Ducati into
the Volkswagen Group. Following the contribution in full
of Porsche’s automotive business to the Volkswagen Group,
the corresponding plants in Zuffenhausen and Leipzig are
now members of the network. The new vehicle plant in
Yizheng in China started production in the reporting period.
With 67 vehicle and component locations, Europe
remains the center of the Volkswagen Group’s production
activities. The Asia-Pacific region is becoming increasingly
important and now has 17 locations. In order to continue
serving the key North America market in the long term
with locally manufactured vehicles, the Group is now
represented there at three production sites. The number
of production sites in South America (nine sites) and
Africa (three sites) remained unchanged in the reporting
period.
China is the Volkswagen Group’s largest sales market.
To continue building on the success story in this market,
we have decided with our two joint venture partners to
extend our environmentally-friendly production capacity.
The Shanghai Volkswagen joint venture opened the vehicle
plant in Yizheng in southern China in mid-year. Production
of the Polo started there initially; manufacturing began for
ŠKODA brand vehicles as well in December 2012. The
expansion of the existing plants in Changchun, Nanjing as
well as Chengdu and other new plants in Foshan and
Ningbo will extend capacity in China to around four million
vehicles by 2018. The Shanghai Volkswagen joint venture
agreed to build a vehicle plant in Urumqi in western China
so as to anticipate the expected market growth in the more
rural areas of China. In a first step, semi-knocked down
vehicles are to be assembled there as early as 2013. To meet
the increasing demand for powertrains resulting from the
expansion of vehicle production in China, we are building
four engine manufacturing sites at different locations,
which will produce the latest generation of engines from
2013 onwards. The foundation stone was also laid for a
new plant to produce direct shift gearboxes.
In addition to China, the ASEAN region is becoming
increasingly important as part of our growth strategy. We
began construction of a Volkswagen production facility in
March 2012 on the grounds of our partner DRB-Hicom in
Malaysia. Up to approximately 30,000 additional Volkswagen
models will be manufactured there on a CKD basis starting
in the first quarter of 2013. This is a step towards opening
up the Malaysian automotive market for the long term and
is a key component in our ASEAN strategy. Vehicles for
Volkswagen Passenger Cars, Audi and Volkswagen Commer-
cial Vehicles are already assembled by our Indonesian
partner Indomobil.
The start of engine production in Silao in Mexico in
2013 marked the opening of the Volkswagen Group’s 100th
plant and added additional capacity for local production to
the production network in North America. This further
strengthens the local presence – as do the locations in
Chattanooga, Puebla, Queretaro and San José Chiapa – in the
key North America sales market, supports our ambitious
growth target in this region and makes an important
contribution to hedging currency fluctuations.
The ongoing strong growth of the market in Russia is
strategically important to the Volkswagen Group. To
continue to and extend our position in this market, we created
the basis for increasing short-term local production
capacity to approximately 110,000 vehicles each year by
signing a contract manufacturing agreement with the GAZ
Group in Nizhny Novgorod in June 2011. We launched
CKD production of the ŠKODA Yeti there together with GAZ
in December 2012. Production of the Jetta will follow in
March 2013 and the ŠKODA Octavia in mid-2013. An
engine production plant with an annual capacity of
150,000 units is being built close to our vehicle plant in
Kaluga to locally supply our vehicle production facilities.
The next generation of engines will be manufactured there
starting in 2015.

205
Business Development Shares and Bonds Results of Operations, Financial Position and Net Assets Volkswagen AG (HGB) Value-Enhancing Factors Risk Report Report on Expected Developments
MANAGEMENT REPORT
VEHICLE PRODUCTION LOCATIONS OF THE VOLKSWAGEN GROU P
Share of total production 2012 in percent
New start-ups and production milestones
Worldwide, the Volkswagen Group implemented 28 new
production start-ups during 2012, 14 of which were new
products or successor products. The highlight was the
start of production of the seventh generation of the Golf in
the Wolfsburg and Zwickau plants in August. Production of
the new Audi A3 already began in Ingolstadt in April. The
ŠKODA brand expanded its model portfolio with the
Rapid in July in Mladá Boleslav. Series production of the
new Porsche Boxster began in Osnabrück in September.
Lamborghini has been manufacturing the Aventador since
October in Sant´Agata Bolognese in Italy. The start of the
successor to the Leon in Martorell was a major milestone
in the SEAT brand’s production calendar.
The Volkswagen Group also celebrated a number of
milestones in 2012: the Volkswagen Group celebrated the
production of its 175 millionth vehicle in March. In Germany
and China, the Tiguan exceeded the one-million mark for
vehicles manufactured overall. The three millionth vehicle
rolled off the assembly line in our plant in Uitenhage in
South Africa in September, and the SEAT brand has now
produced 10 million vehicles since becoming a member of
the Volkswagen Group. Our component production also
reached a milestone: the 111,111,111th transmission was
produced in Kassel.
Start of production based on the Modular Transverse Toolkit
The need and demand for vehicles and the number of
vehicle and powertrain derivatives is growing just as steadily
as customer-specific requirements in the global markets.
In order to accomplish this, we must make optimal use of
our production capacity. The modular toolkits developed
by the Group give us the opportunity to reproduce a wide
variety of vehicle and drive concepts with a minimum of
effort using a uniform vehicle architecture, thus meeting the
demands of the various markets. Thanks to our standardized
products and production processes, we can manufacture
different models of different brands on a single production
line. This significantly increases our flexibility when we are
planning how to adapt our plants.
The MQB was used by the Audi and Volkswagen Passenger
Car brands for the first time for the roll-out of the new
Audi A3 and the production start of the new Golf. Another
new development, the Modular Production Toolkit (MPB),
transfers the modular concept from the vehicle to pro-
duction. Standardized facilities and operating equipment
are enhancing flexibility and profitability in existing
structures. The modular systems enable the widest variety
of models to be produced, including with different drive
types and wheelbases. For example, multiple variants of
the Golf can be manufactured in a single working day on
one production line – the hatchback, the estate and the
Golf Plus.
Use of the MPB will deliver additional efficiency gains
when other models based on the MQB are rolled out. For
example, the factories in Foshan and Puebla, which will
also produce the Golf, will benefit from the standardized,
proven modules.
north a meric a
3 locations (8%)a sia
9 locations (29%)
south a meric a
6 locations (11%)
* Of which: ger m any
13 locations (17%)
europe *
37 locations (51%)
south afric a
3 locations (1%)

206
In engine manufacturing, production of a new petrol
engine and a new diesel engine family has started as part
of the start of the MQB.
The Group’s production system
The “Volkswagen Way” works agreements signed at the end
of 2007 laid the foundation stone for a long-term process
of change in the corporate culture and a new common
understanding at Volkswagen. The goal is a holistic develop-
ment process for the Company on its way to becoming the
leading automobile manufacturer in the world.
With the “Volkswagen Way”, we aim to improve our
efficiency, productivity, quality, communication, cooperation,
ergonomics and teamwork. We do this by permanently
avoiding waste and by perfecting work methods. The focus
is always on people. Thus, workplaces and workflows are
– directly and indirectly – optimized in multiple steps
using the CIP cascade (Continuous Improvement Process).
Using workshops and the active participation of employees,
we have already identified many solutions that have been
further developed to create product or process standards.
The Group’s value-driven, synchronous production system
supplies the necessary methods and instruments for
implementing the “Volkswagen Way”, improving quality
and adherence to schedules while simultaneously reducing
costs. Uniform Group standards and stable processes
increase productivity and shorten throughput times.
Training is an important way to approach this. To establish
the standards for the long term, employees complete
Group-wide training on the CIP cascade at lean
and training centers. The logistics training center at
VOLKSWAGEN SLOVAKIA, which only opened last year, has
already won an award: the “Lean & Green Efficiency
Award 2012” was awarded jointly by trade magazine
“ATZproduktion” and consulting company “Growtth Con-
sulting Europe” to the Bratislava plant for its lean and
environmentally-friendly production. The main production
facility in Wolfsburg also received an award. The successes
of the “Volkswagen Way” associated with sustainably
improving productivity and management processes were
recognized by the “Automotive Lean Production Award
2012” from trade magazine “Automobil Produktion”. This
year, we opened a training center for optimizing production
and management processes at the main ŠKODA pro-
duction facility in Mladá Boleslav. Continuously qualifying
employees is an integral feature of our production strategy.
A new logistics concept for the Volkswagen Group, which
is currently being implemented and continually enhanced,
is designed to make supplies for production locations and
the corresponding material and information flows even
more efficient. The focus is not limited to the internal
processes for providing materials to the assembly lines,
but also includes the upstream transportation and
logistics processes between us and our suppliers. It is
primarily here where the Group’s different brands and
plants can leverage potential synergies. These mainly result
from smaller inventories, more stable processes, higher-
quality information and more transparency.
E-traction in production
The upcoming start-ups of vehicles that are solely and
partially powered by electricity represent challenges for
production. As early as 2012, we looked at this topic
intensively and made the corresponding preparations.
The focus was on products designed with a view to pro-
duction, integration onto the existing production lines and
the training for employees.
The targets that already apply to the production of the
Group’s hybrid vehicles were used, enhanced and factored
into Volkswagen’s standardization process. Thus, they con-
tribute to expanding the production system for electrically
powered vehicles.
Extending technological expertise in warm forming
For several years now, the process of warm forming special
types of steel has been an established method to manu-
facture the strongest crash-relevant body parts.
Volkswagen decided early on to produce its own press-
hardened parts and is continuously driving forward
technological development in terms of productivity and
improving the characteristics of parts. The first two warm
forming lines were successfully brought into operating at
the Wolfsburg site in the past fiscal year to meet the
growing demand for these types of parts in the product
platforms.
Both furnace and tool technology were further optimized.
The warm forming lines were built in a Y-configuration
(two parallel furnaces and a press) to optimize the cycle
time. In addition, the laser cutting that usually follows this
has now been replaced in part by “warm cutting” in the
metal forming tool. This saves energy and investment costs
and also reduces the manufacturing time.

Since it first embarked on its economic reform and liberali-
zation policy more than 30 years ago, China has become one
of the world’s most important automotive markets and is now
the Volks wagen Group’s largest sales market. With a share of
20.8 per cent of the passenger car market and sales of
2.8 million vehicles in 2012, the Volkswagen Group is the market
leader in China.
We laid the foundation for this success in 1984 by establish-
ing the Shanghai-Volkswagen Automotive Company Ltd. (SV W )
joint venture. The first model we produced in Shanghai was the
Santana, which dominated the Chinese automotive market for
many years. Thanks to the introduction of the ŠKODA brand in
2007 and the ten models now manufactured locally, SV W has so
far produced more than eight million vehicles. The FAW-
Volks wagen Automotive Company Ltd. (FAW-V W ) joint venture
was founded in Changchun in 1991. The first FAW-V W factory
started production in 1993 with the Jetta. Production was
expanded to include the Audi brand two years later and the
factory today produces 10 models. More than six million vehicles
have rolled off the FAW-V W production line to date.
To meet the constantly rising demand in China, we have now
established 17 companies, including component, finance and
sales companies. In 2004, we reached a significant milestone
with the establishment of Volkswagen Group China, which co or-
dinates and manages all of the Volkswagen Group’s activities
in China. A “China” Board of Management function was created
in 2012 to underpin the growing significance of the Chinese
market.
At the end of the 1990s, the focus began to turn to diversify-
ing the product range. A crucial factor here was the establish-
ment of the import business in 2007, which we have since
extended to include all of the Group’s passenger car brands. Our
Chinese product portfolio now covers all segments from small
cars to luxury sports cars. We took account of up-and-coming
vehicle classes, such as the SU V segment, in our local production
at an early stage. The commercial vehicle segment is also gaining
in importance for us.
Our localization strategy is a key factor in our success in
China: in addition to vehicles that are also sold elsewhere in the
world, vehicles that have been specially modified for Chinese
customers (with a long wheelbase, for example) and models
developed exclusively for the Chinese markets are cornerstones
of the business. We use state-of-the-art technology both on the
product side, with innovative new generations of engines and
gearboxes, and on the production side, with the latest vehicle
and component plants.
We have had a strong presence in the northern and eastern
coastal provinces from the outset, with our Shanghai and
Changchun vehicle plants. Our “Go South” and “Go West” strate-
gies were devised to increase our presence throughout the
country, enhance the Volkswagen Group’s positive image in
China and keep up with new regional growth trends. Specifically,
these strategies include the construction of plants in Foshan,
Ningbo and Urumqi, which is currently underway, and the sig-
nificant expansion of the dealer network over the medium term.
The “Go South” strategy has already led to a considerable
increase in market share in the southern regions since 2008.
The “Go West” strategy is designed to enable us to benefit from
the growing importance of the inland regions.
The Volkswagen Group’s extensive product portfolio, state-of-
the-art technologies and plans for hybrid and electric vehicles
mean it is ideally placed to meet future challenges, such as strict
emission limits and restrictions on vehicle registrations in
megacities, and to maintain a key position on the Chinese auto-
motive market over the long term. The Chinese automotive
market still offers great growth potential since average income
is rising, urbanization is steadily progressing (around 130 cities
in China already have more than a million inhabitants) and
industrialization in the west of the country is also progressing
continually. At present, there are only around 50 cars per 1,000
inhabitants; in Germany there are around 520. The genuine
parts and used car business, as well as financial services in the
automotive sector are also set to become much more important
in China in future. The Volkswagen Group intends to maintain
its leading role in these future markets as well through initia-
tives like “Das WeltAuto.” and by expanding its local financial
services.
From pioneer to market leader in ChinaA success story founded on strong partnershipsA success story founded on strong partnerships
MARKET FOCUS
T H E “GO S O U T H ” A N D “GO WEST ” ST R AT EGI ES
Existing production locations
New production locations
Urumqi
Yizheng
Beijing
Foshan
Shanghai
Changchun
Chengdu
Ningbo
Nanjing
„Go West“
„Go South“
207

208
SALES AND MARKETING
The Volkswagen Group has a unique product portfolio: it is
made up of twelve successful brands that excite millions of
customers worldwide year in and year out. In 2012, we
systematically reinforced the distinct and individual image
of each brand and optimized their market positioning.
Brand diversity in the Volkswagen Group
The “Volkswagen – Das Auto.” slogan unites the three core
messages that distinguish the Volkswagen Passenger Cars
brand: innovative, offering enduring value and responsible.
Customers worldwide associate quality, reliability and
German engineering skill with Volkswagen Passenger
Cars. This brand profile, which creates trust in our
customers, is the reason the Volkswagen brand is the first
choice for millions of customers when buying a car. Global
brand management focuses on the wishes and preferences
of customers, today and in the future. They are the starting
point for developing innovations that are driven by demand,
while remaining affordable. This is our competitive
advantage: based on this, the Volkswagen Passenger Cars
brand aims to become the most innovative volume manu-
facturer with the best quality in each class in the medium
to long term.
In the premium segment, Audi has become one of the
strongest car brands worldwide under the slogan of “Vor-
sprung durch Technik”. Its objective is to become the market
leader in this segment. To do this, the Audi brand relies
heavily on its sporty, high-quality and progressive image.
The numerous honors and awards that Audi models
receive every year, coupled with the success of Audi’s four
rings in all markets around the world, are impressive
proof of the fact that Audi has evolved into a premium,
high-prestige brand. This success is based on the brand
strategy of innovative engineering solutions and an emotional
design language.
With its “Simply clever” slogan, ŠKODA has become
one of the fastest emerging brands, particularly in Europe
and China. The brand image is dominated by a compelling
value proposition and an attractive design, coupled with
intelligent ideas for the use of space that are technically
simple but offer refined and practical details. The numerous
awards for its ambitious, innovative and sophisticated
vehicle design are proof of the high recognition for this
brand concept.
Models that regularly win awards for their out-
standing design are representative of Spanish SEAT brand’s
image. SEAT is aiming for stronger growth, particularly in
Europe, by sharpening its brand profile and focusing on
its distinctive brand values of being dynamic, young and
design-oriented. The new brand claim “Enjoyneering”
suitably expresses the character of the brand as a passionate
perfectionist and emotional technology leader.
Sports car manufacturer Porsche has captivated car
fans around the world for decades. The fact that more than
70% of all Porsche vehicles that have ever been produced
are still on the roads in many countries worldwide is
thanks to the brand’s high quality standards. The sports
car manufacturer’s brand values are characterized by
opposites: exclusivity and acceptance, tradition and inno-
vation, performance and suitability for daily use, design
and functionality. Porsche’s motto is “to achieve maximum
output from minimum input”.
Volkswagen Commercial Vehicles stands for superior
mobility with its three core values of reliability, economy
and partnership. The brand offers a range of different
transport solutions at the highest levels of engineering for
different customer groups. The light commercial vehicles
in the Caddy, Saveiro, Multivan/Transporter, Crafter and
Amarok ranges are tailored to meet the individual trans-
portation needs of customers in retail and craft businesses,
as well as civil authorities and service providers. Private
customers value family-friendly MPVs and leisure-oriented
motor homes as derivatives of our light commercial vehicles.
Exclusivity, power and elegance – these are the qualities
demonstrated by our Bentley, Bugatti and Lamborghini
brands in the luxury vehicle segments. They round off the
brand diversity of the Volkswagen Group in the passenger
cars segment.
Swedish Scania brand follows the core values of “cus-
tomer first”, “respect for the individual” and “quality”. For
over 100 years, this successful company has been manu-
facturing high-performance trucks and buses featuring
extremely innovative technology. The brand offers its
customers efficient transport solutions backed by service
offerings and financial services.
The core values of the MAN brand are reliability,
innovation, dynamic strength and openness. These values
are key success factors for MAN, one of the leading Euro-
pean manufacturers of commercial vehicles, engines and
mechanical engineering equipment. The company manu-
factures diesel engines, turbomachinery and special gear
units, alongside trucks and buses.
Ducati is one of the most famous manufacturers of
premium motorcycles. Its products, with the highest level
of quality craftsmanship, uncompromising performance
and challenging dynamics, thrill the customers of the
Italian brand. Italian style is reflected in the lines of all the
brand’s motorcycles.

209
Business Development Shares and Bonds Results of Operations, Financial Position and Net Assets Volkswagen AG (HGB) Value-Enhancing Factors Risk Report Report on Expected Developments
MANAGEMENT REPORT
Customer satisfaction and customer loyalty
Our sales activities are always oriented on making our
customers more satisfied – this is the top priority for us.
We again increased the satisfaction of our vehicle buyers,
customers in the after-sales area and that of our dealer-
ship partners in 2012 by deploying the measures and
processes introduced in fiscal year 2011.
The Group brands regularly measure the satisfaction
of their customers. The main focus is on product quality
and service. Based on the survey results, they derive
measures to further increase customer satisfaction.
Measured by overall customer satisfaction with
products, the Audi and Porsche brands occupy leading
positions in the core European markets in comparison to
both other Group brands and their competitors. The other
brands in the Group score just as high as or higher than
competing brands.
Customer satisfaction is a precondition for customer
loyalty. If our customers are satisfied with our products
and services, then they are loyal to our brands and trust
them. The extent of this trust is impressively illustrated by
our loyalty figures, which are measured on a regular basis.
The Volkswagen Passenger Cars brand, for example, has
maintained a high level of customer loyalty in its core
European markets for several years in a row. The loyalty of
ŠKODA customers has likewise kept that brand in the upper
rankings in a competitive comparison for several years.
Structure of Group sales
The independence of our brands is backed by the Volks-
wagen Group’s multibrand structure. Nevertheless, we do
focus on cross-brand sales activities in order to increase
sales volumes and market share, lift earnings contri-
butions and sales efficiency, and decrease costs at the
same time.
In 2012, we integrated dealers more tightly into the
Group’s IT systems environment; this is part of our
distribution network strategy and serves to optimize the
exchange of information between dealers themselves and
between them and our wholesale operations. Our close
working relationship with dealers and their profitability
are a key focus. We manage our wholesale business in over
20 markets through companies belonging to the Group. A
central department that manages these national sales
companies makes sales activities more transparent and
more profitable, creating synergies between the different
brands and their activities. This enables us to transfer the
best practice approaches of individual companies to the
other wholesale companies quickly and efficiently. The
central department is instrumental in helping us achieve
the goals laid down in the Group’s Strategy 2018.
Following our acquisition of the trading business of
Porsche Holding Salzburg on March 1, 2011, we pushed
ahead with the integration of this company in 2012 and
reorganized tasks in the Volkswagen Group so as to be able
to take full advantage of its specific skills. We have combined
the majority of the Group’s own trading activities under
the management responsibility Porsche Holding Salzburg
so as to make them even more efficient and powerful.
Porsche Holding Salzburg is a key element in assuming
the role of importer in emerging markets, for example in
South America.
Fleet customer business further expanded
A characteristic of our relationships with fleet customers is
their long duration. This customer group guarantees more
stable vehicle sales than private customers in volatile
conditions. The Volkswagen Group further expanded its
well established position in Europe in the fleet customer
business in 2012.
The Volkswagen Group has a broad business fleet
customer base in Germany and the rest of Europe. Our
extensive product offering enables us to satisfy custom
mobility needs from a single source.
Remarketing: efficient management of used cars and
attractive residual values
As part of its Strategy 2018, the Volkswagen Group is
focused on providing professional management for used
cars. The used car business mainly supports the new car
business for the long term with a view to increasing sales
volumes and profitability. The focus is on ensuring more
stable residual values for vehicles that are superior to
those of the competition.
We further increased the success of the independent
used car brands such as “Das WeltAuto.” or “Audi Gebraucht-
wagen :plus” (“Audi used cars :plus”) in fiscal year 2012.
The brands set themselves a particular focus in the past
year of showcasing their reliability and trustworthiness,
building an emotional attachment for customers and thus
creating a unique, positive brand experience. Our used car
programs increase the recognition value of the individual
brands and ensure the same high level of performance
worldwide, efficient processes and transparent management
in the used car business.

210
We take advantage of the unique brand diversity, pooling
expertise within the Group and further expanding our
market position by implementing overarching projects
across the organization. In line with our objective of devel-
oping sustainable, customer-oriented services, we also
conduct surveys on customer behavior and needs.
In order to manage the growing complexity of the used
car business and to be able to react flexibly to new market
developments, we introduced standardized and harmonized
IT systems and processes for the used car business in 2012.
The development of the used car brands in growth
markets remains a key factor in our long term success.
QUALITY ASSU RANCE
The satisfaction of our customers worldwide is determined
to a significant extent by the quality of our products and
services. We maintained our high level of quality in 2012
as well, thus contributing to growth and to increasing the
value of the Volkswagen Group.
Volkswagen’s Quality Assurance applies preventive
strategies not only to process stability and product reliability,
but also to ensure customer satisfaction in particular.
There are three main factors here: vehicle concepts that
are consistently focused on customer wishes, well-
structured production processes that ensure flawless
delivery quality, as well as excellence, during vehicle hand-
over and the subsequent service provided by the dealer.
Focus on customer wishes
Quality Assurance allows us to cater to the wishes of our
customers all over the world by ensuring that particular
regional features are identified, prioritized and then
appropriately factored into the design of new products as
well as in the production of established vehicle models.
Examples of these include the available fuel quality, road
conditions, traffic density, country-specific usage patterns
as well as local legislation. Volkswagen’s strong growth
outside of Europe, in particular in the BRIC countries,
means that the main focus of Quality Assurance is on
conditions in these markets.
We mainly use studies and customer surveys to capture
customer requirements in the different markets. Our
primary focus in 2012 was to refine the cross-business
area program for raising customer satisfaction. One of its
goals is to more strongly incorporate insights from product
usage into the design of future products.
Product and supplier quality
Customers are satisfied and loyal only when their expec-
tations of a product or service are met or even exceeded.
Reliability, appeal and service determine the quality
perceived by the customer throughout the entire product
experience. Our objective is to surprise and excite our
customers in all these areas so that we can win them over
with outstanding quality.
In the reporting period, several new facilities went into
operation, numerous product start-ups happened and we
used the Modular Transverse Toolkit (MQB) for the first
time. Despite these challenging conditions, we maintained
the high quality of the previous year for all Group brands
and locations, and kept the number of repairs at a
consistently low level. Our suppliers also made significant
contributions to this. We expect sustainable practices in
addition to the highest product quality and reliability of
supply from them.
In 2012, we continued to standardize our defect elimi-
nation process so that we can react even more quickly in
the future to vehicle problems and help our customers
even faster. Eliminating defects quickly pays off for the
Volkswagen Group both by increasing customer satisfaction
and reducing warranty and ex gratia repair costs.
Service quality
Our goal is to improve global service quality and thus increase
customer satisfaction in the area of service. As the direct
interface with the customer, the starting point in customer
satisfaction is the dealership operation, as is the after-
sales business. Through our close cooperation with the
dealers, we can identify at an early stage any defects that may
be revealed in the emotional moment of vehicle handover
and correct them systematically.
In 2012, we continued to refine the processes at the
interface between markets and dealers. To accomplish
this, Technical Service, previously a part of Quality
Assurance, was integrated into the after-sales business.
The greater closeness to the market helps the Technical
Service to recognize vehicle problems at an even earlier
stage, prioritize them, take countermeasures and evaluate
their effectiveness. Quality Assurance and Technical Service
continue to work together closely in the new structure.

211
Business Development Shares and Bonds Results of Operations, Financial Position and Net Assets Volkswagen AG (HGB) Value-Enhancing Factors Risk Report Report on Expected Developments
MANAGEMENT REPORT
EMPLOYEES
Excellent performance, the success that comes from it and
participation in its rewards are at the heart of Volks-
wagen’s human resources strategy. Only a top team can
deliver the excellence that is necessary for Volkswagen to
become number one in international automotive
production. This human resource policy maxim applies
throughout the Group.
As of December 31, 2012, the Volkswagen Group, includ-
ing the Chinese joint ventures, employed 549,763 people,
9.5% more than at the end of fiscal year 2011 (501,956).
Significant factors in this increase, in addition to volume-
related growth, were the consolidation of Porsche with
17,502 employees and of motorcycle manufacturer Ducati
with 1,197 employees. The distribution between Group
employees in Germany and those abroad shifted slightly in
the past year: at the end of 2011, 44.8% of employees still
worked in Germany, while on the reporting date, this was
45.4%.
Volkswagen AG, Volkswagen Sachsen GmbH, AUDI AG and
Volkswagen Financial Services AG alone took over a total of
3,301 temporary employees into the core workforce in 2011.
In addition, 1,591 temporary employees were employed in
permanent jobs in these Group companies in 2012.
Starting a career at Volkswagen is possible in two ways:
via vocational training at the Company and being recruited
as a university graduate.
Vocational training at Volkswagen
Vocational training is a key factor in the development of
Volkswagen’s outstanding team. Volkswagen has stepped
up its commitment to dual education and training and has
introduced vocational training at additional international
sites. In December 2012, the Group had 16,714 employees
in vocational training worldwide, 11,913 of whom were in
Germany.
As of December 31, 2012, Volkswagen AG was training
approximately 4,838 vocational trainees and students in
32 professions and 26 degree courses at its six German
locations (Wolfsburg, Hanover, Braunschweig, Kassel,
Emden and Salzgitter) under the StIP integrated study and
traineeship scheme. A further 125 vocational training
positions were created as against 2011. 50 additional
vocational training positions were established at Volkswagen
Sachsen GmbH, Automobilmanufaktur Dresden GmbH
and Volkswagen Osnabrück GmbH.
As of the end of 2012, AUDI AG recorded a total of
2,459 vocational trainees in 23 professions. Furthermore,
2,212 vocational trainees were employed at MAN and 453
vocational trainees at Porsche in Germany at the end of the
year.
Dual vocational training and education now exists at a
large number of sites abroad and is in development at
additional sites. In the Kaluga plant at Volkswagen Group
Rus, for example, the third year of vocational training began
in 2012. Trainees can now also train to be warehouse
logistics specialists alongside the previous vocational
training careers of vehicle mechatronics specialists, design
and production mechanics, vehicle painters and mecha-
tronics specialists.
Vocational trainees at Volkswagen in Chattanooga,
USA, have started a training program for mechatronics for
the third time. This is run in cooperation with the local
partners: Tennessee Technology Center and Chattanooga
State Community College.
A modern training center opened at Volkswagen
Navarra in Pamplona in April 2012. Building the training
center and being committed to education is credited in
this region of Spain as a key factor in Volkswagen’s
assumption of social responsibility.
Every year, the Group Board of Management and the
World Works Council present the “Best Apprentice Award”
to Volkswagen’s best trainees around the world. This prize
was awarded for the twelfth time at the end of November
2012 in Munich. Twenty-nine vocational trainees from 13
countries received the honor.
Volkswagen supports particularly talented vocational
trainees in the talent group for young specialists. This is a
key instrument to guide employees who are outstanding at
both a professional and personal level through the transition
from vocational traineeship to professional practice. A
total of 232 talented young people at Volkswagen AG and
Volkswagen Financial Services AG took part in this two-
year development and training program in December
2012. 163 talented employees have already completed it.
The focus of Volkswagen’s vocational training is on the
professional development of the participants. They also
benefit from a series of supplementary programs and
opportunities. In Germany, these include the cooperation
between Volkswagen vocational training and the “Youth
Start-Ups” high-tech and business start-up competition as
well as organizing of the “ProTalent” and “ProMechanic”
competitions. In cooperation with Porsche Inter Auto
GmbH & Co. KG in Salzburg and VOLKSWAGEN SLOVAKIA
a.s. in Bratislava, Volkswagen AG vocational trainees already
have the opportunity to expand their acquired knowledge
and skills abroad and to develop professional mobility and
flexibility.
Volkswagen vocational trainees have a more than
twenty-year tradition of involvement with the Auschwitz
memorial site. Prepared and supervised by the International

212
Auschwitz Council and Volkswagen Coaching GmbH, the
trainees from Volkswagen and Polish young people travel
to Auschwitz at least four times a year for two weeks in
each case in order to work on maintaining the memorial.
More than 2,100 young people from Germany and Poland
have participated in the program so far. Since 2012,
vocational trainees at other Volkswagen subsidiaries and
investment companies have now also had the opportunity
to help with the maintenance work on the memorial site in
Auschwitz.
On completion of their training, since 2006 young
people at the start of their career have had the opportunity
to take part in the “Wanderjahre” (Years Abroad) program,
spending twelve months at one of the Group’s international
locations. Today, 32 Volkswagen Group companies in 17
different countries participate in this development program.
So far, over 320 young employees of the Volkswagen Group
have taken advantage of this opportunity. 46 young people
from Germany and ten participants from four other
countries started their Year Abroad program in the Volks-
wagen Group in 2012.
Developing university graduates
Highly qualified young talent is essential for the future of
the Company because innovative strength is one of the
decisive competitive factors in the automotive industry.
Volkswagen uses a differentiated approach to support its
academic young talent: the Student Talent Bank and the
Academic Talent Pool.
Volkswagen has been using the Student Talent Bank
since 1998 to develop particularly high-achieving students
in functional and crossfunctional areas. Since then, roughly
2,100 students have successfully completed an internship
at Volkswagen thanks to their committed approach. Volks-
wagen supports these former interns during their further
studies and invites them to presentations and seminars by
specialists or on excursions to Volkswagen locations, for
example.
Talented students are added to the Academic Talent
Pool just before they complete their degree or doctorate.
This new recruiting tool makes selected potential employees
visible in the Company, meaning that they are considered
for starting a career in one of the functional areas because
of their prior experience.
Volkswagen offers the “StartUp Direct” trainee program
to young university graduates to get them off to a flying
start in the Company. Over a two-year period, participants
in the program not only work in their own department and
familiarize themselves with the Company, but also attend
supplementary training seminars. The program additionally
includes multiple-week placements in production and
sales as well as an optional foreign placement.
University graduates with an international focus can
alternatively enter the “StartUp Cross” program. This inter-
national program includes a three-month international
placement during its 18-month period. Over 2,000 trainees
gained their first Volkswagen experience in one of these
two programs since 2008.
With its “StartUp Europe” trainee program, Volks-
wagen Group has offered young engineers from Southern
Europe an opportunity to gain international work
experience since 2012. This Volkswagen program is
initially targeted at university graduates from Spain and
Portugal. The graduates start off in a company in either
Spain or Portugal, followed by up to 21 months in a Group
company in Germany. Permanent positions may be offered
after completion of the two-year program.
Professional development and training for all employees
In order to allow employees to progress personally as
individuals within the Company, they have to be supported
and given the opportunity to demonstrate their capa-
bilities and develop them further. Volkswagen offers
opportunities for training to all employees in the vocational
groups. A vocational group includes all employees who
perform activities based on similar technical competencies
and thus work together across experience and development
levels. Learning and teaching happens by involving the
vocational group’s own internal specialists using both
tested and new forms of skills development. This means
that learning processes are focused more than ever on the
concrete work processes and the specialist skills require-
ments of the vocational group: knowledge is transferred in
an efficient and needs-based way.
Volkswagen’s approach to mutual learning is being
continuously built up and expanded: more and more areas
of the Company are forming vocational groups with their
own academies in which they organize their own skills
development. The Volkswagen Group Academy was conceived
in 2012 as an umbrella organization for all of the Group’s
academies. This is an integrated qualification platform
that leverages synergies and ensures high quality and
expertise levels throughout the Group. It will be used for
vocational training up to and including academic pro-
fessional development.
The master craftsmen at the Volkswagen Group enjoy
particular attention with regard to training and professional
development. Their qualifications are currently being
adapted to uniform worldwide standards and introduced
at the international locations: basic master craftsman
qualification training prepares future master craftsmen for
their work in production management. Overall, 364
master craftmen qualified at Volkswagen in the reporting
period, including 140 abroad.

213
Business Development Shares and Bonds Results of Operations, Financial Position and Net Assets Volkswagen AG (HGB) Value-Enhancing Factors Risk Report Report on Expected Developments
MANAGEMENT REPORT
Volkswagen prepares prospective managers to assume
management tasks through basic leadership qualification
training and a subsequent exam. These two elements are
being increasingly introduced at the international Group
companies.
The management selection process enables employees to
progress to management positions: candidates are selected
for their specialist skills at in-depth selection meetings in
the departments. The candidates’ entrepreneurial skills
are subsequently tested in a cross-divisional Management
Assessment Center. The Management Assessment Center
was successfully implemented in India, Russia, China and
the USA in 2012.
There are also many tailored training opportunities for
other professions in the Group. First and foremost is
Volkswagen Coaching GmbH, the main professional
development organizational of Volkswagen AG, which
offers a broad spectrum of learning. This includes
programs for personal development, interdisciplinary
seminars and courses, and specialized training programs
designed for the particular needs of individual vocational
groups. This ensures that all employees are able to develop
the unique skills they need for their individual functions.
At the same time, we facilitate systematic training for
employees with respect to corporate and divisional goals.
In 2012, over 110,624 participants received further
training at the 9,193 seminars held by Volkswagen
Coaching GmbH lasting a total of 269,128 participant
days. In the area of specialist skills development (e.g.
factory automation, robotics and applications engineering,
or business), 70,382 participants were involved in 7,027
seminars covering 162,869 participant days. In the field of
“crossfunctional skills development” (which includes leader-
ship skills and personal development), 40,242 participants
attended 2,166 training courses representing 106,259
participant days. To ensure that its range of training
options always keeps pace with the Company’s training
needs, Volkswagen Coaching GmbH developed a further
324 training courses in 2012.
Professional development at university level: the AutoUni
The AutoUni assures the availability of specialized academic
knowledge within the Volkswagen Group. Here, the edu-
cational offerings, which are developed in conjunction
with the functional areas and cooperating universities, are
built around the needs of the vocational groups. With its
eight institutes, the AutoUni offers numerous lectures,
conferences, programs and cooperative study modules at
university level. Scientific topics are studied in more detail
in cooperative study modules and finish with an exam.
Programs at the AutoUni, which is based in Wolfsburg,
have been rolled out internationally for several years. Alto-
gether, more than 15,000 participants attended 273
courses organized by the AutoUni in 2012. Roughly one-
quarter of the courses were held outside of the main
location in Wolfsburg. Around 40% of the events were
open to the public as part of Volkswagen’s regional
commitment. One of the focuses was on future mobility:
people need innovative drivetrains as well as trans-
portation systems that are comfortable, accessible and
sustainable.
The AutoUni is also intensely involved in the Group’s
doctoral student program. More than 440 doctoral
students were supervised in 2012 at the various companies
of the Volkswagen Group in Germany. The doctoral
students are conducting research on ambitious PhD thesis
topics with relevance for the Company. During this time,
they work closely with their own department in the Group,
which also appoints a supervisor within the Company for
them. Completed theses can be published as part of the
AutoUni’s publication series. Active and former Volks-
wagen doctoral students regularly use the research forum
for doctoral students to attend seminars, lectures, sporting
activities and other events together. The doctoral students
organize and implement the research forum and its
activities themselves.

214
Advancement of women, family-friendly HR policies
Volkswagen’s corporate culture places a very high value on
both job and family. For Volkswagen, family-friendly
human resources policies are a key success factor. This
commitment has tradition behind it: in 1989, Volkswagen
was the first major German corporation to establish
guidelines for the advancement of women and to support
them with targeted programs. Volkswagen AG first set
concrete targets for raising the proportion of women in
the Company in 2007. In spring 2011, the Volkswagen
Group proposed individual goals to raise the proportion of
women at Volkswagen in Germany as part of a voluntary
commitment.
PROPORTION OF WOMEN
VOLKSWAGEN GROU P IN GERMANY*
as of December 31, 2012
% 2012 2011
Vocational trainees total 26.8 26.4
Industrial vocational trainees 20.9 20.4
Commercial vocational trainees 52.3 52.9
Students in traineeship schemes 31.3 32.0
Management total 9.3 8.5
Management 11.0 10.1
Senior management 7.0 6.4
Top management 5.5 4.9
* Excluding Scania, MAN and Porsche.
A pioneering instrument for achieving the goal is the
quota for the university graduates we hire. Volkswagen
hires the year’s best university graduates in the necessary
fields and then trains them further. Volkswagen is guided
in this by the proportion of female graduates in each field
of study. Consequently, approximately 10% of graduate
engineer recruits have to be women. For electrical engi-
neering, the ratio is also 10% and for business and
economics 50%. Averaged across all fields of study relevant
to Volkswagen, the individual ratios produce an overall
goal of at least a 30% ratio of women among university
graduates hired. Volkswagen approaches female students
at an early stage: for example, Volkswagen uses its Ger-
many-wide “Woman DrivING Award” and the newly intro-
duced “Woman Experience Days” to focus on female engi-
neering students and graduates so as to recruit them for
technical positions at Volkswagen.
This increased proportion of qualified women joining
the Company will enable us to steadily lift the proportion
of female executives in the coming years. The Volkswagen
Group is aiming to have a proportion of 30% of women at
all levels of the management hierarchy in Germany in the
long term. For example, the proportion of women in manage-
ment positions at the Volkswagen Group in Germany
increased from 8.5% (2011) to 9.3% (2012). 41 women at
Volkswagen AG participated in a mentoring program in
2012, giving them support on their path into management.
Volkswagen also has the goal of raising the proportion
of women among skilled workers and master-level workers
to 10%. The current proportion of women among workers
at the master level at Volkswagen AG is 4.3%. In 2012,
31 women were helped in their effort to become master
craftswomen through a targeted mentoring program.
The Volkswagen Group is leading the way in the auto-
motive industry in Germany, with a share of 26.8% female
trainees in 2012, and especially with 20.9% in industrial
and technical fields. We aim to increase this to around
30%. Volkswagen therefore specifically recruits female
talent, for example by offering special information days for
industrial and technical vocational training at Volkswagen
and career experience days for young women. The Com-
pany has participated for many years in the national
“Girls’ Day” in Germany and in 2012 offered roughly
2,000 schoolgirls a behind-the-scenes look into careers in
the automotive industry.
Volkswagen is also attempting to systematically improve
its work/family balance alongside hiring and supporting
talented female employees. This includes a high level of
working time flexibility and a range of part-time and shift
models, as well as local and on-site childcare facilities.
Volkswagen offers meetings and seminars for employees
on parental leave in order to retain contact with employees
on parental leave and help ease their transition back into
the workforce.
Performance incentives and bonus arrangements
For the Volkswagen Group, professional development and
training are a key component in creating an outstanding
team. A major part of our strategy includes systematically
supporting and recognizing achievements and switching
to remuneration systems that allow employees to share in
the Company’s success in the long term. Universal and
uniform criteria for developing skills and recognizing
achievements have been in place at Volkswagen AG since
2010. This applies to the entire workforce – from trainees
to senior executives. The criteria are underpinned by
concrete incentive systems in the remuneration structure.

215
Business Development Shares and Bonds Results of Operations, Financial Position and Net Assets Volkswagen AG (HGB) Value-Enhancing Factors Risk Report Report on Expected Developments
MANAGEMENT REPORT
AGE STRUCTU RE OF THE EMPLOYEES OF THE VOLKSWAGEN GROU P*
age in years, percentages
Men
Women
40-49
0 5 10 15 20 25
60+
30
50-59
20-29
30-39
< 20
* Excluding Scania and MAN.
Volkswagen AG’s employees covered by collective pay agree-
ments have a remuneration system that comprises three
key elements:
> the basic pay in the form of a monthly remuneration,
> the right to a bonus arrangement anchored in the
collective pay agreement,
> since the beginning of 2011, the performance-based
remuneration component, which recognizes all employ-
ees’ individual achievements.
Volkswagen AG’s remuneration system, which was expanded
to include a performance-based remuneration component,
has proven as a tool for the workforce to participate in the
Company’s success. At the same time, it helps individual
achievements to be recognized while maintaining com-
petitiveness. This three-tier remuneration system is being
increasingly implemented throughout the Group.
Employee participation
Volkswagen Group employees can actively help shape the
Company through participating in the opinion survey. This
uniform, Group-wide employee survey gathers information
about employee satisfaction once a year. Following the
survey, the results are discussed together by supervisors
and employees. Complaints and problems are discussed
just as much as suggestions on how to improve the structure
of work. The areas of improvement that are agreed upon
are then implemented in the period before the next survey.
The opinion survey was conducted for the fifth time in
2012. A total of 102 locations and companies in 32 countries
were included in the survey. Of the over 378,000 employees
invited to participate, more than 342,000 took part.
Porsche Holding Salzburg, Volkswagen Osnabrück GmbH
and Volkswagen Group Japan K.K. took part for the first
time. The sentiment rating is a key parameter for the opinion
survey, in addition to the level of employee participation.
The Group also identified a positive trend here.
Another instrument for whose success the involvement
of employees has special significance is the “Volkswagen
Way”. This has been an integral feature at Volkswagen for
five years. It aims to safeguard competitiveness and employ-
ment. It focuses on a comprehensive improvement process
that aims to achieve continuous improvement in produc-
tivity and efficiency, as well as quality, ergonomics, leader-
ship and teamwork. The “Volkswagen Way” is a durable
instrument that offers across-the-board, systematic and
binding solutions to problems using high standards and
drives improvements. Every employee’s participation allows
us to continuously improve the workplaces, processes and
structures in the individual areas of the Company. The
Volkswagen Group’s other brands have similar efficiency
enhancement programs. For example, during production,
a Group-wide uniform production system is used for all
brands.
Volkswagen places tremendous value on facilitating the
flow of ideas and improvement suggestions from its
employees into the work organization and production
process. The input of employees is screened and evaluated
by Volkswagen Ideas Management, which is represented at
all German locations. The origin of the suggestion system
at Volkswagen goes back to 1949. Since then, involvement
in the improvement of products and processes has been a

216
firm indicator of the creativity, expertise and motivation of
our employees. Ideas Management is an important
leadership and motivational instrument for line super-
visors. We worked on systematically integrating all of
Volkswagen’s locations worldwide in the reporting period.
In fiscal 2012, Volkswagen employees throughout the
Group submitted a total of 536,532 improvement proposals,
12.9% more than in the previous year (475,073). The
implementation of 380,475 of these suggestions in the
reporting period significantly helped to improve the
quality of our products and the efficiency of our processes,
and helped to reduce costs in the Group by a total of €358.1
million. Employees who submitted ideas received bonuses
worth some €34.1 million in acknowledgment of their
creativity and contributions in shaping the Company. Ideas
Management also helps work at Volkswagen to be safer and
more compatible with good health. Occupational health
and safety measures are being continuously improved
thanks to successfully implemented ideas.
Preventive healthcare and occupational safety
Healthcare management at Volkswagen is much more than
classic preventive healthcare and occupational safety. The
holistic healthcare management system that has been in
place at Volkswagen for a long time also comprises aspects
of work organization, ergonomics, management culture
and prospects for all individuals.
The “CheckUp”, a free, comprehensive medical exami-
nation, was made available to all employees at Audi in 2006
and at Volkswagen in 2010. This now firmly established
tool also helps to maintain and improve employees’ health,
fitness and performance. The high level of diagnostic quality
of the check-ups is widely acknowledged by the employees:
more than 42,000 Volkswagen check-ups and more than
51,000 Audi check-ups have been performed to date.
After the check-ups were successfully implemented at
the German plants, the focus in 2012 was on expanding the
internal and external prevention offerings that are linked
to this tool. The Volkswagen CheckUp was also rolled out
on a large scale at Group locations abroad, for example at
Volkswagen de Mexico’s Puebla plant. Existing preventive
medical examination programs at other companies are
being adapted to meet the Group-wide standard for the
CheckUp. At the same time, Volkswagen uses improve-
ments along the entire product development process to
guarantee that the quality of workplaces and the strains on
employees that arise as a result of production are already
taken into account in the planning and design stages of
vehicle models. The common objective is to align the
creation of ergonomically state-of-the-art workplaces and
innovative work processes, taking both science and practice
into account. The deployment of occupational therapists to
the production lines means that employees are able to
receive advice and guidance directly at their workplace about
the more ergonomic implementation of their workflows.
In the course of our management development programs,
line supervisors are taught to give stronger consideration
in their leadership practices to the link between leader-
ship and employee health. We have also been developing
compulsory training modules on occupational safety and
introducing them for all prospective managers since the
beginning of 2012. Based on the Group occupational safety
management system implemented in 2010, all Group
brands and companies covered by it analyzed their existing
occupational safety organizations and processes. The
results are now available throughout the Group in a central
database system. This includes the systematic communi-
cation of examples of good practice identified in the Volks-
wagen Group.
Social benefits
All Volkswagen AG employees are insured by a group
accident insurance policy against accidents resulting in
death or disability. Employees in the international Group
companies enjoy additional benefits. Depending on the
location, these include transportation and subsistence
allowances, affordable housing, monthly childcare allow-
ances as well as subsidies towards selected leisure activities.
Additional preventive healthcare services or supple-
mentary pension insurances round off this offering on a
location-specific basis.
To secure the retirement income of former employees,
Volkswagen AG along with its brands and subsidiaries
operates a number of occupational pension systems. In
Germany, this is based on a direct pension commitment.
The occupational pension arrangements at Volkswagen AG
comprise the basic pension and the additional retirement
benefits of contributory pension schemes I and II. While
the basic pension and contributory pension scheme I are
funded by the employer, contributory pension scheme II
offers employees the opportunity to provide for their own
retirement income through deferred compensation.

217
Business Development Shares and Bonds Results of Operations, Financial Position and Net Assets Volkswagen AG (HGB) Value-Enhancing Factors Risk Report Report on Expected Developments
MANAGEMENT REPORT
Since 2001, funds for the Volkswagen AG direct pension
commitment have been invested in the capital markets by
the company pension fund administered in trust by Volks-
wagen Pension Trust e.V. At the end of 2012, an additional
22 Group companies in Germany made use of this facility.
A total of €3,009 million had been contributed to the com-
pany pension fund by the end of 2012 as lifelong pension
payments for employee retirement and disability pensions,
and for benefits in the event of death. Direct insurance is
another opportunity for employees to provide for their own
retirement income through deferred compensation.
Volkswagen AG’s Time Asset is an instrument that gives
staff the opportunity to retire earlier. Since 1998, employees
have been able to make contributions from their gross
salary and time credits, which are invested in the capital
markets by the Time Asset investment fund administered
in trust by Volkswagen Pension Trust e.V. The accumulated
Time Asset credits can be used for paid early retirement. At
the end of the reporting period, the assets in the Time
Asset investment fund amounted to €1,329 million.
EMPLOYEE BREAKDOWN
as of December 31, 2012
2012 2011 2010 2009 2008
Vocational trainees in the Group 16,714 15,021 10,545 9,846 9,884
Industrial 12,508 11,249 7,799 7,439 7,498
Commercial 4,206 3,772 2,746 2,407 2,386
Passive stage of partial retirement 7,804 4,488 4,778 7,070 8,841
Group’s active employees 525,245 482,447 384,058 351,584 351,203
Total headcount 549,763 501,956 399,381 368,500 369,928
Europe 410,427 378,030 290,159 278,779 284,962
America 63,193 58,072 54,571 48,529 48,867
Africa 6,461 6,602 6,546 5,608 6,194
Asia 68,704 58,540 47,607 35,123 29,423
Australia 978 712 498 461 482
Percentage of female employees in the Group 15.2 14.7 14.2 14.2 14.0
Absences1 (in %) 3.2 3.4 3.3 2.5 3.0
Number of accidents at work2 1,728 1,806 1,855 1,865 1,819
Frequency of accidents2 2.9 3.2 3.6 4.0 4.0
1 Production locations excluding Scania, MAN and Porsche.
2 Production locations excluding Scania, MAN and Porsche (also excluding Audi Brussels in 2009);
frequency of accidents = number of accidents at work x 1 million/number of hours worked.

218
I N FORMATION TECHNOLOGY ( IT)
The communication society, the nearly universal infor-
mation technology support for business processes and the
development of new locations bring constant challenges to
the IT functions of large companies. An adequately equipped
IT infrastructure, both technologically and quantitatively, is
the foundation for stable IT systems and thus for optimal IT
support.
It is of considerable importance to Volkswagen that the
IT infrastructure’s equipment is energy-efficient and
resource-friendly: for us, “Green IT” is not a buzzword. It is
a priority. The Audi brand’s new data center at the Ingolstadt
location is an example of the systematic approach adopted
in the Volkswagen Group: as soon as an ambient temper-
ature of 12°C is reached, outside air is exclusively used for
cooling. Although more than twice as many servers are
being used as before, innovative technology makes it
possible to eliminate the use of energy-intensive refrig-
eration compressors for cooling for more than six months
a year. This enabled the data center to reduce its energy
consumption by around one-third despite its expansion.
The efficient enhancement of the application environ-
ment at the different corporate locations, in the business
processes and in the sales network is just as vital as having
a modern IT infrastructure. The IT staff are responsible
not only for programming the systems at all of the Volks-
wagen Group’s brands, but also for supporting users in
Technical Development, Production and Sales. This is how
applications tailored to the exact needs of the users are
created. Volkswagen’s factory planners can use the “digital
factory,” for example, to virtually walk through the future
production buildings long before the ground is broken. IT
ensures that employees on the production line can build
the right vehicle at the right time using the “Fertigungs-,
Informations- und Steuerungssystem” (FIS – Production,
Information and Control System) system used throughout
the Group. The IT-based car sharing “Quicar – Share a
Volkswagen” project, was launched in 2011 in cooperation
with Volkswagen Financial Services AG. At currently 50
stations in Hanover, Quicar customers have 200 Golf
BlueMotion cars available for use 24/7. Expert teams on
the ground develop solutions that can be applied globally
and across brands for all of these IT services. This enables
Volkswagen to establish IT standards in the business areas
that are the basis for leveraging potential synergies,
among other things.
S U STA I N A B I L I T Y I N T H E VOL KSWAG E N G R OU P www.volkswagenag.com/sustainability
ENVI RONMENTAL MANAGEMENT I N THE GROU P
By 2018, we also intend to be the number one in the
automotive industry in ecological terms. To reach this goal,
we must first make production in our plants around the
world more environmentally friendly. We aim to reduce
energy and water consumption, emissions and waste at all
of the Group’s sites by 25% compared with 2010. We made
further progress in fiscal year 2012; the charts on page
221 provide an overview. Additional key environmental
indicators can be found in the Volkswagen Group’s sus-
tainability report. Second, we intend to make our products
more environmentally friendly. Thus, we plan to reduce
the CO2 emissions of the European new vehicle fleet by
30% compared with 2006 by 2015. Every new model
generation is designed to be 10% to 15% more efficient than
its immediate predecessor. Our Group environmental policy
and Group-wide environmental management are the
foundation for reaching these goals.
Environmental management ensures that the ecological
aspects of sustainability in product development and in
production are taken into account at all locations. The
main pillars are the Group’s globally applicable environ-
mental principles for products and production. Since 2010,
these efforts have been supported by a Group-wide energy
management system.
Since 1995, Volkswagen’s German locations have volun-
tarily participated in the EU’s Eco-Management and Audit
Scheme as well as worldwide in the environmental certifi-
cation process under international standard EN ISO 14001.
Since 1996, this standard has also applied to the environ-
mental management system used by Volkswagen’s Technical
Development function, which has additionally been certified
in accordance with DIN ISO/TR 14062 since 2009. By
means of recertifications and external validations, we also
confirmed our role as a trailblazer in the reporting period.
We specifically train environmental protection experts
at many of our locations in order to implement environ-
mental aspects across the Group. These experts support the
environmental officers on the ground and help to build a
broad foundation for environmental protection. The envi-
ronmental officers from the European locations have been
regularly sharing their experiences since 1976. They discuss
current topics at environmental conferences that take place
at regional and Group levels, present examples of best
practice and initiate concrete measures and thus synchro-
nize their work with Volkswagen’s environmental policies.
In the reporting period, the 5th Group environmental
conference was held in Wolfsburg, where over 400 experts
from the locations met and discussed implementation
strategies, measures and projects. A summary presentation
is available at http://www.volkswagenag.com/sustainability.

219
Business Development Shares and Bonds Results of Operations, Financial Position and Net Assets Volkswagen AG (HGB) Value-Enhancing Factors Risk Report Report on Expected Developments
MANAGEMENT REPORT
Climate protection
Protecting the climate is one of the most important tasks
facing Volkswagen in terms of sustainability because a
company that produces over nine million vehicles a year
has a special responsibility. We discharge this respon-
sibility by efficiently producing efficient vehicles and by
using renewable energy sources.
The Board of Management embeds climate change and
the resulting opportunities and risks into all of its strategic
decisions. These decisions are primarily based on
information provided by the CSR & Sustainability steering
group and the Group’s CO2 steering group, for example the
“CO2 Registry” management and analysis tool. This is an
instrument that analyzes every one of the Group’s vehicle
projects over the entire product development process with
regard to their CO2 emissions. The requirements for CO2
savings are laid down in the Group’s environmental policies
as well as in the environmental goals of the Technical
Development function. A Group Expert Network for Climate
and Energy was established to facilitate the exchange of
knowledge and experience between all brands and regions.
Efficient production
A car has the greatest ecological impact when it is being used.
However, there is still tremendous potential for production
to be more sustainable as well.
The individual Group brands launched overarching
initiatives to make production more efficient. These initiatives
identify potential, develop strategies and solutions, and
implement measures. Examples include the Volkswagen
Passenger Cars brand’s “Think Blue. Factory.” initiative
and the ŠKODA brand’s “GreenFuture” initiative.
Examples from the reporting period illustrate clearly
that these initiatives are effective: a new demand-driven
way to sequence the generation of compressed air is cutting
usage by 15% at the Chattanooga site. In the Russian
Kaluga plant, hot waste gases from the boiler house are
vented through an additional heat exchanger. This recovers
heat, which is then used for the hot water system, saving
approximately 1,000 megawatt hours (MWh) of energy
each year and reducing annual CO2 emissions by 485
tonnes. A new body shell production facility was established
in 2012 at the Emden site. Volkswagen uses the approxi-
mately 5,000 foundation piles, bored into the ground, to
store energy: in the summer, the piles store the waste heat
from the welding machines in the ground; in the winter,
the stored heat is used to heat the production sheds.
Volkswagen relies on generating its own energy from
renewable sources at many of its locations so as to reduce
the proportion of additional primary energy it purchases.
For example, the photovoltaic installation on the roof of
the production facility for body shells for the Audi A3 in
Ingolstadt generates around 460 MWh of electricity a year.
Additional systems came into operation in 2012, for example
in Braunschweig and Hanover (each generating 420 MWh
a year). Another solar energy system with over 33,000 solar
panels will be installed at the beginning of 2013 at Volks-
wagen’s Chattanooga location. A new, 17,000 m2 solar power
plant reduced CO2 emissions by 30% at the Lamborghini
brand’s Italian location in Sant’Agata Bolognese in the
reporting period.
Warm forming of sheet steel is an example of a case
where saving energy can also sometimes mean that more
energy is used initially. This process forms and heat-treats
the steel by cooling it in seconds from 950°C to about
175°C in a single step. This means that the material can be
stretched up to six times more than steel used in conven-
tional deep drawing. The result is thinner and lighter
components that are just as stable as conventional parts.
Although more energy is used at first for this warm
forming process, the energy that the vehicle requires over
its overall life cycle is lower because it weighs less. The new
Golf, for example, is produced using such parts.
Volkswagen also set new milestones in 2012 in terms of
materials efficiency. At the Wolfsburg site, the width of the
coils – flat-rolled steel strips that are used to make parts for
the body – was reduced. This creates significantly less
waste. Additionally, the tools, the component geometries
and plates nesting were optimized to improve materials
utilization. The new Golf generates 15% less waste during
production than its predecessor. Each year, optimization
measures save around 73,000 tonnes of steel in the
aggregate for other models.
In the paintshop at the Wolfsburg location, 48 of the
latest generation of painting robots went into operation in
the reporting period. The robots are equipped with color
changing and application systems, which cut the amount
of paint and cleaning products used as well as paint waste
by up to 50%, corresponding to a saving of €800,000. In
addition, the robots require up to 20% less compressed air
and significantly less energy than their predecessors. This
avoids 120 tonnes of CO2 emissions annually.

220
Water management
Reducing water consumption, cutting the volume of waste
water, treating contaminated water and protecting habitats
– these are the core aspects of sustainable water manage-
ment at Volkswagen that are laid down in the Group’s
environmental principles. We have set ourselves the goal
of reducing water consumption per vehicle in all plants by
25% by 2018 compared with 2010. The following current
examples of efficient water usage show which technologies
can be used to reach this goal.
In Foshan, China, we are currently putting into operation
a manufacturing process that is virtually free of waste
water. At that site, waste water is collected in a biological
sewage treatment plant with membrane bioreactors and
treated so that it can be reused. This technology is 98%
effective in relation to biologically degradable water contam-
ination. The plant is the first of its kind in the Chinese
automotive sector and the largest in the Volkswagen Group.
In the Taubaté plant in Brazil, water usage has been cut
by 20% thanks to a painting process without fillers and an
innovative overspray removal method.
Water consumption at the Puebla location in Mexico
dropped from 5.1 m3 per vehicle in 1999 to around 3.0 m3
currently. This success is based on improved treatment of
waste water and the use of intelligent facilities that collect
rainwater and make it usable.
So far, we have made good progress in 2012 in the
reforestation project at the Popocatépetl volcano in Mexico.
The newly planted trees and other measures ensure that
the ground there can store more rainwater. This adds
around 2.6 million m3 to the groundwater a year – signifi-
cantly more than the Volkswagen plant in Puebla requires.
Volkswagen informs the public and its stakeholders in
detail on how the Company uses water. It has participated
in the Water Disclosure Project (WDP) since 2011, making
its information available to the public. A key aspect of this
is the “water footprint”, which we calculated for selected
models based on the comprehensive data from our envi-
ronmental impact studies. This basis allows us to identify
which processes consume the most water in the entire
product lifecycle. In calculating these water footprints, we
capture the water consumption not only at our production
locations, but also in all phases of the value chain.
In cases where extracting water is unavoidable, Volks-
wagen looks for opportunities – wherever possible – to offset
it correspondingly: for the plant currently under con-
struction in Ningbo in southern China, for example, we are
driving forward the designation of tidal flats on the Yellow
Sea as protected areas to compensate.
Noise reduction
Responsible concern for the environment means that an
automobile manufacturer must consider the full range of
its vehicles’ effects. Increasingly, this includes the topic of
noise. Volkswagen is facing up to this responsibility – not
only by striving for ever lower noise emissions from
individual vehicles, but also in the form of far-reaching
activities in the area of overall traffic noise. The goal is to
better understand the influence that cars have on traffic
noise so as to identify which tasks will be assumed in the
future by vehicle manufacturers and when – as part of a
comprehensive approach – there is also a need for dialog
with other participants.
In cooperation with the internationally prominent Lärm-
kontor GmbH, Hamburg, we developed a “noise level tool”
that will be able to compare measures to quantitatively
reduce noise in terms of its effect on the noise level on the
whole as well as on the number of those affected in a model
city. The main focus is on total traffic, not on individual
vehicles. An innovative feature is that this “noise level tool”
indicates noise pollution for the first time, meaning how
much noise is “perceived” by how many of the city’s inhabi-
tants. Previously, looking exclusively at the sources of noise
produced a skewed picture of the effectiveness of noise-
reduction measures. The control variables include traffic
volume, the proportion of passenger cars and commercial
vehicles, speed, road surface, engine noise and rolling noise.
These activities are Volkswagen’s contribution to
ensuring that future measures for reducing noise are better
coordinated and that funds can be used more selectively.

221
Business Development Shares and Bonds Results of Operations, Financial Position and Net Assets Volkswagen AG (HGB) Value-Enhancing Factors Risk Report Report on Expected Developments
MANAGEMENT REPORT
VOC EMISSIONS (VOLATI LE ORGAN IC COMPOU N DS)*
in grams per vehicle
3,902.73
3,521.97
4,045.46
2012
2010
2011
0 500 3,000 4,5001,000 1,500 2,000 2,500 3,500 4,000
FRESH WATER CONSUMPTION*
in cubic meters per vehicle
5.00
4.55
4.56
2012
2010
2011
0 1 62 3 4 5
DISPOSABLE WASTE*
in ki lograms per vehicle
22.99
20.99
21.59
2012
2010
2011
0 5 30 3510 15 20 25
CO 2 EMISSIONS*
in ki lograms per vehicle
1,079.19
889.75
995.83
2012
2010
2011
0 200 1,200400 600 800 1,000
ENERGY CONSUMPTION*
in megawatt hours per vehicle
2011
2010
20120.421.79
0.472.06
0.431.83
0 1 2 3
Energy and heat
Fuel gas
* Production of passenger cars and light commercial vehicles.

222
Lifecycle assessment and environmental ratings
Volkswagen uses lifecycle assessments as an instrument for
reducing a vehicle’s environmental impact. We evaluate
vehicles, components and materials as part of these analyses,
from the first design sketches through production and use,
down to disposal, because a vehicle does not use energy
and generate emissions in its usage phase alone. Since the
environmental impact varies in the different phases of the
lifecycle, we take a range of measures to make mobility as
environmentally friendly as possible.
The lifecycle inventory is the first step in the assess-
ment. We compile data for this on every material, component
and step in the process. The data provides a picture of all of
the emissions in the air, water and ground, and of the
waste generated during the entire lifecycle. In addition,
the lifecycle inventory indicates how much primary energy is
used for the complete life of a car and the amount of emissions
that are generated, such as CO2, carbon monoxide, sulfur
dioxide, nitrogen oxides, hydrocarbons, or methane.
The potential environmental impact of a vehicle is
estimated in the second step. The various material flows
from production, usage and recycling are then allocated to
the environmental impact categories – the greenhouse
effect, summer smog, acidification, ozone depletion and
overfertilization.
The final step is certification in accordance with the
ISO EN 14040 standard. Volkswagen uses external experts,
for example the German TÜV Nord inspection organization,
to verify that it has acted in compliance with this standard;
it presents the results of the lifecycle assessment trans-
parently in the form of an environmental commendation.
In the reporting period, for example, the new Golf was
awarded such a commendation, which documents ecological
progress compared with the previous model over the
entire lifecycle.
External environmental awards
In fiscal year 2012, the Volkswagen Group’s brands and
projects received many awards for being environmentally
friendly.
The German consumer organization Stiftung Warentest
investigated nine car-sharing providers in Germany and
the Netherlands in 2012. Volkswagen Financial Services’
Quicar offering scored 1.8, the top score in the test. Quicar
convinced the experts in the categories for booking,
driving and online presence, among other factors.
Verkehrsclub Deutschland e.V. determines the most
environmentally-friendly each year. The natural gas-fueled
Volkswagen eco up! was the overall winner for 2012/2013.
Its emissions of 79 grams of CO2/km set new environmental
and economic benchmarks. In addition to its first place
finish in the overall ranking, the eco up! also won the “Best
for the Environment” category.
The Brazilian magazine “Auto Esporte” awarded the Gol
Ecomotion and the Polo BlueMotion the “Green Car of the
Year” award last year – one of the top prizes for efficient
vehicles in Brazil.
Every year, the ADAC presents one of the most important
prizes in the automotive industry: the “Golden Angel”. The
natural gas-fueled Passat TSI EcoFuel was recognized in
the “Car of the Future” category. Its low-emission drive
system clinched its success.
MAN was awarded five different prizes in Brazil for its
environmentally friendly technologies. The “AEA Environ-
ment Award” from the Association of Brazilian Automotive
Engineers went to the Constellation 17.280 6x2 Híbrido
for pioneering work in the development of the first
Brazilian hybrid truck. This hybrid truck also received two
“Renewable Energy Infrastructure Awards”. MAN won the
“Top Ethanol Award” for a vehicle from the TGS series that
can be powered flexibly by both diesel and ethanol.
Another award went to MAN for its forward-looking
research into the use of bioenergy.
The commercial vehicle trade journals “Verkehrsrund-
schau” and “Trucker” awarded the “Green Truck” title for
the second time in 2012. It was won by the Scania R 480
Euro 6, which stood out from the competition thanks to its
extremely low fuel consumption and ensuing low CO2
emissions, as well as its compliance with the Euro 6
emission standard.
Volkswagen moved up two spots year-on-year to fourth
place in the global sustainability ranking for the “Best
Global Green Brands 2012” by brand consulting company
Interbrand. This makes Volkswagen both the most environ-
mentally friendly automobile manufacturer and the “greenest”
company in Germany.
Fuel and drivetrain strategy
The use of efficient, sustainable drivetrains is a highly
important strategic issue for Volkswagen. The Group is not
only working to continuously optimize its existing drivetrains
but is also – as in the past – pursuing a variety of alternative
drive concepts, and especially electric traction. At present,
our customers primarily choose conventional engines to
drive their vehicles. Electrified drive technology and
conventional combustion engines will continue to coexist
in the future on the road to carbon-neutral, sustainable
mobility. This coexistence will be flanked by a steady
increase in the share of carbon-neutral energy sources, be
it in the form of renewable power for electric vehicles, the
production of carbon-neutral biofuels, or synthetic natural
gas. The latter is produced in electrolysis and methanation
plants fueled by wind-powered electricity. It can be used
among other things to power specially developed CNG
combustion engines. It addition, the Group is examining

223
Business Development Shares and Bonds Results of Operations, Financial Position and Net Assets Volkswagen AG (HGB) Value-Enhancing Factors Risk Report Report on Expected Developments
MANAGEMENT REPORT
innovative renewable fuels that bind CO2 during production
and that put carbon-neutral mobility within grasping
distance.
Particularly in global growth markets such as Russia,
India and the Far East, combustion engines look set from
today’s perspective to serve as the broad basis for drive
technology in the coming years. Given the need to use
resources responsibly, it is crucial to optimize combustion
engines here so as to facilitate sustainable, forward-looking
mobility. In response to this challenge, the Volkswagen
Group has developed entirely new generations of petrol and
diesel engines that are being incorporated successively
into its vehicle range. These drivetrains were used in the
successor models for the Audi A3 and Golf for the first time
in 2012.
All the new engines feature turbocharging, direct injec-
tion and a start-stop system as a standard feature. In
addition, they make use of other fuel-saving technologies
such as intelligent thermomanagement for reducing mechan-
ical and energy losses, recuperation, demand-driven auxiliary
power unit management and variable valve management.
Many Group vehicles with petrol engines started using
active cylinder management for the first time in 2012,
which automatically switches off individual cylinders
without the driver noticing when they are not needed. This
innovative technology cuts fuel consumption by up to 0.5 l
per 100 km, depending on the engine involved. Active
cylinder management is used in the Polo BlueGT, the new
Golf, the Audi A3, S6, S7 Sportback and S8 models and the
Bentley Continental.
Driver profile selection is another means of reducing
fuel consumption. It is already integrated into several
Volkswagen Group vehicles and was included in a volume
model – the new generation of the Golf – for the first time
in 2012. The eco, normal and sport modes selected by the
driver are used in engine and gear management and to
switch auxiliary power units and the air conditioning on
and off as necessary.
The Group’s efficiency models show what can already be
achieved today by combining efficient conventional drives
and vehicle innovations such as low rolling resistance tires
and aerodynamic measures. At Volkswagen, they are
available under the “BlueMotion” label, at ŠKODA they are
known as the “GreenLine” models and at SEAT they go by
the name of “ECOMOTIVE”. With CO2 emissions of 87 g/km
and fuel consumption of only 3.3 l per 100 km, the Polo
BlueMotion is one of the most environmentally-friendly
and economical five-door vehicles in the world. The new
Golf BlueMotion – available from mid-2013 onwards –
with its new 1.6 TDI engine will have an average fuel
consumption of only 3.2 l per 100 km and CO2 emissions of
a mere 85 g/km. The ŠKODA Octavia GreenLine that will be
introduced in 2013 emits only 89 g/km CO2 and uses 3.4 l
diesel per 100 km. The eco up! that was launched at the
end of 2012 has a 1.0 CNG engine and CO2 emissions of
merely 79 g/km.
What is more, the Audi and Porsche brands provide
impressive proof that premium-segment diesel engines can
be both dynamic and economical. The twin turbocharged
3.0 TDI engine in the new Audi SQ5 TDI has an output of
230 kW (313 PS) and uses a mere 6.8 l of diesel per 100 km.
Porsche’s Cayenne S diesel offers another example of twin
turbocharger technology in the form of its 4.2 l V8 diesel
engine, which has an output of 281 kW (382 PS). It uses a
mere 8.3 l of diesel per 100 km.
Our successful TSI, TFSI and TDI engines, ideally
combined with the Group’s innovative direct shift gear-
boxes, offer a good starting point for efficient vehicle propul-
sion now and in the future. They can be combined with
electrical components on a modular basis to produce hybrid
drives. Plug-in versions of these vehicles can be recharged
via electrical outlets and – depending on the model
concerned – can cover between 20 and 80 km in purely
electric mode.

224
TH E ROAD TO CARBON-NEUTRAL MOBILITY
When it comes to drive electrification, hybrids – and
particularly plug-in hybrids – are a core topic for the Volks-
wagen Group, since these are currently the best way of
supplementing petrol and diesel engines. They combine
the benefits of two technologies and hence meet a number
of customer expectations: an unlimited range thanks to
their combustion engines, an attractive electric drive unit
for day-to-day urban use, no restrictions on speed, hill-
climbing ability, or trailer loads and substantial potential
for reducing CO2 emissions. As a result, Volkswagen Group
is mounting a major new push for this technology, a key
element of which is its integration into the modular toolkit
strategy. This underscores the importance of e-mobility
within the Group, giving it a firm, long-term place in its
product strategy. Combined drives are already available
today in a large number of vehicle classes in the form of the
hybrid versions of the Jetta, Touareg, Audi Q5, Audi A6,
Audi A8, Porsche Cayenne S and Porsche Panamera S models.
Volkswagen will also ring in the age of pure-play e-
mobility in 2013 with the market launch of the e-up! and
then the e-Golf. The Group brands performed extensive
international fleet trials with purely electric vehicles and a
large number of different customer groups in fiscal year
2012 and were able to optimize the technology, its
suitability for daily use and user requirements for later
series production. At present, for example, ten ŠKODA
Octavia Green E Line vehicles are in use at a number of
customers in the Czech Republic. However, a number of
challenges still have to be mastered before electric vehicles
can be launched onto the wider market. Developing high-
performance batteries and building up technological
expertise in the area of battery chemistry are both vital to
increasing the range and hence the attractiveness of
electric vehicles. Another challenge is integrating electric
cars into the existing infrastructure. A large number of
questions still need to be answered together with the
government, municipal authorities and utilities with respect
to the recharging strategy to be adopted (“smart grid”),
how to construct an end-to-end infrastructure, particularly
of rapid charging stations, and how to book charging
points and bill the electricity provided. In the Volkswagen
Group’s opinion, the intelligent combination of the
automotive, power generation and telecommunications
sectors offers the opportunity to ease the transition to
e-mobility for customers, or to make it attractive for them –
for example by providing new services and business
models, such as mobile online services that give details on
battery charge levels and recharging options.
Volkswagen will manufacture not only the bodywork
but also the core components of electric cars – the electric
motor and the battery system. The Kassel plant has been
designated to manufacture the motors, while the battery
modules will be assembled into battery systems in the
Braunschweig facility.
This basic mix of conventional and alternative tech-
nologies and Volkswagen’s modular toolkit strategy, which
allows innovations to be incorporated rapidly into different
vehicles, means that the Group is optimally positioned to
meet the challenges that the future will bring.
Fuel cell
Battery power
Plug-in hybrid
Hybrid drive
Combustion engine
–neutral and sustainable
mobilityConventional fuels
Conventional electricity
Carbon-neutral electricity
Carbon-neutral fuels (liquid, gaseous)
Carbon

225
Business Development Shares and Bonds Results of Operations, Financial Position and Net Assets Volkswagen AG (HGB) Value-Enhancing Factors Risk Report Report on Expected Developments
MANAGEMENT REPORT
Biodiversity
Biological diversity and functioning ecosystems are at the
heart of life itself and of economic activity. Despite this
knowledge, however, we are facing a dramatic loss in species,
ecosystems and genetic diversity. This makes preserving
biodiversity one of the most urgent tasks we are currently
facing. Businesses are also called on to take responsibility
in this area. At Volkswagen, protecting biodiversity has
been a corporate goal since 2007. Although industrial
enterprises contribute to this through classic nature and
species conservation projects, their key contribution is by
reducing greenhouse gas emissions and ensuring effective
environmental management at their production locations.
Volkswagen aims to play a pioneering role in protecting
biodiversity, which is why we drove forward integration of
this topic with our processes in the period under review. In
addition, we participated in the following projects, among
others:
> Support for scientific research into biodiversity through
Volkswagen’s “Por amor al planeta” program in Mexico
> Protection of dolphins and penguins in South Africa as a
sponsor partner of the Wilderness Foundation’s Rhino
Protection Initiative
> Support for an EU-sponsored species inventory in the
Czech Republic’s national parks
> Support for a range of conservation and environmental
protection projects, including Europe’s largest river resto-
ration program, on the Lower Havel river, a project to
create habitat corridors in the Allertal valley and estab-
lishing green corridors for wild cats together with the
Bund für Umwelt und Naturschutz (BUND), Germany’s
League for the Environment and Nature Conservation
> Financial and organizational support for extensive moor
restoration projects in northern Germany
> Preparation of a feasibility study on the restoration of
moors in the Nizhny Novgorod region of Russia
> Continuation of Volkswagen Group China’s Green Future
Environmental Education Initiative together with Chinese
partners, for the first time with the support of the
Naturschutzjugend (NAJU), the youth wing of Germany’s
Nature And Biodiversity Conservation Union (NABU)
Systematic ongoing stakeholder dialog is vital to species
conservation, which is why Volkswagen has actively sought
to exchange information and opinions with associations
and institutions. For example, the Group sponsored the
Eleventh Meeting of the Conference of the Parties to the
Convention on Biological Diversity in Hyderabad, India, in
October 2012. In addition, Volkswagen was active in the
international “Biodiversity in Good Company” initiative
and in the Biodiversity & Ecosystems Services Project
Group run by econsense, the German sustainability forum.
Volkswagen receives ongoing advice from NABU as part of a
long-term strategic stakeholder dialog.
We expanded our reporting and communication on
biodiversity protection activities in 2012. Among other
things, we designed the website www.mobil-fuer-mensch-
und-natur.de as an interactive platform for our cooperation
with NABU.

226
In this chapter, we first explain the internal control and
risk management system relevant for Volkswagen’s financial
reporting process. We then outline the specific risks facing
us in our business activities. The “Report on Expected
Developments” on pages 237 to 246 describes the oppor-
tunities arising from our work.
I NTEGRATED I NTERNAL CONTROL AN D RISK MANAGEMENT
SYSTEM RELEVANT FOR THE FINANCIAL REPORTING PROCESS
The accounting-related internal control and risk manage-
ment system that is relevant for the financial statements of
Volkswagen AG and the Volkswagen Group comprises mea-
sures that are intended to ensure the complete, accurate
and timely transmission of the information required for
the preparation of the financial statements of Volkswagen
AG, the consolidated financial statements and the Group
management report, and to minimize the risk of material
misstatement in the accounts and in the external reporting.
Main features of the integrated internal control and risk
management system relevant for the financial reporting
process
The Volkswagen Group’s accounting is organized along
decentralized lines. For the most part, accounting duties
are performed by the consolidated companies themselves
or entrusted to the Group’s centralized shared service
centers. The financial statements of Volkswagen AG and
the subsidiaries prepared in accordance with IFRSs and
the Volkswagen Group accounting manual and reported on
by the auditors are transmitted to the Group in encrypted
form. A standard market product is used for encryption.
The Group accounting manual ensures the application
of uniform accounting policies based on the requirements
applicable to the parent. In particular, these include more
detailed guidance on the application of legal requirements
and industry-specific issues. Components of the reporting
packages required to be prepared by the Group companies
are also set out in detail and requirements established
regarding the presentation and settlement of intragroup
transactions and the balance reconciliation process building
on this.
Control activities at Group level include analyzing and,
if necessary, adjusting the data reported in the financial
statements presented by the subsidiaries, taking into account
the reports submitted by the auditors and the outcome of
the meetings on the financial statements with represen-
tatives of the individual companies. These discussions
address both the reasonableness of the single-entity financial
statements and specific critical issues at the subsidiaries.
Alongside reasonableness reviews, the clear delineation of
areas of responsibility and the application of the dual
control principle are further control mechanisms applied
during the preparation of the single-entity and consolidated
financial statements of Volkswagen AG.
In addition, the financial reporting-related internal
control system is independently reviewed by Group Internal
Audit in Germany and abroad.
Integrated consolidation and planning system
The Volkswagen consolidation and corporate management
system (VoKUs) enables the Volkswagen Group to consolidate
and analyze both Financial Reporting’s backward-looking
data and Controlling’s forward-looking data. It offers
centralized master data management, uniform reporting
and maximum flexibility with regard to changes to the legal
environment, providing a future-proof technical platform
that benefits Group Financial Reporting and Group
Controlling in equal measure. To verify data consistency,
Risk Report (Report in accordance with section 289(5) of the HGB) Using effective systems to identify and control risks
Our Company’s sustainable success also depends on how promptly we identify the risks
arising from our operating activities and how forward-looking we are in managing them.
The Volkswagen Group’s internal control system and a comprehensive risk management system
help the Group deal with these risks in a responsible manner.

227MANAGEMENT REPORT
Business Development Shares and Bonds Results of Operations, Financial Position and Net Assets Volkswagen AG (HGB) Value-Enhancing Factors Risk Report Report on Expected Developments
VoKUs has a multi-level validation system that primarily
checks content plausibility between the balance sheet, the
income statement and the notes.
RISK EARLY WARN I NG SYSTEM IN LIN E WITH THE KONTRAG
The Company’s risk situation is ascertained, assessed and
documented annually in accordance with the require-
ments of the Gesetz zur Kontrolle und Transparenz im
Unternehmensbereich (KonTraG – German Act on Control
and Transparency in Business). The purpose of risk
management as an operational component of our business
processes is to identify risks at an early stage, assess their
extent, promptly initiate any necessary countermeasures
and report to the Board of Management in accordance
with the internal rules. Each year, the auditors check the
processes and procedures implemented for this as well as
the adequacy of the documentation.
The Scania brand, which has been consolidated in the
Group since July 22, 2008, has not yet been incorporated into
the Volkswagen Group’s risk management system due to
various provisions of Swedish company law. According to
Scania’s Corporate Governance Report, risk management
and risk assessment are integral parts of corporate manage-
ment. Risk areas are evaluated by the Controlling depart-
ment and reflected in the financial reporting.
Porsche Holding Salzburg, which was consolidated in
2011, was fully integrated into the Volkswagen Group’s
existing systems in the reporting period. MAN SE, likewise
consolidated in 2011, and Dr. Ing. h.c. F. Porsche AG,
which was consolidated in 2012, have already imple-
mented mature structures for a risk early warning system
and are included in the annual reporting. Ducati Motor
Holding S.p.A., which was also consolidated in 2012, will
gradually be integrated starting in 2013.
Updating the risk documentation
Each year, both the risk managers of the individual
divisions and the members of the boards of management
and managing directors of significant investees receive
standardized risk position surveys. Their responses are
used to update the overall picture of the potential risk
situation. In the process, the expected likelihood of
occurrence and the expected loss are assigned to each
significant risk identified and the measures taken are docu-
mented. The annual updating of the risk documentation is
coordinated centrally by the Governance, Risk and
Compliance function. Under the guidance of the auditors,
the plausibility and adequacy of the risk reports are
examined on a test basis in detailed interviews with the
divisions and companies concerned. The auditors assessed
the effectiveness of our risk early warning system based on
this information and established both that the risks
identified were presented accurately and that measures
and rules have been assigned to the risks adequately and in
full. We therefore meet the requirements of the KonTraG.
In addition, the Financial Services Division is subject to
scheduled checks as part of the audit of the annual
financial statements and unscheduled checks within the
meaning of section 44 of the Kreditwesengesetz (KWG –
German Banking Act) by Bundesanstalt für Finanzdienst-
leistungsaufsicht (BaFin – the German Federal Financial
Supervisory Authority), as well as checks by association
auditors.
Workflow rules, guidelines, instructions and descriptions
are systematically recorded and can for the most part be
accessed online. Adherence to these rules is assured by
internal controls performed by the heads of the Group
Internal Audit, Quality Assurance, Group Treasury, Brand
Controlling and Group Controlling organizational units.
The risk management system – goals and operation
The Group’s risk management system is designed to
identify potential risks at any early stage so that suitable
counter-measures can be taken to avert the threat of loss to
the Company, and any risks that might jeopardize its
continued existence can be ruled out.
The risk management system is an integral part of the
Volkswagen Group’s structure and workflows and is embed-
ded in its business processes. Events that may give rise to
risk are identified and assessed on a decentralized basis in
the divisions and at the investees. Countermeasures are
introduced immediately, their effects are assessed and the
information is incorporated into the planning in a timely
manner. The results of the operational risk management
process are incorporated into budget planning and
controlling on an ongoing basis. The targets agreed in the
budget planning rounds are continually reviewed in
revolving planning updates.
At the same time, the results of risk mitigation
measures that have already been taken are incorporated
into the monthly forecasts on further business develop-
ment in a timely manner. This means that the Board of
Management has access to an overall picture of the current
risk situation through the documented reporting channels
during the year as well.
We are prepared to enter into transparent risks that
are proportionate to the benefits expected from the
business.
Continuous monitoring and enhancement
The internal control and risk management system is
constantly optimized as part of our continuous monitoring
and improvement processes. In the process, equal consid-
eration is given to both internal and external requirements
– such as the provisions of the Bilanzrechtsmodernisierungs-
gesetz (BilMoG – German Accounting Law Modernization
Act). External appraisers support the continuous enhance-
ment of our internal control and risk management systems
on a case-by-case basis. The objective of the monitoring
and improvements is to ensure the effectiveness of the

228
internal control and risk management systems. The results
culminate in both regular and event-driven reporting to
the Board of Management and Supervisory Board of Volks-
wagen AG.
SPECI FIC RISKS
This section explains the specific risks arising from our
business activities in the coming years.
Macroeconomic risk
We believe the biggest risks to continued global economic
expansion consist primarily of unanswered questions
surrounding the resolution of the European and US debt
crises and the future institutional structures in the eurozone.
Imbalances in foreign trade and volatile financial markets
are also contributing to a high level of uncertainty. Added
to this are geopolitical risks resulting from tensions in the
Middle East and North Africa, which could impact
negatively on the trend in energy and commodity prices.
Due to the persistent structural challenges in the
industrialized nations, a climate of uncertainty remains in
evidence in the international markets. This is indicated by
a lack of investment by businesses and hesitant lending on
the part of commercial banks. This has a considerable
impact on the Volkswagen Group’s risk position.
We see further risks in protectionist tendencies in the
economic policies adopted by certain countries, which
could lead to the implementation of trade restrictions and
hence hinder the international exchange of goods.
We consider the risk of renewed global recession to be
relatively low, but see the possibility of a prolonged period
of below-average growth due to the factors mentioned.
Sector-specific risk
The growth markets of Asia, South America, and Central
and Eastern Europe are particularly important in terms of
the global trend in demand for passenger cars. Although
these markets harbor the greatest potential, the overall
environment in some of the countries in these regions
makes it difficult to increase unit sales figures there. Some
have high customs barriers or minimum local content
requirements for domestic production, for example.
Following the reduction in the number of new vehicles
allowed to be registered in places such as Beijing, further
restrictions on registrations could enter into force in other
Chinese metropolitan areas as well. Furthermore, the
global economic slowdown could impact negatively on
consumer confidence in some of these countries.
Likewise, we cannot entirely rule out the risk of freight
deliveries being shifted from commercial vehicles to other
means of transport and of demand for the Group’s
commercial vehicles falling as a result.
Price pressure in established automotive markets is a
particular challenge for the Volkswagen Group as a
supplier of volume and premium models due to its high
level of market coverage. If global economic conditions
deteriorate, competitive pressures are likely to increase
further. Manufacturers will respond by offering price
discounts in order to meet their sales targets, thereby
putting the entire sector under pressure, particularly in
Western Europe, the USA and China.
Western Europe is one of the Volkswagen Group’s main
sales markets. A combination of a drop in prices due to the
economic climate and a fall in demand in this region
would therefore have a particularly strong impact on the
Company’s earnings. Volkswagen counters this risk with a
clear, customer-oriented and innovative product and
pricing policy. Outside Western Europe, its overall delivery
volume is broadly diversified throughout the world. The
Chinese market accounts for an increasing share of the
volume. In addition, we are already market leader in
numerous existing and developing markets or are working
resolutely to take pole position. Moreover, strategic
partnerships help us to increase our presence in the
relevant countries and regions and cater to requirements
there.
The global economic climate deteriorated noticeably
during the reporting period. The resulting challenges for
our trading and sales companies, for example efficient
warehouse management and the profitability of the dealer
network, are considerable. They meet them by taking
appropriate measures. Although it remains difficult to
finance business activities through bank loans, our
financial services companies offer dealers financing on
attractive terms with the aim of bolstering their business
model and reducing operational risk. We have also
developed and installed a comprehensive liquidity risk
management system so that we can promptly counteract
any liquidity bottlenecks at the dealers’ end that could
hinder smooth business operations.
We continue to approve loans for vehicle finance on the
basis of the same cautious principles applied in the past,
taking into account the regulatory requirements of section
25a(1) of the KWG.
Volkswagen may be exposed to increased competition
in aftermarkets for two reasons: firstly, because of the
provisions of the new Block Exemption Regulation, which
have been in force for after-sales service since June 2010,

229MANAGEMENT REPORT
Business Development Shares and Bonds Results of Operations, Financial Position and Net Assets Volkswagen AG (HGB) Value-Enhancing Factors Risk Report Report on Expected Developments
and, secondly, because of the amendments included in EU
Regulation 566/2011 dated June 8, 2011 expanding
independent market participants’ access to technical
information.
The European Commission is planning to end design
protection for visible vehicle parts. If this plan is actually
implemented, it could adversely affect the Volkswagen
Group’s genuine parts business.
Research and development risk
We ensure that we give our customers’ requirements
adequate consideration during development by conducting
extensive trend analyses, customer surveys and scouting
activities. These measures guarantee that we recognize
trends at an early stage and verify their relevance for our
customers in good time.
We counter the risk that it may not be possible to
develop products or modules within the specified
timeframe, to the required quality standards, or in line
with cost specifications by continuously and systematically
monitoring the progress of all projects. We regularly
compare this progress with the original targets; in the
event of deviations, we introduce appropriate counter-
measures in good time. Our end-to-end project organi-
zation supports effective cooperation among all areas
involved in the process, ensuring that specific require-
ments are incorporated into the development process as
early as possible and that their implementation is planned
in good time.
Procurement risk
The global rise in automotive industry unit sales is also
reflected in an increased need among suppliers for
investment financing and working capital. In the
eurozone, however, the euro crisis is impeding provision
of the necessary financing. This may lead to declines in
individual market segments and an adverse effect on
suppliers’ financial position. In the second half of 2012,
investors became more reluctant to invest in the
automotive supply sector due to the drop in demand in
Europe and the difficult situation facing competitors. Our
procurement risk management system is well prepared for
this situation. We continuously monitor changes at the
suppliers’ end and, if there are any negative developments,
use a suite of different measures intended to help reduce
risks and ensure supplies. This enables us both to largely
avoid supply risks due to supplier defaults and minimize
the financial effects of crises up to and including insolvencies
in the supply chain.
Production risk
In the second half of the reporting period, most European
markets experienced a sharp fall in unit sales that had a
noticeable impact on the entire European automotive
industry. At our largest competitors, the drop in unit sales
in core segments led to a decline in plant and workforce
capacity utilization, which in extreme cases even resulted
in factory closures. For several reasons, the Volkswagen
Group was able to address this risk successfully and thus
keep capacity utilization at its European locations largely
unchanged: firstly, the Volkswagen Group benefits from its
broad product range, so that declines in individual vehicle
segments can be offset elsewhere. Secondly, our presence
in almost all the world’s markets also helps us to absorb
fluctuations in demand in one region in our global
production network. However, these two factors can only
come into play as a result of our flexible production
network, which uses turntable concepts, for example, to
distribute production volumes evenly and hence minimize
the impact on individual sites. This applies to both vehicle
and component factories.
Nevertheless, shifts between the vehicle segments – as
a result of the sales crisis in Europe – may, for example,
cause the balance of demand between different vehicle
equipment features to deviate sharply from the original
plan in the short term, potentially leading to supply
bottlenecks, for example. We have various tools that enable
us to spot such changes in demand as early as possible,
introduce appropriate measures to adjust capacity and
thus minimize the supply risk during peaks in demand for
individual vehicle features. For instance, we regularly
examine the feasibility of various demand scenarios in
light of the components available and, if necessary,
identify appropriate adjustment measures based on our
findings. We also have extensive flexibility in the areas of
logistics and existing working time models.
Special risks may arise during large projects. These
result in particular from contracting deficiencies,
miscosting, post-contracting changes in economic and
technical conditions, and poor performance on the part of
subcontractors. We counter these risks by performing
appropriate project controls throughout all project phases.

230
Risks arising from changes in demand
Consumer demand not only depends on real factors such
as disposable income; it is also shaped by psychological
factors that are impossible to plan for.
Increased fuel and energy prices could lead to
unexpected buyer reluctance, which could be further
exacerbated by media reports. This is particularly the case
in saturated automotive markets such as Western Europe,
where demand could drop as a result of owners holding on
to their vehicles for longer.
In 2012, the effect of unplannable psychological
demand factors was exacerbated by the euro crisis and its
impact on the global economy and the entire automotive
industry. Several automotive markets, particularly in
Southern Europe, were in a downward spiral, which in
some cases assumed dramatic proportions. We are
countering this buyer reluctance with our attractive range
of models and in-depth customer orientation.
In addition to buyer reluctance as a result of the crisis,
a combination of vehicle taxes based on CO2 emissions – like
those already structured in some European countries – and
high oil and energy prices is causing a shift in demand
towards smaller segments and engines in individual
markets. We counter the risk that such a shift will
negatively impact the Volkswagen Group’s earnings by
constantly developing new, fuel-efficient vehicles and
alternative drive technologies on the basis of our
drivetrain and fuel strategy. In the rapidly expanding
markets of Asia and Eastern Europe, risks arise due to
government intervention in the form of tax increases, for
example, which could reduce private consumption.
Dependence on fleet customer business
In fiscal year 2012, the percentage of total registrations in
Germany accounted for by business fleet customers
increased to 12.7% (12.4%). The Volkswagen Group’s
share of this segment rose to 47.7% (46.8%). In Europe,
Volkwagen’s extensive product range and target group-
specific customer care enabled it to extend its successful
position in this segment: although registrations by
business fleet customers fell by 4.3% in a declining
market, the Group’s share increased to 29.3% (28.7%).
The fleet customer business continues to be marked by
increasing concentration and internationalization. Thanks
to its broad product portfolio, however, the Volkswagen
Group is well positioned to face the growing importance of
the issue of CO2 and the trend towards downsizing. No
default risk concentrations exist for individual corporate
customers.
Quality risk
Sustained high demand in the Volkswagen Group’s key
markets poses particular challenges for quality assurance.
Quality assurance is of fundamental importance especially
in the growing automotive markets of Brazil, Russia, India
and China, for which dedicated vehicles are developed and
where local manufacturing operations and suppliers have
been established. We analyze the conditions specific to
each market and thus ensure growth in these regions. In
cooperation with the central quality assurance function,
we continuously develop effective measures to counter
identified local risks and then implement those measures
locally, thus minimizing quality defects from the outset.
Our need for high-grade supplier components of
impeccable quality is rising due to growing production
volumes, increasing complexity and the use of the Group’s
toolkit system. To ensure production and hence meet
customer expectations, it is extremely important that our
own plants and our suppliers deliver on time. The
introduction of an internally-tested risk management
system at suppliers is an important step towards ensuring
long-term quality and supply capability early on in the
supply chain. Quality assurance thus helps to fulfill
customer expectations and consequently boost our
Company’s reputation, sales figures and earnings.
Personnel risk
The individual skills and technical expertise of our
employees are a major factor contributing to the Volks-
wagen Group’s success. Our aim of becoming the top
employer in the automotive industry improves Volkswagen’s
chances of recruiting and retaining the most talented
employees.
Our strategic, end-to-end human resources development
strategy gives all employees attractive training and develop-
ment opportunities, with particular emphasis placed on
increasing technical expertise in the Company’s different
vocational groups. By continuously expanding our recruit-
ment tools and boosting training programs, particularly at
our international locations, we are able to adequately
address the challenges posed by growth on the human
resources side.
In addition to the standard twin-track vocational
training, programs such as our StIP integrated degree and
traineeship scheme ensure a pipeline of highly qualified
and motivated employees. At a cross-functional level, the
Top 100 program ensures that key expertise continues to
be acquired and propagated within the Volkswagen Group.

231MANAGEMENT REPORT
Business Development Shares and Bonds Results of Operations, Financial Position and Net Assets Volkswagen AG (HGB) Value-Enhancing Factors Risk Report Report on Expected Developments
The program is based on the tandem principle, i.e. knowl-
edge and expertise are transferred from person to person.
We counter the risk that knowledge will be lost as a result
of employee fluctuation and retirement with intensive,
department-specific training. We have also expanded our
base of senior experts in the Group to ensure that the
valuable knowledge of specialists retiring from Volkswagen
is transferred to other employees.
Participation and codetermination are factors in the
Volkswagen Group’s success. Employee involvement and
motivation are two sides of the same coin. We aim to
maintain a culture of participation at Volkswagen inter-
nationally as well. The challenge lies in crafting labor
relations with the many trade unions and stakeholder
representatives worldwide. We have created a framework
for this with our Labor Relations Charter and have pledged
our commitment to it.
IT risk
At Volkswagen, a global company geared towards further
growth, the information technology (IT) used in all
divisions Group-wide is assuming an increasingly
important role. IT risks include unauthorized access to
sensitive electronic corporate data as well as limited
systems availability as a consequence of downtime or
natural disasters. We address the risk of unauthorized
access to corporate data by using firewall and intrusion
prevention systems and a dual authentication procedure.
We achieve additional protection by restricting the
allocation of access rights to systems and information and
by keeping backup copies of critical data resources. For
this, we use technical resources that have been tried and
tested in the market, adhering to standards applicable
throughout the Company. By implementing redundant IT
infrastructures, we protect ourselves against risks that
occur in the event of a systems failure or natural disaster.
Back in 2011, a new Group data center was put into
operation at the Wolfsburg site, which sets high standards
across the entire automotive industry in terms of security,
performance and energy efficiency. We maintained this
course in 2012 commissioning additional data centers at
the Mladá Boleslav and Ingolstadt sites.
In addition, we continuously take measures to combat
identified and anticipated risks during the software
development process, when protecting the IT infra-
structure and also in the allocation of access rights to.
systems and data resources. These preventative measures
are taken with the aim of counteracting the growing intensity
and quality of attacks on our IT systems and data resources
at an early stage.
Environmental protection regulations
The EU regulations governing CO2 emissions from
passenger cars (443/2009/EC) and light commercial
vehicles of up to 3.5 tonnes (510/2011/EU), in effect since
April 2009 and June 2011 respectively, set the specific
emission limits for all new passenger car and light
commercial vehicle models and the fleet targets calculated
from the individual vehicle data of brands and groups in
the 27 EU member states until 2019. They are an important
component of European climate protection regulations
and therefore form the key regulatory framework for
product design and marketing by all vehicle manufac-
turers operating in the European markets.
From 2012 onwards, the average CO2 emissions of
European manufacturers’ new passenger car fleets may
not exceed 130 g CO2/km. This requirement is to be
introduced in four stages: 65% of the fleet must meet this
requirement as of 2012 and the entire fleet by 2015. A
further significant reduction in European passenger car
fleet emissions to 95 g CO2/km from 2020 onwards has
already been resolved, although the details as to how it will
be reached have not. These are expected to be agreed by
mid-2013 in the course of the European Commission’s
current review.
The EU CO2 regulation for light commercial vehicles
requires limits to be met from 2014 onwards, with targets
being phased in over the period to 2017: the average CO2
emissions of new registrations in Europe may not exceed
175 g CO2/km. The long-term target for the period after
2020 has also been set (at 147 g CO2/km), subject to the
European Commission’s current review. Like the CO2
regulation for passenger cars, the regulation provides for
derogations from the targets, for example by offering relief
for eco-innovations.
The European Commission intends to set out the CO2
regime for the period after 2020 by the end of 2014.
Politicians are already discussing reduction targets for the
transport sector for the period to 2050, such as the 60%
reduction in greenhouse gases from 1990 levels cited in
the EU White Paper on transport published in March 2011.
It will only be possible to meet these long-term goals by
also making extensive use of nonfossil sources of energy, in
particular in the form of renewable electricity.
At the same time, CO2 or fuel consumption regulations
are also being developed or introduced outside Europe – in
Japan, China, India, Brazil, Australia and Mexico, for
example. In the USA, a new consumption regulation will
prolong uniform fuel consumption and greenhouse gas

232
rules in all states of the USA for the period from 2017 to
2025. The law was signed by the US president on August
28, 2012.
Increasing CO2 and consumption regulations mean
that the latest mobility technologies are required in all key
markets worldwide.
The Volkswagen Group closely coordinates technology
and product planning with its brands so as to avoid target
breaches, which entail severe sanctions. In principle, the
EU legislation permits some flexibility. For example:
> Excess emissions and emission shortfalls may be offset
between vehicle models
> Emission pools may be formed
> Relief may be provided in the form of credits that are
granted for additional eco-innovations contained in the
vehicle and that apply outside the test cycle
> Special rules are in place for small and niche manu-
facturers.
Whether the targets are met, however, depends crucially
on the Group’s technological and financial capabilities,
which are reflected, among other things, in our drivetrain
and fuel strategy (see page 222).
The other main EU regulations affecting the auto-
motive industry include
> EU Directive 2009/33/EC on the promotion of clean and
energy-efficient road transport vehicles (Green Procure-
ment Directive),
> Passenger car energy consumption labeling directive
1999/94/EC,
> Fuel Quality Directive 2009/30/EC: updates the fuel
quality specifications and introduces energy efficiency
specifications for fuel production,
> Renewable Energy Directive 2009/28/EC: introduces
sustainability criteria,
> Revised Energy Taxation Directive 2003/96/EC: updates
the minimum tax rates for all energy products and power.
The implementation of the above-mentioned directives by
the EU member states serves as a flanking measure for the
CO2 regulations in Europe. As well as vehicle manu-
facturers, they are also aimed at other stakeholders such
as the mineral oil industry. Plans to tax vehicles based on
CO2 emissions are having a similar effect; many EU member
states have already incorporated CO2 elements into their
rules on vehicle taxation.
At the same time as the CO2 legislation for passenger
cars and light commercial vehicles, the EU is preparing
CO2 regulation for heavy commercial vehicles. Setting one
overarching limit for these vehicles – like that in place for
passenger cars and light commercial vehicles – is
extremely complicated because of the wide range of
variants (tractors with different trailers or bodywork).
Therefore, a system for measuring and certifying CO2
emissions by heavy commercial vehicles that considers the
vehicle as a whole is currently being worked on. This is
expected to be the basis for the EU’s concrete regulatory
proposals, which are expected for 2014 and are likely to
enter into force in 2017/2018.
Manufacturers of heavy commercial vehicles are
urging the adoption of a system for quantifying CO2 figures
that is accessible to everyone and that looks at the vehicle
as a whole, and not simply at the engine or the tractor, in
order to increase transparency and therefore competition
in the market.
As part of its efforts to reduce the CO2 emissions of
heavy commercial vehicles, the European Commission is
also planning to revise the provisions regarding the
maximum permissible dimensions of trucks (Directive
96/53/EC, the “weights and measures” directive). By
relaxing the legal length restrictions, it may be possible to
design vehicles in an aerodynamic way without losing any
loading space. As air resistance is lower in a rounded and
streamlined design, this leads to lower fuel consumption.
Considering the vehicle as a whole could save up to 25% in
fuel through the aerodynamic design of cabs and trailers,
as well as additional technical innovations.
In the Power Engineering segment, the International
Maritime Organization (IMO) has laid down the
International Convention for the Prevention of Pollution
from Ships (MARPOL), which phases in limits on exhaust
emissions from marine engines. Emission limits also
apply, for example, under EU directive 97/68/EC and the
US EPA (Environmental Protection Agency) marine
regulations. As regards stationary equipment, national
rules are in place worldwide and have to be applied locally.
On December 18, 2008, the World Bank Group set limits
for gas and diesel engines in its “Environmental, Health,
and Safety Guidelines for Thermal Power Plants”, which
are binding if individual countries have adopted no or less
strict national requirements. In addition, back in 1979,
the United Nations adopted the Convention on Long-range
Transboundary Air Pollution, setting limits on total
emissions as well as nitrogen oxide limits for the signatory
states (including all EU states, other countries in Eastern
Europe, the USA and Canada). Enhancements to the

233MANAGEMENT REPORT
Business Development Shares and Bonds Results of Operations, Financial Position and Net Assets Volkswagen AG (HGB) Value-Enhancing Factors Risk Report Report on Expected Developments
product portfolio in the Power Engineering segment are
focusing on improving the efficiency of the equipment and
systems.
In order to be optimally prepared for the third
emissions trading period starting in 2013, we calculated
and reported the CO2 emissions to be reported for our
German plants in accordance with the Datenerhebungs-
verordnung (DEV 2020 – German Data Collection
Regulation). We submitted the appropriate applications for
the allocation of certificates to the Deutsche Emissions-
handelsstelle (DEHSt – German Emissions Trading
Authority) for all our plants. Our other plants in the
European Union were also checked in accordance with the
national laws in force at those locations and action was
taken to ensure that applications were submitted to the
relevant national authorities in good time.
The changes to the Emissions Trading Directive and
their transposition into German law have been completed.
From a current perspective, the number of plants included
in the European emissions trading system from 2013
onwards and the related amount of CO2 emissions
requiring to be traded will not increase significantly.
The allocation of the necessary emissions certificates
will change fundamentally as of 2013. They will no longer
be allocated mostly free of charge through national
allocation plans. Instead, a steadily falling number of
certificates, for heat generation using natural gas for
example, will be allocated free of charge. Companies will
have to purchase any additional certificates they require at
auction. Unlike before, CO2 emissions certificates for
power generation will have to be purchased in full.
Estimates to date indicate that the energy costs incurred by
the Volkswagen Group’s European sites will increase as a
result of purchasing the emission allowances required for
the operation of proprietary power plants and heating
facilities. The amount of the additional costs will depend
essentially on the price at which the certificates are traded.
The European Commission is currently giving detailed
consideration to intervening in EU emissions trading in
order to boost it. The Commission is currently in favor of
withdrawing a defined number of freely allocated
certificates at the beginning of the third trading period and
not allocating them until the end of the trading period.
This artificial shortage of certificates at the beginning of
the trading period may cause certificate prices to rise.
The future political direction of global climate
protection agreements remains unclear. There is currently
no sound long-term prospect of specific reduction targets,
responsibilities and funding arrangements or more
stringent climate protection requirements based on them.
At the UN, a new climate protection agreement for 2020
onwards is to be negotiated by 2015 at the latest.
Litigation
In the course of their operating activities, Volkswagen AG
and the companies in which it is directly or indirectly
invested become involved in legal disputes and official
proceedings in Germany and internationally. In particular,
such proceedings may occur in relation to suppliers,
dealers, customers, employees, or investors. For the
companies involved, these may result in payment or other
obligations. Particularly in cases where US customers
assert claims for vehicle defects individually or by way of a
class action, highly cost-intensive measures may have to be
taken and substantial compensation or punitive damages
paid. Corresponding risks also result from US patent
infringement proceedings.
Where transparent and economically viable, adequate
insurance cover is taken out for these risks and
appropriate provisions recognized for the remaining
identifiable risks. The Company does not believe,
therefore, that these risks will have a sustained effect on
the economic position of the Group. However, as some
risks cannot be assessed or can only be assessed to a
limited extent, the possibility of loss or damage not being
covered by the insured amounts and provisions cannot be
ruled out.
After the two actions filed by the Verbraucherzentrale
für Kapitalanleger e.V. (VzfK – German Protection Agency for
Investors) with regard to the General Meetings on April 23,

234
2009 (action for avoidance) and April 22, 2010 (action for
avoidance and disclosure) had been dismissed by the
courts of first and second instance, the plaintiff lodged an
appeal with the Federal Supreme Court against denial of
leave to appeal in both cases. Both appeals were dismissed
in 2012. Additional details about these legal disputes can
be found on page 169 of this report.
ARFB Anlegerschutz UG (haftungsbeschränkt), Berlin,
brought an action against Porsche Automobil Holding SE,
Stuttgart, and Volkswagen AG for claims for damages
allegedly assigned to it in the amount of approximately
€1.8 billion. The plaintiff asserts that these claims are
based on alleged breaches by the defendants of legislation
to protect the capital markets in connection with Porsche’s
acquisition of Volkswagen shares in 2008. In 2011, investors
initiated conciliation proceedings for other alleged damages
– including claims against Volkswagen AG – that amount to
approximately €2.6 billion in total and also relate to
transactions at that time. Volkswagen rejected all claims at
the time and refused to participate in any conciliation
proceedings.
In fiscal years 2010/2011, antitrust authorities
launched investigations at truck manufacturers including
MAN and Scania. Such investigations normally take several
years. It is still too early to judge whether these
investigations pose any risk to MAN or Scania.
MAN has also launched an investigation into the extent
to which irregularities occurred in the course of the hand-
over of four-stroke marine diesel engines, and in particular
whether technically calculated fuel consumption figures
were externally manipulated. MAN has informed the
Munich Public Prosecution Office (I) about the ongoing
investigation and has handed the matter to the Augsburg
Public Prosecution Office. It is also still too early to judge the
outcome of this matter.
Suzuki Motor Corporation has filed an action against
Volkswagen AG at a London court of arbitration for
retransfer of the 19.9% interest held in Suzuki, and for
damages. Volkswagen considers the claims to be
unfounded and has itself filed counterclaims. The court of
arbitration is not expected to reach a decision until mid-
2013 at the earliest.
Strategies for hedging financial risks
In the course of our business activities, financial risks may
arise from changes in interest rates, exchange rates, raw
materials prices, or share and fund prices. Management of
financial and liquidity risks is the responsibility of the
central Group Treasury department, which minimizes
these risks using nonderivative and derivative financial
instruments. The Board of Management is informed of the
current risk situation at regular intervals.
We hedge interest rate risk, where appropriate in
combination with currency risk, and risks arising from
fluctuations in the value of financial instruments by means
of interest rate swaps, cross-currency swaps and other
interest rate contracts with matching amounts and
maturity dates. This also applies to financing arrange-
ments within the Volkswagen Group.
Foreign currency risk is reduced in particular through
natural hedging, i.e. by flexibly adapting our production
capacity at our locations around the world, establishing
new production facilities in the most important currency
regions and also procuring a large percentage of
components locally, currently for instance in India,
Russia, the USA, China and Mexico. We hedge the residual
foreign currency risk using hedging instruments. These
include currency forwards, currency options and cross-
currency swaps. We use these transactions to limit the
currency risk associated with forecasted cash flows from
operating activities and intragroup financing in currencies
other than the respective functional currency. The currency
forwards and currency options can have a term of up to six
years. We use them to hedge our principal foreign currency
risks associated with forecasted cash flows, mostly against
the euro and primarily in US dollars, sterling, Chinese
renminbi, Russian rubles, Swedish kronor, Mexican
pesos, Australian dollars and Korean won.
In purchasing raw materials, risks arise relating to the
availability of raw materials and price trends. We limit
these risks mainly by entering into forward transactions
and swaps. We have used appropriate contracts to hedge
some of our requirements for commodities such as alu-
minum, copper, lead, platinum, rhodium, palladium and
coal over a period of up to seven years. Similar transactions
have been entered into for the purpose of supplementing
and improving allocations of CO2 emission certificates.
We ensure that the Company remains solvent at all
times by holding sufficient liquidity reserves, through
confirmed credit lines and through our tried-and-tested
money market and capital market programs. We cover the
capital requirements of the growing financial services
business mainly through borrowings at matching maturities
raised in the national and international financial markets
as well as through customer deposits from the direct
banking business. Financing conditions in the reporting

235MANAGEMENT REPORT
Business Development Shares and Bonds Results of Operations, Financial Position and Net Assets Volkswagen AG (HGB) Value-Enhancing Factors Risk Report Report on Expected Developments
period were almost unchanged compared with 2011. For
this reason and thanks to the broadly diversified structure
of our refinancing sources, we were always able to raise
sufficient liquidity in the various markets.
Credit lines from banks are generally only ever used
within the Group to cover short-term working capital
requirements. Projects are financed by, among other
things, loans provided at favorable interest rates by
development banks such as the European Investment
Bank (EIB), the International Finance Corporation (IFC)
and the European Bank for Reconstruction and
Development (EBRD), or by national development banks
such as Kreditanstalt für Wiederaufbau (KfW) and Banco
Nacional de Desenvolvimento Econômico e Social (BNDES).
This extensive range of options means that the liquidity
risk to the Volkswagen Group is extremely low.
The notes on pages 324 to 332 explain our hedging
policy, the hedging rules and the default and liquidity risks,
and quantify the hedging transactions mentioned. Addition-
ally, we outline the market risk within the meaning of IFRS 7.
Risks arising from financial instruments
Channeling excess liquidity into investments gives rise to
counterparty risk. Partial or complete failure by a
counterparty to perform its obligation to pay interest and
repay principal would have a negative impact on the
Volkswagen Group’s earnings and liquidity. We counter
this risk through our counterparty risk management,
which we describe in more detail in the section entitled
“Principles and Goals of Financial Management” starting
on page 177. In addition to counterparty risk, the financial
instruments held for hedging purposes hedge balance
sheet risks, which we limit by applying hedge accounting.
By diversifying when we invest excess liquidity and by
entering into financial instruments for hedging purposes,
we ensure that the Volkswagen Group remains solvent at
all times, even in the event of a default by individual
counterparties.
Risks arising from trade receivables and from financial
services are explained in the notes from page 324.
Liquidity risks
A downgrade of the Company’s rating could adversely
affect the terms attached to the Volkswagen Group’s
borrowings. In the reporting period, the contribution in
full of Dr. Ing. h.c. F. Porsche AG to the Volkswagen Group
as of August 1, 2012, the increase in the equity interest in
MAN SE and the acquisition of sports motorcycle manu-
facturer Ducati Motor Holding S.p.A. resulted in a large
outflow of liquidity. However, the strong performance by
the Company’s operating business minimized the impact of
these transactions on its liquidity position, thus
maintaining Volkswagen’s financial stability and flexibility
overall: Standard & Poor’s (S&P) affirmed the Group’s
existing rating and raised its outlook to “positive”. Moody’s
Investor Service assigned the rating a positive outlook in
the previous year. Information on the ratings of Volks-
wagen AG, Volkswagen Financial Services AG and Volkswagen
Bank GmbH can be found on page 173 of this report.
In the reporting period, a mandatory convertible note
was issued in the amount of €2.5 billion in order to further
strengthen our liquidity and capital base with an eye
toward future global growth and the systematic
implementation of our Strategy 2018. This transaction
increased not only the Volkswagen Group’s net liquidity,
but also its equity.
Residual value risk in the financial services business
In the financial services business, we agree to buy back
selected vehicles at a residual value that is fixed at
inception of the contract. Residual values are set realistically
so that we are able to leverage market opportunities. We
evaluate the underlying lease contracts at regular intervals
and recognize any necessary provisions if we identify any
potential risks.
Management of the residual value risk is based on a
defined feedback loop ensuring the full assessment,
monitoring, management and communication of risks. This
process design ensures not only professional management
of residual risks but also that we systematically improve
and enhance our handling of residual value risks.

236
As part of our risk management, we use residual value
forecasts to regularly assess the appropriateness of the
provisions for risks and the potential for residual value risk.
In so doing, we compare the contractually agreed residual
values with the fair values obtainable. These are determined
utilizing data from external service providers and our own
marketing data. We do not take account of the upside in
residual market values when making provisions for risks.
More information on residual value risk and other risks
in the financial services business, such as counterparty,
market and liquidity risk, can be found in the 2012 annual
report of Volkswagen Financial Services AG.
Other factors
Going beyond the risks already outlined, there are other
factors that cannot be predicted and are therefore difficult
to control. Should these transpire, they could have an
adverse effect on the further development of the Volkswagen
Group. These factors include natural disasters, epidemics
and terror attacks.
SUMMARY OF THE RISK SITUATION OF THE GROU P
The Volkswagen Group’s overall risk situation results from
the specific risks shown above. We have put in place a
comprehensive risk management system to ensure that
these risks are controlled. Furthermore, taking into
account all the information known to us at present, no risks
exist which could pose a threat to the continued existence
of the Volkswagen Group.
REPORT ON POST-BALANCE SHEET DATE EVENTS
There were no significant events after the end of fiscal year
2012.

237
Business Development Shares and Bonds Results of Operations, Financial Position and Net Assets Volkswagen AG (HGB) Value-Enhancing Factors Risk Report Report on Expected Developments
MANAGEMENT REPORT
The Group’s key business risks are explained in detail in
the risk report on the previous pages. In this section we
describe the expected future development of the Volks-
wagen Group and the general framework for its business
activities. We take the resulting opportunities and potential
into account in the Group’s planning process on an ongoing
basis, allowing them to be exploited promptly.
Our forecasts are based on current estimates by third-
party institutions. These include economic research insti-
tutes, banks, multinational organizations and consulting
firms.
GLOBAL ECONOMIC DEVELOPMENT
Our plans assume that the global economy will continue
growing. Going forward, we expect that growth will remain
strongest in the emerging economies, and especially Asia
and Latin America, whereas we are forecasting only
moderate rates of expansion for the major industrialized
nations in the medium term.
Europe/Remaining markets
In view of the ongoing sovereign debt crisis, we are
expecting to see stagnation in Western Europe overall in
2013, and recessionary trends in Southern Europe. A rapid
recovery in 2014 will only be possible if substantial progress
is made in solving the crises in the eurozone. In Central
and Eastern European countries, on the other hand, we
believe that significantly faster growth is likely, though this
will be affected in no small measure by developments in
Western Europe.
In the case of the South African economy, we are
expecting a slight rise in growth rates in 2013 and 2014
compared with the reporting period.
Germany
Following the tailing off of the economy last year, we are
forecasting only slight growth in the German economy in
2013. The situation in the labor market will remain stable
for the time being. The German economy is likely to return
to a moderate growth trajectory starting in 2014. The pace
of growth will depend to a large extent on further develop-
ments in the eurozone.
North America
This year, growth in the USA, Canada and Mexico will be
roughly on a level with the prior year. Economic activity in
North America can be expected to continue to pick up in
2014 as the global economy recovers.
South America
In Brazil, we are anticipating significantly higher growth
rates in 2013 than in 2012. Argentina will also be able to
boost GDP, although inflation will remain high. Both
countries should see continued growth in 2014.
Asia-Pacific
We expect China’s growth rates in 2013 and 2014 to remain
at the robust level recorded in 2012. In India, we anticipate
that the pace of expansion will be faster than in 2012. In
Japan, the economic recovery that followed the natural
disasters in 2011 will slow.
Report on Expected Developments Slower growth expected in the automotive markets
Despite the economic uncertainty, the global economy and many automotive markets are expected to
continue growing in 2013 and 2014, with the emerging markets again playing a key role. The Volkswagen
Group intends to take advantage of the opportunities presented by this trend by building on the strength
of its brand diversity, pioneering technologies and strong market position.

238
DEVELOPMENT OF THE M ARKETS FOR PASSENGER CARS AN D
LIGHT COMMERCIAL VEHICLES
We expect developments in the markets for passenger cars
and light commercial vehicles in the individual regions to
be mixed in 2013; overall, growth in global demand for
new vehicles will probably be significantly slower than in
the reporting period. We expect market momentum to
increase in 2014 as against 2013.
The Volkswagen Group is well positioned to deal with
the mixed developments in the automotive markets. Our
broad product range featuring the latest generation of
consumption-optimized engines gives us a global compet-
itive advantage. We are pursuing the goal of offering all
customers the mobility and innovation they need, sustainably
strengthening our competitive position in the process.
Europe/Remaining markets
In Western Europe, we expect demand for automobiles to
decline in 2013. The ongoing debt crisis is unsettling
consumers in many countries in the region and restricting
their financial freedom to buy new cars. Particularly in
core markets such as Spain and Italy, large-scale govern-
ment austerity measures are also putting a damper on
demand. We expect the economic situation in Western
Europe to ease somewhat in 2014, which should lead to a
modest recovery in demand for new cars in many markets.
In Central and Eastern European markets, we expect
only a slight increase in demand for automobiles in 2013
as against the prior-year level, and a return to higher
growth rates in 2014. In Russia, it will fail to beat the high
level recorded in 2012 and the market will probably not
return to a growth trajectory until 2014.
After three years of high growth rates, the South African
vehicle market is likely to ease in 2013 and 2014.
Germany
Despite the stable economic environment, the widespread
consumer restraint in Western Europe also reached the
German market in the reporting period. We expect demand
to decline in 2013. Starting in 2014, there should be a
modest rise in demand for automobiles in Germany once
again, depending on further developments in the eurozone.
North America
In spite of a muted economic recovery, the US vehicle
market benefited from pent-up replacement demand in
2012, a trend we believe will endure in a weaker form in
2013. However, the continuing uncertainty as to fiscal
developments, the weak labor market and potential lending
restrictions could impact market growth in the short term.
We anticipate a sustained positive market trend in 2014.
We are also expecting to see a positive trend in the Canadian
and Mexican markets for passenger cars and light com-
mercial vehicles in 2013 and 2014.
South America
Owing to their dependence on demand for raw materials,
the South American markets are heavily dependent on the
global economic developments. Increasingly protectionist
tendencies are also adversely affecting the performance of
the region’s vehicle markets, especially in Brazil and
Argentina, which have imposed restrictions on vehicle
imports. In Brazil, the largest market in the region, demand
for vehicles soared in 2012 on the strength of tax breaks. It
will probably remain on a level with the previous year due
to the gradual reduction of these subsidies over the course
of 2013. The Argentinian market is expected to contract
further as a result of the macroeconomic situation. We
anticipate that the region’s automotive markets will start
growing again as from 2014. South America’s major
economies should benefit from the expected rebound of
the global economy.
Asia-Pacific
The markets in the Asia-Pacific region look set to continue
their growth in 2013, albeit at a slower pace. Increasing
demand for individual mobility will drive demand in China
in particular. However, indications that the economy is
losing traction could act as a brake on the demand for auto-
mobiles. In addition, restrictions on vehicle registrations
– such as have already been introduced in Beijing, for
example – could also be imposed in other metropolitan
areas in China in the future, dampening market growth
there. India is also likely to see positive volume growth,
depending on the general economic policy environment.
In Japan, backlog effects resulting from the natural disasters
and government incentives boosted the market to an excep-
tionally high level in the reporting period. We expect a
substantial decline in demand in 2013, a trend that will be
exacerbated by a weaker economy on the whole. For 2014
we assume that the Asian vehicle markets will continue
growing, especially China and the markets in the ASEAN
region.

239
Business Development Shares and Bonds Results of Operations, Financial Position and Net Assets Volkswagen AG (HGB) Value-Enhancing Factors Risk Report Report on Expected Developments
MANAGEMENT REPORT
DEVELOPMENT OF THE MARKETS FOR TRUCKS AND BUSES
Following the 8.9% decrease in demand for midsize and
heavy trucks in 2012, we expect total volumes in the markets
relevant to the Volkswagen Group to mirror the 2012 level
in 2013 and 2014.
Market growth in Western Europe is currently being
hard hit by the weaker economy. We therefore anticipate a
further decline in 2013 and a virtually flat market in 2014.
In 2013, the pace of growth in Russia is expected to
trail behind that of 2012, while in 2014 it should remain at
roughly the same level. Key factors in this development are
the multiyear fleet renewal program, which has saturated
demand for replacement purchases, and declining export
and transport volumes to the EU.
In the United States, we envisage greater demand for
trucks despite the uncertain business climate for 2013 and
2014.
The Brazilian market is expected to see increased
demand in 2013. This will continue in 2014, buoyed by state
subsidies and more favorable financing conditions for
trucks. The preparations for the upcoming major sporting
events and the associated infrastructure developments may
also boost the market.
China, the world’s largest truck market, is expected to
stabilize at 2012 levels in 2013 and 2014. The extent to which
the incentive programs planned by the Chinese govern-
ment will up demand for trucks remains to be seen.
We expect the Indian market to develop positively in
2013 and 2014.
Demand for buses will probably exceed 2012 levels in
almost all regions in 2013 and 2014. In Western Europe,
however, the bus market is expected to shrink slightly in
2013 due to the debt crisis. We expect to see a slight recovery
in the market again in 2014 with a return to 2012 levels. In
China, the world’s largest bus market, we are forecasting
an upswing.
DEVELOPMENT OF THE MARKETS FOR POWER ENGI NEERING
After recording an overall decline in the market in the Power
Engineering segment in 2012, we are predicting weak
market momentum for 2013 and 2014.
The merchant shipbuilding market is still dominated
by substantial overcapacity and is not expected to recover
in the next few years despite a further drop in ship deliv-
eries. The excess capacity is generating considerable price
pressure among shipyards and suppliers and leading to a
further drop in global shipbuilding capacity. The continued
growth in offshore and special ships is expected to help
ease the situation in the coming years as well. Likewise,
there will be continued demand for government vessels.
Growth in the power generation market will depend on
macroeconomic developments. The high growth rates
recorded in 2011 were not repeated in 2012. However, we
anticipate that the emerging markets will experience a slight
recovery in 2013 and 2014. The trend towards more
decentralized energy supplies, both here and in developed
countries, is also likely to have a positive long-term effect
on the business. The shift in power plants fueled by diesel
or heavy oil towards natural gas power plants will continue.
The processing industry should continue to see positive,
albeit slower growth in 2013 and 2014 in the emerging
economies, which will also be subject to increasing price
pressure. Due to the population growth in these countries,
however, there is also high long-term demand for primary
materials.
The market trends in the oil and gas industry is
encouraging. We are currently seeing heavy investment in
the exploitation of deep sea oil reserves, but also in the
production and sea transport of natural gas. Due to its low
price, natural gas will lead to new developments in, among
other things, energy infrastructure, transport, petrochem-
icals and production, especially in the USA. The trend of
using natural gas as an alternative to oil is generally having
a positive effect in all key regions. We anticipate further
growth in the oil and gas industry in 2013 and 2014.
The offshore wind market is not expected to pick up until
the technical and financial hurdles have been overcome.
DEVELOPMENT OF THE MARKETS FOR FI NANCIAL SERVICES
We expect automotive financial services to continue to grow
in importance worldwide in 2013 and 2014. We anticipate
that demand for financial services will increase more
strongly in those emerging markets in which market pene-
tration is currently low, such as China and Russia. In
regions with developed automotive finance markets, there
will be a further shift in the offering towards enabling
mobility at a manageable total cost, with services such as
insurance, innovative packages of services and new mobility
offerings like car sharing becoming increasingly important.

240
EXCHANGE RATE TRENDS
In fiscal year 2012, the global economy was dominated by
uncertainty, which also significantly affected market partici-
pants’ expectations. This in turn substantially impacted
exchange rates, leading to substantial volatility. The euro
gained against the US dollar in the first two months of
2012 before weakening again up to mid-year. It then
trended upwards again in the second half of the year. For
2013 and 2014, we expect euro exchange rates against the
US dollar, sterling, Chinese renminbi and other key cur-
rencies to be stable, despite continuing high volatility in
the financial markets. Event risk – defined as the risk arising
from unforeseen market developments – has increased,
however.
I NTEREST RATE TRENDS
Interest rates remained extremely low in fiscal 2012 due to
the ongoing expansionary monetary policy and the difficult
overall economic environment. Several countries actually
lowered their interest rates further in the course of the year.
In 2013, we consider it unlikely that either Europe or the
USA will adopt a more restrictive monetary policy, and hence
increase interest rates. We are predicting that short- and
long-term interest rates will only rise in 2014 if inflation
increases.
DEVELOPMENT OF COMMODITY PRICES
Commodity prices were highly volatile in 2012. After peaks
were recorded in the first and third quarters, prices tailed
off as the year drew to a close. The main reasons for this
were the downward revisions in growth estimates for
Europe and the US economy in particular, and their impact
on global development. Assuming that the global economy
continues to grow, we expect prices of most exchange-traded
raw materials to remain high, but to fluctuate considerably,
in 2013 and 2014. Prices for raw materials may also fall if
growth rates decline.
N EW MODELS I N 2013
The Volkswagen Group will continue its model initiative in
2013 and judiciously modernize and expand its offering by
introducing attractive new vehicles. Priority will always be
given to what customers want.
The Volkswagen Passenger Cars brand will continue to
renew its Golf product family in 2013. In addition to the
Golf estate and the exciting top-of-the-line models, the GTI
and GTD, we will be presenting the new, particularly fuel-
efficient Golf BlueMotion. The up! family will be enlarged
by adding the cross up! and the e-up!, the first vehicle
developed by the Volkswagen Group to run on electrical
power alone.
On the Chinese market, we will continue revamping our
range of compact saloons in 2013 by rolling out the new
Jetta.
The Audi brand will systematically continue its product
drive in the premium segment, offering the A3 saloon for
the first time in addition to the new A3 Sportback. These
models are specifically geared towards premium customers
in emerging markets who prefer saloons. Audi will also
introduce a large number of other exciting, sporty versions
in nearly all size classes. The flagship Audi A8 and the Audi
R8 products will be significantly enhanced.
ŠKODA plans to roll out the new versions of the Octavia
and Octavia estate, which are based on the Modular
Transverse Toolkit (MQB), in 2013. The Rapid series will be
expanded by adding a sporty, compact hatchback model.
The SEAT brand will unveil the sporty three-door version
of the new Leon and enter the stationwagon segment with
the Leon ST.
The Group’s new brand, Porsche, will also expand its
product range in 2013, revamping the 911, Cayman,
Cayenne and Panamera series. The Group will additionally
launch the Panamera S and the 918 Spyder, the first vehicles
with plug-in hybrid technology.
Bentley will upgrade its model range in 2013 as well.
Following the introduction of the Continental GT Speed
Convertible, the new Bentley Flying Spur will be launched
mid-year.
Lamborghini will bring out a roadster version of the
Aventador in 2013 to match the existing coupé.
MAN will deliver the new TG family with its Euro 6
engines, which was already showcased at the IAA Com-
mercial Vehicles 2012, to customers for the first time in
2013.
It is also planning to roll out a new six-cylinder gas engine
at the end of 2013. Powered by natural or special gas, this
can be deployed in all areas in which CHP is used, for
example in swimming pools, hospitals, and biogas and
sewage treatment plants.
As in previous years, we will continue to expand the
Volkswagen Group’s model range where appropriate in
2014, further strengthening our market position. We will
successively expand our portfolio of vehicles equipped with
electric drives.
PLAN NED PRODUCT MEASU RES
The Volkswagen Group’s goal is to offer consistently
efficient and carbon-optimized mobility, including options
based on alternative drive technologies, so as to live up to
its responsibilities with respect to sustainability. Given the
increasingly strict exhaust and emission standards and the
fact that vehicle taxation is CO2-dependent, vehicle CO2

241
Business Development Shares and Bonds Results of Operations, Financial Position and Net Assets Volkswagen AG (HGB) Value-Enhancing Factors Risk Report Report on Expected Developments
MANAGEMENT REPORT
emissions are playing a more and more important role in
vehicle purchases. Volkswagen is therefore continuing to
focus in depth on developing efficient drive technologies,
thus extending its position as an innovation leader in the
area of environmentally friendly mobility.
We shall continue to drive forward the issues of down-
sizing and zero emissions in our products in the coming
years. Downsizing increases material and energy efficiency
by reducing drivetrain sizes while retaining their original
performance. Volkswagen is expanding its e-mobility
operations – in the form of both plug-in hybrids and purely
electric drives – thanks to its in-depth research. Its current
and future projects are improving the Volkswagen Group’s
environmental footprint on an ongoing basis.
The Group’s many different concepts are proof of the
individual brands’ high level of development and diversi-
fication expertise. At the beginning of 2012, the Group
became the first manufacturer to implement fuel-saving
technology in series production of a charged four-cylinder
engine with its cylinder management concept for the 1.4 TSI.
The Volkswagen Passenger Cars brand has consolidated its
holistic ecological sustainability policy in its “Think Blue.”
concept. This not only combines innovative technology and
solutions such as the BlueMotion technologies, but also
offers recommendations for reducing emissions and con-
sumption, such as tips and training on how to save fuel.
Like the BlueMotion vehicles, highly efficient technologies
such as the BlueTDI and TSI EcoFuel drives (CNG) set
standards for consumption and CO2 emissions. They leverage
innovations such as hybrid/electric drives, start-stop
systems and brake energy recuperation. Other Group brands
such as ŠKODA’s GreenLine model range and SEAT’s
ECOMOTIVE models also make use of this technology. Audi
offers efficiency technologies as standard, and we are also
developing products such as the fully electronic e-tron
vehicles and the natural gas powered A3, which are based
on sustainable supply concepts.
STRATEGIC SALES FOCUS
The Volkswagen Group’s multibrand structure, comprising
largely independent brands that nevertheless achieve
maximum synergies, is one of its defining features. The
structures that have been put in place have been designed
for managing a multibrand organization. In the reporting
period we succeeded in increasing our global market
share, bringing us closer to our goal of being the global
market leader in 2018. Strict cost management will allow
us to continue driving forward our focus on profitability in
our sales activities.
We will further expand our multibrand structure in the
growth markets in particular so as to facilitate market
entry for other Group brands. We will also increase our
customer focus across all sales levels and in customer
service by continually enhancing employee qualifications
on the one hand, and by optimizing processes and systems
in view of changing customer demands and markets on the
other. The aim of our sales strategy remains the same – the
integrated marketing of vehicles, financial and other services,
as well as genuine parts and accessories.
MARKET OPPORTU NITIES
The Volkswagen Group sees the greatest growth potential
– above and beyond the established markets in China and
Brazil – in India, Russia and the USA, as well as in the ASEAN
and Middle East regions. We are also examining the market
opportunities in particularly price-sensitive segments, which
in terms of volume are particularly relevant in China and
India, but also in other markets around the world.
China
In spite of a slowdown in the economy, the Chinese
passenger car market continued to pick up speed in 2012.
We are expecting a higher market volume in 2013 than in
the prior year. In 2014, the vehicle market is expected to
continue growing, driven by overall economic develop-
ment, although growth will probably shift from the large
cities on the coast to the country’s interior. To be able to
leverage the considerable opportunities offered by this
market and retain our market lead in China for the long
term, we are continuously expanding our product range to
include models that have been specially developed for this
market. We are also further expanding production
capacity.
Brazil
Towards the end of 2011, the Brazilian government
significantly raised sales tax (IPI) on imported vehicles to
protect local industry and create additional incentives for
investments in the automotive sector. As a result, demand
for imported vehicles plummeted at the beginning of 2012.
High inflation, a slow-down in lending and declining
consumer confidence also impacted the passenger car
market in the first half of 2012. To support its strategically
important automotive industry, the government reduced
sales tax (IPI) on locally produced passenger cars, which gave
a major boost to the market. Demand recovered percep-
tibly in the second half of the reporting period, pushing up
the market volume to 2.9 million vehicles at year-end, a

242
significant increase year-on-year. Brazil remains a strate-
gically important passenger car market for the Volkswagen
Group and offers substantial potential going forward, too.
We shall continue to leverage these growth opportunities
in the future and to expand our market position with models
that we have developed specially for this market and that
we produce locally.
India
Volkswagen Group deliveries in India again increased in
fiscal 2012 despite difficult conditions. High inflation and
high fuel prices in particular impacted demand. We are
forecasting that demand in the Indian market will continue
to grow in the coming years. Going forward, we will
significantly expand our local dealer network and invest in
training for sales and service staff as well as in genuine
parts logistics so as to further boost our growth in India.
Russia
The financial and economic crisis hit the Russian auto-
motive market particularly hard. The rapid recovery in
demand for vehicles in 2010 and especially in 2011 is due
to the broad-based stabilization of the Russian economy.
In the reporting period, the market initially benefited from
comprehensive government investment programs and the
positive trend on the labor market. Demand remained
robust thereafter, although some momentum was lost as
the year went on. Despite the more difficult environment,
the Volkswagen Group saw a clear rise in its market share
to 11.1%, with demand for cars climbing to 2.7 million
vehicles. In the future, we expect that Russia will grow to
become one of the largest automotive markets in the
world. We are leveraging these growth opportunities in
Russia with our plant in Kaluga, 160 km southwest of
Moscow, and our contract manufacturing agreement with
GAZ, a local manufacturer. GAZ has been manufacturing
the ŠKODA Yeti on a full production basis since November
2012. The Jetta and the ŠKODA Octavia will also start full
production in the first half of 2013. In this way, we are
continuing to expand our local production capacity so as to
satisfy rising demand for our models in the Russian market.
USA
In 2012, the automotive market in the USA continued to
recover from the slump in vehicle sales following the
financial and economic crisis. The market for passenger
cars and light commercial vehicles amounted to 14.5
million vehicles in 2012; this corresponds to an increase
of 13.4% compared with the prior-year figure. The US
vehicle market is expected to grow further in the coming
years. We are continuing to systematically pursue our goal
of developing from a niche provider into a volume supplier
in the USA. The successful launch in 2010 and 2011 of the
Passat and Jetta models that were designed specially for
this market, as well as the construction of our manufac-
turing facility in Chattanooga, Tennessee, were initial key
milestones in our strategy for the long-term penetration of
the US dollar area. These measures allowed us to benefit
more than average from the growth of the US vehicle market
and increase our market share to 4.1% (2011: 3.5%). We
shall continue to develop and manufacture important
products for the US market locally over the coming years.
This will allow us to strengthen our market position and
minimize sales risks resulting from exchange rate volatility.
ASEAN
The Volkswagen Group is pursuing its goal of establishing a
long-term presence in the ASEAN economic area, whose
automotive markets offer substantial growth opportunities
in the aggregate. However, the individual markets in the
region are extremely mixed: demand in Thailand, for
example, is mainly for pickup models, whereas in Malaysia
and Indonesia demand is strongest for multi-purpose
vehicles (MPVs), hatchbacks and notchbacks. High import
duties, local taxes and extreme price sensitivity in the
region require us to assemble our vehicles locally so as to
be able to strengthen our position in these markets by
offering competitive prices. Since October 2011, the
Passat has been assembled at the facility operated by our
Malaysian partner, DRB-HICOM. Production of the Polo
hatchback and notchback and the Jetta on a CKD basis will
also begin there in 2013. The Volkswagen Group Malaysia
is investing in its wholesale organization and rapidly
expanding its dealer network so to strengthen its sales
structure. In Indonesia, we are reviewing whether to
include other models in the manufacturing program there.
We are also investigating and evaluating opportunities for
assembling vehicles locally in other countries in the region
to further strengthen our market position in the region.
Independent of this, we are working hard to improve local
sales structures.
Middle East
Despite the economic and political instability in the Middle
East region, the market as a whole offers growth opportu-
nities. We are leveraging this potential for sustainable
growth even without our own production facilities by
offering a range of vehicles that has been specifically
tailored to this market. Optimized sales channels will also
help to permanently increase our market share.

243
Business Development Shares and Bonds Results of Operations, Financial Position and Net Assets Volkswagen AG (HGB) Value-Enhancing Factors Risk Report Report on Expected Developments
MANAGEMENT REPORT
I NVESTMENT AND FI NANCIAL PLAN N ING 2013 TO 2015 IN TH E AUTOMOTIVE DIVISION
€ bi l l ion
Cash flows from operating activities 61.4
Cash flows from investing activities attributable to operating activities 50.2
Investments in property, plant and equipment 39.2
Surplus 11.3
Development costs 10.6
0 10 20 30 40 50 60
Net cash flow
Other 0.4
70
Gross cash flow 62.3 Change in working capital – 0.9
I NVESTMENT PLAN N ING
Based on our current planning, we shall invest a total of
€50.2 billion in the Automotive Division in the period from
2013 to 2015. Investments in property, plant and equipment
will account for €39.2 billion, more than half of which (60%)
will be in Germany alone. The ratio of capital expenditure
to sales revenue in the period from 2013 to 2015 will be at
a competitive level of 6–7%. Besides investments in
property, plant and equipment, investing activities will
include additions of €10.6 billion to capitalized develop-
ment costs. Volkswagen is laying the foundations for
profitable, sustainable growth by investing in new facilities
and models, as well as by developing alternative drives and
modular toolkits.
At €24.7 billion (roughly 63%), we will spend the lion’s
share of the total amount to be invested in property, plant
and equipment in the Automotive Division on modernizing
and extending the product range for our brands. The main
focus will be on new vehicles, derivatives and successor
models in almost all vehicle classes, which will be based on
the modular toolkit technology and related components.
This will allow the Volkswagen Group to systematically
continue its model rollout with a view to tapping new
markets and segments. In the area of drivetrain produc-
tion, we will launch new generations of engines offering
improved performance and lower fuel consumption and
emission levels. In particular, we will continue to press
ahead with the development of hybrid and electric motors.
In addition, Volkswagen will make cross-product
investments of €14.5 billion over the next three years. This
includes investments to expand capacity, such as a new
vehicle production facility for Audi in Mexico, expanding
Porsche’s Leipzig plant so that it can produce the new SUV
model, the Macan, and increasing production capacity for
automatic gearboxes. Other investment focuses include
modifications to the press shops, paintshops and assembly
facilities as a result of our high quality targets and the
continuous improvement of our production processes.
Non-production-related investments are mainly planned
for the areas of development, quality assurance, sales,
genuine parts supply and information technology.
Our objective is to finance our investments in the
Automotive Division using internally generated funds. We
expect cash flows from operating activities to amount to
€61.4 billion over the 2013 to 2015 planning period. This
means that the funds generated are expected to exceed the
Automotive Division’s investment requirements by €11.3
billion, further improving our liquidity position. We expect
net cash flow in the Automotive Division to develop
positively in 2013 and 2014.
The plans are based on the Volkswagen Group’s
current structures and already take into account Porsche’s
automotive business, but not the possible settlement
payable to other shareholders associated with the planned
control and profit and loss transfer agreement with MAN
SE. The joint ventures in China are not consolidated and
are therefore also not included in the above figures. These
companies will invest a total of €9.8 billion in new
production facilities and products in the period from 2013
to 2015. These investments will be financed from the joint
ventures’ own funds.
We are planning to invest €1.3 billion in the Financial
Services Division between 2013 and 2015. We expect the
rise in leasing and rental assets and in receivables from
leasing, customer and dealer financing to lead to funds
tied up in working capital of €45.3 billion. Roughly 34% of
the total capital requirements of €46.5 billion will be
financed from gross cash flow. As is common in the sector,
the remaining funds needed will be met primarily through
established money and capital market debt issuance
programs and customer deposits from the direct banking
business.

244
TARGETS FOR VALUE-BASED MANAGEMENT
Based on long-term interest rates derived from the capital
market and the target capital structure (fair value of equity
to debt = 2:1), the minimum required rate of return on
invested capital defined for the Automotive Division
remains unchanged at 9%. We again clearly exceeded the
minimum required rate of return in the reporting period,
at 16.6% (see also pages 183 and 187). An increase in
invested capital as a result of the largest volume of invest-
ments in the Group’s history will have a dampening effect
on future returns. Nevertheless, we expect that our return
will continue to be in excess of the minimum required rate
of return. Under our Strategy 2018, our medium-term goal
is a sustained return on investment of more than 16% in
the Automotive Division, which is significantly above the
minimum required rate of return.
FUTU RE LEGAL STRUCTU RE OF THE GROU P
The Volkswagen Group increased its share of voting rights
in MAN SE to 75.03%, strengthening the alliance between
MAN, Scania and Volkswagen Commercial Vehicles in the
reporting period. Volkswagen is aiming for closer
cooperation between Group companies in the commercial
vehicles segment and is keeping all options open going
forward on the future structure of the commercial vehicles
business. In this context, Volkswagen announced on
January 9, 2013 that it was seeking to enter into a control
and profit and loss transfer agreement with MAN SE. The
aim is to facilitate enhanced and simplified cooperation
between Volkswagen and MAN and make the two
companies more competitive. MAN will continue its
business activities under a control and profit and loss
transfer agreement, retaining its brand-specific features
and business fields
STRATEGY 2018
Our Strategy 2018 focuses on positioning the Volkswagen
Group as a global economic and environmental leader
among automobile manufacturers. We have defined four
goals that are intended to make Volkswagen the most
profitable, fascinating and sustainable automaker in the
world by 2018:
> Volkswagen intends to deploy intelligent innovations and
technologies to become a world leader in customer
satisfaction and quality.
> The goal is to increase unit sales to more than 10 million
vehicles a year; in particular, Volkswagen intends to
capture an above-average share of growth in the major
growth markets.
> Volkswagen’s aim is a long-term return on sales before
tax of at least 8% so as to ensure that the Group’s solid
financial position and ability to act are guaranteed even
in difficult market periods.
> Volkswagen aims to become the top employer across all
brands, in all companies and regions; this is necessary in
order to build a first-class team.
We are focusing in particular on the environmentally
friendly orientation and profitability of our vehicle projects
so that the Volkswagen Group has the right products for
success even in more challenging economic conditions. At
the same time, this will mean that capital expenditure
remains at manageable levels. Our attractive and environ-
mentally friendly range of vehicles, which we are steadily
and judiciously expanding, and the excellent position
enjoyed by our individual brands in the markets
worldwide, are key factors allowing us to leverage the
Group’s strengths and to systematically increase our
competitive advantages. Our activities are primarily
oriented on setting new ecological standards in the areas
of vehicles, drivetrains and lightweight construction. Our
modular toolkit system, which we are enhancing on an
ongoing basis, allows us to constantly improve production
efficiency and flexibility, thus increasing the Group’s
profitability.
In addition, we want to expand the Volkswagen Group’s
customer base by acquiring new, satisfied customers
around the world. Equally, we aim to increase satisfaction
among our existing customers. We shall continue the
measures we are currently taking to improve our productivity
and quality regardless of the economic situation and
without any time limit. Key elements include standardizing
processes in both the direct and indirect areas of the
Group and reducing throughput times in production.
Together with disciplined cost and investment manage-
ment, these efforts play a major role in ensuring that we
reach our long-term profitability targets and safeguard
solid long-term liquidity.

245MANAGEMENT REPORT
Business Development Shares and Bonds Results of Operations, Financial Position and Net Assets Volkswagen AG (HGB) Value-Enhancing Factors Risk Report Report on Expected Developments
SUMMARY OF EXPECTED DEVELOPMENTS IN 2013 AN D 2014
The Volkswagen Group’s Board of Management expects
competition in the international automotive markets to
increase further in the coming years. The markets in which
the Group’s brands operate are becoming increasingly
challenging, particularly in Western Europe. The develop-
ment of the automotive sector remains dependent on
global economic developments, which continue to be
shrouded in considerable uncertainty. The financial
markets still entail risks resulting above all from the strained
debt situation of many countries.
The global markets for passenger cars and light com-
mercial vehicles are facing a difficult year in 2013 with
forecasts of merely slight growth. We expect demand to rise
more strongly again in 2014. The strongest growth in 2013
is likely to be in the Asia-Pacific region and in the USA,
whereas in Western Europe in particular the market
volume is expected to decline. We anticipate that demand
will probably rise again in all regions in 2014. The Volks-
wagen Group has a large share of many important markets
around the world. We are strengthening this position
further by expanding production capacities and building
more local production facilities that will, in some cases,
produce vehicles developed specifically for the countries
concerned.
Following the substantial dip in demand for trucks and
buses in the reporting period, we expect the total volume in
2013 and 2014 in the markets that are relevant for the
Volkswagen Group to remain at the same level as in 2012.
We believe that automotive financial services will
continue to grow in importance over the coming years.
The Volkswagen Group’s unique brand portfolio cover-
ing almost all segments from motorcycles through sub-
compact cars to heavy trucks and buses, its steadily growing
presence in all major markets in the world and its wide
range of financial services give us decisive competitive
advantages. We offer an extensive range of environ-
mentally friendly, cutting-edge, high-quality vehicles for
all markets and customer groups that is unparalleled in the
industry. We therefore estimate that our deliveries in 2013
and 2014 will exceed the prior-year figure in each case.
Our Chinese joint ventures, as well as the new production
facilities in China, Russia, the USA and India, will make a
significant contribution to this development.
Challenges will come from the difficult market environ-
ment and increasingly fierce competition as well as interest
rate and exchange rate volatility and considerable fluctu-
ations in raw materials prices.
We expect sales revenue in the Automotive and Financial
Services Divisions to increase in 2013 and 2014 as against
2012. Our goal for the Volkswagen Group’s operating
profit is to match the 2012 figure in 2013, and to exceed it
in 2014. We believe that this will be the case for the
Passenger Cars Business Area and the Commercial
Vehicles, Power Engineering Business Area – which
remains affected by high write-downs relating to purchase
price allocation, among other things – and the Financial
Services Division. Starting in 2013, we will report the
Volkswagen Commercial Vehicles brand as part of the
Commercial Vehicles, Power Engineering Business Area,
in line with the management structure created.
We aim to achieve a sustainable return on sales before
tax at Group level of at least 8%. The average ratio of capital
expenditure to sales revenue in the Automotive Division
will fluctuate around a competitive level of 6–7%. Our goal
is also to maintain our positive rating compared with the
industry as a whole and to continue our solid liquidity
policy.
The decisive advantages that the Volkswagen Group can
exploit to master the challenges of the automotive future and
to achieve its Strategy 2018 targets are its unique brand
portfolio, its young, innovative and environmentally friendly
model range, its broad international presence with local
value added in many key regions, the significant synergy
potential offered by the Group-wide development of tech-
nologies and models, and finally its financial strength. We
are working to make even more focused use of the strengths
of our multibrand group by constructing new plants, devel-
oping technologies and platforms, and agreeing strategic
partnerships. Disciplined cost and investment manage-
ment remains an integral part of our Strategy 2018.

246
PROSPECTS FOR 2013
In 2012, the global economy grew at a slower pace than in
the prior year. We expect global growth to continue in 2013
in spite of the economic uncertainty. The industrialized
nations will probably record only low rates of expansion. In
Southern Europe, we anticipate that the recessionary trend
will continue for the time being. The emerging markets in
Asia and Latin America will see the greatest momentum.
Global demand for passenger cars and light com-
mercial vehicles in 2013 looks set to rise more slowly than
in the reporting period. We are forecasting that the overall
downturn in the Western European market will continue,
with the German market also remaining below its 2012
level. The pace of growth in Central and Eastern Europe
will decrease. The markets in the Asia-Pacific region that
are strategically important for the Volkswagen Group are
again expected to record higher-than-average growth rates
in 2013. While we expect to see encouraging development
in the North American market, demand in South America
will stagnate.
We anticipate that in 2013 the overall volume of trucks
and buses in the markets that are relevant for the Volks-
wagen Group will remain at the same level as in 2012.
Demand for mobility-related financial services is likely
to rise further in 2013.
The Volkswagen Group’s unique brand portfolio
covering almost all segments from motorcycles through
subcompact cars to heavy trucks and buses, its steadily
growing presence in all major markets in the world and its
wide range of financial services give us decisive competitive
advantages. We offer an extensive range of environmentally
friendly, cutting-edge, high-quality vehicles for all markets
and customer groups that is unparalleled in the industry.
In 2013, the Volkswagen Group’s brands will launch a
large number of fascinating new models and so help further
expand our strong position in the global markets.
We expect that the Volkswagen Group will outperform
the market as a whole in a challenging environment and
that deliveries to customers will increase year-on-year.
However, we are not completely immune to the intense
competition and the impact this has on business. The
modular toolkit system, which is being continuously
expanded, will have an increasingly positive effect on the
Group’s cost structure.
We expect the Volkswagen Group’s 2013 sales revenue
to exceed the prior-year figure. Given the ongoing uncer-
tainty in the economic environment, the Group’s goal for
operating profit is to match the prior-year level in 2013.
This applies equally to the Passenger Cars Business Area,
the Commercial Vehicles, Power Engineering Business
Area – which remains affected by high write-downs relating
to purchase price allocation, among other things – and the
Financial Services Division. While we shall see positive
effects from our attractive model range and strong market
position, there will also be increasingly stiff competition in
a challenging market environment. Disciplined cost and
investment management and the continuous optimization
of our processes remain an integral part of our Strategy
2018.
Wolfsburg, February 12, 2013
The Board of Management
This report contains forward-looking statements on the business development of
the Volkswagen Group. These statements are based on assumptions relating to
the development of the economic and legal environment in individual countries
and economic regions, and in particular for the automotive industry, which we
have made on the basis of the information available to us and which we consider
to be realistic at the time of going to press. The estimates given entail a degree of
risk, and the actual developments may differ from those forecast. Consequently,
any unexpected fall in demand or economic stagnation in our key sales markets,
such as Western Europe (and especially Germany) or in the USA, Brazil, China, or
Russia will have a corresponding impact on the development of our business. The
same applies in the event of a significant shift in current exchange rates, mostly
against the euro and primarily in US dollars, sterling, Chinese renminbi, Russian
rubles, Swedish kronor, Mexican pesos, Australian dollars and Korean won. In
addition, expected business developments may vary if this report’s assessments
of value-enhancing factors and risks develop in a way other than we are currently
expecting.

fin
an
cia
l s
tat
em
en
ts
Consolidated Financial Statements
Vo l k swag e n g ro u p o pe r at i n g pro f i t (in € billion)
11.5
The Volkswagen Group’s operating profit in fiscal year 2012 amounted to €11.5 bil lion – above the record figure for the previous year. Since August 1, 2012, Porsche AG has been consolidated in the Volkswagen Group.
2011
11.3
2012
7.1
2010

co n s o li date d f i n a n ci a l statem e nt s
250 Income Statement
251 Statement of Comprehensive Income
253 Balance Sheet
254 Statement of Changes in Equity
256 Cash Flow Statement
257 Notes
257 Basis of presentation
257 Effects of new and amended IFRSs
257 New and amended IFRSs not applied
259 Basis of consolidation
268 Consolidation methods
269 Currency translation
270 Accounting policies
281 Segment reporting
285 Income Statement Disclosures
285 1 | Sales revenue
285 2 | Cost of sales
285 3 | Distribution expenses
286 4 | Administrative expenses
286 5 | Other operating income
286 6 | Other operating expenses
287 7 | Share of profits and losses of equity-accounted investments
287 8 | Finance costs
288 9 | Other financial result
288 10 | Income tax income/expense
292 11 | Earnings per share
293 Disclosures in Accordance with IAS 23 (Borrowing Costs)
293 Disclosures in Accordance with IFRS 7 (Financial Instruments)
295 Balance Sheet Disclosures
295 12 | Intangible assets
297 13 | Property, plant and equipment
299 14 | Leasing and rental assets and investment property
301 15 | Equity-accounted investments and other equity investments
303 16 | Noncurrent and current financial services receivables
304 17 | Noncurrent and current other financial assets
305 18 | Noncurrent and current other receivables
306 19 | Tax assets
306 20 | Inventories

306 21 | Trade receivables
307 22 | Marketable securities
307 23 | Cash, cash equivalents and time deposits
308 24 | Equity
309 25 | Noncurrent and current financial liabilities
310 26 | Noncurrent and current other financial liabilities
311 27 | Noncurrent and current other liabilities
311 28 | Tax liabilities
312 29 | Provisions for pensions and other post-employment benefits
315 30 | Noncurrent and current other provisions
316 31 | Trade payables
316 Disclosures in Accordance with IFRS 7 (Financial Instruments)
323 Other Disclosures
323 32 | Cash flow statement
324 33 | Financial risk management and financial instruments
333 34 | Capital management
333 35 | Contingent liabilities
334 36 | Litigation
335 37 | Other financial obligations
336 38 | Total audit fees of the Group auditors
336 39 | Total expense for the period
336 40 | Average number of employees during the year
336 41 | Events after the balance sheet date
337 42 | Related party disclosures in accordance with IAS 24
342 43 | Notices and disclosure of changes regarding the
ownership of voting rights in Volkswagen AG
in accordance with the Wertpapierhandels-
gesetz (WpHG – German Securities Trading Act)
349 44 | German Corporate Governance Code
350 45 | Remuneration of the Board of Management and the Supervisory Board
351 Responsibility Statement
352 Auditors’ Report

250
of the Volkswagen Group for the Period January 1 to December 31, 2012 € million Note 2012 2011
Sales revenue 1 192,676 159,337
Cost of sales 2 –157,518 –131,371
Gross profit 35,158 27,965
Distribution expenses 3 –18,850 –14,582
Administrative expenses 4 –6,223 –4,384
Other operating income 5 10,496 9,727
Other operating expenses 6 –9,070 –7,456
Operating profit 11,510 11,271
Share of profits and losses of equity-accounted investments 7 13,568 2,174
Finance costs 8 –2,552 –2,047
Other financial result 9 2,967 7,528
Financial result 13,982 7,655
Profit before tax 25,492 18,926
Income tax income/expense 10 –3,608 –3,126
current –4,196 –4,351
deferred 588 1,225
Profit after tax 21,884 15,799
Noncontrolling interests 168 391
Profit attributable to shareholders of Volkswagen AG 21,717 15,409
Basic earnings per ordinary share in € 11 46.42 33.10
Diluted earnings per ordinary share in € 11 46.42 33.10
Basic earnings per preferred share in € 11 46.48 33.16
Diluted earnings per preferred share in € 11 46.48 33.16
Income Statement

251
Income Statement Statement of Comprehensive Income Balance Sheet Statement of Changes in Equity Cash Flow Statement Notes Responsibility Statement Auditors’ Report
CONSOLI DATED FI NANCIAL STATEMENTS
Changes in Comprehensive Income for the Period January 1 to December 31, 2011
€ million Total VW AG
shareholders
Non-controlling
interests
Profit after tax 15,799 15,409 391
Actuarial gains/losses
Actuarial gains/losses, before tax –1,005 –926 –79
Deferred taxes relating to actuarial gains/losses 282 261 21
Actuarial gains/losses, net of tax –722 –665 –57
Exchange differences on translating foreign operations
Unrealized currency translation gains/losses –189 –168 –22
Transferred to profit or loss – – –
Exchange differences on translating foreign operations, before tax –189 –168 –22
Deferred taxes relating to exchange differences on translating foreign operations 1 1 –
Exchange differences on translating foreign operations, net of tax –189 –167 –22
Cash flow hedges
Fair value changes recognized in other comprehensive income –2,013 –2,006 –8
Transferred to profit or loss –65 –65 –
Cash flow hedges, before tax –2,079 –2,071 –8
Deferred taxes relating to cash flow hedges 577 573 4
Cash flow hedges, net of tax –1,502 –1,498 –4
Available-for-sale financial assets
Fair value changes recognized in other comprehensive income 127 127 –
Transferred to profit or loss 83 83 –
Available-for-sale financial assets, before tax 211 211 –
Deferred taxes relating to available-for-sale financial assets –10 –10 –
Available-for-sale financial assets, net of tax 200 200 –
Share of other comprehensive income of
equity-accounted investments, net of tax* –391 –393 2
Other comprehensive income, before tax –3,453 –3,347 –106
Deferred taxes relating to other comprehensive income 850 825 25
Other comprehensive income, net of tax –2,603 –2,522 –81
Total comprehensive income 13,196 12,886 310
* Including income and expenses transferred to profit or loss due to the change in the accounting for MAN SE (€48 million) and the
Suzuki Motor Corporation (€430 million).
Statement of Comprehensive Income

252
Changes in Comprehensive Income for the Period January 1 to December 31, 2012
€ million Total VW AG
shareholders
Non-controlling
interests
Profit after tax 21,884 21,717 168
Actuarial gains/losses
Actuarial gains/losses, before tax –5,589 –5,480 –109
Deferred taxes relating to actuarial gains/losses 1,632 1,603 29
Actuarial gains/losses, net of tax –3,957 –3,877 –81
Exchange differences on translating foreign operations
Unrealized currency translation gains/losses –212 –207 –5
Transferred to profit or loss – – –
Exchange differences on translating foreign operations, before tax –212 –207 –5
Deferred taxes relating to exchange differences on translating foreign operations 0 0 –
Exchange differences on translating foreign operations, net of tax –212 –207 –5
Cash flow hedges
Fair value changes recognized in other comprehensive income 1,570 1,565 5
Transferred to profit or loss 951 951 –
Cash flow hedges, before tax 2,521 2,516 5
Deferred taxes relating to cash flow hedges –719 –719 0
Cash flow hedges, net of tax 1,802 1,797 5
Available-for-sale financial assets
Fair value changes recognized in other comprehensive income 493 493 –
Transferred to profit or loss –32 –32 –
Available-for-sale financial assets, before tax 461 461 –
Deferred taxes relating to available-for-sale financial assets –13 –13 –
Available-for-sale financial assets, net of tax 448 448 –
Share of other comprehensive income of
equity-accounted investments, net of tax* 78 79 –1
Other comprehensive income, before tax –2,742 –2,631 –110
Deferred taxes relating to other comprehensive income 900 871 29
Other comprehensive income, net of tax –1,842 –1,760 –81
Total comprehensive income 20,042 19,956 86
* Including expenses of €–316 million transferred to profit or loss due to the change in the accounting for Porsche Holding Stuttgart.

253
Income Statement Statement of Comprehensive Income Balance Sheet Statement of Changes in Equity Cash Flow Statement Notes Responsibility Statement Auditors’ Report
CONSOLI DATED FI NANCIAL STATEMENTS
of the Volkswagen Group as of December 31, 2012 € million Note Dec. 31, 2012 Dec. 31, 2011
Assets
Noncurrent assets
Intangible assets* 12 59,158 22,176
Property, plant and equipment* 13 39,424 31,876
Leasing and rental assets 14 20,034 16,626
Investment property 14 433 340
Equity-accounted investments 15 7,309 10,249
Other equity investments 15 3,870 3,049
Financial services receivables 16 49,785 42,450
Other financial assets 17 6,431 12,823
Other receivables 18 1,671 1,582
Noncurrent tax receivables 19 552 627
Deferred tax assets 19 7,915 6,333
196,582 148,129
Current assets
Inventories 20 28,674 27,551
Trade receivables 21 10,099 10,479
Financial services receivables 16 36,911 33,754
Other financial assets 17 5,872 4,253
Other receivables 18 4,823 4,543
Current tax receivables 19 761 623
Marketable securities 22 7,433 6,146
Cash, cash equivalents and time deposits 23 18,488 18,291
113,061 105,640
Total assets* 309,644 253,769
Equity and Liabilities
Equity 24
Subscribed capital 1,191 1,191
Capital reserves 11,509 9,329
Accumulated comprehensive income 64,815 47,019
Equity attributable to shareholders of Volkswagen AG 77,515 57,539
Noncontrolling interests 4,310 5,815
81,825 63,354
Noncurrent liabilities
Noncurrent financial liabilities* 25 63,603 44,442
Other noncurrent financial liabilities 26 2,397 2,547
Other noncurrent liabilities 27 4,675 4,394
Deferred tax liabilities* 28 9,050 4,055
Provisions for pensions 29 23,969 16,787
Provisions for taxes 28 4,239 3,721
Other noncurrent provisions* 30 14,373 13,235
122,306 89,179
Current liabilities
Current financial liabilities 25 54,060 49,090
Trade payables 31 17,268 16,325
Current tax payables 28 238 844
Other current financial liabilities 26 4,425 4,888
Other current liabilities* 27 11,111 11,196
Provisions for taxes 28 1,721 2,888
Other current provisions* 30 16,689 16,005
105,513 101,237
Total equity and liabilities* 309,644 253,769
* Prior-period figures adjusted because of the updated purchase price allocation in conjunction with the acquisition of MAN.
Balance Sheet

254
of the Volkswagen Group for the Period January 1 to December 31, 2012
A C C U M U L AT E D C O M P R E H E N S I V E I N C O M E
€ million
Subscribedcapital Capital reserves
Retained earnings
Currencytranslation
reserve
Balance at Jan. 1, 2011 1,191 9,326 37,684 –165
Profit after tax – – 15,409 –
Other comprehensive income, net of tax – – – –167
Total comprehensive income – – 15,409 –167
Capital increase 0 3 – –
Dividend payment – – –1,034 –
Capital transactions involving a change in ownership
interest – – –286 –
Other changes – – –9 –
Balance at Dec. 31, 2011 1,191 9,329 51,764 –332
Balance at Jan. 1, 2012 1,191 9,329 51,764 –332
Profit after tax – – 21,717 –
Other comprehensive income, net of tax – – – –207
Total comprehensive income – – 21,717 –207
Capital increase1 0 2,180 – –
Dividend payment – – –1,406 –
Capital transactions involving a change in ownership
interest2 – – –762 –
Other changes3 – – –141 –
Balance at Dec. 31, 2012 1,191 11,509 71,172 –539
1 Volkswagen AG recorded an inflow of cash funds amounting to €2,500 million, less transaction costs of €54 million, from the mandatory
convertible note placed in the fiscal year. A total of €2,048 million of this amount is required to be classified as equity instruments granted.
Additionally, there are noncash effects from the deferral of taxes amounting to €133 million. The residual amount is classified as debt.
2 The capital transactions involving a change in ownership interest are attributable primarily to the increase in the equity interest in MAN SE.
3 The other changes relate primarily to the reclassification of components of OCI in conjunction with the consolidation of Porsche Holding
Stuttgart (previous year: MAN SE) as well as to changes in the basis of consolidation.
Explanatory notes on equity are presented in note 24.
Statement of Changes in Equity

255
Income Statement Statement of Comprehensive Income Balance Sheet Statement of Changes in Equity Cash Flow Statement Notes Responsibility Statement Auditors’ Report
CONSOLI DATED FI NANC IAL STATEMENTS
Reserve for
actuarial gains/losses
Cash flow hedges
Available-for-sale financial assets
Equity-accounted
investments
Equityattributable to
shareholders ofVW AG
Noncontrolling interests Total equity
–2,201 61 –25 107 45,978 2,734 48,712
– – – – 15,409 391 15,799
–665 –1,498 200 –393 –2,522 –81 –2,603
–665 –1,498 200 –393 12,886 310 13,196
– – – – 3 – 3
– – – – –1,034 –232 –1,266
– – – – –286 –749 –1,035
– – – – –9 3,752 3,743
–2,866 –1,437 176 –286 57,539 5,815 63,354
–2,866 –1,437 176 –286 57,539 5,815 63,354
– – – – 21,717 168 21,884
–3,877 1,797 448 79 –1,760 –81 –1,842
–3,877 1,797 448 79 19,956 86 20,042
– – – – 2,180 – 2,180
– – – – –1,406 –267 –1,673
– – – – –762 –1,339 –2,101
0 – – 148 8 14 22
–6,743 360 624 –59 77,515 4,310 81,825

256
of the Volkswagen Group for the Period January 1 to December 31, 2012 € million 2012 2011
Cash and cash equivalents at beginning of period 16,495 18,228
Profit before tax 25,492 18,926
Income taxes paid –5,056 –3,269
Depreciation and amortization of, and impairment losses on, intangible assets, property, plant and
equipment, and investment property* 7,617 5,969
Amortization and write-downs of capitalized development costs* 1,903 1,697
Impairment losses on equity investments* 20 13
Depreciation of, and impairment losses on, leasing and rental assets* 3,594 2,667
Gain/loss on disposal of noncurrent assets –32 13
Share of profit or loss of equity-accounted investments –11,512 –715
Other noncash expense/income –2,031 –6,462
Change in inventories 460 –4,234
Change in receivables (excluding financial services) –56 –2,241
Change in liabilities (excluding financial liabilities) –236 3,077
Change in provisions 465 3,960
Change in leasing and rental assets –5,606 –4,090
Change in financial services receivables –7,814 –6,811
Cash flows from operating activities 7,209 8,500
Investments in intangible assets, property, plant and equipment, and investment property –10,493 –8,087
Additions to capitalized development costs –2,615 –1,666
Acquisition of subsidiaries –3,550 –5,833
Acquisition of other equity investments –570 –577
Disposal of subsidiaries 0 –
Disposal of other equity investments 14 21
Proceeds from disposal of intangible assets, property, plant and equipment, and investment property 373 140
Change in investments in securities –1,133 –699
Change in loans and time deposits –1,510 –1,931
Cash flows from investing activities –19,482 –18,631
Capital contributions 2,046 3
Dividends paid –1,673 –1,266
Capital transactions with noncontrolling interests –2,101 –335
Other changes 36 –23
Proceeds from issuance of bonds 26,055 16,715
Repayment of bonds –16,952 –11,603
Change in other financial liabilities 6,432 4,805
Finance lease payments –132 19
Cash flows from financing activities 13,712 8,316
Effect of exchange rate changes on cash and cash equivalents –141 82
Net change in cash and cash equivalents 1,298 –1,733
Cash and cash equivalents at end of period 17,794 16,495
Cash and cash equivalents at end of period 17,794 16,495
Securities, loans and time deposits 14,352 12,163
Gross liquidity 32,146 28,658
Total third-party borrowings –117,663 –93,533
Net liquidity –85,517 –64,875
* Net of impairment reversals.
Explanatory notes on the cash flow statement are presented in note 32.
Cash Flow Statement

257
Income Statement Statement of Comprehensive Income Balance Sheet Statement of Changes in Equity Cash Flow Statement Notes Responsibility Statement Auditors’ Report
CONSOLI DATED FI NANC IAL STATEMENTS
of the Volkswagen Group as of December 31, 2012
Basis of presentation
Volkswagen AG is domiciled in Wolfsburg, Germany, and entered in the commercial register at
the Braunschweig Local Court under no. HRB 100484. The fiscal year corresponds to the
calendar year.
In accordance with Regulation No. 1606/2002 of the European Parliament and of the Council,
Volkswagen AG prepared its consolidated financial statements for 2012 in compliance with the
International Financial Reporting Standards (IFRSs), as adopted by the European Union. We
have complied with all the IFRSs adopted by the EU and required to be applied.
The accounting policies applied in the previous year were retained, with the exception of the
changes due to the new or amended standards.
In addition, we have complied with all the provisions of German commercial law that we are
also required to apply, as well as with the German Corporate Governance Code.
The consolidated financial statements were prepared in euros. Unless otherwise stated, all
amounts are given in millions of euros (€ million).
All figures shown are rounded, so minor discrepancies may arise from addition of these
amounts.
The income statement was prepared using the internationally accepted cost of sales method.
Preparation of the consolidated financial statements in accordance with the above-
mentioned standards requires management to make estimates that affect the reported amounts
of certain items in the consolidated balance sheet and in the consolidated income statement, as
well as the related disclosure of contingent assets and liabilities. The consolidated financial
statements present fairly the net assets, financial position and results of operations as well as
the cash flows of the Volkswagen Group.
The Board of Management completed preparation of the consolidated financial statements
on February 12, 2013. On that date, the period ended in which adjusting events after the
reporting period are recognized.
Effects of new and amended IFRSs
Volkswagen AG has adopted all accounting pronouncements required to be applied starting in
fiscal year 2012.
As a consequence of the amendment to IFRS 7 in October 2010, the disclosure requirements
for transfers of financial assets were supplemented starting in fiscal year 2012. The
supplemented disclosures relate both to transferred financial assets that are derecognized in
their entirety and to transferred financial assets that are not derecognized in their entirety. The
other balance sheet disclosures in accordance with IFRS 7 (Financial Instruments) were
supplemented in line with this.
New and amended IFRSs not applied
In its 2012 consolidated financial statements, Volkswagen AG did not apply the following
accounting pronouncements that have already been adopted by the IASB, but were not yet
required to be applied for the fiscal year.
Notes to the Consolidated Financial Statements

258
Standard/Interpretation1 Issued by the IASB Effective date2 Adopted by
the EU1 Expected effects
IFRS 1
First-time Adoption – Severe
Hyperinflation and Removal of
Fixed Dates for First-time Adopters Dec. 20, 2010 Jan. 1, 2013 Yes None
IFRS 1 Government Loans Mar. 13, 2012 Jan. 1, 2013 No None
IFRS 7
Financial Instruments:
Disclosures – Offsetting Financial
Assets and Financial Liabilities Dec. 16, 2011 Jan. 1, 2013 Yes
Enhanced disclosures on
offsetting of financial
instruments
IFRS 9
Financial Instruments:
Classification and Measurement
Nov. 12, 2009/
Oct. 28, 2010 Jan. 1, 20153 No
Change in the accounting
treatment of fair value
changes in financial
instruments previously
classified as available for sale
IFRS 10 Consolidated Financial Statements May 12, 2011 Jan. 1, 2014 Yes No material changes
IFRS 11 Joint Arrangements May 12, 2011 Jan. 1, 2014 Yes No material effects
IFRS 12
Disclosures of Interests in Other
Entities May 12, 2011 Jan. 1, 2014 Yes
Enhanced disclosures on
interests in other entities
Transition Guidance on IFRS 10,
IFRS 11, IFRS 12 June 28, 2012 Jan. 1, 2013 No No material changes
Investment Entities (Amendments
to IFRS 10, IFRS 12, IAS 27) Oct. 31, 2012 Jan. 1, 2014 No None
IFRS 13 Fair Value Measurement May 12, 2011 Jan. 1, 2013 Yes
Modifications to and
enhanced disclosures on fair
value measurement
IAS 1
Presentation of Financial
Statements – Presentation of
Items of Other Comprehensive
Income June 16, 2011 Jan. 1, 2013 Yes
Change in the presentation
of other comprehensive
income
IAS 12
Deferred Taxes – Recovery of
Underlying Assets Dec. 20, 2010 Jan. 1, 2013 Yes No material changes
IAS 19 Employee Benefits June 16, 2011 Jan. 1, 2013 Yes
Change in accounting for and
enhanced disclosures on
employee benefits
IAS 27 Separate Financial Statements May 12, 2011 Jan. 1, 2014 Yes None
IAS 28
Investments in Associates and
Joint Ventures May 12, 2011 Jan. 1, 2014 Yes None
IAS 32
Financial Instruments:
Presentation – Offsetting Financial
Assets and Financial Liabilities Dec. 16, 2011 Jan. 1, 2014 Yes No material changes
Improvements to IFRSs 20114 May 17, 2012 Jan. 1, 2013 No No material changes
IFRIC 20
Stripping Costs in the Production
Phase of a Surface Mine Oct. 19, 2011 Jan. 1, 2013 Yes None
1 Up to December 31, 2012.
2 Required to be applied for the first time by Volkswagen AG.
3 Effective date postponed from 2013 to 2015 by the Mandatory Effective Date project.
4 Minor amendments to a large number of IFRSs (IFRS 1, IAS 1, IAS 16, IAS 32, IAS 34).
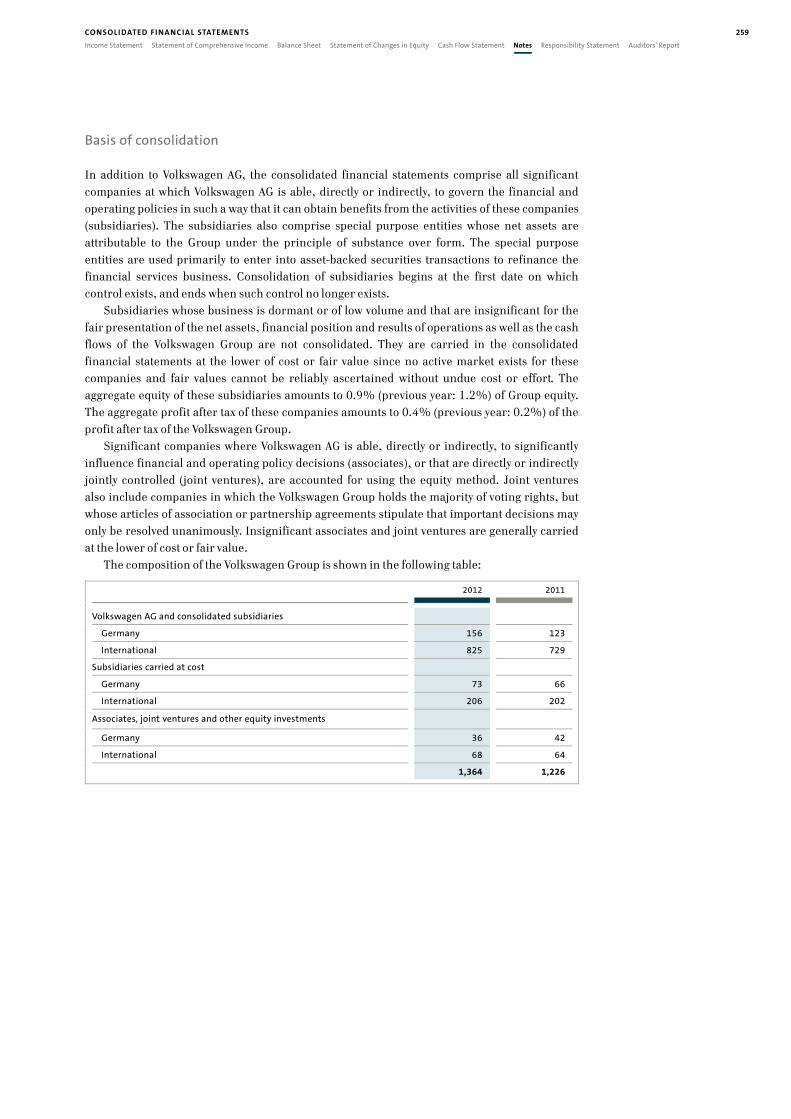
259
Income Statement Statement of Comprehensive Income Balance Sheet Statement of Changes in Equity Cash Flow Statement Notes Responsibility Statement Auditors’ Report
CONSOLI DATED FI NANC IAL STATEMENTS
Basis of consolidation
In addition to Volkswagen AG, the consolidated financial statements comprise all significant
companies at which Volkswagen AG is able, directly or indirectly, to govern the financial and
operating policies in such a way that it can obtain benefits from the activities of these companies
(subsidiaries). The subsidiaries also comprise special purpose entities whose net assets are
attributable to the Group under the principle of substance over form. The special purpose
entities are used primarily to enter into asset-backed securities transactions to refinance the
financial services business. Consolidation of subsidiaries begins at the first date on which
control exists, and ends when such control no longer exists.
Subsidiaries whose business is dormant or of low volume and that are insignificant for the
fair presentation of the net assets, financial position and results of operations as well as the cash
flows of the Volkswagen Group are not consolidated. They are carried in the consolidated
financial statements at the lower of cost or fair value since no active market exists for these
companies and fair values cannot be reliably ascertained without undue cost or effort. The
aggregate equity of these subsidiaries amounts to 0.9% (previous year: 1.2%) of Group equity.
The aggregate profit after tax of these companies amounts to 0.4% (previous year: 0.2%) of the
profit after tax of the Volkswagen Group.
Significant companies where Volkswagen AG is able, directly or indirectly, to significantly
influence financial and operating policy decisions (associates), or that are directly or indirectly
jointly controlled (joint ventures), are accounted for using the equity method. Joint ventures
also include companies in which the Volkswagen Group holds the majority of voting rights, but
whose articles of association or partnership agreements stipulate that important decisions may
only be resolved unanimously. Insignificant associates and joint ventures are generally carried
at the lower of cost or fair value.
The composition of the Volkswagen Group is shown in the following table: 2012 2011
Volkswagen AG and consolidated subsidiaries
Germany 156 123
International 825 729
Subsidiaries carried at cost
Germany 73 66
International 206 202
Associates, joint ventures and other equity investments
Germany 36 42
International 68 64
1,364 1,226

260
The list of all shareholdings that forms part of the annual financial statements of Volkswagen AG
can be downloaded from the electronic companies register at www.unternehmensregister.de
and from www.volkswagenag.com/ir by clicking on “Further mandatory Publications” under the
heading “Mandatory Publications”.
The following consolidated German subsidiaries with the legal form of a corporation or
partnership meet the criteria set out in section 264(3) or section 264b of the Handelsgesetzbuch
(HGB – German Commercial Code) due to their inclusion in the consolidated financial
statements and have as far as possible exercised the option not to publish annual financial
statements:
> Audi Akademie GmbH, Ingolstadt
> Audi Berlin GmbH, Berlin
> Audi Frankfurt GmbH, Frankfurt am Main
> Audi Hamburg GmbH, Hamburg
> Audi Hannover GmbH, Hanover
> Audi Leipzig GmbH, Leipzig
> Audi Stuttgart GmbH, Stuttgart
> Audi Vertriebsbetreuungsgesellschaft mbH, Ingolstadt
> Automobilmanufaktur Dresden GmbH, Dresden
> Autostadt GmbH, Wolfsburg
> AutoVision GmbH, Wolfsburg
> Bugatti Engineering GmbH, Wolfsburg
> Haberl Beteiligungs-GmbH, Munich
> MAHAG GmbH, Munich
> quattro GmbH, Neckarsulm
> Raffay Versicherungsdienst GmbH, Hamburg
> VfL Wolfsburg-Fußball GmbH, Wolfsburg
> VGRD GmbH, Wolfsburg
> Volim Volkswagen Immobilien Vermietgesellschaft für VW-/Audi-Händlerbetriebe mbH,
Braunschweig
> Volkswagen Automobile Berlin GmbH, Berlin
> Volkswagen Automobile Frankfurt GmbH, Frankfurt am Main
> Volkswagen Automobile Hamburg GmbH, Hamburg
> Volkswagen Automobile Stuttgart GmbH, Stuttgart
> Volkswagen Financial Services Beteiligungsgesellschaft mbH, Braunschweig
> Volkswagen Gebrauchtfahrzeughandels und Service GmbH, Langenhagen
> Volkswagen Group Real Estate GmbH & Co. KG, Wolfsburg
> Volkswagen Immobilien GmbH, Wolfsburg
> Volkswagen Logistics GmbH & Co. OHG, Wolfsburg
> Volkswagen Original Teile Logistik GmbH & Co. KG, Baunatal
> Volkswagen Osnabrück GmbH, Osnabrück
> Volkswagen R GmbH, Wolfsburg
> Volkswagen Sachsen GmbH, Zwickau
> Volkswagen Versicherungsvermittlung GmbH, Braunschweig
> Volkswagen Vertriebsbetreuungsgesellschaft mbH, Chemnitz
> Volkswagen Zubehör GmbH, Dreieich
> Volkswagen-Versicherungsdienst GmbH, Braunschweig

261
Income Statement Statement of Comprehensive Income Balance Sheet Statement of Changes in Equity Cash Flow Statement Notes Responsibility Statement Auditors’ Report
CONSOLI DATED FI NANC IAL STATEMENTS
CONSOLI DATED SU BSIDIARIES
The Volkswagen Group acquired a majority stake in MAN SE, Munich, on November 9, 2011
under the terms of a mandatory public offer. The analysis of the assets acquired and liabilities
assumed was only completed in the reporting period for reasons of time. Following an
adjustment based on better knowledge, the business combination generated goodwill of €759
million (originally €575 million). The updated purchase price allocation resulted in the
adjustment of the corresponding prior-year comparative figures. This updating had no effect on
the prior-year income statement. The goodwill is not tax-deductible.
The following table shows the allocation of the purchase price to the assets and liabilities:
€ million
IFRS carryingamounts at the
acquisition date Purchase price
allocation
Adjustment of balance sheet as of
Dec. 31, 2011 Fair values at the acquisition date
Brand names 53 1,574 – 1,628
Technology 545 1,852 – 2,397
Customer and dealer relationships 470 2,689 – 3,160
Other intangible assets* 779 –351 – 428
Property, plant and equipment 2,034 880 –41 2,872
Investments 1,965 –234 – 1,731
Leasing and rental assets 2,232 – – 2,232
Other noncurrent assets 2,377 – – 2,377
Inventories 3,745 185 – 3,930
Trade receivables 2,319 – – 2,319
Cash and cash equivalents 607 – – 607
Other current assets 1,405 –63 – 1,342
Total assets 18,531 6,532 –41 25,022
Noncurrent financial liabilities 1,824 150 –1 1,973
Other noncurrent liabilities and provisions 2,797 2,126 –36 4,887
Current financial liabilities 1,334 – – 1,334
Trade payables 2,137 – – 2,137
Current provisions 1,364 398 193 1,954
Other current liabilities 3,175 – –13 3,162
Total liabilities 12,631 2,674 143 15,447
* Excluding goodwill of Volkswagen AG.
€505 million of the goodwill and €1,158 million of the brand names are allocated to the MAN
Commercial Vehicles operating segment, which is part of the Trucks and Buses reporting segment;
the remaining goodwill of €254 million and the remaining brand names of €470 million are
allocated to the Power Engineering segment.
In fiscal year 2012, Volkswagen acquired further shares in MAN SE for €2,081 million and, as
of December 31, 2012, held 75.03% of the voting rights and 73.72% of the share capital of
MAN SE. The difference of €–678 million arising from the acquisition of further shares was
recognized directly in equity.
The shares of Scania AB held by MAN SE increase the interest in the capital of Scania attrib-
utable to Volkswagen AG shareholders to 59.13% (December 31, 2011: 56.94%). The resulting
difference of €–73 million was recognized directly in equity.
The share of noncontrolling interests acquired in the equity of MAN and Scania was €1,331
million.

262
On August 1, 2012, Porsche Automobil Holding SE, Stuttgart (Porsche SE), contributed its holding
company operating business to Volkswagen AG by way of singular succession in the course of a
capital increase with a mixed noncash contribution.
The business acquired from Porsche SE consists in particular of the 50.1% interest held by
Porsche SE in Porsche Holding Stuttgart GmbH, Stuttgart (Porsche Holding Stuttgart) (formerly:
Porsche Zweite Zwischenholding GmbH, Stuttgart, as the legal successor to Porsche Zwischen-
holding GmbH, Stuttgart), and thus indirectly in Dr. Ing. h.c. F. Porsche AG, Stuttgart (Porsche AG),
and of all other subsidiaries of Porsche SE existing at the contribution date (with the exception
of the interest in Volkswagen AG), as well as receivables from and liabilities to companies of the
Porsche Holding Stuttgart Group.
With unit sales of 117 thousand vehicles, premium sports car manufacturer Porsche AG
generated sales revenue of €10,928 million and profit before tax of €2,108 million in fiscal year
2011. The integration of Porsche allows the Volkswagen Group to expand its product portfolio in
the premium segment.
Volkswagen AG increased its share capital by €2.56 by issuing one new ordinary bearer share
and allowed Porsche SE to subscribe for this new share; the preemptive rights of the other
shareholders were disapplied. Volkswagen AG paid €4,495 million to Porsche SE as further
consideration. The cash consideration is based on the equity value of €3,883 million for the
remaining 50.1% interest in Porsche Holding Stuttgart (and thus indirectly in Porsche AG) held
by Porsche SE set out in the Comprehensive Agreement, and also comprises a number of adjust-
ment items. Among other things, Porsche SE will be remunerated for dividend payments from
its indirect interest in Porsche AG that it would have received as well as for half of the present
value of the net synergies realizable as a result of the accelerated integration, which amount to a
total of approximately €320 million.
Based on the updated assumptions underlying the valuation at the acquisition date, Volks-
wagen AG’s call option on the shares of Porsche Holding Stuttgart agreed in the Comprehensive
Agreement with Porsche SE has a positive fair value of €10,199 million (December 31,
2011: €8,409 million) and the corresponding put option has a negative fair value of €2 million
(December 31, 2011: €87 million). The fair values of the options are included in the cost of the
business combination. The difference attributable to the updated fair values amounting to
€1,875 million was recognized in the other financial result.
The shares of Porsche Holding Stuttgart, which were accounted for using the equity method
at the acquisition date, were revalued at their fair value of €12,566 million on acquisition of the
remaining shares. Measurement of the shares uses the same assumptions that were also used to
measure the options on the outstanding shares of Porsche Holding Stuttgart and is based on
Porsche Holding Stuttgart’s business plans. The transition from the equity method to consolidation
resulted in a noncash book gain of €10,399 million, which was recognized in the share of profits
and losses of equity-accounted investments; this includes amounts totaling €–316 million that
were previously recognized directly in equity and that were transferred to the income statement.

263
Income Statement Statement of Comprehensive Income Balance Sheet Statement of Changes in Equity Cash Flow Statement Notes Responsibility Statement Auditors’ Report
CONSOLI DATED FI NANC IAL STATEMENTS
The measurement basis for the goodwill is calculated as follows: € million 2012
Purchase price for shares acquired on August 1 4,495
Fair value of options on the outstanding shares 10,197
Fair value of existing shares 12,566
Issued ordinary share of Volkswagen AG 0
Measurement basis for goodwill 27,258
The costs incurred in connection with the issue of the new ordinary share reduced the capital
reserves by €1 million, net of deferred taxes. The other transaction-related costs incurred to
date of €3 million were recognized as expenses.
The analysis of the assets acquired and liabilities assumed was not completed by the date of
issue of the consolidated financial statements for reasons of time. Preliminary purchase price
allocation indicates that the business combination generated goodwill of €18,871 million. The
goodwill is not tax-deductible.
The following table shows the preliminary allocation of the purchase price to the assets and
liabilities:
€ million
IFRS carryingamounts at the
acquisition date Purchase price
allocation Adjustment in the
measurement period Fair values at the acquisition date
Brand names – 13,823 – 13,823
Technology 1,489 714 – 2,203
Customer and dealer relationships – 698 –6 691
Other intangible assets* 386 82 21 489
Property, plant and equipment 2,983 565 – 3,548
Investments 162 – –2 160
Leasing and rental assets 1,360 65 – 1,425
Other noncurrent assets 7,458 325 158 7,941
Inventories 1,243 382 – 1,625
Trade receivables 348 – – 348
Cash and cash equivalents 1,812 – – 1,812
Other current assets 3,060 350 –155 3,256
Total assets 20,301 17,004 15 37,321
Noncurrent financial liabilities 10,227 339 –911 9,654
Other noncurrent liabilities and provisions 3,152 5,359 4 8,516
Current financial liabilities 3,211 255 675 4,142
Trade payables 989 – 122 1,112
Current provisions 1,237 – 71 1,308
Other current liabilities 4,160 – 42 4,203
Total liabilities 22,977 5,952 4 28,934
* Excluding goodwill of Volkswagen AG.

264
The goodwill and the brand name are allocated to the Porsche operating segment, which is part
of the Passenger Cars and Light Commercial Vehicles reporting segment.
The gross carrying amount of the receivables acquired was €9,858 million at the acquisition
date, and the net carrying amount (equivalent to the fair value) was €9,775 million. Of this total, gross
carrying amounts of €6,449 million (net carrying amounts: €6,449 million) are attributable to
acquired loans and gross carrying amounts of €1,202 million (net carrying amounts: €1,127 million)
are attributable to acquired finance lease receivables. The depreciable noncurrent assets have
remaining useful lives of between 4 months and 50 years.
As of December 31, 2012, the inclusion of the company increased the Group’s sales revenue by
€4,534 million and increased its profit after tax, net of write-downs of hidden reserves identified
in the course of purchase price allocation, by €292 million. If Porsche had been included as of
January 1, 2012, the Group’s sales revenue after consolidation as of December 31, 2012 would
have been approximately €6,208 million higher and its profit after tax, net of write-downs of
hidden reserves identified in the course of purchase price allocation, would have been
approximately €656 million higher.
The contribution of Porsche SE’s holding company operating business increases the consoli-
dated Group by 107 consolidated subsidiaries.
As of July 19, 2012, the Volkswagen Group acquired 100% of the voting rights of motorcycle
manufacturer Ducati Motor Holding S.p.A., Bologna, Italy, against payment of a purchase price
of €747 million, via Automobili Lamborghini S.p.A., Sant’ Agata Bolognese, Italy, a subsidiary of
AUDI AG. The acquisition of Ducati – a leading international manufacturer of premium motorcycles
with significant expertise in high-performance engines and lightweight construction – has seen
the Group move into the growth market for high-quality motorcycles. The Ducati Group sold
42,016 motorcycles in calendar year 2011, generating sales revenue of €479 million.
The analysis of the assets acquired and liabilities assumed was not completed by the date of
issue of the consolidated financial statements for reasons of time. The provisional goodwill
determined in the amount of €290 million contains intangible assets that are not separable and
that cannot be attributed to contractual or other rights, such as the expertise of Ducati’s
employees. The goodwill is not tax-deductible. The transaction-related costs incurred to date of
€1 million were recognized as expenses.
The following table shows the preliminary allocation of the purchase price to the assets and
liabilities:
€ million
IFRS carrying amounts at the
acquisition date Purchase price
allocation Fair values at the acquisition date
Brand names 211 193 404
Customer relationships 49 131 180
Other intangible assets 78 17 95
Land and buildings 78 3 81
Other noncurrent assets 25 8 33
Inventories 83 0 83
Cash and cash equivalents 150 – 150
Other current assets 154 – 154
Total assets 828 352 1,180
Noncurrent liabilities 106 108 214
Current liabilities 510 – 510
Total liabilities 616 108 724

265
Income Statement Statement of Comprehensive Income Balance Sheet Statement of Changes in Equity Cash Flow Statement Notes Responsibility Statement Auditors’ Report
CONSOLI DATED FI NANC IAL STATEMENTS
The gross carrying amount of the receivables acquired was €153 million at the acquisition date,
and the net carrying amount (equivalent to the fair value) was €142 million.
As of December 31, 2012, the inclusion of the company increased the Group’s sales revenue
by €209 million and reduced its profit, net of write-downs of hidden reserves identified in the
course of purchase price allocation, by €27 million. If Ducati had been included in the consoli-
dated financial statements as of January 1, 2012, the Group’s sales revenue after consolidation
as of December 31, 2012 would have been approximately €422 million higher and its profit
after tax, net of write-downs of hidden reserves identified in the course of purchase price
allocation, would have been approximately €34 million higher.
In order to strengthen its sales activities, Volkswagen acquired all shares of KPI Polska Sp.z o.o.,
Poznan (KPI Polska), effective January 1, 2012. KPI Polska is the exclusive importer and
distributor of various Volkswagen Group brands in Poland. At the same time, Volkswagen acquired
from the previous owners of KPI Polska the outstanding shares of the former jointly controlled
companies Volkswagen Leasing Polska Sp.z o.o., Warsaw, and Volkswagen Bank Polska S.A.,
Warsaw. The purchase price paid amounted to €254 million in total. The measurement of the
existing shares in the financial services companies at a fair value of €66 million resulted in a
noncash book gain of €21 million, which was recognized in the share of profits and losses of
equity-accounted investments.
In addition, on March 28, 2012, the Volkswagen Group acquired through MAN Truck & Bus AG,
Munich, the remaining shares (apart from one share) of MAN TRUCKS India Private Limited,
Akurdi/India (formerly: MAN FORCE TRUCKS Private Limited, Akurdi/India), which until then
had been a joint venture, against payment of €150 million. The company has been consolidated
since that date. MAN TRUCKS India produces CLA series heavy MAN trucks for the Indian market
and for export to Asian and African countries. The shares, which were accounted for using the equity
method at the acquisition date, were recognized at their acquisition-date fair value of €73 million.
This resulted in a noncash book loss of €37 million, which was recognized in the share of profits
and losses of equity-accounted investments. The measurement basis for the goodwill from the
two transactions is calculated as follows: € million 2012
Purchase price for shares acquired 404
Fair value of existing shares 139
Measurement basis for goodwill 543
Transaction-related costs of €3.5 million were recognized directly as expenses.
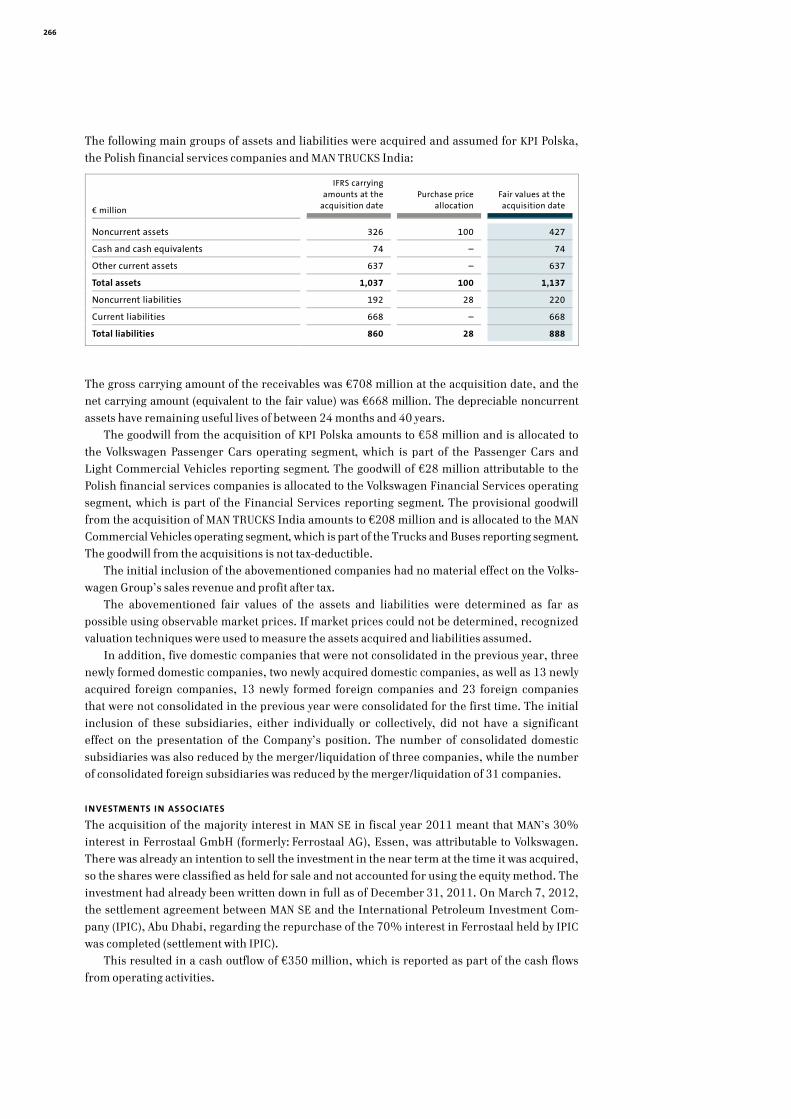
266
The following main groups of assets and liabilities were acquired and assumed for KPI Polska,
the Polish financial services companies and MAN TRUCKS India:
€ million
IFRS carryingamounts at the
acquisition date Purchase price
allocation Fair values at the acquisition date
Noncurrent assets 326 100 427
Cash and cash equivalents 74 – 74
Other current assets 637 – 637
Total assets 1,037 100 1,137
Noncurrent liabilities 192 28 220
Current liabilities 668 – 668
Total liabilities 860 28 888
The gross carrying amount of the receivables was €708 million at the acquisition date, and the
net carrying amount (equivalent to the fair value) was €668 million. The depreciable noncurrent
assets have remaining useful lives of between 24 months and 40 years.
The goodwill from the acquisition of KPI Polska amounts to €58 million and is allocated to
the Volkswagen Passenger Cars operating segment, which is part of the Passenger Cars and
Light Commercial Vehicles reporting segment. The goodwill of €28 million attributable to the
Polish financial services companies is allocated to the Volkswagen Financial Services operating
segment, which is part of the Financial Services reporting segment. The provisional goodwill
from the acquisition of MAN TRUCKS India amounts to €208 million and is allocated to the MAN
Commercial Vehicles operating segment, which is part of the Trucks and Buses reporting segment.
The goodwill from the acquisitions is not tax-deductible.
The initial inclusion of the abovementioned companies had no material effect on the Volks-
wagen Group’s sales revenue and profit after tax.
The abovementioned fair values of the assets and liabilities were determined as far as
possible using observable market prices. If market prices could not be determined, recognized
valuation techniques were used to measure the assets acquired and liabilities assumed.
In addition, five domestic companies that were not consolidated in the previous year, three
newly formed domestic companies, two newly acquired domestic companies, as well as 13 newly
acquired foreign companies, 13 newly formed foreign companies and 23 foreign companies
that were not consolidated in the previous year were consolidated for the first time. The initial
inclusion of these subsidiaries, either individually or collectively, did not have a significant
effect on the presentation of the Company’s position. The number of consolidated domestic
subsidiaries was also reduced by the merger/liquidation of three companies, while the number
of consolidated foreign subsidiaries was reduced by the merger/liquidation of 31 companies.
I NVESTMENTS IN ASSOCIATES
The acquisition of the majority interest in MAN SE in fiscal year 2011 meant that MAN’s 30%
interest in Ferrostaal GmbH (formerly: Ferrostaal AG), Essen, was attributable to Volkswagen.
There was already an intention to sell the investment in the near term at the time it was acquired,
so the shares were classified as held for sale and not accounted for using the equity method. The
investment had already been written down in full as of December 31, 2011. On March 7, 2012,
the settlement agreement between MAN SE and the International Petroleum Investment Com-
pany (IPIC), Abu Dhabi, regarding the repurchase of the 70% interest in Ferrostaal held by IPIC
was completed (settlement with IPIC).
This resulted in a cash outflow of €350 million, which is reported as part of the cash flows
from operating activities.

267
Income Statement Statement of Comprehensive Income Balance Sheet Statement of Changes in Equity Cash Flow Statement Notes Responsibility Statement Auditors’ Report
CONSOLI DATED FI NANC IAL STATEMENTS
At the same time, the agreement between MAN and MPC Industries GmbH, Hamburg, regarding
the transfer of 100% of the shares of Ferrostaal to MPC and a co-investor was implemented (the
MPC sale). The completion of the settlement with IPIC and the sale of MPC did not result in any
earnings effects for Volkswagen because the earnings effects attributable to the transaction had
already been included in purchase price allocation for the MAN Group as a contingent liability.
The following carrying amounts are attributable to the Volkswagen Group from its proportionate
interest in Sinotruk (Hong Kong) Limited, Hong Kong (Sinotruk), and Rheinmetall MAN Military
Vehicles GmbH, Munich (RMMV):
S I N O T R U K R M M V
€ million 2012 2011 2012 2011
Equity interest ( %) 25.0 25.0 49.0 49.0
Share of quoted market
price 400 298 – –
Assets1 1,499 1,601 184 31
Liabilities1 858 1,053 159 26
Sales revenue2 859 1,079 185 44
Profit/loss for the period2 8 49 9 1
1 Amounts for Sinotruk refer to the June 30 reporting date and for RMMV to the September 30 reporting date.
2 Amounts for Sinotruk refer to the period from July 1 to June 30 and for RMMV to the period from October 1 to September 30.
I NTERESTS IN JOINT VENTURES
The following carrying amounts are attributable ratably to the Volkswagen Group from its pro-
portionate interest in joint ventures:
€ million
FAW -Volkswagen Automotive
Company
Shanghai-Volkswagen Automotive
Company
Global Mobility Holding
Porsche Holding
Stuttgart* Others Total
2012
Equity interest (%) 40.0 50.0 50.0 49.9 – –
Noncurrent assets 1,991 1,925 5,510 – 2,018 11,445
Current assets 3,828 2,807 4,714 – 1,666 13,015
Noncurrent liabilities 442 323 3,885 – 1,006 5,655
Current liabilities 2,961 2,486 4,690 – 1,723 11,861
Income 13,351 10,122 522 4,497 2,172 30,666
Expenses 11,834 9,065 401 4,069 1,959 27,328
2011
Equity interest (%) 40.0 50.0 50.0 49.9 – –
Noncurrent assets 1,594 1,484 5,254 5,744 1,710 15,786
Current assets 3,278 2,622 4,683 1,696 1,994 14,274
Noncurrent liabilities 314 227 3,572 5,466 1,376 10,954
Current liabilities 2,717 1,993 4,823 2,600 1,567 13,700
Income 9,512 8,134 508 6,387 2,264 26,806
Expenses 8,435 7,206 408 5,803 2,123 23,975
* Application of the equity method was terminated on August 1, 2012 when this company was fully consolidated. The disclosures
on income and expenses for 2012 relate to the period up to July 31.

268
The Volkswagen Group holds a 50% indirect interest in the joint venture LeasePlan Corpo-
ration N.V., Amsterdam, the Netherlands, via its 50% stake in the joint venture Global Mobility
Holding B.V., Amsterdam, the Netherlands. Volkswagen agreed with Fleet Investments B.V.,
Amsterdam, the Netherlands, an investment company belonging to the von Metzler family, that
Fleet Investments would become the new co-investor in Global Mobility Holding in 2010 for an
initial period of two years. The agreement was prolonged by a further two years in fiscal year 2011.
The previous co-investors were instructed by Volkswagen AG to transfer their shares to Fleet Invest-
ments B.V. on February 1, 2010 for the purchase price of €1.4 billion. Volkswagen AG granted
the new co-investor a put option on its shares. If this option is exercised, Volkswagen must pay
the original purchase price plus accumulated pro rata preferred dividends or the higher fair
value. The put option is accounted for at fair value.
In addition, Volkswagen has pledged claims under certificates of deposit with Bankhaus Metzler
in the amount of €1.5 billion to secure a loan granted to Fleet Investments B.V. by Bankhaus
Metzler. This pledge does not increase the Volkswagen Group’s risk arising from the above-
mentioned short position.
Consolidation methods
The assets and liabilities of the German and foreign companies included in the consolidated
financial statements are recognized in accordance with the uniform accounting policies used
within the Volkswagen Group. In the case of companies accounted for using the equity method,
the same accounting policies are applied to determine the proportionate equity, based on the
most recent audited annual financial statements of each company.
In the case of subsidiaries consolidated for the first time, assets and liabilities are measured
at their fair value at the date of acquisition. Their carrying amounts are adjusted in subsequent
years. Goodwill arises when the purchase price of the investment exceeds the fair value of
identifiable net assets. Goodwill is tested for impairment once a year to determine whether its
carrying amount is recoverable. If the carrying amount of goodwill is higher than the recoverable
amount, an impairment loss must be recognized. If this is not the case, there is no change in the
carrying amount of goodwill compared with the previous year. If the purchase price of the
investment is less than the identifiable net assets, the difference is recognized in the income state-
ment in the year of acquisition. Goodwill is accounted for at the subsidiaries in the functional
currency of those subsidiaries. Any difference that arises from the acquisition of additional
shares of an already consolidated subsidiary is taken directly to equity. Unless otherwise stated,
the proportionate equity directly attributable to noncontrolling interests is determined at the
acquisition date as the share of the fair value of the assets (excluding goodwill) and liabilities
attributable to them. Contingent consideration is measured at fair value at the acquisition date.
Subsequent changes in the fair value of contingent consideration do not result in the adjustment
of the acquisition-date measurement. Acquisition-related costs that are not equity transaction
costs are not added to the purchase price, but instead recognized as expenses in the period in
which they are incurred.
Receivables and liabilities, and expenses and income, between consolidated companies are
eliminated. Intercompany profits or losses are eliminated in Group inventories and noncurrent
assets. Deferred taxes are recognized for consolidation adjustments recognized in the income
statement, with deferred tax assets and liabilities offset where taxes are levied by the same tax
authority and relate to the same tax period.

269
Income Statement Statement of Comprehensive Income Balance Sheet Statement of Changes in Equity Cash Flow Statement Notes Responsibility Statement Auditors’ Report
CONSOLI DATED FI NANC IAL STATEMENTS
Currency translation
Transactions in foreign currencies are translated in the single-entity financial statements of
Volkswagen AG and its consolidated subsidiaries at the rates prevailing at the transaction date.
Foreign currency monetary items are recorded in the balance sheet using the middle rate at the
closing date. Foreign exchange gains and losses are recognized in the income statement. This
does not apply to foreign exchange differences from loans receivable that represent part of a net
investment in a foreign operation. The financial statements of foreign companies are translated
into euros using the functional currency concept. Asset and liability items are translated at the
closing rate. With the exception of income and expenses recognized directly in equity, equity is
translated at historical rates. The resulting foreign exchange differences are recognized in other
comprehensive income until disposal of the subsidiary concerned, and are presented as a
separate item in equity.
Income statement items are translated into euros at weighted average rates.
The rates applied are presented in the following table:
B A L A N C E S H E E T
M I D D L E R AT E O N D E C E M B E R 3 1 ,
I N C O M E S TAT E M E N T
AV E R A G E R AT E
€1 = 2012 2011 2012 2011
Argentina ARS 6.48404 5.57444 5.84444 5.74487
Australia AUD 1.27120 1.27230 1.24134 1.34839
Brazil BRL 2.70360 2.41590 2.50970 2.32651
Canada CAD 1.31370 1.32150 1.28479 1.37610
Czech Republic CZK 25.15100 25.78700 25.14567 24.58977
India INR 72.56000 68.71300 68.62947 64.88593
Japan JPY 113.61000 100.20000 102.62121 110.95860
Mexico MXN 17.18450 18.05120 16.90867 17.28765
People’s Republic of
China CNY 8.22070 8.15880 8.10942 8.99600
Poland PLN 4.07400 4.45800 4.18433 4.12061
Republic of Korea KRW 1,406.23000 1,498.69000 1,448.19540 1,541.23409
Russia RUB 40.32950 41.76500 39.92376 40.88455
South Africa ZAR 11.17270 10.48300 10.55455 10.09704
Sweden SEK 8.58200 8.91200 8.70672 9.02984
United Kingdom GBP 0.81610 0.83530 0.81110 0.86788
USA USD 1.31940 1.29390 1.28560 1.39196

270
Accounting policies
MEASU REMENT PRINCI PLES
With certain exceptions such as financial instruments at fair value through profit or loss,
available-for-sale financial assets and provisions for pensions and other post-employment
benefits, items in the Volkswagen Group are accounted for under the historical cost convention.
The methods used to measure the individual items are explained in more detail below.
I NTANGIBLE ASSETS
Purchased intangible assets are recognized at cost and amortized over their useful life using the
straight-line method. This relates in particular to software, which is amortized over three years.
In accordance with IAS 38, research costs are recognized as expenses when incurred.
Development costs for future series products and other internally generated intangible
assets are capitalized at cost, provided manufacture of the products is likely to bring the Volks-
wagen Group an economic benefit. If the criteria for recognition as assets are not met, the expenses
are recognized in the income statement in the year in which they are incurred.
Capitalized development costs include all direct and indirect costs that are directly attrib-
utable to the development process. The costs are amortized using the straight-line method from
the start of production over the expected life cycle of the models or powertrains developed
– generally between two and ten years.
Amortization recognized during the year is allocated to the relevant functions in the income
statement.
Brand names from business combinations usually have an indefinite useful life and are
therefore not amortized. This is reviewed on a regular basis.
Goodwill, intangible assets with indefinite useful lives and intangible assets that are not yet
available for use are tested for impairment at least once a year. Assets in use and other
intangible assets with finite useful lives are tested for impairment only if there are specific
indications that they may be impaired. The Volkswagen Group generally applies the higher of
value in use and fair value less costs to sell of the relevant cash-generating unit (brands or
products) to determine the recoverable amount of goodwill and indefinite-lived intangible
assets. Measurement of value in use is based on management’s current planning. The planning
period generally covers five years. For subsequent years, plausible assumptions are made regarding
future trends. The planning assumptions are adapted to reflect the current state of knowledge.
They include reasonable assumptions about macroeconomic trends (exchange rate, interest
rate and commodity price trends) and historical developments.
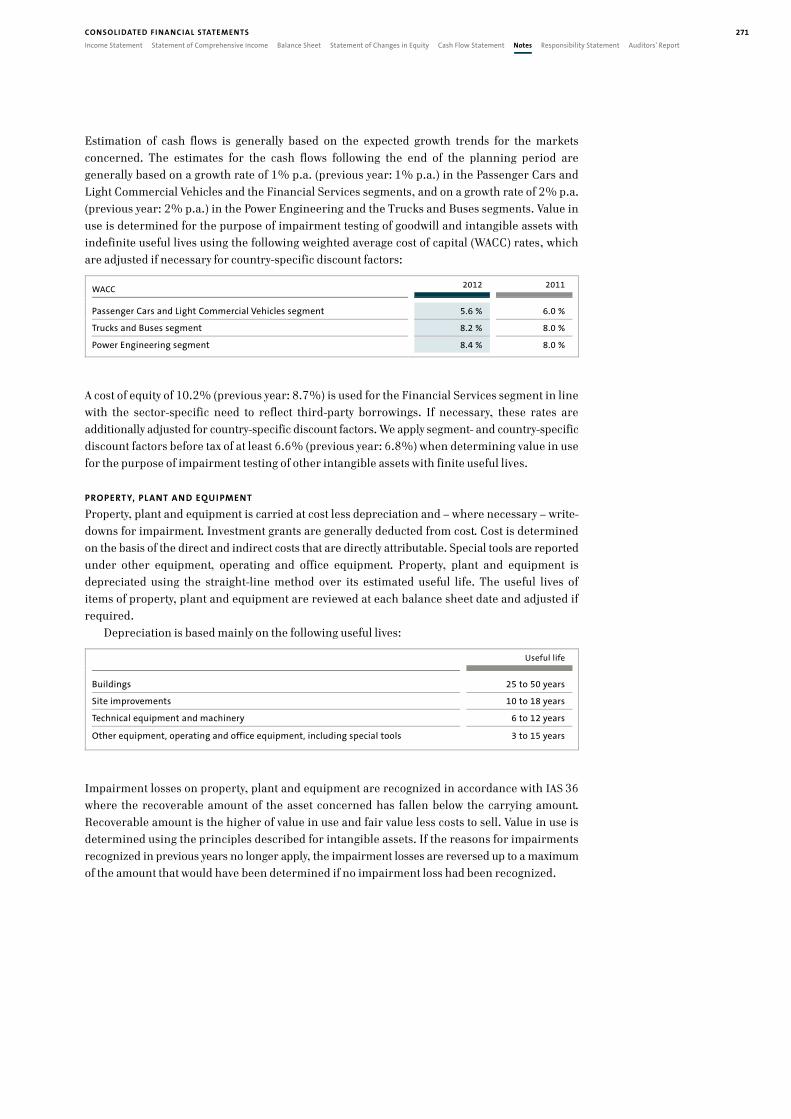
271
Income Statement Statement of Comprehensive Income Balance Sheet Statement of Changes in Equity Cash Flow Statement Notes Responsibility Statement Auditors’ Report
CONSOLI DATED FI NANC IAL STATEMENTS
Estimation of cash flows is generally based on the expected growth trends for the markets
concerned. The estimates for the cash flows following the end of the planning period are
generally based on a growth rate of 1% p.a. (previous year: 1% p.a.) in the Passenger Cars and
Light Commercial Vehicles and the Financial Services segments, and on a growth rate of 2% p.a.
(previous year: 2% p.a.) in the Power Engineering and the Trucks and Buses segments. Value in
use is determined for the purpose of impairment testing of goodwill and intangible assets with
indefinite useful lives using the following weighted average cost of capital (WACC) rates, which
are adjusted if necessary for country-specific discount factors: WACC 2012 2011
Passenger Cars and Light Commercial Vehicles segment 5.6 % 6.0 %
Trucks and Buses segment 8.2 % 8.0 %
Power Engineering segment 8.4 % 8.0 %
A cost of equity of 10.2% (previous year: 8.7%) is used for the Financial Services segment in line
with the sector-specific need to reflect third-party borrowings. If necessary, these rates are
additionally adjusted for country-specific discount factors. We apply segment- and country-specific
discount factors before tax of at least 6.6% (previous year: 6.8%) when determining value in use
for the purpose of impairment testing of other intangible assets with finite useful lives.
PROPERTY, PLANT AN D EQU I PMENT
Property, plant and equipment is carried at cost less depreciation and – where necessary – write-
downs for impairment. Investment grants are generally deducted from cost. Cost is determined
on the basis of the direct and indirect costs that are directly attributable. Special tools are reported
under other equipment, operating and office equipment. Property, plant and equipment is
depreciated using the straight-line method over its estimated useful life. The useful lives of
items of property, plant and equipment are reviewed at each balance sheet date and adjusted if
required.
Depreciation is based mainly on the following useful lives: Useful life
Buildings 25 to 50 years
Site improvements 10 to 18 years
Technical equipment and machinery 6 to 12 years
Other equipment, operating and office equipment, including special tools 3 to 15 years
Impairment losses on property, plant and equipment are recognized in accordance with IAS 36
where the recoverable amount of the asset concerned has fallen below the carrying amount.
Recoverable amount is the higher of value in use and fair value less costs to sell. Value in use is
determined using the principles described for intangible assets. If the reasons for impairments
recognized in previous years no longer apply, the impairment losses are reversed up to a maximum
of the amount that would have been determined if no impairment loss had been recognized.

272
In accordance with the principle of substance over form, assets that have been formally
transferred to third parties under a sale and leaseback transaction including a repurchase option
also continue to be accounted for as separate assets.
Where leased items of property, plant and equipment are used, the criteria for classification
as a finance lease as set out in IAS 17 are met if all material risks and rewards incidental to
ownership have been transferred to the Group company concerned. In such cases, the assets
concerned are recognized at fair value or at the present value of the minimum lease payments (if
lower) and depreciated using the straight-line method over the asset’s useful life, or over the
term of the lease if this is shorter. The payment obligations arising from the future lease payments
are discounted and recorded as a liability in the balance sheet.
Where Group companies are the lessees of assets under operating leases, i.e. if not all material
risks and rewards incidental to ownership are transferred, lease and rental payments are
recorded directly as expenses in the income statement.
LEASING AND RENTAL ASSETS
Vehicles leased out under operating leases are recognized at cost and depreciated to their estimated
residual value using the straight-line method over the term of the lease. Impairment losses
identified as a result of an impairment test in accordance with IAS 36 are recognized and the
depreciation rate is adjusted. The forecast residual values are adjusted to include constantly updated
internal and external information on residual values, depending on specific local factors and the
experiences gained in the marketing of used cars.
I NVESTMENT PROPERTY
Real estate and buildings held in order to obtain rental income (investment property) are carried
at amortized cost; the useful lives applied to depreciation generally correspond to those of the
property, plant and equipment used by the Company itself. The fair value of investment property
must be disclosed in the notes if it is carried at amortized cost. Fair value is estimated using an
income capitalization approach based on internal calculations. This involves determining the
income value for a specific building on the basis of gross income, taking into account additional
factors such as land value, remaining useful life and a multiplier specific to residential property.
CAPITALIZATION OF BORROWI NG COSTS
Borrowing costs that are directly attributable to the acquisition of qualifying assets on or after
January 1, 2009 are capitalized as part of the cost of these assets. A qualifying asset is an asset that
necessarily takes at least a year to get ready for its intended use or sale.
EQU ITY-ACCOU NTED INVESTMENTS
The cost of equity-accounted investments is adjusted to reflect the share of increases or reductions
in equity at the associates and joint ventures after the acquisition that is attributable to the
Volkswagen Group. Additionally, the investment is tested for impairment if there are indications of
impairment and written down to the lower recoverable amount if necessary. Recoverable amount
is determined using the principles described for indefinite-lived intangible assets. If the reason
for impairment ceases to apply at a later date, the impairment loss is reversed to the carrying
amount that would have been determined had no impairment loss been recognized.

273
Income Statement Statement of Comprehensive Income Balance Sheet Statement of Changes in Equity Cash Flow Statement Notes Responsibility Statement Auditors’ Report
CONSOLI DATED FI NANC IAL STATEMENTS
FI NANCIAL INSTRUMENTS
Financial instruments are contracts that give rise to a financial asset of one company and a
financial liability or an equity instrument of another. Regular way purchases or sales of financial
instruments are accounted for at the settlement date – that is, at the date on which the asset is
delivered.
IAS 39 classifies financial assets into the following categories:
> financial assets at fair value through profit or loss;
> held-to-maturity financial assets;
> loans and receivables; and
> available-for-sale financial assets.
Financial liabilities are classified into the following categories:
> financial liabilities at fair value through profit or loss; and
> financial liabilities measured at amortized cost.
We recognize financial instruments at amortized cost or at fair value.
The amortized cost of a financial asset or liability is the amount:
> at which a financial asset or liability is measured at initial recognition;
> minus any principal repayments;
> minus any write-down for impairment or uncollectibility;
> plus or minus the cumulative amortization of any difference between the original amount and
the amount repayable at maturity (premium, discount), amortized using the effective interest
method over the term of the financial asset or liability.
In the case of current receivables and liabilities, amortized cost generally corresponds to the
principal or repayment amount.
Fair value generally corresponds to the market or quoted market price. If no active market
exists, fair value is determined using valuation techniques, such as by discounting the future
cash flows at the market interest rate, or by using recognized option pricing models, and
verified by confirmations from the banks that handle the transactions.
The fair value option is not used in the Volkswagen Group.
LOANS AN D RECEIVABLES AN D FINANCIAL LIABILITIES
Loans, receivables and liabilities, as well as held-to-maturity investments, are measured at
amortized cost, unless hedged. Specifically, these relate to:
> receivables from financing business;
> trade receivables and payables;
> other receivables and financial assets and liabilities;
> financial liabilities; and
> cash, cash equivalents and time deposits.

274
AVAI LABLE-FOR-SALE FI NANCIAL ASSETS
Available-for-sale financial assets are either allocated specifically to this category or are financial
assets that cannot be assigned to any other category.
Available-for-sale financial assets (marketable securities) are carried at fair value. Changes
in fair value are recognized directly in equity, net of deferred taxes.
Shares in unconsolidated subsidiaries and other equity investments that are not accounted
for using the equity method are also classified as available-for-sale financial assets. They are
recognized at cost in the consolidated financial statements if there is no active market for those
companies and fair values cannot be reliably ascertained without undue cost or effort. Fair
values are recognized if there are indications that fair value is lower than cost. There is currently
no intention to sell these financial assets.
DERIVATIVES AND HEDGE ACCOUNTI NG
Volkswagen Group companies use derivatives to hedge balance sheet items and future cash
flows (hedged items). Derivatives such as swaps, forward transactions and options are used as
the primary hedging instruments. The criteria for the application of hedge accounting are that
the hedging relationship between the hedged item and the hedging instrument is clearly
documented and that the hedge is highly effective.
The accounting treatment of changes in the fair value of hedging instruments depends on
the nature of the hedging relationship. In the case of hedges against the risk of change in the
carrying amount of balance sheet items (fair value hedges), both the hedging instrument and
the hedged risk portion of the hedged item are measured at fair value. Several risk portions of
hedged items are grouped into a portfolio if appropriate. In the case of a fair value portfolio
hedge, the changes in fair value are accounted for in the same way as for a fair value hedge of an
individual underlying. Gains or losses from the remeasurement of hedging instruments and
hedged items are recognized in profit or loss. In the case of hedges of future cash flows (cash flow
hedges), the hedging instruments are also measured at fair value. Gains or losses from remea-
surement of the effective portion of the derivative are initially recognized in the reserve for cash
flow hedges directly in equity, and are only recognized in the income statement when the
hedged item is recognized in profit or loss; the ineffective portion of a cash flow hedge is
recognized immediately in profit or loss.
Derivatives used by the Volkswagen Group for financial management purposes to hedge
against interest rate, foreign currency, commodity, or price risks, but that do not meet the strict
hedge accounting criteria of IAS 39, are classified as financial assets or liabilities at fair value
through profit or loss (also referred to below as “derivatives not included in hedging relationships”).
This also applies to options on shares. External hedges of intragroup hedged items that are
subsequently eliminated in the consolidated financial statements are also assigned to this
category.

275
Income Statement Statement of Comprehensive Income Balance Sheet Statement of Changes in Equity Cash Flow Statement Notes Responsibility Statement Auditors’ Report
CONSOLI DATED FI NANC IAL STATEMENTS
RECEIVABLES FROM FI NANCE LEASES
Where a Group company is the lessor – generally of vehicles – a receivable in the amount of the net
investment in the lease is recognized in the case of finance leases, in other words where
substantially all the risks and rewards incidental to ownership are transferred to the lessee.
OTHER RECEIVABLES AN D FINANCIAL ASSETS
Other receivables and financial assets (except for derivatives) are recognized at amortized cost.
IMPAI RMENT LOSSES ON FI NANCIAL INSTRUMENTS
Default risk on loans and receivables in the financial services business is accounted for by recog-
nizing specific valuation allowances and portfolio-based valuation allowances.
More specifically, in the case of significant individual receivables (e.g. dealer finance receivables
and fleet customers) specific valuation allowances are recognized in accordance with Group-wide
standards in the amount of the incurred loss. A potential impairment is assumed in the case of a
number of situations such as delayed payment over a certain period, the institution of enforce-
ment measures, the threat of insolvency or overindebtedness, application for or the opening of
bankruptcy proceedings, or the failure of reorganization measures.
Portfolio-based valuation allowances are recognized by grouping together insignificant
receivables and significant individual receivables for which there is no indication of impairment
into homogeneous portfolios on the basis of comparable credit risk features and allocating them
by risk class. As long as no definite information is available as to which receivables are in default,
average historical default probabilities for the portfolio concerned are used to calculate the
amount of the valuation allowances.
As a matter of principle, specific valuation allowances are recognized on receivables outside
the Financial Services segment.
Valuation allowances on receivables are regularly recognized in separate allowance accounts.
An impairment loss is recognized on financial assets available-for-sale if there is objective
evidence of permanent impairment. In the case of equity instruments, evidence of impairment
is taken to exist, among other things, if the fair value decreases below cost significantly (by more
than 20%) or the decrease is prolonged (by more than 10% of the average market prices over
one year). If impairment is identified, the cumulative loss is recognized in the reserve and
charged to profit and loss. In the case of equity instruments, reversals of impairment losses are
taken directly to equity. Impairment losses are recognized on debt instruments if a decrease in
the future cash flows of the financial asset is expected. An increase in the risk-free interest rate
or an increase in credit risk premiums is not in itself evidence of impairment.

276
DEFERRED TAXES
Deferred tax assets are generally recognized for tax-deductible temporary differences between
the tax base of assets and their carrying amounts in the consolidated balance sheet, as well as on
tax loss carryforwards and tax credits provided it is probable that they can be used in future
periods. Deferred tax liabilities are generally recognized for all taxable temporary differences
between the tax base of liabilities and their carrying amounts in the consolidated balance sheet.
Deferred tax liabilities and assets are recognized in the amount of the expected tax liability
or tax benefit, as appropriate, in subsequent fiscal years, based on the expected enacted tax rate
at the time of realization. The tax consequences of dividend payments are not taken into account
until the resolution on appropriation of earnings available for distribution has been adopted.
Deferred tax assets that are unlikely to be realized within a clearly predictable period are
reduced by valuation allowances.
Deferred tax assets and deferred tax liabilities are offset where taxes are levied by the same
taxation authority and relate to the same tax period.
I NVENTORIES
Raw materials, consumables and supplies, merchandise, work in progress and self-produced
finished goods reported in inventories are carried at the lower of cost or net realizable value.
Cost is determined on the basis of the direct and indirect costs that are directly attributable.
Borrowing costs are not capitalized. The measurement of same or similar inventories is based
on the weighted average cost method.
NONCU RRENT ASSETS HELD FOR SALE AND DISCONTINUED OPERATIONS
Under IFRS 5, noncurrent assets or groups of assets and liabilities (disposal groups) are
classified as held for sale if their carrying amounts will be recovered principally through a sale
transaction rather than through continuing use. Such assets are carried at the lower of their
carrying amount and fair value less costs to sell, and are presented separately in current assets
and liabilities in the balance sheet.
Discontinued operations are components of an entity that have either been disposed of or
are classified as held for sale. The assets and liabilities of operations that are held for sale
represent disposal groups that must be measured and reported using the same principles as
noncurrent assets held for sale. The income and expenses from discontinued operations are
presented in the income statement as “profit or loss from discontinued operations” below the
profit or loss from continuing operations. Corresponding disposal gains or losses are contained
in the profit or loss from discontinued operations. The prior-year figures in the income
statement are adjusted accordingly.

277
Income Statement Statement of Comprehensive Income Balance Sheet Statement of Changes in Equity Cash Flow Statement Notes Responsibility Statement Auditors’ Report
CONSOLI DATED FI NANC IAL STATEMENTS
PENSION PROVISIONS
The actuarial valuation of pension provisions is based on the projected unit credit method in
respect of defined benefit plans in accordance with IAS 19. The valuation is not only based on
pension payments and vested entitlements known at the balance sheet date, but also reflects
future salary and pension trends, as well as experience-based staff turnover rates. Actuarial
gains and losses are recognized directly in equity, net of deferred taxes.
PROVISIONS FOR TAXES
Tax provisions contain obligations resulting from current taxes. Deferred taxes are presented in
separate items of the balance sheet and income statement.
OTHER PROVISIONS
In accordance with IAS 37, provisions are recognized where a present obligation exists to third
parties as a result of a past event, where a future outflow of resources is probable and where a
reliable estimate of that outflow can be made.
Provisions not resulting in an outflow of resources in the year immediately following are
recognized at their settlement value discounted to the balance sheet date. Discounting is based
on market interest rates. An average discount rate of 0.69% (previous year: 1.79%) was used in
Germany. The settlement value also reflects cost increases expected at the balance sheet date.
Provisions are not offset against claims for reimbursement.
We recognize insurance contracts that form part of the insurance business in accordance
with IFRS 4. Reinsurance acceptances are accounted for without any time delay in the year in
which they arise. Provisions are generally recognized based on the cedants’ contractual duties.
Estimation techniques based on assumptions about future changes in claims are used to
calculate the claims provision. Other technical provisions relate to the provision for cancellations
and the provision for suspended vehicle insurance policies.
The share of the provisions attributable to reinsurers is calculated in accordance with the
contractual agreements with the retrocessionaries and reported under other assets.
LIABI LITI ES
Noncurrent liabilities are recorded at amortized cost in the balance sheet. Differences between
historical cost and the repayment amount are amortized using the effective interest method.
Liabilities to members of partnerships from puttable shares are recognized in the income
statement at the present value of the redemption amount at the balance sheet date.
Liabilities under finance leases are carried at the present value of the lease payments.
Current liabilities are recognized at their repayment or settlement value.

278
REVENUE AND EXPENSE RECOGNITION
Sales revenue, interest and commission income from financial services and other operating
income are recognized only when the relevant service has been rendered or the goods have been
delivered, that is, when the risk has passed to the customer, the amount of sales revenue can be
reliably determined and settlement of the amount can be assumed. Revenue is reported net of
sales allowances (discounts, rebates, or customer bonuses). Sales revenue from financing and lease
agreements is recognized using the effective interest method. If non-interest-bearing or low-
interest vehicle financing arrangements are agreed, sales revenue is reduced by the interest
benefits granted. Revenue from operating leases is recognized using the straight-line method
over the term of the lease. Sales revenue from extended warranties or maintenance agreements
is recognized when deliveries take place or services are rendered. In the case of prepayments,
deferred income is recognized proportionately by reference to the costs expected to be incurred,
based on experience. Revenue is recognized on a straight-line basis if there is insufficient
experience. If the expected costs exceed the accrued sales revenue, a loss is recognized from these
agreements.
If a contract comprises several separately identifiable components (multiple-element arrange-
ments), these components are recognized separately in accordance with the principles outlined
above. At initial recognition, receivables are measured at fair value.
Income from assets for which a Group company has a buy back obligation is recognized only
when the assets have definitively left the Group. If a fixed repurchase price was agreed when the
contract was entered into, the difference between the selling and repurchase price is
recognized as income ratably over the term of the contract. Prior to that time, the assets are
carried as inventories in the case of short contract terms and as leasing and rental assets in the
case of long contract terms.
Cost of sales includes the costs incurred to generate the sales revenue and the cost of goods
purchased for resale. This item also includes the costs of additions to warranty provisions.
Research and development costs not eligible for capitalization in the period and amortization of
development costs are likewise carried under cost of sales. Reflecting the presentation of
interest and commission income in sales revenue, the interest and commission expenses
attributable to the financial services business are presented in cost of sales.
Construction contracts are recognized using the percentage of completion (PoC) method,
under which revenue and cost of sales are recognized by reference to the stage of completion at
the end of the reporting period, based on the contract revenue agreed with the customer and the
expected contract costs. As a rule, the stage of completion is determined as the proportion that
contract costs incurred by the end of the reporting period bear to the estimated total contract
costs (cost-to-cost method). In certain cases, in particular those involving innovative, complex

279
Income Statement Statement of Comprehensive Income Balance Sheet Statement of Changes in Equity Cash Flow Statement Notes Responsibility Statement Auditors’ Report
CONSOLI DATED FI NANC IAL STATEMENTS
contracts, the stage of completion is measured using contractually agreed milestones (milestone
method). If the outcome of a construction contract cannot yet be estimated reliably, contract
revenue is recognized only in the amount of the contract costs incurred to date (zero profit
method). In the balance sheet, contract components whose revenue is recognized using the
percentage of completion method are reported as trade receivables, net of prepayments received.
Expected losses from construction contracts are recognized immediately in full as expenses by
recognizing impairment losses on recognized contract assets, and additionally by recognizing
provisions for amounts in excess of the impairment losses.
Dividend income is recognized on the date when the dividend is legally approved.
GOVERNMENT GRANTS
Government grants related to assets are deducted when arriving at the carrying amount of the
asset and are recognized in profit or loss over the life of the depreciable asset as a reduced
depreciation expense. Government grants related to income, i.e. that compensate the Group for
expenses incurred, are recognized in profit or loss for the period in those items in which the
expenses to be compensated by the grants are also recognized.
ESTIMATES AND ASSUMPTIONS BY MANAGEMENT
Preparation of the consolidated financial statements requires management to make certain
estimates and assumptions that affect the reported amounts of assets and liabilities, and income
and expenses, as well as the related disclosure of contingent assets and liabilities of the
reporting period. The estimates and assumptions relate largely to the following matters:
The impairment testing of nonfinancial assets (especially goodwill, brand names and
capitalized development costs) and equity-accounted investments, or investments accounted at
cost, and the measurement of options on shares in companies that are not traded in an active
market require assumptions about the future cash flows during the planning period, and
possibly beyond it, as well as about the discount rate to be applied. In addition, the recoverability
of the Group’s leasing and rental assets depends in particular on the residual value of the leased
vehicles after expiration of the lease term, because this represents a significant portion of the
expected cash flows. More detailed information on impairment tests and the measurement
parameters used for those tests can be found in the explanations on the accounting policies for
intangible assets.
If there are no observable market inputs, the fair values of assets acquired and liabilities
assumed in a business combination are measured using recognized valuation techniques, such
as the relief-from-royalty method or the residual method.
Impairment testing of financial assets requires estimates about the extent and probability of
occurrence of future events. As far as possible, estimates are derived from past experience. In
the case of financial services receivables, both specific and portfolio-based valuation allowances
are recognized. The more detailed balance sheet disclosures on IFRS 7 (Financial Instruments)
contain an overview of these specific and portfolio-based valuation allowances.

280
Accounting for provisions is also based on estimates of the extent and probability of occurrence
of future events, as well as estimates of the discount rate. As far as possible, these are also based
on past experience or external opinions. In addition, the measurement of pension provisions
depends on the estimated growth in plan assets. The assumptions underlying the measurement
of pension provisions are contained in note 29. Actuarial gains and losses are recognized in
other comprehensive income and do not affect profit or loss reported in the income statement.
Any change in the estimates of the amount of other provisions is always recognized in profit or
loss. The use of empirical values means that additional amounts must frequently be recognized
for provisions, or that unused provisions are reversed. Reversals of provisions are recognized as
other operating income, whereas expenses relating to the recognition of provisions are allocated
directly to the functions. Warranty claims from sales transactions are calculated on the basis of
losses to date, estimated future losses and the policy on ex gratia arrangements. Note 30 contains
an overview of other provisions. For information on litigation, see also note 36.
Estimates of the useful life of finite-lived assets are based on past experience and are reviewed
regularly. Where estimates are modified the residual useful life is adjusted and an impairment
loss is recognized, if necessary.
Measuring deferred tax assets requires assumptions regarding future taxable income and
the timing of the realization of deferred tax assets.
The estimates and assumptions are based on underlying assumptions that reflect the
current state of available knowledge. Specifically, the expected future development of business
was based on the circumstances known at the date of preparation of these consolidated financial
statements and a realistic assessment of the future development of the global and sector-specific
environment. Our estimates and assumptions remain subject to a high degree of uncertainty
because future business developments are subject to uncertainties that in part cannot be
influenced by the Group. This applies in particular to short- and medium-term cash flow
forecasts and to the discount rates used.
Developments in this environment that differ from the assumptions and that cannot be
influenced by management could result in amounts that differ from the original estimates. If
actual developments differ from the expected developments, the underlying assumptions and, if
necessary, the carrying amounts of the assets and liabilities affected are adjusted.
The global economy registered slower growth in 2012 than in the previous year. We believe
that global growth will continue in 2013 despite economic uncertainties. As a result, from today’s
perspective, we are not expecting any material adjustment in the following fiscal year in the
carrying amounts of the assets and liabilities reported in the consolidated balance sheet.
Estimates and assumptions by management were based in particular on assumptions
relating to the development of the general economic environment, the automotive markets and
the legal environment. These and further assumptions are explained in detail in the Report on
Expected Developments.

281
Income Statement Statement of Comprehensive Income Balance Sheet Statement of Changes in Equity Cash Flow Statement Notes Responsibility Statement Auditors’ Report
CONSOLI DATED FI NANC IAL STATEMENTS
Segment reporting
Segments are identified on the basis of the Volkswagen Group’s internal management and
reporting. In line with its multibrand strategy, each of the Group’s brands is managed by its own
board of management. The Group targets and requirements laid down by the Board of Manage-
ment of Volkswagen AG or the Group Board of Management must be complied with to the extent
permitted by law. The segment reporting comprises the four reportable segments of Passenger
Cars and Light Commercial Vehicles, Trucks and Buses, Power Engineering and Financial Services.
The activities of the Passenger Cars and Light Commercial Vehicles segment cover the
development of vehicles and engines, the production and sale of passenger cars and light
commercial vehicles, and the corresponding genuine parts business. As a rule, the individual
passenger car brands and light commercial vehicles of the Volkswagen Group are combined on
a consolidated basis into a single reportable segment.
The Trucks and Buses segment primarily comprises the development, production and sale of
trucks and buses, the corresponding genuine parts business and related services.
The activities of the Power Engineering segment consist of the development and production
of large-bore diesel engines, turbo compressors, industrial turbines and chemical reactor systems,
as well as the production of gear units, propulsion components and testing systems.
The activities of the Financial Services segment comprise dealer and customer financing,
leasing, banking and insurance activities, as well as fleet management.
In the expanded segment structure, purchase price allocation for companies acquired is
allocated directly to the corresponding segments.
The business of Porsche AG acquired in fiscal year 2012 is allocated to the Passenger Cars
and Light Commercial Vehicles segment, with the exception of Porsche’s financial services
activities, which are presented in the Financial Services segment.
The Ducati Group is allocated to the Audi operating segment and is thus presented in the
Passenger Cars and Light Commercial Vehicles reporting segment.
At Volkswagen, segment profit or loss is measured on the basis of operating profit or loss.
In the segment reporting, the share of the profits or losses of joint ventures is contained in
the share of profits and losses of equity-accounted investments in the corresponding segments.
The reconciliation contains activities and other operations that do not by definition
constitute segments. It also includes the unallocated Group financing activities. Consolidation
adjustments between the segments are also contained in the reconciliation.
Investments in intangible assets, property, plant and equipment, and investment property
are reported net of investments under finance leases.
As a matter of principle, business relationships between the companies within the segments
of the Volkswagen Group are transacted at arm’s length prices.

282
REPORTI NG SEGMENTS 2011
€ million
Passenger Cars
and Light Commercial
Vehicles Trucks and
Buses Power
Engineering FinancialServices
Total segments
Recon-ciliation
VolkswagenGroup
Sales revenue from
external customers 130,061 11,529 662 15,784 158,037 1,300 159,337
Intersegment sales revenue 8,630 194 – 1,461 10,285 –10,285 –
Total sales revenue 138,692 11,723 662 17,244 168,322 –8,985 159,337
Depreciation and amortization 6,302 844 65 2,412 9,623 52 9,675
Impairment losses 640 1 – 96 737 6 744
Reversal of impairment losses 81 – – 5 85 – 85
Segment profit or loss
(operating profit or loss) 9,886 937 –6 1,298 12,115 –844 11,271
Share of profits and losses of
equity-accounted investments 2,458 –22 0 133 2,570 –396 2,174
Net interest income and
other financial result –438 222 10 –30 –235 5,716 5,481
Equity-accounted investments 7,824 610 22 1,793 10,249 – 10,249
Investments in intangible assets,
property, plant and equipment,
and investment property 9,011 475 33 158 9,676 77 9,753

283
Income Statement Statement of Comprehensive Income Balance Sheet Statement of Changes in Equity Cash Flow Statement Notes Responsibility Statement Auditors’ Report
CONSOLI DATED FI NANC IAL STATEMENTS
REPORTI NG SEGMENTS 2012
€ million
Passenger Cars
and Light Commercial
Vehicles Trucks and
Buses Power
Engineering FinancialServices
Total segments
Recon-ciliation
VolkswagenGroup
Sales revenue from
external customers 148,157 20,261 4,222 18,151 190,790 1,886 192,676
Intersegment sales revenue 9,917 306 12 1,703 11,938 –11,938 –
Total sales revenue 158,074 20,567 4,234 19,854 202,728 –10,052 192,676
Depreciation and amortization 7,554 1,932 508 3,053 13,047 –50 12,997
Impairment losses 72 12 0 102 186 11 197
Reversal of impairment losses 65 – – 3 68 –8 60
Segment profit or loss
(operating profit or loss) 10,778 358 161 1,586 12,883 –1,373 11,510
Share of profits and losses of
equity-accounted investments 13,512 –93 4 145 13,568 – 13,568
Net interest income and
other financial result –689 –35 –4 –140 –868 1,283 414
Equity-accounted investments 4,906 446 22 1,935 7,309 – 7,309
Investments in intangible assets,
property, plant and equipment,
and investment property 11,576 1,028 181 222 13,007 101 13,108

284
RECONCI LIATION € million 2012 2011
Segment sales revenue 202,728 168,322
Unallocated activities 3,086 2,303
Group financing 37 34
Consolidation adjustments –13,176 –11,322
Group sales revenue 192,676 159,337
Segment profit or loss (operating profit or loss) 12,883 12,115
Unallocated activities 105 70
Group financing –25 –3
Consolidation adjustments –1,453 –912
Operating profit 11,510 11,271
Financial result 13,982 7,655
Consolidated profit before tax 25,492 18,926
BY REGION 2011
€ million Germany
Europe andOther
Regions1 North
America
South
America
Asia/
Oceania Total
Sales revenue from external customers 34,600 69,291 17,553 14,910 22,983 159,337
Intangible assets, property, plant and equipment,
leasing and rental assets, and investment property2 30,705 26,144 9,651 3,556 962 71,017
1 Excluding Germany.
2 The reporting for companies that were initially consolidated in fiscal year 2011 is now more detailed. This improves the allocation
of noncurrent assets to the regions. The figures for fiscal year 2011 were adjusted.
BY REGION 2012
€ million Germany
Europe andOther
Regions* North
America
South
America
Asia/
Oceania Total
Sales revenue from external customers 37,734 77,650 25,046 18,311 33,936 192,676
Intangible assets, property, plant and equipment,
leasing and rental assets, and investment property 73,075 30,084 10,930 3,640 1,321 119,049
* Excluding Germany.
Allocation of sales revenue to the regions follows the destination principle.

285
Income Statement Statement of Comprehensive Income Balance Sheet Statement of Changes in Equity Cash Flow Statement Notes Responsibility Statement Auditors’ Report
CONSOLI DATED FI NANC IAL STATEMENTS
Income Statement Disclosures
1 | Sales revenue
STRUCTU RE OF GROU P SALES REVENUE € million 2012 2011
Vehicles 134,537 116,449
Genuine parts 12,070 9,784
Used vehicles and third-party products 7,735 6,023
Engines, powertrains and parts deliveries 8,990 5,438
Power Engineering 4,222 662
Motorcycles 148 –
Rental and leasing business 11,825 10,245
Interest and similar income 6,337 5,535
Other sales revenue 6,812 5,200
192,676 159,337
For segment reporting purposes, the sales revenue of the Group is presented by segment and
market.
Other sales revenue comprises revenue from workshop services, among other things.
Sales revenue from construction contracts amounted to €969 million (previous year: €162
million), mainly related to the Power Engineering segment.
2 | Cost of sales
Cost of sales includes interest expenses of €2,577 million (previous year: €2,402 million)
attributable to the financial services business. This item also includes impairment losses on
intangible assets, property, plant and equipment, and leasing and rental assets in the amount of
€210 million (previous year: €736 million). Impairment losses are based on updated impair-
ment tests and reflect market and exchange rate risks in particular, as well as amended sales
forecasts and reduced product life cycles.
Government grants related to income amounted to €225 million in the fiscal year (previous
year: €225 million) and were generally allocated to the functions.
3 | Distribution expenses
Distribution expenses amounting to €18,850 million (previous year: €14,582 million) include
nonstaff overheads and personnel costs, and depreciation and amortization applicable to the
distribution function, as well as the costs of shipping, advertising and sales promotions.

286
4 | Administrative expenses
Administrative expenses of €6,223 million (previous year: €4,384 million) mainly include non-
staff overheads and personnel costs, as well as depreciation and amortization applicable to the
administrative function.
5 | Other operating income
€ million 2012 2011
Income from reversal of valuation allowances on receivables and
other assets 687 677
Income from reversal of provisions and accruals 2,975 2,495
Income from foreign currency hedging derivatives 1,601 1,678
Income from foreign exchange gains 2,437 2,176
Income from sale of promotional material 193 187
Income from cost allocations 832 752
Income from investment property 65 60
Gains on asset disposals and the reversal of impairment losses 159 163
Miscellaneous other operating income 1,548 1,539
10,496 9,727
Foreign exchange gains mainly comprise gains from changes in exchange rates between the
dates of recognition and payment of receivables and liabilities denominated in foreign currencies,
as well as exchange rate gains resulting from measurement at the closing rate. Foreign exchange
losses from these items are included in other operating expenses.
6 | Other operating expenses
€ million 2012 2011
Valuation allowances on receivables and other assets 1,386 1,392
Losses from foreign currency hedging derivatives 2,817 1,897
Foreign exchange losses 2,329 1,992
Expenses from cost allocations 155 132
Expenses for termination agreements 55 22
Losses on disposal of noncurrent assets 66 108
Miscellaneous other operating expenses 2,261 1,913
9,070 7,456

287
Income Statement Statement of Comprehensive Income Balance Sheet Statement of Changes in Equity Cash Flow Statement Notes Responsibility Statement Auditors’ Report
CONSOLI DATED FI NANC IAL STATEMENTS
7 | Share of profits and losses of equity-accounted investments
€ million 2012 2011
Share of profits of equity-accounted investments 13,675 2,578
of which: from joint ventures (13,658) (2,564)
of which: from associates (16) (14)
Share of losses of equity-accounted investments 107 404
of which: from joint ventures (42) (5)
of which: from associates (65) (399)
13,568 2,174
The share of profits and losses of equity-accounted investments in the previous year includes the
amounts from the adjustment of the equity interest in Suzuki Motor Corporation until
September 13, 2011 and the adjustment of the equity interest in MAN SE until November 8,
2011. Following the discontinuation of equity accounting for these companies, an expense of
€263 million was recognized for Suzuki and an expense of €292 million for MAN. The share of
profits and losses of equity-accounted investments in the fiscal year includes the amounts from
the adjustment of the equity interest in Porsche Holding Stuttgart until July 31, 2012. Following
the discontinuation of equity accounting for Porsche Holding Stuttgart, a gain of €10,399
million was recognized; this figure includes the recognition in the income statement of amounts
previously recognized in other comprehensive income.
8 | Finance costs
€ million 2012 2011
Other interest and similar expenses 1,380 1,129
Interest cost included in lease payments 19 17
Interest expenses 1,398 1,146
Interest component of additions to pension provisions 760 722
Interest cost on other liabilities 394 179
Interest cost on liabilities 1,154 901
Finance costs 2,552 2,047

288
9 | Other financial result
€ million 2012 2011
Income from profit and loss transfer agreements 18 24
Cost of loss absorption 16 5
Other income from equity investments 55 58
Other expenses from equity investments 19 21
Income from marketable securities and loans* 113 0
Other interest and similar income 844 885
Gains and losses from fair value remeasurement and impairment of
financial instruments 7 –46
Gains and losses from fair value remeasurement of derivatives not
included in hedging relationships 2,071 6,654
Gains and losses on hedging relationships –107 –21
Other financial result 2,967 7,528
* Including disposal gains/losses.
Gains and losses from the fair value measurement of derivatives not included in hedging
relationships include gains of €1,875 million (previous year: €6,554 million) from the
remeasurement of the put and call options on the outstanding 50.1% of the shares of Porsche
Holding Stuttgart. See note 42 Related party disclosures in accordance with IAS 24 for further
information.
10 | Income tax income/expense
COMPON ENTS OF TAX I NCOME AN D EXPENSE € million 2012 2011
Current tax expense, Germany 2,360 2,758
Current tax expense, abroad 2,152 1,673
Current tax expense 4,513 4,431
of which prior-period expense income (19) (–7)
Income from reversal of tax provisions –317 –80
Current income tax expense 4,196 4,351
Deferred tax income/expense, Germany –308 –799
Deferred tax income/expense, abroad –280 –425
Deferred tax income –588 –1,225
Income tax income/expense 3,608 3,126
The statutory corporation tax rate in Germany for the 2012 assessment period was 15%.
Including trade tax and the solidarity surcharge, this resulted in an aggregate tax rate of 29.5%.
The local income tax rates applied for companies outside Germany vary between 0% and
42%. In the case of split tax rates, the tax rate applicable to undistributed profits is applied.
The realization of tax benefits from tax loss carryforwards from previous years resulted in a
reduction in current income taxes in 2012 of €319 million (previous year: €419 million).

289
Income Statement Statement of Comprehensive Income Balance Sheet Statement of Changes in Equity Cash Flow Statement Notes Responsibility Statement Auditors’ Report
CONSOLI DATED FI NANC IAL STATEMENTS
Previously unused tax loss carryforwards amounted to €11,762 million (previous year: €8,628
million). Tax loss carryforwards amounting to €9,810 million (previous year: €6,742 million)
can be used indefinitely, while €611 million (previous year: €582 million) must be used within
the next ten years. There are additional tax loss carryforwards amounting to €1,341 million
(previous year: €1,304 million) that can be used within a period of 15 or 20 years. Tax loss
carryforwards of €9,885 million (previous year: €5,547 million), of which €724 million
(previous year €551 million) can only be utilized subject to restrictions in the period from 2013
to 2028, were estimated not to be usable overall.
The increase in tax loss carryforwards estimated not to be usable resulted primarily from a
reorganization within the Group, producing a tax loss of €3,000 million; based on the current
earnings projections, this amount must be classified as unusable.
The benefit arising from previously unrecognized tax losses or tax credits of a prior period
that is used to reduce current tax expense amounts to €67 million (previous year: €169 million).
Deferred tax expense was reduced by €37 million (previous year: €23 million) because of a
benefit arising from previously unrecognized tax losses and tax credits of a prior period.
Deferred tax expense arising from the write-down of deferred tax assets amounts to €342
million (previous year: €86 million). Deferred tax income arising from the reversal of a write-
down of a deferred tax asset amounts to €1 million (previous year: €– million).
Tax benefits amounting to €741 million (previous year: €679 million) were recognized
because of tax credits granted by various countries.
No deferred tax assets were recognized for deductible temporary differences of €455 million
(previous year: €159 million) and for tax credits of €409 million (previous year: €437 million)
that would expire in the period from 2014 to 2029, or for tax credits of €45 million (previous
year: €– million) that will not expire.
Due to the change in the statutory provisions in Germany, a refund claim for corporation tax
was recognized as a current tax asset for the first time in fiscal year 2006. It was recognized in
the balance sheet under current tax receivables at a present value of €951 million. The present
value of the refund claim was €600 million at the balance sheet date.
Deferred tax income resulting from changes in tax rates amounted to €133 million at Group
level (previous year: €41 million).
Deferred taxes of €437 million (previous year: €439 million) were recognized without being
offset by deferred tax liabilities in the same amount. The companies concerned expect positive
tax income in future following losses in the fiscal year under review or in the previous year.
€2,678 million (previous year: €1,790 million) of the deferred taxes recognized in the
balance sheet was credited to equity and relates to other comprehensive income. €56 million of
this figure (previous year: €37 million) is attributable to noncontrolling interests. In the fiscal
year under review, deferred taxes declined by €10 million (previous year: €2 million) due to the
effects of capital transactions with noncontrolling interests. Changes in deferred taxes
classified by balance sheet item are presented on pages 251 and 252.
In the reporting period, tax effects of €14 million resulting from equity transaction effects
were credited directly to the capital reserves.
Deferred taxes recognized directly in equity in the fiscal year are presented in detail in the
statement of comprehensive income.

290
DEFERRED TAXES CLASSI FI ED BY BALANCE SHEET ITEM
The following recognized deferred tax assets and liabilities were attributable to recognition and
measurement differences in the individual balance sheet items and to tax loss carryforwards:
D E F E R R E D TA X A S S E T S D E F E R R E D TA X L I A B I L I T I E S
€ million Dec. 31, 2012 Dec. 31, 2011 Dec. 31, 2012 Dec. 31, 2011
Intangible assets 218 348 9,140 4,568
Property, plant and equipment,
and leasing and rental assets* 3,578 3,287 4,904 3,948
Noncurrent financial assets 39 33 41 23
Inventories 1,601 1,345 598 532
Receivables and other assets
(including Financial Services
Division) 1,309 964 5,608 5,136
Other current assets 1,456 1,113 171 199
Pension provisions 4,063 2,279 257 270
Liabilities and other provisions* 7,057 6,434 1,524 374
Tax loss carryforwards net of
valuation allowances 807 938 – –
Tax credits net of valuation
allowances 285 264 – –
Valuation allowances on other
deferred tax assets –114 –84 – –
Gross value* 20,300 16,922 22,243 15,049
of which noncurrent* (13,248) (10,730) (18,624) (12,049)
Offset* 13,339 11,345 13,339 11,345
Consolidation 954 756 145 351
Amount recognized* 7,915 6,333 9,050 4,055
* Prior-period figures adjusted because of the updated purchase price allocation for MAN.

291
Income Statement Statement of Comprehensive Income Balance Sheet Statement of Changes in Equity Cash Flow Statement Notes Responsibility Statement Auditors’ Report
CONSOLI DATED FI NANC IAL STATEMENTS
In accordance with IAS 12, deferred tax assets and liabilities are offset if, and only if, they relate
to income taxes levied by the same taxation authority and relate to the same tax period.
The tax expense of €3,608 million reported for 2012 (previous year: €3,126 million) was
€3,912 million (previous year: €2,457 million) lower than the expected tax expense of €7,520
million that would have resulted from application of a tax rate applicable to undistributed
profits of 29.5% to the profit before tax of the Group. This difference resulted primarily from
the measurement of the existing shares of Porsche Holding Stuttgart at fair value in the course of
the business combination (see the disclosures on the basis of consolidation) and from the fair
value measurement of the call and put options relating to the acquisition of the remaining
interest in Porsche Holding Stuttgart, which do not have any tax effects in the Group.
RECONCI LIATION OF EXPECTED TO EFFECTIVE INCOME TAX € million 2012 2011
Profit before tax 25,492 18,926
Expected income tax expense
(tax rate 29.5%; previous year 29.5%) 7,520 5,583
Reconciliation:
Effect of different tax rates outside Germany –101 –38
Proportion of taxation relating to:
tax-exempt income –1,131 –693
expenses not deductible for tax purposes 345 189
effects of loss carryforwards and tax credits 397 –102
temporary differences for which no deferred taxes were recognized –3,413 –1,839
Tax credits –110 –51
Prior-period tax expense 28 –6
Effect of tax rate changes –133 –41
Other taxation changes 206 124
Effective income tax expense 3,608 3,126
Effective tax rate (%) 14.2 16.5

292
11 | Earnings per share
Basic earnings per share are calculated by dividing profit attributable to shareholders of
Volkswagen AG by the weighted average number of ordinary and preferred shares outstanding
during the reporting period. IAS 33.23 sets out that all potential shares that will be issued upon
the conversion of a mandatory convertible note must be accounted for as issued shares and
included in the calculation of basic and diluted earnings per share. The number of outstanding
preferred shares is therefore increased by the potential preferred shares that would be issued if
the mandatory convertible note issued in November were actually to be converted. The average
number of new preferred shares to be included is based on the maximum conversion ratio
resulting from the minimum conversion price of €154.50. The finance costs associated with the
mandatory convertible note are not included in the calculation of consolidated profit because
the interest component was recognized in other comprehensive income when the note was
issued, and interest expense arises only from the amount of compound interest. Since the
number of basic and diluted shares is identical, basic earnings per share also correspond to diluted
earnings per share.
See note 24 for further information regarding the issuance of the mandatory convertible
note.
O R D I N A R Y P R E F E R R E D
Quantity 2012 2011 2012 2011
Weighted average number of
shares outstanding – basic 295,089,818 295,068,426 172,480,067 170,142,778
Dilutive potential ordinary shares
from the stock option plan 0 7,508 0 0
Weighted average number of
shares outstanding – diluted 295,089,818 295,075,934 172,480,067 170,142,778
€ million 2012 2011
Profit after tax 21,884 15,799
Noncontrolling interests 168 391
Profit attributable to shareholders of Volkswagen AG 21,717 15,409
Basic earnings attributable to ordinary shares 13,699 9,767
Diluted earnings attributable to ordinary shares 13,699 9,767
Basic earnings attributable to preferred shares 8,017 5,642
Diluted earnings attributable to preferred shares 8,017 5,642
€ 2012 2011
Basic earnings per ordinary share 46.42 33.10
Diluted earnings per ordinary share 46.42 33.10
Basic earnings per preferred share 46.48 33.16
Diluted earnings per preferred share 46.48 33.16

293
Income Statement Statement of Comprehensive Income Balance Sheet Statement of Changes in Equity Cash Flow Statement Notes Responsibility Statement Auditors’ Report
CONSOLI DATED FI NANC IAL STATEMENTS
Additional Income Statement Disclosures in Accordance with IAS 23 (Borrowing Costs)
Capitalized borrowing costs amounted to €55 million (previous year: €41 million) and related
mainly to capitalized development costs. An average cost of debt of 3.0% (previous year: 3.6%)
was used as a basis for capitalization in the Volkswagen Group.
Additional Income Statement Disclosures in Accordance with IFRS 7 (Financial Instruments)
CLASSES OF FINANCIAL INSTRUMENTS
Financial instruments are divided into the following classes at the Volkswagen Group:
> financial instruments measured at fair value,
> financial instruments measured at amortized cost and
> financial instruments not falling within the scope of IFRS 7.
Financial instruments not falling within the scope of IFRS 7 include in particular investments in
associates and joint ventures accounted for using the equity method.
N ET GAINS OR LOSSES FROM FINANCIAL I NSTRUMENTS BY MEASU REMENT CATEGORY UN DER IAS 39 € million 2012 2011
Financial instruments at fair value through profit or loss 1,868 6,687
Loans and receivables 4,855 4,506
Available-for-sale financial assets 256 –34
Financial liabilities measured at amortized cost –3,992 –3,588
2,988 7,570
Net gains and losses from financial assets and liabilities at fair value through profit or loss are
composed of the fair value measurement gains and losses on derivatives, including interest and
gains and losses on currency translation.
Net gains and losses from available-for-sale financial assets primarily comprise income and
expenses from marketable securities including disposal gains/losses, impairment losses on
investments and currency translation effects.
Net gains and losses from loans and receivables and from financial liabilities carried at
amortized cost comprise interest income and expenses in accordance with the effective interest
method under IAS 39, including currency translation effects. Interest also includes interest
income and expenses from the lending business of the financial services operations.

294
TOTAL INTEREST I NCOME AN D EXPENSES OF FINANCIAL INSTRUMENTS NOT MEASURED AT FAI R VALU E
TH ROUGH PROFIT OR LOSS € million 2012 2011
Interest income 5,144 4,624
Interest expenses 3,747 3,400
1,396 1,224
IMPAIRMENT LOSSES ON FINANCIAL ASSETS BY CLASS € million 2012 2011
Measured at fair value 6 36
Measured at amortized cost 1,403 1,391
1,409 1,427
Impairment losses relate to write-downs of financial assets, such as valuation allowances on
receivables, marketable securities and unconsolidated subsidiaries. Interest income on
impaired financial assets amounted to €63 million in the fiscal year (previous year: €58
million).
In fiscal year 2012, €4 million (previous year: €3 million) was recognized as an expense and
€49 million (previous year: €39 million) as income from fees and commissions for trust
activities and from financial assets and liabilities not measured at fair value that are not
accounted for using the effective interest method.

295
Income Statement Statement of Comprehensive Income Balance Sheet Statement of Changes in Equity Cash Flow Statement Notes Responsibility Statement Auditors’ Report
CONSOLI DATED FI NANC IAL STATEMENTS
Balance Sheet Disclosures
12 | Intangible assets
CHANGES I N INTANGIBLE ASSETS
BETWEEN JAN UARY 1 AN D DECEMBER 31, 2011
€ million
Brand names Goodwill*
Capitalized costsfor products
underdevelopment
Capitalizeddevelopment
costs forproducts
currently in use
Other intangible
assets Total*
Cost
Balance at Jan. 1, 2011 1,149 3,410 2,025 13,479 2,131 22,194
Foreign exchange
differences 6 12 –91 –28 64 –37
Changes in
consolidated Group 1,701 912 604 1,793 4,725 9,735
Additions – – 1,331 336 204 1,871
Transfers – – –1,068 1,069 33 35
Disposals – 0 104 2,224 220 2,549
Balance at Dec. 31, 2011 2,857 4,334 2,696 14,425 6,937 31,248
Amortization and
impairment
Balance at Jan. 1, 2011 2 – 145 7,645 1,298 9,090
Foreign exchange
differences – – – –22 3 –19
Changes in
consolidated Group – – – – 57 57
Additions to cumulative
amortization 5 – – 1,500 660 2,164
Additions to cumulative
impairment losses 35 0 41 157 11 243
Transfers – – –44 44 0 0
Disposals – 0 82 2,177 204 2,463
Reversal of impairment
losses – – – – 0 0
Balance at Dec. 31, 2011 42 – 61 7,146 1,824 9,073
Carrying amount at
Dec. 31, 2011 2,815 4,334 2,635 7,279 5,113 22,176
* Figures adjusted because of the updated purchase price allocation for MAN.
Other intangible assets comprise in particular concessions, purchased customer lists and
dealer relationships, industrial and similar rights, and licenses in such rights and assets.
Sensitivity analyses have shown that it is unnecessary to recognize impairment losses on
goodwill and other indefinite-lived intangible assets, including where realistic variations are
applied to key assumptions.

296
CHANGES I N INTANGIBLE ASSETS
BETWEEN JAN UARY 1 AN D DECEMBER 31, 2012
€ million
Brand names Goodwill*
Capitalized costsfor products
underdevelopment
Capitalizeddevelopment
costs forproducts
currently in use
Other intangible
assets Total*
Cost
Balance at Jan. 1, 2012 2,857 4,334 2,696 14,425 6,937 31,248
Foreign exchange
differences 40 130 –3 25 –109 83
Changes in
consolidated Group 14,239 19,472 1,017 1,254 1,524 37,505
Additions – – 2,174 441 379 2,994
Transfers – – –2,229 2,244 –14 1
Disposals – – 29 965 277 1,271
Balance at Dec. 31, 2012 17,135 23,935 3,627 17,422 8,441 70,560
Amortization and
impairment
Balance at Jan. 1, 2012 42 – 61 7,146 1,824 9,073
Foreign exchange
differences –1 – 0 16 –9 7
Changes in
consolidated Group 0 – – 0 18 18
Additions to cumulative
amortization 14 – 2 1,910 1,591 3,517
Additions to cumulative
impairment losses – – 1 38 3 42
Transfers – – –17 17 3 3
Disposals – – – 939 271 1,210
Reversal of impairment
losses – – 20 28 0 48
Balance at Dec. 31, 2012 56 – 27 8,160 3,158 11,401
Carrying amount at
Dec. 31, 2012 17,079 23,935 3,599 9,262 5,282 59,158
* Figures adjusted because of the updated purchase price allocation for MAN.
The reported brand names mainly relate to Porsche (€13,823 million), Scania Vehicles and
Services (€1,134 million), MAN Commercial Vehicles (€1,145 million), MAN Power Engineering
(€470 million) and Ducati (€404 million).
€18,871 million of the goodwill recognized as of December 31, 2012 relates to Porsche,
€3,260 million (previous year: €3,139 million) to Scania Vehicles and Services, €708 million
(previous year: €505 million) to MAN Commercial Vehicles, €290 million to Ducati, €257
million (previous year: €254 million) to MAN Power Engineering, €161 million (previous
year: €157 million) to ŠKODA and €152 million (previous year: €153 million) to Porsche Holding
Salzburg. €176 million (previous year: €98 million) of the remaining amount relates to the
Passenger Cars and Light Commercial Vehicles segment, €46 million (previous year: €15 million)
to the Financial Services segment and €13 million (previous year: €13 million) to unallocated
areas. The recoverability test for recognized goodwill is based on value in use and is not affected
by a variation in the growth forecast or in the discount rate of +/–0.5 percentage points.
Of the total research and development costs incurred in 2012, €2,615 million (previous
year: €1,666 million) met the criteria for capitalization under IFRSs.

297
Income Statement Statement of Comprehensive Income Balance Sheet Statement of Changes in Equity Cash Flow Statement Notes Responsibility Statement Auditors’ Report
CONSOLI DATED FI NANC IAL STATEMENTS
The following amounts were recognized as expenses: € million 2012 2011
Research and noncapitalized development costs 6,900 5,537
Amortization of development costs 1,951 1,697
Research and development costs recognized in the income statement 8,851 7,234
13 | Property, plant and equipment
CHANGES I N PROPERTY, PLANT AN D EQU I PMENT BETWEEN JAN UARY 1 AN D DECEMBER 31, 2011
€ million
Land, land rightsand buildings,
includingbuildings on
third-party land*
Technical equipment and
machinery
Otherequipment,
operating andoffice equipment
Payments on account and assets under construction Total*
Cost
Balance at Jan. 1, 2011 18,485 30,331 38,568 3,164 90,548
Foreign exchange differences –106 –292 –165 –13 –576
Changes in consolidated Group 2,723 942 344 174 4,184
Additions 516 1,161 2,402 3,780 7,859
Transfers 491 834 1,068 –2,461 –68
Disposals 150 1,445 681 29 2,304
Balance at Dec. 31, 2011 21,959 31,531 41,537 4,616 99,643
Depreciation and impairment
Balance at Jan. 1, 2011 9,151 23,366 32,128 55 64,701
Foreign exchange differences –36 –208 –151 –2 –396
Changes in consolidated Group 9 1 12 – 22
Additions to cumulative depreciation 625 1,710 2,571 11 4,917
Additions to cumulative impairment losses 10 17 367 6 399
Transfers 14 –13 18 –19 –1
Disposals 64 1,103 640 1 1,807
Reversal of impairment losses – 56 0 12 68
Balance at Dec. 31, 2011 9,710 23,714 34,305 39 67,767
Carrying amount at Dec. 31, 2011 12,249 7,818 7,232 4,577 31,876
of which assets leased under
finance lease contracts
Carrying amount at Dec. 31, 2011 190 69 7 – 266
* Figures adjusted because of the updated purchase price allocation for MAN.

298
Future finance lease payments due, and their present values, are shown in the following table: € million 2012 2013 – 2016 from 2017 Total
Finance lease payments 88 241 232 562
Interest component of finance
lease payments 44 86 89 220
Carrying amount/present value 44 156 143 343
CHANGES I N PROPERTY, PLANT AN D EQU I PMENT BETWEEN JAN UARY 1 AN D DECEMBER 31, 2012
€ million
Land, land rightsand buildings,
includingbuildings on
third-party land*
Technical equipment and
machinery
Otherequipment,
operating andoffice equipment
Payments on account and assets under construction Total*
Cost
Balance at Jan. 1, 2012 21,959 31,531 41,537 4,616 99,643
Foreign exchange differences –48 –67 –242 –40 –397
Changes in consolidated Group 1,537 397 1,482 399 3,816
Additions 810 1,873 3,498 4,009 10,190
Transfers 559 753 1,894 –3,295 –89
Disposals 183 830 1,671 32 2,716
Balance at Dec. 31, 2012 24,633 33,657 46,499 5,657 110,446
Depreciation and impairment
Balance at Jan. 1, 2012 9,710 23,714 34,305 39 67,767
Foreign exchange differences –33 –42 –191 –2 –268
Changes in consolidated Group 18 5 11 – 34
Additions to cumulative depreciation 754 2,059 3,143 12 5,969
Additions to cumulative impairment losses 15 5 15 0 36
Transfers –4 –560 570 –12 –6
Disposals 144 783 1,572 0 2,500
Reversal of impairment losses – 3 0 6 9
Balance at Dec. 31, 2012 10,315 24,395 36,282 30 71,022
Carrying amount at Dec. 31, 2012 14,318 9,262 10,217 5,627 39,424
of which assets leased under
finance lease contracts
Carrying amount at Dec. 31, 2012 285 55 19 – 358
* Figures adjusted because of the updated purchase price allocation for MAN.
Options to purchase buildings and plant leased under the terms of finance leases exist in most
cases, and are also expected to be exercised. Interest rates on the leases vary between 1.6% and
11.0% (previous year: between 2.1% and 11.0%), depending on the market and the date of
inception of the lease.

299
Income Statement Statement of Comprehensive Income Balance Sheet Statement of Changes in Equity Cash Flow Statement Notes Responsibility Statement Auditors’ Report
CONSOLI DATED FI NANC IAL STATEMENTS
Future finance lease payments due, and their present values, are shown in the following table: € million 2013 2014 – 2017 from 2018 Total
Finance lease payments 49 178 270 497
Interest component of finance
lease payments 13 38 27 78
Carrying amount/present value 36 140 243 419
For assets leased under operating leases, payments recognized in the income statement
amounted to €1,164 million (previous year: €794 million). With respect to internally used assets,
€1,024 million (previous year: €690 million) of this figure is attributable to minimum lease
payments and €41 million (previous year: €7 million) to contingent lease payments. The payments
of €99 million (previous year: €97 million) under subleases primarily relate to minimum lease
payments.
Government grants of €418 million (previous year: €530 million) were deducted from the
cost of property, plant and equipment, and noncash benefits received amounting to €4 million
(previous year: €1 million) were not capitalized as the cost of assets.
14 | Leasing and rental assets and investment property
CHANGES I N LEASING AN D RENTAL ASSETS AND I NVESTMENT PROPERTY
BETWEEN JAN UARY 1 AN D DECEMBER 31, 2011
€ million
Leasing andrental assets
Investmentproperty
Total
Cost
Balance at Jan. 1, 2011 15,863 429 16,292
Foreign exchange differences 283 6 289
Changes in consolidated Group 3,171 31 3,202
Additions 7,674 42 7,716
Transfers 0 34 34
Disposals 5,632 17 5,649
Balance at Dec. 31, 2011 21,359 525 21,884
Depreciation and impairment
Balance at Jan. 1, 2011 4,051 177 4,228
Foreign exchange differences 58 1 58
Changes in consolidated Group 8 – 8
Additions to cumulative depreciation 2,584 10 2,594
Additions to cumulative impairment losses 87 1 88
Transfers 0 1 1
Disposals 2,051 4 2,055
Reversal of impairment losses 5 – 5
Balance at Dec. 31, 2011 4,733 185 4,918
Carrying amount at Dec. 31, 2011 16,626 340 16,966

300
The following payments from noncancelable leases and rental agreements were expected to be
received over the coming years: € million 2012 2013 – 2016 from 2017 Total
Lease payments 2,032 2,356 40 4,427
CHANGES I N LEASING AN D RENTAL ASSETS AND I NVESTMENT PROPERTY
BETWEEN JAN UARY 1 AN D DECEMBER 31, 2012
€ million
Leasing andrental assets
Investmentproperty
Total
Cost
Balance at Jan. 1, 2012 21,359 525 21,884
Foreign exchange differences –215 –5 –220
Changes in consolidated Group 1,470 2 1,472
Additions 9,816 34 9,851
Transfers –1 89 89
Disposals 6,976 19 6,996
Balance at Dec. 31, 2012 25,453 626 26,079
Depreciation and impairment
Balance at Jan. 1, 2012 4,733 185 4,918
Foreign exchange differences –69 –1 –70
Changes in consolidated Group 8 2 10
Additions to cumulative depreciation 3,498 14 3,512
Additions to cumulative impairment losses 99 0 99
Transfers –3 6 3
Disposals 2,845 12 2,857
Reversal of impairment losses 2 1 3
Balance at Dec. 31, 2012 5,419 194 5,612
Carrying amount at Dec. 31, 2012 20,034 433 20,467
Leasing and rental assets include assets leased out under the terms of operating leases and
assets covered by long-term buy-back agreements.
Investment property includes apartments rented out and leased dealerships with a fair value
of €758 million (previous year: €642 million). Operating expenses of €50 million (previous
year: €53 million) were incurred for the maintenance of investment property in use. Expenses of
€1 million (previous year: €2 million) were incurred for unused investment property.
The following payments from noncancelable leases and rental agreements are expected to
be received over the coming years: € million 2013 2014 – 2017 from 2018 Total
Lease payments 2,688 2,995 39 5,723

301
Income Statement Statement of Comprehensive Income Balance Sheet Statement of Changes in Equity Cash Flow Statement Notes Responsibility Statement Auditors’ Report
CONSOLI DATED FI NANC IAL STATEMENTS
15 | Equity-accounted investments and other equity investments
CHANGES I N EQU ITY-ACCOUNTED INVESTMENTS AN D OTHER EQUITY I NVESTMENTS
BETWEEN JAN UARY 1 AN D DECEMBER 31, 2011
€ million
Equity-accountedinvestments
Other equityinvestments
Total
Gross carrying amount
at Jan. 1, 2011 13,551 855 14,407
Foreign exchange differences 91 0 91
Changes in consolidated Group –3,863 1,756 –2,107
Additions 195 494 689
Transfers –6 6 –
Disposals* 1,043 21 1,064
Changes recognized in profit or loss 2,740 – 2,740
Dividends –1,487 – –1,487
Other changes recognized in other comprehensive
income* 83 175 258
Balance at Dec. 31, 2011 10,261 3,264 13,526
Impairment losses
Balance at Jan. 1, 2011 24 215 239
Foreign exchange differences 1 –1 0
Changes in consolidated Group – 0 0
Additions – 13 13
Transfers – – –
Disposals – 11 11
Reversal of impairment losses 13 – 13
Balance at Dec. 31, 2011 12 216 228
Carrying amount at Dec. 31, 2011 10,249 3,049 13,298
* The presentation of the recognition of components of OCI in connection with changes in the basis of consolidation was adjusted.

302
CHANGES I N EQU ITY-ACCOUNTED INVESTMENTS AN D OTHER EQUITY I NVESTMENTS
BETWEEN JAN UARY 1 AN D DECEMBER 31, 2012
€ million
Equity-accountedinvestments
Other equityinvestments
Total
Gross carrying amount
at Jan. 1, 2012 10,261 3,264 13,526
Foreign exchange differences –25 –3 –28
Changes in consolidated Group –12,742 –46 –12,788
Additions 10,812 488 11,301
Transfers 0 0 –
Disposals 2 16 17
Changes recognized in profit or loss 3,226 – 3,226
Dividends –3,925 – –3,925
Other changes recognized in other comprehensive
income –243 419 176
Balance at Dec. 31, 2012 7,362 4,107 11,469
Impairment losses
Balance at Jan. 1, 2012 12 216 228
Foreign exchange differences 0 –1 –1
Changes in consolidated Group – 1 1
Additions 41 20 62
Transfers – – –
Disposals – 0 0
Reversal of impairment losses – – –
Balance at Dec. 31, 2012 53 236 290
Carrying amount at Dec. 31, 2012 7,309 3,870 11,179
Equity-accounted investments include joint ventures in the amount of €6,870 million (previous
year: €9,713 million) and associates in the amount of €439 million (previous year: €536 million).
€12,566 million of the changes in the consolidated Group concerning equity-accounted
investments relates to the reclassification of the shares of Porsche Holding Stuttgart because of
the initial consolidation of that company. The income of €10,716 million from the
remeasurement of the existing shares held resulting from discontinuation of equity-method
accounting was reported under additions.
Of the other changes recognized in other comprehensive income, €–245 million (previous
year: €45 million) is attributable to joint ventures and €2 million (previous year: €39 million) to
associates. They are mainly the result of foreign exchange differences in the amount of €–48
million (previous year: €–195 million), actuarial gains/losses in the amount of €–135 million
(previous year: €8 million) and losses on the fair value measurement of cash flow hedges in the
amount of €–185 million (previous year: €–172 million).

303
Income Statement Statement of Comprehensive Income Balance Sheet Statement of Changes in Equity Cash Flow Statement Notes Responsibility Statement Auditors’ Report
CONSOLI DATED FI NANC IAL STATEMENTS
16 | Noncurrent and current financial services receivables
Carryingamount Fair value
Carrying amount Fair value
€ million Current Noncurrent Dec. 31,
2012 Dec. 31,
2012 Current Noncurrent Dec. 31,
2011 Dec. 31,
2011
Receivables from
financing business
Customer financing 17,277 34,460 51,737 52,439 15,321 29,675 44,995 46,092
Dealer financing 11,389 1,330 12,719 12,647 10,631 1,070 11,701 11,702
Direct banking 167 1 168 168 153 – 153 153
28,832 35,791 64,624 65,254 26,104 30,745 56,849 57,947
Receivables from
operating leases 204 – 204 204 166 – 166 166
Receivables from
finance leases 7,875 13,994 21,868 21,944 7,484 11,705 19,188 19,375
36,911 49,785 86,696 87,402 33,754 42,450 76,204 77,489
Noncurrent receivables from the customer financing business mainly bear fixed interest at rates
of between 0.0% and 37.0% (previous year: 0.0% and 37.0%), depending on the market
concerned. They have terms of up to 242 months (previous year: 242 months). The noncurrent
portion of dealer financing is granted at interest rates of between 0.0% and 18.4% (previous
year: 0.0% and 18.4%), depending on the country.
The receivables from customer financing and finance leases contained in financial services
receivables of €86.7 billion (previous year: €76.2 billion) rose by €56 million as a result of a fair
value adjustment from portfolio hedging (previous year: €46 million).
The receivables from customer and dealer financing are secured by vehicles or real property
liens.
The receivables from dealer financing include €124 million (previous year: €104 million)
receivable from affiliated companies.

304
The receivables from finance leases – almost entirely in respect of vehicles – were or are
expected to generate the following cash flows as of December 31, 2011 and December 31, 2012: € million 2012 2013 – 2016 from 2017 Total
Future payments from finance
lease receivables 8,190 12,470 129 20,789
Unearned finance income from
finance leases (discounting) –706 –886 –8 –1,600
Present value of minimum lease
payments outstanding at the
reporting date 7,484 11,584 121 19,188
€ million 2013 2014 – 2017 from 2018 Total
Future payments from finance
lease receivables 8,557 14,827 176 23,561
Unearned finance income from
finance leases (discounting) –683 –1,005 –5 –1,692
Present value of minimum lease
payments outstanding at the
reporting date 7,875 13,822 171 21,868
17 | Noncurrent and current other financial assets
Carryingamount
Carrying amount
€ million Current Noncurrent Dec. 31,
2012 Current Noncurrent Dec. 31,
2011
Positive fair value
of derivatives 832 2,226 3,057 789 9,737 10,526
Marketable securities – 1,612 1,612 – 1,470 1,470
Receivables from
loans, bonds, profit
participation rights
(excluding Interest) 2,777 2,024 4,801 1,986 973 2,959
Miscellaneous
financial assets 2,263 570 2,833 1,479 642 2,121
5,872 6,431 12,304 4,253 12,823 17,076
The noncurrent and current financial assets previously reported in the “Other receivables and
financial assets” item are presented in greater detail in fiscal year 2012. The prior-period
figures were reclassified accordingly.
Other financial assets include receivables from related parties of €5,033 million (previous
year: €2,811 million) and €3,625 million (previous year: €2,858 million) of collateral furnished
for financial liabilities and contingent liabilities. There is no original right of disposal or pledge
for the furnished collateral on the part of the collateral taker.
With the exception of the noncurrent securities, there are no material restrictions on title or
right of use in respect of the reported other financial assets. Default risks are accounted for by
means of valuation allowances.

305
Income Statement Statement of Comprehensive Income Balance Sheet Statement of Changes in Equity Cash Flow Statement Notes Responsibility Statement Auditors’ Report
CONSOLI DATED FI NANC IAL STATEMENTS
The positive fair values of derivatives relate to the following items: € million Dec. 31, 2012 Dec. 31, 2011
Transactions for hedging
foreign currency risk from assets using fair value hedges 11 47
foreign currency risk from liabilities using fair value hedges 16 59
interest rate risk using fair value hedges 671 528
interest rate risk using cash flow hedges 1 6
foreign currency and price risk from future cash flows
(cash flow hedges) 1,802 791
Hedging transactions 2,501 1,430
Assets related to derivatives not included in hedging relationships 556 9,096
3,057 10,526
The positive fair value of transactions for hedging price risk from future cash flows (cash flow
hedges) amounted to €76 million (previous year: €121 million).
Positive fair values of €41 million (previous year: €57 million) were recognized from
transactions for hedging interest rate risk (fair value hedges) used in portfolio hedges.
In the previous year, assets arising from derivatives not included in hedging relationships
included in particular Volkswagen AG’s call options to acquire the outstanding shares of Porsche
Holding Stuttgart in the amount of €8,409 million.
Further details on derivative financial instruments as a whole are given in note 33 Financial
risk management and financial instruments.
18 | Noncurrent and current other receivables
Carryingamount
Carrying amount
€ million Current Noncurrent Dec. 31,
2012 Current Noncurrent Dec. 31,
2011
Recoverable income
taxes 3,092 76 3,168 2,963 39 3,002
Miscellaneous
receivables 1,731 1,595 3,326 1,580 1,543 3,123
4,823 1,671 6,494 4,543 1,582 6,125
Miscellaneous receivables include plan assets to fund post-employment benefits in the amount
of €36 million (previous year: €48 million). This item also includes the share of the technical
provisions attributable to reinsurers amounting to €131 million (previous year: €127 million).
There are no material restrictions on title or right of use in respect of the reported other
receivables. Default risks are accounted for by means of valuation allowances.
Current other receivables are predominantly non-interest-bearing.

306
19 | Tax assets
Carrying amount Carrying amount
€ million Current Noncurrent Dec. 31, 2012 Current Noncurrent Dec. 31, 2011
Deferred tax assets − 7,915 7,915 − 6,333 6,333
Tax receivables 761 552 1,313 623 627 1,249
761 8,466 9,228 623 6,960 7,583
€4,060 million (previous year: €3,553 million) of the deferred tax assets is due within one year.
20 | Inventories
€ million Dec. 31, 2012 Dec. 31, 2011
Raw materials, consumables and supplies 3,506 3,429
Work in progress 3,504 3,324
Finished goods and purchased merchandise 18,015 17,383
Current leasing and rental assets 3,477 3,204
Payments on account 172 210
28,674 27,551
Of the total inventories, €3,576 million (previous year: €2,543 million) is recognized at net
realizable value. At the same time as the relevant revenue was recognized, inventories in the
amount of €150,121 million were included in cost of sales (previous year: €124,813 million).
Valuation allowances recognized as expenses in the reporting period amounted to €748 million
(previous year: €333 million). Vehicles amounting to €260 million (previous year: €227 million)
were assigned as collateral for partial retirement obligations.
21 | Trade receivables
€ million Dec. 31, 2012 Dec. 31, 2011
Trade receivables from
third parties 8,705 8,989
affiliated companies 167 196
joint ventures 1,191 1,267
associates 33 25
other investees and investors 3 1
10,099 10,479

307
Income Statement Statement of Comprehensive Income Balance Sheet Statement of Changes in Equity Cash Flow Statement Notes Responsibility Statement Auditors’ Report
CONSOLI DATED FI NANC IAL STATEMENTS
The fair values of the trade receivables correspond to the carrying amounts.
The trade receivables include receivables from construction contracts accounted for using
the percentage of completion method. These are calculated as follows: € million Dec. 31, 2012 Dec. 31, 2011
Contract costs and proportionate contract profit/loss of construction
contracts 1,704 1,351
of which billed to customers –11 –
Exchange rate effects –2 4
PoC receivables, gross 1,691 1,355
Prepayments received –1,475 –1,157
PoC receivables, net 217 198
Other payments received on account of construction contracts in the amount of €407 million
(previous year: €1 million), for which no construction costs have yet been incurred, are recognized
under other liabilities.
22 | Marketable securities
The marketable securities serve to safeguard liquidity. Marketable securities are quoted, mainly
short-term fixed-income securities and shares allocated to the available-for-sale financial
instruments category.
23 | Cash, cash equivalents and time deposits
€ million Dec. 31, 2012 Dec. 31, 2011
Bank balances 18,017 18,057
Checks, cash-in-hand, bills and call deposits 471 234
18,488 18,291
Bank balances are held at various banks in different currencies and include time deposits as
well as restricted cash (see also note 32).

308
24 | Equity
The subscribed capital of Volkswagen AG is composed of no-par value bearer shares with a
notional value of €2.56. As well as ordinary shares, there are preferred shares that entitle the
bearer to a €0.06 higher dividend than ordinary shares, but do not carry voting rights.
The subscribed capital is composed of 295,089,818 no-par value ordinary shares and
170,142,778 preferred shares. Volkswagen AG issued one ordinary share in connection with
the contribution of Porsche SE’s holding company operating business to Volkswagen AG in the
course of a capital increase with a mixed noncash contribution (for further information, see the
disclosures on the basis of consolidation).
Authorized capital of up to €110 million, expiring on April 18, 2017, was approved for the
issue of new ordinary bearer shares or preferred shares based on the resolution by the Annual
General Meeting on April 19, 2012.
Following the capital increase implemented in fiscal year 2010, there is still authorized
capital of up to €179.4 million, resolved by the Extraordinary General Meeting on December 3,
2009 and expiring on December 2, 2014, to issue up to 70,095,502 new no-par value preferred
bearer shares.
The Annual General Meeting on April 22, 2010 resolved to create contingent capital in the
amount of up to €102.4 million expiring on April 21, 2015 that can be used to issue up to
€5 billion in bonds with warrants and/or convertible bonds.
This authorization was exercised in the reporting period to issue a €2.5 billion mandatory
convertible note to subscribe for preferred shares. The preemptive rights of existing
shareholders were disapplied. The convertible note bears a coupon of 5.50% and matures on
November 9, 2015. The minimum conversion price was set at €154.50, and the maximum
conversion price is €185.40. The conversion price will be adjusted if certain events occur. The
convertible note will be settled by issuing new preferred shares no later than at maturity. Based
on the conversion prices given above, the mandatory convertible note entitles the holders of the
convertible note to subscribe for a maximum of 16,181,229 and a minimum of 13,484,358 no-
par value preferred shares of Volkswagen AG. There was no conversion in the reporting period.
Volkswagen can convert the mandatory convertible note at any time at the minimum conversion
price. Because of the fixed conversion ratio, the mandatory convertible note is recognized, net
of transaction costs (€54 million) and the deferral of taxes (€133 million), in the capital reserves
at an amount of €2,181 million and in the financial liabilities at an amount of €397 million.
CHANGE IN ORDINARY AN D PREFERRED SHARES AND SU BSCRI BED CAPITAL
S H A R E S €
2012 2011 2012 2011
Balance at January 1 465,232,595 465,188,345 1,190,995,443 1,190,882,163
Capital increase 1 – 3 –
Stock option plan – 44,250 – 113,280
Balance at December 31 465,232,596 465,232,595 1,190,995,446 1,190,995,443

309
Income Statement Statement of Comprehensive Income Balance Sheet Statement of Changes in Equity Cash Flow Statement Notes Responsibility Statement Auditors’ Report
CONSOLI DATED FI NANC IAL STATEMENTS
The capital reserves comprise the share premium totaling €11,183 million (previous year:
€9,087 million net of transaction costs of €84 million) from capital increases, the share
premium of €219 million from the issuance of bonds with warrants and an amount of €107
million appropriated on the basis of the capital reduction implemented in 2006. The capital
reserves increased by €2,181 million in the reporting period due to the issuance of the
mandatory convertible note. No amounts were withdrawn from the capital reserves.
DIVIDEN D PROPOSAL
In accordance with section 58(2) of the Aktiengesetz (AktG – German Stock Corporation Act),
the dividend payment by Volkswagen AG is based on the net retained profits reported in the
annual financial statements of Volkswagen AG. Based on the annual financial statements of
Volkswagen AG, net retained profits of €3,200 million are eligible for distribution. The Board of
Management and Supervisory Board will propose to the Annual General Meeting that a total
dividend of €1,639 million, i.e. €3.50 per ordinary share and €3.56 per preferred share, be paid
from the net retained profits. Shareholders are not entitled to a dividend payment until it has
been resolved by the Annual General Meeting.
A dividend of €3.00 per ordinary share and €3.06 per preferred share was distributed in
fiscal year 2012.
NONCONTROLLING INTERESTS
The noncontrolling interests in equity are attributable primarily to shareholders of MAN SE and
Scania AB.
25 | Noncurrent and current financial liabilities
The details of noncurrent and current financial liabilities are presented in the following table:
Carrying
amount Carryingamount
€ million Current Noncurrent Dec. 31,
2012 Current Noncurrent Dec. 31,
2011
Bonds* 12,822 36,883 49,705 11,917 24,029 35,947
Commercial paper and notes 9,206 12,687 21,892 7,732 7,537 15,269
Liabilities to banks 9,670 10,621 20,291 7,474 8,561 16,035
Deposit business 21,974 1,943 23,917 19,997 3,093 23,089
Loans and miscellaneous liabilities 355 1,074 1,428 1,901 923 2,825
Bills of exchange 0 – 0 24 – 24
Finance lease liabilities 33 396 429 44 299 343
54,060 63,603 117,663 49,090 44,442 93,532
* Prior-period figures adjusted because of the updated purchase price allocation for MAN.

310
Of the financial liabilities reported in the consolidated balance sheet, a total of €2,496 million
(previous year: €511 million) is secured, for the most part by real estate liens and leasing
portfolios.
The deposits from direct banking business contained in the financial liabilities of €117.7 billion
(previous year: €93.5 billion) increased by €3.4 million as a result of a fair value adjustment
from portfolio hedging (previous year: increase of €6.3 million).
Asset-backed securities transactions amounting to €17,655 million (previous year: €14,478
million) entered into to refinance the financial services business are included in bonds, commercial
paper and notes, and liabilities from loans. Receivables of €21,543 million (previous year:
€16,795 million) from the customer finance and leasing business are pledged as collateral. The
expected payments are assigned to special purpose vehicles and the financed vehicles trans-
ferred as collateral.
All public and private asset-backed securities transactions of the Volkswagen Financial
Services AG group can be repaid in advance (clean-up call) if less than 9% of the original
transaction volume is outstanding. The asset-backed securities conduit transactions of Volks-
wagen Financial Services (UK) and Volkswagen Financial Services Japan are private trans-
actions that can be terminated at fixed dates.
26 | Noncurrent and current other financial liabilities
Carrying
amount Carryingamount
€ million Current Noncurrent Dec. 31,
2012 Current Noncurrent Dec. 31,
2011
Negative fair values of derivative financial
instruments 1,230 1,587 2,818 1,727 2,247 3,974
Interest payable 731 6 737 749 6 756
Miscellaneous financial liabilities 2,464 803 3,267 2,412 293 2,705
4,425 2,397 6,822 4,888 2,547 7,435
The noncurrent and current financial liabilities previously reported in the “Other liabilities” item
are presented in greater detail in fiscal year 2012. The prior-period figures were reclassified
accordingly.
The negative fair values of derivatives relate to the following items: € million Dec. 31, 2012 Dec. 31, 2011
Transactions for hedging
foreign currency risk from assets using fair value hedges 21 14
foreign currency risk from liabilities using fair value hedges 53 85
interest rate risk using fair value hedges 238 168
interest rate risk using cash flow hedges 77 73
foreign currency and price risk from future cash flows
(cash flow hedges) 1,822 2,607
Hedging transactions 2,211 2,948
Liabilities related to derivatives not included in hedging relationships 607 1,026
2,818 3,974

311
Income Statement Statement of Comprehensive Income Balance Sheet Statement of Changes in Equity Cash Flow Statement Notes Responsibility Statement Auditors’ Report
CONSOLI DATED FI NANC IAL STATEMENTS
Of the other financial liabilities reported in the consolidated balance sheet, a total of €744 million
(previous year: €539 million) is secured, for the most part by real estate liens.
The negative fair value of transactions for hedging price risk from future cash flows (cash
flow hedges) amounted to €26 million (previous year: €35 million).
Negative fair values of €158 million (previous year: €89 million) were recognized from
transactions for hedging interest rate risk (fair value hedges) used in portfolio hedges.
In the previous year, liabilities from derivatives not included in hedging relationships
included the put options written by Volkswagen AG to acquire the outstanding shares of Porsche
Holding Stuttgart in the amount of €87 million.
Further details on derivative financial instruments as a whole are given in note 33 Financial
risk management and financial instruments.
27 | Noncurrent and current other liabilities
Carrying
amount Carryingamount
€ million Current Noncurrent Dec. 31,
2012 Current Noncurrent Dec. 31,
2011
Payments on account received in respect
of orders* 3,891 779 4,671 4,413 1,134 5,548
Liabilities relating to
other taxes 1,652 388 2,040 1,681 322 2,003
social security 458 32 490 433 38 471
wages and salaries 2,730 715 3,446 2,842 459 3,301
Miscellaneous liabilities* 2,380 2,761 5,140 1,827 2,440 4,267
11,111 4,675 15,786 11,196 4,394 15,590
* Prior-period figures adjusted because amounts were aggregated and because of the updated purchase price allocation for MAN.
28 | Tax liabilities
Carrying
amount Carryingamount
€ million Current Noncurrent Dec. 31,
2012 Current Noncurrent Dec. 31,
2011
Deferred tax liabilities* − 9,050 9,050 − 4,055 4,055
Provisions for taxes 1,721 4,239 5,960 2,888 3,721 6,609
Current tax payables 238 − 238 844 − 844
1,959 13,289 15,248 3,732 7,776 11,508
* Prior-period figures adjusted because of the updated purchase price allocation for MAN.
€14 million (previous year: €154 million) of the deferred tax liabilities is due within one year.

312
29 | Provisions for pensions and other post-employment benefits
Provisions for pensions are recognized for commitments in the form of retirement, invalidity
and dependents’ benefits payable under pension plans. The benefits provided by the Group vary
according to the legal, tax and economic circumstances of the country concerned, and usually
depend on the length of service and remuneration of the employees.
Group companies provide occupational pensions under both defined contribution and defined
benefit plans. In the case of defined contribution plans, the Company makes contributions to
state or private pension schemes based on legal or contractual requirements, or on a voluntary
basis. Once the contributions have been paid, there are no further obligations for the Company.
Current contributions are recognized as pension expenses of the period concerned. In 2012,
they amounted to a total of €1,580 million (previous year: €1,237 million) in the Volkswagen
Group. Of this figure, contributions to the compulsory state pension system in Germany amounted
to €1,219 million (previous year: €925 million).
Most pension plans are defined benefit plans, with a distinction made between pensions
financed by provisions and externally funded plans.
The pension provisions for defined benefits are measured using the internationally
accepted projected unit credit method in accordance with IAS 19, under which the future
obligations are measured on the basis of the ratable benefit entitlements earned as of the
balance sheet date. Measurement reflects assumptions as to trends in the relevant variables
affecting the level of benefits. All defined benefit plans require actuarial calculations. Actuarial
gains or losses arise from changes in the number of beneficiaries and differences between
actual trends (for example, in salary and pension increases or changes in interest rates) and the
prior-year assumptions on which calculations were based. Actuarial gains and losses are
recognized in other comprehensive income.
Owing to their benefit character, the obligations of the US Group companies in respect of
post-employment medical care in particular are also carried under provisions for pensions and
other post-employment benefits. These post-employment benefit provisions take into account the
expected long-term rise in the cost of healthcare. A one percentage point increase or decrease in
the assumed healthcare cost trends would only marginally affect the amount of the obligations.
€18 million (previous year: €16 million) was recognized in fiscal year 2012 as an expense for
health care costs. The related carrying amount as of December 31, 2012 was €226 million
(previous year: €196 million).
Since 1996, the occupational pension arrangements of the Volkswagen Group in Germany
have been based on a specially developed expense-related pension model that is classified as a
defined benefit plan under IAS 19. With effect from January 1, 2001, this model was developed
into a pension fund, with the annual remuneration-linked contributions being invested in funds
by Volkswagen Pension Trust e.V. as the trustee. By investing in funds, this model offers an
opportunity for increasing benefit entitlements, while at the same time safeguarding them. For
this reason, almost all Group companies in Germany have now joined the fund. Since the fund
investments held by the trust meet the criteria in IAS 19 for classification as plan assets, they are
deducted from the obligation.
Where the foreign Group companies provide collateral for obligations, this mainly takes the
form of shares, fixed-income securities and real estate.

313
Income Statement Statement of Comprehensive Income Balance Sheet Statement of Changes in Equity Cash Flow Statement Notes Responsibility Statement Auditors’ Report
CONSOLI DATED FI NANC IAL STATEMENTS
The following amounts were recognized in the balance sheet for defined benefit plans: € million Dec. 31, 2012 Dec. 31, 2011 Dec. 31, 2010 Dec. 31, 2009 Dec. 31, 2008
Present value of funded obligations 8,824 7,228 4,885 4,120 3,240
Fair value of plan assets 7,288 6,559 4,554 3,852 3,153
Funded status (net) 1,536 668 331 268 87
Present value of unfunded obligations 22,361 16,023 14,986 13,552 12,743
Unrecognized past service cost 29 33 35 36 22
Amount not recognized as an asset because
of the limit in IAS 19 7 14 22 26 34
Net liability recognized in the balance sheet 23,933 16,739 15,375 13,881 12,886
of which provisions for pensions 23,969 16,787 15,432 13,936 12,955
of which other assets 36 48 57 54 69
The present value of the obligations is calculated as follows: € million 2012 2011
Present value of obligations at January 1 23,251 19,871
Current service cost 573 391
Interest cost 1,102 994
Actuarial gains/losses 5,697 821
Employee contributions to plan assets 41 25
Pension payments from company assets 762 679
Pension payments from plan assets 210 123
Past service cost –10 –10
Gains from plan curtailments and settlements 0 –8
Settlements – –14
Changes in consolidated Group 1,485 2,056
Other changes 84 –19
Foreign exchange differences from foreign plans –67 –54
Present value of obligations at December 31 31,185 23,251
Changes in the composition of the plan assets are shown in the following table: € million 2012 2011
Fair value of plan assets at January 1 6,559 4,554
Expected return on plan assets 342 272
Actuarial gains/losses 108 –184
Employer contributions to plan assets 440 391
Employee contributions to plan assets 41 25
Pension payments from plan assets 210 123
Settlements – 14
Changes in consolidated Group 60 1,706
Other changes 6 –36
Foreign exchange differences from foreign plans –59 –30
Fair value of plan assets at December 31 7,288 6,559

314
Investment of the plan assets to cover future pension obligations resulted in income in the
amount of €450 million (previous year: €88 million).
Plan assets include €20 million (previous year: €17 million) invested in Volkswagen Group
assets and €7 million (previous year: €11 million) in Volkswagen Group debt instruments.
The rate for the expected long-term return on plan assets is based on the long-term returns
actually generated for the portfolio, historical overall market returns and a forecast of expected
returns on the securities classes held in the portfolio. The forecasts are based on detailed
analyses by actuaries and experts in the investment industry. As the remaining period of service
is used as the investment horizon, no major changes were made to assumptions regarding the
expected return.
Employer contributions to plan assets in the next fiscal year are expected to amount to €485
million (previous year: €426 million).
Plan assets consist of the following components: % 2012 2011
Equities 25.3 24.9
Fixed-income securities 56.1 58.6
Cash 6.7 2.6
Real estate 3.3 3.7
Other 8.6 10.3
The following amounts were recognized in the income statement: € million 2012 2011
Current service cost 573 391
Interest cost 1,102 994
Expected return on plan assets 342 272
Past service cost –10 –10
Gains from plan curtailments and settlements 0 –8
Net income and expenses recognized in profit or loss 1,324 1,095
The above amounts are generally included in the personnel costs of the functions in the income
statement. Interest cost on pension provisions and the expected return on plan assets are
presented in finance costs.
€6,900 million (previous year: €2,965 million) of actuarial gains and losses, including non-
controlling interests, recognized in the balance sheet was debited to equity.
The experience adjustments, meaning differences between changes in assets and
obligations expected on the basis of actuarial assumptions and actual changes in those assets
and obligations, are shown in the following table: € million 2012 2011 2010 2009 2008
Differences between expected and actual
developments:
as % of present value of the obligation 0.85 –0.79 0.39 1.16 –1.04
as % of fair value of plan assets 1.45 –2.50 0.13 3.16 –10.47

315
Income Statement Statement of Comprehensive Income Balance Sheet Statement of Changes in Equity Cash Flow Statement Notes Responsibility Statement Auditors’ Report
CONSOLI DATED FI NANC IAL STATEMENTS
Calculation of the pension provisions was based on the following assumptions:
G E R M A N Y A B R O A D
% 2012 2011 2012 2011
Discount rate at December 31 3.20 4.60 4.66 5.39
Expected return on plan assets 4.12 4.14 5.85 6.78
Salary trend 2.78 2.80 3.87 3.81
Pension trend 1.80 1.55 2.29 2.67
Employee turnover rate 1.02 1.10 4.22 4.20
Annual increase in healthcare costs – – 6.08 6.72
30 | Noncurrent and current other provisions
€ million
Obligations arising from
sales Employeeexpenses
Miscellaneousprovisions*
Total*
Balance at Jan. 1, 2011 12,561 3,158 6,964 22,683
Foreign exchange differences 21 –10 –96 –85
Changes in consolidated Group 966 221 1,467 2,654
Utilized 5,180 1,564 1,435 8,179
Additions/New provisions 7,516 2,897 3,457 13,870
Interest cost 118 11 20 148
Reversals 632 190 1,030 1,852
Balance at Dec. 31, 2011 15,370 4,524 9,346 29,240
of which current 7,398 2,682 5,925 16,005
of which noncurrent 7,972 1,842 3,421 13,235
Balance at Jan. 1, 2012 15,370 4,524 9,346 29,240
Foreign exchange differences –119 –26 –157 –302
Changes in consolidated Group 988 482 407 1,877
Utilized 6,025 2,468 2,731 11,223
Additions/New provisions 7,780 3,029 3,108 13,917
Interest cost 246 110 5 361
Reversals 1,116 141 1,550 2,807
Balance at Dec. 31, 2012 17,124 5,509 8,429 31,062
of which current 8,487 3,272 4,930 16,689
of which noncurrent 8,637 2,237 3,499 14,373
* Prior-period figures adjusted because of the updated purchase price allocation for MAN.

316
The obligations arising from sales contain provisions covering all risks relating to the sale of
vehicles, components and genuine parts through to the disposal of end-of-life vehicles. They
primarily comprise warranty claims, calculated on the basis of losses to date and estimated
future losses. They also include provisions for discounts, bonuses and similar allowances which are
incurred after the balance sheet date, but for which there is a legal or constructive obligation
attributable to sales revenue before the balance sheet date.
Provisions for employee expenses are recognized for long-service awards, time credits, the
part-time scheme for employees near to retirement, severance payments and similar obligations,
among other things.
Miscellaneous provisions relate to a wide range of identifiable specific risks and uncertain
obligations, which are measured in the amount of the expected settlement value.
Miscellaneous provisions include provisions amounting to €293 million relating to the
insurance business (previous year: €242 million).
31 | Trade payables
€ million Dec. 31, 2012 Dec. 31, 2011
Trade payables to
third parties 16,978 16,100
affiliated companies 80 129
joint ventures 136 83
associates 68 11
other investees and investors 6 3
17,268 16,325
Additional Balance Sheet Disclosures in Accordance with IFRS 7 (Financial Instruments)
CARRYING AMOU NT OF FINANCIAL INSTRUMENTS BY MEASUREMENT CATEGORY UN DER IAS 39 € million Dec. 31, 2012 Dec. 31, 2011
Financial assets at fair value through profit or loss 556 9,096
Loans and receivables 102,451 92,163
Available-for-sale financial assets 11,306 9,197
Financial liabilities at fair value through profit or loss 607 1,026
Financial liabilities measured at amortized cost* 138,506 112,975
* Prior-period figures adjusted because of the updated purchase price allocation for MAN.
RECONCI LIATION OF BALANCE SHEET ITEMS TO CLASSES OF FI NANCIAL I NSTRUMENTS
The following table shows the reconciliation of the balance sheet items to the relevant classes of
financial instruments, broken down by carrying amount and fair value of the financial
instruments.
The fair value of financial instruments measured at amortized cost, such as receivables and
liabilities, is calculated by discounting using a market rate of interest for a similar risk and
matching maturity. For reasons of materiality, the fair value of current balance sheet items is
deemed to be their carrying amount.

317
Income Statement Statement of Comprehensive Income Balance Sheet Statement of Changes in Equity Cash Flow Statement Notes Responsibility Statement Auditors’ Report
CONSOLI DATED FI NANC IAL STATEMENTS
RECONCI LIATION OF BALANCE SHEET ITEMS TO CLASSES OF FI NANCIAL INSTRUMENTS
AS OF DECEMBER 31, 2011
M E A S U R E D
AT FA I R
VA L U E
M E A S U R E D AT A M O R T I Z E D
C O S T
N O T W I T H I N
S C O P E O F
I F R S 7
B A L A N C E
S H E E T I T E M
AT D E C . 3 1 ,
2 0 1 1
€ million
Carrying amount
Carryingamount Fair value
Carryingamount
Noncurrent assets
Equity-accounted investments – – – 10,249 10,249
Other equity investments 2,033 1,015 1,015 – 3,049
Financial services receivables – 42,450 43,735 – 42,450
Other financial assets 9,737 3,085 3,116 – 12,823
Current assets
Trade receivables – 10,479 10,479 – 10,479
Financial services receivables – 33,754 33,754 – 33,754
Other financial assets 789 3,464 3,464 – 4,253
Marketable securities 6,146 – – – 6,146
Cash, cash equivalents and time
deposits – 18,291 18,291 – 18,291
Noncurrent liabilities
Noncurrent financial liabilities* – 44,442 45,572 – 44,442
Other noncurrent financial
liabilities 2,247 299 298 – 2,547
Current liabilities
Current financial liabilities – 49,090 49,090 – 49,090
Trade payables – 16,325 16,325 – 16,325
Other current financial liabilities 1,727 3,161 3,161 – 4,888
* Prior-period figures adjusted because of the updated purchase price allocation for MAN.

318
RECONCI LIATION OF BALANCE SHEET ITEMS TO CLASSES OF FI NANCIAL INSTRUMENTS
AS OF DECEMBER 31, 2012
M E A S U R E D
AT FA I R
VA L U E
M E A S U R E D AT A M O R T I Z E D
C O S T
N O T W I T H I N
S C O P E O F
I F R S 7
B A L A N C E
S H E E T I T E M
AT D E C . 3 1 ,
2 0 1 2
€ million
Carrying amount
Carryingamount Fair value
Carryingamount
Noncurrent assets
Equity-accounted investments – – – 7,309 7,309
Other equity investments 2,606 1,265 1,265 – 3,870
Financial services receivables – 49,785 50,491 – 49,785
Other financial assets 2,226 4,206 4,279 – 6,431
Current assets
Trade receivables – 10,099 10,099 – 10,099
Financial services receivables – 36,911 36,911 – 36,911
Other financial assets 832 5,041 5,041 – 5,872
Marketable securities 7,433 – – – 7,433
Cash, cash equivalents and time
deposits – 18,488 18,488 – 18,488
Noncurrent liabilities
Noncurrent financial liabilities – 63,603 66,183 – 63,603
Other noncurrent financial
liabilities 1,587 810 816 – 2,397
Current liabilities
Current financial liabilities – 54,060 54,060 – 54,060
Trade payables – 17,268 17,268 – 17,268
Other current financial liabilities 1,230 3,195 3,195 – 4,425

319
Income Statement Statement of Comprehensive Income Balance Sheet Statement of Changes in Equity Cash Flow Statement Notes Responsibility Statement Auditors’ Report
CONSOLI DATED FI NANC IAL STATEMENTS
BALANCE SHEET ITEMS MEASURED AT FAI R VALUE € million Dec. 31, 2011 Level 1 Level 2 Level 3
Financial assets at fair value
through profit or loss
Derivatives 10,526 – 1,942 8,584
Available-for-sale financial assets
Other equity investments 2,033 2,033 – –
Marketable securities 6,146 6,122 24 –
Financial assets measured at fair
value 18,706 8,156 1,966 8,584
Financial liabilities at fair value
through profit or loss
Derivatives 3,974 – 3,379 595
Financial liabilities measured at
fair value 3,974 – 3,379 595
€ million Dec. 31, 2012 Level 1 Level 2 Level 3
Financial assets at fair value
through profit or loss
Derivatives 3,057 – 2,939 119
Available-for-sale financial assets
Other equity investments 2,606 2,606 – –
Marketable securities 7,433 7,419 14 –
Financial assets measured at fair
value 13,096 10,025 2,953 119
Financial liabilities at fair value
through profit or loss
Derivatives 2,818 – 2,757 60
Financial liabilities measured at
fair value 2,818 – 2,757 60

320
The allocation of fair values to the three levels in the fair value hierarchy is based on the
availability of observable market prices in an active market. Level 1 is used to report the fair
value of financial instruments for which a quoted price is available. Examples include
marketable securities and other equity investments measured at fair value. Fair values in Level 2,
e.g. of derivatives, are measured on the basis of market inputs such as exchange rates or yield
curves using market-based valuation techniques. Level 3 fair values are calculated using
valuation techniques that incorporate inputs that are not directly observable in active markets.
In the Volkswagen Group, Level 3 fair values comprise long-term commodity futures because
the prices available on the market must be extrapolated for measurement purposes. Options on
equity instruments and residual value protection models are also reported in Level 3. This
mainly relates to the options on the outstanding shares of Porsche Holding Stuttgart until
July 31, 2012.
CHANGES I N BALANCE SHEET ITEMS MEASURED AT FAI R VALUE BASED ON LEVEL 3
€ million
Financial assetsmeasured at fair value
Financial liabilities measured at fair value
Balance at Jan. 1, 2011 2,118 396
Foreign exchange differences 0 0
Total comprehensive income 6,565 –298
recognized in profit or loss 6,541 –216
recognized in other comprehensive income 23 –81
Additions (purchases) – –
Sales and settlements – 83
Transfers into Level 2 –98 –15
Balance at Dec. 31, 2011 8,584 595
Total gains or losses recognized in profit or loss 6,541 –216
Net other operating expense/income 90 –116
of which attributable to assets/liabilities held at
the reporting date 90 –116
Financial result 6,452 –100
of which attributable to assets/liabilities held at
the reporting date 6,414 17

321
Income Statement Statement of Comprehensive Income Balance Sheet Statement of Changes in Equity Cash Flow Statement Notes Responsibility Statement Auditors’ Report
CONSOLI DATED FI NANC IAL STATEMENTS
€ million
Financial assetsmeasured at fair value
Financial liabilities measured at fair value
Balance at Jan. 1, 2012 8,584 595
Foreign exchange differences 0 0
Total comprehensive income 1,784 486
recognized in profit or loss 1,785 423
recognized in other comprehensive income –1 63
Additions (purchases) – –
Sales and settlements –10,199 21
Transfers into Level 2 –51 –28
Balance at Dec. 31, 2012 119 60
Total gains or losses recognized in profit or loss 1,785 423
Net other operating expense/income 9 –3
of which attributable to assets/liabilities held at
the reporting date –13 24
Financial result 1,776 426
of which attributable to assets/liabilities held at
the reporting date 3 –228
The transfers out of Level 3 into Level 2 comprise commodity futures for which observable quoted
prices are now available again for measurement purposes due to the decline in their remaining
maturities; consequently, no extrapolation is required.
Commodity prices are the key risk variable for the fair value of commodity futures. Sensitivity
analyses are used to present the effect of changes in commodity prices on profit after tax and equity.
If commodity prices for commodity futures classified as Level 3 had been 10% higher (lower)
as of December 31, 2012, profit would have been €4 million (previous year: €34 million) higher
(lower) and equity would have been €18 million (previous year: €38 million) higher (lower).
The key risk variable for measuring options on equity instruments held by the Company is
the relevant enterprise value. Sensitivity analyses are used to present the effect of changes in
risk variables on profit.
If the assumed enterprise values had been 10% higher, profit would have been €14 million
(previous year: €1,322 million) higher. If the assumed enterprise values had been 10% lower,
profit would have been €25 million (previous year: €1,324 million) lower.

322
Residual value risks result from hedging agreements with dealers under which earnings effects
caused by market-related fluctuations in residual values that arise from buy-back obligations
under leases are borne in part by the Volkswagen Group.
The key risk variable influencing the fair value of the options relating to residual value risks
is used car prices. Sensitivity analyses are used to quantify the effects of changes in used car
prices on earnings after tax.
If the prices for the used cars covered by the residual value protection model had been 10%
higher as of December 31, 2012, profit after tax would have been €162 million higher. If the
prices for the used cars covered by the residual value protection model had been 10% lower as
of December 31, 2012, profit after tax would have been €162 million lower.
CHANGES I N CREDIT RISK VALUATION ALLOWANCES ON FINANCIAL ASSETS
€ million
Specific valuation
allowances
Portfolio-basedvaluation
allowances 2012
Specificvaluation
allowances
Portfolio-based valuation
allowances 2011
Balance at Jan. 1 1,983 1,050 3,033 1,951 685 2,636
Exchange rate and other
changes –20 –13 –34 –24 –6 –31
Changes in consolidated
Group 46 13 59 38 19 57
Additions 901 383 1,284 834 484 1,318
Utilization 399 – 399 382 – 382
Reversals 416 203 619 442 124 566
Reclassification –23 23 0 8 –8 –
Balance at Dec. 31 2,072 1,253 3,325 1,983 1,050 3,033
The valuation allowances mainly relate to the credit risks associated with the financial services
business.
The receivables from customer financing and trade receivables include transferred receivables
in the total amount of €570 million and €8 million respectively that were not derecognized in
their entirety because the credit risk remains with the Volkswagen Group. The total purchase
price received of €553 million and €8 million, respectively, is reported in financial liabilities.
The fair values of the receivables and liabilities are not materially different to their carrying
amounts.

323
Income Statement Statement of Comprehensive Income Balance Sheet Statement of Changes in Equity Cash Flow Statement Notes Responsibility Statement Auditors’ Report
CONSOLI DATED FI NANC IAL STATEMENTS
Other Disclosures
32 | Cash flow statement
Cash flows are presented in the cash flow statement classified into cash flows from operating
activities, investing activities and financing activities, irrespective of the format of the balance
sheet.
Cash flows from operating activities are derived indirectly from profit before tax. Profit before
tax is adjusted to eliminate noncash expenditures (mainly depreciation and amortization) and
income. Other noncash income and expenses include in particular income from the remea-
surement of the Porsche call option amounting to €1,875 million (previous year: €6,554 million).
This results in cash flows from operating activities after accounting for changes in working
capital, which also include changes in leasing and rental assets and in financial services
receivables.
Investing activities include additions to property, plant and equipment and equity invest-
ments, additions to capitalized development costs and investments in securities and loans.
Financing activities include outflows of funds from dividend payments and redemption of
bonds, inflows from the capital increase and issuance of bonds, and changes in other financial
liabilities. Please refer to note 24 for information on the inflows from the issuance of a mandatory
convertible note (€2,048 million) contained in the capital contributions.
The changes in balance sheet items that are presented in the cash flow statement cannot be
derived directly from the balance sheet, as the effects of currency translation and changes in the
consolidated Group are noncash transactions and are therefore eliminated.
In 2012, cash flows from operating activities include interest received amounting to €5,740
million (previous year: €7,202 million) and interest paid amounting to €3,915 million (previous
year: €4,796 million). In addition, the share of profits and losses of equity-accounted invest-
ments (note 7) includes dividends amounting to €3,925 million (previous year: €1,487 million).
Dividends amounting to €1,406 million (previous year: €1,034 million) were paid to Volks-
wagen AG shareholders. € million Dec. 31, 2012 Dec. 31, 2011
Cash, cash equivalents and time deposits
as reported in the balance sheet 18,488 18,291
Time deposits and restricted cash –694 –1,796
Cash and cash equivalents as reported in the cash flow statement 17,794 16,495
Time deposits and restricted cash are not classified as cash equivalents. Time deposits have a
contractual maturity of more than three months. Restricted cash at the reporting date amounted
to €128 million (previous year: €– million). The maximum default risk corresponds to its carrying
amount.

324
33 | Financial risk management and financial instruments
1. HEDGI NG GU IDELI NES AND FINANCIAL RISK MANAGEMENT PRINCI PLES
The principles and responsibilities for managing and controlling the risks that could arise from
financial instruments are defined by the Board of Management and monitored by the Supervisory
Board. General rules apply to the Group-wide risk policy; these are oriented on the statutory
requirements and the “Minimum Requirements for Risk Management by Credit Institutions”.
Group Treasury is responsible for operational risk management and control. At present, the
Scania and MAN subgroups are not centrally coordinated by Group Treasury due to reasons of
time or legal restrictions related to stock exchange law. Additionally, the integration process for
both Porsche Holding Stuttgart and Porsche Holding GmbH, Salzburg (Porsche Holding Salzburg)
has not yet been fully completed. All of these companies have their own, well-established risk
management structures. The Executive Committee for Liquidity and Foreign Currency is
regularly informed about current financial risks. In addition, the Group Board of Management
and the Supervisory Board are regularly updated on the current risk situation.
For more information, please see the management report on page 234.
2. CREDIT AN D DEFAU LT RISK
The credit and default risk arising from financial assets involves the risk of default by counter-
parties, and therefore comprises at a maximum the amount of the claims under carrying
amounts receivable from them and the irrevocable credit commitments. The maximum
potential credit and default risk is reduced by collateral held and other credit enhancements in
the amount of €65,267 million (previous year: €59,237 million). The collateral held relates
solely to financial assets carried at amortized cost and mainly serves to secure financial services
receivables and trade receivables. Collateral comprises vehicles and assets transferred as security,
as well as guarantees and real property liens. The risk arising from nonderivative financial
instruments is also accounted for by recognizing bad debt losses. Significant cash and capital
investments, as well as derivatives, are only entered into with prime-rated national and inter-
national counterparties. Risk is additionally limited by a limit system based primarily on credit
assessments by the international rating agencies and on the equity base of the counterparties
concerned.
There were no material concentrations of risk at individual counterparties or counterparty
groups in the past fiscal year due to the global allocation of the Group’s business activities and
the resulting diversification. By contrast, a significant portion of the Group-wide cash and capital
investments, as well as derivatives, was attributable to the German public banking sector as a whole.

325
Income Statement Statement of Comprehensive Income Balance Sheet Statement of Changes in Equity Cash Flow Statement Notes Responsibility Statement Auditors’ Report
CONSOLI DATED FI NANC IAL STATEMENTS
CREDIT AN D DEFAU LT RISK RELATI NG TO FINANCIAL ASSETS BY GROSS CARRYING AMOUNT
€ million
Neither past due
nor impaired
Past due and not
impaired Impaired Dec. 31,
2012
Neitherpast due
norimpaired
Past due and not
impaired
Impaired Dec. 31,
2011
Measured at amortized
cost
Financial services
receivables 83,104 2,767 3,333 89,204 73,332 2,356 2,825 78,513
Trade receivables 7,055 3,111 378 10,544 7,674 2,688 343 10,706
Other receivables 8,832 73 512 9,417 6,460 69 523 7,052
98,991 5,951 4,223 109,165 87,467 5,113 3,691 96,271
There are no past due financial instruments measured at fair value in the Volkswagen Group. In
fiscal year 2012, marketable securities measured at fair value with a cost of €85 million
(previous year: €73 million) were individually impaired.
CREDIT RATING OF THE GROSS CARRYI NG AMOUNTS OF FI NANCIAL ASSETS
THAT ARE NEITHER PAST DUE NOR IMPAIRED € million Risk class 1 Risk class 2 Dec. 31, 2012 Risk class 1 Risk class 2 Dec. 31, 2011
Measured at amortized
cost
Financial services
receivables 67,630 15,475 83,104 62,252 11,080 73,332
Trade receivables 7,054 1 7,055 7,674 0 7,674
Other receivables 8,796 36 8,832 6,427 33 6,460
Measured at fair value 10,108 – 10,108 16,387 – 16,387
93,587 15,512 109,099 92,740 11,114 103,854
The Volkswagen Group performs a credit assessment of borrowers in all loan and lease
agreements, using scoring systems for the high-volume business and rating systems for
corporate customers and receivables from dealer financing. Receivables rated as good are
contained in risk class 1. Receivables from customers whose credit rating is not good but have
not yet defaulted are contained in risk class 2.
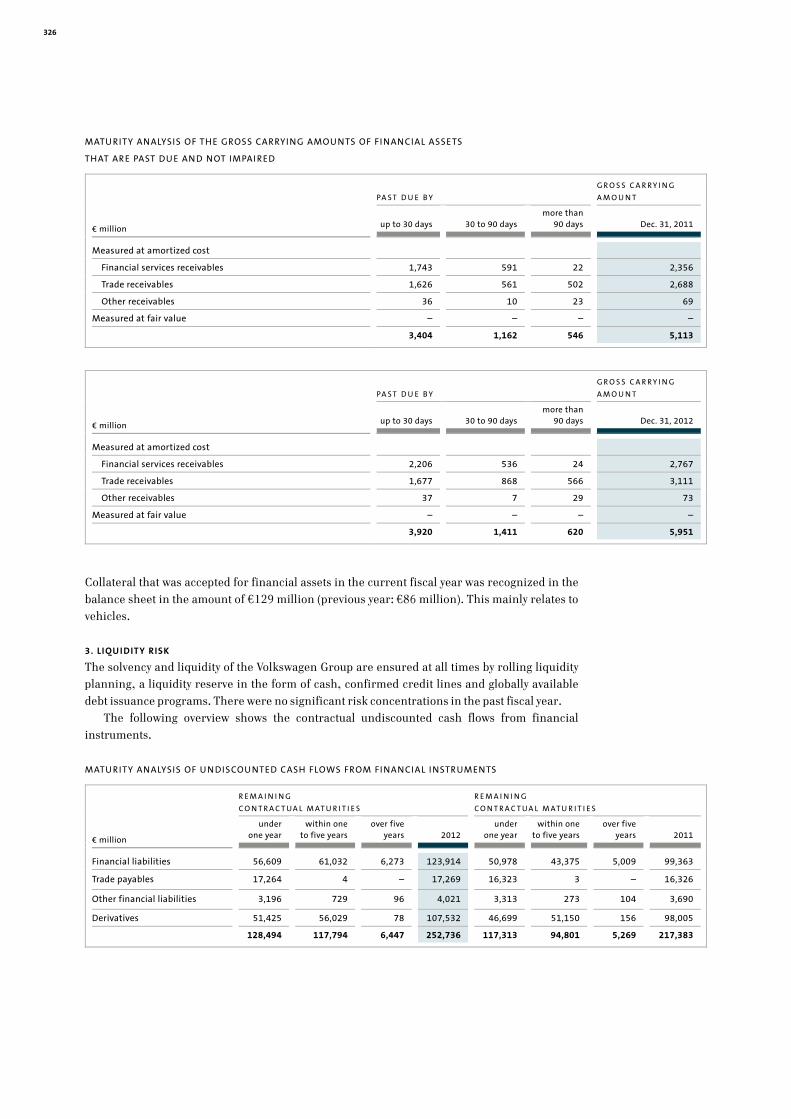
326
MATU RITY ANALYSIS OF THE GROSS CARRYING AMOU NTS OF FINANCIAL ASSETS
THAT ARE PAST DU E AN D NOT IMPAI RED
PA S T D U E B Y
G R O S S C A R R Y I N G
A M O U N T
€ million up to 30 days 30 to 90 days more than
90 days Dec. 31, 2011
Measured at amortized cost
Financial services receivables 1,743 591 22 2,356
Trade receivables 1,626 561 502 2,688
Other receivables 36 10 23 69
Measured at fair value – – – –
3,404 1,162 546 5,113
PA S T D U E B Y
G R O S S C A R R Y I N G
A M O U N T
€ million up to 30 days 30 to 90 days more than
90 days Dec. 31, 2012
Measured at amortized cost
Financial services receivables 2,206 536 24 2,767
Trade receivables 1,677 868 566 3,111
Other receivables 37 7 29 73
Measured at fair value – – – –
3,920 1,411 620 5,951
Collateral that was accepted for financial assets in the current fiscal year was recognized in the
balance sheet in the amount of €129 million (previous year: €86 million). This mainly relates to
vehicles.
3. LIQU IDITY RISK
The solvency and liquidity of the Volkswagen Group are ensured at all times by rolling liquidity
planning, a liquidity reserve in the form of cash, confirmed credit lines and globally available
debt issuance programs. There were no significant risk concentrations in the past fiscal year.
The following overview shows the contractual undiscounted cash flows from financial
instruments.
MATU RITY ANALYSIS OF U N DISCOU NTED CASH FLOWS FROM FI NANCIAL I NSTRUMENTS
R E M A I N I N G
C O N T R A C T UA L M AT U R I T I E S
R E M A I N I N G
C O N T R A C T UA L M AT U R I T I E S
€ million
under one year
within oneto five years
over fiveyears 2012
underone year
within one to five years
over five years 2011
Financial liabilities 56,609 61,032 6,273 123,914 50,978 43,375 5,009 99,363
Trade payables 17,264 4 – 17,269 16,323 3 – 16,326
Other financial liabilities 3,196 729 96 4,021 3,313 273 104 3,690
Derivatives 51,425 56,029 78 107,532 46,699 51,150 156 98,005
128,494 117,794 6,447 252,736 117,313 94,801 5,269 217,383

327
Income Statement Statement of Comprehensive Income Balance Sheet Statement of Changes in Equity Cash Flow Statement Notes Responsibility Statement Auditors’ Report
CONSOLI DATED FI NANC IAL STATEMENTS
Derivatives comprise both cash flows from derivative financial instruments with negative fair
values and cash flows from derivatives with positive fair values for which gross settlement has
been agreed. The cash outflows from derivatives for which gross settlement has been agreed are
matched in part by cash inflows. These cash inflows are not reported in the maturity analysis. If
these cash inflows were also recognized, the cash outflows presented would be substantially lower.
The cash outflows from irrevocable credit commitments are presented in note 37, classified
by contractual maturities.
The maximum potential liability under financial guarantees amounted to €846 million as of
December 31, 2012 (previous year: €542 million). Financial guarantees are assumed to be due
immediately in all cases. They relate primarily to guarantees. The year-on-year increase is
primarily due to the initial consolidation of the newly acquired companies in the reporting period.
4. MARKET RISK
4.1 HEDGI NG POLICY AN D FINANCIAL DERIVATIVES
During the course of its general business activities, the Volkswagen Group is exposed to foreign
currency, interest rate, commodity price, equity price and fund price risk. Corporate policy is to
limit or eliminate such risk by means of hedging. All necessary hedging transactions with the
exception of the Scania, MAN, Porsche Holding Stuttgart and Porsche Holding Salzburg
subgroups are executed or coordinated centrally by Group Treasury. There were no significant
risk concentrations in the past fiscal year.
The following table shows the gains and losses on hedges: € million 2012 2011
Hedging instruments used in fair value hedges 12 206
Hedged items used in fair value hedges –119 –220
Ineffective portion of cash flow hedges 0 –7
The ineffective portion of cash flow hedges represents the income and expenses from changes
in the fair value of hedging instruments that exceed the changes in the fair value of the hedged
items but that are shown to be within the permitted range of 80% to 125% overall when
measuring effectiveness. Such income or expenses are recognized directly in the financial result.
In 2012, €958 million (previous year: €–71 million) from the cash flow hedge reserve was
transferred to the other operating result, reducing earnings, while €14 million (previous
year: €29 million) was transferred to the financial result, reducing earnings, and €–21 million
(previous year: €–24 million) was included in the cost of sales, increasing earnings.
The Volkswagen Group uses two different methods to present market risk from nonderivative
and derivative financial instruments in accordance with IFRS 7. A value-at-risk model is used to
measure foreign currency and interest rate risk in the Volkswagen Financial Services subgroup,
while market risk in the other Group companies is determined using a sensitivity analysis. The
value-at-risk calculation entails determining potential changes in financial instruments in the
event of variations in interest and exchange rates using a historical simulation based on the last
1,000 trading days. Other calculation parameters are a holding period of 40 days and a
confidence level of 99%. The sensitivity analysis calculates the effect on equity and profit or loss
by modifying risk variables within the respective market risks.

328
4.2 MARKET RISK IN TH E VOLKSWAGEN GROU P (EXCLU DING VOLKSWAGEN FINANCIAL SERVICES)
4.2.1 Foreign currency risk
Foreign currency risk in the Volkswagen Group (excluding Volkswagen Financial Services) is attrib-
utable to investments, financing measures and operating activities. Currency forwards,
currency options, currency swaps and cross-currency swaps are used to limit foreign currency
risk. These transactions relate to the exchange rate hedging of all material payments covering
general business activities that are not made in the functional currency of the respective Group
companies. The principle of matching currencies applies to the Group’s financing activities.
Hedging transactions performed in 2012 as part of foreign currency risk management related
primarily to the US dollar, sterling, the Chinese renminbi, the Russian ruble, the Swedish
krona, the Mexican peso, the Australian dollar and the Korean won.
All nonfunctional currencies in which the Volkswagen Group enters into financial instru-
ments are included as relevant risk variables in the sensitivity analysis in accordance with IFRS 7.
If the functional currencies concerned had appreciated or depreciated by 10% against the
other currencies, the exchange rates shown below would have resulted in the following effects
on the hedging reserve in equity and on profit after tax. It is not appropriate to add together the
individual figures, since the results of the various functional currencies concerned are based on
different scenarios.

329
Income Statement Statement of Comprehensive Income Balance Sheet Statement of Changes in Equity Cash Flow Statement Notes Responsibility Statement Auditors’ Report
CONSOLI DATED FI NANC IAL STATEMENTS
D E C . 3 1 , 2 0 1 2 D E C . 3 1 , 2 0 1 1
€ million +10% –10% +10% –10%
Exchange rate
EUR/USD
Hedging reserve 2,000 –1,863 1,519 –1,471
Profit after tax –367 266 –207 185
EUR/GBP
Hedging reserve 1,200 –1,200 897 –897
Profit after tax –53 53 3 –3
EUR/CNY
Hedging reserve 716 –660 271 –271
Profit after tax 4 –34 –76 76
EUR/CHF
Hedging reserve 385 –380 354 –354
Profit after tax –8 5 –6 6
EUR/JPY
Hedging reserve 207 –200 189 –189
Profit after tax –17 11 9 –9
EUR/SEK
Hedging reserve 148 –148 125 –125
Profit after tax –49 49 –26 26
EUR/CAD
Hedging reserve 115 –113 92 –92
Profit after tax –19 15 0 0
EUR/AUD
Hedging reserve 108 –108 97 –97
Profit after tax –7 7 –23 23
CZK/GBP
Hedging reserve 104 –104 88 –88
Profit after tax 0 0 0 0
EUR/CZK
Hedging reserve 52 –52 73 –73
Profit after tax –39 39 –36 36
CZK/USD
Hedging reserve 81 –81 62 –62
Profit after tax –2 2 –2 2
EUR/RUB
Hedging reserve 29 –29 9 –9
Profit after tax –40 40 –49 49
EUR/HUF
Hedging reserve –58 58 –58 58
Profit after tax 2 –2 3 –3

330
4.2.2 Interest rate risk
Interest rate risk in the Volkswagen Group (excluding Volkswagen Financial Services) results
from changes in market interest rates, primarily for medium- and long-term variable interest
receivables and liabilities. Interest rate swaps, cross-currency swaps and other types of interest
rate contracts are entered into to hedge against this risk primarily under fair value or cash flow
hedges, and depending on market conditions. Intragroup financing arrangements are mainly
structured to match the maturities of their refinancing.
Interest rate risk within the meaning of IFRS 7 is calculated for these companies using
sensitivity analyses. The effects of the risk-variable market rates of interest on the financial result
and on equity are presented, net of tax.
If market interest rates had been 100 bps higher as of December 31, 2012, equity would have
been €126 million (previous year: €60 million) lower. If market interest rates had been 100 bps
lower as of December 31, 2012, equity would have been €103 million (previous year: €58 million)
higher.
If market interest rates had been 100 bps higher as of December 31, 2012, profit after tax would
have been €81 million (previous year: €120 million) higher. If market interest rates had been
100 bps lower as of December 31, 2012, profit after tax would have been €67 million (previous
year: €124 million) lower.
4.2.3 Commodity price risk
Commodity price risk in the Volkswagen Group (excluding Volkswagen Financial Services)
primarily results from price fluctuations and the availability of nonferrous metals and precious
metals, as well as of coal, CO2 certificates and rubber. Forward transactions and swaps are entered
into to limit these risks.
Hedge accounting in accordance with IAS 39 was applied in some cases to the hedging of
commodity risk associated with aluminum, copper and coal.
Commodity price risk within the meaning of IFRS 7 is presented using sensitivity analyses.
These show the effect on profit after tax and equity of changes in risk variables in the form of
commodity prices.
If the commodity prices of the hedged metals, coal and rubber had been 10% higher (lower) as
of December 31, 2012, profit after tax would have been €114 million (previous year: €169 million)
higher (lower).
If the commodity prices of the hedging transactions accounted for using hedge accounting
had been 10% higher (lower) as of December 31, 2012, equity would have been €65 million
(previous year: €84 million) higher (lower).
4.2.4 Equity and bond price risk
The Spezialfonds (special funds) launched using surplus liquidity and the equity interests
measured at fair value are subject in particular to equity price and bond price risk, which can
arise from fluctuations in quoted market prices, stock exchange indices and market rates of
interest. The changes in bond prices resulting from variations in the market rates of interest are
quantified in sections 4.2.1 and 4.2.2, as are the measurement of foreign currency and other
interest rate risks arising from the special funds and the equity interests measured at fair value.
As a rule, we counter the risks arising from the special funds by ensuring a broad diversification

331
Income Statement Statement of Comprehensive Income Balance Sheet Statement of Changes in Equity Cash Flow Statement Notes Responsibility Statement Auditors’ Report
CONSOLI DATED FI NANC IAL STATEMENTS
of products, issuers and regional markets when investing funds, as stipulated by our Investment
Guidelines. In addition, we use exchange rate hedges in the form of futures contracts when
market conditions are appropriate.
As part of the presentation of market risk, IFRS 7 requires disclosures on how hypothetical
changes in risk variables affect the price of financial instruments. Potential risk variables here
are in particular quoted market prices or indices, as well as interest rate changes as bond price
parameters.
If share prices had been 10% higher as of December 31, 2012, equity would have been
€222 million (previous year: €159 million) higher. If share prices had been 10% lower as of
December 31, 2012, equity would have been €233 million (previous year: €159 million) lower.
4.3 MARKET RISK AT VOLKSWAGEN FINANCIAL SERVICES
Exchange rate risk in the Volkswagen Financial Services subgroup is mainly attributable to
assets that are not denominated in the functional currency and from refinancing within
operating activities. Interest rate risk relates to refinancing without matching maturities and
the varying interest rate elasticity of individual asset and liability items. The risks are limited by
the use of currency and interest rate hedges.
Microhedges and portfolio hedges are used for interest rate hedging. Fixed-rate assets and
liabilities included in the hedging strategy are recognized at fair value, as opposed to their original
subsequent measurement at amortized cost. The resulting effects in the income statement are
offset by the corresponding gains and losses on the interest rate hedging instruments (swaps).
Currency hedges (currency forwards and cross-currency swaps) are used to mitigate foreign
currency risk. All cash flows in foreign currency are hedged.
As of December 31, 2012, the value at risk was €87 million (previous year: €167 million) for
interest rate risk and €144 million (previous year: €168 million) for foreign currency risk.
The entire value at risk for interest rate and foreign currency risk at the Volkswagen Financial
Services subgroup was €155 million (previous year: €196 million).
5. METHODS FOR MONITORING HEDGE EFFECTIVEN ESS
In the Volkswagen Group, hedge effectiveness is assessed prospectively using the critical terms
match method and using statistical methods in the form of a regression analysis. Retrospective
analysis of effectiveness uses effectiveness tests in the form of the dollar offset method or a
regression analysis.
Under the dollar offset method, the changes in value of the hedged item expressed in monetary
units are compared with the changes in value of the hedging instrument expressed in monetary
units.
Where regression analysis is used, the change in value of the hedged item is presented as an
independent variable, and that of the hedging instrument as a dependent variable. Hedge
relationships are classified as effective if they have sufficient coefficients of determination and
slope factors.

332
NOTIONAL AMOU NT OF DERIVATIVES
R E M A I N I N G T E R M
T O TA L
N O T I O N A L
A M O U N T
T O TA L
N O T I O N A L
A M O U N T
€ million under one year within one to
five years over five years Dec. 31, 2012 Dec. 31, 2011
Notional amount of hedging instruments
used in cash flow hedges:
Interest rate swaps 1,232 4,735 – 5,967 8,954
Currency forwards 36,838 45,454 – 82,293 73,118
Currency options 4,284 8,696 – 12,980 812
Currency swaps 410 501 – 912 647
Cross-currency swaps 432 1,088 17 1,538 1,586
Commodity futures contracts 284 599 – 884 1,133
Notional amount of other derivatives:
Interest rate swaps 18,109 41,638 1,895 61,642 51,832
Interest rate option contracts – – 40 40 63
Currency forwards 6,392 1,001 1 7,394 7,175
Other currency options 254 30 7 290 175
Currency swaps 5,680 121 – 5,800 4,768
Cross-currency swaps 2,363 6,557 7 8,928 7,560
Commodity futures contracts 965 758 – 1,723 2,771
In addition to the derivatives used for hedging foreign currency, interest rate and price risk, the
Group held options and other derivatives on equity instruments at the reporting date whose
remaining maturity is under one year with a notional amount of €1.5 billion (previous year:
€1.5 billion), and options on equity instruments whose remaining maturity is more than one
year with a notional amount of €– billion (previous year: €7.8 billion). In the previous year, this
mainly related to options on the outstanding shares of Porsche Holding Stuttgart.
Existing cash flow hedges in the notional amount of €76 million were discontinued because
of a reduction in the projections. €3 million was transferred from the cash flow hedge reserve to
the other financial result, increasing earnings.
Items hedged under cash flow hedges are expected to be realized in accordance with the
maturity buckets of the hedges reported in the table.
The fair values of the derivatives are estimated using market data at the balance sheet date
as well as by appropriate valuation techniques. The following term structures were used for the
calculation: as % EUR USD GBP CNY RUB SEK MXN AUD KRW
Interest rate for
six months 0.3200 0.5083 0.6669 4.1000 7.6600 1.7275 4.3700 3.3700 2.9300
Interest rate for
one year 0.5420 0.8435 1.0138 4.4002 7.3900 1.9425 4.5300 3.6820 2.9600
Interest rate for
five years 0.7650 0.8215 1.0179 4.2100 7.4500 1.5230 5.1100 3.2900 2.8950
Interest rate for
ten years 1.5650 1.7425 1.8630 4.2500 7.9700 2.0350 5.3450 3.8250 3.1225

333
Income Statement Statement of Comprehensive Income Balance Sheet Statement of Changes in Equity Cash Flow Statement Notes Responsibility Statement Auditors’ Report
CONSOLI DATED FI NANC IAL STATEMENTS
34 | Capital management
The goal of capital management is to ensure that the Group can effectively achieve its goals and
strategies in the interests of shareholders, employees and other stakeholders. In particular,
management focuses on generating the minimum return on invested assets in the Automotive
Division that is required by the capital markets, and on increasing the return on equity in the
Financial Services Division. In addition, the goals of the Financial Services Division are to meet
the banking supervisory authorities’ regulatory capital requirements, to support its external rating
by ensuring capital adequacy and to procure equity for the growth planned in the next fiscal
years. In the process, it aims overall to achieve the highest possible growth in the value of the
Group and its divisions for the benefit of all the Company’s stakeholder groups.
The Volkswagen Group’s financial target system focuses systematically on continuously and
sustainably increasing the value of the Company. In order to maximize the use of resources in the
Automotive Division and to measure the success of this, we have been using value contribution,
a control variable linked to the cost of capital, for a number of years.
The concept of value contribution not only allows overall performance to be measured in the
Automotive Division, but also in the individual business units, projects and products. In addition,
business units and product-specific investment projects can be managed operationally and
strategically using the value contribution.
Equity and financial liabilities are compared in the following table: € million Dec. 31, 2012 Dec. 31, 2011
Equity 81,825 63,354
Proportion of total equity and liabilities as % 26.4 25.0
Noncurrent financial liabilities* 63,603 44,442
Current financial liabilities 54,060 49,090
Total financial liabilities* 117,663 93,532
Proportion of total equity and liabilities as % 38.0 36.9
Total equity and liabilities* 309,644 253,769
* Prior-period figures adjusted because of the updated purchase price allocation for MAN.
35 | Contingent liabilities
€ million Dec. 31, 2012 Dec. 31, 2011
Liabilities under guarantees 846 542
Liabilities under warranty contracts 96 89
Pledges on company assets as security for third-party liabilities 1,487 1,449
Other contingent liabilities 2,188 1,997
4,617 4,077
The trust assets and liabilities of the savings and trust entities belonging to the South American
subsidiaries not included in the consolidated balance sheet amount to €511 million (previous year:
€449 million).
In the case of liabilities from guarantees (financial guarantee contracts), the Group is required
to make specific payments if the debtors fail to meet their financial obligations.

334
Liabilities arising from the pledge of company assets as security for third-party liabilities
primarily include the pledge of claims under certificates of deposit with Bankhaus Metzler in
the amount of €1.5 billion to secure a loan granted to Fleet Investments B.V. by Bankhaus
Metzler (please see the information on the basis of consolidation and joint ventures).
The other contingent liabilities are attributable primarily to potential liabilities arising from
matters relating to taxes and customs duties, as well as to litigation and proceedings relating to
suppliers, dealers, customers and employees.
36 | Litigation
The investigation launched in fiscal year 2010 by the UK Office of Fair Trading (OFT) into Volks-
wagen subsidiaries Scania and MAN SE was discontinued in fiscal year 2011 and forwarded to the
European Commission. The investigations by the European Commission into MAN Truck & Bus AG
and MAN Diesel & Turbo SE launched in fiscal year 2011 due to a suspected possible antitrust
violation in the engines business were discontinued in fiscal year 2012. The investigation into
Scania and MAN launched by the European Commission in fiscal year 2011 concerning alleged
inappropriate exchange of information is continuing. Additionally, in fiscal years 2011/2012,
the South Korean antitrust authorities conducted investigations at MAN Truck & Bus (Korea)
Limited, Seoul/South Korea, and at the Scania-owned import company in South Korea. Such
investigations normally take several years. It is still too early to judge whether these inves-
tigations pose any risk to Scania or MAN.
Based on indications of irregularities in the course of the handover of four-stroke marine
diesel engines by MAN Diesel & Turbo SE, MAN SE's Executive Board launched an investigation
by MAN SE's Compliance department and external advisers. This investigation has shown that it
was possible to externally manipulate the technically calculated fuel consumption figures of
four-stroke marine diesel engines on test beds operated by MAN Diesel & Turbo SE (formerly:
MAN Diesel SE) such that the figures displayed differed from the actual test results. MAN
informed the Munich Public Prosecution Office I about the investigation. The matter was
transferred to the Augsburg Public Prosecution Office at the end of 2011 and is still ongoing.
In the course of their operating activities, Volkswagen AG and the companies in which it is
directly or indirectly invested also become involved in legal disputes and official proceedings in
Germany and internationally. In particular, such proceedings may occur in relation to suppliers,
dealers, customers, employees, or investors.
For the companies involved, these may result in payment or other obligations. Particularly in
cases where US customers assert claims for vehicle defects individually or by way of a class action,
highly cost-intensive measures may have to be taken and substantial compensation or punitive
damages paid. Corresponding risks also result from US patent infringement proceedings.
Where transparent and economically viable, adequate insurance cover is taken out for these
risks and appropriate provisions recognized for the remaining identifiable risks. The Company
does not believe, therefore, that these risks will have a sustained effect on the economic position of
the Group.
However, as some risks cannot be assessed or can only be assessed to a limited extent, the
possibility of loss or damage not being covered by the insured amounts and provisions cannot be
ruled out.

335
Income Statement Statement of Comprehensive Income Balance Sheet Statement of Changes in Equity Cash Flow Statement Notes Responsibility Statement Auditors’ Report
CONSOLI DATED FI NANC IAL STATEMENTS
37 | Other financial obligations
PAYA B L E PAYA B L E PAYA B L E T O TA L
€ million 2012 2013 – 2016 from 2017 Dec. 31,
2011
Purchase commitments in respect of
property, plant and equipment 5,126 775 – 5,901
intangible assets 216 43 – 259
investment property 0 – – 0
Obligations from
loan commitments to unconsolidated
subsidiaries 161 – – 161
irrevocable credit commitments to customers 3,420 128 – 3,548
long-term leasing and rental contracts 644 1,616 2,193 4,453
Miscellaneous other financial obligations 3,943 707 77 4,727
PAYA B L E PAYA B L E PAYA B L E T O TA L
€ million 2013 2014 – 2017 from 2018 Dec. 31,
2012
Purchase commitments in respect of
property, plant and equipment 6,755 1,170 – 7,925
intangible assets 428 98 – 525
investment property 1 – – 1
Obligations from
loan commitments to unconsolidated
subsidiaries 95 – – 95
irrevocable credit commitments to customers 2,747 151 284 3,183
long-term leasing and rental contracts 805 1,996 2,163 4,963
Miscellaneous other financial obligations 4,121 1,215 76 5,412
Other financial obligations from long-term leasing and rental contracts are partly offset by
expected income from subleases of €626 million (previous year: €680 million).
The miscellaneous other financial obligations contain obligations under an irrevocable
credit commitment in the amount of €1.3 billion to LeasePlan Corporation N.V., Amsterdam,
the Netherlands, a Volkswagen Group joint venture, with a term until December 2015. The loan
has not been drawn down to date.

336
38 | Total audit fees of the Group auditors
Under the provisions of the Handelsgesetzbuch (HGB – German Commercial Code), Volkswagen AG
is obliged to disclose the total audit fee of the Group auditors in Germany. € million 2012 2011
Financial statement audit services 12 17
Other assurance services 4 3
Tax advisory services 0 0
Other services 4 10
20 31
39 | Total expense for the period
€ million 2012 2011
Cost of materials
Cost of raw materials, consumables and supplies,
purchased merchandise and services 122,450 104,648
Personnel expenses
Wages and salaries 24,050 19,360
Social security, post-employment and other employee benefit costs 5,453 4,494
29,503 23,854
40 | Average number of employees during the year
2012 2011
Performance-related wage-earners 222,487 196,666
Salaried staff 247,010 203,404
469,497 400,070
of which in the passive phase of partial retirement (6,386) (4,276)
Vocational trainees 14,803 11,706
484,300 411,776
Chinese manufacturing joint ventures 49,169 42,249
533,469 454,025
41 | Events after the balance sheet date
There were no significant events after the end of fiscal year 2012.

337
Income Statement Statement of Comprehensive Income Balance Sheet Statement of Changes in Equity Cash Flow Statement Notes Responsibility Statement Auditors’ Report
CONSOLI DATED FI NANC IAL STATEMENTS
42 | Related party disclosures in accordance with IAS 24
Related parties as defined by IAS 24 are natural persons and entities that Volkswagen AG has the
ability to control or on which it can exercise significant influence, or natural persons and
entities that have the ability to control or exercise significant influence on Volkswagen AG, or
that are influenced by another related party of Volkswagen AG.
At 50.73%, Porsche SE held the majority of the voting rights in Volkswagen AG as of the
reporting date. The creation of rights of appointment for the State of Lower Saxony was resolved
at the Extraordinary General Meeting of Volkswagen AG on December 3, 2009. As a result,
Porsche SE can no longer appoint the majority of the members of Volkswagen AG’s Supervisory
Board for as long as the State of Lower Saxony holds at least 15% of Volkswagen AG’s ordinary
shares. However, Porsche SE has the power to participate in the operating policy decisions of
the Volkswagen Group.
Porsche SE contributed its holding company operating business to Volkswagen AG by way of
singular succession on August 1, 2012. A more detailed description of the transaction, including
the treatment of the options on the outstanding shares of Porsche Holding Stuttgart that existed
until that date, is contained in the section entitled “Basis of consolidation – Consolidated
subsidiaries”.
In addition, the contribution of Porsche SE’s holding company operating business to
Volkswagen AG has the following effects on the agreements between Porsche SE, Volkswagen AG
and companies of the Porsche Holding Stuttgart Group that existed prior to the contribution and
were entered into on the basis of the Comprehensive Agreement and its related implementation
agreements:
> Porsche SE had already issued an undertaking to Volkswagen AG, Porsche Holding Stuttgart and
Porsche AG under an implementation agreement relating to the Comprehensive Agreement to
indemnify those companies in relation to obligations arising from certain legal disputes, tax
liabilities (including interest in accordance with section 233a of the Abgabenordnung (AO –
German Tax Code)) and certain major losses. Unless otherwise described in the following,
these indemnifications ceased to apply effective August 1, 2012 because of the contribution of
Porsche SE’s holding company operating business to Volkswagen AG.
> Moreover, Porsche SE had issued various guarantees relating to Porsche Holding Stuttgart and
Porsche AG to Volkswagen AG under an implementation agreement relating to the Comprehensive
Agreement. Among other things, these related to the proper issuance of and full payment for
shares and capital contributions, to the ownership of the shares of Porsche Holding Stuttgart and
Porsche AG, and to the existence of the approvals, permissions and industrial property rights
required to operate the business activities of Porsche AG. Unless otherwise described in the
following, these indemnifications ceased to apply effective August 1, 2012 because of the con-
tribution of Porsche SE’s holding company operating business to Volkswagen AG.
> Volkswagen AG continues to indemnify Porsche SE against certain financial guarantees issued
by Porsche SE to creditors of the companies belonging to the Porsche Holding Stuttgart Group up
to the amount of its share in the capital of Porsche Holding Stuttgart, which amounts to 100%
since the contribution as of August 1, 2012. Porsche Holding Finance plc, Dublin, Ireland, was
contributed to the Volkswagen Group in the course of the transfer of Porsche SE’s holding company
operating business. Since August 1, 2012, the indemnification therefore includes financial
guarantees issued by Porsche SE to creditors of Porsche Holding Finance plc in relation to interest
payments on and the repayment of bonds in the aggregate amount of €310 million. As part of
the contribution of Porsche SE’s holding company operating business to Volkswagen AG, Volks-
wagen AG undertook to assume standard market liability compensation effective August 1,
2012 for guarantees issued to external creditors, whereby it is indemnified internally.

338
> Until the date of the contribution, Volkswagen AG guaranteed loans made by Porsche Holding
Stuttgart or Porsche AG to Porsche SE in the case that these loans fell due and could not be recovered
because of the insolvency of Porsche Holding Stuttgart or Porsche AG, to the extent that these
obligations could have been settled if the companies had not been insolvent on the due date by
offsetting them against counterclaims against Porsche SE. As a result of the contribution of the
holding company operating business, these loan liabilities were transferred to the Volkswagen
Group with the effect of discharging the liability, such that Volkswagen AG can no longer have
any guarantee obligations to Porsche SE.
> Volkswagen AG continues to indemnify Porsche SE internally against claims by the Einlagen-
sicherungsfonds (German deposit protection fund) after Porsche SE submitted an indemni-
fication agreement required by the Bundesverband Deutscher Banken (Association of German
Banks) to the Einlagensicherungsfonds in August 2009. Volkswagen AG has also undertaken to
indemnify the Einlagensicherungsfonds against any losses caused by measures taken by the latter
in favor of a bank in which Volkswagen AG holds a majority interest.
> Under certain conditions, Porsche SE continues to indemnify Porsche Holding Stuttgart,
Porsche AG and their legal predecessors against tax liabilities that exceed the obligations recognized
in the financial statements of those companies relating to periods up to and including July 31,
2009. In return, Volkswagen AG has undertaken to pay to Porsche SE any tax benefits or tax refunds
of Porsche Holding Stuttgart, Porsche AG and their legal predecessors and subsidiaries for tax
assessment periods up to July 31, 2009.
Under the terms of the Comprehensive Agreement, Porsche SE and Volkswagen AG had granted
each other put and call options with regard to the remaining 50.1% interest in Porsche Holding
Stuttgart held by Porsche SE until the contribution of its holding company operating business to
Volkswagen AG. The strike price for the two options amounted to €3,883 million and was subject
to certain adjustments (see the disclosures on the basis of consolidation). In the course of the
contribution, the legal position of Porsche SE under the put and call options was transferred to
Volkswagen AG in each case such that the options were extinguished due to confusion of rights.
Both Volkswagen AG (if it had exercised its call option) and Porsche SE (if it had exercised its
put option) had undertaken to bear the tax burden resulting from the exercise of the options and
any subsequent activities in relation to the equity investment in Porsche Holding Stuttgart
(e.g. from recapture taxation on the spin-off in 2007 and/or 2009). If tax benefits had accrued to
Volkswagen AG, Porsche Holding Stuttgart, Porsche AG, or their respective subsidiaries as a
result of recapture taxation on the spin-off in 2007 and/or 2009, the purchase price to be paid
by Volkswagen AG for the transfer of the outstanding 50.1% equity investment in Porsche
Holding Stuttgart if the put option had been exercised by Porsche SE would have been increased
by the present value of the tax benefit. This arrangement was taken over under the terms of the
contribution agreement to the effect that Porsche SE has a claim against Volkswagen AG for
payment in the amount of the present value of the realizable tax benefits from any recapture
taxation of the spin-off in 2007 as a result of the contribution. It was also agreed under the terms
of the contribution that Porsche SE will indemnify Volkswagen AG, Porsche Holding Stuttgart
and their subsidiaries against taxes if measures taken by or not taken by Porsche SE result in
recapture taxation for 2012 at these companies in the course of or following implementation of
the contribution. In this case, too, Porsche SE is entitled to assert a claim for payment against
Volkswagen AG in the amount of the present value of the realizable tax benefits that arise at the
level of Volkswagen AG or one of its subsidiaries as a result of such a transaction.
To secure any potential remaining claims by Volkswagen AG under the agreement between
Porsche SE and Volkswagen AG on the acquisition by Volkswagen AG of an interest in Porsche
Holding Stuttgart, a purchase price retention mechanism had been agreed in favor of Volks-

339
Income Statement Statement of Comprehensive Income Balance Sheet Statement of Changes in Equity Cash Flow Statement Notes Responsibility Statement Auditors’ Report
CONSOLI DATED FI NANC IAL STATEMENTS
wagen AG for the case that the put or call options were exercised. The corresponding agree-
ments were extinguished in the course of the contribution of Porsche SE’s holding company
operating business to Volkswagen AG.
Further agreements were entered into and declarations were issued in connection with the
contribution of Porsche SE’s holding company operating business to Volkswagen AG, in
particular:
> Porsche SE issued various guarantees to Volkswagen AG in the course of the contribution relating
to Porsche Holding Stuttgart, Porsche AG and its other transferred investees. Among other
things, these relate to the proper issuance of and full payment for shares and capital con-
tributions, and/or to the ownership of the shares of Porsche Holding Stuttgart and Porsche AG.
> Under the terms of the contribution of its holding company operating business, Porsche SE also
issued guarantees to Volkswagen AG for other assets transferred and liabilities assumed. In
doing so, Porsche SE guarantees that these have not been assigned and are, in principle, free
from third-party rights up to the date of completion of the contribution.
> As a general principle, Porsche SE’s liabilities for these guarantees are restricted to the con-
sideration paid by Volkswagen AG.
> Porsche SE indemnifies its contributed subsidiaries, Porsche Holding Stuttgart, Porsche AG
and their subsidiaries against liabilities to Porsche SE that relate to the period up to and including
December 31, 2011 and that exceed the obligations recognized in the financial statements of
those companies for that period.
> Porsche SE indemnifies Porsche Holding Stuttgart and Porsche AG against obligations arising
from certain legal disputes; this includes the costs of an appropriate legal defense.
> Moreover, Porsche SE indemnifies Volkswagen AG, Porsche Holding Stuttgart, Porsche AG and
their subsidiaries against half of the taxes (other than taxes on income) arising at those
companies in conjunction with the contribution that would not have been incurred in the event
of the exercise of the call option on the shares of Porsche Holding Stuttgart that continued to be
held by Porsche SE until the contribution. Volkswagen AG therefore indemnifies Porsche SE
against half of such taxes that it incurs. In addition, Porsche Holding Stuttgart is indemnified
against half of the land transfer tax and other costs triggered by the merger.
> Additionally, Porsche SE and Porsche AG agreed to allocate any subsequent VAT receivables or
liabilities from transactions in the period up to December 31, 2009 to the company entitled to
the receivable or incurring the liability.
> A range of information, conduct and cooperation obligations were agreed by Porsche SE and
the Volkswagen Group.
According to a notification dated January 9, 2013, the State of Lower Saxony and Hannoversche
Beteiligungsgesellschaft mbH, Hanover, held 20.00% of the voting rights of Volkswagen AG on
December 31, 2012. As mentioned above, the General Meeting of Volkswagen AG on December 3,
2009 also resolved that the State of Lower Saxony may appoint two members of the Supervisory
Board (right of appointment).
Members of the Board of Management and Supervisory Board of Volkswagen AG are members
of supervisory and management boards or shareholders of other companies with which Volks-
wagen AG has relations in the normal course of business. All transactions with related parties
are conducted on an arm’s length basis.
The following tables present the amounts of supplies and services transacted, as well as out-
standing receivables and liabilities, between consolidated companies of the Volkswagen Group
and related parties.

340
RELATED PARTIES
S U P P L I E S A N D S E R V I C E S
R E N D E R E D
S U P P L I E S A N D S E R V I C E S
R E C E I V E D
€ million 2012 2011 2012 2011
Porsche SE 5 1 3 0
Supervisory Board members 2 1 4 0
Board of Management members 0 0 1 0
Unconsolidated subsidiaries 1,084 1,207 771 766
Joint ventures and their majority
interests¹ 14,195 12,699 1,853 1,526
Associates and their majority
interests² 354 335 436 496
Pension plans 2 2 0 0
Other related parties 0 3 0 16
Porsche Holding Salzburg, its
majority interests and joint
ventures³ – 744 – 27
State of Lower Saxony, its
majority interests and joint
ventures 9 9 2 0
1 Porsche Holding Stuttgart and its majority interests until July 31, 2012.
2 Suzuki Motor Corporation until September 13, 2011 and MAN SE until November 9, 2011.
3 Until February 28, 2011.
R E C E I VA B L E S
F R O M
O B L I G AT I O N S
T O
€ million Dec. 31, 2012 Dec. 31, 2011 Dec. 31, 2012 Dec. 31, 2011
Porsche SE 862 0 896 –
Supervisory Board members 0 0 215 162
Board of Management members 0 0 51 63
Unconsolidated subsidiaries 950 652 456 374
Joint ventures and their majority
interests* 4,958 3,886 1,752 2,330
Associates and their majority
interests 40 65 72 53
Pension plans 1 1 8 –
Other related parties – – 16 –
State of Lower Saxony, its
majority interests and joint
ventures 0 4 0 0
* Prior-period figures adjusted.

341
Income Statement Statement of Comprehensive Income Balance Sheet Statement of Changes in Equity Cash Flow Statement Notes Responsibility Statement Auditors’ Report
CONSOLI DATED FI NANC IAL STATEMENTS
The table above does not contain the dividend payments of €3,925 million (previous year:
€1,487 million) received from the joint ventures and dividends of €449 million (previous year:
€329 million) paid to Porsche SE, nor does it contain the cash payment of €4,495 million made
in connection with the contribution of Porsche SE’s holding company operating business.
The supplies and services received from Porsche SE relate mainly to standard market
liability compensation for guarantees assumed. The supplies and services rendered to Porsche SE
relate mainly to interest income on loans granted.
The receivables from Porsche SE comprise a claim for payment of a corporation tax refund
and a receivable under a loan agreement. The obligations to Porsche SE consist mainly of term
deposits.
Obligations to joint ventures contain miscellaneous other financial obligations under an
irrevocable credit commitment in the amount of €1.3 billion to LeasePlan Corporation N.V.,
Amsterdam, the Netherlands, a Volkswagen Group joint venture, with a term until December
2015.
As in the previous year, obligations to members of the Supervisory Board amounting to €215
million (previous year: €162 million) relate primarily to interest-bearing bank balances of
Supervisory Board members that were invested at standard market terms and conditions at
Volkswagen Group companies.
Outstanding balances for bonuses payable to Board of Management members existed in the
amount of €46,520,000 at the end of the fiscal year (previous year: €61,075,000).
In addition to the amounts shown above, the following benefits and remuneration were
recognized for the members of the Board of Management and Supervisory Board of the Volks-
wagen Group in the course of their activities as members of these bodies: € 2012 2011
Short-term benefits 65,134,654 78,005,219
Post-employment benefits 4,253,401 4,818,087
69,388,055 82,823,306
The employee representatives on the Supervisory Board are also entitled to a regular salary as
set out in their employment contracts. This is based on the provisions of the Betriebsver-
fassungsgesetz (BetrVG – German Works Constitution Act) and represents an appropriate
remuneration for their functions and activities in the Company. The same also applies to the
representative of the senior executives on the Supervisory Board.
The post-employment benefits relate to additions to pension provisions for current members
of the Board of Management (see note 45). The expenses shown above do not correspond to the
definition of remuneration of members of the Board of Management and the Supervisory Board
in accordance with the German Corporate Governance Code. Disclosures on pension provisions
for members of the Board of Management can be found in note 45.
342
43 | Notices and disclosure of changes regarding the ownership of voting rights in Volkswagen AG in accordance with the Wertpapierhandelsgesetz (WpHG – German Securities Trading Act)
PORSCHE
1) Porsche Automobil Holding SE, Stuttgart, Germany has notified us in accordance with section
21(1) of the WpHG that its share of the voting rights in Volkswagen Aktiengesellschaft,
Wolfsburg, Germany, exceeded the threshold of 50% on January 5, 2009 and amounted to
50.76% (149,696,680 voting rights) at this date.
2) The following persons notified us in accordance with section 21(1) of the WpHG that their
share of the voting rights in Volkswagen Aktiengesellschaft in each case exceeded the threshold
of 50% on January 5, 2009 and in each case amounted to 50.76% (149,696,680 voting rights) at
this date. All of the above-mentioned 149,696,680 voting rights are attributable to each of the
persons making the notification in accordance with section 22(1) sentence 1 no. 1 of the WpHG.
The voting rights attributed to the persons making the notifications are held via subsidiaries
within the meaning of section 22(3) of the WpHG, whose attributed share of the voting rights
amounts to 3% or more and whose names are given in brackets:
Mag. Josef Ahorner, Austria
(Ferdinand Porsche Privatstiftung, Salzburg/Austria; Ferdinand Porsche Holding GmbH,
Salzburg/Austria; Louise Daxer-Piëch GmbH, Salzburg/Austria; Louise Daxer-Piëch GmbH,
Grünwald/Germany; Prof. Ferdinand Alexander Porsche GmbH, Salzburg/Austria; Ferdinand
Alexander Porsche GmbH, Grünwald/Germany; Gerhard Anton Porsche GmbH, Salzburg/
Austria; Gerhard Porsche GmbH, Grünwald/Germany; Familien Porsche-Daxer-Piëch
Beteiligung GmbH, Grünwald/Germany; Porsche Automobil Holding SE, Stuttgart/Germany),
Mag. Louise Kiesling, Austria
(Ferdinand Porsche Privatstiftung, Salzburg/Austria; Ferdinand Porsche Holding GmbH,
Salzburg/Austria; Louise Daxer-Piëch GmbH, Salzburg/Austria; Louise Daxer-Piëch GmbH,
Grünwald/Germany; Prof. Ferdinand Alexander Porsche GmbH, Salzburg/Austria; Ferdinand
Alexander Porsche GmbH, Grünwald/Germany; Gerhard Anton Porsche GmbH, Salzburg/
Austria; Gerhard Porsche GmbH, Grünwald/Germany; Familien Porsche-Daxer-Piëch
Beteiligung GmbH, Grünwald/Germany; Porsche Automobil Holding SE, Stuttgart/Germany),
Prof. Ferdinand Alexander Porsche, Austria
(Ferdinand Porsche Privatstiftung, Salzburg/Austria; Ferdinand Porsche Holding GmbH,
Salzburg/Austria; Louise Daxer-Piëch GmbH, Salzburg/Austria; Louise Daxer-Piëch GmbH,
Grünwald/Germany; Prof. Ferdinand Alexander Porsche GmbH, Salzburg/Austria; Ferdinand
Alexander Porsche GmbH, Grünwald/Germany; Gerhard Anton Porsche GmbH, Salzburg/
Austria; Gerhard Porsche GmbH, Grünwald/Germany; Familien Porsche-Daxer-Piëch
Beteiligung GmbH, Grünwald/Germany; Porsche Automobil Holding SE, Stuttgart/Germany),
Dr. Oliver Porsche, Austria
(Ferdinand Porsche Privatstiftung, Salzburg/Austria; Ferdinand Porsche Holding GmbH,
Salzburg/Austria; Louise Daxer-Piëch GmbH, Salzburg/Austria; Louise Daxer-Piëch GmbH,
Grünwald/Germany; Prof. Ferdinand Alexander Porsche GmbH, Salzburg/Austria; Ferdinand
Alexander Porsche GmbH, Grünwald/Germany; Gerhard Anton Porsche GmbH, Salzburg/
Austria; Gerhard Porsche GmbH, Grünwald/Germany; Familien Porsche-Daxer-Piëch
Beteiligung GmbH, Grünwald/Germany; Porsche Automobil Holding SE, Stuttgart/Germany),

343
Income Statement Statement of Comprehensive Income Balance Sheet Statement of Changes in Equity Cash Flow Statement Notes Responsibility Statement Auditors’ Report
CONSOLI DATED FI NANC IAL STATEMENTS
Kai Alexander Porsche, Austria
(Ferdinand Porsche Privatstiftung, Salzburg/Austria; Ferdinand Porsche Holding GmbH,
Salzburg/Austria; Louise Daxer-Piëch GmbH, Salzburg/Austria; Louise Daxer-Piëch GmbH,
Grünwald/Germany; Prof. Ferdinand Alexander Porsche GmbH, Salzburg/Austria; Ferdinand
Alexander Porsche GmbH, Grünwald/Germany; Gerhard Anton Porsche GmbH, Salzburg/
Austria; Gerhard Porsche GmbH, Grünwald/Germany; Familien Porsche-Daxer-Piëch
Beteiligung GmbH, Grünwald/Germany; Porsche Automobil Holding SE, Stuttgart/Germany),
Mark Philipp Porsche, Austria
(Ferdinand Porsche Privatstiftung, Salzburg/Austria; Ferdinand Porsche Holding GmbH,
Salzburg/Austria; Louise Daxer-Piëch GmbH, Salzburg/Austria; Louise Daxer-Piëch GmbH,
Grünwald/Germany; Prof. Ferdinand Alexander Porsche GmbH, Salzburg/Austria; Ferdinand
Alexander Porsche GmbH, Grünwald/Germany; Gerhard Anton Porsche GmbH, Salzburg/
Austria; Gerhard Porsche GmbH, Grünwald/Germany; Familien Porsche-Daxer-Piëch
Beteiligung GmbH, Grünwald/Germany; Porsche Automobil Holding SE, Stuttgart/Germany),
Gerhard Anton Porsche, Austria
(Ferdinand Porsche Privatstiftung, Salzburg/Austria; Ferdinand Porsche Holding GmbH,
Salzburg/Austria; Louise Daxer-Piëch GmbH, Salzburg/Austria; Louise Daxer-Piëch GmbH,
Grünwald/Germany; Prof. Ferdinand Alexander Porsche GmbH, Salzburg/Austria; Ferdinand
Alexander Porsche GmbH, Grünwald/Germany; Gerhard Anton Porsche GmbH, Salzburg/
Austria; Gerhard Porsche GmbH, Grünwald/Germany; Familien Porsche-Daxer-Piëch
Beteiligung GmbH, Grünwald/Germany; Porsche Automobil Holding SE, Stuttgart/Germany),
Ing. Hans-Peter Porsche, Austria
(Familie Porsche Privatstiftung, Salzburg/Austria; Familie Porsche Holding GmbH, Salzburg/
Austria; Ing. Hans-Peter Porsche GmbH, Salzburg/Austria; Hans-Peter Porsche GmbH, Grünwald/
Germany; Familie Porsche Beteiligung GmbH, Grünwald/Germany; Porsche Automobil Holding SE,
Stuttgart/Germany),
Peter Daniel Porsche, Austria
(Familie Porsche Privatstiftung, Salzburg/Austria; Familie Porsche Holding GmbH, Salzburg/
Austria; Ing. Hans-Peter Porsche GmbH, Salzburg/Austria; Hans-Peter Porsche GmbH, Grünwald/
Germany; Familie Porsche Beteiligung GmbH, Grünwald/Germany; Porsche Automobil Holding SE,
Stuttgart/Germany),
Dr. Wolfgang Porsche, Germany
(Familie Porsche Privatstiftung, Salzburg/Austria; Familie Porsche Holding GmbH, Salzburg/
Austria; Ing. Hans-Peter Porsche GmbH, Salzburg/Austria; Hans-Peter Porsche GmbH, Grünwald/
Germany; Wolfgang Porsche GmbH, Grünwald/Germany; Familie Porsche Beteiligung GmbH,
Grünwald/Germany; Porsche Automobil Holding SE, Stuttgart/Germany),
Ferdinand Porsche Privatstiftung, Salzburg/Austria
(Ferdinand Porsche Holding GmbH, Salzburg/Austria; Louise Daxer-Piëch GmbH, Salzburg/
Austria; Louise Daxer-Piëch GmbH, Grünwald/Germany; Prof. Ferdinand Alexander Porsche GmbH,
Salzburg/Austria; Ferdinand Alexander Porsche GmbH, Grünwald/Germany; Gerhard Anton
Porsche GmbH, Salzburg/Austria; Gerhard Porsche GmbH, Grünwald/Germany; Familien
Porsche-Daxer-Piëch Beteiligung GmbH, Grünwald/Germany; Porsche Automobil Holding SE,
Stuttgart/Germany),

344
Familie Porsche Privatstiftung, Salzburg/Austria
(Familie Porsche Holding GmbH, Salzburg/Austria; Ing. Hans-Peter Porsche GmbH,
Salzburg/Austria; Hans-Peter Porsche GmbH, Grünwald/Germany; Familie Porsche Beteiligung
GmbH, Grünwald/Germany; Porsche Automobil Holding SE, Stuttgart/Germany),
Ferdinand Porsche Holding GmbH, Salzburg/Austria
(Louise Daxer-Piëch GmbH, Salzburg/Austria; Louise Daxer-Piëch GmbH, Grünwald/Germany;
Prof. Ferdinand Alexander Porsche GmbH, Salzburg/Austria; Ferdinand Alexander Porsche
GmbH, Grünwald/Germany; Gerhard Anton Porsche GmbH, Salzburg/Austria; Gerhard Porsche
GmbH, Grünwald/Germany; Familien Porsche-Daxer-Piëch Beteiligung GmbH, Grünwald/
Germany; Porsche Automobil Holding SE, Stuttgart/Germany),
Familie Porsche Holding GmbH, Salzburg/Austria
(Ing. Hans-Peter Porsche GmbH, Salzburg/Austria; Hans-Peter Porsche GmbH, Grünwald/
Germany; Familie Porsche Beteiligung GmbH, Grünwald/Germany; Porsche Automobil Holding SE,
Stuttgart/Germany),
Louise Daxer-Piëch GmbH, Salzburg/Austria
(Louise Daxer-Piëch GmbH, Grünwald/Germany; Porsche Automobil Holding SE, Stuttgart/
Germany; Familien Porsche-Daxer-Piëch Beteiligung GmbH, Grünwald/Germany),
Prof. Ferdinand Alexander Porsche GmbH, Salzburg/Austria
(Ferdinand Alexander Porsche GmbH, Grünwald/Germany; Familien Porsche-Daxer-Piëch
Beteiligung GmbH, Grünwald/Germany; Porsche Automobil Holding SE, Stuttgart/Germany),
Gerhard Anton Porsche GmbH, Salzburg/Austria
(Gerhard Porsche GmbH, Grünwald/Germany; Familien Porsche-Daxer-Piëch Beteiligung GmbH,
Grünwald/Germany; Porsche Automobil Holding SE, Stuttgart/Germany),
Louise Daxer-Piëch GmbH, Grünwald/Germany
(Familien Porsche-Daxer-Piëch Beteiligung GmbH, Grünwald/Germany; Porsche Automobil
Holding SE, Stuttgart/Germany),
Ferdinand Alexander Porsche GmbH, Grünwald/Germany
(Familien Porsche-Daxer-Piëch Beteiligung GmbH, Grünwald/Germany; Porsche Automobil
Holding SE, Stuttgart/Germany),
Gerhard Porsche GmbH, Grünwald/Germany
(Familien Porsche-Daxer-Piëch Beteiligung GmbH, Grünwald/Germany; Porsche Automobil
Holding SE, Stuttgart/Germany),
Ing. Hans-Peter Porsche GmbH, Salzburg/Austria
(Hans-Peter Porsche GmbH, Grünwald/Germany; Familie Porsche Beteiligung GmbH,
Grünwald/Germany; Porsche Automobil Holding SE, Stuttgart/Germany),

345
Income Statement Statement of Comprehensive Income Balance Sheet Statement of Changes in Equity Cash Flow Statement Notes Responsibility Statement Auditors’ Report
CONSOLI DATED FI NANC IAL STATEMENTS
Hans-Peter Porsche GmbH, Grünwald/Germany
(Familie Porsche Beteiligung GmbH, Grünwald/Germany; Porsche Automobil Holding SE,
Stuttgart/Germany),
Wolfgang Porsche GmbH, Grünwald/Germany
(Familie Porsche Beteiligung GmbH, Grünwald/Germany; Porsche Automobil Holding SE,
Stuttgart/Germany),
Familien Porsche-Daxer-Piëch Beteiligung GmbH, Grünwald/Germany
(Porsche Automobil Holding SE, Stuttgart/Germany),
Familie Porsche Beteiligung GmbH, Grünwald/Germany
(Porsche Automobil Holding SE, Stuttgart/Germany),
Porsche GmbH, Stuttgart/Germany
(Porsche Automobil Holding SE, Stuttgart/Germany),
Dr. Hans Michel Piëch, Austria
(Porsche Automobil Holding SE, Stuttgart/Germany; Hans Michel Piëch GmbH, Grünwald/
Germany; Dr. Hans Michel Piëch GmbH, Salzburg/Austria),
Dr. Hans Michel Piëch GmbH, Salzburg/Austria
(Porsche Automobil Holding SE, Stuttgart/Germany; Hans Michel Piëch GmbH, Grünwald/
Germany),
Hans Michel Piëch GmbH, Grünwald/Germany
(Porsche Automobil Holding SE, Stuttgart/Germany),
Dipl.-Ing. Dr. h.c. Ferdinand Piëch, Austria
(Porsche Automobil Holding SE, Stuttgart/Germany; Ferdinand Piëch GmbH, Grünwald/
Germany; Dipl.-Ing. Dr. h.c. Ferdinand Piëch GmbH, Salzburg/Austria; Ferdinand Karl Alpha
Privatstiftung, Vienna/Austria),
Ferdinand Karl Alpha Privatstiftung, Vienna/Austria
(Porsche Automobil Holding SE, Stuttgart/Germany; Ferdinand Piëch GmbH, Grünwald/
Germany; Dipl.-Ing. Dr. h.c. Ferdinand Piëch GmbH, Salzburg/Austria),
Dipl.-Ing. Dr. h.c. Ferdinand Piëch GmbH, Salzburg/Austria
(Porsche Automobil Holding SE, Stuttgart/Germany; Ferdinand Piëch GmbH, Grünwald/
Germany),
Ferdinand Piëch GmbH, Grünwald/Germany
(Porsche Automobil Holding SE, Stuttgart/Germany).
3) Porsche Holding Gesellschaft m.b.H., Salzburg/Austria, and Porsche GmbH, Salzburg/
Austria, notified us in accordance with section 21(1) of the WpHG that their share of the voting
rights in Volkswagen Aktiengesellschaft in each case exceeded the threshold of 50% on January 5,
2009 and in each case amounted to 53.13% (156,702,015 voting rights) at this date.

346
All the above-mentioned 156,702,015 voting rights are attributable to Porsche Holding
Gesellschaft m.b.H. in accordance with section 22(1) sentence l no. 1 of the WpHG. The
companies via which the voting rights are actually held and whose attributed share of the voting
rights amounts to 3% or more are:
– Porsche GmbH, Salzburg/Austria;
– Porsche GmbH, Stuttgart/Germany;
– Porsche Automobil Holding SE, Stuttgart/Germany.
Of the above-mentioned 156,702,015 voting rights, 50.76% of the voting rights (149,696,753
voting rights) are attributable to Porsche GmbH, Salzburg/Austria, in accordance with section
22(1) sentence 1 no. 1 of the WpHG. The companies via which the voting rights are actually held
and whose attributed share of the voting rights amounts to 3% or more are:
– Porsche GmbH, Stuttgart/Germany;
– Porsche Automobil Holding SE, Stuttgart/Germany.
4) Porsche Wolfgang 1. Beteiligungs GmbH & Co. KG, Stuttgart, Germany has notified us in
accordance with section 21(1) of the WpHG that its (indirect) share of the voting rights in
Volkswagen Aktiengesellschaft, Wolfsburg, Germany, exceeded the thresholds of 3%, 5%, 10%,
15%, 20%, 25%, 30% and 50% of the voting rights on September 29, 2010 and amounted to
50.74% of the voting rights (149,696,680 voting rights) at this date.
Of this figure, 50.74% of the voting rights (149,696,680 voting rights) are attributable to
Porsche Wolfgang 1. Beteiligungs GmbH & Co. KG in accordance with section 22(1) sentence 1
no. 1 of the WpHG.
The voting rights attributed to Porsche Wolfgang 1. Beteiligungs GmbH & Co. KG are held via the
following enterprises controlled by it, whose share of the voting rights in Volkswagen
Aktiengesellschaft amounts to 3% or more in each case: Wolfgang Porsche GmbH, Grünwald,
Familie Porsche Beteiligung GmbH, Grünwald, Porsche Automobil Holding SE, Stuttgart.
QATAR
We have received the following notification:
(1) Pursuant to section 21 (1) WpHG we hereby notify for and on behalf of the State of Qatar,
acting by and through the Qatar Investment Authority, Doha, Qatar, that its indirect voting
rights in Volkswagen Aktiengesellschaft
(a) exceeded the threshold of 10% on December 17, 2009 and amounted to 13.71% of the
voting rights of Volkswagen Aktiengesellschaft (40,440,274 voting rights) as per this date
(i) 6.93% (20,429,274 voting rights) of which have been obtained by the exercise by
Qatar Holding LLC of financial instruments within the meaning of section 25 (1)
sentence 1 WpHG on that date granting the right to acquire shares in Volkswagen
Aktiengesellschaft, and

347
Income Statement Statement of Comprehensive Income Balance Sheet Statement of Changes in Equity Cash Flow Statement Notes Responsibility Statement Auditors’ Report
CONSOLI DATED FI NANC IAL STATEMENTS
(ii) all of which are attributed to the State of Qatar pursuant to section 22 (1) sentence
1 no. 1 WpHG.
(b) exceeded the threshold of 15% on December 18, 2009 and amounted to 17.00% of the
voting rights of Volkswagen Aktiengesellschaft (50,149,012 voting rights) as per this date
(i) 3.29% (9,708,738 voting rights) of which have been obtained by the exercise by
Qatar Holding LLC of financial instruments within the meaning of section 25 (1)
sentence 1 WpHG on that date granting the right to acquire shares in Volkswagen
Aktiengesellschaft, and
(ii) all of which are attributed to the State of Qatar pursuant to section 22 (1) sentence
1 no. 1 WpHG.
Voting rights that are attributed to the State of Qatar pursuant to lit. (a) and (b) above are
held via the following entities which are controlled by it and whose attributed proportion
of voting rights in Volkswagen Aktiengesellschaft amount to 3% each or more:
(aa) Qatar Investment Authority, Doha, Qatar;
(bb) Qatar Holding LLC, Doha, Qatar;
(cc) Qatar Holding Luxembourg II S.à.r.l., Luxembourg; Luxembourg;
(dd) Qatar Holding Netherlands B.V., Amsterdam, The Netherlands.
(2) Pursuant to section 21 (1) WpHG we hereby notify for and on behalf of the Qatar Investment
Authority, Doha, Qatar, that its indirect voting rights in Volkswagen Aktiengesellschaft
(a) exceeded the threshold of 10% on December 17, 2009 and amounted to 13.71% of the
voting rights of Volkswagen Aktiengesellschaft (40,440,274 voting rights) as per this date
(i) 6.93% (20,429,274 voting rights) of which have been obtained by the exercise by
Qatar Holding LLC of financial instruments within the meaning of section 25 (1)
sentence 1 WpHG on that date granting the right to acquire shares in Volkswagen
Aktiengesellschaft, and
(ii) all of which are attributed to the Qatar Investment Authority pursuant to section
22 (1) sentence 1 no. 1 WpHG.
(b) exceeded the threshold of 15% on December 18, 2009 and amounted to 17.00% of the
voting rights of Volkswagen Aktiengesellschaft (50,149,012 voting rights) as per this date

348
(i) 3.29% (9,708,738 voting rights) of which have been obtained by the exercise by
Qatar Holding LLC of financial instruments within the meaning of section 25 (1)
sentence 1 WpHG on that date granting the right to acquire shares in Volkswagen
Aktiengesellschaft, and
(ii) all of which are attributed to the Qatar Investment Authority pursuant to section
22 (1) sentence 1 no. 1 WpHG.
Voting rights that are attributed to the Qatar Investment Authority pursuant to lit. (a) and
(b) above are held via the entities as set forth in (1) (bb) through (dd) which are controlled
by it and whose attributed proportion of voting rights in Volkswagen Aktiengesellschaft
amount to 3% each or more.
(3) Pursuant to section 21 (1) WpHG we hereby notify for and behalf of Qatar Holding LLC,
Doha, Qatar, that its direct and indirect voting rights in Volkswagen Aktiengesellschaft
(a) exceeded the threshold of 10% on December 17, 2009 and amounted to 13.71% of the
voting rights of Volkswagen Aktiengesellschaft (40,440,274 voting rights) as per this date
(i) 6.93% (20,429,274 voting rights) of which have been obtained by the exercise of
financial instruments within the meaning of section 25 (1) sentence 1 WpHG on that
date granting the right to acquire shares in Volkswagen Aktiengesellschaft, and
(ii) 6.78% (20,011,000 voting rights) of which are attributed to Qatar Holding LLC
pursuant to section 22 (1) sentence 1 no. 1 WpHG.
(b) exceeded the threshold of 15% on December 18, 2009 and amounted to 17.00% of the
voting rights of Volkswagen Aktiengesellschaft (50,149,012 voting rights) as per this date
(i) 3.29% (9,708,738 voting rights) of which have been obtained by the exercise of
financial instruments within the meaning of section 25 (1) sentence 1 WpHG on that
date granting the right to acquire shares in Volkswagen Aktiengesellschaft, and
(ii) 6.78% (20,011,000 voting rights) of which are attributed to Qatar Holding LLC
pursuant to section 22 (1) sentence 1 no. 1 WpHG.
Voting rights that are attributed to Qatar Holding LLC pursuant to lit. (a) and (b) above are
held via the entities as set forth in (1) (cc) through (dd) which are controlled by it and
whose attributed proportion of voting rights in Volkswagen Aktiengesellschaft amount to
3% each or more.
We have received the following notification:
(1) Pursuant to section 21 (1) WpHG we hereby notify for and on behalf of Qatar Holding
Luxembourg II S.à.r.l., Luxembourg, Luxembourg, that its indirect voting rights in
Volkswagen Aktiengesellschaft exceeded the thresholds of 10% and 15% on December
18, 2009 and amounted to 17.00% of the voting rights of Volkswagen Aktiengesellschaft
(50,149,012 voting rights) as per this date, all of which are attributed to Qatar Holding
Luxembourg II S.à.r.l. pursuant to section 22 (1) sentence 1 no.1 WpHG.

349
Income Statement Statement of Comprehensive Income Balance Sheet Statement of Changes in Equity Cash Flow Statement Notes Responsibility Statement Auditors’ Report
CONSOLI DATED FI NANC IAL STATEMENTS
Voting rights that are attributed to Qatar Holding Luxembourg II S.à.r.l. are held via the
following entities which are controlled by it and whose attributed proportion of voting
rights in Volkswagen Aktiengesellschaft amount to 3% each or more:
(a) Qatar Holding Netherlands B.V., Amsterdam, The Netherlands;
(b) Qatar Holding Germany GmbH, Frankfurt am Main, Germany.
(2) Pursuant to section 21 (1) WpHG we hereby notify for and on behalf of Qatar Holding
Netherlands B.V., Amsterdam, The Netherlands, that its indirect voting rights in Volkswagen
Aktiengesellschaft exceeded the thresholds of 10% and 15% on December 18, 2009 and
amounted to 17.00% of the voting rights of Volkswagen Aktiengesellschaft (50,149,012
voting rights) as per this date, all of which are attributed to Qatar Holding Luxembourg II
S.à.r.l. pursuant to section 22 (1) sentence 1 no. 1 WpHG.
Voting rights that are attributed to Qatar Holding Netherlands B.V. are held via the entity as
set forth in (1) (b) which is controlled by it and whose attributed proportion of voting rights
in Volkswagen Aktiengesellschaft amounts to 3% or more.
(3) Pursuant to section 21 (1) WpHG we hereby notify for and on behalf of Qatar Holding
Germany GmbH, Frankfurt am Main, Germany, that its direct voting rights in Volkswagen
Aktiengesellschaft exceeded the thresholds of 3%, 5%, 10% and 15% on December 18,
2009 and amounted to 17.00% of the voting rights of Volkswagen Aktiengesellschaft
(50,149,012 voting rights) as per this date.
STATE OF LOWER SAXONY
The State of Lower Saxony notified us on January 9, 2013 that it held a total of 59,022,310
ordinary shares as of December 31, 2012. It held 440 VW ordinary shares directly and
59,021,870 ordinary shares indirectly via Hannoversche Beteiligungsgesellschaft mbH (HanBG),
which is owned by the State of Lower Saxony.
44 | German Corporate Governance Code
On November 23, 2012, the Board of Management and Supervisory Board of Volkswagen AG
issued their declaration of conformity with the German Corporate Governance Code as required
by section 161 of the Aktiengesetz (AktG – German Stock Corporation Act) and made it
permanently available to the shareholders of Volkswagen AG on the Company’s website at
www.volkswagenag.com/ir.
On November 29, 2012, the Board of Management and Supervisory Board of AUDI AG
likewise issued their declaration of conformity with the German Corporate Governance Code
and made it permanently available to the shareholders at www.audi.com/cgk-declaration.
In December 2012, the Executive Board and Supervisory Board of MAN SE issued their
declaration of conformity with the German Corporate Governance Code as required by section
161 of the AktG and made it permanently available to the shareholders at www.man.eu.
The Executive and Supervisory Boards of Renk AG issued a declaration of conformity on
December 14, 2012 and made it permanently available to the shareholders at www.renk.biz.

350
45 | Remuneration of the Board of Management and the Supervisory Board
€ 2012 2011
Board of Management remuneration
Non-performance-related remuneration 9,506,343 9,031,491
Performance-related remuneration 47,000,000 61,555,000
Supervisory Board remuneration
Fixed remuneration components 651,625 380,521
Variable remuneration components 8,125,886 6,995,630
Loans to Supervisory Board members 25,000 12,500
The fixed remuneration of the Board of Management also includes differing levels of
remuneration for appointments assumed at Group companies as well as the cost or cash
equivalent of noncash and other benefits, such as the use of company cars and the payment of
insurance premiums. Taxes due on the noncash benefits were mainly borne by Volkswagen AG. The
variable remuneration paid to each member of the Board of Management comprises a bonus,
which relates to business performance over the preceding two years, and, since 2010, a Long-Term
Incentive (LTI) plan, which is based on the previous four fiscal years, subject to an introductory
phase.
On December 31, 2012, the pension provisions for members of the Board of Management
amounted to €103,535,287 (previous year: €78,627,844). Current pensions are index-linked in
accordance with the index-linking of the highest collectively agreed salary insofar as the
application of section 16 of the Gesetz zur Verbesserung der betrieblichen Altersversorgung
(BetrAVG – German Company Pension Act) does not lead to a larger increase. Members of the
Board of Management with contracts entered into on or after January 1, 2010 are entitled to
payment of their normal remuneration for twelve months in the event of illness. Contracts
entered into before that date grant remuneration for six months. In the event of disability, they
are entitled to the retirement pension. Surviving dependents receive a widow’s pension of
66 2/3% and a 20% orphan’s pension per child based on the pension of the former member of
the Board of Management.
Retired members of the Board of Management and their surviving dependents received
€8,797,230 (previous year: €8,618,915). Provisions for pensions for this group of people were
recognized in the amount of €146,501,307 (previous year: €109,452,277).
Interest-free advances in the total amount of €480,000 (previous year: €480,000) have been
granted to members of the Board of Management. The advances will be set off against performance-
related remuneration in the following year. Loans in the total amount of €25,000 (repayments
in 2012: €1,667) have been granted to members of the Supervisory Board. The loans generally
bear interest at a rate of 4% and have an agreed term of up to 15 years.
The individual remuneration of the members of the Board of Management and the Super-
visory Board is explained in the remuneration report in the management report (see page 138).
A comprehensive assessment of the individual bonus components of the LTI is also to be found there.

351
Income Statement Statement of Comprehensive Income Balance Sheet Statement of Changes in Equity Cash Flow Statement Notes Responsibility Statement Auditors’ Report
CONSOLI DATED FI NANC IAL STATEMENTS
To the best of our knowledge, and in accordance with the applicable reporting principles, the
consolidated financial statements give a true and fair view of the assets, liabilities, financial
position and profit or loss of the Group, and the Group management report includes a fair
review of the development and performance of the business and the position of the Group,
together with a description of the material opportunities and risks associated with the expected
development of the Group.
Wolfsburg, February 12, 2013
Volkswagen Aktiengesellschaft
The Board of Management
Martin Winterkorn Francisco Javier Garcia Sanz Jochem Heizmann
Christian Klingler Michael Macht Horst Neumann
Leif Östling Hans Dieter Pötsch Rupert Stadler
Responsibility Statement
Martin Winterkorn Francisco Javier Garcia Sanz Jochem Heizmann Martin Winterkorn Francisco Javier Garcia Sanz Jochem Heizmann
Christian Klingler Michael Macht Horst Neumann Christian Klingler Michael Macht Horst Neumann
Leif Östling Hans Dieter Pötsch Rupert Stadler

352
On completion of our audit, we issued the following unqualified auditors’ report dated
February 13, 2013. This report was originally prepared in German. In case of ambiguities the
German version takes precedence:
Auditors’ Report
We have audited the consolidated financial statements prepared by the VOLKSWAGEN
AKTIENGESELLSCHAFT, Wolfsburg, comprising the income statement and statement of
comprehensive income, the balance sheet, the statement of changes in equity, the cash flow
statement and the notes to the consolidated financial statements, together with the group
management report, which is combined with the management report of the VOLKSWAGEN
AKTIENGESELLSCHAFT, Wolfsburg, for the business year from January 1 to December 31,
2012. The preparation of the consolidated financial statements and the combined management
report in accordance with the IFRSs, as adopted by the EU, and the additional requirements of
German commercial law pursuant to § (article) 315a Abs. (paragraph) 1 HGB ("Handelsgesetz-
buch": German Commercial Code) are the responsibility of the Company's Board of Manage-
ment. Our responsibility is to express an opinion on the consolidated financial statements and
the combined management report based on our audit.
We conducted our audit of the consolidated financial statements in accordance with § 317 HGB
and German generally accepted standards for the audit of financial statements promulgated by
the Institut der Wirtschaftsprüfer (Institute of Public Auditors in Germany) (IDW). Those
standards require that we plan and perform the audit such that misstatements materially
affecting the presentation of the net assets, financial position and results of operations in the
consolidated financial statements in accordance with the applicable financial reporting
framework and in the combined management report are detected with reasonable assurance.
Knowledge of the business activities and the economic and legal environment of the Group and
expectations as to possible misstatements are taken into account in the determination of audit
procedures. The effectiveness of the accounting-related internal control system and the
evidence supporting the disclosures in the consolidated financial statements and the combined
management report are examined primarily on a test basis within the framework of the audit.
The audit includes assessing the annual financial statements of those entities included in
consolidation, the determination of the entities to be included in consolidation, the accounting
and consolidation principles used and significant estimates made by the Company´s Board of
Management, as well as evaluating the overall presentation of the consolidated financial
statements and the combined management report. We believe that our audit provides a
reasonable basis for our opinion.
Our audit has not led to any reservations.
Auditors’ Report

353
Income Statement Statement of Comprehensive Income Balance Sheet Statement of Changes in Equity Cash Flow Statement Notes Responsibility Statement Auditors’ Report
CONSOLI DATED FI NANC IAL STATEMENTS
In our opinion based on the findings of our audit the consolidated financial statements comply
with the IFRSs, as adopted by the EU, and the additional requirements of German commercial law
pursuant to § 315a Abs. 1 HGB and give a true and fair view of the net assets, financial position
and results of operations of the Group in accordance with these provisions. The combined
management report is consistent with the consolidated financial statements and as a whole
provides a suitable view of the Group's position and suitably presents the opportunities and
risks of future development.
Hanover, February 13, 2013
PricewaterhouseCoopers
Aktiengesellschaft
Wirtschaftsprüfungsgesellschaft
Harald Kayser Martin Schröder
German Public Auditor German Public Auditor

354
Consumption and Emission Data
MODEL
O U T P U T
k W ( P S )
F U E L C O N S U M P T I O N
( l / 1 0 0 k m )
C O 2
E M I S S I O N S
( g / k m )
urban extra-urban combined combined
Audi SQ5 3.0 TDI quattro tiptronic, 8-speed 230 (313) 7.6 6.4 6.8 179
Audi Q5 2.0 TFSI hybrid quattro tiptronic, 8-speed 180 (245) 6.6 7.1 6.9 159
Audi RS 4 Avant 4.2 FSI quattro S tronic, 7-speed 331 (450) 14.6 8.5 10.7 249
Audi RS 5 Cabriolet 4.2 FSI quattro S tronic, 7-speed 331 (450) 14.6 8.5 10.7 249
Audi RS 5 Coupé 4.2 FSI quattro S tronic, 7-speed 331 (450) 14.4 8.3 10.5 246
Audi A6 hybrid tiptronic, 8-speed 180 (245) 6.2 6.2 6.2 145
Audi S6 Avant 4.0 TSFI quattro S tronic, 7-speed 309 (420) 13.4 7.5 9.7 226
Audi S6 saloon 4.0 TFSI quattro S tronic, 7-speed 309 (420) 13.4 7.5 9.6 225
Audi S7 Sportback 4.0 TFSI quattro S tronic, 7-speed 309 (420) 13.4 7.5 9.6 225
Audi A8 2.0 TFSI hybrid tiptronic, 8-speed 180 (245) 6.4 6.2 6.3 147
Audi S8 4.0 TFSI quattro tiptronic, 8-speed 382 (520) 14.4 7.6 10.1 235
Bentley Continental GT 423 (575) 22.4 9.9 14.5 338
Bentley Continental GT V8 373 (507) 15.4 7.7 10.6 246
Bentley Continental GTC 423 (575) 23.0 10.1 14.9 347
Bentley Continental GTC V8 373 (507) 15.8 8.0 10.9 254
Bentley Continental GT Speed 460 (625) 22.4 9.9 14.5 338
Bentley Mulsanne 377 (512) 25.3 11.8 16.9 393
Lamborghini Aventador LP 700-4 Coupé 515 (700) 24.7 10.7 16.0 370
Lamborghini Aventador LP 700-4 Roadster 515 (700) 24.7 10.7 16.0 370
Lamborghini Gallardo LP 560-4 Coupé 412 (560) 20.7 9.6 13.7 325
Lamborghini Gallardo LP 560-4 Spyder 412 (560) 20.8 9.7 13.8 330
Porsche Cayenne S Hybrid 245 (333) 8.7 7.9 8.2 193
Porsche Cayenne S Diesel 281 (382) 10.0 7.3 8.3 218
Porsche Cayenne Turbo S 405 (550) 15.8 8.4 11.5 270
Porsche Panamera GTS 316 (430) 16.1 8.0 10.9 256
Porsche Panamera S Hybrid 245 (333) 8.3 6.4 7.1 167
SEAT Mii Ecofuel Ecomotive (CNG) 50 (68)
5.5 m3
(3.6 kg)
3.8 m3
(2.5 kg)
4.4 m3
(2.9 kg) 79
ŠKODA Citigo CNG Green tec (CNG) 50 (68)
5.5 m3
(3.6 kg)
3.8 m3
(2.5 kg)
4.4 m3
(2.9 kg) 79
Volkswagen Multivan BlueMotion 2.0 TDI 84 (114) 7.6 5.7 6.4 169
Volkswagen eco up! 1.0 EcoFuel (CNG) 50 (68)
5.5 m3
(3.6 kg)
3.8 m3
(2.5 kg)
4.4 m3
(2.9 kg) 79
Volkswagen Golf 1.4 TSI ACT, 6-speed manual 103 (140) 5.8 4.2 4.7 109
Volkswagen Golf 1.4 TSI ACT, 7-speed-DSG 103 (140) 5.8 4.1 4.7 110
Volkswagen Jetta Hybrid 1.4 TSI 110 (150) 4.4 3.9 4.1 95
Volkswagen Polo BlueGT 1.4 TSI (DSG) 103 (140) 5.6 3.9 4.5 105
Volkswagen Polo GTI 132 (180) 7.5 5.1 5.9 139
Volkswagen Touareg Hybrid 3.0 V6 TSI 279 (380) 8.7 7.9 8.2 193

ADDITIONAL I N FORM ATION
Consumption and Emission Data Glossary Index List of Tables Contact Information
355
MODEL
F U E L
C O N S U M P T I O N
( l / 1 0 0 k m )
C O 2
E M I S S I O N S
( g / k m )
combined combined
Audi A1 5.9 – 3.8 139 – 99
Audi A1 Sportback 5.9 – 3.8 139 – 99
Audi A3 6.6 – 3.8 152 – 99
Audi A3 Sportback 5.6 – 3.8 130 – 99
Audi Q3 7.7 – 5.2 179 – 137
Audi TT 9.1 – 5.3 212 – 139
Audi A4 10.7 – 4.3 249 – 112
Audi A4 allroad quattro 7.3 – 5.8 170 – 152
Audi A4 Avant 10.7 – 4.4 249 – 116
Audi A4 saloon 9.4 – 4.3 190 – 112
Audi A5 10.5 – 4.5 246 – 119
Audi A5 Sportback 8.1 – 4.5 190 – 119
Audi Q5 8.5 – 5.3 199 – 139
Audi A6 9.7 – 4.9 226 – 129
Audi A6 allroad quattro 8.9 – 6.1 206 – 159
Audi S6 9.7 – 9.6 226 – 225
Audi A7 9.6 – 5.1 225 – 135
Audi Q7 10.7 – 7.2 249 – 189
Audi A8 10.1 – 6.0 235 – 147
Audi A8 L 11.9 – 6.4 277 – 149
Audi R8 14.9 – 12.4 349 – 289
Bentley Continental GT 14.5 – 10.6 338 – 246
Bentley Continental GTC 14.9 – 10.9 347 – 254
Lamborghini Gallardo 13.7 – 13.3 325 – 315
Lamborghini Gallardo Spyder 13.8 – 13.6 330 – 327
Porsche 911 Carrera 9.9 – 8.2 234 – 194
Porsche 911 Carrera Cabriolet 10.0 – 8.4 236 – 198
Porsche 911 Carrera 4S Coupé 9.9 – 9.1 234 – 215
Porsche Boxster 8.8 – 7.7 206 – 180
Porsche Boxster S 8.8 – 8.0 206 – 188
Porsche Cayenne 11.5 – 7.2 270 – 189
Porsche Cayman 8.8 – 7.7 206 – 180
Porsche Panamera 11.5 – 6.5 270 – 167
SEAT Alhambra 8.5 – 5.5 198 – 143
SEAT Altea 8.4 – 4.5 197 – 119
SEAT Exeo 7.7 – 4.5 179 – 117
SEAT Ibiza 5.9 – 3.3 139 – 87
SEAT Leon 5.2 – 3.8 120 – 99
SEAT Leon FR 5.9 – 4.1 137 – 106
SEAT Mii 4.7 – 4.1 108 – 95
SEAT Toledo 5.9 – 3.9 137 – 104

356
MODEL
F U E L
C O N S U M P T I O N
( l / 1 0 0 k m )
C O 2
E M I S S I O N S
( g / k m )
combined combined
ŠKODA Citigo 4.7 – 4.1 108 – 96
ŠKODA Fabia 6.2 – 3.4 148 – 89
ŠKODA Octavia 7.8 – 3.8 182 – 99
ŠKODA Octavia estate 7.8 – 4.1 182 – 107
ŠKODA Octavia saloon 7.7 – 3.8 180 – 99
ŠKODA Rapid 6.1 – 3.9 137 – 104
ŠKODA Roomster/Praktik 6.4 – 4.2 149 – 109
ŠKODA Superb 10.1 – 4.4 235 – 114
ŠKODA Yeti 8.0 – 4.6 189 – 119
Volkswagen Caddy 6.8 – 5.1 174 – 134
Volkswagen California 10.5 – 7.0 245 – 184
Volkswagen Multivan/Caravelle 10.5 – 6.4 245 – 169
Volkswagen Beetle 7.6 – 4.3 176 – 113
Volkswagen Beetle Convertible 7.8 – 4.5 180 – 118
Volkswagen CC 9.2 – 4.6 213 – 120
Volkswagen Eos 7.5 – 4.8 174 – 125
Volkswagen Golf 5.2 – 3.8 122 – 99
Volkswagen Golf Cabriolet 8.2 – 4.4 190 – 117
Volkswagen Golf Plus 6.5 – 4.3 153 – 114
Volkswagen Golf estate 6.4 – 4.2 149 – 109
Volkswagen Jetta 7.7 – 4.1 178 – 95
Volkswagen Passat 9.3 – 4.1 215 – 109
Volkswagen Passat Alltrack 8.6 – 5.2 199 – 135
Volkswagen Passat 1.4 TSI EcoFuel (CNG)
6.7 – 6.6 m3
(4.3 kg) 119 – 117
Volkswagen Passat 1.4 TSI EcoFuel (petrol) 6.9 – 6.8 161 – 157
Volkswagen Phaeton 12.5 – 8.5 290 – 224
Volkswagen Polo 7.5 – 3.3 174 – 87
Volkswagen Polo BlueMotion 3.4 – 3.3 89 – 87
Volkswagen Scirocco 8.1 – 4.5 189 – 118
Volkswagen Sharan 8.4 – 5.5 196 – 143
Volkswagen Tiguan 8.6 – 5.3 199 – 139
Volkswagen Touareg 9.9 – 7.0 236 – 184
Volkswagen Touran 7.2 – 4.5 168 – 119
Volkswagen Touran 1.4 TSI EcoFuel (CNG)
7.6 – 7.0 m3
(5.0 – 4.6 kg) 136 – 125
Volkswagen up! 4.7 – 4.1 108 – 95

ADDITIONAL I N FORM ATION
Consumption and Emission Data Glossary Index List of Tables Contact Information
357
SELECTED TERMS AT A GL ANCE
ASEAN
Association of Southeast Asian Nations. An international organization
of Southeast Asian nations with political, economic and cultural aims
that has been in existence since August 8, 1967.
Completely Knocked Down (CKD)
A method of manufacturing vehicles in which kits are manufactured for
export to individual countries rather than complete vehicles.
Compliance
Adherence to statutory provisions, internal company policies and
ethical principles.
Compressed Natural Gas (CNG)
Burning this compressed natural gas releases approximately 25% less
CO2 than petrol because of its low carbon and high energy content.
Continuous Improvement Process (CIP)
CIP aims to ensure the continuous optimization of product, process and
service quality focused on corporate objectives. Inefficiencies are
eliminated gradually and permanently and work methods are optimized
through the systematic incorporation of employees’ abilities and
practical knowledge.
Corporate Governance
International term for responsible corporate management and
supervision driven by long-term value added.
Direct shift gearbox (DSG)
Gearbox that consists of two gearboxes with a dual clutch and so
combines the agility, driving pleasure and low consumption levels of a
manual gearbox with the comfort of an automatic.
Hedge accounting
Presentation of hedges in the balance sheet with the aim of
compensating offsetting gains and losses from hedged items and
hedges within the same period economically and in the financial
statements.
Hedging instruments
Hedging transactions used in risk management, for example to hedge
interest rate and exchange rate risks.
Hybrid drive
Drive combining two different types of engine and energy storage
system (usually an internal combustion engine and an electric motor).
Modular Longitudinal Toolkit (MLB)
The use of a modular strategy in vehicle platforms in which the
drivetrain is mounted longitudinally to the direction of travel. This
modular arrangement of all components enables maximum synergies
to be achieved between the vehicle families.
Modular Transverse Toolkit (MQB)
As an extension of the modular strategy, this platform can be deployed
in vehicles whose architecture permits a transverse arrangement of the
engine components. The modular perspective enables high synergies to
be achieved between the vehicles in the Volkswagen Passenger Cars,
Volkswagen Commercial Vehicles, Audi, SEAT and ŠKODA brands.
Penetration rate for financial services
The ratio of the leasing and financing business to total unit sales.
Plug-in-hybrid
Second-generation hybrid vehicles. Plug-in hybrid electric vehicles
(PHEVs) have a larger battery with a correspondingly higher capacity
that can be charged via the combustion engine, the brake system, or an
electrical outlet. This increases the range of the vehicle.
Rating
Systematic evaluation of companies in terms of their credit quality.
Ratings are expressed by means of rating classes, which are defined
differently by the individual rating agencies.
Recuperation
Recovery of kinetic energy by using an electric motor as a generator, for
example in the drivetrain.
Turntable concept
Concept of flexible manufacturing enabling the production of different
models in variable daily volumes within a single plant, as well as
offering the facility to vary daily production volumes of one model
between two or more plants.
Value drivers
Factors and measures that determine the earnings and value of a
company. The efficiency of a company’s value drivers can be measured
by means of financial and non-financial performance indicators.
Vocational groups
For example, electronics, logistics, marketing, or finance. A new
teaching and learning culture is gradually being established by
promoting training in the vocational groups. The specialists are actively
involved in the teaching process by passing on their skills and
knowledge to their colleagues.
Glossary

358
A
Accounting policies 270
Annual General Meeting 144, 169
B
Balance sheet structure 181
C
Cash and cash equivalents 177
Cash flow 177
CO2 emissions 195, 196, 221
Consolidation methods 268
Consumption of energy 221
Corporate Governance 18, 131, 349
D
Declaration of conformity 18, 131
Deliveries 159
Demand 154, 230, 238
Dividend policy, yield 168
Dividend proposal 189, 309
E
Earnings
- brands and business fields 104
- market 104
- per share 168, 292
Economic growth 155
Employees 211, 230
- age structure 215
- number of 164, 190
Environmental protection 190, 218
Exchange rate movements 154
Executive Bodies 147
F
Financial position 177
Foreign currency risk 234
Fresh water consumption 221
G
General economic
development 153, 228, 237
Global Compact 193
Group structure 104, 143
I
IFRSs, new and amended 257
Information technology 218
Inventories 164
Investment planning 243
L
Litigation 233
M
Market shares 161
Mandatory convertible note 169, 172
Models 157, 160, 240
N
Nonfinancial performance indicators 192
O
Operating profit 105, 175
Orders received 120, 122, 163
P
Procurement 200, 229
Production 204, 229
Production figures 107, 109, 111, 113, 115,
117, 119, 121, 123, 125, 164, 190
Prospects 246
Purchasing volume 190, 202
Q
Quality assurance 210, 230
R
Ratings 173, 235
Refinancing 172
Remuneration Report 137, 350
Report on post-balance
sheet date events 236
Research and development 190, 195, 229
Risk management 136, 226
S
Sales and marketing 208, 230
Sales revenue
- brands and business fields 104
- market 104, 284
Segment reporting 281
Share
- identification codes, indices, exchanges 171
- price development 167
Share of sales revenue by market 176
Shareholder structure 168
Summary 165, 184, 236, 245
Supplier relationships 201
Sustainability 192
V
Value added 184
Value-based management 186, 244
Vehicle production locations 205
Vehicle sales 105, 164, 190
Index

ADDITIONAL I N FORM ATION
Consumption and Emission Data Glossary Index List of Tables Contact Information
359
A
Audi brand 108-109
Audit fees 336
B
Balance sheet
- balance sheet disclosures in
accordance with IFRS 7 316-322
- cash, cash equivalents
and time deposits 307
- division 180
- equity 254-255, 308-309
- equity-accounted investments
and other equity investments 301-302
- financial liabilities 309
- financial services receivables 303-304
- intangible assets 295-297
- inventories 306
- leasing and rental assets
and investment property 299-300
- other financial assets 304-305
- other financial liabilities 310-311
- other liabilities 311
- other receivables 305
- Passenger Cars and Light Commercial
Vehicles Business Area 182
- property, plant and equipment 297-299
- provisions 312-315
- tax assets 306
- tax liabilities 311
- trade payables 316
- trade receivables 306
- Trucks and Buses, Power Engineering
Business Area 182
- Volkswagen AG 188
- Volkswagen Group 253
Basis of consolidation 259-268
Bentley brand 114-115
C
Capital management 333
Cash flow statement
- division 178
- Passenger Cars and Light Commercial
Vehicles Business Area 179
- Trucks and Buses, Power Engineering
Business Area 179
- Volkswagen Group 256, 323
China, Volkswagen Group in 124-125
Consumption and emission data 354-356
Contingent liabilities 333
Currency translation 269
D
Deliveries
- markets U4
- passenger cars and light commercial
vehicles 161
- trucks and buses 162
- Volkswagen Group 159
E
Earnings per share 292
Employees
- average number of employees
during the year 336
- breakdown 217
- pay and benefits 189
- proportion of women 214
Environmental protection,
expenditure on 190
F
Financial risk management
and financial instruments 324-332
Five-year review 185
I
Income statement
- division 175
- equity-accounted investments 287
- finance costs 287
- income statement disclosures in
accordance with IFRS 7 293-294
- income tax income/expense 288-291
- other financial result 288
- other operating expenses 286
- other operating income 286
- Passenger Cars and Light Commercial
Vehicles Business Area 176
- sales revenue 285
- Trucks and Buses, Power Engineering
Business Area 177
- Volkswagen AG 188
- Volkswagen Group 250
K
Key figures U3
- brands and business fields 105
- market 105
Key financial figures 183
M
MAN brand 122-123
Money and capital market programs 173
O
Other financial obligations 335
P
Porsche brand 116-117
Proposal on the appropriation
of net profit 189
Purchasing volume 202
R
Related parties 340-341
Remuneration
- members of the Board
of Management 138, 141, 350
- members of the Supervisory Board 142, 350
Research and development costs 199
S
Scania brand 120-121
SEAT brand 112-113
Segment reporting 174, 282-284
Share, key figures 170
ŠKODA brand 110-111
Statement of changes in equity 254-255
Statement of comprehensive income 251-252
T
Target-performance comparison 165
Total expense for the period 336
V
Value added 184
Value contribution
- Automotive Division 187
- cost of capital 186, 271
Volkswagen Commercial
Vehicles brand 118-119
Volkswagen Financial Services 126-128
Volkswagen Passenger Cars brand 106-107
List of Tables

Contact Information
PU B L I S H E D BY
Volkswagen AG
Finanzpublizität
Brieffach 1848-2
38436 Wolfsburg
Germany
Phone +49 5361 9-0
Fax +49 5361 9-28282
Volkswagen AG
Konzernkommunikation
Brieffach 1970
38436 Wolfsburg
Germany
Phone +49 5361 9-0
Fax +49 5361 9-28282
This annual report is published in English and German.
Both versions of the report are available on the
Internet at: www.volkswagenag.com/ir.
I N V ESTO R R E L AT I O N S
Volkswagen AG
Investor Relations
Brieffach 1849
38436 Wolfsburg
Germany
Phone +49 5361 9-86622 IR Hotline
Fax +49 5361 9-30411
E-mail [email protected]
Internet www.volkswagenag.com/ir
Volkswagen AG
Investor Relations
17C Curzon Street
London W1J 5HU
United Kingdom
Phone +44 20 7290 7820
Volkswagen Group China
No. 3A, Xi Liu Jie, Sanlitun Road
Chaoyang District
Beijing 100027
P.R. China
Phone +86 10 6531 3000
Volkswagen Group of America, Inc.
Investor Relations Liaison Office
(Questions relating to American Depositary Receipts)
2200 Ferdinand Porsche Drive
Herndon, Virginia 20171
USA
Phone +1 703 364 7000
CO N CE P T, D ES I G N A N D R E A L IZ AT I O N
3st kommunikation, Mainz
E D ITO R I A L CO N CE P T | E D ITO R I A L CO O R D I N AT I O N
M AG A Z I N E S EC T I O N
Johannes Winterhagen, Tina Rumpelt
E N G L I S H T R A N S L AT I O N
Fry & Bonthrone Partnerschaft, Mainz-Kastel
F I N A N CI A L R E P O R T
Produced in-house with FIRE.sys
PH OTO G R A PH Y | I L LUST R AT I O N S | P I C T U R E CR E D IT S
Jorge Ferrari (p. 2–3, 88)
Getty Images (p. 43)
Kai-Uwe Knoth (p. 2, 10–11, 72–75)
Andreas Mader (p. 2–3, 6–9, 40–41, 43–44, 76, 79–83, 85, 90–94)
Andreas Mühe (p. 46, 70, 98)
Hartmut Nägele (p. 2–3, 4–5, 22, 24–25, 28–29, 48–52, 54–57, 66–69)
Rüdiger Nehmzow (p. 58–60)
Marcus Pietrek (p. 2, 30–32, 35, 37)
Shams Power Company (p. 86–87)
Peter Vann (p. 64–65)
Helene Weimann / 3st kommunikation (p. 38–39, 96–97)
Volkswagen AG
PR I N T E R
Kunst- und Werbedruck, Bad Oeynhausen
PA PE R
Algro Design Duo, Deutsche Papier
Druckfein neu, Römerturm
Heaven 42, Papierfabrik Scheufelen
ISSN 358.809.541.20
Printed in Germany
carbon neutralnatureOffice.com | DE-149-488532
print production
360

Moto r Sh owS
M a rch 7 – 17
Internationa l Motor Show, Geneva
M a rch 28 – a PrIL 7
New York International Auto Show, New York
a PrIL 8 – 12
Hanover Trade Show, Hanover
a PrIL 23 – 29
Auto Shanghai, Shanghai
M aY 11 – 19
Sa lón Internaciona l del Automóvil, Barcelona
SEP tEMB E r 12 – 22
Internationa l Motor Show ( I A A), Frankfurt
N oV EMB E r 21 – 30
Los A ngeles Auto Show, Los A ngeles
N oV EMB E r 23 – D EcEM B Er 1
Tokyo Motor Show, Tokyo
D EcEMB E r 7 – 15
Bologna Motor Show, Bologna
FIN aNcIaL c aLENDar
M a rch 14
Volkswagen AG Annual Media Conference and Investor Conference
a PrIL 25
Volkswagen AG Annual General Meeting(Hanover Exhibition Center)
a PrIL 29
Interim Report January – March
JULY 31
Ha lf-Yearly Financia l Report
o c to B Er 31
Interim Report January – September
Scheduled Dates 2013

Ch
ro
niC
le
20
12
JanuaryJanuary 6 Volkswagen builds new plant in ningbo in southern ChinaThe Volkswagen Group expands its production capacity in China and signs the contracts to build a new plant in Ningbo. The facility is scheduled for completion by 2014 and should produce approxi-mately 300,000 vehicles every year.
January 9 north American international Auto ShowVolkswagen Passenger Cars kicks off the new automotive year in Detroit with the world premiere of the Jetta Hybrid and the E-Bugster concept car. Bentley unveils two new models – the Continental GT and the Continental GTC.
January 11 What Car? Awards 2012The Volkswagen Group takes seven out of 13 cate-gories in the British industry awards with its Volkswagen Passenger Cars, Audi and Seat brand vehicles. The jury of experts names the up! city car “Car of the Year”, making it the overall winner.
January 19 Golden Angel 2012In 2012, Volkswagen is again among the winners of this renowned ADAC award, with prizes in the “Car”,
“Innovation and Environment”, “Car of the Future” and “Quality” categories. The ADAC is Germany’s largest automobile club.
January 26 The Best Cars of 2012The Volkswagen Group is voted the most successful company in the poll by readers of the German spe-cialist journal “auto motor und sport”, coming first in numerous categories. Volkswagen Passenger Cars, Volkswagen Commercial Vehicles, Audi, SEAT and ŠKODA brand vehicles take the top honors.
FebruaryFebruary 21 up! wins gold iF product design awardThe up! is a trendsetter in terms of design, too, winning a prestigious “iF product design award 2012” in gold for its innovative exterior.
MayMay 31 Volkswagen and iG Metall conclude wage negotiation roundVolkswagen and IG Metall successfully conclude negotiations on the company collective agreement. Basic pay rises by 4.3% as of June 1, 2012.
JuneJune 2 Volkswagen Group makes extensive structural and management changesFollowing the strong growth seen in recent years, the Volkswagen Group implements extensive restructuring measures at an organizational and management level in response to the increased demands, giving its Strategy 2018 additional momentum.
June 6 Volkswagen Group increases its share of voting rights in MAn Effective June 6, 2012, Volkswagen increased its share of voting rights in MAN SE to 75.03%, thus strengthening the alliance between MAN, Scania and Volkswagen Commercial Vehicles.
June 13 2012 international engine of the Year AwardVolkswagen’s 1.4 TSI engine is presented with the
“International Engine of the Year Award” for the seventh time in a row in June in the 1.0 to 1.4 liter category.
June 28 Fifty million engines from the Salzgitter plantThe 50-millionth engine rolls off the production line at the Volkswagen plant in Salzgitter.
MarchMarch 2 reader poll chooses the “Best brands in all classes”The Volkswagen Group receives 23 awards in the new trend barometer, the “Best brands in all classes” reader poll, of the German magazine
“AUTO BILD”.
March 6 international Motor Show, GenevaThe Volkswagen Group presents a large number of new models and concept cars in Geneva. The Group also kicks off a fundamental environmental re-structuring effort that aims to make Volkswagen the leading automobile manufacturer from an ecological perspective as well.
March 23 Production milestone in WolfsburgA Golf TSI BlueMotion car is the 40-millionth vehicle to roll off the production line at the Wolfsburg plant.
March 28 Double win in the “AUTo BilD Allrad” reader pollMore than 120,000 “AUTO BILD Allrad” readers vote on their favorite vehicles. Two Volkswagen models are awarded the title of “Four-Wheel-Drive Car of the Year 2012”: the Passat Alltrack and the Touareg Hybrid.
AprilApril 5 The up! is named “World Car of the Year 2012”The up! receives the coveted award at the New York International Auto Show.
April 23 Volkswagen Group plans to expand its presence in ChinaProf. Dr. Martin Winterkorn, Chairman of the Board of Management of Volkswagen AG, and represen-tatives of Chinese partner SAIC Motor Corporation sign a contract to build a new plant in Urumqi in western China in the presence of Chinese Premier Wen Jiabao and German Chancellor Dr. Angela Merkel.
Chronicle 2012

JulyJuly 4 Best Company Car 2012Volkswagen Passenger Cars, Audi, SEAT and ŠKODA claim a total of five first places at the German
“Best Company Car 2012” awards.
July 26 Volkswagen Group opens new plant in ChinaThe Volkswagen Group opens a new vehicle plant in Yizheng in eastern China. The production facility, which is part of the Shanghai-Volkswagen joint venture, has an annual capacity of around 300,000 vehicles.
AugustAugust 1 Volkswagen and Porsche create integrated automotive groupThe creation of the integrated automotive group comprising Volkswagen and Porsche is completed on August 1. The accelerated integration of Porsche AG into the Volkswagen Group allows extensive synergy effects to be captured more quickly. Porsche will re-tain its own identity and operational independence under the Volkswagen Group umbrella.
August 31 Volkswagen Group builds new gearbox plant in ChinaThe foundation stone is laid for a new gearbox plant in the city of Tianjin in China. This adds a new location to the Volkswagen Group’s Chinese production network.
SeptemberSeptember 3 Volkswagen Germany sets vocational training recordA total of 1,708 young people – more than ever before – begin their vocational training or an integrated degree and traineeship scheme.
September 4 World premiere of the new Golf in BerlinThe Volkswagen Passenger Cars brand unveils the new Golf to the public. Around 1,000 invited guests experience the world premiere of the seventh generation of this classic car.
September 20 IAA Commercial Vehicles show in HanoverA key focus of the largest commercial vehicles show in the world is on efficient and environmentally- friendly transport solutions. The Volkswagen Group is represented by the Volkswagen Commercial Vehicles, Scania and MAN brands.
September 27 Mondial de l’Automobile in ParisThe Volkswagen Group presents a large number of new models and concept cars at the Paris International Motor Show. The Volkswagen Passenger Cars brand’s new Golf is the highlight.
OctoberOctober 22 São Paulo International Motor ShowVolkswagen’s Taigun – a newly developed compact SUV concept car – is given its world premiere at the 2012 São Paulo International Motor Show in Brazil.
NovemberNovember 20 Auto Trophy 2012The Volkswagen Group wins major prizes at the “Auto Trophy 2012” awards. Readers of the German “Auto Zeitung” magazine vote 14 models as top of their classes.
DecemberDecember 11 Volkswagen Group lays foundation stone for new engine plant in RussiaStarting in 2015, the Group will supply its vehicle pro-duction facility in Kaluga and its contract manufac-turing operations at the GAZ plant in Nizhny Novgorod with state-of-the-art, locally-produced engines.
December 27 eco up! and Passat TSI EcoFuel top eco-ranking
“AUTO TEST” magazine and the “ÖKOTREND” institute crown Volkswagen’s eco up! and Passat 1.4 TSI EcoFuel as two of the most environmentally-friendly cars.

Experience D[r]iversity.A N N U A L R E P O R T 2 0 1 2
AN
NU
AL
RE
PO
RT
20
12
AN
NU
AL
RE
PO
RT
20
12
Copyright © 2022 FDOKUMEN