Volkswagen Golf model year 2020 - Cleanfi Oy
54
Comparison of electric cars and different internal combustion engine fuel options – Volkswagen Golf model year 2020 Kimmo Klemola, Cleanfi Oy 1 , Lappeenranta Finland 3.3.2020 1 Cleanfi Oy is a company providing cradle to gate life cycle assessment services for quantifying the carbon footprint and other environmental impacts of various activities, e.g., industry, energy, electricity generation and transportation. Kimmo Klemola is Dr.S. (Tech., oil refining). www.cleanfi.fi
-
Upload
khangminh22 -
Category
Documents
-
view
0 -
download
0
Transcript of Volkswagen Golf model year 2020 - Cleanfi Oy

Comparison of electric cars and different internal combustion
engine fuel options – Volkswagen Golf model year 2020
Kimmo Klemola, Cleanfi Oy1, Lappeenranta Finland
3.3.2020
1 Cleanfi Oy is a company providing cradle to gate life cycle assessment services for quantifying the carbon footprint and other environmental impacts of various activities, e.g., industry, energy, electricity generation and transportation. Kimmo Klemola is Dr.S. (Tech., oil refining). www.cleanfi.fi

Contents Example cars ......................................................................................................................................... 2
Excerpts ................................................................................................................................................. 2
Tutkitut automallit ............................................................................................................................... 3
Huomioita ............................................................................................................................................. 3
Global warming potential (carbon footprint) .................................................................................. 4
Economics and tax revenues ............................................................................................................ 15
Environmental impacts of dedieselisation of the car fleet in Finland ........................................ 18
Electric car sales globally and battery cell patent indicators ....................................................... 19
Data ...................................................................................................................................................... 22
Car components and materials ........................................................................................................ 22
Electricity generation and use .......................................................................................................... 25
Fuels production and use .................................................................................................................. 31
Manufacturing a car ........................................................................................................................... 41
Principles and parameters ................................................................................................................ 41
References (selected) .......................................................................................................................... 45

2
Example cars The curb weight, battery pack weight and fuel/electricity consumption data (WLTP2) of the following Volkswagen Golf models (2020) were used in comparing different fuel and engine options: Volkswagen Golf Trendline 1.0 TSI 63 kW, Volkswagen Golf Trendline 1.6 TDI 85 kW, Volkswagen Golf 1.5 TGI 96 kW, Volkswagen e-Golf 100 kW and Volkswagen GTE Plug-In Hybrid 150 kW. In calculations, no other factory data were used. In economics comparison, January 2020 Volkswagen Golf prices in Finland were used.
Excerpts Considering CO2e:
New electric car beats new diesel car after 29 000 km in Finland. New electric car beats new gasoline car after 26 000 km in Finland. New electric car beats old diesel car after 70 000 km (old diesel car still has driving,
fuel cycle, maintenance and end-of-life emissions – but not the emissions from manufacturing a car) in Finland.
Electric car in Finland beats biogas car after 208 000 km in Finland (if there is no battery pack replacement)
Electric car with biogas electricity beats biogas ICE car after 136 000 km. Electric car with biogas electricity beats biogas ICE car after 336 000 km, if the battery
pack is replaced once.
Considering euros:
In Finland, e-Golf (new electric car) gives cheapest life-time kilometers followed by CNG (compressed natural gas) car and CBG (compressed biogas) car.
In Finland, lifetime costs are about equal for gasoline Golf and diesel Golf. January 2020 fuel/electricity prices and taxes and January 2020 car prices were used
for the whole lifetime of the car.
2 The worldwide harmonized light vehicles test procedure (WLTP) is a global harmonized standard for determining the levels of pollutants and CO2 emissions, fuel or energy consumption, and electric range from light-duty vehicles (passenger cars and light commercial vans). (Wikipedia)

3
Tutkitut automallit Volkswagen Golf edustaa keskivertoa suomalaista henkilöautomallia. Golfin eri mallien omamassaa, akuston kokoa ja painoa sekä WLTP3-kulutuslukemia käytettiin laskiessa ja verrattaessa mallien elinkaaren hiilijalanjälkeä. Golfin eri käyttövoimien elinkaaren kustannukset laskettiin. Tutkitut Golfin mallit olivat: Volkswagen Golf Trendline 1.0 TSI 63 kW, Volkswagen Golf Trendline 1.6 TDI 85 kW, Volkswagen Golf 1.5 TGI 96 kW, Volkswagen e-Golf 100 kW ja Volkswagen GTE Plug-In Hybrid 150 kW. Elinkaaren kilometreiksi arvioitiin 298 000 km.
Huomioita Koskien CO2e:
Uuden sähköauton valmistuksen hiilijalanjälki on suurempi kuin dieselauton. Suomessa 29 000 kilometrin jälkeen sähköauton hiilijalanjälki on pienempi kuin uuden dieselauton. Eli mikäli autolla ajetaan 15 vuotta, puolentoista vuoden jälkeen sähköauton ja dieselauton hiilijalanjäljet ovat tasoissa ja sen jälkeen loput 13,5 vuotta sähköauton hiilijalanjälki on koko ajan pienempi ja pienempi kuin dieselauton.
Suomessa 26 000 kilometrin jälkeen sähköauton hiilijalanjälki on pienempi kuin uuden bensiiniauton.
Suomessa 70 000 kilometrin jälkeen sähköauton hiilijalanjälki on pienempi kuin vanhan dieselauton (vanhalla autolla on kontollaan ajon, polttoaineen jalostuksen, huollon ja romutuksen hiilijalanjälki, mutta ei valmistuksen hiilijalanjälkeä).
Suomessa 208 000 kilometrin jälkeen sähköauton hiilijalanjälki on pienempi kuin uuden biokaasuauton.
136 000 kilometrin jälkeen biokaasusähköllä kulkevan uuden sähköauton hiilijalanjälki on pienempi kuin uuden biokaasuauton.
336 000 kilometrin jälkeen biokaasusähköllä kulkevan uuden sähköauton hiilijalanjälki on pienempi kuin uuden biokaasuauton, mikäli akusto joudutaan vaihtamaan kerran.
Koskien euroja:
Suomessa koko elinkaarelle lasketut halvimmat uuden Volkswagen Golfin kilometrit ovat järjestyksessä: e-Golf, maakaasu-Golf ja biokaasu-Golf.
Elinkaaren kustannukset diesel- ja bensiini-Golfille ovat suunnilleen samat, mutta suuremmat kuin e- tai kaasu-Golfille.
Tammikuun 2020 automallien ja polttoaineiden hintoja sekä verotasoja käytettiin laskennassa.
Koskien sekä CO2e:a että euroja, mallit ovat kooltaan suunnilleen samankokoisia, mutta suorituskyvyissä on eroja.
3 Syyskuusta 2017 alkaen markkinoille tulleita uusia autoja ovat koskeneet uudet kulutusarvot, jotka määritetään uuden WLTP-standardin mukaan (volkswagen.fi).

4
Global warming potential (carbon footprint)
166
164
49
49
13
13
24
23
23
215
215
73
73
2
215
5
5
78
126
99
141
152
5
51
2
3
2
7
21
23
90
140
65
65
164
75
11
10
11
11
26
39
26
39
26
26
39
18
39
26
39
18
39
26
26
26
26
26
26
26
26
26
26
26
11
11
11
10
10
10
11
19
8
8
8
8
8
8
8
8
8
8
8
8
8
8
8
8
8
8
8
8
8
8
8
8
8
8
8
8
8
8
8
8
8
8
8
9
6
6
6
6
6
6
6
6
6
6
6
6
6
6
6
6
6
6
6
6
6
6
6
6
6
6
6
6
6
6
6
6
6
6
6
6
0
0
0
0
0
0
0
0
0
0
0
0
0
0
0
0
0
0
0
0
0
0
0
0
0
0
0
0
0
0
0
0
0
0
0
0
0 50 100 150 200 250 300
Petroleum to diesel ICEV
Petroleum to gasoline ICEV
Manure biogas CBG ICEV
Manure biogas CBG + gasoline (real) ICEV
Manure biogas electricity, EV
Manure biogas electricity, one battery replacement, EV
Finland electricity (generated) 2019, EV
Finland electricity 2019, one battery replacement, EV
Finland electricity 2019 (used electricity), EV
Estonia electricity 2017, EV
Estonia electricity 2017, one battery replacement, EV
Germany electricity 2019, EV
Germany electricity 2019, one battery replacement, EV
Iceland electricity 2010, EV
Iceland electricity 2010, one battery replacement, EV
Sweden electricity 2018, EV
Sweden electricity 2018, one battery replacement, EV
Natural gas electricity, 95.8% CHP, EV
Coal electricity, 77.4% CHP, EV
Residual fuel oil electricity, 63.6% CHP, EV
Diesel oil electricity, 0% CHP, EV
Peat electricity, 83.9% CHP, EV
Wood electricity, 87.1% CHP, EV
Waste electricity, 75.4% CHP, EV
Hydroelectricity EV
Nuclear EV
Wind EV
Solar photovoltaic EV
BioVerno diesel (side product) ICEV
NExBTL diesel (waste) ICEV
NExBTL diesel (tallow side product) ICEV
Corn ethanol (85%) flexifuel ICEV
Sugarcane ethanol (85%) flexifuel ICEV
Cellulosic ethanol (85%) flexifuel ICEV
Natural gas CNG ICEV
Plugin-hybrid, Finland electricity 2019
Volkswagen Golf in Finland (298 000 km, WLTP consumption), gCO2e/km
GWP operation (whole fuel/electricity cycle) GWP materials (car)
GWP manufacturing (car) GWP maintenance and repair (car)
GWP end-of-life (car)

5
166
164
49
49
13
13
25
25
26
215
215
77
77
2
215
5
5
78
126
99
141
152
5
51
2
3
2
7
21
23
90
140
65
65
164
78
0 50 100 150 200 250
Petroleum to diesel ICEV
Petroleum to gasoline ICEV
Manure biogas CBG ICEV
Manure biogas CBG + gasoline (real) ICEV
Manure biogas electricity, no battery replacement, EV
Manure biogas electricity, one battery replacement, EV
Finland electricity mix 2017, no battery replacement, EV
Finland electricity mix 2017, one battery replacement,…
Finland electricity 2017 (used electricity), no battery…
Estonia electricity mix 2017, no battery replacement, EV
Estonia electricity mix 2017, one battery replacement,…
Germany electricity mix 2018, no battery replacement,…
Germany electricity mix 2018, one battery…
Iceland electricity mix 2010, no battery replacement, EV
Iceland electricity mix 2010, one battery replacement,…
Sweden electricity mix 2016, no battery replacement, EV
Sweden electricity mix 2016, one battery replacement,…
Natural gas electricity, 95.8% CHP, EV
Coal electricity, 77.4% CHP, EV
Residual fuel oil electricity, 63.6% CHP, EV
Diesel oil electricity, 0% CHP, EV
Peat electricity, 83.9% CHP, EV
Wood electricity, 87.1% CHP, EV
Waste electricity, 75.4% CHP, EV
Hydroelectricity EV
Nuclear EV
Wind EV
Solar photovoltaic EV
BioVerno diesel (side product) ICEV
NExBTL diesel (waste) ICEV
NExBTL diesel (tallow side product) ICEV
Corn ethanol (85%) flexifuel ICEV
Sugarcane ethanol (85%) flexifuel ICEV
Cellulosic ethanol (85%) flexifuel ICEV
Natural gas CNG ICEV
Plugin-hybrid
Volkswagen Golf in Finland operation stage (298 000 km, WLTP consumption), gCO2e/km
GWP operation (whole fuel/electricity cycle)

6
11
10
11
11
26
39
26
39
26
26
39
18
39
26
39
18
39
26
26
26
26
26
26
26
26
26
26
26
11
11
11
10
10
10
11
19
8
8
8
8
8
8
8
8
8
8
8
8
8
8
8
8
8
8
8
8
8
8
8
8
8
8
8
8
8
8
8
8
8
8
8
9
6
6
6
6
6
6
6
6
6
6
6
6
6
6
6
6
6
6
6
6
6
6
6
6
6
6
6
6
6
6
6
6
6
6
6
6
0
0
0
0
0
0
0
0
0
0
0
0
0
0
0
0
0
0
0
0
0
0
0
0
0
0
0
0
0
0
0
0
0
0
0
0
0 10 20 30 40 50 60
Petroleum to diesel ICEV
Petroleum to gasoline ICEV
Manure biogas CBG ICEV
Manure biogas CBG + gasoline (real) ICEV
Manure biogas electricity, EV
Manure biogas electricity, one battery replacement, EV
Finland electricity (generated) 2019, EV
Finland electricity 2019, one battery replacement, EV
Finland electricity 2019 (used electricity), EV
Estonia electricity 2017, EV
Estonia electricity 2017, one battery replacement, EV
Germany electricity 2019, EV
Germany electricity 2019, one battery replacement, EV
Iceland electricity 2010, EV
Iceland electricity 2010, one battery replacement, EV
Sweden electricity 2018, EV
Sweden electricity 2018, one battery replacement, EV
Natural gas electricity, 95.8% CHP, EV
Coal electricity, 77.4% CHP, EV
Residual fuel oil electricity, 63.6% CHP, EV
Diesel oil electricity, 0% CHP, EV
Peat electricity, 83.9% CHP, EV
Wood electricity, 87.1% CHP, EV
Waste electricity, 75.4% CHP, EV
Hydroelectricity EV
Nuclear EV
Wind EV
Solar photovoltaic EV
BioVerno diesel (side product) ICEV
NExBTL diesel (waste) ICEV
NExBTL diesel (tallow side product) ICEV
Corn ethanol (85%) flexifuel ICEV
Sugarcane ethanol (85%) flexifuel ICEV
Cellulosic ethanol (85%) flexifuel ICEV
Natural gas CNG ICEV
Plugin-hybrid, Finland electricity 2019
Volkswagen Golf in Finland excluding operation stage (298 000 km, WLTP consumption), gCO2e/km
GWP materials (car) GWP manufacturing (car)
GWP maintenance and repair (car) GWP end-of-life (car)

7
49.46
48.95
14.69
14.62
3.76
3.76
7.02
6.91
6.91
64.11
64.11
21.60
21.60
0.61
64.11
1.57
1.57
23.11
37.67
29.59
42.07
45.21
1.45
15.10
0.73
0.96
0.50
2.23
6.17
6.78
26.95
41.66
19.27
19.37
48.71
22.43
3.34
3.13
3.38
3.38
7.65
11.58
7.65
11.58
7.65
7.65
11.58
5.24
11.58
7.65
11.58
5.24
11.58
7.65
7.65
7.65
7.65
7.65
7.65
7.65
7.65
7.65
7.65
7.65
3.34
3.34
3.34
3.13
3.13
3.13
3.38
5.80
2.49
2.33
2.52
2.52
2.46
2.46
2.46
2.46
2.46
2.46
2.46
2.46
2.46
2.46
2.46
2.46
2.46
2.46
2.46
2.46
2.46
2.46
2.46
2.46
2.46
2.46
2.46
2.46
2.49
2.49
2.49
2.33
2.33
2.33
2.52
2.81
1.71
1.71
1.71
1.71
1.71
1.71
1.71
1.71
1.71
1.71
1.71
1.71
1.71
1.71
1.71
1.71
1.71
1.71
1.71
1.71
1.71
1.71
1.71
1.71
1.71
1.71
1.71
1.71
1.71
1.71
1.71
1.71
1.71
1.71
1.71
1.71
0.13
0.12
0.13
0.13
0.13
0.13
0.13
0.13
0.13
0.13
0.13
0.13
0.13
0.13
0.13
0.13
0.13
0.13
0.13
0.13
0.13
0.13
0.13
0.13
0.13
0.13
0.13
0.13
0.13
0.13
0.13
0.12
0.12
0.12
0.13
0.14
0 10 20 30 40 50 60 70 80 90
Petroleum to diesel ICEV
Petroleum to gasoline ICEV
Manure biogas CBG ICEV
Manure biogas CBG + gasoline (real) ICEV
Manure biogas electricity, EV
Manure biogas electricity, one battery replacement, EV
Finland electricity (generated) 2019, EV
Finland electricity 2019, one battery replacement, EV
Finland electricity 2019 (used electricity), EV
Estonia electricity 2017, EV
Estonia electricity 2017, one battery replacement, EV
Germany electricity 2019, EV
Germany electricity 2019, one battery replacement, EV
Iceland electricity 2010, EV
Iceland electricity 2010, one battery replacement, EV
Sweden electricity 2018, EV
Sweden electricity 2018, one battery replacement, EV
Natural gas electricity, 95.8% CHP, EV
Coal electricity, 77.4% CHP, EV
Residual fuel oil electricity, 63.6% CHP, EV
Diesel oil electricity, 0% CHP, EV
Peat electricity, 83.9% CHP, EV
Wood electricity, 87.1% CHP, EV
Waste electricity, 75.4% CHP, EV
Hydroelectricity EV
Nuclear EV
Wind EV
Solar photovoltaic EV
BioVerno diesel (side product) ICEV
NExBTL diesel (waste) ICEV
NExBTL diesel (tallow side product) ICEV
Corn ethanol (85%) flexifuel ICEV
Sugarcane ethanol (85%) flexifuel ICEV
Cellulosic ethanol (85%) flexifuel ICEV
Natural gas CNG ICEV
Plugin-hybrid, Finland electricity 2019
Volkswagen Golf in Finland (298 000 km, WLTP consumption), tCO2e/lifetime
GWP operation (whole fuel/electricity cycle) GWP materials (car)
GWP manufacturing (car) GWP maintenance and repair (car)
GWP end-of-life (car)

8
49.46
48.95
14.69
14.62
3.76
3.76
7.02
6.91
6.91
64.11
64.11
21.60
21.60
0.61
64.11
1.57
1.57
23.11
37.67
29.59
42.07
45.21
1.45
15.10
0.73
0.96
0.50
2.23
6.17
6.78
26.95
41.66
19.27
19.37
48.71
22.43
0 10 20 30 40 50 60 70
Petroleum to diesel ICEV
Petroleum to gasoline ICEV
Manure biogas CBG ICEV
Manure biogas CBG + gasoline (real) ICEV
Manure biogas electricity, EV
Manure biogas electricity, one battery replacement, EV
Finland electricity (generated) 2019, EV
Finland electricity 2019, one battery replacement, EV
Finland electricity 2019 (used electricity), EV
Estonia electricity 2017, EV
Estonia electricity 2017, one battery replacement, EV
Germany electricity 2019, EV
Germany electricity 2019, one battery replacement, EV
Iceland electricity 2010, EV
Iceland electricity 2010, one battery replacement, EV
Sweden electricity 2018, EV
Sweden electricity 2018, one battery replacement, EV
Natural gas electricity, 95.8% CHP, EV
Coal electricity, 77.4% CHP, EV
Residual fuel oil electricity, 63.6% CHP, EV
Diesel oil electricity, 0% CHP, EV
Peat electricity, 83.9% CHP, EV
Wood electricity, 87.1% CHP, EV
Waste electricity, 75.4% CHP, EV
Hydroelectricity EV
Nuclear EV
Wind EV
Solar photovoltaic EV
BioVerno diesel (side product) ICEV
NExBTL diesel (waste) ICEV
NExBTL diesel (tallow side product) ICEV
Corn ethanol (85%) flexifuel ICEV
Sugarcane ethanol (85%) flexifuel ICEV
Cellulosic ethanol (85%) flexifuel ICEV
Natural gas CNG ICEV
Plugin-hybrid, Finland electricity 2019
Volkswagen Golf in Finland operation stage (298 000 km, WLTP consumption), tCO2e/lifetime
GWP operation (whole fuel/electricity cycle)

9
3.3
3.1
3.4
3.4
7.7
11.6
7.7
11.6
7.7
7.7
11.6
5.2
11.6
7.7
11.6
5.2
11.6
7.7
7.7
7.7
7.7
7.7
7.7
7.7
7.7
7.7
7.7
7.7
3.3
3.3
3.3
3.1
3.1
3.1
3.4
5.8
2.5
2.3
2.5
2.5
2.5
2.5
2.5
2.5
2.5
2.5
2.5
2.5
2.5
2.5
2.5
2.5
2.5
2.5
2.5
2.5
2.5
2.5
2.5
2.5
2.5
2.5
2.5
2.5
2.5
2.5
2.5
2.3
2.3
2.3
2.5
2.8
1.7
1.7
1.7
1.7
1.7
1.7
1.7
1.7
1.7
1.7
1.7
1.7
1.7
1.7
1.7
1.7
1.7
1.7
1.7
1.7
1.7
1.7
1.7
1.7
1.7
1.7
1.7
1.7
1.7
1.7
1.7
1.7
1.7
1.7
1.7
1.7
0.1
0.1
0.1
0.1
0.1
0.1
0.1
0.1
0.1
0.1
0.1
0.1
0.1
0.1
0.1
0.1
0.1
0.1
0.1
0.1
0.1
0.1
0.1
0.1
0.1
0.1
0.1
0.1
0.1
0.1
0.1
0.1
0.1
0.1
0.1
0.1
0 2 4 6 8 10 12 14 16 18
Petroleum to diesel ICEV
Petroleum to gasoline ICEV
Manure biogas CBG ICEV
Manure biogas CBG + gasoline (real) ICEV
Manure biogas electricity, EV
Manure biogas electricity, one battery replacement, EV
Finland electricity (generated) 2019, EV
Finland electricity 2019, one battery replacement, EV
Finland electricity 2019 (used electricity), EV
Estonia electricity 2017, EV
Estonia electricity 2017, one battery replacement, EV
Germany electricity 2019, EV
Germany electricity 2019, one battery replacement, EV
Iceland electricity 2010, EV
Iceland electricity 2010, one battery replacement, EV
Sweden electricity 2018, EV
Sweden electricity 2018, one battery replacement, EV
Natural gas electricity, 95.8% CHP, EV
Coal electricity, 77.4% CHP, EV
Residual fuel oil electricity, 63.6% CHP, EV
Diesel oil electricity, 0% CHP, EV
Peat electricity, 83.9% CHP, EV
Wood electricity, 87.1% CHP, EV
Waste electricity, 75.4% CHP, EV
Hydroelectricity EV
Nuclear EV
Wind EV
Solar photovoltaic EV
BioVerno diesel (side product) ICEV
NExBTL diesel (waste) ICEV
NExBTL diesel (tallow side product) ICEV
Corn ethanol (85%) flexifuel ICEV
Sugarcane ethanol (85%) flexifuel ICEV
Cellulosic ethanol (85%) flexifuel ICEV
Natural gas CNG ICEV
Plugin-hybrid, Finland electricity 2019
Volkswagen Golf in Finland excluding operation stage (298 000 km, WLTP consumption), tCO2e/lifetime
GWP materials (car) GWP manufacturing (car)
GWP maintenance and repair (car) GWP end-of-life (car)

10

11
0 50 100 150 200 250
e-Golf, Finnish electricity mix 2019
e-Golf, Finland electricity 2019 (used electricity)
e-Golf, Germany electricity mix 2019
e-Golf, Estonia electricity mix 2017
e-Golf, Iceland electricity mix 2010
e-Golf, Sweden electricity mix 2018
e-Golf, Manure biogas electricity, CHP share 95.8%
VW Golf 1.6 TDI, Diesel with 4.1% biodiesel
VW Golf 1.6 TDI, Diesel
VW Golf 1.0 TSI, Gasoline with 7.7% ethanol
VW Golf 1.0 TSI, Gasoline
VW Golf 1.4 TGI Gas, Manure biogas
VW Golf 1.4 TGI Gas, Manure biogas and 4.7% gasoline
e-Golf, Natural gas electricity, CHP share 95.8%
e-Golf, Coal electricity, CHP share 77.4%
e-Golf, Residual fuel oil electricity, CHP share 63.6%
e-Golf, Diesel oil electricity, CHP share 0%
e-Golf, Peat electricity, CHP share 83.9%
e-Golf, Wood electricity, CHP share 87.1%
e-Golf, Waste electricity, CHP share 75.4%
e-Golf, Hydro electricity
e-Golf, Wind electricity
e-Golf, Nuclear electricity
e-Golf, Photovoltaic electricity
VW Golf 1.6 TDI, NExBTL biodiesel (waste)
VW Golf 1.6 TDI, NExBTL biodiesel (tallow side product)
VW Golf 1.6 TDI, BioVerno biodiesel
VW Golf 1.0 TSI, Corn ethanol E85
VW Golf 1.0 TSI, Sugarcane ethanol E85
VW Golf 1.0 TSI, Wood ethanol E85
VW Golf 1.4 TGI Gas, CNG natural gas
Golf GTE Plug-In Hybrid, Finnish electricity mix
Volkswagen Golf in Finland (298 000 km, WLTP consumption), operation stage (driving), gCO2e/km
Tailpipe CO2 Tailpipe CO Tailpipe CH4 Tailpipe N2O
Fuel cycle CO2 Fuel cycle CH4 Fuel cycle N2O Fuel cycle others

12
0 10 20 30 40 50 60 70 80 90 100
e-Golf, Finnish electricity mix 2019
e-Golf, Finland electricity 2019 (used electricity)
e-Golf, Germany electricity mix 2019
e-Golf, Estonia electricity mix 2017
e-Golf, Iceland electricity mix 2010
e-Golf, Sweden electricity mix 2018
e-Golf, Manure biogas electricity, CHP share 95.8%
VW Golf 1.6 TDI, Diesel with 4.1% biodiesel
VW Golf 1.6 TDI, Diesel
VW Golf 1.0 TSI, Gasoline with 7.7% ethanol
VW Golf 1.0 TSI, Gasoline
VW Golf 1.4 TGI Gas, Manure biogas
VW Golf 1.4 TGI Gas, Manure biogas and 4.7% gasoline
e-Golf, Natural gas electricity, CHP share 95.8%
e-Golf, Coal electricity, CHP share 77.4%
e-Golf, Residual fuel oil electricity, CHP share 63.6%
e-Golf, Diesel oil electricity, CHP share 0%
e-Golf, Peat electricity, CHP share 83.9%
e-Golf, Wood electricity, CHP share 87.1%
e-Golf, Waste electricity, CHP share 75.4%
e-Golf, Hydro electricity
e-Golf, Wind electricity
e-Golf, Nuclear electricity
e-Golf, Photovoltaic electricity
VW Golf 1.6 TDI, NExBTL biodiesel (waste)
VW Golf 1.6 TDI, NExBTL biodiesel (tallow side product)
VW Golf 1.6 TDI, BioVerno biodiesel
VW Golf 1.0 TSI, Corn ethanol E85
VW Golf 1.0 TSI, Sugarcane ethanol E85
VW Golf 1.0 TSI, Wood ethanol E85
VW Golf 1.4 TGI Gas, CNG natural gas
Golf GTE Plug-In Hybrid, Finnish electricity mix
Volkswagen Golf in Finland (298 000 km, WLTP consumption), operation stage (driving), % of gCO2e
Tailpipe CO2 Tailpipe CO Tailpipe CH4 Tailpipe N2O
Fuel cycle CO2 Fuel cycle CH4 Fuel cycle N2O Fuel cycle others

13
0 50 100 150 200 250
e-Golf, Finnish electricity mix 2019
e-Golf, Finland electricity 2019 (used electricity)
e-Golf, Germany electricity mix 2019
e-Golf, Estonia electricity mix 2017
e-Golf, Iceland electricity mix 2010
e-Golf, Sweden electricity mix 2018
e-Golf, Manure biogas electricity, CHP share 95.8%
VW Golf 1.6 TDI, Diesel with 4.1% biodiesel
VW Golf 1.6 TDI, Diesel
VW Golf 1.0 TSI, Gasoline with 7.7% ethanol
VW Golf 1.0 TSI, Gasoline
VW Golf 1.4 TGI Gas, Manure biogas
VW Golf 1.4 TGI Gas, Manure biogas and 4.7% gasoline
e-Golf, Natural gas electricity, CHP share 95.8%
e-Golf, Coal electricity, CHP share 77.4%
e-Golf, Residual fuel oil electricity, CHP share 63.6%
e-Golf, Diesel oil electricity, CHP share 0%
e-Golf, Peat electricity, CHP share 83.9%
e-Golf, Wood electricity, CHP share 87.1%
e-Golf, Waste electricity, CHP share 75.4%
e-Golf, Hydro electricity
e-Golf, Wind electricity
e-Golf, Nuclear electricity
e-Golf, Photovoltaic electricity
VW Golf 1.6 TDI, NExBTL biodiesel (waste)
VW Golf 1.6 TDI, NExBTL biodiesel (tallow side product)
VW Golf 1.6 TDI, BioVerno biodiesel
VW Golf 1.0 TSI, Corn ethanol E85
VW Golf 1.0 TSI, Sugarcane ethanol E85
VW Golf 1.0 TSI, Wood ethanol E85
VW Golf 1.4 TGI Gas, CNG natural gas
Golf GTE Plug-In Hybrid, Finnish electricity mix
Volkswagen Golf in Finland (298 000 km, WLTP consumption), operation stage (driving) different components, gCO2e/km
CO2 CH4 N20 Others
14
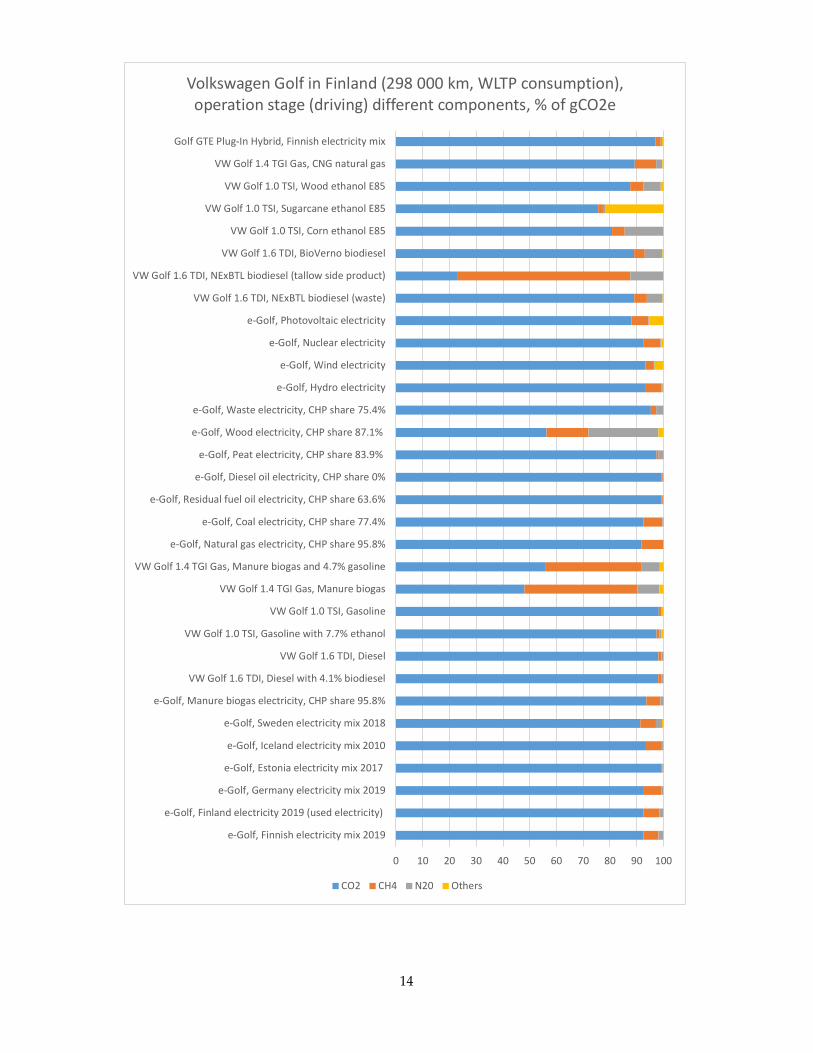
0 10 20 30 40 50 60 70 80 90 100
e-Golf, Finnish electricity mix 2019
e-Golf, Finland electricity 2019 (used electricity)
e-Golf, Germany electricity mix 2019
e-Golf, Estonia electricity mix 2017
e-Golf, Iceland electricity mix 2010
e-Golf, Sweden electricity mix 2018
e-Golf, Manure biogas electricity, CHP share 95.8%
VW Golf 1.6 TDI, Diesel with 4.1% biodiesel
VW Golf 1.6 TDI, Diesel
VW Golf 1.0 TSI, Gasoline with 7.7% ethanol
VW Golf 1.0 TSI, Gasoline
VW Golf 1.4 TGI Gas, Manure biogas
VW Golf 1.4 TGI Gas, Manure biogas and 4.7% gasoline
e-Golf, Natural gas electricity, CHP share 95.8%
e-Golf, Coal electricity, CHP share 77.4%
e-Golf, Residual fuel oil electricity, CHP share 63.6%
e-Golf, Diesel oil electricity, CHP share 0%
e-Golf, Peat electricity, CHP share 83.9%
e-Golf, Wood electricity, CHP share 87.1%
e-Golf, Waste electricity, CHP share 75.4%
e-Golf, Hydro electricity
e-Golf, Wind electricity
e-Golf, Nuclear electricity
e-Golf, Photovoltaic electricity
VW Golf 1.6 TDI, NExBTL biodiesel (waste)
VW Golf 1.6 TDI, NExBTL biodiesel (tallow side product)
VW Golf 1.6 TDI, BioVerno biodiesel
VW Golf 1.0 TSI, Corn ethanol E85
VW Golf 1.0 TSI, Sugarcane ethanol E85
VW Golf 1.0 TSI, Wood ethanol E85
VW Golf 1.4 TGI Gas, CNG natural gas
Golf GTE Plug-In Hybrid, Finnish electricity mix
Volkswagen Golf in Finland (298 000 km, WLTP consumption), operation stage (driving) different components, % of gCO2e
CO2 CH4 N20 Others

15
Economics and tax revenues
29.09
29.09
23.89
20.58
24.52
23.89
23.89
20.58
24.52
42.69
8.05
8.05
21.46
27.34
18.57
23.89
23.89
25.90
16.00
15.19
18.50
18.50
18.50
18.50
18.50
18.50
18.50
18.50
18.50
18.50
4.09
4.09
10.32
3.59
6.96
10.32
10.32
3.59
6.96
1.96
0.00
7.19
0.00
0.00
0.00
0.00
0.00
0.00
0.00
0.00
0 20 40 60 80 100
e-Golf
e-Golf with battery replacement
VW Golf Trendline 1.6 TDI, Petroleum diesel
VW Golf Trendline 1.0 TSI, Petroleum gasoline
VW Golf 1.5 TGI Gas, Biogas
VW Golf Trendline 1.6 TDI, NExBTL biodiesel
VW Golf Trendline 1.6 TDI, BioVerno biodiesel
VW Golf Trendline 1.0 TSI, E85
VW Golf 1.5 TGI Gas, CNG
Golf GTE Plug-In Hybrid, Finnish electricity mix
Life-cycle costs of Volkswagen Golf in Finland (298 000 km, WLTP consumption), thousand euros
Car Fuel/electricity Insurance, service, repair Vehicle taxes Extra battery

16
Gasoline 1920510
Diesel 750603
Gasoline/electricity plugin hybrid 12061 Gasoline/ethanol
4032Gasoline/methane
4775
Electricity2404
Diesel/electricity plugin hybrid 1034 Methane 821
Other 68
Passenger cars in use in Finland 31.12.2018 (Statistics Finland)
0
100
200
300
400
500
600
700
800
Car tax revenue in 2017 Electric cars replace all diesel cars Biogas cars replace all diesel cars
Effect on car tax (purchase) revenue in Finland, if in 2017 all diesel passenger cars had been either electric cars or biogas
cars, million euros

17
0
50
100
150
200
250
300
350
Vehicle tax revenue in 2017 Electric cars replace all diesel cars Biogas cars replace all diesel cars
Effect on vehicle tax (yearly) revenue in Finland, if in 2017 all diesel passenger cars had been either electric cars or
biogas cars, million euros
0
200
400
600
800
1000
1200
1400
1600
1800
Fuel tax revenue in 2017 Electric cars replace all diesel cars Biogas cars replace all diesel cars
Effect on fuel tax revenue in Finland, if in 2017 all diesel passenger cars had been either electric cars or biogas cars,
million euros

18
Environmental impacts of dedieselisation of the car fleet in Finland
0
1000
2000
3000
4000
5000
6000
7000
8000
9000
2017 Electric cars replace all diesel cars Biogas cars replace all diesel cars
Effect on greenhouse gas emissions of passenger cars in Finland, if in 2017 all diesel passenger cars had been either
electric cars or biogas cars (only fuel/electricity cycle), kt CO2e
0
50
100
150
200
250
300
350
400
450
500
2017 Electric cars replace all diesel cars Biogas cars replace all diesel cars
Effect on exhaust pipe particulate matter emissions of passenger cars in Finland, if in 2017 all diesel passenger
cars had been either electric cars or biogas cars, tons PM

19
Electric car sales globally and battery cell patent indicators
0
2000
4000
6000
8000
10000
12000
14000
16000
2017 Electric cars replace all diesel cars Biogas cars replace all diesel cars
Effect on exhaust pipe nitric oxide emissions of passengercars in Finland, if in 2017 all diesel passenger cars had been
either electric cars or biogas cars, tons PM

20
0
500
1000
1500
2000
2500
3000
1998 2000 2002 2004 2006 2008 2010 2012 2014 2016 2018
EV battery patent filing trend
Panasonic LG Chem Samsung SDI BYD
0 2000 4000 6000 8000 10000 12000 14000
Secondary cells (HO1M10)
Constructional details (H01M2)
Electrodes (H01M4)
EV battery cell technologies
BYD Panasonic Samsung SDI LG Chem

21

22
Data Below car component and material data and electricity/fuel data are given in detail.
Car components and materials Table 1. Volkswagen Golf Trendline 1.0 TSI 63 kW, gasoline, 5.7 L/100 km. Car components (generic data).
Component group All vehicles (kg)
ICEV only (kg)
ICEV (kg)
Body and doors 528.21
Brakes 12.28
Chassis 15.58
Fluids ICEV and EV 5.02
Vehicle interior and exterior 238.43
Tyres and wheels 79.61
Total 879.13
Engine (ICEV) 170.75
Fluids (ICEV only) 5.02
Other ICEV powertrain 92.55
ICEV transmission 52.03
ICEV battery 16.52
Total 336.86
Car weight 1216.00
Table 2. Volkswagen Golf Trendline 1.6 TDI 85 kW, diesel, 4.9 L/100 km. Car components (generic data).
Component group All vehicles (kg)
ICEV only (kg)
ICEV (kg)
Body and doors 565.13
Brakes 13.14
Chassis 16.67
Fluids ICEV and EV 5.37
Vehicle interior and exterior 255.10
Tyres and wheels 85.18
Total 940.58
Engine (ICEV) 182.69
Fluids (ICEV only) 5.37
Other ICEV powertrain 99.02
ICEV transmission 55.66
ICEV battery 17.68
Total 360.41
Car weight 1301.00

23
Table 3. Volkswagen Golf 1.5 TGI 96 kW, methane, 4.1 kg/100 km. Car components (generic data).
Component group All vehicles (kg)
ICEV only (kg)
ICEV (kg)
Body and doors 572.08
Brakes 13.30
Chassis 16.88
Fluids ICEV and EV 5.43
Vehicle interior and exterior 258.24
Tyres and wheels 86.22
Total 952.15
Engine (ICEV) 184.93
Fluids (ICEV only) 5.43
Other ICEV powertrain 100.24
ICEV transmission 56.35
ICEV battery 17.89
Total 364.84
Car weight 1317.00
Table 4. Volkswagen e-Golf 100 kW, electricity, 15.6 kWh/100 km (grid electricity consumption). Car components (generic data).
Component group All vehicles (kg)
EV only (kg)
EV (kg)
Body and doors 566.03
Brakes 13.16
Chassis 16.70
Fluids ICEV and EV 5.38
Vehicle interior and exterior 255.51
Tyres and wheels 85.31
Total 942.09
EV motor and transmission 304.36
EV differential transmission 38.56
EV Li-NCM battery 330.00
Total 672.92
Car weight 1615.00

24
Table 5. Volkswagen Golf, car materials. Some materials are lumped together (generic data).
Material Volkswagen Golf Trendline 1.0 TSI 63 kW (kg)
Volkswagen Golf Trendline 1.6 TDI 85 kW (kg)
Volkswagen Golf 1.5 TGI 96 kW Gas (kg)
Volkswagen e-Golf 100 kW (kg)
Volkswagen e-Golf 100 kW with extra battery pack (kg)
Plastics: 178.35 190.82 193.17 183.37 202.18
Polyethylene 16.31 17.45 17.66 13.43 13.43
Polypropylene 83.51 89.35 90.45 76.96 91.81
Polystyrene 34.11 36.50 36.95 42.91 46.87
Polyethylene terephthalate
29.38 31.43 31.82 33.10 33.10
Polyvinylchloride 15.05 16.10 16.30 16.96 16.96
Metals (non-ferrous): 109.86 117.54 118.98 299.24 452.03
Aluminum 73.18 78.30 79.26 167.89 239.50
Copper (manganese, cobalt, nickel)
36.68 39.24 39.72 131.35 212.53
Metals (ferrous): 807.70 864.16 874.78 835.49 835.82
Pig iron 24.10 25.78 26.10 3.54 3.54
Cast iron 131.88 141.10 142.83 5.25 5.25
Steel RR 635.37 679.78 688.14 799.13 799.13
Steel OK 16.35 17.49 17.71 27.57 27.90
Fluids: 14.35 15.35 15.54 95.93 175.79
Lubricating oil 7.02 7.51 7.61 1.13 1.13
Refrigerant 4.01 4.29 4.35 3.39 3.39
Water 3.32 3.55 3.59 91.40 171.26
Other materials: 105.74 113.13 114.52 200.98 279.19
Various plastics 33.86 36.23 36.68 38.16 38.16
Adhesives 4.03 4.31 4.37 18.43 30.64
Minerals (clay) 5.92 6.33 6.41 3.39 3.39
Glass 31.78 34.01 34.42 35.44 35.44
Wood 0.00 0.00 0.00 0.00 0.00
Rubber (not tyre) 10.06 10.77 10.90 9.82 9.82
Rubber (tyre) 18.39 19.68 19.92 20.73 20.73
Sulphuric acid 1.68 1.80 1.82 0.41 0.41
Lithium 0.00 0.00 0.00 5.22 9.84
Graphite 0.00 0.00 0.00 69.38 130.76

25
Electricity generation and use
Nuclear; 34.7%
Wind; 9.1%
Water; 18.6%
Bio (wood); 18.1%
Waste; 1.2%
Peat; 4.3%
Natural gas; 5.9%
Oil; 0.3%Coal; 7.5%
Solar; 0.3%
Electricity generation in Finland in 2019 (66.1 TWh), %
Nuclear; 4.7%Wind; 0.6%
Water; 1.9%Bio (wood); 3.7%
Waste; 2.5%
Peat; 27.7%
Natural gas; 19.0%
Oil; 1.4%
Coal; 38.4%
Solar; 0.1%
Electricity generation in Finland in 2019 (143.4 gCO2e/kWh), % (benefit sharing method)

26
Nuclear; 34.8%
Wind; 8.5%
Water; 23.0%
Bio (wood); 14.4%
Waste; 1.0%
Peat; 3.2%
Natural gas; 8.7%
Oil; 0.3% Coal; 5.6%Solar; 0.2%
Oil shale; 0.3%
Electricity used in Finland in 2019 (86.1 TWh), %
Nuclear; 4.8%Wind; 0.6%
Water; 2.4%Bio (wood); 2.9%
Waste; 2.0%
Peat; 20.9%
Natural gas; 33.1%
Oil; 1.2%
Coal; 29.1%
Solar; 0.1%Oil shale; 2.9%
Electricity used in Finland in 2019 (141.1 gCO2e/kWh), % (benefit sharing method)

27
Nuclear; 41.2%
Wind; 10.4%
Water; 38.8%
Bio (wood); 7.0%
Waste; 0.5% Peat; 0.5%
Natural gas; 0.3%Oil; 0.2%
Coal; 0.9%Solar; 0.2%
Electricity generation in Sweden in 2018 (159.6 TWh), %
Nuclear; 25.2%
Wind; 3.3%
Water; 18.2%
Bio (wood); 6.3%Waste; 4.3%
Peat; 14.0%
Natural gas; 4.6%
Oil; 3.5%
Coal; 20.3%
Solar; 0.3%
Electricity generation in Sweden in 2018 (32.0 gCO2e/kWh), % (benefit sharing method)

28
Wind; 6.1% Water; 0.2%
Bio (wood); 3.4%Waste; 0.0%
Peat; 0.9%
Natural gas; 0.5%
Oil; 1.2%
Coal; 0.2%
Oil shale; 87.4%
Electricity generation in Estonia in 2017 (11.86 TWh), %
Wind; 0.0%Water; 0.0%
Bio (wood); 0.1%
Waste; 0.0%Peat; 0.6%
Natural gas; 0.2%Oil; 0.5%Coal; 0.1%
Oil shale; 98.5%
Electricity generation in Estonia in 2017 (1365 gCO2e/kWh), % (benefit sharing method)

29
Oil; 0.3% Coal; 9.5%
Brown coal; 19.7%
NG; 10.2%
Nuclear; 13.7%
Wind; 24.6%
Solar; 9.0%
Hydro; 3.7%Waste; 0.6%
Bio; 8.7%
Electricity generation in Germany in 2019 (518.1 TWh), %
Oil; 0.5%
Coal; 25.2%
Brown coal; 55.2%
NG; 15.1%Nuclear; 0.7%Solar; 1.1%Hydro; 0.1% Waste; 0.5%
Bio; 0.9%
Electricity generation in Germany in 2019 (386.1 gCO2e/kWh), % (benefit sharing method)

30
Water; 75.0%
Oil; 0.01%
Geothermal; 25.0%
Electricity generation in Iceland in 2010 (17.06 TWh), %
Water; 90.8%
Oil; 0.8%
Geothermal; 8.4%
Electricity generation in Iceland in 2010 (1.6 gCO2e/kWh), % (benefit sharing method)

31
Fuels production and use
Petroleum ; 1.161
Natural gas ; 0.112
Coal ; 0.001Coke ; 0.019
Gasoline production energy consumption (1 MJ product), MJ
20.145
0.013
0.042
1.913
0.7790.001
0.001
69.300
0.021
0.206
0.595
Gasoline GHG emissions, tot 93.0 g CO2e/MJ, gCO2e/MJ
Well-to-fuel energy-based CO2
Well-to-fuel energy-based CH4
Well-to-fuel energy-based N2O
Drilling CO2 removal and flaringCO2
Venting, flaring and fugitive CH4
Venting, flaring and fugitive N2O
Well-to-fuel CO
Combustion CO2
Combustion CH4
Combustion N2O
32
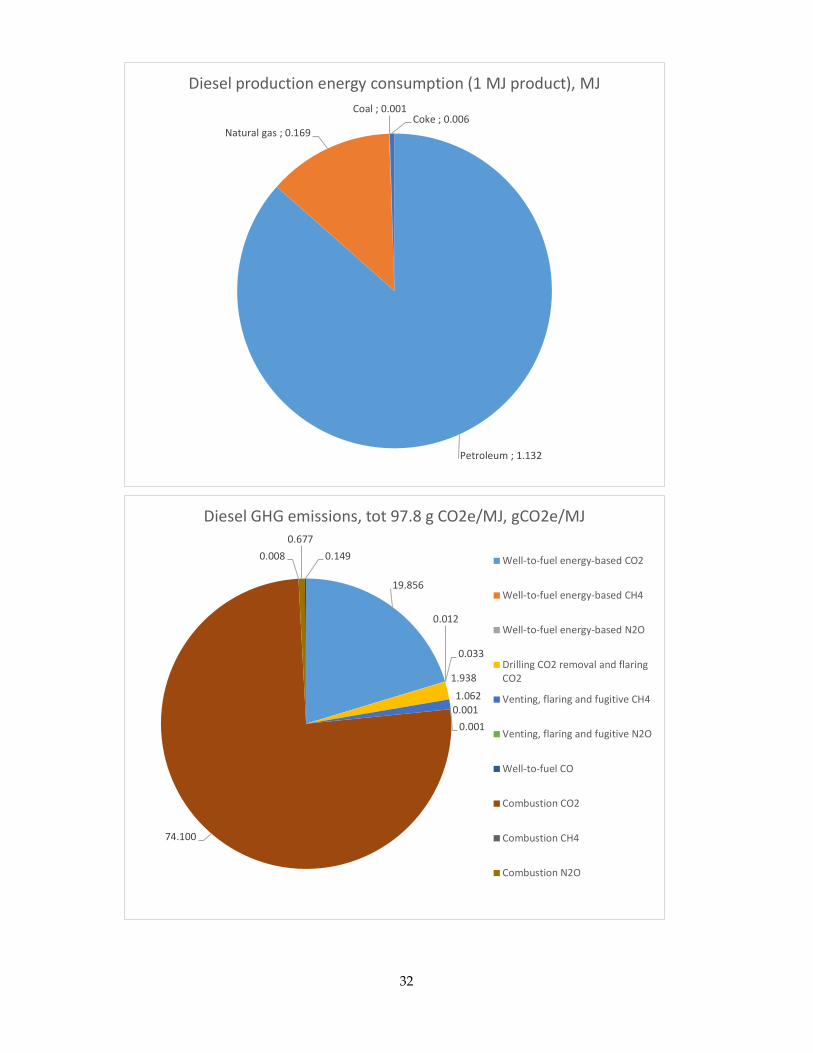
Petroleum ; 1.132
Natural gas ; 0.169
Coal ; 0.001Coke ; 0.006
Diesel production energy consumption (1 MJ product), MJ
19.856
0.012
0.033
1.938
1.0620.001
0.001
74.100
0.0080.677
0.149
Diesel GHG emissions, tot 97.8 g CO2e/MJ, gCO2e/MJ
Well-to-fuel energy-based CO2
Well-to-fuel energy-based CH4
Well-to-fuel energy-based N2O
Drilling CO2 removal and flaringCO2
Venting, flaring and fugitive CH4
Venting, flaring and fugitive N2O
Well-to-fuel CO
Combustion CO2
Combustion CH4
Combustion N2O

33
Petroleum ; 0.066
Natural gas ; 0.084
Coal ; 0.002Biomass ; 0.012 Peat ; 0.003
Bioverno diesel production energy consumption, raw-material biomass excluded (1 MJ product), MJ
20.145
0.013
0.042
1.913
0.779
0.001
0.001
69.300
0.021
0.206 0.595
BioVerno diesel GHG emissions, tot 11.8 gCO2e/MJ, g CO2e/MJ
Well-to-fuel energy-based CO2
Well-to-fuel energy-based CH4
Well-to-fuel energy-based N2O
Drilling CO2 removal and flaringCO2
Venting, flaring and fugitive CH4
Venting, flaring and fugitive N2O
Well-to-fuel CO
Combustion CO2
Combustion CH4
Combustion N2O

34
Petroleum ; 0.060
Natural gas ; 0.114
Coal ; 0.002
NExBTL diesel (raw material is waste animal fats) production energy consumption, biomass excluded (1 MJ
product), MJ
11.045
0.006
0.0160.461
0.600
0.000
0.0010.000
0.008 0.677 0.149
NExBTL diesel (raw material is waste animal fats) GHG emissions, tot 13.0 g CO2e/MJ, gCO2e/MJ
Well-to-fuel energy-based CO2
Well-to-fuel energy-based CH4
Well-to-fuel energy-based N2O
Drilling CO2 removal and flaringCO2
Venting, flaring and fugitive CH4
Venting, flaring and fugitive N2O
Well-to-fuel CO
Combustion CO2
Combustion CH4
Combustion N2O

35
Petroleum ; 0.060
Natural gas ; 0.114
Coal ; 0.002
NExBTL diesel (raw material is side-product animal fats) production energy consumption, biomass excluded (1 MJ
product), MJ
11.399
0.006
0.017
0.473
33.094
5.600
0.001
0.0000.008 0.677
0.149
NExBTL diesel (raw material is side-product animal fats)GHG emissions, tot 51.4 g CO2e/MJ, gCO2e/MJ
Well-to-fuel energy-based CO2
Well-to-fuel energy-based CH4
Well-to-fuel energy-based N2O
Drilling CO2 removal and flaringCO2
Venting, flaring and fugitive CH4
Venting, flaring and fugitive N2O
Well-to-fuel CO
Combustion CO2
Combustion CH4
Combustion N2O

36
Petroleum ; 0.034
Natural gas ; 0.038
Coal ; 0.051
Hydro; 0.033
Nuclear; 0.045
Wind ; 0.005
Biomass ; 0.062
Peat ; 0.015
Manure biogas production energy consumption (1 MJproduct), MJ
11.456
0.043
0.1150.098
9.971
0.000
0.013 0.000
0.1331.869
0.360
Manure biogas GHG emissions, tot 24.1 g CO2e/MJ, gCO2e/MJ
Well-to-fuel energy-based CO2
Well-to-fuel energy-based CH4
Well-to-fuel energy-based N2O
Drilling CO2 removal and flaringCO2
Venting, flaring and fugitive CH4
Venting, flaring and fugitive N2O
Well-to-fuel CO
Combustion CO2
Combustion CH4
Combustion N2O

37
Petroleum ; 0.102
Natural gas ; 0.656
Coal ; 0.093
Hydro; 0.006
Nuclear; 0.015Wind ; 0.002
Corn ethanol production energy consumption, biomass excluded (1 MJ product), MJ
53.118
0.022
0.082
1.904
4.021
13.674
0.003
0.0000.414
0.355
0.000
Corn ethanol GHG emissions, tot 73.6 g CO2e/MJ, gCO2e/MJ
Well-to-fuel energy-based CO2
Well-to-fuel energy-based CH4
Well-to-fuel energy-based N2O
Land-use (agriculture) CO2
Land-use (agriculture) CH4
Land-use (agriculture) N2O
Well-to-fuel CO
Combustion CO2
Combustion CH4
Combustion N2O
Combustion CO

38
Petroleum ; 0.103
Natural gas ; 0.027
Coal ; …
Sugarcane ethanol production energy consumption, biomass excluded (1 MJ product), MJ
9.373
0.0070.022
0.381
0.177
0.0010.414
0.355
Sugarcane ethanol GHG emissions, tot 10.7 g CO2e/MJ, gCO2e/MJ
Well-to-fuel energy-based CO2
Well-to-fuel energy-based CH4
Well-to-fuel energy-based N2O
Land-use (agriculture) CO2
Land-use (agriculture) CH4
Land-use (agriculture) N2O
Well-to-fuel CO
Combustion CO2
Combustion CH4
Combustion N2O
Combustion CO

39
Petroleum ; 0.150 Natural gas ; 0.006Coal ; 0.039
Biomass ; 3.005
Wood ethanol production energy consumption (1 MJproduct), MJ
14.984
1.273
2.532
0.472
0.355
0.000
0.327
0.0000.414 0.355
0.000
Wood ethanol GHG emissions, tot 20.7 g CO2e/MJ, gCO2e/MJ
Well-to-fuel energy-based CO2
Well-to-fuel energy-based CH4
Well-to-fuel energy-based N2O
Drilling CO2 removal and flaringCO2
Venting, flaring and fugitive CH4
Venting, flaring and fugitive N2O
Well-to-fuel CO
Combustion CO2
Combustion CH4
Combustion N2O

40
Petroleum ; 0.001
Natural gas ; 1.233
Coal ; 0.004Nuclear; 0.003
Natural gas to CNG production energy consumption (1 MJ), MJ
13.562
0.005
0.009
1.498
6.216
0.000
0.001
56.100
0.1331.869 0.360
Natural gas to CNG GHG emissions, tot 79.8 gCO2e/MJ, gCO2e/MJ
Well-to-fuel energy-based CO2
Well-to-fuel energy-based CH4
Well-to-fuel energy-based N2O
Drilling CO2 removal and flaringCO2
Venting, flaring and fugitive CH4
Venting, flaring and fugitive N2O
Well-to-fuel CO
Combustion CO2
Combustion CH4
Combustion N2O

41
Manufacturing a car
Principles and parameters
Volkswagen Golf models’ weight and fuel/electricity consumption (WLTP) were used in calculations, not the real material and energy use data from Volkswagen manufacturing plants. The scientific literature data are used in the calculations. Volkswagen Golf is an average-size car in Finland.
In combined heat and power (CHP) generation, the energy inputs and emissions are allocated between heat and power outputs. The principles of the allocation methods are explained by Soimakallio and Manninen4:
Energy method: primary energy is allocated to heat and power on the basis of the energy (enthalpy) content of those products. Burning 100 MJ fuel in a CHP plant generates 36 MJe usable electricity and 51 MJ heat. These values are used in this analysis. In power generation, the power station losses are taken into account.
Exergy method: primary energy is allocated to power and heat on the basis of the exergy content of those products. The exergy of power is higher than the exergy of heat and thus e.g. the CO2e emissions per kWh for power are higher than in energy method. The exergy factors used for power and heat are 1 and 0.24, respectively. These values were used by Soimakallio and Manninen.
4 Soimakallio Sampo, Manninen Jussi, Chapter 2: Energy efficiency and the Finnish energy system, in Energy Use – Visions and Technology Opportunities in Finland, VTT, Edita, 2007.
2302
692311174
262 262
Manufacturing a generic one-ton car, energy consumption (not including materials), MJ
Crude oil
Natural gas
Coal
Hydroelectric
Nuclear

42
Price method: primary energy is allocated to power and heat on the basis of the difference between the prices of those products. The price of power is higher than the price of heat and thus e.g. the CO2e emissions per kWh for power are higher than in energy method. The average household prices for electricity and district heat were calculated from 2015 to 2017 and were found to be 16.99 cent/kWh and 7.80 cent/kWh, respectively5.
Benefit sharing method: primary energy is allocated to heat and power on the basis of the fuel consumption of the forms of heat and power production replaced by CHP. The benefit for power is higher than the benefit for heat and thus e.g. the CO2e emissions per kWh for power are higher than in energy method. The efficiencies of the replaced heat and power production plants used here equal to 89 % and 36 %, respectively. In power generation, the power station losses are taken into account. Benefit sharing method is used in this analysis.
Partial benefit sharing method: primary energy is allocated to heat on the basis of the fuel consumption of alternative heat production, and the remaining share is allocated to power. Not calculated in this analysis.
No sharing method: primary energy is allocated without sharing, i.e. allocated to one product only. If all primary energy is allocated to electricity, e.g. all CO2e emissions are allocated to power.
For electricity generated in Finland:
90% steam generator efficiency 44% turbine efficiency 99% electrical generator efficiency 3.8% power station losses (Finnish Energy statistics 2017) 3.24% transmission losses (Finnish Energy statistics 2017)
Battery packs:
The carbon footprint of manufacturing a 330 kg and 35.8 kWh battery pack (e-Golf) is about 4 ktCO2e. In calculations, it has been assumed that the battery is lithium manganese oxide battery that contains no nickel and cobalt. Lithium manganese cobalt oxide batteries contain nickel and cobalt, but manufacturing these metals for a 330 kg battery is not a major source of greenhouse gases (about 260 kg CO2e).
There is not yet any second-life applications for the electric car batteries, so all life-cycle emissions have to be allocated to electric car use.
The most energy (electricity) intensive part of battery pack manufacturing is the manufacturing of battery cells. They are manufactured in countries with high carbon intensity in electricity generation (China, Japan, South Korea, Poland). In this analysis, South-Korean electricity mix was used.
Fuel and electricity consumption, curb weight and battery capacity:
e-Golf, 15.7 kWh/100 km, 1615 kg, 35.8 kWh VW Golf Trendline 1.6 TDI, petroleum diesel 4.9 L/100 km, 1301 kg VW Golf Trendline 1.0 TSI, petroleum gasoline 5.7 L/100 km, 1216 kg
5 Statistics Finland's PX-Web databases, Price of district heating by type of consumer, Price of electricity by type of consumer.

43
VW Golf 1.5 TGI Gas, methane 4.1 kg/100 km, 1317 kg VW Golf Trendline 1.6 TDI, NExBTL biodiesel 5.1 L/100 km, 1301 kg VW Golf Trendline 1.6 TDI, BioVerno biodiesel 5.1 L/100 km, 1301 kg VW Golf Trendline 1.0 TSI, E85 7.8 L/100 km, 1216 kg Golf GTE Plug-In Hybrid, gasoline 1.9 L/100 km, electricity 12 kWh/100 km, 1615 kg,
13kWh
Notifications (figures)
Electricity generation and consumption data for Finland are from Finnish Energy statistics. Peat LULUCF and emissions from the field are taken into account for peat (Statistics Finland's data for years 2010–2014). Export and import data are also from Finnish Energy statistics, and the electricity generation data for Sweden, Russia, Norway and Estonia are from Energimyndigheten, World Bank, IEA Statistics and Statistics Estonia, respectively. Germany electricity generation data are from Fraunhofer Institute for Solar Energy Systems ISE and Iceland electricity generation data are from IEA Statistics.
The carbon footprints i.e. global warming potential life-cycle analyses are carried out from cradle to gate. All life-cycle stages and all greenhouse gases are taken into account. This is also the case for gasoline and diesel, natural gas and biofuels.
Figure “Life-cycle carbon footprints of VW Golf (including materials, manufacturing, maintenance, driving and end-of-life) as a function of driving distance”:
New electric car beats new diesel car after 29 000 km in Finland. New electric car beats new gasoline car after 26 000 km in Finland. New electric car beats old diesel car after 70 000 km (old diesel car still has driving,
fuel cycle, maintenance and end-of-life emissions – but not the emissions from manufacturing a car) in Finland.
Electric car in Finland beats biogas car after 208 000 km in Finland (if there is no battery pack replacement)
Electric car with biogas electricity beats biogas ICE car after 136 000 km. Electric car with biogas electricity beats biogas ICE car after 336 000 km, if the battery
pack is replaced once.
Figures “Volkswagen Golf in Finland (298 000 km, WLTP consumption), gCO2e/km” and “Volkswagen Golf in Finland (298 000 km, WLTP consumption), tCO2e/lifetime”:

44
The CHP share values are from Finland 2019 electricity mix. Lifetime distance of an average car used in calculations is 298 000 km.6 In Finland in 2017, diesel fuel contained 4.1 vol-% HVO biodiesel (assumption 2.05
vol-% NExBTL biodiesel and 2.05 vol-% BioVerno biodiesel). In Finland in 2017, gasoline contained 7.71 vol-% ethanol (assumption 3.76 vol-%
Brazilian sugarcane ethanol, 3.76 vol-% U.S. corn ethanol and 0.19 vol-% Finnish cellulosic ethanol).
In real life (own two-year experiment with gas Touran), 4.7% of fuel is gasoline (by energy content).
NExBTL and BioVerno biodiesels have 4.9% higher fuel consumption by volume than petroleum diesel due to lower volumetric energy content of HVO diesel.
E85 has 37.3% higher fuel consumption by volume than petroleum gasoline.7
Figure “Life-cycle costs of Volkswagen Golf in Finland (298 000 km, WLTP consumption), thousand euros”:
Fuel price o Gasoline 1.61 e/L (projected 1.8.2020) o Diesel 1.46 e/L (projected 1.8.2020) o E85 ethanol/gasoline 1.11 e/L o NExBTL and BioVerno biodiesel 1.56 e/L o Compressed biogas 1.52 e/L o Compressed natural gas 1.31 e/L o Electricity 0.17 e/kWh o Today’s prices are assumed for the whole lifetime.
Insurance, service, repair etc. 1000 e/year Vehicle tax
o Volkswagen Golf Trendline 1.0 TSI 63 kW: 194.18 e/year o Volkswagen Golf Trendline 1.6 TDI 85 kW: 558.08 e/year o Volkswagen Golf 1.5 TGI 96 kW Gas: 375.95 e/year o Volkswagen e-Golf 100 kW (136 hp) automatic: 221.18 e/year o Volkswagen Golf GTE Plug-In Hybrid 150 kW DSG: 105.85/year o Today’s taxes are assumed for the whole lifetime.
In Finland, e-Golf (new electric car) gives cheapest life-time kilometers followed by CNG (compressed natural gas) car and CBG (compressed biogas) car.
In Finland, lifetime costs are about equal for gasoline Golf and diesel Golf. January 2020 fuel/electricity prices and taxes and January 2020 car prices were used
for the whole lifetime of the car.
Figure “Global annual sales of plug-in electric passenger cars in world's top markets 2011–2018” is from https://en.wikipedia.org/wiki/Electric_car. In 2018, the sales of electric cars were about 1.85 million globally. In 2019, the number of sold electric cars was probably over
6 Klemola Kimmo, Life-cycle energy consumption and carbon dioxide emissions of world cars, Lappeenranta University of Technology, 2006. 7 Model year 2007 fuel economy guide, U.S. Environmental Protection Agency.

45
2 million. About 71 million passenger cars were sold in the world in 2017, and in total about 97 million motor vehicles (International Organization of Motor Vehicle Manufacturers).
Japanese Panasonic, South-Korean LG Chem and Samsung SDI and Chinese BYD are the four major manufacturers in EV battery cell technologies. The patent trend analyses for this report were provided by TurnIP (http://www.turnip.co.in).
References (selected) The life-cycle analysis tool consists of model library and inventory with thousands of references. Only selected references are presented here.
General
Power generation in Finland – fuels and CO2-emissions, Energiateollisuus (Finnish Energy), 15.1.2020.
Electricity net production, imports and exports (GWh) in Finland, Energiateollisuus (Finnish Energy), 27.1.2020.
Combined heat and power – evaluating the benefits of greater global investment, International Energy Agency, 2008.
Key world energy statistics 2008, International Energy Agency, 2008.
Hyödynjakomenetelmä (Benefit sharing method), Motiva, http://www.motiva.fi/files/6820/Kuvaus_hyodynjako-menetelmasta.pdf.
Soimakallio Sampo, Manninen Jussi, Chapter 2: Energy efficiency and the Finnish energy system, in Energy Use – Visions and Technology Opportunities in Finland, VTT, Edita, 2007.
Honorio Livio, Bartaire Jean-Guy, Bauerschmidt Rolf, Öhman Tapio, Tihanyi Zoltan, Zeinhofer Hans, Scowcroft John F., de Janeiro Vasco, Krüger Hartmut, Meier Hans-Joachim, Offermann Daniel, Langnickel Ulrich, Efficiency in Electricity Generation, The Union of the Electricity Industry - EURELECTRIC, July, 2003.
How much electricity is lost in transmission and distribution in the United States?, The U.S. Energy Information Administration (EIA), www.eia.gov.
Keto Matias, Energiamuotojen kerroin, Yleiset perusteet ja toteutuneen sähkön- ja lämmöntuotannon kertoimet, Raportti ympäristöministeriölle, Aalto-yliopiston teknillinen korkeakoulu, Energiatekniikan laitos, 2010.
Fuel-processing and fuel fugitive emissions: IPCC
IPCC Draft 2006 IPCC Guidelines for National Greenhouse Gas inventories, Volume 2: Energy, Intergovernmental Panel on Climate Change, Hayama, Japan, 2006.
Ozone-depleting substances (ODS) – A list of Class I and Class II ODS including their ozone depletion potential (ODP) and global warming potential (GWP), U.S. Environmental Protection Agency, http://www.epa.gov.
Petroleum
Jacobs Consultancy, Life cycle assessment comparison of North American and imported crudes, July, Jacobs Consultancy, Chicago, Illinois, 2009.

46
European Commission, Study on actual GHG data for diesel, petrol, kerosene and natural gas, October, Interim Report, European Commission, 2014.
Extraction of crude oil and gas, Chalmers.
Oil electricity energy system, [no desulfurization or particulate removal], Chalmers.
Keiserås Bakkane Kristin, Life cycle data for Norwegian oil and gas, Tapir Publishers, 1994.
Ökoinventare von Energiesystemen, Grundlagen für den ökologischen Vergleich von Energiesystemen und den Einbezug von Energiesystemen in Ökobilanzen für die Schweiz. ETH, Eidgenössische Technische Hochschule, Zürich, Gruppe Energie – Stoffe – Umwelt (ESU), Paul Scherrer Institut, Villigen/Würenlingen, Sektion Ganzheitliche Systemanalysen, 3rd edition, 1996.
Natural gas
European Commission, Study on actual GHG data for diesel, petrol, kerosene and natural gas, October, Interim Report, European Commission, 2014.
Natural gas, cradle-to-gate, Chalmers.
Fuel gas electricity energy system, Chalmers.
Hallberg et al, Setup of f3 data network for Well-to-wheel (method and) LCI data for fossil and renewable fuels in the Swedish market, f3 – Swedish Knowledge Centre for Renewable Transportation Fuels, f3 project report, Available at www.f3centre.se, 2013.
Ökoinventare von Energiesystemen, Grundlagen für den ökologischen Vergleich von Energiesystemen und den Einbezug von Energiesystemen in Ökobilanzen für die Schweiz. ETH, Eidgenössische Technische Hochschule, Zürich, Gruppe Energie – Stoffe – Umwelt (ESU), Paul Scherrer Institut, Villigen/Würenlingen, Sektion Ganzheitliche Systemanalysen, 3rd edition, 1996.
Coal, anthracite, bituminous coal sub-bituminous coal, coaking coal
Spath Pamela L., Mann Margaret K., Kerr Dawn R., Life cycle assessment of coal-fired power production, National Renewable Energy Laboratory, June, 1999. [including mining transportation and FGD]
Life cycle assessment of coal-fired power production, Chalmers.
Stone coal electricity energy system, [adjusted to Hanasaari B., i.e. desulphurization and electrostatic precipitators are used, particulates and SO2 substantially lower], Chalmers.
Ökoinventare von Energiesystemen, Grundlagen für den ökologischen Vergleich von Energiesystemen und den Einbezug von Energiesystemen in Ökobilanzen für die Schweiz. ETH, Eidgenössische Technische Hochschule, Zürich, Gruppe Energie – Stoffe – Umwelt (ESU), Paul Scherrer Institut, Villigen/Würenlingen, Sektion Ganzheitliche Systemanalysen, 3rd edition, 1996.
Lignite
Spath Pamela L., Mann Margaret K., Kerr Dawn R., Life cycle assessment of coal-fired power production, National Renewable Energy Laboratory, June 1999. [including mining transportation and FGD]

47
Life cycle assessment of coal-fired power production, Chalmers.
Lignite electricity energy system, Chalmers.
Ökoinventare von Energiesystemen, Grundlagen für den ökologischen Vergleich von Energiesystemen und den Einbezug von Energiesystemen in Ökobilanzen für die Schweiz. ETH, Eidgenössische Technische Hochschule, Zürich, Gruppe Energie – Stoffe – Umwelt (ESU), Paul Scherrer Institut, Villigen/Würenlingen, Sektion Ganzheitliche Systemanalysen, 3rd edition, 1996.
Petroleum coke, residual fuel oil (high and low sulphur content), diesel
Extraction of crude oil and gas, Chalmers.
Oil electricity energy system, [no desulfurization or particulate removal], Chalmers.
Keiserås Bakkane Kristin, Life cycle data for Norwegian oil and gas, Tapir Publishers, 1994.
Ökoinventare von Energiesystemen, Grundlagen für den ökologischen Vergleich von Energiesystemen und den Einbezug von Energiesystemen in Ökobilanzen für die Schweiz. ETH, Eidgenössische Technische Hochschule, Zürich, Gruppe Energie – Stoffe – Umwelt (ESU), Paul Scherrer Institut, Villigen/Würenlingen, Sektion Ganzheitliche Systemanalysen, 3rd edition, 1996.
Palou-Rivera Ignasi, Wang Michael, Updated estimation of energy efficiencies of U.S. petroleum refineries, Center for Transportation Research, Argonne National Laboratory, July, 2010.
Oil shale
Gavrilova Olga, Randla Tiina, Vallner Leo, Strandberg Marek, Vilu Raivo, Life cycle analysis of the Estonian oil shale industry, Institute of Chemistry/Institute of Geology, Tallinn University of Technology, Estonian Fund for Nature, Tallinn, 2005.
Peat
Tilastokeskus, Suomen kasvihuonekaasupäästöt 1990–2015, Helsinki 2016.
Peat fired plant for heat and power production, Chalmers.
Kirkinen Johanna, Soimakallio Sampo, Mäkinen Tuula, McKeough Paterson, Savolainen Ilkka, Turvepohjaisen F–T-dieselin tuotannon ja käytön kasvihuonevaikutukset, VTT tiedotteita 2418, VTT, 2007.
Wood chips, wood pellets
Wood chips fired plant (with stoker) for heat and power production, Chalmers.
Wood pellets fired plant for heat and power production, Chalmers.
Incineration of wood, Chalmers.
Klemola Kimmo, Energy from Finnish softwood – ethanol, electricity or heat?, Lappeenranta University of Technology, 2013.

48
Johansson L.S., Leckner B., Gustavsson L., Cooper D., Tullin C., Potter A. Emission characteristics of modern and old-type residential boilers fired with wood logs and wood pellets, Atmospheric Environment 38(2004):4183–4195, 2004.
Korhonen K.T., Heikkinen J., Henttonen H., Ihalainen A., Pitkänen J., Tuomainen T., Suomen metsävarat 2004–2005, Metsätieteen Aikakauskirja 1B, 2006.
Nuutinen T., Hirvelä H., Hakkuumahdollisuudet Suomessa valtakunnan metsien 10. inventoinnin perusteella, Metsätieteen aikakauskirja 1B, 2006.
Alakangas E., Properties of fuels used in Finland, VTT Research Notes 2045, VTT Technical Research Centre of Finland, 2000.
Mäki-Simola E., Torvelainen J., Removals and transportation of roundwood, Finnish Statistical Yearbook of Forestry 2012, Finnish Forest Research Institute, 2012.
Peltola A., Foreign trade by forest industries, Finnish Statistical Yearbook of Forestry 2012. Finnish Forest Research Institute, 2012.
Ylitalo E., Wood consumption, Finnish Statistical Yearbook of Forestry 2012, Finnish Forest Research Institute, 2012.
Rieppo K., Väkevä J., Örn J., Metsäkoneiden polttoaineen kulutuksen mittaaminen, esitutkimus, Forest machinery fuel consumption measurement, preliminary study, Metsäteho, 2003.
Wang M.Q., GREET 1.5—Transportation fuel-cycle model, vol. 1: methodology, development, use, and results, Center for Transportation Research, Energy Systems Division, Argonne National Laboratory, August, 1999.
Torvelainen J., Harvesting and transportation of roundwood, Finnish Statistical Yearbook of Forestry 2011, Finnish Forest Research Institute, 2011.
Juntunen M-L., Herrala-Ylinen H., Silviculture, Finnish Statistical Yearbook of Forestry 2011, Finnish Forest Research Institute, 2011.
Väkevä J., Pennanen O., Örn J., Timber truck fuel consumption, Puutavara-autojen polttoaineen kulutus, Metsäteho Report 166, 2004.
Peltomaa R., Drainage of forests in Finland, Irrigation and Drainage, 56(S1): 151–59, 2007.
Waste burning
Combustion of waste to generate heat and electricity, Chalmers.
Jätevoimalan toiminta lukuina, http://www.vantaanenergia.fi/fi/TietoaKonsernista/jatevoimalahanke/Sivut/jatevoimalan_toiminta_lukuina.aspx, 18.09.2014.
Hydro electricity
Hydro electricity energy system, Chalmers.
Ökoinventare von Energiesystemen, Grundlagen für den ökologischen Vergleich von Energiesystemen und den Einbezug von Energiesystemen in Ökobilanzen für die Schweiz. ETH, Eidgenössische Technische Hochschule, Zürich, Gruppe Energie – Stoffe – Umwelt

49
(ESU), Paul Scherrer Institut, Villigen/Würenlingen, Sektion Ganzheitliche Systemanalysen, 3rd edition, 1996.
Wind power
Wind electricity energy system, Chalmers.
Ökoinventare von Energiesystemen, Grundlagen für den ökologischen Vergleich von Energiesystemen und den Einbezug von Energiesystemen in Ökobilanzen für die Schweiz. ETH, Eidgenössische Technische Hochschule, Zürich, Gruppe Energie – Stoffe – Umwelt (ESU), Paul Scherrer Institut, Villigen/Würenlingen, Sektion Ganzheitliche Systemanalysen, 3rd edition, 1996.
Spath P.L., Mann M.K., Life cycle assessment of renewable hydrogen production via wind/electrolysis. Colorado: National Renewable Energy Laboratory, 2004.
Nuclear power
Nuclear electricity energy system, Chalmers.
Ökoinventare von Energiesystemen, Grundlagen für den ökologischen Vergleich von Energiesystemen und den Einbezug von Energiesystemen in Ökobilanzen für die Schweiz. ETH, Eidgenössische Technische Hochschule, Zürich, Gruppe Energie – Stoffe – Umwelt (ESU), Paul Scherrer Institut, Villigen/Würenlingen, Sektion Ganzheitliche Systemanalysen, 3rd edition, 1996.
Montreal protocol on substances that deplete the ozone layer, Ozone Secretariat, United Nations Environment Programme, ninth edition, 2012. (Regarding the use of CFC-114 in uranium enrichment)
Photovoltaic power
Hsu David D., O’Donoughue Patrick, Fthenakis Vasilis, Heath Garvin A., Kim Hyung Chul, Sawyer Pamala, Choi Jun-Ki, Turney Damon E., Life Cycle Greenhouse Gas Emissions of Crystalline Silicon Photovoltaic Electricity Generation Systematic Review and Harmonization, volume 16, Number S1, Journal of Industrial Ecology, 2012.
Perpiñan O., Lorenzo E., Castro M.A., Eyras, R. Energy payback time of grid connected PV systems: comparison between tracking and fixed systems. Progress in photovoltaics: re-search and applications, 17(2), 137-147, 2009.
Wafer production, for photovoltaic cells, Chalmers.
Suomalainen K., Environmental life cycle assessment of a large-scale grid-connected PV power plant. Environmental Systems Analysis report 2006:14, Chalmers University of Tech-nology, Gothenburg, Sweden, 2006.
Cetinkaya E., Dincer I., Naterer G.F., Life cycle assessment of various hydrogen production methods, International Journal of Hydrogen Energy, 37(3): 2071–2080, 2012.

50
Biogas
Pimentel David, Biomass utilization, limits of Encyclopedia of Physical Science and Technology, 3rd ed., Vol. 2. San Diego, Academic Press, 2002.
Persson Margareta, Evaluation of upgrading techniques for biogas, School of Environmental Engineering, Lund University, October 2003.
Anker Thyø Kathrine, Wenzel Henrik, Life cycle assessment of biogas from maize silage and from manure - for transport and for heat and power production under displacement of

51
natural gas based heat works and marginal electricity in northern Germany, Institute for Product Development, June 21st 2007.
NExBTL biodiesel
NExBTL® renewable diesel Singapore plant tallow pathway description, Neste Oil, March, 2013. available at: California Environmental Protection Agency, Air Resources Board, http://www.arb.ca.gov/fuels/lcfs/2a2b/apps/neste-aus-rpt-031513.pdf.
Singapore energy statistics 2015, Energy Market Authority, Singapore, 2015. Available at https://www.ema.gov.sg/cmsmedia/Publications_and_Statistics/Publications/SES2015_Final_website_2mb.pdf
Tallow production (taking tallow production into account by market value; years 2012–2014 tallow price per kg in Australia was 23% of the average price of mutton and lamb meat):
Biswas W.K., Graham J., Kelly K., John M.B., Global warming contributions from wheat, sheep meat and wool production in Victoria, Australia – a life cycle assessment, Journal of Cleaner Production, 18(14), 1386–1392, 2010.
Record lamb and mutton price conditions repeating in 2015, Sheep Central, April 10, 2015. Available at: http://www.sheepcentral.com/record-lamb-and-mutton-price-conditions-repeating-in-2015.
MLA co-product market report, MLA Meat & Livestock Australia, August 2014. Available at: http://www.mla.com.au/files/320040f2-ec8f-485b-b701-a3a20099e85e/MLA-Co-product-Market-Report-August.pdf
Williams A., Audsley E., Sandars D., Determining the environmental burdens and resource use in the production of agricultural and horticultural commodities: Defra project report IS0205, 2006.
BioVerno biodiesel
Klemola Kimmo, Environmental impact and energy depletion comparison: BioVerno tall oil diesel and petroleum diesel (preliminary study), Cleanfi Oy, 2014.
Ethanol
Shapouri H., Duffield J.A., Wang M.Q., The energy balance of corn ethanol: an update. No. 34075, United States Department of Agricuture, Economic Research Service, 2002.
Pimentel D., Patzek T.W., Ethanol production using corn, switchgrass, and wood biodiesel production using soybean and sunflower, Natural Resources Research, Vol. 14, No. 1, March 2005.
Graboski Michael S., Comparison of USDA and Pimentel net energy balances, National Corn Growers Association, www.ncga.com, August 22, 2001.
Lorenz D., Morris D., How much energy does it take to make a gallon of ethanol? Revised and updated, Institute for Local Self-Reliance, Washington, DC, August, 1995.
Kim S., Dale B.E., Environmental aspects of ethanol derived from no-tilled corn grain: nonrenewable energy consumption and greenhouse gas emissions, Biomass and Bioenergy, Vol. 28, 475–489, 2005.

52
Marland G., Turhollow A.F., CO2 emissions from the production and combustion of fuel ethanol from corn, Energy 16.11: 1307–1316, 1991.
Hammerschlag Roel, Ethanol's energy return on investment: a survey of the literature 1990-present, Environmental Science & Technology, Vol. 40, 1744–1750, 2006.
Kaliyan Nalladurai, Morey R. Vance, Tiffany Douglas G., Reducing life cycle greenhouse gas emissions of corn ethanol by integrating biomass to produce heat and power at ethanol plants, Biomass and Bioenergy, 35.3, 1103–1113, 2013.
García Carlos A., Fuentes Alfredo, Hennecke Anna, Riegelhaupt Enrique, Manzini Fabio, Masera Omar, Life-cycle greenhouse gas emissions and energy balances of sugarcane ethanol production in Mexico, Applied Energy, 88(6), 2088-2097, 2011.
Flexifuel vehicles’ fuel consumption
Model year 2007 fuel economy guide, U.S. Environmental Protection Agency, www.fueleconomy.gov, 2007.
HSC Chemistry software, Outotec.
Premanufacturing (mining, material production etc.), manufacturing, maintenance (insurance, service, infrastructure such as roads, parking lots etc.) and end-of-life (scrapping and recycling)
Sullivan J.L., Williams R.L., Yester S., Cobas-Flores E., Chubbs S.T., Hentges S.G., Pomper S.D., Life cycle inventory of a generic US family sedan overview of results USCAR AMP project, Society of Automotive Engineers, report 982160, 1998.
Gaines L., Sullivan J., Burnham A., Belharouak I., Life-cycle analysis for lithium-ion battery production and recycling, In Transportation Research Board 90th Annual Meeting, Washington, DC, pp. 23–27, 2011.
Hawkins T., Singh B., Majeau-Bettez G., Strømman A.H., Comparative environmental life cycle assessment of conventional and electric vehicles, Journal of Industrial Ecology, 17, no. 1: 53–64, 2013.
Maclean Heather L., Lester B. Lave, A life-cycle model of an automobile, Environmental Policy Analysis, Vol. 3, No. 4, 1998.
Klemola K., Karvonen M., Impacts of electrification of automotive transport in different OECD countries, International Journal of Transitions and Innovation Systems, Vol. 5, No. 2, 158–178, 2016.
Electric vehicle batteries
Ellingsen L. A.-W., Hung, C. R. & Strömman, A. H., 2016. Lifecycle impacts of lithium-ion batteries: a review. Quebec, Canada, s.n., p. 9.
Ellingsen L. A.-W.et al., 2014. Life cycle assessment of a lithium-ion battery vehicle pack. Journal of Industrial Ecology, pp. 113–124.

53
Kim H. C. et al., 2016. Cradle-to-Gate Emissions from a Commercial Electric Vehicle Li-Ion Battery: A Comparative Analysis. Environmental Science & Technology, pp. 7715–7722.
Romare Mia, Dahllöf Lisbeth, The life cycle energy consumption and greenhouse gas emissions from lithium-ion batteries, IVL Swedish Environmental Research Institute, 2017.
Kwade Arno, Diekman Jan (eds.), Recycling of Lithium-Ion Batteries, The LithoRec Way, Springer, 2018.
Particulate matter and nitric oxide emissions
Lipasto, Unit emissions, http://lipasto.vtt.fi/yksikkopaastot/tavaraliikennee/tieliikennee/tavara_tiee.htm.