Investor and Analyst Conference Call Q1 2022 - Volkswagen AG
32
Leading the Transformation. Investor and Analyst Conference Call Q1 2022 May 4, 2022
-
Upload
khangminh22 -
Category
Documents
-
view
2 -
download
0
Transcript of Investor and Analyst Conference Call Q1 2022 - Volkswagen AG

Leading the Transformation.
Investor and Analyst Conference Call Q1 2022
May 4, 2022

Investor & Analyst Conference Call Q1 2022
Arno Antlitz
Chief Financial OfficerVolkswagen AG
Rolf Woller
Head of Group Treasury and Investor Relations
Volkswagen AG
Herbert Diess
Chairman of theBoard of Management
Volkswagen AG
2

The following presentations as well as remarks/comments and explanations in this context contain forward-looking statements on the business
development of the Volkswagen Group. These statements are based on assumptions relating to the development of the economic, political and
legal environment in individual countries, economic regions and markets, and in particular for the automotive industry, which we have made on the
basis of the information available to us and which we consider to be realistic at the time of going to press. The estimates given entail a degree of
risk, and actual developments may differ from those forecast.
At the time of preparing these presentations, it is not yet possible to conclusively assess the specific effects of the latest developments in the Russia-
Ukraine conflict on the Volkswagen Group’s business, nor is it possible to predict with sufficient certainty to what extent further escalation of the
Russia-Ukraine conflict will impact on the global economy and growth in the industry in fiscal year 2022.
Any changes in significant parameters relating to our key sales markets, or any significant shifts in exchange rates, energy and other commodities or
commodities relevant to the Volkswagen Group or the supply with parts, or deviations in the actual effects of the Covid-19 pandemic from the
scenario presented will have a corresponding effect on the development of our business. In addition, there may be departures from our expected
business development if the assessments of the factors influencing sustainable value enhancement and of risks and opportunities presented
develop in a way other than we are currently expecting, or if additional risks and opportunities or other factors emerge that affect the development
of our business.
We do not update forward-looking statements retrospectively. Such statements are valid on the date of publication and can be superseded.
This information does not constitute an offer to exchange or sell or an offer to exchange or buy any securities.
Disclaimer
3

Solid figures reflect robust business model, despite lower vehicle salesJanuary to March 2019 vs. 2021 vs. 2022
[m vehicles]
Vehicle Sales
[€ bn]
Sales Revenue
Q12019
Q12021
Q12022
60.0 62.4 62.7
+5%
Q1 2019
Q1 2022
2,583
Q1 2021
2,334 1,995
-23%
1 before special items
[€ bn] Margin [%]
Operating Profit 1 and Margin
7.7% 13.5%
4,7 5,04,3
Q12019
3,5
Q12021
Q12022
4,8 4,8
8,5
Positive fair value measurements on hedging instruments outside hedge accountingincluded in other operating result
8.1%
4

Midterm strategy: Our setup will be even more global
Ambitious growth plan in the U.S.
• Raise of Group‘s overall market share to10% by 2030
• Investment of $ 7.1 billion to boost productline-up, R&D and manufacturing
• Launch of locally assembled ID.4 in 2022
• Regional sourcing and production with 95% ofall cars for the region being built in the region
Accelerated NEV-transition in China
• In Q1 29.000 BEVs delivered - one third of theGroup’s worldwide BEV deliveries
• Electric premium cars with Audi-FAW inChangchun from 2024
• New regional CARIAD subsidiary – doublestaff (600 today) in coming years
• Ralf Brandstätter pushing cross-brand andcross-platform approach as new China CEO
5

Short term measures: Adaptation to dynamic market environment
Reallocation logic
Resulting total production
China, North America, rest of the world (not affected by
Ukraine)
EU(strongly affected by
Ukraine)
Constructible vehicles
Surplus of semiconductors
(not buildable because of Ukraine)
Reallocation
ILLUSTRATIVE
6

Brands
Mechatronics
Software
Battery &Charging
Mobility Solutions
CompetitionVolkswagen
Volume Premium Sport
SSP
NEW AUTO strategy: From a classic OEM to a vertically integrated mobility company
7

Transformation: Five major proof points
MEBExpansion of e-mobility partnership with Ford
Battery & ChargingInvestment of 7 billion Euro in
Spain, including e-mobility hub and new charging price
model
Mobility ServicesID.Buzz drives autonomously
on public roads in MunichEuropcar deal closing in Q2
SustainabilityProduction emissions in line with 1.5-degree target and increased ambitions (50%
reduction compared to 2018)
CARIADStrategic growth through
acquisitions and successful launch of new Travel Assist
8

Further robustness demonstrated in Q1 2022 despite ongoing semiconductor shortage, wiring harness supply bottlenecks, resurgence of COVID-19 in certain regions and volatile raw material costs
• Sales revenues only slightly down (adj. for first time consolidation of Navistar) despite further decline in unit sales (-340K)
• Operating profit before positive fair value measurements outside hedge accounting above Q1 21
• Overhead costs fully in our sight while keeping investments in transformation high
Start of BEV plants Emden and Chattanooga in 2022 according to plan• BEV production in 3 core regions will drive scale and efficiency up
Science Based Targets initiative confirms increased 1.5 degrees climate targets in production
Key Highlights Q1 2022
New Auto
Volkswagen ID.5
Škoda Enyaq iV Coupé
Porsche Taycan GTS Sport Turismo Volkswagen ID. Buzz
Audi A6 Avant e-tron
Škoda Enyaq iV Coupé: Power consumption combined: 14.0 kWh/100km (NEDC), CO2 emissions combined: 0g/km, CO2 efficiency class: A+++Porsche Taycan GTS Sport Turismo: Power consumption combined: 26.0 kWh/100km (NEDC), CO2 emissions combined: 0g/km, CO2 efficiency class: A+++ID.5/ID.Buzz: Vehicles are near-production concept carsAudi A6 Avant e-tron: Concept car 9

Supply Chain Disruptions due to COVID-19 and geopolitical Tensions Countermeasures implemented War in the Ukraine
• War in the Ukraine led to supply disruptions and production stoppages at key wiring harness suppliers
• Supporting our partners was top priority before taking countermeasures
Duplicating production to other countries as backup to existing capacity
Increasing the production of purchased parts at other suppliers
Securing logistics chains
Semiconductor bottlenecks
• Q1 2022 continued to be affected by shortfalls in supply due to the structural shortage of semiconductors
• We anticipate that the supply of chips will improve in H2 2022, compared with H1 2022 by
Increased transparency in the value chain
Structural changes in contractual agreements
Increasing supply channel effectiveness
COVID in China
• Resurgence of COVID-19 pandemic and zero COVID policy started to impact operations in March 2022
• Currently we are securing critical logistic routes and organize stock piling of critical parts to ensure rapid production ramp up
• Production catch-up program initiated
10

Solid Figures Despite lower Sales are Testimony to our robust Business Model January to March 2019 vs. 2021 vs. 2022
[m vehicles]
Vehicles Sales
[€ bn]
Sales Revenue
Q12019
Q12021
Q12022
60.0 62.4 62.7
+5%
2.583 2.334 1.995
Q1 2022
Q1 2019
Q1 2021
-23%
1 before special items
[€ bn] Margin [%]
Operating Profit 1 and Margin
7.7% 13.5%
Q12019
4.7
3.5
8.5
4.3
Q12021
Q12022
5.0
4.8 4.8
Positive fair value measurements on hedging instruments outside hedge accountingincluded in other operating result
8.1%
11

[€ bn]
Reported Net Cash Flow 1
[€ bn]
'Clean' Net Cash Flow 1, 2
Automotive Clean Net Cash in Q1 impacted by negative Changes in Working Capital; Automotive Net Liquidity up January to March 2019 vs. 2021 vs. 2022
Q12022
Q12021
Q12019
4.72.0 1.5
Q12019
Q12022
Q12021
5.5
2.5 2.2
1 Automotive Division2 Reported net cash flow before M&A and Diesel payments
[€ bn]
Net Liquidity 1
29.7
Q12019
Q12021
Q12022
16.0
31.1
12

OperatingBusiness
31.12.21
-0.2
Hybrid Capital
1.1
DieselOutflow
-0.5
M&A
1.7
Other 31.3.22
26.7 2.2
31.1
Automotive Division – Net Liquidity 1 up significantly January to March 2022[€ bn]
1 All figures shown are rounded, minor discrepancies may arise from addition of these amounts2 Placement hybrid bond €2.3 bn; repayment hybrid bond €-1.1 bn
Reported Net Cash flow € 1.5bn
Clean Net Cash flow
€ 2.2bn
2
13

EBIT [€ bn]incl. Margin [%]
Solid Margins in all DivisionsJanuary to March 2019 vs. 2021 vs. 2022
EBIT [€ bn]incl. Margin [%]
Automotive Division
EBIT [€ bn]incl. Margin [%]
Financial Services Division
Passenger Cars 1, 2 Commercial Vehicles3) Financial Services
Q12019
Q12021
1.00.7
Q12022
1.5
1 before special items2 Passenger Cars = Automotive Division ./. Commercial Vehicles, Power Engineering3 TRATON excluding Financial Services
8.7% 8.5% 15.5% 6.7% 1.5% 4.0% 7.6% 9.3% 13.3%
Q12019
3.8
Q12021
Q12022
3.8
6.5
Q12019
Q12021
Q12022
0.40.1 0.3
14

Operating Result Passenger Cars (before special items) – EBIT BridgeJanuary to March 2021 vs. 2022
Operating result [€ bn] incl. Margin [%]
1
4
6
5
0
2
7
3
2.4
Jan - March2021before
special items
0.6
Volume / Mix / Prices
Exchange Rates /
Derivatives
-0.6
ProductCosts
0.3
FixedCosts /
Other Costs
Jan - March2022before
special items
3.8
6.5
Jan - March2021
before special items
Jan - March2022
before special items
3.8
6.5
8.4% 15.5% [€ bn]
Volume -2.3Mix / Price +2.8
15

Passenger Cars – Brand Group PerformanceJanuary to March 2021 vs. 2022EBIT 1 [€ m] incl. Margin [%]
V O L U M E
B R A N D G R O U P
S P O R T & L U X U R Y
B R A N D G R O U P
P R E M I U M
B R A N D G R O U P 2
680Q1
2022Q1
2021
197
1,366877
Q12022
1,247
Q12021
2,2881,469
3,535
Q12021
Q12022
1,178 1,359
5.0% 3.6% 10.0% 24.8% 16.7% 18.6%
Hedge Accounting for commodity hedges planned for 2024 onwards
Hedge Accounting for commodity hedges planned for 2024 onwards
Vehicles [‘000]
Deliveries
Sales
Production
1,831 1,371 -25.1%
1,197 918 -23.2%
1,715 1,461 -14.8%
469 391 -16.6%
290 244 -15.7%
454 422 -7.2%
72 68 -5.0%
73 66 -10.0%
84 92 +9.7%
1 before special items 2 The previous year’s figures were calculated by means of a simple addition with the Bentley figuresNote: Commodity hedging effects outside hedge accounting: 1,538m € relate to the VW Group holding; shown in ‘other line’ in table ‘key figures’ by brands and business fields
Commodityhedging effectsoutside hedge accounting
Commodityhedging effectsoutside hedge Accounting
16

Passenger Cars – Volume Brand Group PerformanceJanuary to March 2021 vs. 2022EBIT 1 [€ m] incl. Margin [%] , Vehicle Sales [‘000]
490 513
Q12021
Q12022
448 337
Q12021
Q12022
-36
5
Q12021
Q12022
29 46
Q12021
Q12022
2.8% 3.4%
1 before special items
363
-33Q1
2021Q1
2022
877
Q12021
Q12022
1,366
3.6%5.0%
-1.3% 0.2%
1.1% 2.0%
7.6% -0.9%
6.6%8.9%
769537
Q12021
Q12022
234 231
Q12022
Q12021
157 107
Q12021
Q12022
96 73
Q12021
Q12022
918
Q12021
Q12022
1,197
t h e r e o f
V O L U M E
B R A N D G R O U P
V E H I C L E S A L E S E B I T 1
V E H I C L E S A L E S E B I T 1 B R A N D
17

Financial Services DivisionJanuary to March 2021 to 2022
Financial Services
Sales Revenue [€ bn]
Q12021
Q12022
10.83711.532
1.5
Q12021
Q12022
1.0
EBIT [€ bn] ; Margin [%]
9.3% 13.3%
18

661 824
3,602
3,026
276
2020 2021 2022E
China Joint Ventures – Proportionate Operating Profit
[€ m]
Drivers
• Continued impacts from semi supply bottlenecks and COVID related production disruptions towards the end of the 1st quarter
• Continued strong premium performance, performance of SAIC Volkswagen improved YoY
• SAIC Audi started production, thereby strengthening the local footprint
• Production catch-up program initiated
FYQ1
19

Volkswagen Group – Outlook for 2022 1 confirmed
Up to 15% higher than prior-year figure
1 it is not yet possible to conclusively assess the specific effects of the latest developments in the Russia-Ukraine conflict on the Volkswagen Group’s business, nor is it possible to predict with sufficient certainty to what extent further escalation of the Russia-Ukraine conflict will impact on the global economy and growth in the industry in fiscal year 2022
2 before special items3 including any cash outflows in connection with the EU antitrust proceedings against Scania
2020
9.3 8.9
222.9 250.2 8% to 13% higher than the prior-year figure
4.8 8.0In the range of 7.0% to 8.5%
2 2
Deliveries to customersm vehicles
Sales revenue € billion
Operating return on sales %
AutomotiveNet Liquidity€ billion
2021 2022 1
5% to 10% up on the previous year
Actual Outlook
26.726.8
6.4 8.6 Same level as in the previous year 3
15.510.0AutomotiveClean Net Cash flow € billionAutomotiveReported Net Cash flow € billion
In the range of 13 – 15 bn €
20

Proof Points of our Strategy – CFO Perspective
Strategic CFO Targets CFO Focus Areas
Acting based on integrity and values
Managing margins and Cash Flows
Focus on product transformation towards electric
Digitalization: Advancing in software/services
Capturing group-wide synergies
Group-wide cost & efficiency programs
Focused financial steering of the transformation
(allocation of resources to future topics)
Safeguarding andstrengthening
our financial foundation (… for continued investments in
future technologies such as electrification, digital technology
and autonomous driving)
21

BEV ramp up – Striving for Scale Effects2021, Q1 2022 and Outlook
Q3 21
60
Q1 21
8.3%
Q4 21Q2 21 Q1 22
2.5%
4.4%
6.2%
5.2%
BEV Share [%]; BEV Deliveries [‘000 units]
2021 2022E
5.1%
2021 2022E
7-8%
Volkswagen ID.5: Vehicle is a near-production concept carAudi Q4 e-tron: Power consumption combined: 18.3–15.2 kWh/100 km (NEDC), CO2 emissions combined: 0g/km, CO2 efficiency class: A+++Porsche Taycan GTS Sport Turismo: Power consumption combined: 26.0 kWh/100km (NEDC), CO2 emissions combined: 0g/km, CO2 efficiency class: A+++
111 122 160 99 453
22
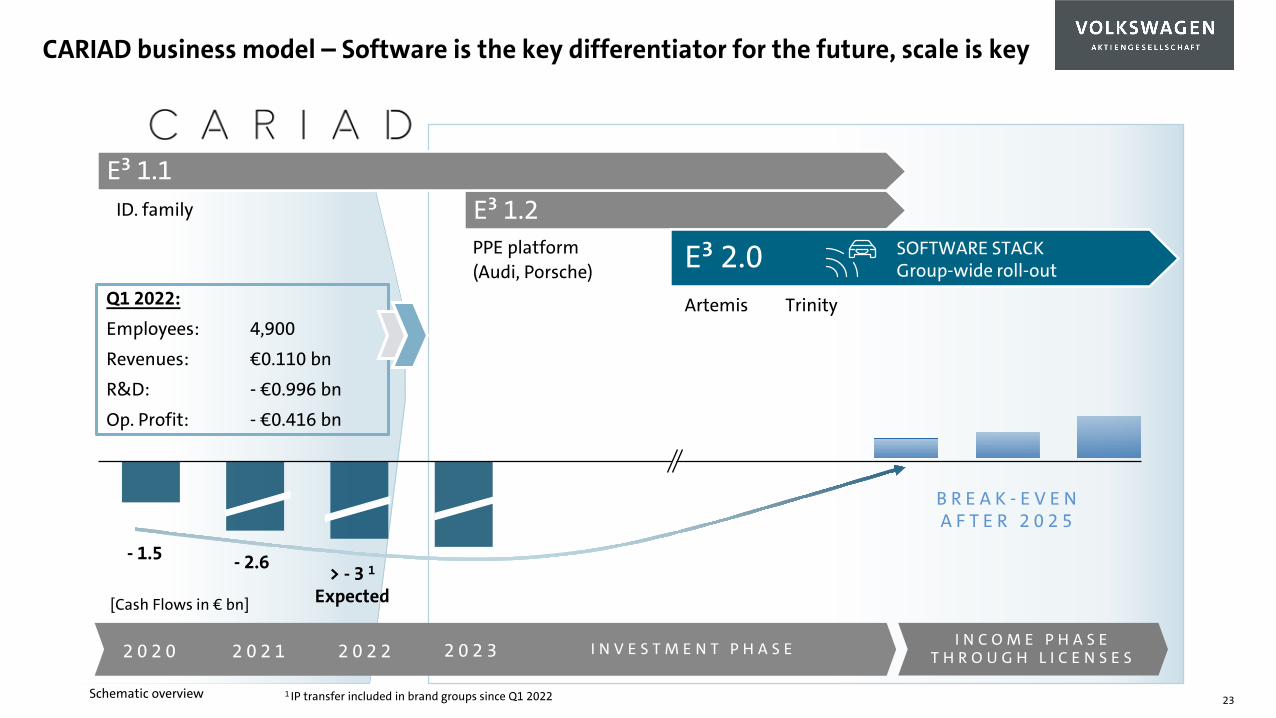
CARIAD business model – Software is the key differentiator for the future, scale is key
E³ 1.1
SOFTWARE STACK Group-wide roll-out
ID. family E³ 1.2PPE platform(Audi, Porsche) E³ 2.0
TrinityArtemis
E³ 1.1
I N C O M E P H A S ET H R O U G H L I C E N S E S
B R E A K - E V E NA F T E R 2 0 2 5
- 1.5 - 2.6
[Cash Flows in € bn]
Schematic overview
> - 3 1Expected
Q1 2022:
Employees: 4,900 Revenues: €0.110 bnR&D: - €0.996 bnOp. Profit: - €0.416 bn
I N V E S T M E N T P H A S E2 0 2 0 2 0 2 1 2 0 2 2 2 0 2 3
1 IP transfer included in brand groups since Q1 2022 23

37.5
41.4
Target2023
2019
9.3
2021
9.5
2022E
Financing the Transformation: Overhead Cost Program ahead of Schedule; so far allowing for compensation of Fix Cost Increase1
1 All figures shown are rounded, minor discrepancies may arise from addition of these amounts2 Thereof Passenger Cars €+ 0.1 bn y–o-y; Automotive Division €-0.2 bn y-o-y (Navistar not yet consolidated in Q1/21)
Level Freeze
~ -10%
Group-wide Overhead Cost Program (w/o R&D, CAPEX), Deliveries to customers[in m units]
[€ bn]
Overhead cost(w/o R&D, Capex)
Plant program(Productivity & Overhead)
Working capital management / cashflow orientation
Purchasing program
Pricing & other sales costs optimization
8.911 +5-10%
Q1
2
24

Increase in R&D especially for Software compensated by CAPEX Discipline
0
2
4
6
8
10
12
14
~5.1%(€ 10.5 bn)
∑ 12.5%
2022e
~6.6%(€ 14.0 bn)
~6.7%(€ 14.3 bn)
~3.3%(€1.7 bn)
2019
~7.6%(€ 15.6 bn)
2021
~8.5%(€4.4 bn)
Q1 2022
~5.5%
~7.0%
∑ 13.3%(€ 28.3 bn)
∑ 12.7%(€ 26.1 bn) ∑ 11.8%
(€ 6.1 bn)
[%, €] CAPEX R&D
R&D / Capex – Absolute and Ratio (Automotive Division)
Reducing complexity / variances
Focus on synergies
Investment in software
Multi brand production in MQB plants
25

Overall Ambition: Leading the Transformation with Integrity and Based on our Values
BEV
Software
AI / mobility services
Strong brands
Financial strength
Integrity
26

Backup
27

Volkswagen Group – Analysis by Brand and Business FieldJanuary to March 2022
VEHICLE SALES SALES REVENUE OPERATING RESULT OPERATING MARGINTsd. Fahrzeuge/Mio. € 2022 2021 2022 2021 2022 2021 2022 2021
Volume brand group 918 1,197 24,361 27,354 877 1,366 3.6 5.0Volkswagen Passenger Cars 537 769 14,879 17,571 513 490 3.4 2.8ŠKODA 231 234 5,101 5,049 337 448 6.6 8.9SEAT 107 157 2,404 2,851 5 -36 0.2 -1.3Volkswagen Commercial Vehicles 73 96 2,294 2,660 46 29 2.0 1.1Tech. Components – – 3,614 4,762 -33 363 -0.9 7.6Consolidation -29 -59 -3,931 -5,540 9 73 – –
Audi (Premium brand group) 1 244 290 14,282 14,644 3,535 1,469 24.8 10.0Porsche Automotive (Sport & Luxury brand group) 2 66 73 7,317 7,039 1,359 1,178 18.6 16.7TRATON Commercial Vehicles3 68 61 8,353 6,438 331 104 4.0 1.6At equity accounted companies in China4 765 800 – – – – – –MAN Energy Solutions – – 761 757 55 32CARIAD – – 110 75 -416 -194 – –Volkswagen Financial Services – – 10,908 10,295 1,495 908 13.7 8.8Other5 – 67 – 86 -3,350 -4,225 1,217 -50 – –Volkswagen Group before special items – – – – 8,453 4,812 13.5 7.7Special Items – – – – -130 –Volkswagen Group 1,995 2,334 62,742 62,376 8,323 4,812 13.3 7.7Automotive Division6 1,995 2,334 51,210 51,538 6,786 3,809 13.3 7.4Of which: Passenger Cars Business Area 1,927 2,273 42,096 44,344 6,402 3,751 15.2 8.5
Commercial Vehicles Business Area 68 61 8,353 6,438 330 93 4.0 1.4Power Engineering Business Area – – 761 757 54 -36 7.1 -4.8
Financial Services Division – – 11,532 10,837 1,537 1,003 13.3 9.31 The previous year’s figures were calculated by means of a simple addition with the Bentley figures.2 Porsche (including Financial Services): sales revenue €8,043 (7,726) million, operating result € 1,467 (1,249) million.3 Includes Navistar from July 1, 2021.4 The sales revenue and operating result of the equity-accounted companies in China are not included in the consolidated figures; the share of the operating result generated by these companies amounted to €824 (661) million.5 In the operating result, mainly intragroup items recognized in profit or loss, in particular from the elimination of intercompany profits; the figure includes depreciation and amortization of identifiable assets as part of purchase price allocation, as well as companies not allocated to the brands.6 Including allocation of consolidation adjustments between the Automotive and Financial Services divisions.
28

Net Liquidity and Cash Flow Automotive DivisionSolid Clean Net Cash Flow and DCM Activity drive Net Liquidity Position
Clean Net Cash flow (€ 2.2bn)Reported Net Cash flow (€ 1.5bn)
Cash outflow from change in WC mainly related to supply chain disruptions: €1.6
Net
Liq
uidi
ty31
.03.
2022
activ
ated
Dev
elop
men
t cos
t
-0.5
Gro
ss C
ash
Flow
0.3
-2.1
othe
r
othe
r
31.1
M&
A
-2.2
Cape
x
Hyb
rid C
apita
l
-0.3
Chan
gein
pay
able
s
Chan
ge
in re
ceiv
able
s
Net
Liq
udity
31.1
2.20
21
-1.7
26.7
1.7
-0.2
-1.7
Oth
er ch
ange
s w
ithin
wor
king
capi
tal
Chan
gein
inve
ntor
ies
7.4
2.5
1.1
Die
sel
[€ bn]
29

Gross Cash Flow
-1.6
Clean Net cash flow
Change in Working Capital
5.8
Cash flow from
operating activities
-1.7
-2.2
CAPEX Capitalized development
costs
0.3
Other
2.2
-0.5
Diesel outflow
-0.2
Acquisition and disposal
of equity investments
Reported Net Cash flow
7.4
1.5
Automotive Division – Net Cash Flow Development 1January to March 2022
1 All figures shown are rounded, minor discrepancies may arise from addition of these amounts. Including allocation of consolidation adjustments between Automotive and Financial Services divisions
[€ bn]
7.2 +1.7 8.9 -1.9 -1.9 0.4 5.5 -0.4 -0.4 4.72021
Negative working capital impacts due to supply chain disruptions
30

Reported net cash flow Aquisition and disposalof equity investments
0.2
Diesel outflow
0.5
Clean net cash flow
2.2
1.5
Automotive Division – Net Cash Flow 1January to March 2022
1 Including allocation of consolidation adjustments between Automotive and Financial Services divisions.
[€ bn]
31

Elements already included in GUIDANCE for 2022 for the operating profit
• Favorable Price and Mix continue to support operating results
• Headwinds from raw material costs incl. product costs increase
• The semiconductor supply bottlenecks will improve in the second half of the year
• Substantial contribution to operating profits from TRATON
• A normalization of the result of the Financial Services Division from €6bn to €4.5bn
What is not covered by our GUIDANCE
• A resurgence of the COVID-19-Pandemic situation
• The guidance presented is also subject to the further development of the crisis in Ukraine and in particular the impact on our supplychains and the global economy as a whole. At the time of preparing this outlook, there is a risk that the latest developments in theRussia-Ukraine conflict will have a negative impact on the Volkswagen Group’s business.
• This may also result from bottlenecks in the supply chain. At the present time, it is not yet possible to conclusively assess thespecific effects. Nor is it possible at this stage to predict with sufficient certainty to what extent further escalation of the Russia-Ukraine conflict will impact on the global economy and growth in the industry in fiscal year 2022.
• The further development of the commodity markets also remains unpredictable, which in turn may have significant effects on themeasurement of hedging instruments.
What is in our Guidance?
32