Q1 2022 Transcript FINAL
25
Q1 2022 Transcript This Transcript contains forward-looking statements and non-GAAP financial measures, please see Appendix for additional information. April 21, 2022
-
Upload
khangminh22 -
Category
Documents
-
view
0 -
download
0
Transcript of Q1 2022 Transcript FINAL

Q1 2022 Transcript
This Transcript contains forward-looking statements and non-GAAP financial measures,
please see Appendix for additional information.
April 21, 2022

SNAP INC. | Q1 2022 | TRANSCRIPT 2
Thank you all so much for joining us. The first quarter of 2022
proved more challenging than we had expected, and our team was
able to make significant progress against our goals despite
increased volatility in the operating environment. Our community
grew 18% year-over-year to 332 million daily active users, and
revenue grew 38% year-over-year to $1.06 billion. This resulted in
adjusted EBITDA of $64 million, and free cash flow of $106 million,
marking our third quarter of positive free cash flow. While we are
pleased with our progress given the macroeconomic environment,
we also recognize that we have a significant amount of work to do
to realize our long-term opportunity, and we believe we are well
positioned to invest through the turbulence.
A great deal of our focus has been supporting our team members
located in Ukraine and helping our Ukrainian colleagues. The war in
Ukraine is heartbreaking for all of us, especially because Ukraine is
the birthplace of Looksery, the company that laid the foundation for
Snap’s augmented reality platform. As we look forward to our Snap
Partner Summit on April 28, where we will celebrate our partners
and launch new products, our thoughts and prayers are with our
Ukrainian team members and their families — not only because of
these horrible circumstances, but because they have made so many
of our innovations possible.
We have remained focused on expanding our product offering and
deepening engagement with our global community, which grew by
13 million daily active users in the quarter. The future of our
business depends on the engagement of our community, and we
are pleased to see elevated growth rates in the Rest of World
region, where we added 10 million daily active users in the quarter.
This Rest of World growth follows our investments in building out
the team and operations necessary to accelerate our growth in
geographies where our community has demonstrated a clear
product-market fit with Snapchat, as well as our efforts to localize
Evan SpiegelCO-FOUNDER AND CEO
Daily Active Users
Our community grew
18% Year over Year to
332 Million
Revenue
Revenue grew
38% Year over Year to
$1,063 Million

SNAP INC. | Q1 2022 | TRANSCRIPT 3
our product offering and improve application performance across a
wide range of devices. Our community in North America and
Europe continued to grow, and these geographies represent our
largest monetization opportunities in the near and medium term.
We believe that reinventing the camera represents our greatest
opportunity to improve the way people live and communicate. What
began as an application for visual communication has evolved into
a leading augmented reality platform where creators are building
unique and innovative AR experiences in Lens Studio and
distributing them on Snapchat and in their own applications using
Camera Kit. Over 250 million Snapchatters engage with augmented
reality every day, on average, across a variety of use cases including
entertainment, fashion, and education. Over 250,000 creators have
built more than 2.5 million Lenses, and Snapchatters played with
Lenses created by our community more than twice as much this
quarter when compared to Q1 2021.
We recently launched our “ASL Alphabet” Lens — a first-of-its-kind
AR experience that inspires Snapchatters to learn American Sign
Language through the Snapchat camera. The “ASL Alphabet” Lens
uses advanced hand-tracking to recognize hand poses and
gestures, providing feedback as people practice communicating
with sign language.
We also launched Custom Landmarkers in Lens Studio, helping
creators to build location-based Lenses for local places they care
about — from statues to storefronts — to tell richer stories about
their communities through AR. In partnership with Tukwini Mandela
and Black Cultural Archives, we released our “Hidden Black Stories”
Local Lens, transforming London’s Trafalgar Square into an AR
experience that showcases key moments, figures, and stories from
Black British history.
ASL Alphabet Lens
250 Million + Snapchatters engage with augmented reality every day, on average.
SNAP INC. | Q1 2022 | TRANSCRIPT 4
In an effort to educate our community on the power of AR, we
announced a new augmented reality creator program in India
powered by Lens Studio. The program will include an online
developer course and a series of challenges that aim to empower
developers and local creators across the country. In celebration of
International Women’s Day, we launched an AR Lensathon
consisting of three workshops across Southeast Asia to encourage
the participation of young women in new digital fields like
augmented reality.
We believe that augmented reality belongs everywhere, not just on
Snapchat. We built Camera Kit to enable our partners to leverage
our augmented reality platform in their own websites and
applications. Through Camera Kit, we can help grow the ecosystem
of AR developers and help businesses understand the immense
potential of AR. We are excited by the growing demand from
businesses who want to bring Snap’s AR capabilities into their own
apps and websites. For example, Zoog, a storytelling app for
families, integrated Camera Kit to help people bond by sharing
stories while using Lenses to resemble storybook characters.
We continue to make meaningful progress overlaying computing on
the world through Spectacles, our augmented reality glasses.
Hundreds of creators are developing AR Lenses for Spectacles,
building new immersive and interactive experiences, like
reimagining a restaurant menu in three dimensions or enhancing a
workout routine. We have continued to make software
improvements and offer new capabilities for developers, including a
new VoiceML template in Lens Studio, which enables creators to
build voice-enabled experiences without scripting, and Lens Studio
Streaming Mode, which helps creators develop Lenses with hand
tracking from a first person perspective.
Zoog
Zoog integrated Camera Kit to help people bond by sharing stories while using Lenses.

SNAP INC. | Q1 2022 | TRANSCRIPT 5
With our powerful developer tools in Lens Studio, and distribution
through Snapchat, Camera Kit, and Spectacles, we’ve created a
compelling platform for creators to build and share augmented
reality experiences, reaching hundreds of millions of people and
exploring the next generation of computing.
We continue to provide value for our growing community through
our diverse content offerings, which include our two content
platforms, Stories and Spotlight. Our Stories platform enables
Snapchatters to share Snaps with their friends in narrative form via
Friends Stories, and watch content from professional publishers and
influencers in Discover. Spotlight is our newest content platform for
showcasing the most entertaining Snaps created by our
community. In Q1, overall time spent watching content globally
grew on a year-over-year basis, driven primarily by growth in time
spent with content in Discover and Spotlight.
We continue to see growth in viewership of content on Discover,
which has become a destination for credible and entertaining
content for our community. For example, total daily time spent by
Snapchatters 25 and older engaging with shows and publisher
content on Discover increased by more than 25% year-over-year. We
expanded our international content offerings by partnering with
News UK, TF1 and Le Monde in France, and MBC and Al Arabiya in
the Middle East. Snap Originals represent another important
element of our strategy to improve the diversity of available content
on Discover. Over 10 million viewers have watched Breakwater, our
new Snap Original about a dystopian future caused by climate
change that featured episodic AR Lenses in partnership with
Verizon, helping Snapchatters to immerse themselves in the show.
Our content partners continue to find success on our platform, with
six Discover partners reaching over 100 million global viewers in Q1.
We are also investing in new tools and capabilities to better serve
25%+year over year increase in total daily time spent by Snapchatters 25 & older engaging with shows and publisher content on Discover.
Over 10 million viewers have watched Breakwater, our new Snap Original about a dystopian future caused by climate change.

SNAP INC. | Q1 2022 | TRANSCRIPT 6
our content partners and to help them reach new audiences on
Snapchat. We recently announced Dynamic Stories, a new Discover
format that allows publishers to automatically create Stories based
on news they publish online to help Snapchatters learn about the
world as it happens. Early partners include GQ, Vogue, CNN, ESPN,
and The Wall Street Journal.
We are very excited about the long-term potential of Spotlight.
While still early in its growth and evolution, we’re pleased with the
engagement we’re seeing, with total time spent growing 230% year-
over-year. Over the last several months, we have focused on
building the tools and infrastructure to help creators of all kinds
thrive on Spotlight, and we observed a 3.5x increase in the number
of Spotlight submissions using our AR Lenses or Creative Tools
compared with Q1 2021.
Spotlight offers opportunities for creators to improve discoverability
and get more reach with their Snaps. We continue to focus on the
relationship between Stories and Spotlight, where creators can use
Spotlight to start building an audience and deepen their
relationship with that audience through their Stories. Today, there
are many different ways for creators to grow an audience and build
a business on Snapchat. Creators can open shops to sell
merchandise, join our Creator Marketplace, receive virtual gifts
from fans, and monetize their content via our recently announced
mid-roll ads in Stories.
We continue to innovate on our Map to bring utility and value to our
community and partners. As Snapchatters are able to move about
the world again, we are seeing upticks in engagement on the Map.
While still very early, we are encouraged to see that Snapchatters
opened Places from the Map more than twice as often this quarter
when compared to Q1 2021. We also added a new way to help
3.5x increase in the number of Spotlight submissions using our AR Lenses or Creative Tools compared with Q1 2021.

SNAP INC. | Q1 2022 | TRANSCRIPT 7
Snapchatters discover live events with the launch of our
Ticketmaster Layer. Snapchatters can now browse Ticketmaster’s
upcoming events on the Map based on what is happening nearby.
We see incredible potential for innovation across our
communications platform, which brings enormous value to our
community by connecting people with their close friends and
family. In addition to adding several new chat features including
Chat Replies, Bitmoji Reactions, and Poll Stickers, it’s also where our
community can launch Games and Minis, two platforms built to
reimagine shared experiences with friends. We were pleased to see
returning gaming partners — Funday Factory and Voodoo — launch
new game titles in Q1. Our gaming partners are finding success
growing their businesses, with more than one-third of our current
gaming partners having made over $1 million in revenue.
Minis represent a new platform for social experiences. We’ve seen
recent momentum with Givingli’s second Mini, Send Gifts, where
Snapchatters can send gift cards to friends. Discover partner Wave
Sports + Entertainment launched the Gym Heroes Mini, a social
fitness experience on Snapchat that offers original daily fitness
challenges and full workouts curated by fitness experts. The Mini is
designed for Snapchatters to challenge their friends and
collaborate in groups toward their workout goals.
We’re so excited about the growth of our community and the
evolution of our service, and we can’t wait to share more at our
Snap Partner Summit next week on April 28. We will meet the
challenges of the current operating environment by prioritizing the
needs of our community and partners who are essential to our
success, and we will continue to invest against our enormous
opportunity in augmented reality as we work to accelerate our road
map and deliver against our long-term plans for computing overlaid
on the world.
Snapchatters can now browse Ticketmaster’s upcoming events on the Map based on what is happening nearby.
Ticketmaster

SNAP INC. | Q1 2022 | TRANSCRIPT 8
We continue to make progress against the many opportunities we
have to support our community and advertising partners globally. In
Q1, we generated total revenue of $1.06 billion, an increase of 38%
year-over-year. We continued to work through platform policy
changes, which are primarily impacting direct-response advertising
partners, and we believe that we are building effective
measurement solutions for advertisers to prove the efficacy of their
campaigns.
In addition to these ongoing platform-related headwinds, supply
chain shortages and labor disruptions, rising inflation, and
geopolitical unrest are presenting challenges for a wider array of
industry verticals than in the prior quarter. Nonetheless, we saw
strong growth in verticals like Financial Services and Streaming,
which each grew well over 50% year-over-year. We believe that the
impact from the ongoing platform policy changes was compounded
by macroeconomic challenges, which are now the primary
headwinds to client demand. We remain focused on supporting our
community and advertising partners. We will do so by continuing to
focus on our three key priorities: First, driving measurable ROI.
Second, deepening our vertical expertise and growing our sales
capacity. Third, creating innovative ad formats focused on video
and augmented reality. Our commitment to these priorities, along
with our unique reach and global, growing audience, allows us to
drive performance at scale for businesses around the world.
Our team continues to help advertisers navigate the platform policy
changes through the enablement and utilization of privacy-
preserving measurement solutions. We’ve made a significant push
to improve our first-party solutions as we seek to help advertisers
adapt to the platform policy changes. The first step was to drive
broad availability of these solutions, which we have largely
achieved. Now we are working toward achieving broad utilization of
— and full confidence in — these measurement solutions. While it
CHIEF BUSINESS OFFICER
Jeremi Gorman
Revenue
We generated total revenue of
$1.06 Billion, an increase of
38% Year over Year

SNAP INC. | Q1 2022 | TRANSCRIPT 9
can take time for advertisers to tune their campaigns using our new
measurement solutions, some advertisers who have invested early
in our first-party solutions are seeing signs of success. Beauty brand
Nice One implemented our Conversions API, or CAPI, on both Web
and App to deepen its partnership with Snap and leverage the full
integration across its platforms. After integrating CAPI for Web and
App, the multi-product integration resulted in a 6x increase in ROAS
above its non-integrated results.
We also continue to innovate by improving our first-party
measurement solutions with features like Estimated Conversions,
which helps provide more granular and timely results in a privacy-
safe manner, and improvements to CAPI, which strengthen Snap’s
direct advertiser data integrations, allowing advertisers to measure
conversions from multiple sources. Launched in 2018, CAPI also
provides advertisers with more sophisticated incremental
measurement solutions such as Conversion Lift. For example, sports
betting company DraftKings ran a conversion lift study in the two
weeks leading up to the Super Bowl across several established
Sportsbook states and observed a 10.8% lift in App Installs and 188%
lift in first time deposits for Males 21+, outpacing their install and
deposit goals.
As we continue working to drive measurable ROI for advertisers of
all sizes, improving the efficiency of our offering and lowering the
effort it takes to utilize our platform is a major focus. By lowering the
cost and decreasing the time to create personalized ads, we can
improve ROI by reducing the investment it takes to achieve a given
return. One notable example is our progress with Dynamic Ads. By
dynamically building ads from product catalogs, we’re able to
greatly expand the set of ads that are created. Dynamic Ads can
update automatically as new products are entered into the catalog,
remaining up to date and driving ROI. As a result, revenue from
Dynamic Ads more than tripled year-over-year.
DraftKings
10.8%Lift in App Installs for Males 21+
188%Lift in First Time Deposits for Males 21+

SNAP INC. | Q1 2022 | TRANSCRIPT 10
In addition to Dynamic Ads, we’re also increasing the automation of
our ad suite through Multi-Format Ad Delivery, which allows our
systems to optimize across formats to achieve the best ROI for our
advertisers and the most relevant ads for our community. These
features reduce set-up time, increase delivery efficiency, and
expand advertisers’ addressable audience. We are seeing strong
adoption of our automated offerings and will prioritize these efforts
in the year ahead.
We continue to add deep domain expertise with our verticalized
sales strategy, allowing us to effectively serve advertisers of all types
and sizes. Our work with agency and advertising partners over the
past year has resulted in upfront commitments for 2022 that are
more than 60% higher than the total upfront commitments made in
2021. We view upfront commitments as a signal of strong
confidence from agency and advertising partners as we become a
part of their always-on, performance-oriented advertising strategies.
While the majority of our revenue today is generated from video
ads, we believe we are still early in terms of realizing the full
monetization potential of our content platform. Today, we comprise
less than 2% of the $210 billion US digital ad market and less than 1%
of the $520 billion global digital ad market, while reaching nearly
half of US smartphone users and more than 75% of 13 to 34 year-
olds in over 20 countries. In addition, mobile advertising is growing
faster than desktop advertising, video advertising is growing faster
than non-video advertising, and self-serve advertising is expected to
make up 90% of all digital display ad spend in 2022. These trends
are favorable for our strategy, and we believe our video advertising
business has the potential to deliver robust top line growth.
Our unique and innovative AR Lenses give our team a huge
opportunity to attract advertisers across multiple verticals. In the
past, larger brands used augmented reality for brand moments to
Snapchat comprises
less than 2% of the US digital ad market and
less than 1% of the global digital ad market, yet
reaches nearly half of US smartphone users and
more than 75% of 13 to 34 year-olds in
over 20 countries

SNAP INC. | Q1 2022 | TRANSCRIPT 11
drive awareness and reach through expensive one-day takeover
Lenses. Today, both brand and performance-oriented advertisers
are utilizing augmented reality to drive significant and measurable
business results.
We are also adding more tools to help our advertising partners find
customers and build their businesses on Snapchat. We launched
our first Snap AR certification on Snap Focus called Augmented
Reality Strategies for Advertisers. This five-part learning pathway
offers hands-on education and real-life examples to help advertisers
gain a deeper understanding of how AR is an essential tool for
business and marketing objectives.
We continue to invest in Arcadia, our global creative studio for
branded augmented reality experiences. The team has been hard at
work creating, managing, and launching several experiences —
most recently a Verizon 5G connected Snapchat Lens for the Big
Game in our hometown of LA — letting Snapchatters team up and
battle with other groups to take control of a giant virtual airship
hovering above the field. Arcadia also created a 5G AR Lens in
partnership with Verizon and Cirque du Soleil that transports the
renowned "O" performance in Las Vegas to the palm of a
Snapchatter's hand.
We have seen a notable acceleration in the number of advertisers
leveraging our self-service tools for AR, with over 70% of AR revenue
now delivered via our self-serve ad platform. We recently brought
our GBB Pixel Purchase Optimization to AR, and we are also
investing in additional features for Ads Manager to make it easier for
advertisers to create, manage, and deploy their AR experiences.
Following the launch of First Commercial in October 2020, we
recently launched First Lens, which enables advertisers to reserve
the first Sponsored Lens impression a Snapchatter sees in the Lens
Carousel. First Lens offers more operational ease because bookings
We recently launched a 5G Lens with Verizon and Cirque du Soleil that brings the "O" performance directly to Snapchatters.

SNAP INC. | Q1 2022 | TRANSCRIPT 12
are made through Ads Manager, and it simultaneously improves the
Snapchatter experience by surfacing the first Lens based on
relevance.
A top priority for AR is reducing the barrier to creation and helping
brands understand the importance of AR experiences and the value
they can drive. While we are still in the early stages of AR advertiser
adoption, we are already making solid progress and investing to
build the AR ecosystem. For example, Nike recently launched its
“Nike By You” sneaker customization Lens in order to drive
increased engagement with its Nike app and generate membership
sign-ups. The multi-cell campaign resulted in an increase in sign-
ups, especially among 13 to 17 year-olds, a key demographic for
Nike’s program. After the success of the AR campaign in the US,
Nike has scaled its Lens campaign to additional regions
internationally. These results are emblematic of a larger shift we are
seeing, with AR transforming ecommerce by increasing conversion
rates. We believe that virtual try-on represents a massive
opportunity to improve the way our community shops and
experiences new products.
Businesses are benefiting from creating their own Public Profile,
which offers a free, permanent home on Snapchat where they can
showcase compelling AR experiences and share shoppable
products directly within the app. Online retail platform GOAT
recently created a profile and uploaded two AR shoe try-on Lenses.
In the first week alone, they saw over 1 million plays, encouraging
GOAT to further invest in their Snapchat presence. We are seeing
higher retention for advertisers who have activated their Public
Profile, a promising, early indication that an organic presence on
Snapchat is meaningful for advertiser ROAS.
+1MPlays in First Week After Creation
GOAT

SNAP INC. | Q1 2022 | TRANSCRIPT 13
Lastly, when brands use a portfolio approach of combining
Sponsored AR Lenses with Snap Ads, they are able to drive higher
ROI and lower costs per outcome. For example, Electronic Arts’ ran
a campaign for its Madden NFL ’22 video game franchise, which
included Commercials, Snap Ads, Lenses, Filters, and Story Ads,
where each of these products saw significant lift in higher and lower
funnel metrics. For Snapchatters that were exposed to all three ad
products, we saw even higher lifts. This is why we are so excited
about Multi-Format Delivery, which enables these types of
campaigns with greater ease.
While the macro operating environment remains challenging and
difficult to predict, we continue to invest in product innovation to
help advertising partners scale, build strong relationships with
advertisers across verticals, and improve our targeting and
measurement capabilities for businesses. Based on the size of our
audience, their high levels of engagement across our service, and
our overall opportunity in the growing digital advertising market, we
believe we are well positioned to drive business results for
advertisers over the long term.

SNAP INC. | Q1 2022 | TRANSCRIPT 14
Our Q1 financial results reflect our priorities of growing our
community, making focused investments in the future of our
business, and scaling our operations efficiently in order to drive
toward profitability and positive free cash flow.
As Evan mentioned earlier, our community grew to 332 million Daily
Active Users (DAU) in Q1, an increase of 52 million or 18% year-over-
year. In North America, DAU grew by 5% year-over-year to reach 98
million. In Europe, DAU grew by 10% to reach 84 million. In Rest of
World, DAU grew by 36% to reach 150 million, as we continue to
invest in local language support, local content, local marketing
partnerships and support for local creator communities.
Total revenue for Q1 was $1,063 million, an increase of 38% year-
over-year. Revenue growth in Q1 initially exceeded our expectations
entering the quarter, with year-over-year growth of approximately
44% through February 23. In the days immediately following Russia’s
invasion of Ukraine on February 24, we observed that a large
number of advertisers initially paused their campaigns. The vast
majority of clients resumed their campaigns within 10 days
following the invasion, and daily average revenue in March
exceeded pre-invasion levels, but the rate of year-over-year growth
remained below pre-invasion levels at approximately 32% from
February 24 through the end of Q1.
The slowdown in the rate of year-over-year growth observed post
the invasion of Ukraine was broad-based, with the deceleration
evident in both our Direct Response and Brand advertising
businesses and in many industry verticals. In the latter portion of
Q1, advertisers in a wider variety of industry groups reported
concerns related to the macro operating environment, including
continued supply chain disruptions, rising input costs, economic
concerns due to rising interest rates, and concerns related to
geopolitical risks stemming from the war in Ukraine. While the
CHIEF FINANCIAL OFFICER
Q1 '21
Q1 '22 332M
280M
+18%Growth Year over Year
332MDaily Active Users
Daily Active Users
Q1 '21
Q1 '22 1,063M
770M
+38%Year over Year
Revenue ($)
Derek Andersen

SNAP INC. | Q1 2022 | TRANSCRIPT 15
impact of these headwinds was felt broadly, our Brand advertising
business grew at a relatively slower rate of 26% year-over-year in Q1,
as new headwinds built on top of supply chain and labor supply
headwinds already impacting a subset of industry sectors coming
into this quarter.
Despite the challenging operating environment, we were
encouraged by the progress in our Direct Response advertising
business, with a year-over-year growth rate of 43% for the full
quarter and nearly 50% prior to the invasion of Ukraine. A small
subset of lower-funnel, app-based GBBs, such as in-app purchase,
continue to be the most impacted by the platform policy changes.
The rollout of our privacy-preserving first-party measurement
solutions continues to progress, with these solutions now enabled
for advertisers representing more than 90% of Direct Response
advertising revenue. We are cautiously optimistic that the partners
who utilize these lower-funnel GBBs will benefit from the more
holistic and timely measurement of results that our first-party
measurement solutions afford as they build confidence in them over
time. We believe that our continued focus on driving measurable
returns on advertising for our partners will be critical to the long-
term success of our advertising partners and our business.
Adjusted gross margin was 61% in Q1, an increase of approximately
14 percentage points year-over-year. Infrastructure cost per DAU
was $0.58 in Q1, which is the best we have ever reported for this
metric as a public company, down from $0.62 in the prior year and
$0.66 the prior quarter. With global ARPU growing at 17% year-over-
year, and infrastructure cost per DAU declining by 6% over the same
Q1 '21
Q1 '22 642M
357M
GAAP Gross Margin ($)
Q1 '21
Q1 '22 0.58
0.62
-6%Year over Year
Infrastructure Costs per Daily Active User ($)
1. We define adjusted gross margin as GAAP revenue less adjusted cost of revenue divided by GAAP revenue. Adjusted cost of revenue excludes stock-based compensation expense and other payroll related tax expense, depreciation and amortization, and certain other non-cash or non-recurring items impacting net income (loss) from time to time of $8 million and $8 million for the three months ended 2022 and 2021, respectively.
Q1 '21
Q1 '22 650M
366M
61%Adjusted Gross Margin
Adjusted Gross Margin ($)1
14pptAdjusted Gross Margin Expansion

SNAP INC. | Q1 2022 | TRANSCRIPT 16
period, efficient scaling of our cloud infrastructure was the largest
driver of expanding gross margins. We have now completed new
multi year agreements with both of our large infrastructure partners,
and the lower pricing from these agreements drove the majority of
the sequential improvement in cost per DAU. We believe the
progress we have made in driving down our unit costs over time,
especially in an inflationary environment, provides powerful
validation for our asset-light infrastructure model, which has in turn
allowed us to hold CapEx investment at less than 2% of revenue
over the trailing 12 months. The growing scale of our cloud partners
and their resulting efficiency are flowing through to our pricing. At
the same time, our multi-cloud approach, the growing scale of our
community, and our improving operational excellence in managing
our unit costs, have worked together to expand our adjusted gross
margin by 22 percentage points over the last three years. The
operating leverage we have realized from scaling our infrastructure
costs efficiently is a key input toward our ability to invest in the long-
term growth of our business while making continued progress
toward sustained positive free cash flow generation.
Adjusted operating expenses were $586 million in Q1, up 60% year-
over-year, reflecting a combination of our ongoing rate of
investment in the business as well as several factors that are further
elevating our adjusted operating expense growth rate in the near
term. As expected, our rate of hiring stepped up in Q1 while our rate
of attrition remained low. Total personnel costs were up 52% year-
over-year, driven by a 52% increase in full-time head count. This
reflects ongoing investments in our team as well as the integration
of acquisitions completed over the last year, which contributed
Q1 '21
Q1 '22 586M
367M
Adjusted Operating Expenses ($)2
Q1 '21
Q1 '22 913M
661M
GAAP Operating Expenses ($)
Q1 '21
Q1 '22 6,131
4,043
Headcount
2. Adjusted operating expenses excludes stock-based compensation expense and other payroll related tax expense, depreciation and amortization, and certain other non-cash or non-recurring items impacting net income (loss) from time to time of $328 million and $294 million for the three months ended 2022 and 2021, respectively.
Lowest Infrastructure Cost per DAU in more than 5 Years

SNAP INC. | Q1 2022 | TRANSCRIPT
3. We define Adjusted EBITDA as net income (loss), excluding interest income; interest expense; other income (expense), net; income tax benefit (expense); depreciation and amortization; stock-based compensation expense and other payroll related tax expense; and certain other non-cash or non-recurring items impacting net income (loss) from time to time. See Appendix for reconciliation of net loss to Adjusted EBITDA.
4. We define adjusted EBITDA leverage as the year-over-year change in adjusted EBITDA divided by the year-over-year change in GAAP revenue.
17
approximately 9 percentage points of the year-over-year growth in
full-time headcount in Q1. Marketing was the next-largest driver of
year-over-year adjusted operating expense growth, with total
marketing spending more than doubling year-over-year in Q1, due in
part to the timing of marketing campaigns and events relative to the
prior year. We estimate the timing of marketing expenses elevated
our overall adjusted operating expense growth rate by
approximately 4 percentage points in Q1. In addition, we continue
to see costs return to our cost structure that were otherwise
diminished during the pandemic period, including travel, event, and
certain operations costs, which collectively contributed
approximately 3 percentage points to the year over year growth rate
in Q1. Finally, we incurred approximately $5 million in costs to
support our team members impacted by the war in Ukraine during
Q1, which further contributed to the elevated year-over-year growth
in adjusted operating expenses.
Adjusted EBITDA was $64 million in Q1, an improvement of $66
million year-over-year. We delivered adjusted EBITDA leverage of
23% in Q1 as we continue to invest in the future of our business
while making progress toward sustained profitability and positive
free cash flow.
Net income was negative $360 million in Q1, compared to a loss of
$287 million in Q1 of the prior year. The current quarter results
include a $100 million year-over-year decline in Other Income,
driven primarily by a $92 million unrealized loss on an investment
Q1 '21
Q1 '22 -360M
-287M
GAAP Net Income ($)
Q1 '21
Q1 '22 64M
-2M
23%Adjusted EBITDA Leverage4
Adjusted EBITDA ($)3
SNAP INC. | Q1 2022 | TRANSCRIPT 18
that became public in the second half of 2021. Excluding the impact
of mark-to-market losses on this investment, Net Income would
have improved by $19 million or 7% year-over-year to reach negative
$267 million, which is due primarily to the flow-through of the $66
million improvement in adjusted EBITDA, partially offset by $19
million higher stock-based compensation, $15 million higher
depreciation and amortization, $7 million in higher taxes, and $6
million in other net expenses.
While we have continued to grow our team and leverage stock-
based compensation strategically to foster an ownership culture
and drive long-term retention, we have remained focused on
managing these programs responsibly. Total fully diluted shares
grew 4.8% year-over-year in Q1 with the vast majority of this growth
driven by $1.1 billion of early conversions of our outstanding
convertible notes completed in 2021. Excluding dilution related to
convertible notes, the rate of growth was 1.3% in Q1, compared with
1.2% in the prior quarter and 2.6% in the prior year. While we are
pleased with the progress we have made on this metric, it is
important to note that the dilution rate, in particular as it relates to
SBC, tends to move inversely with our stock price and thus can be
subject to market forces over time.
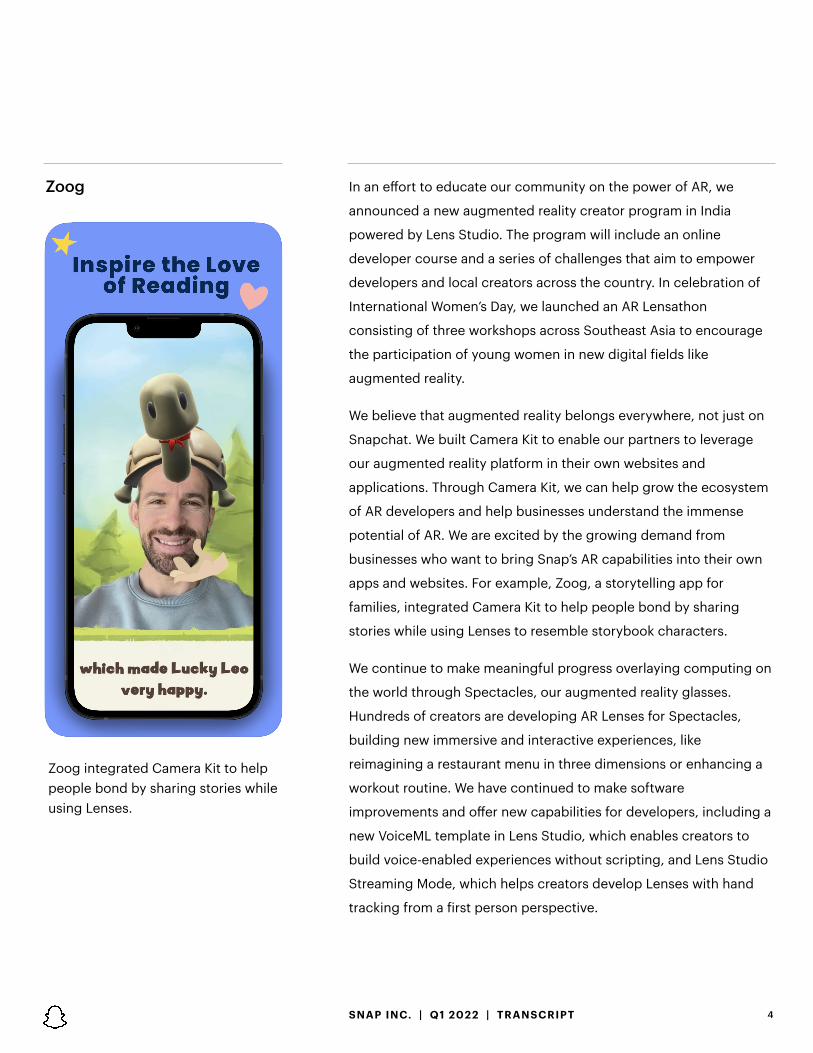
Free cash flow for Q1 was positive $106 million and we ended the
quarter with $5.0 billion in cash and marketable securities, up from
$2.6 billion in the prior year, with the increase reflecting the
proceeds of convertible notes and cash we have generated
from operations.
Q1 '21
Q1 '22 106M
126M
Free Cash Flow ($)5
Q1 '21
Q1 '22 127M
137M
Operating Cash Flow ($)
5. We define Free Cash Flow as net cash provided by (used in) operating activities, reduced by purchases of property and equipment. See Appendix for reconciliation of net cash provided by (used in) operating activities to Free Cash Flow.
6. We define trailing twelve months as the sum of the last four quarters of data for applicable measures. See Appendix for quarterly data and reconciliation of net loss to Adjusted EBITDA and net cash provided by (used in) operating activities to Free Cash Flow.
Three Consecutive Quarters of
Positive Free Cash Flow
Trailing 12 Month Free Cash Flow6 of
$203 Million Up 314% Year over Year
Trailing 12 Month Operating Cash Flow of
$283 Million

SNAP INC. | Q1 2022 | TRANSCRIPT 19
As we look forward to Q2, we are pleased with the momentum we
have observed in our community and our guidance for the quarter
assumes DAU will be approximately 343 to 345 million in Q2. On the
revenue side, forward looking visibility is as difficult today, or
perhaps more difficult, than at any point in recent memory. While
the 116% revenue growth we experienced in Q2 of the prior year
makes the comparisons more difficult this quarter, we believe the
bigger challenge to forward looking visibility is the uncertain
operating environment. The macro headwinds we observed in Q1,
including supply chain disruptions, labor shortages, inflationary
pressures, and the impact of rising interest rates on the overall
economic environment remain challenges as we enter Q2. We
believe the impact of the war in Ukraine on input costs, marketing
budgets, and overall economic confidence has been significant,
and that it is difficult to predict its impact on a forward looking
basis. Given the uncertainty caused by these challenging
circumstances, we have opted to share that our growth rate thus far
in Q2 is approximately 30% year over year, or just below the
approximately 32% growth rate we observed following the invasion
of Ukraine in Q1. That said, we are concerned that the operating
environment ahead could be even more challenging, leading to
further campaign pauses or advertiser budget reductions, and as I
noted earlier our prior year comparisons are more difficult in Q2
than in Q1. Given this, we believe that revenue guidance of 20% to
25% year-over-year revenue growth in Q2 is reasonable.
Given the abundance of opportunities we see to invest productively
in our business, we continue to expect that 2022 will be a significant
investment year. When the impact of new investments in 2022 are
combined with the full-year impact of investments made in 2021, we
expect that a smaller share of incremental revenue will flow through
to adjusted EBITDA and net income in 2022. While the operating
environment is currently challenging, we believe that the progress
Q1 '21
Q1 '22 5,001M
2,557M
Cash, Cash Equivalents, and Marketable Securities ($)
Revenue:
20% to 25% Year over Year
Adjusted EBITDA:
Breakeven to $50M
Financial Guidance for Q2 2022

SNAP INC. | Q1 2022 | TRANSCRIPT 20
we have made to deliver positive free cash flow over the trailing 12
months, and the strength of our balance sheet with $5 billion in
cash and marketable securities on hand, have positioned us well to
invest through the current environment. Continuing to invest
through the current headwinds will allow us to build on the
momentum we have established in our business in order to ensure
we capture the immense long-term upside we see in the future of
augmented reality, and we believe we can do so responsibly as we
continue to thoughtfully prioritize our investments. Given our
revenue guidance, and our planned level of investment, we expect
adjusted EBITDA to be between breakeven and $50 million in Q2.

Appendix

SNAP INC. | Q1 2022 | TRANSCRIPT 22
Forward-Looking StatementsThis transcript contains forward-looking statements within the meaning of Section 27A of the Securities Act of 1933, as amended,
or the Securities Act, and Section 21E of the Securities Exchange Act of 1934, as amended, or the Exchange Act, about us and our
industry that involve substantial risks and uncertainties. All statements other than statements of historical facts contained in this
transcript, including statements regarding guidance, our future results of operations or financial condition, business strategy and
plans, user growth and engagement, product initiatives, objectives of management for future operations, and advertiser and
partner offerings, are forward-looking statements. In some cases, you can identify forward-looking statements because they
contain words such as “anticipate,” “believe,” “contemplate,” “continue,” “could,” “estimate,” “expect,” “going to,” “intend,” “may,”
“plan,” “potential,” “predict,” “project,” “should,” “target,” “will,” or “would” or the negative of these words or other similar terms or
expressions. We caution you that the foregoing may not include all of the forward-looking statements made in this transcript.
You should not rely on forward-looking statements as predictions of future events. We have based the forward-looking statements
contained in this transcript primarily on our current expectations and projections about future events and trends, including our
financial outlook, geo-political conflicts, and the COVID-19 pandemic, that we believe may continue to affect our business,
financial condition, results of operations, and prospects. These forward-looking statements are subject to risks and uncertainties
related to: our financial performance; our lack of historical profitability; our ability to generate and sustain positive cash flow; our
ability to attract and retain users, publishers, and advertisers; competition and new market entrants; managing our international
expansion and our growth and future expenses; compliance with new laws, regulations, and executive actions; our ability to
maintain, protect, and enhance our intellectual property; our ability to succeed in existing and new market segments; our ability
to attract and retain qualified and key personnel; our ability to repay outstanding debt; future acquisitions, divestitures or
investments; and the potential adverse impact of climate change, natural disasters, health epidemics, and war or other armed
conflict, as well as risks, uncertainties, and other factors described in “Risk Factors” and elsewhere in our most recent periodic
report filed with the U.S. Securities and Exchange Commission, or SEC, which is available on the SEC’s website at www.sec.gov.
Additional information will be made available in Snap Inc.’s periodic report that will be filed with the SEC for the period covered by
this transcript and other filings that we make from time to time with the SEC. In addition, any forward-looking statements
contained in this transcript are based on assumptions that we believe to be reasonable as of this date. We undertake no obligation
to update any forward-looking statements to reflect events or circumstances after the date of this transcript or to reflect new
information or the occurrence of unanticipated events, including future developments related to the geo-political conflicts and
the COVID-19 pandemic, except as required by law.

SNAP INC. | Q1 2022 | TRANSCRIPT 23
Non-GAAP Financial MeasuresTo supplement our consolidated financial statements, which are prepared and presented in accordance with GAAP, we use certain
non-GAAP financial measures, as described below, to understand and evaluate our core operating performance. These non-GAAP
financial measures, which may be different than similarly titled measures used by other companies, are presented to enhance
investors’ overall understanding of our financial performance and should not be considered a substitute for, or superior to, the
financial information prepared and presented in accordance with GAAP.
We use the non-GAAP financial measure of Free Cash Flow, which is defined as net cash provided by (used in) operating activities,
reduced by purchases of property and equipment. We believe Free Cash Flow is an important liquidity measure of the cash that is
available, after capital expenditures, for operational expenses and investment in our business and is a key financial indicator used
by management. Additionally, we believe that Free Cash Flow is an important measure since we use third-party infrastructure
partners to host our services and therefore we do not incur significant capital expenditures to support revenue generating
activities. Free Cash Flow is useful to investors as a liquidity measure because it measures our ability to generate or use cash. Once
our business needs and obligations are met, cash can be used to maintain a strong balance sheet and invest in future growth.
We use the non-GAAP financial measure of Adjusted EBITDA, which is defined as net income (loss); excluding interest income;
interest expense; other income (expense), net; income tax benefit (expense); depreciation and amortization; stock-based
compensation expense and other payroll related tax expense; and certain other non-cash or non-recurring items impacting net
income (loss) from time to time. We believe that Adjusted EBITDA helps identify underlying trends in our business that could
otherwise be masked by the effect of the expenses that we exclude in Adjusted EBITDA.
We use the non-GAAP financial measure of non-GAAP net income (loss), which is defined as net income (loss); excluding
amortization of intangible assets; stock-based compensation expense and other payroll related tax expense; certain other non-cash
or non-recurring items impacting net income (loss) from time to time; and related income tax adjustments. Non-GAAP net income
(loss) and weighted average diluted shares are then used to calculate non-GAAP diluted net income (loss) per share. Similar to
Adjusted EBITDA, we believe these measures help identify underlying trends in our business that could otherwise be masked by the
effect of the expenses we exclude in the measure.
We believe that these non-GAAP financial measures provide useful information about our financial performance, enhance the
overall understanding of our past performance and future prospects, and allow for greater transparency with respect to key metrics
used by our management for financial and operational decision-making. We are presenting these non-GAAP measures to assist
investors in seeing our financial performance through the eyes of management, and because we believe that these measures
provide an additional tool for investors to use in comparing our core financial performance over multiple periods with other
companies in our industry.
For a reconciliation of these non-GAAP financial measures to the most directly comparable GAAP financial measure, please see
“Reconciliation of GAAP to Non-GAAP Financial Measures” included as an Appendix to this transcript.
Snap Inc., “Snapchat,” and our other registered and common law trade names, trademarks, and service marks are the property of
Snap Inc. or our subsidiaries.

SNAP INC. | Q1 2022 | TRANSCRIPT
Adjusted EBITDA reconciliation: 3/31/22 12/31/21 9/30/21 6/30/21 3/31/21
Net loss $ (359,624) $ 22,550 $ (71,959) $ (151,664) $ (286,882)
Add (deduct):
Interest income (3,123) (1,554) (1,257) (1,251) (1,137)
Interest expense 5,173 4,050 4,031 4,564 5,031
Other expense (income), net 77,537 (63,204) (112,631) (42,282) (22,058)
Income tax expense 8,510 13,031 992 (1,879) 1,440
Depreciation and amortization 38,100 34,863 32,510 28,270 23,498
Stock-based compensation expense 275,444 297,564 300,898 256,600 237,073
Payroll and other tax expense
related to stock-based
compensation 22,451 19,493 21,615 25,045 41,326
Adjusted EBITDA1 $ 64,468 $ 326,793 $ 174,199 $ 117,403 $ (1,709)
24
Reconciliation of GAAP to Non-GAAP Financial Measures (In thousands, unaudited)
Three Months Ended
Free Cash Flow reconciliation: 3/31/22 12/31/21 9/30/21 6/30/21 3/31/21
Net cash provided by
operating activities $ 127,459 $ 185,528 $ 71,552 $ (101,086) $ 136,886
Less:
Purchases of property
and equipment (21,175) (24,565) (19,836) (14,623) (10,851)
Free Cash Flow2 $ 106,284 $ 160,963 $ 51,716 $ (115,709) $ 126,035
Three Months Ended
1. We define Adjusted EBITDA as net income (loss), excluding interest income; interest expense; other income (expense), net; income tax benefit (expense); depreciation and amortization; stock-based compensation expense and other payroll related tax expense; and certain other non-cash or non-recurring items impacting net income (loss) from time to time.
2. We define Free Cash Flow as net cash provided by (used in) operating activities, reduced by purchases of property and equipment.