MeRck Q1 21 Roadshow
119
MeRck Q1 21 Roadshow Matthias Heinzel, CEO Life Science Andrew Bulpin, Head of Process Solutions July 8, 2021
-
Upload
khangminh22 -
Category
Documents
-
view
1 -
download
0
Transcript of MeRck Q1 21 Roadshow

Classification: Public
MeRckQ1 21 Roadshow
Matthias Heinzel, CEO Life Science Andrew Bulpin, Head of Process Solutions
July 8, 2021

Classification: Public
Disclaimer
Cautionary Note Regarding Forward-Looking Statements and financial indicators
This communication may include “forward-looking statements.” Statements that include words such as “anticipate,” “expect,” “should,” “would,” “intend,” “plan,” “project,” “seek,” “believe,” “will,” and other words of similar meaning in connection with future events or future operating or financial performance are often used to identify forward-looking statements. All statements in this communication, other than those relating to historical information or current conditions, are forward-looking statements. We intend these forward-looking statements to be covered by the safe harbor provisions for forward-looking statements in the Private Securities Litigation Reform Act of 1995. These forward-looking statements are subject to a number of risks and uncertainties, many of which are beyond control of Merck which could cause actual results to differ materially from such statements.
Risks and uncertainties include, but are not limited to: the risks of more restrictive regulatory requirements regarding drug pricing, reimbursement and approval; the risk of stricterregulations for the manufacture, testing and marketing of products; the risk of destabilization of political systems and the establishment of trade barriers; the risk of a changingmarketing environment for multiple sclerosis products in the European Union; the risk of greater competitive pressure due to biosimilars; the risks of research and development; therisks of discontinuing development projects and regulatory approval of developed medicines; the risk of a temporary ban on products/production facilities or of non-registration ofproducts due to non-compliance with quality standards; the risk of an import ban on products to the United States due to an FDA warning letter; the risks of dependency on suppliers;risks due to product-related crime and espionage; risks in relation to the use of financial instruments; liquidity risks; counterparty risks; market risks; risks of impairment on balancesheet items; risks from pension obligations; risks from product-related and patent law disputes; risks from antitrust law proceedings; risks from drug pricing by the divested GenericsGroup; risks in human resources; risks from e-crime and cyber attacks; risks due to failure of business-critical information technology applications or to failure of data center capacity;environmental and safety risks; unanticipated contract or regulatory issues; a potential downgrade in the rating of the indebtedness of Merck; downward pressure on the common stockprice of Merck and its impact on goodwill impairment evaluations as well as the impact of future regulatory or legislative actions.
The foregoing review of important factors should not be construed as exhaustive and should be read in conjunction with the other cautionary statements that are included elsewhere,including the Report on Risks and Opportunities Section of the most recent annual report and quarterly report of Merck. Any forward-looking statements made in this communication arequalified in their entirety by these cautionary statements, and there can be no assurance that the actual results or developments anticipated by us will be realized or, even if substantiallyrealized, that they will have the expected consequences to, or effects on, us or our business or operations. Except to the extent required by applicable law, we undertake no obligation toupdate publicly or revise any forward-looking statement, whether as a result of new information, future developments or otherwise.
This presentation contains certain financial indicators such as EBITDA pre adjustments, net financial debt and earnings per share pre adjustments, which are not defined by InternationalFinancial Reporting Standards (IFRS). These financial indicators should not be taken into account in order to assess the performance of Merck in isolation or used as an alternative to thefinancial indicators presented in the consolidated financial statements and determined in accordance with IFRS. The figures presented in this statement have been rounded. This maylead to individual values not adding up to the totals presented.
2

Classification: Public
Agenda
Business overview
Transforming the company
Healthcare – Executing on the earnings phase
Life Science – Focusing on profitable growth
Electronics – Leveraging portfolio shift
Sustainability
Guidance & executive summary
3

Classification: Public
Business overview
01

Classification: Public
Merck GroupThree high-tech businesses competing in attractive markets
Leading life science company
▪ Tools and services for biotech research & production
▪ Tools and laboratory supply for academic research and industrial testing
Leading company inhigh-tech solutions
▪ High-tech solutions and materials for electronics
▪ Broad portfolio of decorative and functional solutions
Leading in specialty pharma markets
▪ Biologics and small-molecule prescription medicines against cancer, multiple sclerosis, infertility
▪ Research focus: Oncology, Immunology & Immuno-Oncology
▪ Successful portfolio management: e.g. divestment of Consumer Health and Allergopharma
ElectronicsHealthcare Life Science
5

Classification: Public
36%
Global specialty innovator poised for above-industry growth
▪ Resilient core business backed by excellent life cycle management
▪ Strong growth from new products, late-stage pipeline assets with blockbuster potential
▪ Rigorous cost discipline and value-maximizing pipeline prioritization
Merck today – three strong pillars as basis for profitable growth
6
Merck Group
Healthcare
LifeScience
Electronics
Diversified industry leader poised for above-market growth
▪ Portfolio advantage and outperformance drive above-market growth
▪ Strengthen core: products (PS), chemistry (RS), lab water (AS)
▪ Establish new pillars: PS services, gene editing and novel modalities
Leading electronics player poised for accelerating growth
▪ Growing semiconductor share as key driver for acceleration
▪ More resilient growth through rising diversification
▪ Strict cost discipline in maturing parts of the portfolio
38%
FY 2020 contribution to1
Sales EBITDA pre
45%43%
19%19%
Acronyms: PS = Process Solutions, RS = Research Solutions, AS = Applied Solutions
1.
2.
3.1EBITDA pre share excluding Corporate & Others; 2020 EBITDA pre restated for €365 m patent litigation provision release

Classification: Public
Merck GroupThe 2016 vision – a strategic agenda until 2022
7
2012-2015 2016-2018 2019-2022
Efficiency program
Portfolio optimization in LS and EL
Turnaroundin
Healthcare
Leadership in Electronics
Sigma integration
Digitalbusiness models
New applications beyond displays
First pipeline launches
3 strong pillars
Above-market growthin Life Science
Fully leverage pipeline potential
Portfolio management
Executing on the growth and expansion phase of the 2016-22 strategic agenda
= delivered; = well on track

Classification: Public
Group-wide:Profitable Growth & Cost Discipline
Healthcare
Merck Group2021 and beyond – poised for growth in a challenging environment
8
Life Science Electronics
• Drive profitable growththrough pipeline launches
• Execute on stringent cost discipline
• Continue to outperform the market
• Sustain industryleading profitability
• Accelerate top-line growth
• Keep margins atattractive level
Trade Wars
China AutoChina
VBP
Staying on course in a potentially volatile environment
Acronym: VBP = volume based procurement

Classification: Public
Transforming the company
02

Classification: Public
Merck GroupWe have added scale and strengthened the attractiveness of our portfolio
Divestments Acquisitions
~€10 bn3 ~€36 bn
Transformation volume
Electronics
Life Science+
Millipore & Sigma-Aldrich
+- divested acquired
+Versum
Materials5
Healthcare+Serono
2020: ~€18 bn sales
1Closing of sale of Consumer Health at a cash purchase price of €3.4 bn completed as of December 1, 2018; 2Excluding “Crop Bioscience”, which was divested; 3Profroma divestment volume includes cash proceeds for Consumer Health; 4Excluding “Theramex”, which was divested; 5Closing of acquisition of Versum Materials at a purchase price of €5.8 bn completed as of October 7, 2019
mergedLaboratory Business
Life Science Solutions2
Liquid Crystals
Pigments
merged
Generics -
2007: ~€7 bn sales
Ethicals4
Consumer Health1
merged
-
AZ
Allergopharma -
10

Classification: Public
Merck GroupContinue to transform to a science and technology focused company
7 202 6 7757 402
8 9519 922
10 756 10 73511 363
12 845
15 024 15 327 14 8363
16 152
17 534
26%20%
22%28%
27% 28% 30%29% 28%
30%28%
26%27% 28%
10%
15%
20%
25%
30%
35%
40%
0
2 000
4 000
6 000
8 000
10 000
12 000
14 000
16 000
18 000
2007 2008 2009 2010 2011 2012 2013 2014 2015 2016 2017 2018 2019 2020
Net sales [€m] EBITDA pre margin [%]
[€m] Margins
Acquisition of Millipore
Acquisition of AZElectronic Materials1
Acquisition of SeronoDivestment of Generics
Acquisition of Sigma-Aldrich
22
Divesture of Consumer Health
Acquisition of Versum Materials
11
3
11
1Included since 2 May 2014; 22007 and 2014 EBITDA pre margin adjusted for comparability; 32018 net sales reflect Consumer Health divesture (reduction of ~€1 bn net sales p.a.)42020 margin restated for €365 m patent litigation provision release
4

Classification: Public
Merck GroupAll three business sectors delivering on their strategic priorities
12
▪ Above-market organic growth paired with industry-leading margin
▪ Significant growth investments (organic, inorganic & partnerships)
▪ Accelerating organic growth with rising contribution from launches (Mavenclad®, Bavencio®)
▪ Margin trough behind, pipeline progressing well
▪ Significant portfolio change towards higher growth business (Semi, OLED)
▪ Margin stabilizing at ~30% amid sound execution of Bright Future
Healthcare Life Science Electronics
1 Company estimate based on industry data and reporting by peers
28.6%31.0%
2019
4.7%
24.9%
2016 2017
28.6%
4.6%
2018
5.2%6.2% 8.8%
2018
29.8%29.2%
9.0%
20172016 2019
5.3%
30.4% 31.0%
6.3%
44.1%
2016
15%
40.1% 31.2%
-6.5%2017 2018
32.7%
33%
2019
-4.7%-1.7%
Semi. Solutions as % of PM salesIndustry margin avg. Market growthEBITDA pre margin org. sales growth new product share (pp.)
+1,7%
1 1
From: Merck Capital Markets Day 2020 – 2020.09.16

Classification: Public
Merck GroupClear set of priority goals
Healthcare
▪ Deliver on ambition to keep core business at least stable until 2022
▪ Transition from investment to earnings phase by 2019
▪ Foster successful Bavencio®
and Mavenclad® ramp up▪ Stringent pipeline execution
Life Science
▪ Strengthen position as differentiated player in a highly attractive market
▪ Maintain consistent above-market growth trajectory and superior profitability
Electronics
▪ Deliver ambition of 3-4% CAGR▪ Implement 5-year transformation
program and focus on seamless integration of Versum and Intermolecular; to deliver financial ambition of around 30% margin
▪ Maintain strong cash generation and cash conversion
EBITDApre*
~40%EBITDA
pre*
~42%EBITDA
pre*
~18%
13
*based on FY 2020

Classification: Public
Global life science industry~5% to 6%
Merck GroupThree-pillar structure – positioned to win in high-growth markets
14
Global pharma industry ~4% to 5%
1 Company estimates of mid-term growth outlook based on industry forecasts and reports from public research institutes (e.g. IMF, IQVIA, EvaluatePharma, Prismark, etc.)
Global electronics industry~4%Global
GDP
~3% to 4%
Oncology: ~10% Immunology: ~5% to 9%
Global economy1 End markets1 Focus market areas1
~4% to 5%
Purposefully positioned in attractive markets with secular growth above global GDP …further focusing investments on attractive sub-segments
Biologics: ~10% to 12% Services: ~7% to 8%
Semi materials: ~4% to 6%
Σ 6%-plus Σ
From: Merck Capital Markets Day 2020 – 2020.09.16

Classification: Public
Three main drivers of growth to 2022 and beyond
15
ProcessSolutions
HealthcarePipeline
20222019 SemiconductorSolutions
OtherBusinesses
>>>
Beyond 2022: further significant growth potential from “BIG3” and increasing contributions from other businesses
>80% ofgrowthfrom “BIG3”
deliver ~€2 bnpipeline ambition
poised for low-teens org. growth
poised for mid to high single-digit org. growth
Merck Group
1
1 2019 Group sales of €16.2 bn; 2 Including Versum portfolio effect
2
From: Merck Capital Markets Day 2020 – 2020.09.16

Classification: Public
2019 2022 >>>
Merck GroupPortfolio strategy – from transformation to evolution
16
Strong portfolio: significant organic growth potential to 2022 and beyond …and higher likelihood of regular bolt-ons post 2022
Bolt-ons and in-licensing
Deleveraging and organic growth investments in focus until 2022
▪ Primarily organic growth from ”BIG3“
▪ Selective bolt-ons possible if budget allows Higher likelihood of regular bolt-ons
Reduced probability of larger acquisitions post 2022
Larger acquisitions
1
1 2019 Group sales of €16.2 bn
From: Merck Capital Markets Day 2020 – 2020.09.16

Classification: Public
Healthcare
03
Executing on the earnings phase

Classification: Public
HealthcareCreating optionality through focused pipeline approach
18
Pipeline and launch progress supported by strong base
Confirming financial ambition of a stable base business and ~€2 bn pipeline sales until 2022 with further significant growth potential beyond
Mid-term outlookHealthcare
~€2 bnpipeline sales
& stable base businessuntil 2022
+significant growth
potentialbeyond
Strong core business due to excellent life cycle management
Pip
elin
e q
ual
ity
Lau
nch
ac
tivi
ty
• Early stage pipeline fueled by in-house innovation• Potentially transformative late-stage pipeline assets (Evobrutinib,
Bintrafusp alfa)
• Optimized risk profile through strategic partnerships (Pfizer and GSK), in-licensing (pivotal-stage Xevinapant) & focused externalization
• Mavenclad® approved in >80 countries including the U.S.
• Bavencio® launched in MCC1, RCC2, and UC 1L/2L3
• Tepotinib first-in-class approval of an oral MET inhibitor4
1 MCC = Merkel Cell Carcinoma, launched in all major jurisdictions; 2 RCC = Renal Cell Carcinoma, launched in all major jurisdictions; 3 UC = Urothelial Carcinoma, 1L = first line, 2L = second line, launched in all major jurisdictions; 4 approved in Japan and U.S.

Classification: Public
Healthcare: Base BusinessConfirming ambition to keep base business at least stable to 2022
Healthcare base business net sales until 2022▪ Maintain solid track record of patient retention▪ Integrate into joint franchise with Mavenclad®
▪ Drive EM1 growth and mitigate competitive / price pressure in EU by clear branding
▪ Continued China NRDL inclusion secured through successful renegotiation in late 2020
▪ Drug demand driven by emerging marketsgrowth and demographics
▪ Leverage competitive strengths (e.g. broad and innovative portfolio, security of supply)
▪ Drive recovery after COVID-19
▪ Increasing prevalence of diabetes and cardiovascular diseases
▪ Mitigate VBP pressure in China through EM growth, effective life cycle management, and portfolio expansion
2020 2022E2013
Rebif®
Decline in line with interferon market
Erbitux®
Stable to slightly growing
FertilityRecovery as of mid 2020,mid single-digit growth beyond 2021
CM&E2
Stable in 2021, mid to high single-digit growth beyond
Core business
1 EM: emerging markets; 2 Cardiovascular, Metabolism and Endocrinology (new Franchise name as of Q1 2021)
Core business with 36 consecutive quarters of growth (Q2 2011 – Q1 2020)Growth to pick up after COVID-19 impact, further growth potential after 2022
1919

Classification: Public
ILLUSTRATIVE - Not to scale; Acronyms: BTD = Breakthrough Designation; ODD = Orphan Drug Designation; IA = Interim Analysis; RTOR = Real-Time Oncology Review; sBLA = Supplemental Biologics License Application
Healthcare: Sales from PipelineMavenclad and Bavencio launches on track for ~€2 bn pipeline ambition in 2022
20
▪ Approved for aRCC (USA, EU, Japan), mMCC (50 countries incl. USA and EU), and UC 2L (USA, Canada, Israel)
▪ Approved for UC 1L in US on June 30, 2020, in EU on January 25, 2021 and in Japan on February 24, 2021
▪ Phase III read-out remaining: NSCLC 1L (est. primary completion date: October 2021)
▪ Global peak sales: €1.0–1.4 bn
▪ Approved in >80 countries, including USA, EU, Canada and Australia
▪ Dynamic market volume still lags pre pandemic levels by ~20% but increased vaccination likely to drive market recovery and Q2 growth
▪ Approved in Japan on March 25, 2020(Sakigake and ODD granted in 2018 & 2019)
▪ Approved in US on February 3, 2021(granted priority review under RTOR)
▪ Multiple potentially registrational studies across various tumor types ongoingBintrafusp alfa
Tepotinib
Classification: Public
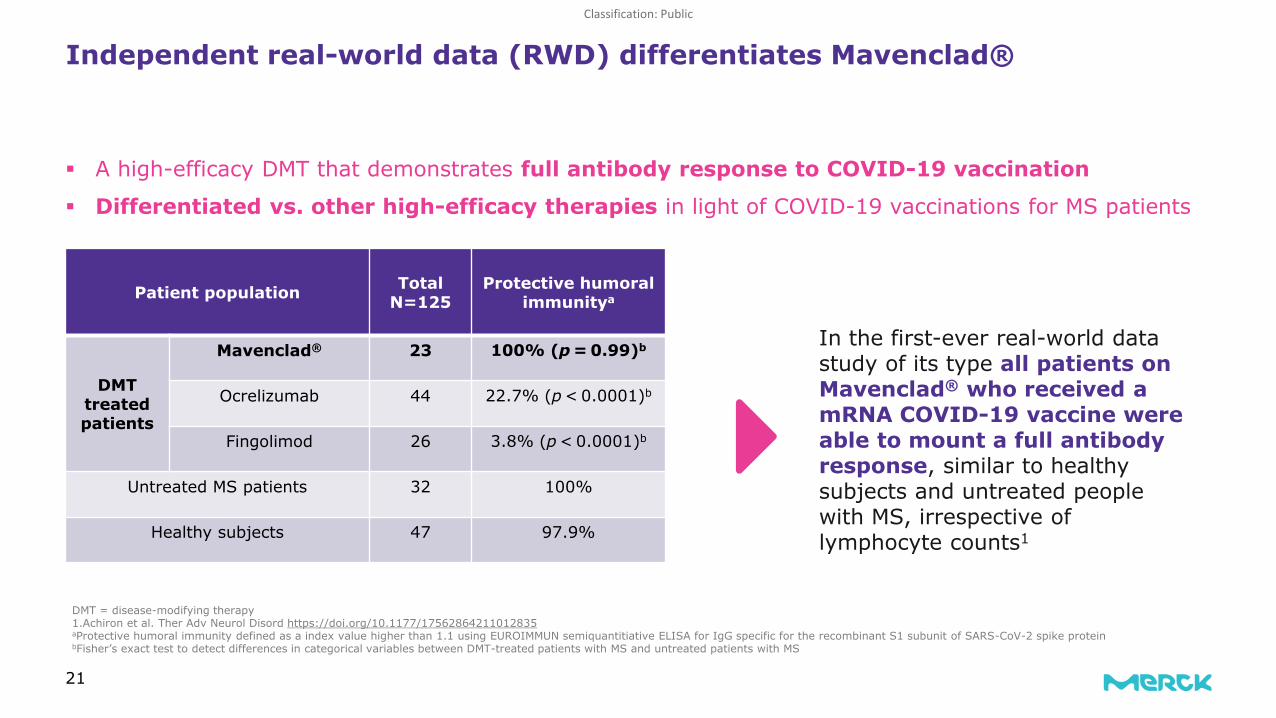
▪ A high-efficacy DMT that demonstrates full antibody response to COVID-19 vaccination
▪ Differentiated vs. other high-efficacy therapies in light of COVID-19 vaccinations for MS patients
21
In the first-ever real-world data study of its type all patients on Mavenclad® who received a mRNA COVID-19 vaccine were able to mount a full antibody response, similar to healthy subjects and untreated people with MS, irrespective of lymphocyte counts1
DMT = disease-modifying therapy1.Achiron et al. Ther Adv Neurol Disord https://doi.org/10.1177/17562864211012835aProtective humoral immunity defined as a index value higher than 1.1 using EUROIMMUN semiquantitiative ELISA for IgG specific for the recombinant S1 subunit of SARS-CoV-2 spike proteinbFisher’s exact test to detect differences in categorical variables between DMT-treated patients with MS and untreated patients with MS
Independent real-world data (RWD) differentiates Mavenclad®
Patient population Total N=125
Protective humoral immunitya
DMT treated patients
Mavenclad® 23 100% (p = 0.99)b
Ocrelizumab 44 22.7% (p < 0.0001)b
Fingolimod 26 3.8% (p < 0.0001)b
Untreated MS patients 32 100%
Healthy subjects 47 97.9%

Classification: Public
Bavencio® UC 1L launch update: Significant opportunity to drive further growth by increasing the adoption of 1L maintenance therapy
22
1: Carboplatin or Cisplatin, 2: Complete / partial response or stable disease based on clinical trial data; Acronyms: PT = Platinum, SOC = Standard of care
NewlydiagnosedmetastaticUC cases
Platinum eligble
PT-based chemo1
1L treatmentMaintenance
therapy eligible2
U.S. - ~10 months into launch, on track to changing the SOC:
85%1L Maintenance Therapy (SOC)
Increasing adoption by academic centers with further growth opportunity among community oncologists
Dominant market share within indicated segment
▪ Bavencio® maintenance treatment recently upgraded to category 1 level of evidence in NCCN guidelines as the only IO in 1L UC
Growing share of PT-based chemo: increased from ~50% at launch and rising
Europe & Japan – Recently approved, promising early signals:
▪ Market access on track▪ Strong initial uptake in key launch markets▪ Recently recommended by EAU (European Association of Urology) guidelines (March 25) as the preferred treatment in 1L UC
~70% ~70% ~35% 80%

Classification: Public
Q2 2021 Q3 2021 Q4 2021 Q1 2022
Healthcare catalysts – Significant developmental progress across Oncology and Immuno-Oncology portfolio expected in 2021
Acronyms: EMA = European Medicines Agency, LA = locally advanced, SCLC = Small cell lung cancer, SCCHN = Squamous cell carcinoma of the head and neck, NSCLC = Non-small cell lung cancer, , TLR = Toll-like receptor, 1: Clinical timelines are event-driven and may be subject to change
23
EMA: Filing accepted in Q4 2020, review ongoing
Oncology
Immuno-Oncology
M5049 (TLR 7/8 antagonist)
Covid-19 pneumonia: Results dependent on recruitment and COVID-19 infection rates
Immunology
Bavencio®
(Avelumab/Anti-PD-L1)1L NSCLC (JAVELIN 100):Expected data read-out1
Tepotinib(c-Met–inhibitor)
Bintrafusp alfa(TGFbeta trap/anti-PD-L1)
2L Cervical (INTR@PID 017): Expected data read-out
Initiation of Ph III studyin Cisplatin-Ineligible LA SCCHN
Xevinapant(IAP inhibitor)

Classification: Public
Life science
04
Focusing on profitable growth

Classification: Public
Life ScienceBuilding growth momentum with focus on attractive market segments
25
Total Life Science Market1
~€170-180 bn; ~5-6% CAGR
Upgrading mid-term financial ambition to 6-9% organic sales CAGR
Consumables~55%; ~5-6%
Mid-term outlookLife Science Business Sector
Instruments~15%; ~4-5%
Services~30%; ~7-8%
Research ~30%; ~2-3%
Merck’s market presence: strong moderate limited
Process~35%; ~8-9%
Applied ~35%; ~4-5%
6-9%
Organic sales
CAGR
1 Company estimate of the market segments, based on industry forecast over 5-year horizon; all growth rates in 3x3 Matrix indicate external market growth
From: Merck Capital Markets Day 2020 – 2020.09.16

Classification: Public
Market outlook improving further, mainly due to Process segment
Above-market growth set to continue due to portfolio advantage and outperformance
Life ScienceImproved mid-term outlook driven by market and portfolio focus
26
~€170-180 bn~5-6% CAGR1
+50-150 bps
+50-150 bps
~6-9% CAGR1
1 Company estimate based on industry forecast over 5-year horizon
From: Merck Capital Markets Day 2020 – 2020.09.16

Classification: Public
47%
29%
23%
Life ScienceAll business units contributing to above-market growth
27
6-9% CAGR
Process SolutionsLow-teens growth
vs. market of 8-9%
Applied SolutionsMid single-digit growth
vs. market of 4-5%
Research SolutionsLow single-digitgrowth
vs. market of 2-3%
▪ Regulation: rise in quality standards and increasing demand for testing across customer segments
▪ Population and economic growth: demand for access to more sophisticated products and services rises, e.g. in emerging markets
▪ Speed: need for fast testing results raises requirements for Applied customers, esp. in clinical testing and food & beverage testing
Mid-term outlook2 Fundamental growth driversCustomer Split3Sales split1
Pharma and Biotech P AcademiaI DiagnosticsAIndustrial and Testing DCustomer Segments:
P I
I
P
I
D
D
A
P
A
▪ Biologics: global mAbs4 production growing by ~11-15% p.a. for 2020-20245 driven by new molecules and biosimilars
▪ Diversification: contribution by top 10 molecules will decline to ~30% until 2024 from ~50% in 20206
▪ Novel modalities: cell & gene therapy market with >30% CAGR 2020-20245, complex delivery drives demand for services and viral vectors
▪ Research activity: >9,000 pre-clinical projects in research pipelines7; rising number of experiments backs healthy growth in biotechs/CROs8
▪ Public and private funding: availability, access and predictability drive demand from academia and emerging biotechs
▪ Emerging technologies: high growth technologies for drug discovery and development, e.g. advanced cell culture and AI drug discovery
1 Based on H1 2020, CAGR is organic mid-term ambition; 2 growth rates are organic CAGRs; 3 indicative only; 4 mAbs = monoclonal antibodies; 5 Source: company estimate based on industry forecasts;6 Source: EvaluatePharma; 7 Source: statista; 8 CRO = Contract Research Organization
From: Merck Capital Markets Day 2020 – 2020.09.16

Classification: Public
Life ScienceCritical offering in the fight against COVID-19
PrODUCTS feed into...
VIRUSDETECTION• Leading critical component
provider for Molecular and Serological diagnostic kits
• PCR reagents, kits and tools for all stages of assay development
VACCINE & THERAPYPRODUCTION• Supporting global COVID-19
vaccine and therapy response effort:
• Upstream and downstream research and scaling
• End-to-End solutions
• Biosafety Testing Services
VIRUSCHARACTERIZATION• Offering is among largest biologic
reagents and hardware portfolios
• Effective vaccines and therapies start with reliable virus characterization
• Highest quality reagents needed for understanding of viral attachment, genomics, or proteomics
www.sigmaaldrich.com/covid-19
28From: Merck Q3 2020 earnings call – 2021.03.04

Classification: Public
Life Science: Upside potential for Process Solutions materializing amid increasing capacity; Research Solutions gaining momentum as well
29
Organic growth versus LY by Quarter
Research Solutions
Process Solutions
▪ Strong core business▪ Parts of growth attributable to ongoing
recovery post lock-downs▪ Less than half of growth since Q2
2020 has been COVID-19 related
▪ Successful capacity ramp-up accelerated further
▪ Roughly half of additional growth since Q2 2020 has been COVID-19 related
▪ Strong underlying demand▪ Order intake > +60%
Key factors for 2021 guidance remain:▪ Further progress of capacity expansions & optimizations▪ Sustainable demand growth; both Covid-19 and underlying
Shaded areas represent COVID-19 growth contributions
27%
15% 16%
27%
13%
Q2’19
4%
10%
5%
Q1’19
16%
4%
Q3’19
13%
3%
Q4’19
0%
Q1’20
20%
-7%
Q2’20 Q3’20
16%
Q4’20
38%
24%
Q1’21

Classification: Public
Electronics
05
Leveraging the portfolio shift
Classification: Public
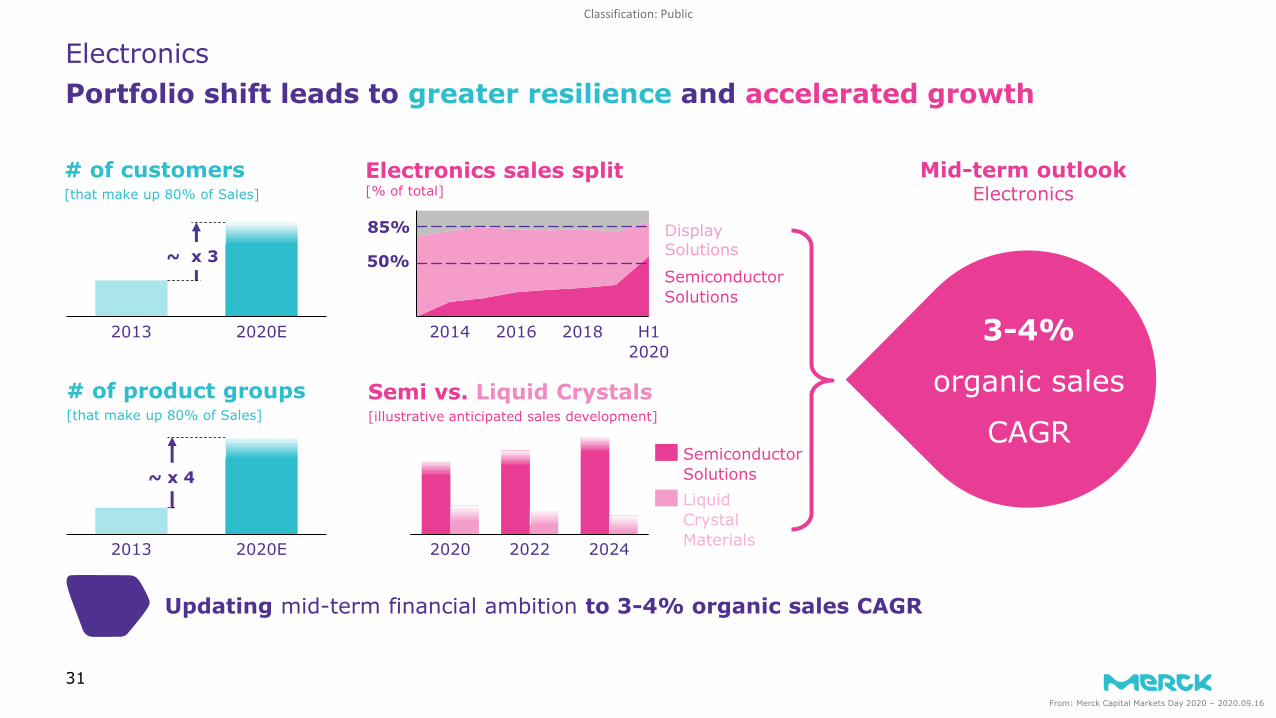
20222020 2024
2014
SemiconductorSolutions
2016 2018 H1 2020
2013 2020E
~ x 3
2013 2020E
~ x 4
Updating mid-term financial ambition to 3-4% organic sales CAGR
ElectronicsPortfolio shift leads to greater resilience and accelerated growth
31
Mid-term outlookElectronics
3-4%
organic sales
CAGR
# of customers [that make up 80% of Sales]
# of product groups [that make up 80% of Sales]
Semi vs. Liquid Crystals[illustrative anticipated sales development]
Electronics sales split[% of total]
85%
50%
SemiconductorSolutionsLiquidCrystalMaterials
From: Merck Capital Markets Day 2020 – 2020.09.16
DisplaySolutions

Classification: Public
56%33%
11%
Electronics Portfolio refocus drives mid-term guidance upgrade to 3 to 4% CAGR
32
2020€ 3.5bn
Semiconductor SolutionsMid- to high single-digit growth
Surface SolutionsLow single-digit growth
Display SolutionsLow single-digit decline
▪ Well balanced exposure to automotive and cosmetics end market▪ Drivers: rising living standards, higher disposable income in growing
markets & higher demand for high value products at reasonable prices▪ Light vehicle production and relevant cosmetics end markets returning
to growth in 2021 and reaching 2019 levels by 2022 and beyond7
Mid-term outlook2 Fundamental growth driversBusiness Split3Sales split1
▪ Continued market growth due to technological advances (Artificial intelligence, 5G, Big Data and cloud, Internet of Things) serving customers in Logic, Memory, Packaging and others
▪ 4 to 6% market growth4
▪ 200 to 300bps above-market growth from share gains & better portfolio (incl. 100 to 150bps additional growth from integration top-line synergies)
▪ Driven by trend to bigger TV size, higher resolutions, more mobile devices
▪ 3 to 4% growth of total LCD m² area5, while price pressure continues▪ 18 to 22% growth of total OLED m² area5 with slight to moderate
market share gains▪ OLED material market to exceed LC material market by 20216
From: Merck Q1 2021 Roadshow Presentation
DS&S
LCOLED
Other
1 Based on FY 2020, CAGR is organic mid-term ambition; 2growth rates are organic CAGRs; 3indicative only4Source: Jan 2020 IC Insights 2018-2024 CAGR for wafer starts in million units; 5Source: Omdia Display Market Outlook, Q1 2020; 6Internal Business Intelligence; 7Sources: LMC Automotive Light Vehicles Forecast, Aug 2020 & Euromonitor BPC (Beauty & Personal Care) Aug 2020

Classification: Public
Electronics5-year transformation program Bright Future is well on track
Cultural change
2018 2019 2020 2021 2022+
Back to organic Growth
Portfolio management
3-4% CAGR1
Resource allocation & process excellence~30% Margin
Cultural change addressed in three dedicated initiatives focused on customer centricity, market-driven innovation and corporate culture
Site closures in Atsugi, Japan (2021) and Chilworth, UK (2019) announced
Outsourcing progressing; reduction of LC production capacity in Darmstadt until 2022 announced
Cost saving measures ahead of plan; target of approx. 500 FTE worldwide until 2022
Acquisition of Versum Materials and Intermolecular successfully closed
Significant changes in composition of leadership team
331New mid-term CAGR guidance starting 2020

Classification: Public
ElectronicsStrategic roadmap materializing
Both transactions successfully closed
Leading supplier of high-purity process chemicals, gases and equipment serving semiconductor manufacturers
Track record of accelerated growth and industry leading profitability
➢ Creating a leading electronic materials player with attractivelong-term prospect
Leading in advanced materials innovation
Acquisition to strengthen semiconductor technology offering
➢ Application specific materials expertise with that perfectly complement Group’s business and technology portfolio
Atsugi
Shut down of Electronics activities at Atsugi site started (to be completed during 2021)
R&D and production activities in Atsugi transferred and consolidated in other PM locations in Asia
Consolidation of site structure in Japan
Bottom-line management to support margin ambition
of 30% in the long-term
Darmstadt
In Darmstadt focus on R&D and production
Immediate bottom line contributionfrom 2019 onwards
Reduce the number of FTEs by ~15%= ~400 FTEs
Chilworth
Chilworth site during September 2019 successfully closed
Measures for a bright future
34

Classification: Public
ElectronicsSuccessful integration drives substantial synergy upgrade and acceleration
35
EBITDA pre impact of synergy ramp-up [€ m]
Original target for 2022 is now being addressed for 2021
*Top-line synergies from cross-selling, new products introductions and overarching initiatives
~50 ~83 ~95
~75
~202040
7530
35
10810
2020 2021 2022
Original cost synergy target
Accelerated & additionalcost synergies
Additional from top-line synergies*
Sources of synergies
Procurement and Supply Chain
• Optimize production andsupply chain network
• Achieve savings through joint procurement
Corporate and Administrative
Functions
• Integrate corporate & administrative functions
• Cost savings due to U.S. company delistings
Business Optimization
• Transform country setup
• Streamline duplicate structures
From: Merck Q4 2020 earnings call – 2021.03.04

Classification: Public
Sustainability
06

Classification: Public
Sustainability strategy enhanced, leveraging strengths with clear commitment to new targets
37
Innovation Power▪ Merck is a leading science and
technology company with curious minds dedicated to human progress
▪ Long track-record in offering innovative products in attractive markets and serving important megatrends
Pioneering Products▪ Well-equipped for developing new
product classes: Portfolio of life-improving products in all businesses
▪ Enabling customers incl. scientists and developers to design next-gen products
Responsible Governance▪ Resilient operations; sustainable
leadership and risk-mitigation approach
▪ Responsibility is in our DNA: reflected by legal form, corporate governance and long history of more than 350 years
Steered & Reviewed▪ Executive Board
▪ Supervisory Board
▪ Corporate Sustainability Committee
Integrated▪ Part of the overall strategy
▪ Linked to steering and operations
▪ Currently built into part of Executive Board compensation system
Communicated▪ Development and reporting of
meaningful KPIs
▪ Annual Report, Sustainability Report
▪ Investor events
Integration
ESG: Environmental, Social, Governance
TargetsWho we are
Goal #1: Dedicated to human progressIn 2030, we will advance human progress for more than 1 bn people through sustainable science & technology.
Goal #2: Creating sustainable value chainsBy 2030, we will integrate sustainability into all our
value chains.
Goal #3: Reducing our ecological footprintBy 2040, we will achieve climate neutrality and reduce
our resource consumption.
▪ Sustainable innovations and technology for our customers
▪ Impact of our technologies and products on health and well-being
▪ Sustainability culture & values
▪ Sustainable and transparent supply chain
▪ Securing our social license to operate in all regions
▪ Climate change & emissions
▪ Water & resource intensity
From: Merck Q4 2020 earnings call – 2021.03.04

Classification: Public
38
Potential to increase sustainable value for business and society
Business opportunities▪ Develop a new range of sustainable products & services,
benefiting from Merck’s innovation power
▪ Open up additional customer groups and expand regional reach
Risk management▪ Reduce risks through higher awareness and longer-term view
▪ Secure supply chain resilience
Partnerships▪ Contribute as supplier of choice to customers’ ESG strategy
▪ Improve ESG impact of our suppliers
▪ Increase depth, meaning, and strategic focus of partnerships
Operations▪ Increase attractiveness as employer
▪ Reduce costs of capital
▪ Benefit from grants and reliefs (politics, insurance, etc.)
▪ Incentivize through integrated compensation schemes
SDGs: Sustainable Development Goals of the United Nations
Goal
and benefitMeRck’s contributionHigh Impact SDGs
Good Health and Well-being
Decent Work and Economic Growth
Industry, Innovation and Infrastructure
Responsible Consumption and Production
Partnerships for the Goals
Where MeRCK can contributeHigh-Impact SDGs
➢Merck is able to contribute with dedicated products, know-how, partnerships and initiatives in pharma, science and technology.
➢Merck ambition of future growth considers health and safety of employees also in the supply chain.
➢Merck’s innovation power will lead to more sustainable products and processes in various industries.
➢Being a responsible supplier, Merck will also challenge suppliers to support in reaching company targets.
➢ To unleash even more power, Merck fosters collaborations with capable partners to sum up know-how for more sustainable impact.
1
3
1
2
1
2
2
3
1
3
ESG: Environmental, Social, Governance
From: Merck Q3 2020 earnings call – 2020.11.12

Classification: Public
Reduce our environmental footprint: Environmental targets 2020 have been achieved, new targets set
39
1versus 2006 baseline, excluding Versum Materials2versus 2014 baseline3versus 2016 baseline4Sites > 70.000 m³/a
Achievements 2020
Water target 2020 achieved!✓ Water use in stressed areas reduced by
27% in 2020 vs. 2014 (planned: 10%)✓ By 2020, all production sites4
successfully implemented sustainable water management system
Emissions target 2020 achieved!✓ 25% overall reduction for
Scope 1 and 2 emissions in 2020 relative to 2006 (planned: 20%)
Waste target ongoing & on track!✓ Based on Merck Waste Score, reduced
environmental impact by 4.6% vs. 2016 (planned: 5% by 2025)
Reduce water in stressed areas
Reduce scope 1+2 emissions
2020 result1:
-25%
2020 target1: -20%
Reduce Merck Waste Score
2020 result2:
-27%
2020 target2: -10%
2020 result3:-4.6%
2025 target3: -5%
New targets from 2021
▪ Aiming for climate neutrality (scope 1 to 3 emissions) by 2040
▪ Lower scope 1 and 2 GHG5
emissions by 50% and to source 80% of purchased electricity from renewable sources until 2030 vs. 2020 baseline
▪ Absolute reduction of 1,500 kt6
scope 3 CO2 equivalents by 2030
▪ Enhancing water efficiency and improve the new Merck water intensity score by 10% by 2025vs. 2019 baseline
▪ Minimize negative environmental impacts, harmful emission residues should be lowered below a scientifically defined threshold by 2030
5GHG = Greenhouse Gas6corresponds to ~30% of 2019 scope 3 emissions (current estimation incl. Versum Materials)
From: Merck Q4 2020 earnings call – 2021.03.04

Classification: Public
Next steps towards achieving ESG targets
40
1ESG: Environmental, Social, Governance2Sustainable Business Value: Dive in deeper and read the research article on the SBV method
AGENDA 2020-2022Analysis of requirements: Strategy, business, regulation, stakeholders
Develop SBV tool2 to measureproduct sustainability value
Build effective data platformfor internal steering
Develop ESG KPIs for reporting
Further incorporate ESG in R&D, controlling, M&A and supply chain
Decide on dedicated investmentsand initiatives to achieve targets
Link ESG1 to board compensation
Dedicated to human progress
Creating sustainable value chains
Reducing our ecological
footprint
2030targets
01Go
al
02Go
al
03Go
al
From: Merck Q4 2020 earnings call – 2021.03.04

Classification: Public
Guidance and Executive summary
07

Classification: Public
Latest COVID-19 assumptions for 2021
Overarching assumptions▪ Increasing vaccination penetration across large populations in all major regions as of summer▪ Global gradual easing of lockdowns to continue; vaccination efforts expected to keep up with virus mutations▪ Overall improvement in the course of 2021 to continue; however, higher degree of forecast uncertainty
Healthcare assumptions▪ Confirm ~ stable organic base business & pipeline sales target, despite
higher uncertainty
▪ Pandemic impact on ramp-ups (particularly still depressed MS dynamic & high efficacy market in Q1 2021) remains a watch out; recent vaccination data expected to accelerate market position of Mavenclad®
▪ Fertility to continue recovery
Life Science assumptions▪ Continued strong additional demand & capacity expansions to support
strong growth in Process Solutions ▪ Research and Applied more volatile and differentiated across customer and
product segments; tailwinds for Research, about neutral effect in Applied
Electronics assumptions▪ Neutral to positive impact on Semiconductor Solutions end markets
▪ Display and Surface Solutions to return to underlying trajectories
42

Classification: Public
Full-year 2021 guidance
43
Net sales: Organic: +10% to +12% YoY
FX: -2% to -4% YoY~€18.5 – 19.5 bn
EBITDA pre: Organic: +16% to +20% YoY (excl Biogen1)
FX: -2% to -4% YoY~€5.4 – 5.8 bn
EPS pre: ~€7.50 – 8.20
1 Q3 20 reversal of the provisions for the patent litigation proceedings for Rebif in the amount of ~€365 m; Guidance including Biogen – organic: +9% to +12%

Classification: Public
Executive Summary
GroupSuccessfully driving
transformation into a leading science and technology company
Growth Engines
Healthcare pipeline, Process Solutions and Semiconductor Solutions will be key drivers
of growth to 2022 and beyond
Steady earnings Growthwith high margins and a low risk profile
Execution
Delivery on strategic priorities ensures profitable growth;
regaining financial flexibility with higher likelihood of
regular bolt-ons post 2022
Setup
Three-pillar structure strengthened further as a
resilient basis; COVID-19 crisis as another proof point
44From: Merck Capital Markets Day 2020 – 2020.09.16

Classification: Public
Appendix

Classification: Public
Group

Classification: Public
Sales• Balanced regional sales split between EU, NA and RoW
Sales• Global presence• ~35% of sales in Europe
Sales• ~75% of sales in Asia-Pacific • Industry is USD-driven
Costs• High cost base in EUR from main manufacturing sites
• HQ costs and large part of R&D costs in EUR
Costs• Extensive manufacturing and research footprint in the U.S.
• Global customer proximity requires broad-based sales force
Costs• Main production sites in NA, APAC and Germany, several R&D and production facilities in Asia
• Improved natural hedge post Versumacquisition
Low High
FX sensitivity per business sector
1Net sales not generated in €; 2Indicative feedthrough of net sales FX impact to EBITDA pre; can vary over time depending on development of FX rates
Low High Low High
Life Science ElectronicsHealthcare
FX impact on EBITDA pre2 FX impact on EBITDA pre2 FX impact on EBITDA pre2
Net Sales currency exposure1 Net Sales currency exposure1 Net Sales currency exposure1
Low HighLow High Low High
From: Merck Q4 2017 Roadshow Presentation
47

Classification: Public
Acquisition history - Strengthening leadership positions
Year Company Volume Sector2021 Amptec n/a Life Science2020 Resolutions Spectra Systems n/a Life Science
2019FloDesign Sonics n/a Life ScienceVersum Materials Inc., USA € 5.8 bn Electronics Intermolecular Inc., USA € 62 m
2017Grzybowski Scientific Inventions Ltd., USA € 7 m & € 1 m Life ScienceNatrix Separations Inc., Canada € 12 m & € 7 m Life ScienceBioControl € 161m Life Science
2015Sigma-Aldrich € 13.1 bn Life ScienceQlight Nanotech Ltd. (Israel) n/a Life ScienceOrmet Circuits Inc. (USA) n/a Electronics
2014 AZ Electronics € 1.9 bn ElectronicsPeer+ n/a
2012 Biochrom AG n/a Life ScienceCellASIC (USA)
2011 Amnis (USA) n/a Life Scienceheipha Dr. Müller GmbH / Hycon branch of Biotest AG n/a
2010 Beijing Skywing Technology (China) € 14.5 m Life ScienceMillipore Corporation (US) € 5.1 bn2009 Taizhu (China) € 26.3 m Electronics
2008 Bio-Fyt Pharma (Belgium) € 30.0 m HealtchareSeQuant € 6.9 m Life Science
2006 Serono (Switzerland) € 10.3 bn HealthcareAgribiotics Holdings (Canada) € 21.9 m Electronics
2005 Survac (Denmark) € 10.8 m HealthcareAvecia (UK) incl. Covion (Germany) € 49.3 m Electronics
48

Classification: Public
Divestment history - Focusing on profitable core areas
Year Company Volume Sector
2020 Allergopharma n/a Healthcare2018 Consumer Health € 3.4 bn Healthcare2018 Flow Cytometry business € 62.5m Life Science2017 Biosimilars 656 m Healthcare2016 Merck Pakistan Healthcare business n/a Healthcare2014 Discovery and Development Solutions € 22.6 m Life Science2012 Mobile Energy Business (Germany) n/a Electronics
2010Crop BioScience Business (USA, CA and Argentina) € 208.2 m
HealthcareThéramex (Monaco and Italy) € 269.3 m
2007 Merck Generics € 4.9 bn Healtchare2006 ITO/CF Business (Taiwan) € 29 m Electronics2005 Electronic Chemicals Business € 270 m Electronics
2004Lab distribution VWR (US) $ 1.68 bn Healthcare50% holding of Biomet-Merck $ 300 m Electronics
49

Classification: Public
Successful crisis management increasingly mitigates pandemic impact
50
▪ Fertility: well managed return to pre COVID-19 levels - not yet all regions▪ Strong Mavenclad® recovery being driven since June▪ Bavencio® UC launch progressing very well on a largely virtual launch▪ General Medicine on track with good volume development
▪ Life Science well positioned for new COVID-19 driven demand trends▪ Process business rapidly addressing new market needs, fueling net upside ▪ Research and Applied driving recovery in Q3
Quarterly Net Sales in €m*
COVID-19Impact
▪ Managing visible recovery in Q3, but not yet growing organically▪ Semiconductors Solutions’ strength within strong market▪ Net downside from COVID-19 in Display and Surface
Underlying developments
Q1’20Q3’19 Q4’19 Q2’20 Q3’20
Healthcare
Life Science
Electronics
* At fixed 2019 FX rates
Guidance upgrade proof point of excellent crisis management and strong business performance
From: Merck Q3 2020 earnings call – 2020.11.12

Classification: Public
-
Merck Group2020 – strong resilience in times of global crisis
51
N&ISemiconductor
Oncology
2020E COVID-19 impact
Fertility
GM&E
Process
Research
Applied
DisplaySurface
+
Merck - steady earnings growth with high margins and a low risk profileCMD 2019
1 Indicative only and based on guidance from August 6: slight to moderate organic sales and EBITDA pre growth, COVID-19 with up to a mid single-digit impact on sales of which 50-60% hitting EBITDA pre
▪ 2020 guidance confirmed; recovery started in June▪ Most businesses growing despite COVID-19▪ Largest business growing and positively affected▪ Smallest businesses with biggest impact
2020
E or
gani
csa
les
grow
th
Growth and COVID-19 impact by business1
Delivery on priorities during crisis
✓ Health & safety of employees✓ Business continuity✓ Contributions to public health and society✓ Sustainability aspects further enforced
✓
From: Merck Capital Markets Day 2020 – 2020.09.16

Classification: Public
2021 business sector guidance1
525252
Healthcare
Life Science
Electronics
Net sales EBITDA pre
Net sales EBITDA pre
Net sales EBITDA pre
▪ Organic:+12% to +15% YoY (excl Biogen2)
▪ FX: -5% to -7% YoY▪ ~€2,000 – 2,100 m
▪ Organic: +7% to +10%▪ Mainly driven by
Mavenclad®, Bavencio® and recovery of Fertility
▪ Base business organically around stable
▪ Organic:+9% to +12% YoY▪ FX: -3% to -5% YoY▪ ~€1,050 – 1,130 m
▪ Organic:+22% to +26% YoY▪ FX: -1% to -3% YoY▪ ~€2,850 – 3,000 m
▪ Organic: +15% to +18%▪ Process Solutions as main growth
driver
▪ Organic: +5% to +7%▪ Strong Semiconductor Solutions
contribution, subject to quarterly DS&S project phasing
▪ OLED with high growth1Buiness Sector guidances are only support to the group guidance and do not have to add up; 2 Q3 20 reversal of the provisions for the patent litigation proceedings for Rebif in the amount of ~€365 m; Guidance including Biogen – organic: -4% to -6%
Classification: Public
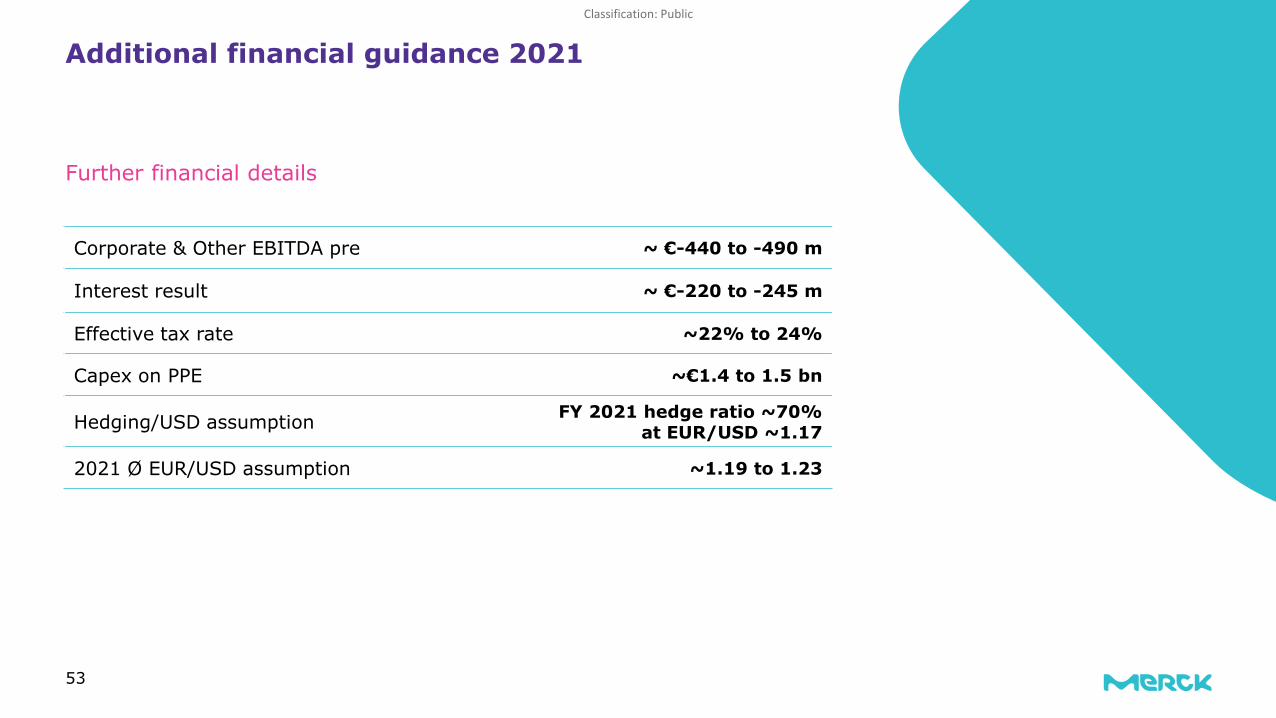
Additional financial guidance 2021
Further financial details
53
Corporate & Other EBITDA pre ~ €-440 to -490 m
Interest result ~ €-220 to -245 m
Effective tax rate ~22% to 24%
Capex on PPE ~€1.4 to 1.5 bn
Hedging/USD assumption FY 2021 hedge ratio ~70%at EUR/USD ~1.17
2021 Ø EUR/USD assumption ~1.19 to 1.23

Classification: Public
25.2% 25.4% 24.2% 24.0%
0.0%
10.0%
20.0%
30.0%
40.0%
2018 2019 2020 2021
Old guidance range ~24 - 26%
Reported tax rate
Tax rate development 2018-2020 and from 2021 onwards
New guidance range ~22 - 24% Rationale for update
Strong profit growth in Life Science results in different profit contributions worldwide, leading to a lower overall tax rate
54
Underlying tax rate guidance lowered to new range of 22% to 24%
Classification: Public
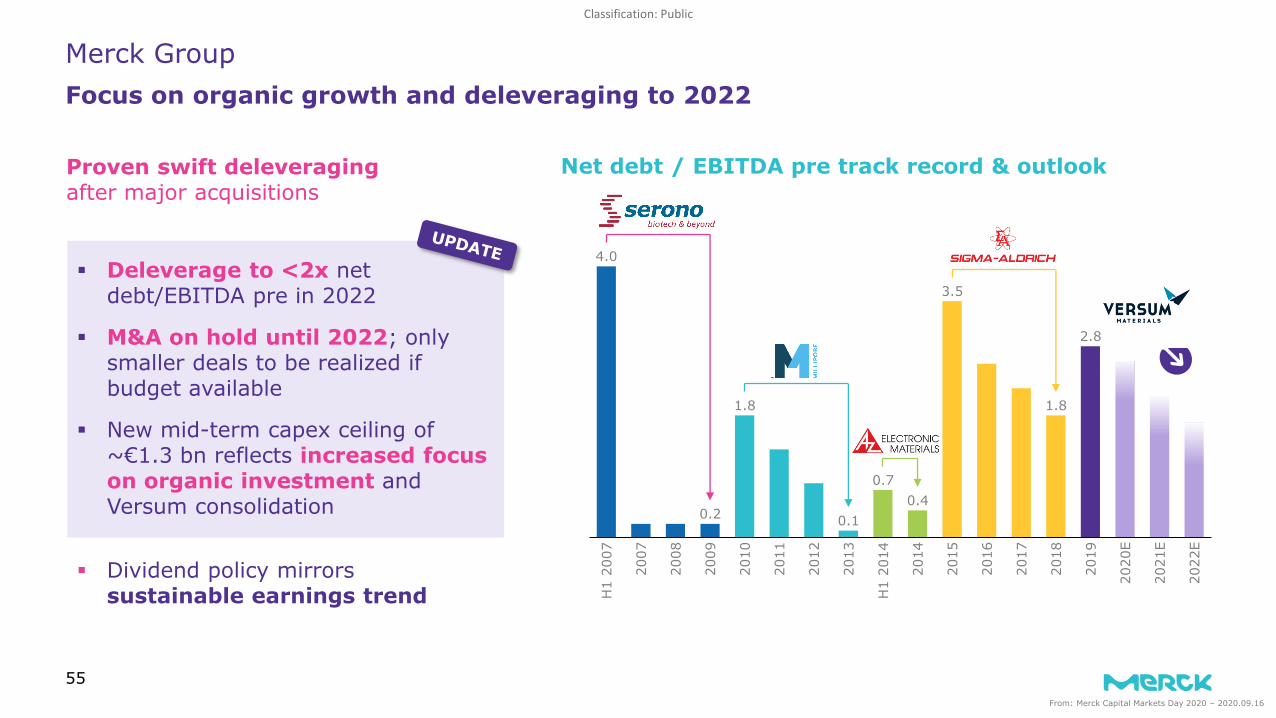
Merck GroupFocus on organic growth and deleveraging to 2022
55
Proven swift deleveraging after major acquisitions
▪ Deleverage to <2x net debt/EBITDA pre in 2022
▪ M&A on hold until 2022; only smaller deals to be realized if budget available
▪ New mid-term capex ceiling of ~€1.3 bn reflects increased focus on organic investment andVersum consolidation
▪ Dividend policy mirrors sustainable earnings trend H
1 20
14
2014
2015
2016
2017
2018
2019
2008
H1
2007
2021
E
2022
E
2007
2009
2010
2013
0.1
1.8
2011
0.2
2012
4.0
1.8
0.70.4
3.5
2.8
2020
E
Net debt / EBITDA pre track record & outlook
From: Merck Capital Markets Day 2020 – 2020.09.16

Classification: Public
56
1.00 1.051.20 1.25 1.25 1.30
1.40
2014 2015 2016 2017 2018 2019 2020
▪ Dividend of €1.40 (+8% YoY) per share proposed1 for 2020
▪ Payout ratio of 23.1% of EPS pre2 in 2020; aiming for 20-25% of EPS pre
▪ Dividend yield3 of 1.0%
Dividend1 development 2014 -2020 2020 dividend
1
1Final decision is subject to Annual General Meeting approval
2Excluding Biogen provision release, including the provision release the ratio is 20.9%
3Calculated with 2020 year-end share price of € 140.35 per share.
Sustainable dividend growth
From: Merck Q4 2020 earnings call – 2021.03.04

Classification: Public
Merck‘s ownership structure
57
Governance
30% 70%
▪ Shareholders hold ~30% of Merck KGaA’s total capital▪ Share capital is divided into 129,242,252 bearer shares
and one name share without nominal value ▪ Listed at German Stock Exchange’s Prime Standard,
member of the DAX 30▪ Only bearer shares entitled to vote at Merck’s Annual
General Meeting: one share, one vote
Its Chairman leads AGM, representing interests of Merck’s shareholders:▪ Approving financial statements of Merck KGaA▪ Working together with Executive Board, receiving
reporting on progress regarding business and financial development at Merck, Containing 16 members: 8 employee representatives, 8 independent representatives (2 family representatives and 6 elected shareholder representatives)
▪ 2 committees: Nomination and Audit Committee
▪ E. Merck KG (99.9% Merck Family) holds ~70% of Merck KGaA’s total capital
▪ These 70% of the total capital are not entitled to vote at Merck’s AGM
▪ A Family Board represents the entrepreneurial interests of the Merck family (elected by partners’ meeting)
Elected by Family Board, and takes over some duties of a usual Supervisory Board:▪ Appointment, dismissal and supervision of Executive
Board members of Merck KGaA▪ Approves extraordinary business transactions and annual
financial statements of E. Merck KG▪ Contains 5 members of the Family Board and 4
external members of the business community▪ 3 committees: Finance, Personnel and R&D
Committee
Shareholders of Merck KGaA
E. Merck KG: Partners‘ Meeting & Family Board
Supervisory Board
Board of Partners
Nomination CommitteeDefines criteria and makes
proposals for new candidates
Audit CommitteeControl systems, external
auditing, financial statements
Finance Committeefinancial statements,
external auditing
Personnel CommitteeExecutive board members, contracts, compensation
R&D Committeeresearch activities of all
sectors: HC, LS, EL
Family Board: Familienrat; Board of Partners: Gesellschafterrat; Supervisory Board: Aufsichtsrat; Nomination Committe: Nominierungsausschuss; Audit Committee: Prüfungsausschuss: Finance Committee: Finanzausschuss; Personell Committee: Personalausschuss; R&D Committee: Forschungs- und Entwicklungsausschuss
From: Merck SRI presentation – 2021.03
Classification: Public
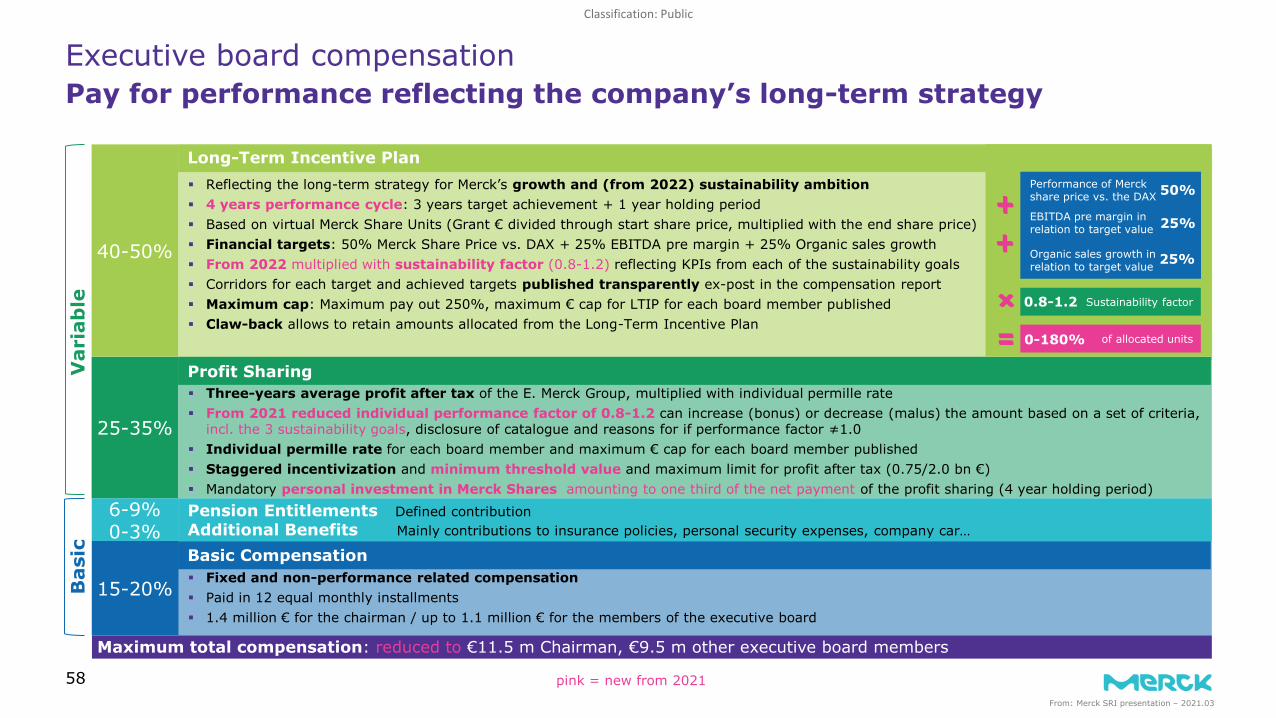
Merck Long-Term Incentive Plan▪ Reflecting the long-term strategy for Merck’s growth and (from 2022) sustainability ambition▪ 4 years performance cycle: 3 years target achievement + 1 year holding period▪ Based on virtual Merck Share Units (Grant € divided through start share price, multiplied with the end share price)▪ Financial targets: 50% Merck Share Price vs. DAX + 25% EBITDA pre margin + 25% Organic sales growth▪ From 2022 multiplied with sustainability factor (0.8-1.2) reflecting KPIs from each of the sustainability goals▪ Corridors for each target and achieved targets published transparently ex-post in the compensation report▪ Maximum cap: Maximum pay out 250%, maximum € cap for LTIP for each board member published▪ Claw-back allows to retain amounts allocated from the Long-Term Incentive Plan
Executive board compensationPay for performance reflecting the company’s long-term strategy
58
Profit Sharing▪ Three-years average profit after tax of the E. Merck Group, multiplied with individual permille rate▪ From 2021 reduced individual performance factor of 0.8-1.2 can increase (bonus) or decrease (malus) the amount based on a set of criteria,
incl. the 3 sustainability goals, disclosure of catalogue and reasons for if performance factor ≠1.0▪ Individual permille rate for each board member and maximum € cap for each board member published▪ Staggered incentivization and minimum threshold value and maximum limit for profit after tax (0.75/2.0 bn €)▪ Mandatory personal investment in Merck Shares amounting to one third of the net payment of the profit sharing (4 year holding period)
Pension Entitlements Defined contributionAdditional Benefits Mainly contributions to insurance policies, personal security expenses, company car…
Basic Compensation▪ Fixed and non-performance related compensation▪ Paid in 12 equal monthly installments▪ 1.4 million € for the chairman / up to 1.1 million € for the members of the executive board
40-50%
25-35%
15-20%
Var
iab
leB
asic
6-9%0-3%
Maximum total compensation: reduced to €11.5 m Chairman, €9.5 m other executive board members
Long-Term Incentive Plan
Profit Sharing
Basic Compensation
Performance of Merck share price vs. the DAX 50%
EBITDA pre margin in relation to target value 25%
Organic sales growth inrelation to target value 25%
Sustainability factor0.8-1.2
of allocated units0-180%
pink = new from 2021From: Merck SRI presentation – 2021.03

Classification: Public
59
External stakeholders assess our engagement
In 2019, the Merck share was again included in STOXX Global ESG Leaders Index,a sustainability index basedon key environmental, social and governance criteria.
Merck has been reconfirmedas a constituent of the Ethibel Sustainability Index (ESI) Excellence Europe since May 2020, based on VigeoEiris.
Merck for the second time received platinum status in 2021, among the top 1% of companies. EcoVadisannually examines ~75,000 suppliers from 160 countries.
CDP Climate: In 2020,we scored “B” (2019: C).CDP Water: In 2020, we received a “B” (2019: B).
In the 2021 Access to Medicine Index Merck ranked eighth place. We were recognized for our performance in R&D, where we ranked fifth.
As of 2020, Merck received an MSCI ESG* Ratingof AAA.
*Environment, Social, Governance
2021, we received an ESG Risk Rating of 19.5 and Sustainalytics: low risk of experiencing material financial impacts from ESG factors.
Since 2008, Merck is partof FTSE4Good Index, measuring the performance of companies with strong ESG practices (top 15).
In 2020, Merck has once more achieved prime status by ISS Oekom.
Copyright ©2020 Sustainalytics. All rights reserved. This presentation contains information developed by Sustainalytics. Such information and data are proprietary of Sustainalytics and/or its third party suppliers (Third Party Data) and are provided for informational purposes only. They do not constitute an endorsement of any product or project, nor an investment advice and are not warranted to be complete, timely, accurate or suitable for a particular purpose. Their use is subject to conditions available at https://www.sustainalytics.com/legal-disclaimers.
Copyright MSCI: The use by Merck of any MSCI ESG Research LLC or its affiliates (“MSCI”) data, and the use of MSCI logos, trademarks, service marks or index names herein, do not constitute a sponsorship, endorsement, recommendation, or promotion of Merck by MSCI. MSCI services and data are the property of MSCI or its information providers, and are provided “as-is” and without warranty. MSCI names and logos are trademarks or service marks of MSCI.
From: Merck SRI presentation | Mar, 2021

Classification: Public
▪ Supporting profitable growth strategy
▪ IRR > WACC▪ EPS pre accretive ▪ Maintain investment grade rating
▪ Acquisitions and divestments are part of Merck’s history
▪ Licensing and partnershipsremain on our agenda
▪ All prior transactions earned their cost of capital
▪ Three strong pillars with no business marginalized
▪ Leading market positionin attractive markets
▪ Focus on innovation and sustainability through science and technology
Merck GroupRegular portfolio review remains key to success
60
✓ ✓ ✓
Current set-up is strong and organic investment opportunities are attractive
Expect to regain financial flexibility by 2022 to pursue external growth opportunities
Targeted and more regular bolt-on approach more likely than large transformative deals
Strong track record
Defining portfolio guard rails
Clear financial M&A criteria
From: Merck Capital Markets Day 2020 – 2020.09.16

Classification: Public
Life Science demand drives particularly strong growth in North America and Asia-Pacific
Q1 2020 Regional breakdown of net sales [€m]
▪ APAC: strong Life Science and Healthcare growth while Electronics ~ stable with Semi offsetting Display
▪ Europe: Growth in Process & Research Solutions more than compensates Healthcare decline largely in CM&E
▪ North America: growth across all three sectors, particularly strong Life Science and Bavencio® performance
▪ LATAM growth driven foremost by Fertility and Bavencio®
▪ CM&E is the largest growth driver in ME&A
Regional organic development
Middle East & Africa
Asia-Pacific
Europe
Latin America
North America
+4.7%org.
+12.9%org.
+9.9%org.
+12.0%org.
+20.0%org.
36%
5%
27%
3%
29%
Q1 2021Net sales:€4,631 m
61 Totals may not add up due to rounding

Classification: Public
Organic Currency Portfolio Total
Healthcare 3.5% -5.9% -1.2% -3.6%
Life Science 26.7% -6.2% 0.0% 20.4%
Electronics 0.2% -4.5% 0.0% -4.3%
Group 12.2% -5.8% -0.4% 6.0%
▪ 22% org. growth in Fertility and 20% org. growth in Oncology more than compensate for N&I decline (-4% org.) amid depressed dynamic market and VBP impact in CM&E1 (-4% org.)
▪ Record Life Science organic growth driven by all business units with Process Solutions up +38%; Research elevated to +24%; Applied Solutions delivers 8% organic growth
▪ Electronics about stable as Semiconductor Solutions growth (+4% org.) and recovering Surface Solutions (+5% org.) are offsetting decline in Display (-7% org.)
▪ Organic EBITDA pre growth three times faster than sales growth
▪ Strong Life Science gross profit further boosted by Bavencio® milestones and continued cost discipline in all sectors
▪ FX burden of -8% across various currencies with largest negative impact from USD, BRL and JPY; partly mitigated by hedging
Q1 YoY Net Sales Q1 YoY EBITDA pre
Totals may not add up due to rounding
CurrencyQ1 2020 Organic Portfolio Q1 2021
€1,181 m
36.3%
-8.3% -0.1%€1,511 m
27% organic growth in Life Science, moderate Healthcare growth & stable Electronics drive very strong organic Group sales and EBITDA pre growth
62
1 Cardiovascular, Metabolism and Endocrinology (new Franchise name as of Q1 2021)

Classification: Public
Balanced maturity profile: Lower refinancing risks & higher flexibility
63
Maturity profile as of March 31, 2021
550 600 750 600 750 800
1,000
1,600
317500
1 000 1,000
2021 2022 2023 2024 2025 2026 2027 2028 2029 2030 2031
EUR bonds USD bonds Hybrids (first call dates)
2.625%
1.625%3.375%
2.950%1.375%
3.250%0.125%
Coupon
[€ m/US $ m]
0.005% 0.375%
2.875%
0.875%
5000.500%
1.625%
1No decision on call rights taken yet
1

Classification: Public
Q1 2021: Overview
Totals may not add up due to rounding64
Net sales
Q1 2020
4,370
EBITDA pre
EPS pre
Operating cash flow
Q1 2021 Δ
4,631 6.0%
1,181 1,511 27.9%
1.50 2.18 45.3%
516 1,216 135.4%
▪Net sales growth of 6% driven by 12% organic growth and FX burden of -6%
▪ EBITDA pre increase, driven particularly by operating leverage in Life Science further boosted by Bavencio® milestones
▪ EPS pre driven by EBIT pre growth, supported by better financial result & lower effective tax rate
▪Operating cash flow more than doubles, largely driven by strong EBITDA pre growth and favorable net working capital
▪ Significant reduction of net financial debt
Comments
[€m]
Margin (in % of net sales) 27.0% 32.6%
Net financial debt 10,758
Working capital
Employees
Δ
10,081 -6.3%
3,938 4,231 7.4%
58,096 57,933 0.0%
Dec. 31, 2020
Key figures
[€m] March 31, 2021

Classification: Public
716 1,043 45.7%
-98 -59 -40.0%
617 984 59.4%
-159 -236 48.1%
25.8% 24.0%
456 747 63.7%
1.05 1.72 63.8%
Q1 2021: Reported figures
EBIT▪ Strong performance across all sectors
particularly in Life Science drives 46% EBIT growth
▪ Reduced interest expense and lower LTIP provisions drive improved financial result
▪ Effective tax rate at the higher end of the new guidance range
▪ EBIT growth, improved financial result and lower tax rate drive higher net income & EPS
Comments
Financial result
Profit before tax
Income tax
Effective tax rate
Net income
EPS (€)
Reported results
Totals may not add up due to rounding
Q1 2020 Q1 2021 Δ
65
[€m]

Classification: Public
458 748 290
431 424 -7
16 -34 -50
-23 160 183
-10 6 16
-356 -88 267
516 1,216 700
-288 -346 -58
-337 -309 29
542 6 -536
Cash flow statement
Profit after tax
Q1 2020 Q1 2021 Δ ▪ Strong increase in profit after tax driven particularly by Life Science, further boosted by Bavencio® milestones
▪ Provisions largely reflect various favorable developments in litigation positions
▪ Contribution from other assets/liabilities largely explained by tax positions
▪ Working capital upside mainly driven by higher payables (Q4 2020 phasing effect)
▪ Delta in investing cash flow primarily explained by divestment of Allergopharma in Q1 2020
▪ Capex driven foremost by Life Science capacity expansions
Cash flow drivers
D&A
Changes in provisions
Changes in other assets/liabilities
Other operating activities
Changes in working capital
Operating cash flow
Investing cash flow
thereof Capex on PPE
Financing cash flow
[€m]
Q1 2021 – cash flow statement
Totals may not add up due to rounding66

Classification: Public
-27 2 10 0
11 0 14 0
35 0 17 3
17 0 6 0
36 2 47 3
Adjustments in Q1 2021
Q1 2020
Adjustments
[€m]
Healthcare
Life Science
Electronics
Corporate & Other
Total
EBIT Adjustments
thereof D&A
Q1 2021
Adjustments thereof D&A
67
Classification: Public
68
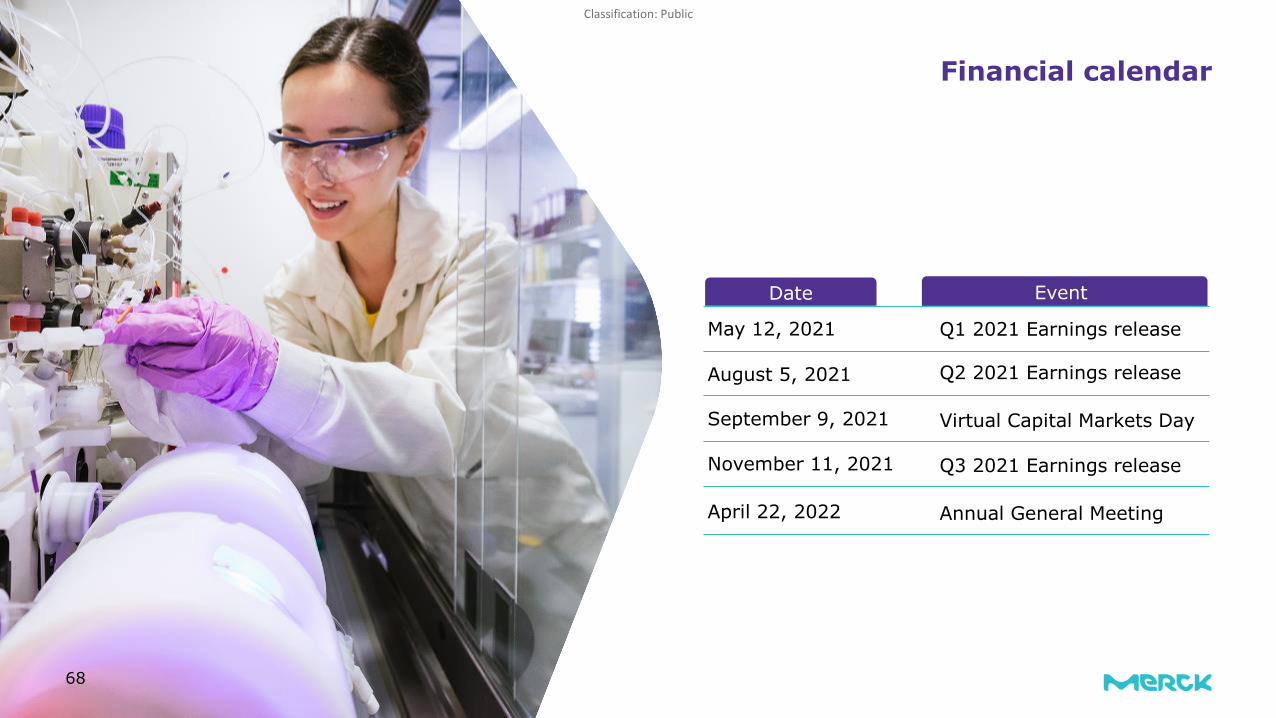
Financial calendar
EventDate
Q1 2021 Earnings release
Virtual Capital Markets Day
Q2 2021 Earnings release
Q3 2021 Earnings release
August 5, 2021
September 9, 2021
May 12, 2021
November 11, 2021
Annual General MeetingApril 22, 2022

Classification: Public
Healthcare

Classification: Public
70From: Merck Q4 2020 earnings call – 2021.03.04
20202019 2021
1: hospital market for bisoprolol and metformin makes up ~70% of total market, this includes urban hospitals, rural hospitals, and community health centers; 2: Concor® price cut in the high single digit %; 3: alliance products; Acronyms: VBP = Volume-Based Procurement
July: Round 3 announced (incl. Metformin IR and XR)1
December: Round 2 announced (incl. bisoprolol)
April: Round 2 winners granted exclusive access to 60% of total hospital market1, non-winners (incl. Concor®) retain access to remaining 40% of hospital market at a gradient price cut2 + can freely compete in non-hospital/ retail market
Round 3
August: Bidding completed, 8 winners (all Chinese manufacturers), Glucophage® not among winners
▪ Access retained to non-hospital/retail market (~30% of total market), and ~20% of the hospital market (at gradient price cut)
▪ Continued growth of Chinese metformin market >10% p.a. over the next 5 years
Round 2Round 1
China Glucophage sales represent only ~8% of the total base business (2020 net sales)Sustained confidence in approx. stable base business (org.) through 2021 and 2022
China‘s VBP: Round 4 bidding recently completed, sustained confidence in keeping base business approx. stable through 2021 and 2022
Jan: Round 4 announced (incl. calcium dobesilate3 and canagliflozin3), bidding completed on Feb 3, Invokana® & Doxium ®
not among winners, Implementation starts from late April/May subsequentially
Round 4
March: First round initiated, no Merck products impacted

Classification: Public
71From: Merck Q4 2020 earnings call – 2021.03.04
Healthcare pipeline May 12, 2021
Pipeline products are under clinical investigation and have not been proven to be safe and effective. There is no guarantee any product will be approved in the sought-after indication.
berzosertibATR inhibitorSmall-Cell Lung Cancer3
tepotinibMET kinase inhibitorMetastatic Colorectal CancerRAS/BRAF wt, MET amplified4
tepotinibMET kinase inhibitorNon-small cell lung cancer,EGFR mutant, MET amplified5
bintrafusp alfaTGFbeta trap/anti-PD-L1Non-small cell lung cancer 1L/2L
bintrafusp alfaTGFbeta trap/anti-PD-L1Locally advanced non-small celllung cancer
Phase II
bintrafusp alfaTGFbeta trap/anti-PD-L1Cervical cancer 1L
M6223anti-TIGIT mAbSolid tumors2
M5049TLR7/8 antagonistSystemic lupus erythematosus /Cutaneous lupus erythematosus
M5717PeEF2 inhibitorMalaria
Phase I
M1231Bispec. MUC1xEGFR ADCSolid tumors
M1774ATR inhibitorSolid tumors
peposertibDNA-PK inhibitorSolid tumors1
Neurology
Oncology
Immunology
Immuno-Oncology
Global Health
Phase III
Registration
tepotinibMET kinase inhibitor Non-small cell lung cancer,METex14 skipping7,8
bintrafusp alfaTGFbeta trap/anti-PD-L1Biliary tract cancer 1L
bintrafusp alfaTGFbeta trap/anti-PD-L1Cervical cancer 2L
bintrafusp alfaTGFbeta trap/anti-PD-L1Triple negative breast cancer(HMGA2 positive)
M5049TLR7/8 antagonistCOVID-19 pneumonia
xevinapantIAP inhibitorLocally advanced squamous cell carcinoma of the head and neck6
avelumabanti-PD-L1 mAbNon-small cell lung cancer 1L
evobrutinibBTK inhibitorRelapsing multiple sclerosis
avelumabanti-PD-L1 mAbUrothelial cancer 1L-M9,10
ADC: Antibody Drug Conjugate; Bispec.: bispecific; 1L: first-line treatment; 1L-M: first-line maintenance treatment; 2L: second-line treatment;1 Study in combination with avelumab. 2 Includes study in combination with bintrafusp alfa. 3 Includes studies (phase I/II) in collaboration with/ sponsored by external partners, e.g. NCI. 4 In combination with cetuximab. 5 In combination with osimertinib. 6 On March 01, Merck announced a worldwide in-licensing agreement with Debiopharm, Switzerland, for the development and commercialization of xevinapant(Debio 1143). 7 As announced on February 03, 2021, the US Food and Drug Administration (FDA) has approved tepotinib for the treatment of adult patients with metastatic non-small cell lung cancer (NSCLC) harboring mesenchymal-epithelial transition (MET) exon 14 skipping alterations. This indication is approved under accelerated approval based on overall response rate and duration of response. Continued approval for this indication may be contingent upon verification and description of clinical benefit in confirmatory trials. 8 As announced on November 26, 2020, the European Medicines Agency (EMA) has validated for review the application for tepotinib for the treatment of adult patients with advanced non-small cell lung cancer. 9 As announced on January 25, 2021, the European Commission (EC) has approved avelumab as monotherapy for the first-line maintenance treatment of adult patients with locally advanced or metastatic urothelial carcinoma. 10 As announced on February 24, 2021, Japan’s Ministry of Health, Labor and Welfare (MHLW) has approved a new indication for avelumab as a first-line maintenance treatment for advanced bladder cancer.Additional information: Several combination studies (phase II) of avelumab with talazoparib, axitinib, ALK inhibitors or chemotherapy ongoing under sponsorship of Pfizer.
Unless noted otherwise, clinical programs conducted in collaboration with external partners are not shown unless Merck has co-ownership of data. In such case the indication is shown in Italics.

Classification: Public
XevinapantPotential to become standard of care in core area for Merck
Internal ExternalCo-Development
InternalExternal
Bintrafusp alfa(anti-PD-L1/TGFβ Trap)
Bavencio®
(Avelumab)Tepotinib (MET kinase inhibitor)
M5049 (TLR7/8 antagonist)
Evobrutinib(BTK-inhibitor)
M6223 (anti-TIGIT)
M1231 (Anti-MUC1/ EGFR ADC)2
Sonelokinab/M1095 (Anti IL-17
Nanobody®)4
Selected DDR assets (incl. M6620/Berzosertib)
Adenosine A2aR/A2bR inhibitor1
Development
Selected DDR assets (incl. M3814/Peposertib)
M9831 (formerly VX984)3
PI3K delta inhibitor
Discovery
Co-D
iscovery
Oncology
Immuno-Oncology
Immunology
Neuro-degenerative
discovery projects
Xevinapant(IAP5 antagonist)
Worldwide xevinapant in-licensing builds on leadership in head and neck
1. Strategic fit
2. Exploitability
3. Clinical & commercial competencies
Chart originally presented in 2020 R&D update call; selected, non-exhaustive examples
72
1: In 2017, Domain Therapeutics and Merck entered into a collaboration and licensing agreement for the development of adenosine receptor antagonist drugs specifically designed for oncology and immuno-oncology; 2: In 2014, Sutro and Merck initiated a collaboration to discover and develop ADCs utilizing Sutro’s cell-free protein synthesis platform, Xpress CF+™. Merck is responsible for drug product, clinical development and commercialization of any resulting products; 3: In 2019, an exclusive license was granted to Vertex for the use of M9831 in gene-editing applications; 4: Avillion conducted Ph II of M1095 in Psoriasis, Merck decided to out license sonelokinab to a new partner to initiate Phase III development in 2021 5: Inhibitor of Apoptosis Proteins
From: Merck Q4 2020 earnings call – 2021.03.04

Classification: Public
Xevinapant (Debio 1143)Potentially first in class oral IAP antagonist with FDA BTD
▪ Oral Inhibitor of Apoptosis Proteins (IAP) antagonist: chemo-/radio-sensitizer & enhancer of anti-tumor immunity
▪ IAP antagonists tackling two cancer hallmarks:
▪ Enhancing anti-tumor immunity
▪ Lowering threshold for tumor cell death
▪ Improvement in OS statistically significant and clinically meaningful: HR 0.49 (0.26–0.92); p=0.0261
▪ Clinically compelling PFS improvement: HR 0.34 (0.17–0.68); p=0.0023
▪ Predictable and manageable safety profile without substantial additional toxicity to standard CRT
OS at 3 years1.0
0.6
0.4
0
0.8
0
Overall survival duration (months)
52
0.2
10 20 30 402 4 6 8 12141618 22242628 323436 38 42444648
66%
51%
2years
1year 3
years4
years
50
Xevinapant
Placebo
PFS at 3 years1.0
0.6
0.4
0
0.8
0
PFS duration (months)
52
0.2
10 20 30 402 4 6 8 12141618 22242628 323436 38 42444648
72%
36%
2years
1year
3years
4years
50
Kap
lan
-Mei
er e
stim
ate
73
Acronyms: BTD = Breakthrough Therapy Designation; IAP = Inhibitor of Apoptosis Proteins; 1: Debiopharm; 2: ESMO 2020 - Late Breaking Abstract 39 - 3-years follow-up of double-blind randomized phase II comparing concurrent high-dose cisplatin chemo-radiation plus xevinapant or placebo in high-risk patients with locally advanced squamous cell carcinoma of the head and neck
Mode of Action1 Compelling Phase 2 data2 published in The Lancet Oncology, and presented at ESMO 2020

Classification: Public
Upfront payment ~ €190 m Largest part to be capitalized as an intangible asset
Approvalmilestones Up to ~ €380 m1 To be paid and capitalized as an intangible asset upon approval and to be
amortized once asset is ready for use
Commercialmilestones Up to ~ €330 m To be paid and capitalized as an intangible asset, based on sales
thresholds and to be amortized over remaining useful life
Sales n/a Merck to recognize sales globally (incl. US)
R&D Costs n/a
For ongoing TrilynX study▪ Cash view: 50/50 cost sharing▪ P&L view: fully shown in Merck P&L2nd study for cisplatin-ineligible patients: Merck incurs 100% of cost
Royalties n/a Merck to pay industry-typical sales royalty to Debiopharm
XevinapantTotal deal-volume of up to ~ €900 m and industry-typical sales royalties
Payment type Amount (in €) Accounting treatment2
74
1 thereof up to ~€300 m for focus H&N indications) 2 final accounting treatment is still subject to alignment with auditors
From: Merck Q4 2020 earnings call – 2021.03.04

Classification: Public
Two Phase III studies are designed to target the majority of unresectable LA SCCHN patients receiving systemic therapy + RT
Xevinapant (Potentially first in class oral IAP antagonist)
RegistrationalPhase III
TrilynX study(NCT04459715)
Additional registrational
Phase III study
2020 2021 2022 … 2025 …
Initiated in September 2020;Potential launch in 2025
To be started in late 2021/ early 2022
▪ Cisplatin-eligible LA SCCHN ▪ Xevinapant + cisplatin/RT▪ 700 patients
▪ Cisplatin-Ineligible LA SCCHN▪ Currently being planned
1
2
20,000+ unresectable LA SCCHN patients in US and EU-5 each
Blockbuster potential provided success of both studies
75

Classification: Public
76
Explore EGFR resistance in CRC –Tepotinib + Erbitux® combo(NCT04515394)
• Opportunity for Tepotinib to address an unmet need in metastatic colorectal cancer (mCRC) together with Erbitux®
• Highly competitive data set presented at ASCO 2020 and published in New England Journal of Medicine in May 2020 (99 patients with a follow up ≥9 mths)
• First-in-class launch1 in Japan2 in March 2020, Sakigake designation3 granted in 2018• Approval by US FDA1 received on February 3, 2021
Tap into a Growing Opportunity in NSCLC –EGFRmut/ METamp(INSIGHT 2 study, NCT039407032-5% of total NSCLC population)
• Increased EGFRm detection with testing and treatment moving into earlier lines of therapy (ADAURA trial demonstrates a 79% reduction in the risk of death with Osimertinib in the adjuvant setting (ASCO 2020), suggesting an even greater uptake of Osimertinib)
• METamp as the primary driver of resistance - Some publications suggest that METamp resistance post-Osimertinib could be ~25%4
Lay the Foundation in NSCLC – MET Exon14 (VISION study, NCT028649923-5% of total NSCLC population)
1: approved for both treatment naïve and previously treated METex14 positive NSCLC patients; 2: second largest Oncology market globally; 3: SAKIGAKE designation promotes research and development in Japan, aiming at early practical application for innovative pharmaceutical products; 4: Piotrowska et al., “Landscape of Acquired Resistance to Osimertinib in EGFR -Mutant NSCLC and Clinical Validation of Combined EGFR and RET Inhibition with Osimertinib and BLU-667 for Acquired RET Fusion”, AACR Cancer Discovery 2018; Acronyms: CRC = Colorectal cancer; EGFR = Epidermal Growth Factor Receptor; NSCLC = Non-small cell lung cancer
Tepotinib (MET kinase inhibitor)First-in-class launch in MET Exon14 sets foundation for EGFRm/METamp opportunity and exploration in other tumor types

Classification: Public
77
Tepotinib (MET kinase inhibitor)Tapping into the rapidly evolving EGFRmut/METamp market –Encouraging INSIGHT 1 data
INSIGHT 2 – Tepotinib + Osimertinib in Osimertinib Relapsed METamp NSCLC
• Study design recently amended to reflect evolved and future standard of care:− Target population – Inclusion criteria adjusted to focus
solely on 1L Osimertinib failures− Testing - Streamline patient enrollment based on
current gold standard method (TBx FISH)− Increasing METamp prevalence - Some publications
suggest that METamp resistance post-Osimertinib could be ~25%1
• Estimated primary completion date: November 2022
Tepotinib + Erbitux® (Cetuximab) -Adressing a significant medical need in 2L
metastatic colorectal cancer (mCRC)
• Opportunity for Tepotinib to address an unmet need in CRC together with Erbitux®
• Estimated primary completion date: March 2023
A solid foundation - Encouraging INSIGHT 1 data (18-months follow-up presented at WCLC 2019)2
Proof of Concept: MET amplification can be considered a suitable biomarker for treatment with Tepotinib
Safety: generally well-tolerated, most adverse events mild to moderate
Endpoint Tepotinib + gefitinib Chemotherapy
Primary - PFS(HR 0.13 [90% CI 0.04, 0.43])
16.6 m 4.2 m
Secondary - ORR (OR 2.67 [90% CI 0.37, 19.56])
66.7% 42.9%
Secondary - OS(HR 0.09 [CI 0.01, 0.54])
37.3 m 13.1 m
1: Piotrowska et al., “Landscape of Acquired Resistance to Osimertinib in EGFR -Mutant NSCLC and Clinical Validation of Combined EGFR and RET Inhibition with Osimertinib and BLU-667 for Acquired RET Fusion”, AACR Cancer Discovery 2018; 2: Wu et al., „Long term outcomes to tepotinib plus gefitinib in patients with EGFR mutant NSCLC and MET dysregulation: 18 month follow up“, presented at WCLC 2019; Acronyms: FISH = Fluorescence in situ hybridization; TBx = Tissue Biopsy

Classification: Public
78
Newly diagnosed metastatic UC cases/ year in the US: ~20kEU5: ~29kJapan: ~9k
UC 1L maintenance treatment achieving transformative OS benefit (31% reduction in risk of death, 7 months increase in median overall survival)
1: Kantar Health Patient Metrics & Kantar Health Treatment Architecture for epidemiological data; IMS Claims, Kantar and IPSOS for triangulation of market shares
Bavencio® (Avelumab) – Urothelial Carcinoma (UC 1L)
Platinum eligble:
US: ~17kEU5: ~25k
JP: ~8k85%
Carboplatin or Cisplatin 1L treatment:
US: ~8.5kEU5: ~21k
JP: ~7k
US: ~70%
Other chemotherapy or
Immuno-Oncology (IO) montherapy
Complete or partial response, or stable disease; eligble for maintenance therapy:
US: ~6k EU5: ~15k
JP: ~5k
~70%
Show disease progressionduring chemotherapy:
IO (incl. Bavencio in the US) approved as 2L treatment
~30%
EU5: ~85%
JP: ~95%
Durable responses to standard of care (1L chemotherapy) are rare with most patients experiencing progression within 9 months of treatment1
• 2 checkpoint inhibitors approved for 1L UC treatment as monotherapy given the high unmet need in 1L UC - labels currently restricted to cis-ineligible, PD-L1 positive patients.
Platinum ineligble
15%

Classification: Public
79
Bintrafusp alfa1
An innovative first-in-class bifunctional fusion protein discovered in-house leading the TGF-β immuno-oncology field
Clinical Development
Plans
• Innovative first-in-class bifunctional fusion protein designed to simultaneously target two immune suppressive pathways (blocking PD-L1 and reducing TGF-β signaling)
• Demonstrated superior anti-tumor activity in pre-clinical study compared to anti-PD-L1 alone, and anti-PD-L1 and TGF-β given in combination as separate agents
• Great excitement in IO community about M7824 uniquely addressing TGF-ß biology widely accepted as key resistance factor for anti-PDx therapies
• Multiple high priority immuno-oncology clinical development studies ongoing or expected to commence shortly, including studies in non-small cell lung and biliary tract cancers with registrational intent and most recently advanced, unresectable cervical cancer
• Tested in 14 Phase Ib expansion cohorts across >700 patients in more than 10 tumor types
• Shown clinical anti-tumor activity across multiple hard-to-treat cancers includingadvanced NSCLC, biliary tract cancer, HPV-associated cancers, and gastric cancer
• PhII study M7824 monotherapy versus pembrolizumab 1L, advanced NSCLC high PD-L1-tumor expressers started in October 2018
Clinical Development Achievements
Mode of action
1proposed International Nonproprietary Name (INN) Acronyms: NSCLC = Non-small Cell Lung Cancer, IO = Immuno-Oncology

Classification: Public
80
INTR@PID Program: Upcoming Readouts
From: Merck Q4 2020 earnings call – 2021.03.04
Bintrafusp alfa
2022
Cervical 017 - 2LMonotherapy
BTC 055 - 1LCT combo (Gemcitabine Plus Cisplatin)
Lung 024 - 1LCT combo
Lung 005 – Stage* IIIcCRT + IO combo followed by IO
Solid tumors - (M6223)Anti-TIGIT combo
Urothelial 152 –2LMonotherapy
TNBC 020 - 2LMonotherapy
Cervical 046 - 1L CT, +/- bevacizumab combo
Q4
Q1
Q2
Q4
Q3
Q3
Ph II/III
Ph I
Ph Ib
Ph II
Ph I/II
Ph I
Ph II
Ph II
Registrational potential
2021
Recentlymoved up
CT
com
bo
CT/
CR
T co
mb
oH
PV
dri
ven
/P
reci
sio
n I
O
2023 2024
Q1
Q1
Acronyms: BTC = Biliary Tract Cancer; CT = Chemotherapy; EMT = Epithelial-mesenchymal transition; HPV = Human papillomavirus; NSCLC = Non-small Cell Lung Cancer; RT = Radiation therapy; TNBC = Triple-Negative Breast Cancer; * unresectable; All clinical timelines are event-driven and may be subject to change
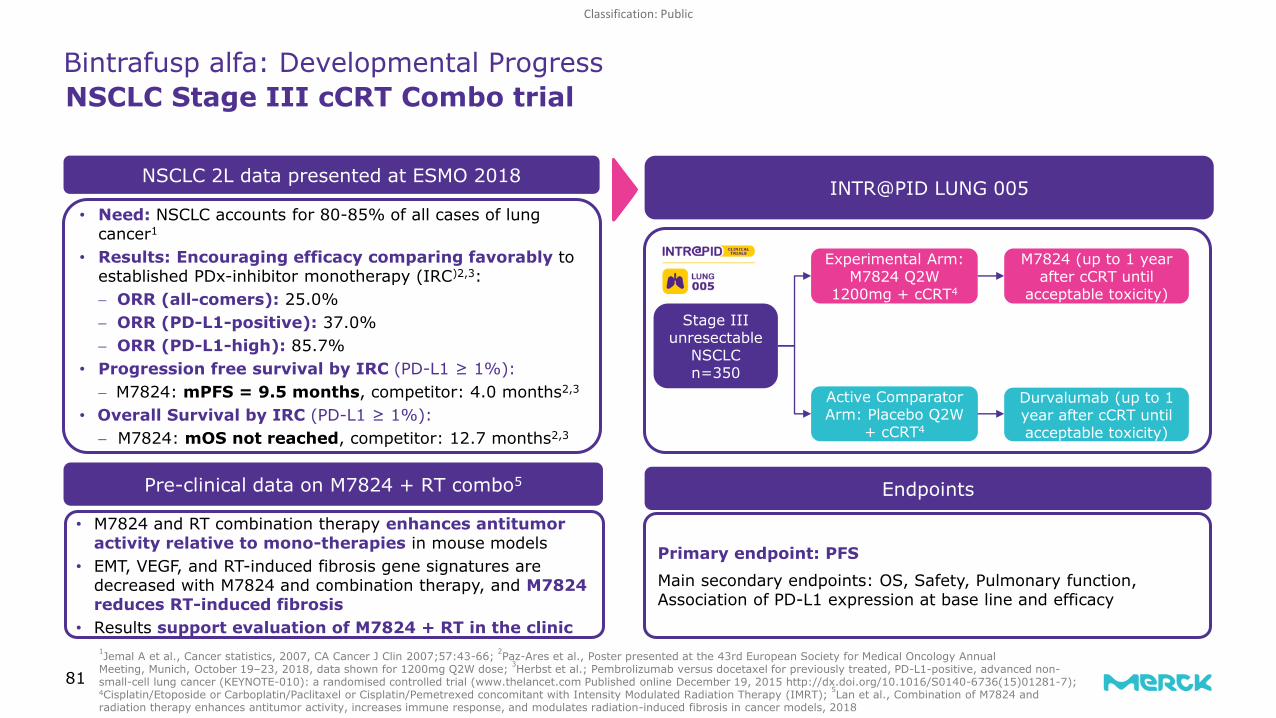
Classification: Public
81
Bintrafusp alfa: Developmental Progress
Stage III unresectable
NSCLCn=350
Experimental Arm:M7824 Q2W
1200mg + cCRT4
Active Comparator Arm: Placebo Q2W
+ cCRT4
NSCLC Stage III cCRT Combo trial
M7824 (up to 1 year after cCRT until
acceptable toxicity)
Durvalumab (up to 1 year after cCRT until acceptable toxicity)
INTR@PID LUNG 005
Endpoints
Primary endpoint: PFSMain secondary endpoints: OS, Safety, Pulmonary function, Association of PD-L1 expression at base line and efficacy
NSCLC 2L data presented at ESMO 2018
• Need: NSCLC accounts for 80-85% of all cases of lung cancer1
• Results: Encouraging efficacy comparing favorably to established PDx-inhibitor monotherapy (IRC)2,3:− ORR (all-comers): 25.0%− ORR (PD-L1-positive): 37.0%− ORR (PD-L1-high): 85.7%
• Progression free survival by IRC (PD-L1 ≥ 1%):− M7824: mPFS = 9.5 months, competitor: 4.0 months2,3
• Overall Survival by IRC (PD-L1 ≥ 1%):− M7824: mOS not reached, competitor: 12.7 months2,3
1Jemal A et al., Cancer statistics, 2007, CA Cancer J Clin 2007;57:43-66; 2Paz-Ares et al., Poster presented at the 43rd European Society for Medical Oncology Annual Meeting, Munich, October 19–23, 2018, data shown for 1200mg Q2W dose; 3Herbst et al.; Pembrolizumab versus docetaxel for previously treated, PD-L1-positive, advanced non-small-cell lung cancer (KEYNOTE-010): a randomised controlled trial (www.thelancet.com Published online December 19, 2015 http://dx.doi.org/10.1016/S0140-6736(15)01281-7);4Cisplatin/Etoposide or Carboplatin/Paclitaxel or Cisplatin/Pemetrexed concomitant with Intensity Modulated Radiation Therapy (IMRT); 5Lan et al., Combination of M7824 and radiation therapy enhances antitumor activity, increases immune response, and modulates radiation-induced fibrosis in cancer models, 2018
Pre-clinical data on M7824 + RT combo5
• M7824 and RT combination therapy enhances antitumor activity relative to mono-therapies in mouse models
• EMT, VEGF, and RT-induced fibrosis gene signatures are decreased with M7824 and combination therapy, and M7824 reduces RT-induced fibrosis
• Results support evaluation of M7824 + RT in the clinic

Classification: Public
82
Prevalence: >630,000 new cases of HPV-related cancer are reported worldwide annually1
Response Rates: • Bintrasfusp alfa response rates compared favorably to those
with anti–PD-1 inhibitors (ORRs of 13%–24%)1-7
• ORR was 27.9% and 30.6% in HPV-associated and HPV+ cancers, respectively
• Including three additional patients with delayed PRs after initial PD: Total response rate was 34.9% and 38.9% in HPV-associated and HPV+ cancers, respectively
Long-term Benefit:• Most responses durable with 4 responses having DoR >18
months and 11/15 responses ongoing at the data cutoff• Responses to bintrafusp alfa occurred irrespective of tumor
type or PD-L1 expression • Safety profile was similar to anti–PD-(L)1 therapy1,5 except
for SCC/KAs and low grade mucosal bleeding which are anticipated AEs with TGF-β inhibition8,9
Bintrafusp alfa: Developmental Progress
Cervical Cancer 2L study recentlyposted on ct.gov
Efficacy variable HPV-associated cancer (n=43)
HPV+*(n=36)
Confirmed BOR, n (%)
CR 2 (4.7%) 2 (5.6%)
PR 10 (23.3%) 9 (25%)
SD 6 (14.0%) 5 (13.9%)
PD 20 (46.5%) 17 (47.2%)
Not evaluable 5 (11.6%) 3 (8.3%)
Delayed PR† 3 (7.0%) 3 (8.3%)
ORR per RECIST v1.1, n (%) [95% CI]
12 (27.9%) [15.3–43.7]
11 (30.6%) [16.3–48.1]
Total clinical response rate†, n (%) 15 (34.9%) 14 (38.9%)
DCR, n (%) 18 (41.9%) 44.4%
Data shown at AACR 2019 highlights opportunity in HPV-related cancers
†Due to confirmed PD before onset of response, these patients did not meet response criteria by RECIST v1.1; *HPV status was determined from prior documentation, or by using cobas® 4800 HPV Test (Roche) in the dose escalation phase or RNA sequencing (RNASeq) in the expansion phase. 1Bauml J, et al. J Clin Oncol. 2017;35:1542–49; 2Ott PA, et al. Ann Oncol. 2017;28:1036–41; 3Hollebecque A, et al. J Clin Oncol. 2017;35(Suppl):Abstract 5504; 4Chung HC, et al. J Clin Oncol. 2018;36(Suppl):Abstract 5522; 5Ferris RL, et al. N Engl J Med. 2016;375:1856–67; 6Mehra R, et al. Br J Cancer. 2018;119:153–59; 7Morris VK, et al. Lancet Oncol. 2017;18:446–53; 8Lacouture ME, et al. Cancer ImmunolImmunother. 2015;64:437–46; 9Trachtman H, et al. Kidney Int. 2011;79:1236–43

Classification: Public
83
DNA Damage Response (DDR)Leading DDR portfolio with a broad clinical program4
DNA-PKi
• Ph Ib/II in Rectal cancer (CRT combo) recently discontinued
• Combo with Avelumab: Study with and w/o RT ongoing (PhI, solid tumors)
• Multiple NCI studies in various tumor types
Strategy presented at R&D Update Call 2019
M4344(formerly VX-803)
Peposertib/M3814
M4076• Clinical candidate/ready for Phase I trials,
chemical structure first disclosed at AACR 2019
M9831(formerly VX984)
• Exclusive license1 granted to Vertex in 2019 for use in gene-editing applications
• Development recently terminated due to prioritization of M1774
1: incl. upfront payment + milestone/royalties on future sales; Acronyms: ATMi = Ataxia telangiectasia-mutated; ATRi = Ataxia telangiectasia and Rad3-related inhibitors; CRT = Chemoradiotherapy; DDR = DNA Damage Response; DNA-PKi = DNA-dependent Protein Kinase Inhibitor; PARP = poly(ADP-ribose) polymerase inhibitor; POC = Proof of concept; RCT = Randomized Controlled Trial; RT = Radiation Therapy
ATMi
• Only ATR-inhibitor with a POC from an RCT(Ovarian cancer, Berzosertib +/- Gem)
• Multiple NCI studies in various tumor types• Promising Phase II data (Small cell lung cancer)
recently published in “Cancer Cell”• Phase II SCLC trial recently initiatedATRi
Berzosertib/M6620(formerly VX-970)
M1774(formerly VX-400)
• Phase I FiH monotherapy study ongoing. Expansions to investigate combinations under discussion.

Classification: Public
We pioneered BTKi development for MS with EvobrutinibPotential to have 3 complementary MS branded products by 2025
84
3.3
7
5.2
5.6
10.8
7.3
2019 2024
19 20BTKi is a novel class of non-depleting therapies selectively targeting both B-cells and innate immune cells including disease progression-relevant microglia
Merck KGaA, Darmstadt, Germanywas the first to conduct a full Phase II dose-ranging study in MS with Evobrutinib, a highly selective covalent BTKi2
Merck KGaA, Darmstadt, Germany is a growing MS player and could have 3 complementary branded products by 2025 –Mavenclad®, Rebif®, Evobrutinib
▪ ~50% of patients with Relapsing MS (RMS) continue to have ongoing disease activity over 2 years even when treated with the most effective agents
▪ No therapy with impact on progression mediated by CNS myeloid cells
▪ Systemic side effects of therapies limit patient acceptance and compliance
▪ All approved higher efficacy therapies associated with elevated risk of infection
Worldwide MS Market [€ bn]1
B-cell Targeting
Other HE
Platform
Platform agents – interferons, copaxone, DMFs and Teriflunomide; Other HE (high-efficacy) - cladribine, S1Ps, alemtuzumab; B-cell Targeting – ocrelizumab, ofatumumab, ublituximab. Includes branded products, generics and biosimilars; 1: Merck KGaA, Darmstadt, Germany internal estimates; 2: Montalban et al. NEJM 2019; 380:2406-2417; Acronyms: BTKi = Bruton's tyrosine kinase inhibitor
B-Cell Targeting + High-Efficacy (HE) Orals
represent >60% of MS sales
Unmet need in Multiple Sclerosis (MS) –
Need for new mechanisms to control disease

Classification: Public
Fenebrutinib## Tolebrutinib** Evobrutinib
Clin
ical
Evi
den
ce
Long-term* efficacy on relapses
Long-term* safety
Convenience (oral)
Exposure in CSF
Biomarker of inflammation and progression in MS patients (sNfL)
Pre
clin
ical
d
ata
BTK occupancy in the CNS
Efficacy in progressive EAE model and reduction of leptomeningeal inflammation#
Evobrutinib stands out amongst BTK inhibitors under developmentUniquely positioned both in terms of clinical evidence and mode of action
85
*Long term is defined as the continuous treatment of MS patients for at least 96 weeks; **Extension to Phase II clinical trial in MS ongoing; #Defined as having an evidence on all the following: Inhibition of leptomeningeal and cortical inflammation and progression in preclinical models; ## No reported data in MS patients; 1: Montalban et al., triMS.online conference 2020; 2: Smith et al., ACTRIMS 2019; 3: data on file; 4: Francesco et al., ECTRIMS 2017; 5: Boschert U et al., ECTRIMS-ACTRIMS 2017; 6: Kim et al., ECTRIMS 2020, 7: Alankus YB et al., ECTRIMS 2018; 8: Rijvers et al., ECTRIMS 2020; Acronyms: sNfL serum Neurofilament Light Chain; BID twice a day; QD once a day; HV healthy volunteers; MS multiple sclerosis
(1)
(3)
(1)
(3)
(5)
(6-8)
Phase III studies: Recruitment on track → Target data in-house in Q4 2023 and potential filing shortly after
(4)
: not reported
BIDBID QD
(2, ##)
in HV in MS

Classification: Public
Evobrutinib has the potential to tackle Multiple Sclerosis directly in the brain
86
▪ Evobrutinib was quantifiable in CSF of 9 of 9 clinically stable RMS patients administered the efficacious 75 mg BID dose in the RMS Phase 2 OLE study*
‒ Plasma PK were at steady-state and consistent with other RMS Phase2 patients
▪ CSF concentrations are consistent with free plasma concentrations
▪ The measured CSF concentrations are biologically relevant
‒ Median BTK trough occupancy >95% observed at similar plasma concentrations
CSF cerebrospinal fluid; BID twice a day; RMS relapsing multiple sclerosis; OLE open label extension; PK pharmacokinetic; BTK Bruton Tyrosine Kinase; *Data on file

Classification: Public
Evobrutinib is a CNS penetrant BTKi2
Evobrutinib targets inflammation and progression
87
Blood Brain
0
10
20
30
40
Ex
po
su
re [
ng
/ml o
r n
g/g
]
Blood Brain
0
20
40
60
80
100
120
BT
K O
cc
up
an
cy
[%
]
Blood Brain
0
10
20
30
40
Ex
po
su
re [
ng
/ml o
r n
g/g
]
Blood Brain
0
20
40
60
80
100
120
BT
K O
cc
up
an
cy
[%
]
CNS exposure in EAE mice
Evobrutinib shifts macrophage phenotypes
from M1 pro- to M2anti-inflammatory 3
Macrophages after GM-CSF activation IL-1β
Leptomeningeal structures
Vehicle:
EAE in SJL/J mice
Evobrutinib:
Evobrutinib reduces CNS B cells and leptomeningeal inflammation4
IL-10
▪ Important role ofmacrophage/ microglia cells in addition to B and T cells in bothperiphery and CNS1
▪ Evobrutinibreaches brain to potentially impact compartmentalized inflammation2
▪ Effects may be mediated through effects on CNS-resident and CNS-migrating cells3,4
Dual mechanism of action offers an innovative oral approach to MS therapy
MOA on B-cells and macrophage/microglia cells is
an innovative oral approach to MS therapy
with potential to impact compartmentalized
inflammation and progression
Figure modified from: Li R, et al. 2018.
1. Li et al. Nat Immunol 2018; 2. Adapted from Boschert U et al. ECTRIMS-ACTRIMS 2017; 3. Alankus YB et al. ECTRIMS 2018; 4. Sol Kim ECTRIMS 2020

Classification: Public
Evobrutinib is optimally dosed to offer best-in-class BTK inhibitionOptimized dose selection & targeted covalent binding results in sustained BTK inhibition that is necessary for robust efficacy
881. Boschert et al., ECTRIMS 2017; 2. Bianco et al., Trends in Pharmacological Sciences 2020; 3. Bauer R.A., Drug Discovery Today 2012; 4. Swinney D.C., Curr. Top. Med. Chem. 2006; 5. Barf, T. & Kaptein, A., J. Med. Chem. 2012; 6. Caldwell et al., J. Med. Chem. 2019; 7. Montalban et al., EAN 2020., 8. Montalban et al NEJM 2018*at disease relevant concentrations; ARR: annualized relapse rate; *75 mg BID fasted equals 45 mg BID fed that is a dose used in Phase III EVOLUTION studies
Sustained BTK inhibition in CNS-resident and CNS-migrating cells resulting from covalent binding MOA and BID dosing can be critical to achieve best-in-disease efficacy1
Targeted covalent binding leads to highly specific continuous target engagement2-6
BID dosing enables critical >95% BTK inhibition throughout the day in the majority of patients7
Evobrutinib
Targeted covalent binding
Covalent binding
Reversible binding
Tolebrutinib
Fenebrutinib
BTK
BTK
BTK
Multiple other kinases
Sustained action in CNS
Selectivity*
Efficacy at 48 weeks8
75 mg QD EvobrutinibFasted:ARR = 0.25
75 mg BID EvobrutinibFasted:ARR = 0.11
BTKOccupancy(SS Trough) Threshold
25 mg QD 75 mg QD 75 mg BID
% of Population (RMS Ph2)
95% 23 48 98
RelapsesMaximum efficacy
Noefficacy

Classification: Public
Evobrutinib holds unmatched Long-Term Data among BTKi class in MSBest-in-disease efficacy & favorable safety over 2 years in largest Phase II study in MS
891. Montalban et al 2020 EAN; 2. Data on file; 3. Kuhle et al. Neurol. 2019; *Significant covariates of evobrutinib effect on NfL (age, EDSS, T2 lesion volume and time since MS onset) are markers associated with advanced and progressing MS;** Average ARR during the 1 year before the study are historically collected data and relapses were not confirmed by an independent, blinded rater. No formal statistical comparison was conducted between pre-study and on-study ARR.
Very high, sustained efficacy
▪ Evobrutinib is the only BTKi to have demonstrated very high, sustained efficacy and favorable safety in the largest Phase II study in MS (n=267), with an ARR of confirmed relapses of 0.12 up to 108 weeks1
▪ Evobrutinib impacts sNfL levels, a biomarker of neuronal damage, reflecting disease activity and drug response in patients with MS3,starting at 12 weeks and maintained through 24 weeks2
▪ Evobrutinib is highly selective resulting in targeted kinase inhibition, and its safety data in >1200 patients over 2+ years supports the potential for an optimal long-term safety profile2
0.111
1.19**
Week 48
Evobrutinib
75mg BID Ph21
0.121
Annualized Relapse Rate
1ye
ar b
efor
est
ud
y
Evobrutinib
75mg BID Ph22
Week 108
Early and substantial impact on sNfL*
Relative reduction of Serum Neurofilament Light vs Placebo (%)3
-18.3%
-16.2%
Rel
ativ
e re
duct
ion
vsp
lace
bo
(%)
p = 0.013 p = 0.047 W
eek
12
Wee
k 2
4
Evobrutinib(BTK-inhibitor)

Classification: Public
M5049 (TLR7/8 antagonist)TLR7/8 are drivers of SLE pathology and possibly of COVID-19
90
• M5049 (discovered in-house) is a potentially first-in class small molecule that blocks activation of Toll-like receptors TLR7 and TLR8, two innate immune sensors that detect single-stranded (ss) RNA from viruses such as SARS-COV-2, the virus responsible for COVID-19, and inflammatory self-RNAs in the context of autoimmunity
• Activation of TLR7/8 leads to immune cell activation and inflammation, which when not properly controlled can cause severe immunopathology
Preliminary Phase I data warrant further investigation as a potential treatment for autoimmune diseases including SLE
2
1: Port et al., A PHASE I, FIRST-IN-HUMAN STUDY TO ASSESS THE SAFETY, PHARMACOKINETICS AND PHARMACODYNAMICS OF SINGLE AND MULTIPLE ASCENDING DOSES OF M5049, A DUAL ANTAGONIST OF TLR7/8, IN HEALTHY SUBJECTS, Lupus Science & Medicine 2020;7(Suppl 1):A1–A131, conference cancelled due to COVID-19; 2 Adapted from ImmunoHorizons July 1, 2018 Dowling, D; Acronyms: SLE = Systemic lupus erythematosus; TLR = Toll-like receptors
Mechanism of Action1
Results from Phase I study in
healthy volunteers
(NCT03676322)1
• Well-tolerated over the dosing interval, no significant or dose-limiting adverse event• Pharmacokinetic parameters linear and dose-proportional from 1 to 200 mg• Exposure-dependent inhibition of ex vivo-stimulated IL-6 secretion observed, with
maximum inhibition achieved at 200 mg

Classification: Public
M5049 (TLR7/8 antagonist)Similarities between SLE and COVID-19
91 All timelines are event-driven and may be subject to change
Similarities between SLE and COVID-191
Rational:• Investigate if M5049 intervention at critical point in course of
COVID-19 disease may prevent or ameliorate hyper-inflammatory response in patients with COVID-19 pneumonia and prevent progression to ‘cytokine storm’
• Successful intervention with investigational drug may reduce life-threatening complications of COVID-19, including severe respiratory symptoms often necessitating further interventions such as mechanical ventilation
Design: • Phase II randomized, controlled clinical study
• Commenced in July 2020
Results:Dependent on recruitment and COVID-19 infection ratesFirst results expected in Q3/Q4 2021
Phase II study started in July 2020
1: Illustration created in-house; Acronyms: SLE = Systemic lupus erythematosus

Classification: Public
Healthcare: strong Fertility & Oncology performance, while Mavenclad®
remains impacted by depressed dynamic market
Totals may not add up due to rounding
92
▪ Mavenclad® growing +26 % organically to €147 m, amid still depressed dynamic market; Rebif® decline -17% in Q1 due to tough comps related to tender win in Q1 2020
▪ Oncology up +20%, Bavencio® sales doubled post UC 1L launch in U.S. and initial contribution from EU & JP1; Erbitux® up +10% largely driven by China growth
▪ Base business about stable, strong Fertility growth (+22% org.) compensating for Rebif® and CM&E decline (-4% org.)
▪ Strong savings in M&S from continuous rigorous cost discipline, supported by reduced face-to-face activities amid pandemic
▪ R&D flat as a result of continued prioritization; no significant COVID-19 related project delays
▪ EBITDA pre and margin significantly supported by Bavencio®
milestones (~ €50 m)
Healthcare P&L
Comments
[€m] IFRS Pre
Q1 2020 Q1 2021 Q1 2020 Q1 2021
Net sales 1,701 1,639 1,701 1,639M&S* -423 -370 -423 -365Admin -79 -73 -78 -69R&D -417 -416 -417 -415EBIT 422 445 395 455EBITDA 501 523 - -EBITDA pre 472 533 472 533(in % of net sales) 27.8% 32.5% 27.8% 32.5%
Q1 2020 Organic Currency
3.5%
Q1 2021Portfolio
€1,701 m-5.9% -1.2%
€1,639 m
€472 m €533 m
PortfolioQ1 2020 Organic Currency Q1 2021
29.0%
-15.8% -0.3%
Net sales bridge
EBITDA pre bridge
1 U.S., Europe and Japan approvals received on 30/06/2020, 25/01/2021 and 24/02/2021 respectively* Marketing and selling expenses

Classification: Public
Life Science

Classification: Public
Life ScienceCapitalizing on three key life science trends
94
COMPLEX BIOLOGICS1 DIGITAL
UNIVERSE2 ASIA3
1measured by traffic, rated by external service SimilarWeb; 2by business segment within Life Science
Viral Vectors
Antibody Drug Conjugates (ADC)
Single Use / End to End
Launched ADC Express™ for the rapid production of ADCs
Opened Wuxi site in 2018, and expanded Danvers facility
Expanded Carlsbad viral vector manufacturing site in 2016; further doubling of capacity planned for 2021
#1 eCommerce site in Life Science1
• >90% of Millipore products on eCommerce platform
• X2 net sales growth of eCommerce vs. non-eCommerce2
Manufacturing/DistributionNantong, Wuxi Single use
Commercial expansionTier 2 cities
eCommerce partnership
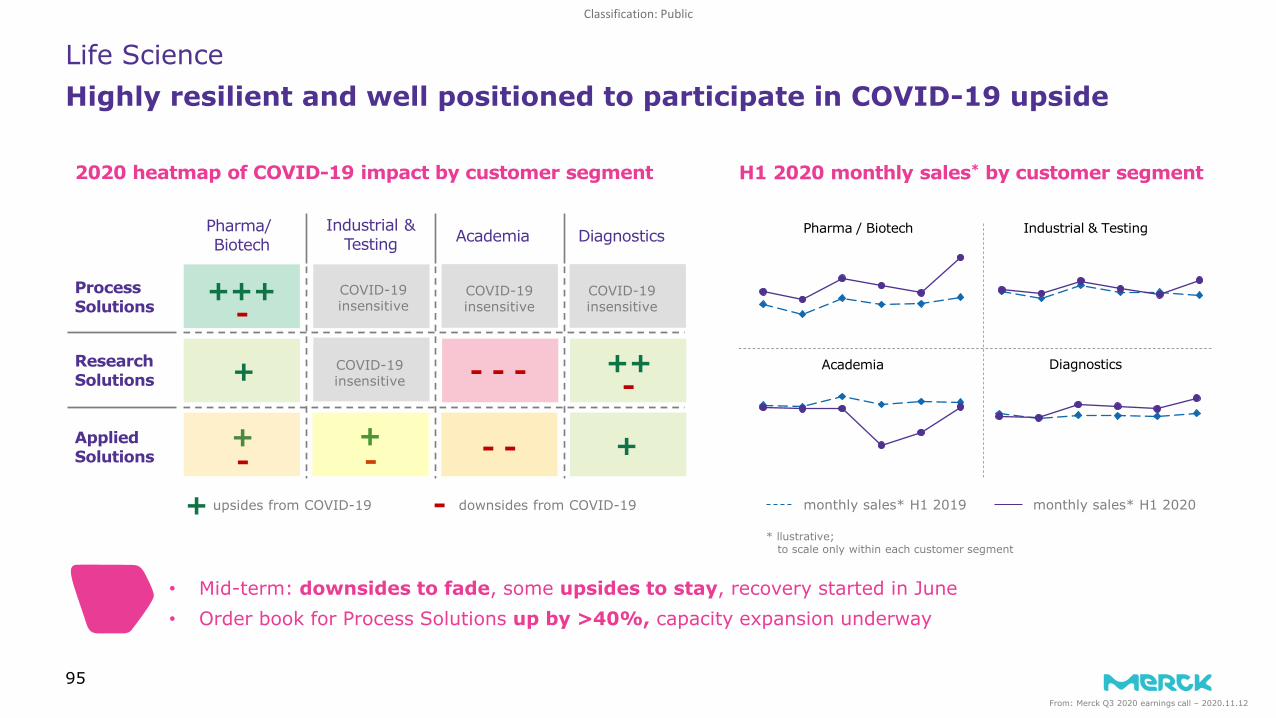
Classification: Public
+
• Mid-term: downsides to fade, some upsides to stay, recovery started in June• Order book for Process Solutions up by >40%, capacity expansion underway
Pharma/ Biotech
Industrial &Testing Academia Diagnostics
+++-
++-
+- -+--
- - -+
2020 heatmap of COVID-19 impact by customer segment H1 2020 monthly sales* by customer segment
+ -upsides from COVID-19 downsides from COVID-19
Pharma / Biotech Industrial & Testing
Academia Diagnostics
monthly sales* H1 2019 monthly sales* H1 2020
ProcessSolutions
ResearchSolutions
AppliedSolutions
* llustrative; to scale only within each customer segment
COVID-19insensitive
COVID-19insensitive
COVID-19insensitive
COVID-19insensitive
95From: Merck Q3 2020 earnings call – 2020.11.12
Life ScienceHighly resilient and well positioned to participate in COVID-19 upside

Classification: Public
96
NOVEL
FORMULATED FOR an Individual
Uses DNA, RNA, Cells
Potentially curative
Non-templatedmanufacturing
Gene & Viral
Cell therapies
mRNA
FORMULATED FOR THE MASSES
TRADITIONAL
Chronic,manages or treats
Templatedmanufacturing
Uses small molecules,peptides, proteins HP-API
Vaccines
Plasma
Acronyms: HP-API = highly potent active pharmaceutical ingredient; mAbs = monoclonal antibodies; DNA = deoxyribonucleic acid; (m)RNA = (messenger) ribonucleic acid; ADC = antibody drug conjugate
MODALITIESMODALITIES
ADCs
mAbs
From: Merck Capital Markets Day 2020 – 2020.09.16
Process Solutions: Therapies are evolving from treatments to curesAdvancing traditional is critical as novel modalities develop

Classification: Public
97
Unit Operations
Cell culture media
Biopharmmaterials
Chromatography
Hardware
Single use
Sterile
Virus
Clarification
Tangential flow filtration
= A leading player = Significant presence = No offering
COVID-19 Outlook
Vaccine
mAb65 programsBind and block virus from entering cells
Type Implications
• Universal templates• A leading position for 8
out of 9 unit ops
• Multiple templates• Leveraging Single Use
199 programsProtective immune response
Nucleic Acid • Emerging manufacturing processes
• Lipids are critical
Sources: press releases, company reports, and internal assessments
43 programsLeveraging human factory
Process SolutionsCOVID demands align with our strengths but increase supply chain pressure
From: Merck Capital Markets Day 2020 – 2020.09.16

Classification: Public
98
2024
2020
mAbs dominate; Novels fastest
Accessible Market (€ bn)
2020
3
3
Small Molecules
mAbs & rProteins
328
Other biologics
5
Cell & gene therapy
41
2024
6% 9% 13% 32%
10%
Origins of biologics pipelineEmerging biotechs drive novels
Traditional therapies
85%
15%
50%50% EstablishedEmerging
Novel therapies
Company type
Services see faster growth in coming years
Products
9% 12%
17%
16%
33%
9%
14%
5%
2%
4%
Service importance varies by modality
2
2020-24 Sales CAGRs Services
mAbs & rProteins
Other biologicsSmall molecules
Cell & gene therapy
1
Sources: Evaluate Pharma, internal market models, CSR sales data; 1 Other biologics include plasma, vaccines, insulin, microbial and non-mAb biosimilars; 2 mAbs include ADCs here; Additional acronym: rProteins = recombinant proteins
Process SolutionsOpportunities in services to accelerate double-digit growth
From: Merck Capital Markets Day 2020 – 2020.09.16

Classification: Public
99
Near term Mid term Long term
NOVELTRADITIONAL ALL
Revenue driver
Modality
Portfolio
ServicesOffering Products Products
Perfusion Bioreactor w/ Cellicon BioContinuumTM
1
2
Advanced Filtration
Technology ✓ Contract development &
manufacturing organization
✓ Contract testing organization
✓ Product characterization
✓ Templated viral manufacturing consumables and reagents
✓ Autologous manufacturing system
Single Use
Gene
transfer
Manufacturing novel therapies
From: Merck Capital Markets Day 2020 – 2020.09.16
Process Solutions: Strategic directionInnovate and invest today to continue above market growth in the future

Classification: Public
Process Solutions
100
BioReliance ® EMPROVE®
Ex-Cell®Advanced™
media
CHOZNCell Line
Clarisolve®
Depth FiltersViresolve®
Pro SolutionPellicon®
UltrafiltrationCassettes
Opticap®
FiltersDurapore®
FiltrationEshmuno®
Chrom. resinProSep®
Ultra Plus Resin
Tod
ay’s
pro
cess
& p
ortf
olio
Mobius®
bioreactor
Tom
orro
w’s
pro
cess
Millipak®
Final Fill Filter
Launched 2018
cGMP SOLUTIONS & SERVICES
Launched 2018
Continuous bioprocessing will …• be an evolution in mAb bioprocessing• take time to establish• leverage the present • lead to hybrid solutions
100
Next-generation bioprocessing on the cards

Classification: Public
Process SolutionsOur single-use technologies drive flexibility in modern bioprocessing
*CAPEX = Capital Expenditure
CAPEX* required
Footprint
Change over time
Time to construct
CAPEX required
Footprint
Change over time
Time to construct
~$500 m to $1 bn
~>70,000 m2
5 to 10 years
4 weeks
$20 m to $100 m
~11,000 m2
1.5 years
0.5 days
Innovative Single-use facilityTraditional multi-use facility
30,000 l stain-lesssteel tank
500 l single-use
tank
Strong demand for single-use technologies and Process Solutions’ broad offering was and will remain a key source of growth for Life Science
101

Classification: Public
Process SolutionsmAbs market democratization will drive diversification, change & variability
Vol
ume
[met
ric
tons
]
Top 10 mAbs New mAbs Biosimilars1
Market development• Overall mAbs market will grow
~11-15% CAGR
• Top 10 originator mAbs represent ~ 50% of market volume today and will decline to ~30% in 2024
• Biosimilars will gain share
mAb volume projections 2020 to 2024
1Biosimilars scaling factor = 2.8 based off internal estimates and McKinsey analysis; Source: company estimate based on industry forecasts, EvaluatePharma; mAbs = Monoclonal antibodies
102
0
5
10
15
20
25
30
35 CAGR ~11-15%

Classification: Public
BIG 3 - Process Solutions: upside potential continues to materialize
103
Sales development [€m] - org. growth [%]
802892 926
975
26.9%
13.2%
Q4 2020Q3 2020Q1 2020
26.5%
19.8%
Q2 2020
38.3%
Q1 2021
1,054 ▪ COVID-19 related projects in BioP Single Use and Downstream remain key drivers of ~ 50% additional pandemic-related growth
▪ Unprecedented growth across all regions particularly strong in Asia (>50% org.) in large parts driven by the recovery vs. Q1 2020 lockdown in China
▪ Pharma & Biotech customer segment remains by far the strongest growth driver
▪ Comps will be getting tough from Q2 2021 onwards, as base starts including significant COVID-19 business upside
▪ FX headwinds of -7% mute absolute numbers

Classification: Public
Research Solutions: additional COVID-19 demand has gained momentum
104
Sales development [€m] - org. growth [%]
▪ Ongoing core business recovery boosted by additional COVID-19 related demand
▪ Unprecedented growth across all regions particularly strong in Asia (>30% org.) and North America (>20% org.)
▪ Pharma & Biotech customer segment strongest Q1 growth driver in absolute terms; Diagnostics customer segment showed fastest growth in relative terms
▪ Q2 2021 will be softest comp, against the COVID-19 induced lock-down dip in 2020
▪ FX headwinds of -6% mute absolute numbers
546501
566602
644
Q4 2020Q2 2020
0.0%
Q1 2020 Q3 2020
-7.1%
24.0%
9.5%
16.0%
Q1 2021

Classification: Public
Life Science: strong core business and rising COVID-19 demand fuel record growth, particularly in Process and Research Solutions
Life Science P&L
Comments
+0.0%
▪ Process Solutions org. growth of +38% driven by downstream & single use for COVID-19 projects; strong underlying demand supported by acceleration of capacity expansions
▪ Research Solutions speeding up further to an exceptional +24% organic growth, driven by recovery in base business and additional COVID-19 opportunities, mainly in diagnostics and pharma
▪ Applied Solutions growth (+8% org.) driven by APAC recovery against low Q1 2020
▪ Declining M&S in % of sales from 28% to 23% despite higher logistics cost amid pandemic
▪ Flat R&D spend with continued focused investments in strategic projects in high growth & emerging segments
▪ Business performance, operational leverage & favorable mix continue to drive strong EBITDA pre and margin expansion despite 6% FX drag
€1 769 m €2 131 m
Q1 2020 Q1 2021Organic Currency Portfolio
26.7%-6.2%
0.0%
€553 m €793 m
PortfolioQ1 2020 Organic Currency Q1 2021
49.9%-6.3% -0.1%
Net sales bridge
EBITDA pre bridge
105
[€m] IFRS Pre
Q1 2020 Q1 2021 Q1 2020 Q1 2021
Net sales 1,769 2,131 1,769 2,131M&S* -498 -501 -497 -500Admin -89 -82 -80 -74R&D -75 -75 -75 -75EBIT 345 593 357 607EBITDA 541 779 - -EBITDA pre 553 793 553 793(in % of net sales) 31.2% 37.2% 31.2% 37.2%
Totals may not add up due to rounding
* Marketing and selling expenses

Classification: Public
Electronics

Classification: Public
Electronics targets attractive markets –especially in the electronics space
107
Electronicssales by end market
2020ASales
• Driven by digital disruptions and megatrends such as digitalization
• Heterogeneous end-user applications• Semiconductors as the engine of all electronic
systems
• Driven by world GDP growth
• Increasing demand inemerging markets
• Driven by world GDP growth
• Rising living standards and higher disposable income
Electronics Market
Automotive Market
Cosmetics Market
Market size1:~€1,800 bnCAGR 19-242:
~4%
Market size:~€400 bn
Market size:~€2,000 bn
~89% ~11%
1Prismark 2021; 2 Internal estimation
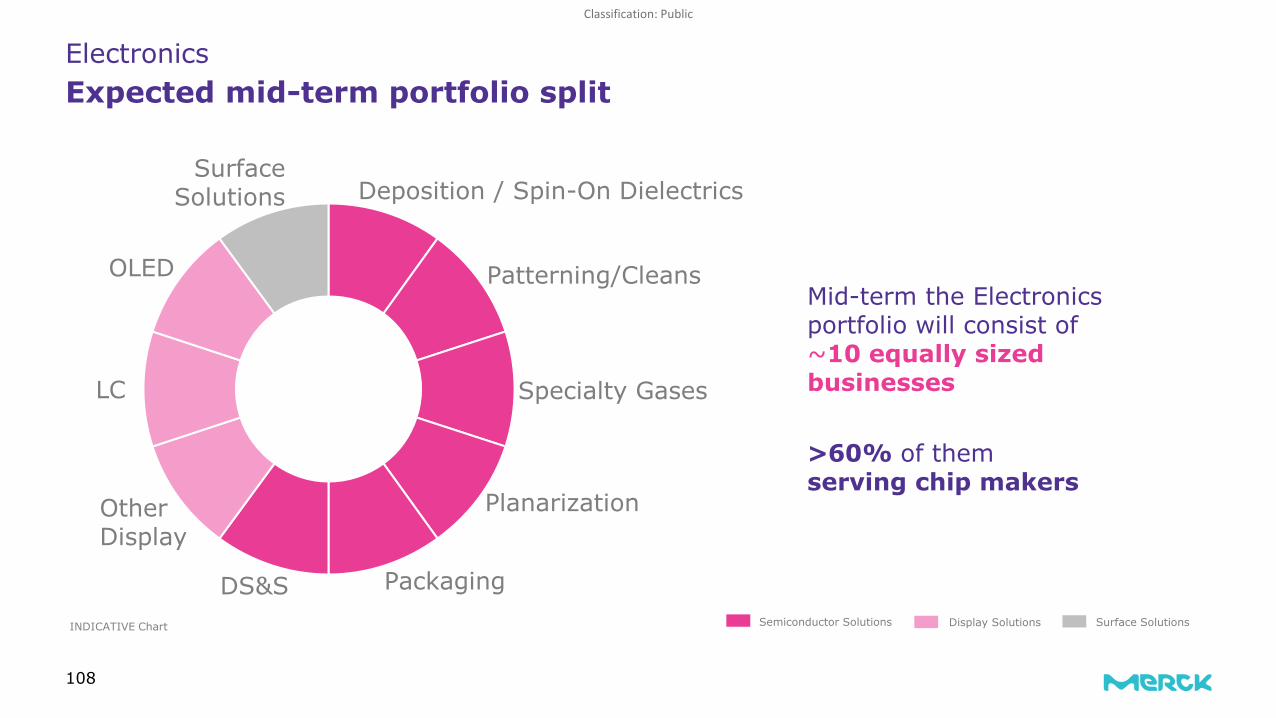
Classification: Public
108
Deposition / Spin-On DielectricsSurface
Solutions
Mid-term the Electronics portfolio will consist of ~10 equally sized businesses
>60% of them serving chip makers
Patterning/Cleans
Specialty Gases
Planarization
PackagingDS&S
LC
OLED
OtherDisplay
Semiconductor Solutions Display Solutions Surface Solutions
Electronics Expected mid-term portfolio split
INDICATIVE Chart

Classification: Public
Semiconductor Solutions – integrated materials player, well positioned to serve the need of customers in semiconductor fabrication
109
370 Semiconductorcomponents
Other components,
assembly & profit
1,800SemiconductorMaterials
47
54
Other cost& profit
368Electronics Semiconductors Semiconductor Solutions
▪ Smartphones▪ PCs & Laptops▪ Servers▪ Communication▪ Wearables▪ Smart devices▪ …
▪ CPUs / logic chips▪ Memory chips (SSD, RAM)▪ Sensor chips▪ Communication chips▪ …
Silicon wafersPatterning materialsThin film materialsPlanarization materialsCleansSpecialty gasesBulk gasesPackaging materials
Other Consumables4
Parts & equipmentApplications & services
Merck Semiconductor Materials offering Merck DS&S offering No Merck offering
1
3
3
3
llustrative Industry P&Ls based on Sources: 1Prismark 2021, 2 1Prismark 2021 & WSTS/SIA & SEMI Q1 2020; 3Representative player in the industry, non-exclusive list, not based on any underlying criteria; 4e.g. Filters, Pads, etc.; CPU = Central Processing Unit; RAM = Random Access Memory; SSD = Solid State Disk; CMOS = Complementary metal-oxide semiconductor
[in € bn] [in € bn]2
3
Wafer FabricationEquipment
From: Merck Capital Markets Day 2020 – 2020.09.16

Classification: Public
Wafer processing
offers highest value creation
potential in value chain
Unique comprehensive products and services portfolio offers end-to-end solutions, well-placed in high growth segments
110
ModuleAssembly End UsePackagingChip Design
Etching
Cleaning
Doping
Deposition
Patterning Planarization
Prototyping and Testing
ServiceProjects Delivery
Merck Delivery Systems & Services offering
Merck Semiconductor Materials offering
Merck Intermolecular products & services
Steps of Merck customers in manufacturing integrated circuits
Steps in Merck’s Delivery Systems & Services business
From: Merck Capital Markets Day 2020 – 2020.09.16

Classification: Public
Beyond a comprehensive portfolio Semiconductor Solutions also has an industry spanning customer base, supplying various end markets
111
2019 wafer capacity by region1 Selected customers per region2
1SEMI World Fab Forecast Q3 2020 - Dec 2019 capacity,
Focus on logic chips
Focus on memory chips
Focus on other chips
Semiconductor Solutions has
over 100
Customerssupplying all top 10 chip
makers and virtually all of
the top 1003
2Representative, non-exclusive list, not based on any underlying criteria
3Based on H1 2020 Sales
6%9%
12%
16%
18%
19%
19%Taiwan
NorthAmerica
S. Korea
Others
Japan
Europe
China
From: Merck Capital Markets Day 2020 – 2020.09.16

Classification: Public
Only 3 companies are currently running volume production ≤10nm These companies have the largest market shares across all nodes
112
20 1914
106 4 4 3 2
90nm 65nm130nm 32/28nm45/40nm 22/20nm 10/7nm16/14nm 5/3nm
Number of companies currently running volume production per logic chip node1
CN EU JP USKR TW
and others
USKR TWLeading edge
Specialtyaccounts currently only
1Source: Wikichip.org and own data; volume production as of Sep 2020; countries are listed in alphabetical order
Primary focus on operation efficiency Primary focus on innovation efficiency
From: Merck Capital Markets Day 2020 – 2020.09.16

Classification: Public
113
▪ Technological trends inevitably drive exponential data growth
▪ More data requires more chipsand higher complexity of chips
▪ Rising materials value added per wafer
▪ Comprehensive offering focusing on attractive materials categories
▪ Integration topline synergies▪ Critical mass and deep customer centricity➢ Better customer understanding: know-how
exchange and collaboration across DS&S and Semiconductor Materials
➢ Cutting-edge innovation and R&D capabilities
Semiconductor Solutions
Market
80%
100%
120%
140%
2023202220212020
4 to 6% CAGR1
200 to 300bps above market
Semiconductor Solutions sales guidance vs. market[Indexed 2020 = 100%]
Semiconductor MaterialsSet to outgrow highly attractive semiconductor materials market
Semiconductor Solutions:
Market:
1Source: Jan 2020 IC Insights 2018-2024 CAGR for wafer starts in million units
From: Merck Capital Markets Day 2020 – 2020.09.16

Classification: Public
Technology trends inevitably drive exponential data growth……more chips needed to generate, transfer, process & store data
114
0
50
100
150
200
2010
2011
2012
2013
2014
2015
2016
2017
2018
2019
2020
2021
2022
2023
2024
2025
TODAY
Zet
taby
te
1 Zettabyte = 1 trillion gigabytes
Data created worldwide is growing +30% annually
Source: IDC DataAge 2025 Whitepaper
All segments of data application are affected by global data growth
Technology trends strongly impact relevance of data application segments
5G Technology1
>122% CAGR
Data Center Services4
>13% CAGR
Artificial Intelligence2
>33% CAGR
Autonomous Driving5
>18% CAGR
IoT Sensors3
>24% CAGR
Technology market growth - examples
Semiconductor Solutions supports growth trend as part of “the company behind the companies, advancing digital living”
Size of global data sphere
1) alliedmarketresearch.com, Prismark 2020, CAGR 2021-2026; 2) fortunebusinessinsights.com, post-gazette.com, CAGR 2018-2026; 3) mordorintelligence.com, computerweekly.com, CAGR 2020-2025; 4) mordorintelligence.com, Prismark 2020; CAGR 2020-2025; 5G = 5th-generation cellular wireless; IoT = Internet of Things 5) mordorintelligence.com, autonomous car market value CAGR 2020-2025
From: Merck Capital Markets Day 2020 – 2020.09.16

Classification: Public
Semiconductor SolutionsCOVID-19 has vaulted the “digital transformation” by ~5 years1
115
2010 2015 2020 2025
100
20
60
140
180
Expected COVID-19 impact on global datasphere2
[zetabytes]
COVID-19 data bump
~+20%
▪ Adobe: US consumers in June 2020 spent US$73.2 bn online, up 76.2% YoY
▪ Ericsson: Global mobile network traffic +56% YoY in Q1 2020, esp. in video
▪ DE-CIX: 9.1Tbit/s internet traffic spike at Frankfurt hub March 2020; video conference traffic +50%, online & cloud gaming +25% YTD
▪ ...
COVID-19 impact on data growth expected to be positive
▪ Work-from-home/stay-at-home economy▪ Significant increase in video conferences,
online shopping, online gaming, streaming 1
2 ▪ Change in consumers’ and enterprises’ digital behavior expected to be long-lasting
3▪ Need for more, faster & more reliable data
processing, storage and bandwidth ▪ Acceleration of semiconductor demand
Semiconductor Solutions stands ready to support increased demand
1Source: McKinsey May 2020 “The COVID-19 recovery will be digital: A plan for the first 90 days”; 2Source: Seagate, IDC April 2020, Merck
From: Merck Capital Markets Day 2020 – 2020.09.16

Classification: Public
ElectronicsExpanding the limits of how small you can go
116
Lithography limitation Directed self-assembly (DSA)
Wide features AZ® shrink materials
As lines get narrower and closer together in advanced chip generation, lines tend to “stick” due to surface tension.
Block copolymer can generate small lines or contact holes by self-assembly. This allows miniaturization without expensive new equipment.
Shrink materials “shrink” the gap between lines and, hence, allow the manufacture of narrower features otherwise not possible.
Pattern collapse AZ® rinse materials
Merck delivers highly innovative solutions for complex customer problems

Classification: Public
ElectronicsDisplay Solutions - OLED material market to exceed LC material market already in 2021
117
2017 2025
13
2021
192
5
246 264
21
3% 5% 7% 32% 52% 62%
OLED shipment area / addressable material market [in % of total]x%
837772
2017 2021
1,694
2025
1,109 1,139 1,450
-8%+7%
Display shipment area1
[km²]Addressable material market2
[€m]
▪ Continued growth across all technologies
▪ OLED growing faster than LCD, but LCD to command 90+% area share for foreseeable future
+20%
+4%
▪ Material value per OLED display higher than in LCD
▪ OLED material market to exceed LC material market by 2021, but market split between many more players
1Omdia; 2Internal Business Intelligence; Acronyms: LCD = Liquid-Crystal Display, OLED = Organic Light Emitting
OLEDLiquid Crystals

Classification: Public
Electronics: year-over-year and vs. Q4 2020 Semi growth as well as recovering Surface compensate Display Solutions decline
Electronics P&L
▪ Semiconductor Solutions: solid Semiconductor Materials growth across all product categories muted by DS&S project launch phasing; continued confidence in strong outlook for FY 2021
▪ Display Solutions: down -7% organically as OLED growth not yet compensating for Liquid Crystals decline
▪ Surface Solutions: returning to 5% organic growth, mainly supported by recovery in the automotive industry
▪ Stable M&S despite higher logistic costs, while Admin and R&D are declining
▪ All P&L lines continue to reflect diligent cost management amid Bright Future transformation and Versum integration synergies
▪ EBITDA pre (+2% org.) exceeds sales growth but burdened by -7% FX headwinds
+0.0%
€900 m €861 m
Q1 2021Q1 2020 Organic Currency Portfolio
0.2%-4.5%
0.0%
€286 m €274 m 0.0%
CurrencyQ1 2020 Organic Portfolio Q1 2021
2.4%-6.5%
Net sales bridge
EBITDA pre bridge
118
Comments
[€m] IFRS Pre
Q1 2020 Q1 2021 Q1 2020 Q1 2021
Net sales 900 861 900 861M&S* -136 -135 -134 -135Admin -38 -34 -38 -33R&D -71 -67 -73 -66EBIT 116 126 151 142EBITDA 251 260 - -EBITDA pre 286 274 286 274(in % of net sales) 31.7% 31.8% 31.7% 31.8%
Totals may not add up due to rounding
* Marketing and selling expenses

Classification: Public
EMAIL: [email protected]: www.merckgroup.com/investorsFAX: +49 6151 72-913321
AMELIE SCHRADERGUNNAR ROMER
SVENJA BUNDSCHUHCONSTANTIN FEST
Institutional Investors / Analysts +49 6151 [email protected]
Assistant Investor Relations+49 6151 72-3744 [email protected]
Head of Investor Relations+49 6151 72-5271 [email protected]
Institutional Investors / Analysts +49 6151 [email protected]
ILJA DOERING
Institutional Investors / Analysts +49 6151 [email protected]
EVA STERZEL
SARA HOFMANN
ESG / Institutional & Retail Investors / AGM+49 6151 72-5355 [email protected]
Assistant Investor Relations+49 6151 72-3321 [email protected]
119