MacArthur - Roadshow Presentation - Final - 130917
56
Investors Presentation For Debenture Offering CP All Public Company Limited 17 September 2013
-
Upload
khangminh22 -
Category
Documents
-
view
0 -
download
0
Transcript of MacArthur - Roadshow Presentation - Final - 130917

Investors Presentation
For Debenture Offering
CP All Public Company Limited
17 September 2013
Disclaimer
This presentation contains some information from other sources, that CPALL does not make any representations
regarding the use, validity, accuracy, or reliability of, or the results of the use of information, data but not limited to,
all text, and images (“the Content”) on this presentation. Some content may contain forward-looking statements,
that based on management’s view upon the information currently available to us. These statement are subject to
certain risks and uncertainties that could cause the actual results materially differed from what had been previously
stated.
The Content and the Forward-looking statements state within this presentation only as the date they made. CPALL
undertakes no responsibility on the change after that date stated herein.
The material set forth herein is for informational purposes only. It should not be construed, as an offer of securities for
sale.
2
Agenda
• The Company
• Financial Performance
• The Acquisition of MAKRO
• The Offering
Appendix
• Financial Statements
• Industry Outlook
3
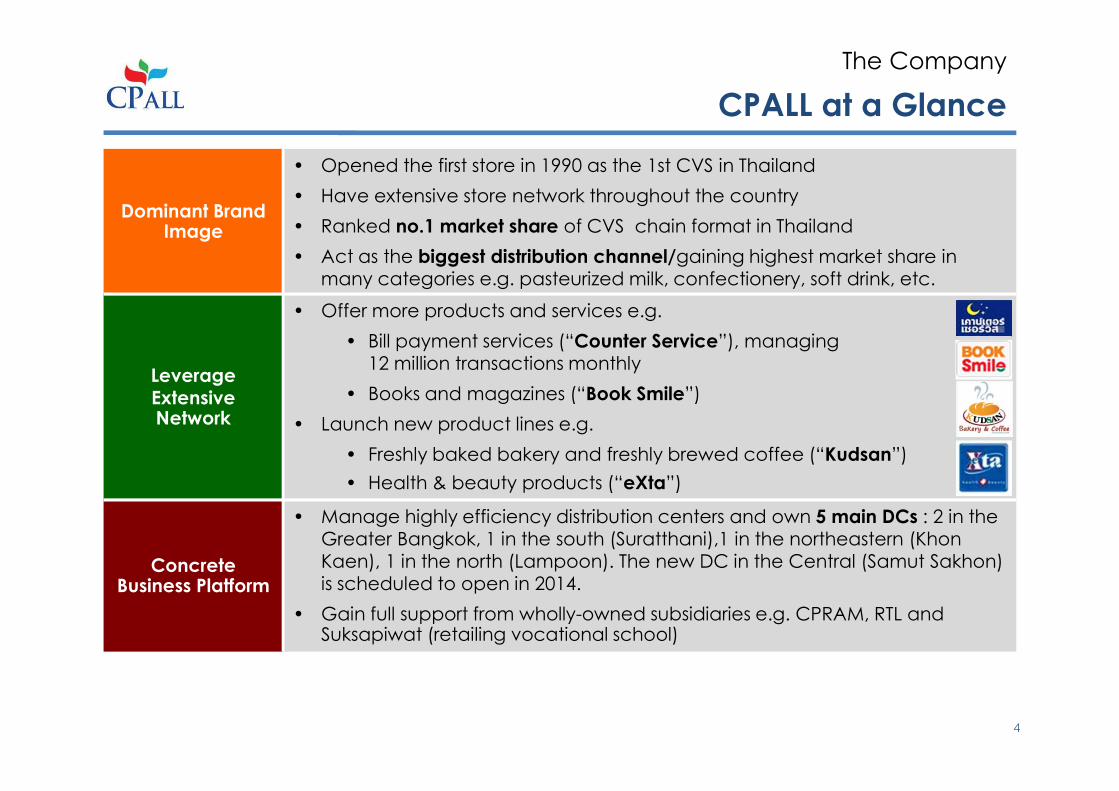
CPALL at a Glance
The Company
Dominant Brand Image
• Opened the first store in 1990 as the 1st CVS in Thailand
• Have extensive store network throughout the country
• Ranked no.1 market share of CVS chain format in Thailand
• Act as the biggest distribution channel/gaining highest market share in many categories e.g. pasteurized milk, confectionery, soft drink, etc.
Leverage ExtensiveNetwork
• Offer more products and services e.g.
• Bill payment services (“Counter Service”), managing 12 million transactions monthly
• Books and magazines (“Book Smile”)
• Launch new product lines e.g.
• Freshly baked bakery and freshly brewed coffee (“Kudsan”)
• Health & beauty products (“eXta”)
Concrete Business Platform
• Manage highly efficiency distribution centers and own 5 main DCs : 2 in the Greater Bangkok, 1 in the south (Suratthani),1 in the northeastern (KhonKaen), 1 in the north (Lampoon). The new DC in the Central (Samut Sakhon) is scheduled to open in 2014.
• Gain full support from wholly-owned subsidiaries e.g. CPRAM, RTL and Suksapiwat (retailing vocational school)
4
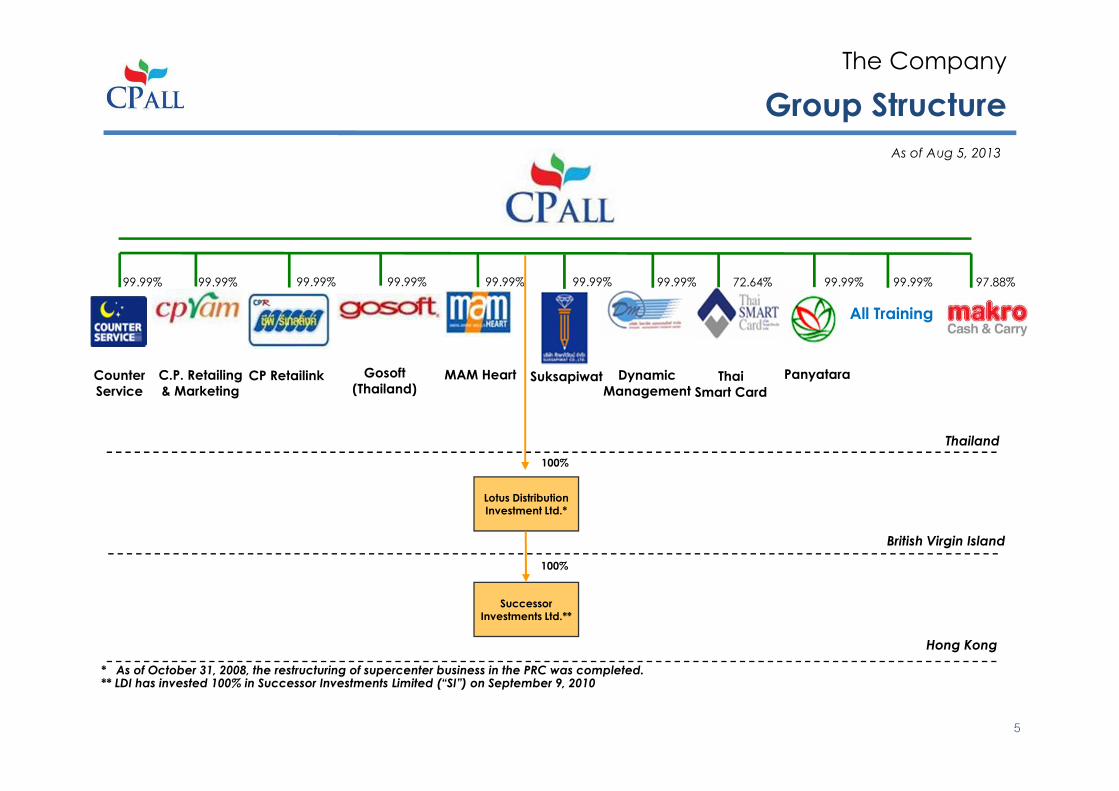
Group Structure
The Company
As of Aug 5, 2013
C.P. Retailing
& Marketing
Thailand
British Virgin Island
Lotus Distribution Investment Ltd.*
100%
* As of October 31, 2008, the restructuring of supercenter business in the PRC was completed.** LDI has invested 100% in Successor Investments Limited (“SI”) on September 9, 2010
Successor Investments Ltd.**
Hong Kong
100%
Counter
ServiceThai
Smart Card
CP Retailink Gosoft
(Thailand)MAM Heart
99.99% 99.99% 99.99% 99.99% 99.99% 99.99%
Dynamic
Management
99.99%
Suksapiwat
72.64%
Panyatara
99.99%
All Training
99.99% 97.88%
5
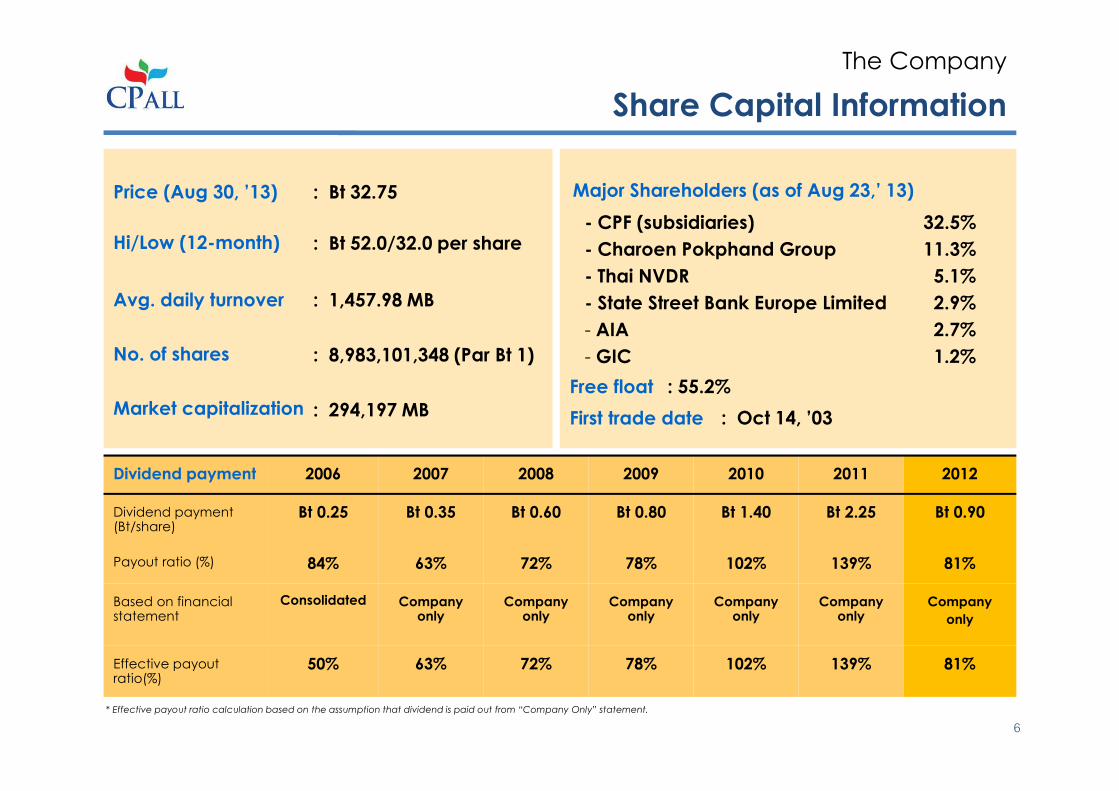
: Bt 32.75
: Bt 52.0/32.0 per share
: 1,457.98 MB
: 8,983,101,348 (Par Bt 1)
: 294,197 MB
Price (Aug 30, ’13)
Hi/Low (12-month)
Avg. daily turnover
No. of shares
Market capitalization
Major Shareholders (as of Aug 23,’ 13)
* Effective payout ratio calculation based on the assumption that dividend is paid out from “Company Only” statement.
Dividend payment 2006 2007 2008 2009 2010 2011 2012
Dividend payment (Bt/share)
Bt 0.25 Bt 0.35 Bt 0.60 Bt 0.80 Bt 1.40 Bt 2.25 Bt 0.90
Payout ratio (%) 84% 63% 72% 78% 102% 139% 81%
Based on financial statement
Consolidated Company only
Company only
Company only
Company only
Company only
Company
only
Effective payout ratio(%)
50% 63% 72% 78% 102% 139% 81%
: Oct 14, ’03First trade date
Free float : 55.2%
- CPF (subsidiaries) 32.5%
- Charoen Pokphand Group 11.3%
- Thai NVDR 5.1%
- State Street Bank Europe Limited 2.9%
- AIA 2.7%
- GIC 1.2%
Share Capital Information
6
The Company
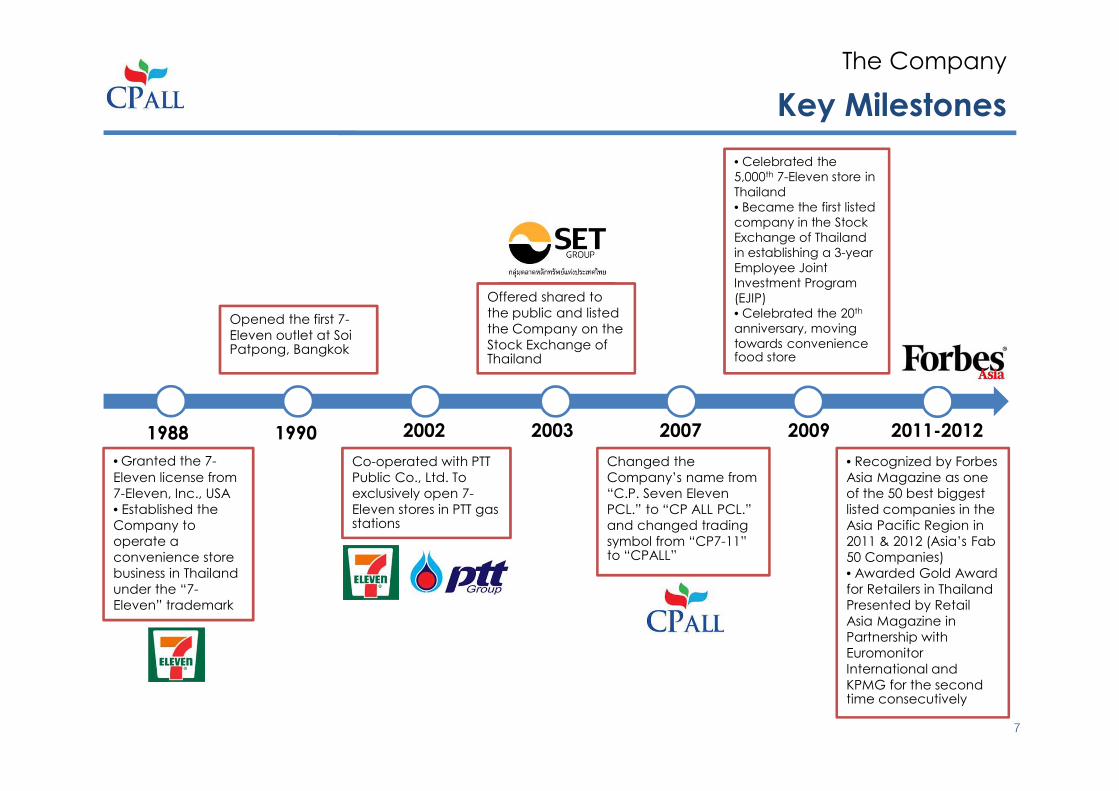
Key Milestones
The Company
1988 1990 2002 2003 2007 2009 2011-2012
• Granted the 7-
Eleven license from
7-Eleven, Inc., USA
• Established the
Company to
operate a
convenience store
business in Thailand
under the “7-
Eleven” trademark
Opened the first 7-
Eleven outlet at SoiPatpong, Bangkok
Co-operated with PTT
Public Co., Ltd. To
exclusively open 7-
Eleven stores in PTT gas stations
Offered shared to
the public and listed
the Company on the
Stock Exchange of Thailand
Changed the
Company’s name from
“C.P. Seven Eleven
PCL.” to “CP ALL PCL.”
and changed trading
symbol from “CP7-11” to “CPALL”
• Celebrated the
5,000th 7-Eleven store in
Thailand
• Became the first listed
company in the Stock
Exchange of Thailand
in establishing a 3-year
Employee Joint
Investment Program
(EJIP)
• Celebrated the 20th
anniversary, moving
towards convenience food store
• Recognized by Forbes
Asia Magazine as one
of the 50 best biggest
listed companies in the
Asia Pacific Region in
2011 & 2012 (Asia’s Fab
50 Companies)
• Awarded Gold Award
for Retailers in Thailand
Presented by Retail
Asia Magazine in
Partnership with
Euromonitor
International and
KPMG for the second time consecutively
7
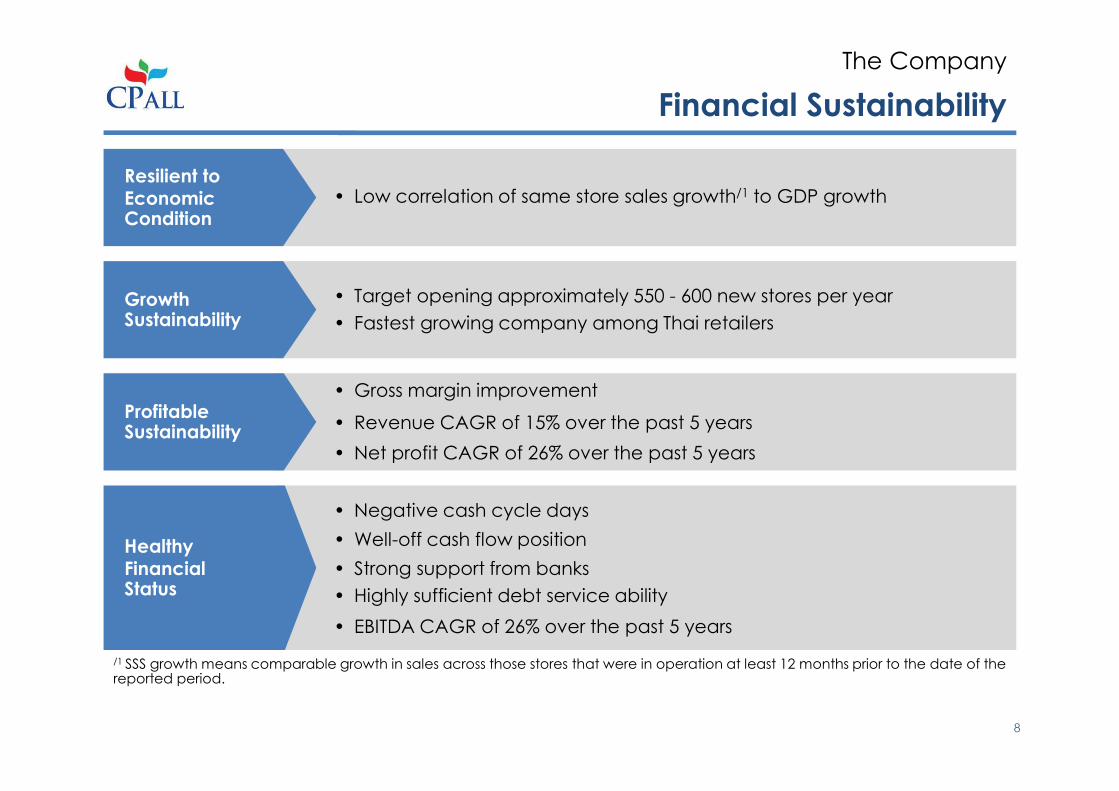
Financial Sustainability
The Company
• Low correlation of same store sales growth/1 to GDP growth
• Target opening approximately 550 - 600 new stores per year
• Fastest growing company among Thai retailers
• Gross margin improvement
• Revenue CAGR of 15% over the past 5 years
• Net profit CAGR of 26% over the past 5 years
• Negative cash cycle days
• Well-off cash flow position
• Strong support from banks
• Highly sufficient debt service ability
• EBITDA CAGR of 26% over the past 5 years
Resilient to EconomicCondition
Growth Sustainability
Profitable Sustainability
HealthyFinancial Status
/1 SSS growth means comparable growth in sales across those stores that were in operation at least 12 months prior to the date of the reported period.
8
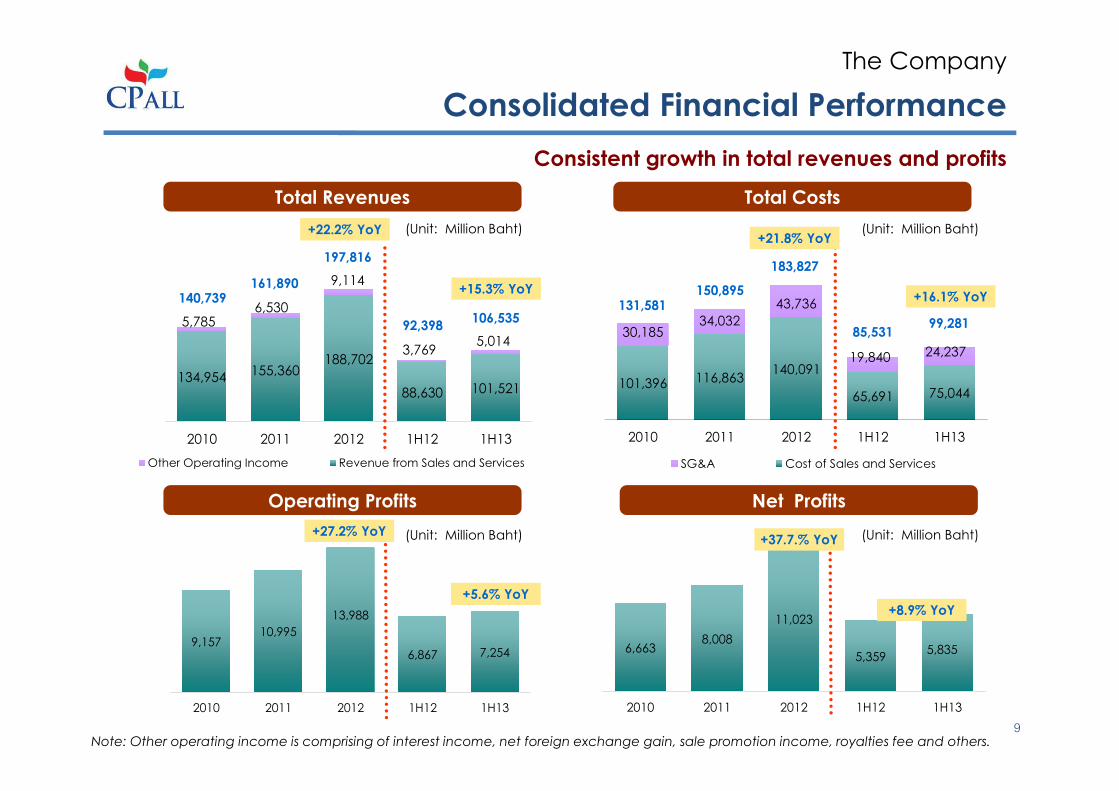
9,15710,995
13,988
6,867 7,254
2010 2011 2012 1H12 1H13
6,6638,008
11,023
5,3595,835
2010 2011 2012 1H12 1H13
134,954155,360
188,702
88,630 101,521
5,7856,530
9,114
3,7695,014
2010 2011 2012 1H12 1H13
Other Operating Income Revenue from Sales and Services
101,396 116,863140,091
65,691 75,044
30,18534,032
43,736
19,840 24,237
2010 2011 2012 1H12 1H13
SG&A Cost of Sales and Services
(Unit: Million Baht) (Unit: Million Baht)
(Unit: Million Baht) (Unit: Million Baht)
+8.9% YoY
+16.1% YoY150,895
140,739161,890 +15.3% YoY
131,581
+5.6% YoY
92,39885,531
197,816183,827
106,535 99,281
+22.2% YoY
+37.7.% YoY+27.2% YoY
+21.8% YoY
Consolidated Financial Performance
The Company
9Note: Other operating income is comprising of interest income, net foreign exchange gain, sale promotion income, royalties fee and others.
Net ProfitsOperating Profits
Total Revenues Total Costs
Consistent growth in total revenues and profits
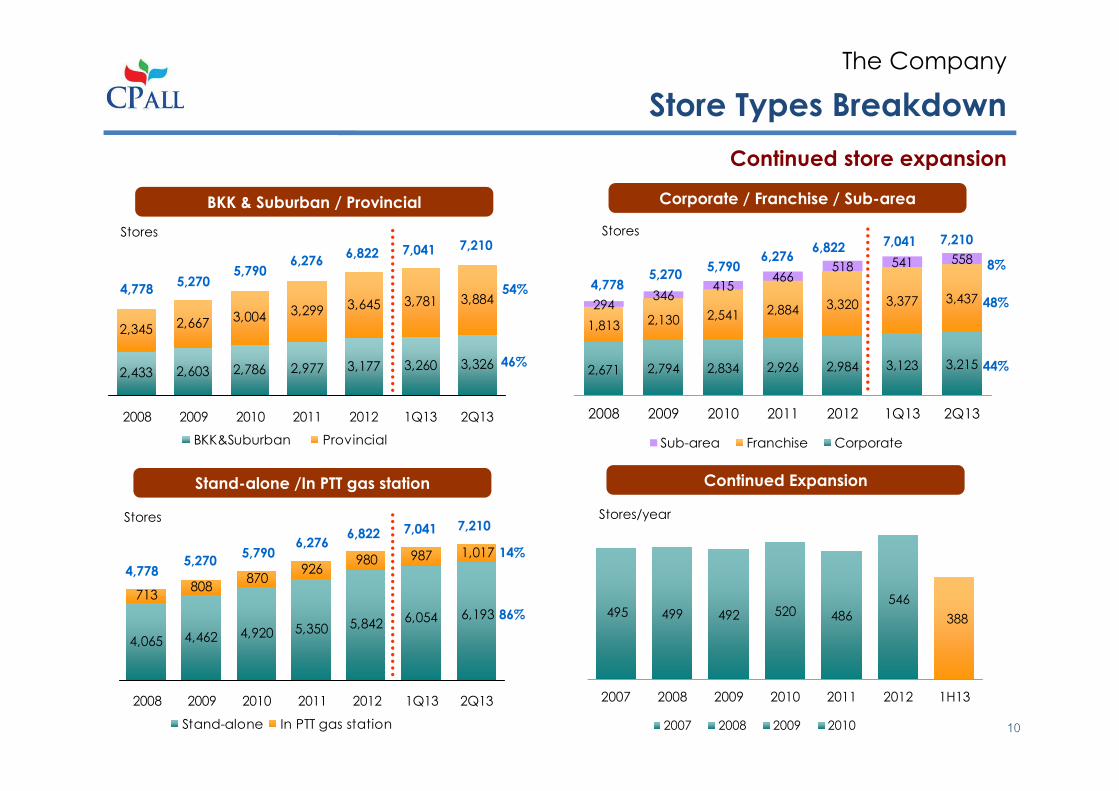
Store Types Breakdown
The Company
4,462 4,920 5,350 5,842
808870
926980 987
6,1936,054
4,065
1,017
713
2008 2009 2010 2011 2012 1Q13 2Q13
Stand-alone In PTT gas station
Stores
4,7785,270
5,7906,276
14%
86%
6,822
2,433 2,603 2,786 2,977 3,177 3,260 3,326
2,345 2,667 3,004 3,299 3,645 3,781 3,884
2008 2009 2010 2011 2012 1Q13 2Q13
BKK&Suburban Provincial
BKK & Suburban / Provincial
Stores
54%
46%2,671 2,794 2,834 2,926 2,984 3,123 3,215
1,813 2,130 2,541 2,884 3,320 3,377 3,437294346
415466
518 541 558
2008 2009 2010 2011 2012 1Q13 2Q13
Sub-area Franchise Corporate
Corporate / Franchise / Sub-area
Stores
44%
48%
8%
Stand-alone /In PTT gas station
7,041 7,210
4,7785,270
5,7906,276
6,822 7,041 7,210
4,7785,270
5,7906,276
6,822 7,041 7,210
495 499 492 520 486
546
388
2007 2008 2009 2010 2011 2012 1H13
2007 2008 2009 2010
Continued Expansion
Stores/year
10
Continued store expansion
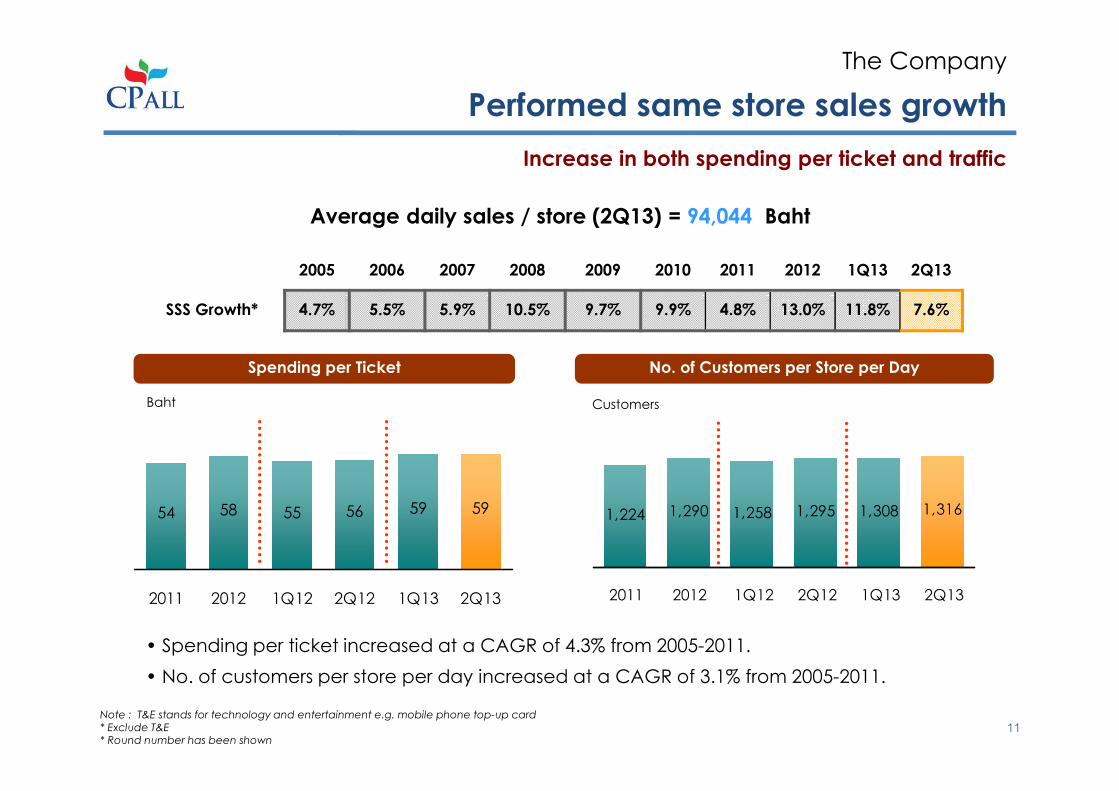
Performed same store sales growth
The Company
54 58 55 56 59 59
2011 2012 1Q12 2Q12 1Q13 2Q13
1,224 1,290 1,258 1,295 1,308 1,316
2011 2012 1Q12 2Q12 1Q13 2Q13
Note : T&E stands for technology and entertainment e.g. mobile phone top-up card* Exclude T&E* Round number has been shown
Average daily sales / store (2Q13) = 94,044 Baht
2005 2006 2007 2008 2009 2010 2011 2012 1Q13 2Q13
SSS Growth* 4.7% 5.5% 5.9% 10.5% 9.7% 9.9% 4.8% 13.0% 11.8% 7.6%
Baht Customers
• Spending per ticket increased at a CAGR of 4.3% from 2005-2011.
• No. of customers per store per day increased at a CAGR of 3.1% from 2005-2011.
Spending per Ticket No. of Customers per Store per Day
Increase in both spending per ticket and traffic
11

Product Sales Mix & Gross Margin Mix
The Company
Maintained gross margin yoy
72.8% 72.8% 72.8% 73.6% 72.7% 73.3%
27.2% 27.2% 27.2% 26.4% 27.3% 26.7%
2011 2012 1Q12 2Q12 1Q13 2Q13
Foods Non-foods
25.9%25.8%26.0%
25.5%25.7%
25.5%
24.6%
23.9%
24.4% 24.3%
24.0%24.3%
25.4%25.6%
25.1%
25.4%
25.1%
25.6%
2011 2012 1Q12 2Q12 1Q13 2Q13
Total Products
Non-foods
Foods
Product Sales Mix (excl. T&E)
Gross Margin Mix (excl. T&E)
Food Service i.e. RTE
Processed Food
Beverage
12
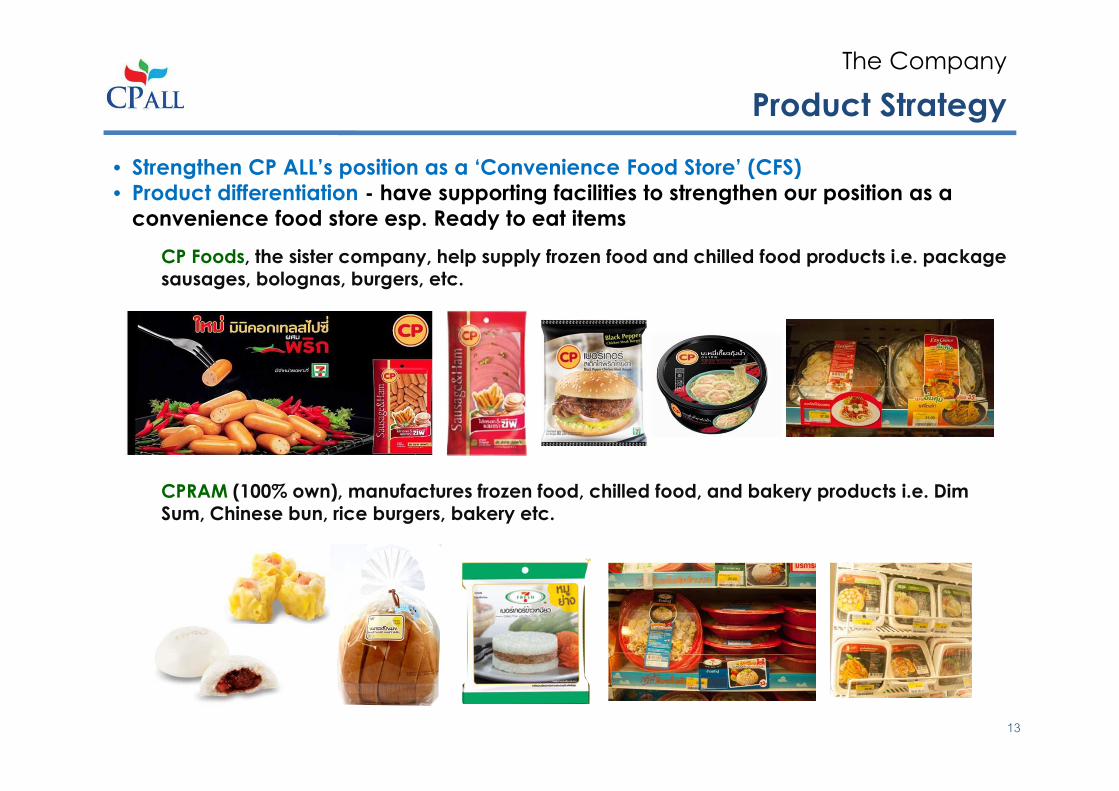
Product Strategy
The Company
13
• Strengthen CP ALL’s position as a ‘Convenience Food Store’ (CFS)
• Product differentiation - have supporting facilities to strengthen our position as a
convenience food store esp. Ready to eat items
CP Foods, the sister company, help supply frozen food and chilled food products i.e. package sausages, bolognas, burgers, etc.
CPRAM (100% own), manufactures frozen food, chilled food, and bakery products i.e. Dim Sum, Chinese bun, rice burgers, bakery etc.
Other services
The Company
14
• Financial services – install ATMs and provide in-store bill payments service
ATM: partner with all commercial banks to offer more than 6,000 ATM services at the stores
Counter Services ( 100% own ): provide financial payment services of more than 10 million transactions/month, with over 300 venders i.e. utilities, credit cards, telecom, transportation, entertainment, etc.
Supporting Facilities
• Maintenance service
Retaillink ( 100% own ): import equipment and provide service maintenance, becoming one of the largest company with over 1,000 mechanical staffs.
• Educational service
Suksapiwat ( 100% own ), be the first to offer work-based learning program in Thailand. This helps secure manpower to support growth for 7-Eleven stores.
Well-built Infrastructure
The Company
15
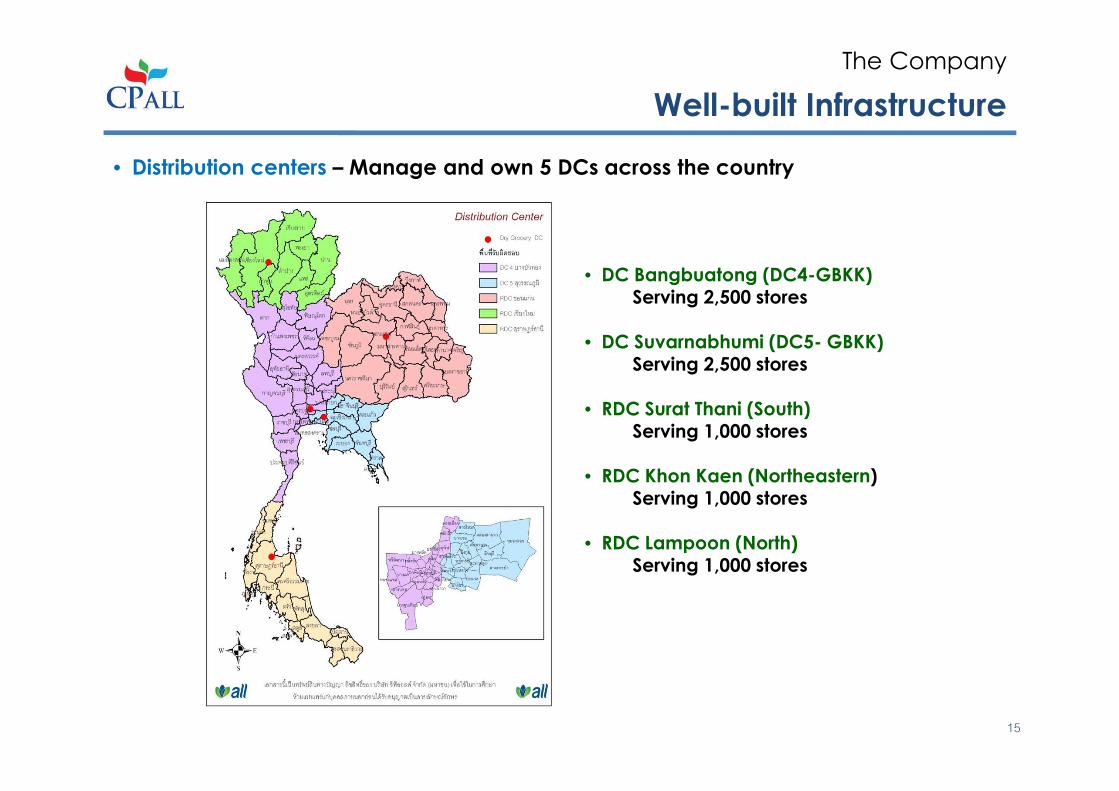
• Distribution centers – Manage and own 5 DCs across the country
• DC Bangbuatong (DC4-GBKK) Serving 2,500 stores
• DC Suvarnabhumi (DC5- GBKK)Serving 2,500 stores
• RDC Surat Thani (South)Serving 1,000 stores
• RDC Khon Kaen (Northeastern)Serving 1,000 stores
• RDC Lampoon (North)Serving 1,000 stores
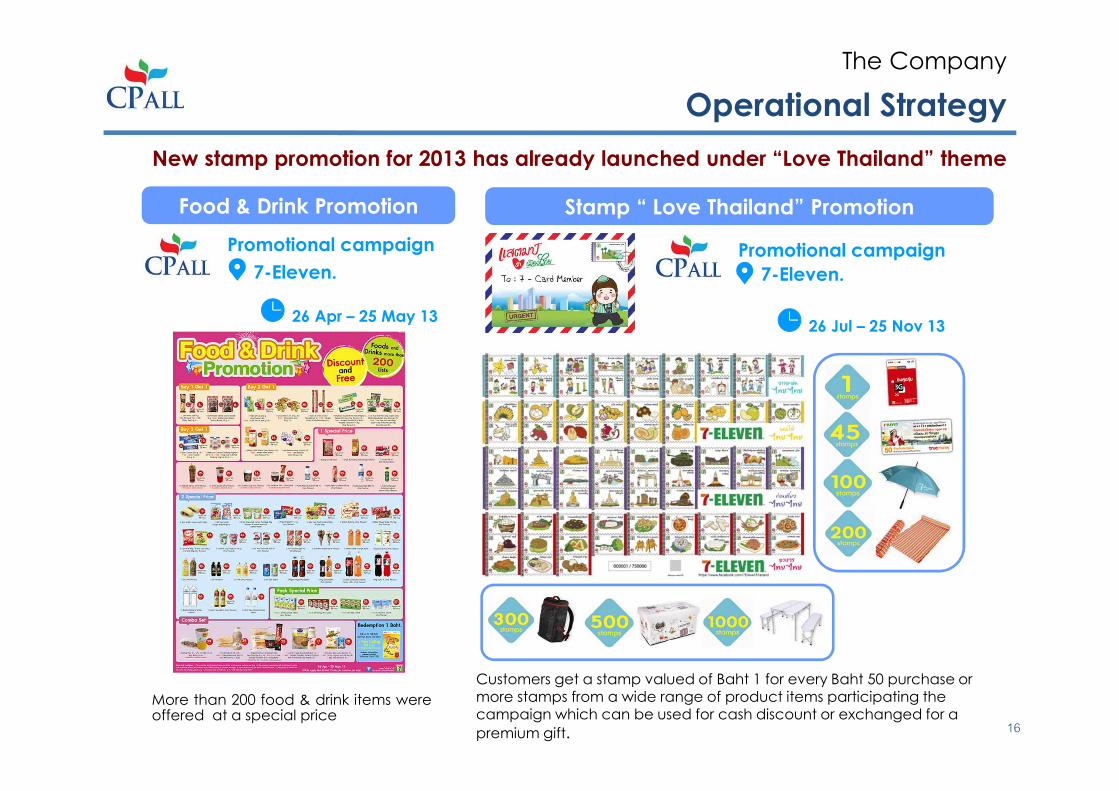
Operational Strategy
The Company
Stamp “ Love Thailand” PromotionFood & Drink Promotion
Promotional campaign
7-Eleven.
26 Apr – 25 May 1326 Jul – 25 Nov 13
Promotional campaign
7-Eleven.
More than 200 food & drink items were offered at a special price
Customers get a stamp valued of Baht 1 for every Baht 50 purchase or more stamps from a wide range of product items participating the campaign which can be used for cash discount or exchanged for a
premium gift.
New stamp promotion for 2013 has already launched under “Love Thailand” theme
16
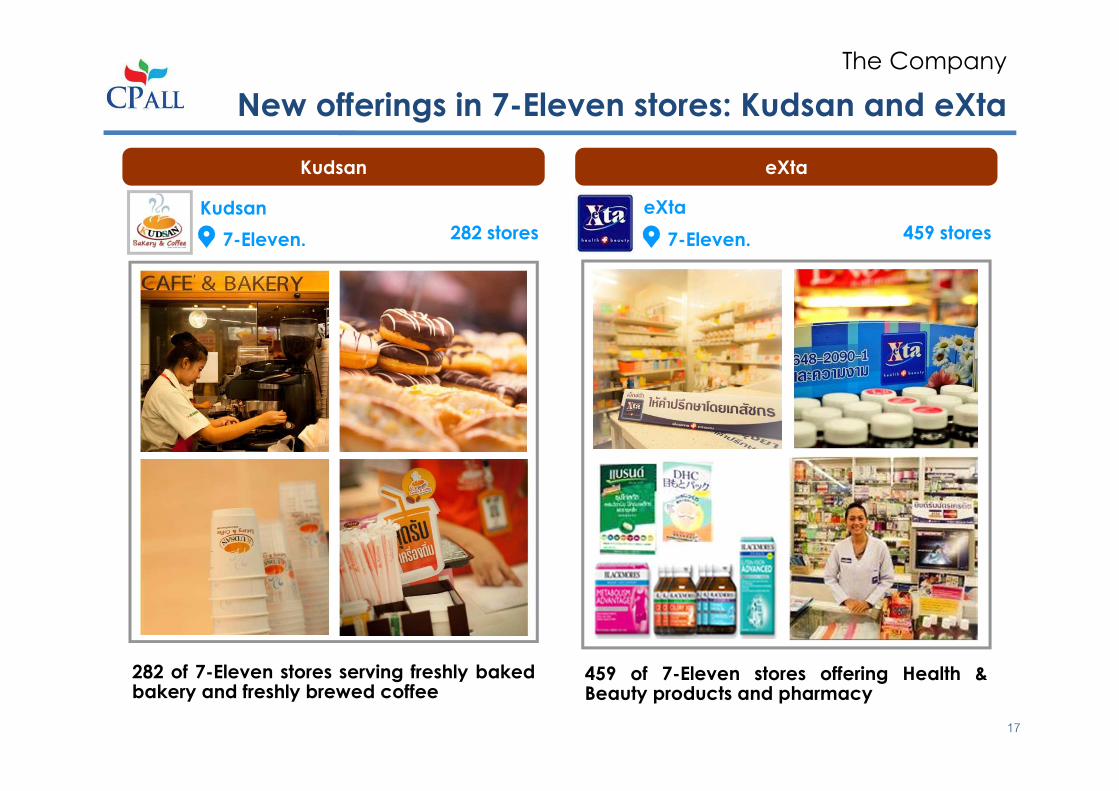
New offerings in 7-Eleven stores: Kudsan and eXta
The Company
282 of 7-Eleven stores serving freshly baked bakery and freshly brewed coffee
Kudsan
Kudsan
282 stores
eXta
eXta
459 stores
459 of 7-Eleven stores offering Health & Beauty products and pharmacy
7-Eleven. 7-Eleven.
17
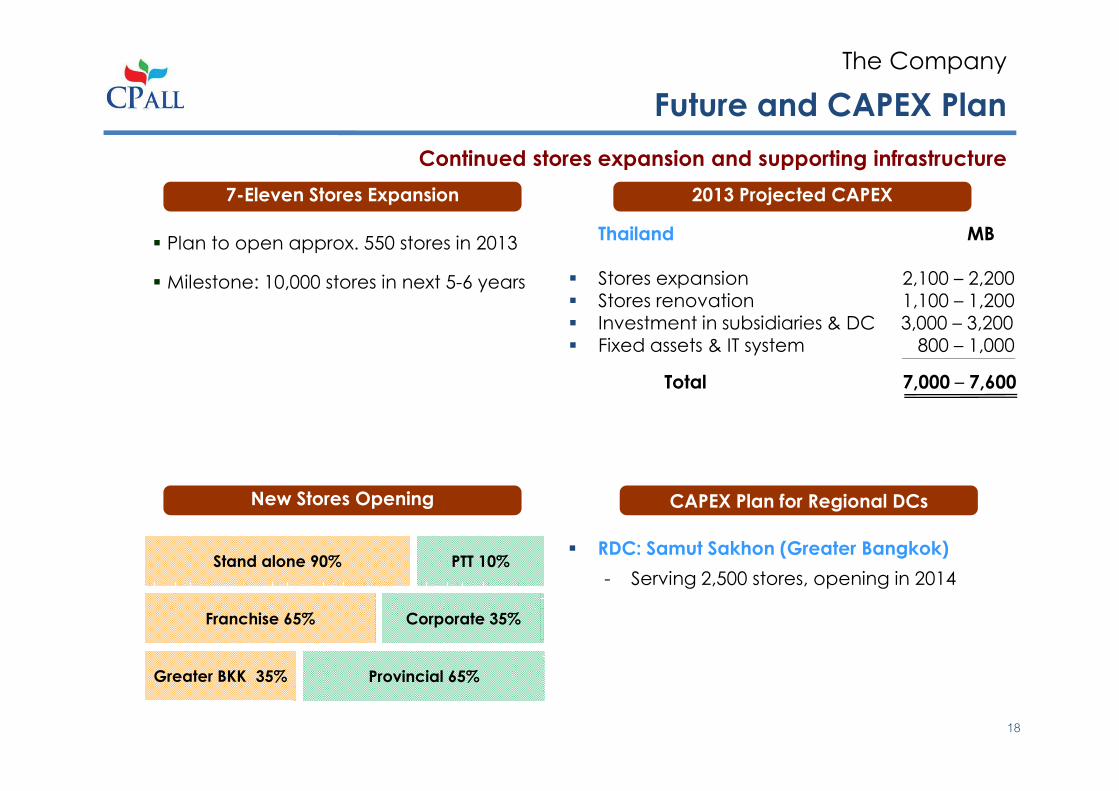
Future and CAPEX Plan
The Company
Continued stores expansion and supporting infrastructure
7-Eleven Stores Expansion 2013 Projected CAPEX
CAPEX Plan for Regional DCsNew Stores Opening
Thailand MB
� Stores expansion 2,100 – 2,200� Stores renovation 1,100 – 1,200� Investment in subsidiaries & DC 3,000 – 3,200� Fixed assets & IT system 800 – 1,000
Total 7,000 – 7,600
� Plan to open approx. 550 stores in 2013
� Milestone: 10,000 stores in next 5-6 years
Stand alone 90% PTT 10%
Franchise 65% Corporate 35%
Greater BKK 35% Provincial 65%
� RDC: Samut Sakhon (Greater Bangkok)
- Serving 2,500 stores, opening in 2014
18
Agenda
• The Company
• Financial Performance
• The Acquisition of MAKRO
• The Offering
Appendix
• Financial Statements
• Industry Outlook
19
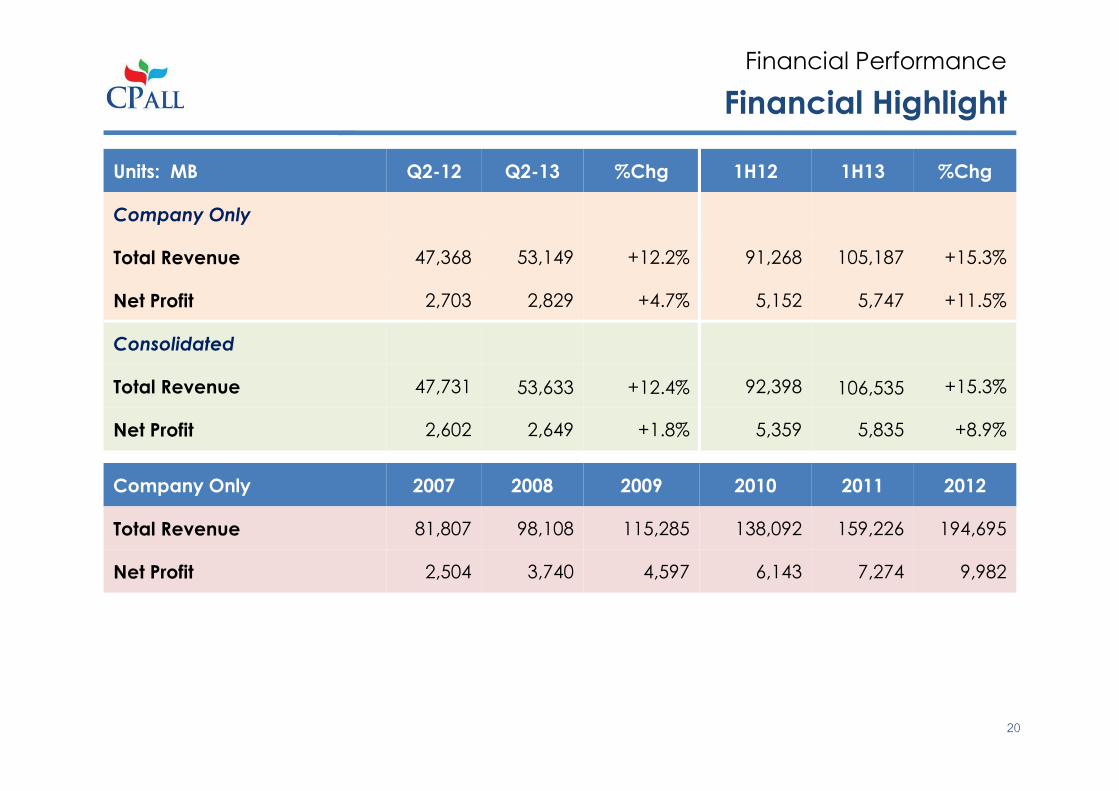
Financial Highlight
Financial Performance
Units: MB Q2-12 Q2-13 %Chg 1H12 1H13 %Chg
Company Only
Total Revenue 47,368 53,149 +12.2% 91,268 105,187 +15.3%
Net Profit 2,703 2,829 +4.7% 5,152 5,747 +11.5%
Consolidated
Total Revenue 47,731 53,633 +12.4% 92,398 106,535 +15.3%
Net Profit 2,602 2,649 +1.8% 5,359 5,835 +8.9%
Company Only 2007 2008 2009 2010 2011 2012
Total Revenue 81,807 98,108 115,285 138,092 159,226 194,695
Net Profit 2,504 3,740 4,597 6,143 7,274 9,982
20
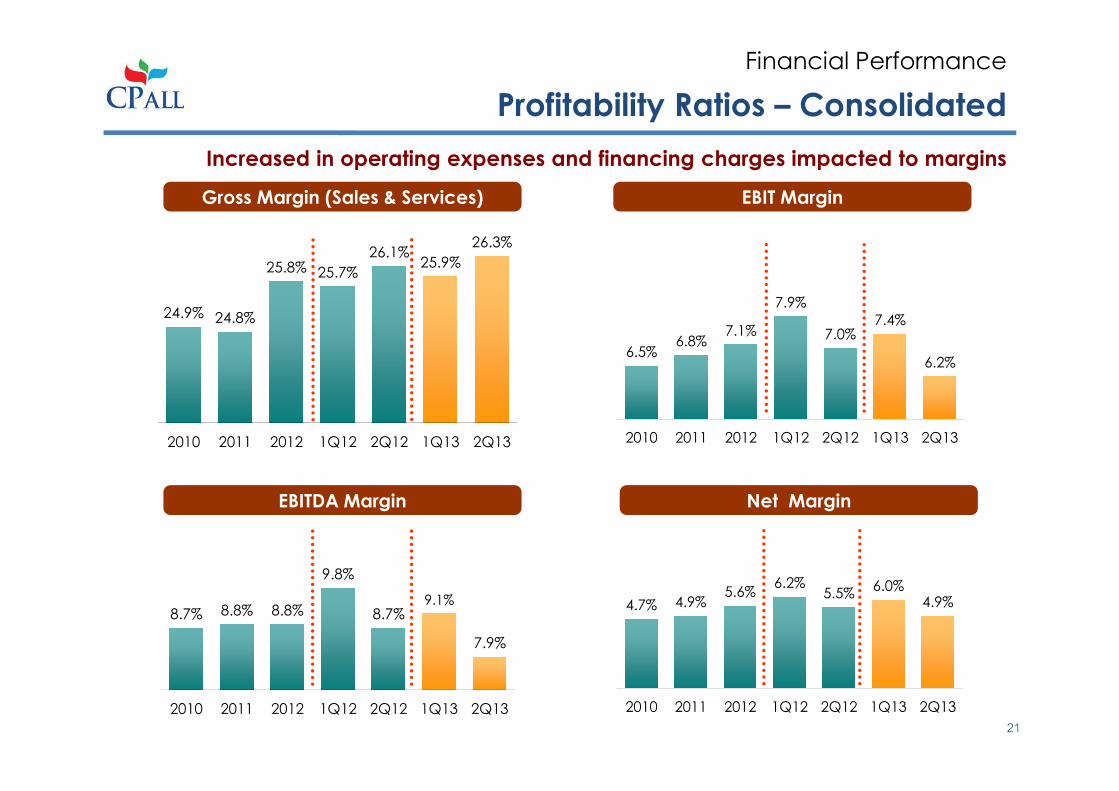
4.7% 4.9%5.6%
6.2%5.5%
6.0%4.9%
2010 2011 2012 1Q12 2Q12 1Q13 2Q13
8.7% 8.8% 8.8%
9.8%
8.7%9.1%
7.9%
2010 2011 2012 1Q12 2Q12 1Q13 2Q13
Profitability Ratios – Consolidated
Financial Performance
Gross Margin (Sales & Services) EBIT Margin
Net MarginEBITDA Margin
24.9% 24.8%
25.8% 25.7%
26.1%25.9%
26.3%
2010 2011 2012 1Q12 2Q12 1Q13 2Q13
6.5%6.8%
7.1%
7.9%
7.0%7.4%
6.2%
2010 2011 2012 1Q12 2Q12 1Q13 2Q13
Increased in operating expenses and financing charges impacted to margins
21
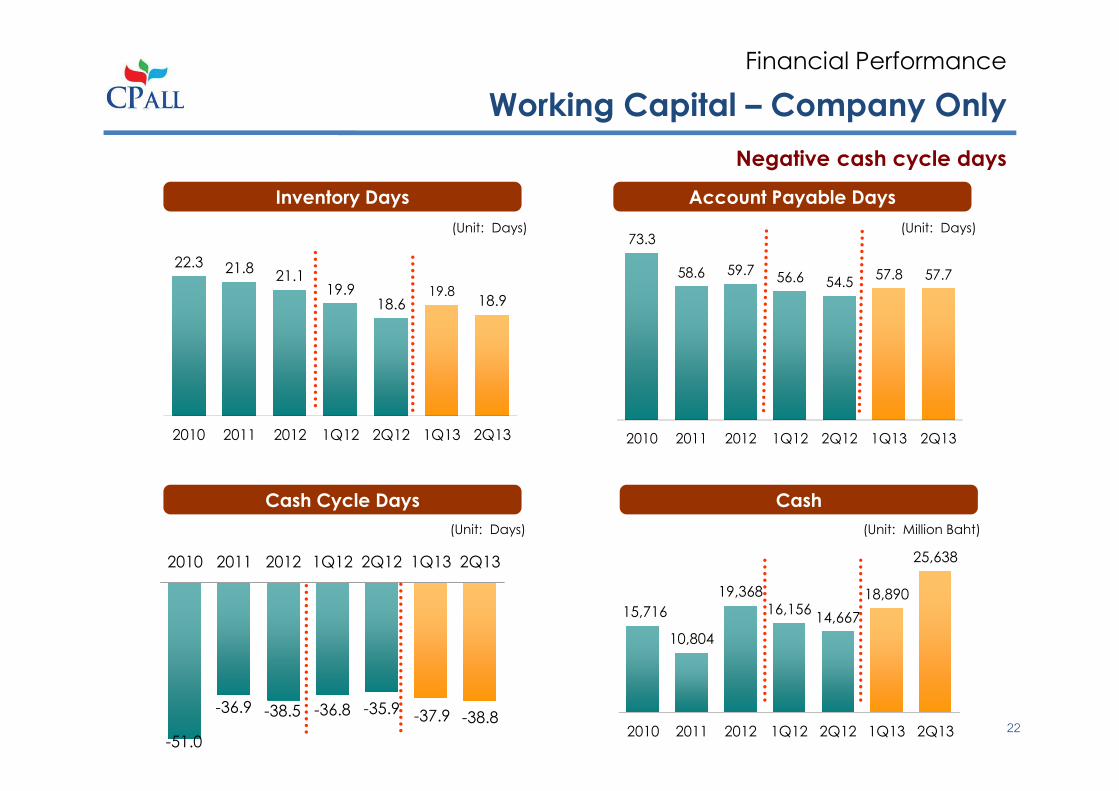
Working Capital – Company Only
Financial Performance
Inventory Days Account Payable Days
CashCash Cycle Days
Negative cash cycle days
73.3
58.6 59.756.6 54.5
57.8 57.7
2010 2011 2012 1Q12 2Q12 1Q13 2Q13
22.3 21.821.1
19.918.6
19.818.9
2010 2011 2012 1Q12 2Q12 1Q13 2Q13
(Unit: Days) (Unit: Days)
-51.0
-36.9 -38.5 -36.8 -35.9 -37.9 -38.8
2010 2011 2012 1Q12 2Q12 1Q13 2Q13
15,716
10,804
19,368
16,15614,667
18,890
25,638
2010 2011 2012 1Q12 2Q12 1Q13 2Q13
(Unit: Days) (Unit: Million Baht)
22
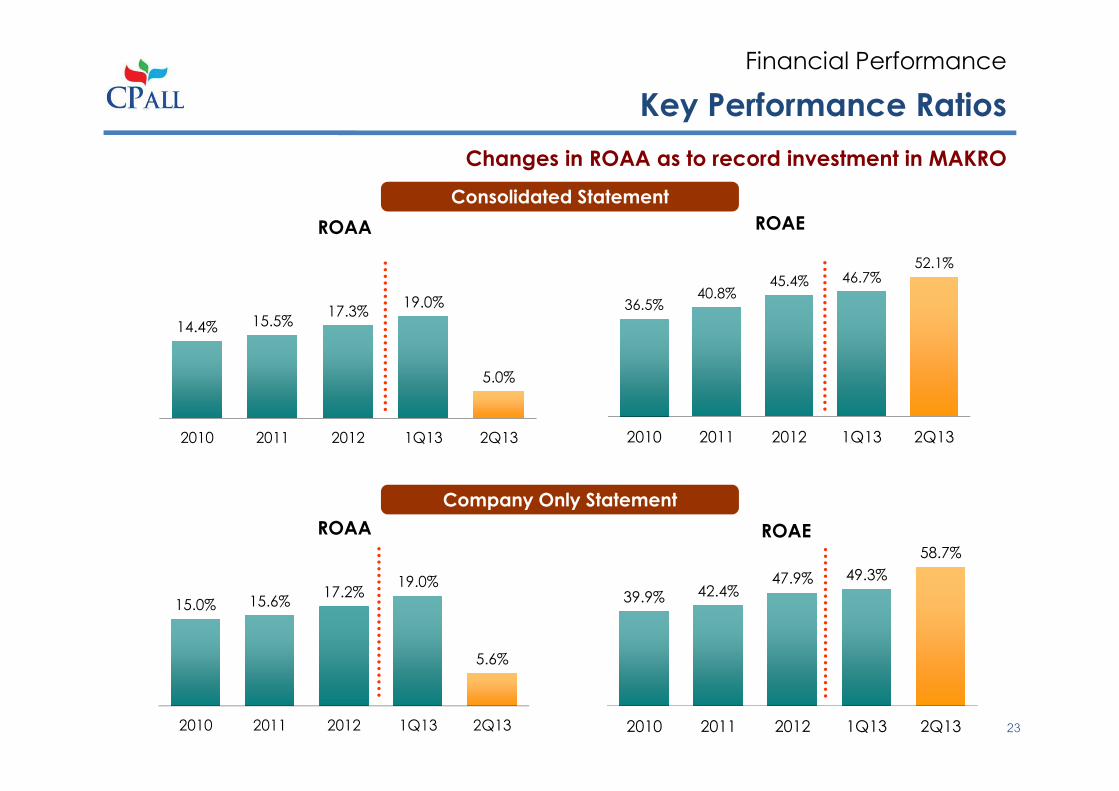
Key Performance Ratios
Financial Performance
Consolidated Statement
Company Only Statement
Changes in ROAA as to record investment in MAKRO
39.9% 42.4%47.9% 49.3%
58.7%
2010 2011 2012 1Q13 2Q13
36.5%40.8%
45.4% 46.7%52.1%
2010 2011 2012 1Q13 2Q13
15.0% 15.6%17.2%
19.0%
5.6%
2010 2011 2012 1Q13 2Q13
14.4% 15.5%17.3%
19.0%
5.0%
2010 2011 2012 1Q13 2Q13
ROAA ROAE
ROAA ROAE
23
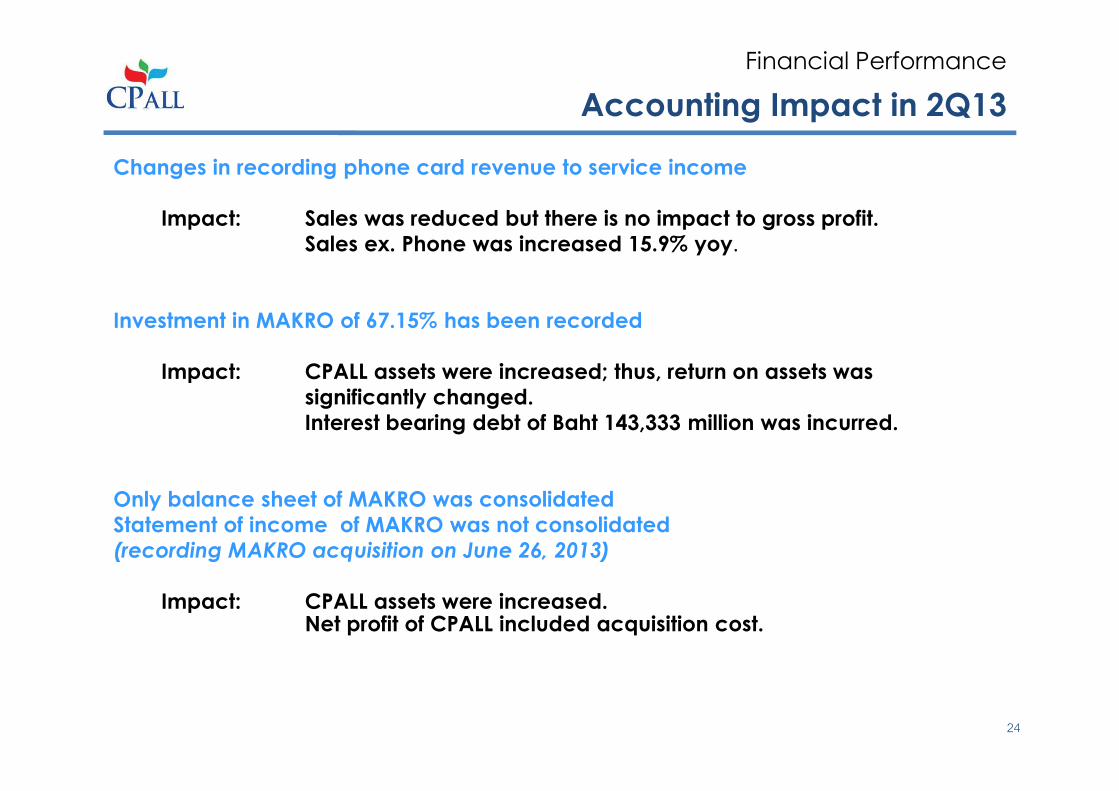
Accounting Impact in 2Q13
Financial Performance
Changes in recording phone card revenue to service income
Impact: Sales was reduced but there is no impact to gross profit.
Sales ex. Phone was increased 15.9% yoy.
Investment in MAKRO of 67.15% has been recorded
Impact: CPALL assets were increased; thus, return on assets was
significantly changed.
Interest bearing debt of Baht 143,333 million was incurred.
Only balance sheet of MAKRO was consolidated
Statement of income of MAKRO was not consolidated
(recording MAKRO acquisition on June 26, 2013)
Impact: CPALL assets were increased.Net profit of CPALL included acquisition cost.
24

Agenda
• The Company
• Financial Performance
• The Acquisition of MAKRO
• The Offering
Appendix
• Financial Statements
• Industry Outlook
25

Transaction Overview
The Acquisition of MAKRO
Transaction Structure
CPALL to acquire MAKRO in 2 steps
• Initial Acquisition: Acquire shares of
1) Siam Makro PCL (“MAKRO”)
2) Siam Makro Holdings Co., Ltd. and
3) OHT Co., Ltd. resulting in a total shareholding,
both direct and indirect, in MAKRO of approx.64.35% including MAKRO’s
Brand, IP and IT
• Tender Offer: Subsequently trigger mandatory tender offer for remaining shares
Transaction Size THB 188,880 mm for total equity value
Tender Offer Price THB 787 per share
Acquisition Funding Debt financing and internal cash flow
Conditions Precedent CPALL’s EGM’s approval with 75% supporting votes
Timeline CPALL’s EGM on 12 Jun 2013
• Initial acquisition after CPALL’s EGM approval in June 26, 2013
• T/O period in 28 Jul – 5 Aug 2013
• Completion in August 8, 2013
As of August 5, 2013, which was the last tender offer date, CPALL
successfully finished acquiring 97.88% shares of MAKRO
26
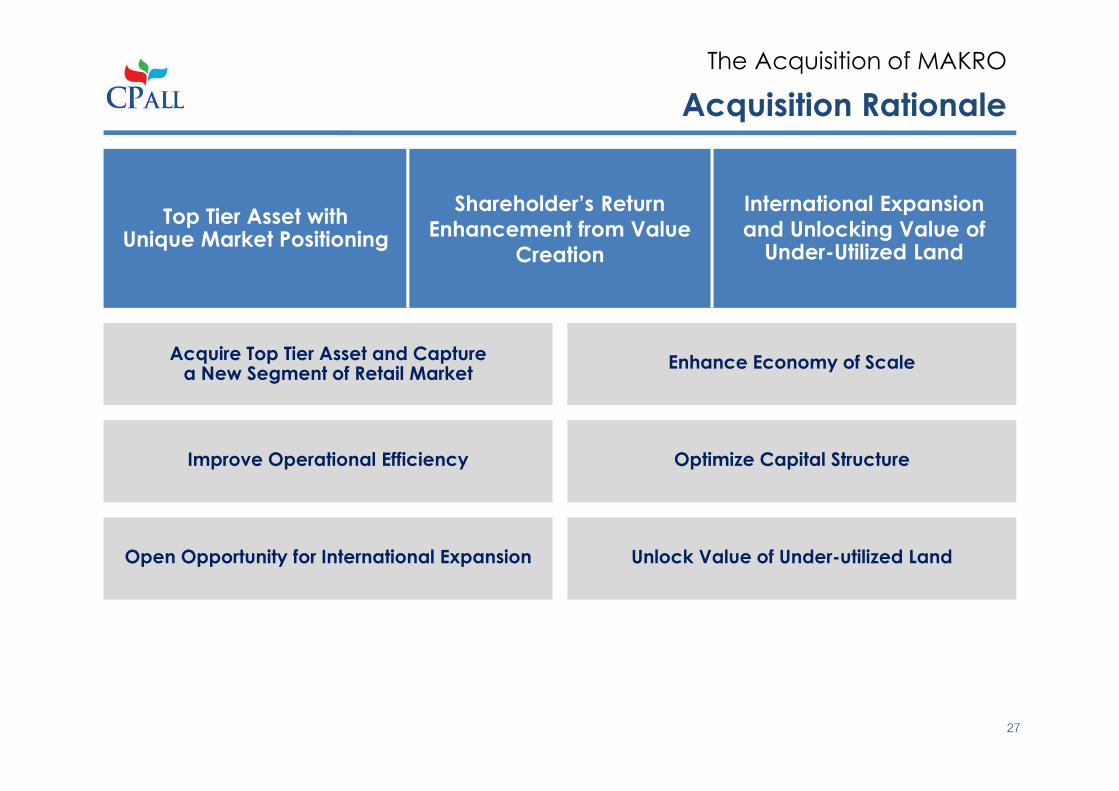
Acquisition Rationale
The Acquisition of MAKRO
Top Tier Asset with Unique Market Positioning
Shareholder’s Return
Enhancement from Value
Creation
International Expansion
and Unlocking Value ofUnder-Utilized Land
Acquire Top Tier Asset and Capturea New Segment of Retail Market
Improve Operational Efficiency
Open Opportunity for International Expansion
Enhance Economy of Scale
Optimize Capital Structure
Unlock Value of Under-utilized Land
27
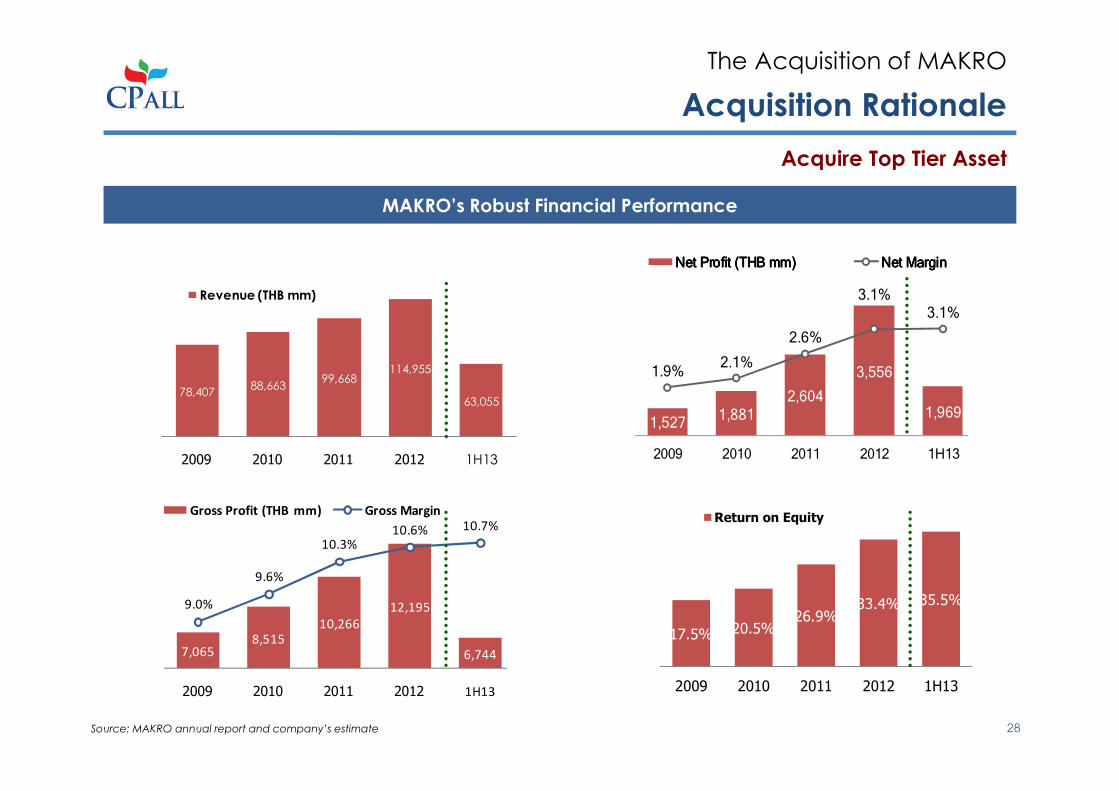
7,0658,515
10,266
12,195
6,744
9.0%
9.6%
10.3%10.6% 10.7%
8%
9%
10%
11%
5,000
7,000
9,000
11,000
13,000
2009 2010 2011 2012 1H13
Gross Profit (THB mm) Gross Margin
Acquisition Rationale
The Acquisition of MAKRO
28
Acquire Top Tier Asset
MAKRO’s Robust Financial Performance
1,5271,881
2,604
3,556
1,969
1.9%2.1%
2.6%
3.1%3.1%
1%
2%
3%
4%
1,000
2,000
3,000
4,000
2009 2010 2011 2012 1H13
Net Profit (THB mm)Net Profit (THB mm)Net Profit (THB mm)Net Profit (THB mm) Net MarginNet MarginNet MarginNet Margin
Source: MAKRO annual report and company’s estimate
78,40788,663
99,668114,955
63,055
2009 2010 2011 2012 1H13
Revenue (THB mm)
17.5% 20.5%26.9%
33.4% 35.5%
2009 2010 2011 2012 1H13
Return on Equity
Acquisition Rationale
The Acquisition of MAKRO
29
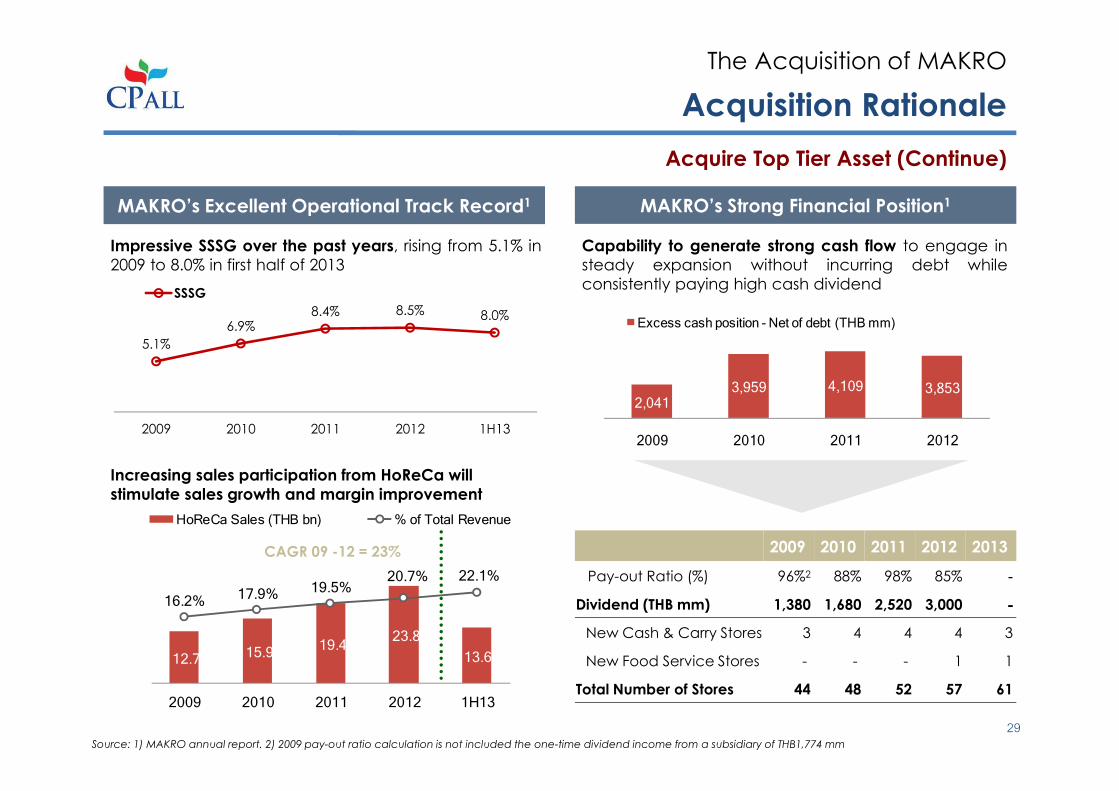
Acquire Top Tier Asset (Continue)
MAKRO’s Excellent Operational Track Record1
Impressive SSSG over the past years, rising from 5.1% in
2009 to 8.0% in first half of 2013
Increasing sales participation from HoReCa will
stimulate sales growth and margin improvement
12.7 15.9 19.4
23.8
13.6
16.2%17.9% 19.5%
20.7% 22.1%
0.0%
5.0%
10.0%
15.0%
20.0%
25.0%
-
5.0
10.0
15.0
20.0
25.0
2009 2010 2011 2012 1H13
HoReCa Sales (THB bn) % of Total Revenue
CAGR 09 -12 = 23%
MAKRO’s Strong Financial Position1
Capability to generate strong cash flow to engage in
steady expansion without incurring debt while
consistently paying high cash dividend
2,0413,959 4,109 3,853
2009 2010 2011 2012
Excess cash position - Net of debt (THB mm)
2009 2010 2011 2012 2013
Pay-out Ratio (%) 96%2 88% 98% 85% -
Dividend (THB mm) 1,380 1,680 2,520 3,000 ----
New Cash & Carry Stores 3 4 4 4 3
New Food Service Stores - - - 1 1
Total Number of Stores 44 48 52 57 61
Source: 1) MAKRO annual report. 2) 2009 pay-out ratio calculation is not included the one-time dividend income from a subsidiary of THB1,774 mm
5.1%
6.9%8.4% 8.5% 8.0%
2009 2010 2011 2012 1H13
SSSG
Acquisition Rationale
The Acquisition of MAKRO
30
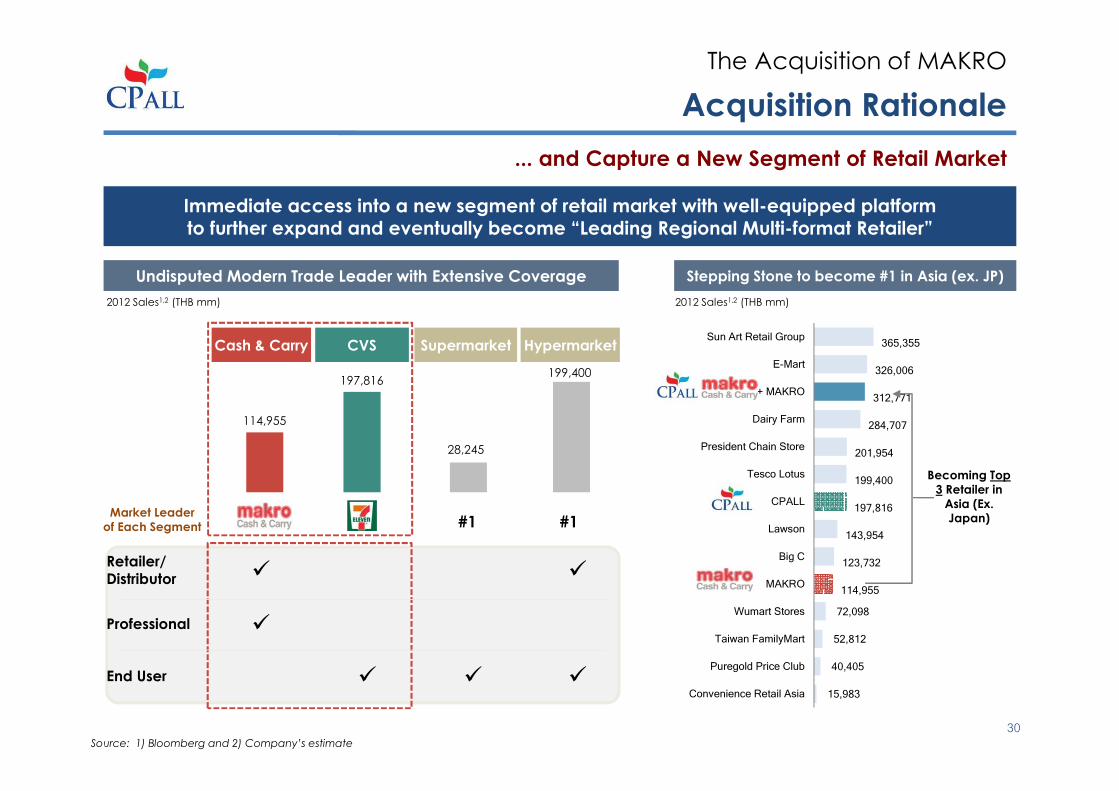
... and Capture a New Segment of Retail Market
Retailer/Distributor � �
Professional �
End User � � �
Source: 1) Bloomberg and 2) Company’s estimate
Undisputed Modern Trade Leader with Extensive Coverage Stepping Stone to become #1 in Asia (ex. JP)
2012 Sales1,2 (THB mm)
HypermarketSupermarket
Market Leader
of Each Segment
199,400
28,245
Cash & Carry
114,955
CVS
197,816
#1 #1
15,983
40,405
52,812
72,098
114,955
123,732
143,954
197,816
199,400
201,954
284,707
312,771
326,006
365,355
Convenience Retail Asia
Puregold Price Club
Taiwan FamilyMart
Wumart Stores
MAKRO
Big C
Lawson
CPALL
Tesco Lotus
President Chain Store
Dairy Farm
CPALL + MAKRO
E-Mart
Sun Art Retail Group
Becoming Top
3 Retailer in
Asia (Ex. Japan)
Immediate access into a new segment of retail market with well-equipped platformto further expand and eventually become “Leading Regional Multi-format Retailer”
2012 Sales1,2 (THB mm)
Acquisition Rationale
The Acquisition of MAKRO
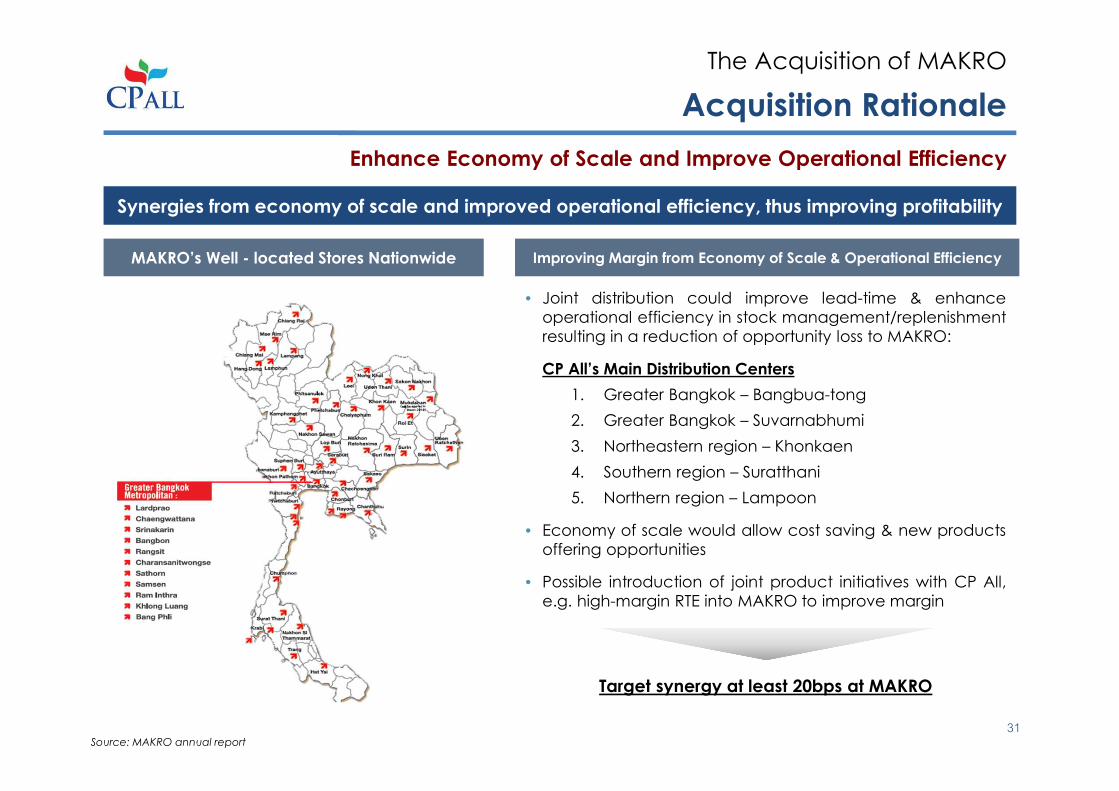
31
Enhance Economy of Scale and Improve Operational Efficiency
Synergies from economy of scale and improved operational efficiency, thus improving profitability
• Joint distribution could improve lead-time & enhance
operational efficiency in stock management/replenishment
resulting in a reduction of opportunity loss to MAKRO:
CP All’s Main Distribution Centers
1. Greater Bangkok – Bangbua-tong
2. Greater Bangkok – Suvarnabhumi
3. Northeastern region – Khonkaen
4. Southern region – Suratthani
5. Northern region – Lampoon
• Economy of scale would allow cost saving & new products
offering opportunities
• Possible introduction of joint product initiatives with CP All,
e.g. high-margin RTE into MAKRO to improve margin
MAKRO’s Well - located Stores Nationwide Improving Margin from Economy of Scale & Operational Efficiency
Source: MAKRO annual report
Target synergy at least 20bps at MAKRO
Acquisition Rationale
The Acquisition of MAKRO
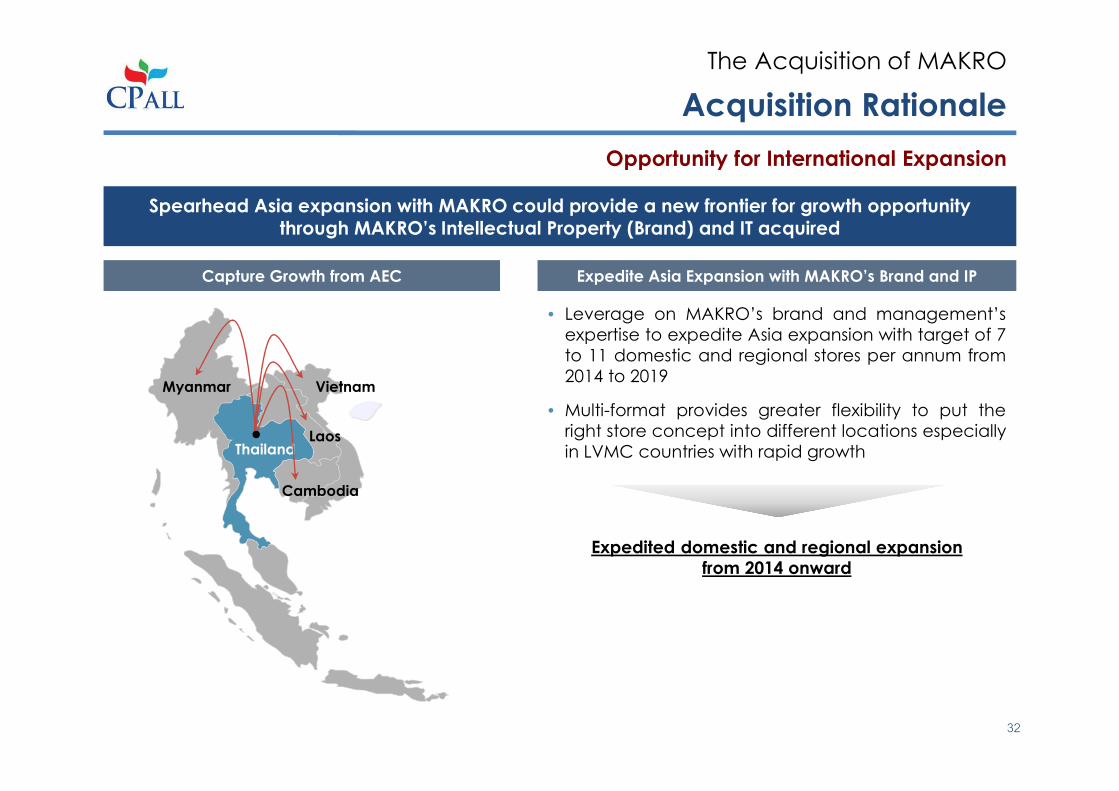
32
Opportunity for International Expansion
Spearhead Asia expansion with MAKRO could provide a new frontier for growth opportunity through MAKRO’s Intellectual Property (Brand) and IT acquired
• Leverage on MAKRO’s brand and management’s
expertise to expedite Asia expansion with target of 7
to 11 domestic and regional stores per annum from
2014 to 2019
• Multi-format provides greater flexibility to put the
right store concept into different locations especially
in LVMC countries with rapid growth
Expedited domestic and regional expansion
from 2014 onward
Myanmar
LaosThailand
Cambodia
Vietnam
Capture Growth from AEC Expedite Asia Expansion with MAKRO’s Brand and IP
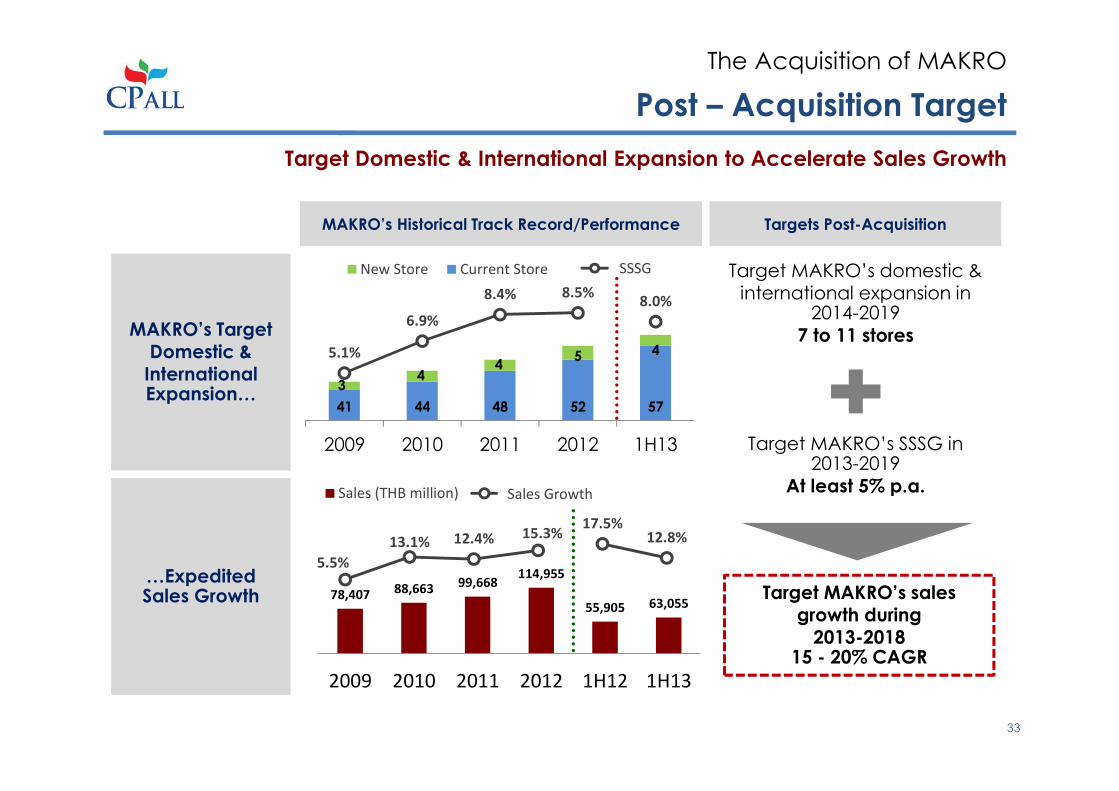
5.1%
6.9%
8.4% 8.5%8.0%
2012
78,407 88,663 99,668114,955
55,905 63,055
2009 2010 2011 2012 1H12 1H13
Sales (THB million)
5.5%
13.1% 12.4% 15.3%17.5%
12.8%
1H13
41 44 48 52 57
34
45 4
2009 2010 2011 2012 1H13
New Store Current Store
Post – Acquisition Target
The Acquisition of MAKRO
MAKRO’s TargetDomestic & InternationalExpansion…
…ExpeditedSales Growth
MAKRO’s Historical Track Record/Performance Targets Post-Acquisition
Target MAKRO’s domestic &international expansion in
2014-2019
7 to 11 stores
Target MAKRO’s SSSG in2013-2019
At least 5% p.a.
Target MAKRO’s salesgrowth during 2013-2018
15 - 20% CAGR
33
Target Domestic & International Expansion to Accelerate Sales Growth
Sales Growth
SSSG
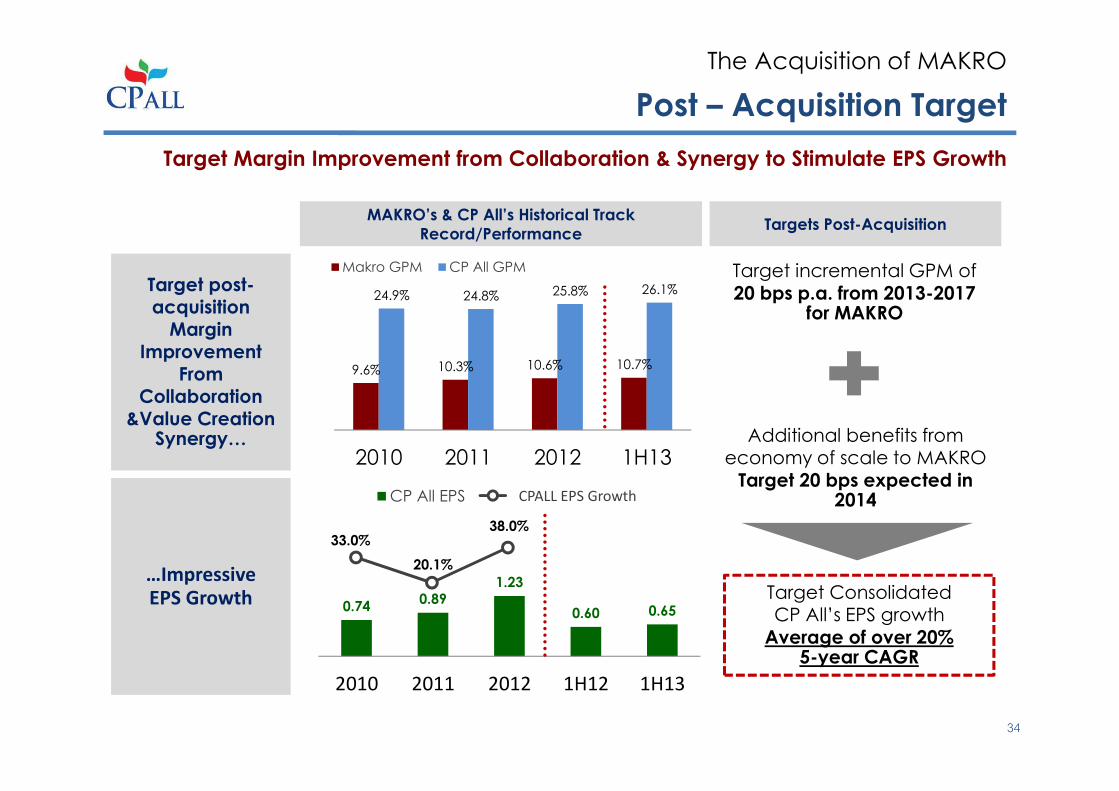
9.6% 10.3% 10.6% 10.7%
24.9% 24.8% 25.8% 26.1%
2010 2011 2012 1H13
Makro GPM CP All GPM
Post – Acquisition Target
The Acquisition of MAKRO
Target post-acquisition Margin
ImprovementFrom
Collaboration &Value Creation
Synergy…
…Impressive EPS Growth
Target incremental GPM of
20 bps p.a. from 2013-2017 for MAKRO
Additional benefits fromeconomy of scale to MAKRO
Target 20 bps expected in 2014
Target ConsolidatedCP All’s EPS growth
Average of over 20%5-year CAGR
34
Target Margin Improvement from Collaboration & Synergy to Stimulate EPS Growth
MAKRO’s & CP All’s Historical Track
Record/PerformanceTargets Post-Acquisition
0.740.89
1.23
0.60 0.65
2010 2011 2012 1H12 1H13
CP All EPS
33.0%
20.1%
38.0%
1H13CPALL EPS Growth
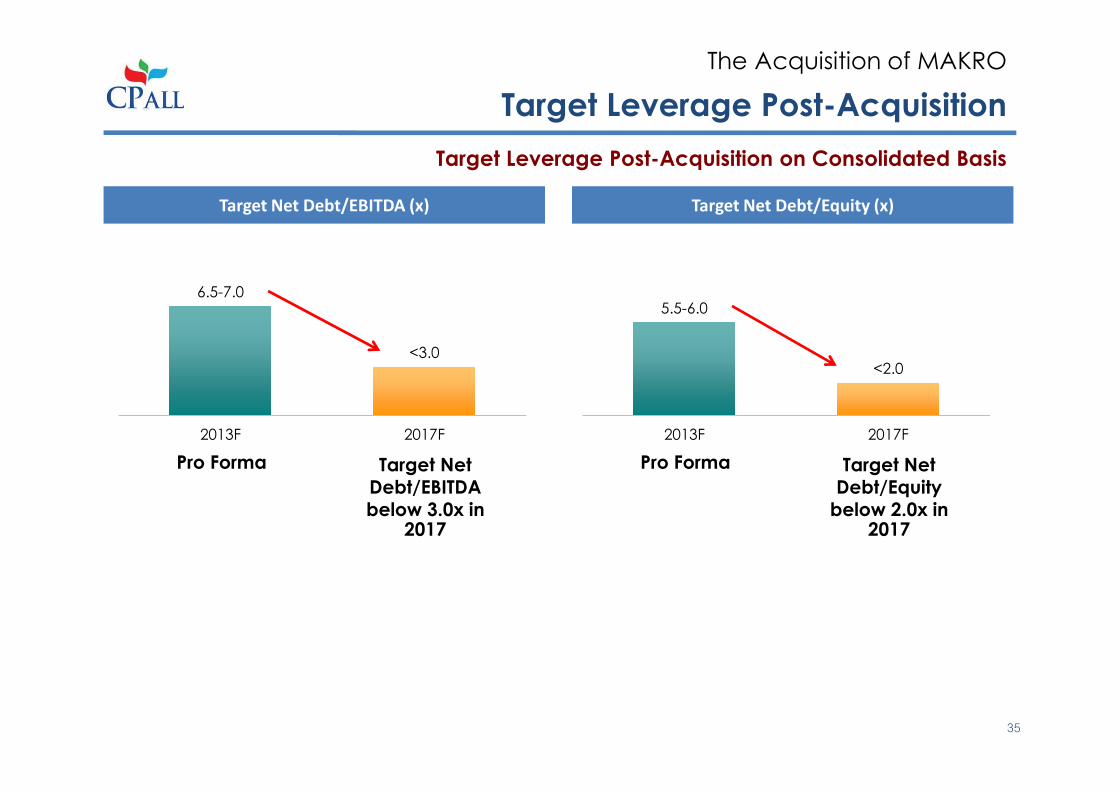
Target Leverage Post-Acquisition
The Acquisition of MAKRO
Target Leverage Post-Acquisition on Consolidated Basis
35
Target Net Debt/EBITDA (x) Target Net Debt/Equity (x)
6.5-7.0
<3.0
2013F 2017F
5.5-6.0
<2.0
2013F 2017F
Pro Forma Target Net Debt/EBITDA below 3.0x in
2017
Pro Forma Target Net Debt/Equity below 2.0x in
2017
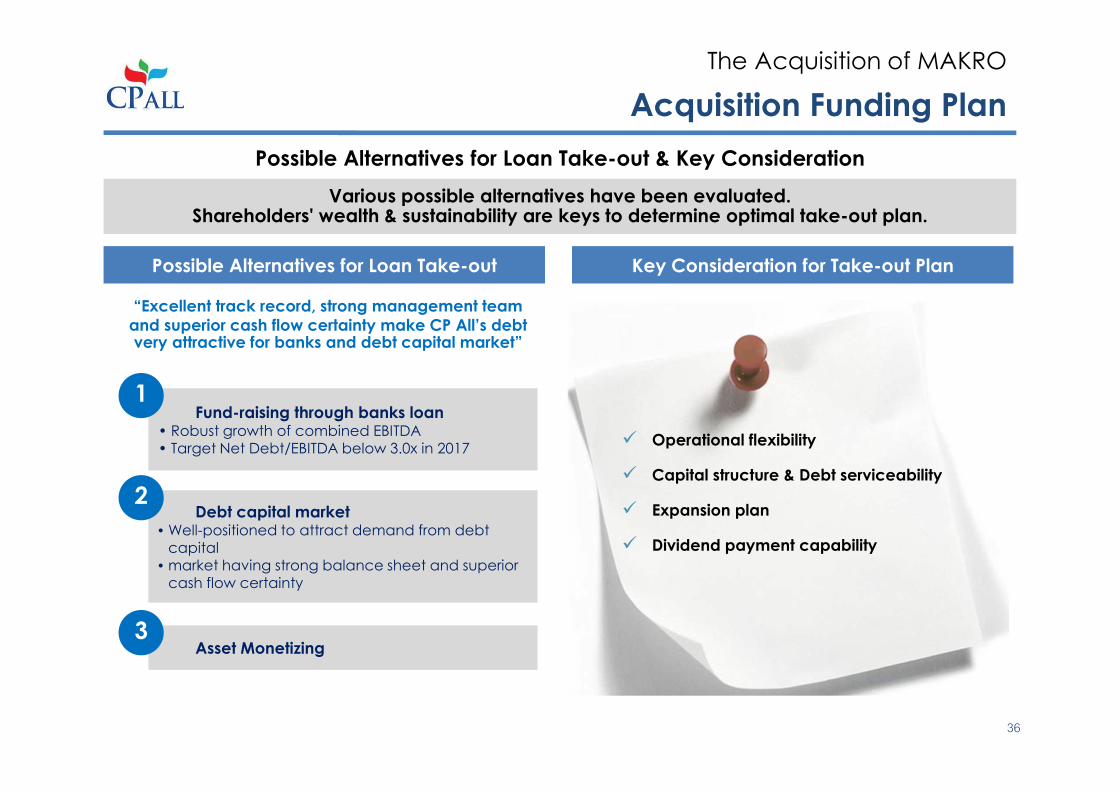
Acquisition Funding Plan
The Acquisition of MAKRO
Various possible alternatives have been evaluated. Shareholders' wealth & sustainability are keys to determine optimal take-out plan.
Possible Alternatives for Loan Take-out & Key Consideration
Possible Alternatives for Loan Take-out Key Consideration for Take-out Plan
“Excellent track record, strong management team
and superior cash flow certainty make CP All’s debt very attractive for banks and debt capital market”
Fund-raising through banks loan • Robust growth of combined EBITDA• Target Net Debt/EBITDA below 3.0x in 2017
1
Debt capital market • Well-positioned to attract demand from debt
capital• market having strong balance sheet and superior
cash flow certainty
2
Asset Monetizing3
36
� Operational flexibility
� Capital structure & Debt serviceability
� Expansion plan
� Dividend payment capability
Agenda
• The Company
• Financial Performance
• The Acquisition of MAKRO
• The Offering
Appendix
• Financial Statements
• Industry Outlook
37
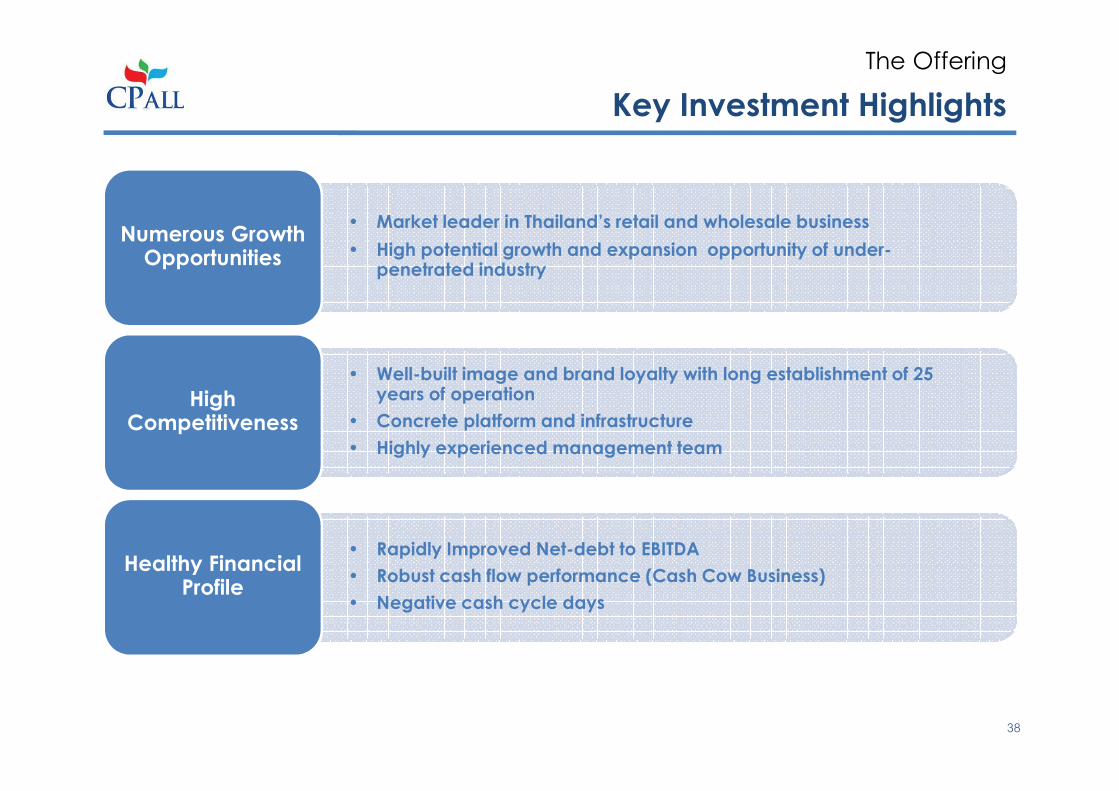
Key Investment Highlights
The Offering
• Market leader in Thailand’s retail and wholesale business
• High potential growth and expansion opportunity of under-penetrated industry
Numerous Growth Opportunities
• Well-built image and brand loyalty with long establishment of 25 years of operation
• Concrete platform and infrastructure
• Highly experienced management team
High Competitiveness
• Rapidly Improved Net-debt to EBITDA
• Robust cash flow performance (Cash Cow Business)
• Negative cash cycle days
Healthy Financial Profile
38
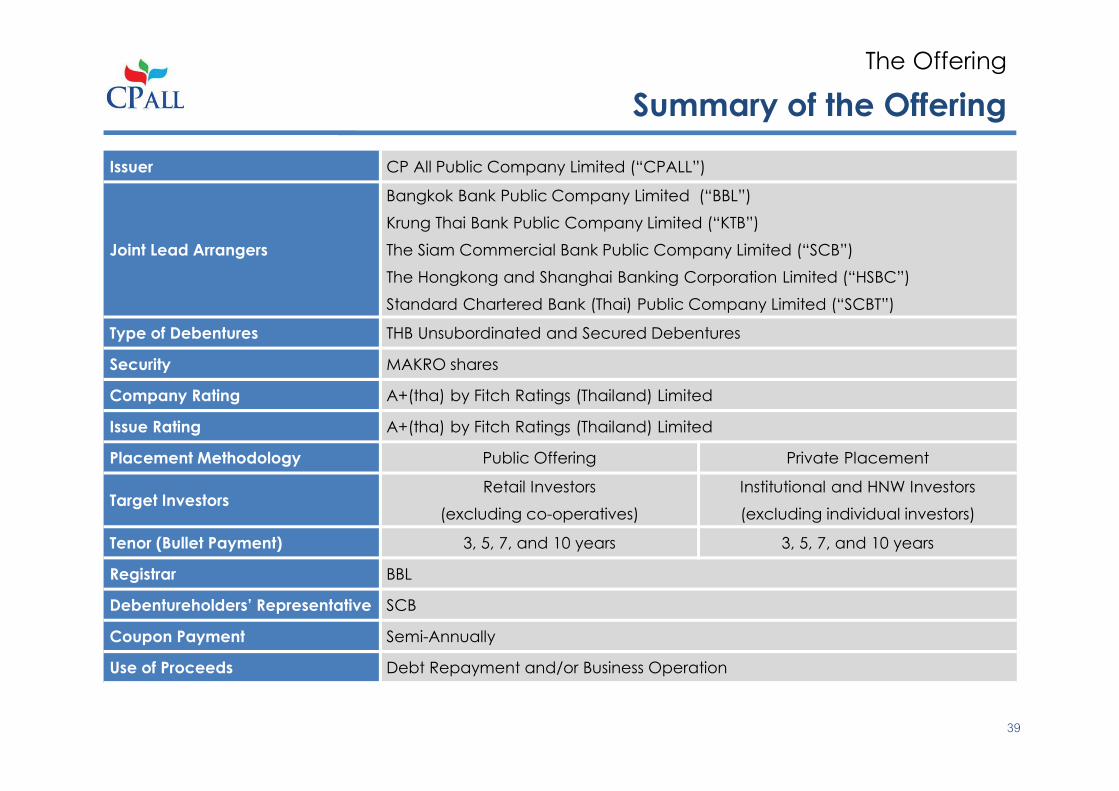
Summary of the Offering
The Offering
Issuer CP All Public Company Limited (“CPALL”)
Joint Lead Arrangers
Bangkok Bank Public Company Limited (“BBL”)
Krung Thai Bank Public Company Limited (“KTB”)
The Siam Commercial Bank Public Company Limited (“SCB”)
The Hongkong and Shanghai Banking Corporation Limited (“HSBC”)
Standard Chartered Bank (Thai) Public Company Limited (“SCBT”)
Type of Debentures THB Unsubordinated and Secured Debentures
Security MAKRO shares
Company Rating A+(tha) by Fitch Ratings (Thailand) Limited
Issue Rating A+(tha) by Fitch Ratings (Thailand) Limited
Placement Methodology Public Offering Private Placement
Target InvestorsRetail Investors
(excluding co-operatives)
Institutional and HNW Investors
(excluding individual investors)
Tenor (Bullet Payment) 3, 5, 7, and 10 years 3, 5, 7, and 10 years
Registrar BBL
Debentureholders’ Representative SCB
Coupon Payment Semi-Annually
Use of Proceeds Debt Repayment and/or Business Operation
39
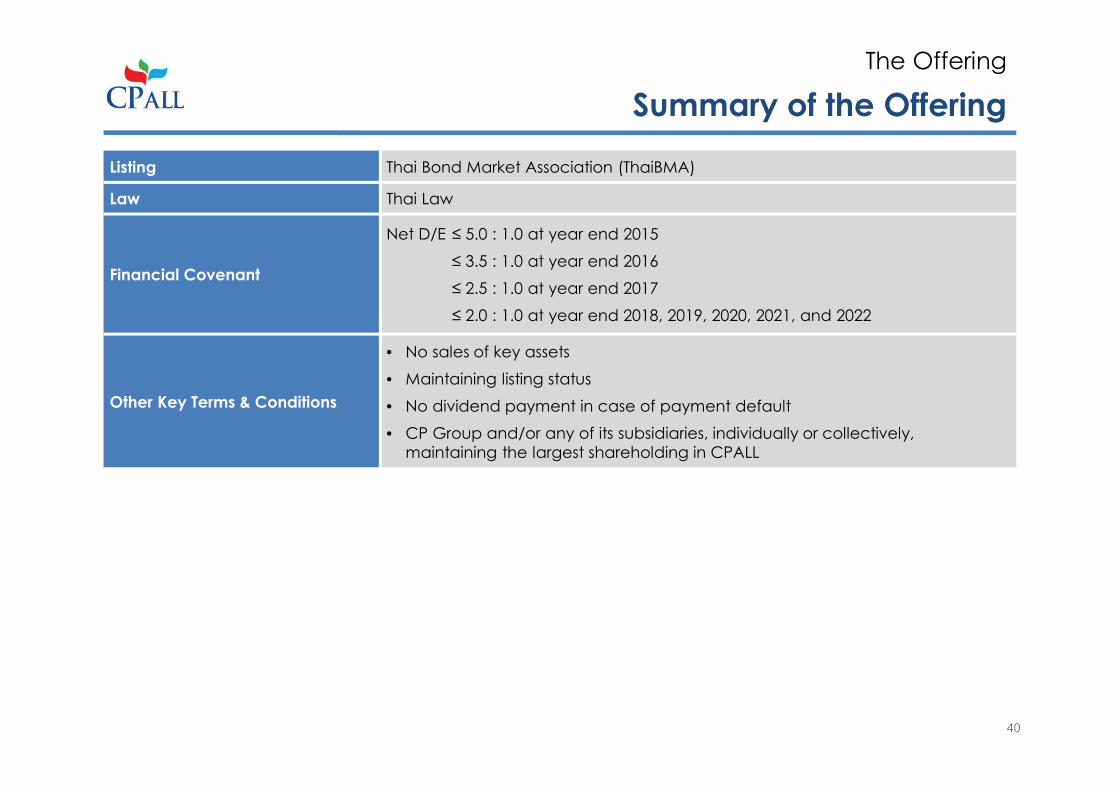
Summary of the Offering
The Offering
Listing Thai Bond Market Association (ThaiBMA)
Law Thai Law
Financial Covenant
Net D/E ≤ 5.0 : 1.0 at year end 2015
≤ 3.5 : 1.0 at year end 2016
≤ 2.5 : 1.0 at year end 2017
≤ 2.0 : 1.0 at year end 2018, 2019, 2020, 2021, and 2022
Other Key Terms & Conditions
• No sales of key assets
• Maintaining listing status
• No dividend payment in case of payment default
• CP Group and/or any of its subsidiaries, individually or collectively,
maintaining the largest shareholding in CPALL
40
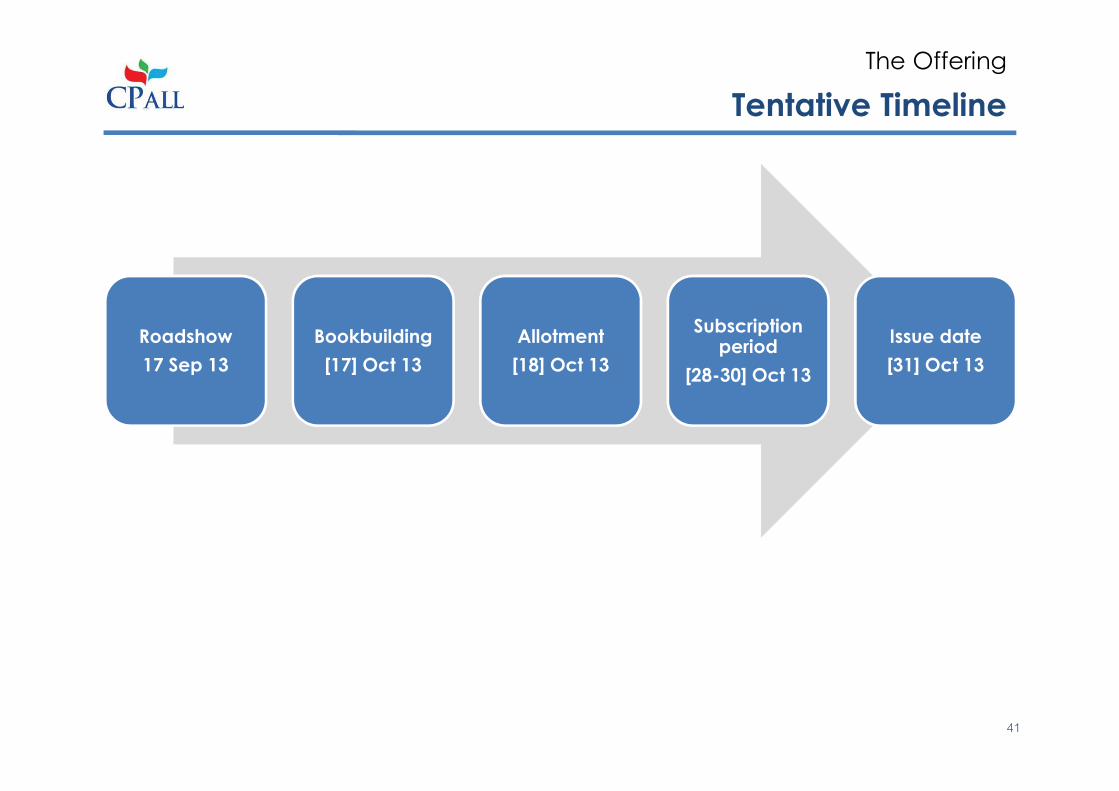
Tentative Timeline
The Offering
Roadshow
17 Sep 13
Bookbuilding
[17] Oct 13
Allotment
[18] Oct 13
Subscription period
[28-30] Oct 13
Issue date
[31] Oct 13
41
Agenda
• The Company
• Financial Performance
• The Acquisition of MAKRO
• The Offering
Appendix
• Summary of Financial Statements
• Industry Outlook
42
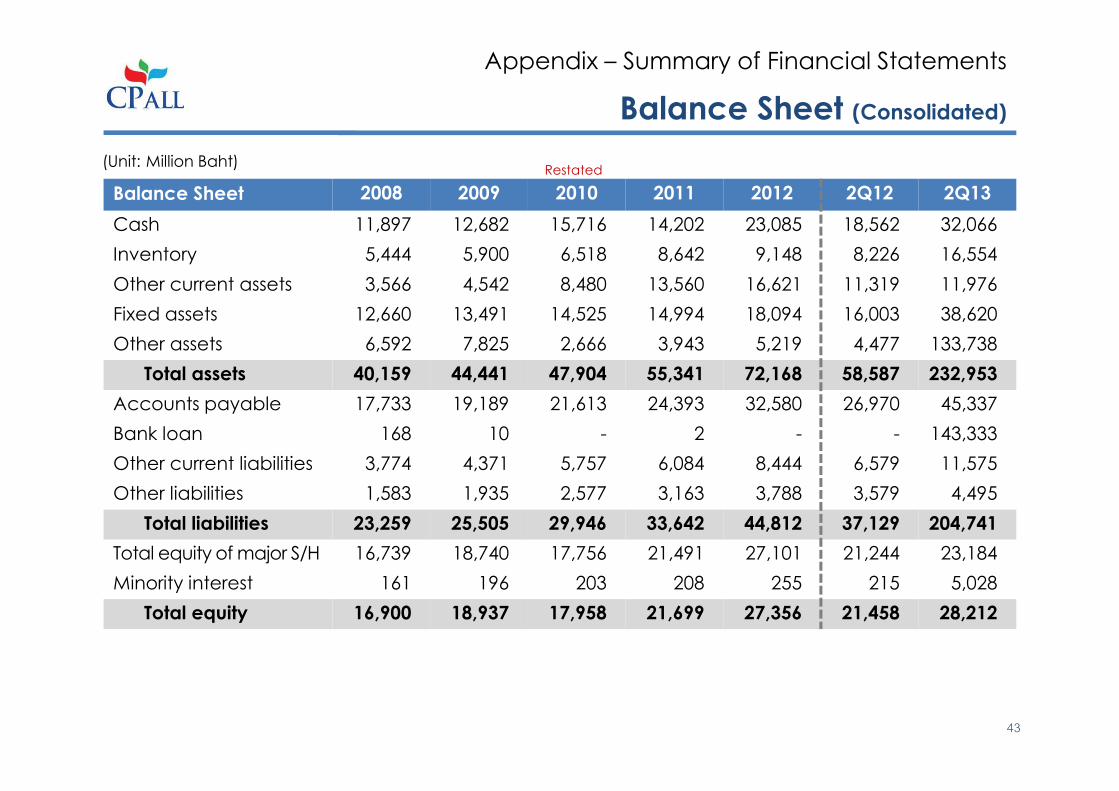
Balance Sheet 2008 2009 2010 2011 2012 2Q12 2Q13
Cash 11,897 12,682 15,716 14,202 23,085 18,562 32,066
Inventory 5,444 5,900 6,518 8,642 9,148 8,226 16,554
Other current assets 3,566 4,542 8,480 13,560 16,621 11,319 11,976
Fixed assets 12,660 13,491 14,525 14,994 18,094 16,003 38,620
Other assets 6,592 7,825 2,666 3,943 5,219 4,477 133,738
Total assets 40,159 44,441 47,904 55,341 72,168 58,587 232,953
Accounts payable 17,733 19,189 21,613 24,393 32,580 26,970 45,337
Bank loan 168 10 - 2 - - 143,333
Other current liabilities 3,774 4,371 5,757 6,084 8,444 6,579 11,575
Other liabilities 1,583 1,935 2,577 3,163 3,788 3,579 4,495
Total liabilities 23,259 25,505 29,946 33,642 44,812 37,129 204,741
Total equity of major S/H 16,739 18,740 17,756 21,491 27,101 21,244 23,184
Minority interest 161 196 203 208 255 215 5,028
Total equity 16,900 18,937 17,958 21,699 27,356 21,458 28,212
Balance Sheet (Consolidated)
Appendix – Summary of Financial Statements
(Unit: Million Baht)Restated
43
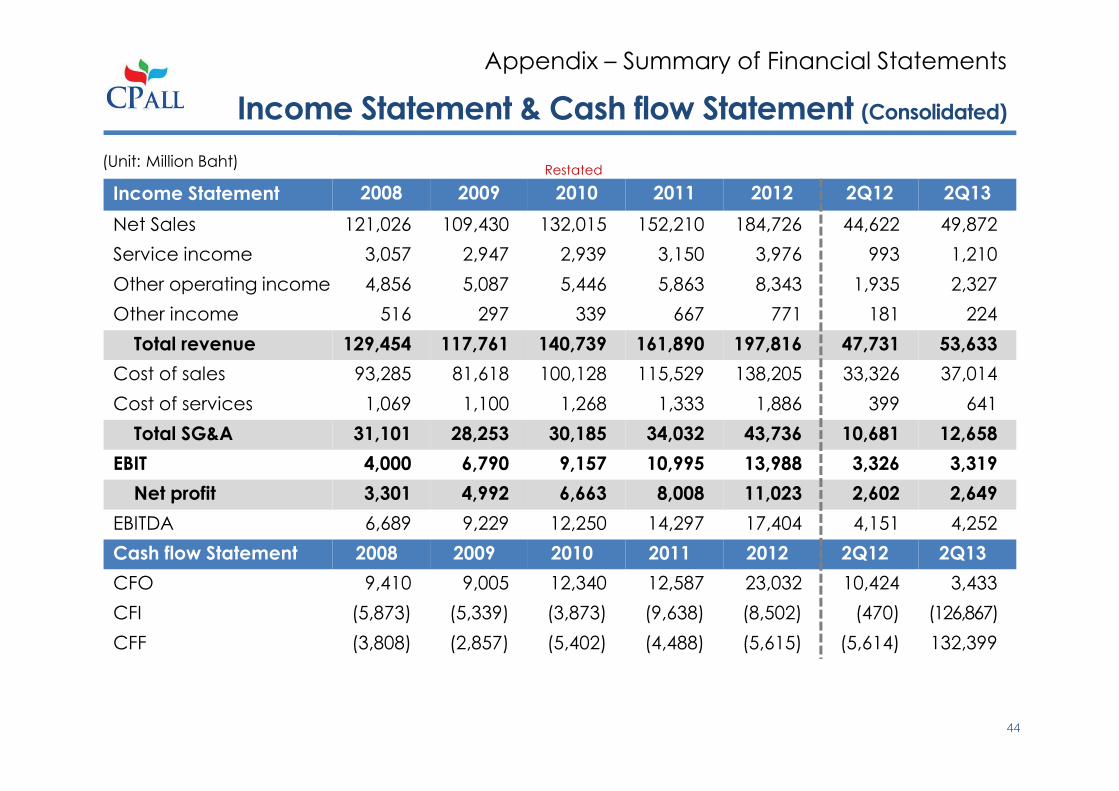
Income Statement & Cash flow Statement (Consolidated)
Appendix – Summary of Financial Statements
Income Statement 2008 2009 2010 2011 2012 2Q12 2Q13
Net Sales 121,026 109,430 132,015 152,210 184,726 44,622 49,872
Service income 3,057 2,947 2,939 3,150 3,976 993 1,210
Other operating income 4,856 5,087 5,446 5,863 8,343 1,935 2,327
Other income 516 297 339 667 771 181 224
Total revenue 129,454 117,761 140,739 161,890 197,816 47,731 53,633
Cost of sales 93,285 81,618 100,128 115,529 138,205 33,326 37,014
Cost of services 1,069 1,100 1,268 1,333 1,886 399 641
Total SG&A 31,101 28,253 30,185 34,032 43,736 10,681 12,658
EBIT 4,000 6,790 9,157 10,995 13,988 3,326 3,319
Net profit 3,301 4,992 6,663 8,008 11,023 2,602 2,649
EBITDA 6,689 9,229 12,250 14,297 17,404 4,151 4,252
Cash flow Statement 2008 2009 2010 2011 2012 2Q12 2Q13
CFO 9,410 9,005 12,340 12,587 23,032 10,424 3,433
CFI (5,873) (5,339) (3,873) (9,638) (8,502) (470) (126,867)
CFF (3,808) (2,857) (5,402) (4,488) (5,615) (5,614) 132,399
Restated
44
(Unit: Million Baht)

Balance Sheet (Company Only)
Appendix – Summary of Financial Statements
Balance Sheet 2008 2009 2010 2011 2012 2Q12 2Q13
Cash 8,866 9,496 12,180 10,804 19,368 14,667 25,638
Inventory 4,940 5,470 6,019 7,901 8,286 7,529 7,996
Other current assets 2,540 4,346 4,247 8,780 12,644 7,377 5,892
Fixed assets 9,317 10,269 11,428 11,743 13,711 12,469 15,767
Other assets 7,961 9,010 9,355 10,674 11,840 11,032 148,378
Total assets 33,624 38,591 43,229 49,902 65,849 53,074 203,671
Accounts payable 12,611 15,123 17,482 20,005 25,740 22,253 25,039
Bank loan - - - - - - 141,228
Other current liabilities 6,487 6,681 7,606 8,461 13,517 9,473 12,913
Other liabilities 1,396 1,757 2,381 2,895 3,420 3,278 3,655
Total liabilities 20,495 23,560 27,469 31,361 42,677 35,004 182,836
Total equity of major S/H 13,129 15,031 15,760 18,541 23,172 18,070 20,835
Minority interest - - - - - - -
Total equity 13,129 15,031 15,760 18,541 23,172 53,074 20,835
Restated
45
(Unit: Million Baht)
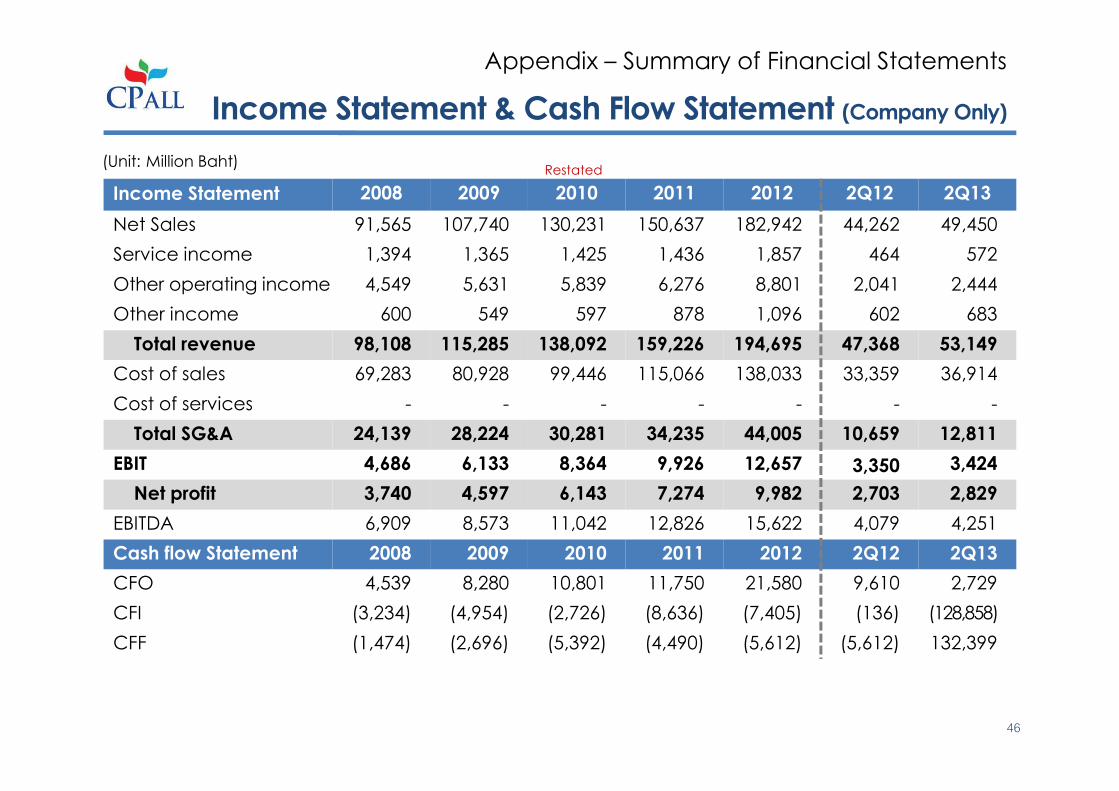
Income Statement & Cash Flow Statement (Company Only)
Appendix – Summary of Financial Statements
Income Statement 2008 2009 2010 2011 2012 2Q12 2Q13
Net Sales 91,565 107,740 130,231 150,637 182,942 44,262 49,450
Service income 1,394 1,365 1,425 1,436 1,857 464 572
Other operating income 4,549 5,631 5,839 6,276 8,801 2,041 2,444
Other income 600 549 597 878 1,096 602 683
Total revenue 98,108 115,285 138,092 159,226 194,695 47,368 53,149
Cost of sales 69,283 80,928 99,446 115,066 138,033 33,359 36,914
Cost of services - - - - - - -
Total SG&A 24,139 28,224 30,281 34,235 44,005 10,659 12,811
EBIT 4,686 6,133 8,364 9,926 12,657 3,350 3,424
Net profit 3,740 4,597 6,143 7,274 9,982 2,703 2,829
EBITDA 6,909 8,573 11,042 12,826 15,622 4,079 4,251
Cash flow Statement 2008 2009 2010 2011 2012 2Q12 2Q13
CFO 4,539 8,280 10,801 11,750 21,580 9,610 2,729
CFI (3,234) (4,954) (2,726) (8,636) (7,405) (136) (128,858)
CFF (1,474) (2,696) (5,392) (4,490) (5,612) (5,612) 132,399
Restated
46
(Unit: Million Baht)
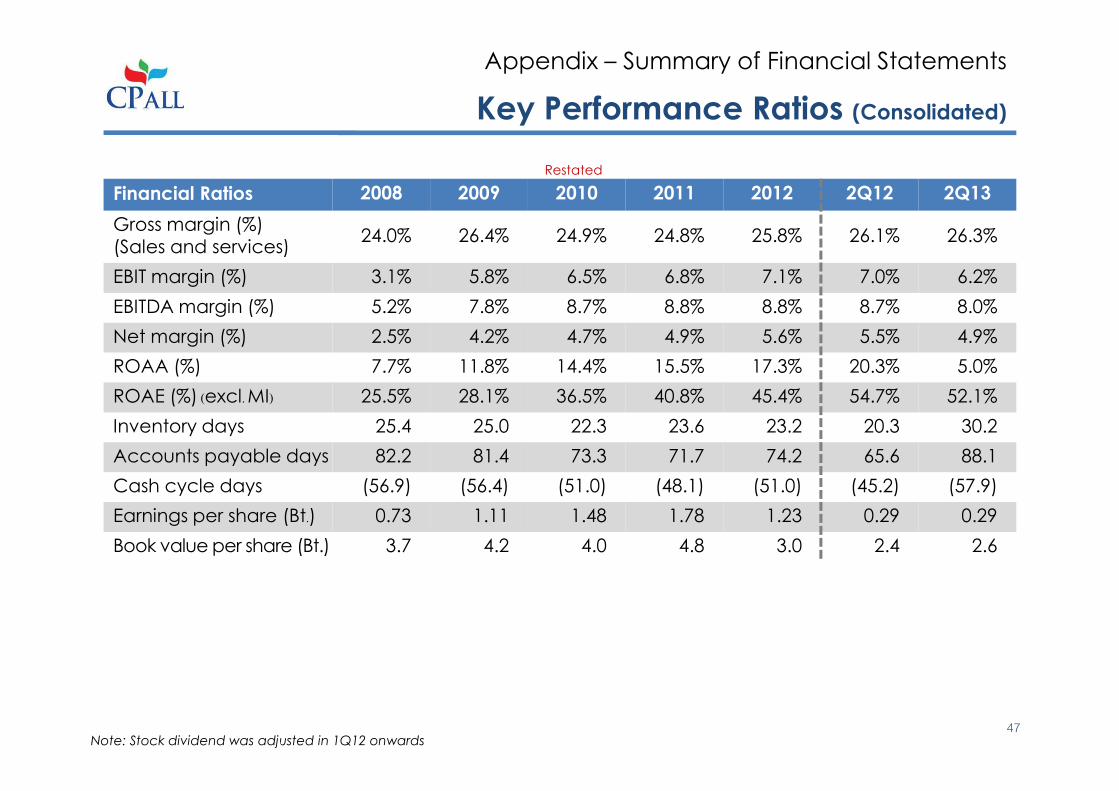
Financial Ratios 2008 2009 2010 2011 2012 2Q12 2Q13
Gross margin (%)(Sales and services)
24.0% 26.4% 24.9% 24.8% 25.8% 26.1% 26.3%
EBIT margin (%) 3.1% 5.8% 6.5% 6.8% 7.1% 7.0% 6.2%
EBITDA margin (%) 5.2% 7.8% 8.7% 8.8% 8.8% 8.7% 8.0%
Net margin (%) 2.5% 4.2% 4.7% 4.9% 5.6% 5.5% 4.9%
ROAA (%) 7.7% 11.8% 14.4% 15.5% 17.3% 20.3% 5.0%
ROAE (%) (excl. MI) 25.5% 28.1% 36.5% 40.8% 45.4% 54.7% 52.1%
Inventory days 25.4 25.0 22.3 23.6 23.2 20.3 30.2
Accounts payable days 82.2 81.4 73.3 71.7 74.2 65.6 88.1
Cash cycle days (56.9) (56.4) (51.0) (48.1) (51.0) (45.2) (57.9)
Earnings per share (Bt.) 0.73 1.11 1.48 1.78 1.23 0.29 0.29
Book value per share (Bt.) 3.7 4.2 4.0 4.8 3.0 2.4 2.6
Key Performance Ratios (Consolidated)
Appendix – Summary of Financial Statements
Restated
Note: Stock dividend was adjusted in 1Q12 onwards47

Financial Ratios 2008 2009 2010 2011 2012 2Q12 2Q13
Gross margin (%)(Sales and services)
25.5% 25.8% 24.5% 24.3% 25.3% 25.4% 26.2%
EBIT margin (%) 4.8% 5.3% 6.1% 6.2% 6.5% 7.1% 6.4%
EBITDA margin (%) 7.0% 7.4% 8.0% 8.1% 8.0% 8.6% 8.0%
Net margin (%) 3.8% 4.0% 4.4% 4.6% 5.1% 5.7% 5.3%
ROAA (%) 11.7% 12.7% 15.0% 15.6% 17.2% 21.6% 5.6%
ROAE (%) (excl. MI) 31.2% 32.7% 39.9% 42.4% 47.9% 61.2% 58.7%
Inventory days 23.9 23.2 20.8 21.8 21.1 18.6 18.9
Accounts payable days 62.1 61.7 59.0 58.6 59.7 54.5 57.7
Cash cycle days (38.2) (38.5) (38.2) (36.9) (38.5) (35.9) (38.8)
Earnings per share (Bt.) 0.83 1.02 1.37 1.62 1.11 0.30 0.31
Book value per share (Bt.) 2.9 3.3 3.5 4.1 2.6 2.0 2.3
Key Performance Ratios (Company Only)
Appendix – Summary of Financial Statements
Restated
Note: Stock dividend was adjusted in 1Q12 onwards48

Agenda
• The Company
• Financial Performance
• The Acquisition of MAKRO
• The Offering
Appendix
• Summary of Financial Statements
• Industry Outlook
49
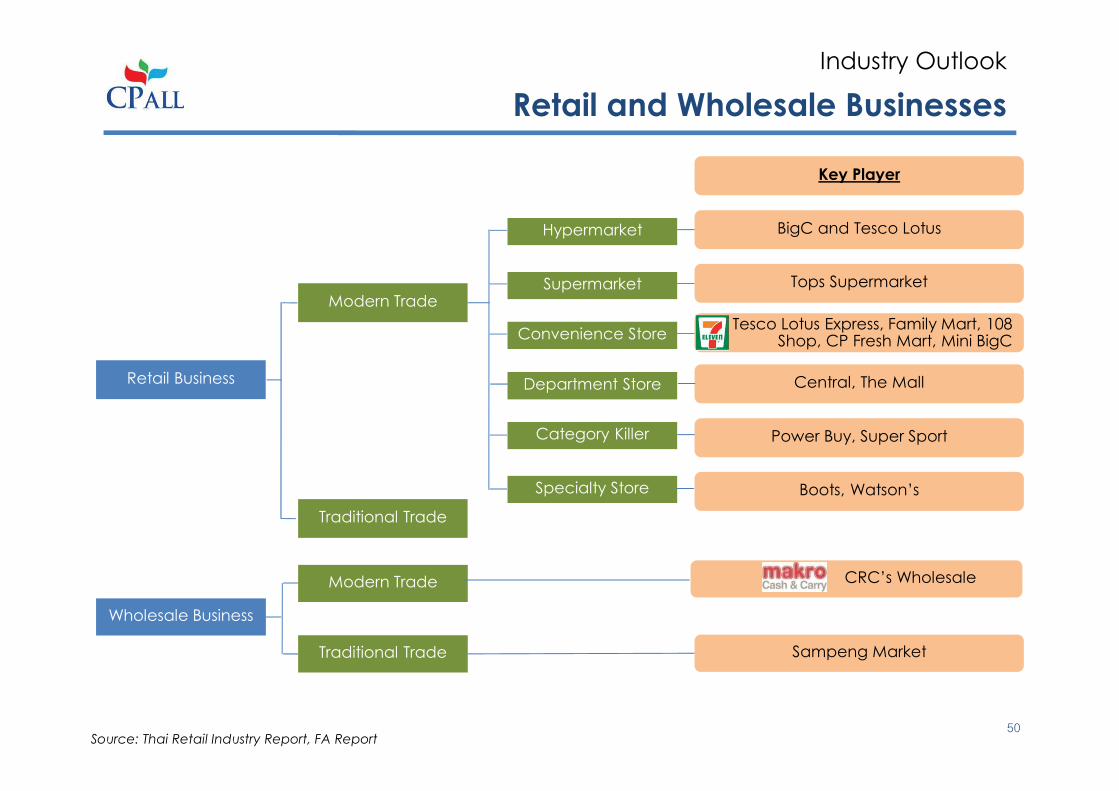
Retail and Wholesale Businesses
Industry Outlook
Retail Business
Traditional Trade
Modern Trade
Hypermarket
Supermarket
Convenience Store
Department Store
Category Killer
Specialty Store
BigC and Tesco Lotus
Tops Supermarket
Tesco Lotus Express, Family Mart, 108 Shop, CP Fresh Mart, Mini BigC
Central, The Mall
Power Buy, Super Sport
Boots, Watson’s
Key Player
Wholesale Business
Modern Trade
Traditional Trade
CRC’s Wholesale
Sampeng Market
Source: Thai Retail Industry Report, FA Report50

Retail Business in Thailand
Industry Outlook
6.9%
-0.7%
11.7%
3.8% 6.4%
5.8%3.4%
4.6% 4.8% 5.6%
2008 2009 2010 2011 2012
GDP Growth Retail Sales Growth
1,235,695
54
1,1
55
52
2,5
11
48
5,6
72
45
4,0
79
41
4,5
21
37
9,9
73
34
5,2
69
34
0,9
16
34
0,4
79
The highest 10’s GPP* Per Capita in 2011 (Baht per annum)
Source: Euromonitor, NESDB
Source: NESDB
*GPP = Gross Provincial Product
9%
7%
5% 1%1%
1%
Others
76%
Retailing Brand Shares 2012
Source: Euromonitor,
• Retail industry was a core contributor to Thai’s
economy and was resilient to economic cycle
• A number of Thai consumers prefer shopping at
the most convenient location. As a result, retailing
operators were attempting to respond to this
demand by having more shops expansion
• The giant retailers were gearing up for this
strategy. 7-Eleven by CP All PCL will continue to
be a leading player in this area
• While market saturation could be seen in Bangkok
and metropolitan area, the expansion will also
start to penetrate provincial and rural areas
Thailand GDP Growth VS Retail Sale Growth
51
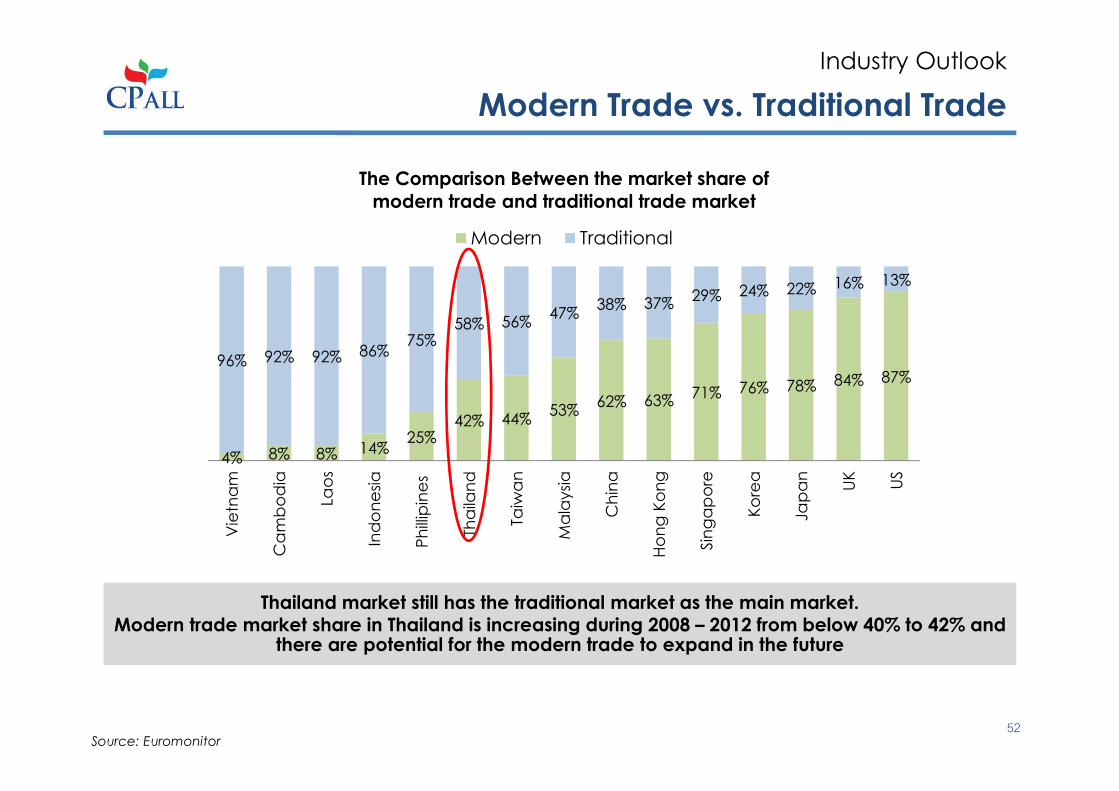
Modern Trade vs. Traditional Trade
Industry Outlook
4% 8% 8% 14%25%
42% 44%53%
62% 63%71% 76% 78% 84% 87%
96% 92% 92% 86%75%
58% 56%47%
38% 37%29% 24% 22% 16% 13%
Vie
tna
m
Ca
mb
od
ia
Lao
s
Ind
on
esi
a
Ph
illip
ine
s
Tha
ilan
d
Taiw
an
Ma
laysi
a
Ch
ina
Ho
ng
Ko
ng
Sin
ga
po
re
Ko
rea
Ja
pa
n
UK
US
The Comparison Between the market share of
modern trade and traditional trade market
Modern Traditional
Thailand market still has the traditional market as the main market.Modern trade market share in Thailand is increasing during 2008 – 2012 from below 40% to 42% and
there are potential for the modern trade to expand in the future
Source: Euromonitor52
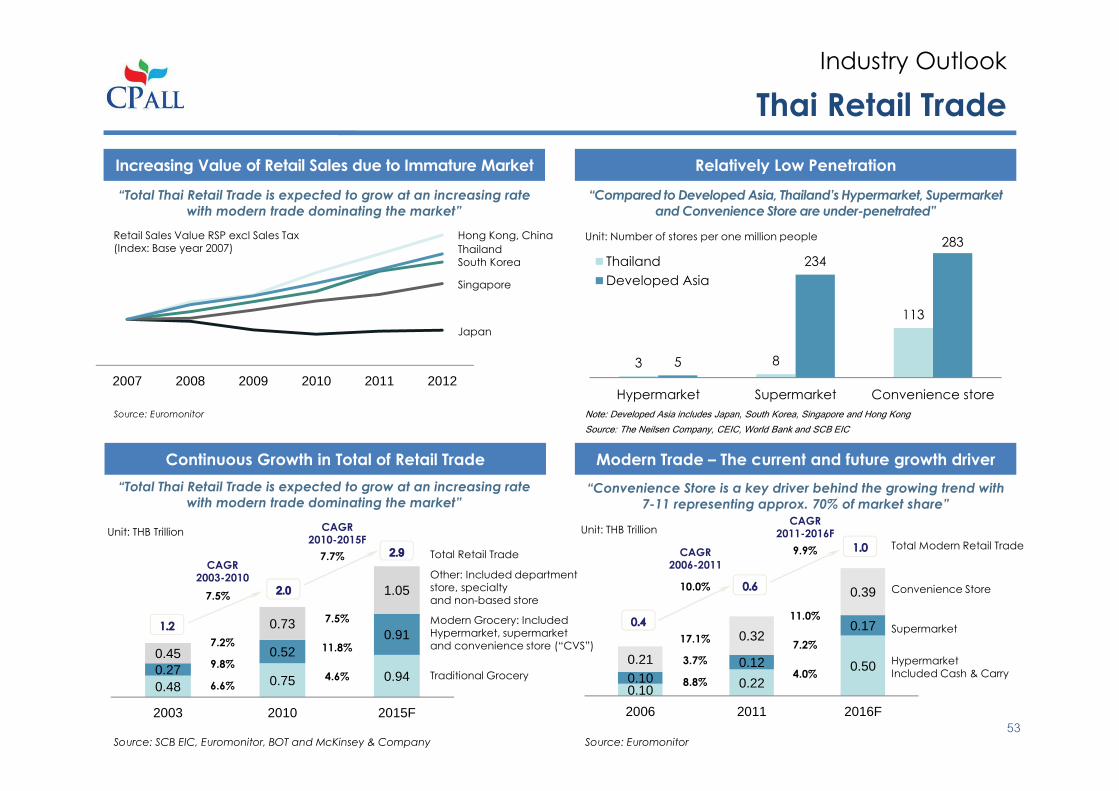
South Korea
3 8
113
5
234
283
Hypermarket Supermarket Convenience store
Thailand
Developed Asia
Thai Retail Trade
Industry Outlook
2007 2008 2009 2010 2011 2012
Increasing Value of Retail Sales due to Immature Market
Note: Developed Asia includes Japan, South Korea, Singapore and Hong Kong
Source: The Neilsen Company, CEIC, World Bank and SCB EIC
Relatively Low Penetration
“Total Thai Retail Trade is expected to grow at an increasing rate
with modern trade dominating the market”
“Compared to Developed Asia, Thailand’s Hypermarket, Supermarket
and Convenience Store are under-penetrated”
Unit: Number of stores per one million people Retail Sales Value RSP excl Sales Tax(Index: Base year 2007)
Source: Euromonitor
Japan
Singapore
Thailand
Hong Kong, China
Continuous Growth in Total of Retail Trade
Source: Euromonitor
Modern Trade – The current and future growth driver
“Total Thai Retail Trade is expected to grow at an increasing rate
with modern trade dominating the market” “Convenience Store is a key driver behind the growing trend with
7-11 representing approx. 70% of market share”
Source: SCB EIC, Euromonitor, BOT and McKinsey & Company
0.48 0.75 0.940.270.52
0.910.45
0.73
1.05
2003 2010 2015F
CAGR 2003-2010
CAGR 2010-2015F
6.6%
9.8%
7.2%
4.6%
11.8%
7.5%
Total Retail Trade
Other: Included department store, specialtyand non-based store
Modern Grocery: Included Hypermarket, supermarketand convenience store (“CVS”)
Traditional Grocery
7.5%
7.7%
Unit: THB Trillion
0.10 0.220.50
0.100.12
0.17
0.21
0.32
0.39
2006 2011 2016F
Total Modern Retail Trade
Convenience Store
Supermarket
HypermarketIncluded Cash & Carry
CAGR 2006-2011
CAGR 2011-2016F
10.0%
9.9%
8.8%
3.7%
17.1%
4.0%
7.2%
11.0%
Unit: THB Trillion
53
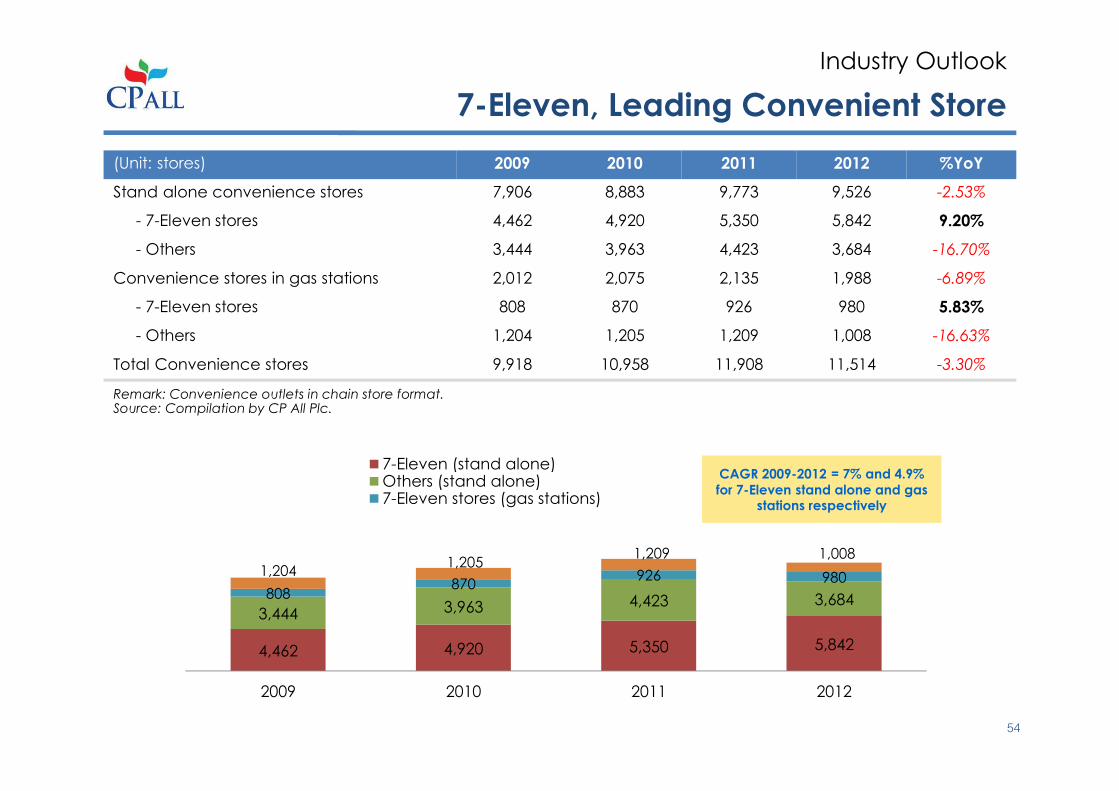
7-Eleven, Leading Convenient Store
Industry Outlook
(Unit: stores) 2009 2010 2011 2012 %YoY
Stand alone convenience stores 7,906 8,883 9,773 9,526 -2.53%
- 7-Eleven stores 4,462 4,920 5,350 5,842 9.20%
- Others 3,444 3,963 4,423 3,684 -16.70%
Convenience stores in gas stations 2,012 2,075 2,135 1,988 -6.89%
- 7-Eleven stores 808 870 926 980 5.83%
- Others 1,204 1,205 1,209 1,008 -16.63%
Total Convenience stores 9,918 10,958 11,908 11,514 -3.30%
4,462 4,920 5,350 5,842
3,444 3,963 4,423 3,684808870
926 9801,2041,205
1,209 1,008
2009 2010 2011 2012
7-Eleven (stand alone)Others (stand alone)7-Eleven stores (gas stations)
Remark: Convenience outlets in chain store format.Source: Compilation by CP All Plc.
CAGR 2009-2012 = 7% and 4.9%
for 7-Eleven stand alone and gas stations respectively
54
Q&A
THANK YOU