Huhtamaki Roadshow presentation, April–June 2021
62
Becoming the first choice in sustainable packaging solutions Roadshow presentation April-June 2021
-
Upload
khangminh22 -
Category
Documents
-
view
1 -
download
0
Transcript of Huhtamaki Roadshow presentation, April–June 2021

Becoming the first choice in sustainable packaging solutionsRoadshow presentationApril-June 2021

April–June 2021 Roadshow presentation | Huhtamaki2
Broadly serving food on-the-go and food on-the-shelf
Convenience Food safety Food availability Food waste reduction
Packaging technology
Products
Food on-the-go
QSR Food Delivery
Markets
Customers
Food on-the-shelf
FMCG Retail
Paperboard conversion Molded fiber Flexibles

April–June 2021 Roadshow presentation | Huhtamaki3
Huhtamaki operates on a global scale
NET SALES
€3.3BADJUSTED EBIT MARGIN
9.1%MANUFACTURING UNITS
81OPERATING COUNTRIES
35EMPLOYEES
18,227
Figures for 2020

April–June 2021 Roadshow presentation | Huhtamaki4
We operate through 3 business areas
Net sales per business area (2020)
Flexible Packaging
29 manufacturing units and
operations in 16 countries
7,500 employees
€1.1B net sales
Fiber Packaging and Foodservice EAO have been integrated as of June 1, 2020. The segments will continue to be reported separately.
Fiber and FoodserviceEurope-Asia-Oceania
34 manufacturing units and
operations in 28 countries
6,400 employees
€1.1B net sales
34%
34%
32%
Fiber and Foodservice Europe-Asia-Oceania
North America
Flexible Packaging
North America
18 manufacturing units and
operations in 2 countries
4,200 employees
€1.1B net sales

April–June 2021 Roadshow presentation | Huhtamaki5
Understanding the value of packaging within the broader sustainability context
Hygiene
Packaging promotes hygiene and prevents spread of disease
Food safety
Packaging keeps food safe from spoilage and preserves its original properties
Food availability
Packaging enables food availability everywhere in the world and allows food to be transported affordably and at low emissions
Food waste prevention
1/3 of food is wasted, representing 8% of global greenhouse gases. Packaging prevents food waste

April–June 2021 Roadshow presentation | Huhtamaki6
Our strategy builds on transformative trends impacting the future of packaging
• The next billion consumers will come from emerging markets
• Future consumer will require packaging to be innovative, individual and sustainable
• Digitalization will influence packaging and the way we do business
• Sustainability will drive innovation and collaboration

April–June 2021 Roadshow presentation | Huhtamaki7
Our 2030 Strategy
Protecting food, people and the planet
EMBEDDING SUSTAINABILITY IN EVERYTHING WE DO
GROWING OUR BUSINESS
IMPROVING OUR COMPETITIVENESS
DEVELOPING OUR TALENT
Our ambition is to be the first choice in sustainable packaging solutions, enabling wellbeing and convenience for people around the world
Our values Care Dare Deliver help us to make a difference, where it matters
DRIVEN BY DIGITAL TECHNOLOGIES AND DATA
April–June 2021 Roadshow presentation | Huhtamaki8
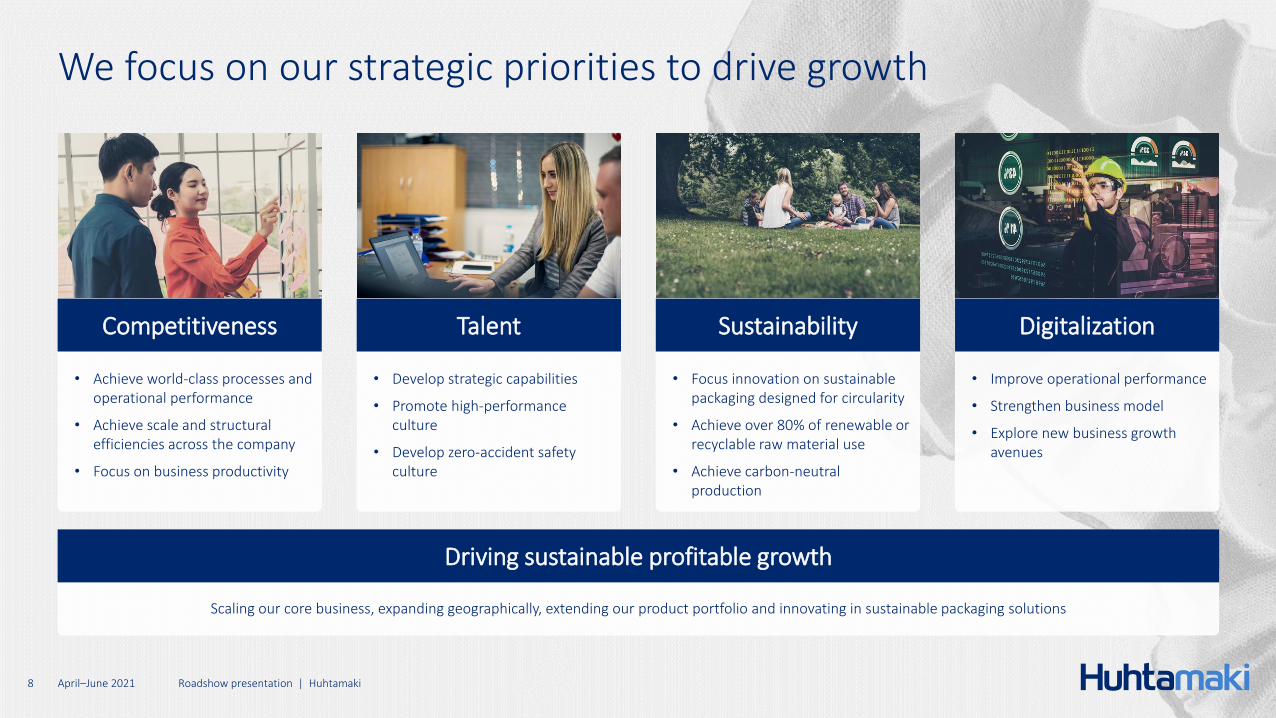
We focus on our strategic priorities to drive growth
• Develop strategic capabilities
• Promote high-performance culture
• Develop zero-accident safety culture
• Focus innovation on sustainable packaging designed for circularity
• Achieve over 80% of renewable or recyclable raw material use
• Achieve carbon-neutral production
• Improve operational performance
• Strengthen business model
• Explore new business growth avenues
• Achieve world-class processes and operational performance
• Achieve scale and structural efficiencies across the company
• Focus on business productivity
Competitiveness Talent Sustainability Digitalization
Scaling our core business, expanding geographically, extending our product portfolio and innovating in sustainable packaging solutions
Driving sustainable profitable growth
April–June 2021 Roadshow presentation | Huhtamaki9
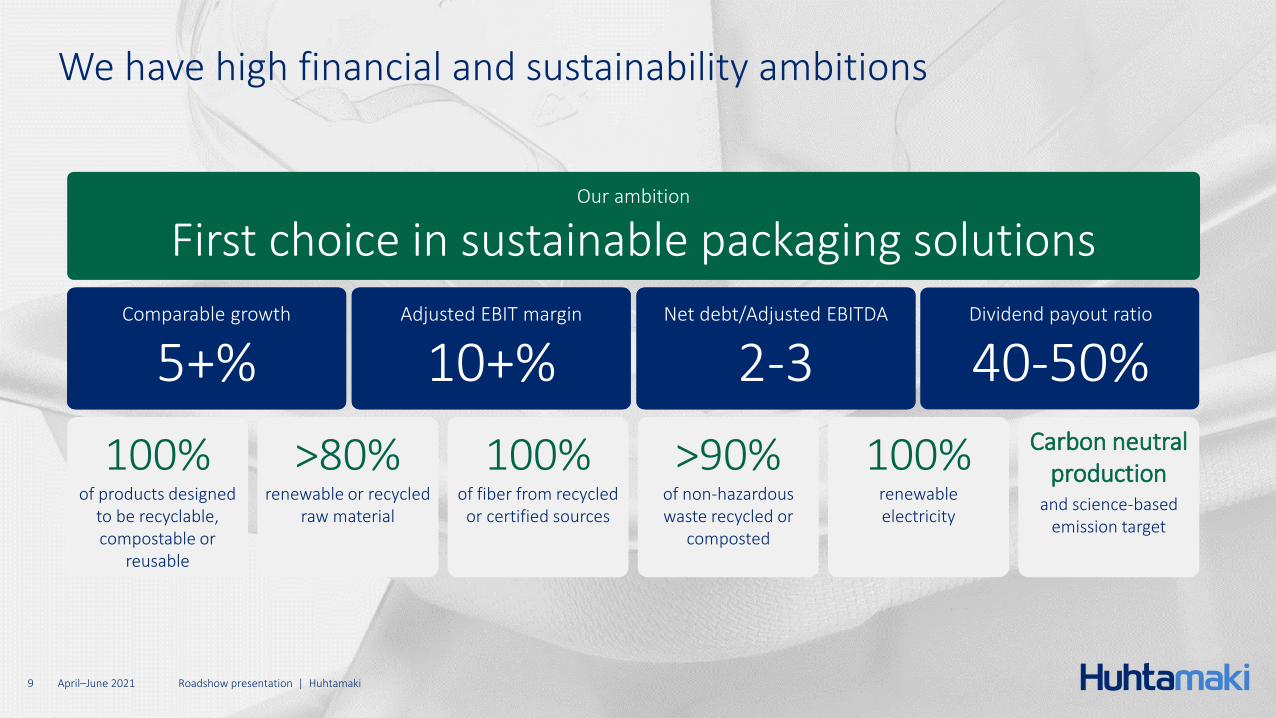
We have high financial and sustainability ambitions
100% of products designed
to be recyclable, compostable or
reusable
Our ambition
First choice in sustainable packaging solutions
Comparable growth
5+%Net debt/Adjusted EBITDA
2-3Adjusted EBIT margin
10+%Dividend payout ratio
40-50%
>80% renewable or recycled
raw material
100%of fiber from recycled
or certified sources
Carbon neutral production
and science-based emission target
100%renewable electricity
>90% of non-hazardous waste recycled or
composted

For further information, please contact us:
April–June 2021Roadshow presentation | Huhtamaki10
www.huhtamaki.com/investors

Disclaimer
April–June 2021 Roadshow presentation | Huhtamaki11
Information presented herein contains, or may be deemed to contain, forward-looking statements. These statements relate to future events or Huhtamäki Oyj’s or its affiliates’ (“Huhtamaki”) future financial performance, including, but not limited to, strategic plans, potential growth, expected capital expenditure, ability to generate cash flows, liquidity and cost savings that involve known and unknown risks, uncertainties and other factors that may cause Huhtamaki’s actual results, performance or achievements to be materially different from those expressed or implied by any forward-looking statements. By their nature, forward-looking statements involve risks and uncertainties because they relate to events and depend on circumstances that may or may not occur in the future. Such risks and uncertainties include, but are not limited to: (1) general economic conditions such as movements in currency rates, volatile raw material and energy prices and political uncertainties; (2) industry conditions such as demand for Huhtamaki’s products, pricing pressures and competitive situation; and (3) Huhtamaki’s own operating and other conditions such as the success of manufacturing activities and the achievement of efficiencies therein as well as the success of pending and future acquisitions and restructurings and product innovations. Future results may vary from the results expressed in, or implied by, forward-looking statements, possibly to a material degree. All forward-looking statements made in this presentation are based on information currently available to the management and Huhtamaki assumes no obligation to update or revise any forward-looking statements. Nothing in this presentation constitutes investment advice and this presentation shall not constitute an offer to sell or the solicitation of an offer to buy any securities or otherwise to engage in any investment activity.

Appendix:The role of packaging
April–June 2021 Roadshow presentation | Huhtamaki13
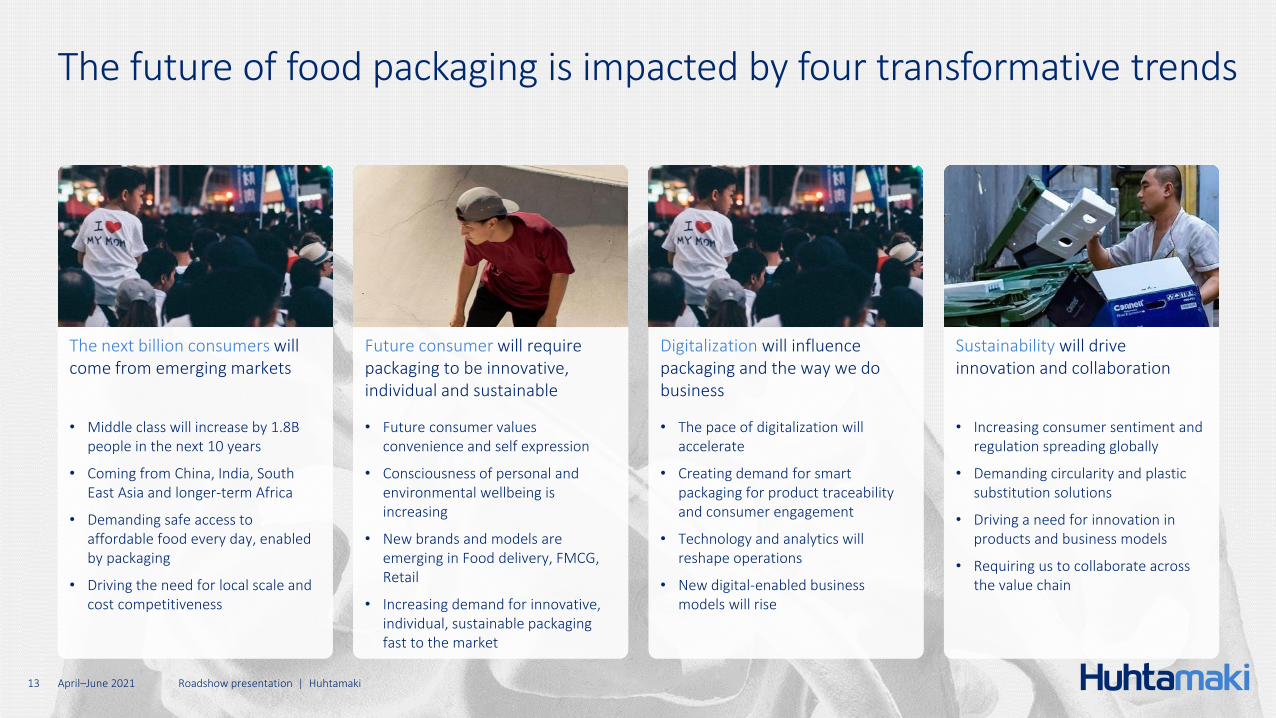
The future of food packaging is impacted by four transformative trends
The next billion consumers will come from emerging markets
• Middle class will increase by 1.8B people in the next 10 years
• Coming from China, India, South East Asia and longer-term Africa
• Demanding safe access to affordable food every day, enabled by packaging
• Driving the need for local scale and cost competitiveness
Future consumer will require packaging to be innovative, individual and sustainable
• Future consumer values convenience and self expression
• Consciousness of personal and environmental wellbeing is increasing
• New brands and models are emerging in Food delivery, FMCG, Retail
• Increasing demand for innovative, individual, sustainable packaging fast to the market
Digitalization will influence packaging and the way we do business
• The pace of digitalization will accelerate
• Creating demand for smart packaging for product traceability and consumer engagement
• Technology and analytics will reshape operations
• New digital-enabled business models will rise
Sustainability will drive innovation and collaboration
• Increasing consumer sentiment and regulation spreading globally
• Demanding circularity and plastic substitution solutions
• Driving a need for innovation in products and business models
• Requiring us to collaborate across the value chain
April–June 2021 Roadshow presentation | Huhtamaki14
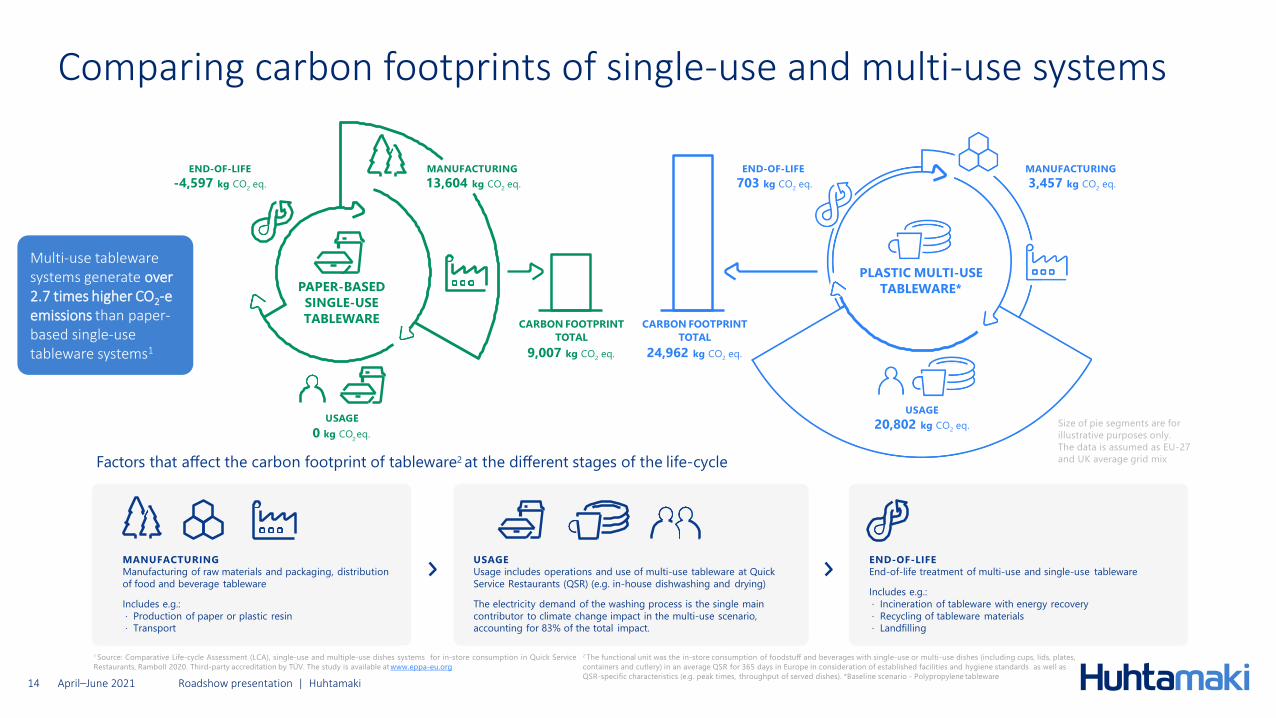
Comparing carbon footprints of single-use and multi-use systems
Factors that affect the carbon footprint of tableware2 at the different stages of the life-cycle
1 Source: Comparative Life-cycle Assessment (LCA), single-use and multiple-use dishes systems for in-store consumption in Quick Service
Restaurants, Ramboll 2020. Third-party accreditation by TÜV. The study is available at www.eppa-eu.org
END-OF-LIFE
703 kg CO2
eq.
MANUFACTURING
Manufacturing of raw materials and packaging, distribution
of food and beverage tableware
Includes e.g.:
· Production of paper or plastic resin
· Transport
USAGE
Usage includes operations and use of multi-use tableware at Quick
Service Restaurants (QSR) (e.g. in-house dishwashing and drying)
The electricity demand of the washing process is the single main
contributor to climate change impact in the multi-use scenario,
accounting for 83% of the total impact.
END-OF-LIFE
End-of-life treatment of multi-use and single-use tableware
Includes e.g.:
· Incineration of tableware with energy recovery
· Recycling of tableware materials
· Landfilling
Size of pie segments are for
illustrative purposes only.
The data is assumed as EU-27
and UK average grid mix
USAGE
20,802 kg CO2
eq.
MANUFACTURING
3,457 kg CO2
eq.
END-OF-LIFE
-4,597 kg CO2
eq.
USAGE
20 kg CO eq.
MANUFACTURING
13,604 kg CO2
eq.
PLASTIC MULTI-USE
TABLEWARE*
2 The functional unit was the in-store consumption of foodstuff and beverages with single-use or multi-use dishes (including cups, lids, plates,
containers and cutlery) in an average QSR for 365 days in Europe in consideration of established facilities and hygiene standards as well as
QSR-specific characteristics (e.g. peak times, throughput of served dishes). *Baseline scenario - Polypropylene tableware
PAPER-BASED
SINGLE-USE
TABLEWARE CARBON FOOTPRINT
TOTAL
9,007 kg CO2
eq.
CARBON FOOTPRINT
TOTAL
24,962 kg CO2
eq.
Multi-use tableware systems generate over 2.7 times higher CO2-e emissions than paper-based single-use tableware systems1

Source: CGIAR Research Program on Climate Change, Agriculture and Food Security (CCAFS)
April–June 2021 Roadshow presentation | Huhtamaki15
Food is a major contributor to climate change
1/3 of the food produced is lost or
wasted
Global GHG emissions
of global GHG emissions come from wasted of lost food
of global GHG emissions come from food systems
approx. 25% 8%

April–June 2021 Roadshow presentation | Huhtamaki16
Packaging accounts for approx. 5% of food’s CO2 footprint
80% 15% 5%
Food production Transport and distribution Packaging

The CO2 emissions of paper cups can be halved by recycling all cups
The fiber in our paper cups can be used up to seven times
Cup & lid 9%
Milk production 73%
Energy to make the latte 4%
Coffee production 14%
Co2 of a latte on the go
Source: Comparative LCA study of cups for hot drinks made of six different materials, VTT 2019
April–June 2021 Roadshow presentation | Huhtamaki17
Only a small share of CO2 emissions of a latte on-the-go come from the cup, and these can be halved by increasing recycling

April–June 2021 Roadshow presentation | Huhtamaki18
In addition to recyclable packaging, consumer awareness and an efficient collection, sorting and recycling infrastructure are required to solve littering and waste challenges
Collection, sortingand recycling infrastructure
Consumer behaviour
Less waste in the environment
Recyclable packaging

April–June 2021 Roadshow presentation | Huhtamaki19
Recycling rates vary – significant potential to utilize valuable materials
~14% ~30-90% ~70% ~50-80%
Recycled Recycled Recycled Recycled
Plastic packaging Paper Glass Metal
Source: Smithers Pira: Future Lifecycles of Packaging Recycling to 2023

Examples of recent innovations and product launches
April–June 2021 Roadshow presentation | Huhtamaki20
100% renewable FutureSmart product line further reduces CO2
emissions
Huhtamaki paper straws– an eco-friendly solution for enjoying cold drinks
High-quality
alternative to plastic
straws
RecyclableMade from
100% PEFC certified
paper
Huhtamaki blueloop – flexible packaging designed for recycling
• Mono-material structures
• Minimum 90% standard materials like PE, PP, or PET
• Available already for several end applications ranging from candy and chocolates to dry foods and personal care products
Huhtamaki Fresh ready meal tray – a recyclable alternative to black plastic, made of renewable raw materials
Micro-wave
and oven safe
Cooler to touch than
plastic

Appendix:Segments and financials

April–June 2021 Roadshow presentation | Huhtamaki22
Operating model: We are a converter
Raw materials- Paperboard- Plastic resins- Recycled fiber- Approximately 66% of raw
materials used in manufacturing our products are renewable
Energy and water in 2020- Energy 2,142 GWh- Water 8.7 million m3
Global operations- 81 manufacturing units, 35
countries
Personnel- Competence and know-how of
18,227 employees
Financial resources on Dec 31, 2020- Equity M€ 1,364- Net debt M€ 867
Social capital- Key stakeholder relationships- Collaboration with key customers
and suppliers
Intellectual property- Immaterial rights, patents- Brand and reputation
Advanced manufacturing- Cup forming- Folded carton production- Smooth and rough molded fiber
production- Extrusion and lamination technology- Plastic thermoforming- Printing and digital printing
Resource efficiency- Energy: 5% improvement in energy efficiency
in 2016–2020
Innovations- Digitalization and design of sustainable
packaging solutions- Continuous product development
Leadership and management- Strive for excellence and collaboration
between our business segments and centralized functions to benefit our customers
- Workplace safety improved 45% in 2016–2020 with the Lost Time Incident rate decreasing from 2.9 to 1.6
- Guiding principles and systems (e.g. Code of Conduct)
- Continuous improvement (Lean Six Sigma, Total Productive Manufacturing)
Organic growth and acquisitions- Growing both organically and through
acquisitions- Capital expenditure M€ 223
Safe, convenient and fit-for-purpose consumer packaging- Cups, plates, bowls and folded cartons
for foodservice products- Laminates, pouches and labels for food
and personal care- Molded fiber packaging for eggs and
fruit
Emissions and waste- Relative GHG emissions reduced 11% in
2016–2020- Waste in 2020
- Recycling 70%- Energy recovery 10%- Landfill 19%
Intellectual- Immaterial rights, patents
New manufacturing assets- Through investments and acquisitions
Economic value- Gross profit M€ 553
Environment- Replacing non-renewable materials
with alternative renewable materials- Reducing food waste with fit-for-
purpose packaging, designed for circular economy
- Impact on climate change from manufacturing and waste to landfill
Intellectual- Huhtamaki brand value- Product and design innovations
Social capital- Customer satisfaction - Employee engagement and increased
know-how through learning- Job opportunities and value for local
communities
Financial economic value distributed in 2020- Profit M€ 184- Wages and benefits M€ 721- Net financial items M€ 28- Taxes M€ 53- Dividends M€ 93
Key inputs Our activities Key outputs Key impacts

Fiber and Foodservice Europe-Asia-Oceania
April–June 2021 Roadshow presentation | Huhtamaki23
Recycled and other natural fibers are used to make fresh product packaging, such as egg, fruit, food and drink packaging, and foodservice paper and plastic disposable tableware, such as cups and lids, is supplied to foodservice operators, fast food restaurants and coffee shops.
Production in Europe, South Africa, Middle East, Asia and Oceania.
NET SALES
€1,121 mnADJUSTED EBIT MARGIN
8.7%EMPLOYEES
6,440Combined figures for 2020 for Fiber Packaging and Foodservice Europe-Asia-Oceania.
OPERATING COUNTRIES MANUFACTURING UNITS
28 34
MARKET POSITION
#1• globally operating foodservice
packaging company
• in fiber packaging globally
Fiber Packaging and Foodservice E-A-O have been integrated as of June 1, 2020

North America
April–June 2021 Roadshow presentation | Huhtamaki24
Serves local markets with foodservice packaging, Chinet® disposable tableware as well as ice-cream containers and other consumer goods packaging products.
Production in the United States and Mexico.
NET SALES
€1,139 mnADJUSTED EBIT MARGIN
12.0%EMPLOYEES
4,185Figures for 2020
OPERATING COUNTRIES MANUFACTURING UNITS
2 18
MARKET POSITION
#1globally operating
foodservice packaging
company

Flexible Packaging
April–June 2021 Roadshow presentation | Huhtamaki25
Flexible packaging is used for a wide range of pre-packed consumer products including food, beverages, pet food, hygiene and health care products.
Production in Europe, Middle East and Africa, Asia and South America.
NET SALES
€1,051 mnADJUSTED EBIT MARGIN
7.7%EMPLOYEES
7,468Figures for 2020
OPERATING COUNTRIES MANUFACTURING UNITS
16 29
MARKET POSITION
#1flexible packaging
company in
emerging markets

Products, customers, sales split and competitors per segment
April–June 2021 Roadshow presentation | Huhtamaki26
Key competitors
Net sales split
Our customers
Our products
Fiber Packaging North America Flexible Packaging
Europe ROW
Europe
Asia
Middle East and Africa
Foodservice
Retail
Consumer goods
• Graphic Packaging • Westrock• Dart/Solo • Sabert• Reynolds/Pactiv • Gen Pak• Koch/Georgia Pacific • AJM• Novolex • Aspen• Berry Global
• Amcor • Dai Nippon
• Constantia • Regional players
• Sealed Air • Local players
• Hartmann • Local players
• Pactiv • Plastics manufacturers
Western Europe & UK
Central & Eastern Europe
Rest of world
Foodservice E-A-O
• Seda • Graphic Packaging
• Detpak • Dart/Solo
• HK Cup • Local players
Fiber Packaging and Foodservice E-A-O have been integrated as of June 1, 2020
Net sales(in 2020)
EUR 829 million (25% of group) EUR 1,051 million (32% of group)EUR 308 million (9% of group) EUR 1,139 million (34% of group)

April–June 2021 Roadshow presentation | Huhtamaki27
Strategic focus areas for segments
Global key accounts in QSR, Coffee and FMCG• Strong business with room to grow
product portfolio and expand geographically
• Well positioned to expand in emerging markets
Plastic substitution• Unique platform in paperboard
conversion and molded fiber, to develop complex sustainable solutions
• Global reach and scale allows to industrialize new solutions fast
Agile models• Agile model serving small accounts,
combining short-run, long-run, sourcing and distribution capabilities
• Base to build a strong food delivery packaging business
Foodservice E-A-O North America Flexible PackagingFiber Packaging
Retail, Foodservice, Consumer goods• Convenience lifestyle driving growth for
our core products
• Room to expand in growing categories – folded carton, molded fiber, private label pressed plates
Unique capabilities position us well to capture growth• Brand building and retail expertise
• Ice cream systems and capabilities
• Paperboard technology and ability to do complex promotion management
• Molded fiber technology and scale
• Strong track record in sustainability
• National network allowing us to offer right products in the right markets to the right customers
Strong demand for flexible packaging• Strong underlying demand for FMCG
products, driven by emerging markets
• Flexible packaging remains superior solution for modern retail supply chain
• Footprint in fast growing emerging markets with further room to expand
• Accelerating innovation in line with our customer needs positions us for growth above market
Competitiveness, agility and sustainability• Improving operations to be the best-in-
class will drive rise in profitability
• Increasing agility, while maintaining quality and reliability
• Actions in circularity, advocacy and innovation for sustainability will enhance our industry leadership
Egg and fruit protective packaging• Steady underlying growth and plastic
substitution in some geographies
• Room to expand geographically, within product categories and to take share from plastic
• Base to develop circular models together with Foodservice
Molded fiber technology• Plastic substitution in QSR, FMCG and
Grocery Retail drives demand for more complex molded fiber applications
• Our molded fiber technology and application development capabilities position us well to capture this opportunity together with Foodservice
Fiber Packaging and Foodservice E-A-O have been integrated as of June 1, 2020

April–June 2021 Roadshow presentation | Huhtamaki28
Segment key figures (1/2)
All figures excluding Items Affecting Comparability (IAC). 1 2018 figures have been restated for IFRS 16 impact.
Key figures (MEUR) 2013 2014 2015 2016 2017 20181 2019 2020 Long-term ambition
Net sales 629.1 620.4 667.5 741.0 807.5 881.7 956.7 829.1
Comparable growth 2% 4% 4% 5% 4% 4% 4% -10% 5-7%
Adjusted EBIT 46.9 57.4 52.4 63.2 70.1 77.1 85.7 60.9
Margin 7.5% 9.3% 7.9% 8.5% 8.7% 8.7% 9.0% 7.3% 9-11%
Key figures (MEUR) 2013 2014 2015 2016 2017 20181 2019 2020 Long-term ambition
Net sales 236.3 247.0 260.3 267.8 285.1 283.0 293.4 307.8
Comparable growth 6% 9% 5% 5% 5% 4% 6% 9% 3-5%
Adjusted EBIT 29.6 35.0 33.5 34.6 28.2 31.2 29.0 37.4
Margin 12.5% 14.2% 12.9% 12.9% 9.9% 11.0% 9.9% 12.2% 13-15%
Foodservice Europe-Asia-Oceania
Fiber Packaging
Fiber Packaging and Foodservice E-A-O have been integrated as on June 1, 2020• Improving customers access to combined fiber
and paperboard technology • Leveraging organization synergies and growth
opportunities (plastic substitution, food delivery)
• Positive financial benefits

April–June 2021 Roadshow presentation | Huhtamaki29
Segment key figures (2/2)
All figures excluding Items Affecting Comparability (IAC). 1 2018 figures have been restated for IFRS 16 impact.
Key figures (MEUR) 2013 2014 2015 2016 2017 20181 2019 2020 Long-term ambition
Net sales 725.3 769.3 947.7 1,005.1 1,000.4 1,002.7 1,152.7 1,138.9
Comparable growth 5% 6% 4% 6% 2% 5% 9% 1% 3-5%
Adjusted EBIT 38.4 38.4 88.2 107.6 104.1 73.0 111.4 136.6
Margin 5.3% 5.0% 9.3% 10.7% 10.4% 7.3% 9.7% 12.0% 9-10%
Key figures (MEUR) 2013 2014 2015 2016 2017 20181 2019 2020 Long-term ambition
Net sales 585.8 618.0 868.9 868.6 912.7 952.3 1,016.4 1,050.8
Comparable growth 4% 7% 3% -1% 4% 7% 3% 1% 6-8%
Adjusted EBIT 44.0 45.5 68.8 73.8 69.7 67.8 82.6 80.7
Margin 7.5% 7.4% 7.9% 8.5% 7.6% 7.1% 8.1% 7.7% 9-11%
North America
Flexible Packaging

April–June 2021 Roadshow presentation | Huhtamaki30
Group financials 2010-2020
2010 2011 20122 20131 20141 2015 2016 2017 20182 2019 2020
Net sales MEUR 1,952 2,043 2,321 2,161 2,236 2,726 2,865 2,989 3,104 3,399 3,302
Comparable growth3 3% 5% 3% 3% 6% 4% 4% 3% 5% 6% -2%
Adjusted EBITDA4 MEUR 214 208 254 242 259 342 382 390 399 456 473
Margin4 11.0% 10.2% 10.9% 11.2% 11.6% 12.5% 13.3% 13.0% 12.8% 13.4% 14.3%
Adjusted EBIT4 MEUR 134 128 164 160 175 238 268 268 251 293 302
Margin4 6.9% 6.2% 7.0% 7.4% 7.8% 8.7% 9.4% 9.0% 8.1% 8.6% 9.1%
Adjusted EPS4 EUR 0.92 0.87 1.19 1.17 1.24 1.65 1.83 1.9 1.69 1.88 1.95
Adjusted ROI4 12.0% 9.8% 12.6% 12.1% 12.6% 14.7% 14.7% 13.6% 11.6% 12.3% 11.7%
Adjusted ROE4 14.5% 11.0% 15.8% 15.8% 16.1% 18.1% 17.7% 17.0% 14.5% 15.2% 14.8%
Capex MEUR 86 82 94 121 127 147 199 215 197 204 223
Free cash flow MEUR 113 65 103 56 65 91 100 56 80 226 207
Gearing 0.32 0.49 0.5 0.5 0.32 0.53 0.57 0.58 0.73 0.63 0.64
Net debt to adj. EBITDA4 1.2 1.9 1.6 1.6 1.0 1.6 1.8 1.8 2.3 2.0 1.8
Dividend per share EUR 0.44 0.46 0.56 0.57 0.60 0.66 0.73 0.80 0.84 0.89 0.925
1Continuing operations 2Figures restated 3Net sales growth excluding foreign currency changes, acquisitions and divestments 4Excluding IAC 5Proposal by the Board of Directors

April–June 2021 Roadshow presentation | Huhtamaki31
Comparable net sales growth by business segment
Quarterly Q1 17 Q2 17 Q3 17 Q4 17 Q1 18 Q2 18 Q3 18 Q4 18 Q1 19 Q2 19 Q3 19 Q4 19 Q1 20 Q2 20 Q3 20 Q4 20 Q1 21
Foodservice E-A-O 3% 2% 4% 6% 5% 5% 5% 3% 4% 3% 4% 4% -4% -28% -1% -7% -2%
North America 2% 1% 2% 2% 5% 2% 2% 11% 5% 13% 14% 6% 9% -5% 4% -2% -2%
Flexible Packaging 3% -2% 7% 9% 6% 11% 6% 4% 5% 1% 4% 3% 2% 2% 1% 0% 0%
Fiber Packaging 4% 8% 5% 4% 5% 3% 4% 5% 4% 7% 7% 8% 9% 10% 7% 8% 4%
Group 3% 1% 4% 5% 5% 6% 4% 6% 5% 6% 7% 5% 3% -8% 2% -2% -0%
Fiber Packaging and Foodservice E-A-O have been integrated as on June 1, 2020
• Improving customers access to combined fiber and paperboard technology
• Leveraging organization synergies and growth opportunities (plastic substitution, food delivery)
• Positive financial benefits
Annual FY 17 FY 18 FY 19 FY 20Long-term
ambition
Foodservice E-A-O 4% 4% 4% -10% 5-7%
North America 2% 5% 9% 1% 3-5%
Flexible Packaging 4% 7% 3% 1% 6-8%
Fiber Packaging 5% 4% 6% 9% 3-5%
Group 3% 5% 6% -2% 5+%

Solid track record of growth investments
April–June 2021 Roadshow presentation | Huhtamaki32
Capex M€ New product categoryNew countryCountries with major growth investments
2010
0
86
USA, Poland
2011
46
82
USA, India, Poland
Folding carton, US
2012
86
94
USA, Russia, Thailand
Labels, India
Pressed plates, US
Paper and plastic disposable packaging, China & HK
2013
20
121
USA
Corrugated folding carton, UK
7
127
2014
Russia, Brazil, Thailand
Bags & wraps, Russia
298
147
2015
USA, Brazil, Thailand, Russia, UK
UAE, Malaysia
2016
133
199
USA, UK, Poland
Folding carton, Europe
Short-run flexible packaging, Eastern Europe
2017
15
215
USA, Egypt, China, Poland
2018
70
197
USA, Egypt
Distribution, Australia
Ireland
2019
41
204
USA, South Africa
Paper straws, Europe
Fresh ready-meal trays, UK
Huhtamaki blueloopCAPEX
1,433M&A spend
6242013–2020
(EUR million)
M&A spend M€ (EV)
2020
40
223
USA, UK, Germany

20 acquisitions completed since 2011
April–June 2021 Roadshow presentation | Huhtamaki33
Date (completed) Acquired company Country Acquiring segment
Q3 2021 (TBC) Jiangsu Hihio-Art Packaging Co. Ltd China Foodservice E-A-O
Mar 2020 Laminor S.A. Brazil Flexible Packaging
Jan 2020 Mohan Mutha Polytech Private Limited India Flexible Packaging
Dec 2019 Everest Flexibles Pty Ltd South Africa Flexible Packaging
Jun 2018 Ajanta Packaging India Flexible Packaging
May 2018 Cup Print Unlimited Company Republic of Ireland Foodservice E-A-O
Apr 2018 Tailored Packaging Pty Ltd. Australia Foodservice E-A-O
Sep 2017 International Paper foodservice packaging units China Foodservice E-A-O
Jul 2016 Val Pack Solutions Private Limited India Foodservice E-A-O
May 2016 Delta Print and Packaging Ltd. UK Foodservice E-A-O
Jan 2016 FIOMO a.s. Czech Republic Flexible Packaging
Jul 2015 Pure-Stat Technologies, Inc. USA North America
Apr 2015 Butterworth Paper Cups Malaysia Foodservice E-A-O
Jan 2015 Positive Packaging India Flexible Packaging
Aug 2014 Interpac Packaging Ltd. New Zealand Foodservice E-A-O
Nov 2013 BCP Fluted Packaging Ltd. UK Foodservice E-A-O
Nov 2012 Webtech Labels Private Limited India Flexible Packaging
Aug 2012 Winterfield, LLC USA North America
Apr 2012 Josco (Holdings) Limited China Foodservice E-A-O
Nov 2011 Ample Industries, Inc. USA North America
Sep 2011 Paris Packaging, Inc. USA North America
More details of the acquisitions available on our website:
www.huhtamaki.com/en/investors/huhtamaki-as-an-investment/acquisitions-and-divestments/

Appendix:Shareholders and management

Split of shareholding
36%
15%
50%
Finnish institutions, companies and organizations
Households
Foreign and nominee-registered shareholders
April–June 2021 Roadshow presentation | Huhtamaki35
Largest shareholders and split of shareholding
Shareholder Number of shares % of total shares Change Change %
1. Finnish Cultural Foundation 11,314,840 10.50% 0 0.00%
2. Huhtamäki Oyj 3,395,709 3.15% -15,000 -0.44%
3. Ilmarinen Mutual Pension Insurance Company 2,690,000 2.50% 0 0.00%
4. Varma Mutual Pension Insurance Company 2,320,809 2.15% -125,000 -5.11%
5. Elo Mutual Pension Insurance Company 1,137,931 1.06% -17,500 -1.51%
6. Society of Swedish Literature in Finland 988,500 0.92% 0 0.00%
7. Holding Manutas Oy 880,000 0.82% 200,000 29.41%
8. The State Pension Fund 695,951 0.65% 0 0.00%
9. Mandatum Life Insurance Company Ltd. 657,330 0.61% -42,685 -6.10%
10. Security Trading Oy 580,000 0.54% 120,000 26.09%
Total of 10 largest shareholders 24,661,070 22.89% 119,815 0.11%
Other shareholders 83,099,315 77.11% - -
Total 107,760,385 100.00% - -
Shareholder data as at April 30, 2021. 'Change' refers to the change in shareholding during the previous calendar month.

April–June 2021 Roadshow presentation | Huhtamaki36
Foreign shareholding and distribution by geography
Total number of shareholders and foreign shareholding
40%
42%
44%
46%
48%
50%
52%
54%
20,000
25,000
30,000
35,000
40,000
45,000
01/2
015
04/2
015
07/2
015
10/2
015
01/2
016
04/2
016
07/2
016
10/2
016
01/2
017
04/2
017
07/2
017
10/2
017
01/2
018
04/2
018
07/2
018
10/2
018
01/2
019
04/2
019
07/2
019
10/2
019
01/2
020
04/2
020
07/2
020
10/2
020
01/2
021
04/2
021
Total number of shareholders (left) Foreign and nominee-registered shareholders (right)
Approximate shareholder distribution by geography (Ownership as a percentage of identified shareholders in September 2020)
56%
11%
8%
8%
7%4%
5% 1%
Finland
United States
Sweden
United Kingdom
France
Norway
Rest of Europe
Rest of the world

April–June 2021 Roadshow presentation | Huhtamaki37
Global Executive Team
Thomasine KamerlingEVP Sustainability and Communications
Thomas GeustCFO
Eric Le LayPresident, Foodservice EAOand Fiber Packaging
Ann O’HaraPresident, North America
Antti ValtokariEVP IT and Process Performance
Sami PauniEVP Corporate Affairs and Legal, Group General Counsel
Marina MadanatEVP Strategy and Business Development
Teija SarajärviEVP Human Resources and safety
Charles HéaulméPresident and CEO
Arup Basu, President, Flexible Packaging, decided to leave
Huhtamaki on May 12, 2021. The Flexible Packaging team will report to President and
CEO Charles Héaulmé until a successor is appointed.

April–June 2021 Roadshow presentation | Huhtamaki38
Board of Directors
Born 1957, Finnish citizen
Starting date: April 24, 2012
Key positions of trust: Sanoma Corporation, Chairman of the Board (2016–) and Board member (2014–); SAP SE, Supervisory Board member (2002–); and others
Kerttu TuomasVice-Chairman
Doug Baillie William R. Barker
Anja Korhonen Sandra Turner Ralf K. Wunderlich
Pekka Ala-PietiläChairman of the Board
Born 1957, Finnish citizen
Starting date: April 27, 2017
Key positions of trust:Medix Biochemica Group Oy, Board member (2018–); Kemira Oyj, Vice-Chairman of the Board (2014–2021) and Board member (2010–2021); and others
Born 1955, U.K. citizen
Starting date: April 21, 2016
Key positions of trust:Airtel Africa PLC, Board member (2019–); The MasterCard Foundation, Board member (2015–); Leverhulme Trust, Board member (2015–)
Born 1949, U.S. citizen
Starting date: March 24, 2010
Key positions of trust:Shield Holdco LLC (holding company of Dynatect Manufacturing, Inc.), Board member (2014, 2019–) and Chairman of the Board (2014–2019); and others
Born 1953, Finnish citizen
Starting date: April 25, 2018
Key positions of trust:Outotec Oyj, Board member (2013–);Oriola Oyj, Board member (2014–)
Born 1952, U.K. citizen
Starting date: April 20, 2011
Key positions of trust:Carpetright PLC, Board member (2010–); McBride PLC, Board member (2011–); Greggs PLC, Board member (2014–); Greene King PLC, Board member (2019–); and others
Born 1966, German citizen
Starting date: July 1, 2018
Key positions of trust:AptarGroup, Board member (2009–); Essentra PLC, Board member (2017–); Shepherd Building Group, Board Member (2021–)
All members of the Board of Directors are independent of the Company and significant shareholders.
-------------------------------------------------------------
= Audit Committee
= Human Resources Committee
= Chairman of the Committee
-------------------------------------------------------------
For more information about the Board of Directors, please see here.
HR
HR AC HR HR
AC AC HRAC

Q1 2021 results:Improved profitability with a gradual recovery in demand

April–June 2021 Roadshow presentation | Huhtamaki40
Q1 2021: Net sales negatively impacted by effects from COVID-19
Development of net sales in Q1 2021(EUR million)
Comparable net sales growth is growth excluding foreign currency changes, acquisitions, divestments and ancillary businesses.Acquisitions calculated for 12 first months from closing.
845
802
-3 6
-46
Q1 2020 Organic Acquisitions Currency Q1 2021
Net sales -5% in Q1 2021
• Comparable net sales flat (4% in emerging markets)
• 1% growth from acquisitions
• 5% negative currency impact

April–June 2021 Roadshow presentation | Huhtamaki
Gradual recovery for food on-the-go, slow progress in Flexible Packaging
Comparable net sales growth is growth excluding foreign currency changes, acquisitions, divestments and ancillary businesses.
• COVID-19 continued to affect foodservice business globally, however demand is gradually improving
• North America sales growth impacted by the relative comparison to a very strong Q1 2020
• Slow progress in Flexible Packaging organic growth
• Solid growth in fiber even in comparison to a very strong Q1 last year
Comparable growth Q1 20 Q2 20 Q3 20 Q4 20 Q1 21 2020Long-term
ambitions
Foodservice E-A-O -4% -28% -1% -7% -2% -10% 5-7%
North America 9% -5% 4% -2% -2% 1% 3-5%
Flexible Packaging 2% 2% 1% 0% 0% 1% 6-8%
Fiber Packaging 9% 10% 7% 8% 4% 9% 3-5%
Group 3% -8% 2% -2% -0% -2% 5+%
41

April–June 2021 Roadshow presentation | Huhtamaki
Strong adjusted EBIT adding to the progress made in previous quarters
• Net sales decreased due to FX impact – gradually improving sales not enough to offset
• Adjusted EBIT improved following favorable sales mix and continued focus on operational efficiency
• Increase in adjusted EPS following improvement in earnings
• Significant decrease in capex, mostly timing-related
MEUR Q1 21 Q1 20 Change 2020
Net sales 801.9 844.6 -5% 3,301.8
Adjusted EBIT1 77.0 73.6 5% 302.1
Margin 9.6% 8.7% 9.1%
Adjusted EPS, EUR2 0.49 0.46 7% 1.95
Capital expenditure 33.0 39.4 -16% 223.5
1) Excluding IAC of EUR -5.3 million in Q1 2021 (EUR 8.9 million) and -36.8 million in 2020.2) Excluding IAC of EUR -4.1 million in Q1 2021 (EUR 6.9 million) and -26.2 million in 2020.
42

Q1 2021 results:Business segment review

Key figures, MEUR Q1 21 Q1 20 Change
Net sales 207.4 217.6 -5%
Comparable growth -2% -4 %
Adjusted EBIT1 17.6 17.5 1%
Margin 8.5% 8.0%
Adjusted RONA 7.7% 10.9%
Capital expenditure 9.8 16.0 -39%
Operating cash flow1 21.4 11.1 93%
Net sales and comparable growth (EUR million and %)
218
167
231213207
Q1 Q2 Q3 Q4
2020
2021
-4% -2% -28% -1% -7%
Foodservice EAO: Gradual recovery in demand
April–June 2021 Roadshow presentation | Huhtamaki
Comp. growth
• COVID-19 continued to have a negative impact on demand – demand improved gradually
• The segment’s adjusted EBIT remained at the previous year’s level despite lower sales
• Encouraging signs on the back of the transformation
1) Excluding IAC of EUR -4.2 million in Q1 2021 (EUR -1.6 million).
44

Acquisition of Jiangsu Hihio-Art Packaging Co. Ltd in China
April–June 2021 Roadshow presentation | Huhtamaki
Jiangsu Hihio-Art Packaging Co. Ltd. (announced on April 21, 2021)
• A leading manufacturer of paper bags, wraps and folding carton packaging in China
• Manufacturing unit in Xuzhou city, Jiangsu
• Currently serves international quick-service restaurants (QSR) as well as national bakery chains
• Strengthens Huhtamaki’s position as the leading foodservice packaging provider in Asia and expands product portfolio in China
Net salesApproximately EUR 20 million
EmployeesApproximately 200
Debt free purchase priceEUR 27 million
Expected completion of acquisitionEnd of Q3 2021
Reporting segmentPart of the Foodservice Europe-Asia-Oceania segment
45

1) Excluding IAC of EUR 0.0 million in Q1 2021 (EUR -3.4 million).
Net sales and comparable growth (EUR million and %)
286 296 283 274256
Q1 Q2 Q3 Q4
2020
2021
9% -2% -5% 4% -2%
North America: Continued strong performance
April–June 2021 Roadshow presentation | Huhtamaki
• Sales growth impacted by the relative comparison to a very strong Q1 2020
• Demand for foodservice packaging still impacted by COVID-19, continued strong demand for retail tableware
• Earnings improved as a result of operational performance and favorable sales mix
Comp. growth
Key figures, MEUR Q1 21 Q1 20 Change
Net sales 256.0 286.2 -11%
Comparable growth -2% 9 %
Adjusted EBIT1 31.2 30.4 2%
Margin 12.2% 10.6%
Adjusted RONA 17.0% 14.0%
Capital expenditure 9.6 11.9 -19%
Operating cash flow1 13.0 7.3 77%
46

1) Excluding IAC of EUR -1.1 million in Q1 2021 (EUR -4.7 million).
Net sales and comparable growth (EUR million and %)
271 263 266 251267
Q1 Q2 Q3 Q4
2020
2021
2% 0% 2% 1% 0%
Flexible Packaging: Slow progress in organic growth
April–June 2021 Roadshow presentation | Huhtamaki
• Slow progress particularly linked to varying levels of demand across geographies
• Growth was strongest in Southeast Asia – restrictions and lockdowns impacted sales negatively in the United Arab Emirates
• Earnings growth was driven mainly by improved operational efficiency and partially offset by higher raw material prices
Comp. growth
Key figures, MEUR Q1 21 Q1 20 Change
Net sales 267.1 271.0 -1%
Comparable growth 0% 2 %
Adjusted EBIT1 21.7 20.9 4%
Margin 8.1% 7.7%
Adjusted RONA 10.1% 10.5%
Capital expenditure 8.1 7.9 3%
Operating cash flow1 14.8 1.7 >100%
47

1) Excluding IAC of EUR 0.0 million in Q1 2021 (EUR -0.7 million).
Net sales and comparable growth (EUR million and %)
75 76 7285
79
Q1 Q2 Q3 Q4
2020
2021
9% 4% 10% 7% 8%
Fiber Packaging: Continued strong demand and performance
April–June 2021 Roadshow presentation | Huhtamaki
• Continued strong demand for fiber-based packaging
• Net sales growth was strong, especially in Eastern Europe, driven by volume and pricing actions
• Earnings improvement driven by volume growth and pricing actions implemented earlier
Comp. growth
Key figures, MEUR Q1 21 Q1 20 Change
Net sales 78.6 74.5 5%
Comparable growth 4% 9 %
Adjusted EBIT1 9.5 8.2 15%
Margin 12.1% 11.0%
Adjusted RONA 16.1% 13.1%
Capital expenditure 5.2 3.4 53%
Operating cash flow1 2.6 -0.1 >100%
48

Q1 2021 results:Financials review

April–June 2021 Roadshow presentation | Huhtamaki
Adjusted EBIT margin increased to 9.6%
• Lower net sales due to negative impact from COVID-19 on foodservice products
• Earnings improved following favorable sales mix and continued focus on operational efficiency
• Lower net financial items
• Tax rate 23%
• Adjusted EPS increased 7%
MEUR Q1 21 Q1 20 Change 2020
Net sales 801.9 844.6 -5% 3,301.8
Adjusted EBITDA1 117.8 117.0 1% 473.1
Margin 1 14.7% 13.9% 14.3%
Adjusted EBIT2 77.0 73.6 5% 302.1
Margin 2 9.6% 8.7% 9.1%
EBIT 71.6 82.6 -13% 265.3
Net financial items -8.4 -9.2 9% -28.2
Adjusted profit
before taxes68.6 64.4 6% 270.9
Adjusted income tax
expense3 -16.0 -14.5 -11% -60.9
Adjusted profit for
the period4 52.5 49.9 5% 209.9
Adjusted EPS, EUR4 0.49 0.46 7% 1.95
1) Excluding IAC of EUR -3.0 million in Q1 2021 (EUR 13.1 million) and EUR -8.6 million in 2020.
2) Excluding IAC of EUR -5.3 million in Q1 2021 (EUR 8.9 million) and EUR -36.8 million in 2020.
3) Excluding IAC of EUR 1.2 million in Q1 2021 (EUR -2.0 million) and EUR 7.6 million in 2020.
4) Excluding IAC of EUR -4.1 million in Q1 2021 (EUR 6.9 million) and EUR -26.2 million in 2020.
50

Foreign currency translation impact
Q1 2021(EUR million)
Net sales EBIT
-46 -5
April–June 2021 Roadshow presentation | Huhtamaki
Continued negative currency impact
Please note: Income statement is valued on average rate, balance sheet on closing rate.
Average
rate
Average
rate
Q1 2020 Q1 2021Q1 20 Q2 20 Q3 20 Q4 20 Q1 21
USD 1.10 1.21 -9% 1.10 1.13 1.17 1.23 1.17 -6%
INR 79.80 87.95 -10% 83.50 85.19 86.28 89.88 86.25 -3%
GBP 0.86 0.88 -2% 0.89 0.92 0.91 0.90 0.85 4%
CNY 7.69 7.82 -2% 7.83 7.98 7.98 8.01 7.72 2%
AUD 1.67 1.56 7% 1.80 1.64 1.64 1.60 1.54 14%
THB 34.46 36.49 -6% 36.08 34.85 36.99 36.77 36.71 -2%
RUB 73.45 89.75 -22% 88.14 78.92 92.16 91.89 89.16 -1%
BRL 4.89 6.59 -35% 5.65 6.11 6.60 6.36 6.77 -20%
NZD 1.74 1.68 3% 1.84 1.75 1.77 1.71 1.68 9%
ZAR 16.87 18.05 -7% 19.73 19.43 19.87 18.01 17.54 11%
Change in
average
rate
Closing ratesChange in
closing
rate(YoY)
51

April–June 2021 Roadshow presentation | Huhtamaki
Net debt to adjusted EBITDA decreased compared to Q1/2020
Net debt, net debt/adj. EBITDA and gearing • Net debt/Adj. EBITDA at 1.9
• At the end of Q1 2021:
• Cash and cash equivalents EUR 272 million
• Unused committed credit facilities available EUR 323 million
• Net debt EUR 898 million and lease liabilities EUR 160 million
Ambition
2–3
Covenant level 3.75
980908 896 867 898
2.12.0
1.91.8
1.9
0.68 0.62 0.65 0.64 0.62
Q1 20 Q2 20 Q3 20 Q4 20 Q1 21
Net debt, M€
Net debt/Adj.
EBITDA
Gearing
52

0
100
200
300
400
500
600
700
2021 2022 2023 2024 2025 Later
Lease liabilities Contingent considerations
Available unused committed facilities Drawn committed credit facilities
Commercial paper program Uncommitted loans from financial institutions
Bonds and other loans
April–June 2021 Roadshow presentation | Huhtamaki
Loan maturities
Debt maturity structure March 31, 2021(EUR million)
• Average maturity 3.4 years at the end of Q1 2021 (3.2 at the end of Q1 2020)
• Unused committed credit facilities of EUR 323 million maturing in 2022
• New syndicated multicurrency revolving credit facility loan agreement signed in January 2021 • Size: EUR 400 million
• Maturity: 3 years with two one-year extension options
• Interest margin: Tied to three sustainability indicators
• Reason: To refinance existing credit facility signed in 2015
• Purpose: For general corporate purposes
53

The Board of Directors aims for predictable and growing dividends
April–June 2021 Roadshow presentation | Huhtamaki54
Dividend per share (EUR) and payout ratio (% of adjusted EPS) 2020 2019 Change
Adjusted EPS 1.95 1.88 4%
Dividend per share 0.92 0.89 3%
Payout ratio 47% 47%
Share price on Dec 31 42.26 41.38 2%
Dividend yield 2.2% 2.2%
0,34 0,38 0,44 0,460,56 0,57 0,60 0,66
0,730,80 0,84 0,89 0,92
65%
50%
42%
53%
47% 47% 47%
40% 40%42%
50%47% 47%
2008 2009 2010 2011 2012 2013 2014 2015 2016 2017 2018 2019 2020*
Dividend per share Payout ratio
Long-term ambition:Payout ratio
40-50%
– 12th consecutive year of growing dividends
– Dividend has increased 171% since 2008
– CAGR +9% since 2008

Progress towards long-term financial ambitions
April–June 2021 Roadshow presentation | Huhtamaki
FY 2018 figures restated for IFRS 16 impact. * Dividend for 2020 is a proposal made by the Board of Directors.
• A dividend of EUR 0.92 for fiscal year 2020, in two instalments:
• First instalment: EUR 0.46 per share, payment date May 3, 2021
• Second instalment: EUR 0.46 per share, payment date October 8, 2021
*
2014 2015 2016 2017 2018 2019 2020 Q1 2021Long-term
ambition
Organic growth 6% 4% 4% 3% 5% 6% -2% -0% 5+%
Adjusted EBIT margin 7.8% 8.7% 9.4% 9.0% 8.1% 8.6% 9.1% 9.6% 10+%
Net debt/Adj. EBITDA 1.0 1.6 1.8 1.8 2.3 2.0 1.8 1.9 2-3
Dividend payout ratio 47% 40% 40% 42% 50% 47% 47% 40-50%
55

Q1 2021 results:Looking forward

Outlook 2021
April–June 2021 Roadshow presentation | Huhtamaki
The Group’s trading conditions are expected to improve compared to 2020, however with continued volatility in the operating environment. Huhtamaki's diversified product portfolio provides resilience and the Group’s good financial position enables addressing profitable growth opportunities.
57
Short-term risks and uncertainties
April–June 2021 Roadshow presentation | Huhtamaki
The COVID-19 pandemic is a significant short-term risk potentially creating disturbance in the Group’s trading conditions and its operating environment, as well as in demand for the Group’s products. Volatile raw material and energy prices as well as movements in currency rates are considered to be relevant short-term business risks and uncertainties in the Group's operations. General political, economic and financial market conditions can also have an adverse effect on the implementation of the Group's strategy and on its business performance and earnings.
58

Improved profitability with a gradual recovery in demand
April–June 2021 Roadshow presentation | Huhtamaki
• The gradual recovery in demand for food on-the-go products has continued. Strong continued demand for fiber packaging and retail tableware
• Significant tension in supply and price of raw materials – especially in polymers and recycled fiber
• Unfavorable currency exchange rate evolution
• Our transformation journey continues, with focus on improving our competitiveness, innovation and sustainability, for growth
59

April–June 2021 Roadshow presentation | Huhtamaki
Financial calendar 2021
July 22, 2021
Half-yearly Report
October 21, 2021
Q3 2021 Interim Report
60

Disclaimer
April–June 2021 Roadshow presentation | Huhtamaki61
Information presented herein contains, or may be deemed to contain, forward-looking statements. These statements relate to future events or Huhtamäki Oyj’s or its affiliates’ (“Huhtamaki”) future financial performance, including, but not limited to, strategic plans, potential growth, expected capital expenditure, ability to generate cash flows, liquidity and cost savings that involve known and unknown risks, uncertainties and other factors that may cause Huhtamaki’s actual results, performance or achievements to be materially different from those expressed or implied by any forward-looking statements. By their nature, forward-looking statements involve risks and uncertainties because they relate to events and depend on circumstances that may or may not occur in the future. Such risks and uncertainties include, but are not limited to: (1) general economic conditions such as movements in currency rates, volatile raw material and energy prices and political uncertainties; (2) industry conditions such as demand for Huhtamaki’s products, pricing pressures and competitive situation; and (3) Huhtamaki’s own operating and other conditions such as the success of manufacturing activities and the achievement of efficiencies therein as well as the success of pending and future acquisitions and restructurings and product innovations. Future results may vary from the results expressed in, or implied by, forward-looking statements, possibly to a material degree. All forward-looking statements made in this presentation are based on information currently available to the management and Huhtamaki assumes no obligation to update or revise any forward-looking statements. Nothing in this presentation constitutes investment advice and this presentation shall not constitute an offer to sell or the solicitation of an offer to buy any securities or otherwise to engage in any investment activity.