CIN Company Name Investor First Name Investor Middle Name ...
Upload
independentCategory
view
1download
0
INVESTOR PRESENTATION INVESTOR PRESENTATION INVESTOR PRESENTATION
VINGROUP JOINT STOCK COMPANY
Investor Presentation April 2014

INVESTOR PRESENTATION INVESTOR PRESENTATION INVESTOR PRESENTATION
Table of contents
2
A. Introduction to Vingroup 6 - 12
B. Business Strategy 10 - 12
C. Key Investment Highlights 13 - 22
D. Business Overview 23 - 24
E. Financial Overview – VAS 25 - 32
F. Financial Overview – IFRS 33 - 39
G. Appendix – Vincom Retail 40 - 42

INVESTOR PRESENTATION INVESTOR PRESENTATION INVESTOR PRESENTATION
A. Introduction to Vingroup
3

INVESTOR PRESENTATION INVESTOR PRESENTATION INVESTOR PRESENTATION
History of Vingroup
Synergies with large land bank owned by Vinpearl
Lowered overall cost of funding for the Group
Critical mass and diversified business model and
revenue streams
Economies of scale
Membership program integration across all consumer
segments
Expanded operations into consumer focused industry
sectors such as hospitality and leisure
362 379435
2009 2010 2011 Jan-12
1,001 1,237
1,680
2,641
3,585
2009 2010 2011 2012 2013
Total Assets US$ mn
Established in 2001
Listed on the HOSE in Jan 2008
Opened the first resort, Vinpearl Resort Nha Trang in 2003
Opened Vinpearl Land in 2006 and Vinpearl Luxury Nha Trang,
Vinpearl Golf Club - Nha Trang, Vinpearl Luxury Danang in 2011
Established in May 2002
Listed on the HOSE in 2007
Opened the first commercial building Vincom Center Ba Trieu in 2004
Launched over 8,000 apartments at Royal City, Times City in 2010
and 2011
“Made a conscious decision to focus on the core business in Vietnamese
real estate” – McKinsey (2012)
1. Financials are prepared under VAS; Based on exchange rate of US$1 = VND21,135
2. Total assets from 2009-2011 contains only Vincom’s total assets. 2012 includes Vinpearl and Vincom’s total assets
Total Assets US$ mn
4
Vincom – Leadership in Residential, Commercial and Retail
Vinpearl – Leadership in Hospitality
Transformational Merger in 2011 to form Vingroup
Summary Financials(1)
Merger with
Vincom to form
Vingroup
(US$mn) 2010 2011 2012 2013
Revenue 183 109 374 870
EBITDA 152 84 185 550
Total Assets (2) 1,237 1,680 2,641 3,585
Cash + Cash
Equivalents + Short-
term investments
258 256 259 617

INVESTOR PRESENTATION INVESTOR PRESENTATION INVESTOR PRESENTATION 5
Integrated Platform Focused on the Vietnamese Urban Consumer
Uniquely positioned to benefit from Vietnam’s consumption growth
Source: Economist Intelligence Unit as of 31 December 2013
1. Total Consumer Spending equals Consumer Expenditure on Housing, on Tourism, on Hospital and others
Consumer Expenditure
on Housing
(US$ Bn)
Consumer Expenditure
on Tourism
(US$ Bn)
Consumer Expenditure
on Hospital
(US$ Bn)
Total Consumer
Spending (1)
(US$ Bn)
6.98.0
9.410.9
12.213.6
15.3
10 11 12 13E 14E 15E 16E
6.67.3
8.39.4
10.311.3
12.4
10 11 12 13E 14E 15E 16E
3.94.6
5.46.4
7.38.3
9.6
10 11 12 13E 14E 15E 16E
68.978.9
91.6104.9
115.6127.7
142.1
10 11 12 13E 14E 15E 16E
Largest Developer In Vietnam
Premium Brand Recognition
Diversified Sector Exposure
Develop, Manage and
Operate Commercial
and High-end
Residential and Mixed-
Use Properties
Residential and
Commercial
Manage and Operate
High-end Retail
Properties
Retail Properties
Develop, Manage, and
Operate Premium
Tourism, Hospitality
Properties
Manage and Operate
Entertainment Services
Hospitality and
Entertainment
Manage and Operate
a High-end and High-
quality Hospital
Hospital
Quality Formal
Education from
Kindergarten to High
School
Education
Own International &
Domestic retail brands;
Retail and
Lifestyle
INVESTOR PRESENTATION INVESTOR PRESENTATION INVESTOR PRESENTATION 6
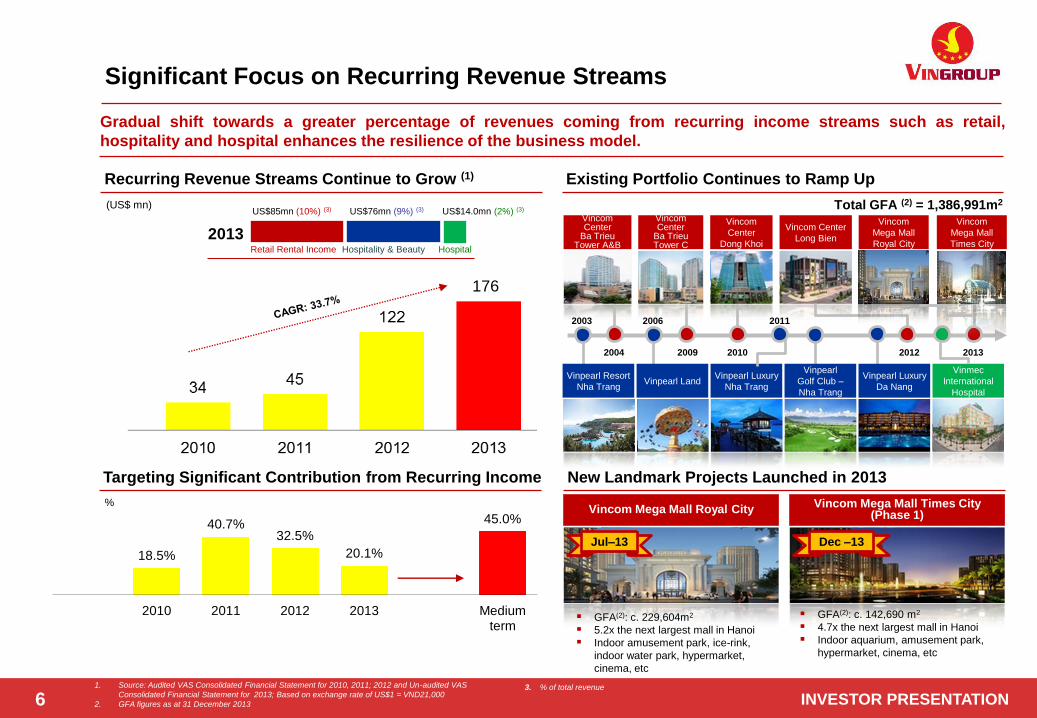
Significant Focus on Recurring Revenue Streams
Gradual shift towards a greater percentage of revenues coming from recurring income streams such as retail,
hospitality and hospital enhances the resilience of the business model.
1. Source: Audited VAS Consolidated Financial Statement for 2010, 2011; 2012 and Un-audited VAS
Consolidated Financial Statement for 2013; Based on exchange rate of US$1 = VND21,000
2. GFA figures as at 31 December 2013
(US$ mn)
Recurring Revenue Streams Continue to Grow (1)
%
Targeting Significant Contribution from Recurring Income
Existing Portfolio Continues to Ramp Up
New Landmark Projects Launched in 2013
2013
US$85mn (10%) (3) US$76mn (9%) (3) US$14.0mn (2%) (3)
Retail Rental Income Hospitality & Beauty Hospital
Vincom Mega Mall Royal City Vincom Mega Mall Times City
(Phase 1)
GFA(2): c. 229,604m2
5.2x the next largest mall in Hanoi
Indoor amusement park, ice-rink,
indoor water park, hypermarket,
cinema, etc
GFA(2): c. 142,690 m2
4.7x the next largest mall in Hanoi
Indoor aquarium, amusement park,
hypermarket, cinema, etc
Total GFA (2) = 1,386,991m2
Jul–13 Dec –13
2004 2009 2010 2012 2013
Vinpearl Resort
Nha Trang Vinpearl Land
Vinpearl Luxury
Nha Trang
Vinpearl
Golf Club –
Nha Trang
Vinpearl Luxury
Da Nang
Vinmec
International
Hospital
2003 2006 2011
Vincom Center
Ba Trieu Tower A&B
Vincom Center
Ba Trieu Tower C
Vincom
Center
Dong Khoi
Vincom Center
Long Bien
Vincom
Mega Mall
Royal City
Vincom
Mega Mall
Times City
176
3. % of total revenue
18.5%
40.7% 32.5%
20.1%
45.0%
2010 2011 2012 2013 Medium term
INVESTOR PRESENTATION INVESTOR PRESENTATION INVESTOR PRESENTATION 7
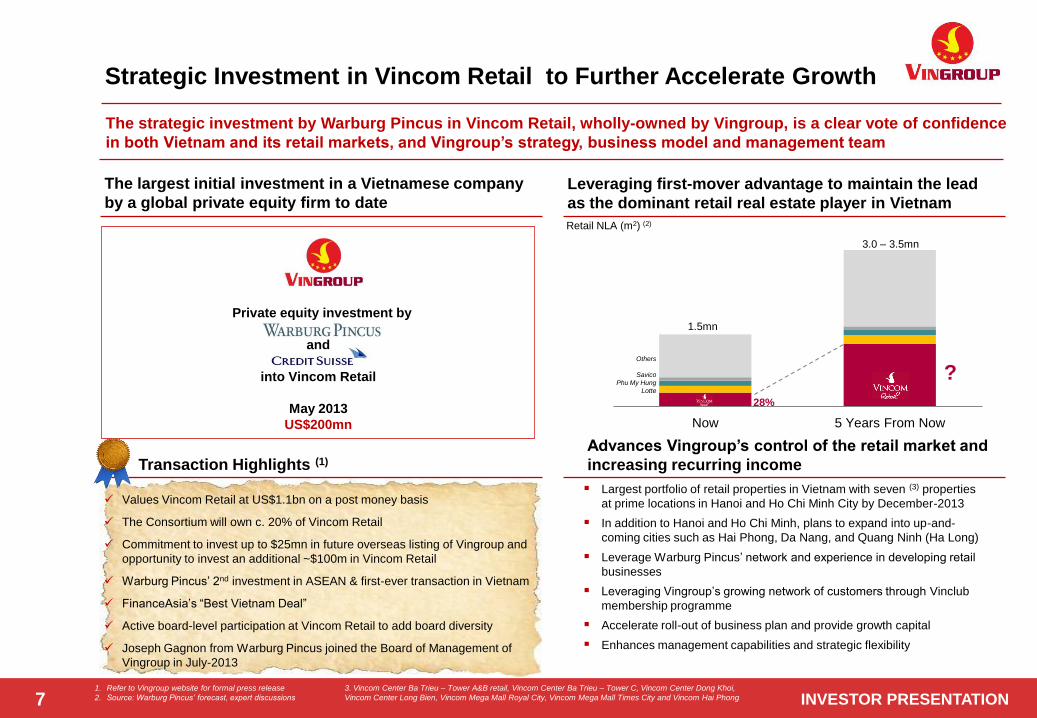
Strategic Investment in Vincom Retail to Further Accelerate Growth
The strategic investment by Warburg Pincus in Vincom Retail, wholly-owned by Vingroup, is a clear vote of confidence
in both Vietnam and its retail markets, and Vingroup’s strategy, business model and management team
1. Refer to Vingroup website for formal press release
2. Source: Warburg Pincus’ forecast, expert discussions
Private equity investment by
and
into Vincom Retail
May 2013
US$200mn
Largest portfolio of retail properties in Vietnam with seven (3) properties
at prime locations in Hanoi and Ho Chi Minh City by December-2013
In addition to Hanoi and Ho Chi Minh, plans to expand into up-and-
coming cities such as Hai Phong, Da Nang, and Quang Ninh (Ha Long)
Leverage Warburg Pincus’ network and experience in developing retail
businesses
Leveraging Vingroup’s growing network of customers through Vinclub
membership programme
Accelerate roll-out of business plan and provide growth capital
Enhances management capabilities and strategic flexibility
Advances Vingroup’s control of the retail market and
increasing recurring income
Values Vincom Retail at US$1.1bn on a post money basis
The Consortium will own c. 20% of Vincom Retail
Commitment to invest up to $25mn in future overseas listing of Vingroup and
opportunity to invest an additional ~$100m in Vincom Retail
Warburg Pincus’ 2nd investment in ASEAN & first-ever transaction in Vietnam
FinanceAsia’s “Best Vietnam Deal”
Active board-level participation at Vincom Retail to add board diversity
Joseph Gagnon from Warburg Pincus joined the Board of Management of
Vingroup in July-2013
The largest initial investment in a Vietnamese company
by a global private equity firm to date
Leveraging first-mover advantage to maintain the lead
as the dominant retail real estate player in Vietnam
Transaction Highlights (1)
Now 5 Years From Now
Others
Savico
Phu My Hung
Lotte
?
1.5mn
28%
Retail NLA (m2) (2)
3.0 – 3.5mn
3. Vincom Center Ba Trieu – Tower A&B retail, Vincom Center Ba Trieu – Tower C, Vincom Center Dong Khoi,
Vincom Center Long Bien, Vincom Mega Mall Royal City, Vincom Mega Mall Times City and Vincom Hai Phong

INVESTOR PRESENTATION INVESTOR PRESENTATION INVESTOR PRESENTATION 8
Residential Cash Flows Are Resilient & Locked In
Continue to ramp up our major development projects, with a substantial amount of presales locked in with cash
deposits on hand.
Vin
ho
me
s
Ro
ya
l C
ity
Total GFA: 1.207mn m2 (54% residential)
3,697/4,518 (82%) units sold and leased; of
which, 788 units delivered
Total contract value: US$539mn, received
US$468mn
90 149 65 255
694
361 290
78 71
434 244
873
605
(US$mn)
Resilient Apartment and Villa Sales with Upside to Come
2009 2010 2011 2012 2013
Major Projects To Be Handed Over This Year (1)
Vinhomes Riverside
Vinhomes Times City
Vinhomes Royal City
Vin
ho
me
sT
ime
s C
ity
Total GFA: 2.176mn m2 (64% residential)
Phase 1: 3,152/4,254 (74%) units sold; of
which, 2,419 units delivered
Total contract value: US$399mn, received
US$392mn
Vin
ho
me
s
Riv
ers
ide
Total GFA: 1.193mn m2 (56% residential)
Total contract value with 5 sub-developers
and a wholesaler: US$772mn, received
US$581mn
Promising Pipeline of New Projects (2)
1. As at 31 December 2013
2. These projects are undergoing an approval process as a result of which the components and GFA are subject to change
Vincom Projects Vinpearl Projects
Vin
co
m
Hai P
ho
ng
High-end retail, office & residential and
parking complex
Total GFA: c.144,730m2 (56% residential)
Expected start: 2Q – 2014
Expected completion: 1Q – 2015
Vin
co
m
Vil
lag
e 2
Mixed-use project adjacent to Vinhomes
Riverside in Long Bien, Hanoi
Total GFA: c. 596,523m2 (79% residential)
Expected start: 1Q – 2014
Expected completion: 4Q – 2016
56
Ng
uye
n
Ch
i T
ha
nh
Mixed-use residential, retail, office and
school
Total GFA(3): 226,382m2 (49% residential)
Expected start: 1Q– 2014
Expected completion: 1Q – 2017
Large scale resort development includes
hotel, golf course, villas, entertainment,…
Total GFA: 597,446m2
Started : 4Q– 2013
Expected completion: Oct 2014 (phase 1)
Vin
pe
arl
P
hu
Qu
oc
Unrecognized
revenue as at
31 Dec 2013
Progress
payment for
un-recognized
revenue
Vin
co
m
Cen
ter
Ha L
on
g Mixed-use site, a total land area of 1.6ha, 5
storey-mall with 1 basement
Total GFA(3): 43,589m2
Started: Oct 2013
Expected completion: Oct 2014
Pro
jec
t T
ho
ma
s Mixed-use project in Binh Thanh District, Ho
Chi Minh City
Site area: c. 355,000m2
Expected start: 3Q – 2014
Expected completion: 3Q – 2019

INVESTOR PRESENTATION INVESTOR PRESENTATION INVESTOR PRESENTATION
Understanding the Land Acquisition & Purchase Process
Understanding the development and presale process is a crucial part of appreciating Vingroup’s locked-in revenue streams.
Delivery Presales (1) Land Acquisition
1. Obtaining approval-in-principle
Acquire an “approval-in-principle”
from the local people’s committee
Indicates the approval of a
specific project
2. Investment Registration
Certificate
Can be obtained once “approval-
in-principle” received
After the investment certificate
obtained, a developer may
proceed to:
o Get approval on the land
clearance plan
o Commence the land
clearance process
o Start construction of the project
o Obtain the land use right
certificate for the project
First Stage of Presale
Via Loan Agreements
The Group offers
buyers option to sign
a loan agreement
presale
Loan principal
expected to be
applied to initial
installments due
under a sale and
purchase agreement
(SPA)
Typically loan
amount is 20-40% of
the purchase price
18 months at
~2% interest
Second Stage of
Presale – conversion
to SPA
When foundation
work or first floor area
is complete –
buyer has 15 days to
confirm purchase
On confirmation and
signing of SPA - loan
principal applied to
the deposit and
installments under the
SPA
Delivery of property
upon completion
Buyer has to pay
the remaining ~30%
of contract value
upon delivery
depending on SPA
Revenue can be
recognized by the
Group for sale
of property
Property is delivered
to buyer and removed
from inventory
Stage 1 – Loan
Agreements
Stage 2 – Sale &
Purchase Contract
Stage 3 –
Apportioned
Pre-sales Before
Completion
Third Stage –
Installments
Subsequent
installment
payments made –
depending on SPA
terms
Installment
payments of 10-20%
are made in varying
stages depending on
SPA
1. Vietnamese law requires the completion of either the foundation of a building or its 1st floor area for a sale and purchase agreement to be signed.
Hence all sales prior to this completion are made in Stage 1 by loan agreement, upon completion they are converted to SPAs under Stage 2 9

INVESTOR PRESENTATION INVESTOR PRESENTATION INVESTOR PRESENTATION
B. Business Strategy
10

INVESTOR PRESENTATION INVESTOR PRESENTATION INVESTOR PRESENTATION 11
What Differentiates Vingroup?
These elements provide competitive
advantages for Vingroup
Strong brand equity
attracts premium
tenants & clienteles
Pricing premium for
new projects focused
on the high / middle
class Vietnamese
consumer
Significant growth
potential in hospital,
retail, leisure,
education and
residential sectors
Fully leveraged to ride
expansion of upper /
middle class
Higher % of recurring
revenues over time
Asset sales allow
recycling of capital
into more consumer
driven business
segments
Realize synergies
between Vingroup’s
consumer focused
segments
Able to target different
tiers of high value
consumers through
differentiated
membership
Largest Developer in
Vietnam with Premium
Brand Name
Fully Integrated Real
Estate Owner &
Developer with Exposure
to Key Consumer
Segments
Unique Vingroup
Membership Platform
that Strategically Unites
Target High Value
Consumers
Capital Recycling Model
That has been
Successfully
Demonstrated

INVESTOR PRESENTATION INVESTOR PRESENTATION INVESTOR PRESENTATION 12
Business Strategies Are Reinforcing
Leverage on expertise and experience in identifying and securing
prime sites
Target the mid to high-end markets
Deliver on the need for high-quality retail and residential
space through mixed use developments which increases
its appeal
Develop high-quality resorts and villas
Capture the segment of increasing domestic
household wealth
Attract more international tourists
Develop a substantial portfolio of commercial buildings
(including office, retail and resort properties)
Provides a source of stable, recurring income
Potential for capital gains
Target the growing disposable income of upper and middle
class consumers by delivering on their various needs
Develop internal capabilities to enhance
efficiency and support its portfolio of prime
commercial investment properties
Sales and Leasing
Project management
Property management
Commence large-scale projects near
high-growth areas
Expansion into the upper mid-end segment
Expand addressable market by providing
more affordable units
Stable & Defensive Two pronged approach
Develop properties for sale
Operate properties for stable, recurring
income
Pre-sales reduces the need to raise capital
Focus on High-quality, Large-scale Mixed Use Developments
in Prime Locations and Further Expand into Selected
Strategic Cities
Grow Recurring Revenues Across Consumer Segments
and Enhance Inventory Property Turnover
Further Develop in-house Sales
and Leasing, Project Management
and Property Management
Capabilities Diversify and Enhance Property Income
Stream
1 2
3 4

INVESTOR PRESENTATION INVESTOR PRESENTATION INVESTOR PRESENTATION
C. Key Investment Highlights
13

INVESTOR PRESENTATION INVESTOR PRESENTATION INVESTOR PRESENTATION 14
1 Vietnam’s Largest Listed Real Estate Developer
2 Capital Efficient Real Estate Platform with Track Record of Successful Asset
Disposals
3 One of the Largest Landbank in Prime Locations Across Vietnam
5 Proven Track Record of Access to Capital Markets
6 Highly Experienced Management and Good Corporate Governance
4 Well-recognized Premium Brand Names in Vietnam
Investment Highlights
INVESTOR PRESENTATION INVESTOR PRESENTATION INVESTOR PRESENTATION 15
Vietnam’s Largest Listed Real Estate Developer
1. Source: Bloomberg as of 12 February 2014, CBRE report dated 17 October 2013
2. As of 31 December 2013, Vingroup has 36 projects in Vietnam, of which, Vingroup has controlling interest in 34 projects, except Green City and Tan Cang
3. Attributable site area based on effective interest for projects under construction and future developments
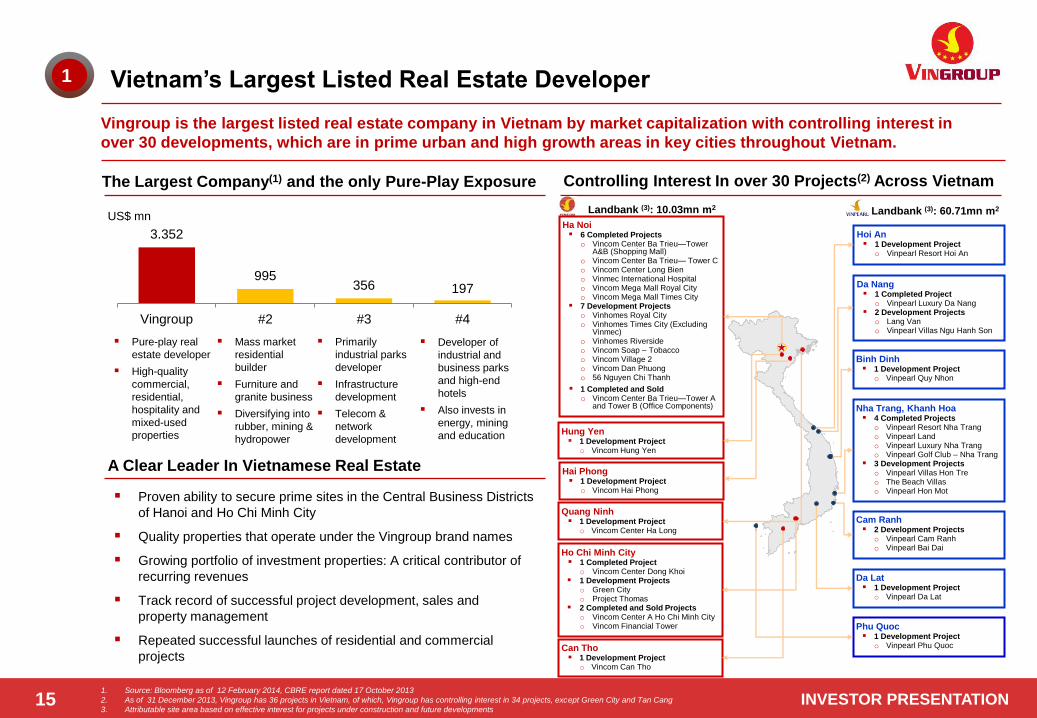
Vingroup is the largest listed real estate company in Vietnam by market capitalization with controlling interest in
over 30 developments, which are in prime urban and high growth areas in key cities throughout Vietnam.
Proven ability to secure prime sites in the Central Business Districts
of Hanoi and Ho Chi Minh City
Quality properties that operate under the Vingroup brand names
Growing portfolio of investment properties: A critical contributor of
recurring revenues
Track record of successful project development, sales and
property management
Repeated successful launches of residential and commercial
projects
1
Controlling Interest In over 30 Projects(2) Across Vietnam The Largest Company(1) and the only Pure-Play Exposure
A Clear Leader In Vietnamese Real Estate
US$ mn
Pure-play real
estate developer
High-quality
commercial,
residential,
hospitality and
mixed-used
properties
Mass market
residential
builder
Furniture and
granite business
Diversifying into
rubber, mining &
hydropower
Primarily
industrial parks
developer
Infrastructure
development
Telecom &
network
development
Developer of
industrial and
business parks
and high-end
hotels
Also invests in
energy, mining
and education
3.352
995 356 197
Vingroup #2 #3 #4
Cam Ranh 2 Development Projects
o Vinpearl Cam Ranh o Vinpearl Bai Dai
Da Nang 1 Completed Project
o Vinpearl Luxury Da Nang 2 Development Projects
o Lang Van o Vinpearl Villas Ngu Hanh Son
Hoi An 1 Development Project
o Vinpearl Resort Hoi An
Nha Trang, Khanh Hoa 4 Completed Projects
o Vinpearl Resort Nha Trang o Vinpearl Land o Vinpearl Luxury Nha Trang o Vinpearl Golf Club – Nha Trang
3 Development Projects o Vinpearl Villas Hon Tre o The Beach Villas o Vinpearl Hon Mot
Da Lat 1 Development Project
o Vinpearl Da Lat
Hai Phong 1 Development Project
o Vincom Hai Phong
Hung Yen 1 Development Project
o Vincom Hung Yen
Ho Chi Minh City 1 Completed Project
o Vincom Center Dong Khoi 1 Development Projects
o Green City o Project Thomas
2 Completed and Sold Projects o Vincom Center A Ho Chi Minh City o Vincom Financial Tower
Ha Noi 6 Completed Projects
o Vincom Center Ba Trieu—Tower A&B (Shopping Mall)
o Vincom Center Ba Trieu— Tower C o Vincom Center Long Bien o Vinmec International Hospital o Vincom Mega Mall Royal City o Vincom Mega Mall Times City
7 Development Projects o Vinhomes Royal City o Vinhomes Times City (Excluding
Vinmec) o Vinhomes Riverside o Vincom Soap – Tobacco o Vincom Village 2 o Vincom Dan Phuong o 56 Nguyen Chi Thanh
1 Completed and Sold o Vincom Center Ba Trieu—Tower A
and Tower B (Office Components)
Landbank (3): 10.03mn m2 Landbank (3): 60.71mn m2
Binh Dinh 1 Development Project
o Vinpearl Quy Nhon
Quang Ninh 1 Development Project
o Vincom Center Ha Long
Can Tho 1 Development Project
o Vincom Can Tho
Phu Quoc 1 Development Project
o Vinpearl Phu Quoc
INVESTOR PRESENTATION INVESTOR PRESENTATION INVESTOR PRESENTATION
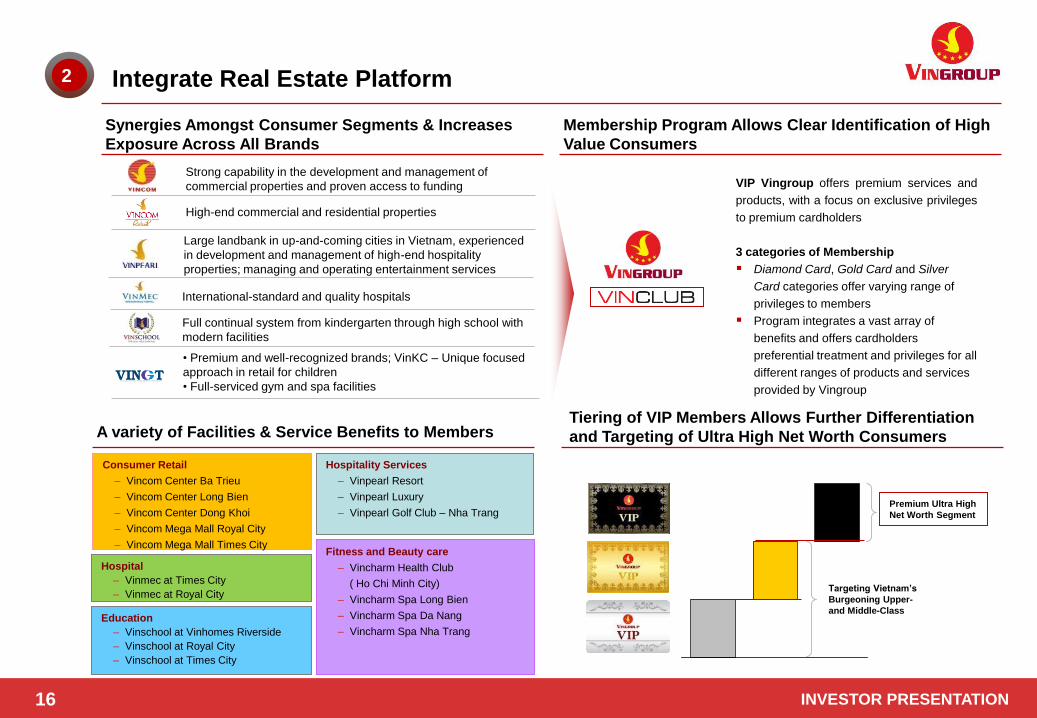
• Premium and well-recognized brands; VinKC – Unique focused
approach in retail for children
• Full-serviced gym and spa facilities
16
Targeting Vietnam’s
Burgeoning Upper-
and Middle-Class
Premium Ultra High
Net Worth Segment
Fitness and Beauty care
– Vincharm Health Club
( Ho Chi Minh City)
– Vincharm Spa Long Bien
– Vincharm Spa Da Nang
– Vincharm Spa Nha Trang
Hospital
– Vinmec at Times City
– Vinmec at Royal City
Hospitality Services
– Vinpearl Resort
– Vinpearl Luxury
– Vinpearl Golf Club – Nha Trang
Consumer Retail
– Vincom Center Ba Trieu
– Vincom Center Long Bien
– Vincom Center Dong Khoi
– Vincom Mega Mall Royal City
– Vincom Mega Mall Times City
Integrate Real Estate Platform
VIP Vingroup offers premium services and
products, with a focus on exclusive privileges
to premium cardholders
3 categories of Membership
Diamond Card, Gold Card and Silver
Card categories offer varying range of
privileges to members
Program integrates a vast array of
benefits and offers cardholders
preferential treatment and privileges for all
different ranges of products and services
provided by Vingroup
2
Synergies Amongst Consumer Segments & Increases
Exposure Across All Brands
Membership Program Allows Clear Identification of High
Value Consumers
A variety of Facilities & Service Benefits to Members Tiering of VIP Members Allows Further Differentiation
and Targeting of Ultra High Net Worth Consumers
Education
– Vinschool at Vinhomes Riverside
– Vinschool at Royal City
– Vinschool at Times City
Strong capability in the development and management of
commercial properties and proven access to funding
Large landbank in up-and-coming cities in Vietnam, experienced
in development and management of high-end hospitality
properties; managing and operating entertainment services
International-standard and quality hospitals
Full continual system from kindergarten through high school with
modern facilities
High-end commercial and residential properties

INVESTOR PRESENTATION INVESTOR PRESENTATION INVESTOR PRESENTATION 17
Capital Efficient Business Model (Cont’)
Demonstrated ability to create onshore liquidity by monetizing assets even in unfavorable conditions
1. By GFA as of 31 December 2013
2. Long-term operating lease with Vicentra, total cash was received as of 31 July 2013
Recycling of capital into consumer growth segments that are more defensible and higher yielding
2
Sale Price US$24.5mn US$51.1mn US$63.5mn US$471.6mn US$237.4mn
Profit %(3) 170% 100% 960% 129% 238%
Holding
period
(years)
2 0 (4) 8 1 3
Area Sold 22,480 m2 31,300 m2 24,059 m2 98,057 m2 77,694 m2
Acquirer
Integrated Development Model
Royal City
Residential GFA
54% (1)
Residential segment
presales used to fund
development of both the
residential and
commercial components
Commercial and
others’ GFA
46% (1)
Recurring
revenue
becomes a
larger
component of
total project
revenues
over time
Recycle Capital through Opportunistic Disposals
Vincom Center
Ba Trieu – Tower
A (office
component)
Vincom
Financial Tower
(office)
Vincom Center
Ba Trieu
–Tower B
(office
component)
Vincom Center A
HCMC
(shopping mall,
hotel)
Vincom Center
Dong Khoi
(office
component)(2)
2006 2010 2012 2013 2013
Retail
properties Hospitality,
Tourism and
Entertainment
Leading Retail Brands
• Fitness & Beauty care
International
Hospital
High quality
education
systems
Residential &
Commercial
3. % profit denotes the profit achieved from the sale, by comparing the sale price
with the construction cost, taking into account depreciation, of the assets
4. Vincom Financial Tower was sold upon construction completion

INVESTOR PRESENTATION INVESTOR PRESENTATION INVESTOR PRESENTATION 1. andbank and GFA as at 31 December 2013
1. Subject to change as projects are in planning phase
(million sqm)
Vincom Projects Vinpearl Projects
(million sqm)
Total GFA: 24,464,965m2 (2)(3)
One of the Largest Landbanks in Prime Locations Across
Vietnam Effective Landbank Breakdown by Construction Status (1) GFA Breakdown by Type (1)(2)
Planned GFA Breakdown by Construction Status (1)(2)
10.03 million sqm 60.71 million sqm
14.00 million sqm 9.38 million sqm
3
Land banking Strategy
70.74 million square metres of effective landbank is
sufficient for the next 10 years of deployment
Seek to acquire land adjacent to existing mixed-use
projects to benefit from economies of scale and increase
the critical mass of existing projects
Only look for land at prime locations in major cities
Proactive in infrastructure development to support
accessibility of own projects
0,05 1,878,02
3,77
21.51
39.2
Completed Underconstruction
Development Completed Underconstruction
Development
Villa
53%
Others
16%
Hospital and school
4%
Hotel
5%
Retail and Office ( 2)
9%
Apartment
13%
0,83
4,13
9,87
0,251,60
7,78
Completed Under construction Development Completed Under construction Development
3. GFA includes completed, under construction and development projects
18

INVESTOR PRESENTATION INVESTOR PRESENTATION INVESTOR PRESENTATION 19
Well-recognized Premium Brand Names in Vietnam
1. n February 2013, Vingroup transferred 100% interest in Vincom Center A Ho Chi Minh City to a real-estate investment company.
As at 31 May 2013, the cash proceeds have been received in full
4
Best Villa Development (Vietnam) for Vinhomes
Riverside
– South East Asia Property Awards 2012
Secured 2 (1) out of the 20 Golden Sites in Vietnam
Vingroup develops its commercial, retail, residential
and mixed-use properties under the Vincom brand
name
Demonstrated ability to sell residential and commercial
real estate even in difficult times in 2010 and 2011
Proven execution skills: Completion of large scale
projects under CBRE’s estimation of construction time
Recognized for quality of service
Successful in identifying and developing premium
hospitality projects
Hosted large national and international events e.g. Miss
Vietnam World 2008, Miss Universe 2010 and Miss
Earth 2010
World-class hospitals
International standard facility equipped with modern
test, diagnostic and operating facilities
Provides modern fitness and spa facilities operated by
professional fitness, beauty care and therapy
specialists to support other Vingroup brands
Best Retail Developer in Vietnam
– Euromoney Real Estate Awards 2012
Best Mixed-use Development (Asia) for Vinhomes
Riverside
– Asia Pacific Property Awards 2013
Best Developer (Vietnam)
– South East Asia Property Awards 2012
Vietnamese Golden Star Award
Strong Brands Across Segments
Numerous Awards from independent media is a
testimony of the Group’s brand name
Educational philosophy behind Vinschool focuses on
the overall development of students from an early
stage in order to develop and shape the future
generations of Vietnam and instill knowledge and
health and life skills
Full continual system from kindergarten through high
school with modern facilities
International Shopping Centre 2013 for Vincom
Center A HCMC
─ Global RLI Awards 2013
Best Condominium Development (Vietnam) for
Royal City
– South East Asia Property Awards 2013
INVESTOR PRESENTATION INVESTOR PRESENTATION INVESTOR PRESENTATION 20
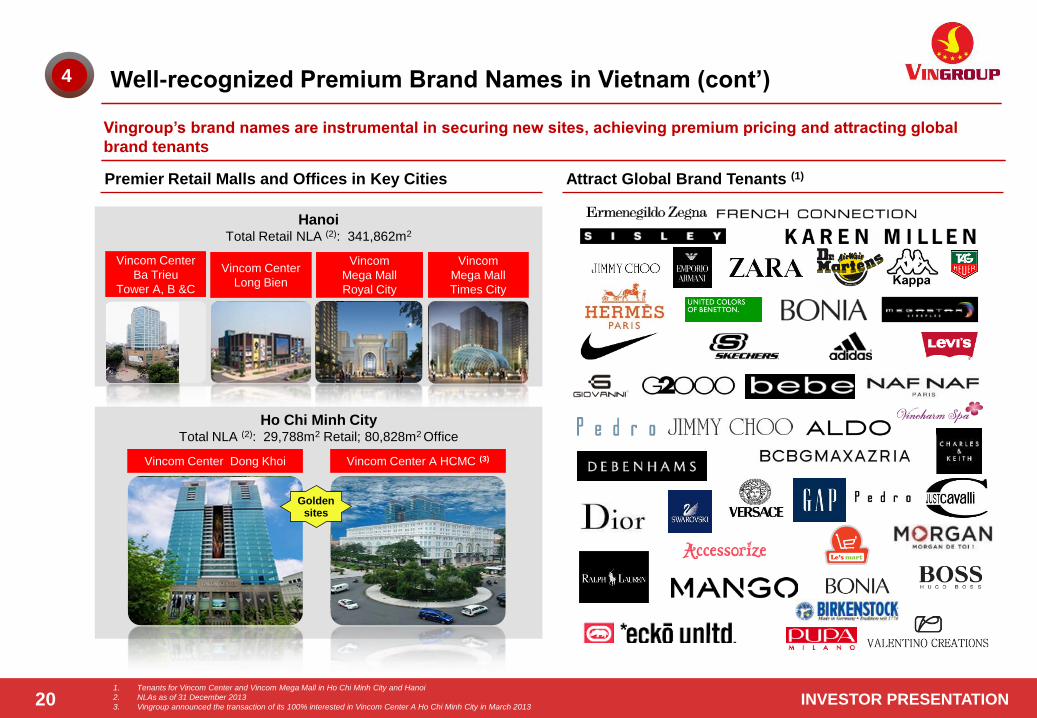
Well-recognized Premium Brand Names in Vietnam (cont’) 4
Vingroup’s brand names are instrumental in securing new sites, achieving premium pricing and attracting global
brand tenants
1. Tenants for Vincom Center and Vincom Mega Mall in Ho Chi Minh City and Hanoi
2. NLAs as of 31 December 2013
3. Vingroup announced the transaction of its 100% interested in Vincom Center A Ho Chi Minh City in March 2013
Premier Retail Malls and Offices in Key Cities Attract Global Brand Tenants (1)
Ho Chi Minh City Total NLA (2): 29,788m2 Retail; 80,828m2 Office
Vincom Center Dong Khoi Vincom Center A HCMC (3)
Golden sites
Hanoi Total Retail NLA (2): 341,862m2
Vincom
Mega Mall
Times City
Vincom Center
Ba Trieu
Tower A, B &C
Vincom Center
Long Bien
Vincom
Mega Mall
Royal City

INVESTOR PRESENTATION INVESTOR PRESENTATION INVESTOR PRESENTATION 21
Track Record in Accessing Capital Markets
Holistic cooperation with local banks, including facilitation
of mortgage financings for customers and transactional
banking services at Vingroup commercial properties
Good relationship with all leading domestic banks with
repeat loan and bond issuance
Cash & short term investments sufficient to cover any
near term debt maturities independent of any new capital
raising
Vingroup has a pioneering track record of success in the international capital markets, having raised more than
US$1 billion since 2009 through 6 major transactions
Strong cash balance maintained to service working
capital and interest payments
Demonstrated ability to create onshore liquidity through
capital recycling of non-core assets
Strong control over capital expenditures allow flexibility
around liquidity management
5
Private Equity
Investment by
into Vincom Retail
May 2013
US$200mn(1)
Best Capital Markets
Deal 2012
Convertible Bonds
Mar & Jul 2012
US$300mn
Best Vietnam Deal 2012
Best Vietnam Deal 2012
Unsecured Loans
January 2013
US$100mn
Convertible Bonds
Nov 2009
US$100mn
Debt and equity-linked
Deal of the year 2010
International
Syndicated Loan
October 2013
US$150mn
RegS/144A
International Senior
Unsecured Notes
October 2013
US$200mn
Best Vietnam Deal 2013 2013 Real-estate Deal of
the Year
Vietnam Capital
Markets Deal 2013
Best Vietnam Deal 2013
Best Vietnam Deal 2013

INVESTOR PRESENTATION INVESTOR PRESENTATION INVESTOR PRESENTATION 22
Experienced Management Team, Good Corporate Governance and
Strong Sponsor
Ms Mai Huong Noi
Board member and Deputy CEO
23 years in industry
8 years with Vingroup
Ms Vu Tuyet Hang
Vice Chairwoman & Deputy CEO
11 years in industry
9 years with Vingroup
Mr. Pham Nhat Vuong
Chairman of the Board of Management Holds a Bachelors Degree in Geological Economic Engineering
Long track record as an entrepreneur both in and out of Vietnam, founded Technocom Limited Company in Ukraine, which was sold to
Nestle S.A. in 2010
Established Vinpearl in 2001 and Vincom in 2002
Major shareholder of Vingroup
Mr Dang Thanh Thuy
Deputy General Director of
Vingroup JSC and General
Director of Vinpearl
18 years in industry
11 years with Vinpearl
Ms Tran Thi Khanh Van
Chief Accountant
23 years in industry
7 years with Vinpearl
Ms Nguyen Thi Huyen Tran
Deputy General Director
18 years with Vinpearl
Professor Do Tat Cuong
Acting CEO
41 years in industry
4 years with Vinmec
Mr Nguyen Manh Duc
Chief Accountant
14 years in industry
3 years with Vinmec
Ms Le Thuy Anh
COO
15 years in industry
3 years with Vinmec
Mr Pham Van Khuong
Deputy General Director
Over 29 years in industry
11 years with Vingroup
Ms Nguyen Dieu Linh
Vice Chairwoman & Deputy CEO
14 years in industry
9 years with Vingroup
6
Ms. Pham Thuy Hang
Vice Chairwoman
Ms. Nguyen Dieu Linh
Vice Chairwoman cum Deputy CEO
Ms. Mai Huong Noi
Vice Chairwoman cum Deputy CEO
Ms. Pham Thu Huong
Vice Chairwoman
Ms. Vu Tuyet Hang
Vice Chairwoman cum Deputy CEO
Mr. Marc Villers Townsend (1)
Independent Member
Mr. Ling Chung Yee Roy (3)
Independent Member
Ms. Le Thi Thu Thuy
Vice Chairwoman
Mr. Le Khac Hiep
Vice Chairman
Mr. Joseph Gagnon (2)
Independent Member
Board of Management
Key Executives
1. Mr. Marc Villers Townsend is the Managing Director of CBRE Vietnam (Ho Chi Minh City)
2. Mr. Joseph Gagnon is a Managing Director from Warburg Pincus
3. Mr. Ling Chung Yee Roy is the Managing Director of RL Capital Management
Ms Duong Thi Mai Hoa
CEO
Over 20 years in industry
Recently joined Vingroup
Ms Le Thi Thu Thuy
Vice Chairwoman
14 years in industry
6 years with Vingroup
INVESTOR PRESENTATION INVESTOR PRESENTATION INVESTOR PRESENTATION
D. Business Overview
23
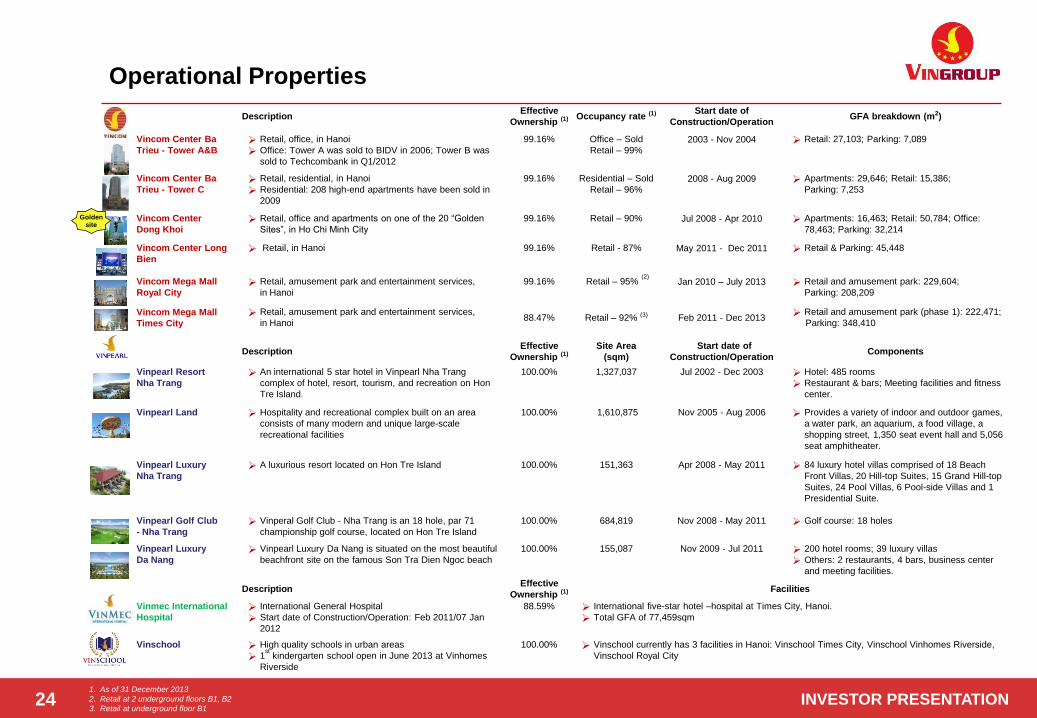
INVESTOR PRESENTATION INVESTOR PRESENTATION INVESTOR PRESENTATION 24
Description Effective
Ownership (1) Occupancy rate (1)
Start date of
Construction/Operation GFA breakdown (m2)
Vincom Center Ba
Trieu - Tower A&B
Retail, office, in Hanoi
Office: Tower A was sold to BIDV in 2006; Tower B was
sold to Techcombank in Q1/2012
99.16% Office – Sold
Retail – 99% 2003 - Nov 2004 Retail: 27,103; Parking: 7,089
Vincom Center Ba
Trieu - Tower C Retail, residential, in Hanoi
Residential: 208 high-end apartments have been sold in
2009
99.16% Residential – Sold
Retail – 96% 2008 - Aug 2009 Apartments: 29,646; Retail: 15,386;
Parking: 7,253
Vincom Center
Dong Khoi Retail, office and apartments on one of the 20 “Golden
Sites”, in Ho Chi Minh City
99.16% Retail – 90% Jul 2008 - Apr 2010 Apartments: 16,463; Retail: 50,784; Office:
78,463; Parking: 32,214
Vincom Center Long
Bien
Vincom Mega Mall
Royal City
Retail, in Hanoi
Retail, amusement park and entertainment services,
in Hanoi
99.16%
99.16%
Retail - 87%
Retail – 95% (2)
May 2011 - Dec 2011
Jan 2010 – July 2013
Retail & Parking: 45,448
Retail and amusement park: 229,604;
Parking: 208,209
Vincom Mega Mall
Times City Retail, amusement park and entertainment services,
in Hanoi 88.47% Retail – 92% (3) Feb 2011 - Dec 2013 Retail and amusement park (phase 1): 222,471;
Parking: 348,410
Description Effective
Ownership (1)
Site Area
(sqm)
Start date of
Construction/Operation Components
Vinpearl Resort
Nha Trang An international 5 star hotel in Vinpearl Nha Trang
complex of hotel, resort, tourism, and recreation on Hon
Tre Island.
100.00% 1,327,037 Jul 2002 - Dec 2003 Hotel: 485 rooms
Restaurant & bars; Meeting facilities and fitness
center.
Vinpearl Land Hospitality and recreational complex built on an area
consists of many modern and unique large-scale
recreational facilities
100.00% 1,610,875 Nov 2005 - Aug 2006 Provides a variety of indoor and outdoor games,
a water park, an aquarium, a food village, a
shopping street, 1,350 seat event hall and 5,056
seat amphitheater.
Vinpearl Luxury
Nha Trang A luxurious resort located on Hon Tre Island 100.00% 151,363 Apr 2008 - May 2011 84 luxury hotel villas comprised of 18 Beach
Front Villas, 20 Hill-top Suites, 15 Grand Hill-top
Suites, 24 Pool Villas, 6 Pool-side Villas and 1
Presidential Suite.
Vinpearl Golf Club
- Nha Trang Vinperal Golf Club - Nha Trang is an 18 hole, par 71
championship golf course, located on Hon Tre Island
100.00% 684,819 Nov 2008 - May 2011 Golf course: 18 holes
Vinpearl Luxury
Da Nang Vinpearl Luxury Da Nang is situated on the most beautiful
beachfront site on the famous Son Tra Dien Ngoc beach
100.00% 155,087 Nov 2009 - Jul 2011 200 hotel rooms; 39 luxury villas
Others: 2 restaurants, 4 bars, business center
and meeting facilities.
Description Effective
Ownership (1) Facilities
Vinmec International
Hospital International General Hospital
Start date of Construction/Operation: Feb 2011/07 Jan
2012
88.59% International five-star hotel –hospital at Times City, Hanoi.
Total GFA of 77,459sqm
Vinschool High quality schools in urban areas
1st kindergarten school open in June 2013 at Vinhomes
Riverside
100.00% Vinschool currently has 3 facilities in Hanoi: Vinschool Times City, Vinschool Vinhomes Riverside,
Vinschool Royal City
Operational Properties
1. As of 31 December 2013
2. Retail at 2 underground floors B1, B2
3. Retail at underground floor B1
Golden site

INVESTOR PRESENTATION INVESTOR PRESENTATION INVESTOR PRESENTATION
E. Financial Overview – VAS
25

INVESTOR PRESENTATION INVESTOR PRESENTATION INVESTOR PRESENTATION 26
(VNDbn)
As of 31 December 2013, Vingroup has VND13,047 billion cash and cash equivalents and short term investment which
is adequate to cover the near term debt maturities.
Source: VAS Consolidated FS for 9M 2013
Debt Maturity
Source: VAS Consolidated Financial Statement for 2013
1. There is a high possibility that bonds are converted to equity. Yield to maturity is 1.4% to 1.14%, lower than 5.5% coupon at time of issuance
2,250
6,050 6,217
6,246
369
527
4,231
982
107
35
Less Than 1 Year 1-3 Years 3-5 Years More Than 5 Years
Corporate Bonds Convertible Bonds Convertible loan Long-Term Borrowings Short Term Borrowings
3,023
10,808
13,445
107

INVESTOR PRESENTATION INVESTOR PRESENTATION INVESTOR PRESENTATION 27
Debt Mix Analysis
Total: VND27,276 Bn (US$1.29Bn)
Diversified Funding Sources (1)
Notes: Based on an exchange rate of US$1=VND21,135
1. As of 31 December 2013
Debt Breakdown (1)
By Currency
By Interest Rate
Bank Loans 20,8%
Domestic Bonds 37,6%
Convertible Bonds 22,8%
International Bonds 15,4%
Others 3,4%
VND 47% USD
53%
Float 59%
Fixed 42%
INVESTOR PRESENTATION INVESTOR PRESENTATION INVESTOR PRESENTATION
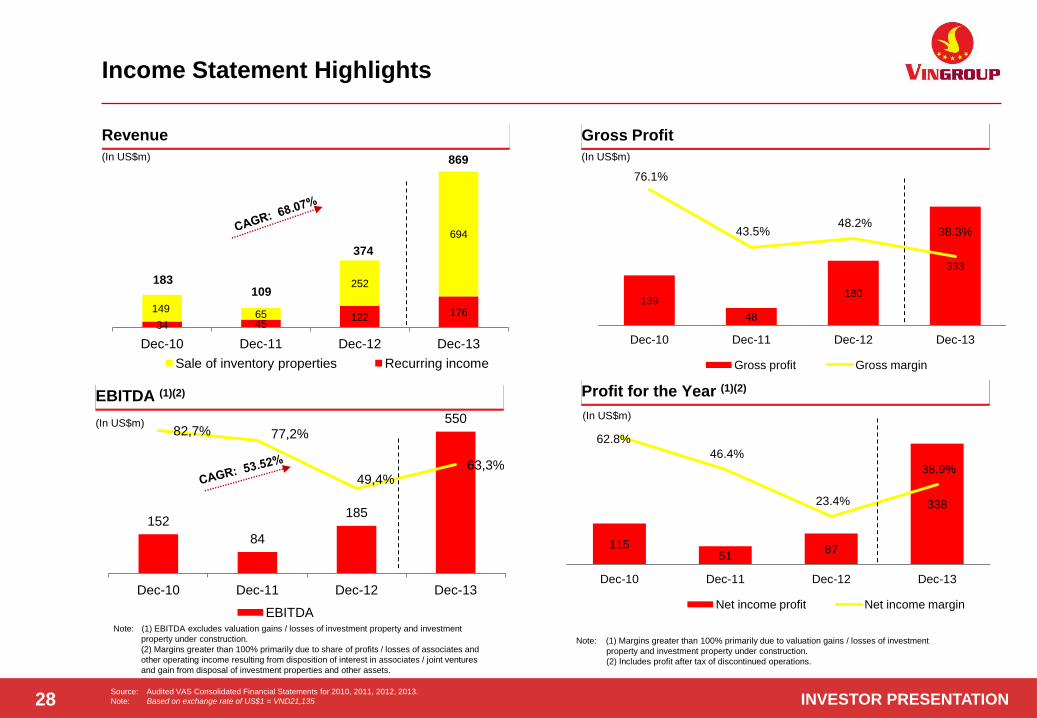
152
84
185
550 82,7% 77,2%
49,4% 63,3%
Dec-10 Dec-11 Dec-12 Dec-13
EBITDA
34 45 122 176 149
65
252
694
Dec-10 Dec-11 Dec-12 Dec-13
Sale of inventory properties Recurring income
(In US$m)
Note: (1) EBITDA excludes valuation gains / losses of investment property and investment
property under construction.
(2) Margins greater than 100% primarily due to share of profits / losses of associates and
other operating income resulting from disposition of interest in associates / joint ventures
and gain from disposal of investment properties and other assets.
(In US$m)
Note: (1) Margins greater than 100% primarily due to valuation gains / losses of investment
property and investment property under construction.
(2) Includes profit after tax of discontinued operations.
(In US$m) (In US$m)
Source: Audited VAS Consolidated Financial Statements for 2010, 2011, 2012, 2013.
Note: Based on exchange rate of US$1 = VND21,135 28
Income Statement Highlights
Revenue
EBITDA (1)(2)
Gross Profit
Profit for the Year (1)(2)
869
139
48
180
333
76.1%
43.5% 48.2%
38.3%
Dec-10 Dec-11 Dec-12 Dec-13
Gross profit Gross margin
374
109 183
115 51
87
338
62.8%
46.4%
23.4%
38.9%
–
10,0%
20,0%
30,0%
40,0%
50,0%
60,0%
70,0%
Dec-10 Dec-11 Dec-12 Dec-13
Net income profit Net income margin

INVESTOR PRESENTATION INVESTOR PRESENTATION INVESTOR PRESENTATION
NA NA
7
13
2010 2011 2012 2013
NA NA
57
76
2010 2011 2012 2013
148
65
252
694
2010 2011 2012 2013
34
45
59
85
2010 2011 2012 2013
183
109
374
869
2010 2011 2012 2013
(In US$m)
Total Revenue
(In US$m)
((In US$m)
(In US$m)
(In US$m)
Rental Sale of Inventory Properties
Hospitality and Beauty Care Hospital
Source: Audited VAS Consolidated Financial Statements for 2010, 2011, 2012, 2013
Notes: Based on exchange rate of US$1 = VND21,135 29
Revenue Performance
INVESTOR PRESENTATION INVESTOR PRESENTATION INVESTOR PRESENTATION
(In US$m)
(In US$m)
(In US$m)
30
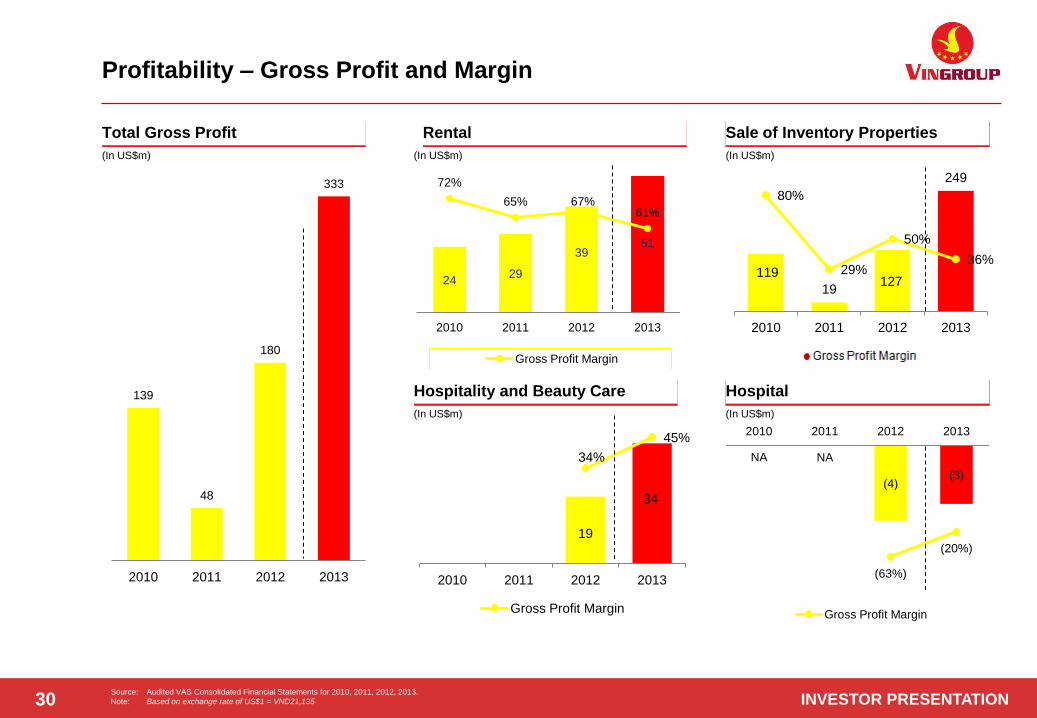
Profitability – Gross Profit and Margin
Total Gross Profit Rental Sale of Inventory Properties
Source: Audited VAS Consolidated Financial Statements for 2010, 2011, 2012, 2013.
Note: Based on exchange rate of US$1 = VND21,135
Hospitality and Beauty Care Hospital
(In US$m) (In US$m)
139
48
180
333
2010 2011 2012 2013
24 29
39 51
72%
65% 67% 61%
2010 2011 2012 2013
Gross Profit Margin
NA NA
(4) (3)
(63%)
(20%)
2010 2011 2012 2013
Gross Profit Margin
19
34
34%
45%
0 0,05 0,1 0,15 0,2 0,25 0,3 0,35 0,4 0,45 0,5
0
5
10
15
20
25
30
35
40
2010 2011 2012 2013
Gross Profit Margin
119
19 127
249
80%
29%
50%
36%
0%
20%
40%
60%
80%
100%
-
50
100
150
200
250
300
2010 2011 2012 2013
INVESTOR PRESENTATION INVESTOR PRESENTATION INVESTOR PRESENTATION
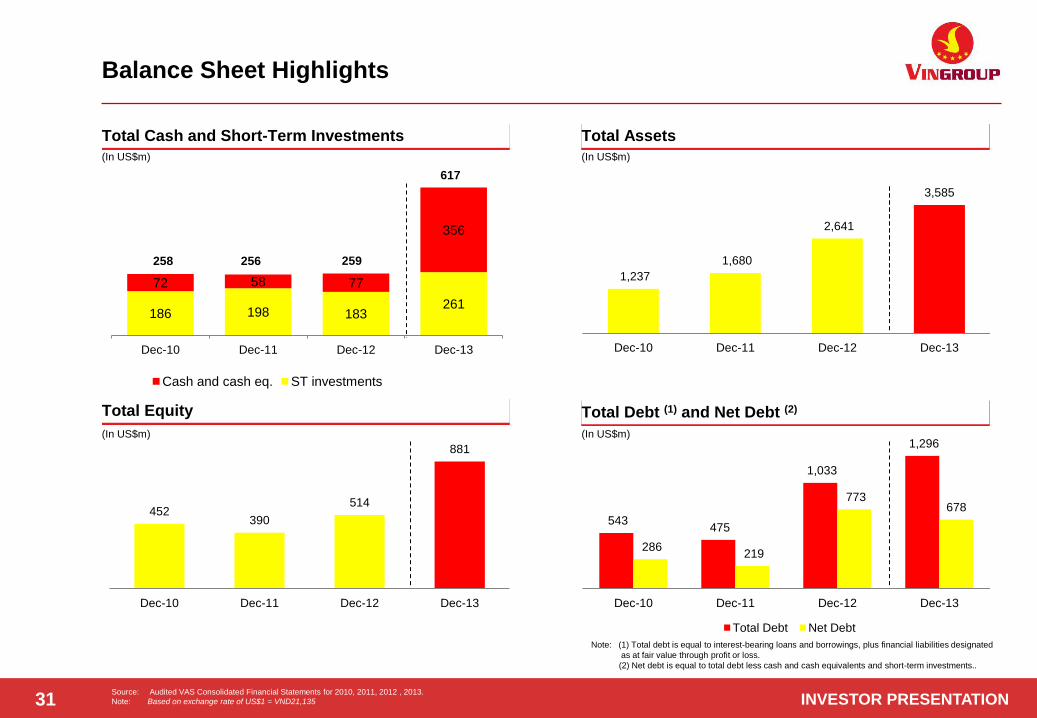
186 198 183 261
72 58 77
356
Dec-10 Dec-11 Dec-12 Dec-13
Cash and cash eq. ST investments
258
(In US$m) (In US$m)
Note: (1) Total debt is equal to interest-bearing loans and borrowings, plus financial liabilities designated
as at fair value through profit or loss.
(2) Net debt is equal to total debt less cash and cash equivalents and short-term investments..
(In US$m) (In US$m)
31 Source: Audited VAS Consolidated Financial Statements for 2010, 2011, 2012 , 2013.
Note: Based on exchange rate of US$1 = VND21,135
Balance Sheet Highlights
Total Cash and Short-Term Investments
Total Equity
Total Assets
Total Debt (1) and Net Debt (2)
617
259 256
1,237
1,680
2,641
3,585
Dec-10 Dec-11 Dec-12 Dec-13
452 390
514
881
Dec-10 Dec-11 Dec-12 Dec-13
543 475
1,033
1,296
286 219
773 678
Dec-10 Dec-11 Dec-12 Dec-13
Total Debt Net Debt

INVESTOR PRESENTATION INVESTOR PRESENTATION INVESTOR PRESENTATION
Recurring Income / Interest Expense (1)
Debt (1) / EBITDA
EBITDA / Interest Expense (1)
Total Debt (1) / Total Capitalization (2)
Note: (1) Interest expense includes capitalized interest.
Note: (1) Total debt is equal to interest-bearing loans and borrowings, plus financial liabilities
designated as at fair value through profit or loss. Net debt is equal to total debt less cash
and cash equivalents and short-term investments.
Note: (1) Total debt is equal to interest-bearing loans and borrowings, plus financial liabilities
designated as at fair value through profit or loss.
(2) Total capitalization is equal to total debt plus total book value of equity.
32 Source: Audited VAS Consolidated Financial Statements for 2010, 2011, 2012, 2013.
Note: Based on exchange rate of US$1 = VND21,135
Note: (1) Interest expense includes capitalized interest.
Key Credit Metrics
(x) (x)
(x) (x)
0.57x 0.54
1.04x
1.26x
Dec-10 Dec-11 Dec-12 Dec-13
2.53x
1.04x
1.58x
3.93x
Dec-10 Dec-11 Dec-12 Dec-13
3.6x
5.6x 5.6x
2.4x 1.9x
2.6x
4.2x
1.2x
Dec-10 Dec-11 Dec-12 Dec-13
Debt / EBITDA Net Debt / EBITDA
0.55x 0.55x
0.67x 0.59x
Dec-10 Dec-11 Dec-12 Dec-13
INVESTOR PRESENTATION INVESTOR PRESENTATION INVESTOR PRESENTATION
F. Financial Overview - IFRS
33

INVESTOR PRESENTATION INVESTOR PRESENTATION INVESTOR PRESENTATION 34
(US$mn)
As of 31 December 2013, Vingroup has USD 616 million cash and cash equivalents and short term investment which is
adequate to cover the near term debt maturities.
Source: VAS Consolidated FS for 9M 2013
Debt Maturity
Source: IFRS Consolidated Financial Statement for 2013
1. There is a high possibility that bonds are converted to equity. Yield to maturity is 1.4% to 1.14%, lower than 5.5% coupon at time of issuance
106
283 284
222
17
25
17
193
46
5
Less than 1 year 1-3 years 3-5 years More than 5 years
Corporate bonds Convertible bond Convertible loan Long-term borrowings Short-term debts
5
141
501
552

INVESTOR PRESENTATION INVESTOR PRESENTATION INVESTOR PRESENTATION
176 117
232
604
97.0% 105.7%
75.5% 69.5%
Dec-10 Dec-11 Dec-12 Dec-13
EBITDA EBITDA margin
34 45 122 176 148 65
185
694
Dec-10 Dec-11 Dec-12 Dec-13
Recurring income Sales of Inventory Properties
182 110
307
869
(In US$m)
Note: (1) EBITDA excludes valuation gains / losses of investment property and investment
property under construction.
(2) Margins greater than 100% primarily due to share of profits / losses of associates and
other operating income resulting from disposition of interest in associates / joint ventures
and gain from disposal of investment properties and other assets.
(In US$m)
Note: (1) Margins greater than 100% primarily due to valuation gains / losses of investment
property and investment property under construction.
(2) Includes profit after tax of discontinued operations.
(In US$m) (In US$m)
Source: IFRS Consolidated Financial Statements for 2010, 2011, 2012, 2013.
Note: Based on exchange rate of US$1 = VND21,135 35
Income Statement Highlights
Revenue
EBITDA (1)(2)
Gross Profit
Profit for the Year (1)(2)
73.1%
48.6% 41.6% 39.5%
Dec-10 Dec-11 Dec-12 Dec-13
Gross profit Gross margin
133
54
128
343
260
137 149
289
142.8%
123.9%
48.4% 33.3%
Dec-10 Dec-11 Dec-12 Dec-13
Net income profit Net income margin

INVESTOR PRESENTATION INVESTOR PRESENTATION INVESTOR PRESENTATION
182
110
307
869
2010 2011 2012 2013
NA NA
7
14
2010 2011 2012 2013
NA NA
57
76
2010 2011 2012 2013
148
65
252
694
2010 2011 2012 2013
34
45
59
85
2010 2011 2012 2013
(In US$m)
Total Revenue
(In US$m)
((In US$m)
(In US$m)
(In US$m)
Rental Sale of Inventory Properties
Hospitality and Beauty Care Hospital
Source: IFRS Consolidated Financial Statements for 2010, 2011, 2012, 2013
Notes: Based on exchange rate of US$1 = VND21,135
Revenue Performance
36

INVESTOR PRESENTATION INVESTOR PRESENTATION INVESTOR PRESENTATION
(In US$m)
(In US$m)
(In US$m)
37
Profitability – Gross Profit and Margin
Total Gross Profit Rental Sale of Inventory Properties
Source: IFRS Consolidated Financial Statements for 2010, 2011, 2012, 2013.
Note: Based on exchange rate of US$1 = VND21,135
Hospitality and Beauty Care Hospital
(In US$m) (In US$m)
NA NA
(4) (3)
(63%)
(21%)
2010 2011 2012 2013
Gross Profit Margin
133
54
128
343
2010 2011 2012 2013
27 35
46 63
79% 77% 79% 74%
2010 2011 2012 2013
Gross Profit Margin
19
35
34%
46%
2010 2011 2012 2013
Gross Profit Margin
106
19
67
249 72%
29%
36% 36%
-
50
100
150
200
250
300
2010 2011 2012 2013

INVESTOR PRESENTATION INVESTOR PRESENTATION INVESTOR PRESENTATION
(In US$m) (In US$m)
Note: (1) Total debt is equal to interest-bearing loans and borrowings, plus financial liabilities designated
as at fair value through profit or loss.
(2) Net debt is equal to total debt less cash and cash equivalents and short-term investments..
(In US$m) (In US$m)
38 Source: IFRS Consolidated Financial Statements for 2010, 2011, 2012 , 2013.
Note: Based on exchange rate of US$1 = VND21,135
Balance Sheet Highlights
Total Cash and Short-Term Investments
Total Equity
Total Assets
Total Debt (1) and Net Debt (2)
139 156 181 260
71 58 77
356
Dec-10 Dec-11 Dec-12 Dec-13
Cash and cash eq. ST investments
210 214 258
616
1,720
2,454
3,325
4,056
Dec-10 Dec-11 Dec-12 Dec-13
792 790 771
1,103
Dec-10 Dec-11 Dec-12 Dec-13
556 472
1,005
1,268
346 258
747 652
Dec-10 Dec-11 Dec-12 Dec-13
Total Debt Net Debt
INVESTOR PRESENTATION INVESTOR PRESENTATION INVESTOR PRESENTATION
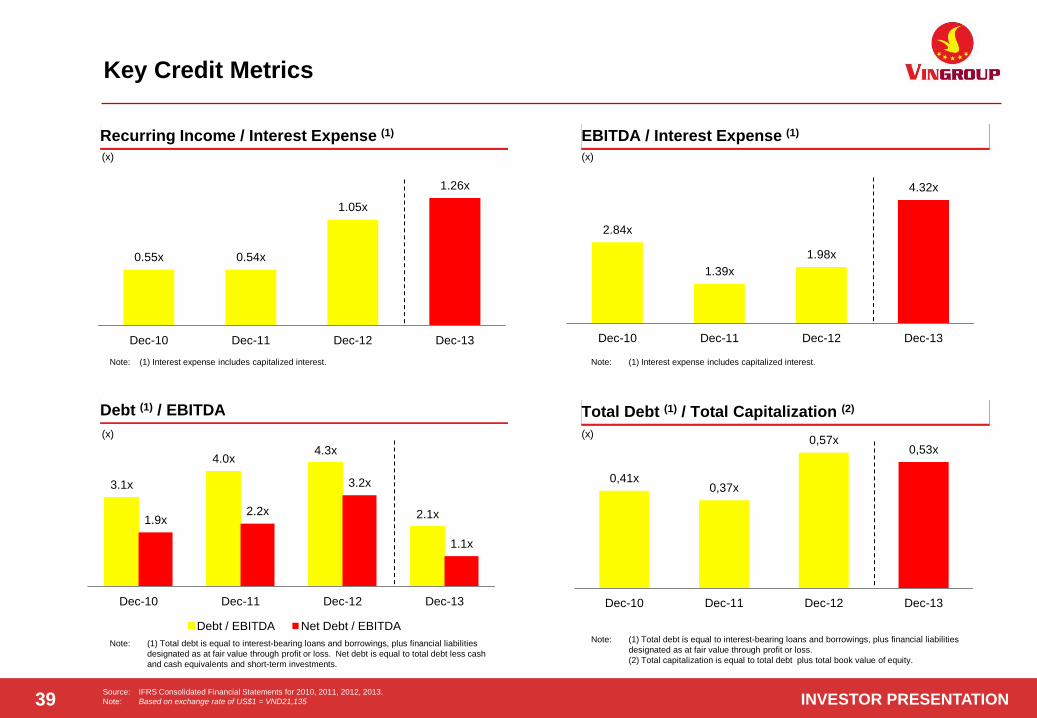
Recurring Income / Interest Expense (1)
Debt (1) / EBITDA
EBITDA / Interest Expense (1)
Total Debt (1) / Total Capitalization (2)
Note: (1) Interest expense includes capitalized interest.
Note: (1) Total debt is equal to interest-bearing loans and borrowings, plus financial liabilities
designated as at fair value through profit or loss. Net debt is equal to total debt less cash
and cash equivalents and short-term investments.
Note: (1) Total debt is equal to interest-bearing loans and borrowings, plus financial liabilities
designated as at fair value through profit or loss.
(2) Total capitalization is equal to total debt plus total book value of equity.
39 Source: IFRS Consolidated Financial Statements for 2010, 2011, 2012, 2013.
Note: Based on exchange rate of US$1 = VND21,135
Note: (1) Interest expense includes capitalized interest.
Key Credit Metrics
(x) (x)
(x) (x)
0.55x 0.54x
1.05x
1.26x
Dec-10 Dec-11 Dec-12 Dec-13
2.84x
1.39x
1.98x
4.32x
Dec-10 Dec-11 Dec-12 Dec-13
3.1x
4.0x 4.3x
2.1x 1.9x
2.2x
3.2x
1.1x
Dec-10 Dec-11 Dec-12 Dec-13
Debt / EBITDA Net Debt / EBITDA
0,41x 0,37x
0,57x 0,53x
Dec-10 Dec-11 Dec-12 Dec-13

INVESTOR PRESENTATION INVESTOR PRESENTATION INVESTOR PRESENTATION
G. Appendix – Vincom Retail
40
RATINGS UPDATE PRESENTATION 41
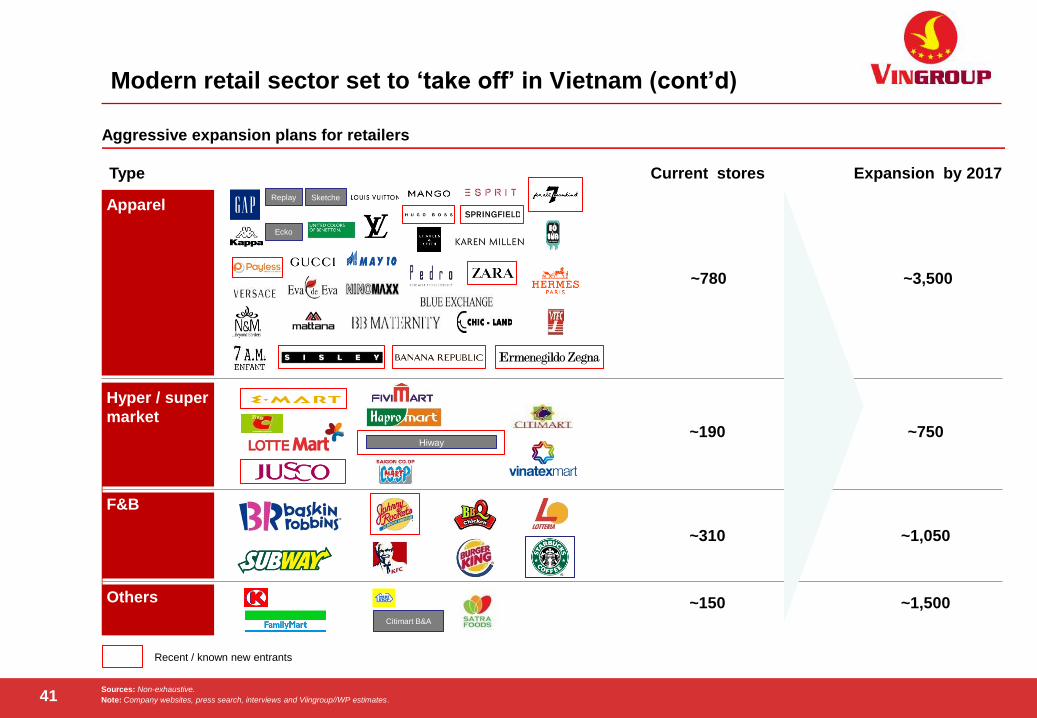
Modern retail sector set to ‘take off’ in Vietnam (cont’d)
Sources: Non-exhaustive.
Note: Company websites, press search, interviews and Viingroup//WP estimates.
Aggressive expansion plans for retailers
Type
F&B
Expansion by 2017
Replay Sketche
Ecko
Citimart B&A
~3,500
~750
~1,050
~1,500
Hiway
~780
~190
~310
~150
Current stores
Others
Apparel
Hyper / super
market
Recent / known new entrants
RATINGS UPDATE PRESENTATION 42
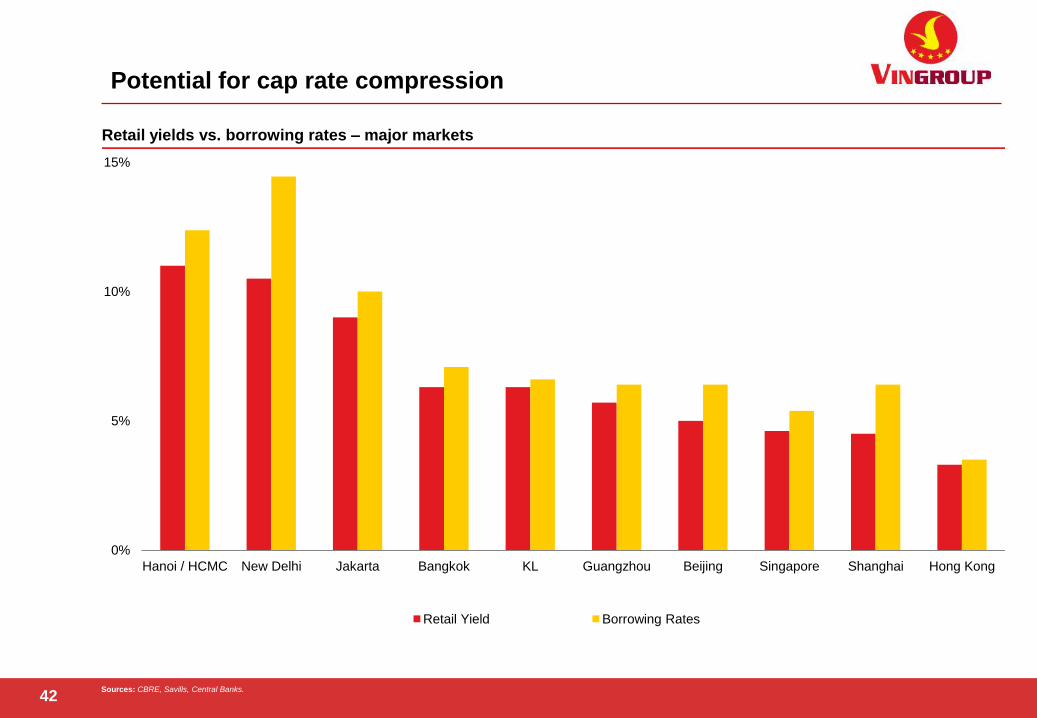
Potential for cap rate compression
Sources: CBRE, Savills, Central Banks.
Retail yields vs. borrowing rates – major markets
0%
5%
10%
15%
Hanoi / HCMC New Delhi Jakarta Bangkok KL Guangzhou Beijing Singapore Shanghai Hong Kong
Retail Yield Borrowing Rates
INVESTOR PRESENTATION INVESTOR PRESENTATION INVESTOR PRESENTATION 43
This presentation may contain forward-looking statements that involve risks and uncertainties. Actual future performance,
outcomes, and results may differ materially from those expressed in forward-looking statements as a result of a number of
risks, uncertainties and assumptions. Representative examples of these factors include (without limitation) general industry
and economic conditions, interest rate trends, cost of capital and capital availability, cost of construction, availability of real
estate properties and land, competition from other companies and venues for the sale/distribution of goods and services, shifts
in customer demands, customers and partners, changes in operation expenses, including employee wages, benefits and
training, governmental and public policy changes and the continued availability of financing in the amounts and the terms
necessary to support future business. You are cautioned not to place undue reliance on these forward-looking statements,
which are based on current view of management on future events.
Disclaimer
INVESTOR PRESENTATION INVESTOR PRESENTATION INVESTOR PRESENTATION
Vingroup JSC
Vingroup Office Tower, Vinhomes Riverside Eco-Urban Area
Long Bien District, Hanoi, Vietnam
Tel: +84 (4) 3974 9999 ext. 926
Fax: +84 (4) 3974 8888
Website: http://www.vingroup.net
E-mail: [email protected]
Investor Relations Department
Copyright © 2022 FDOKUMEN