Investor Presentation - Healthpeak
19
Investor Presentation Healthpeak Properties March 2022 Vantage Phase I (Rendering) South San Francisco, CA
-
Upload
khangminh22 -
Category
Documents
-
view
2 -
download
0
Transcript of Investor Presentation - Healthpeak

InvestorPresentation
Healthpeak Properties
March 2022
Vantage Phase I (Rendering)South San Francisco, CAVantage Phase I (Rendering)
South San Francisco, CA

DisclaimersThis Healthpeak Properties, Inc. (the “Company”) presentation is solely for your information,is subject to change and speaks only as of the date hereof. This presentation is not completeand is only a summary of the more detailed information included elsewhere, including in ourSecurities and Exchange Commission (“SEC”) filings. No representation or warranty,expressed or implied is made and you should not place undue reliance on the accuracy,fairness or completeness of the information presented.
Forward-Looking StatementsStatements contained in this presentation that are not historical facts are "forward-lookingstatements" within the meaning of Section 27A of the Securities Act of 1933, as amended,and Section 21E of the Securities Exchange Act of 1934, as amended. Forward-lookingstatements include, among other things, statements regarding our and our officers’ intent,belief or expectation as identified by the use of words such as “may,” “will,” “project,”“expect,” “believe,” “intend,” “anticipate,” “seek,” “target,” “forecast,” “plan,” “potential,”“estimate,” “could,” “would,” “should” and other comparable and derivative terms or thenegatives thereof.
Examples of forward-looking statements include, among other things, (i) statementsregarding timing, outcomes and other details relating to current, pending or contemplatedacquisitions, dispositions, transitions, developments, redevelopments, densifications, jointventure transactions, leasing activity and commitments, capital recycling plans, financingactivities, or other transactions; (ii) development, densification and land bank opportunities;(iii) outlooks related to life science, medical office and CCRCs; and (iv) potential capitalsources and uses. You should not place undue reliance on these forward-lookingstatements. Pending acquisitions, dispositions and leasing activity, including those that aresubject to binding agreements, remain subject to closing conditions and may not close withinthe anticipated timeframes or at all. Forward-looking statements reflect our currentexpectations and views about future events and are subject to risks and uncertainties thatcould significantly affect our future financial condition and results of operations. Whileforward-looking statements reflect our good faith belief and assumptions we believe to bereasonable based upon current information, we can give no assurance that our expectationsor forecasts will be attained. Further, we cannot guarantee the accuracy of any suchforward-looking statement contained in this presentation, and such forward-lookingstatements are subject to known and unknown risks and uncertainties that are difficult topredict. These risks and uncertainties include, but are not limited to: the Covid pandemic andhealth and safety measures intended to reduce its spread, the availability, effectiveness andpublic usage and acceptance of vaccines, and how quickly and to what extent normaleconomic and operating conditions can resume within the markets in which we operate; theability of our existing and future tenants, operators and borrowers to conduct their respectivebusinesses in a manner sufficient to maintain or increase their revenues and manage theirexpenses in order to generate sufficient income to make rent and loan payments to us andour ability to recover investments made, if applicable, in their operations; increasedcompetition, operating costs and market changes affecting our tenants, operators andborrowers; the financial condition of our tenants, operators and borrowers, including potentialbankruptcies and downturns in their businesses, and their legal and regulatory proceedings;our concentration of real estate investments in the healthcare property sector, which makesus more vulnerable to a downturn in a specific sector than if we invested in multipleindustries and exposes us to the risks inherent in illiquid investments; our ability to identifyand secure replacement tenants and operators and the potential renovation costs and
regulatory approvals associated therewith; our property development, redevelopment andtenant improvement activity risks, including project abandonments, project delays and lowerprofits than expected; changes within the life science industry; high levels of regulation,funding requirements, expense and uncertainty faced by our life science tenants; the abilityof the hospitals on whose campuses our medical office buildings (“MOBs”) are located andtheir affiliated healthcare systems to remain competitive or financially viable; our ability tomaintain or expand our hospital and health system client relationships; operational risksassociated with third party management contracts, including the additional regulation andliabilities of our RIDEA lease structures; economic and other conditions that negatively affectgeographic areas from which we recognize a greater percentage of our revenue; uninsuredor underinsured losses, which could result in significant losses and/or performance declinesby us or our tenants and operators; our investments in joint ventures and unconsolidatedentities, including our lack of sole decision making authority and our reliance on our partners’financial condition and continued cooperation; our use of fixed rent escalators, contingentrent provisions and/or rent escalators based on the Consumer Price Index; competition forsuitable healthcare properties to grow our investment portfolio; our ability to foreclose oncollateral securing our real estate-related loans; our ability to make material acquisitions andsuccessfully integrate them; the potential impact on us and our tenants, operators andborrowers from litigation matters, including rising liability and insurance costs; an increase inour borrowing costs, including due to higher interest rates; the availability of external capitalon acceptable terms or at all, including due to rising interest rates, changes in our creditratings and the value of our common stock, volatility or uncertainty in the capital markets,and other factors; cash available for distribution to stockholders and our ability to makedividend distributions at expected levels; our ability to manage our indebtedness level andcovenants in and changes to the terms of such indebtedness; changes in global, nationaland local economic and other conditions; laws or regulations prohibiting eviction of ourtenants; the failure of our tenants, operators and borrowers to comply with federal, state andlocal laws and regulations, including resident health and safety requirements, as well aslicensure, certification and inspection requirements; required regulatory approvals to transferour senior housing properties; compliance with the Americans with Disabilities Act and fire,safety and other regulations; the requirements of, or changes to, governmentalreimbursement programs such as Medicare or Medicaid; legislation to address federalgovernment operations and administration decisions affecting the Centers for Medicare andMedicaid Services; our participation in the CARES Act Provider Relief Fund and other Covid-related stimulus and relief programs; provisions of Maryland law and our charter that couldprevent a transaction that may otherwise be in the interest of our stockholders;environmental compliance costs and liabilities associated with our real estate investments;our ability to maintain our qualification as a real estate investment trust (“REIT”); changes toU.S. federal income tax laws, and potential deferred and contingent tax liabilities fromcorporate acquisitions; calculating non-REIT tax earnings and profits distributions; ownershiplimits in our charter that restrict ownership in our stock; the loss or limited availability of ourkey personnel; our reliance on information technology systems and the potential impact ofsystem failures, disruptions or breaches; and other risks and uncertainties described fromtime to time in our SEC filings. Except as required by law, we do not undertake, and herebydisclaim, any obligation to update any forward-looking statements, which speak only as ofthe date on which they are made.
CalculationsThe estimated yields included in this presentation are calculated by dividing projected cash
net operating income (adjusting for the impact of upfront rental concessions) for theapplicable properties by the aggregate purchase price or expected development costs, asapplicable, for such properties. Newly acquired operating assets are generally consideredstabilized at the earlier of lease up (typically when the tenant(s) control(s) the physical use ofat least 80 of the space) or 12 months from the acquisition date. Newly completeddevelopments are considered stabilized at the earlier of lease up or 24 months from the datethe property is placed in service. Actual stabilized yields are calculated by dividing actualcash net operating income (adjusting for the impact of upfront rental concessions) by theaggregate purchase price or development costs, as applicable, for such properties.
The cash net operating income projections used in calculating the estimated yields includedin this presentation are based on (i) information currently available to us, including, inconnection with acquisitions, information made available to us by the seller in the diligenceprocess, and (ii) certain assumptions applied by us related to anticipated occupancy, rentalrates, property taxes and other expenses over a specified period of time in the future basedon historical data and the Company’s knowledge of and experience with the submarket.Accordingly, the estimated yields included in this presentation are inherently based oninexact projections that may be incorrect or imprecise and may change as a result of eventsor factors currently unknown to the Company. The actual yields for these properties maydiffer materially and adversely from the estimated yields discussed in this presentation basedon numerous factors, including any difficulties achieving assumed occupancy and/or rentalrates, development delays, unanticipated expenses not payable by a tenant, increases in theCompany’s financing costs, tenant defaults, the results of final purchase price allocations, aswell as the risk factors set forth in the Company’s Annual Report on Form 10-K for the yearended December 31, 2021 and its subsequent filings with the SEC. As such, we can provideno assurance that the yields for these properties will be consistent with the estimated yieldsset forth in this presentation.
Market and Industry DataThis presentation also includes market and industry data that the Company has obtainedfrom market research, publicly available information and industry publications. The accuracyand completeness of such information are not guaranteed. Such data is often based onindustry surveys and preparers’ experience in the industry. Similarly, although Healthpeakbelieves that the surveys and market research that others have performed are reliable, suchsurveys and market research are subject to assumptions, estimates and other uncertaintiesand Healthpeak has not independently verified this information.
Non-GAAP Financial MeasuresThis presentation contains certain supplemental non-GAAP financial measures. While theCompany believes that non-GAAP financial measures are helpful in evaluating its operatingperformance, the use of non-GAAP financial measures in this presentation should not beconsidered in isolation from, or as an alternative for, a measure of financial or operatingperformance as defined by GAAP. We caution you that there are inherent limitationsassociated with the use of each of these supplemental non-GAAP financial measures as ananalytical tool. Additionally, the Company’s computation of non-GAAP financial measuresmay not be comparable to those reported by other REITs. You can find reconciliations of thenon-GAAP financial measures to the most directly comparable GAAP financial measures inthe fourth quarter 2021 Discussion and Reconciliation of Non-GAAP Financial Measuresavailable on our website.
2Investor Presentation – March 2022

Healthpeak Platform Delivering Results
3Investor Presentation – March 2022
(1) Reconciliations, definitions, and important discussions regarding the usefulness and limitations of the non-GAAP financial measures used in this presentation can be found at http://ir.healthpeak.com/quarterly-results.(2) See disclaimers on page 2 for a description of how we calculate stabilized and estimated stabilized yields.
ProvenDevelopment Platform
$1.7B of completed projects since 2015 at a blended ~8% yield on cost(2)
Active $1.6B pipeline expected to generate a blended ~7% yield(2) and is 74% preleased (92% excluding recently announced Vantage project)
2021 Financial Results Strong FY 2021 operating results with FFO as Adjusted(1) +$0.06/sh and same-store +200 bps above initial 2021 guidance
Completed $4 billion senior housing disposition program; reinvested proceeds into high-quality life science and MOB assets, value-creating development and redevelopment pipeline, and reduced leverage
Advancing E, S & G Environmental: Executing on science-based targets for GHG emissions reductions as well as goals for energy, water, waste, and recycling
Social: “We Stand Together” initiative to enhance racial diversity, awareness and education within PEAK and our communities
Governance: “Prime” rating from ISS and “AA” rating from MSCI
Irreplaceable Real Estate Campuses
Portfolio of large-scale life science & MOB mega campuses differentiates PEAK and drives operating results
Purpose-built life science campuses in the hot bed markets of South San Francisco, San Diego and Boston provide amenity rich settings to meet thegrowth needs of tenants
Critical mass of on-campus MOBs creates a mutually-beneficial partnership with hospital systems and competitive advantages compared to other properties in the market

Why Healthpeak
4
Vital and Growing Real Estate
Differentiated portfolio of vital real estate in life science, MOBs and CCRCs, each with irreplaceable businesses in high barrier to entry markets and all benefitting from powerful demographic & scientific demand tailwinds
Embedded growth from lease mark-to-markets and a recovery in CCRC occupancy
Shadow Pipeline to Drive Future Growth
PEAK’s portfolio is positioned to provide stable and growing near and long-term earnings, cash flow and NAV from a high-quality portfolio of vital real estate that benefits from an embedded growth pipeline and continued demographic and scientific tailwinds
Current $1.6B development pipeline delivering over the next year and a half
25 and 35 years of life science and MOB development experience, respectively
$11B+ embedded shadow development and densification pipeline creates a decade-plus growth opportunity on land we own and control today
Consistent Growth Consistent earnings and cash flow growth through the inevitable cycles due to a diversified portfolio of high average operating margin businesses, a strong investment-grade balance sheet and ample liquidity
Investor Presentation – March 2022
Scale and Relationships
One of the largest owners in each of our Life Science, MOB and CCRC businesses creates scale and tenant / customer relationships
Decades of operational expertise drives property-level performance; deep industry relationships create external growth opportunities
Vital and Growing Real Estate
DevelopmentPipeline
Shadow Pipeline to Drive Future Growth

Irreplaceable Real Estate Campuses

The Shore & Towers | 1.1M SF | 7 Properties | $56M NOI The Cove | 966K SF | 7 Properties | $75M NOI
Life Science Mega Campuses Leasing Flexibility in Amenity Rich Settings
Investor Presentation – March 2022 6
Oyster Point | 923K SF | 10 Properties | $73M NOI
Seaport Center | 643K SF | 15 Properties | $40M NOI Torrey Pines Science Park | 699K SF | 10 Properties | $33M NOI Torrey Pines Science Center | 495K SF | 7 Properties | $26M NOI
CambridgePark Drive | 449K SF | 3 Properties | $37M NOI Hayden Research Center | 612K SF | 3 Properties | $32M NOI Cambridge Discovery Park | 607K SF | 4 Properties | $33M NOI
(1) Cash NOI for in-process developments based on projected stabilized Cash NOI. Reconciliations, definitions, and important discussions regarding the usefulness and limitations of the non-GAAP financial measures used in this presentation can be found at http://ir.healthpeak.com/quarterly-results.
Nine select campus totaling 6.5M square feet represent $405M of Cash NOI(1)
Redwood City, CA
Brisbane, CA South San Francisco, CA
Torrey Pines, CA Torrey Pines, CA
Cambridge, MA Lexington, MA Cambridge, MA
South San Francisco, CA

Nine select campus totaling 6.2M square feet represent $123M of Cash NOI(2)
MOB Mega CampusesOn-campus scale creates mutually-beneficial partnership with hospital systems and competitive advantages compared to other properties in the market
Swedish Medical Center | 610K SF | 6 Properties | $24M NOI Medical City Dallas | 2.2M SF | 7 Properties | $44M NOI
Investor Presentation – March 2022 7
Tristar Centennial | 837K SF | 9 Properties | $15M NOI
Sky Ridge | 421K SF | 4 Properties | $10M NOI The Woodlands | 418K SF | 4 Properties | $6M(1) NOI Swedish Medical Ctr | 311K SF | 4 Properties | $7M NOI
St. Matthews | 386K SF | 4 Properties | $7M NOI Southwest Plaza | 603K SF | 4 Properties | $6M(1) NOI Patewood Campus | 384K SF | 4 Properties | $4M NOI
PEAK MOB Hospital
1) Cash NOI shown at 100%; Healthpeak share of NOI at the campus is 51%.2) Reconciliations, definitions, and important discussions regarding the usefulness and limitations of the non-GAAP financial measures used in this presentation can be found at
http://ir.healthpeak.com/quarterly-results.
HCA | Dallas, TX Providence Health | Seattle, WA HCA | Nashville, TN
HCA | Denver, CO Memorial Hermann | Houston, TX HCA | Denver, CO
Prisma Health | Greenville, SC Norton Health | Louisville, KY Memorial Hermann | Houston, TX

ProvenDevelopment Platform

$1.6B Active Development Pipeline(1)
Investor Presentation – March 2022 9
$1.6B of active development projects that are 74% pre-leased and forecast to generate a blended ~7% yield on cost(6)
Note: Total Cost minus Cost to Date may not equal Remaining Cost due to rounding. (1) Total Cost, Remaining Cost and Estimated Initial Occupancy as of 12/31/21. Based on management’s estimates and are forward-looking. (2) Cost to Date represents land value and construction in process balance on 12/31/21. Percent Leased is as of 12/31/21.(3) The Boardwalk includes the redevelopment of 10275 Science Center Drive. Cost to Date includes land and the net book value of the redeveloped building upon commencement of the project totaling $34 million.(4) During the fourth quarter of 2021, a portion of The Shore at Sierra Point - Phase II totaling 66,000 square feet was completed and placed in service.(5) Represents total for Total Cost, Cost to Date, Remaining Cost and Leasable Area. Percent Leased is a weighted average by leasable area. (6) See Disclaimers on page 2 for a description of how we calculate yield on cost.
Project Market Total Cost ($M)
Cost to Date ($M)(2)
Remaining Cost ($M)
Leasable Area (000s SF)
Percent Leased(2)
Est. Initial Occupancy
The Boardwalk(3) Torrey Pines $175 $164 $12 192 100% 1Q 2022
The Shore Phase II(4) South San Francisco 261 246 15 232 100% 1Q 2022
The Shore Phase III South San Francisco 94 89 5 109 100% 1Q 2022
101 CambridgePark Dr West Cambridge 180 75 104 161 88% 4Q 2022
Callan Ridge Torrey Pines 140 41 99 185 100% 2Q 2023
Sorrento Gateway Sorrento Mesa 117 26 91 163 100% 2Q 2023
Nexus on Grand South San Francisco 162 49 113 148 100% 2Q 2023
Vantage - Phase I South San Francisco 393 86 307 343 – 3Q 2023
3 MOB Developments Various 69 54 15 232 61% 1Q 2022
Total / Weighted Average(5) $1,591 $830 $761 1,765 74%

Future Land Bank and Densification ProjectsSelect Life
Science Projects
Investor Presentation – March 2022 10
12 acres for future development phases
Multi-year densification as leases expire
Surface parking to be transformed into Class A life science
36 acres to develop into a vibrant, mixed-use multi-phase project
Seeking entitlements for additional density
Tear down and rebuild of existing office into purpose-built lab
VantageS. San Francisco
The TowersBrisbane
AlewifeW. Cambridge
The PostWaltham
Vista SorrentoSorrento Mesa
Life Science MOB CCRC
Pointe GrandS. San Francisco
$11B+ of future development and densification opportunities on premium land to be built over a decade-plus, primarily in our Life Science business
Various Other opportunities throughout core markets
Description
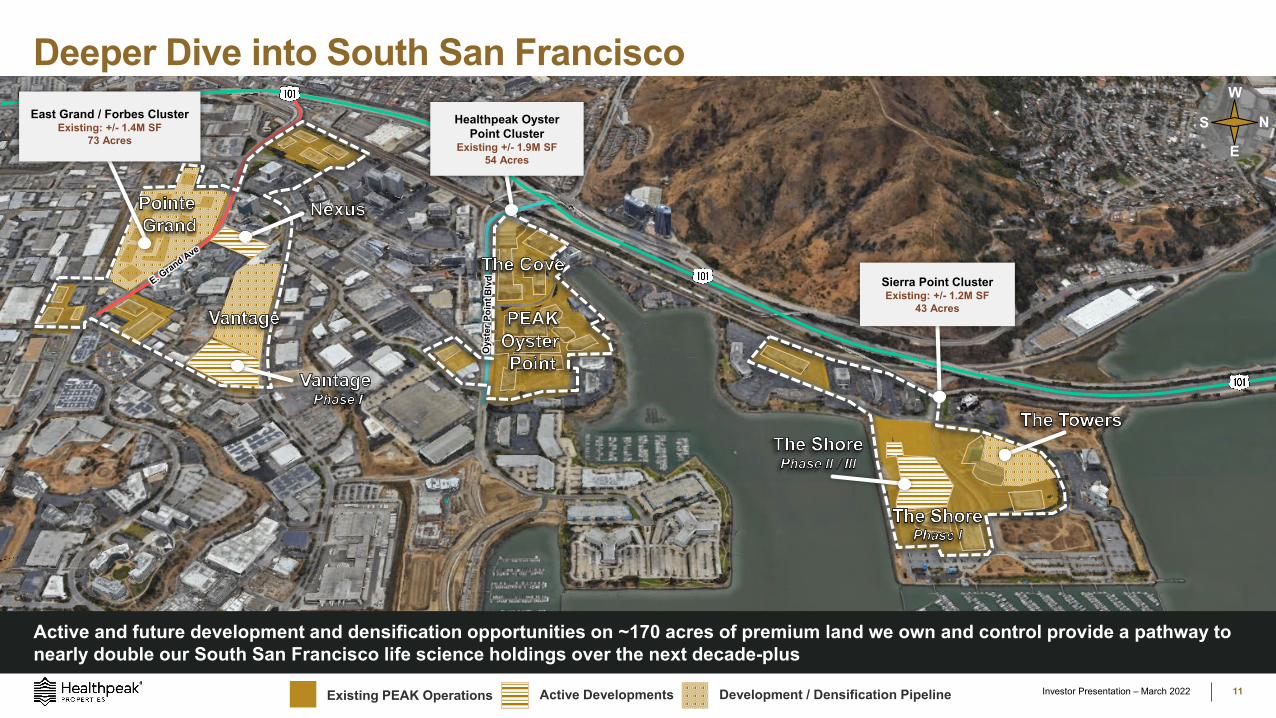
Deeper Dive into South San FranciscoN
E
W
S
Active and future development and densification opportunities on ~170 acres of premium land we own and control provide a pathway to nearly double our South San Francisco life science holdings over the next decade-plus
11
Sierra Point ClusterExisting: +/- 1.2M SF
43 Acres
Healthpeak Oyster Point Cluster
Existing +/- 1.9M SF54 Acres
Investor Presentation – March 2022Existing PEAK Operations Active Developments Development / Densification Pipeline
East Grand / Forbes ClusterExisting: +/- 1.4M SF
73 Acres

Vantage Phase I RenderingSouth San Francisco, CA
$393M Vantage Phase I Development
12
Vantage Phase I RenderingSouth San Francisco, CA
Investor Presentation – March 2022
343K square foot / $393M Class A life science development in the heart of South San Francisco
South San Francisco, CA

163K Sq Ft | 100% Leased | Est Initial Occupancy: 2Q 2023
Sorrento Gateway
185K Sq Ft | 100% Leased | Est Initial Occupancy: 2Q 2023
Callan Ridge
192K Sq Ft | 100% Leased | Est Initial Occupancy: 1Q 2022
The Boardwalk
Deeper Dive into San Diego
Investor Presentation – March 2022 13
San Diego Active Developments
University Towne Centre
Sorrento MesaTorrey
Pines
5
5
805
Downtown
Sorrento Gateway Development
The Boardwalk Development
Callan RidgeDevelopment Vista Sorrento
Future Development
Existing Property Active Development Site
Future Development Site
1
4
3
2
14
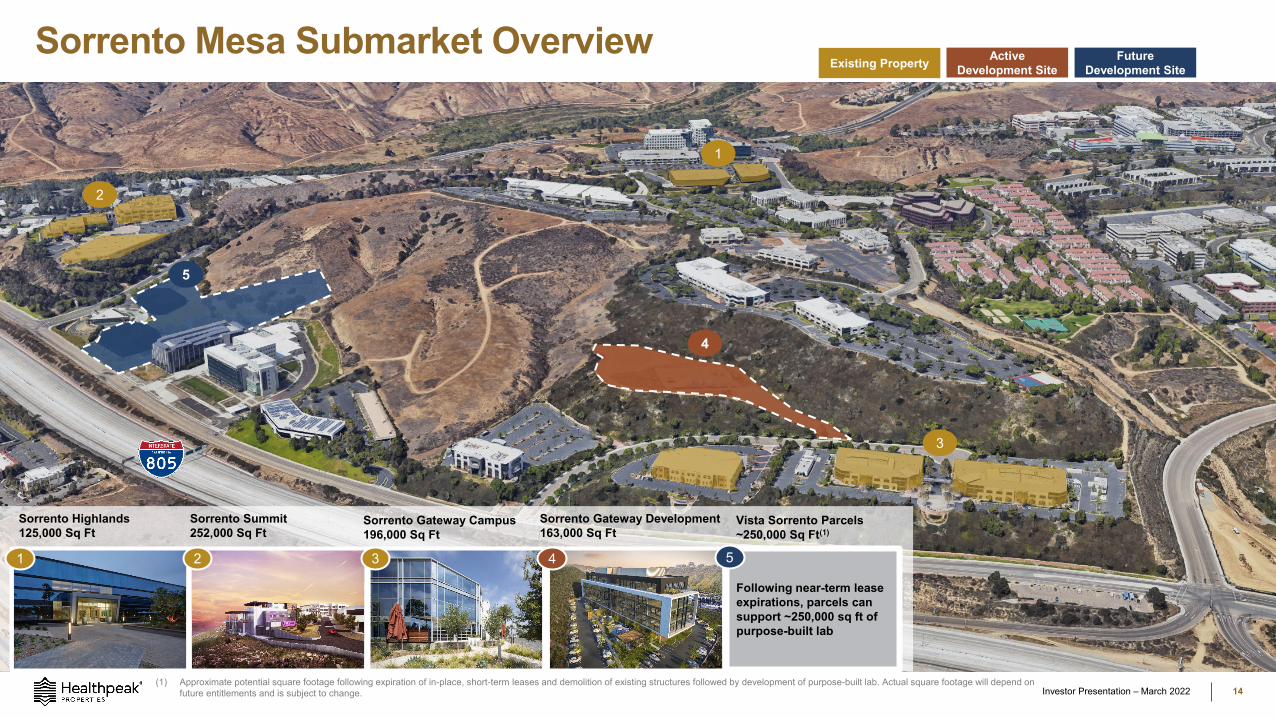
Sorrento Mesa Submarket Overview
Investor Presentation – March 2022
Sorrento Summit252,000 Sq Ft
Sorrento Gateway Campus196,000 Sq Ft
Sorrento Gateway Development163,000 Sq Ft
Sorrento Highlands125,000 Sq Ft
1 2 3 4
Vista Sorrento Parcels~250,000 Sq Ft(1)
(1) Approximate potential square footage following expiration of in-place, short-term leases and demolition of existing structures followed by development of purpose-built lab. Actual square footage will depend on future entitlements and is subject to change.
Existing Property Active Development Site
Future Development Site
Following near-term lease expirations, parcels can support ~250,000 sq ft of purpose-built lab
5
5
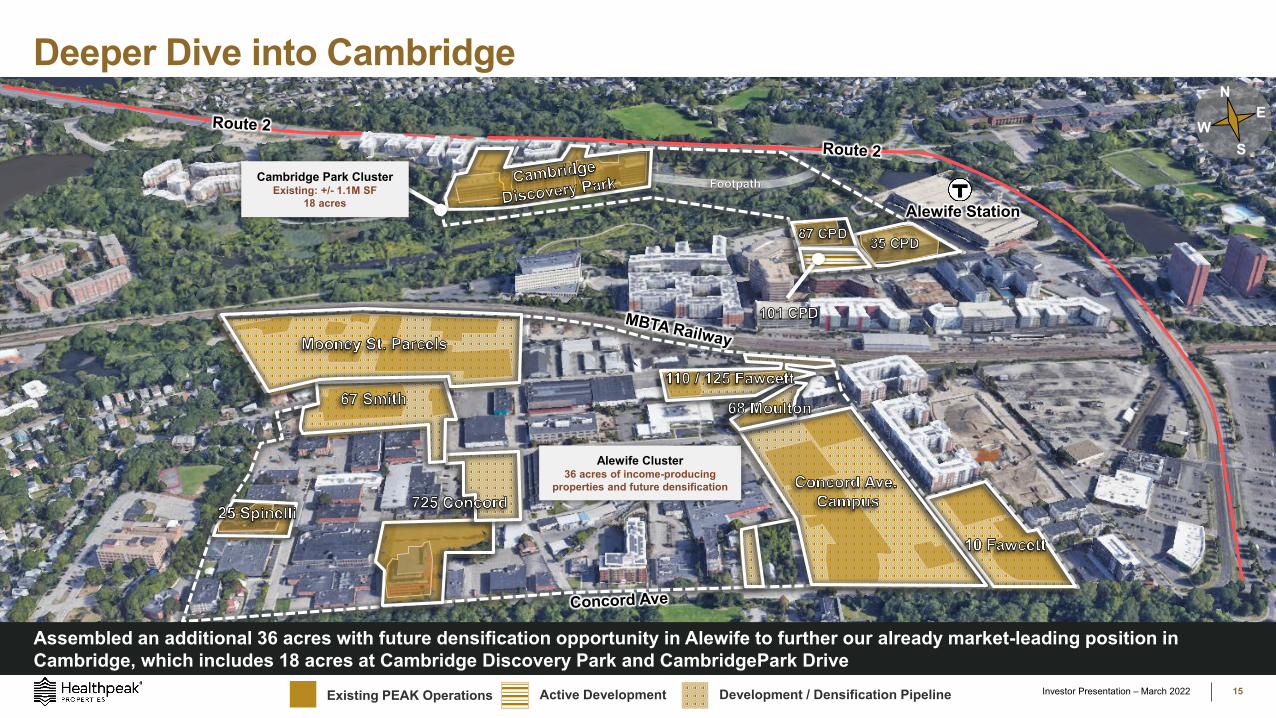
Deeper Dive into Cambridge N
EW
S
15
Alewife Station
Assembled an additional 36 acres with future densification opportunity in Alewife to further our already market-leading position in Cambridge, which includes 18 acres at Cambridge Discovery Park and CambridgePark Drive
Alewife Cluster 36 acres of income-producing
properties and future densification
Investor Presentation – March 2022
Cambridge Park ClusterExisting: +/- 1.1M SF
18 acres
Existing PEAK Operations Active Development Development / Densification Pipeline
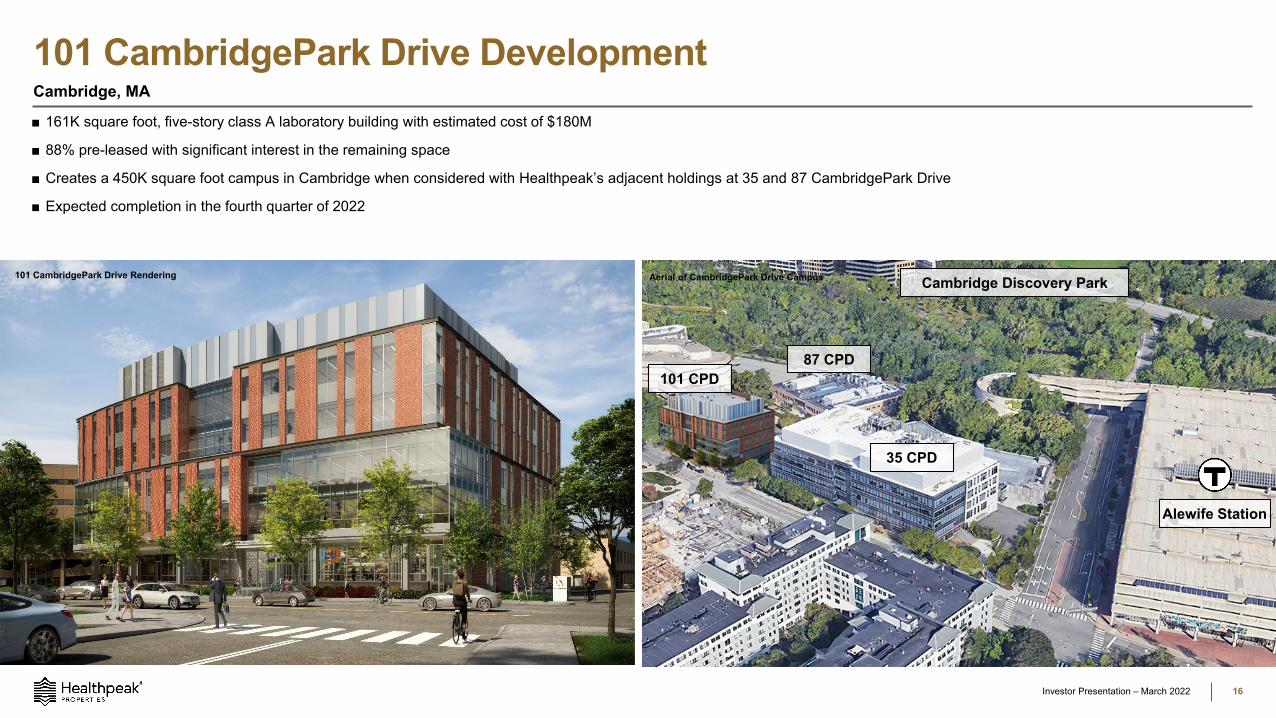
101 CambridgePark Drive Development Cambridge, MA
■ 161K square foot, five-story class A laboratory building with estimated cost of $180M
■ 88% pre-leased with significant interest in the remaining space
■ Creates a 450K square foot campus in Cambridge when considered with Healthpeak’s adjacent holdings at 35 and 87 CambridgePark Drive
■ Expected completion in the fourth quarter of 2022
Aerial of CambridgePark Drive Campus
87 CPD
35 CPD
101 CPD
Cambridge Discovery Park101 CambridgePark Drive Rendering
Investor Presentation – March 2022 16
Alewife Station

Advancing E, S & G

Gender Diversity
Racial/Ethnic Diversity
We Stand Together Initiative□ Launched company-wide initiative to enhance racial
diversity, awareness and education within our Companyand in our communities
Commitment to Environmental, Social, and Governance InitiativesWe believe that environmental, social, and governance initiatives are a vital part of corporate responsibility
Science-Based Long-Term Emissions Reduction Goals□ In collaboration with the Science-Based Targets
initiative, in 2019, established long-term Scope 1 and Scope 2 emissions reductions targets to reduce global footprint
Established New 2030 Long-Term Goals for Energy & Water Savings, Landfill Diversions and Recycling
Green Buildings Certifications□ 115 ENERGY STAR Certifications□ 5.4 million Sq. Ft. of LEED(1) Certified Assets
Corporate Governance Highlights
□ All director nominees, other than our CEO, are
independent, including Independent Chairman
□ Average Board tenure of seven and a half years
□ Board diversity, including four female directors and two
racially/ethnically diverse directors
□ Anti-hedging, anti-pledging and clawback policies
□ Robust executive officer and director stock ownership
guidelines
□ Director term limit policy to ensure orderly Board
refreshment
□ Stockholder proxy access right reflecting market
standard terms
(1) LEED®—an acronym for Leadership in Energy and Environmental Design™—and its related logo are trademarks owned by the U.S. Green Building Council® and are used with permission. Learn more at www.usgbc.org/LEED.
Environmental Social Governance
18Investor Presentation - March 2022

healthpeak.com