
Investor Presentation - Stifel
41
Investor Presentation September 9, 2020
-
Upload
khangminh22 -
Category
Documents
-
view
0 -
download
0
Transcript of Investor Presentation - Stifel

Investor Presentation
September 9, 2020

Disclaimer
2
Forward-Looking Statements
This presentation may contain “forward-looking statements” within the meaning of the Private Securities Litigation Reform Act of 1995 that involve significant risks,assumptions, and uncertainties, including statements relating to the market opportunity and future business prospects of Stifel Financial Corp., as well as Stifel,Nicolaus & Company, Incorporated and its subsidiaries (collectively, “SF” or the “Company”). These statements can be identified by the use of the words “may,”“will,” “should,” “could,” “would,” “plan,” “potential,” “estimate,” “project,” “believe,” “intend,” “anticipate,” “expect,” and similar expressions. In particular,these statements may refer to our goals, intentions, and expectations, our business plans and growth strategies, our ability to integrate and manage our acquiredbusinesses, estimates of our risks and future costs and benefits, and forecasted demographic and economic trends relating to our industry.
You should not place undue reliance on any forward-looking statements, which speak only as of the date they were made. We will not update these forward-lookingstatements, even though our situation may change in the future, unless we are obligated to do so under federal securities laws.
Actual results may differ materially and reported results should not be considered as an indication of future performance. Factors that could cause actual results todiffer are included in the Company’s annual and quarterly reports and from time to time in other reports filed by the Company with the Securities and ExchangeCommission and include, among other things, changes in general economic and business conditions, actions of competitors, regulatory and legal actions, changes inlegislation, and technology changes.
Use of Non-GAAP Financial Measures
The Company utilized certain non-GAAP calculations as additional measures to aid in understanding and analyzing the Company’s financial results for the six monthsended June 30, 2020. Specifically, the Company believes that the non-GAAP measures provide useful information by excluding certain items that may not beindicative of the Company’s core operating results and business outlook. The Company believes that these non-GAAP measures will allow for a better evaluation ofthe operating performance of the business and facilitate a meaningful comparison of the Company’s results in the current period to those in prior and future periods.Reference to these non-GAAP measures should not be considered as a substitute for results that are presented in a manner consistent with GAAP. These non-GAAPmeasures are provided to enhance investors' overall understanding of the Company’s current financial performance. The non-GAAP financial information should beconsidered in addition to, not as a substitute for or as being superior to, operating income, cash flows, or other measures of financial performance prepared inaccordance with GAAP. These non-GAAP measures primarily exclude expenses which management believes are, in some instances, non-recurring and notrepresentative of ongoing business.
A limitation of utilizing these non-GAAP measures is that the GAAP accounting effects of these charges do, in fact, reflect the underlying financial results of theCompany’s business and these effects should not be ignored in evaluating and analyzing its financial results. Therefore, the Company believes that GAAP measuresand the same respective non-GAAP measures of the Company’s financial performance should be considered together.

3
Our Strategy
Strategic Vision
4
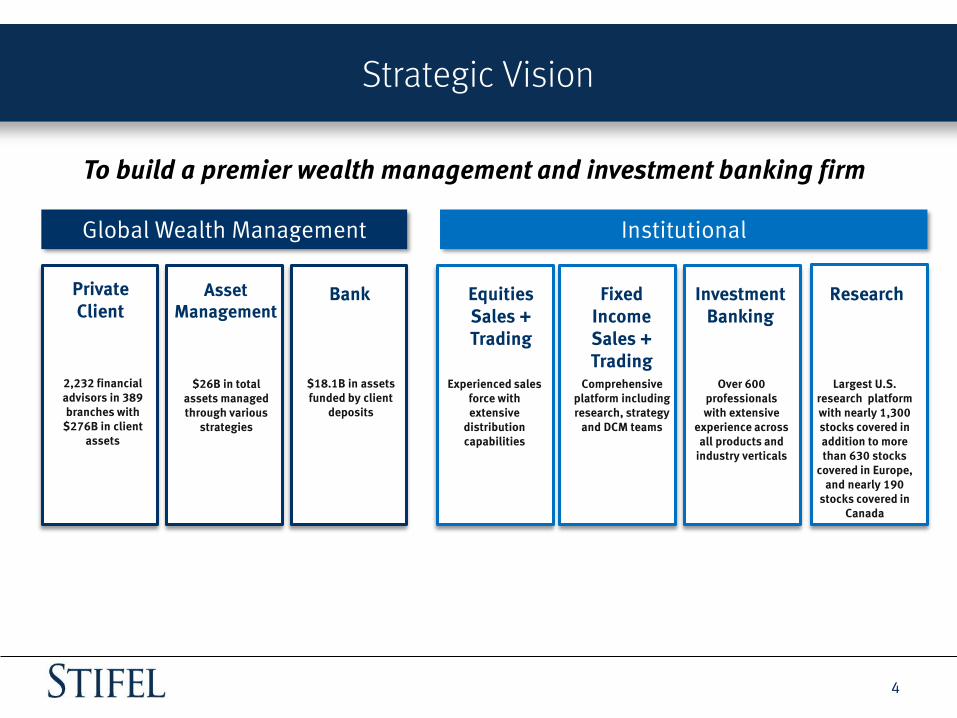
To build a premier wealth management and investment banking firm
Global Wealth Management Institutional
Private Client
2,232 financial advisors in 389 branches with
$276B in client assets
Asset Management
$26B in total assets managed through various
strategies
Bank
$18.1B in assets funded by client
deposits
Equities Sales + Trading
Fixed Income Sales + Trading
Investment Banking
Research
Experienced sales force with extensive
distribution capabilities
Comprehensive platform including research, strategy
and DCM teams
Over 600 professionals with extensive
experience across all products and
industry verticals
Largest U.S. research platform with nearly 1,300 stocks covered in addition to more than 630 stocks
covered in Europe, and nearly 190
stocks covered in Canada
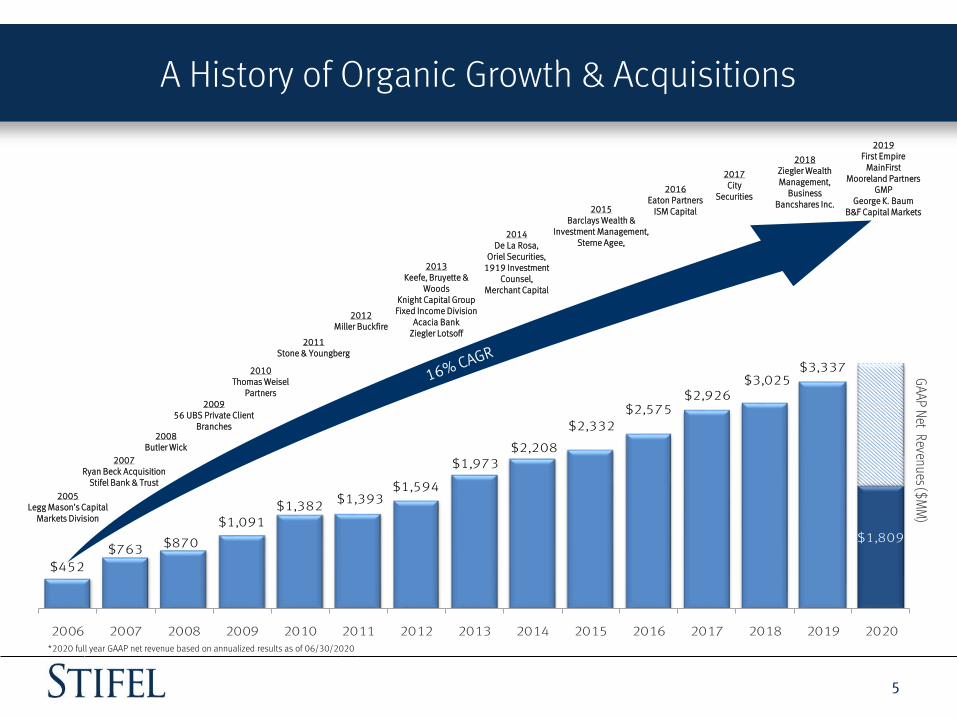
A History of Organic Growth & Acquisitions
5
$452
$763 $870
$1,091$1,382
$1,393$1,594
$1,973$2,208
$2,332
$2,575$2,926
$3,025$3,337
$1,809
2006 2007 2008 2009 2010 2011 2012 2013 2014 2015 2016 2017 2018 2019 2020
GAAP N
et Revenues ($M
M)
2005Legg Mason’s Capital
Markets Division
2007Ryan Beck Acquisition
Stifel Bank & Trust
2008Butler Wick
200956 UBS Private Client
Branches
2010Thomas Weisel
Partners
2011Stone & Youngberg
2012Miller Buckfire
2013Keefe, Bruyette &
WoodsKnight Capital Group Fixed Income Division
Acacia BankZiegler Lotsoff
2014De La Rosa,
Oriel Securities,1919 Investment
Counsel,Merchant Capital
2015Barclays Wealth &
Investment Management,Sterne Agee,
2016Eaton Partners
ISM Capital
2017City
Securities
2018Ziegler Wealth Management,
Business Bancshares Inc.
2019First Empire
MainFirstMooreland Partners
GMP George K. Baum
B&F Capital Markets
* 2019 full year GAAP net revenues based on annualized results as of 9/30/19.*2020 full year GAAP net revenue based on annualized results as of 06/30/2020

6
Stifel Overview

Stifel – Premier Investment Bank and Wealth Management Firm
7
Stifel at a Glance 2019 GAAP Net Revenue - $3.3 billion
Global Wealth Management (GWM)2019 Net Revenue - $2.1 billion
Institutional Group (IG)2019 Net Revenue - $1.2 billion
Private Client
Stifel Bancorp
Margin and Securities-based Lending
Asset Management
Equity & Fixed Income Capital Raising M&A Advisory / Restructuring Institutional Equity and Fixed Income Brokerage Independent Research
Low leverage (6.6x) (1) (2), $3.9 billion stockholders’ equity (2) and $3.6 billion market capitalization (3)
29% Insider ownership aligns employees' interests with other shareholders (4)
Approximately 8,400 full-time associates(2)
Balanced business mix (64% GWM / 36% IG) (2019 net revenues)
National presence with 2,232 financial advisors(2)
Largest U.S. equity research platform with approximately 1,300 stocks under coverage(2)
Broad investment banking and institutional sales and trading capabilities – domestic and international
(1) Assets / equity.(2) As of 06/30/2020 (3) As of 09/04/2020(4) Insider ownership percentage includes all units outstanding, as of March 18, 2020.
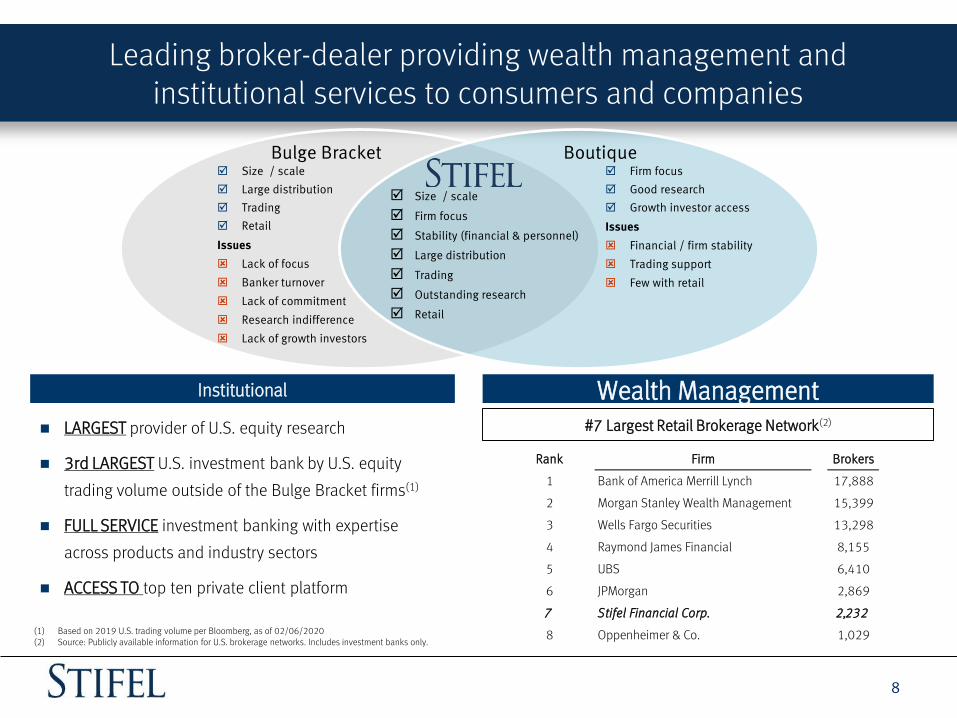
Leading broker-dealer providing wealth management and institutional services to consumers and companies
8
Bulge Bracket Boutique Size / scale
Large distribution
Trading
Retail
Issues
Lack of focus
Banker turnover
Lack of commitment
Research indifference
Lack of growth investors
Firm focus
Good research
Growth investor access
Issues
Financial / firm stability
Trading support
Few with retail
Size / scale
Firm focus
Stability (financial & personnel)
Large distribution
Trading
Outstanding research
Retail
Institutional Wealth Management
LARGEST provider of U.S. equity research
3rd LARGEST U.S. investment bank by U.S. equity
trading volume outside of the Bulge Bracket firms(1)
FULL SERVICE investment banking with expertise
across products and industry sectors
ACCESS TO top ten private client platform
#7 Largest Retail Brokerage Network(2)
(1) Based on 2019 U.S. trading volume per Bloomberg, as of 02/06/2020(2) Source: Publicly available information for U.S. brokerage networks. Includes investment banks only.
Rank Firm Brokers
1 Bank of America Merrill Lynch 17,888 no longer include footnote on number of advisor in consumer banking segment (2818 in 2Q19). Now use the number of Fas
2 Morgan Stanley Wealth Management 15,399
3 Wells Fargo Securities 13,298
4 Raymond James Financial 8,155
5 UBS 6,410 Page 21 of quarterly report (Wealth management regional breakdown)
6 JPMorgan 2,869
7 Stifel Financial Corp. 2,232
8 Oppenheimer & Co. 1,029
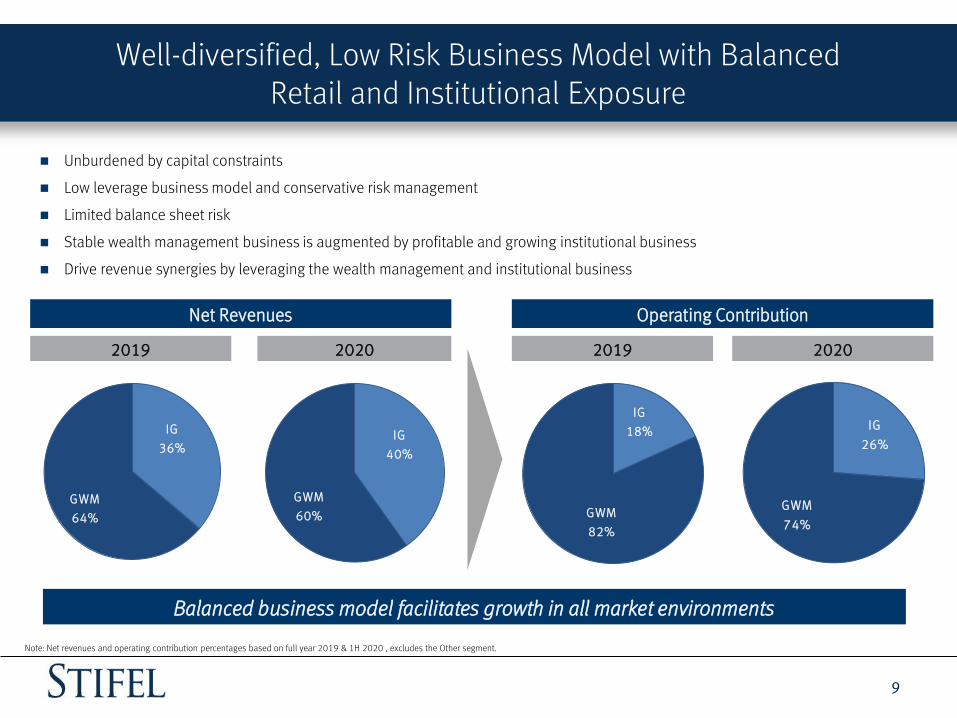
Well-diversified, Low Risk Business Model with Balanced Retail and Institutional Exposure
9
Unburdened by capital constraints
Low leverage business model and conservative risk management
Limited balance sheet risk
Stable wealth management business is augmented by profitable and growing institutional business
Drive revenue synergies by leveraging the wealth management and institutional business
Net Revenues
2019 2020
Operating Contribution
2019 2020
Balanced business model facilitates growth in all market environments
Note: Net revenues and operating contribution percentages based on full year 2019 & 1H 2020 , excludes the Other segment.
IG
36%
GWM
64%
IG
40%
GWM
60%
IG
18%
GWM
82%
IG
26%
GWM
74%
A Stable Track Record Through Multiple Business Cycles
10
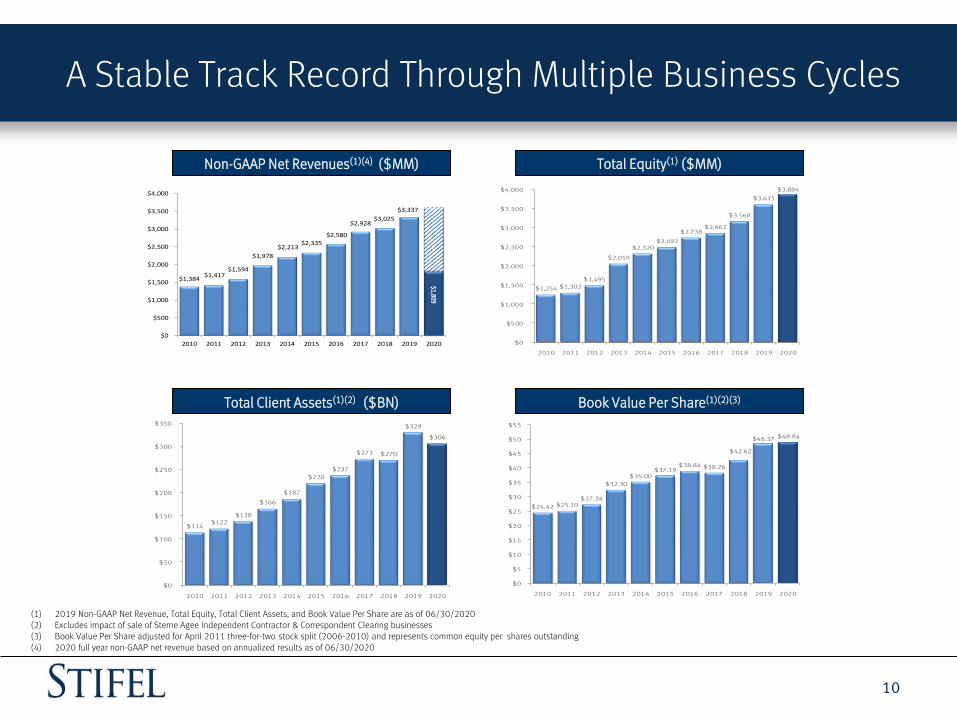
Non-GAAP Net Revenues(1)(4) ($MM) Total Equity(1) ($MM)
Total Client Assets(1)(2) ($BN) Book Value Per Share(1)(2)(3)
$1,384 $1,417
$1,594
$1,978
$2,213 $2,335
$2,580
$2,928 $3,025
$3,337
$1,809
$0
$500
$1,000
$1,500
$2,000
$2,500
$3,000
$3,500
$4,000
2010 2011 2012 2013 2014 2015 2016 2017 2018 2019 2020
$1,254 $1,302
$1,495
$2,059
$2,320 $2,492
$2,738 $2,862
$3,168
$3,615
$3,884
$0
$500
$1,000
$1,500
$2,000
$2,500
$3,000
$3,500
$4,000
2010 2011 2012 2013 2014 2015 2016 2017 2018 2019 2020
$114 $122
$138
$166
$187
$220
$237
$273 $270
$329
$306
$0
$50
$100
$150
$200
$250
$300
$350
2010 2011 2012 2013 2014 2015 2016 2017 2018 2019 2020
$24.42 $25.10 $27.24
$32.30
$35.00 $37.19
$38.84 $38.26
$42.62
$48.37 $48.84
$0
$5
$10
$15
$20
$25
$30
$35
$40
$45
$50
$55
2010 2011 2012 2013 2014 2015 2016 2017 2018 2019 2020
(1) 2019 Non-GAAP Net Revenue, Total Equity, Total Client Assets, and Book Value Per Share are as of 06/30/2020(2) Excludes impact of sale of Sterne Agee Independent Contractor & Correspondent Clearing businesses(3) Book Value Per Share adjusted for April 2011 three-for-two stock split (2006-2010) and represents common equity per shares outstanding(4) 2020 full year non-GAAP net revenue based on annualized results as of 06/30/2020
11
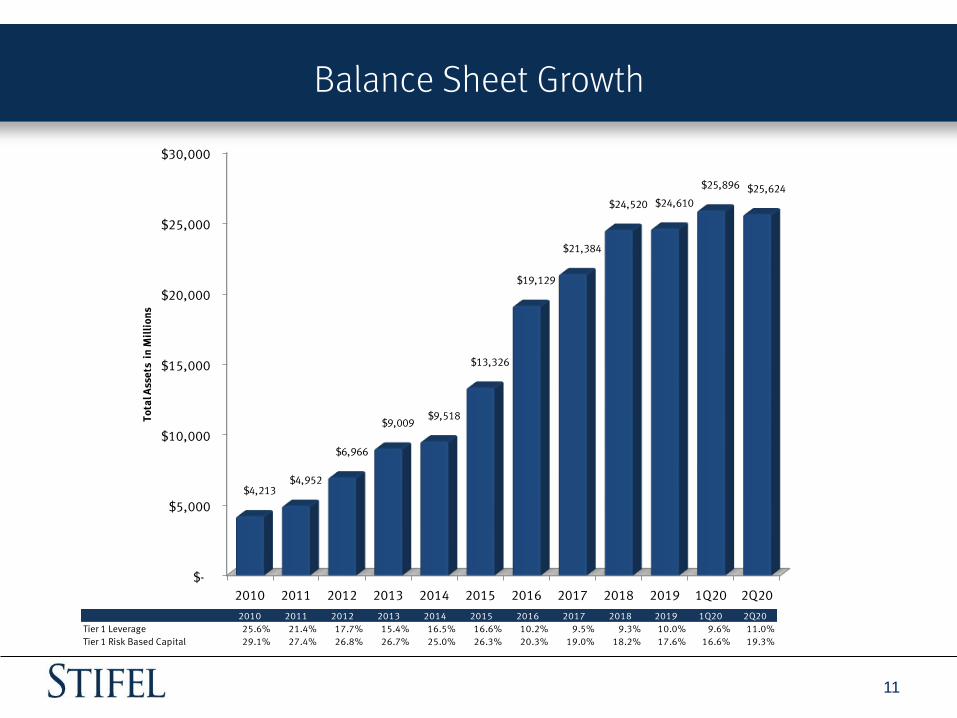
Balance Sheet Growth
$-
$5,000
$10,000
$15,000
$20,000
$25,000
$30,000
2010 2011 2012 2013 2014 2015 2016 2017 2018 2019 1Q20 2Q20
$4,213 $4,952
$6,966
$9,009 $9,518
$13,326
$19,129
$21,384
$24,520 $24,610
$25,896 $25,624
To
tal A
sse
ts i
n M
illi
on
s
2010 2011 2012 2013 2014 2015 2016 2017 2018 2019 1Q20 2Q20
Tier 1 Leverage 25.6% 21.4% 17.7% 15.4% 16.5% 16.6% 10.2% 9.5% 9.3% 10.0% 9.6% 11.0%
Tier 1 Risk Based Capital 29.1% 27.4% 26.8% 26.7% 25.0% 26.3% 20.3% 19.0% 18.2% 17.6% 16.6% 19.3%

12
Global Wealth Management
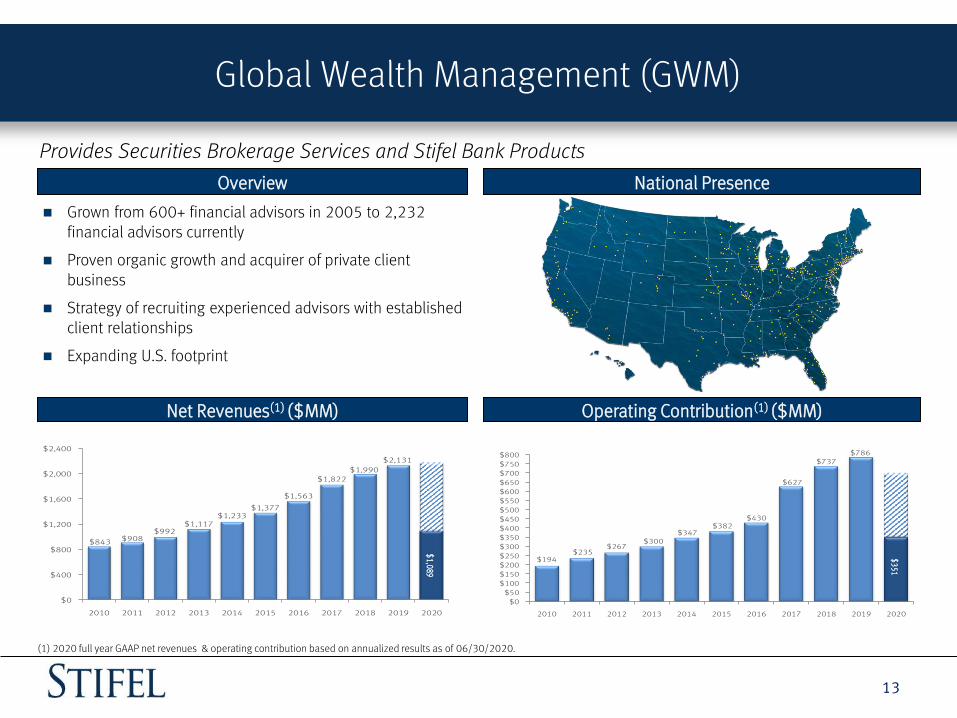
Global Wealth Management (GWM)
13
Provides Securities Brokerage Services and Stifel Bank Products
Overview National Presence
Grown from 600+ financial advisors in 2005 to 2,232 financial advisors currently
Proven organic growth and acquirer of private client business
Strategy of recruiting experienced advisors with established client relationships
Expanding U.S. footprint
Net Revenues(1) ($MM) Operating Contribution(1) ($MM)
$843 $908$992
$1,117$1,233
$1,377
$1,563
$1,822$1,990
$2,131
$1,089
$0
$400
$800
$1,200
$1,600
$2,000
$2,400
2010 2011 2012 2013 2014 2015 2016 2017 2018 2019 2020
$194$235
$267$300
$347$382
$430
$627
$737$786
$3
51
$0
$50
$100
$150
$200
$250
$300
$350
$400
$450
$500
$550
$600
$650
$700
$750
$800
2010 2011 2012 2013 2014 2015 2016 2017 2018 2019 2020
• 2017 full year net revenue and operating contribution based on annualized results as of 9/30/2017(1) 2018 full year results based on annualized result as of 9/30/2018(1) 2020 full year GAAP net revenues & operating contribution based on annualized results as of 06/30/2020.
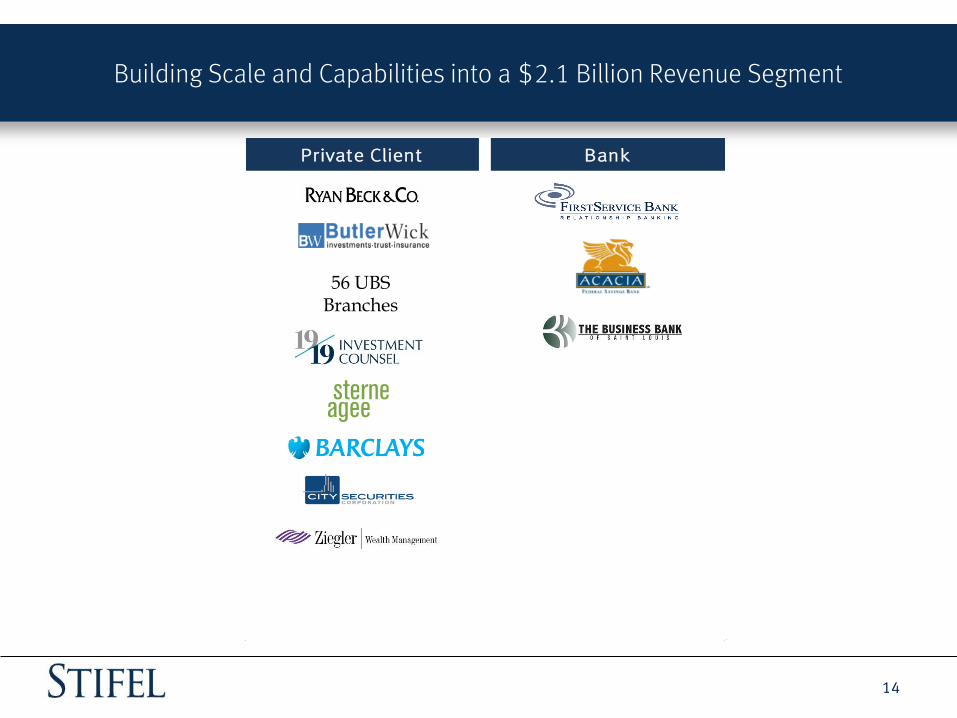
Building Scale and Capabilities into a $2.1 Billion Revenue Segment
14
Private Client Bank
56 UBS Branches

GWM - Private Client Group
15
Key Operating Metrics
Accounts(1)(2)
Financial Advisors(1)(2)(3)
Total Client Assets(1)(2) ($MM)
Branches(1)(2)
1,935 1,987 2,041 2,077 2,103
2,291 2,282 2,244 2,152
2,222 2,232
0
500
1,000
1,500
2,000
2,500
2010 2011 2012 2013 2014 2015 2016 2017 2018 2019 2020
285 291 307
317 330
361 360 355 369
382 389
0
50
100
150
200
250
300
350
400
450
2010 2011 2012 2013 2014 2015 2016 2017 2018 2019 2020
635,842 654,625 681,818 703,663
728,444
793,795 813,844 850,880
903,953 944,970 962,331
0
100,000
200,000
300,000
400,000
500,000
600,000
700,000
800,000
900,000
1,000,000
2010 2011 2012 2013 2014 2015 2016 2017 2018 2019 2020
113,585 122,466
137,855
165,570
186,558
219,900 236,942
272,591 269,862
329,495
306,235
0
50,000
100,000
150,000
200,000
250,000
300,000
350,000
2010 2011 2012 2013 2014 2015 2016 2017 2018 2019 2020
(1) 2020 Financial Advisors, Branches, Accounts, and Total Client Assets are as of 06/30/2020(2) Excludes Legacy Sterne Agee Independent Contractor Business.(3) 2018, 2019, & 2020 reflect change in the definition of producing brokers as of January 1, 2019.

GWM – Stifel Bancorp, Inc.
16
Acquired FirstService Bank, a St. Louis-based, Missouri-chartered commercial bank, in April 2007
Stifel Financial became a bank holding company and financial services holding company
Substantial Balance sheet growth with low-risk assets
Funded by Stifel Nicolaus client deposits
Maintain high levels of liquidity
Overview Key Statistics (000s) (1)(2)
Total assets $18,123
Total deposits 16,302
Total equity 1,378
ROAA 1.26%
ROAE 18.22%
Tier 1 Risk Based Capital 12.40%
Tier 1 Leverage 7.20%
NPAs/Assets 0.08%
Investment Portfolio Loan Portfolio(3)Interest Earnings Assets
5%
35%
60%
Cash Investment Securities Loans
76%
10%
14% 0%
ABS Corporates MBS Munis Other
17%
39%
34%
4%5%
Securities-based lending Commercial and industrial
Residential real estate Commercial real estate
OtherNote: Key Statistic Data as of 06/30/2020.(1) ROAA, ROAE, as well as Tier 1 capital ratios specific to Stifel Bank & Trust (2) NPAs include: nonaccrual loans, restructured loans, loans 90+ days past due, and other real estate owned.(3) Other includes construction and land, consumer loans, and home equity lines of credit.
Growing Asset Management Capabilities
17
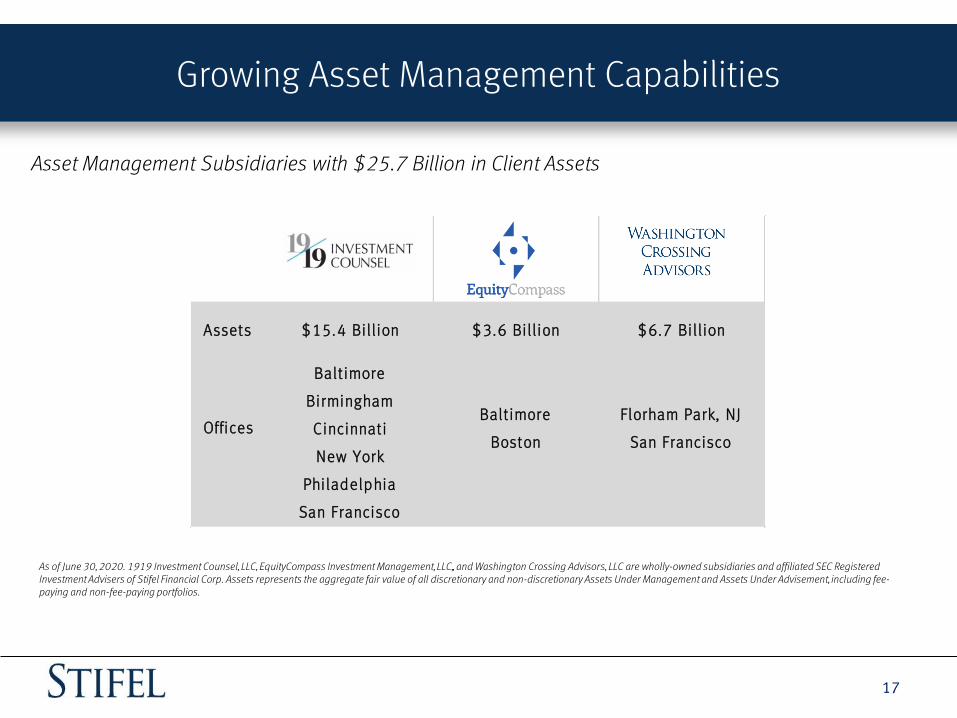
Asset Management Subsidiaries with $25.7 Billion in Client Assets
Assets $15.4 Bill ion $3.6 Bill ion $6.7 Bill ion
Baltimore
Birmingham
Cincinnati
New York
Philadelphia
San Francisco
OfficesBaltimore
Boston
Florham Park, NJ
San Francisco
As of June 30, 2020. 1919 Investment Counsel, LLC, EquityCompass Investment Management, LLC,, and Washington Crossing Advisors, LLC are wholly-owned subsidiaries and affiliated SEC Registered Investment Advisers of Stifel Financial Corp. Assets represents the aggregate fair value of all discretionary and non-discretionary Assets Under Management and Assets Under Advisement, including fee-paying and non-fee-paying portfolios.

18
Institutional Group
Institutional Group
19
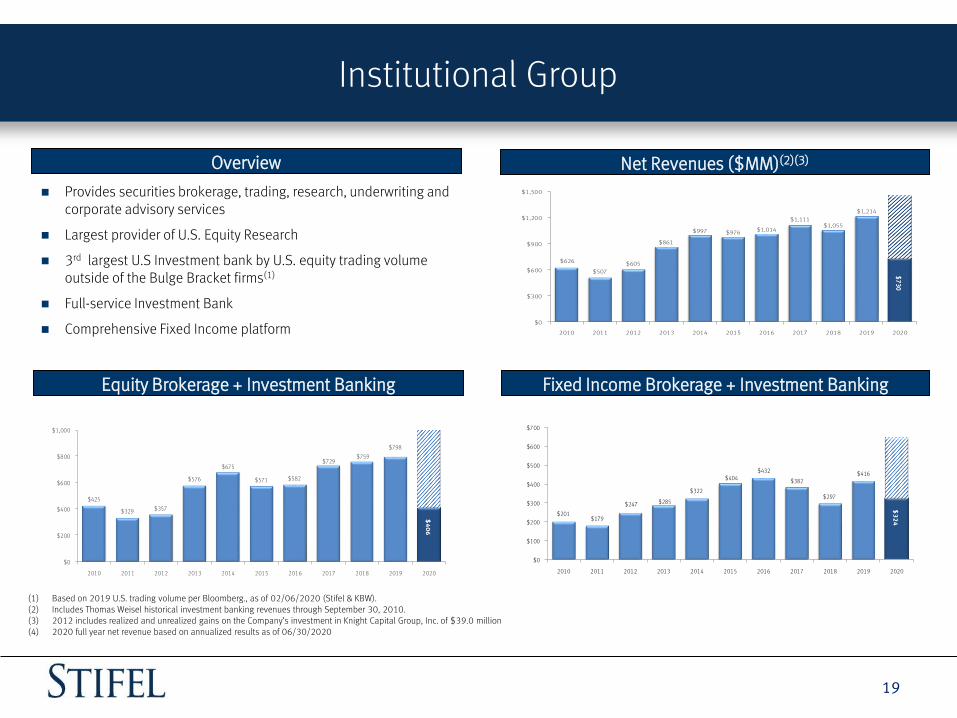
Net Revenues ($MM)(2)(3)
Fixed Income Brokerage + Investment Banking
Overview
Equity Brokerage + Investment Banking
Provides securities brokerage, trading, research, underwriting and corporate advisory services
Largest provider of U.S. Equity Research
3rd largest U.S Investment bank by U.S. equity trading volume outside of the Bulge Bracket firms(1)
Full-service Investment Bank
Comprehensive Fixed Income platform
$626
$507
$605
$861
$997 $976 $1,014
$1,111$1,055
$1,214
$7
30
$0
$300
$600
$900
$1,200
$1,500
2010 2011 2012 2013 2014 2015 2016 2017 2018 2019 2020
$201$179
$247 $285
$322
$404$432
$382
$297
$416
$3
24
$0
$100
$200
$300
$400
$500
$600
$700
2010 2011 2012 2013 2014 2015 2016 2017 2018 2019 2020
(1) Based on 2019 U.S. trading volume per Bloomberg., as of 02/06/2020 (Stifel & KBW). (2) Includes Thomas Weisel historical investment banking revenues through September 30, 2010.(3) 2012 includes realized and unrealized gains on the Company’s investment in Knight Capital Group, Inc. of $39.0 million(4) 2020 full year net revenue based on annualized results as of 06/30/2020(5) 2019 full year net revenues based on annualized net revenue as of 9/30/2019
$425
$329 $357
$576
$675
$571 $582
$729$759
$798
$4
06
$0
$200
$400
$600
$800
$1,000
2010 2011 2012 2013 2014 2015 2016 2017 2018 2019 2020

Building Scale and Capabilities into a $1.2 Billion Revenue Segment
20
Investment Banking Fixed Income Equities
Knight
GMP
Institutional Group – Advisory
21
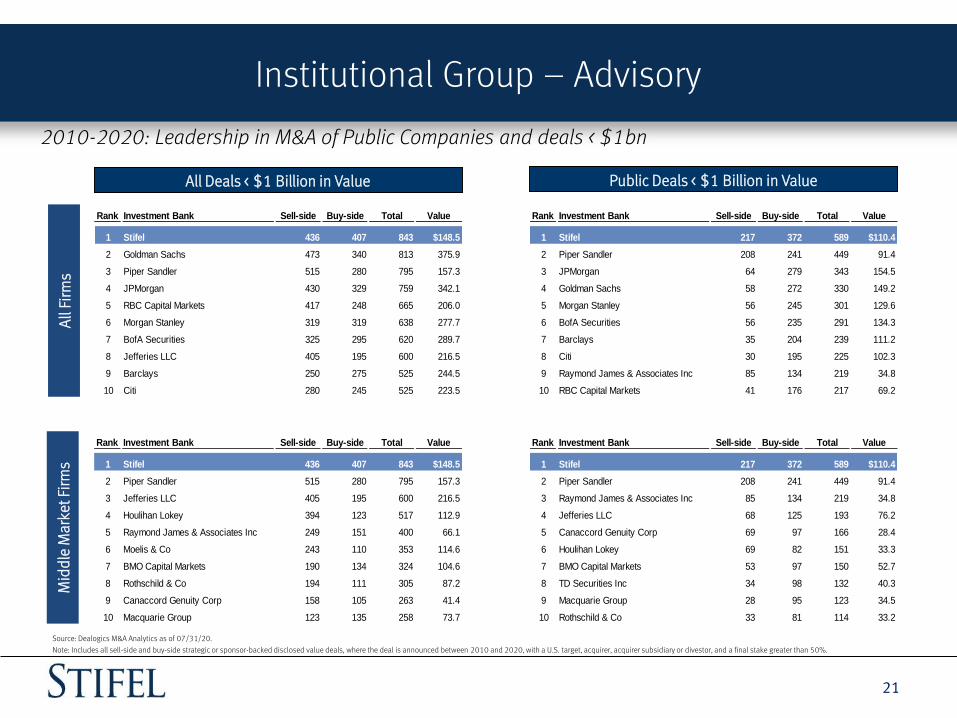
2010-2020: Leadership in M&A of Public Companies and deals < $1bn.
Public Deals < $1 Billion in ValueAll Deals < $1 Billion in Value
All
Firm
s M
idd
le M
arke
t Fir
ms
Source: Dealogics M&A Analytics as of 07/31/20.
Note: Includes all sell-side and buy-side strategic or sponsor-backed disclosed value deals, where the deal is announced between 2010 and 2020, with a U.S. target, acquirer, acquirer subsidiary or divestor, and a final stake greater than 50%.
Rank Investment Bank Sell-side Buy-side Total Value
1 Stifel 436 407 843 $148.5
2 Goldman Sachs 473 340 813 375.9
3 Piper Sandler 515 280 795 157.3
4 JPMorgan 430 329 759 342.1
5 RBC Capital Markets 417 248 665 206.0
6 Morgan Stanley 319 319 638 277.7
7 BofA Securities 325 295 620 289.7
8 Jefferies LLC 405 195 600 216.5
9 Barclays 250 275 525 244.5
10 Citi 280 245 525 223.5
Rank Investment Bank Sell-side Buy-side Total Value
1 Stifel 436 407 843 $148.5
2 Piper Sandler 515 280 795 157.3
3 Jefferies LLC 405 195 600 216.5
4 Houlihan Lokey 394 123 517 112.9
5 Raymond James & Associates Inc 249 151 400 66.1
6 Moelis & Co 243 110 353 114.6
7 BMO Capital Markets 190 134 324 104.6
8 Rothschild & Co 194 111 305 87.2
9 Canaccord Genuity Corp 158 105 263 41.4
10 Macquarie Group 123 135 258 73.7
Rank Investment Bank Sell-side Buy-side Total Value
1 Stifel 217 372 589 $110.4
2 Piper Sandler 208 241 449 91.4
3 JPMorgan 64 279 343 154.5
4 Goldman Sachs 58 272 330 149.2
5 Morgan Stanley 56 245 301 129.6
6 BofA Securities 56 235 291 134.3
7 Barclays 35 204 239 111.2
8 Citi 30 195 225 102.3
9 Raymond James & Associates Inc 85 134 219 34.8
10 RBC Capital Markets 41 176 217 69.2
Rank Investment Bank Sell-side Buy-side Total Value
1 Stifel 217 372 589 $110.4
2 Piper Sandler 208 241 449 91.4
3 Raymond James & Associates Inc 85 134 219 34.8
4 Jefferies LLC 68 125 193 76.2
5 Canaccord Genuity Corp 69 97 166 28.4
6 Houlihan Lokey 69 82 151 33.3
7 BMO Capital Markets 53 97 150 52.7
8 TD Securities Inc 34 98 132 40.3
9 Macquarie Group 28 95 123 34.5
10 Rothschild & Co 33 81 114 33.2

Institutional Group – Equity Underwriting
22
Accomplished U.S. Equity Underwriting Franchise – All Equity Transactions
Bookrun Equity Deals Since 2010All Managed Equity Deals Since 2010
Source: Dealogic. Rank eligible SEC registered IPOs and Follow-On offerings since 2010. Includes demutualizations. As of 07/31/20. Overlapping deals between Stifel and its acquired firms have been removed.
Note: $ Volume represents full credit to underwriter for All Managed Equity Deals and apportioned credit to bookrunner for Bookrun Equity Deals. Bold font indicates middle-market firms.
($ in billions) # of $
Rank Firm Deals Volume
1 JPMorgan 2,282 $1,249.6
2 BofA Securities 2,143 $1,209.1
3 Morgan Stanley 2,034 $1,186.7
4 Citi 1,949 $1,186.6
5 Goldman Sachs 1,844 $1,144.2
6 Credit Suisse 1,692 $972.6
7 Barclays 1,673 $977.9
8 Wells Fargo Securities 1,599 $836.3
9 Stifel 1,523 $489.0
10 RBC Capital Markets 1,403 $716.3
11 Deutsche Bank 1,345 $821.1
12 Piper Sandler 1,221 $409.1
13 Raymond James & Associates Inc 1,111 $424.1
14 UBS 1,053 $605.4
15 Jefferies LLC 1,047 $271.0
16 Truist Financial Corp 907 $394.1
17 Cowen & Company LLC 875 $188.7
18 Robert W Baird & Co 800 $238.7
19 JMP Securities LLC 744 $160.7
20 William Blair & Co LLC 736 $206.0
21 Oppenheimer & Co Inc 725 $175.9
22 BMO Capital Markets 630 $227.7
23 B Riley FBR Inc 619 $111.7
24 KeyBanc Capital Markets 613 $257.8
25 Canaccord Genuity Corp 598 $102.1
($ in billions) # of $
Rank Firm Deals Volume
1 JPMorgan 2,115 $255.5
2 BofA Securities 1,975 $213.8
3 Morgan Stanley 1,899 $264.1
4 Citi 1,756 $220.8
5 Goldman Sachs 1,731 $262.0
6 Credit Suisse 1,465 $174.2
7 Barclays 1,437 $180.8
8 Wells Fargo Securities 1,159 $87.0
9 Deutsche Bank 1,096 $115.1
10 Jefferies LLC 929 $48.8
11 RBC Capital Markets 813 $61.9
12 UBS 797 $70.6
13 Stifel 622 $27.9
14 Piper Sandler 588 $26.6
15 Cowen & Company LLC 546 $22.5
16 SVB Leerink 383 $16.9
17 Raymond James & Associates Inc 378 $15.1
18 BMO Capital Markets 295 $16.1
19 Roth Capital Partners 234 $3.7
20 Robert W Baird & Co 221 $8.3
21 William Blair & Co LLC 210 $7.1
22 Cantor Fitzgerald & Co 195 $11.7
23 Truist Financial Corp 189 $11.5
24 Oppenheimer & Co Inc 158 $3.7
25 Evercore Inc 156 $10.8
Institutional Group – Research
23
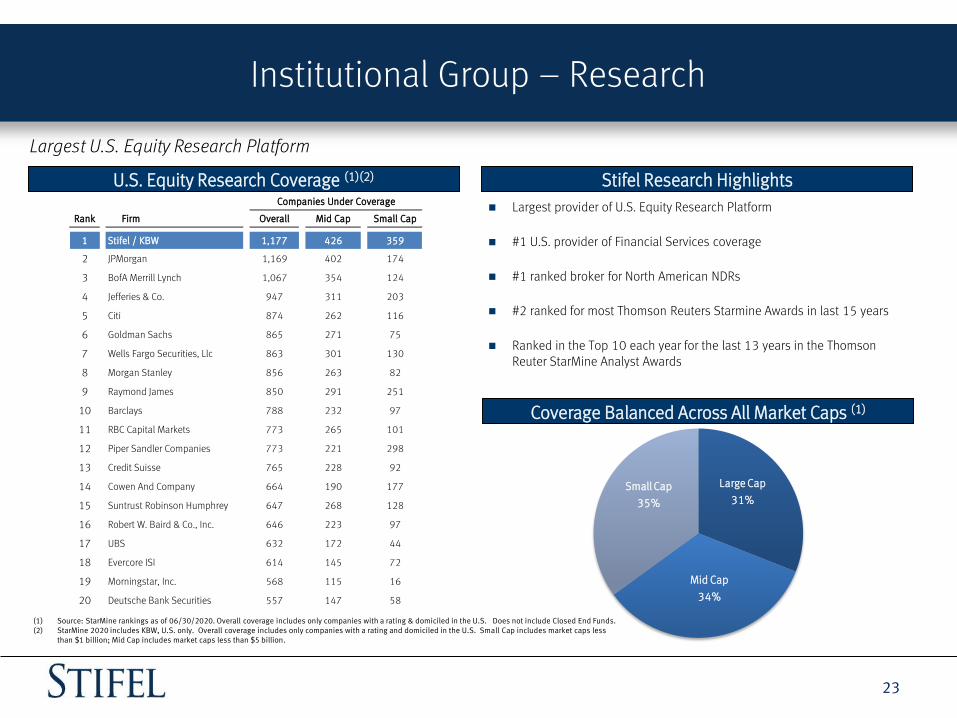
Largest U.S. Equity Research Platform
U.S. Equity Research Coverage (1)(2)
Coverage Balanced Across All Market Caps (1)
Stifel Research Highlights
Largest provider of U.S. Equity Research Platform
#1 U.S. provider of Financial Services coverage
#1 ranked broker for North American NDRs
#2 ranked for most Thomson Reuters Starmine Awards in last 15 years
Ranked in the Top 10 each year for the last 13 years in the Thomson Reuter StarMine Analyst Awards
(1) Source: StarMine rankings as of 06/30/2020. Overall coverage includes only companies with a rating & domiciled in the U.S. Does not include Closed End Funds. (2) StarMine 2020 includes KBW, U.S. only. Overall coverage includes only companies with a rating and domiciled in the U.S. Small Cap includes market caps less
than $1 billion; Mid Cap includes market caps less than $5 billion.
Companies Under Coverage
Rank Firm Overall Mid Cap Small Cap
1 Stifel / KBW 1,177 426 359
2 JPMorgan 1,169 402 174
3 BofA Merrill Lynch 1,067 354 124
4 Jefferies & Co. 947 311 203
5 Citi 874 262 116
6 Goldman Sachs 865 271 75
7 Wells Fargo Securities, Llc 863 301 130
8 Morgan Stanley 856 263 82
9 Raymond James 850 291 251
10 Barclays 788 232 97
11 RBC Capital Markets 773 265 101
12 Piper Sandler Companies 773 221 298
13 Credit Suisse 765 228 92
14 Cowen And Company 664 190 177
15 Suntrust Robinson Humphrey 647 268 128
16 Robert W. Baird & Co., Inc. 646 223 97
17 UBS 632 172 44
18 Evercore ISI 614 145 72
19 Morningstar, Inc. 568 115 16
20 Deutsche Bank Securities 557 147 58
Large Cap
31%
Mid Cap
34%
Small Cap
35%

Institutional Group – Equity Sales and Trading
24
Powerful Platform Spanning North America and Europe
Institutional Equity Sales Equity Trading
Extensive Distribution Network
Relationships with over 3,500 institutional accounts globally
Active daily market maker in over 4,000 stocks
Traded over 6.6 billion shares in 2019*
Complete coverage of North America and Europe for North American listed equities
Major liquidity provider to largest equity money management complexes
Multi-execution venues: high-touch, algorithms, program trading, and direct market access
Dedicated convertible sales, trading, and research desk
49 sales traders located in Baltimore, New York, Boston, San Francisco, Geneva, London, Toronto, Frankfurt, and Paris
32 position traders covering each major industry
19 specialized traders focused on: Option Trading, Convertible & ETF Trading
Profitable model with advantages of scale
116 person sales force
Experts in small and mid cap growth and value
Team-based sales model with 2 - 4 coverage sales people per account
Team leaders have an average of 20 years experience
Offices in all major institutional markets in North America & Europe
Accounts range from large mutual funds to small industry-focused investors
Managed over 700 non-deal roadshow days in 2019
Extensive experience with traditional and overnight corporate finance transactions
*Based on trading volumes for Stifel & KBW

Institutional Group – Fixed Income Capital Markets
25
Strong Fixed Income Brokerage Capabilities
Institutional Fixed Income Sales Institutional Fixed Income Trading
Platform & Products
Comprehensive platform
80+ traders with annual client trade volume more than $600 billion1
60+-person Fixed Income Research and Strategy Group
Widespread distribution
200+ institutional sales professionals covering more than 8,500 accounts
50+ institutional fixed income offices nationwide
Offices in Frankfurt, Geneva, London, Madrid, Milan, Munich, Paris and Zurich
Customer-driven
Focus on long-only money
managers and income
funds, depositories, and
hedge funds
Consistency of execution
Identification of relative
value through asset
class/security selection
US Government and Agency Securities
Mortgage-Backed Securities (MBS)
Whole Loans
Government-Guaranteed Loans
Asset-Backed Securities (ABS)
Commercial Mortgage-Backed Securities (CMBS)
Certificates of Deposit
Litigation Finance
High Yield and Distressed Credit
Loan Trading Group
Hybrid Securities
Emerging Markets
Structured Products
Investment Grade Credit
Municipal Sales and Trading and Public Finance
UK Sales and Trading
Unmatched distribution network for clients, issuers and debt investors
65+ credit sales specialists in U.S. and Europe
Actively trading with accounts in the U.S., Europe and Asia
Deep relationships across insurance, depositories and asset managers
Extensive network of retail and high net-worth clients
*All data as of 07/31/2020(1) Trailing 12-months, 07/31/2020

Institutional Group – Public Finance
26
Overview
Stifel has been growing its public finance practice both organically and through acquisitions over the past seven years including De La Rosa, Merchant Capital, Sterne Agee, City Securities, and George K. Baum.
Stifel has ranked in the top ten nationally for senior managed negotiated underwritings, by par value, for each of the past five years.
Stifel ranked #1 nationally for senior managed K-12, development, multifamily housing and taxable muni negotiated underwritings for 2019.
Specialty sectors:
Education (Public & Private K-12) Higher Education
Local Government/Municipal
Public-Private Partnerships/Development
Housing
Source: Thomson Reuters: SDC (True Economics to Book) Ranked by number of transactions.
Total of 36 Public Finance offices
Nearly 200 Public Finance professionals

27
Second Quarter 2020 Results
STIFEL FINANCIAL CORP. 2019 ANNUAL REPORT
“We can do much better with regard to diversity among our associates in particular. The business case for this effort is simple, as greater diversity – in all its forms – provides more opportunities to grow while reducing the risks of blinkered, narrow-minded thinking. This applies to greater diversity in our community just as in our revenue sources, business models, and geographic locations. More importantly, though, this is the only fair and just path forward. Look again at the cover of this annual report, because it expresses an ideal that we should strive for: There should be nothing about anyone’s birth or personal background that limits their ability to contribute and compete at our firm. The benefits of moving toward this ideal will be unquantifiable, in the best sense of the word, so I cannot stress enough that diversity doesn't need to earn its place in our ranks. We need to work, and keep working, to earn its benefits.”
- Ron Kruszewski, Chairman & CEO
Diversity
28

Institutional Group Generated Record Quarterly Revenue
Second Quarter Snapshot
29
2Q20 RESULTSmillions, except per share and ratios
HIGHLIGHTS
NET REVENUES
GAAP $895.8 NON-GAAP $895.8
NET EARNINGS
GAAP $103.0 NON-GAAP $115.3
EPS
GAAP $1.39 NON-GAAP $1.55
ANNUALIZED ROE
GAAP 12.6% NON-GAAP 14.1%
ANNUALIZED ROTCE
GAAP 20.7% NON-GAAP 23.2%
BOOK VALUE PER SHARE
TBV $30.16 BV $48.84
Continued to Attract High Quality Financial Advisors
Record Quarterly Fixed Income Brokerage Revenue
Capital Raising GeneratedSecond Highest Quarterly Revenue
Credit Quality at Stifel Bank Remains Strong
Strong Sequential Growth in Fee-Based Client Assets

Second Quarter Results
30
SECOND QUARTER HIGHLIGHTS
■ Second quarter Non-GAAP Net Revenue of $896 million, up 12% Y/Y.
■ Record Institutional Group Net Revenue of $398 million, up 47% Y/Y
■ Record Institutional Fixed Income Brokerage Revenue of $121 million, up 107% Y/Y
■ Institutional Equity Brokerage Revenue of $63 million, up 55% Y/Y
■ Investment Banking Revenue of $217 million, up 21% Y/Y
■ Pre-tax Pre-Provision Margin of 19.9%, up 380 bps sequentially
■ Fee-based Client Assets of $106 billion, up 13% sequentially
■ Tangible Book Value Per Share of $30.16, up 6% Y/Y
■ Non-GAAP annualized return on average tangible common shareholders’ equity was 23.2%
1 Before provision credit loss and additional comp. 2 Amount in excess of 59%
$801 $822
$944$913 $896
$0
$200
$400
$600
$800
$1,000
2Q19 3Q19 4Q19 1Q20 2Q20
mil
lio
ns
NET REVENUE
millions 2Q20 Y/Y ChangeSequential
ChangeYTD VS 2019
Global Wealth Management $506 -5% -13% $1,089 4%
Institutional 398 47% 20% 730 37%
Other -8 259% 273% -10 175%
Net revenues 896 12% -2% 1,809 15%
Compensation expense 529 14% -2% 1,067 16%
Operating expense 180 2% -8% 376 9%
Earnings before special items 1 187 17% 5% 366 19%
Provision for credit loss 19 716% 20% 35 661%
Additional compensation accrual2 9 - -72% 41 -
Pre-tax income 159 1% 24% 288 -5%
Taxes 39 -5% 23% 71 -11%
Net income 120 2% 24% 217 -3%
Preferred dividends 5 -8% 0% 10 27%
Net income available to common
shareholders115 4% 26% 207 -4%
Diluted EPS $1.55 10% 29% $2.74 0%
Compensation ratio 60.0% 210 bps -250 bps 61.3% 290 bps
Non-compensation ratio 22.2% -10 bps -120 bps 22.8% 60 bps
Pre-tax pre-provision margin 19.9% -20 bps 380 bps 17.9% -180 bps
Pre-tax operating margin 17.8% -200 bps 370 bps 15.9% -350 bps
Book value per share $48.84 9% 6%
Tangible book value per share $30.16 6% 11%
ROTCE 23.2% 60 bps 460 bps
FINANCIAL RESULTS
HIGHLIGHTS
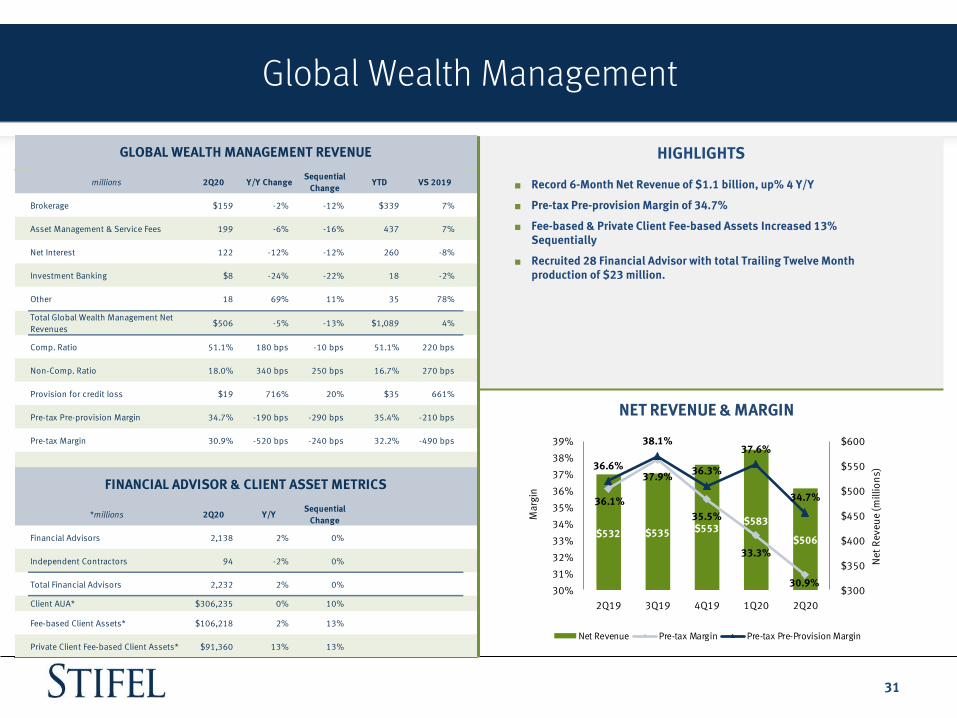
■ Record 6-Month Net Revenue of $1.1 billion, up% 4 Y/Y
■ Pre-tax Pre-provision Margin of 34.7%
■ Fee-based & Private Client Fee-based Assets Increased 13% Sequentially
■ Recruited 28 Financial Advisor with total Trailing Twelve Month production of $23 million.
Global Wealth Management
31
$532 $535 $553$583
$506
36.1%
37.9%
35.5%
33.3%
30.9%
36.6%
38.1%
36.3%
37.6%
34.7%
$300
$350
$400
$450
$500
$550
$600
30%
31%
32%
33%
34%
35%
36%
37%
38%
39%
2Q19 3Q19 4Q19 1Q20 2Q20
Net
Rev
eue
(mill
ion
s)
Ma
rgin
NET REVENUE & MARGIN
Net Revenue Pre-tax Margin Pre-tax Pre-Provision Margin
millions 2Q20 Y/Y ChangeSequential
ChangeYTD VS 2019
Brokerage $159 -2% -12% $339 7%
Asset Management & Service Fees 199 -6% -16% 437 7%
Net Interest 122 -12% -12% 260 -8%
Investment Banking $8 -24% -22% 18 -2%
Other 18 69% 11% 35 78%
Total Global Wealth Management Net
Revenues$506 -5% -13% $1,089 4%
Comp. Ratio 51.1% 180 bps -10 bps 51.1% 220 bps
Non-Comp. Ratio 18.0% 340 bps 250 bps 16.7% 270 bps
Provision for credit loss $19 716% 20% $35 661%
Pre-tax Pre-provision Margin 34.7% -190 bps -290 bps 35.4% -210 bps
Pre-tax Margin 30.9% -520 bps -240 bps 32.2% -490 bps
*millions 2Q20 Y/YSequential
Change
Financial Advisors 2,138 2% 0%
Independent Contractors 94 -2% 0%
Total Financial Advisors 2,232 2% 0%
Client AUA* $306,235 0% 10%
Fee-based Client Assets* $106,218 2% 13%
Private Client Fee-based Client Assets* $91,360 13% 13%
GLOBAL WEALTH MANAGEMENT REVENUE
FINANCIAL ADVISOR & CLIENT ASSET METRICS
Wealth Management Metrics
32
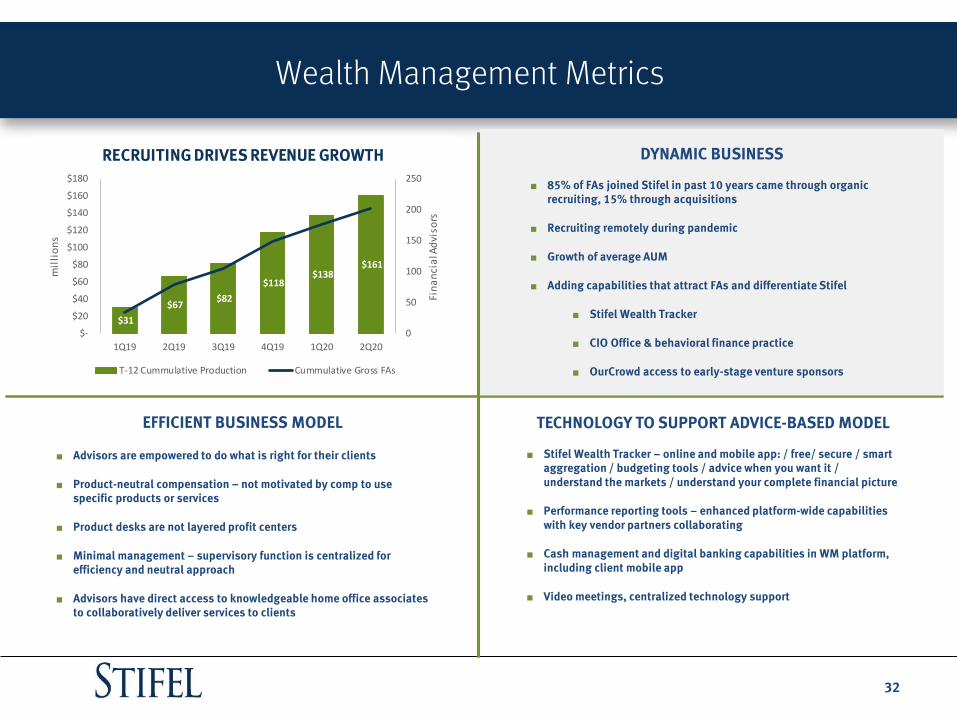
EFFICIENT BUSINESS MODEL
■ Advisors are empowered to do what is right for their clients
■ Product-neutral compensation – not motivated by comp to use specific products or services
■ Product desks are not layered profit centers
■ Minimal management – supervisory function is centralized for efficiency and neutral approach
■ Advisors have direct access to knowledgeable home office associates to collaboratively deliver services to clients
TECHNOLOGY TO SUPPORT ADVICE-BASED MODEL
■ Stifel Wealth Tracker – online and mobile app: / free/ secure / smart aggregation / budgeting tools / advice when you want it / understand the markets / understand your complete financial picture
■ Performance reporting tools – enhanced platform-wide capabilities with key vendor partners collaborating
■ Cash management and digital banking capabilities in WM platform, including client mobile app
■ Video meetings, centralized technology support
DYNAMIC BUSINESS
■ 85% of FAs joined Stifel in past 10 years came through organic recruiting, 15% through acquisitions
■ Recruiting remotely during pandemic
■ Growth of average AUM
■ Adding capabilities that attract FAs and differentiate Stifel
■ Stifel Wealth Tracker
■ CIO Office & behavioral finance practice
■ OurCrowd access to early-stage venture sponsors
$31
$67 $82
$118 $138
$161
0
50
100
150
200
250
$-
$20
$40
$60
$80
$100
$120
$140
$160
$180
1Q19 2Q19 3Q19 4Q19 1Q20 2Q20
Fin
an
cia
l Ad
viso
rs
mil
lio
ns
RECRUITING DRIVES REVENUE GROWTH
T-12 Cummulative Production Cummulative Gross FAs

Institutional Group
33
* Includes net interest, asset management and service fees, and other income
HIGHLIGHTS
■ Record Quarterly Revenue of $398 million, up 47% Y/Y
■ Record Institutional Brokerage of $184 million, up 86% Y/Y
■ Second Strongest Quarter for Capital Markets Revenue with $111 million, up 29% Y/Y
■ Record Pre-tax Contribution of $83 million, up 111% Y/Y
■ Pre-tax margin of 20.9%, up 640 bps Y/Y
■ Balanced business mix between equities and fixed income
millions 2Q20 Y/Y ChangeSequential
ChangeYTD VS 2019
Advisory $98 18% 29% $174 -7%
Capital Raising $111 29% 19% $204 51%
Brokerage $184 86% 8% $354 72%
Total Institutional Revenue* $398 47% 20% $730 37%
Comp. Ratio 60.6% 300 bps -140 bps 61.3% 200 bps
Non-Comp. Ratio 18.5% -940 bps -690 bps 21.6% -570 bps
Pre-tax Margin 20.9% 640 bps 830 bps 17.1% 370 bps
INSTITUTIONAL GROUP REVENUE
$271 $290
$392$332
$398
14.5%
16.8%
14.2%
12.6%
20.9%
$0
$150
$300
$450
0%
3%
6%
9%
12%
15%
18%
21%
24%
2Q19 3Q19 4Q19 1Q20 2Q20
Ne
t R
eve
nu
e (m
illi
on
s)
Pre
-ax
Ma
rgin
NET REVENUE AND MARGIN
Net Revenue Pre-tax Margin
millions 2Q20 Y/Y ChangeSequential
ChangeYTD VS 2019
Advisory Fees $98 18% 29% $174 -7%
Equities $126 26% -3% $256 54%
Fixed Income $169 96% 27% $301 73%
Total Institutional Revenue* $398 47% 20% $730 37%
INSTITUTIONAL REVENUE SOURCES
* Includes net interest, asset management and service fees, and other income

HIGHLIGHTS
■ Record Quarterly Brokerage Revenue Surpassed Prior Record by 21% (1Q20)
■ Second Strongest Quarterly Revenue in Capital Raising
■ Lead Managed 211 Negotiated Municipal Offerings
■ Brokerage Activity in July Down from 2Q20 but Above 2019 Levels
Institutional Equities & Fixed Income
34
HIGHLIGHTS
■ Record First Half Equities Revenue Surpassed Prior Record by 14% (2015)
■ Third Highest Capital Raising Quarter
■ Brokerage Activity in July Down from 2Q20 but Above 2019 Levels
$41 $41 $46 $70 $63
$59 $53$64
$60$63
$0
$20
$40
$60
$80
$100
$120
$140
2Q19 3Q19 4Q19 1Q20 2Q20
mill
ion
s
REVENUE
Brokerage Underwriting
$100 $94
$110
$126$130
$58 $61 $70 $100 $121
$27 $31$48
$33
$48
$0
$20
$40
$60
$80
$100
$120
$140
$160
$180
2Q19 3Q19 4Q19 1Q20 2Q20
mil
lio
ns
REVENUE
Brokerage Underwriting
$92
$118
$133
$85
$169
millions 2Q20 Y/Y ChangeSequential
ChangeYTD VS 2019
Brokerage $63 55% -10% $133 68%
Capital Raising $63 7% 5% $123 42%
Total Equities $126 26% -3% $256 54%
INSTITUTIONAL EQUITIES REVENUE
millions 2Q20 Y/Y ChangeSequential
ChangeYTD VS 2019
Brokerage $121 107% 21% $220 75%
Capital Raising $48 77% 46% $81 69%
Total Fixed Income $169 96% 27% $301 73%
INSTITUTIONAL FIXED INCOME REVENUE
Investment Banking Revenue
35
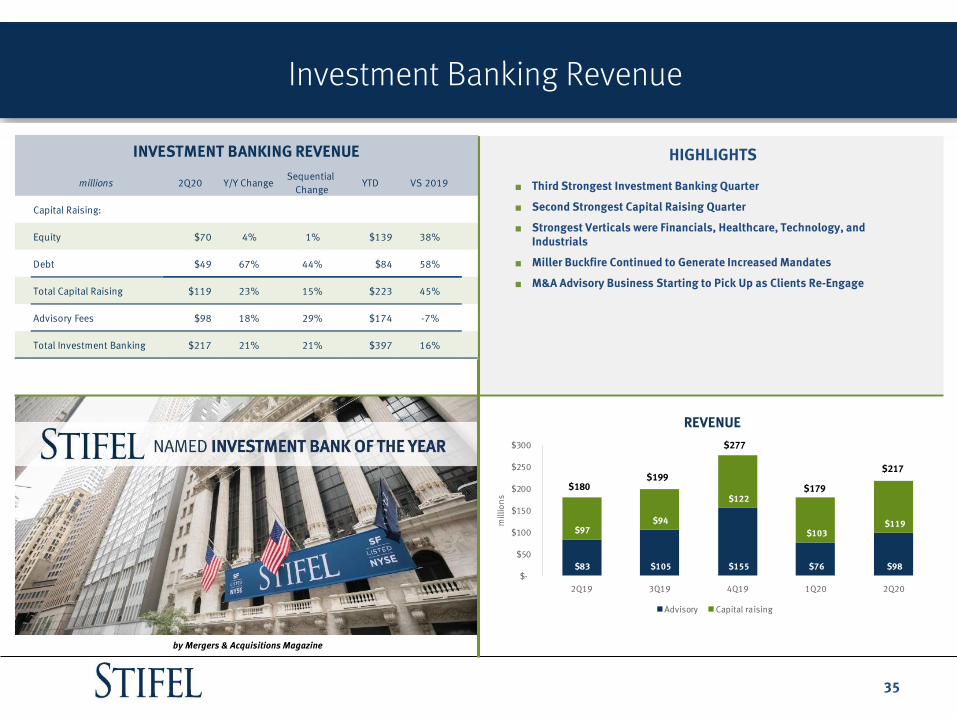
HIGHLIGHTS
■ Third Strongest Investment Banking Quarter
■ Second Strongest Capital Raising Quarter
■ Strongest Verticals were Financials, Healthcare, Technology, and Industrials
■ Miller Buckfire Continued to Generate Increased Mandates
■ M&A Advisory Business Starting to Pick Up as Clients Re-Engage
by Mergers & Acquisitions Magazine
millions 2Q20 Y/Y ChangeSequential
ChangeYTD VS 2019
Capital Raising:
Equity $70 4% 1% $139 38%
Debt $49 67% 44% $84 58%
Total Capital Raising $119 23% 15% $223 45%
Advisory Fees $98 18% 29% $174 -7%
Total Investment Banking $217 21% 21% $397 16%
INVESTMENT BANKING REVENUE
$83 $105 $155 $76 $98
$97 $94
$122
$103 $119
$-
$50
$100
$150
$200
$250
$300
2Q19 3Q19 4Q19 1Q20 2Q20
mill
ion
s
REVENUE
Advisory Capital raising
$180$199
$277
$179
$217
Net Interest Income
36
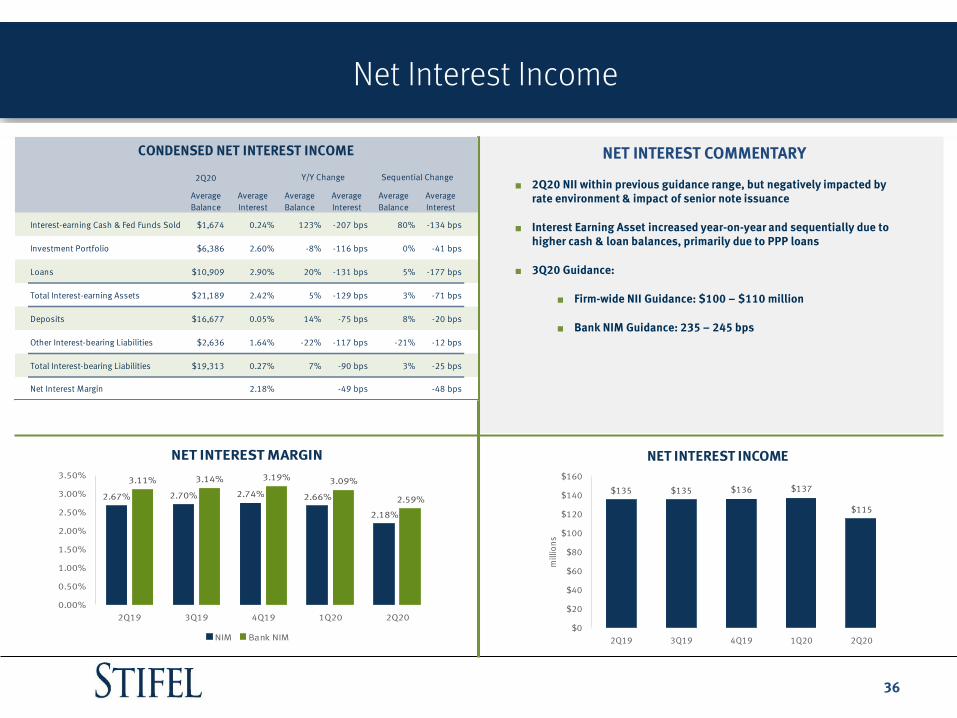
NET INTEREST COMMENTARY
■ 2Q20 NII within previous guidance range, but negatively impacted by rate environment & impact of senior note issuance
■ Interest Earning Asset increased year-on-year and sequentially due to higher cash & loan balances, primarily due to PPP loans
■ 3Q20 Guidance:
■ Firm-wide NII Guidance: $100 – $110 million
■ Bank NIM Guidance: 235 – 245 bps
2.67% 2.70% 2.74% 2.66%
2.18%
3.11% 3.14% 3.19% 3.09%
2.59%
0.00%
0.50%
1.00%
1.50%
2.00%
2.50%
3.00%
3.50%
2Q19 3Q19 4Q19 1Q20 2Q20
NET INTEREST MARGIN
NIM Bank NIM
$135 $135 $136 $137
$115
$0
$20
$40
$60
$80
$100
$120
$140
$160
2Q19 3Q19 4Q19 1Q20 2Q20
mill
ion
s
NET INTEREST INCOME
2Q20
Average
Balance
Average
Interest
Average
Balance
Average
Interest
Average
Balance
Average
Interest
Interest-earning Cash & Fed Funds Sold $1,674 0.24% 123% -207 bps 80% -134 bps
Investment Portfolio $6,386 2.60% -8% -116 bps 0% -41 bps
Loans $10,909 2.90% 20% -131 bps 5% -177 bps
Total Interest-earning Assets $21,189 2.42% 5% -129 bps 3% -71 bps
Deposits $16,677 0.05% 14% -75 bps 8% -20 bps
Other Interest-bearing Liabilities $2,636 1.64% -22% -117 bps -21% -12 bps
Total Interest-bearing Liabilities $19,313 0.27% 7% -90 bps 3% -25 bps
Net Interest Margin 2.18% -49 bps -48 bps
Sequential ChangeY/Y Change
CONDENSED NET INTEREST INCOME

HIGHLIGHTS
■ AAA /AA CLOs with a Portfolio Credit Enhancement of 28.6%
■ 83% of CLO Collateral is BB/B
■ Using Severely Adverse Default Expectations Results in Remaining Credit Enhancement of 17.1%
■ Limited Exposure to Hotel, Gaming, & Leisure and Energy Verticals
Investment Portfolio & CLOs
37
millions Total Portfolio % of Portfolio
CLO $4,396 70%
Agency MBS 752 12%
Corporate Bonds 537 9%
SBA 290 5%
Student Loan ARS 156 2%
CMBS 102 2%
Others 13 0%
Total Portfolio $6,246 100%
INVESTMENT PORTFOLIO
Healthcare & Pharmaceuticals10.5%
High Tech Industries9.9%
Services: Business8.2%
Banking, Finance, Insurance & Real Estate7.5%
Telecommunications5.6%
Media: Broadcasting & Subscription5.1%
Hotel, Gaming, Leisure4.8%
Chemicals, Plastics & Rubber3.6%
Services: Consumer3.6%
Beverage, Food & Tobacco3.4%
Construction & Building3.4%
Capital Equipment3.2%
CLO BY MAJOR SECTOR
28.6%23.6%
17.1%
0%
20%
40%
60%
80%
100%
Current Adverse Severely Adverse
CLO CREDIT ENHANCEMENT

HIGHLIGHTS
■ Lending facilities for Stifel WM and Institutional clients, as well as banking relationships outside of Stifel
■ Over 50% of the loan portfolio is to Wealth Management clients
■ Diversity of geographic, sector, business phase, and loan type enhances stability in various markets; low NPLs historically
■ Limited exposure to the Energy Industry as well as to the Hotel, Leisure, Entertainment & Restaurant Industry which on a combined basis is less than 3% of our SBI loans.
Stifel Bancorp Inc. Loan Portfolio
38
1 Total excludes $475 million of loans classified as held for sale
2Q20% of Total
Portfolio
Residential Real Estate $3,711 35%
Securities Based Lending1,717 16%
Home Equity lines of Credit63 1%
Other loans 56 1%
Total Consumer $5,547 52%
Commercial Real Estate407 4%
Commercial4,149 39%
Construction and land 472 4%
Total Commercial $5,028 48%
Total Loan Portfolio $10,575 100%
Unfunded Commitments 1,774
Total $12,349
millions
LOAN PORTFOLIO
Financials $763 7.22%
Industrials $688 6.51%
Consumer Discretionary $674 6.38%
Information Technology $458 4.33%
PPP $344 3.25%
Hotel, Leisure, Entertainment, Restaurants $294 2.78%
Materials $267 2.52%
REITs $226 2.14%
Consumer Staples $193 1.83%
Health Care $156 1.48%
Telecom Services $74 0.70%
Energy, Utilities $12 0.11%
Total $4,149 39.23%
COMMERCIAL PORTFOLIO BY SECTOR

CECL Impact
39
ASSUMPTIONS
■ Moody’s forecast:
■ 40% Baseline (sudden sharp recession)
■ 30% Downside (double dip recession)
■ 30% Upside (near term growth)
■ Forecast update for most recent scenarios
■ Includes significant economic shock in 3Q and 4Q, followed by slow, sustained recovery
■ Reserve build driven by COVID-19 recessionary assumptions
CECL 2Q20 FACTORS
- all figures are in millions
- ALL as of 12/31/2019 includes allowance for loans and off-balance sheet credit exposures
PortfolioCECL Reserve
Day 1
CECL Reserve
% Day 1
Quarterly
Reserve
Build
CECL Reserve
3/31/2020
CECL Reserve
%
Q/Q
Change
Portfolio
Activity
Economic
Factors
Quarterly
Reserve
Build
CECL
Reserve
6/30/2020
CECL
Reserve %
Q/Q
Change
Consumer 22,191 0.40% 1,550 23,723 0.43% 0.02% 1,139 1,732 2,871 26,596 0.48% 0.05%
Commercial 61,652 1.45% 17,429 79,079 1.71% 0.26% 1,600 8,696 10,296 89,225 1.90% 0.20%
PPP - 0.00% - - 0.00% 0.00% - - - - 0.00% 0.00%
Unfunded / Other reserves 23,659 1.53% (2,776) 20,883 1.40% -0.14% 3,185 2,724 5,909 26,792 1.45% 0.06%
Total 107,502 1.10% 16,203 123,685 1.22% 0.12% 5,924 13,152 19,076 142,613 1.35% 0.13%
Totals Excluding PPP 107,502 1.10% 16,203 123,685 1.22% 0.12% 19,076 142,613 1.39% 0.18%
Allowance for Credit LossesDAY 1 1Q'20 2Q'20
Portfolio Changes
Economic Factors$5.9
$1.9
ALL - 12.31.2019 ACL -3.31.2020 ACL -6.30.2020
$123.7
$10.4
$97.1
- CECL Day 1
transition
adjustment
- Includes ACL for
loan and leases
and off-balance
sheet credit
exposures
Portfolio Changes
$14.3
- Changes to
macro-economic
variables
- Changes to
macro-economic
variables
Economic Factors
- New loans, less
amortization, and
credit
performance
- New loans, less
amortization, and
credit
performance
$142.6
$13.2
Expenses
40
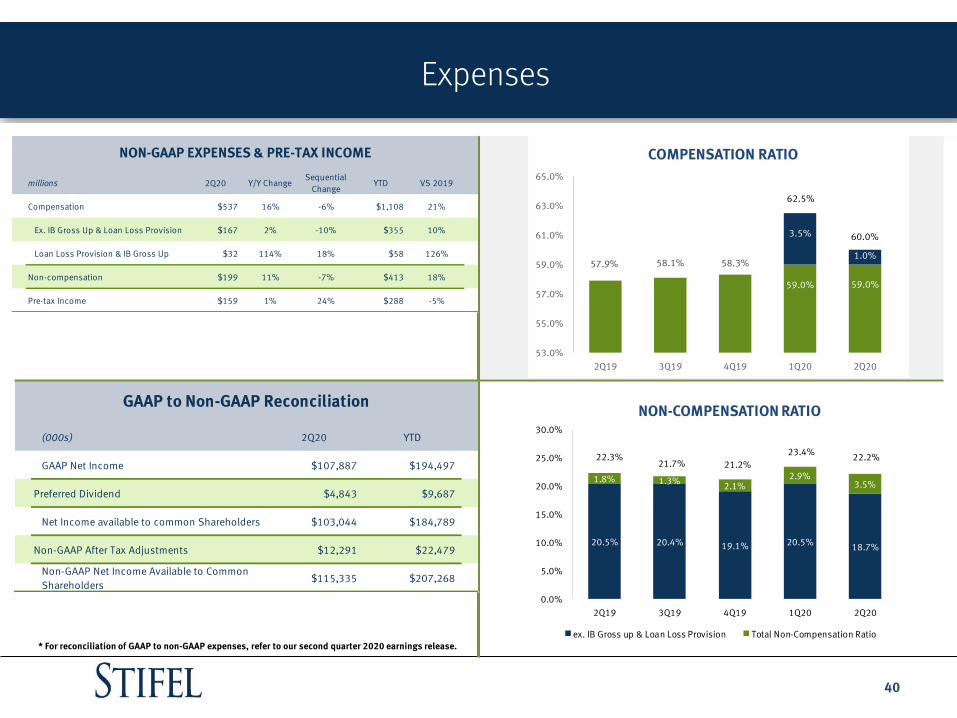
* For reconciliation of GAAP to non-GAAP expenses, refer to our second quarter 2020 earnings release.
20.5% 20.4% 19.1% 20.5%18.7%
1.8% 1.3%2.1%
2.9%3.5%
0.0%
5.0%
10.0%
15.0%
20.0%
25.0%
30.0%
2Q19 3Q19 4Q19 1Q20 2Q20
NON-COMPENSATION RATIO
ex. IB Gross up & Loan Loss Provision Total Non-Compensation Ratio
22.3%21.7% 21.2%
23.4%22.2%
(000s) 2Q20 YTD
GAAP Net Income $107,887 $194,497
Preferred Dividend $4,843 $9,687
Net Income available to common Shareholders $103,044 $184,789
Non-GAAP After Tax Adjustments $12,291 $22,479
Non-GAAP Net Income Available to Common
Shareholders$115,335 $207,268
GAAP to Non-GAAP Reconciliation
57.9% 58.1% 58.3%
59.0% 59.0%
3.5%
1.0%
53.0%
55.0%
57.0%
59.0%
61.0%
63.0%
65.0%
2Q19 3Q19 4Q19 1Q20 2Q20
COMPENSATION RATIO
62.5%
60.0%
millions 2Q20 Y/Y ChangeSequential
ChangeYTD VS 2019
Compensation $537 16% -6% $1,108 21%
Ex. IB Gross Up & Loan Loss Provision $167 2% -10% $355 10%
Loan Loss Provision & IB Gross Up $32 114% 18% $58 126%
Non-compensation $199 11% -7% $413 18%
Pre-tax Income $159 1% 24% $288 -5%
NON-GAAP EXPENSES & PRE-TAX INCOME
Capital & Liquidity
41
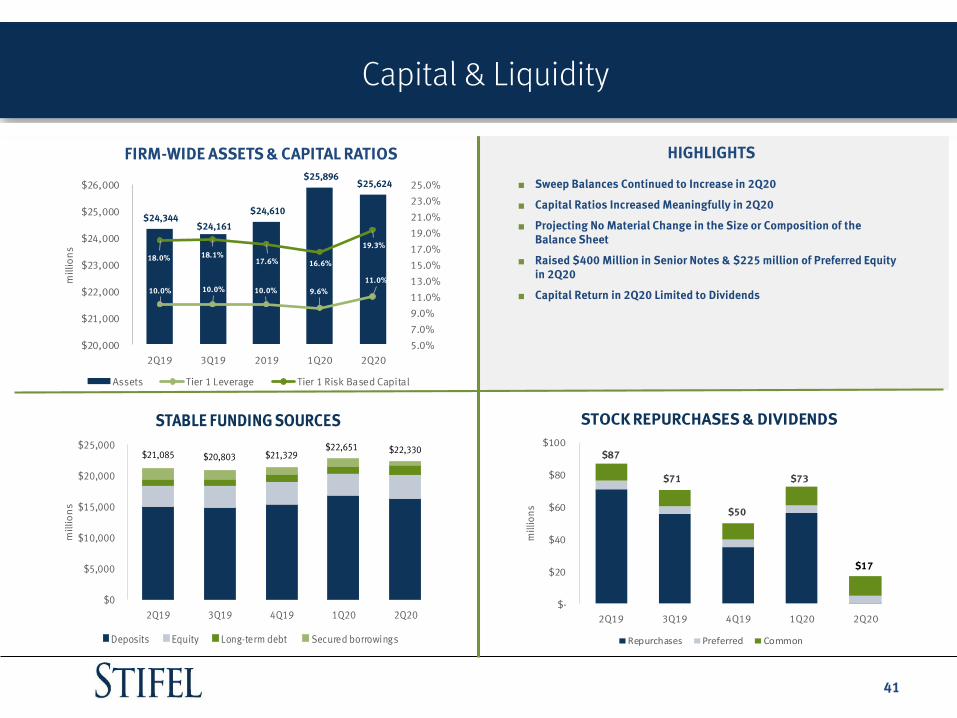
HIGHLIGHTS
■ Sweep Balances Continued to Increase in 2Q20
■ Capital Ratios Increased Meaningfully in 2Q20
■ Projecting No Material Change in the Size or Composition of the Balance Sheet
■ Raised $400 Million in Senior Notes & $225 million of Preferred Equity in 2Q20
■ Capital Return in 2Q20 Limited to Dividends
$24,344 $24,161
$24,610
$25,896 $25,624
10.0% 10.0% 10.0% 9.6%
11.0%
18.0% 18.1%17.6% 16.6%
19.3%
5.0%
7.0%
9.0%
11.0%
13.0%
15.0%
17.0%
19.0%
21.0%
23.0%
25.0%
$20,000
$21,000
$22,000
$23,000
$24,000
$25,000
$26,000
2Q19 3Q19 2019 1Q20 2Q20
mil
lio
ns
FIRM-WIDE ASSETS & CAPITAL RATIOS
Assets Tier 1 Leverage Tier 1 Risk Based Capital
$87
$71
$50
$73
$-
$20
$40
$60
$80
$100
2Q19 3Q19 4Q19 1Q20 2Q20
mill
ion
s
STOCK REPURCHASES & DIVIDENDS
Repurchases Preferred Common
$17
$0
$5,000
$10,000
$15,000
$20,000
$25,000
2Q19 3Q19 4Q19 1Q20 2Q20
mil
lio
ns
STABLE FUNDING SOURCES
Deposits Equity Long-term debt Secured borrowings
$21,085 $20,803 $21,329$22,651 $22,330