Investor Presentation May 2014
29
May 2014 These materials may not be used or relied upon for any purpose other than as specifically contemplated by a written agreement with Credit Suisse AG or its Affiliates (hereafter “Credit Suisse”). UBL | Investor Relations Investor Presentation May 2014
-
Upload
khangminh22 -
Category
Documents
-
view
0 -
download
0
Transcript of Investor Presentation May 2014

May 2014
These materials may not be used or relied upon for any purpose other than as specifically contemplated by a written agreement with Credit Suisse AG or its Affiliates (hereafter “Credit Suisse”).
UBL | Investor Relations
Investor PresentationMay 2014

2nd largest branch network in Pakistanwith 1,281 branches
Pioneer of Branchless Banking in Pakistan. More than 14,500 agents
in 800 cities and towns across Pakistan
Over 50 years of successful operational history
Long term rating of AA+ and short term rating of A‐1+ by JCR‐
VIS
Subsidiaries and affiliates include Asset Management and Insurance
services, majority stake in Khushhali Bank, a leading
microfinance bank in Pakistan
Largest Pakistan based Bank in the Middle East, branches in UAE, Qatar, Yemen, Bahrain and USA. International outreach extended through fully licensed banks in UK,
Switzerland and Tanzania
One of the most profitable banks in Pakistan, ROE of
21% in 2013
Overview of the UBL Group – one of the largest and most profitable Banks in Pakistan
Highly experienced senior management team;
Succession of departing CEO by an internal candidate is a testament of UBL’s deep leadership bench strength
1
Source: Company information.

14 1418
2428 29
2008 2009 2010 2011 2012 2013
Financial highlights
Strong PBT performance Return on equity
Our shareholders – March 31, 2014 Consolidated financials – 2013
Source: Company information.Note: Equity and profit after tax include amounts attributable to non-controlling interests.
US$ amount based on USDPKR rate of 98.5297 as of March 31, 2014.(1) Based on March 2014 PAT – annualized performance.
(PKR in billions)
19.7%18.0% 17.7%
20.7%
23.4%
21.3%22.6%
2008 2009 2010 2011 2012 2013 2014(1)
Bestway Group61.4%GoP
19.8%
Others18.8% PKR mn US$ mn
% Growth over Dec'12 in US$
Total assets 1,083,633 10,998 12.6%
Total deposits 889,526 9,028 18.2%
Net advances 415,283 4,215 7.6%
Equity 111,273 1,129 9.2%
Pre tax profit 28,965 294 2.3%
Profit after tax 19,371 200 2.5%
Consistent growth in earnings led by 50 years of operational history
2

Highly experienced senior management team
3
Source: Company information.(1) Years with UBL / years in banking.
UBL’s management team comprises highly experienced individuals with an average of more than 20 years of sector experience and proven abilities to grow the business
Atif Riaz BokhariPresident & CEO (until 31 May)10 / 30(1)
Aameer KarachiwallaCOO15 / 22(1)
Rayomond KotwalCFO4 / 17(1)
Wajahat HusainInternational OperationsPresident & CEO (from 1 June) 9 / 29(1)
On 18 April 2014, Mr. Atif R Bokhari resigned from his position of President & CEO. He will continue as CEO until 31 May 2014 On 8 May 2014, Mr. Wajahat Husain was appointed as the new President & CEO of UBL effective 1 June 2014
− Mr. Wajahat Husain, currently Head of International Operations, has an illustrious banking career spanning three decades in Pakistan and abroad. He has served in various institutions at Sr. Mgmt. positions, including Union National Bank and Mashreq Bank in the UAE
− Under his international stewardship over the last few years, UBL made its first foray into Africa, established a footprint in China and successfully expanded and re‐strategised the business in the Middle East
Succession of departing CEO by an internal candidate is a testament of UBL’s deep leadership bench strength
Ali Sameer FarooquiCorporate Banking & Cash Management13 / 25(1)
Ali HasnainRetail Bank4 / 30(1)
Mohammad Hanif AkhaiTreasury & Capital Markets5 / 35(1)
Saeed IgbalInvestment Banking11 / 18(1)
Muhammad EjazuddinAudit & Inspection15 / 38(1)
Aqeel Ahmed NasirLegal & Secretaries8 / 8(1)
Atif RasheedCompliance & Control8 / 16(1)
Zulfiqar AlaviRisk & Credit Policy8 / 25(1)
Javed SyedStrategic Business Planning7 / 7(1)
Jamal NasirHuman Resources4 / 16(1)

Our core business segments
Premier retail bank – The cornerstone of our banking operations
Deposit base with deep penetration across banking flows within the economy Product offerings target varied customer segments with continuous innovation Consumer loans – Full product suite in the market offered, strong retail risk management Market leader in domestic home remittance businessCorporate and investment banking – Diversified client coverage, complete range of products
Business partner to top tier client base, client service model focuses on customer needs Risk appetite supported by strong balance sheet and capital base, diversification across sectors within loan book Market leader in cash management services Leading market position with experienced and established investment banking team Well established deal execution and distribution experience across all sectors
UBL Omni is the pioneer and market leader in branchless banking in Pakistan First commercial bank in Pakistan to offer branchless banking services via its proprietary technology, UBL “Omni” Product and services ideal for wide outreach, covering FMCGs, schools, collections UBL Omni platform achieved payment application – Data security standards (PA DSS) certification in July 2013 Close partnership with government and donor agencies and dominant provider and channel for G2P flows
Treasury and capital markets – Diversified portfolio with strong market risk management
Active player in the global and domestic fixed income securities market, primary dealer with development role within local debt market Strong sales and distribution setup for foreign exchange, derivatives and fixed income product segments One of the first authorized derivatives dealers appointed by State Bank of Pakistan in the local derivative market Focus remains on prudent balance sheet management along with enhancing yields through capital markets
Within our 5 core business segments we are serving over 4 million customers across 4 continents
4
International business adds significant strategic advantage – One of the highest ROE and earnings by any Pakistan based bank
Source: Company information.
We are one of the only 3 Banks in the UAE to be awarded the prestigious ISO 9001:2008 Quality Management System certification Focused business development has revitalized our UK and Switzerland subsidiaries, enabling synergies within the Group Expanding our global presence to Africa, a fully owned banking subsidiary in Tanzania has been set up in 2012 Full banking service operations with 21% contribution to bottom line in 2013, 39% earnings growth over 2012

UBL innovation and awards
5
UBL “Firsts” – Initiatives to stay ahead of the market Market recognition and awards
First Commercial Bank in Pakistan to launch Branchless Banking (UBL OMNI)
First Bank in the world to issue VISA Debit Cards for G2P assistance to affectees
First Bank to provide Instantaneous ATM/Debit cards to branchless banking customers at the time of account opening (UBL Omni)
First Pakistani Bank to be granted status of Authorized Derivative Dealer (ADD) in Pakistan and First institution from Pakistan and third in South Asia to be accredited with Primary Membership of International Swaps and Derivatives Association
First Bank in Pakistan to offer Prepaid VISA Debit Card
First Bank in Pakistan to offer Verified by Visa Service
First Bank in Pakistan where customer’s inward remittances are deposited automatically on an ATM and VISA enabled debit card(UBL Tezraftaar Pardes Card)
2012 & 2013 Bank of the Year in Pakistan Award, awarded by The Banker Magazine, an affiliate of the Financial Times, UK
Recognized globally in 2013 as one of the 14 “Sprinters” by the GSMA’s Mobile Money for the Unbanked (MMU) program, the only Bank out of the 150 worldwide branchless implementations surveyed
GSMA Global Mobile Award 2012 for “Best Use of Mobile in Emergency or Humanitarian Situations” and Financial Insights Innovation Award for “Innovation in Cash Disbursements (G2P)”
“Pakistani Deal of the Year”, 2012, award from Acquisition International Magazine for the acquisition of majority stake in Khushhali Bank Limited
ASIAMONEY Best Domestic Bank Award for 2011 and 2012
Top 25 Companies award by the Karachi Stock Exchange for 2012
Awarded by CFA Pakistan Society for the “Best Investor Relations” function in 2013
Source: Company information.

Looking ahead..…
6
Continue to invest in domestic network to maintain pace with competitors1
Leverage international network (branches and subsidiaries) as increasing contributor to bottom line2
Continue to invest in R&D to maintain technology / innovation edge3
Service delivery will remain key differentiator, build delivery standards4
Serving a developing economy as a strategic business partner to economic change
Increasing emphasis on service delivery through staff training and driving improvements that enhance the customer experience Build on our multiple service channels that include ATMs, debit and credit cards, IVR banking, a 24x7 state of the art call center, agent banking
mobile banking, internet banking and social media
Building on wholesale banking model across International including subsidiaries ‐maximizing cross sell amongst group entities Expand business relationships to new markets through FI entry to understand dynamics and opportunities Focus on SAARC, ASEAN and East Africa via subsidiaries / branches and representative offices Increased focus on energizing Tezraftaar business and transactional banking services
160 branches opened in the last three years, including within the fast growing Islamic banking segment Optimizing the expanded network to accelerate low cost deposit growth remains a priority Future expansion would be of lower scale to maintain market share Profitable Priority Banking initiative with 14 lounges in 10 cities Agent network expanded to 14,500+, covering 800+ cities / towns
Technology platforms managed and operated in‐house – agility to respond to market developments R&D within service and delivery model continues with the launch of biometric and solar ATMs In line with the Bank’s “innovation” agenda, we aim to remain on the cutting edge of designing products and roll out new business models Reinvent Omni’s business model to ensure it keeps developing and evolving to remain relevant and continues to maintain its international
recognition UBL launched its internet acquiring platform in April 2013, being the only Bank offering this payment gateway with 3D security
Source: Company information.

PAKISTAN BRANCHES1,281OVERSEAS BRANCHES
18ASSOCIATED COMPANIES
3
SUBSIDIARIES4
Our international outreach – serving in 4 continents under the single “UBL” brand
Asset mix by region | FY2013Pakistan Operation 69.0%
International operations 31.0%Middle East 23.4%Europe 7.0%United States of America 0.3%Africa 0.2%Karachi Export Processing Zone 0.1%
7
Source: Company information.

Growth momentum within our distribution network and client acquisition in the last couple of yearsNo. of deposit accounts (million)
UBL offers a wide range of channels to address the needs of a diverse customer base Our strategy also includes younger customers who can stay with the bank The channel strategy evolves to remain relevant to ever changing customer needs
No. of branches – domestic
No. of Omni agents
1,218
1,278 1,283 1,281
Dec '11 Dec '12 Dec '13 Mar '14
3.28 3.31 3.81 3.95
Dec '11 Dec '12 Dec '13 Mar '14
6,400
10,00013,200 14,500
Dec '11 Dec '12 Dec '13 Mar '14
No. of ATMs
476578
718 725
Dec '11 Dec '12 Dec '13 Mar '14
8
Source: Company information.

UBL’s share outperforms Pakistan bank peers based on strong growthUBL share price performance vs. peers(1) ‐ growth Consolidated book value per share
Dividend payout as a % of par value of shares UBL’s EPS has grown by 75% in the last 3 years
49
6775
86101
111 110
4960 61
7082
91 90
2008 2009 2010 2011 2012 2013 Mar'14Total equity – cons. (PKR bn) BV per share – cons. (PKR)
7.518.56 9.01
12.13
15.65 15.7518.25
4.926.83 7.57
4.32 5.35
8.42 8.87
Dec '08 Dec '09 Dec '10 Dec '11 Dec '12 Dec '13 Mar '14EPS P/E
25% 25%50%
75% 85%100%
25%
10% 10%
46.6%40.9%
55.5%61.8%
54.3%
63.5%55.6%
2008 2009 2010 2011 2012 2013 Mar '14
Cash Stock Dividend Payout Ratio as a % of PAT
Source: FactSet, company information.Note: Book values include amount attributable to non-controlling interests.(1) Market prices as of 9 May 2014. Share prices indexed to UBL share price on 31 December 2012.(2) Interim dividend declared until March 2014.(3) March 2014 EPS annualized for PE calculation.
(2) (3)
1‐Jan‐13 1‐Apr‐13 1‐Jul‐13 1‐Oct‐13 1‐Jan‐14 1‐Apr‐1460
80
100
120
140
160
180
200
UBL HBL NBP MCBABL Pakistan bank sector
+106.1%+86.9%
+35.1%
+63.6%
+107.2%
+59.1%
9

Appendix – Additional materials on UBL
10

492 504568
635753
890 905
2008 2009 2010 2011 2012 2013 Mar '14
Deposit led balance sheet growth, strong capital for expansion
Deepening our deposit base Managing loan book (net advances)
Total assets Capital
(PKR in billions)
378362
342 341
386415 406
2008 2009 2010 2011 2012 2013 Mar '14
(PKR in billions)
(PKR in billions) (PKR in billions)
621 640726
808
9621,084 1,101
2008 2009 2010 2011 2012 2013 Mar '14
55 62 69 74 7525 25 31 28 26527 589
675772 770
2010 2011 2012 2013 Mar '14
Tier 1 Capital Tier 2 Capital Total RWA
Tier 1 CAR 10.4% 10.6% 10.2% 9.6% 9.7%Total CAR 15.0% 14.9% 14.9% 13.3% 13.1%
11
Source: Company information.

Retail Banking
One of the largest banks in Pakistan focusing on mass segments through a differentiated service and multi‐product offering
Portfolio Products and distribution
Gen
eral Banking
Branch BankingPriority Ba
nking
Consumer Finance
Auto, M
ortgage, Cashline
Cred
it Ca
rd, BTF
Customers
Channels Branches Signature Lounges
OmniAgents
ATMs, Call Centre, IVR, Social Media.
Internet Banking
Products
Liabilities
Wealth Management
Bancassurance
Cash Management
Unsecured Loans
Secured Loans
Deposits
HNWI
FCY deposits
Term Deposits
Transactional Accounts
Current Deposits
12
Source: Company information.

0.0%
1.0%
2.0%
3.0%
4.0%
5.0%
6.0%
Q1'11 Q2'11 Q3'11 Q4'11 Q1'12 Q2'12 Q3'12 Q4'12 Q1'13 Q2'13 Q3'13 Q4'13 Q1'14
Domestic International Bank
Strategy is to grow core domestic deposits while maintaining low cost of fundsCost of deposits Deposits – standalone bank
Quarterly deposit trend – average deposits Mobilization with focus on key segments
Focus remains on Core vs. Opportunistic deposits to achieve stable balance sheet growth. Core deposits have increased by 4% during Q1’14, ahead of market growth of 0.6%
Despite continuous regulatory changes which have increased the savings rate and downward inelastic deposit cost, UBL has the lowest cost of deposits vs. peers
Product innovation and service improvements remain key for both acquisition and retention
UBL International’s deposit growth is largely liquidity driven in order to fund advances
Bank Rs Bn PE COF % PE COF % PE COF % PE COF %
Domestic deposits 495 4.8% 540 4.6% 619 4.1% 651 4.5%
International deposits 118 2.3% 158 3.4% 209 3.1% 196 2.6%
Total Bank 613 4.3% 698 4.3% 828 3.9% 847 4.1%
International(US$ in millions)
1,312 2.3% 1,631 3.4% 1,986 3.1% 1,989 2.6%
Domestic CASA 80% 83% 83% 83%
Dec '11 Dec '12 Dec '13 Mar '14
0
100
200
300
400
500
600
700
800
900
Q1'11 Q2'11 Q3'11 Q4'11 Q1'12 Q2'12 Q3'12 Q4'12 Q1'13 Q2'13 Q3'13 Q4'13 Q1'14
Low cost deposits Total deposits
(PKR in billions)
13
4.5%4.1%
2.6%
510
837
Source: Company information.

Retail bank product suite
We provide a complete set of banking solutions where “You Come First”
14
Source: Company information.

UBL Omni – the success story continues . . .
Winner of GSMA International Mobile Award 2012 for “Best Use of Mobile in Humanitarian Initiatives” and recipient of Financial Insights Innovation Award 2012, Singapore. Nominated again for GSMA Mobile Award 2013
GSMA benchmarking survey of MMU programs has ranked UBL Omni at or near the top of most success indicators and well above global and regional averages
Recognized globally as one of the 14 “Sprinters” by the GSMA’s Mobile Money for the Unbanked (MMU) program, the only Bank out of the 150 worldwide branchless implementation surveyed
Menu of services includes: account opening, instant debit card issuance at agent location, cash deposit, cash withdrawal, cash transfer, bill payments, purchase of airtime vouchers etc.
UBL Omni was also recognized during the World Marketing Summit Malaysia 2013 for focus on attaining the UN’s 8 Millennium Development Goals (one of which is Financial Inclusion)
UBL Omni platform achieved Payment Application – Data Security Standards (PA DSS) Certification in July 2013 which is the global security standard for the card payment industry
UBL Omni’s proprietary platform remains a key competitive advantage. Omni has also been implemented in the UK for remittances to Pakistan
UBL OmniCommercial Launch: April 2010 No of Accounts: 1.44mn+ No of Agents: 14,500+ No of cities/towns: 800+ No of transactions: 122mn+ Transaction volume: PKR 472bn+ Grant Received: US$6.9mn from Bill & Melinda Gates Foundation
Benazir income support programPurpose: Cash subsidy for the poor Current beneficiaries: 1.2mn+ Funds disbursed: PKR26bn+
Watan / Pakistan cardsPurpose: G2P aid for the flood affecteesWatan cards issued: 1.4mn Funds disbursed: PKR59bn Grant received: US$1.5mn from Bill & Melinda Gates Foundation
World Food Program & World Health OrganizationPurpose: Cash in lieu of food, Payments to polio workers Beneficiaries: 145,000+ Funds disbursed: PKR1.77bn
Cash management servicesPurpose: Microfinance, FMCG clients, Schools, CollectionsNo of transactions: 3.8mn+ Transaction volume: PKR14.2bn+
15
Source: Company information.

Agribusiness9%
Airlines2%
Automobile &trans. equip.
2%Cement1%Chemical
andpharmaceuticals
2%
Contractor / constructor
6%
Fertilizerdealers1.2%
Financials3%
Food4%
Individuals9%
Others20%
Prod. &transmission energy
13%
Sugar2%
Telecom1%
Textile14%
Trading4%
Subsidiariesadvances
6%
Asset strategy remains conservative with growth targeted in high quality names
Portfolio diversification
The strategy is to have a diversified spectrum of assets across multiple customer segments and sectors, and grow advances selectively
Target high quality credit
In the Corporate sector, we target blue‐chip names, as well as customers who have demonstrated a steady track record
Serving the mid market
SME and Commercial markets are served through Commercial Centers to cater to the specific needs of these customers. They are staffed with RMs who have the requisite credit / operational skills to manage this segment
Restricted consumer asset acquisition
Although consumer/retail assets have scaled down in the past few years, UBL continues to service this segment by offering products on a relationship basis.
Credit concentration by sector – as at March ‘14
Consolidated Portfolio size: PKR 452 billion
16
Source: Company information.

Advances by business
Our loan book is mainly driven by the corporate bank
(PKR in billions) Dec '12 Dec '13 Mar '14
% growth
Dec '12
% growth
Dec '13
% growth
Mar '14
Corporate bank 173.9 182.1 197.2 12.1% 4.7% 8.3%
Commercial 18.2 19.4 16.3 (3.2%) 6.5% (16.1%)
Commodity advances 48.7 39.9 25.0 6.6% (18.1%) (37.5%)
Consumer 7.9 7.7 8.0 (17.1%) (2.2%) 2.8%
Others 12.1 12.4 10.0 (1.1%) 3.1% (19.5%)
Total domestic 260.8 261.6 256.4 8.0% 0.3% (2.0%)
International 103.5 129.2 120.7 23.3% 24.9% (6.6%)
Bank 364.3 390.8 377.1 12.0% 7.3% (3.5%)
Subsidiaries 21.5 24.5 28.7 36.0% 14.0% 17.2%
Bank – consolidated 385.8 415.3 405.7 13.1% 7.6% (2.3%)
International US$ in millions – bank 1,068.4 1,229.7 1,227.1 14.5% 15.1% (0.2%)
Net advances
17
Source: Company information.

Our focus remains on improving asset quality along with being well reserved
Actively manage weaker names through timely restructuring/rework
Focus on well performing restructured names to proceed towards declassification
Aggressively pursue recovery pool for recoveries and settlements
Asset quality has been maintained at Dec’13 levels (11.9%) despite reduction in gross advances
Gross NPLs have reduced by a further PKR1.8 Bn (3%) during the first 3 months of 2014. This is in addition to a reduction of Rs3.7Bn (6.4%) witnessed in 2013, with improvement in both Domestic and International
Loan book remains well reserved with coverage improving from 81% in 2013 to 83% in Mar’14 on consolidated basis
Our strategy against delinquency
Provisions and loan losses down by 59% in 2013
Steady decline in NPLs with improvement in coverage
12.9% 13.4% 13.6% 11.9% 11.8%
69.0%78.1% 74.6%
81.1% 83.3%
Dec '10 Dec '11 Dec '12 Dec '13 Mar '14
NPL ratio Coverage ratio
Asset quality Dec '10 Dec '11 Dec '12 Dec '13 Mar '14 Dec '10 Dec '11 Dec '12 Dec '13 Mar '14Domestic ex‐sovereign
43.0 44.5 45.2 41.5 40.9 70.3% 79.9% 83.7% 91.1% 91.7%
Sovereign – – 2.7 1.4 1.1 ‐ ‐ ‐ ‐ ‐Total Domestic 43.0 44.5 47.9 42.9 42.0 70.3% 79.9% 79.0% 88.1% 89.4%International 5.6 6.6 9.4 9.8 9.0 59.5% 66.1% 59.6% 64.9% 69.0%Standalone Bank 48.6 51.1 57.3 52.6 51.0 69.0% 78.2% 75.8% 83.8% 85.8%Subsidiaries 0.0 0.0 1.1 2.2 2.1 49.0% 61.6% 12.1% 18.2% 21.6%Consolidated Bank 48.6 51.1 58.5 54.8 53.0 69.0% 78.1% 74.6% 81.1% 83.3%
NPLs Coverage(PKR in billions)
18
Source: Company information.

Appendix – Key financial data
19

Financial ratios – consolidated
Q1'14 FY'13 FY'12 FY'11
Advances / Deposits 47.9% 50.0% 55.0% 57.5%
Asset Quality excl. Sovereign NPLs 11.5% 11.6% 12.9% 13.4%
Coverage 83.3% 81.1% 74.6% 78.1%
NCL Ratio 0.3% 0.4% 1.1% 2.0%
Yield on Performing Advances (standalone) 9.1% 9.7% 11.8% 13.1%
Cost of Deposits (standalone) 4.1% 3.9% 4.3% 4.3%
Net Interest Margin (standalone) 5.1% 5.4% 6.4% 7.2%
Spread (standalone) 3.9% 4.0% 4.7% 5.6%
Cost to Income Ratio 46.1% 47.5% 43.2% 40.1%
Non Fund Inc. / Total Revenue 35.9% 34.4% 33.1% 24.4%
Capital Adequacy Ratio 13.1% 13.3% 14.9% 14.9%
Return on Avg Assets 2.0% 1.9% 2.2% 1.9%
Return on Shareholders' Equity 22.6% 21.3% 23.4% 20.7%
20
Source: Company information.
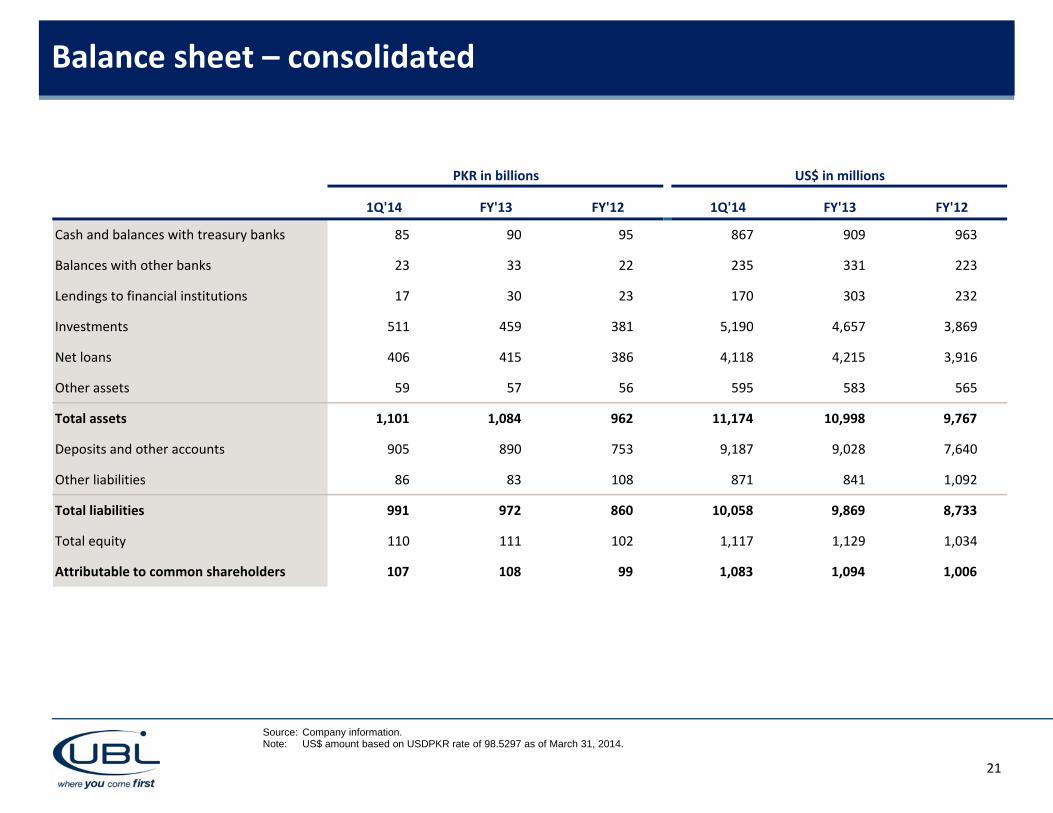
Balance sheet – consolidated
1Q'14 FY'13 FY'12 1Q'14 FY'13 FY'12
Cash and balances with treasury banks 85 90 95 867 909 963
Balances with other banks 23 33 22 235 331 223
Lendings to financial institutions 17 30 23 170 303 232
Investments 511 459 381 5,190 4,657 3,869
Net loans 406 415 386 4,118 4,215 3,916
Other assets 59 57 56 595 583 565
Total assets 1,101 1,084 962 11,174 10,998 9,767
Deposits and other accounts 905 890 753 9,187 9,028 7,640
Other liabilities 86 83 108 871 841 1,092
Total liabilities 991 972 860 10,058 9,869 8,733
Total equity 110 111 102 1,117 1,129 1,034
Attributable to common shareholders 107 108 99 1,083 1,094 1,006
PKR in billions US$ in millions
Source: Company information.Note: US$ amount based on USDPKR rate of 98.5297 as of March 31, 2014.
21

An overview of UBL results – income statement consolidated
FY'13 FY'12 Var % FY'13 FY'12 Var %
Net interest income 39.5 39.6 (0.3%) 401.0 402.1 (0.3%)
Non interest income 20.7 19.6 5.7% 210.1 198.8 5.7%
Gross revenue 60.2 59.2 1.7% 611.1 601.0 1.7%
Operating expenses (29.3) (26.2) (12.1%) (297.6) (265.5) (12.1%)
Pre prov. operating profit 30.9 33.1 (6.6%) 313.5 335.5 (6.6%)
Provision exp. / other writeoffs (1.9) (4.7) 59.5% (19.5) (48.1) 59.5%
Profit before tax 29.0 28.3 2.3% 294.0 287.4 2.3%
Profit after tax 19.7 19.2 2.5% 200.3 195.3 2.5%
PKR in billions US$ in millions
22
Source: Company information.Note: US$ amount based on USDPKR rate of 98.5297 as of March 31, 2014.

An overview of UBL results – income statement consolidated
Q1'14 Q1'13 Var % Q1'14 Q1'13 Var %
Net interest income 10.3 9.1 12.2% 104.1 92.8 12.2%
Non interest income 5.8 5.1 12.9% 58.4 51.7 12.9%
Gross revenue 16.0 14.2 12.4% 162.5 144.5 12.4%
Operating expenses (7.5) (6.8) (11.1%) (76.5) (68.8) (11.1%)
Pre prov. operating profit 8.5 7.5 13.6% 86.0 75.7 13.6%
Provision exp. / other writeoffs (0.3) (0.6) 44.8% (3.3) (5.9) 44.8%
Profit before tax 8.2 6.9 18.6% 82.7 69.8 18.6%
Profit after tax 5.5 4.9 11.6% 56.1 50.2 11.6%
PKR in billions US$ in millions
23
Source: Company information.Note: US$ amount based on USDPKR rate of 98.5297 as of March 31, 2014.

Non interest income – consolidated
FY'13 FY'12 Var % FY'13 FY'12 Var %
Fee & commission income 11,443.6 9,455.1 21.0% 116.1 96.0 21.0%
Income from dealing in foreign currencies 2,211.8 1,946.2 13.6% 22.4 19.8 13.6%
Dividend income 1,611.9 539.6 198.7% 16.4 5.5 198.7%
Income from dealing in derivatives 211.1 2,965.7 (92.9%) 2.1 30.1 (92.9%)
Capital gains 3,021.7 1,258.9 140.0% 30.7 12.8 140.0%
Other income 916.3 1,027.5 (10.8%) 9.3 10.4 (10.8%)
Share of profit / (loss) of associates 1,282.4 2,397.7 (46.5%) 13.0 24.3 (46.5%)
Total non interest income 20,698.7 19,590.7 5.7% 210.1 198.8 5.7%
PKR in millions US$ in millions
24
Source: Company information.Note: US$ amount based on USDPKR rate of 98.5297 as of March 31, 2014.
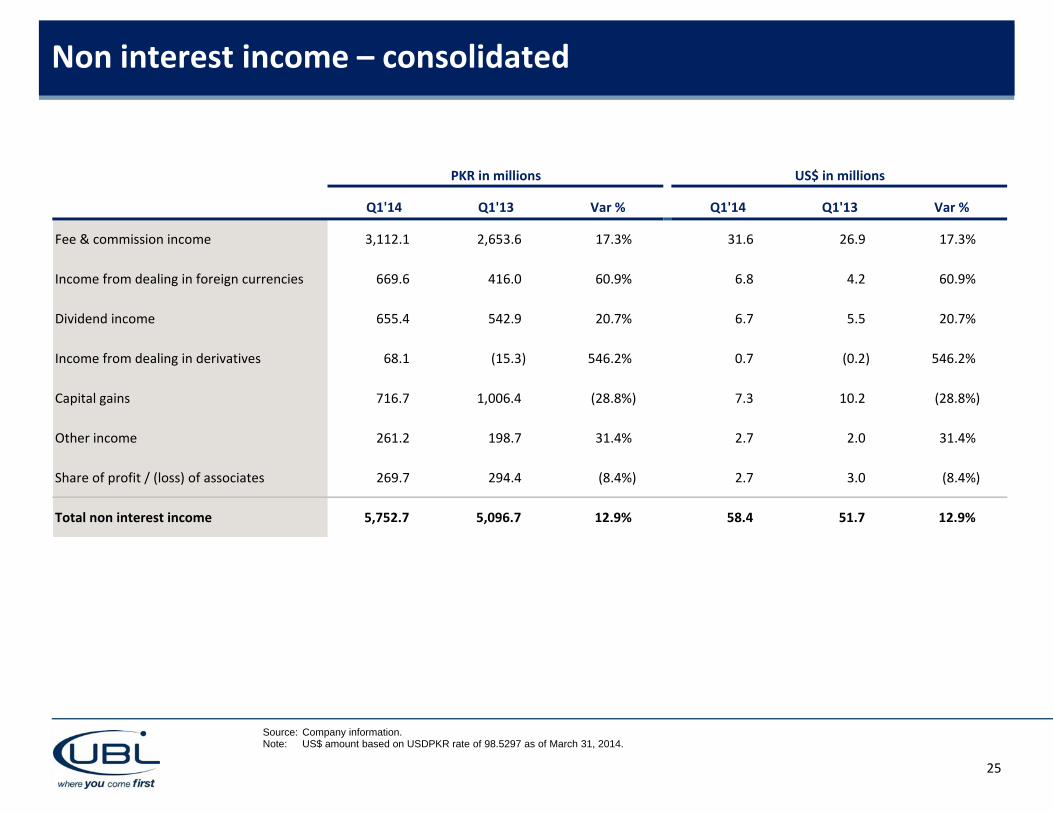
Non interest income – consolidated
Q1'14 Q1'13 Var % Q1'14 Q1'13 Var %
Fee & commission income 3,112.1 2,653.6 17.3% 31.6 26.9 17.3%
Income from dealing in foreign currencies 669.6 416.0 60.9% 6.8 4.2 60.9%
Dividend income 655.4 542.9 20.7% 6.7 5.5 20.7%
Income from dealing in derivatives 68.1 (15.3) 546.2% 0.7 (0.2) 546.2%
Capital gains 716.7 1,006.4 (28.8%) 7.3 10.2 (28.8%)
Other income 261.2 198.7 31.4% 2.7 2.0 31.4%
Share of profit / (loss) of associates 269.7 294.4 (8.4%) 2.7 3.0 (8.4%)
Total non interest income 5,752.7 5,096.7 12.9% 58.4 51.7 12.9%
PKR in millions US$ in millions
25
Source: Company information.Note: US$ amount based on USDPKR rate of 98.5297 as of March 31, 2014.

Administrative expenses – consolidated
FY'13 FY'12 Var % FY'13 FY'12 Var %
Personnel cost 13,796.3 12,665.1 8.9% 140.0 128.5 8.9%
Premises cost 3,733.8 3,175.2 17.6% 37.9 32.2 17.6%
Depreciation and amortization 1,290.1 1,206.3 6.9% 13.1 12.2 6.9%
Advertisement 485.8 447.9 8.5% 4.9 4.5 8.5%
Communications 3,111.4 2,286.9 36.1% 31.6 23.2 36.1%
Maintenance contracts 1,266.1 1,166.1 8.6% 12.8 11.8 8.6%
Stationery and printing 566.1 533.5 6.1% 5.7 5.4 6.1%
Banking service charges 447.5 402.1 11.3% 4.5 4.1 11.3%
Cash transportation charges 703.5 674.9 4.2% 7.1 6.8 4.2%
Legal and professional charges 926.5 882.1 5.0% 9.4 9.0 5.0%
Office running expenses 96.6 95.9 0.7% 1.0 1.0 0.7%
Travelling 383.9 385.0 (0.3%) 3.9 3.9 (0.3%)
Others 1,762.8 1,637.5 7.7% 17.9 16.6 7.7%
Total 28,570.6 25,558.4 11.8% 290.0 259.4 11.8%
PKR in millions US$ in millions
26
Source: Company information.Note: US$ amount based on USDPKR rate of 98.5297 as of March 31, 2014.

Administrative expenses – consolidated
Q1'14 Q1'13 Var % Q1'14 Q1'13 Var %
Personnel cost 4,107.8 3,575.7 14.9% 41.7 36.3 14.9%
Premises cost 912.5 852.0 7.1% 9.3 8.6 7.1%
Depreciation and amortization 549.3 537.8 2.1% 5.6 5.5 2.1%
Advertisement 130.6 112.7 15.9% 1.3 1.1 15.9%
Communications 277.8 267.6 3.8% 2.8 2.7 3.8%
Maintenance contracts 319.7 304.2 5.1% 3.2 3.1 5.1%
Stationery and printing 137.6 126.3 9.0% 1.4 1.3 9.0%
Banking service charges 227.2 203.2 11.8% 2.3 2.1 11.8%
Cash transportation charges 124.7 109.7 13.7% 1.3 1.1 13.7%
Legal and professional charges 55.3 68.8 (19.7%) 0.6 0.7 (19.7%)
Office running expenses 120.4 115.3 4.4% 1.2 1.2 4.4%
Travelling 58.1 56.9 2.1% 0.6 0.6 2.1%
Others 356.2 334.0 6.7% 3.6 3.4 6.7%
Total 7,377.1 6,664.0 10.7% 74.9 67.6 10.7%
PKR in millions US$ in millions
27
Source: Company information.Note: US$ amount based on USDPKR rate of 98.5297 as of March 31, 2014.

Important InformationImportant information
By attending the meeting where this presentation is made, or by reading the presentation materials, you agree to be bound by the following limitations:
The information in this presentation has been prepared by United Bank Limited (“UBL”) for use in presentations by UBL at investor meetings and does not constitute a recommendation regarding the securities of UBL.
The information contained herein reflects our business as of March 31, 2014. It should be understood that subsequent developments may affect the information contained in this presentation, which neither UBL nor their advisors or representatives are under an obligation to update, revise or affirm.
Except the historical information contained herein, statements in this presentation that contain words or phrases such as ‘will’, ‘would’, ‘indicating’ ‘expected to’ etc., and similar expressions or variations of such expressions may constitute ‘forward‐looking statements’. These forward‐looking statements involve a number of risks, uncertainties and other factors beyond the control of management that could cause actual results to differ materially from those suggested by the forward‐looking statements. These risks and uncertainties include, but are not limited to our ability to successfully implement our strategy, future levels of non‐performing loans, our growth and expansion in business, the impact of any acquisitions, the adequacy of our allowance for credit losses, technological, implementation and changes, the actual growth in demand for banking products and services, investment income, cash flow projections, our exposure to market risks as well as other risks detailed in the reports filed by us with various regulatory authorities as per applicable laws and regulations. UBL undertakes no obligations to update forward‐looking statements to reflect event or circumstances after the date thereof.
Nothing contained herein is or should be relied upon as a promise or representation in respect of the future prospects of UBL.
This presentation and the information contained herein do not constitute or form part of any offer for sale or subscription of or solicitation or invitation of any offer to buy or subscribe for any securities of UBL. This presentation and the information contained herein are being furnished to you solely for your information and may not be reproduced or redistributed to any other person, in whole or in part. In particular, neither the information contained in this presentation nor any copy hereof may be, directly or indirectly, taken or transmitted into or distributed in the United States, Canada, Australia, Japan or any other jurisdiction which prohibits the same except in compliance with applicable securities laws. Any failure to comply with this restriction may constitute a violation of U.S. or other national securities laws. No money, securities or other consideration is being solicited, and, if sent in response to this presentation or the information contained herein, will not be accepted.
By reviewing this presentation, you are deemed to have represented and agreed that you and any customers you represent are either (a) a “qualified institutional buyer” (within the meaning of Regulation 144A under the Securities Act), or (b) not a U.S. person and are outside of the United States and not acting for the account or benefit of a U.S. person (as defined in Regulation S under the Securities Act).
28