
Investor Presentation - Bilibili Inc.
26
1 Investor Presentation February 2019
-
Upload
khangminh22 -
Category
Documents
-
view
3 -
download
0
Transcript of Investor Presentation - Bilibili Inc.

1
InvestorPresentationFebruary 2019
2
This announcement contains forward-looking statements. These statements are made under the “safe harbor” provisions of the U.S. PrivateSecurities Litigation Reform Act of 1995. These forward-looking statements can be identified by terminology such as “will,” “expects,” “anticipates,”“aims,” “future,” “intends,” “plans,” “believes,” “estimates,” “confident,” “potential,” “continue” or other similar expressions. Among other things, theOutlook and quotations from management in this announcement, as well as Bilibili’s strategic and operational plans, contain forward-lookingstatements. Bilibili may also make written or oral forward-looking statements in its periodic reports to the U.S. Securities and Exchange Commission,in its annual report to shareholders, in press releases and other written materials and in oral statements made by its officers, directors or employeesto third parties. Statements that are not historical facts, including but not limited to statements about Bilibili’s beliefs and expectations, are forward-looking statements. Forward-looking statements involve inherent risks and uncertainties. A number of factors could cause actual results to differmaterially from those contained in any forward-looking statement, including but not limited to the following: Bilibili’s strategies; Bilibili’s futurebusiness development, financial condition and results of operations; Bilibili’s ability to retain and increase the number of users, members andadvertising customers, provide quality content, products and services, and expand its product and service offerings; competition in the onlineentertainment industry; Bilibili’s ability to maintain its culture and brand image within its addressable user communities; Bilibili’s ability to manage itscosts and expenses; PRC governmental policies and regulations relating to the online entertainment industry, general economic and businessconditions globally and in China and assumptions underlying or related to any of the foregoing. Further information regarding these and other risks isincluded in the Company’s filings with the Securities and Exchange Commission. All information provided in this press release and in theattachments is as of the date of the press release, and the Company undertakes no duty to update such information, except as required underapplicable law.
Safe Harbor Statement

3
Enrich the everyday life of young generations in China
4.1bn 93mm 78minRevenue in 2018 (RMB) MAU (1) in 18Q4 Mobile MAU in 18Q4 Avg. daily time spent
(excl. mobile game) in 18Q4
:
3
80mm

4
17Q1 17Q2 17Q3 17Q4 18Q1 18Q2 18Q3 18Q4
57
65
74 7277
85
93 93
17Q1 17Q2 17Q3 17Q4 18Q1 18Q2 18Q3 18Q4
424
583
728 734
868
1,027 1,079
1,156
Our rapid growth
Rapid user base expansion lays a solid foundation for fast revenue growth
MAU (mm) Net revenue (RMB mm)
5
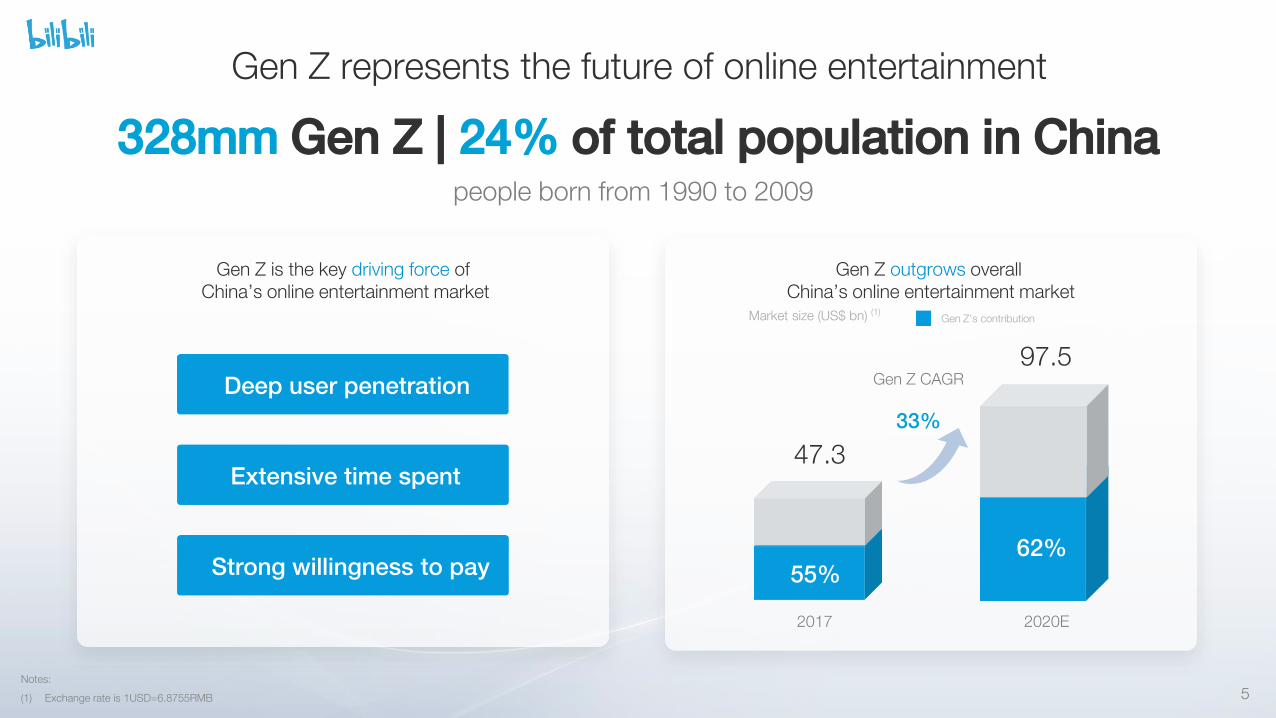
Gen Z represents the future of online entertainment
328mm Gen Z | 24% of total population in Chinapeople born from 1990 to 2009
(1) Exchange rate is 1USD=6.8755RMB
Gen Z is the key driving force of China’s online entertainment market
Gen Z outgrows overall China’s online entertainment market
2017
47.3
2020E
97.5Deep user penetration
Extensive time spent
Strong willingness to pay 55%62%
Market size (US$ bn) (1)
Gen Z CAGR
33%
Notes:
Gen Z’s contribution

6
Efficient with tremendous upside
Commercialization
Content Community
Gen ZEver-growing supply ofuser generated content
Highly engagedand sticky
The story

7
We have become the welcoming home of diverse interests...
ACGAnime, Comic
and Game
Entertainment
NO.1(1)
Pop Culture
Lifestyle
NO.2(1)
Technology
NO.5(1)
Anime
NO.4(1)
Game
NO.3(1)
(1) Ranked by video views in 2018
Celebrity
Pets
Foodie
E-Sports
Mobile Games
Science
Electronics
Cosplay
Domestic AnimeNotes:
Content Community Commercialization

8
…And ever-growing supply of creative PUG videos
(1) In December 2018
total video views contributed by PUG videos
(1)
Talented Content CreatorsNumber of Monthly Average Active Content Creators
18Q417Q4
570234
143%
High-quality Content CreationNumber of Monthly Video Submissions
18Q417Q4
1,716692
148%
Loyal Fan BaseNumber of Content Creators with more than 10,000 Fans
Dec 31,2018Dec 31,2017
81%
89%
reate
Engage
EncourageCreate
(‘000)
(‘000)
Notes:
Content Community Commercialization

9
Continuous support to content creators in all layers
Higher quality production
RewardCash Incentive Program
(1000+ fans)
ToolsMobile Content
Submission
More contentsubmission
TutorNew Star Project
UP Academy
Better incentive
VIP ServicePower Alliances
Top 100 UP Award
Maximize influence
Content Community Commercialization

10
We also have a expansive OGV LibraryContent Community Commercialization
Animation Documentary TV,Movies and Variety shows

11
We fostered highly engaged and sticky communities
Highly engaged users:
436mm avg. daily video views in Q4
1bn interactions(1) generated monthly in Q4
107% YoY growth
298% YoY growth
(1) Interactive features such as bullet-chats, commentaries, favorites, bilibili moment posts and virtual gifting
Notes:
Content Community Commercialization

12
45mm official members (1) ~80% 12th-month retention rate (1)
44% YoY growth
(1) As of December 31, 2018. To become an official member, user needs to take and pass a community entrance exam consists of 100 questions covering community etiquette and various topics
Notes:
And even more loyal official members
50%
60%
70%
80%
90%
100%
0 3 6 9 12
2016 Oct 2016 Nov 2016 Dec2017 Jan 2017 Feb 2017 Mar2017 Apr 2017 May 2017 Jun2017 July 2017 Aug 2017 Sep
Content Community Commercialization
We fostered highly engaged and sticky communities

13
Commercialization comes naturally: massive user demand intersects with high quality supply
Large and engaged user base
with strong willingness to pay
DemandEfficient match
driven by big data insights
of user interests and behaviors
Supply
Mobile GamesAdvertising
Live BroadcastingValue Added Services
….
We understand users’ demand… …and we offer the right contentand services
Content Community Commercialization

14
Compelling core competency of our mobile game business
Efficient Matching Mechanism
Deep insights into our user interest & behavior through analyzing massive and
high quality user data
Customized game recommendation
Strong AC-Games Demand
Game is 3rd most popular video genre on our platform
Sophisticated Game Curation
1 Self developed
11 Exclusively distributed
300+ Jointly operated
(1) According to China Top Grossing Ranking in iOS App Store, Ranked No.2 on Jun 25, 2018
Notes:
Game-themed live broadcasting is also well received
4.5mm players within the first 30 days Top ranked (1) in China mobile game market
We have successfully introduced FGO, a Japanese anime & comics themed mobile game, to the Chinese market
6mm players within the first 30 days Over 100mm RMB gross revenue achieved within the first 30 days
We have successfully launched Azur Lane, a domestic ACG themed mobile game, with outstanding results
Majority of our mobile game players are converted from our community
Content Community Commercialization

1517Q1 17Q2 17Q3 17Q4 18Q1 18Q2 18Q3 18Q4
349
492
600 617
688
791 744
713
Robust game revenue growth and strong pipeline
Azur Lane ReleasedIn 17Q2
FGO Released in 16Q3
RMB (mm)
Content Community Commercialization
Strong Pipeline

16
Gen Z is the golden cohortwell chased by brand advertisers
Brand & Performance-based advertising: two growth engines
Customized performance-based ads help advertisers reach and convert target audiences
Content Community Commercialization

17
17Q1 17Q2 17Q3 17Q4 18Q1 18Q2 18Q3 18Q4
Brand Ads Performance-based Ads
Advertising revenue: strong growth with great potential
RMB (mm)
Content Community Commercialization
Up 302%YOY
2941
49 40
70
96
137
160
18
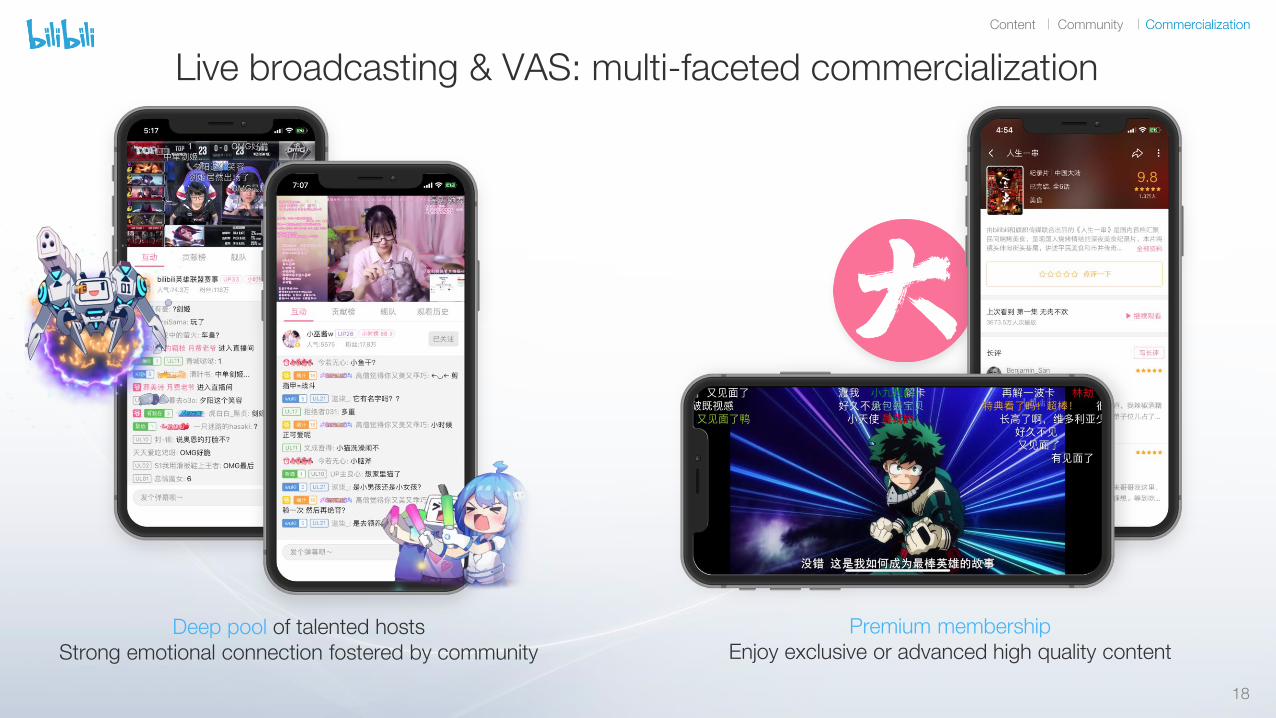
Live broadcasting & VAS: multi-faceted commercialization
Deep pool of talented hostsStrong emotional connection fostered by community
Premium membershipEnjoy exclusive or advanced high quality content
Content Community Commercialization

19
RMB (mm)
17Q1 17Q2 17Q3 17Q4 18Q1 18Q2 18Q3 18Q4
38 41 4354
96
119
169
202
Content Community Commercialization
Live broadcasting & VAS revenue: strong growth with great potential
Up 276%YOY

20
OUR FINANCIALS

21
17Q1 17Q2 17Q3 17Q4 18Q1 18Q2 18Q3 18Q4
57
65
74 7277
85
93 93
Expanding user base and increasing paying ratio
(1) Average monthly active users for each of the quarters (includes both PC and mobile)(2) Calculated as average monthly paying users (MPU) in each year divided by average MAUs in each year. MPUs are calculated by counting individual users and exclude counting multiple services per user.
Notes:
Total MAUs(mm)
17Q1 17Q2 17Q3 17Q4 18Q1 18Q2 18Q3 18Q4
854 1,073 1,174 1,109
2,473
2,966
3,540
4,416
Y-o-Y Growth % 29%
Impressive growth of paying users
MPUs (thousands)
MPUs / MAUs (%)
2017 | 1.6% 2018 | 3.8% 4Q18 | 4.8%
(1)
(2)

22
17Q1 17Q2 17Q3 17Q4 18Q1 18Q2 18Q3 18Q4
7.4
8.99.8 10.2
11.212.1 11.6
12.5
17Q1 17Q2 17Q3 17Q4 18Q1 18Q2 18Q3 18Q4
Mobile games Live broadcasting and VASAdvertising E-commerce and Others
Rapid growth of revenue and revenue per MAU
(1) Average monthly active users for each of the quarters (includes both PC and mobile)
Notes:
Revenue(RMB mm)
Y-o-Y Growth % 57%
Quarterly Total Revenue / Quarterly MAU (1)
(RMB)
Y-o-Y Growth % 23%
1,027
868
734728
583
424
1,1561,079

23
Margin expansion with operating leverage
(1) Excluding Share-based compensation(2) Revenue-sharing costs consist of fees paid to game developers, distribution channels (app stores) and payment processors, as well as fees we pay to hosts of our live broadcasting program and content creators in accordance with our revenue-sharing arrangements.(3) Content costs consist of amortized costs of purchased licensed content from copyright owners or content distributors.(4) Server and bandwidth costs are the fees we pay to telecommunication carriers and other service providers for telecommunication services, hosting our servers at their internet data centers, and providing content and application delivery services.(5) Others includes staff cost, depreciation, and others.
Notes:
Cost of Revenue (1)
(RMB mm; as a percentage of revenue %)
Gross margin %
Operating Expenses (1)
(RMB mm)
As a percentage of revenue
39%31%28%29% 39%19%25%25%24% 17%
17Q4 18Q1 18Q2 18Q3 18Q4
38% 39%41% 41% 38%
12%11%
12%14% 15%
15%16%
14%15% 16%
10%
10%
8%
11%14%
Revenue-sharing costs Content costs Server and bandwidth costs Others
556647
768
877
954
17Q4 18Q1 18Q2 18Q3 18Q4
9% 9%12%
18% 16%9% 8%
7%
8% 12%
11%11%
12%
13%
12%
Selling and marketing expenses General and administrative expenses Research and development expenses
215242
315
418455

24
Consolidated balance sheets
(RMB MM) Dec 31, 2017 Dec 31, 2018Assets
Cash and cash equivalents 763 3,540Time deposit 2 749Restricted Cash -- --Accounts receivable, net 393 324 Receivable due from related parties 30 --Prepayments and other current assets 477 991 Short-term investments 488 946
Total current assets 2,153 6,550
Property, equipment and software, net 187 395Production cost 21 204Intangible assets, net 426 1,420Good will 51 941Long-term Investments 636 980
Total non-current assets 1,321 3,940Total Assets 3,474 10,490
LiabilitiesAccounts payable 597 1,308Salary and welfare payables 149 247Taxes payable 25 39Short-term loans -- --Deferred revenue 573 985Accrued liabilities and other payables 48 670Intercompany payable 6 50
Total current liabilities 1,398 3,299Total Liabilities 1,398 3,299
Total Mezzanine equity 4,015 --
Total Bilibili Inc.’s shareholders’ (deficit)/equity (1,939) 6,951Non-controlling interests -- 240
Total shareholders’ (deficit)/equity (1,939) 7,191
Total Liabilities, Mezzanine and Shareholders' Equity 3,474 10,490
25
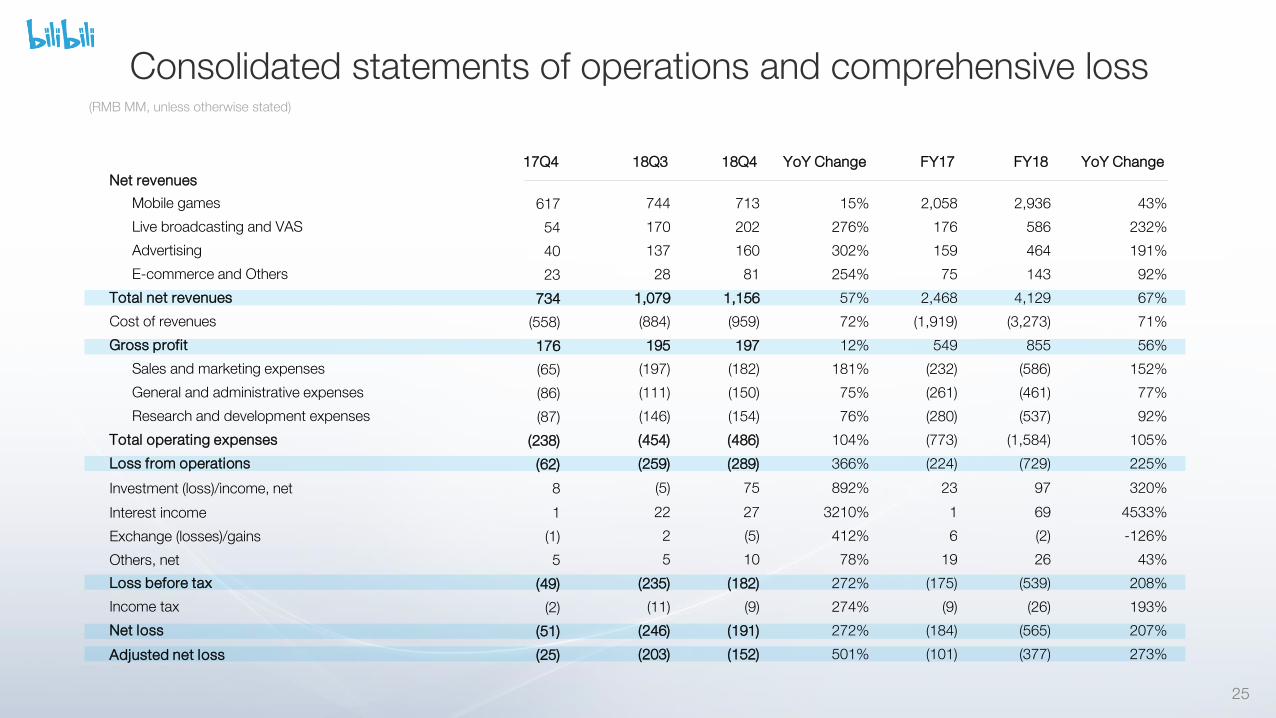
Consolidated statements of operations and comprehensive loss(RMB MM, unless otherwise stated)
17Q4 18Q3 18Q4 YoY Change FY17 FY18 YoY ChangeNet revenues
Mobile games 617 744 713 15% 2,058 2,936 43%
Live broadcasting and VAS 54 170 202 276% 176 586 232%
Advertising 40 137 160 302% 159 464 191%
E-commerce and Others 23 28 81 254% 75 143 92%
Total net revenues 734 1,079 1,156 57% 2,468 4,129 67%
Cost of revenues (558) (884) (959) 72% (1,919) (3,273) 71%
Gross profit 176 195 197 12% 549 855 56%
Sales and marketing expenses (65) (197) (182) 181% (232) (586) 152%
General and administrative expenses (86) (111) (150) 75% (261) (461) 77%
Research and development expenses (87) (146) (154) 76% (280) (537) 92%
Total operating expenses (238) (454) (486) 104% (773) (1,584) 105%
Loss from operations (62) (259) (289) 366% (224) (729) 225%
Investment (loss)/income, net 8 (5) 75 892% 23 97 320%
Interest income 1 22 27 3210% 1 69 4533%
Exchange (losses)/gains (1) 2 (5) 412% 6 (2) -126%
Others, net 5 5 10 78% 19 26 43%
Loss before tax (49) (235) (182) 272% (175) (539) 208%
Income tax (2) (11) (9) 274% (9) (26) 193%
Net loss (51) (246) (191) 272% (184) (565) 207%
Adjusted net loss (25) (203) (152) 501% (101) (377) 273%

26
THANK YOU!IR Contacts
Bilibili Inc.
Juliet YangTel: +86-21-2509 9255 Ext. 8523E-mail: [email protected]
The Piacente Group, Inc.
Tel: +86-10-5730-6200 (In China)Tel: +1-212-481-2050 (In U.S.)E-mail: [email protected]