Investor Presentation - Indus Towers
42
Building and Sharing Vital Infrastructure Investor Presentation Sep 2018
-
Upload
khangminh22 -
Category
Documents
-
view
0 -
download
0
Transcript of Investor Presentation - Indus Towers
Building and Sharing Vital Infrastructure
Investor Presentation
Sep 2018
DisclaimerBy attending the meeting where this presentation is made, or by reading the presentation materials, you agree to be bound by the following limitations:
The information in this presentation has been prepared by Bharti Infratel Limited (the “Company”) for use in presentations by the Company at investor meetings and does not constitute a
recommendation regarding the securities of the Company.
No representation or warranty, express or implied, is made as to, and no reliance should be placed on, the fairness, accuracy, completeness or correctness of the information, or opinions
contained herein. Neither the Company nor any of its advisors or representatives shall have any responsibility or liability whatsoever (for negligence or otherwise) for any loss howsoever
arising from any use of this presentation or its contents or otherwise arising in connection with this presentation. The information set out herein may be subject to updating, completion,
revision, verification and amendment and such information may change materially. Neither the Company nor any of its advisors or representatives is under any obligation to update or keep
current the information contained herein.
The information communicated in this presentation contains certain statements that are or may be forward looking. These statements typically contain words such as "will", "expects" and
"anticipates" and words of similar import. By their nature forward looking statements involve risk and uncertainty because they relate to events and depend on circumstances that will occur in
the future. Any investment in securities issued by the Company will also involve certain risks. There may be additional material risks that are currently not considered to be material or of which
the Company and its advisors or representatives are unaware. Against the background of these uncertainties, readers should not unduly rely on these forward-looking statements. The
Company, its advisors and representatives assume no responsibility to update forward-looking statements or to adapt them to future events or developments.
This presentation has been prepared for informational purposes only. This presentation does not constitute a prospectus under the (Indian) Companies Act, 1956 and will not be registered
with any registrar of companies. Furthermore, this presentation is not and should not be construed as an offer or a solicitation of an offer to buy securities for sale in the India.
This presentation and the information contained herein does not constitute or form part of any offer for sale or subscription of or solicitation or invitation of any offer to buy or subscribe for any
securities of the Company, nor should it or any part of it form the basis of, or be relied on in connection with, any contract or commitment whatsoever. The securities of the Company have not
been and will not be registered under the U.S. Securities Act of 1933, as amended (the "Securities Act"), and may not be offered, sold or delivered within the United States or to U.S. persons
absent from registration under or an applicable exemption from the registration requirements of the United States securities laws. This presentation and the information contained herein is
being furnished to you solely for your information and may not be reproduced or redistributed to any other person, in whole or in part. In particular, neither the information contained in this
presentation nor any copy hereof may be, directly or indirectly, taken or transmitted into or distributed in the U.S., Canada, Australia, Japan or any other jurisdiction which prohibits the same
except in compliance with applicable securities laws. Any failure to comply with this restriction may constitute a violation of the United States or other national securities laws. No money,
securities or other consideration is being solicited, and, if sent in response to this presentation or the information contained herein, will not be accepted.
By reviewing this presentation, you are deemed to have represented and agreed that you and any person you represent are either (a) a qualified institutional buyer (within the meaning of
Regulation 144A under the Securities Act) and a qualified purchaser (within the meaning of the U.S. Investment Company Act of 1940, as amended), or (b) not a U.S. person (as defined in
Regulation S under the Securities Act) and are outside of the United States and not acting for the account or benefit of a U.S. person.
2 of 42

Table of Contents
Company Overview
Industry Overview
In Summary
Business Model Strengths
Proposed Merger with Indus
3 of 42

Company Overview
4 of 42
Bharti Infratel – Who We Are?
A Leading Tower Infrastructure Operator
Pan India Presence across all 22 Telecommunications Circles
Indus Towers – JV between Bharti Infratel, Vodafone and Aditya Birla Telecom
Top 3 Operators Anchor Customers & Relationships with all other Operators
Marquee promoter and investors
5 of 42
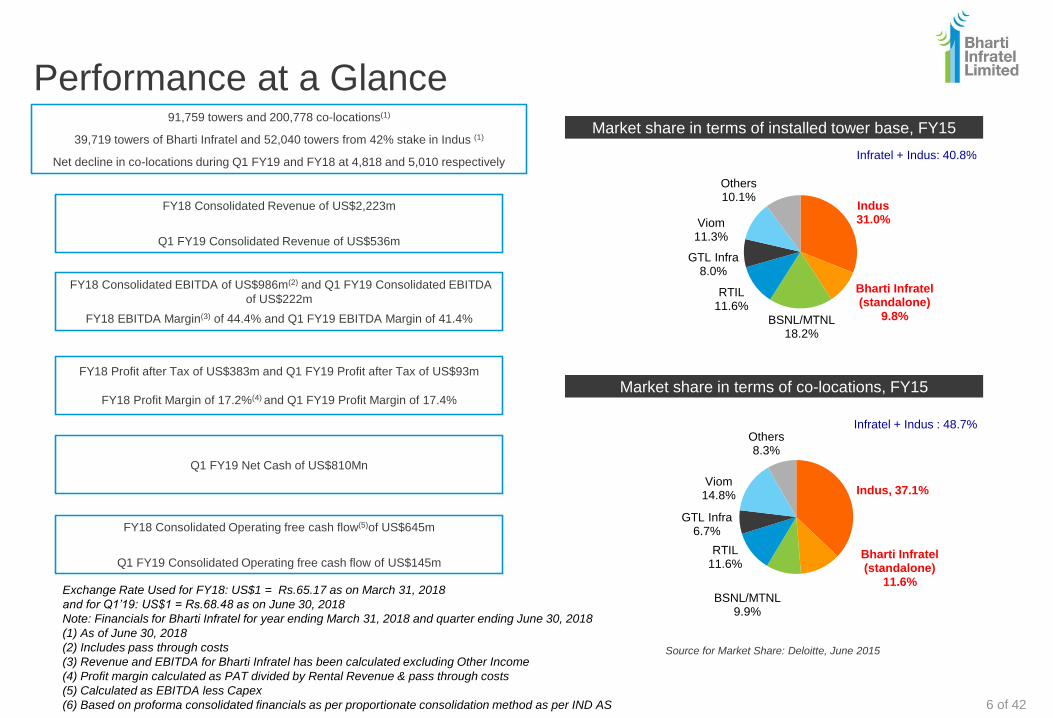
Indus, 37.1%
Bharti Infratel (standalone)
11.6%
BSNL/MTNL9.9%
RTIL11.6%
GTL Infra6.7%
Viom14.8%
Others8.3%
Indus31.0%
Bharti Infratel (standalone)
9.8%BSNL/MTNL18.2%
RTIL11.6%
GTL Infra8.0%
Viom11.3%
Others10.1%
Performance at a Glance
FY18 Consolidated Revenue of US$2,223m
Q1 FY19 Consolidated Revenue of US$536m
FY18 Consolidated EBITDA of US$986m(2) and Q1 FY19 Consolidated EBITDA
of US$222m
FY18 EBITDA Margin(3) of 44.4% and Q1 FY19 EBITDA Margin of 41.4%
FY18 Profit after Tax of US$383m and Q1 FY19 Profit after Tax of US$93m
FY18 Profit Margin of 17.2%(4) and Q1 FY19 Profit Margin of 17.4%
Q1 FY19 Net Cash of US$810Mn
FY18 Consolidated Operating free cash flow(5)of US$645m
Q1 FY19 Consolidated Operating free cash flow of US$145m
91,759 towers and 200,778 co-locations(1)
39,719 towers of Bharti Infratel and 52,040 towers from 42% stake in Indus (1)
Net decline in co-locations during Q1 FY19 and FY18 at 4,818 and 5,010 respectively
Market share in terms of installed tower base, FY15
Market share in terms of co-locations, FY15
Infratel + Indus: 40.8%
Infratel + Indus : 48.7%
Source for Market Share: Deloitte, June 2015
Exchange Rate Used for FY18: US$1 = Rs.65.17 as on March 31, 2018
and for Q1’19: US$1 = Rs.68.48 as on June 30, 2018
Note: Financials for Bharti Infratel for year ending March 31, 2018 and quarter ending June 30, 2018
(1) As of June 30, 2018
(2) Includes pass through costs
(3) Revenue and EBITDA for Bharti Infratel has been calculated excluding Other Income
(4) Profit margin calculated as PAT divided by Rental Revenue & pass through costs
(5) Calculated as EBITDA less Capex
(6) Based on proforma consolidated financials as per proportionate consolidation method as per IND AS 6 of 42
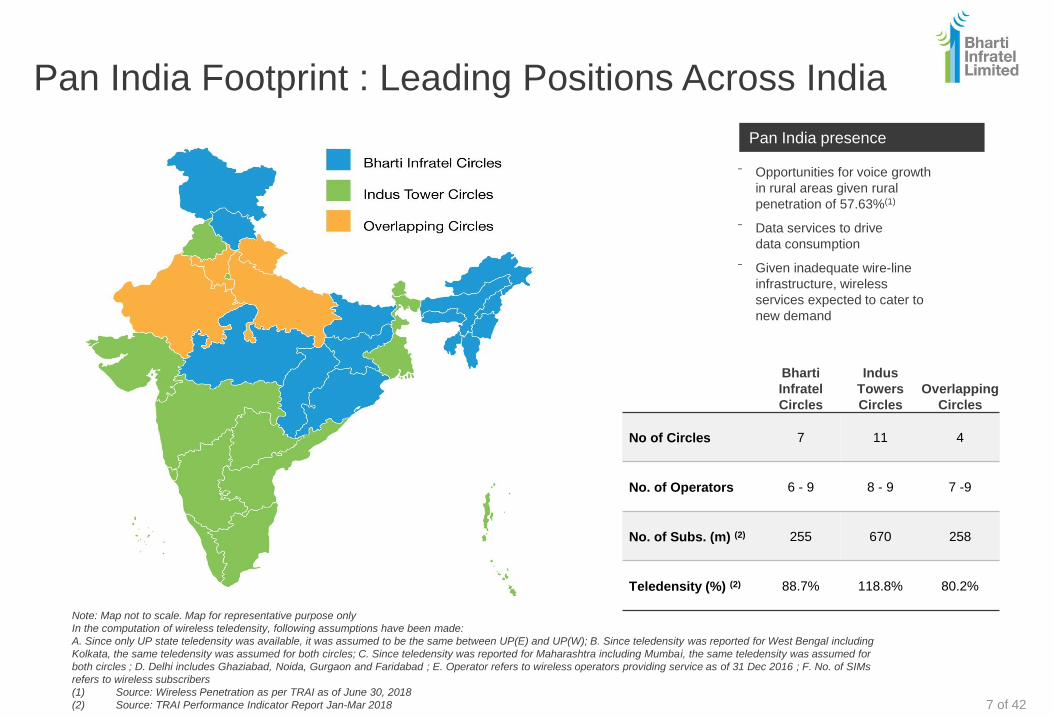
Pan India Footprint : Leading Positions Across India
⁻ Opportunities for voice growth
in rural areas given rural
penetration of 57.63%(1)
⁻ Data services to drive
data consumption
⁻ Given inadequate wire-line
infrastructure, wireless
services expected to cater to
new demand
Bharti
Infratel
Circles
Indus
Towers
Circles
Overlapping
Circles
No of Circles 7 11 4
No. of Operators 6 - 9 8 - 9 7 -9
No. of Subs. (m) (2) 255 670 258
Teledensity (%) (2) 88.7% 118.8% 80.2%
Pan India presence
Note: Map not to scale. Map for representative purpose only
In the computation of wireless teledensity, following assumptions have been made:
A. Since only UP state teledensity was available, it was assumed to be the same between UP(E) and UP(W); B. Since teledensity was reported for West Bengal including
Kolkata, the same teledensity was assumed for both circles; C. Since teledensity was reported for Maharashtra including Mumbai, the same teledensity was assumed for
both circles ; D. Delhi includes Ghaziabad, Noida, Gurgaon and Faridabad ; E. Operator refers to wireless operators providing service as of 31 Dec 2016 ; F. No. of SIMs
refers to wireless subscribers
(1) Source: Wireless Penetration as per TRAI as of June 30, 2018
(2) Source: TRAI Performance Indicator Report Jan-Mar 2018 7 of 42

Industry Overview
8 of 42
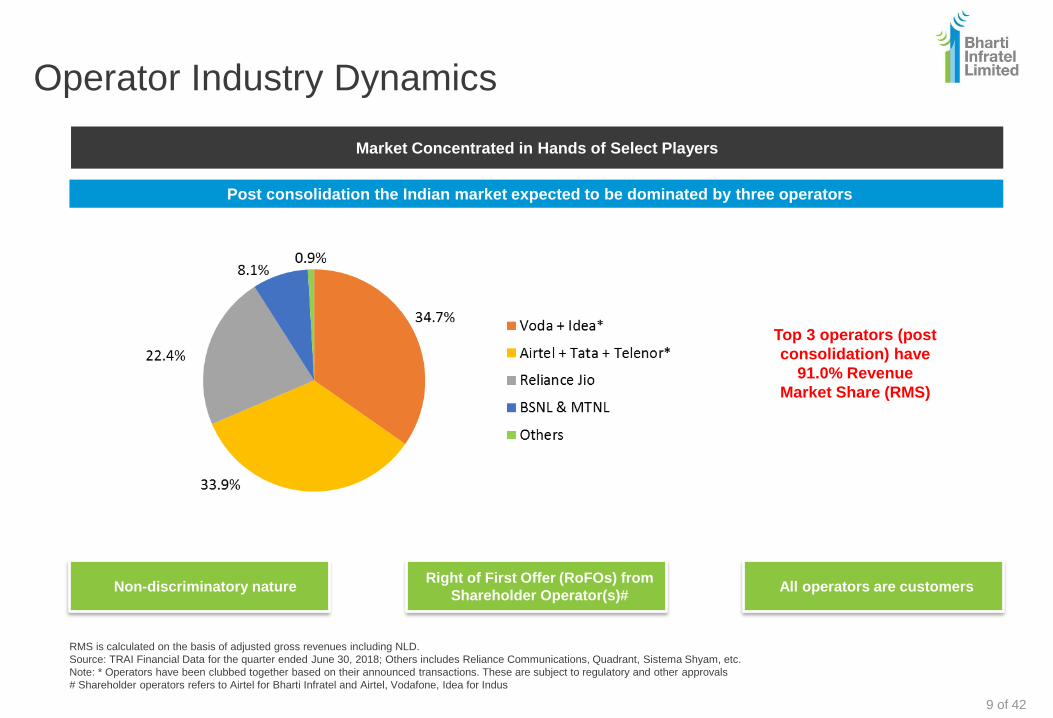
Operator Industry Dynamics
Top 3 operators (post
consolidation) have
91.0% Revenue
Market Share (RMS)
Market Concentrated in Hands of Select Players
Non-discriminatory nature All operators are customersRight of First Offer (RoFOs) from
Shareholder Operator(s)#
Post consolidation the Indian market expected to be dominated by three operators
RMS is calculated on the basis of adjusted gross revenues including NLD.
Source: TRAI Financial Data for the quarter ended June 30, 2018; Others includes Reliance Communications, Quadrant, Sistema Shyam, etc.
Note: * Operators have been clubbed together based on their announced transactions. These are subject to regulatory and other approvals
# Shareholder operators refers to Airtel for Bharti Infratel and Airtel, Vodafone, Idea for Indus
9 of 42
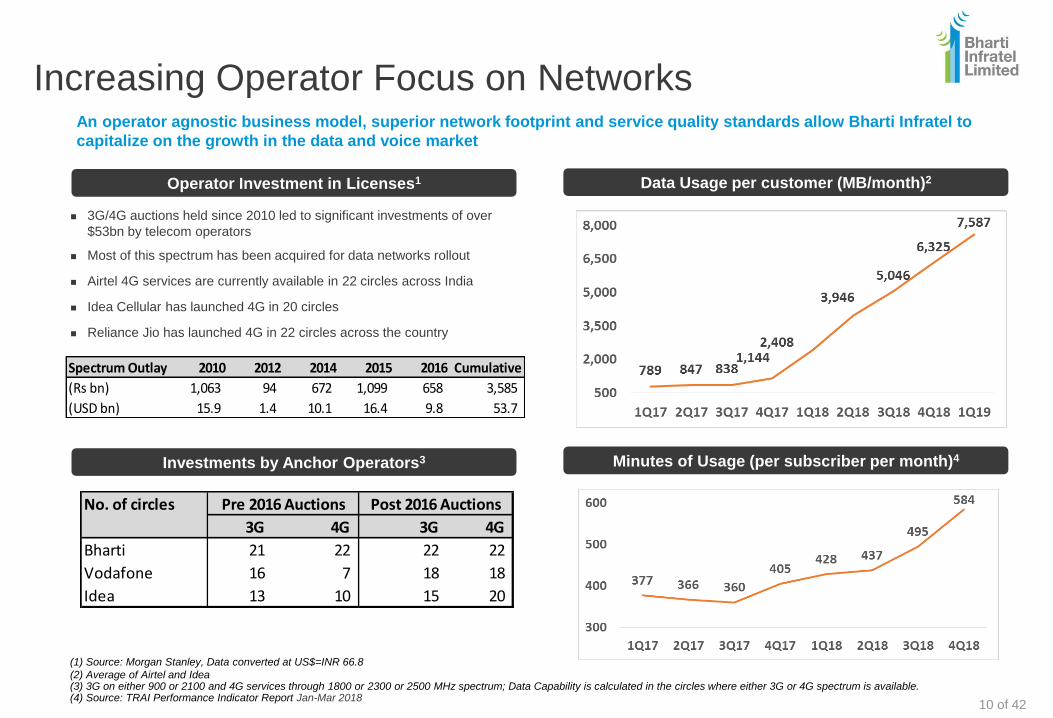
Increasing Operator Focus on Networks
3G/4G auctions held since 2010 led to significant investments of over
$53bn by telecom operators
Most of this spectrum has been acquired for data networks rollout
Airtel 4G services are currently available in 22 circles across India
Idea Cellular has launched 4G in 20 circles
Reliance Jio has launched 4G in 22 circles across the country
Operator Investment in Licenses1
Investments by Anchor Operators3 Minutes of Usage (per subscriber per month)4
An operator agnostic business model, superior network footprint and service quality standards allow Bharti Infratel to
capitalize on the growth in the data and voice market
(1) Source: Morgan Stanley, Data converted at US$=INR 66.8
(2) Average of Airtel and Idea(3) 3G on either 900 or 2100 and 4G services through 1800 or 2300 or 2500 MHz spectrum; Data Capability is calculated in the circles where either 3G or 4G spectrum is available.(4) Source: TRAI Performance Indicator Report Jan-Mar 2018
Spectrum Outlay 2010 2012 2014 2015 2016 Cumulative
(Rs bn) 1,063 94 672 1,099 658 3,585
(USD bn) 15.9 1.4 10.1 16.4 9.8 53.7
No. of circles
3G 4G 3G 4G
Bharti 21 22 22 22
Vodafone 16 7 18 18
Idea 13 10 15 20
Pre 2016 Auctions Post 2016 Auctions
Data Usage per customer (MB/month)2
10 of 42
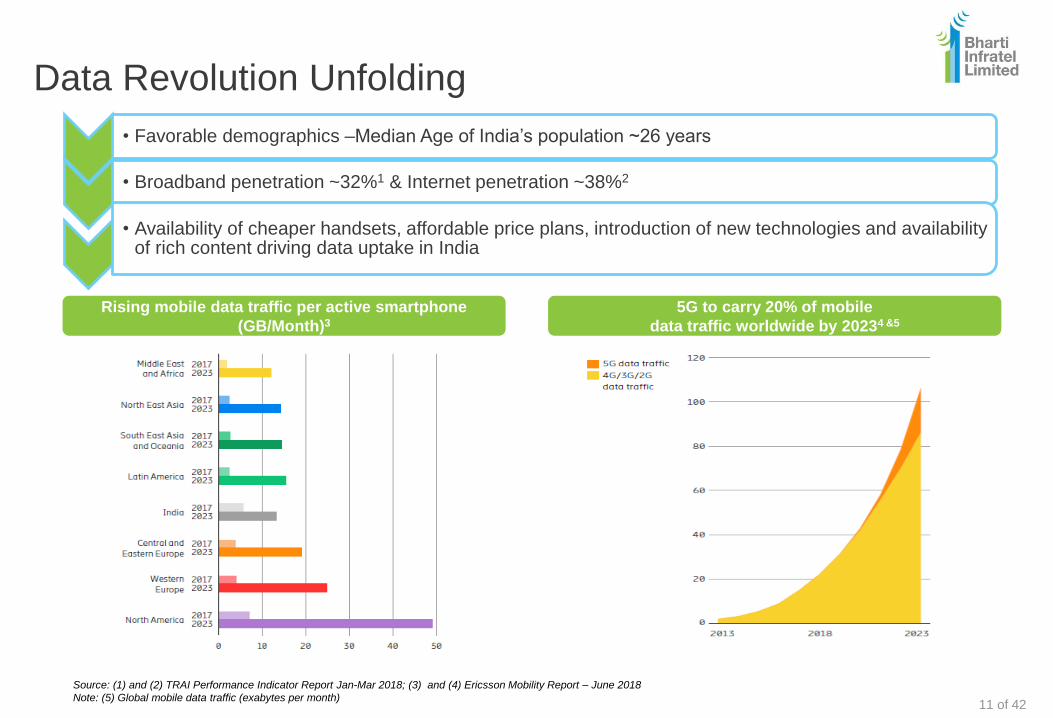
Data Revolution Unfolding
Rising mobile data traffic per active smartphone
(GB/Month)3
• Favorable demographics –Median Age of India’s population ~26 years
• Broadband penetration ~32%1 & Internet penetration ~38%2
• Availability of cheaper handsets, affordable price plans, introduction of new technologies and availability of rich content driving data uptake in India
5G to carry 20% of mobile
data traffic worldwide by 20234 &5
Source: (1) and (2) TRAI Performance Indicator Report Jan-Mar 2018; (3) and (4) Ericsson Mobility Report – June 2018
Note: (5) Global mobile data traffic (exabytes per month)11 of 42
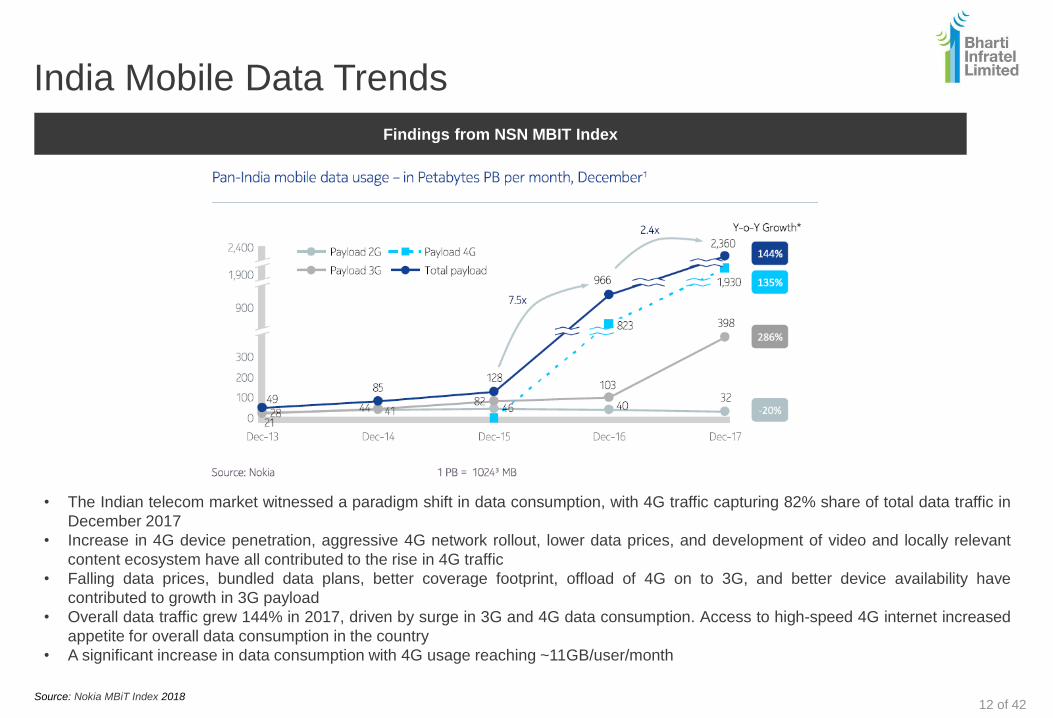
India Mobile Data Trends
Source: Nokia MBiT Index 2018
Findings from NSN MBIT Index
• The Indian telecom market witnessed a paradigm shift in data consumption, with 4G traffic capturing 82% share of total data traffic in
December 2017
• Increase in 4G device penetration, aggressive 4G network rollout, lower data prices, and development of video and locally relevant
content ecosystem have all contributed to the rise in 4G traffic
• Falling data prices, bundled data plans, better coverage footprint, offload of 4G on to 3G, and better device availability have
contributed to growth in 3G payload
• Overall data traffic grew 144% in 2017, driven by surge in 3G and 4G data consumption. Access to high-speed 4G internet increased
appetite for overall data consumption in the country
• A significant increase in data consumption with 4G usage reaching ~11GB/user/month
12 of 42
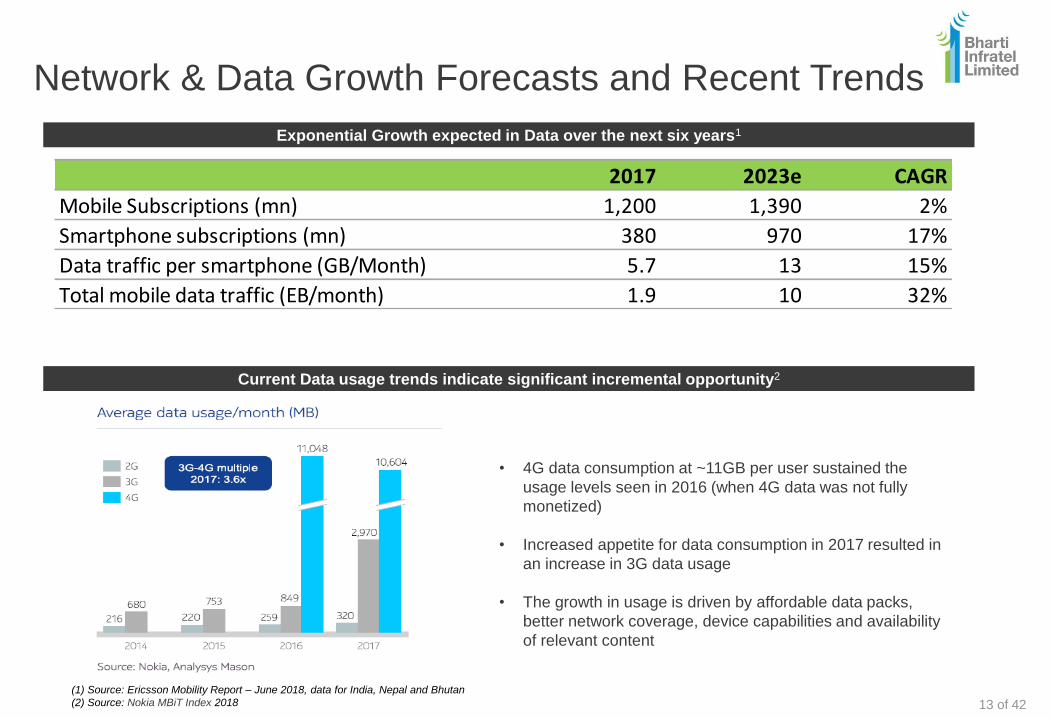
Network & Data Growth Forecasts and Recent Trends
Exponential Growth expected in Data over the next six years1
(1) Source: Ericsson Mobility Report – June 2018, data for India, Nepal and Bhutan
(2) Source: Nokia MBiT Index 2018
Current Data usage trends indicate significant incremental opportunity2
• 4G data consumption at ~11GB per user sustained the
usage levels seen in 2016 (when 4G data was not fully
monetized)
• Increased appetite for data consumption in 2017 resulted in
an increase in 3G data usage
• The growth in usage is driven by affordable data packs,
better network coverage, device capabilities and availability
of relevant content
2017 2023e CAGR
Mobile Subscriptions (mn) 1,200 1,390 2%
Smartphone subscriptions (mn) 380 970 17%
Data traffic per smartphone (GB/Month) 5.7 13 15%
Total mobile data traffic (EB/month) 1.9 10 32%
13 of 42
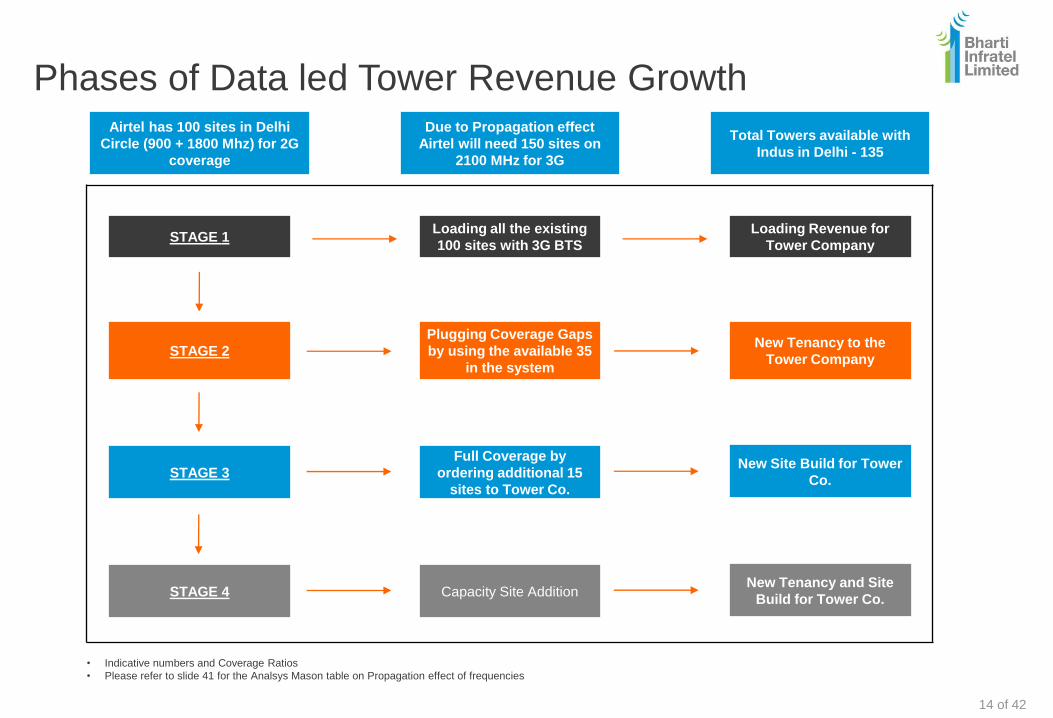
Phases of Data led Tower Revenue Growth
STAGE 1Loading all the existing
100 sites with 3G BTS
Loading Revenue for
Tower Company
STAGE 2
Plugging Coverage Gaps
by using the available 35
in the system
New Tenancy to the
Tower Company
STAGE 3
Full Coverage by
ordering additional 15
sites to Tower Co.
New Site Build for Tower
Co.
STAGE 4 Capacity Site AdditionNew Tenancy and Site
Build for Tower Co.
Airtel has 100 sites in Delhi
Circle (900 + 1800 Mhz) for 2G
coverage
Due to Propagation effect
Airtel will need 150 sites on
2100 MHz for 3G
Total Towers available with
Indus in Delhi - 135
• Indicative numbers and Coverage Ratios
• Please refer to slide 41 for the Analsys Mason table on Propagation effect of frequencies
14 of 42

Business Model Strengths
15 of 42
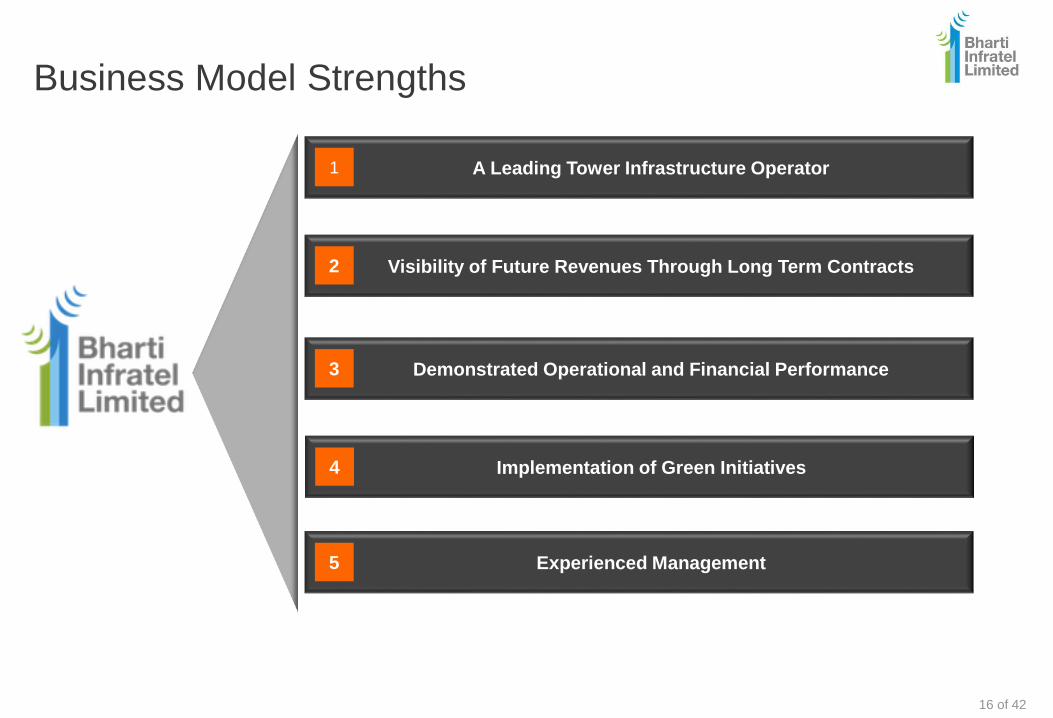
Business Model Strengths
A Leading Tower Infrastructure Operator1
Visibility of Future Revenues Through Long Term Contracts2
Demonstrated Operational and Financial Performance3
Implementation of Green Initiatives4
Experienced Management5
16 of 42
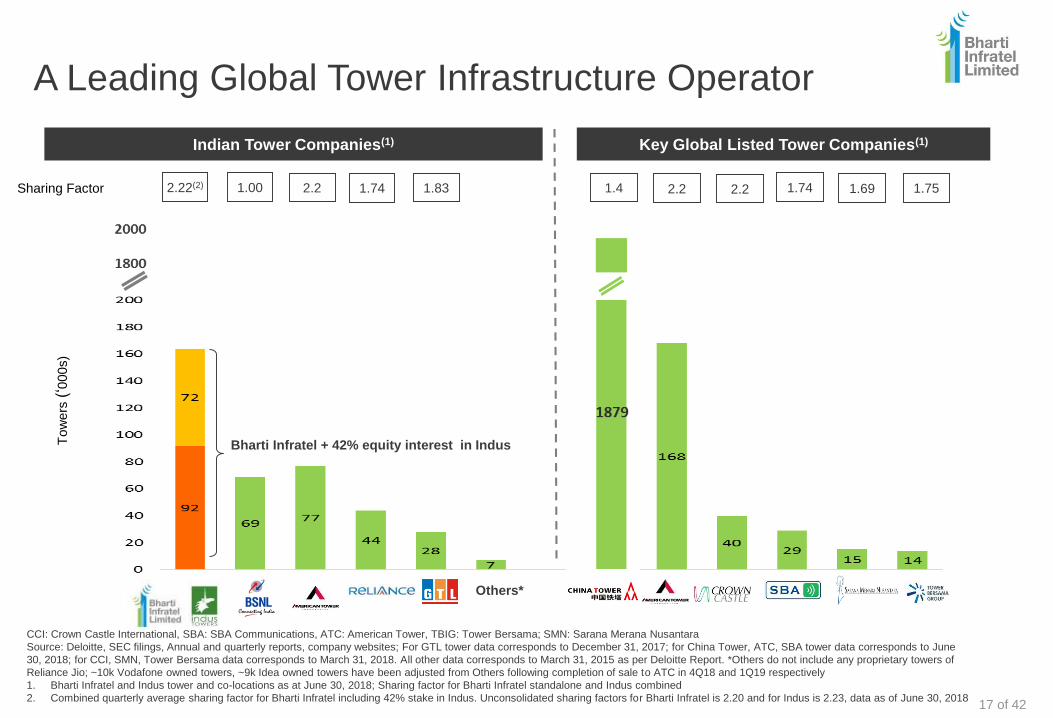
A Leading Global Tower Infrastructure OperatorT
ow
ers
(‘0
00s)
Indian Tower Companies(1) Key Global Listed Tower Companies(1)
1.74 1.692.22(2)
Others*
1.00 2.2 1.74 1.83 1.75
CCI: Crown Castle International, SBA: SBA Communications, ATC: American Tower, TBIG: Tower Bersama; SMN: Sarana Merana Nusantara
Source: Deloitte, SEC filings, Annual and quarterly reports, company websites; For GTL tower data corresponds to December 31, 2017; for China Tower, ATC, SBA tower data corresponds to June
30, 2018; for CCI, SMN, Tower Bersama data corresponds to March 31, 2018. All other data corresponds to March 31, 2015 as per Deloitte Report. *Others do not include any proprietary towers of
Reliance Jio; ~10k Vodafone owned towers, ~9k Idea owned towers have been adjusted from Others following completion of sale to ATC in 4Q18 and 1Q19 respectively
1. Bharti Infratel and Indus tower and co-locations as at June 30, 2018; Sharing factor for Bharti Infratel standalone and Indus combined
2. Combined quarterly average sharing factor for Bharti Infratel including 42% stake in Indus. Unconsolidated sharing factors for Bharti Infratel is 2.20 and for Indus is 2.23, data as of June 30, 2018
Sharing Factor 2.2 2.2
Bharti Infratel + 42% equity interest in Indus
17 of 42
1.4
1879
2000
1800
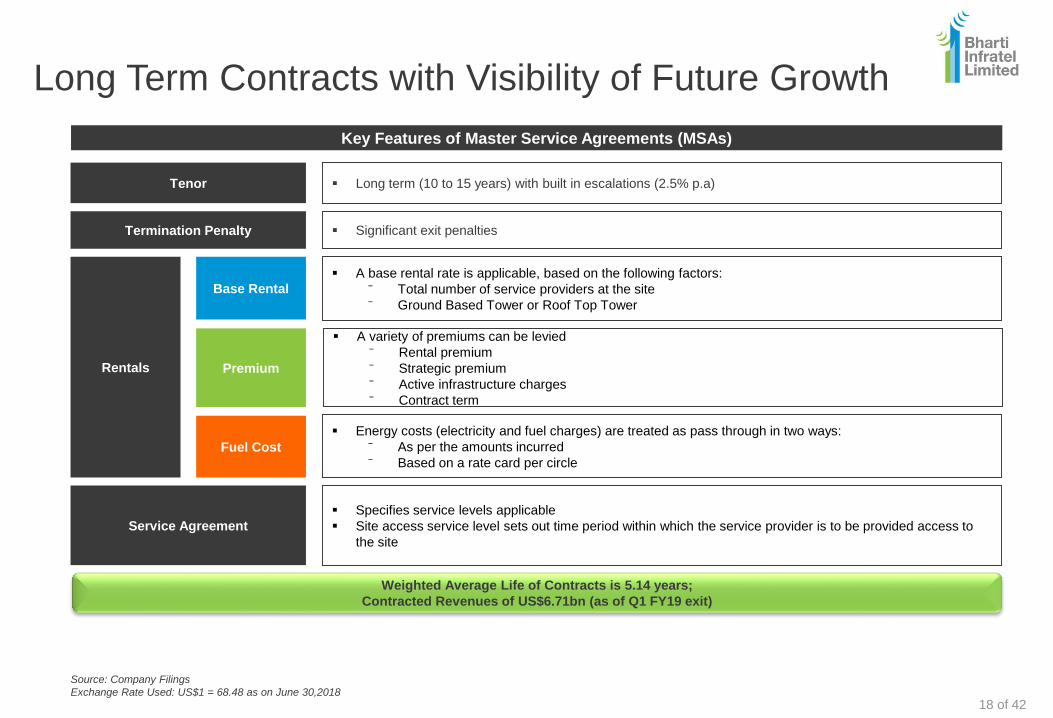
Long Term Contracts with Visibility of Future Growth
Source: Company Filings
Exchange Rate Used: US$1 = 68.48 as on June 30,2018
Tenor
Rentals
Base Rental
Long term (10 to 15 years) with built in escalations (2.5% p.a)
Termination Penalty Significant exit penalties
A base rental rate is applicable, based on the following factors:
⁻ Total number of service providers at the site
⁻ Ground Based Tower or Roof Top Tower
A variety of premiums can be levied
⁻ Rental premium
⁻ Strategic premium
⁻ Active infrastructure charges
⁻ Contract term
Energy costs (electricity and fuel charges) are treated as pass through in two ways:
⁻ As per the amounts incurred
⁻ Based on a rate card per circle
Specifies service levels applicable
Site access service level sets out time period within which the service provider is to be provided access to
the site
Premium
Fuel Cost
Service Agreement
Weighted Average Life of Contracts is 5.14 years;
Contracted Revenues of US$6.71bn (as of Q1 FY19 exit)
Key Features of Master Service Agreements (MSAs)
18 of 42
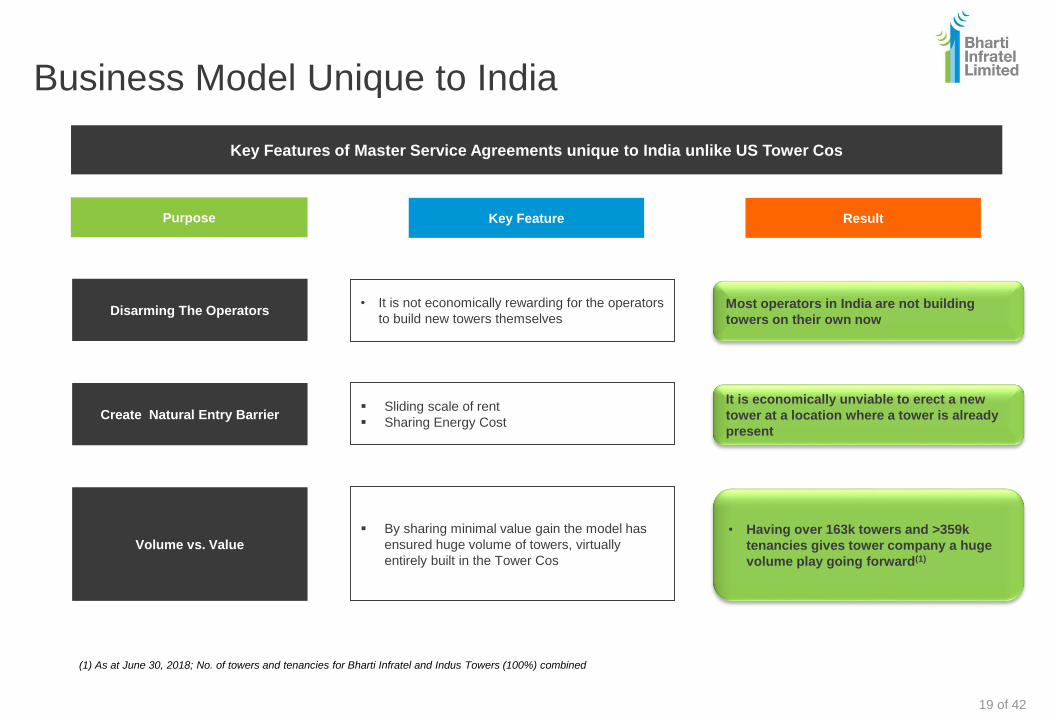
Business Model Unique to India
Disarming The Operators
Key Feature
• It is not economically rewarding for the operators
to build new towers themselves
Result
Most operators in India are not building
towers on their own now
Key Features of Master Service Agreements unique to India unlike US Tower Cos
Purpose
Create Natural Entry Barrier Sliding scale of rent
Sharing Energy Cost
It is economically unviable to erect a new
tower at a location where a tower is already
present
Volume vs. Value
By sharing minimal value gain the model has
ensured huge volume of towers, virtually
entirely built in the Tower Cos
• Having over 163k towers and >359k
tenancies gives tower company a huge
volume play going forward(1)
(1) As at June 30, 2018; No. of towers and tenancies for Bharti Infratel and Indus Towers (100%) combined
19 of 42
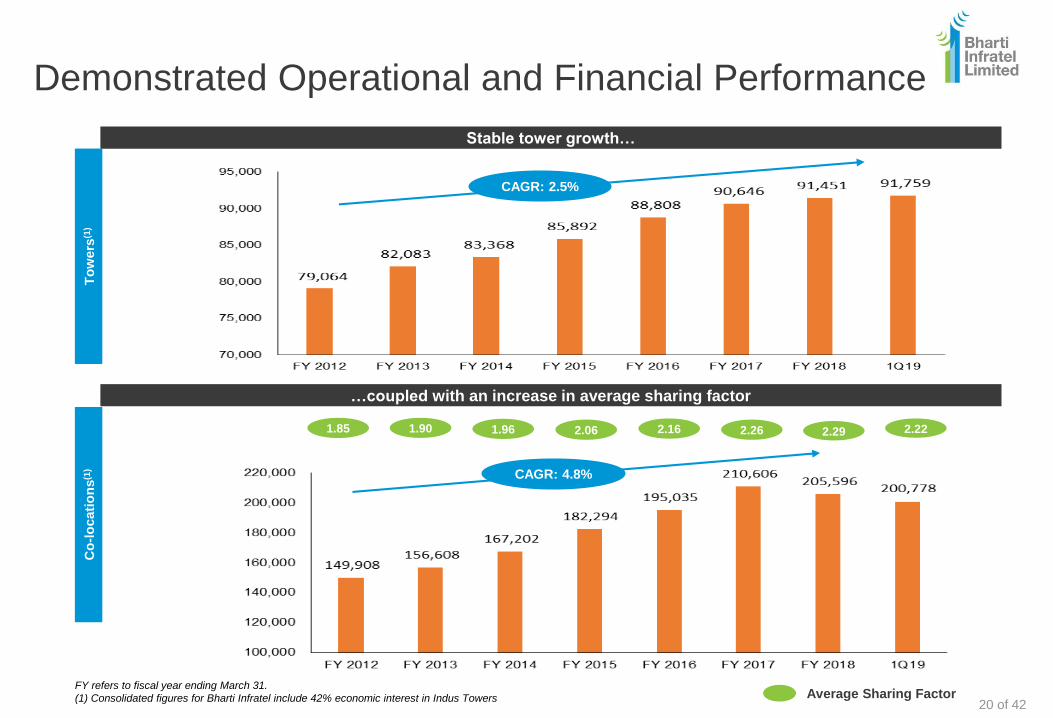
Demonstrated Operational and Financial PerformanceTow
ers
(1)
Co-locations
(1)
Stable tower growth…
…coupled with an increase in average sharing factor
To
wers
(1)
Co
-lo
cati
on
s(1
)
1.85 1.90 1.96 2.06 2.16 2.26
FY refers to fiscal year ending March 31.
(1) Consolidated figures for Bharti Infratel include 42% economic interest in Indus Towers Average Sharing Factor
2.29
CAGR: 2.5%
2.22
CAGR: 4.8%
20 of 42
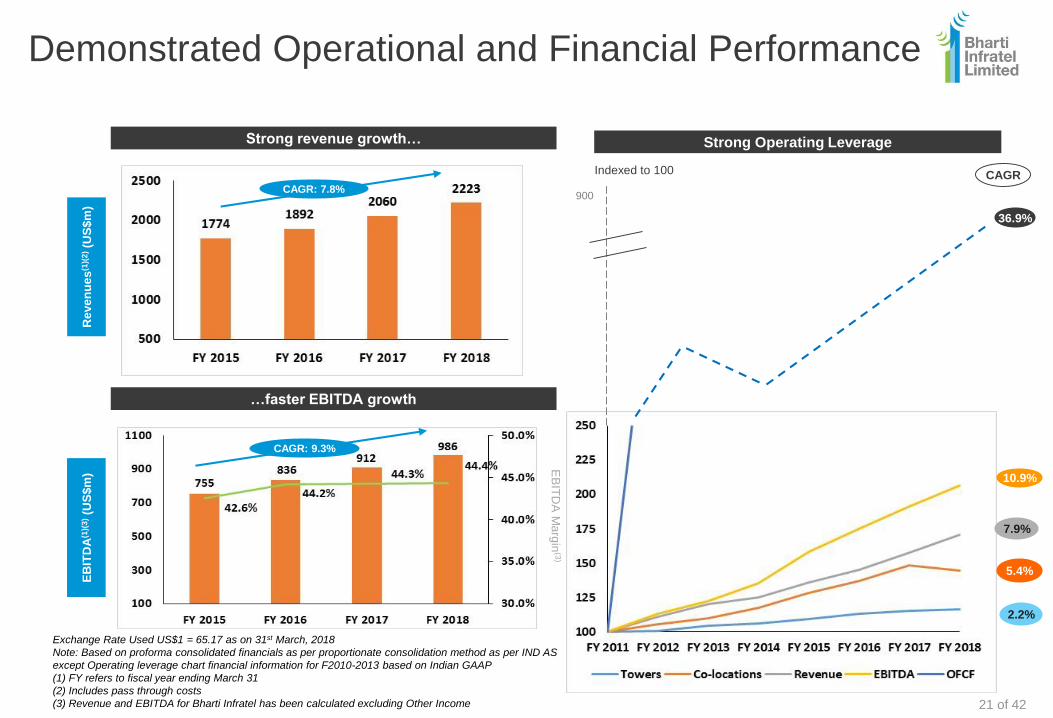
36.9%
Demonstrated Operational and Financial Performance
Strong Operating LeverageStrong revenue growth…
Reve
nu
es
(1)(
2)(U
S$m
)
…faster EBITDA growth
EB
ITD
A(1
)(3
)(U
S$m
)
EB
ITD
A M
arg
in(3
)
CAGRIndexed to 100
10.9%
7.9%
5.4%
2.2%
Exchange Rate Used US$1 = 65.17 as on 31st March, 2018
Note: Based on proforma consolidated financials as per proportionate consolidation method as per IND AS
except Operating leverage chart financial information for F2010-2013 based on Indian GAAP
(1) FY refers to fiscal year ending March 31
(2) Includes pass through costs
(3) Revenue and EBITDA for Bharti Infratel has been calculated excluding Other Income
900CAGR: 7.8%
CAGR: 9.3%
21 of 42
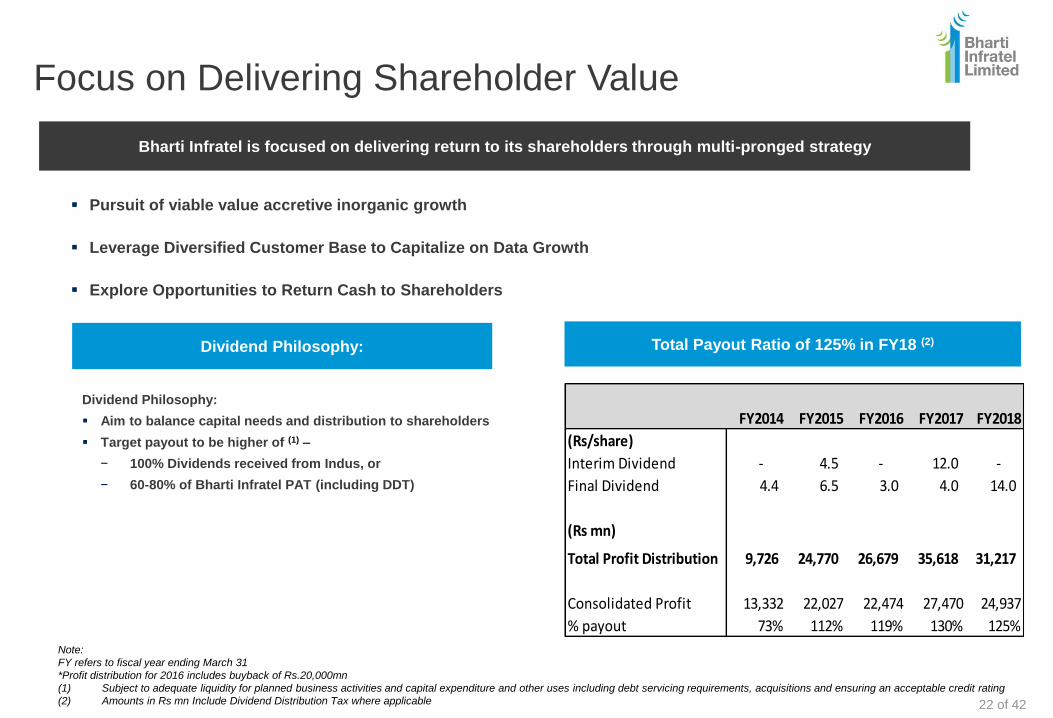
Focus on Delivering Shareholder Value
Dividend Philosophy:
Aim to balance capital needs and distribution to shareholders
Target payout to be higher of (1) –
− 100% Dividends received from Indus, or
− 60-80% of Bharti Infratel PAT (including DDT)
Note:
FY refers to fiscal year ending March 31
*Profit distribution for 2016 includes buyback of Rs.20,000mn
(1) Subject to adequate liquidity for planned business activities and capital expenditure and other uses including debt servicing requirements, acquisitions and ensuring an acceptable credit rating
(2) Amounts in Rs mn Include Dividend Distribution Tax where applicable
Dividend Philosophy:
Pursuit of viable value accretive inorganic growth
Leverage Diversified Customer Base to Capitalize on Data Growth
Explore Opportunities to Return Cash to Shareholders
Bharti Infratel is focused on delivering return to its shareholders through multi-pronged strategy
Total Payout Ratio of 125% in FY18 (2)
FY2014 FY2015 FY2016 FY2017 FY2018
(Rs/share)
Interim Dividend - 4.5 - 12.0 -
Final Dividend 4.4 6.5 3.0 4.0 14.0
(Rs mn)
Total Profit Distribution 9,726 24,770 26,679 35,618 31,217
Consolidated Profit 13,332 22,027 22,474 27,470 24,937
% payout 73% 112% 119% 130% 125%
22 of 42
New opportunities for Telecom Infrastructure
development under ‘Smart Cities’ Project
Development of Smart Cities key for ‘Digital India’ Program
Government has announced the creation of 100 Smart Cities
Communication backbone is key to a Smart City
Entails setting up of telecom infrastructure which will include towers, micro sites and fiberized backhaul
Essentials include 100% coverage of area by cell phone towers coupled with fiber as a backhaul
Expectations from Smart City also include wide availability of Wi-Fi, fiber optic connectivity to home, etc.
Smart City usual business activity for Infratel, however counterparty and business model may vary from project to project
Infratel and Indus have won Smart City bids and are working towards successful project deliveries
Infratel led Consortium is executing Bhopal Smart City project where acceptance testing has been initiated in phases
Indus is also rolling out Smart city projects in Vadodara and New Delhi Municipal Corporation area
Paves the way for both companies to participate in similar bids in the future
Opening up new business avenues wherein benefits of the shared infrastructure model can be replicated
Shall assess opportunities in accordance with the Company philosophy and are value accretive
Best positioned given large footprint, strong balance sheet, relationship with leading operators and proven skills to manage
distributed operations
23 of 42
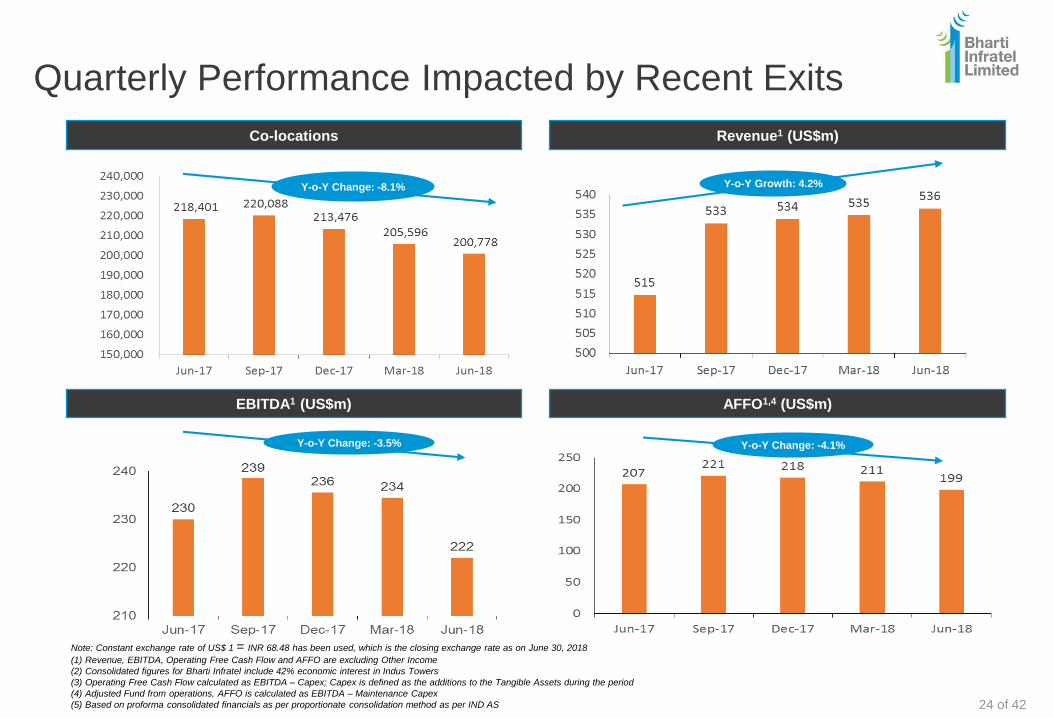
Quarterly Performance Impacted by Recent Exits
Co-locations
EBITDA1 (US$m)
Revenue1 (US$m)
AFFO1,4 (US$m)
Note: Constant exchange rate of US$ 1 = INR 68.48 has been used, which is the closing exchange rate as on June 30, 2018
(1) Revenue, EBITDA, Operating Free Cash Flow and AFFO are excluding Other Income
(2) Consolidated figures for Bharti Infratel include 42% economic interest in Indus Towers
(3) Operating Free Cash Flow calculated as EBITDA – Capex; Capex is defined as the additions to the Tangible Assets during the period
(4) Adjusted Fund from operations, AFFO is calculated as EBITDA – Maintenance Capex
(5) Based on proforma consolidated financials as per proportionate consolidation method as per IND AS
Y-o-Y Growth: 4.2%Y-o-Y Change: -8.1%
Y-o-Y Change: -3.5% Y-o-Y Change: -4.1%
24 of 42
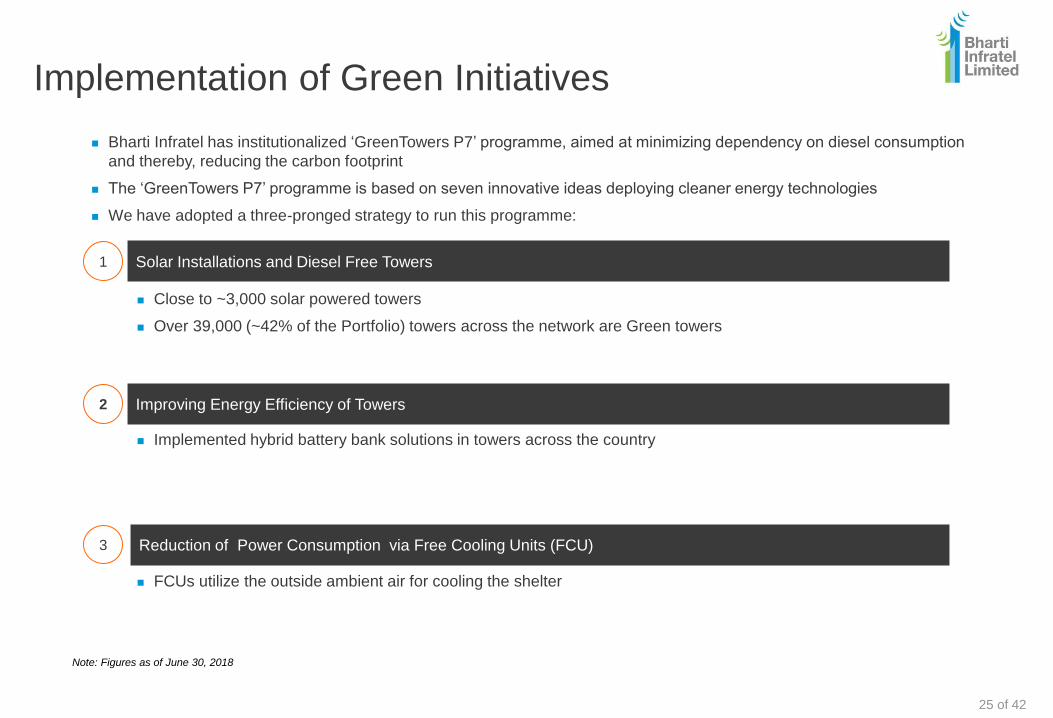
Implementation of Green Initiatives
Bharti Infratel has institutionalized ‘GreenTowers P7’ programme, aimed at minimizing dependency on diesel consumption
and thereby, reducing the carbon footprint
The ‘GreenTowers P7’ programme is based on seven innovative ideas deploying cleaner energy technologies
We have adopted a three-pronged strategy to run this programme:
Solar Installations and Diesel Free Towers1
Close to ~3,000 solar powered towers
Over 39,000 (~42% of the Portfolio) towers across the network are Green towers
Improving Energy Efficiency of Towers2
Implemented hybrid battery bank solutions in towers across the country
Reduction of Power Consumption via Free Cooling Units (FCU)3
FCUs utilize the outside ambient air for cooling the shelter
Note: Figures as of June 30, 2018
25 of 42
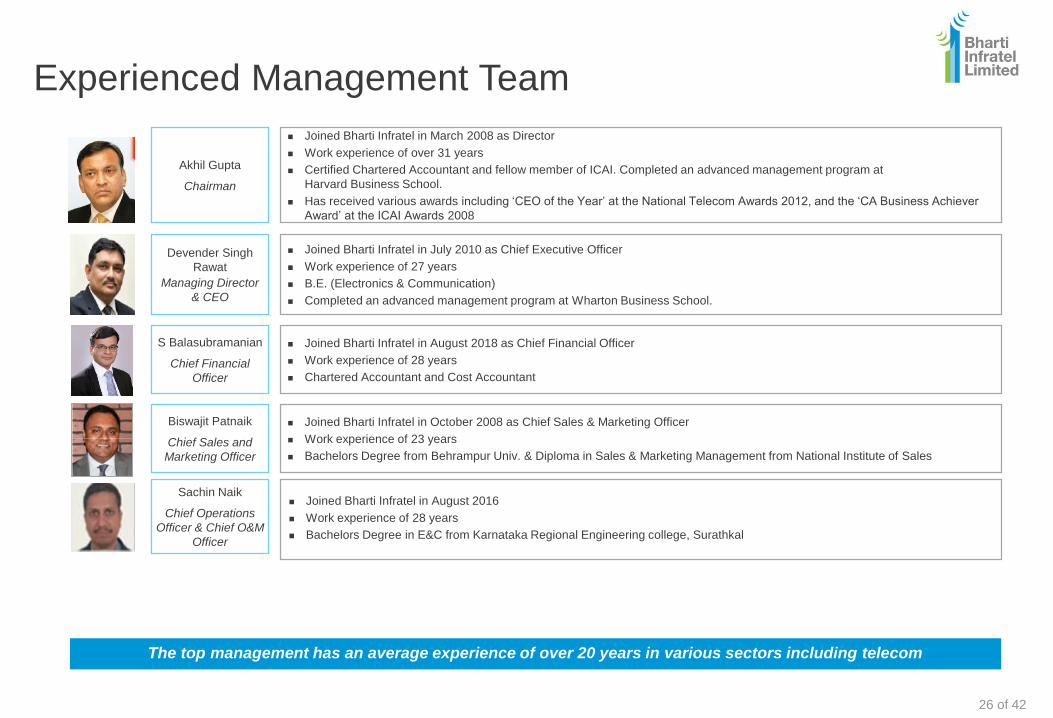
Experienced Management Team
Akhil Gupta
Chairman
Joined Bharti Infratel in March 2008 as Director
Work experience of over 31 years
Certified Chartered Accountant and fellow member of ICAI. Completed an advanced management program at
Harvard Business School.
Has received various awards including ‘CEO of the Year’ at the National Telecom Awards 2012, and the ‘CA Business Achiever
Award’ at the ICAI Awards 2008
S Balasubramanian
Chief Financial
Officer
Joined Bharti Infratel in August 2018 as Chief Financial Officer
Work experience of 28 years
Chartered Accountant and Cost Accountant
Biswajit Patnaik
Chief Sales and
Marketing Officer
Joined Bharti Infratel in October 2008 as Chief Sales & Marketing Officer
Work experience of 23 years
Bachelors Degree from Behrampur Univ. & Diploma in Sales & Marketing Management from National Institute of Sales
The top management has an average experience of over 20 years in various sectors including telecom
Devender Singh
Rawat
Managing Director
& CEO
Joined Bharti Infratel in July 2010 as Chief Executive Officer
Work experience of 27 years
B.E. (Electronics & Communication)
Completed an advanced management program at Wharton Business School.
Sachin Naik
Chief Operations
Officer & Chief O&M
Officer
Joined Bharti Infratel in August 2016
Work experience of 28 years
Bachelors Degree in E&C from Karnataka Regional Engineering college, Surathkal
26 of 42
CSR, Awards and Recognition
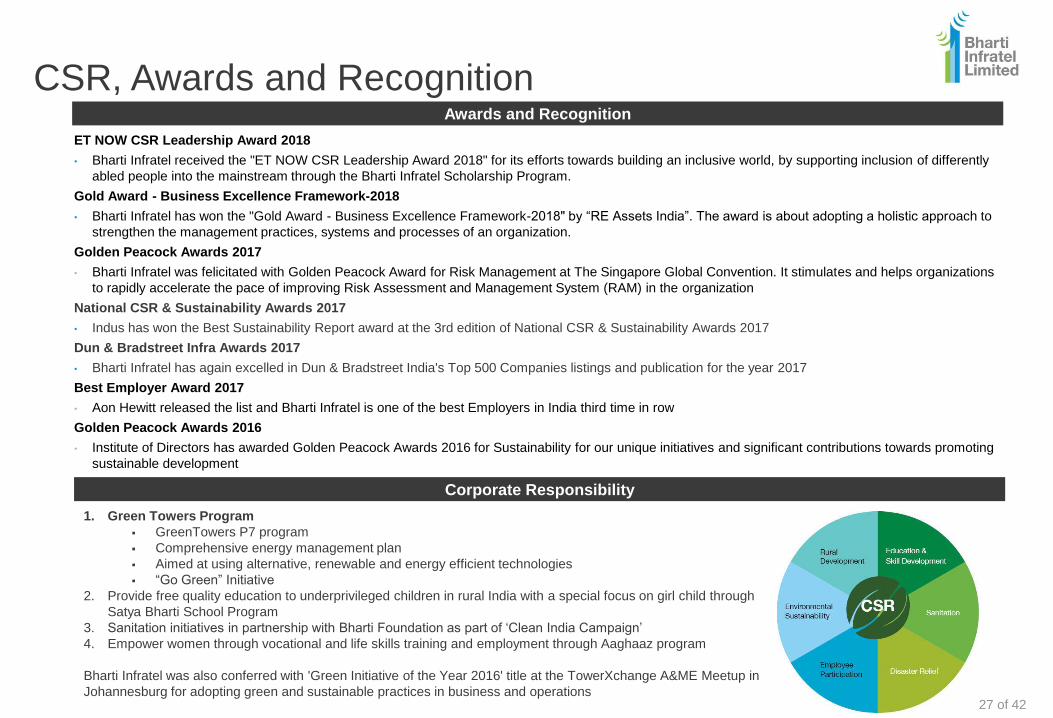
ET NOW CSR Leadership Award 2018
• Bharti Infratel received the "ET NOW CSR Leadership Award 2018" for its efforts towards building an inclusive world, by supporting inclusion of differently
abled people into the mainstream through the Bharti Infratel Scholarship Program.
Gold Award - Business Excellence Framework-2018
• Bharti Infratel has won the "Gold Award - Business Excellence Framework-2018" by “RE Assets India”. The award is about adopting a holistic approach to
strengthen the management practices, systems and processes of an organization.
Golden Peacock Awards 2017
• Bharti Infratel was felicitated with Golden Peacock Award for Risk Management at The Singapore Global Convention. It stimulates and helps organizations
to rapidly accelerate the pace of improving Risk Assessment and Management System (RAM) in the organization
National CSR & Sustainability Awards 2017
• Indus has won the Best Sustainability Report award at the 3rd edition of National CSR & Sustainability Awards 2017
Dun & Bradstreet Infra Awards 2017
• Bharti Infratel has again excelled in Dun & Bradstreet India's Top 500 Companies listings and publication for the year 2017
Best Employer Award 2017
• Aon Hewitt released the list and Bharti Infratel is one of the best Employers in India third time in row
Golden Peacock Awards 2016
• Institute of Directors has awarded Golden Peacock Awards 2016 for Sustainability for our unique initiatives and significant contributions towards promoting
sustainable development
Awards and Recognition
1. Green Towers Program
GreenTowers P7 program
Comprehensive energy management plan
Aimed at using alternative, renewable and energy efficient technologies
“Go Green” Initiative
2. Provide free quality education to underprivileged children in rural India with a special focus on girl child through
Satya Bharti School Program
3. Sanitation initiatives in partnership with Bharti Foundation as part of ‘Clean India Campaign’
4. Empower women through vocational and life skills training and employment through Aaghaaz program
Bharti Infratel was also conferred with 'Green Initiative of the Year 2016' title at the TowerXchange A&ME Meetup in
Johannesburg for adopting green and sustainable practices in business and operations
Corporate Responsibility
27 of 42
Proposed Merger with Indus
28 of 42
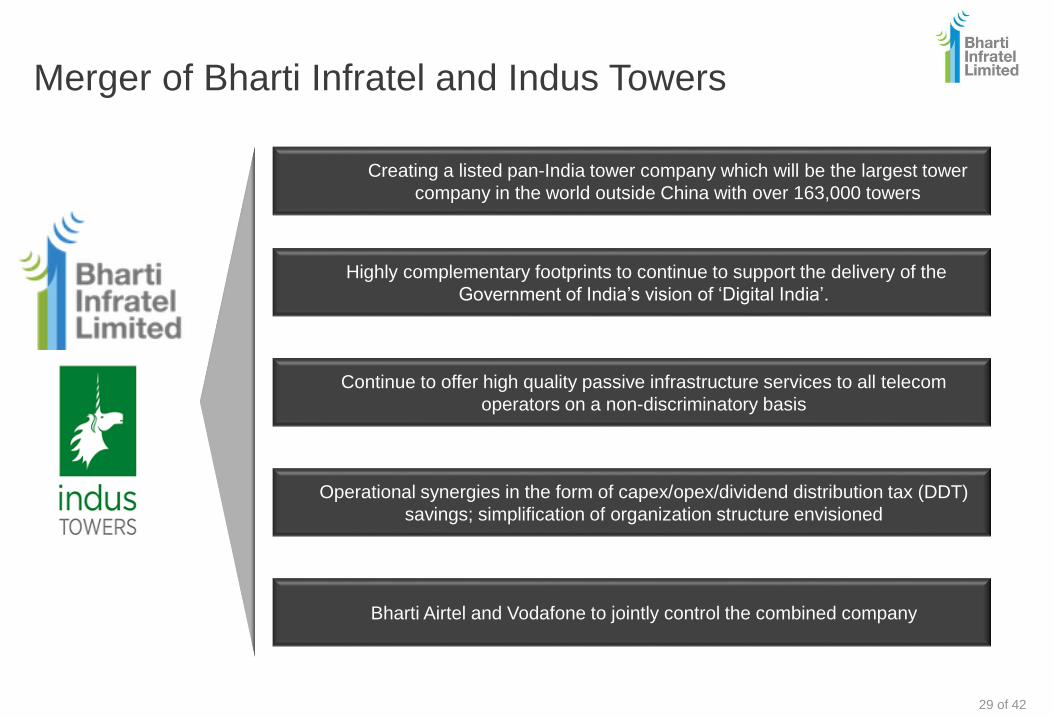
Merger of Bharti Infratel and Indus Towers
Creating a listed pan-India tower company which will be the largest tower
company in the world outside China with over 163,000 towers
Highly complementary footprints to continue to support the delivery of the
Government of India’s vision of ‘Digital India’.
Continue to offer high quality passive infrastructure services to all telecom
operators on a non-discriminatory basis
Operational synergies in the form of capex/opex/dividend distribution tax (DDT)
savings; simplification of organization structure envisioned
Bharti Airtel and Vodafone to jointly control the combined company
29 of 42
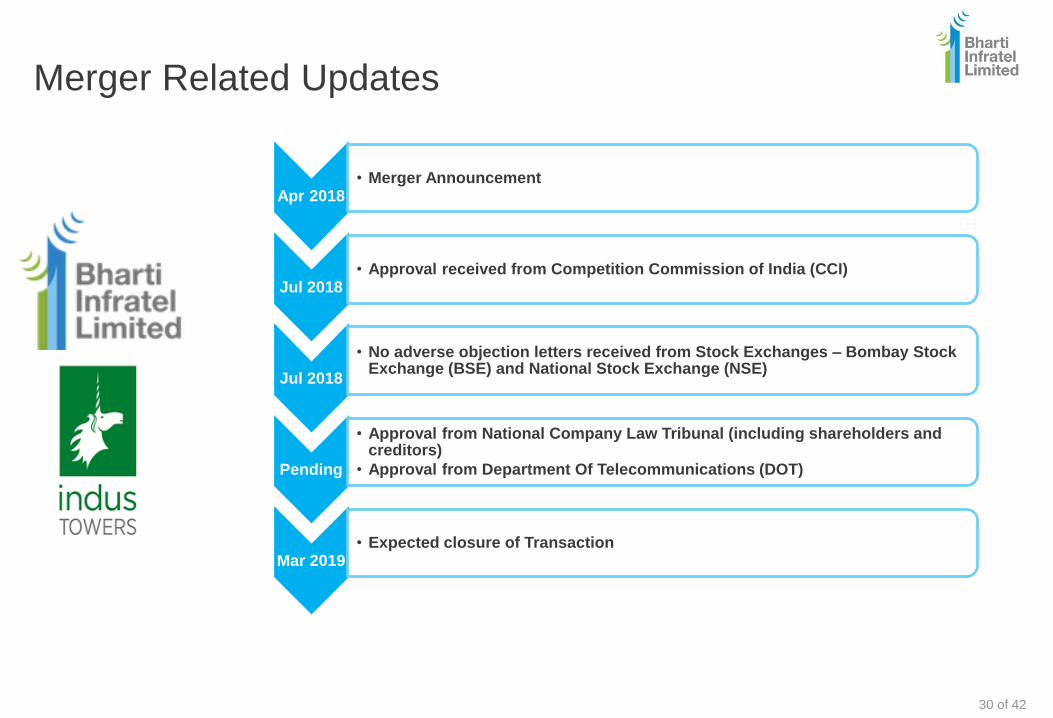
Merger Related Updates
Apr 2018• Merger Announcement
Jul 2018• Approval received from Competition Commission of India (CCI)
Jul 2018
• No adverse objection letters received from Stock Exchanges – Bombay Stock Exchange (BSE) and National Stock Exchange (NSE)
Pending
• Approval from National Company Law Tribunal (including shareholders and creditors)
• Approval from Department Of Telecommunications (DOT)
Mar 2019• Expected closure of Transaction
30 of 42
Key Highlights
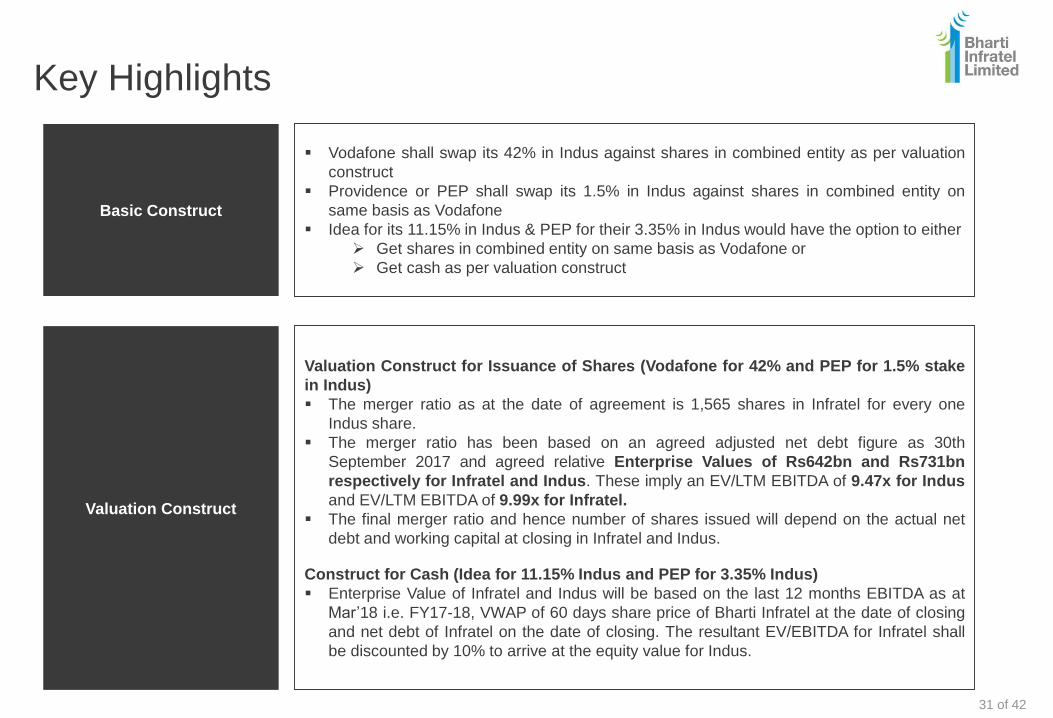
Basic Construct
Vodafone shall swap its 42% in Indus against shares in combined entity as per valuation
construct
Providence or PEP shall swap its 1.5% in Indus against shares in combined entity on
same basis as Vodafone
Idea for its 11.15% in Indus & PEP for their 3.35% in Indus would have the option to either
Get shares in combined entity on same basis as Vodafone or
Get cash as per valuation construct
Valuation Construct
Valuation Construct for Issuance of Shares (Vodafone for 42% and PEP for 1.5% stake
in Indus)
The merger ratio as at the date of agreement is 1,565 shares in Infratel for every one
Indus share.
The merger ratio has been based on an agreed adjusted net debt figure as 30th
September 2017 and agreed relative Enterprise Values of Rs642bn and Rs731bn
respectively for Infratel and Indus. These imply an EV/LTM EBITDA of 9.47x for Indus
and EV/LTM EBITDA of 9.99x for Infratel.
The final merger ratio and hence number of shares issued will depend on the actual net
debt and working capital at closing in Infratel and Indus.
Construct for Cash (Idea for 11.15% Indus and PEP for 3.35% Indus)
Enterprise Value of Infratel and Indus will be based on the last 12 months EBITDA as at
Mar’18 i.e. FY17-18, VWAP of 60 days share price of Bharti Infratel at the date of closing
and net debt of Infratel on the date of closing. The resultant EV/EBITDA for Infratel shall
be discounted by 10% to arrive at the equity value for Indus.
31 of 42
Other Highlights
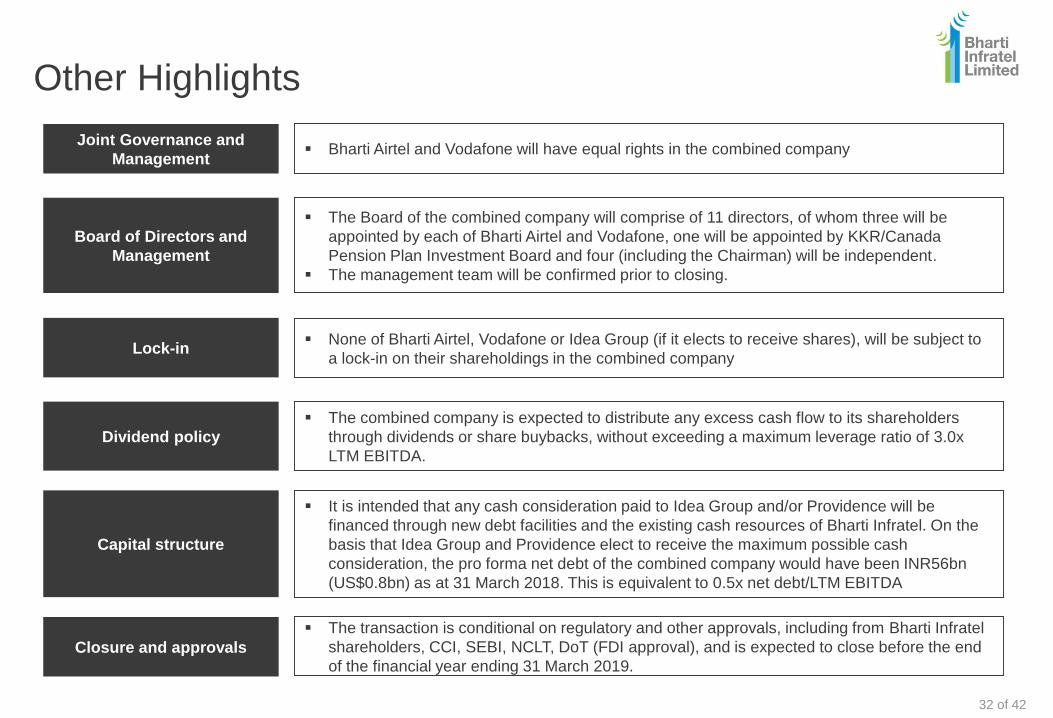
Joint Governance and
Management
Board of Directors and
Management
None of Bharti Airtel, Vodafone or Idea Group (if it elects to receive shares), will be subject to
a lock-in on their shareholdings in the combined company
Dividend policy
The combined company is expected to distribute any excess cash flow to its shareholders
through dividends or share buybacks, without exceeding a maximum leverage ratio of 3.0x
LTM EBITDA.
Capital structure
It is intended that any cash consideration paid to Idea Group and/or Providence will be
financed through new debt facilities and the existing cash resources of Bharti Infratel. On the
basis that Idea Group and Providence elect to receive the maximum possible cash
consideration, the pro forma net debt of the combined company would have been INR56bn
(US$0.8bn) as at 31 March 2018. This is equivalent to 0.5x net debt/LTM EBITDA
Bharti Airtel and Vodafone will have equal rights in the combined company
The Board of the combined company will comprise of 11 directors, of whom three will be
appointed by each of Bharti Airtel and Vodafone, one will be appointed by KKR/Canada
Pension Plan Investment Board and four (including the Chairman) will be independent.
The management team will be confirmed prior to closing.
Lock-in
The transaction is conditional on regulatory and other approvals, including from Bharti Infratel
shareholders, CCI, SEBI, NCLT, DoT (FDI approval), and is expected to close before the end
of the financial year ending 31 March 2019.
Closure and approvals
32 of 42
Illustrative Scenarios
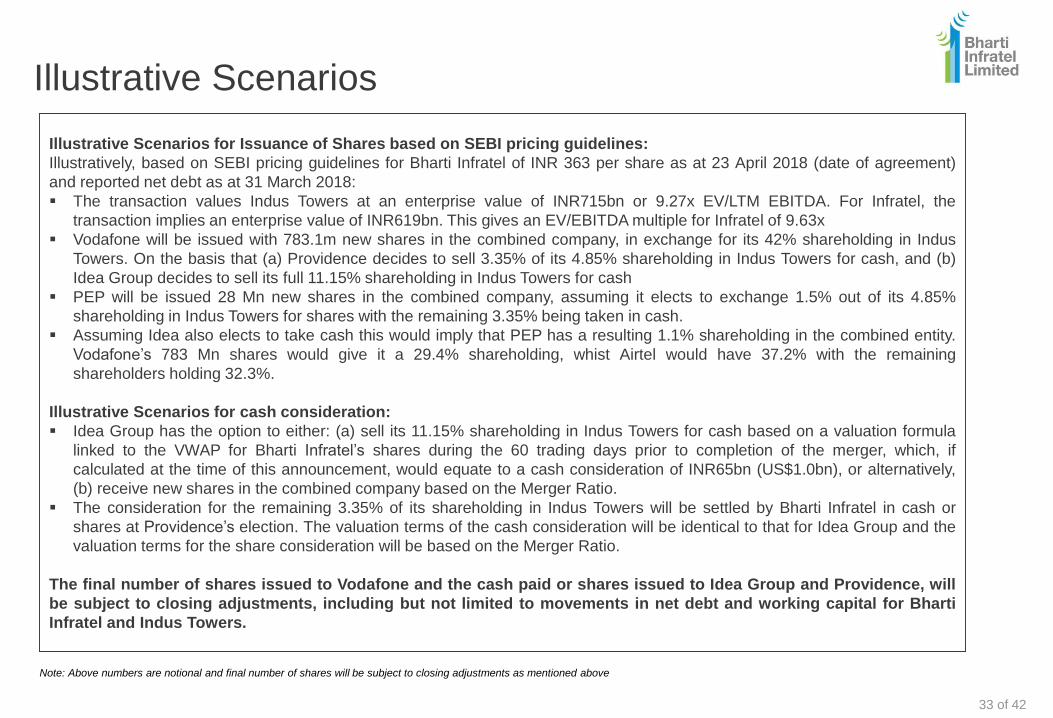
Illustrative Scenarios for Issuance of Shares based on SEBI pricing guidelines:
Illustratively, based on SEBI pricing guidelines for Bharti Infratel of INR 363 per share as at 23 April 2018 (date of agreement)
and reported net debt as at 31 March 2018:
The transaction values Indus Towers at an enterprise value of INR715bn or 9.27x EV/LTM EBITDA. For Infratel, the
transaction implies an enterprise value of INR619bn. This gives an EV/EBITDA multiple for Infratel of 9.63x
Vodafone will be issued with 783.1m new shares in the combined company, in exchange for its 42% shareholding in Indus
Towers. On the basis that (a) Providence decides to sell 3.35% of its 4.85% shareholding in Indus Towers for cash, and (b)
Idea Group decides to sell its full 11.15% shareholding in Indus Towers for cash
PEP will be issued 28 Mn new shares in the combined company, assuming it elects to exchange 1.5% out of its 4.85%
shareholding in Indus Towers for shares with the remaining 3.35% being taken in cash.
Assuming Idea also elects to take cash this would imply that PEP has a resulting 1.1% shareholding in the combined entity.
Vodafone’s 783 Mn shares would give it a 29.4% shareholding, whist Airtel would have 37.2% with the remaining
shareholders holding 32.3%.
Illustrative Scenarios for cash consideration:
Idea Group has the option to either: (a) sell its 11.15% shareholding in Indus Towers for cash based on a valuation formula
linked to the VWAP for Bharti Infratel’s shares during the 60 trading days prior to completion of the merger, which, if
calculated at the time of this announcement, would equate to a cash consideration of INR65bn (US$1.0bn), or alternatively,
(b) receive new shares in the combined company based on the Merger Ratio.
The consideration for the remaining 3.35% of its shareholding in Indus Towers will be settled by Bharti Infratel in cash or
shares at Providence’s election. The valuation terms of the cash consideration will be identical to that for Idea Group and the
valuation terms for the share consideration will be based on the Merger Ratio.
The final number of shares issued to Vodafone and the cash paid or shares issued to Idea Group and Providence, will
be subject to closing adjustments, including but not limited to movements in net debt and working capital for Bharti
Infratel and Indus Towers.
Note: Above numbers are notional and final number of shares will be subject to closing adjustments as mentioned above
33 of 42
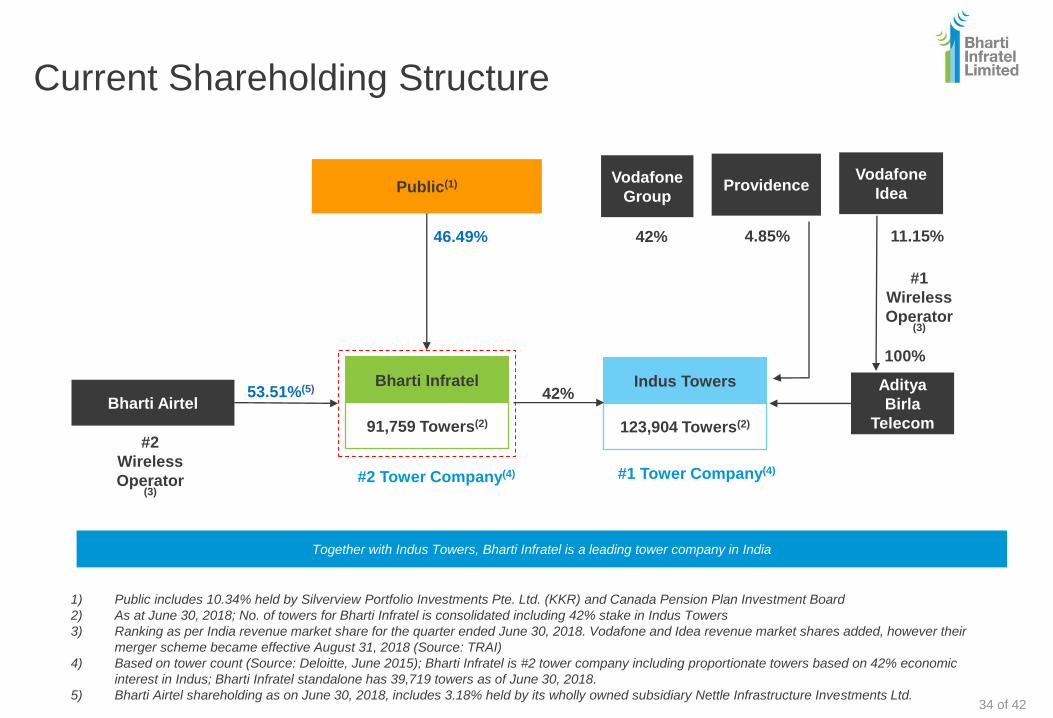
Current Shareholding Structure
1) Public includes 10.34% held by Silverview Portfolio Investments Pte. Ltd. (KKR) and Canada Pension Plan Investment Board
2) As at June 30, 2018; No. of towers for Bharti Infratel is consolidated including 42% stake in Indus Towers
3) Ranking as per India revenue market share for the quarter ended June 30, 2018. Vodafone and Idea revenue market shares added, however their
merger scheme became effective August 31, 2018 (Source: TRAI)
4) Based on tower count (Source: Deloitte, June 2015); Bharti Infratel is #2 tower company including proportionate towers based on 42% economic
interest in Indus; Bharti Infratel standalone has 39,719 towers as of June 30, 2018.
5) Bharti Airtel shareholding as on June 30, 2018, includes 3.18% held by its wholly owned subsidiary Nettle Infrastructure Investments Ltd.
Together with Indus Towers, Bharti Infratel is a leading tower company in India
Bharti Airtel53.51%(5)
#2
Wireless
Operator(3)
Public(1)
46.49%
Bharti Infratel
91,759 Towers(2)
#2 Tower Company(4)
Aditya
Birla
Telecom
Vodafone
Group
Vodafone
Idea
42%
100%
#1
Wireless
Operator(3)
Indus Towers
123,904 Towers(2)
#1 Tower Company(4)
42%
11.15%
Providence
4.85%
34 of 42
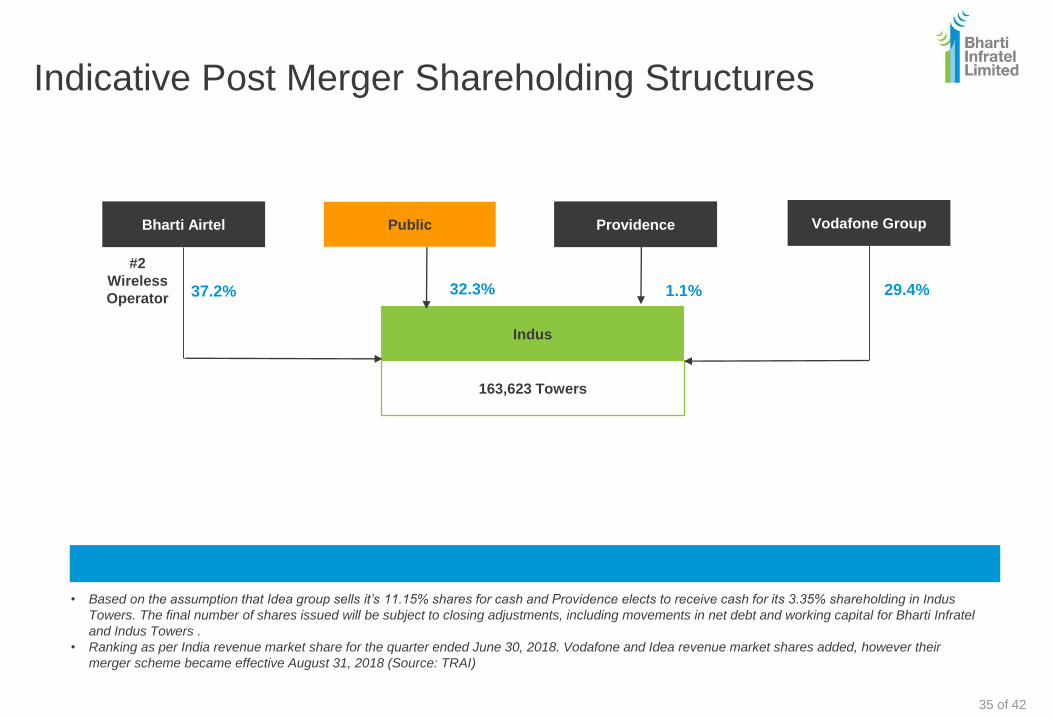
Indicative Post Merger Shareholding Structures
Indus
163,623 Towers
Bharti Airtel
#2
Wireless
Operator
Public Vodafone GroupProvidence
37.2% 29.4%1.1%32.3%
• Based on the assumption that Idea group sells it’s 11.15% shares for cash and Providence elects to receive cash for its 3.35% shareholding in Indus
Towers. The final number of shares issued will be subject to closing adjustments, including movements in net debt and working capital for Bharti Infratel
and Indus Towers .
• Ranking as per India revenue market share for the quarter ended June 30, 2018. Vodafone and Idea revenue market shares added, however their
merger scheme became effective August 31, 2018 (Source: TRAI)
35 of 42
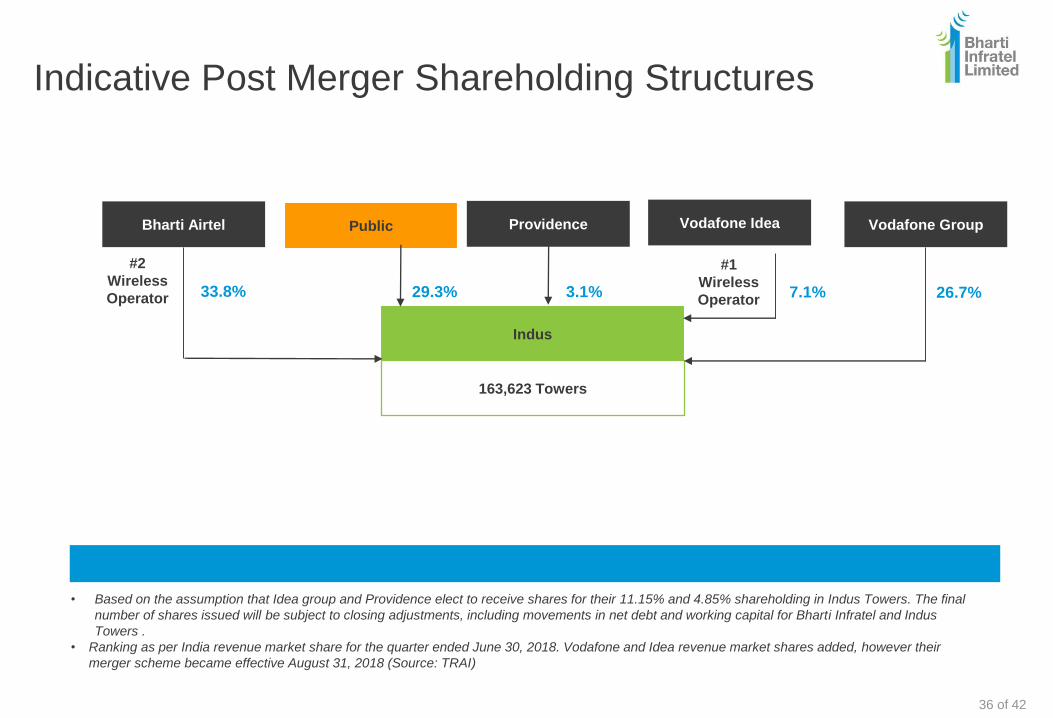
Indus
163,623 Towers
Bharti Airtel
#2
Wireless
Operator
Public Vodafone GroupProvidence
33.8% 26.7%3.1%29.3%
• Based on the assumption that Idea group and Providence elect to receive shares for their 11.15% and 4.85% shareholding in Indus Towers. The final
number of shares issued will be subject to closing adjustments, including movements in net debt and working capital for Bharti Infratel and Indus
Towers .
• Ranking as per India revenue market share for the quarter ended June 30, 2018. Vodafone and Idea revenue market shares added, however their
merger scheme became effective August 31, 2018 (Source: TRAI)
Vodafone Idea
#1
Wireless
Operator
Indicative Post Merger Shareholding Structures
7.1%
36 of 42

In Summary
37 of 42
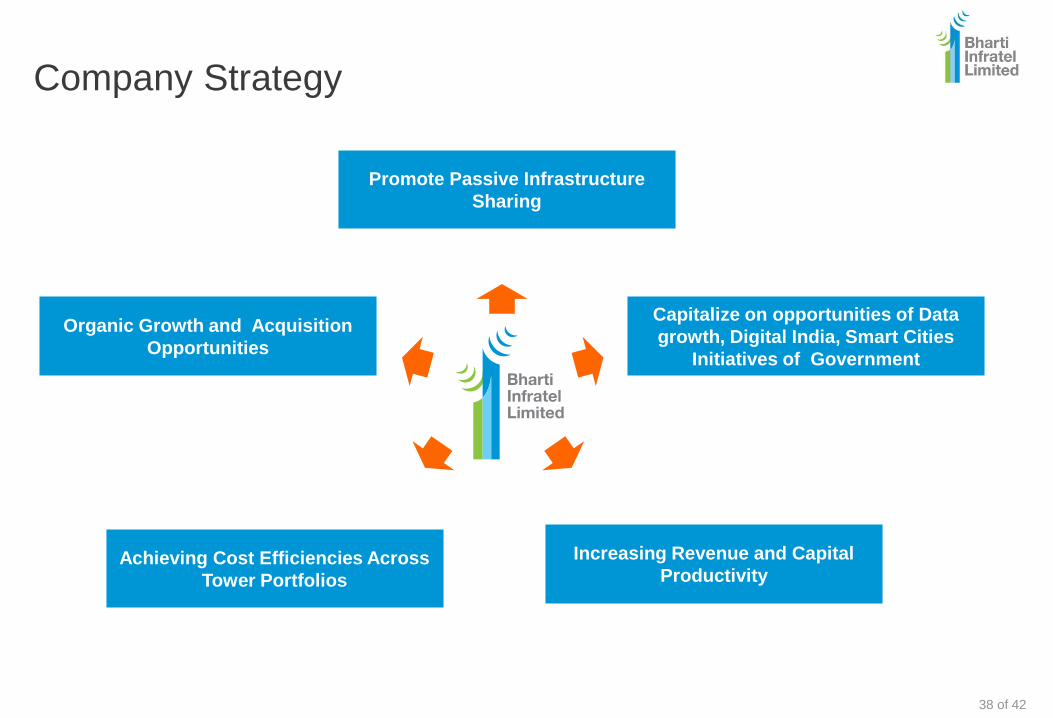
Company Strategy
Promote Passive Infrastructure
Sharing
Capitalize on opportunities of Data
growth, Digital India, Smart Cities
Initiatives of Government
Organic Growth and Acquisition
Opportunities
Increasing Revenue and Capital
ProductivityAchieving Cost Efficiencies Across
Tower Portfolios
38 of 42
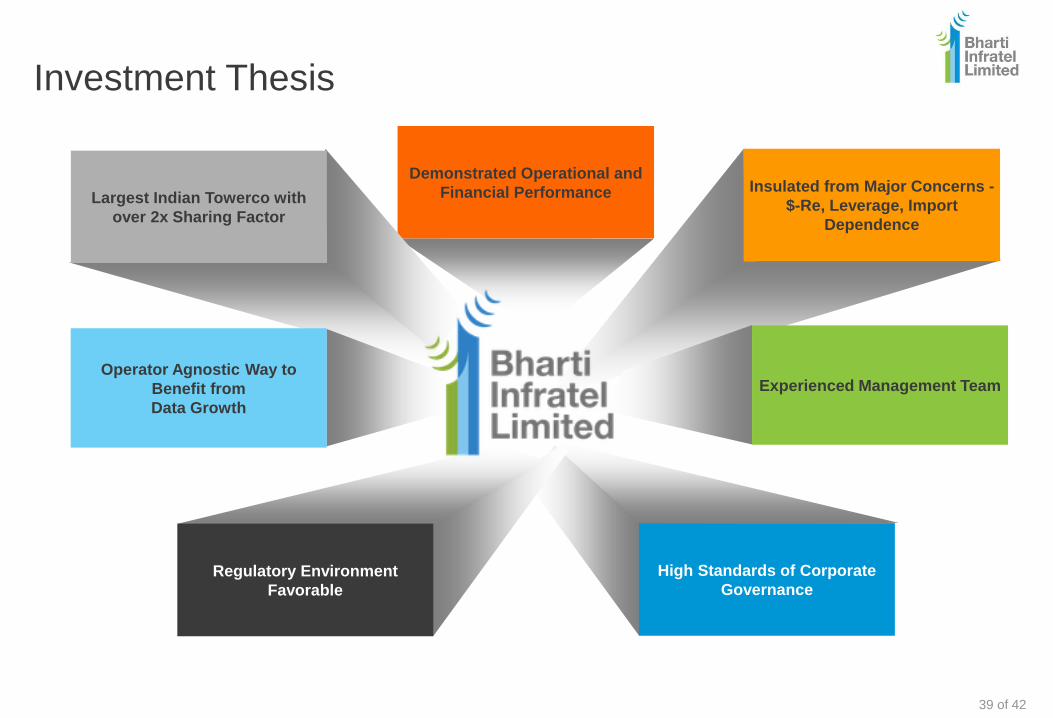
Investment Thesis
Demonstrated Operational and
Financial Performance Insulated from Major Concerns -
$-Re, Leverage, Import
Dependence
High Standards of Corporate
GovernanceRegulatory Environment
Favorable
Largest Indian Towerco with
over 2x Sharing Factor
Operator Agnostic Way to
Benefit from
Data Growth
Experienced Management Team
39 of 42

Appendix
40 of 42
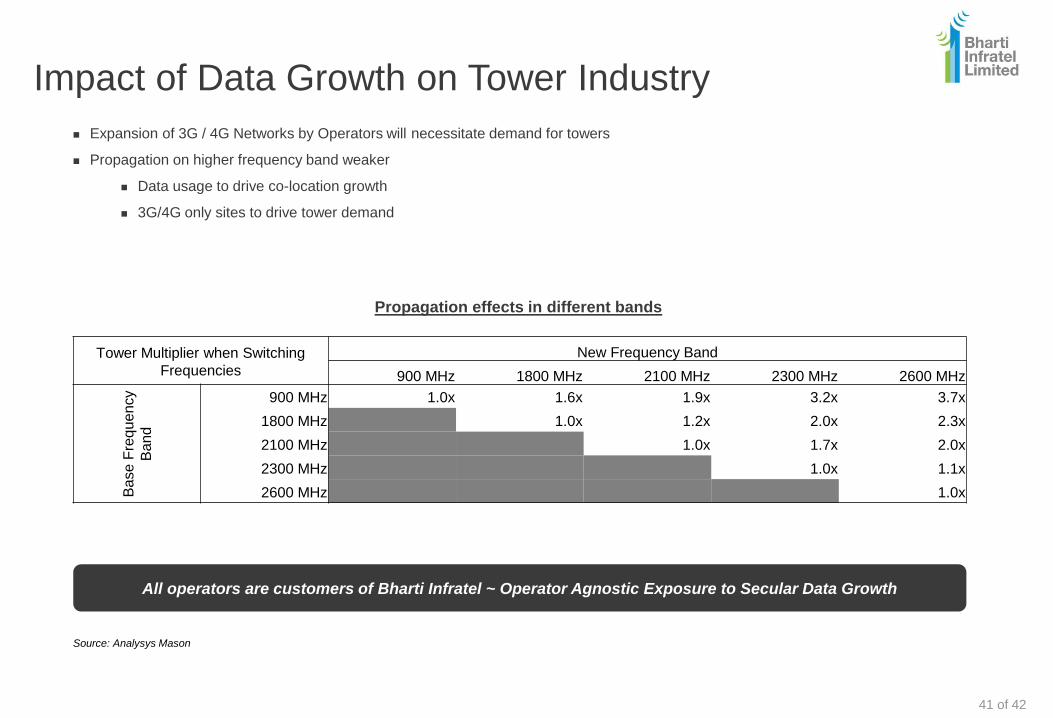
Impact of Data Growth on Tower Industry
Expansion of 3G / 4G Networks by Operators will necessitate demand for towers
Propagation on higher frequency band weaker
Data usage to drive co-location growth
3G/4G only sites to drive tower demand
Source: Analysys Mason
Propagation effects in different bands
All operators are customers of Bharti Infratel ~ Operator Agnostic Exposure to Secular Data Growth
Tower Multiplier when Switching
Frequencies
New Frequency Band
900 MHz 1800 MHz 2100 MHz 2300 MHz 2600 MHz
Ba
se F
req
uen
cy
Ba
nd
900 MHz 1.0x 1.6x 1.9x 3.2x 3.7x
1800 MHz 1.0x 1.2x 2.0x 2.3x
2100 MHz 1.0x 1.7x 2.0x
2300 MHz 1.0x 1.1x
2600 MHz 1.0x
41 of 42
Building and Sharing Vital Infrastructure
Thank You