Implementações do algoritmo de Fortune para variantes do ...
Upload
khangminh22Category
view
2download
0
Fortune Securities Limited |Equity Research
Indus Motor Company (INDU)
Repositioning to brace growth We re-initiate coverage on Indus Motor Company Ltd (INDU) with a BUY stance based on our DCF based Jun’21 Target Price of PKR 1,708/share. Our valuation implies an upside of 26.1% besides a forward dividend yield of 6.3% in FY21. This translates into a TSR of 32.4%. Theme of economic recovery is expected to play out in favour of the automobile sector, underpinned by low cost of consumer loans and a stable exchange rate. Pakistan, being a consumer economy, is slated to witness strong auto demand growth for long-term. INDU is poised to be a major beneficiary from an expected sharp recovery of 48% in auto demand, thereby continuing a 14.5% CAGR over FY21-25.We expect earnings to recover 86% in FY21 to PKR 120.42/share, gaining momentum over our investment case horizon and reaching of PKR 199.5/share in FY23 near to historical high. INDU trades at a forward PE of 11.2x/8.8x for FY21-22 offering DPS of PKR 85.0 & 110.0 over FY21-22. Our investment case relies on:
Repositioning: INDU has introduced Yaris to reposition its space in the 1.3L
and 1.5L category. Corolla, the star product, will stay in the product portfolio
and only compete in 1.6L and 1.8L category. Yaris is expected to solidify its
market share upto 39% as it takes on Corolla sales from lower cylinder
capacity category
Capacity expansion: In an anticipation of strong volumetric growth, INDU
has incurred a whopping capex during last two years to increase their
production capacity to 80,000 units on double shift basis
Cheap consumer financing: Volumetric growth from auto-financing is yet to
blossom as banks have just started rolling out attractive schemes;
outstanding auto loans stand at PKR 215bn (2% FY21TD) against Feb’20 peak
of PKR 219bn. INDU’s allocation of auto-financing cumulates to 30% of total
sales indicating strong recovery projections in the medium term
Strong cash generation: Pre-bookings are expected to sustain over
investment horizon rendering a cash rich balance sheet and healthy interest
income
Key Risks: Major downside risks to our investment thesis include: 1) lower than expected volumetric sales growth, 2) inability to pass on devaluation impact to end consumers, 3) intense competition from new players in sedan category, and 4) aggressive monetary tightening.
17th September’ 2020
tph June, 2015
REP-070
INDU FY18A FY19A FY20A FY21E FY22E FY23E
Net Sales (PKR mn) 139,715 157,996 86,167 138,194 171,419 211,570
Units sold (units) 63,068 65,399 28,378 47,006 55,264 64,777
Gross margin (%) 17.1% 12.1% 8.6% 10.7% 11.3% 12.0%
EBITDA margin (%) 15.1% 10.7% 8.1% 9.7% 10.0% 10.3%
PAT (PKR mn) 15,772 13,715 5,082 9,465 12,076 15,681
EPS (PKR) 200.7 174.5 64.7 120.4 153.6 199.5
DPS (PKR) 140.0 115.0 30.0 85.0 110.0 140.0
Dividend Yield (%) 8.1% 8.9% 2.9% 6.3% 8.1% 10.3%
PE (x) 8.6 7.4 15.8 11.2 8.8 6.8
ROA (%) 21.6% 18.7% 7.0% 12.1% 14.9% 17.2%
ROE (%) 46.4% 35.7% 12.5% 21.7% 25.1% 29.5%
EV/EBITDA (x) 3.7 4.5 5.5 4.8 3.5 2.5
Source: Company Accounts, Fortune Research
Investment Case
Target Price 1,708.0 Stance BUY
Performance (%) 1M 3M 12M
Absolute 1.4 41.1 35.8
Relative -5.8 12.0 1.3
52-week Performance
Key Stats
KATS Code INDU
Bloomberg Code INDU PA
Reuters Code INDM.KA
O/S shares (mn) 78.6
Market Cap (PKR'mn) 106,471
Market Cap (US$'mn) 641.4
Avg Daily Vol (000) 20.0
Free Float 17.0%
Current Price 1,354.6
Target Price 1,708.0
Upside to TP 26.1%
52 week range (PKR) 1,430.0-700.4
Rating BUY
Muqeet Naeem [email protected] (+92 21) 35309112
Fortune Securities Limited
Head Office 3rd Floor, Razi Tower, BC-13, Block No. 9, KDA Scheme No. 5 Clifton, Karachi Phone: (92 21) 35309101-09 Fax: (92 21)35309155
2|P a g e
Fortune Securities Limited |Equity Research
Indus Motor Company Ltd.
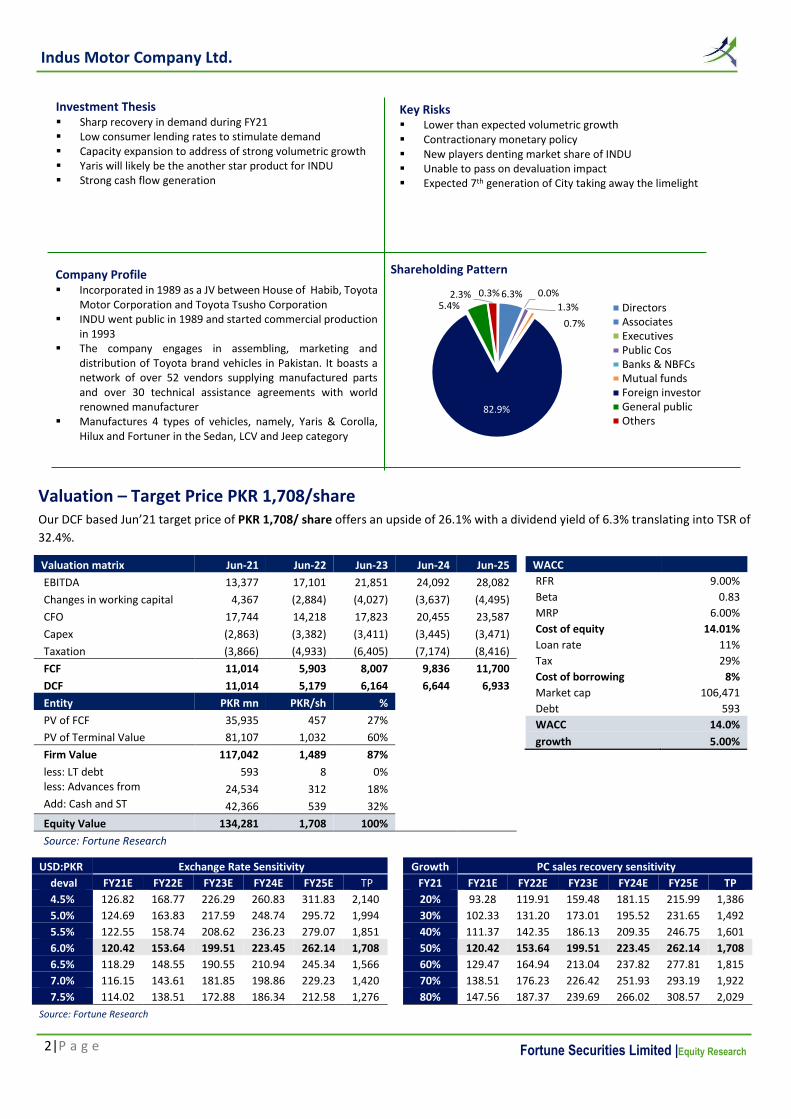
Valuation – Target Price PKR 1,708/share
Our DCF based Jun’21 target price of PKR 1,708/ share offers an upside of 26.1% with a dividend yield of 6.3% translating into TSR of
32.4%.
Valuation matrix Jun-21 Jun-22 Jun-23 Jun-24 Jun-25
EBITDA 13,377 17,101 21,851 24,092 28,082
Changes in working capital 4,367 (2,884) (4,027) (3,637) (4,495)
CFO 17,744 14,218 17,823 20,455 23,587
Capex (2,863) (3,382) (3,411) (3,445) (3,471)
Taxation (3,866) (4,933) (6,405) (7,174) (8,416)
FCF 11,014 5,903 8,007 9,836 11,700
DCF 11,014 5,179 6,164 6,644 6,933
Entity PKR mn PKR/sh %
PV of FCF 35,935 457 27%
PV of Terminal Value 81,107 1,032 60%
Firm Value 117,042 1,489 87%
less: LT debt 593 8 0% less: Advances from customers
24,534 312 18% Add: Cash and ST Investments
42,366 539 32%
Equity Value 134,281 1,708 100%
Source: Fortune Research
Shareholding Pattern
Key Risks Lower than expected volumetric growth Contractionary monetary policy New players denting market share of INDU Unable to pass on devaluation impact Expected 7th generation of City taking away the limelight
Investment Thesis Sharp recovery in demand during FY21 Low consumer lending rates to stimulate demand Capacity expansion to address of strong volumetric growth Yaris will likely be the another star product for INDU Strong cash flow generation
0.3% 6.3% 0.0%
1.3%
0.7%
82.9%
5.4%2.3%
DirectorsAssociatesExecutivesPublic CosBanks & NBFCsMutual fundsForeign investorGeneral publicOthers
Company Profile Incorporated in 1989 as a JV between House of Habib, Toyota
Motor Corporation and Toyota Tsusho Corporation INDU went public in 1989 and started commercial production
in 1993 The company engages in assembling, marketing and
distribution of Toyota brand vehicles in Pakistan. It boasts a network of over 52 vendors supplying manufactured parts and over 30 technical assistance agreements with world renowned manufacturer
Manufactures 4 types of vehicles, namely, Yaris & Corolla, Hilux and Fortuner in the Sedan, LCV and Jeep category
WACC
RFR 9.00%
Beta 0.83
MRP 6.00%
Cost of equity 14.01%
Loan rate 11%
Tax 29%
Cost of borrowing 8%
Market cap 106,471
Debt 593
WACC 14.0%
growth 5.00%
USD:PKR Exchange Rate Sensitivity Growth PC sales recovery sensitivity
deval FY21E FY22E FY23E FY24E FY25E TP FY21 FY21E FY22E FY23E FY24E FY25E TP
4.5% 126.82 168.77 226.29 260.83 311.83 2,140 20% 93.28 119.91 159.48 181.15 215.99 1,386
5.0% 124.69 163.83 217.59 248.74 295.72 1,994 30% 102.33 131.20 173.01 195.52 231.65 1,492
5.5% 122.55 158.74 208.62 236.23 279.07 1,851 40% 111.37 142.35 186.13 209.35 246.75 1,601
6.0% 120.42 153.64 199.51 223.45 262.14 1,708 50% 120.42 153.64 199.51 223.45 262.14 1,708
6.5% 118.29 148.55 190.55 210.94 245.34 1,566 60% 129.47 164.94 213.04 237.82 277.81 1,815
7.0% 116.15 143.61 181.85 198.86 229.23 1,420 70% 138.51 176.23 226.42 251.93 293.19 1,922
7.5% 114.02 138.51 172.88 186.34 212.58 1,276 80% 147.56 187.37 239.69 266.02 308.57 2,029
Source: Fortune Research

3|P a g e
Fortune Securities Limited |Equity Research
Indus Motor Company Ltd.
Tied up with GDP growth
Cyclicality of the auto industry is underpinned by its strong correlation with GDP growth
and monetary policy environment. Upon a decade long analysis of automobile demand
against GDP growth for the period FY10-19, we witnessed a GDP growth multiplier of
1.5x for volumetric automobile sales growth. GDP growth slowed down during FY19-20
backed by aggressive monetary tightening causing a massive decline in auto demand,
which was exacerbated by the outbreak of novel Coronavirus during FY20. However,
with the economy moving back on recovery road along with expansionary monetary
policy, we expect industry demand to recover by 48% during FY21.
Monetary easing brings auto financing to the forefront
Despite policy rate cut of 625 bps since Mar’20, auto financing is yet to materialize as
lockdown restrictions resulted in slow recovery of economic activity. Outstanding auto
loans stand at PKR 215bn (end Jul’20) – which are 40% of total consumer financing.
Auto financing has grown at a 5yr-CAGR of 30% (PKR 64bn to PKR 198bn) during the
period of FY13-18, when policy rate contracted from 12% to 5.75%. With policy rate
reverting to demand conducive level, we believe auto demand will be revitalised from
here onwards. It is pertinent to note that roughly 30% of INDU sales are contributed
by auto financing as per the management.
Auto demand growth has
increased with a GDP growth
multiplier of 1.5x over the
last 10 years
Source: PBS, PAMA, Fortune Research
Total Sales PC’s, LCVs Jeeps (units) – Per capita income (USD)
Source: PBS, PAMA, Fortune Research
Total Sales PC’s, LCVs Jeeps (units) – GDP growth rate %
Source: SBP, Fortune Research
Auto loans outstanding – Policy rates
Soft monetary stance by SBP
has always provided a strong
stimulus to auto demand;
increasing auto financing by
leaps and bounds

4|P a g e
Fortune Securities Limited |Equity Research
Indus Motor Company Ltd.
Utilizations peaked during the last boom
There exists massive potential for automobile assemblers in Pakistan, nonetheless, it
is skewed towards middle to high income groups. Industry car sales demand peaked
in FY18 at 258k units, accomodated mainly by three OEMs having combined capacity
of 255k units. Since then, demand started dwindling and finally hit the rock bottom in
FY20 at 112k units. Current capacity of three OEMs stands at 266k units with other
new entrants i.e. Kia Lucky Motors (Kia) and Hyundai Nishat Motors (Hyundai) further
enhancing supply by another 65k units.
Earlier the demand was entertained by three players with PSMC leading market share,
with INDU and HCAR rounding off the podium places.
Currency risk has dissipated considerably
Pakistan’s Current Account Deficit (CAD) reached an alarming levels of USD 19.2bn
(6.1% of GDP) while PKR remained overvalued against the greenback. The government
took strong measures to tame the current account and SBP adopted market-based
exchange rate to provide stability to the local currency; which started to devalue from
a fixed exchange rate regime. Currently the CAD stands in a soft zone of USD 2.97bn
(1.1% of GDP), causing us to have a bearish stance over any near-term currency
shocks.
Presently, the real effective exchange rate (REER) of PKR is below 100, illustrating an
undervalued scenario against USD. We do not expect significant devaluation going
forward as forex reserves provide adequate import cover in short-medium term.
Source: SBP, Fortune Research
Real effective exchange rate (REER)
Source: SBP, Fortune Research
CAD – devaluation %
Source: PAMA, Fortune Research
Market Shares of OEMs
Source: PAMA, Fortune Research
Industry Capacity Utilization
The utilization levels peaked in
FY18 and have come down
significantly due to adverse
economic conditions
USD:PKR has stabilized, albeit to
a greater extent, from what it
used to be a few years back
when CAD stood at USD 19.2bn
(6.1% of GDP). PKR currently
stands undervalued against USD

5|P a g e
Fortune Securities Limited |Equity Research
Indus Motor Company Ltd.
Lagged price translation from devaluation
In Pakistan, automobile assemblers are exposed to exchange rate risks because
localization is insufficient. This convention is evident from surging import costs,
leaving assemblers with no choice but to transfer inflationary impact to end
consumers. However, gross margin is not completely shielded as assemblers are
unable to completely pass-on the exchange rate impact without compromising on
volumetric growth. Moreover, this impact is dealt by price hikes with a lag effect.
We have graphically explained this phenomena by plotting currency devaluation with
monthly prices of Toyota Corolla (flagship model of INDU) since July’17, portraying a
lagged price transfer.
INDU led margins in the past
Historically, INDU has posted relatively higher gross margin compared to it’s peers
primarily attributable to its high-end luxury vehicles, with Fortuner (high margin
automobile) contributing substantially in this regard. Both INDU and HCAR witnessed
high gross margin in FY17, with INDU peaking at 17.7%. FY19 had a sluggish industry
outlook amid PKR devaluation of 34%, this continued in FY20 which was also marred
by the pandemic in the latter half of the fiscal year. Understandably, INDU’s gross
margin lowered to 8.65% in FY20.
Based on our analysis, we do not anticipate INDU’s margin to reach their previous high
due to increased competition restricting them to incur price hikes while retaining its
market share.
Source: Company website, Pakwheels, Fortune Research
PKR/USD % vs Corolla price %
Lag Factor
Source: Company Accounts, Fortune Research
Gross margins %
Based upon the data that we
have populated; it can be
largely witnessed that INDU
was unable to pass on the
impact of rising costs from PKR
devaluation to the end
consumer instantaneously
INDU has posted relatively
higher gross margin compared
to its peers primarily from
Corolla which sells like hot
cakes and discovery of a market
for Fortuner

6|P a g e
Fortune Securities Limited |Equity Research
Indus Motor Company Ltd.
New entrants and expansions on board
The increase in competition is around the corner with new players making inroads to
dent the market share of existing OEMs. With monetary easing of 625bps by SBP and
declining COVID19 cases bringing positive tides, consumerism is likely to kick-start
once again as approximately 70% of Pakistan’s population belongs to less than 34
years old; a demographic print that can be a leading indicator. This demographic trait
was keenly observed by foreign players as well who took advantage of ADP Policy
2016-21 to set up auto assembly lines in hopes to capture the inevitable growth cycle.
On this premise, we expect a sharp industry recovery of 48% for FY21 which would
continue to grow at a CAGR of 14.5% over the remainder of our investment horizon.
Oligoplistic shackles have been broken
The Automotive Development Policy (ADP) 2016-21 has changed the landscape of the
sector by providing incentives to new players for setting up assembly lines, which have
potentially put a drastic end to the prevailing oligopolistic industry structure. The new
entrants, Kia and Hyundai, have commenced production in FY20 with other renowned
companies like Proton and Volkswagen in pipeline to commence operational activities
in FY21.
Kia and Hyundai have launched Sportage and Tucson, respectively, in a hybrid
segment of crossover SUV, providing consumers with a relatively superior drive in a
similar price point range. We believe that the crossover SUVs from new entrants is
unlikely to give direct competition to Toyota’s Fortuner as it operates in the main SUV
segment. Similarly, Hilux would also retain its prestige (over it’s main competitor Isuzu
D-max) due to its popularity in rural areas as well as being the favored choice of
military personnels.
Indigenous level of new players
Kia has injected USD 175mn to set up assembly plant with capacity of 50,000 units. Its
localization currently stands at 12% and is projected to stretch to 50% localization or
a similar level to existing OEMs in the next 5 years. On the other hand, Hyundai had
initially invested USD 150mn for a single-shift capacity of 15,000 units plant with
further plans of investing additional USD 80mn to enhance their production capacity
to 30,000 units p.a. by 2023. Currently, they are assembling with 20% localization
level, which they intent to increase to 45% in the next 5 years.
Source: PAMA, Fortune Research
Industry Sales
CAGR of 11.9% CAGR of 14.5%
Competition has been rising
over the last couple of years
owing to ADP Policy 2016-21
The rise of new players has put
an end to the oligopoly in the
automobile sector, which has
existed over the last few decades
Kia and Hyundai have been the
leading players in making inroads
in the local arena. It is pertinent
to note that they both,
internationally, belong to the
same auto-manufacturing group

7|P a g e
Fortune Securities Limited |Equity Research
Indus Motor Company Ltd.
New players such as Kia and Hyundai will enjoy cheap import tariffs for the first 5 years
of commissioning. They can import non-localized and localized part at customs duty
of 10% and 25% respectively, bolstering their competency in the OEM market.
However, during the tariff benefit window they will be planning to switch gears
towards localization to be more competitive with exisiting OEMs in upcoming years.
Ride sharing: Is it a threat?
Ride sharing in Pakistan has changed the overall transport system, with Careem and
Uber beginning operations in FY16. Mass transit providers like Airlift and Swvl have
provided working class, a cheap and scheduled alternative for daily commutation.
Both of these services being rendered for a separate segment of society, possessing
extraordinary capacity of revolutionizing conventional mode of traveling via hassle-
free services, proving popular especially in metropolitan cities suffering from
congested traffic and insufficient parking spaces. Cost-benefit analysis between self-
owned cars’ and ride-sharing services – Uber and Careem in this case – indicates
owning a car is relatively more expensive than the other. Successful operations of
these services combined with the change in perception amongst masses will
materialize into a relatively material threat for the automobile industry.
Electric Vehicle policy
Electric Vehicle (EV) policy has been approved by Economic Coordination (ECC) for the
next five years with the aim of cutting pollution and curbing climate change. The policy
is framed for only electric 2-3 wheelers and heavy commercial vehicles (buses and
trucks) in the initial phase, in which specific parts of 2-3 wheelers will be imported at
1% custom duty and 1% GST. The incentive for electric cars would be added to policy
at later stages, leaving room for current assemblers to fulfill the existing demand.
Ride-sharing can potentially
become a threat if used
extensively by the masses
Any near-term impact on auto
demand from EV policy seems
too far-fetched, in our view
Customs duty imposed on current
players for importing CKD parts
lies in the range of 55-75% based
on cylinder capacity

8|P a g e
Fortune Securities Limited |Equity Research
Indus Motor Company Ltd.
INDU expanded to cater growing demand
INDU has incurred whopping capex of c. PKR 15bn during FY19-20 to enhance capacity
to 80k units on double shift basis, potentially increasing to 90-100k units through
debottlenecking, from previous 66k units. Capacity expansion is currently in its final
stages with commissioning expected by 1HFY21. Sales culminated to 65k units in FY19
before bottoming out to remarkably low levels of 28k units in FY20. Aided by
recovering economic activity, we expect 65%YoY growth (c.47k units) during FY21,
likely attaining momentum in the medium term, going beyond the historic peak post
FY23.
At their highest levels, delivery time usually took 6-7 months due to capacity
restraints. Presently, this period has reduced to 2-3 months potentially sustaining due
to i) commencement of double shift from Sep’20 ii) expansion in latter half of CY20.
Yaris; likely star product of INDU
INDU’s popularity emanates from its competitive pricing and high resale value. They
have launched six variants of Toyota Yaris in Mar’20 in 1.3L and 1.5L segments, with
the intention of replacing/repositioning its star product Corolla while competing
Honda City’s in the same segment. Both variants are priced similarly, but Yaris is
equipped with additional features such as superior interior design and availability of
airbags (which are currently unavailable in Honda City).
Source: Company Accounts, Fortune
INDU’s utilization levels likely to improve
INDU has wisely expanded
capacity to c. 80k units to
cater growing demand of
automobiles in Pakistan
Introduction of Yaris will allow
it to position among price
points that are equivalent to
that of Honda City
Source: PAMA, Fortune Research
INDU Product mix

9|P a g e
Fortune Securities Limited |Equity Research
Indus Motor Company Ltd.
In our view, Toyota Yaris is expected to takeover some market share of Honda City
until it introduces 7th generation. It is pertinent to note that Honda has introduced
newer generations of Civic but continues to operate City’s 5th generation for more
than a decade. Historically, price difference between Corolla and City was
approximately 200k-300k (Corolla was more expensive) which has been reduced
substantially with the launch of new Yaris. Yaris replaced the basic variant of Corolla
XLI and GLI in 1.3L segments and added 1.5L in the product portfolio, with Corolla
retaining its existence in 1.6L and 1.8L segments.
Assembling process ensures adequate liquidity
Automobile sector, around the world, operates under just-in-time manufacturing
process. This has enabled them to operate with low cash conversion cycles, in-fact
negative, ensuring pre-payments before delivery.
Cash and equivalents at Jun’20 for INDU stand at PKR 42bn (PKR 539/share) which is
c.40% of total market capitalization, portraying INDU as a cash rich company. The high
cash is a result of advances from customers on car booking which allows the company
to utilize excess cash to invest in PIBs & T-Bills and earn considerable return,
translating its impact in bottom-line, magnifying their profitability. However, if we net
off the impact of advances from cash and equivalents, company’s liquid position is still
satisfactory (PKR 18bn: PKR 227/share).
The just-in-time process of
assembling/manufacturing
allows auto players to keep
a cash rich position
Model Price/unit
Corolla
* Corolla Xli, 1.3L 2,519,000
* Corolla Xli 1.3L A/T 2,619,000
* Corolla Gli, 1.3L 2,769,000
* Corolla Gli, 1.3L A/T 2,869,000
Corolla Altis 1.6L M/T 3,159,000
Corolla Altis 1.6L A/T 3,309,000
Corolla Altis M/T 1.8L 3,479,000
Corolla Altis A/T 1.8L 3,679,000
Corolla Altis Grande MT 1.8L 3,679,000
Corolla Altis Grande AT 1.8L 3,899,000
Yaris
Toyota Yaris GLI MT 1.3 2,469,000
Toyota Yaris GLI CVT 1.3 2,649,000
Toyota Yaris ATIV X MT 1.5 2,789,000
Toyota Yaris ATIV X CVT 1.5 2,959,000
City
Honda City 1.3 i-VTEC 2,449,000
Honda City 1.3 i-VTEC Prosmatec 2,639,000
Honda City Aspire 1.5 i-VTEC 2,699,000
Honda City Aspire 1.5 i-VTEC Prosmatec 2,859,000
Source: Company Websites, PakWheels, Fortune Research, *Discontinued
10|P a g e
Fortune Securities Limited |Equity Research
Indus Motor Company Ltd.
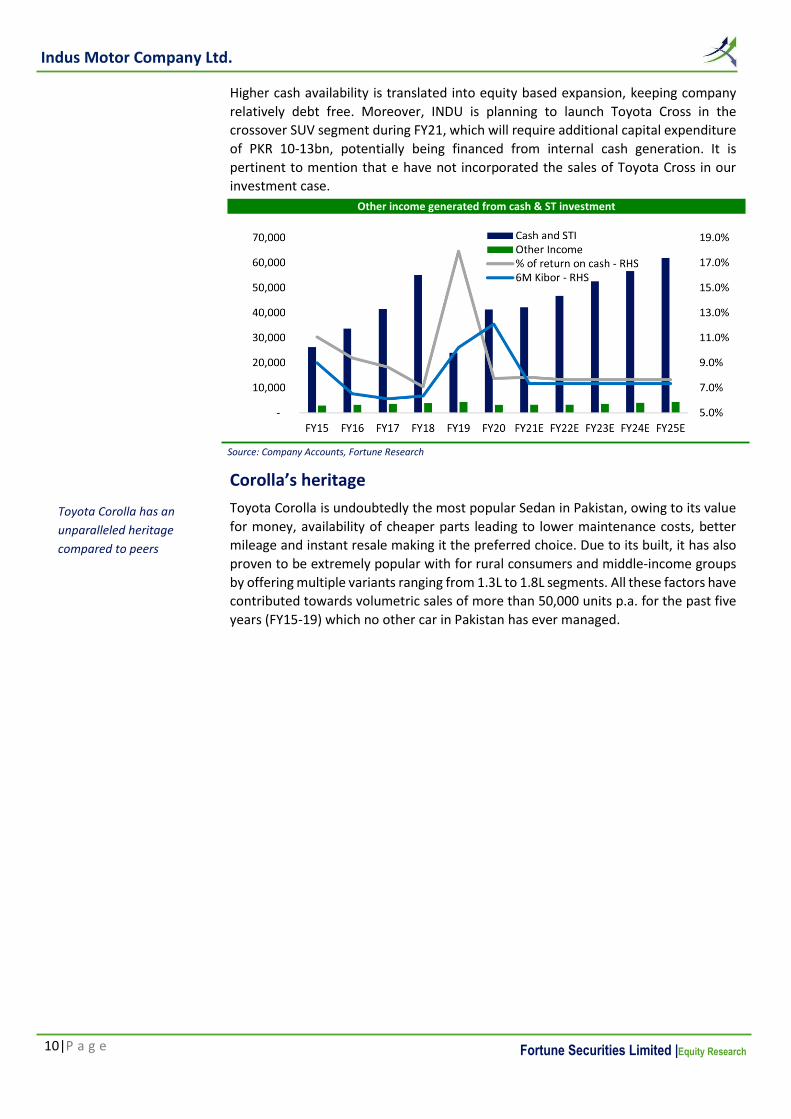
Higher cash availability is translated into equity based expansion, keeping company
relatively debt free. Moreover, INDU is planning to launch Toyota Cross in the
crossover SUV segment during FY21, which will require additional capital expenditure
of PKR 10-13bn, potentially being financed from internal cash generation. It is
pertinent to mention that e have not incorporated the sales of Toyota Cross in our
investment case.
Corolla’s heritage
Toyota Corolla is undoubtedly the most popular Sedan in Pakistan, owing to its value
for money, availability of cheaper parts leading to lower maintenance costs, better
mileage and instant resale making it the preferred choice. Due to its built, it has also
proven to be extremely popular with for rural consumers and middle-income groups
by offering multiple variants ranging from 1.3L to 1.8L segments. All these factors have
contributed towards volumetric sales of more than 50,000 units p.a. for the past five
years (FY15-19) which no other car in Pakistan has ever managed.
Source: Company Accounts, Fortune Research
Other income generated from cash & ST investment
Toyota Corolla has an
unparalleled heritage
compared to peers

11|P a g e
Fortune Securities Limited |Equity Research
Indus Motor Company Ltd.
Key risks
Lower than expected volumetric growth
Our investment theme is based on recovery in volumetric sales amid improving
macroeconomic indicators. Lower than expected recovery in sales is a downside risk
to our investment case.
Impact of new players
INDU has kept a persistent share in Sedan segment due to its flagship model Corolla,
however, emergence of new players in this category can penetrate the market putting
our valuation at a downside risk.
Unable to pass on devaluation impact
Our base assumption implies that INDU will pass on any impact of currency
devaluation to end consumer. However, higher than expected currency devaluation
(6% is our base case) will compromise volumetric growth, exposing our investment
case to exchange rate risk. On the other hand, we have presented an exchange rate
sensitivity for investors assuming no annualized devaluation impact being passed
through to end consumers.
Interest rate risk
Monetary tightening of (200-300 bps) from current levels of 7% can disrupt auto
financing, hence, impeding recovery of volumes. As indicated by management, INDU
sales are roughly 30% from auto financing, therefore, changes in interest rates are a
downside risk to our volumetric estimates.
Ride sharing
Ride sharing gaining attraction in masses can be a potential threat to auto sales, as it
provides cheaper alternative to commute, putting our valuation at a downside risk.

12|P a g e
Fortune Securities Limited |Equity Research
Indus Motor Company Ltd.
Company financials
Income Statement (PKR mn) FY18A FY19A FY20A FY21E FY22E FY23E
Net Sales 139,715 157,996 86,167 138,194 171,419 211,570
Cost of Sales 115,831 138,805 78,716 123,446 152,026 186,277
Gross Profit 23,885 19,192 7,451 14,748 19,393 25,292
Distribution cost 1,284 1,404 1,469 1,749 2,100 2,518
Admin cost 1,524 1,410 1,385 1,575 1,841 2,156
Other Expenses 194 235 197 316 391 483
WPPF and WFF 1,705 1,406 232 933 1,191 1,546
Other Income 3,901 4,307 3,205 3,241 3,226 3,581
EBIT 19,179 14,737 4,168 10,175 13,870 18,589
D&A 1,924 2,121 2,839 3,202 3,232 3,261
EBITDA 21,103 16,858 7,007 13,377 17,101 21,851
Finance Cost 80 67 86 85 87 84
EBT 22,999 18,976 7,287 13,331 17,009 22,087
Taxation 7,227 5,261 2,205 3,866 4,933 6,405
PAT 15,772 13,715 5,082 9,465 12,076 15,681
EPS (PKR) 200.7 174.5 64.7 120.4 153.6 199.5
DPS (PKR) 140.0 115.0 30.0 85.0 110.0 140.0
Balance Sheet (PKR mn) FY18A FY19A FY20A FY21E FY22E FY23E
Fixed assets 7,311 13,898 16,574 16,236 16,386 16,535
Long-Term Loans and Advances 49 16 13 13 13 13
Other non-current assets 24 11 75 10 10 10
Total non-current assets 7,384 13,925 16,661 16,258 16,409 16,558
Current assets (ex-cash & STI) 17,311 24,174 21,251 17,682 22,375 28,076
Cash & equivalents 57,232 26,684 42,366 42,171 46,816 52,547
Total current assets 74,543 50,858 63,617 59,853 69,192 80,623
TOTAL ASSETS 81,927 64,783 80,279 76,111 85,600 97,181
Share capital 786 786 786 786 786 786
Reserves 35,958 39,259 40,383 45,290 49,506 55,126
Total shareholder's equity 36,744 40,045 41,169 46,076 50,292 55,912
Long Term Loan - 81 479 285 176 157
Other non-current liabilities 23 478 4 - - -
Total non-currrent liabilities 23 559 483 285 176 157
Current portion of long term loan - - 113 194 110 20
Trade and other payables 15,731 15,950 13,593 14,776 16,590 18,263
Advances from customers 27,491 7,930 24,534 14,776 18,433 22,829
Other current liabilities 1,938 299 385 4 - -
Total current liabilities 45,160 24,179 38,626 29,750 35,133 41,112
TOTAL LIABILITIES & EQUITY 81,927 64,783 80,279 76,111 85,600 97,181
Cash Flow Statement (PKR mn) FY18A FY19A FY20A FY21E FY22E FY23E
Net cash from operating activities 25,617 (11,552) 24,703 7,276 16,081 19,311
Net cash from investing activities (2,869) (8,662) (5,575) (2,799) (3,382) (3,411)
Net cash from financing activities (10,224) (10,333) (3,446) (4,672) (8,054) (10,170)
Net increase/(decrease) in cash flow 12,523 (30,548) 15,682 (195) 4,646 5,731
Source: Company Accounts, Fortune Research

13|P a g e
Fortune Securities Limited |Equity Research
Indus Motor Company Ltd.
Analyst Certification The research analyst on the cover of this report certifies that: 1) all of the views expressed in this report accurately reflect his or her personal views about any and all of the subject securities or issuers; 2) no part of any of the research analyst’s compensation was, is, or will be directly or indirectly related to the specific recommendation(s) or view(s) expressed by the research analyst(s) in this report; 3) he/she does not have a financial interest in any and all of the subject securities or issuers aggregating more than 1% of the value of the company(s); 4) he/she or its close relative has not served as a director/officer/associate in the past three years in any and all of the subject securities or issuers; 5) he/she or its close relative has received any compensation from any and all of the subject securities or issuers in the previous 12 months; and 6) he/she has not traded in the subject security(ies) or issuer(s) in the past 7 trading days and will not trade in the next 5 trading days of issuing a coverage initiation or a material Target Price revision report.
Acronyms bps basis points LCY Local Currency BVPS Book Value per share MRP Market risk premium CAGR Compounded Annual Growth Rate NAV Net Asset Value CAPM Capital Asset Pricing Model NPV Net Present Value DCF Discounted Cash Flow PB Price-to-Book Value DDM Discounted Dividend Model PCF Price-to-cash flow DE Debt-to-Equity PE Price-to-Earnings DPS Dividend per share PKR Pakistani Rupee DY Dividend yield ppt percentage point EPS Earnings per share PS Price-to-Sales EUR Euro PV Present Value EV Enterprise Value RFR Risk-free rate EVA Economic Value Added RI Residual Income FCF Free Cash Flow ROA Return on Assets FCFE Free Cash Flow to Equity ROE Return on Equity FCFF Free Cash Flow to Firm SOTP Sum Of The Parts FCY Foreign Currency TP Target Price g Growth TSR Total Stock Return IRR Internal Rate of Return USD US Dollars JPBV Justified Price-to-Book Value WACC Weighted average cost of capital
Disclosure The investment recommendation(s) take into account both risk and expected return. FSL based the long-term Target Price estimate on fundamental analysis of the subject security(ies)’s future prospects, after having taken perceived risks into consideration. FSL have conducted extensive research to arrive at the investment recommendation(s) and target price(s) for the subject security (ies). Readers should understand that financial projection(s), target price estimate(s) and statement(s) regarding future prospects may or may not be realized. Forward looking statement(s), opinion(s) and estimate(s) included in this report constitute FSL’s judgment as of this date and are subject to change without prior notice. The target price(s) stated in reports on company update(s), initiation(s) and corporate action adjustment(s) of stocks listed on the PSX are on a 12-month basis. All other reports on PSX-listed securities, such as scoops, sector or company commentaries, do not include, denote, or imply any changes to target price(s). Disclaimer The research report prepared by Fortune Securities Limited (hereinafter referred as FSL) are based on public information and the report is for information purposes only and does not constitute nor it is intended as an offer or solicitation for the purchase or sale of security(ies) or other financial instruments. FSL makes every effort to use reliable, comprehensive information, but it makes no representation that the information contained herein is accurate or complete. Facts and views presented in this report have not been reviewed by and may not reflect information known to professionals in other business areas of FSL or any of its associated entities. FSL has established information barriers between business groups and associations maintaining complete independence of this research report. This report is not intended to provide personal investment advice nor does it provide individually tailored investment advice. This report does not take into account the specific investment objectives, financial situation/financial circumstances and the particular needs of any specific person. Investors should seek financial advice regarding the appropriateness of investing in financial instruments and implementing investment strategies discussed or recommended in this report and should understand that statements regarding future prospects may not be realized. FSL recommends that investors independently evaluate particular investments and strategies and it encourages investors to seek the advice of a financial advisor. FSL has taken all reasonable care to ensure that the information contained herein is accurate, up to date, and complies with all Pakistani legislations. However, no liability can be accepted for any errors or omissions, or for any loss resulting from the use of the information provided as any data and research material provided ahead of an investment decision are for information purposes only. We shall not be liable for any errors in the provision of this information, or for any actions taken in reliance thereon. Copyright and confidentiality No part of this document may be reproduced without the written permission of FSL. The information within this research report must not be disclosed to any other person if and until FSL has made the information publicly available.
Key risks ‒ Lower than expected volumetric growth ‒ Contractionary monetary policy ‒ New players denting market share of INDU ‒ Unable to pass on devaluation impact ‒ Expected 7th generation of City can shrink the sales of Yaris ‒
Valuation Methodology To arrive at period-end Target Price(s), FSL uses different valuation methodologies: ‒ Discounted Cash Flow (DCF, DDM) ‒ Relative Valuation (PE, PB, PS, PCF) ‒ Equity and Asset return based methodologies (EVA, RI, etc.)
Rating
BUY TSR > 15% HOLD -10% > TSR > 15% SELL TSR < -10% NR Not Rated
TSR = Capital gain + DY Old Rating Overweight TSR > 15% Marketweight 0% > TSR > 15% Underweight TSR < 0%
14|P a g e
Fortune Securities Limited |Equity Research
Indus Motor Company Ltd.
Research Team
Chief Executive
Anis ur Rahman, CFA [email protected] ( +92 21) 35309111
Institutional Sales
Irfan Surya [email protected] ( +92 21) 35309131
Director Research
Syed Arif ur Rehman [email protected] ( +92 21) 35309113
Retail Sales
Taha Aslam [email protected] ( +92 21) 35309124
Equity Research
Wajid Rizvi [email protected] (+ 92 21) 35309086
Arvind Anand
(+ 92 21) 35309119
Hasnain Murtaza [email protected] (+ 92 21) 35309119
Muqeet Naeem
(+ 92 21) 35309119
Mahnoor Shafqat
(+ 92 21) 35309119
Kishan Sidi Solanki [email protected] (+ 92 21) 35309112
Copyright © 2022 FDOKUMEN