IHS Towers Annual Report 2021
247
Grow. Connect. Sustain. 2021 Annual Report
-
Upload
khangminh22 -
Category
Documents
-
view
1 -
download
0
Transcript of IHS Towers Annual Report 2021
Grow. Connect. Sustain. 2021 Annual Report
IHS Towers 2021 Annual Report
In this reportWho we are 1
What we do 2
Welcome from our Chairman and CEO 6
Market Review 7
Our Strategy 10
Operations Review 12
Sustainability 14
Governance 16
1IHS Towers 2021 Annual Report
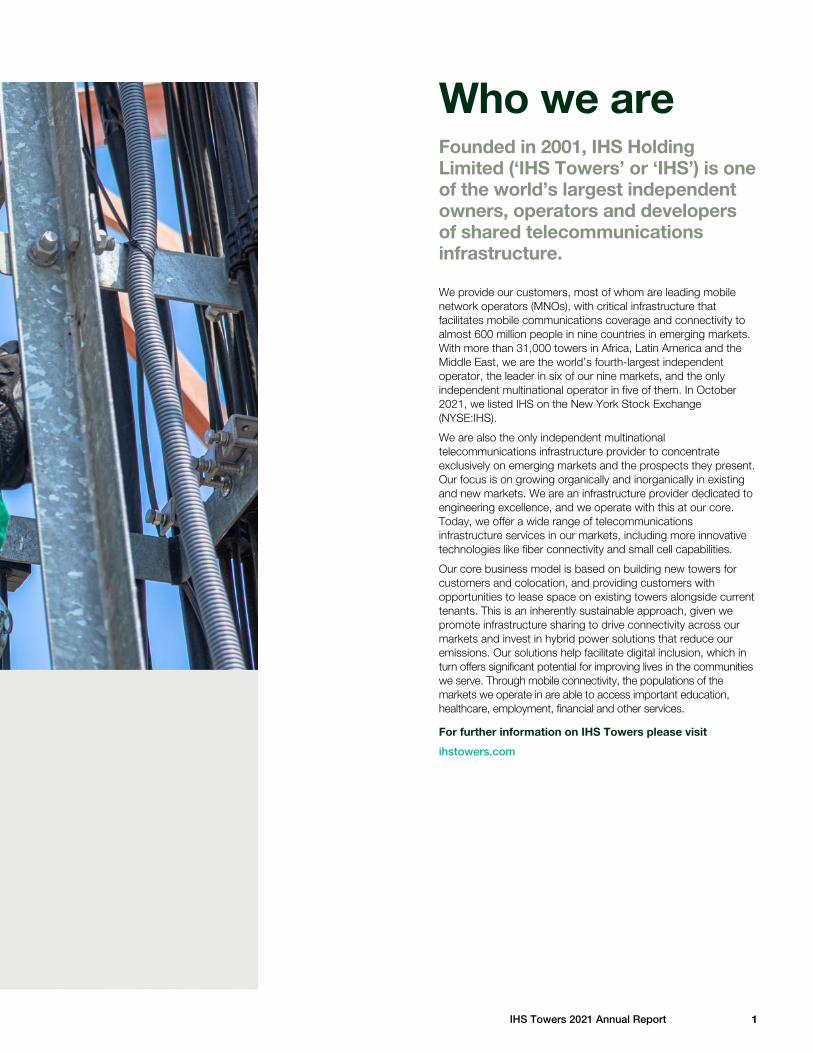
Who we are Founded in 2001, IHS Holding Limited (‘IHS Towers’ or ‘IHS’) is one of the world’s largest independent owners, operators and developers of shared telecommunications infrastructure.
We provide our customers, most of whom are leading mobile network operators (MNOs), with critical infrastructure that facilitates mobile communications coverage and connectivity to almost 600 million people in nine countries in emerging markets. With more than 31,000 towers in Africa, Latin America and the Middle East, we are the world’s fourth-largest independent operator, the leader in six of our nine markets, and the only independent multinational operator in five of them. In October 2021, we listed IHS on the New York Stock Exchange (NYSE:IHS).
We are also the only independent multinational telecommunications infrastructure provider to concentrate exclusively on emerging markets and the prospects they present. Our focus is on growing organically and inorganically in existing and new markets. We are an infrastructure provider dedicated to engineering excellence, and we operate with this at our core. Today, we offer a wide range of telecommunications infrastructure services in our markets, including more innovative technologies like fiber connectivity and small cell capabilities.
Our core business model is based on building new towers for customers and colocation, and providing customers with opportunities to lease space on existing towers alongside current tenants. This is an inherently sustainable approach, given we promote infrastructure sharing to drive connectivity across our markets and invest in hybrid power solutions that reduce our emissions. Our solutions help facilitate digital inclusion, which in turn offers significant potential for improving lives in the communities we serve. Through mobile connectivity, the populations of the markets we operate in are able to access important education, healthcare, employment, financial and other services.
For further information on IHS Towers please visit
ihstowers.com
IHS Towers At a glance
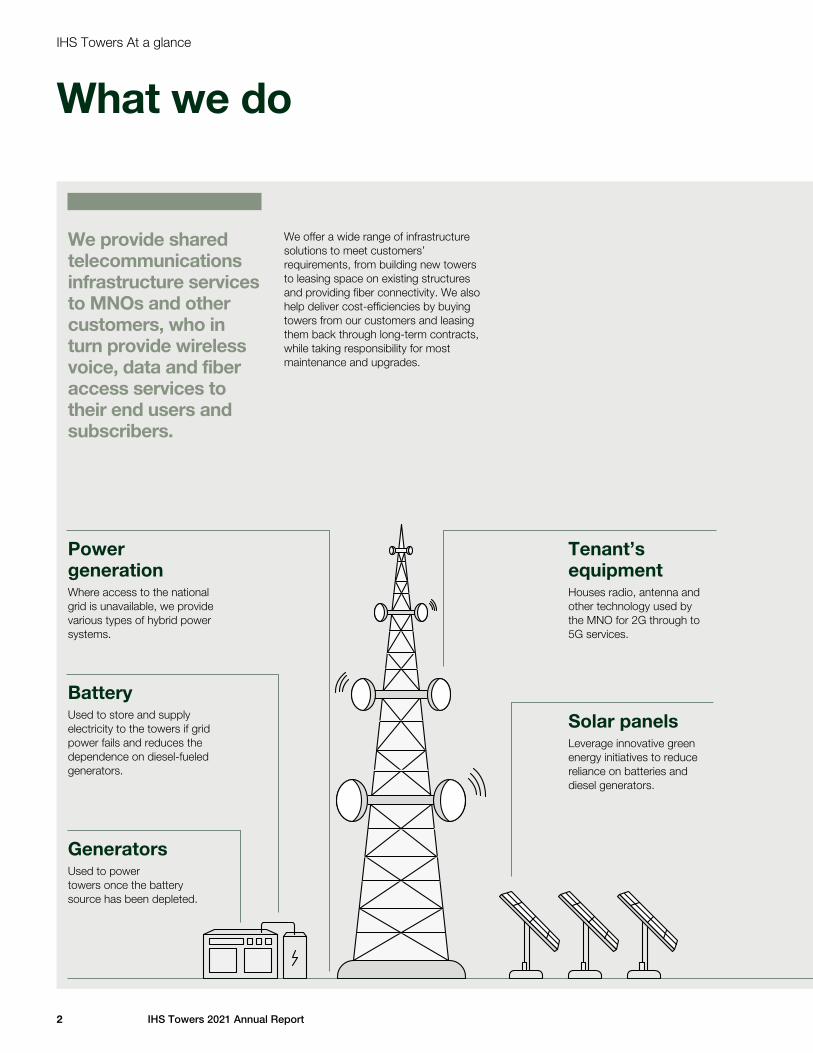
What we do
Solar panelsLeverage innovative green energy initiatives to reduce reliance on batteries and diesel generators.
Tenant’s equipmentHouses radio, antenna and other technology used by the MNO for 2G through to 5G services.
Power generationWhere access to the national grid is unavailable, we provide various types of hybrid power systems.
BatteryUsed to store and supply electricity to the towers if grid power fails and reduces the dependence on diesel-fueled generators.
GeneratorsUsed to power towers once the battery source has been depleted.
We provide shared telecommunications infrastructure services to MNOs and other customers, who in turn provide wireless voice, data and fiber access services to their end users and subscribers.
We offer a wide range of infrastructure solutions to meet customers’ requirements, from building new towers to leasing space on existing structures and providing fiber connectivity. We also help deliver cost-efficiencies by buying towers from our customers and leasing them back through long-term contracts, while taking responsibility for most maintenance and upgrades.
2 IHS Towers 2021 Annual Report
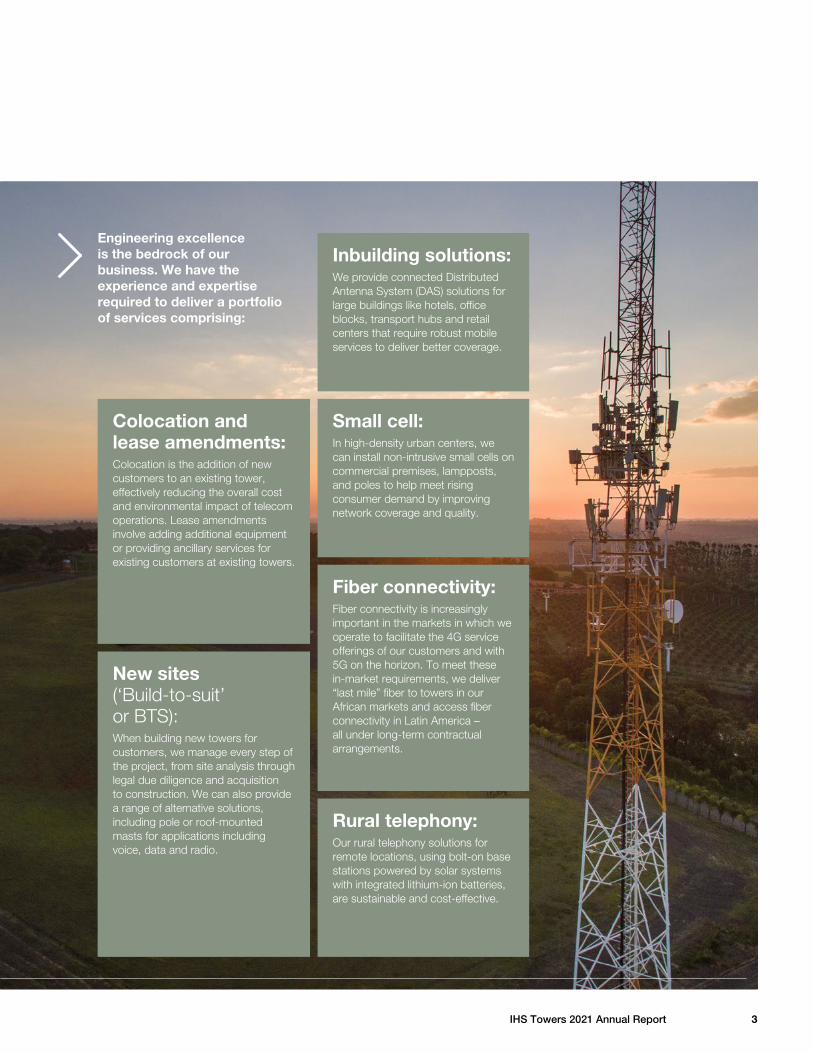
Colocation and lease amendments:Colocation is the addition of new customers to an existing tower, effectively reducing the overall cost and environmental impact of telecom operations. Lease amendments involve adding additional equipment or providing ancillary services for existing customers at existing towers.
Engineering excellence is the bedrock of our business. We have the experience and expertise required to deliver a portfolio of services comprising:
New sites (‘Build-to-suit’ or BTS):When building new towers for customers, we manage every step of the project, from site analysis through legal due diligence and acquisition to construction. We can also provide a range of alternative solutions, including pole or roof-mounted masts for applications including voice, data and radio.
Inbuilding solutions: We provide connected Distributed Antenna System (DAS) solutions for large buildings like hotels, office blocks, transport hubs and retail centers that require robust mobile services to deliver better coverage.
Small cell:In high-density urban centers, we can install non-intrusive small cells on commercial premises, lampposts, and poles to help meet rising consumer demand by improving network coverage and quality.
Fiber connectivity:Fiber connectivity is increasingly important in the markets in which we operate to facilitate the 4G service offerings of our customers and with 5G on the horizon. To meet these in-market requirements, we deliver “last mile” fiber to towers in our African markets and access fiber connectivity in Latin America – all under long-term contractual arrangements.
Rural telephony:Our rural telephony solutions for remote locations, using bolt-on base stations powered by solar systems with integrated lithium-ion batteries, are sustainable and cost-effective.
3IHS Towers 2021 Annual Report

IHS Towers At a glance continued
4 IHS Towers 2021 Annual Report
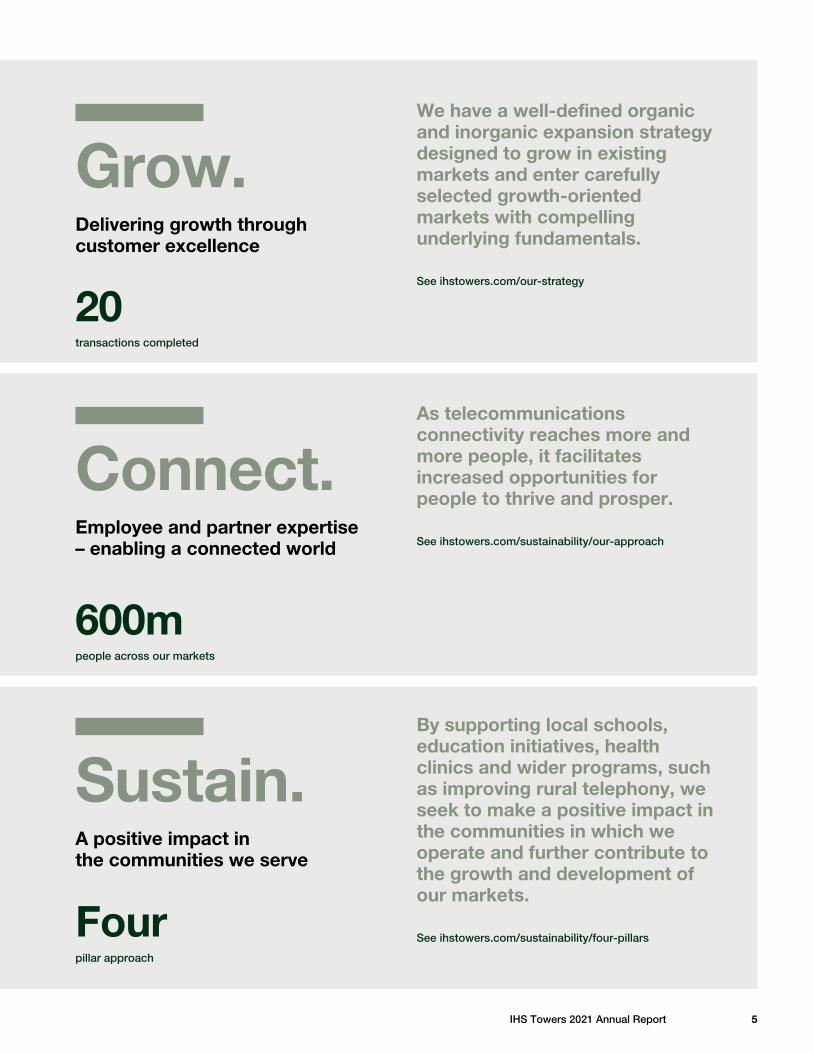
We have a well-defined organic and inorganic expansion strategy designed to grow in existing markets and enter carefully selected growth-oriented markets with compelling underlying fundamentals.
See ihstowers.com/our-strategy
As telecommunications connectivity reaches more and more people, it facilitates increased opportunities for people to thrive and prosper.
See ihstowers.com/sustainability/our-approach
By supporting local schools, education initiatives, health clinics and wider programs, such as improving rural telephony, we seek to make a positive impact in the communities in which we operate and further contribute to the growth and development of our markets.
See ihstowers.com/sustainability/four-pillars
Grow.Delivering growth through customer excellence
Connect.Employee and partner expertise – enabling a connected world
Sustain.A positive impact in the communities we serve
20transactions completed
600mpeople across our markets
Fourpillar approach
5IHS Towers 2021 Annual Report
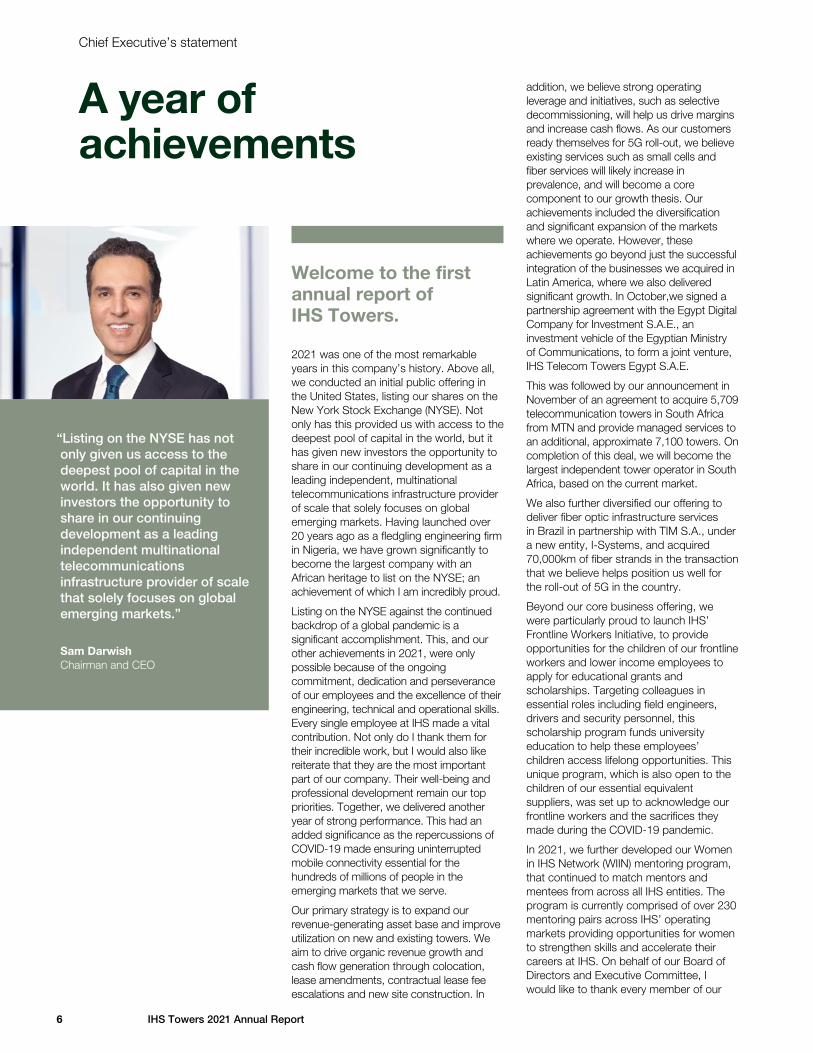
“Listing on the NYSE has not only given us access to the deepest pool of capital in the world. It has also given new investors the opportunity to share in our continuing development as a leading independent multinational telecommunications infrastructure provider of scale that solely focuses on global emerging markets.”
Sam DarwishChairman and CEO
Chief Executive’s statement
A year of achievements
Welcome to the first annual report of IHS Towers.
2021 was one of the most remarkable years in this company’s history. Above all, we conducted an initial public offering in the United States, listing our shares on the New York Stock Exchange (NYSE). Not only has this provided us with access to the deepest pool of capital in the world, but it has given new investors the opportunity to share in our continuing development as a leading independent, multinational telecommunications infrastructure provider of scale that solely focuses on global emerging markets. Having launched over 20 years ago as a fledgling engineering firm in Nigeria, we have grown significantly to become the largest company with an African heritage to list on the NYSE; an achievement of which I am incredibly proud.
Listing on the NYSE against the continued backdrop of a global pandemic is a significant accomplishment. This, and our other achievements in 2021, were only possible because of the ongoing commitment, dedication and perseverance of our employees and the excellence of their engineering, technical and operational skills. Every single employee at IHS made a vital contribution. Not only do I thank them for their incredible work, but I would also like reiterate that they are the most important part of our company. Their well-being and professional development remain our top priorities. Together, we delivered another year of strong performance. This had an added significance as the repercussions of COVID-19 made ensuring uninterrupted mobile connectivity essential for the hundreds of millions of people in the emerging markets that we serve.
Our primary strategy is to expand our revenue-generating asset base and improve utilization on new and existing towers. We aim to drive organic revenue growth and cash flow generation through colocation, lease amendments, contractual lease fee escalations and new site construction. In
addition, we believe strong operating leverage and initiatives, such as selective decommissioning, will help us drive margins and increase cash flows. As our customers ready themselves for 5G roll-out, we believe existing services such as small cells and fiber services will likely increase in prevalence, and will become a core component to our growth thesis. Our achievements included the diversification and significant expansion of the markets where we operate. However, these achievements go beyond just the successful integration of the businesses we acquired in Latin America, where we also delivered significant growth. In October,we signed a partnership agreement with the Egypt Digital Company for Investment S.A.E., an investment vehicle of the Egyptian Ministry of Communications, to form a joint venture, IHS Telecom Towers Egypt S.A.E.
This was followed by our announcement in November of an agreement to acquire 5,709 telecommunication towers in South Africa from MTN and provide managed services to an additional, approximate 7,100 towers. On completion of this deal, we will become the largest independent tower operator in South Africa, based on the current market.
We also further diversified our offering to deliver fiber optic infrastructure services in Brazil in partnership with TIM S.A., under a new entity, I-Systems, and acquired 70,000km of fiber strands in the transaction that we believe helps position us well for the roll-out of 5G in the country.
Beyond our core business offering, we were particularly proud to launch IHS’ Frontline Workers Initiative, to provide opportunities for the children of our frontline workers and lower income employees to apply for educational grants and scholarships. Targeting colleagues in essential roles including field engineers, drivers and security personnel, this scholarship program funds university education to help these employees’ children access lifelong opportunities. This unique program, which is also open to the children of our essential equivalent suppliers, was set up to acknowledge our frontline workers and the sacrifices they made during the COVID-19 pandemic.
In 2021, we further developed our Women in IHS Network (WIIN) mentoring program, that continued to match mentors and mentees from across all IHS entities. The program is currently comprised of over 230 mentoring pairs across IHS’ operating markets providing opportunities for women to strengthen skills and accelerate their careers at IHS. On behalf of our Board of Directors and Executive Committee, I would like to thank every member of our
6 IHS Towers 2021 Annual Report
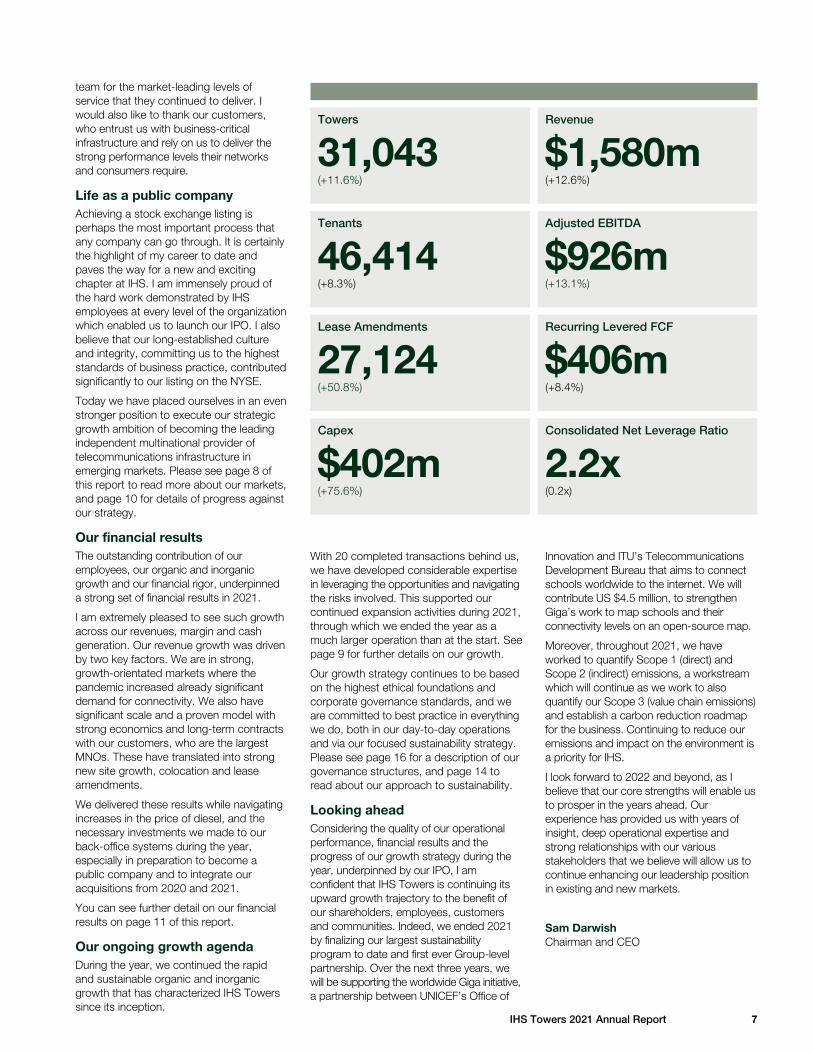
Towers
31,043 (+11.6%)
Revenue
$1,580m(+12.6%)
Adjusted EBITDA
$926m(+13.1%)
Recurring Levered FCF
$406m(+8.4%)
Tenants
46,414(+8.3%)
Lease Amendments
27,124(+50.8%)
Capex
$402m(+75.6%)
Consolidated Net Leverage Ratio
2.2x(0.2x)
team for the market-leading levels of service that they continued to deliver. I would also like to thank our customers, who entrust us with business-critical infrastructure and rely on us to deliver the strong performance levels their networks and consumers require.
Life as a public companyAchieving a stock exchange listing is perhaps the most important process that any company can go through. It is certainly the highlight of my career to date and paves the way for a new and exciting chapter at IHS. I am immensely proud of the hard work demonstrated by IHS employees at every level of the organization which enabled us to launch our IPO. I also believe that our long-established culture and integrity, committing us to the highest standards of business practice, contributed significantly to our listing on the NYSE.
Today we have placed ourselves in an even stronger position to execute our strategic growth ambition of becoming the leading independent multinational provider of telecommunications infrastructure in emerging markets. Please see page 8 of this report to read more about our markets, and page 10 for details of progress against our strategy.
Our financial resultsThe outstanding contribution of our employees, our organic and inorganic growth and our financial rigor, underpinned a strong set of financial results in 2021.
I am extremely pleased to see such growth across our revenues, margin and cash generation. Our revenue growth was driven by two key factors. We are in strong, growth-orientated markets where the pandemic increased already significant demand for connectivity. We also have significant scale and a proven model with strong economics and long-term contracts with our customers, who are the largest MNOs. These have translated into strong new site growth, colocation and lease amendments.
We delivered these results while navigating increases in the price of diesel, and the necessary investments we made to our back-office systems during the year, especially in preparation to become a public company and to integrate our acquisitions from 2020 and 2021.
You can see further detail on our financial results on page 11 of this report.
Our ongoing growth agendaDuring the year, we continued the rapid and sustainable organic and inorganic growth that has characterized IHS Towers since its inception.
With 20 completed transactions behind us, we have developed considerable expertise in leveraging the opportunities and navigating the risks involved. This supported our continued expansion activities during 2021, through which we ended the year as a much larger operation than at the start. See page 9 for further details on our growth.
Our growth strategy continues to be based on the highest ethical foundations and corporate governance standards, and we are committed to best practice in everything we do, both in our day-to-day operations and via our focused sustainability strategy. Please see page 16 for a description of our governance structures, and page 14 to read about our approach to sustainability.
Looking aheadConsidering the quality of our operational performance, financial results and the progress of our growth strategy during the year, underpinned by our IPO, I am confident that IHS Towers is continuing its upward growth trajectory to the benefit of our shareholders, employees, customers and communities. Indeed, we ended 2021 by finalizing our largest sustainability program to date and first ever Group-level partnership. Over the next three years, we will be supporting the worldwide Giga initiative, a partnership between UNICEF’s Office of
Innovation and ITU’s Telecommunications Development Bureau that aims to connect schools worldwide to the internet. We will contribute US $4.5 million, to strengthen Giga’s work to map schools and their connectivity levels on an open-source map.
Moreover, throughout 2021, we have worked to quantify Scope 1 (direct) and Scope 2 (indirect) emissions, a workstream which will continue as we work to also quantify our Scope 3 (value chain emissions) and establish a carbon reduction roadmap for the business. Continuing to reduce our emissions and impact on the environment is a priority for IHS.
I look forward to 2022 and beyond, as I believe that our core strengths will enable us to prosper in the years ahead. Our experience has provided us with years of insight, deep operational expertise and strong relationships with our various stakeholders that we believe will allow us to continue enhancing our leadership position in existing and new markets.
Sam DarwishChairman and CEO
7IHS Towers 2021 Annual Report
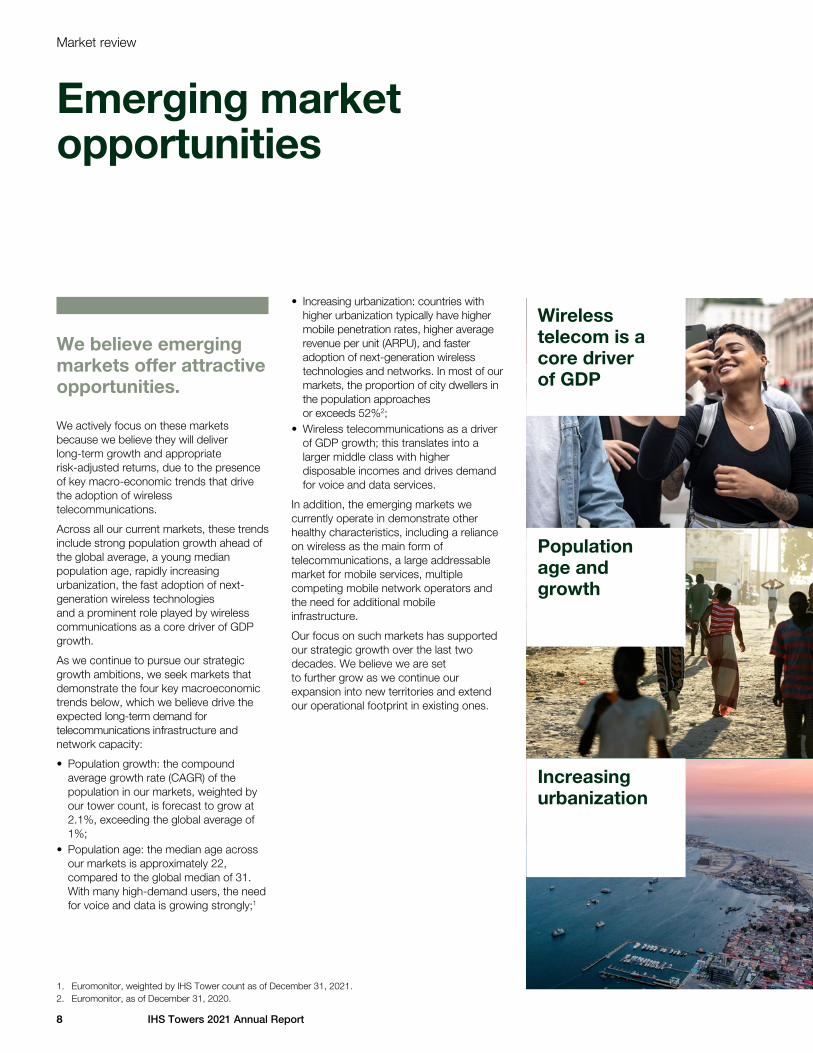
We believe emerging markets offer attractive opportunities.
We actively focus on these markets because we believe they will deliver long-term growth and appropriate risk-adjusted returns, due to the presence of key macro-economic trends that drive the adoption of wireless telecommunications.
Across all our current markets, these trends include strong population growth ahead of the global average, a young median population age, rapidly increasing urbanization, the fast adoption of next-generation wireless technologies and a prominent role played by wireless communications as a core driver of GDP growth.
As we continue to pursue our strategic growth ambitions, we seek markets that demonstrate the four key macroeconomic trends below, which we believe drive the expected long-term demand for telecommunications infrastructure and network capacity:
• Population growth: the compound average growth rate (CAGR) of the population in our markets, weighted by our tower count, is forecast to grow at 2.1%, exceeding the global average of 1%;
• Population age: the median age across our markets is approximately 22, compared to the global median of 31. With many high-demand users, the need for voice and data is growing strongly;1
• Increasing urbanization: countries with higher urbanization typically have higher mobile penetration rates, higher average revenue per unit (ARPU), and faster adoption of next-generation wireless technologies and networks. In most of our markets, the proportion of city dwellers in the population approaches or exceeds 52%2;
• Wireless telecommunications as a driver of GDP growth; this translates into a larger middle class with higher disposable incomes and drives demand for voice and data services.
In addition, the emerging markets we currently operate in demonstrate other healthy characteristics, including a reliance on wireless as the main form of telecommunications, a large addressable market for mobile services, multiple competing mobile network operators and the need for additional mobile infrastructure.
Our focus on such markets has supported our strategic growth over the last two decades. We believe we are set to further grow as we continue our expansion into new territories and extend our operational footprint in existing ones.
Market review
Emerging market opportunities
Wireless telecom is a core driver of GDP
Population age and growth
Increasing urbanization
1. Euromonitor, weighted by IHS Tower count as of December 31, 2021.2. Euromonitor, as of December 31, 2020.
8 IHS Towers 2021 Annual Report
Our 20-year track record
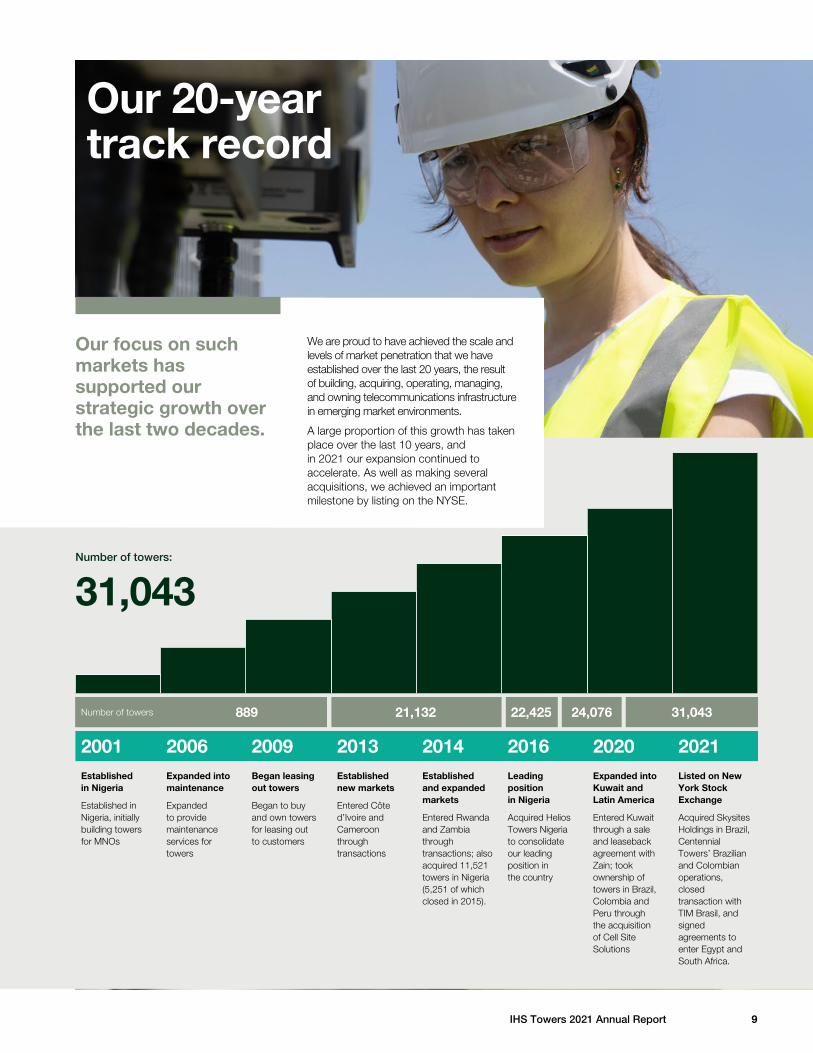
Our focus on such markets has supported our strategic growth over the last two decades.
We are proud to have achieved the scale and levels of market penetration that we have established over the last 20 years, the result of building, acquiring, operating, managing, and owning telecommunications infrastructure in emerging market environments.
A large proportion of this growth has taken place over the last 10 years, and in 2021 our expansion continued to accelerate. As well as making several acquisitions, we achieved an important milestone by listing on the NYSE.
Established in Nigeria
Established in Nigeria, initially building towers for MNOs
Established and expanded markets
Entered Rwanda and Zambia through transactions; also acquired 11,521 towers in Nigeria (5,251 of which closed in 2015).
Began leasing out towers
Began to buy and own towers for leasing out to customers
Expanded into Kuwait and Latin America
Entered Kuwait through a sale and leaseback agreement with Zain; took ownership of towers in Brazil, Colombia and Peru through the acquisition of Cell Site Solutions
Expanded into maintenance
Expanded to provide maintenance services for towers
Leading position in Nigeria
Acquired Helios Towers Nigeria to consolidate our leading position in the country
Established new markets
Entered Côte d’Ivoire and Cameroon through transactions
Listed on New York Stock Exchange
Acquired Skysites Holdings in Brazil, Centennial Towers’ Brazilian and Colombian operations, closed transaction with TIM Brasil, and signed agreements to enter Egypt and South Africa.
2001 20142009 20202006 20162013 2021
Number of towers 889 21,132 22,425 31,043 24,076
Number of towers:
31,043
9IHS Towers 2021 Annual Report
Since our inception in 2001, we have established a reputation as a leader in the high growth, emerging market telecommunications infrastructure sector, serving MNOs and ultimately the growing end-consumer market with critical telecommunications infrastructure.
By serving leading MNOs, who in turn provide their customers with wireless voice and data services, we benefit individuals and communities throughout our markets by enabling accelerated access to advanced mobile communications. Throughout the growth periods of 2G, 3G and 4G, and into the 5G era, we have continued to own, operate, share and construct telecommunications infrastructure to help MNOs deliver the services their consumers require.
We are focused on leveraging our platform to drive growth in our existing markets and to continue expanding into new markets, driving profitability and returns for our shareholders by executing on the following key elements of our strategy:
• Capitalize on significant growth opportunities in existing markets.
• Optimize utilization of existing assets.• Consolidate towers globally in new
and existing emerging markets.• Reinforce market positions through
innovative solutions and expand the value chain.
• Drive profitability and returns to shareholders.
• Continue improving our community and environmental impact.
Leveraging opportunities in high-growth emerging markets
Our strategy
Optimize utilization of existing assets
Consolidate towers in new and existing markets
Reinforce market positions through innovative solutions and expand the value chain
Capitalize on significant growth opportunities in existing markets
Drive profitability and returns to shareholders
Continue improving our community and environmental impact
Our six strategic
pillars
10 IHS Towers 2021 Annual Report
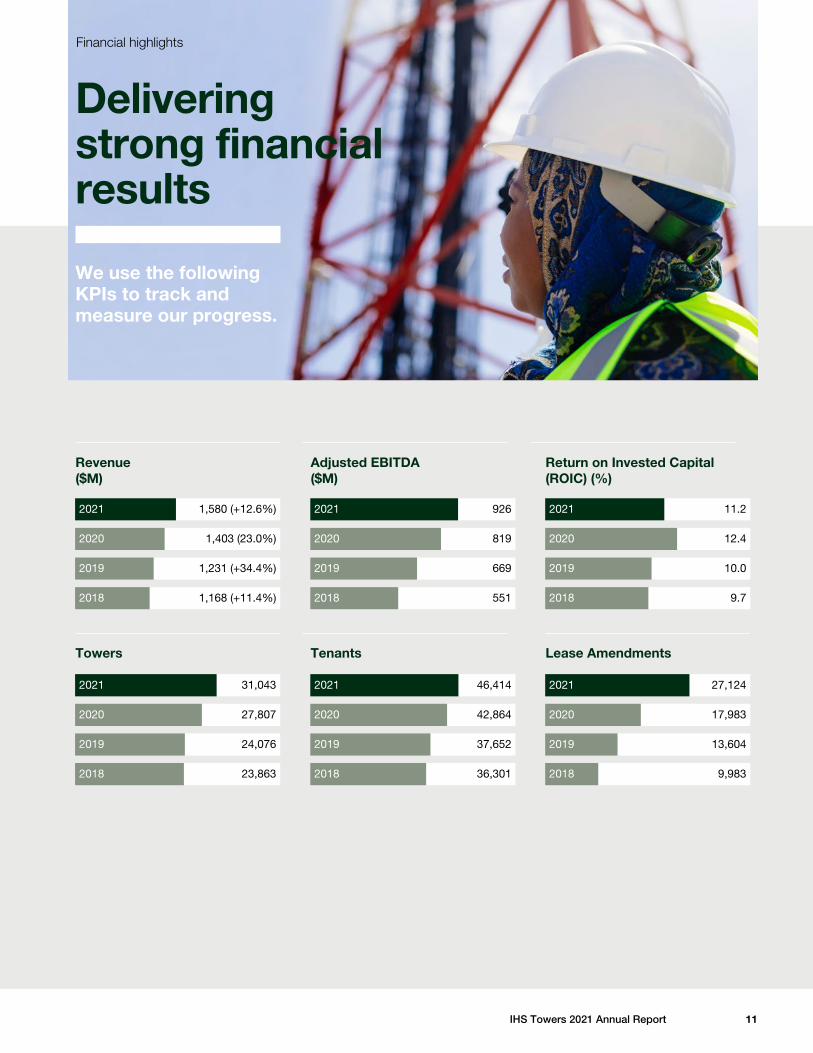
We use the following KPIs to track and measure our progress.
Financial highlights
Delivering strong financial results
Revenue ($M)
Towers
Adjusted EBITDA ($M)
Tenants
Return on Invested Capital (ROIC) (%)
Lease Amendments
2020
2021
2019
2018
1,403 (23.0%)
1,231 (+34.4%)
1,168 (+11.4%)
1,580 (+12.6%)
2020
2021
2019
2018
27,807
24,076
23,863
31,043
2020
2021
2019
2018
819
669
551
926
2020
2021
2019
2018
42,864
37,652
36,301
46,414
2020
2021
2019
2018
12.4
10.0
9.7
11.2
2020
2021
2019
2018
17,983
13,604
9,983
27,124
11IHS Towers 2021 Annual Report
A year of strong operational highlights
Operations review
To reduce our emissions and service our customers better, we have historically invested in carbon reduction solutions such as batteries, solar and other clean energy sources at our sites. As of December 31, 2021, approximately 36% of our African sites had solar power available to them, with the remainder relying on a combination of generators, hybrid, recycled batteries, and the grid.
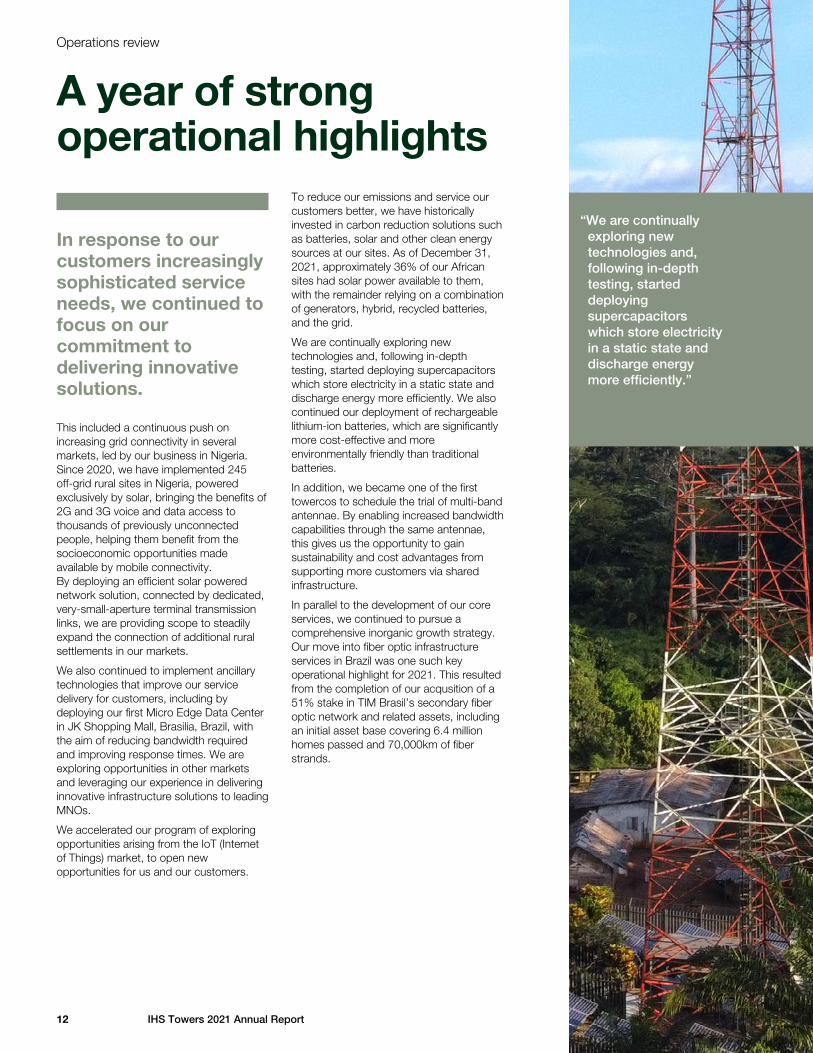
We are continually exploring new technologies and, following in-depth testing, started deploying supercapacitors which store electricity in a static state and discharge energy more efficiently. We also continued our deployment of rechargeable lithium-ion batteries, which are significantly more cost-effective and more environmentally friendly than traditional batteries.
In addition, we became one of the first towercos to schedule the trial of multi-band antennae. By enabling increased bandwidth capabilities through the same antennae, this gives us the opportunity to gain sustainability and cost advantages from supporting more customers via shared infrastructure.
In parallel to the development of our core services, we continued to pursue a comprehensive inorganic growth strategy. Our move into fiber optic infrastructure services in Brazil was one such key operational highlight for 2021. This resulted from the completion of our acqusition of a 51% stake in TIM Brasil’s secondary fiber optic network and related assets, including an initial asset base covering 6.4 million homes passed and 70,000km of fiber strands.
In response to our customers increasingly sophisticated service needs, we continued to focus on our commitment to delivering innovative solutions.
This included a continuous push on increasing grid connectivity in several markets, led by our business in Nigeria. Since 2020, we have implemented 245 off-grid rural sites in Nigeria, powered exclusively by solar, bringing the benefits of 2G and 3G voice and data access to thousands of previously unconnected people, helping them benefit from the socioeconomic opportunities made available by mobile connectivity. By deploying an efficient solar powered network solution, connected by dedicated, very-small-aperture terminal transmission links, we are providing scope to steadily expand the connection of additional rural settlements in our markets.
We also continued to implement ancillary technologies that improve our service delivery for customers, including by deploying our first Micro Edge Data Center in JK Shopping Mall, Brasilia, Brazil, with the aim of reducing bandwidth required and improving response times. We are exploring opportunities in other markets and leveraging our experience in delivering innovative infrastructure solutions to leading MNOs.
We accelerated our program of exploring opportunities arising from the IoT (Internet of Things) market, to open new opportunities for us and our customers.
“We are continually exploring new technologies and, following in-depth testing, started deploying supercapacitors which store electricity in a static state and discharge energy more efficiently.”
12 IHS Towers 2021 Annual Report
2021 2020
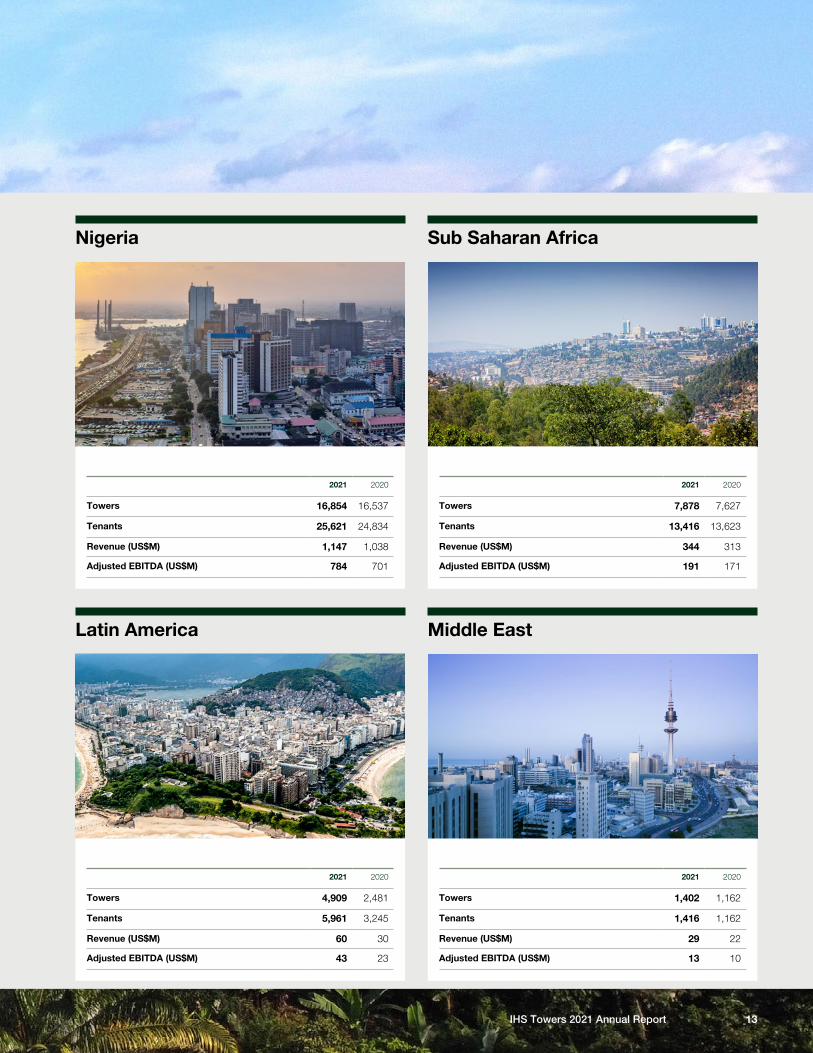
Towers 16,854 16,537
Tenants 25,621 24,834
Revenue (US$M) 1,147 1,038
Adjusted EBITDA (US$M) 784 701
2021 2020
Towers 4,909 2,481
Tenants 5,961 3,245
Revenue (US$M) 60 30
Adjusted EBITDA (US$M) 43 23
2021 2020
Towers 7,878 7,627
Tenants 13,416 13,623
Revenue (US$M) 344 313
Adjusted EBITDA (US$M) 191 171
2021 2020
Towers 1,402 1,162
Tenants 1,416 1,162
Revenue (US$M) 29 22
Adjusted EBITDA (US$M) 13 10
Sub Saharan Africa
Latin America
Nigeria
Middle East
13IHS Towers 2021 Annual Report
14 IHS Towers 2021 Annual Report
Sustainability
Helping to create a connected world
Our vision is to help create a connected world, where telecommunications promotes continued economic growth and social development.
We aim to achieve this by providing the infrastructure that allows people across our markets (approximately 600 million) to access the mobile communications that enable them to stay in touch, conduct business, access health and government services and be educated.
IHS Towers is a Signatory to the UN Global Compact, a UN pact to encourage businesses and firms worldwide to adopt sustainable and socially responsible policies, and to report on their implementation. As a Signatory, IHS is committed to adhering to the ten principles of the UN Global Compact relating to human rights, labor standards, environment and corruption. We believe that our sustainability programs also contribute to nine of the 17 United Nations Sustainable Development Goals (SDGs). We are also progressing towards quantifying our greenhouse gas (GHG) emissions, as a core component of helping minimize our environmental impact.
As in 2020, helping people cope with the impact and the residual effects of the COVID-19 pandemic on health, education and other services remained an essential focus for us in 2021.
A key highlight was the launch of our Frontline Workers Initiative, a new scholarship program which funds university education for the children of our frontline workers, our field engineers, drivers, security guards and maintenance personnel.
We recognize the extraordinary role these colleagues played in keeping our networks up and running, and the income inequality that has been exacerbated by the pandemic. Through this initiative, we hope to provide the families of our frontline workers, and equivalent suppliers, with the life-changing opportunities that equal access to education facilitates.
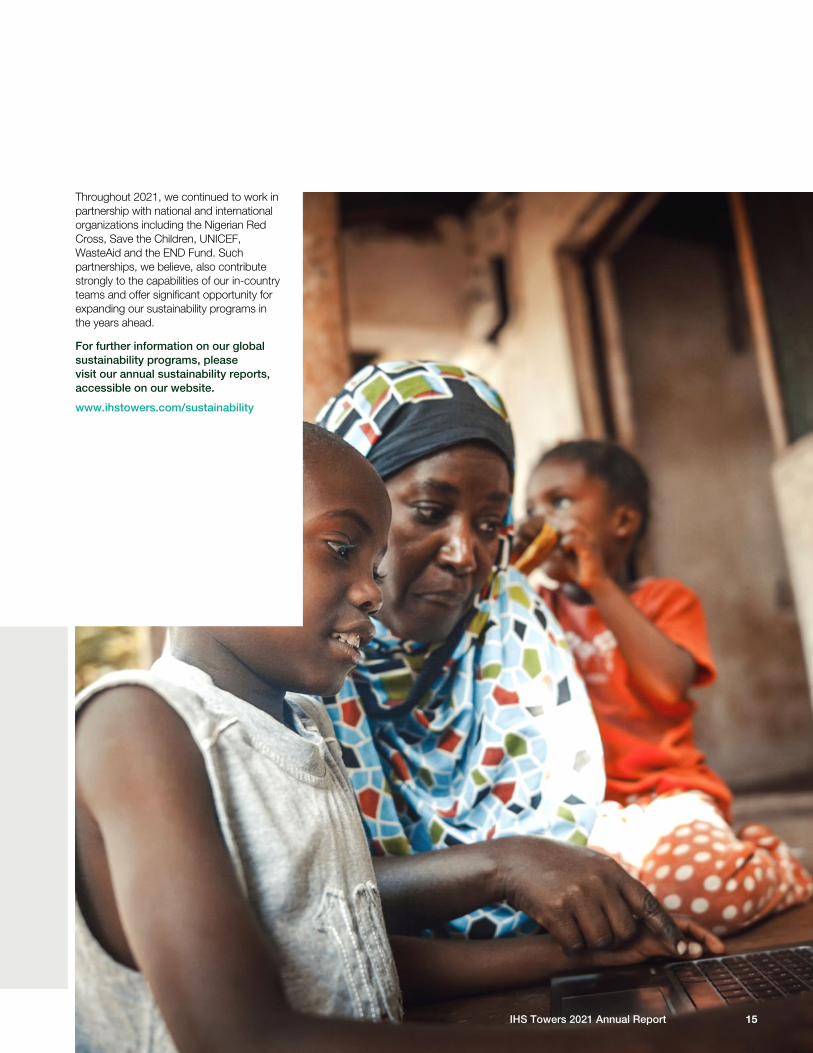
We are extremely proud of our sustainability record and the positive impact of our activities. For example, we believe that approximately one million people directly benefited from our programs in Nigeria during the last year alone.
Ethics and governanceWe strive to be a best-in-class responsible business that promotes the highest standards wherever we operate
We conduct business fairly and highlight the sustainability agenda whenever we can
Education and economic growthWe aim to enable mobile access to help more people benefit from connectivity
We focus on strengthening education opportunities and support the development of businesses and enterprises
Environment and climate changeWe work to minimize the impact of our operations and protect our shared environment by investing in more renewable energy sources
We innovate to create leading-edge engineering solutions and operational excellence that mitigate climate change and raise awareness of environmental issues
Our people and communitiesWe build a diverse and inclusive workforce made up of employees who contribute to the success of the communities in which they live
We focus on helping our employees and communities thrive.
Our approach places sustainability at the heart of our business. As well as the inherent sustainability of our business model, we have developed a sustainability strategy built on the following four pillars:
15IHS Towers 2021 Annual Report
Throughout 2021, we continued to work in partnership with national and international organizations including the Nigerian Red Cross, Save the Children, UNICEF, WasteAid and the END Fund. Such partnerships, we believe, also contribute strongly to the capabilities of our in-country teams and offer significant opportunity for expanding our sustainability programs in the years ahead.
For further information on our global sustainability programs, please visit our annual sustainability reports, accessible on our website.
www.ihstowers.com/sustainability

Sam DarwishChairman, CEO and Director
Ursula M. BurnsIndependent Non-Executive Director
Mallam Bashir Ahmad El-RufaiIndependent Non-Executive Director
Jeb BushIndependent Non-Executive Director
30%of Board Directors are female
16 IHS Towers 2021 Annual Report
Governance
Ethics at the heart of our organization
Our corporate structure provides a strong foundation of governance control, which is integral to our internal procedures and practices.
This ensures we operate compliantly and ethically at every level, in alignment with our values of accountability, achievement, respect and ethical conduct.
The Board has an appropriate balance of executive, non-executive and independent directors who provide a blend of knowledge, skills, objectivity and experience that serves the Group and its stakeholders appropriately.

Aniko SzigetraniIndependent Non-Executive Director
Nick LandIndependent Non-Executive Director
Maria Carolina LacerdaIndependent Non-Executive Director
Phuthuma NhlekoIndependent Non-Executive Director
Frank DangeardNon-Executive Director
Bryce FortNon-Executive Director
17IHS Towers 2021 Annual Report
The Board
The Board is supported by four committees
The Audit Committee
The Audit Committee meets at least four times a year, to coincide with key dates within the financial reporting and audit cycle. It is primarily responsible for ensuring IHS Towers’ financial reporting, auditing and internal controls are in full compliance with all regulation applicable to the jurisdictions in which each IHS entity operates.
The Remuneration Committee
The Remuneration Committee meets at least twice a year, focusing on identifying, reviewing and approving corporate goals and objectives relevant to executive officer remuneration. It ensures these are robust and in-line with company and market benchmarks.
The Nominations and Corporate Governance Committee The Nominations and Corporate Governance Committee meets a minimum of twice a year, with responsibility for the selection and appointment of all directors. It also reviews the composition, function and duties of the Board.
The Health, Safety and Environmental Committee
The Health, Safety and Environmental Committee, which we created during 2021, assists the Board in its oversight and support of the implementation and effectiveness of our environmental, health and safety risk-management procedures, policies, programs and initiatives.
UNITED STATES SECURITIES AND EXCHANGE COMMISSION
Washington, D.C. 20549
FORM 20-F (Mark One) ☐ REGISTRATION STATEMENT PURSUANT TO SECTION 12(b) OR (g) OF THE SECURITIES EXCHANGE ACT OF 1934
OR ☒ ANNUAL REPORT PURSUANT TO SECTION 13 OR 15(d) OF THE SECURITIES EXCHANGE ACT OF 1934
For the fiscal year ended December 31, 2021 OR
☐ TRANSITION REPORT PURSUANT TO SECTION 13 OR 15(d) OF THE SECURITIES EXCHANGE ACT OF 1934 For the transition period from to
OR ☐ SHELL COMPANY REPORT PURSUANT TO SECTION 13 OR 15(d) OF THE SECURITIES EXCHANGE ACT OF 1934
Date of event requiring this shell company report Commission file number 001-40876
IHS Holding Limited (Exact name of Registrant as specified in its charter)
Not Applicable (Translation of Registrant’s name into English)
Cayman Islands (Jurisdiction of incorporation or organization)
1 Cathedral Piazza 123 Victoria Street London SW1E 5BP
United Kingdom (Address of principal executive offices)
Sam Darwish Chief Executive Officer
Telephone: +44 20 8106 1600 IHS Holding Limited 1 Cathedral Piazza 123 Victoria Street London SW1E 5BP
United Kingdom (Name, Telephone, E-mail and/or Facsimile number and Address of Company Contact Person)
Securities registered or to be registered, pursuant to Section 12(b) of the Act
Title of each class Trading Symbol(s) Name of each exchange on which registered Ordinary shares, par value $0.30 per share IHS The New York Stock Exchange
Securities registered or to be registered pursuant to Section 12(g) of the Act: None Securities for which there is a reporting obligation pursuant to Section 15(d) of the Act: None Indicate the number of outstanding shares of each of the issuer’s classes of capital stock or common stock as of the close of the period covered by the annual report 327,820,418 ordinary shares Indicate by check mark if the registrant is a well-known seasoned issuer, as defined in Rule 405 of the Securities Act. Yes ☐ No ☒ If this report is an annual or transition report, indicate by check mark if the registrant is not required to file reports pursuant to Section 13 or 15(d) of the Securities Exchange Act of 1934. Yes ☐ No ☒ Note—Checking the box above will not relieve any registrant required to file reports pursuant to Section 13 or 15(d) of the Securities Exchange Act of 1934 from their obligations under those Sections. Indicate by check mark whether the registrant (1) has filed all reports required to be filed by Section 13 or 15(d) of the Securities Exchange Act of 1934 during the preceding 12 months (or for such shorter period that the registrant was required to file such reports), and (2) has been subject to such filing requirements for the past 90 days. Yes ☒ No ☐ Indicate by check mark whether the registrant has submitted electronically every Interactive Data File required to be submitted pursuant to Rule 405 of Regulation S-T (§ 232.405 of this chapter) during the preceding 12 months (or for such shorter period that the registrant was required to submit such files). Yes ☒ No ☐ Indicate by check mark whether the registrant is a large accelerated filer, an accelerated filer, a non-accelerated filer, or an emerging growth company. See the definitions of “large accelerated filer,” “accelerated filer,” and “emerging growth company” in Rule 12b-2 of the Exchange Act.
☐ Large accelerated filer ☐ Accelerated filer ☒ Non-accelerated filer ☐ Emerging growth company
If an emerging growth company that prepares its financial statements in accordance with U.S. GAAP, indicate by check mark if the registrant has elected not to use the extended transition period for complying with any new or revised financial accounting standards provided pursuant to Section 13(a) of the Exchange Act. ☐ Indicate by check mark whether the registrant has filed a report on and attestation to its management’s assessment of the effectiveness of its internal control over financial reporting under Section 404(b) of the Sarbanes-Oxley Act (15 U.S.C. 7262(b)) by the registered public accounting firm that prepared or issued its audit report. ☐ Indicate by check mark which basis of accounting the registrant has used to prepare the financial statements included in this filing:
☐ U.S. GAAP ☒ International Financial Reporting Standards as issued by the International Accounting Standards Board ☐ Other
If “Other” has been checked in response to the previous question indicate by check mark which financial statement item the registrant has elected to follow. Item 17 ☐ Item 18 ☐ If this is an annual report, indicate by check mark whether the registrant is a shell company (as defined in Rule 12b-2 of the Exchange Act). Yes ☐ No ☒
i
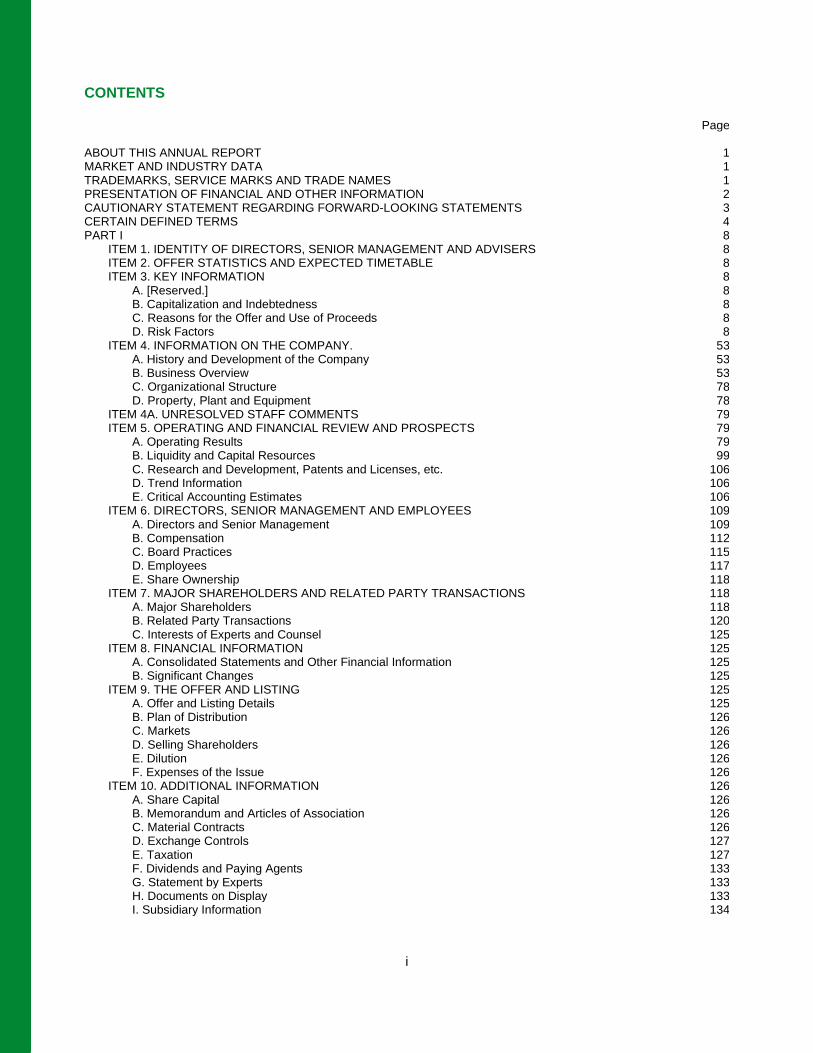
CONTENTS
Page ABOUT THIS ANNUAL REPORT 1 MARKET AND INDUSTRY DATA 1 TRADEMARKS, SERVICE MARKS AND TRADE NAMES 1 PRESENTATION OF FINANCIAL AND OTHER INFORMATION 2 CAUTIONARY STATEMENT REGARDING FORWARD-LOOKING STATEMENTS 3 CERTAIN DEFINED TERMS 4 PART I 8
ITEM 1. IDENTITY OF DIRECTORS, SENIOR MANAGEMENT AND ADVISERS 8 ITEM 2. OFFER STATISTICS AND EXPECTED TIMETABLE 8 ITEM 3. KEY INFORMATION 8
A. [Reserved.] 8 B. Capitalization and Indebtedness 8 C. Reasons for the Offer and Use of Proceeds 8 D. Risk Factors 8
ITEM 4. INFORMATION ON THE COMPANY. 53 A. History and Development of the Company 53 B. Business Overview 53 C. Organizational Structure 78 D. Property, Plant and Equipment 78
ITEM 4A. UNRESOLVED STAFF COMMENTS 79 ITEM 5. OPERATING AND FINANCIAL REVIEW AND PROSPECTS 79
A. Operating Results 79 B. Liquidity and Capital Resources 99 C. Research and Development, Patents and Licenses, etc. 106 D. Trend Information 106 E. Critical Accounting Estimates 106
ITEM 6. DIRECTORS, SENIOR MANAGEMENT AND EMPLOYEES 109 A. Directors and Senior Management 109 B. Compensation 112 C. Board Practices 115 D. Employees 117 E. Share Ownership 118
ITEM 7. MAJOR SHAREHOLDERS AND RELATED PARTY TRANSACTIONS 118 A. Major Shareholders 118 B. Related Party Transactions 120 C. Interests of Experts and Counsel 125
ITEM 8. FINANCIAL INFORMATION 125 A. Consolidated Statements and Other Financial Information 125 B. Significant Changes 125
ITEM 9. THE OFFER AND LISTING 125 A. Offer and Listing Details 125 B. Plan of Distribution 126 C. Markets 126 D. Selling Shareholders 126 E. Dilution 126 F. Expenses of the Issue 126
ITEM 10. ADDITIONAL INFORMATION 126 A. Share Capital 126 B. Memorandum and Articles of Association 126 C. Material Contracts 126 D. Exchange Controls 127 E. Taxation 127 F. Dividends and Paying Agents 133 G. Statement by Experts 133 H. Documents on Display 133 I. Subsidiary Information 134
ii
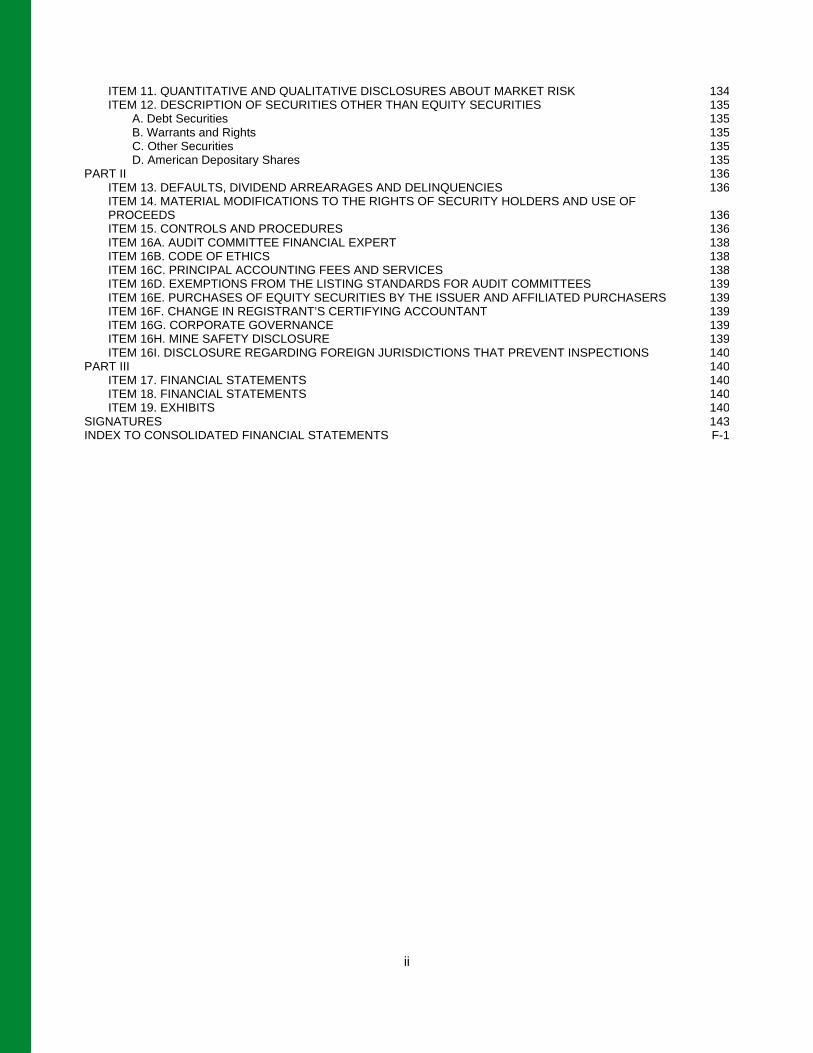
ITEM 11. QUANTITATIVE AND QUALITATIVE DISCLOSURES ABOUT MARKET RISK 134 ITEM 12. DESCRIPTION OF SECURITIES OTHER THAN EQUITY SECURITIES 135
A. Debt Securities 135 B. Warrants and Rights 135 C. Other Securities 135 D. American Depositary Shares 135
PART II 136 ITEM 13. DEFAULTS, DIVIDEND ARREARAGES AND DELINQUENCIES 136 ITEM 14. MATERIAL MODIFICATIONS TO THE RIGHTS OF SECURITY HOLDERS AND USE OF PROCEEDS 136 ITEM 15. CONTROLS AND PROCEDURES 136 ITEM 16A. AUDIT COMMITTEE FINANCIAL EXPERT 138 ITEM 16B. CODE OF ETHICS 138 ITEM 16C. PRINCIPAL ACCOUNTING FEES AND SERVICES 138 ITEM 16D. EXEMPTIONS FROM THE LISTING STANDARDS FOR AUDIT COMMITTEES 139 ITEM 16E. PURCHASES OF EQUITY SECURITIES BY THE ISSUER AND AFFILIATED PURCHASERS 139 ITEM 16F. CHANGE IN REGISTRANT’S CERTIFYING ACCOUNTANT 139 ITEM 16G. CORPORATE GOVERNANCE 139 ITEM 16H. MINE SAFETY DISCLOSURE 139 ITEM 16I. DISCLOSURE REGARDING FOREIGN JURISDICTIONS THAT PREVENT INSPECTIONS 140
PART III 140 ITEM 17. FINANCIAL STATEMENTS 140 ITEM 18. FINANCIAL STATEMENTS 140 ITEM 19. EXHIBITS 140
SIGNATURES 143 INDEX TO CONSOLIDATED FINANCIAL STATEMENTS F-1
1
ABOUT THIS ANNUAL REPORT
Except where the context otherwise requires or where otherwise indicated in this Annual Report, the terms “IHS Towers,” the “Company,” “the Group,” “we,” “us,” “our,” “our company” and “our business” refer to IHS Holding Limited, together with its consolidated subsidiaries as a consolidated entity.
MARKET AND INDUSTRY DATA
We obtained the industry, market and competitive position data and forecasts in this Annual Report from our own internal estimates and research as well as from publicly available information, industry and general publications and research, surveys and studies conducted by third parties, including Euromonitor International Limited. Certain industry, market and competitive position data and information referred to in this Annual Report is based on third-party data provided by Analysys Mason Limited, or Analysys Mason, commissioned between May 15, 2021 and May 27, 2021 for use in this Annual Report. This information involves a number of assumptions and limitations, and you are cautioned not to give undue weight to these estimates, as there is no assurance that any of them will be reached. Our and Analysys Mason’s data is derived from publicly available information released by independent industry analysts and other third-party sources, as well as data from our and Analysys Mason’s internal research, and are based on assumptions made by us upon reviewing such data, and our experience in, and knowledge of, such industry and markets, which we believe to be reasonable. Analysys Mason’s third party data is also prepared on the basis of information provided and views expressed by mobile operators, tower operators and other parties (including certain views expressed and information provided or published by individual operators, service providers, regulatory bodies, industry analysts and other third party sources of data). Although Analysys Mason has obtained such information from sources it believes to be reliable, neither we nor Analysys Mason have verified such information. You are cautioned not to give undue weight to these estimates and assumptions.
In many cases, there is no readily available external information (whether from trade associations, government bodies or other organizations) to validate market related analyses and estimates, requiring us to rely on our own internally developed estimates regarding the industry in which we operate, our position in the industry, our market share and the market shares of various industry participants based on our experience, our own investigation of market conditions and our review of industry publications, including information made available to the public by our competitors. While we believe our internal estimates to be reasonable, these estimates have not been verified by any independent sources and you are cautioned not to give undue weight to these estimates.
Industry publications, research, surveys and studies generally state that the information they contain has been obtained from sources believed to be reliable, but that the accuracy and completeness of such information is not guaranteed. Forecasts and other forward-looking information obtained from these sources and from our and Analysys Mason’s estimates are subject to the same qualifications and uncertainties as the other forward-looking statements in this Annual Report and as described under “Cautionary Statement Regarding Forward-Looking Statements.” These forecasts and other forward-looking information, are subject to uncertainty and risk due to a variety of factors, including those described under Item 3.D. “Risk Factors.” These and other factors could cause results to differ materially from those expressed in the forecasts or estimates from independent third parties and us.
In addition, our and Analysys Mason’s estimates involve risks and uncertainties and are subject to change based on various factors. See Item 3.D. “Risk Factors” and Item 4.B. “Information on the Company—Business Overview” for further discussion.
TRADEMARKS, SERVICE MARKS AND TRADE NAMES
We have proprietary rights to trademarks used in this Annual Report that are important to our business, many of which are registered under applicable intellectual property laws.
Solely for convenience, the trademarks, service marks, logos and trade names referred to in this Annual Report are without the ® and ™ symbols, but such references are not intended to indicate, in any way, that we will not assert, to the fullest extent under applicable law, our rights or the rights of the applicable licensors to these trademarks, service marks and trade names. This Annual Report contains additional trademarks, service marks and trade names of others, which are the property of their respective owners. All trademarks, service marks and trade names appearing in this Annual Report are, to our knowledge, the property of their respective owners. We do not intend our use or display of other companies’ trademarks, service marks, copyrights or trade names to imply a relationship with, or endorsement or sponsorship of us by, any other companies.
2
PRESENTATION OF FINANCIAL AND OTHER INFORMATION
We report under International Financial Reporting Standards, or IFRS, as issued by the International Accounting Standards Board, or the IASB.
Use of Non-IFRS financial measures
Certain parts of this Annual Report contain non-IFRS financial measures, including Adjusted EBITDA and Adjusted EBITDA Margin. The non-IFRS financial information is presented for supplemental informational purposes only and should not be considered a substitute for financial information presented in accordance with IFRS, and may be different from similarly titled non-IFRS measures used by other companies.
We define Adjusted EBITDA as profit/(loss) for the period, before income tax expense/(benefit), finance costs and income, depreciation and amortization, impairment of withholding tax receivables, business combination transaction costs, impairment of property, plant and equipment and related prepaid land rent on the decommissioning of sites, reversal of provision for decommissioning costs, net (profit)/loss on sale of assets, share-based payment (credit)/expense, insurance claims, listing costs and certain other items that management believes are not indicative of the core performance of our business. The most directly comparable IFRS measure to Adjusted EBITDA is our profit/(loss) for the period.
We define Adjusted EBITDA Margin as Adjusted EBITDA divided by revenue for the applicable period, expressed as a percentage.
We believe that Adjusted EBITDA is an indicator of the operating performance of our core business. We believe Adjusted EBITDA and Adjusted EBITDA Margin, as defined above, are useful to investors and are used by our management for measuring profitability and allocating resources, because they exclude the impact of certain items which have less bearing on our core operating performance. We believe that utilizing Adjusted EBITDA and Adjusted EBITDA Margin allows for a more meaningful comparison of operating fundamentals between companies within our industry by eliminating the impact of capital structure and taxation differences between the companies.
Adjusted EBITDA measures are frequently used by securities analysts, investors and other interested parties in their evaluation of companies comparable to us, many of which present an Adjusted EBITDA-related performance measure when reporting their results.
Adjusted EBITDA and Adjusted EBITDA Margin are used by different companies for differing purposes and are often calculated in ways that reflect the circumstances of those companies. You should exercise caution in comparing Adjusted EBITDA and Adjusted EBITDA Margin as reported by us to Adjusted EBITDA and Adjusted EBITDA Margin as reported by other companies. Adjusted EBITDA and Adjusted EBITDA Margin are unaudited and have not been prepared in accordance with IFRS.
Adjusted EBITDA and Adjusted EBITDA Margin are not measures of performance under IFRS and you should not consider Adjusted EBITDA or Adjusted EBITDA Margin as an alternative to profit/(loss) for the period or other financial measures determined in accordance with IFRS.
Adjusted EBITDA and Adjusted EBITDA Margin have limitations as analytical tools, and you should not consider them in isolation. Some of these limitations are:
• they do not reflect interest expense, or the cash requirements necessary to service interest or principal payments, on our indebtedness;
• although depreciation and amortization are non-cash charges, the assets being depreciated and amortized will often need to be replaced in the future and Adjusted EBITDA and Adjusted EBITDA Margin do not reflect any cash requirements that would be required for such replacements;
• some of the items we eliminate in calculating Adjusted EBITDA and Adjusted EBITDA Margin reflect cash payments that have less bearing on our core operating performance, but that impact our operating results for the applicable period; and
3
• the fact that other companies in our industry may calculate Adjusted EBITDA and Adjusted EBITDA Margin differently than we do, which limits their usefulness as comparative measures.
Accordingly, investors should not place undue reliance on Adjusted EBITDA or Adjusted EBITDA Margin.
CAUTIONARY STATEMENT REGARDING FORWARD-LOOKING STATEMENTS
This Annual Report contains forward-looking statements. We intend such forward-looking statements to be covered by relevant safe harbor provisions for forward-looking statements (or their equivalent) of any applicable jurisdiction, including those contained in Section 27A of the Securities Act of 1933, as amended (the “Securities Act”), and Section 21E of the Securities Exchange Act of 1934, as amended (the “Exchange Act”). All statements other than statements of historical facts contained in this Annual Report may be forward-looking statements. In some cases, you can identify forward-looking statements by terms such as “may,” “will,” “should,” “expects,” “plans,” “anticipates,” “could,” “intends,” “targets,” “projects,” “contemplates," “believes,” “estimates,” “forecast,” “predicts,” “potential” or “continue” or the negative of these terms or other similar expressions. Forward-looking statements contained in this Annual Report include, but are not limited to statements regarding our future results of operations and financial position, including our results of operations and financial position, industry and business trends, business strategy, plans, market growth and our objectives for future operations.
We have based these forward-looking statements largely on our current expectations and projections about future events and financial trends that we believe may affect our business, financial condition and results of operations. Forward-looking statements involve known and unknown risks, uncertainties and other important factors that may cause our actual results, performance or achievements to be materially different from any future results, performance or achievements expressed or implied by the forward-looking statements, including, but not limited to:
• non-performance under or termination, non-renewal or material modification of our customer agreements;
• volatility in terms of timing for settlement of invoices or our inability to collect amounts due under invoices;
• a reduction in the creditworthiness and financial strength of our customers;
• the business, legal and political risks in the countries in which we operate;
• general macroeconomic conditions in the countries in which we operate;
• changes to existing or new tax laws, rates or fees;
• foreign exchange risks and/or ability to access U.S. Dollars in our markets;
• regional or global health pandemics, including COVID 19, and geopolitical conflicts and wars, including the current situation between Russia and Ukraine;
• our inability to successfully execute our business strategy and operating plans, including our ability to increase the number of Colocations and Lease Amendments on our Towers and construct New Sites or develop business related to adjacent telecommunications verticals (including, for example, relating to our anticipated fiber businesses in Latin America and elsewhere);
• reliance on third-party contractors, including failure or underperformance;
• increases in operating expenses, including increased costs for diesel;
• failure to renew or extend our ground leases, or protect our rights to access and operate our Towers or other telecommunications infrastructure assets;
• loss of customers;
• changes to the network deployment plans of mobile operators in the countries in which we operate;
• a reduction in demand for our services;
• the introduction of new technology reducing the need for tower infrastructure and/or adjacent telecommunication verticals;
4
• an increase in competition in the telecommunications tower infrastructure industry and/or adjacent telecommunication verticals;
• our failure to integrate recent or future acquisitions;
• reliance on our senior management team and/or key employees;
• failure to obtain required approvals and licenses for some of our sites or businesses or comply with applicable regulations;
• environmental liability;
• inadequate insurance coverage, property loss and unforeseen business interruption;
• violations of anti-bribery, anti-corruption and/or money laundering laws, sanctions and regulations;
• fluctuations in global prices for diesel or other materials;
• disruptions in our supply of diesel or other materials;
• legal and arbitration proceedings;
• reliance on shareholder support (including to invest in growth opportunities) and related party transaction risks;
• risks related to the markets in which we operate;
• injury, illness or death of employees, contractors or third parties arising from health and safety incidents;
• loss or damage of assets due to security issues or civil commotion;
• loss or damage resulting from attacks on any information technology system or software;
• loss or damage of assets due to extreme weather events whether or not due to climate change;
• failure to meet the requirements of accurate and timely financial reporting and/or meet the standards of internal control over financial reporting that support a clean certification under the Sarbanes Oxley Act;
• risks related to our status as a foreign private issuer; and
• the important factors discussed in the section titled “Risk Factors” in this Annual Report.
The forward-looking statements in this Annual Report are based upon information available to us as of the date of this Annual Report, and while we believe such information forms a reasonable basis for such statements, such information may be limited or incomplete, and our statements should not be read to indicate that we have conducted an exhaustive inquiry into, or review of, all potentially available relevant information. These statements are inherently uncertain and investors are cautioned not to unduly rely upon these statements. You should read this Annual Report and the documents that we reference in this Annual Report with the understanding that our actual future results, performance and achievements may be materially different from what we expect. We qualify all of our forward-looking statements by these cautionary statements. These forward-looking statements speak only as of the date of this Annual Report. Except as required by applicable law, we do not plan to publicly update or revise any forward-looking statements contained in this Annual Report, whether as a result of any new information, future events or otherwise..
CERTAIN DEFINED TERMS
Unless the context provides otherwise, references herein to:
• “2025 Notes” refers to our $510 million 7.125% Senior Notes due 2025, which were fully repaid in November 2021.
• “2026 Notes” refers to our $500 million 5.625% Senior Notes due 2026.
5
• “2027 Notes” refers to our $940 million 8.0% Senior Notes due 2027.
• “2028 Notes” refers to our $500 million 6.250% Senior Notes due 2028.
• “9mobile” refers to Emerging Markets Telecommunication Services Limited, which was previously known as Etisalat Nigeria.
• “Airtel Nigeria” refers to Airtel Networks Limited, a subsidiary of Airtel Africa.
• “CBN” refers to the Central Bank of Nigeria.
• “Centennial Acquisition” refers to the acquisition by us on March 19, 2021 of Centennial Colombia and the acquisition by us on April 8, 2021 of Centennial Brazil, both from affiliates of Centennial Towers Holding LP. At closing, Centennial Colombia had 217 towers and Centennial Brazil had 602 towers.
• “Centennial Brazil” refers to Centennial Towers Brasil Coöperatief U.A. and its subsidiaries.
• “Centennial Colombia” refers to Centennial Towers Colombia, S.A.S. and its subsidiaries.
• “CSS” refers to Cell Sites Solutions — Cessão de Infraestruturas S.A.
• “CSS Acquisition” refers to the acquisition by us on February 18, 2020 of CSS from affiliates of Goldman Sachs and Centaurus Capital LP. At closing, CSS had 2,312 towers, including 2,251 towers in Brazil, 51 in Peru and 10 in Colombia.
• “Churn” refers to the loss of tenancies when services provided by us are terminated, a Tenant does not renew its contract or we have ceased recognizing revenue for sites under a customer’s contract in any particular period. When we decommission a site and move a customer from one of our sites to another site to rationalize our portfolio, this is not included in Churn.
• “Colocation” refers to the installation of equipment on existing towers for a new tenant alongside current Tenants.
• “Colocation Rate” refers to the average number of Tenants per Tower across our portfolio at a given point in time. We calculate the Colocation Rate by dividing the total number of Tenants across our portfolio by the total number of Towers across our portfolio at a given time.
• “Contracted Revenue” refers to lease fees to be received from the existing Tenants of Key Customers for the remainder of each Tenant’s current contractual site lease term, lease fees to be received from the existing Lease Amendments of Key Customers for the remainder of each Lease Amendment’s current contractual term and lease fees to be received from Key Customers where we provide fiber access to an OLT for the remainder of the relevant contractual term, as of a specified date. In aggregating Contracted Revenue, we have taken the average lease rate for our Key Customers as of December 31, 2021, which is applied to the remaining term of the tenancies, lease amendments and fiber access of each Key Customer, assuming constant foreign exchange rates, no escalation of lease rates despite contractual provisions in our MLAs in that regard, no new Tenants, new Lease Amendments or new access to fiber, no amendments to our existing MLA terms and no Churn. See “Risk Factors — Our Contracted Revenue is based on certain estimates and assumptions and actual results may differ materially from such estimated operating results.”
• “Dollar”, “USD” or “$” refer to U.S. dollars.
• “Egypt Transaction” refers to a partnership agreement with Egypt Digital Company for Investment S.A.E., an investment vehicle of the Egyptian Ministry of Communications, to form a joint venture, IHS Telecom Towers Egypt S.A.E., or IHS Egypt, to obtain a license from the National Telecom Regulatory Authority (“NTRA”) to construct, operate and lease telecom towers in Egypt. Under the terms of the license, and subject to the fulfillment of certain conditions, IHS Egypt will have a commitment to a coverage plan of 5,800 sites over a three-year period. IHS Towers will own 80% of IHS Egypt and Egypt Digital Company for Investment will own the remaining 20%.
6
• “euro” or “€” refer to the currency introduced at the start of the third stage of European economic and monetary union pursuant to the treaty establishing the European Community, as amended.
• “GTS SP5 Acquisition” refers to our signing of definitive transaction agreements with Grupo Torresur on January 21, 2022 in relation to the acquisition of São Paulo Cinco Locação de Torres Ltda (“SP5”). At the time of signing, the SP5 portfolio had 2,115 towers. Closing remains subject to customary conditions and approvals.
• “IHS Holding Limited Notes” refers to our 2026 Notes and our 2028 Notes, collectively.
• “IHS Netherlands Holdco B.V. Notes” refers to our 2025 Notes and our 2027 Notes, collectively.
• “IHS Nigeria” refers to IHS (Nigeria) Limited, one of our operating subsidiaries in Nigeria.
• “INT Towers” refers to INT Towers Limited, one of our operating subsidiaries in Nigeria.
• “Key Customers” refers to MTN Customers, Orange Cameroun S.A., or Orange Cameroon, Orange Côte d’Ivoire S.A., or Orange Côte d’Ivoire, 9mobile, Airtel Nigeria, Airtel Networks Zambia PLC, or Airtel Zambia, Airtel Rwanda Limited, or Airtel Rwanda, Claro S.A., or Claro Brazil, TIM Cellular S.A., or TIM Brasil, Telefonica Brasil S.A., or Vivo Brazil, Colombia Móvile S.A. E.S.P., or Tigo Colombia, COMSEL S.A., or Claro Colombia, Colombia Telecomunicaciones S.A. ESP BIC, or Vivo Colombia, América móvil Perú SAC, or Claro Peru and Zain Kuwait.
• “Kuwait Acquisition” refers to the acquisition by us of up to 1,620 towers from Zain Kuwait. The acquisition was signed in October 2017, and we completed multiple closings totaling 1,355 towers as of December 31, 2021. The remaining towers are managed and operated under a Managed Services agreement until such time as these towers can legally be transferred to us. These towers are operated in Kuwait through an entity in which we own 70% of the shares and Zain Kuwait owns the remaining 30%.
• “Lease Amendments” refers to the installation of additional equipment on a site or the provision of certain ancillary services for an existing Tenant, for which we charge our customers a recurring lease fee.
• “LTE” refers to long-term evolution, a standard for high-speed wireless communication for mobile devices and data terminals. We refer to LTE and 4G interchangeably in this Annual Report.
• “Managed Services” refers to when MNOs outsource the day-to-day operations of their owned towers or other towers on which they are present, including maintenance, security and power supply.
• “MLA” refers to the long-term lease agreements we enter into with our customers, including but not limited to master lease agreements, master services agreements, infrastructure sharing agreements, master tower space use/license agreements and MLL agreements.
• “MLL” refers to towers we manage with a license to lease for a defined period. Where there is an MLL agreement, we have the right to lease out space on the tower to other MNOs and provide services, generating further revenue for ourselves. The site owner typically reduces its operating costs and eliminates capital expenditures.
• “MNOs” refers to mobile network operators.
• “MTN Customers” refers to MTN Nigeria, MTN Côte d’Ivoire S.A., or MTN Côte d’Ivoire, MTN Cameroon Limited, or MTN Cameroon, MTN Zambia Limited, or MTN Zambia, and MTN Rwandacell Limited, or MTN Rwanda.
• “MTN Group” refers to MTN Group Limited and its subsidiaries, one of which is one of our shareholders as well as a related party of certain MTN operating entities that are our customers in the countries in which we currently operate. In each African market in which we currently operate, one of the MTN operating entities is a customer of ours.
• “MTN Nigeria” refers to MTN Nigeria Communications PLC.
7
• “MTN SA Acquisition” refers to our signing of definitive transaction agreements with MTN South Africa on November 17, 2021 in relation to the acquisition of approximately 5,709 towers. As part of the transaction, we will also be required to provide Managed Services to approximately 7,100 additional MTN South Africa sites. IHS Towers will over time own 70% of the South African Towers business with the remaining 30% owned by a B-BBEE consortium. Closing remains subject to customary conditions and approvals.
• “MTN South Africa” refers to Mobile Telephone Networks Proprietary Limited.
• “NAFEX” refers to the Nigerian Autonomous Foreign Exchange Rate Fixing Methodology.
• “Naira” and “₦” refers to the lawful currency of the Federal Republic of Nigeria.
• “New Sites” refers to Towers owned and operated by the Group constructed through build-to-suit arrangements for the initial Tenant.
• “Notes” refers to the IHS Holding Limited Notes and IHS Netherlands Holdco B.V. Notes, collectively.
• “OLT” refers to an optical line terminal or optical line termination, which is a device which serves as the service provider endpoint of a passive optical network.
• “Prospectus” refers to the final prospectus of IHS Holding Limited, dated October 13, 2021, filed with the Securities and Exchange Commission (“SEC”) in accordance with Rule 424(b) of the Securities Act on October 15, 2021.
• “ROU” refers to towers we operate under a right of use agreement for a defined period. Where there is an ROU agreement, we have the right to lease out space on the tower to other MNOs and provide services, generating further revenue for ourselves.
• “sites” refers to towers that are owned or operated by us.
• “Skysites” refers to Skysites Holdings S.A.
• “Skysites Acquisition” refers to the acquisition by us on January 6, 2021 of Skysites from a group of eighteen persons. At closing, Skysites had 1,005 towers in Brazil.
• “SLAs” refer to site-specific documents or agreements entered into in relation to specific sites pursuant to an MLA.
• “subscribers” refers to the number of active subscriber identification module, or SIM, cards in service rather than the number of services provided (excluding machine to machine connections). For example, if a subscriber has both a data and voice plan on a smartphone this would equate to one subscriber. Alternatively, a subscriber who has a data and voice plan for a smartphone and a data plan for a tablet would be counted as two subscribers.
• “Tenants” refers to the number of distinct customers who have leased space on each Tower across our portfolio. For example, if one customer had leased tower space on five of our Towers, we would have five Tenants.
• “TIM Fiber Acquisition” refers to the acquisition and deployment of TIM Brasil’s secondary fiber network infrastructure. Closing occurred on November 16, 2021. The existing and future fiber assets are operated in Brazil through a new entity, which we refer to as I-Systems, in which we own 51% of the shares and TIM Brasil owns the remaining 49%.
• “TIM Brasil” refers to TIM S.A.
• “Towers” refers to ground-based towers, rooftop and wall-mounted towers, cell poles, in-building solutions, small cells, distributed antenna systems and cells-on-wheels, each of which is deployed to support wireless transmission equipment. We measure the number of Towers in our portfolio at a given time by counting the number of Towers that we own or operate with at least one Tenant. The number of Towers in our portfolio excludes any towers for which we provide managed services.
• “Zain Kuwait” refers to Mobile Telecommunications Company K.S.C.P.
8
PART I
Item 1. Identity of Directors, Senior Management and Advisers
Not applicable.
Item 2. Offer Statistics and Expected Timetable
Not applicable.
Item 3. Key Information
A. [Reserved.]
B. Capitalization and Indebtedness
Not applicable.
C. Reasons for the Offer and Use of Proceeds
Not applicable.
D. Risk Factors
You should carefully consider the risks described below before making an investment decision. Additional risks not presently known to us or that we currently deem immaterial may also impair our business operations. Our business, financial condition or results of operations could be adversely affected by any of these risks. The trading price and value of our ordinary shares could decline due to any of these risks, and you may lose all or part of your investment. This Annual Report also contains forward- looking statements that involve risks and uncertainties. Our actual results could differ materially from those anticipated in these forward-looking statements as a result of certain factors, including the risks faced by us described below and elsewhere in this Annual Report.
Risks Relating to Our Business
A significant portion of our revenue is derived from a small number of MNOs. Non-performance under or termination, non-renewal or material modification of customer lease agreements with these customers could have a material adverse effect on our business, prospects, financial condition and/or results of operations.
A significant portion of our revenue in each of our markets of operation is derived from a small number of customers, who usually constitute some of the largest MNOs in those markets. In particular, for the years ended December 31, 2021 and 2020, revenue from our top three MNO customers, considered in each of our individual markets of operation, collectively accounted for 98% and 98%, respectively, of our consolidated revenue, with MTN Nigeria and Airtel Nigeria accounting for 55% and 11% respectively, of our consolidated revenue for the year ended December 31, 2021. Should there be any negative impact on the businesses of our major customers, including these key MNOs, this in turn could adversely affect their demand for tower space and/or ability to perform their obligations under their lease agreements with us.
Due to the long-term nature of our MLAs (usually 5 to 15 years with subsequent renewal provisions), we are also dependent on the continued financial strength of our customers.
Some customers may operate with substantial leverage and/or rely on capital-raising to fund their operations and such customers may not have sufficient credit support or the ability to raise capital. If, for example, our customers or potential customers are unable to raise adequate capital to fund their business plans as a result of health pandemics or epidemics, including the ongoing outbreak of COVID-19 and future coronavirus or other outbreaks or events with a wide-ranging regional or global impact, or do not have adequate parental support, they may reduce their capital spending, which could materially and adversely affect demand for space on our Tower sites or other infrastructure, which in turn could have a material adverse effect on our financial condition and/or results of operations.
9
Furthermore, some of our customers may become subject to regulatory or other action, which may result in unanticipated levies or fines. For example, in 2018, the CBN alleged improper repatriation by MTN Nigeria Communications PLC, or MTN Nigeria, of $8.1 billion between 2007 and 2015. The CBN, upon review of additional documentation, concluded that MTN Nigeria was no longer required to reverse the historical dividend payments made to MTN Nigeria shareholders. The CBN instructed MTN Nigeria to implement a notional reversal of the 2008 private placement of shares in MTN Nigeria at a net cost of circa ₦19.2 billion—equivalent to $52.6 million (the notional reversal amount). This is on the basis that certain certificates of capital importation or CCIs, utilized in the private placement were not properly issued. MTN Nigeria and the CBN agreed that they will resolve the matter on the basis that MTN Nigeria will pay the notional reversal amount without admission of liability, and that the CBN will regularize all the CCIs issued on the investment by shareholders of MTN Nigeria, thereby bringing to a final resolution all incidental disputes arising from this matter.
In addition, MTN Nigeria was, until January 2020, involved in a $2 billion dispute with Nigeria’s Attorney General regarding a demand for allegedly unpaid tax. In January 2020, the Attorney General withdrew its claims against MTN Nigeria and instead referred the matter to the Nigeria Federal Inland Revenue Service and the Nigeria Customs Service. Any fines levied against our customers, their inability to fund their operations or other financial difficulties experienced by our customers could negatively affect their demand for tower space or their ability to perform their obligations under their lease agreements with us, and in turn could have a material adverse effect on our business, prospects, financial condition and/or results of operations.
In addition, in 2017 Emerging Markets Telecommunication Services Limited, or 9mobile, previously known as Etisalat Nigeria, one of our Key Customers in Nigeria, experienced certain payment issues with lenders, which ultimately resulted in the lenders enforcing their security rights pursuant to the credit agreement over the shares previously held by Etisalat Group (Emirates Telecommunications Group Company PJSC). 9mobile was reportedly sold in a distressed M&A process in November 2018, however, it has since been publicly reported that the international element of the consortium pulled out of the acquisition in early 2019 and the current ownership status remains unclear. 9mobile continues to trade in Nigeria and had a 6.6% market share as of December 31, 2021, down from 15% in 2015. In 2017 and 2018, we incurred a bad and doubtful debt charge of $38.3 million and $30.0 million respectively, relating to 9mobile’s outstanding trade receivables balance as a result of its financial distress during the period it was being restructured. While we continue to engage with 9mobile as a regular customer and currently continue to receive payments from 9mobile, 9mobile has failed to make full monthly payments to us in the past and any continued or future failure to make payments (including pursuant to any new arrangements entered into to try and resolve the situation) may result in us not receiving payment of amounts owed to us and further potential renegotiation of contract terms. See “— We may experience volatility in terms of timing for settlement of invoices or may be unable to collect amounts due under invoices.” These circumstances may, in turn, have a material adverse effect on our business, prospects, financial condition and/or results of operations. For the years ended December 31, 2021 and 2020, 9mobile accounted for 6% and 7% of our revenue generated, respectively.
In addition, if any of our customers are unwilling or unable to perform their obligations under the relevant tower lease or other customer agreements, including as a result of health pandemics or epidemics, such as the ongoing outbreak of COVID-19 and future coronavirus or other outbreaks or events with a wide-ranging regional or global impact, or related events (such as regulatory interventions on pricing to make MNO services more accessible during periods of lockdown or restricted movement or operations), our revenues, financial condition and/or results of operations could be adversely affected. In the ordinary course of our business, we do occasionally experience disputes with our customers, generally regarding the interpretation of terms in our lease agreements. From time to time, we also undertake routine revenue assurance exercises to determine that all customer equipment on site and services being provided to the customers are being accurately invoiced according to our contracts, and occasionally, we locate equipment that we have not previously invoiced to customers that we believe we are contractually able to invoice. Historically, we have sought to resolve these disputes in an amicable manner, and such disputes have not had a material adverse effect on our customer relationships or our business. However, it is possible that such disputes could lead to a termination of our lease agreements with customers, a material modification of the terms of those lease agreements or a failure to obtain new business from existing customers, any of which could have a material adverse effect on our business, prospects, financial condition and/or results of operations. Furthermore, if we are forced to resolve any of these disputes through litigation or arbitration, our relationship with the applicable customer could be terminated or damaged, which could lead to decreased revenue or increased costs, which may in turn result in a material adverse effect on our business, prospects, financial condition and/or results of operations.
Our customers may fail to meet their payment obligations on a timely basis or at all. Such failures to pay, payment delays or other non-performance may be due to a customer’s insolvency or bankruptcy, a downturn in the economic cycle or factors specific to the relevant customer. The failure of our customers to meet their payment obligations and/or our inability to find new customers in a timely manner could have a material adverse effect on our financial condition and/or results of operations.
10
No assurance can be given that our customers will renew their customer lease agreements upon expiration of those agreements or that customers will not request unfavorable amendments to existing agreements. Also, no assurance can be given that we will be successful in negotiating favorable terms with these customers. Any failure to obtain renewals of existing customer lease agreements or failure to successfully negotiate favorable terms for such renewals of or amendments to existing agreements (if sought) could result in a reduction in revenues and, accordingly, have a material adverse effect on our business, prospects, financial condition and/or results of operations.
We may experience volatility in terms of timing for settlement of invoices or may be unable to collect amounts due under invoices.
Our contractual invoicing cycle is typically monthly in arrears or monthly or quarterly in advance, with the contractual payment cycle on average 30 to 60 days post invoice. As of December 31, 2021, we had gross receivables more than 90 days overdue of $75.5 million and held an impairment provision allowance of $51.0 million. While we may continue to pursue our contractual rights in collecting outstanding amounts, should the relevant counterparties be unable to meet their obligations to pay us any such sums in a timely manner, including as a result of health pandemics or epidemics, such as the ongoing outbreak of COVID-19 and future coronavirus or other outbreaks or events with a wide-ranging regional or global impact, or related consequences, this could have a material adverse effect on our business, prospects, financial condition and/or results of operations, including planned working capital requirements. In addition, if our customers experience financial difficulties, as a result of regulatory actions, the COVID-19 pandemic or related effects, prolonged economic downturn, inability to raise funds or capital, or for any other reason, we may be unable to collect amounts due under invoices from those customers, which could have a material adverse effect on our business, prospects, financial condition and/or results of operations.
Our current and future markets involve additional risks compared to more developed markets, which could have a material adverse effect on our business, prospects, financial condition and/or results of operations.
We and our customers operate in various international markets, particularly in emerging markets such as in Africa, the Middle East and Latin America. As a result, we may, directly or indirectly, be exposed to economic, political and other uncertainties, including risks of:
• general political and/or economic conditions, including any deterioration thereof, including inflation, impacting our existing or anticipated markets of operation, such as the effects of health pandemics or epidemics, including the ongoing outbreak of COVID-19 and future coronavirus or other outbreaks or events with a wide-ranging regional or global impact, geopolitical conflicts and wars, as a result of situations such as the current situation between Russia and Ukraine, or as a result of changes in the price of commodities, examples of which include the recent fall in copper prices that adversely affected Zambia’s economy or the volatility of oil price markets that have adversely affected economies such as Nigeria’s;
• civil strikes, acts of war, terrorism, insurrection and incidents of general lawlessness;
• acts of piracy or vandalism;
• significant governmental influence over many aspects of local economies;
• telecommunications regulatory systems and/or competition regimes regulating our or our customers’ services, or our ability to invest further in particular markets as a result of antitrust regimes that may, for example, impact us due to our ultimate shareholders also investing in other, ancillary businesses in the same market;
• laws or regulations that tax or otherwise restrict repatriation of earnings or other funds or otherwise limit distributions of capital;
• laws or regulations that restrict foreign investment;
• changes to existing or new tax laws, rates or fees, either generally or directed specifically at the ownership and operation of towers or our international acquisitions, which may also be applied or enforced retroactively;
• changes to zoning regulations or construction laws, which could also be applied retroactively to our existing sites;
11
• expropriation or governmental regulation restricting foreign ownership or requiring divestiture;
• actions restricting or revoking spectrum or other licenses or suspending business under prior licenses;
• material site security issues;
• significant license or permit surcharges;
• increases in the cost of labor (as a result of unionization or otherwise);
• seizure, nationalization or expropriation of property or equipment;
• repudiation, nullification, modification or renegotiation of contracts;
• limitations on insurance coverage, such as political risk or war risk coverage, in certain areas;
• political or social unrest, such as tensions between the “Anglophone” and “Francophone” regions of Cameroon;
• local, foreign and/or U.S. monetary policy and foreign currency fluctuations and devaluations;
• changes in foreign currency exchange rates;
• price setting or other similar laws for the sharing of passive telecommunications infrastructure, or requirements to construct new sites in remote or rural areas that are less commercially viable for us;
• complications associated with repairing and replacing equipment in remote locations, or supply chain issues arising out of global or geopolitical issues, such as operational and transport restrictions as a result of the COVID-19 pandemic or the conflict between Russia and Ukraine;
• import-export quotas, wage and price controls, imposition of trade barriers;
• U.S. and foreign sanctions, trade embargoes or export control restrictions;
• restrictions on the transfer of funds into or out of countries in which we operate, or lack of availability of foreign currency;
• failure to comply with U.S. Treasury and other internationally recognized sanctions regulations restricting doing business with certain nations or specially designated nationals;
• failure to comply with anti-bribery, anti-corruption or money laundering laws and regulations such as the Foreign Corrupt Practices Act, the UK Bribery Act or similar international or local anti-bribery, anti-corruption or money laundering laws and regulations, or Office of Foreign Assets Control requirements;
• uncertain rulings or results from legal or judicial systems, including inconsistencies between and within laws, regulations and decrees, and judicial application thereof, which may be enforced retroactively, and delays in the judicial process;
• actions, proceedings, claims, disputes and threats brought by governments, regulators, entities or individuals for fees, taxes or other payments, even if meritless or frivolous under applicable law;
• regulatory or financial requirements to comply with bureaucratic actions;
• changes to existing laws or new laws, and/or changing labor and taxation laws or policies, including confiscatory taxation;
• other forms of government regulation and economic conditions that are beyond our control; and
• governmental corruption.
12
Any of these or other risks could adversely impact our customers’ and/or our operations, which, in turn, could have a material adverse effect on our business, prospects, financial condition and/or results of operations, as well as our growth opportunities. In particular, a significant portion of our revenues are currently derived from our Nigerian operations (73% of our revenues for the year ended December 31, 2021), and any such risks materializing within Nigeria in particular may have a significant impact on our business as a whole, including our business, prospects, financial condition and/or results of operations.
Operations in international markets, including emerging and less developed markets (including Africa, the Middle East and Latin America), also subject us to numerous additional and different laws and regulations affecting our business, such as those related to labor, employment, unions, health and safety, antitrust and competition, environmental protection, consumer protection, import/export and anti-bribery, corruption and money laundering. Our employees, subcontractors and agents could take actions that violate any of these requirements. Violations, or alleged violations, of any such laws or regulations could subject us to criminal or civil enforcement actions and adversely affect our reputation, any of which could have a material adverse effect on our business, prospects, financial condition and/or results of operations.
Our expansion into new geographic markets, such as Kuwait, Latin America, Egypt, South Africa and other markets we may enter in the future, may present competitive, distribution, regulatory and other challenges that differ from the challenges we face in markets that we have historically operated in. In addition, we may be less familiar with the customers, competitive dynamics (including antitrust concepts or regimes that may be based on our ultimate group shareholding and that may limit our ability to make future investments, due to, for example, our ultimate shareholders also investing in other ancillary businesses in the same market, which regulatory authorities in some markets may view as impacting their antitrust considerations) and regulatory environment in these markets and may ultimately face different or additional risks, as well as increased or unexpected costs, compared to those we experience in our existing markets. Expansion into new geographic markets may also expose us to direct competition with companies with whom we have limited or no past experience as competitors. To the extent we rely upon expanding into new geographic markets and do not meet, or are unprepared for, any new challenges posed by such expansion, our future sales growth could be negatively impacted, our operating costs could increase, which could have a material adverse effect on our business, prospects, financial condition and/or results of operations. See “Risks Relating to the Markets in which We Operate.”
We and our customers face foreign exchange risks, which may be material.
For the years ended December 31, 2021 and 2020, 63% and 65%, respectively, of our revenue was linked to the U.S. dollar or in euro-pegged currencies. The manner in which these revenues are linked to the U.S. dollar or the euro differs across our MLAs and jurisdictions of operation.
Our U.S. dollar-linked revenues are denominated in U.S. dollars in the relevant MLAs, but paid to us in local currency through contractual mechanisms. In such cases, including the majority of our MLAs in Nigeria, our MLAs may contain a formula for periodically determining the U.S. dollar to local currency exchange rate. Such MLAs typically have U.S. dollar-denominated components and local currency components of pricing, and the U.S. dollar components are converted to the local currency for settlement at a fixed conversion rate for a stated period of time, which conversion rates are reset quarterly, semi-annually or annually. As a result, in the event of devaluation, such as the ones that occurred in June 2016 and March 2020 in Nigeria, there is a risk of a delay between the timing of the devaluation and the next contractual reset, which may be significant. During the period between the date of the devaluation and the date of the reset, all of our revenues (i.e., both those revenues that are contractually linked to the U.S. dollar and those that are contractually linked to local currency) would reflect the new, devalued foreign exchange rate. When the reset is effected, the amount relating to the portion of the lease fees linked to the U.S. dollar, which is invoiced in local currency, is adjusted, upward, including in the cases of the June 2016 and March 2020 devaluations in Nigeria. Furthermore, our ability to maintain or enter into such contractually linked foreign exchange protection mechanisms in the future is not assured, which may in turn reduce our protection against fluctuations in foreign exchange rates and therefore could have a material adverse effect on our business, prospects, financial condition and/or results of operations.
In addition, the conversion rates included in our MLAs may also be different than the rates at which our financial results are translated into U.S. dollars for reporting purposes. If we are required to use a higher rate for accounting purposes than that of our contracts, notwithstanding any underlying performance, it is likely that our financial results for the relevant periods in the future will show a related decline in performance. For example, as described below under “— The existence of multiple foreign exchange markets with different exchange rates may impact the rate at which our operating subsidiaries’ financial results are translated into U.S. dollars for group reporting purposes, which may impact our financial condition and/or results of operations,” in April 2017 the CBN introduced a new foreign exchange window for investors and exporters, and while the majority of our contracts in Nigeria contain contractually linked foreign exchange protection mechanisms that protect against
13
foreign exchange fluctuations, such contracts historically only protected against changes in the official CBN exchange rate. While we have reached an agreement with our Key Customers in Nigeria to update the reference exchange rate in our contracts to the prevailing market rate available on Bloomberg (which has typically been aligned to the NAFEX rate), should these and similar circumstances arise again or continue to exist (where there is a divergence between the applicable market rate or translation rates for our financial results, and the exchange rate reflected in our contracts with customers), there is no guarantee that we will be able to renegotiate these contracts or enter into new contracts to fully protect against such foreign exchange risks, which could materially impact our results of operations. In addition, some of our contracts, particularly in Latin America and Kuwait, are based on local currency pricing with no direct foreign exchange link or conversion mechanism, and therefore any depreciation in local currency rates against the U.S. dollar would similarly impact our financial results when they are translated into U.S. dollars for reporting purposes, notwithstanding any underlying performance.
Certain of our other MLAs have revenue components linked to hard currencies, such as the U.S. dollar or the euro, because the MLAs are in local currencies that maintain a fixed exchange rate, or are “pegged,” to such currencies, such as those in Côte d’Ivoire and Cameroon. In addition, it was announced in December 2019 that the CFA Franc used in the West African Economic and Monetary Union (UEMOA), which includes Côte d’Ivoire, and which has a fixed exchange rate to the euro, would be replaced by a new currency called the Eco, and in June 2021, the heads of state of fifteen West African countries, including Côte d’Ivoire, comprising the Economic Community of West African States adopted a roadmap for the launch of the Eco in 2027. If such fixed or linked exchange rates are not maintained or “de-pegged,” it could result in fluctuations and/or devaluations of these currencies, which could have a material adverse effect on our business, prospects, financial condition and/or results of operations.
In addition, even though our MLAs may have foreign currency-linked revenue components, or have use fees expressed in foreign currencies, the actual currency of settlement of a significant portion of our revenue is in local currencies, and we therefore remain exposed to foreign exchange risks. There may also be regulatory actions or pressure based on, among other things, socioeconomic or political reasons or events, to enforce local currency-based pricing, which would dilute any protection we may seek to include in our contracts to protect against local currency devaluations.
Most of our expenses are in the local currencies of the relevant jurisdiction of operation, except for certain of our borrowings, which are predominantly in U.S. dollars. For example, our $500 million 5.625% Senior Notes due 2026, or the 2026 Notes, our $500 million 6.250% Senior Notes due 2028, or the 2028 Notes and together with the 2026 Notes, the IHS Holding Limited Notes, and our $940 million 8.0% Senior Notes due 2027, or the 2027 Notes, were issued in U.S. dollars. Certain other components of our capital expenditures may also be linked to foreign currency-based pricing elements. Diesel, which is one of our most significant expenses, may be considered as linked to U.S. dollars given the international pricing of oil, but is typically paid for in local currency. See “— Any increase in operating expenses, particularly increased costs for diesel or an inability to pass through or mitigate against increased diesel costs, could erode our operating margins and could have a material adverse effect on our business, prospects, financial condition and/or results of operations.” Should the relevant local currencies depreciate against the U.S. dollar, as was the case in mid-2016 and March 2020 in Nigeria, the local currency cost of buying diesel may increase. However, when translated back into U.S. dollars at the higher foreign exchange rate, the impact on our results is less notable. There may, however, be instances where our suppliers face foreign exchange pressure in the importation of certain materials, or as a result of the exchange rate at which they are able to source (or which applies to items for which charges are based on) foreign currency and import certain materials. This could in turn result in pressure from our suppliers to increase amounts payable by us.
We hold U.S. dollar cash balances in some of our jurisdictions of operation and/or convert local currencies to the relevant foreign currencies for payment obligations. Accordingly, we are subject to fluctuations in the rates of currency exchange between the local currencies and the relevant foreign currency as well as availability to source the relevant foreign currency in the jurisdictions in which we operate, and such fluctuations and/or availability could have a material adverse effect on our business, prospects, financial condition and/or results of operations. There may also be limited availability of U.S. dollars in the market at the time when we convert the relevant local currency to U.S. dollars, in which case we may need to convert the relevant local currency into U.S. dollars at a less favorable currency exchange rate. See also “Risks Relating to the Markets in which We Operate — Shortage of U.S. dollar, euro or other hard currency liquidity in the markets in which we operate could have a material adverse effect on our ability to service our foreign currency liabilities.”
In addition, our major customers may also face foreign exchange risks where their revenues are denominated in local currency, but their costs are denominated in, or linked to, a foreign currency such as the U.S. dollar, including the fees they pay to us. When the local currency depreciates against the relevant foreign currency (such as the significant depreciation of the Naira against the U.S. dollar, from approximately ₦196.5 to $1.00 as of January 1, 2016 to ₦304.5 to $1.00 as of December 31, 2016, based on the official rate published by the CBN), it may impact the ability of our customers to make payments to us on a timely basis or at all, and our customers may either raise prices for their customers or cut back on
14
capital and operational expenditures, both of which could reduce future demand for our services, or result in requests to renegotiate contract terms with us prior to the relevant MLA end date.
Fluctuations in exchange rates, including volatility related to the COVID-19 pandemic and its effects on the global economy, depreciation of local currencies and/or a lack of sufficient availability of hard/international currencies, as required, could have a material adverse effect on our business, prospects, financial condition and/or results of operations. See “— Financial authorities in the markets in which we operate may intervene in the currency markets by drawing on external reserves, and their currencies are subject to volatility” and “— The existence of multiple foreign exchange markets with different exchange rates may impact the rate at which our operating subsidiaries’ financial results are translated into U.S. dollars for group reporting purposes, which may impact our financial condition and/or results of operations.”
The existence of multiple foreign exchange markets with different exchange rates may impact the rate used in our customer contracts and the rate at which our operating subsidiaries’ financial results are translated into U.S. dollars for group reporting purposes, which may impact our financial condition and/or results of operations.
As described below under “— Risks Relating to the Markets in which We Operate — Financial authorities in the markets in which we operate may intervene in the currency markets by drawing on external reserves, and their currencies are subject to volatility,” central banking authorities in the countries in which we operate may intervene in the currency markets or adopt policies that may impact the applicable exchange rates and/or amounts of foreign currency that may be obtained. In markets where there are multiple exchange rates available and/or referenced by the applicable banking authorities, there may be differences among the exchange rates companies use pursuant to accounting standards, contracted rates, rates quoted for other foreign exchange transactions, and ‘official’ central bank rates. If such differences exist, we may encounter issues relating to the interpretation or enforcement of our contracts with our customers. We may also be required to change the exchange rate applied to the translation of the local currency books of our operating subsidiaries to U.S. dollars for our consolidated group reporting purposes.
This has been particularly relevant to our operations in Nigeria, where a significant portion of our operations are based. Following the significant depreciation of the Naira against the U.S. dollar in 2016, as described in “Risks Relating to Our Business — We and our customers face foreign exchange risks, which may be material,” in a continuing effort to improve U.S. dollar liquidity in Nigeria and to assist investors and exporters in accommodating foreign exchange transactions, the CBN introduced a new foreign exchange window for investors and exporters in April 2017. This foreign exchange window, which includes the NAFEX, rate currently allows willing counterparties to exchange foreign currency through authorized dealers at a rate that is essentially market driven. This resulted in a situation where there were differing exchange rates in the market and we have been required to regularly monitor and evaluate which exchange rate is most appropriate to apply in the translation of the Naira books of our Nigerian operations to U.S. dollars for our consolidated group reporting purposes.
During 2018 and 2019 the CBN official rate was approximately ₦306 to the U.S. dollar while the NAFEX rate was approximately ₦362 to the U.S. dollar. During 2020, the divergence between the two rates decreased as they both depreciated against the U.S. dollar, with the CBN rate and NAFEX rates as of December 31, 2020 being ₦380 and ₦410 to the U.S. dollar, respectively. As of May 31, 2021, the CBN ceased publishing what was the CBN Rate, although with limited impact on us given that the NAFEX rate was the most widely used rate at this time. The CBN now publishes the NAFEX rate on its website.
The determination of which is the most appropriate rate to use at the relevant time we produce financial information will depend on a number of factors, including, but not limited to, availability and liquidity in the market generally. The foreign exchange rate that we determine to be the most appropriate for the translation of our results for group reporting purposes may differ from the conversion rates contained within our contracts For example, from January 1, 2018, the results of our subsidiaries in Nigeria have been translated into our presentation currency, U.S. dollars, at the NAFEX monthly average exchange rate for income and expenses and from December 31, 2017, the assets and liabilities at the NAFEX closing rate at the balance sheet date. Prior to the agreements that we reached with our Key Customers in Nigeria to update the reference exchange rate in our contracts to the prevailing market rate available on Bloomberg, because the NAFEX rate used for accounting purposes had historically been higher than the CBN official rate used in our contracts, notwithstanding any underlying performance, our financial results for the relevant periods would have shown a related decline in performance in case of devaluation of NAFEX where the CBN official rate remained at the same level. While our contracts with certain of our Key Customers in Nigeria have been amended to resolve this anomaly, there can be no assurance that such a divergence between the applicable market rate or translation rate for our financial results, and the exchange rate reflected in our contracts with customers, will not occur again, or that the prevailing market rate on Bloomberg will not diverge from other exchange rates in the market (including NAFEX), which could, in turn, have a material adverse effect on our business, prospects, financial condition and/or results of operations, notwithstanding any underlying performance.
15
In addition, other measures taken by the relevant authorities and/or the CBN, including the manner in which various exchange rates are published, may further impact the rates available in the market, and we may need to consider such measures for the purposes of our accounts.
Potential investors should, therefore, bear this in mind when considering an investment in our ordinary shares, and the potential impact on the future trading and/or market price of our ordinary shares based on a decline in reported financial and/or operational performance based on such factors.
A regional or global health pandemic, including the ongoing outbreak of COVID-19, could severely affect our business.
A regional or global health pandemic, depending upon its duration and severity, could have a material adverse effect on our business. For example, since March 2020, -as a result of the COVID-19 pandemic, governmental authorities around the world implemented measures to reduce the spread of COVID-19, including “shelter-in-place” orders suggested or mandated by governmental authorities or otherwise elected as a preventive measure, and such measures adversely affected workforces, supply chains, economies and financial markets and led to an economic downturn in many of our markets.
As a result of the COVID-19 pandemic, we transitioned most of our employees to remote working arrangements and temporarily closed offices in some of our markets.
If under similar circumstances (including as a result of similar events in the future) our employees are not able to effectively work from home, or if our employees contract COVID-19 or another contagious disease, we may experience a decrease in productivity and operational efficiency, which could negatively impact our business, financial condition and results of operations. In addition, in most of our markets we were required to obtain permits designating certain employees as “key personnel” in order to facilitate the access to many of our Tower sites for construction, service and maintenance activities. While we have so far been able to obtain all required permits, there can be no assurance that we will be able to obtain all approvals or permits that may be required in the future.
In addition, as a result of the COVID-19 pandemic and its effects on the global economy, depreciation of local currencies and/or a lack of sufficient availability of hard/international currencies, we may experience fluctuations in foreign currency exchange rates in many of the markets in which we operate, which could have a material adverse effect on our business, prospects, financial condition and/or results of operations. Continued global deterioration in economic conditions in light of the COVID-19 pandemic could adversely and materially affect us and/or our customers through disruptions of, among other things, the ability to procure telecommunications equipment or other supplies through the usual supply chains. For instance, shortages of capacity in shipping may occur and could affect the smooth flow of our and/or our customers’ supply chains, increase transportation costs and/or decrease reliability. Continued global deterioration in economic conditions in light of the COVID-19 pandemic or similar events could also adversely and materially affect the ability of us and/or our customers to maintain liquidity and deploy network capital, with potential decreases in consumer spending contributing to liquidity risks, or even through regulatory interventions or pressure on pricing and services offered that may reduce revenues for periods of time. Any resulting financial difficulties could result in uncollectible accounts receivable or reduced revenues, despite having provided increased services. Resulting supply chain or operational difficulties (including site access) may also result in us being unable to meet the service level agreement targets under our MLAs. See “— We rely on third-party contractors for various services, and any disruption in or non-performance of those services would hinder our ability to effectively maintain our tower infrastructure.” The loss of significant Tenants, or the loss of all or a portion of our anticipated Contracted Revenue from certain Tenants, could have a material adverse effect on our business, financial condition and/or results of operations.
In the past, governments have taken unprecedented actions in an attempt to address and rectify these extreme market and economic conditions by providing liquidity and stability to financial markets. If these actions are not successful, the return of adverse economic conditions may cause a significant impact on our ability and the ability of our customers to raise capital, if needed, on a timely basis and on acceptable terms or at all.
Although our results have not been materially affected by COVID-19 to date, we are unable to accurately predict the impact that COVID-19 will have on our or our customers’ operations going forward due to uncertainties that will be dictated by the length of time that any disruptions or consequential effects continue, which will, in turn, depend on the currently unknown duration of the COVID-19 pandemic, the impact of governmental regulations that might be imposed in response to the pandemic, the efficacy and availability of vaccines around the world, and the overall economic impact of the pandemic. The response measures imposed also differ in scope across our various markets and are subject to continuous updating. The severity and impact of the pandemic may vary across our markets, and the pandemic may have greater adverse effects in
16
the emerging and less developed markets in which we operate. Due to the uncertainty of COVID-19, we will continue to assess the situation, including abiding by any government-imposed restrictions, market by market. While we have developed and expect to continue to develop plans to help mitigate the potential negative impact of COVID-19, these efforts may not be effective, and any protracted economic downturn will likely limit the effectiveness of our efforts. Accordingly, it is not possible for us to predict the duration and extent to which this will affect our business, future results of operations and financial condition at this time.
To the extent the COVID-19 pandemic, or any similar future pandemic or related events could have a material adverse effect on our or our customers’ business, financial condition, results of operations and/or liquidity, it may also have the effect of heightening many of the other risks described in this “Risk Factors” section.
We may not successfully execute our business strategy and operating plans or manage our growth, all of which depend on various factors, many of which are outside our control.
The existing and future execution of our strategic and operating plans will, to some extent, be dependent on external factors that we cannot control, such as changes in the tower infrastructure industry or the wider telecommunications industry, particularly in the various jurisdictions in which we operate and may seek to operate in the future, changes in budgets of or demand from our current or potential customers for tower and other telecommunications infrastructure services, international legislative and regulatory changes, changes in regional security or the economy of the countries in which we operate, changes in fiscal and monetary policies, the availability of additional tower and other telecommunications infrastructure portfolios for acquisition and restrictions or other limitations relating to foreign direct investment or foreign ownership in particular markets (including, among other things, events such as health pandemics or epidemics, including the ongoing outbreak of COVID-19 and future coronavirus or other outbreaks or events with a wide-ranging regional or global impact, accelerating the implementation of any such measures or giving rise to such factors). For example, high tariffs charged to users in the countries in which we operate compared to certain other countries in which we do not operate, may impede or slow the growth of the telecommunications industries in the countries in which we operate and, in turn, our business.
We may be unable to implement our strategy relating to the construction of New Sites and deployment of other telecommunications infrastructure. See “— Our ability to construct New Sites or to deploy other telecommunications infrastructure depends on a number of factors, many of which are outside of our control.”
Our ability to increase the number of Colocations and Lease Amendments on each Tower that we own across our portfolio is a key factor contributing to our growth and a key part of our strategy in the markets in which we operate. If we are unable to increase the number of Colocations and Lease Amendments on our Towers, either due to a lack of available space or from reduced customer demand, if we are unable to accurately assess and invoice customer equipment on our sites, or if we are unable to implement or achieve our other strategic plans or targets and key performance indicators, we may not achieve the revenues, margins or earnings that we need to grow or to offset the impact of any adverse economic conditions that may develop in the future.
Our ability to increase the usage of our infrastructure by our customers may depend on the performance of these customers and their success in acquiring and retaining end users for the purposes of their services. A decline in the number of end users for our customers, or lower than expected growth in end users for our customers, could have a material adverse effect on our business, prospects, financial condition and/or results of operations.
In addition, our strategic and operational plans need to be continually reassessed to meet the challenges and needs of our businesses in order for us to remain competitive. The failure to implement and execute our strategic and operating plans in a cost-effective and timely manner, or at all, realize the cost savings or other benefits or improvements associated with such plans, or have financial resources to fund the costs associated with such plans or to incur costs in excess of anticipated amounts, or sufficiently assess and reassess the plans (including, in each case, as a result of challenges that may be posed or arise as a result of operating companies in which we may not have a majority of the economic or share ownership, whether in terms of operational or further commensurate funding challenges or otherwise), could have a material adverse effect on our business, prospects, financial condition and/or results of operations.
Further, successful execution of our business plan will require effective management of growth, which may include acquisitions. The management team, operational systems and internal controls currently in place or to be implemented may not be adequate for such growth, and the steps taken to hire personnel and to improve such systems and controls may not be sufficient. If we are unable to grow as anticipated, manage our growth effectively or successfully integrate any acquisitions (including their information technology or finance systems), it could have a material adverse effect on our
17
business, prospects, financial condition and/or results of operations. See Item 4.B. “Business Overview — Our Strategy” for further information on our key strategies.
We rely on third-party contractors for various services, and any disruption in or non-performance of those services would hinder our ability to effectively deploy or maintain our infrastructure.
We engage third-party contractors to provide various services in connection with the site acquisition, construction, supply of equipment and spare parts, access management, security and preventative and corrective maintenance of tower sites, as well as power management, including the supply of diesel to certain of our sites, sometimes with a small number of contractors in the relevant jurisdiction. For example, we have outsourced power management, refurbishment, operations and maintenance and security functions for certain of our sites in Nigeria to certain key suppliers, and may continue to do so in other markets (including any new markets which we may enter). Their power management functions include the supply of diesel to and deployment of alternative power technologies, such as hybrid and solar power technologies, on certain sites, to help reduce diesel consumption to a contracted volume. Across our nine markets, as of December 31, 2021, we outsourced certain operations and maintenance activities at 71% of our Towers. We are exposed to the risk that the services rendered by our third-party contractors will not always be available, satisfactory or match our and/or our customers’ targeted quality levels, as well as the risk that they may otherwise be unable to perform their obligations to some extent or at all, including as a result of labor disputes, insolvency, operational, access or transport restrictions or other COVID-19 related limitations, geopolitical events including the conflict between Russia and Ukraine, or other events resulting in export control or similar restrictions. As a result, our customers may be unsatisfied with our services, and we may be required to pay certain financial penalties under our contracts, or our customers may terminate their contracts in the event of a material breach, either of which could have a material adverse effect on our reputation and brand, as well as our business, prospects, financial condition and/or results of operations.
For instance, recent economic and trade sanctions threatened and/or imposed by the U.S. government on a number of China-based technology companies, including Huawei Technologies Co., Ltd., or Huawei, and certain of their respective affiliates and other China-based technology companies, with whom we conduct business, as well as actions brought against Huawei and related persons by the U.S. and the Canadian governments and recent restrictions imposed by the UK government, have raised further concerns as to whether, in the future, there may be additional regulatory challenges or enhanced restrictions involving other China-based technology companies. Such potential restrictions or sanctions, as well as any associated inquiries or investigations or any other government actions, may be difficult or costly to comply with and may, among other things, delay or impede the development of the technology, products and solutions of China-based third-party contractors with whom we are currently engaged or may become engaged with and hinder the stability of the supply chains of such contractors, any of which may have a material adverse effect on our business, financial condition and/or results of operations.
In addition, if third-party contractors do not meet execution targets for both financial and operational performance, including not meeting our standards of service or complying with health, safety, employment or other laws and regulations, or are unable to perform to some extent or at all, we may have to step in and complete the process. If we are required to undertake this work ourselves, it could require extensive time and attention from our management and lead to increased future operating costs while the work is carried out, which could in turn could have a material adverse effect on our business, prospects, financial condition and/or results of operations.
We also rely on third parties for our supply of diesel, which is critical, as many of the markets in which we currently or may, in future, operate (including, in particular, those in Africa and certain markets in the Middle East) have limited or unreliable power grid connectivity (including due to the impact of seasonal extreme weather conditions), thereby resulting in a heavy reliance on alternatives such as diesel-powered generators. Given the importance of diesel for our operations, we may purchase diesel in large quantities which is then stored at our facilities. This supply could be disrupted by events that are beyond our control, including, for example, in light of the COVID-19 pandemic and related effects (or any future coronavirus or other outbreaks or events with a wide-ranging regional or global impact) or events such as those related to political instability, including, for example, in connection with the conflict between Russia and Ukraine. While we maintain planning, monitoring and logistics systems including bulk storage facilities aimed at providing a consistent supply of diesel to sites, scarcity of diesel, lack of available trucks, labor disputes, queues and other issues at fuel depots and security concerns at certain sites, and fire, among other things, including the impact of climate change or related initiatives, have in the past and may in the future, cause this supply to be disrupted. Disruption in the supply of diesel or diesel quality not meeting our requirements would impede our ability to continue to power our sites and adversely affect power uptimes. Widespread or long-term disruption in the supply of diesel may result in us being unable to meet the service level agreement targets under our MLAs, and in some cases we would be required to shoulder resultant financial penalties, which could have a material adverse effect on our business, prospects, financial condition and/or results of operations.
18
Our Contracted Revenue is based on certain estimates and assumptions and actual results may differ materially from such estimated operating results.
Our Contracted Revenue disclosed in this Annual Report represents our estimate of the lease fees to be received from existing Tenants of Key Customers for the remainder of each Tenant’s current contractual site lease term, lease fees to be received from the existing Lease Amendments of Key Customers for the remainder of each Lease Amendment’s current contractual term and lease fees to be received from Key Customers where we provide access to fiber access to an OLT for the remainder of the relevant contractual term, as of December 31, 2021. Our Contracted Revenue is based on certain estimates and assumptions, such as constant foreign exchange rates, no escalation of lease fees despite contractual provisions in our MLAs in that regard, no new tenants or new Lease Amendments added, no amendments to our existing MLA terms and no Churn. Unanticipated events may occur that could adversely affect the actual results achieved by us during the periods to which these estimates relate, causing some or all of the actual results to deviate from our estimates and assumptions, which in turn could have a material adverse effect on our business, financial condition and/or results of operation.
Any increase in operating expenses or costs, particularly increased costs for diesel or ground lease costs, or an inability to pass through or mitigate against such costs, could erode our operating margins and could have a material adverse effect on our business, prospects, financial condition and/or results of operations.
Our primary operating expenses include diesel fuel, site maintenance and security, salaries of engineers and security personnel, fees for licenses and permits and insurance. In addition, we incur ground lease costs and the continued development, expansion and maintenance of our tower site infrastructure requires ongoing capital expenditure. There is no assurance that our operating expenses, including those noted above, will not increase in the future or that we will be able to successfully pass any such increases in operating expenses to the customers. For example, we require a substantial amount of diesel to power our tower site operations. For the year ended December 31, 2021, the cost of power generation, which includes diesel, haulage and minimal electricity, accounted for 29.4% of our cost of sales.
Diesel prices have fluctuated significantly over time, often in parallel to changes in oil prices, and may fluctuate in the future as a result of many factors, including the impact of the recent COVID-19 pandemic, geopolitical tensions, including, for example, in connection with the conflict between Russia and Ukraine, and/or climate change or related initiatives, and we are only able to pass through a component of the fuel costs at our sites to our customers under the terms of certain of our contracts. We therefore remain exposed to diesel price volatility, which may result in substantial increases in our operating costs and reduced profits if prices rise significantly. Further, our attempts to reduce power costs through the deployment of DC generators, hybrid battery and solar technologies, while presently successful, may not be successful in the future.
Our ground lease costs are for a fixed duration, typically a 10-to-15-year term, paid for either on a monthly or quarterly basis or in advance for a multi-year portion of the overall term of the lease. Approximately 24% of our ground leases are due for renewal within the next 24 months. The renewal of a large proportion of our tower portfolio ground leases within a particular year requires a significant upfront rent payment made upon such renewal, which in turn could increase our cash outflows for that particular year. Any increases in operating expenses or lease costs referred to above would reduce our operating margins and may have a material adverse effect on our business, prospects, financial condition and/or results of operations.
If we are unable to renew and/or extend our ground leases, or protect our rights to access and operate our Towers or other telecommunications infrastructure assets, it could have a material adverse effect on our business and operating results.
Our site portfolio consists primarily of ground-based towers constructed on land that is leased under long-term ground lease agreements. As of December 31, 2021, approximately 90% of the sites in our portfolio were operated under ground leases on land that we do not own. For sites on leased land, approximately 41% of the ground leases have an expiration date before the end of 2026 and, as of December 31, 2021, the average remaining life of our ground leases was 7.7 years.
For various reasons, landowners or lessors may not want to renew their ground leases, may seek substantially increased rents, or they may lose their rights to the land (including, for example, if such land is subject to concession agreements) or transfer their land interests to third parties, which could affect our ability to renew ground leases on commercially viable terms or at all. In addition, we may not have the required available capital to extend these ground leases at the end of the applicable period. In the event that we cannot extend these ground leases, we will be required to dismantle and/or relocate these Towers and may lose the cash flows derived from such Towers, which may have a material adverse effect on our business, prospects, financial condition and/or results of operations.
19
Real property interests relating to towers consist primarily of leasehold interests, which in some cases relate to sites for which special access arrangements may be required, such as Towers located on or near airports, government facilities or rooftops. For various reasons, we may not always have the ability to access, analyze and verify all information regarding titles and other issues prior to entering into a ground lease, or we may be unable to contractually agree to amendments in relation to sensitive site access issues, all of which could affect the rights to access and operate the site. From time to time, we may also experience disputes with lessors regarding the terms of ground leases, which could affect our ability to access and operate a tower site. The termination of a ground lease may interfere with our ability to operate and generate revenues from the Tower. If this were to happen at a material number of sites, it would have a material adverse effect on our business, prospects, financial condition and/or results of operations.
Our ability to access and operate our Towers or other telecommunications infrastructure may also rely on right of use or other similar agreements with third parties. In the event that we cannot renew or continue to exercise our rights under these agreements, we will be required to dismantle and/or relocate these Towers or other telecommunications infrastructure assets, and may lose the cash flows derived from such assets, which may have a material adverse effect on our business, prospects, financial condition and/or results of operations.
We may experience the loss of tenancies and/or customers, and are exposed to the loss of revenue from the failure or acquisition of any customer or customer consolidation.
If we were to experience a loss of tenancies when services provided by us are terminated, a Tenant does not renew its contract or we have ceased recognizing revenue for a customer on a site in any particular period, we would face what is known as Churn. For example, Tenants may determine that demand has changed in a particular area and they no longer need tower infrastructure at certain sites. A Tenant may Churn if the MLA or SLA is not renewed at the end of its term, the customer ceases operations or switches to a competing tower company. Similarly, certain customers may be acquired, experience financial difficulties or cease operations as a result of technological changes or other factors, including the COVID-19 pandemic and resulting effects (or any future coronavirus or other outbreaks or events with a wide-ranging regional or global impact), which could result in renewal on less favorable terms, cancellation or non-renewal of our tenancy agreements. We experienced Churn of 1,283 and 381 Tenants for the years ended December 31, 2021 and 2020, respectively. Other than a customer churning at the end of its term, limited termination clauses may apply pursuant to the relevant MLA. Certain of our customer agreements also contain a contractual right to Churn a limited number of sites each year without penalty, and customers with no such right could use their negotiating power in the future to request the ability to Churn certain tenancies. If customers terminate or fail to renew customer lease agreements with us (either on commercially acceptable terms, or at all), are acquired or, become insolvent, or otherwise become unable to pay lease fees, the loss of such customers could have a material adverse effect on our business, prospects, financial condition and/or results of operations.
Also, as is customary in tower infrastructure acquisitions, purchase agreements sometimes allow the purchaser of a site, such as us, to unwind sites when legal title has not been transferred by a date falling a number of months after completion of the acquisition, or the long-stop date, unless extended by the mutual consent of the parties. In the event that such unwinding takes place, which is typically at the option of the purchaser, the seller would reimburse the purchaser for the price paid for the sites that are subject to unwinding and the seller, such as the relevant MNO, would stop paying the lease fee for those sites. Failure to transfer the legal title of acquired sites, including in respect of prior acquisitions where the long-stop date has been extended, or future acquisitions, could have a material adverse effect on our business, prospects, financial condition and/or results of operations.
Further, consolidation among or with our customers could result in a reduction in their or the market demand for base transmission sites and/or Colocation, as certain base transmission sites may become redundant or additional tower spaces could be acquired through consolidation, and our customers may therefore choose not to renew their contracts and lease agreements, and we may also not be able to pursue our strategies to obtain or engage with new customers, or we may face reduced or less than anticipated demand from new or existing customers, in any particular market. Such consolidation may also result in a reduction in our customers’ (or potential new customers’) future capital expenditures, including as a result of their expansion plans being similar or if their requirements for additional sites decreases on a consolidated basis. We believe consolidation may occur in certain of our markets in order to achieve both the scale and economic models necessary for long-term growth. Customer or industry consolidation may also result in increased customer concentration. See “— A significant portion of our revenue is derived from a small number of MNOs. Non-performance under or termination, non-renewal or material modification of customer lease agreements with these customers could have a material adverse effect on our business, prospects, financial condition and/or results of operations.” Our contracts and lease agreements may be unable to protect us adequately from a reduction in tenancies due to consolidations and we may be unable to renew contracts or lease agreements on favorable terms, or at all. If a significant number of contract or lease terminations occur
20
due to industry consolidation, our revenue and cash flow could be adversely affected, which in turn could have a material adverse effect on our business, prospects, financial condition and/or results of operations.
A slowdown in the growth of, or reduction in demand for, wireless communications services could adversely affect the demand for tower space and could have a material adverse effect on our financial condition and/or results of operations.
Demand for tower space is dependent principally on demand from wireless communications carriers, which, in turn, is dependent on subscriber demand for wireless services. Most types of wireless services currently require ground-based network facilities, including communications sites for transmission and reception. The extent to which wireless communications carriers lease such communications sites depends on a number of factors beyond our control, including the level of demand for such wireless services, the availability of spectrum frequencies, the financial condition and access to capital of such carriers (including as a result of the recent COVID-19 pandemic and resulting effects, or any future coronavirus or other outbreaks or events with a wide-ranging regional or global impact), changes in telecommunications regulations and general economic conditions, as well as factors such as geography and population density. In addition, if our customers or potential customers do not have sufficient funds from operations or are unable to raise adequate capital to fund their business plans or face other financial issues, they may reduce their capital spending, which could adversely affect demand for space on our towers, which in turn could have a material adverse effect on our business, prospects, financial condition and/or results of operations.
In addition, tower sharing must continue to be seen by wireless telecommunications providers as a cost-effective way to satisfy their passive infrastructure needs. Any slowdown in the growth of, or reduction in demand for, wireless telecommunications services, or any failure of tower sharing to continue to develop as a way to meet the requirements of wireless telecommunications providers in the countries in which we operate, may adversely affect the demand for tower sites and could have a material adverse effect on our business, prospects, financial condition and/or results of operations, as well as our cash flows.
Further, there can be no assurances that 3G, 4G (including LTE), 5G, advanced wireless services in any other spectrum bands or other new wireless technologies will be deployed or adopted as rapidly as estimated or that these new technologies will be implemented in the manner anticipated or at all. Additionally, the demand by consumers and the adoption rate of consumers for these new technologies once deployed may be lower or slower than anticipated, particularly in emerging and less developed markets such as those in which we operate or may operate in the future. We may also need to adapt our business model to new technologies such as 5G and the resulting change to products and services we offer, as well as to changing customer or local or regulatory requirements, such as increasing construction of new sites and infrastructure expansion in remote or rural areas, which may be less commercially viable or more technologically or operationally challenging for us (including potentially as a result of needing to contemplate elements of active communications equipment or revenue share models within our business or operating model). These factors could adversely affect our growth rate since growth opportunities and demand for our tower space as a result of such new technologies may not be realized at the times or to the extent anticipated, which could have a material adverse effect on our business, prospects, financial condition and/or results of operations.
New technologies designed to enhance the efficiency of wireless networks and potential active sharing of the wireless spectrum could reduce the need for tower-based wireless services and could make our tower infrastructure business less desirable to or necessary for Tenants and result in decreasing revenues.
The development and implementation of new technologies designed to enhance the efficiency of wireless networks or the implementation by MNOs of potential active sharing technologies could reduce the use of and need for tower-based wireless services transmission and reception and could decrease demand for tower-based antenna space and ancillary services we provide. For example, new technologies that may promote network sharing, joint development, or resale agreements by our wireless service provider customers, such as signal combining technologies or network functions virtualization, may reduce the need for our wireless infrastructure, or may result in the decommissioning of equipment on certain sites because portions of the customers’ networks may become redundant. In addition, other technologies and architectures, such as WiFi, DAS, femtocells, other small cells, or satellite (such as low earth orbiting) and mesh transmission systems may, in the future, serve as substitutes for, or alternatives to, the traditional macro site communications architecture that is the basis of substantially all of our site leasing business. Additional examples of such new technologies might include spectrally efficient technologies which could potentially relieve some network capacity problems, or complementary voice over internet protocol access technologies that could be used to offload a portion of subscriber traffic away from the traditional tower-based networks, which would reduce the need for telecommunications operators to add more tower-based antenna equipment at certain tower sites. MNOs in European markets have implemented active sharing technologies in which MNOs share the
21
wireless spectrum and, therefore, need fewer of their own antennas and less tower space for such equipment. Moreover, the emergence of alternative technologies could reduce the need for tower-based wireless services transmission and reception. For example, the growth in delivery of wireless communication, radio and video services by direct broadcast satellites could materially and adversely affect demand for our antenna space, or certain alternative technologies could cause radio interference with older generation tower-based wireless services transmission and reception. As a result, the development and implementation of alternative technologies to any significant degree could have a material adverse effect on our business, prospects, financial condition and/or results of operations.
Increased competition in the tower infrastructure industry could have a material and adverse effect on our business.
Although we are a leading independent provider of telecommunications tower infrastructure in most of our markets, competition in the tower infrastructure industry exists and customers have alternatives for leasing tower space, including:
• telecommunications operators which own and lease their own tower portfolios;
• in certain circumstances, owners of alternative site structures such as building rooftops, outdoor and indoor DAS networks, billboards and electric transmission towers; and
• other independent tower companies operating in the market, such as American Tower Corporation, or ATC, SBA Communications Corporation, or SBA, or other tower companies that may enter the market.
We believe that competition in the tower infrastructure industry in emerging and less developed markets (including markets such as the Middle East and Latin America) is based on, among other things, power management expertise, tower location, relationships with telecommunications operators, tower quality and height, pricing and ability to offer additional services to tenants and operational performance, as well as the size of a company’s site portfolio and its ability to access efficient capital. For example, in 2014, certain MNOs, including MTN Nigeria, Airtel Nigeria and Etisalat Nigeria (now known as 9mobile) concluded sale and lease back transactions of their previously owned site portfolios in Nigeria. These transactions led to the emergence of ATC as the other major independent tower company in Nigeria, with a site portfolio of approximately 6,980 towers as of December 31, 2021. ATC is our primary competitor in Nigeria and Africa. We are the market leader in Africa by tower count with 24,732 towers as of December 31, 2021 compared to ATC with 22,165 towers as of December 31, 2021, Helios Towers Plc with 8,765 towers and SBA Communications with approximately 1,000 towers as of September 30, 2021. In Brazil, the competitive landscape is wider with ATC and SBA owning approximately 23,000 and 10,000 towers, respectively, and numerous smaller tower companies of similar size to or smaller than our business. The Brazilian competitive landscape presents opportunities for consolidation. We also compete to a lesser extent with telecommunications operators who have retained their own towers and continue to manage them and make them available for Colocation. In certain circumstances, we also compete with owners of alternative site structures such as building rooftops, outdoor and indoor DAS networks, billboards and electric transmission towers. In addition, there may be increased competition in the future from other independent tower companies operating in, or that may enter, our markets. In particular, we may face competition in Latin America from other independent tower companies who may have a substantially larger site portfolio or have operated in the region for a longer period of time than we have.
Competitive pressures could increase and could have a material adverse effect on lease rates paid by our customers, which could result in existing customers not renewing their leases, or new customers leasing towers from our competitors rather than from us. In addition, we may not be able to renew existing customer leases or enter into new customer leases, either on commercially acceptable terms or at all, which could have a material adverse effect on our results of operations and growth rate. Increasing competition could also make the acquisition of attractive tower portfolios or other tower companies more costly, or limit acquisition opportunities altogether, particularly in cases where our competitors have a lower cost of capital. Any of the foregoing factors could have a material adverse effect on our business, prospects, financial condition and/or results of operations.
We may not successfully identify or integrate acquired assets or businesses into our operations or be able to fully recognize the anticipated benefits of assets or businesses that we acquire or establish in either existing or new markets.
A key element of our growth strategy has been to increase our tower portfolio through acquisitions, and we expect to continue to make acquisitions in the future, including in new geographic markets and/or adjacent telecommunication infrastructure verticals. During 2020, we completed the Kuwait Acquisition through a controlling investment (for a portfolio
22
of up to 1,620 towers) and also the CSS Acquisition that included 2,312 towers (2,251 in Brazil, 51 in Peru and 10 in Colombia). In early 2021 we completed the Skysites Acquisition that included 1,005 towers in Brazil and the Centennial Acquisition that included 819 towers (602 in Brazil and 217 in Colombia). In November 2021, we also acquired TIM Brasil’s secondary fiber network infrastructure pursuant to the TIM Fiber Acquisition. In October 2021, we signed an agreement pursuant to the Egypt Transaction, while in November 2021 and January 2022, we signed definitive transaction agreements to acquire towers in South Africa and Brazil, pursuant to the MTN SA Acquisition and GTS SP5 Acquisition, respectively. There can be no assurance that we will be able to identify suitable acquisition candidates in the future or acquire them on acceptable terms, including due to increased competition for attractive acquisition opportunities in the relevant markets, or that any particular acquisition or investment will perform as anticipated in our investment appraisals or related targets. Additionally, we rely on our due diligence of the acquired assets or business and the representations and financial records of the sellers and other third parties to establish the anticipated revenues and expenses and whether the acquired assets or business will meet our internal guidelines for current and future potential returns. Given the nature of the individual assets which are numerous and geographically diverse, it can be difficult to conduct effective physical diligence on these, which is typically conducted by way of a sample audit. In addition, we may not always have the ability to analyze and verify all information regarding title, access and other issues regarding the land underlying acquired towers. The condition of the assets can also deteriorate significantly during the period prior to closing (and after physical site audits) because sellers may reduce operating and capital expenditure on such towers.
Moreover, we may incur significant costs during the evaluation and consideration of new investment opportunities or the pursuit of such acquisitions, which are often conducted through competitive auction processes. Tower portfolio or other asset acquisitions typically take a considerable period of time to sign and close and usually close in stages, but can involve up-front investments that cannot be recovered regardless of whether the transaction is successfully completed. Tower portfolio or other asset acquisitions are subject to certain customary conditions precedent and closing these transactions will generally depend on whether certain conditions precedent are satisfied, such as regulatory approvals. In the event that conditions precedent are not satisfied or are not satisfied in a timely manner, we may be unable to acquire certain tower portfolios or other assets, or closings (and therefore operations and revenues) may be delayed, while, in each case, incurring associated or continuing transaction costs. For example, on March 27, 2019, we announced that we had entered into an agreement with Mobile Telecommunications Company Saudi Arabia to acquire approximately 8,100 towers in the Kingdom of Saudi Arabia, although on December 30, 2019, it was announced that this agreement had been terminated following expiry of the initial longstop date. We may also at any time be participating in one or multiple sale or acquisition processes across various markets and continents (which may include processes in Africa, Middle East, Latin America and Southeast Asia with different counterparties). Given the confidential nature of such processes the details of these would only be available once we have been selected as the preferred candidate and reached agreement on terms with the counterparty. We may also be unable to succeed in the processes (or any of them) in which we participate or reach an agreement on terms with the counterparty should we be selected as the preferred candidate. Given the often-varying transaction structures of these telecommunication infrastructure sales or acquisitions, we often have little or no control on the timing of such processes.
We may be required to rely on the financial and operational representations, warranties and undertakings (including any indemnity) of sellers. If: (i) records with respect to the acquired assets are not complete or accurate, (ii) we do not have complete access to, or use of, the land underlying the acquired towers, (iii) we discover that the towers or other telecommunications infrastructure have structural issues (such as overloading) (iv) the towers or other assets do not achieve the financial results anticipated, or (v) there are historic liabilities attaching to the acquired assets that we are unable to successfully recover under an indemnity, it could have a material adverse effect on our business, prospects, financial condition and/or results of operations. Furthermore, some sellers may or may not have the financial capacity to support a subsequent claim against them. While we acquire representation and warranty insurance in some of our transactions, such policies typically contain certain exclusions that would limit our ability to recover certain losses.
In addition, the process of integrating acquired assets or businesses into our operations, including pursuant to the Kuwait Acquisition, CSS Acquisition, Skysites Acquisition, Centennial Acquisition, TIM Fiber Acquisition, Egypt Transaction, MTN SA Acquisition and GTS SP5 Acquisition, may result in unforeseen operating difficulties and large expenditures and may absorb significant management attention that would otherwise be available for the ongoing development of our business. We may also be unable to retain or replace key personnel of an acquired business, or recruit key personnel in the case of acquired assets, which could reduce the value of the acquisition and prevent us from realizing our strategic goals. In certain instances, including pursuant to the TIM Fiber Acquisition, we may also rely on transition services arrangements with external parties to support the operation of acquired assets while they are fully integrated. These risks may be exacerbated in material acquisitions. Further, such material acquisitions may exacerbate the risks inherent with our growth strategy, such as (i) an adverse impact on our overall profitability if the acquired towers or business does not achieve the financial results estimated in our valuation models, (ii) unanticipated costs associated with the acquisitions that may impact our results of operations for a period, (iii) increased demands on our cash resources that may, among other things, impact our ability to
23
explore other opportunities, (iv) undisclosed and assumed liabilities that we may be unable to recover, (v) increased vulnerability to general economic conditions, (vi) an adverse impact on our existing customer relationships, (vii) additional expenses and exposure to new regulatory, political and economic risks if such acquisitions were in new jurisdictions and (viii) diversion of managerial attention.
Furthermore, our international expansion initiatives are subject to additional risks such as complex laws, regulations and business practices that may require additional resources and personnel. There can be no assurance that we will be successful in integrating acquisitions or new businesses, including pursuant to the Kuwait Acquisition, CSS Acquisition, Skysites Acquisition, Centennial Acquisition, TIM Fiber Acquisition, Egypt Transaction, MTN SA Acquisition and GTS SP5 Acquisition into our existing business or be able to fully recognize the anticipated benefits of towers or businesses that we acquire, and failure to do so could have a material adverse effect on our business, prospects, financial condition and/or results of operations.
Our ability to construct New Sites or to deploy other telecommunications infrastructure depends on a number of factors, many of which are outside of our control.
Our ability to construct New Sites or to deploy other telecommunications infrastructure in new or existing markets is affected by a number of factors beyond our control, including the availability of and access to suitable land that meets our requirements, including those of the initial customer, and the availability of construction equipment and skilled construction personnel. Delays brought on by a number of factors could also adversely affect our ability to deliver New Sites or to deploy other telecommunications infrastructure in a timely and cost effective manner, particularly in connection with timelines contractually agreed with customers. There can be no assurance that:
• we will be able to enter into identified new markets in which we intend to deploy New Sites or other telecommunications infrastructure;
• every individual New Site or other telecommunications infrastructure asset will be commercially viable or meet our investment criteria;
• we will be able to overcome setbacks to new construction, including local opposition;
• we will be able to maintain relationships with the regulatory authorities and to obtain any required governmental approvals for new construction, including any access permits required as a result of restrictions imposed in response to the recent COVID-19 pandemic;
• the number of towers or other infrastructure planned for construction will be completed in accordance with the requirements of customers;
• there will be a significant need for the construction of new towers or other telecommunications infrastructure;
• we will be able to finance the capital expenditures associated with construction or deployment of New Sites or other telecommunications infrastructure;
• we will be able to import the equipment necessary for the construction or deployment of New Sites or other telecommunications infrastructure;
• we will be able to purchase and/or import components necessary for the construction or deployment of New Sites or other telecommunications infrastructure, including steel and fiber, or purchase such components at expected prices; or
• we will be able to secure rights or access to the land necessary to execute customer orders for New Sites or other telecommunications infrastructure.
Although we are continuously examining the merits, risks and feasibility of and searching for strategic new site opportunities, such efforts may or may not result in profitable New Sites, including as a result of these uncertainties, which could, in turn, have a material adverse effect on our business, prospects, financial condition and/or results of operations. See “— We do not always operate with the required approvals and licenses for some of our sites, particularly where it is unclear whether a certain license or permit is required or where there is a significant lead time required for processing the application, and
24
therefore may be subject to reprimands, warnings and fines for non-compliance with the relevant licensing and approval requirements” for more information.
We rely on key management personnel and any inability to recruit, train, retain and motivate key employees could have a material adverse effect on our business.
We believe that the current management team contributes significant experience and expertise to the management and growth of the business. The continued success of the business and our ability to execute our business strategies in the future will depend in large part on the efforts of key personnel particularly Mr. Darwish, our Chairman, Group Chief Executive Officer and Director, and our other senior officers, each of whose services are critical to the success of our business strategies. There is also a shortage of skilled personnel in the telecommunications infrastructure industry in the markets in which we operate, which we believe is likely to continue. As a result, we may face increased competition for skilled employees in many job categories from tower companies, telecommunications operators and new entrants into the telecommunications infrastructure industry and this competition is expected to intensify. Although we believe our employee salary and benefit packages are generally competitive with those of our competitors, if our competitors are able to offer more generous salary and benefit packages in the future, we may face difficulties in retaining skilled employees. An inability to successfully integrate, recruit, train, retain and motivate key skilled employees could have a material adverse effect on our business, prospects, financial condition and/or results of operations.
We have incurred and may continue to incur losses.
We incurred losses of $26 million and $323 million for the years ended December 31, 2021 and 2020, respectively. Our losses were principally due to depreciation and amortization and finance costs, which includes realized and unrealized losses from foreign exchange movements, in such periods. As a result of our acquisitions and exposure to foreign exchange movements, we expect our depreciation and amortization and finance costs to continue to be significant and may increase as a result of our planned growth strategy or foreign exchange volatility. If we incur losses in the future, it could have a material adverse effect on our business, prospects, financial condition and/or results of operations.
We do not always operate with the required approvals and licenses for some of our sites, particularly where assets are acquired from third parties or where it is unclear whether a certain license or permit is required or where there is a significant lead time required for processing the application, and therefore may be subject to reprimands, warnings and fines for non-compliance with the relevant licensing and approval requirements.
Although we generally seek and obtain the requisite federal, national, state and/or local approvals prior to the commencement of tower construction, it is often unclear whether certain, particularly local, permits are required and in some circumstances local authorities have imposed permit requirements retrospectively. In instances where we acquire assets from third parties, the prior owners of those assets may not have had the requisite federal, national, state and local approvals for certain of the sites we are acquiring. There is sometimes a long lead-time required for processing applications for approvals and licenses from the local authorities, including construction and building permits required from certain state authorities to construct or build any structure and environmental approvals. See Item 4.B. “Business Overview — Permits and Regulation — License to operate.” Although we make payments in relation to the relevant permits when required, the delay encountered in receiving the permits, licenses or certificates means that we may, therefore, in limited instances, proceed with and complete tower construction and base transmission sites installation for Tenants before all required approvals and licenses have been formally issued by local authorities. As we look to expand our offering to include services like fiber connectivity, rural offerings and other verticals, we may be subject to increased regulatory, license and permit obligations (including in respect of active telecommunications elements that may comprise part of the arrangements with customers, such as for rural offerings, which may be based on an “open RAN” architecture). We may or may not be able to meet any and all such obligations.
Although we believe these practices are customary in the telecommunications industry in the countries in which we operate, there can be no assurance that the relevant authorities will issue the licenses or approvals, if required, or that they will be issued in a timely manner or as expected. If such approvals and licenses are required and not obtained, the local or state authorities may impose penalties, such as reprimands, warnings and fines, for non-compliance with the relevant licensing and approval requirements. In addition, in some jurisdictions, federal, national, state and local authorities charge taxes and levies in relation to similar services, for example tenement rates and environmental permits for our sites. This leads to confusion over which authority should be paid the relevant levy and in many cases we must wait for a demand to be made before we can make the payment.
25
Additionally, certain authorities have recently become more aggressive in setting of permit fees, the enforcement of permits and collection of payments, or may become more so in the event the profile of a business is perceived to have increased. In an extreme case, local authorities may prevent us from entering our sites or demand that we dismantle the unlicensed towers, which has occurred in certain limited cases. For example, in Nigeria, it was publicly reported in 2019 that the NCAA threatened to decommission and dismantle a number of Glo towers for safety violations including failure to obtain the statutory aviation height clearance certificate. It is reported that while no towers were ultimately decommissioned or dismantled by the NCAA, this was due to the affected operators complying with demands. In addition, in December 2019 the Federal Capital Development Authority, or FCDA, stopped the issuance of permits to telecommunications infrastructure companies in the Federal Capital Territory while it sought to review and increase fees. The FCDA briefly resumed issuing new permits in 2021 but the stoppage has recently resumed. During previous periods when new permit issuances were on hold, the development and expansion of our business operations in Abuja (where we had 861 Towers as of December 31, 2021) was impacted, which consequently impacted the quality of service of remaining towers in operation in the area. If we are required to pay additional levies, penalties or fees, or relocate a material number of our Towers and cannot locate replacement sites that are acceptable to our customers, this could adversely affect revenue and cash flow, which in turn could have a material adverse effect on our reputation, business, prospects, financial condition and/or results of operations.
Our business is subject to regulations, including those governing telecommunications, as well as the construction and operation of Towers, and any changes in current or future laws or regulations could restrict our ability to operate our business.
Our business, and that of our customers, is subject to national, state and local regulations governing telecommunications as well as the construction and operation of Towers. These regulations and opposition from local zoning authorities and community organizations against construction in their communities could delay, prevent or increase the cost of new tower construction, modifications, additions of new antennas to a site, or site upgrades, thereby limiting our ability to respond to customer demands and requirements. In addition, certain licenses and permits for the operation of Towers may be subjected to additional terms, conditions or fees/levies (which may be new and unexpected, as a consequence, for example, of a perceived increase in a business’s profile or growth) or new permits imposed on existing sites, with which we cannot comply. As public concern over tower proliferation has grown in recent years, including as a result of concerns about alleged health risks, some communities now also try to restrict tower construction, delay granting permits or require certain towers to be dismantled and relocated. On the other hand, governments and regulators may impose additional requirements on businesses such as ours or our customers based on wider socio-economic considerations, including, potentially, requirements to construct new sites in more remote or rural areas (or regulatory actions or pressure on pricing or packages on our customers or us, including potentially imposition of local currency pricing, as may have been seen in some markets) to increase geographical and network coverage to larger parts of a population (which may be less commercially viable for us) or make services available at lower or fixed tariffs. Existing regulatory policies and changes in such policies may materially and adversely affect the associated timing or cost of such projects and/or the costs attributable to our usual business operations, and additional regulations may be adopted which increase delays, or result in additional costs, or that prevent completion of projects in certain locations. As we look to expand our offering to include services like fiber connectivity, rural offerings and other verticals, we may be subject to increased regulatory, license and permit obligations (including in respect of active telecommunications elements that may comprise part of the arrangements with customers, such as for rural offerings which may be based on an “open RAN” architecture). We may or may not be able to meet any and all such obligations. Any imposition of new regulations, fees or levies, or failure to complete new tower construction, modifications, additions of new antennas to a site, or site upgrades could harm our ability to add additional site space and grow our business, which could have a material adverse effect on our business, prospects, financial condition and/or results of operations.
Our operations are also subject to various other laws and regulations that affect our business, such as those related to labor, employment (including new minimum wage regulations), unions, health and safety, antitrust and competition, environmental protection, consumer protection, import/export and anti-bribery, corruption and money laundering. We or our employees, subcontractors or agents could take actions that might violate any of these requirements. Violations, or alleged violations, of any such laws or regulations could subject us to criminal or civil enforcement actions and adversely affect our reputation, any of which could have a material adverse effect on our business, prospects, financial condition and/or results of operations.
We may seek to raise financing to fund future growth opportunities or operating expense reduction strategies and the inability to do so may adversely affect our ability to implement our business strategy.
We may seek to raise financing to fund future growth opportunities, or operating expense reduction strategies, including debt and equity financing. Our ability to secure future debt or equity financing in amounts sufficient for strategic growth or cost reduction opportunities could be adversely affected by many factors. If our revenues decline, we may not be able to
26
raise additional funds through debt or equity financing (or any debt or equity financing may not be on acceptable terms). Moreover, restrictive debt covenants under current and future indebtedness may limit our ability to raise any such further financing (or refinance existing financing) and also our ability to support our growth strategy, including making strategic acquisitions. Additionally, political instability, a downturn in the economy and/or disruption in the financial and credit markets, foreign currency fluctuations, social unrest or changes in the regulatory environment (including as a result of the COVID-19 pandemic or resulting effects, or any other future coronavirus or other outbreaks or events with a wide-ranging regional or global impact) could increase the cost of borrowing or restrict our ability to obtain financing for future acquisitions and other growth or cost reduction opportunities.
There can be no assurance that we will be successful in obtaining financing from banks and other financial institutions and/or capital markets or that the cost of such financing or the other applicable terms of such financing will not make such financing more onerous than under the facilities available to us at present. If we are unable to raise the necessary financing, we may have to revise our business strategy or forgo certain strategic growth opportunities or operating expense reduction strategies, which could have a material adverse effect on our business, prospects, financial condition and/or results of operations.
Towers with MLL or ROU agreements are subject to termination risk.
As of December 31, 2021, we operated 1,904 towers under license to lease agreements in Cameroon and Côte d’Ivoire. We do not own these towers or the underlying land leases, but have a contractual right to operate the towers, including leasing out additional space on the towers. The MLL agreements may be terminated upon agreement of the parties, if we fail to comply with specified obligations in the agreements or, in some cases, at the customer’s option. If we are unable to protect our rights under, or extend, the MLL agreements or they are terminated, we will lose the cash flows derived from such towers, which could have a material adverse effect on our business, prospects, financial condition and/or results of operations. On January 21, 2022, pursuant to the GTS SP5 Acquisition, we signed definitive transaction agreements to acquire SP5, consisting of 2,115 towers. 2,113 of the 2,115 SP5 towers are operated under an ROU agreement, where SP5 does not own the towers or the underlying land leases, but has a contractual right to operate the towers, including leasing out additional space on the towers. The ROU agreement may be terminated upon agreement of the parties, if we fail to comply with specified obligations in the agreements or, in some cases, at the customer’s option. If we are unable to protect our rights under, or extend, the ROU agreements or they are terminated, we will lose the cash flows derived from such towers, which could have a material adverse effect on our business, prospects, financial condition and/or results of operations.
We provide Managed Services to towers that are owned or operated by third parties. Our inability to access these sites or to perform the services in accordance with our requirements could have a material adverse effect on our business and/or operating results.
We provide Managed Services to certain sites for our customers, which includes the provision of maintenance, security or power services. Sites where we provide Managed Services may be owned by the relevant customer the services are being provided for, or by other third parties. In these instances, we need to coordinate the provision of our services in line with the customer requirements as well as in accordance with the owner or operator of the tower. This includes ensuring that we have appropriate access to the relevant sites and that our equipment is adequately protected. If we are unable to perform our services under our Managed Services agreements, we may suffer penalties, the termination of such services or the loss of our equipment, which could have a material adverse effect on our business, prospects, financial condition and/or results of operations.
Our inability to successfully execute a group-wide enterprise resource planning, or ERP, global template transformation program could have a material adverse effect on our business and/or operating results.
We are currently in the process of implementing a group wide ERP global template which would standardize and streamline our internal operations in a consistent manner across all group companies. It comprises an integrated and optimized set of business processes and associated system build covering the automation, standardization and streamlining of the major operational areas and business processes of IHS, including Record to Insight, Procure to Pay, Enterprise Asset Management and Order to Cash.
In the event that the global template is not implemented successfully, on time, within budget and/or in line with business requirements, or if the system does not perform in a satisfactory manner, it could be disruptive and could have a material adverse effect on our operations, including our potential ability to report accurate, timely and consistent financial results or otherwise maintain adequate internal control over financial reporting; our ability to purchase supplies from and pay our
27
contractors; and our ability to bill and collect receivables from our customers, and we may also lose an opportunity to significantly improve business efficiency, process standardization, and inbuilt Sarbanes-Oxley controls across our operations. In addition, we have put together a team of employees who are taking the lead on the implementation of the ERP system. To the extent that this team or key individuals are not retained through the implementation period, the success of our implementation could be compromised and the expected benefits would not be realized. If the ERP system is not successfully implemented (or if its implementation or ongoing operation is impacted, for example, as a result of failure to integrate (or challenges in integrating) the information technology, finance or other ERP systems of new businesses that we acquire), it could have a material adverse effect on our business, prospects, financial condition and/or results of operations. This could also adversely affect our ability to quickly absorb new acquisitions into our present system application architecture, which could have a material adverse effect on our business, prospects, financial condition and/or results of operations.
Our sites contain sensitive and fragile equipment and indemnities obtained from suppliers and contractors may be inadequate to cover any losses or damages to our customers’ property.
Our sites host sensitive and fragile telecommunications equipment, which could be damaged by actions of our maintenance subcontractors, suppliers or the original equipment manufacturer who may be present on our sites during the course of their duties. While we strive to obtain contractual indemnities and insurance protections from our maintenance subcontractors and suppliers with respect to damage to our property and those of our customers, such contractual rights to indemnity may not adequately cover all losses and/or we may not be able to recover such losses due to protracted litigation, defenses successfully raised by the counterparty and/or insolvency of the subcontractor or supplier, which may lead to increased costs and in turn could have a material adverse effect on our business, prospects, financial condition and/or results of operations.
We rely on key information technology systems, which may be vulnerable to physical or digital/electronic damage, security breaches or cyber-attacks that could have a material adverse effect on our reputation as well as our business, prospects, financial condition and/or results of operations.
We rely on information technology to conduct our daily business, procure products, pay suppliers, communicate internally and externally, share files, and efficiently and accurately provide services to our customers and monitor our operations, including via the operation of our network operations centers, which is key to our site maintenance and performance management. While we seek to apply best practice policies and devote significant resources to network security and other security measures to protect our information technology and communications systems and data, these security measures cannot provide absolute security. In addition, the tools used by cyber criminals continue to evolve in order to circumvent such security measures and maximize the potential damage of a successful attack. Some of our networks are also managed by third-party service providers and are not under our direct control. Third (and beyond) parties have been a popular attack vector for cyber criminals, and depending on the nature of the relationship with some of these partners, we sometimes use their code, software, human-power, networks, or give them access to our servers and data, among many other scenarios. A security vulnerability at any of these third party partners could potentially provide an opportunity for a cyber criminal to reach or damage our networks or data. Despite existing security measures, certain parts of our infrastructure may be vulnerable to damage, disruptions, or shutdowns due to unauthorized access, software bugs, phishing attacks, employee errors, computer viruses, cyber-attacks, and other security breaches, particularly in times of increased usage and reliance such as during and following the COVID-19 pandemic. In addition, many types of cyberattacks are designed to be difficult to detect in order to harvest as much data or cause as much systemic damage as possible before detection. As a result in the event of a cyberattack our systems could be compromised without our knowledge for a period of time before the attack is detected and addressed. The performance of our information technology systems may also be impacted by certain operating conditions in our jurisdictions of operation, including lack of reliable power supply, shortages in replacement parts, as well as general security conditions. In addition, if our employees are required to work from home as a result of global or regional health pandemics, our information technologies and systems may be particularly strained or increasingly vulnerable. An attack attempt or security breach, such as a distributed denial of service attack, or damage caused by other means could potentially result in the interruption or cessation of certain or all of our services to our customers, our inability to meet expected levels of service or data transmitted over our customers’ networks being compromised, as well as other unforeseen damages. In the event of a potential breach, while we would endeavor to comply with any applicable requirements to inform impacted parties within a reasonable time, priority may be given to containing and eliminating the cyberattack in order to limit the damage; which as a result could potentially delay our communication of the identified attack to customers, suppliers, concerned agencies or authorities or other relevant parties.
In addition, we may collect, store and process certain sensitive data (either in respect of our personnel, or from our customers or suppliers), which makes us a potentially vulnerable target to cyber-attacks, computer viruses, physical or electronic break-ins or similar disruptions or data theft. While we have taken steps to protect the confidential information
28
that we have access to, our security measures could be breached. Because the techniques used to sabotage or obtain unauthorized access to systems change frequently and generally are not recognized until they are launched against a target, we may not be able to anticipate these techniques or implement adequate preventative measures. Any accidental or willful security breaches or other unauthorized access to our system could cause any such confidential information to be stolen and used for criminal purposes. Security breaches or unauthorized access to confidential information could also expose us to liability related to the loss of the information, time-consuming and expensive litigation and negative publicity. If our security measures are breached because of third-party action, employee error, malfeasance or otherwise, or if design flaws in our technology infrastructure are exposed and exploited, our relationships (in particular, those with our customers) could be severely damaged, we could incur significant liability and it could have a material adverse effect on our business and operations. Any failure or perceived failure by us to prevent information security breaches or to comply with privacy policies or privacy-related legal obligations, or any compromise of security that results in the unauthorized release or transfer of personally identifiable information or other customer data, could cause our customers to lose trust in us and could expose us to legal claims.
We cannot guarantee that our security and power back-up measures will not be circumvented or fail, resulting in customer network failures or interruptions that could impact our customers’ network availability, potentially resulting in penalties for failure to meet targeted quality levels, as well as otherwise having a material adverse effect on our business, reputation, financial condition and/or operational results. We may be required to spend significant resources to protect against or recover from such threats and attacks. In addition, as we implement new information technology systems, we cannot guarantee that our new security measures will be sufficient. If an actual or perceived breach of our security occurs, the market perception of the effectiveness of our security measures could be harmed, and we could lose customers. Further, the perpetrators of cyber-attacks are not restricted to particular groups or persons. Our employees or external actors operating in any geography may commit these attacks. Any such events could result in legal claims or penalties, disruption in operations, misappropriation of sensitive data, damage to our reputation, negative market perception, or costly response measures, which could have a material adverse effect on our business, prospects, financial condition and/or results of operations.
We could have liability under health, safety and environmental laws.
Our operations are subject to the requirements of various environmental and occupational safety and health laws and regulations, including those relating to the management, use, storage, disposal, emission and remediation of, and exposure to, hazardous and non-hazardous substances, materials, waste, as well as items related to our day-to-day operations such as transport and construction. As an operator of telecommunications infrastructure that has a heavy reliance on diesel, we may purchase diesel in large quantities that is then stored at our facilities. As the owner of these facilities, we may be liable for substantial costs or remediation under health, safety and environment laws in the event that there is leakage or spillage from these storage facilities. As the owner, lessee or operator of telecommunications sites, we may be liable for the substantial costs of remediating soil and groundwater contaminated by hazardous materials, without regard to whether we, as the owner, lessee or operator, knew of or were responsible for the contamination. Many of these laws and regulations contain information reporting and record-keeping requirements, which may be burdensome for us or have high costs associated with compliance, which could have a material adverse effect on our business, prospects, financial condition and/or results of operations.
We cannot assure potential investors that we are or will be in full compliance with all environmental requirements at all times. For example many of our sites rely on the use of carbon-emitting power systems, and at the time of acquisition, certain towers acquired from other companies may not be compliant with environmental regulations or may lack certain environmental permits. We may be subject to potentially significant fines, penalties or criminal sanctions if we fail to comply with any of these requirements. The requirements of these laws and regulations are complex, change frequently, and could become more stringent in the future. It is possible that liabilities will arise in the future in a manner that could have a material adverse effect on our business, prospects, financial condition and/or results of operations.
Failure to provide a safe and healthy working environment in accordance with the relevant applicable legislation, especially in light of the COVID-19 pandemic and related measures imposed in many of the markets in which we operate, may result in government authorities forcing closure of sites on a temporary or permanent basis or refusing lease or license applications. Working conditions, including aspects such as weather and temperature, can add to the inherent dangers.
While we have invested, and will continue to invest, substantial resources in our occupational health and safety programs, there can be no assurance that we will avoid significant liability exposure and we may not be able to deliver a sustained improvement in safety performance as a result of management interventions and training initiatives failing to translate into behavioral change by all employees and contractors. Non-compliance with critical controls is a common failure in safety
29
incidents which can lead to loss of life, workplace injuries and safety-related stoppages, all of which immediately impact operational performance and, in the long term, threaten our ability to operate as intended.
Given the high degree of operational risk in our industry, we have suffered fatalities in the past and may suffer additional fatalities in the future. Serious accidents, including fatalities, may subject us to civil or criminal fines and penalties, liability to employees and third parties for injury, illness, or death and other financial consequences, which may be significant. In addition, if our safety record were to deteriorate over time or we were to suffer substantial penalties or criminal prosecution for violation of health and safety regulations, our customers could cancel our contracts and elect to procure future services from other providers. Unsafe work sites also have the potential to increase employee turnover, increase the costs of projects for our customers, and raise our operating costs. We could also suffer impairment to our reputation, industrial action or difficulty in recruiting and retaining skilled employees and contractors. Any future changes in laws, regulations or community expectations governing safety of our operations could result in increased compliance and remediation costs.
Any of the foregoing developments could have a material adverse effect on our results of operations, cash flows and/or financial condition.
Moreover, there has been increasing public focus, including by investors, customers environmental activists, the media and governmental and nongovernmental organizations, on a variety of environmental, social and other sustainability matters. In addition, this emphasis on environmental, social and other sustainability matters has resulted and may result in the adoption of new laws and regulations, including new reporting requirements as well as our adoption of new voluntary reporting requirements. If we fail to comply with new laws, regulations or reporting requirements or there are inaccuracies in our reporting or we fail to meet expected or anticipated metrics or targets, our reputation and business could be materially adversely impacted.
Revenue and/or costs could be adversely affected due to perceived health risks from radio emissions, particularly if these perceived risks are substantiated.
Public perception of possible health risks, including any perceived connection between radio frequency emissions associated with cellular and other wireless communications technology and certain negative health effects, could interrupt or slow the growth of wireless companies. In particular, negative public perception of, and regulations regarding, these perceived health risks could increase opposition to the development and expansion of tower sites. There have been instances in certain telecommunication markets globally where towers have been vandalized due to perceived health risks associated with 5G technology, including potentially related to COVID-19 as well. The potential connection between radio frequency emissions and certain negative health effects has been the subject of substantial study by the scientific community in recent years, and numerous health-related lawsuits have been filed around the world against wireless carriers and wireless device manufacturers. If a scientific study or court decision resulted in a finding that radio frequency emissions posed health risks to consumers, it could negatively impact the market for wireless services, which could have a material adverse effect on our business, prospects, financial condition and/or results of operation. We do not maintain any significant insurance with respect to these matters.
We may experience local community opposition to some of our sites or other telecommunications infrastructure.
It is normal in the industry to experience, and we may in the future experience, local community opposition to our existing tower sites or the construction of new towers or deployment of other telecommunications infrastructure assets for various reasons, including concerns about alleged health risks and noise or nuisance complaints. See “— Revenue and/or costs could be adversely affected due to perceived health risks from radio emissions, particularly if these perceived risks are substantiated.” As a result of such local community opposition, we could be required by the local authorities to dismantle and relocate certain tower sites or other telecommunications infrastructure. If we are required to relocate certain tower sites or other telecommunications infrastructure and cannot locate replacement sites that are acceptable to our customers, it could materially and adversely affect our revenue and cash flow, which in turn could have a material adverse effect on our business, prospects, financial condition and/or results of operations.
Our insurance may not provide adequate coverage for natural disasters, security breaches and other unforeseen events.
We may not carry insurance for all categories of risk that our business may encounter. Our business assets are subject to risks associated with natural disasters, such as windstorms, floods and hurricanes, including any impact of climate change, as well as theft, particularly of diesel or batteries, vandalism, terror attacks and other unforeseen damage. In certain instances, such as where we store diesel at our facilities, we may be unaware that theft of the diesel is taking place, despite
30
controls that we have in place to prevent this, rendering insurance covering such theft ineffective. In addition, in the event a tower has been constructed in a substandard manner, is overloaded or has not been properly maintained, it may be at risk of collapse or damage. Any damage or destruction to our towers as a result of these or other risks would impact our ability to provide services to our customers. While we maintain insurance to cover the cost of replacing damaged towers, and business interruption insurance and general liability insurance to protect ourselves in the event of an accident involving a tower, we might have claims that exceed our coverage under our insurance policy or claims may be denied and, as a result, the insurance may not be adequate. Insurance may not adequately cover all lost revenues, including revenues lost from new tenants that could have been added to the towers but for the damage. In addition, while we maintain insurance coverage with respect to certain claims, we may not be able to renew or obtain such insurance on acceptable terms in the future, if at all, and any such insurance may not provide adequate coverage against any such claims. Any significant uninsured losses or liabilities may require us to pay substantial amounts, which would reduce our working capital and could have a material adverse effect on our business, financial condition and/or results of operations. If we are unable to obtain adequate insurance coverage or provide services to our customers as a result of damage to our towers, it could lead to customer loss, which could have a material adverse effect on our business, prospects, financial condition and/or results of operations.
While we seek to purchase insurance from financially strong, reputable insurance companies there can be no guarantee that such insurers will be able to pay claims when they arise due to liquidity or solvency reasons. Any delay or shortfall in receipt of insurance proceeds could have a material adverse effect on our business, prospects, financial condition and/or results of operations.
Maintenance of Towers could subject us to liability for property damage or other accidents.
There are risks inherent in the maintenance and use of Towers. Upon acquisition of a new Tower, we update and conduct maintenance to bring such Towers into compliance with our operational and safety standards. The collapse of a Tower, or portion of a Tower, due to known defects we have been unable to address or unforeseen defects, or due to improper maintenance or otherwise, could cause injury to or death of individuals or damage to surrounding property. Further, maintenance work on Towers is inherently dangerous and accidents could result in injury to or death of maintenance workers or other parties. Any such damage or accident could subject us to third-party claims regarding our potential liability, even in cases where we have outsourced maintenance work to third parties. We could incur significant costs defending any such claims and, if we were found liable, paying any resulting claims, either of which could have a material adverse effect on our business, prospects, financial condition and/or results of operations.
We are subject to the effects of climate change.
Climate change, including an increase in extreme weather events (such as floods, windstorms or hurricanes), rising sea levels and limitations on water availability and quality, has the potential to create physical and financial risks and may cause damage or loss to our Towers, limit the availability of resources, result in additional costs or prevent the completion of projects in certain locations. Additionally, some countries in which we operate rely on the generation of electricity through hydro-electric schemes. If changing weather patterns cause water shortages or prolonged droughts in those countries or regions, that may affect our ability to deliver services to our customers. Any of the foregoing factors could have a material adverse effect on our business, prospects, financial condition and/or results of operations.
We may become party to disputes and legal, tax and regulatory proceedings or actions.
In the ordinary course of business, we have been, are and may in the future be, named as a defendant or an interested party in legal, tax, regulatory and/or law enforcement actions, proceedings, claims and disputes by governments, regulators, entities or individuals in connection with our business activities. In certain of the jurisdictions in which we operate, there may be a higher likelihood that such actions, proceedings, claims and disputes may be brought by governments, regulators, entities or individuals for fees, taxes or other payments, even if meritless or frivolous under applicable law, and these actions, proceedings, claims and disputes may increase as the profile of our business rises along with the continued growth and development of our business. Any such investigations, actions, litigation, disputes or proceedings, as well as lawsuits initiated by us for the collection of payables, may be costly, may in certain circumstances require us to dismantle tower sites, may be harmful to our reputation and may divert significant management attention and other resources away from the business, which could have a material adverse effect on our business, prospects, financial condition and/or results of operations.
Similarly, any material litigation could have a material adverse effect on our business and we may not have established adequate provisions for any potential losses associated with litigation not otherwise covered by insurance, which could have
31
a material adverse effect on our prospects, business, financial condition and/or results of operations. Additionally, any negative outcome with respect to any legal actions in which we are involved in the future could require payment of fines, penalties or judgments in amounts that could have a material adverse effect on our business, prospects, financial condition and/or results of operations.
It is possible that disputes with customers could lead to a termination of agreements with customers or a material modification of the terms of those agreements, either of which could have a material adverse effect on our business, prospects, financial condition and/or results of operations. If we are forced to resolve any of these disputes through litigation, our relationship with the applicable customer could be terminated or damaged, which could lead to decreased revenues or increased costs, and could have a material adverse effect on our reputation as well as our business, prospects, financial condition and/or results of operations.
In addition, we have been, are and may in the future be, subject to regulatory and/or law enforcement investigations, actions or proceedings from time to time. In 2017, certain of our bank accounts had “post no debit” restrictions placed on them during the course of certain inquiries by the Nigerian Economic and Financial Crimes Commission, or EFCC, and, until the restriction on the bank accounts was lifted during the latter half of 2018, we were unable to access approximately $197 million. Currently, no amounts remain restricted pursuant to those restrictions (and we were not notified of any formal allegation or investigation against us), however we cannot guarantee that regulators or other authorities or agencies will not take a similar approach should they undertake investigations or inquiries in the future, irrespective of the veracity of any potential claim or severity of any potential outcome.
In 2019, the Federal Competition and Consumer Protection Act, or FCCP Act, became law, introducing competition regulations in Nigeria. Pursuant to the FCCP Act, the Federal Competition and Consumer Protection Commission, or FCCPC, is authorized to designate the market share that would constitute a dominant market share for the purposes of the FCCP Act. The FCCPC has overarching powers to regulate competition in Nigeria, and when its regulatory powers overlap with those of an industry-specific regulator, such as the Nigerian Communications Commission, or NCC, in the area of competition and consumer protection, the FCCPC takes precedence and the two bodies must otherwise work together to regulate competition in that specific industry. Given that we are the leading provider of passive telecommunications infrastructure services in Nigeria, the FCCPC and the NCC may determine that we are in a dominant position in the market and, in an effort to ensure that there is no abuse of market position, may commence a regulatory inquiry or action, levy fines, or otherwise require pricing or other modifications of our contract terms or impose restrictions on our ability to build New Sites or operate existing sites. In addition, where we are required to appear before the tribunal of the NCC, the tribunal has the power under certain circumstances to order us to sell a portion or all of our shares, interests or assets.
Additionally, in the ordinary course of business, we are subject to regular tax reviews. For example, following a detailed tax audit undertaken in 2018 in Nigeria, all matters were settled with no additional material liability (though some tax payments were made). A number of tax audits have been raised in multiple jurisdictions, some of which are ongoing, including in Nigeria. There can be no assurance that such ongoing audits or future audits will not result in material liability which could, in turn, have an adverse effect on our business, prospects, financial condition and/or results of operations.
There could be material adverse tax consequences for our shareholders in the United States if we are classified as a “passive foreign investment company” for United States federal income tax purposes.
Under United States federal income tax laws, if a company is, or for any past period during which a United States shareholder held shares in such company was, a passive foreign investment company, or PFIC, it could have adverse United States federal income tax consequences to such United States shareholder even if the company is no longer a PFIC. We do not believe that we currently are or have been a PFIC for the taxable year ending December 31, 2021, and we do not expect to be a PFIC in the future. However, the determination of whether we are a PFIC is a factual determination made annually based on all the facts and circumstances after the close of each taxable year, and the principles and methodology used in determining whether a company is a PFIC are subject to ambiguities and different interpretations. Therefore, we cannot assure you that we will not be a PFIC for the current taxable year or in the future. If we are a PFIC, United States shareholders would be subject to adverse U.S. federal income tax consequences. United States purchasers of our ordinary shares are urged to consult their tax advisors concerning United States federal income tax consequences of holding our ordinary shares if we are considered to be a PFIC. See the discussion under Item 10.E. “Taxation—Material United States Federal Income Tax Considerations.”
32
If a United States person is treated as owning at least 10% of the ordinary shares, such holder may be subject to adverse U.S. federal income tax consequences.
If a United States person is treated as owning (directly, indirectly, or constructively) at least 10% of the value or voting power of the ordinary shares, such person may be treated as a “United States shareholder” with respect to each “controlled foreign corporation” in the Group (if any). A United States shareholder of a controlled foreign corporation may be required to report annually and include in its U.S. taxable income its pro rata share of “Subpart F income,” “global intangible low-taxed income,” and investments in U.S. property by controlled foreign corporations, regardless of whether the Company makes any distributions. An individual that is a United States shareholder with respect to a controlled foreign corporation generally would not be allowed certain tax deductions or foreign tax credits that would be allowed to a United States shareholder that is a U.S. corporation. Failure to comply with these reporting obligations may subject a United States shareholder to significant monetary penalties and may prevent the statute of limitations with respect to such United States shareholder’s U.S. federal income tax return for the year for which reporting was due from starting. The Company cannot provide any assurances that it will assist holders of the ordinary shares in determining whether any of its non-U.S. subsidiaries is treated as a controlled foreign corporation or whether any holder of the ordinary shares is treated as a United States shareholder with respect to any such controlled foreign corporation or furnish to any United States shareholders information that may be necessary to comply with the aforementioned reporting and tax paying obligations. A U.S. Holder (as defined in Item 10.E. “Taxation—Material United States Federal Income Tax Considerations.”) should consult its advisors regarding the potential application of these rules to an investment in the ordinary shares.
Changes in our rates of taxation, and audits, investigations and tax proceedings could have a material adverse effect on our financial condition and/or results of operation.
We are subject to direct and indirect taxes in numerous jurisdictions. We calculate and provide for such taxes in each tax jurisdiction in which we operate. The amount of tax we pay is subject to our interpretation of applicable tax laws in the jurisdictions in which we file. We will seek to run IHS Holding Limited in such a way that it is and remains tax resident in the United Kingdom. We have taken and will continue to take tax positions based on our interpretation of tax laws, but tax and/or accounting often involves complex matters and judgement is required in determining our worldwide provision for taxes and other tax liabilities.
Although we believe that we have complied with all applicable tax laws, there can be no assurance that a taxing authority will not have a different interpretation of the law and assess us with additional taxes (and possibly related interest and/or penalties).
We are subject to ongoing tax audits in various jurisdictions. Tax authorities have disagreed, and may in the future disagree, with our judgements. We regularly assess the likely outcomes of these audits to determine the appropriateness of our tax liabilities. However, our judgements might not be sustained as a result of these audits, and the amounts ultimately paid could be different from the amounts previously recorded and such amounts could be material. In addition, our effective tax rate in the future could be adversely affected by changes in the mix of earnings in countries with differing statutory tax rates, changes in the valuation of deferred tax assets and liabilities and changes in tax laws. Tax rates in the jurisdictions in which we operate may change as a result of macroeconomic, political or other factors. Increases in the tax rate in any of the jurisdictions in which we operate could have a negative impact on our profitability. In addition, changes in tax laws, treaties or regulations, or their interpretation or enforcement, may be unpredictable, particularly in the types of markets in which we operate (such as emerging markets), and could become more stringent, which could materially adversely affect our tax position. Any of these occurrences could have a material adverse effect on our business, prospects, financial condition and/or results of operations.
Future changes to tax laws could materially adversely affect us and reduce net returns to our shareholders.
Our tax treatment is subject to changes in tax laws, regulations, tax policy initiatives and reforms in jurisdictions in which we operate. In addition, our tax treatment may also be affected by tax policy initiatives and reforms related to the Organization for Economic Co-Operation and Development, or the OECD, the work of the OECD/G20 Inclusive Framework on Pillar One and Pillar Two and other initiatives.
Such changes may include (but are not limited to) the taxation of operating income, investment income, interest income, dividends received or dividends paid. We are unable to predict what tax reform may be proposed or enacted in the future, possibly with retroactive effect, or what effect such changes would have on us. Any such changes could affect our financial position and overall or effective tax rates in countries where we have operations, reduce post-tax returns to our shareholders, and increase the complexity, burden and cost of tax compliance.
33
In July 2021, the OECD/G20 Inclusive Framework announced that the proposals under Pillar Two would apply to multinational groups with revenues exceeding €750 million and would include a globally coordinated set of rules, including an Income Inclusion Rule and an Undertaxed Payment Rule, which would operate with reference to a minimum tax rate of at least 15% determined on a country by country basis. At the end of 2021 the OECD published Pillar Two model rules for the implementation of a global minimum tax rate, however a number of details remain to be addressed and a detailed implementation framework is still to be published.. While the impact of Pillar Two on us is somewhat difficult to predict, if enacted as currently contemplated, it could have a material adverse impact on our operations and post-tax returns to our shareholders. See “— Risks Relating to Ownership of our Ordinary Shares.”
Certain countries in which we operate may treat the indirect change of ownership of our subsidiaries as triggering tax charges.
Changes in the indirect ownership of our subsidiaries resulting from a transfer of our shares can represent a taxable event in certain circumstances in some jurisdictions in which certain of our subsidiaries are located. The applicable taxes may include taxes on capital gains and transfer taxes. Depending on the jurisdiction, the liability can potentially fall on our shareholders (existing or new) or one of our underlying subsidiaries. In jurisdictions where such rules apply, the scope of the legislation and the practical application by the tax authorities can be somewhat uncertain and therefore there is a risk of such liabilities arising, either to one of our subsidiaries or to a shareholder.
We believe that, based on advice from a leading third party tax expert in the area, the issuance of new shares would not give rise to any such capital gains or transfer tax liabilities.
However, in several jurisdictions in which we operate (excluding Nigeria, the most material jurisdiction to us) it is possible that transfers of our shares could still give rise to tax liabilities for our shareholders. Some of the relevant jurisdictions do not provide clear guidance to exempt the sale of listed shares from the scope of these rules and there may be a higher risk with regards to substantial disposals or acquisitions of our shares. We will take all steps which are reasonably possible within the legislation of the relevant jurisdictions to mitigate such risks for shareholders, but cannot guarantee that the relevant tax authorities will not seek to impose capital gains or transfer taxes on a shareholder upon transfers of our shares. Prospective purchasers should consult their tax advisors regarding the potential application of these rules to an investment in our shares.
We are exposed to the risk of violations of anti-bribery and anti-corruption laws or other similar regulations.
We operate and conduct business in various emerging and less developed markets (including Africa, the Middle East and Latin America), and we are expanding into additional markets, which at times experience high levels of fraud, bribery and corruption. We are subject to the applicable anti-corruption laws and regulations of the markets in which we operate, including the U.S. Foreign Corrupt Practices Act of 1977, or the FCPA, and the UK Bribery Act 2010, or the UK Bribery Act. The FCPA prohibits providing, offering, promising, or authorizing, directly or indirectly, anything of value to non-U.S. government officials, political parties, or candidates for political office for the purposes of obtaining or retaining business or securing any improper business advantage. As part of our business, we are regularly required to deal with regulators, government ministries, departments and agencies to obtain permits and licenses to operate our business. We also periodically enter into joint ventures with government ministries, departments and agencies in the ordinary course of our business. The employees of these regulators and government ministries, departments and agencies may be considered government officials for the purposes of the FCPA. The provisions of the UK Bribery Act extend beyond bribery of government officials and are broader than the FCPA in a number of other respects, including jurisdiction, non-exemption of facilitation payments and penalties. In particular, the UK Bribery Act (unlike the FCPA) also applies to the active payment of bribes to private persons (i.e. non-government officials) as well as the passive receiving of bribes. Furthermore, unlike the vicarious liability regime under the FCPA, whereby corporate entities can be liable for the acts of its employees, the UK Bribery Act introduced a new offense applicable to corporate entities and partnerships which carry on part of their business in the United Kingdom that fail to prevent bribery, which can take place anywhere in the world, by persons who perform services for or on behalf of them, subject to a defense of having adequate procedures in place to prevent the bribery from occurring. The offense can render parties criminally liable for the acts of their agents, joint venture partners, or commercial partners even if done without their knowledge.
Public companies listed in the United States are required to maintain records that accurately and fairly represent their transactions and have an adequate system of internal accounting controls. We maintain internal controls, policies, procedures and training to ensure compliance by us and our directors, officers, employees, representatives, consultants, and agents with the FCPA, UK Bribery Act and other applicable anti-corruption laws and make efforts to ensure their effectiveness. However, we can make no assurance that the controls, policies and procedures, even if enhanced, have
34
been or will be followed at all times or effectively detect and prevent all violations of the applicable laws and every instance of fraud, bribery and corruption. As a result, we could be subject to potential civil or criminal penalties, disgorgement and other sanctions and remedial measures and legal expenses under the relevant applicable law, which could have material adverse effects on our business, prospects, financial condition and/or results of operations if we fail to prevent any such violations or are the subject of investigations into potential violations, which may result in a significant diversion of management’s attention and resources and significant defense costs and other professional fees. In addition, such violations could also negatively impact our reputation and, consequently, our ability to win future business. Any such violation by competitors, if undetected, could give them an unfair advantage when bidding for contracts. The consequences that we may suffer due to the foregoing could have a material adverse effect on our business, prospects, financial condition and/or results of operations.
We are subject to certain export controls, trade and economic sanctions laws and regulations that could impair our ability to compete in international markets and subject us to liability for non-compliance.
Our business activities may, at times, be subject (directly or indirectly) to various export controls and trade and economic sanctions laws and regulations, including, without limitation, the U.S. Commerce Department’s Export Administration Regulations, the trade and economic sanctions programs of the U.S. Treasury Department’s Office of Foreign Assets Control, or OFAC, and the U.S. State Department’s Nonproliferation Sanctions, collectively, Trade Controls. Such Trade Controls may prohibit or restrict our ability to, directly or indirectly, conduct activities or dealings in or with certain countries that are the subject of comprehensive embargoes, or Sanctioned Countries, as well as with individuals or entities that are the subject of Trade Controls-related prohibitions and restrictions, collectively, Sanctioned Parties. Further, our sales and services to certain customers may at times trigger reporting requirements under applicable Trade Controls.
For instance, the U.S. government recently announced several orders effectively barring sales of components and software subject to U.S. export controls to, among others, Huawei and certain other China-based technology companies and their respective affiliates. Any sanctions imposed on us as a result of dealings with Huawei or other organizations subject to U.S. export control (or indirectly as a result of our customers, suppliers and other third-party contractors having such dealings) could have a material adverse effect on our business, prospects, financial condition and/or results of operations. These restrictions, and similar or more expansive restrictions that may be imposed by the United States or other jurisdictions in the future, may also materially and could have a material adverse effect on certain of our customers’ abilities to acquire technologies, systems, devices or components that may be critical to their technology infrastructure, service offerings and business operations, which could, in turn, have a material adverse effect on our business, prospects, financial condition and/or results of operations.
Although we have implemented compliance measures designed to prevent prohibited transactions with Sanctioned Countries and Sanctioned Parties, our failure or the failure of our customers, suppliers and third party-contractors to successfully comply with applicable Trade Controls may expose us to negative legal and business consequences, including civil or criminal penalties, government investigations, and reputational harm, which could have a material adverse effect on our business, prospects, financial condition and/or results of operations. See “— We rely on third-party contractors for various services, and any disruption in or non-performance of those services would hinder our ability to effectively maintain our tower infrastructure.”
Our risk management policies and procedures may not be fully effective in achieving their purposes.
Our policies, procedures, controls and oversight to monitor and manage our enterprise risks may not be fully effective in achieving their purpose and may leave us exposed to identified or unidentified risks. Past or future misconduct by our employees or contractors could result in violations of law, regulatory sanctions and/or serious reputational harm or financial harm. We monitor our policies, procedures and controls; however, we cannot assure you that our policies, procedures and controls will be sufficient to prevent all forms of misconduct. We review our compensation policies and practices as part of our risk management program, but it is possible that our compensation policies could incentivize management and other employees to subject us to inappropriate risk or to engage in misconduct. If such inappropriate risks or misconduct occurs, it is possible that it could have a material adverse effect on our business, prospects, financial condition and/or results of operations.
35
We engage in transactions with certain related parties, and if their support and backing does not continue or a conflict of interest arises, our ability to deliver certain services could be harmed and our results of operations could be materially adversely affected.
MTN Group is one of our shareholders as well as a related party of certain MTN Group operating entities that are our customers in the African countries in which we currently operate. While such customers collectively accounted for 66% and 66% of our revenue for the years ended December 31, 2021 and 2020, respectively, our relationship with each MTN Group operating entity is managed separately through separate contracts for each MTN Group operating entity in each country. While we currently have effective working relationships with the relevant entities in each operating country, there can be no assurance that conflicts of interest, inherent in related party transactions, may not arise in the future, potentially resulting in disadvantages to us or the conclusion of transactions on less satisfactory terms, which could in turn affect our ability to deliver certain services and could have a material adverse effect on our business, prospects, financial condition and/or results of operations. See Item 7.B. “Related Party Transactions.”
Risks Relating to the Markets in which We Operate.
Our current operations are conducted in, and many of our customers are located in emerging markets. Accordingly, our business, prospects, financial condition and/or results of operations depend significantly on the economic and political conditions prevailing in such markets, particularly Nigeria, which is our largest market of operation.
Our current and potential markets are subject to greater risks than more developed markets, and financial turmoil in such markets (including those in which we operate) could disrupt our business and cause the price of our ordinary shares to decline.
Investing in securities of issuers in emerging and less developed markets generally involves a higher degree of risk than investments in securities of corporate or sovereign issuers from more developed countries and carries risks that are not typically associated with investing in more mature markets. These risks include, but are not limited to, the following:
• greater potential adverse economic or other impacts of global events, such as health pandemics or epidemics, including the current outbreak of COVID-19 and future coronavirus or other outbreaks or events with a wide-ranging regional or global impact;
• greater political risk, and changes in, and instability of, the political and economic environment, such as the recent economic slowdown in Nigeria (including, more recently, due to oil price volatility), tensions between the “Anglophone” and “Francophone” regions of Cameroon, and the recent fall in copper prices and multiple bond defaults that adversely affected Zambia’s economy;
• civil strikes, acts of war, terrorism insurrection and incidents of general lawlessness;
• labor unrest or unionization action, including in relation to the business of any third-party contractor or customer;
• government interventions (including, without limitation, import-export quotas, wage and price controls, laws or regulations that restrict foreign investment or foreign ownership and the seizure, nationalization or expropriation of property or equipment);
• potential adverse or unforeseen changes in laws and regulatory practices, including import and export license requirements and restrictions, tariffs, legal structures and tax and indigenous ownership laws;
• equipment failure, grid unavailability, planned and unplanned outages, accidents and infrastructure that lead to network failure;
• trade barriers;
• difficulties in staffing and managing operations;
• lack of well-developed legal systems, which could make it difficult for us to enforce contractual rights and intellectual property;
• inability to secure rights or access to the land necessary to execute customer orders for New Sites;
36
• security and safety of employees;
• risk of uncollectible accounts and long collection cycles;
• adverse currency fluctuations, restrictive foreign exchange regulations and illiquidity in the foreign exchange markets, such as, the significant shortage of U.S. dollar liquidity in Nigeria in 2015 and recent Naira devaluations;
• consequences of corrupt practices (or alleged corrupt practices) on the economy in general or particular industries or companies, or of ineffective or insufficient corporate governance standards and practices;
• inconsistent or unpredictable application of laws or regulations by governmental authorities, including financial regulators;
• actions, proceedings, claims and disputes brought by governments, regulators, entities or individuals for fees, taxes or other payments, even if meritless or frivolous under applicable law;
• logistical and communications challenges;
• changes in labor conditions;
• higher volatility of our ordinary share price; and
• uncertain tax regime and inconsistent income taxation.
Investors should exercise particular care in evaluating the risks involved and must decide for themselves whether, in light of those risks, their investment is appropriate. Generally, investment in securities of issuers operating in emerging and less developed markets is only suitable for sophisticated investors who fully appreciate the significance of the risks involved and investors are urged to consult their own legal and financial advisors before making an investment in our ordinary shares. Investors should also note that emerging and less developed markets such as those in which we operate are subject to rapid change and that the information set forth in this Annual Report may become outdated relatively quickly.
Moreover, financial turmoil in any emerging market or less developed market or country tends to adversely affect prices in the financial markets of such markets, as investors move their money to more stable, developed markets. As has happened in the past, financial problems or an increase in the perceived risks associated with investing in other emerging economies could dampen foreign investment in the countries in which we operate and adversely affect the economies of such countries. In addition, during such times, companies that operate in emerging and less developed markets can face severe liquidity constraints as foreign funding sources, including availability of credit or debt financing, are withdrawn. Thus, even if the economies of the countries in which we operate remain relatively stable, financial turmoil in any emerging or less developed market or country could have a material adverse effect on our business, prospects, financial condition and/or results of operations.
We may make acquisitions in or investments into emerging and other less developed markets, and investments in emerging and less developed markets are subject to greater risks than developed markets and could have a material adverse effect on our business, prospects, financial condition and results of operations.
To the extent that we acquire assets or invest in other emerging and/or less developed markets, including in Africa, the Middle East and Latin America, additional risks may be encountered that could adversely affect our business. Such markets tend to have less developed economies and infrastructure and are often more vulnerable to economic and geopolitical challenges and may experience significant fluctuations in gross domestic product, interest rates and currency exchange rates, as well as civil disturbances, government instability, nationalization and expropriation of private assets and the imposition of taxes or other charges by government authorities. In addition, the currencies in which investments are denominated may be unstable, may be subject to significant depreciation and may not be freely convertible or may be subject to the imposition of other monetary or fiscal controls and restrictions.
Emerging and less developed markets are still in relatively early stages of their development and accordingly may not be highly or efficiently regulated, or the interpretation and enforcement of such regulations may be inconsistent or uncertain within the countries or jurisdictions in which we operate. Moreover, emerging and other less developed markets tend to be shallower and less liquid than more established markets which may adversely affect our ability to realize profits from our
37
assets in these markets when we desire to do so or receive what we perceive to be their fair value in the event of a realization. In some cases, a market for realizing profits from an investment may not exist locally. In addition, companies based in emerging and other less developed markets are not generally subject to uniform accounting and financial reporting standards, practices and requirements comparable to those applicable to companies based in more developed countries, thereby potentially increasing the risk of fraud and other deceptive practices. Settlement of transactions may be subject to greater delay and administrative uncertainties than in developed markets and less complete and reliable financial and other information may be available to investors in emerging and other less developed markets than in developed markets. In addition, economic instability in such markets could adversely affect the value of our assets subject to leases in such countries, or the ability of our lessees or customers, which operate in these markets, to meet their contractual obligations. As a result, lessees or customers that operate in emerging and other less developed market countries may be more likely to default under their contractual obligations than those that operate in developed countries. Liquidity and volatility limitations in these markets may also adversely affect our ability to dispose of our assets at the best price available or in a timely manner.
As we have and may continue to invest in or acquire assets located in emerging and less developed markets throughout the world, we may be exposed to any one or a combination of these risks, which could have a material adverse effect on our business, prospects, financial condition and/or results of operations.
Failure to adequately address the significant infrastructure deficiencies in emerging and less developed markets could adversely affect their economies and growth prospects, and companies operating in emerging and less developed markets may face logistical and operational difficulties.
Decades of under-investment have resulted in significant deterioration of public infrastructure and the absence of, or persistent problems with, basic infrastructure to support and sustain growth and economic development in many emerging and less developed markets, including some of those in which we operate, or may operate. In addition to power generation, transmission and distribution deficiencies, emerging and less developed markets may also suffer from deteriorating road networks, congested ports and obsolete rail infrastructure, which have all severely constrained socioeconomic development, including restricting the movement of people and goods within those regions, thereby increasing the time it takes to mobilize workforces and deliver supplies or equipment. The power sectors of emerging and less developed markets may suffer from numerous problems, such as limited access to infrastructure, low connection rates, inadequate power generation capacity, lack of capital for investment, insufficient transmission and distribution facilities, high technical losses and vandalism. Many businesses rely on alternative electricity and water supplies, adding to overall business costs. See “— Some of the markets in which we currently, or may in the future, operate may suffer from chronic electricity shortages.”
Although significant advances have been made in the areas of telecommunications and internet facilities in recent years, the progress of development in these sectors cannot be considered at par with that in more developed economies. For example, the government has identified Nigeria’s decaying infrastructure as a major impediment to economic growth and Nigeria’s Economic Recovery and Growth Plan, or the ERGP, and various policies of the government on infrastructure and economic development include ambitious targets for infrastructure improvements and investments as part of the process of accelerating infrastructure development in the country.
Failure to significantly improve the infrastructure in such markets could adversely affect their economies and growth prospects, including their ability to meet GDP growth targets which, in turn, could have a material adverse effect on our business, prospects, financial condition and/or results of operations. The lack of reliable infrastructure also limits our ability, and that of our commercial partners, contractors, customers and suppliers, to respond quickly to unforeseen situations, which can lead to delays and production stoppages. We may also face operational and logistical challenges as a result of outbreaks of infectious diseases in the regions in which we operate. The occurrence of any of the above could have a material adverse effect on our business, prospects, financial condition and/or results of operations. Furthermore, certain areas/regions in which we operate periodically experience adverse weather conditions and natural disasters, mainly in the form of high winds, floods and erosion, which further limit the use of available infrastructure, particularly during the rainy season in such regions, when the likelihood of delays increases. See “— We are subject to the effects of climate change.” In addition, flooding in the regions in which we operate has also led to outbreaks of disease, which, coupled with the ongoing security concerns in these regions (see “— There are risks related to political instability, religious differences, ethnicity and regionalism in emerging and less developed markets”), may affect our ability to staff our operations with qualified local and overseas individuals should such individuals be deterred from relocating to these regions, as a result of health or security concerns.
38
Some of the markets in which we currently, or may in the future, operate may suffer from chronic electricity shortages.
Successfully managing telecommunications towers in many of the types of markets in which we currently, or may in the future, operate (including emerging markets) is dependent on operational competency in power management, and unreliability of grid power presents significant challenges to managing our sites, uptimes and delivering quality service to customers.
For example, despite the abundant energy resources in the country, significant government reform efforts, and investments in the power sector in recent years, lack of sufficient and reliable electricity supply remains a serious impediment to Nigeria’s economic growth and development. Insufficient power generation, aging infrastructure, weak distribution networks, overloaded transformers and acts of sabotage to pipelines and infrastructure by vandals result in frequent power outages, high transmission and distribution losses and poor voltage output. Only 55.4% of Nigeria’s total population has access to the grid electricity supply (according to World Bank data from 2019) due to insufficient generation capacity and inadequate transmission and distribution networks. In addition, Zambia experienced power outages that adversely impacted its economic growth between 2014 and 2016, in 2019 and 2020.
Similarly in South Africa, where we have signed definitive transaction documentation to acquire towers pursuant to the MTN SA Acquisition as well as agreed to provide Managed Services to approximately 7,100 sites, the national electricity grid has been under significant pressure over the last decade to meet growing demand given insufficient generation capacity due to underinvestment in new generation and maintenance of facilities. This has resulted in periodic periods of load shedding, where planned supply interruptions take place and are rotated across South Africa to reduce pressure on the electricity grid. New initiatives have been implemented by the government, including allowing the private sector to build their own power plants with up to 100 megawatts of generating capacity without requiring a license, in a bid to address the nation's failing electricity supply. Despite these initiatives and ongoing investment from the government into power generation and transmission, load shedding may continue to occur in the future, which in turn, may have a material adverse effect on our business, financial condition, results of operations, cash flows, liquidity and/or prospects.
Despite the introduction of power sector reforms and recent incremental improvements in the sector in certain markets, failure to sustain and improve on these efforts in power generation, transmission and distribution infrastructure could lead to lower GDP growth and hamper the development of economies, as well as increase the underlying costs of operating in such markets, many of which may not be recoverable. Slow growth in the economies in which we operate may also lessen consumers’ propensity to spend, which would negatively affect our customers. This, in turn, may have a material adverse effect on our business, financial condition, results of operations, cash flows, liquidity and/or prospects.
Unlike telecommunication towers businesses in developed markets, such as the United States and the European Union, where the electricity grid is comparatively extremely reliable, successfully managing telecommunications towers in many of the types of markets in which we currently, or may in the future, operate is dependent on operational competency in power management. Given the intermittent and unreliable grid availability in Nigeria, for example, grid electricity is rarely used as a source of power for our Towers, with 39% of Towers operated only with generators and 56% operated with hybrid solutions, which alternate between diesel generators and / or solar or battery systems, as of December 31, 2021. In our other African markets, where grid availability can also be unreliable, as of December 31, 2021, 12% of Towers were powered only by the grid, with the remainder having either generator or hybrid power systems. The unreliability of the grid power presents significant challenges to managing our tower sites and power uptimes and delivering quality service to customers. Any inability to continue to deliver quality service could harm our relationships with our customers, which, in turn, could have a material adverse effect on our business, prospects, financial condition and/or results of operations.
Some of the markets in which we currently, or may in the future, operate are dependent on commodities, and are therefore impacted by global prices and/or demand for such products.
The economies of some of the markets in which we operate may be highly dependent on commodities, such as oil or copper, and therefore on global prices and demand which impact these markets. Reductions in revenues from such commodities could adversely affect the economies of the markets in which we operate. For example, the Nigerian economy is highly dependent on oil production in Nigeria and global prices of oil. According to the Nigerian National Bureau of Statistics, in 2021, the oil sector represented 7.2% of total real GDP, a decrease from the 8.2% and 8.8% recorded in 2020 and 2019, respectively. Reductions in oil revenues, particularly in light of the COVID-19 pandemic and related containment measures or geopolitical tensions as seen recently, could have a material adverse effect on the economies of many of the markets in which we operate and in turn on our and our customers’ business and our results of operations. Additionally,
39
between 2014 and 2016, a fall in copper prices adversely affected Zambia’s economy, along with increased tensions with mining companies due to related tax increases.
Revenues from commodities are a function of the level of the relevant commodity’s production in the relevant country and prevailing world commodity prices and demand. Commodity prices are subject to wide fluctuations in response to relatively minor changes in the supply of, and demand for, such commodity, market uncertainty, and a variety of additional factors that are beyond the control of the relevant country. These factors include, but are not limited to, political conditions in other relevant regions, internal and political decisions of any regional or international bodies or organizations relating to such commodities, such as OPEC, and other nations producing the relevant commodity as to whether to decrease or increase production, domestic and foreign supplies of the commodity, consumer demand, such as the fall in demand resulting from the global response measures to contain the spread of COVID-19 (or any future coronavirus or other outbreaks or events with a wide-ranging regional or global impact), weather conditions, domestic and foreign government regulations, transport costs, the price and availability of alternatives and overall economic conditions.
Declines in commodity prices and/or revenues on which certain of the economies in which we operate rely have had and will continue to have an impact on such economies, and may result in lower economic growth, high rates of unemployment, reduction in foreign exchange and government revenue. For example, the Nigerian government and certain other governments, such as in oil-producing countries in the Middle East, rely heavily on oil revenue to fund their budgets, and the decline in prices since 2014 has resulted in significantly decreased revenues. A reduction in commodity prices, such as the drop in recent oil prices, would likely negatively impact export earnings in the relevant country, government revenue, and national disposable income, and lead to budgetary constraints and reduced investment in key projects such as infrastructure. Further, any foreign exchange controls imposed in the jurisdictions in which we operate, whether as a result of reduced foreign exchange revenues from such commodities or related products or otherwise, may lead to a devaluation of our revenues which are received in local currencies and also affect our ability to obtain foreign currency required for some of our operations or to service some of our foreign currency obligations. See “— Financial authorities in the markets in which we operate may intervene in the currency markets by drawing on external reserves, and their currencies are subject to volatility” and “— Shortage of U.S. dollar, euro or other hard currency liquidity in the markets in which we operate may adversely affect our ability to service our foreign currency liabilities.”
Commodity production in the relevant economies may also fluctuate significantly as a result of a decline in global prices, which may affect the economic viability of certain producing assets, and the activities of vandals (such as in the Niger Delta region of Nigeria, in relation to the oil industry) may lead to significant disruptions in the production of commodities on which such economies or businesses there rely upon. For example, the level of oil production and oil revenues in Nigeria and certain other oil producing countries in the Middle East may also be adversely affected by other factors, including changes in oil production quotas by OPEC, the response of international oil companies to changes in the regulatory framework for oil production in the relevant country or region, and theft of crude oil from pipelines and tank farms. Any long-term shift away from certain commodities (such as fossil fuels), including from developed economies seeking to develop alternative sources of energy, could adversely affect commodity prices and demand and the resulting commodity-related revenue of economies in which we operate. Damage to such economies as a result of such downturns may harm our customers and increase costs (such as fuel costs), which may have a material adverse effect on our business, prospects, financial condition and/or results of operations.
High inflation could have a material adverse effect on the economies in which we operate.
The markets in which we operate are exposed to the risk of high inflation. For example, for the years ended December 31, 2021 and 2020, Nigeria’s inflation rate stood at 17.0% and 13.2%, respectively, according to the Nigeria Bureau of Statistics. Zambia’s inflation rate increased from 10.1% for the year ended December 31, 2015, to 17.9% for the year ended December 31, 2016, before decreasing back to 6.6% for the year ended December 31, 2017, according to the International Monetary Fund, or the IMF. For the years ended December 31 2018, 2019 and 2020, Zambia’s inflation rate was 7.0%, 9.2% and 15.7%, respectively. Changes in monetary and/or fiscal policy in the countries in which we operate may result in higher rates of inflation, which could consequently increase our operating costs. There can be no assurance that inflation rates will not rise in the future. While we have contractual inflation-linked escalation provisions under most of our MLAs, there can be no guarantee that the rates of escalation of lease fees will mitigate future inflation, particularly where our MLAs may include fixed, capped or floored escalators.
Brazil has also experienced high rates of inflation, and the Brazilian government’s actions to control inflation and other policies and regulations have often involved, among other measures, increases or decreases in interest rates, changes in fiscal policies, wage and price controls, foreign exchange rate controls, blocking access to bank accounts, currency devaluations, capital controls and import and export restrictions. Inflation, policies adopted to curb inflationary pressures
40
and uncertainties regarding possible future governmental intervention have contributed to economic uncertainty and heightened volatility in the Brazilian economy.
Significant inflation and measures taken to control inflation could have a material adverse effect on the economies of the countries in which we operate and, as a result, on our business, prospects, financial condition and/or results of operations.
Shortage of U.S. dollar, euro or other hard currency liquidity in the markets in which we operate may adversely affect our ability to service our foreign currency liabilities.
There may be shortages in the availability of, or disruptions or other limitations in the supply of, foreign currencies in the countries in which we operate, whether as a result of economic reasons, monetary controls or otherwise. See also “— Some of the markets in which we currently, or may in the future, operate are dependent on commodities, and are therefore impacted by global prices and/or demand for such products” and “— Financial authorities in the markets in which we operate may intervene in the currency markets by drawing on external reserves, and their currencies are subject to volatility.” For example, there have historically been periods of significant shortage of U.S. dollar liquidity in Nigeria and the CBN imposed additional currency controls that restricted access to U.S. dollars in the official foreign exchange market. The reduced access to foreign exchange negatively impacted certain sectors of the Nigerian economy. However, since the introduction of the Investors and Exporters window in April 2017, which created a market-driven price for foreign-exchange trading in Nigeria, the foreign exchange market has generally experienced greater levels of stability albeit there can still be periods of U.S. dollar liquidity shortage from time to time. In addition, in Nigeria, we continue to access USD through various sources and at various rates (including from commercial banks and authorized dealers using the I&E window) and, in addition, at a premium to NAFEX through identified brokers. In this regard, we may suffer adverse economic consequences as a result of a divergence between the rates at which U.S. dollars are available in the market or as a result of the lack of availability or the shortage of U.S. dollars as stated above.
Should such controls and foreign currency liquidity shortages continue and/or occur in the markets in which we operate, we may face difficulties accessing foreign currency from foreign exchange markets or experience increased costs in sourcing foreign currency or otherwise which would impact our ability to obtain foreign currency required for some of our operations or to service some of our foreign currency obligations, which in turn could have a material adverse effect on our business, prospects, financial condition and/or results of operations.
Financial authorities in the markets in which we operate may intervene in the currency markets by drawing on external reserves, and their currencies are subject to volatility.
Central banking authorities in the countries in which we operate may intervene in the currency markets by drawing on external reserves (such as, most recently, in Nigeria, where a significant portion of our operations are based), or adopting policies that may impact the applicable exchange rates and/or amounts of foreign currency that may be obtained. Fluctuations in an economy’s external reserves, its high dependence on certain foreign-currency revenue streams (such as those related to commodities such as oil, or other exports) and high levels of key imports in foreign currency, could result in local currencies remaining or becoming vulnerable to external shocks.
For example, the CBN has historically favored maintaining the Naira within a narrow band with periodic adjustments. The external reserves have fluctuated in recent years, dropping significantly from a high of $42.9 billion at the end of 2012, to a low of $25.2 billion at the end of 2016, before gradually recovering. As of December 31, 2021 external reserves were recorded at $40.3 billion. Given the fluctuations in Nigeria’s external reserves, its high dependence on oil exports and the fact that Nigeria pays for its key imports, such as refined oil, in U.S. dollars, the Naira will remain vulnerable to external shocks that could lead to a sharp decline in its values, as had occurred historically.
In addition, the currencies of the countries in which we operate are subject to volatility. Our operations are conducted in Nigeria, Côte d’Ivoire, Cameroon, Zambia, Rwanda, Brazil, Colombia, Peru and Kuwait, and the functional currency of our operating subsidiaries are the Nigerian Naira (₦), West African CFA Franc (XOF), Central African CFA Franc (XAF), Zambian Kwacha (ZMW), Rwandan Franc (RWF), Brazilian Real (BRL), Colombian Peso (COP), Peruvian Sol (PEN) and Kuwaiti Dinar (KD), respectively. The operating subsidiaries’ financial results are translated into U.S. dollars for reporting purposes. Accordingly, we are subject to fluctuations in the rates of currency exchange. In particular, the Naira has depreciated significantly against the U.S. dollar, due to declining oil prices, depletion of external reserves, and the absence of fiscal buffers. In early 2015, the CBN instituted certain currency control policies and pegged the Naira at ₦197 to the U.S. dollar, which was then increased to approximately ₦305 in 2016 and then to approximately ₦435 by December 2021. Similarly, the Zambian Kwacha to U.S. dollar exchange rate increased from ZMW9.99 as of December 31, 2017 to
41
ZMW16.65 as of December 31, 2021 and the Brazilian Real to U.S. dollar exchange rate increased from BRL4.03 as of December 31, 2019 to BRL5.58 as of December 31, 2021.
Central banks or monetary authorities in economies where the local currency is subject to such pressures may take various administrative measures aimed at stabilizing the foreign exchange market, including restricting access to the official foreign exchange market or prohibiting the use of foreign currencies in domestic transactions or by other means.
The depreciation or volatility of local currencies of the countries in which we operate may negatively affect their respective economies, which in turn could have a material adverse effect on our and our customers’ business, prospects, financial condition and/or results of operations as well as our liquidity and cash flows. See “Risks Relating to Our Business — We and our customers face foreign exchange risks, which may be material.”
Failure to adequately address actual and perceived risks of corruption may adversely affect the economies of the countries in which we operate, or may operate, and their ability to attract foreign investment.
Corruption is a significant issue in many of the markets in which we operate, as in many other emerging and less developed markets. For example, Nigeria, Cameroon and Egypt placed 154, 144 and 117, respectively, out of 180 countries in Transparency International’s 2021 Corruption Perceptions Index. Despite certain reform efforts, however, corruption continues to be a serious problem impacting some of the countries in which we operate, as reflected by several high-profile convictions. Brazil has also experienced recent political instability, including various investigations into allegations of money laundering and corruption being conducted by the Office of the Brazilian Federal Prosecutor, the largest such investigation known as “Lava Jato,” which have negatively impacted the Brazilian economy and political environment. Corruption has many implications for a country, including difficulty in collecting revenue and controlling expenditure, increasing the risk of political instability, distorting decision-making processes and adversely affecting its international reputation. Failure to address these issues, continued corruption in the public sector and any future allegations of, or perceived risk of, corruption in the markets in which we operate could have adverse effects on their respective economies and may have a negative effect on the ability of these countries to attract foreign investment and, as a result, may have a material adverse effect on our and our customers’ business, prospects, financial condition and/or results of operations.
The policies and reforms of the political administrations in the countries in which we operate may result in political instability or changes in regulatory or other government policies.
Many emerging and less developed markets, including those in which we operate or may operate, face periods of political and economic uncertainty, particularly around the times leading up to elections and/or other political change, including uncertainty as to the manner in which the relevant governing authorities would seek to address the issues facing the relevant country and whether they would alter or reverse certain reforms and actions taken by predecessors or even by incumbents seeking to garner increased favor. Such issues may give rise to uncertainty in the investing community and are likely to reduce inbound investment.
Frequent and intense periods of political instability make it difficult to predict future trends in governmental policies. For example, the Arab Spring of 2010 and 2011 caused substantial political turmoil across the Middle East and North Africa, particularly in Egypt. During this period of instability in Egypt, the government temporarily dissolved the parliament, suspended the constitution and shut down the internet. Any similar shut-down in the countries in which we operate in the future will, however, negatively affect our business and results of operations. In addition, if government or regulatory policies in a market in which we operate were to change or become less business-friendly, our business could be materially adversely affected. Recent economic instability in Brazil also has contributed to a decline in market confidence in the Brazilian economy as well as to a deteriorating political environment. The Brazilian government also frequently intervenes in the Brazilian economy and occasionally makes significant changes in policy and regulations. For instance, the Brazilian government’s actions to control inflation and implement macroeconomic policies have often involved increases in interest rates, wage and price controls, currency devaluations, blocking access to bank accounts, imposing capital controls and limits on imports, among other things. We do not have any control over, and are unable to predict, which measures or policies the Brazilian government may adopt in the future.
In addition, various ongoing investigations into allegations of money laundering and corruption being conducted by the Office of the Brazilian Federal Prosecutor, including the largest such investigation, known as Lava Jato, have negatively impacted the Brazilian economy and political environment and have adversely impacted the image and reputation of those companies that have been implicated. In addition, political demonstrations in Brazil over the last few years have affected the development of the Brazilian economy and investors’ perceptions of Brazil.
42
Moreover, some planned reforms may disadvantage certain existing stakeholders, who may seek to curtail such reforms. For example, planned privatization of state-owned enterprises has in some cases been met with strikes or threats of strikes in anticipation of job losses and price increases. Any significant changes in the political climate in the countries in which we operate, including changes affecting the stability of the government or involving a rejection, reversal or significant modification of policies against nationalization or expropriation of privately owned assets, favoring the privatization of state-owned enterprises, reforms in the telecommunications, power, banking and oil and gas sectors or other reforms, may have negative effects on the economy, government revenues or foreign reserves and, as a result, could have a material adverse effect on our business, prospects, financial condition and/or results of operations.
There are risks related to political instability, religious differences, ethnicity and regionalism in emerging and less developed markets.
Our operations are exposed to the political and social environment of the emerging and less developed markets in which we operate (or may in the future operate), which have the potential for civil and political unrest, contributing to an uncertain operating environment. For example, in Nigeria, corruption, policy uncertainty and collapsing infrastructure, as well as terrorist acts by Boko Haram and increased insecurity in different parts of the country, present significant risks to business operations in parts of Nigeria. Terrorism and militant activity are a problem in parts of Nigeria, where a range of terrorist and militant groups with differing goals operate. The Boko Haram sect, a terrorist group based primarily in north-eastern Nigeria, initially became active in 2009 and increasingly received international attention for the number and frequency of attacks against the Nigerian people and villages. These attacks led to the deployment of troops to Adamawa, Borno, and Yobe states. Despite progress made in combatting the group, Boko Haram continued to mount attacks throughout 2021, particularly in the Lake Chad region. In addition to the instability caused by Boko Haram, the Niger Delta region of Nigeria continues to experience militant activity, creating a challenging environment for companies operating in that region. Cameroon has also recently faced similar issues, including with terrorism as well as increasing instances of unrest as a result of the tensions between the “Anglophone” and “Francophone” regions of Cameroon. Such instability has in the past resulted in, and may continue to result in, vandalism of our sites, obstruction or inability to access our Towers and increased security threats to our sites, as well as corresponding lost revenue or increased maintenance and security costs, as well as increased capital expenditures.
Instances of terrorist activities or other political and/or social unrest as well as general lawlessness can create a challenging environment for companies operating in the relevant regions. While such activity may be targeted within certain regions or at certain types of industry (such as oil and gas companies), the security situation in such regions can be volatile and may also have an impact on our operations, such as attacks on sites by militant or other groups in order to disrupt communications, and can generally create instability, impacting the relevant regions and economies.
Unless resolved by the government, such conflicts may adversely affect the political and economic stability of the markets in which we operate (or may in the future operate), which may, in turn, further have a material adverse effect on our business, prospects, financial condition and/or results of operations.
The taxation, customs and regulatory systems in emerging and less developed markets may be subject to changes and inconsistencies.
The government policies and regulations of emerging and less developed market economies, such as those in which we operate or may operate, on taxation, customs and excise duties and other regulatory matters may change from time to time as considered necessary for the development of the economy. In addition, taxes, customs and excise duties and other fees and fines may increasingly be viewed as major sources of revenue, particularly where other previously prominent sources of revenue (such as those derived from commodities) may have reduced. This may result in the introduction of new taxes, levies or fees where none previously existed (or were not imposed). For example, the Finance Acts of 2019 and 2020 signed into law in 2020, introduced changes to the existing tax regime maintained pursuant to the provisions of the Companies Income Tax Act, the Personal Income Tax Act, the Stamp Duties Act, the Capital Gains Tax Act, the Customs and the Excise Tariff, etc (Consolidated) Act among other related legislation in Nigeria. The Finance Act 2020 expanded the definition of significant economic presence to capture non-resident entities deriving economic benefits from Nigeria through digital services that do not require physical presence within the country. Given a potential need to generate revenue from sources other than exports, other foreign governments may take measures to enforce tax compliance, including taking interim measures for alleged tax default, or to impose fees with respect to our operations, even where not permitted by applicable law. While such measures are often successfully challenged, if they are taken in relation to us, this may have a material adverse effect on our financial condition, results of operations, cash flows, and/or liquidity. Further, the interpretation by the relevant tax or other regulatory authorities of, or decision with respect to, certain sections of tax or other laws may differ on a case-by-case basis, including potentially, against sectors or companies such as ours in the event
43
of a perceived increase in profile or growth. Changes in government policies on taxation, customs and excise duties or other regulations, as well as inconsistencies or uncertainties in the interpretation of and decisions relating to tax laws, may have a material adverse effect on our cash flows and liquidity, as well as our business, prospects, financial condition and/or results of operations, and on the tax liability of holders of our ordinary shares.
Inefficiencies and corruption in the judicial systems may create an uncertain environment for investment and business activity and affect the ability of investors to find remedies through the relevant jurisdictions’ judicial systems.
The legal systems in certain emerging and less developed markets, such as the ones in which we operate and may in the future operate, are still in their growing phase, and the laws and regulations in such jurisdictions continue to undergo development and face a number of challenges, including corruption and delays in the judicial process since most cases take a considerable period of time to be concluded. Similarly, the enforcement of judgments and/or security in such jurisdictions may be affected by inefficiencies in the judicial system and can result in uncertain positions.
As a result, effective legal redress may be difficult to obtain and there is a high degree of uncertainty due to the discretion of governmental authorities, lack of judicial or administrative guidance on interpreting applicable rules and regulations, inconsistencies or conflicts between and within various laws, regulations, decrees, orders and resolutions and relative inexperience of the judiciary and courts in commercial matters. Slow and uncertain judicial process may sometimes affect the enforceability of judgments obtained, or result in judgments or extra-judicial action that may be inconsistent with the expected or applicable legal process, rules or procedures.
Those and other factors that have an impact on the legal systems of the markets in which we operate make an investment in our ordinary shares subject to greater risks and uncertainties than an investment in a country with a more mature legal system.
Risks Relating to our Indebtedness
Our level of indebtedness and the terms of our indebtedness could materially adversely affect our business and liquidity position.
As of December 31, 2021, we had $2,609 million of total borrowings, excluding lease liabilities. We currently use debt financing and plan to continue to use debt financing for our future operations and projects. The terms of the agreements governing our indebtedness limit the circumstances in which we may incur additional indebtedness. However, our indebtedness may increase from time to time in the future for various reasons, including fluctuations in operating results, capital expenditures and potential acquisitions or joint ventures or other investments. As a result, the risks normally associated with debt financing may materially adversely affect our cash flows and liquidity as well as our business, prospects, financial position and/or operating results including because:
• our level of indebtedness may, together with the financial and other restrictive covenants in the agreements governing our indebtedness, significantly limit or impair our ability in the future to obtain financing, refinance any of our indebtedness, sell assets or raise capital on commercially reasonable terms or at all, which could cause us to default on our obligations and materially impair our liquidity;
• a downgrade in our credit rating could restrict or impede our ability to access the capital markets at attractive rates and increase our borrowing costs;
• our level of indebtedness may increase the difficulty for us to repay our debt, including our ability to pay interest when due and/or the principal amounts due under such indebtedness;
• our level of indebtedness may reduce our flexibility to respond to changing business and economic conditions or to take advantage of business opportunities that may arise;
• a portion of our cash flow from operations must be dedicated to interest payments on our indebtedness and is not available for other purposes, which amount would increase if prevailing interest rates rise;
• our level of indebtedness may place us at a competitive disadvantage relative to competitors that have lower leverage or greater financial resources than we have and restrict us from pursuing our strategy (including acquisitions) or exploiting certain business opportunities; and
44
• our level of indebtedness could make us more vulnerable to downturns in general economic or industry conditions or in our business.
In addition, market conditions and monetary restrictions may lead to foreign currency liquidity shortages and we may face difficulties in obtaining sufficient quantities of the relevant foreign currency when required to meet our contractual and indebtedness obligations denominated in U.S. dollars or other foreign currencies. See “— Risks Relating to the Markets in which We Operate — Financial authorities in the markets in which we operate may intervene in the currency markets, and their currencies are subject to volatility” and “— Risks Relating to the Markets in which We Operate — Shortage of U.S. dollar, euro or other hard currency liquidity in the markets in which we operate may adversely affect our ability to service our foreign currency liabilities.” Such shortages or lack of availability could increase our borrowing costs and interest expenses, which could have a material adverse effect on our business, prospects, financial condition and/or results of operations as well as cash flows and liquidity. Such issues or increases could also have a material adverse effect on our cash flows and our ability to service our debt or meet interest payments in the longer term. Shortages in the availability of foreign currency may restrict our ability to satisfy our foreign currency-denominated obligations. Although we may seek to enter into agreements to reduce our risk related to access to foreign currencies and applicable exchange rates, we are under no obligation to do so and we cannot assure you that such arrangements would ensure our access to foreign currencies which we need on commercially acceptable terms or at all, or that we will be able to enter into such arrangements on commercially acceptable terms or at all. See Item 5.B. “Liquidity and Capital Resources.”
We are a holding company and conduct limited operations of our own. Repayment of indebtedness, including under the Restated IHS Holding Revolving Credit Facility, the IHS Holding Bridge Facility and the Notes, is dependent on the ability of our operating companies to make cash available to us. See “— IHS Holding Limited is a holding company with no operations of its own and, as such, it depends on its subsidiaries for cash to fund its operations and expenses, including future dividend payments, if any.”
In addition, our ability to draw funds from our existing and future local facilities may be materially adversely affected by the relatively high or increasing levels of non-performing loans in the relevant local banking sector. Local banks with a lack of geographic diversification or that have substantial exposure to certain industries which are not performing as well, may see the overall quality of their loan portfolio deteriorate or their provisioning costs increase, which may also impact their net interest income and margins. Any regional or local economic downturn that affects the local banking sector may in turn impact our ability to draw funds from any current and future undrawn facilities and could have a material adverse effect on our business, prospects, financial condition and/or results of operations.
Prevailing interest rates or other factors at the time of refinancing, including the possible reluctance of creditors to make commercial loans, as a result of extreme market and economic conditions such as those caused by the COVID-19 pandemic or otherwise, or to invest in operations in developing markets, could also result in higher interest rates, and the increased interest expense could, in the longer term, have a materially adverse effect on our ability to service our debt and to complete our capital expenditure plans, and our financial condition and results of operations could deteriorate as a result.
We are subject to restrictive debt covenants and our failure to comply with these covenants, including as a result of events beyond our control, could result in an event of default that could have a material adverse effect on our financial condition and/or results of operations.
We are party to a credit agreement that governs the IHS Holding Revolving Credit Facility, an indenture that governs the 2027 Notes issued by IHS Netherlands Holdco B.V., an indenture that governs the IHS Holding Limited Notes issued by IHS Holding Limited, a bridge facility agreement that governs the IHS Holding Bridge Facility and credit agreements governing our facilities at our operating subsidiaries, each as further described under Item 5.B. “Liquidity and Capital Resources — Indebtedness,” and may provide guarantees under credit agreements governing our facilities at our operating subsidiaries, and therefore are subject to the restrictive covenants under those agreements. A breach of any of those covenants, ratios, tests or restrictions, including as a result of events beyond our control, could result in an event of default (which may also trigger cross-default or cross-acceleration clauses in other agreements or financings) that could have a material adverse effect on our financial condition and/or results of operations. The instruments governing our indebtedness contain a number of restrictive covenants, including restrictions on our ability to, among other things:
• incur or guarantee additional debt or issue preferred stock;
• pay dividends on, redeem or repurchase share capital, or make other distributions;
• purchase equity interests or reimburse or prepay subordinated debt prior to maturity;
45
• create or incur liens;
• make certain investments;
• agree to limitations on the ability of our subsidiaries to make distributions;
• engage in sales of assets and subsidiary stock;
• enter into transactions with affiliates;
• guarantee other debt; and
• transfer all or substantially all of our assets or enter into merger or consolidation transactions.
The restrictions contained in our debt instruments could affect our ability to operate our business and may limit our ability to react to market conditions or take advantage of potential business opportunities as they arise. For example, these restrictions could have a material adverse effect on our ability to finance our operations, make strategic acquisitions, investments or alliances, restructure our organization or finance our capital needs. Additionally, our ability to comply with these covenants and restrictions may be affected by events beyond our control. Should market conditions deteriorate or fail to improve, or our operating results decrease in the future, then we may have to request amendments and/or waivers to the covenants and restrictions to which we are subject.
There can be no assurance that we will be able to obtain such relief should it be needed in the future. A breach of any of these covenants or restrictions could result in a default and acceleration that would permit our creditors to declare all amounts incurred to be due and payable, together with accrued and unpaid interest, and the commitments of the relevant creditors to make further extensions of credit could be terminated. Such actions may also trigger cross-default or cross-acceleration provisions in other facilities or agreements, which could multiply and extend the impact of any particular event or series of events across our Group.
If we breach certain of our debt covenants, creditors could declare a default and/or require us to pay the then outstanding debt immediately, and, in the case of any secured debt, creditors could sell the property securing such debt if we are unable to pay the outstanding debt immediately. If an event of default is called or if we default on the payments required by our existing indebtedness, we could trigger cross-default or cross-acceleration provisions under other debt agreements or instruments that could make such indebtedness payable on demand, and we may not have sufficient funds to repay all of our debts. The breach of covenants and the exercise by the relevant creditors of their rights under the various financing agreements could have a material adverse effect on our business, prospects, financial condition and/or results of operations.
We are exposed to interest rate risks as certain of our borrowings bear interest at floating rates that could rise significantly, increasing our interest cost and reducing cash flow.
Advances under certain of our existing credit facilities would bear interest at rates which vary depending on certain underlying or reference rates, such as the London Interbank Offered Rate, or LIBOR, the European interbank offered rate, or EURIBOR, the Nigerian Interbank Offered Rate, or NIBOR or the Brazilian interbank deposit rate, or CDI. Increases in such reference rates increase our interest expense, which could have a material adverse effect on our business, prospects, financial condition and/or results of operations. Such increases in interest rates could also have a material adverse effect on our cash flows and our ability to service our debt in the longer term. In addition, we may procure additional indebtedness at floating rates in the future.
Certain of our indebtedness bears interest at variable interest rates, primarily based on the LIBOR, which is subject to regulatory guidance and/or reform that could cause interest rates under our current or future debt agreements to perform differently than in the past or cause other unanticipated consequences. Some tenors of LIBOR were discontinued on December 31, 2021 and the remaining tenors are expected to be discontinued on or after June 30, 2023. The Secured Overnight Financing Rate (“SOFR”) has been proposed as an alternative to LIBOR and is a new index calculated by short-term repurchase agreements and is backed by U.S. Treasury securities. The market transition away from LIBOR towards SOFR is expected to be complicated, and there is no guarantee that SOFR will become a widely accepted benchmark in place of LIBOR. Some of our credit agreements may not contain fulsome or fulsome enough fallback language for circumstances in which LIBOR ceases to be published. The transition process may involve, among other things, increased volatility and illiquidity in markets for instruments that currently rely on LIBOR and may result in increased borrowing costs, uncertainty under our financing facilities, or difficult and costly processes to amend our
46
financing agreements. There remains uncertainty regarding the future utilization of LIBOR and the nature of any replacement rate, and we are uncertain what impact a transition away from LIBOR may have on our business, financial results, and operations. The potential effect of any such event is uncertain, but were it to occur, our cost of capital, financial results, cash flows and/or results of operations could be materially adversely affected.
The applicable interest rates could rise significantly in the future, thereby increasing our interest expenses associated with these obligations, reducing cash flow available for capital expenditures and hindering our ability to make payments on our indebtedness. Although we may hedge the interest rates with respect to certain of our existing credit facilities, we are under no obligation to do so under the documents governing our indebtedness and we may not be able to obtain such hedges, or replace such hedges on terms that are acceptable to us, and any such hedge may not be fully effective, which would expose us to interest rate risk.
We may not be able to generate sufficient cash to service all of our indebtedness and may be forced to take other actions to satisfy our obligations under our indebtedness, which may not be successful.
Our ability to make scheduled payments on or to refinance our debt obligations and to fund planned capital expenditures and working capital requirements depends on our future performance and ability to generate cash, which is subject, among other things, to the success of our business strategy, prevailing economic conditions and financial, competitive, legislative, legal, regulatory and other factors, including the COVID-19 pandemic and those other factors discussed in these “Risk Factors,” many of which are beyond our control.
We can make no assurances that we will be able to generate a level of cash flow from operating activities sufficient to permit us to pay the principal, premium, if any, and interest on our indebtedness or that future borrowings will be available to us in an amount sufficient to enable us to service our other indebtedness or to fund our other liquidity needs. If we default on the payments required by any indebtedness, that indebtedness, together with debt incurred pursuant to debt agreements or instruments that contain cross-default or cross-acceleration provisions may become payable on demand, and we may not have sufficient funds to repay all of our debts.
Furthermore, if our cash flows and capital resources are insufficient to service our debt obligations, we may be forced to reduce or delay investments and capital expenditures or to sell assets, seek additional capital or restructure or refinance our indebtedness, any of which will depend on our cash needs, our financial condition at such time, the then prevailing market conditions and the terms of our then existing debt instruments, which may restrict us from adopting some of these alternatives. Any failure to make payments of interest and principal on our outstanding indebtedness on a timely basis would likely result in a reduction of our credit rating, which could also harm our ability to incur additional indebtedness. In addition, any refinancing of our debt could be at higher interest rates and may require us to comply with more onerous covenants, which could further restrict our business operations, and there can be no assurances that any assets which we could be required to dispose of could be sold or that, if sold, the timing of the sales and the amount of proceeds realized from those sales could be on acceptable terms.
Risks Relating to Ownership of our Ordinary Shares
We are a foreign private issuer and, as a result, we are not subject to U.S. proxy rules and are not subject to Exchange Act reporting obligations that, to some extent, are more lenient and less frequent than those of a U.S. domestic public company.
We report under the Exchange Act as a non-U.S. company with foreign private issuer status. Because we qualify as a foreign private issuer under the Exchange Act, we are exempt from certain provisions of the Exchange Act that are applicable to U.S. domestic public companies, including (i) the sections of the Exchange Act regulating the solicitation of proxies, consents or authorizations in respect of a security registered under the Exchange Act, (ii) the sections of the Exchange Act requiring insiders to file public reports of their share ownership and trading activities and liability for insiders who profit from trades made in a short period of time and (iii) the rules under the Exchange Act requiring the filing with the SEC of current reports on Form 8-K and quarterly reports on Form 10-Q containing unaudited financial and other specified information, although we provide and intend to continue to provide comparable quarterly information on Form 6-K. In addition, foreign private issuers are not required to file their annual report on Form 20-F until 120 days after the end of each fiscal year, while U.S. domestic issuers that are accelerated filers are required to file their annual report on Form 10-K within 75 days after the end of each fiscal year and U.S. domestic issuers that are large accelerated filers are required to file their annual report on Form 10-K within 60 days after the end of each fiscal year. Foreign private issuers are also exempt from
47
Regulation FD, which is intended to prevent issuers from making selective disclosures of material information. As a result of all of the above, you may not have the same protections afforded to shareholders of a company that is not a foreign private issuer.
We may lose our foreign private issuer status in the future, which could result in significant additional costs and expenses.
As discussed above, we are a foreign private issuer, and therefore, we are not required to comply with all of the periodic disclosure and current reporting requirements of the Exchange Act. The determination of foreign private issuer status is made annually on the last business day of an issuer’s most recently completed second fiscal quarter, and, accordingly, the next determination will be made with respect to us on June 30, 2022. In the future, we would lose our foreign private issuer status if (i) more than 50% of our outstanding voting securities are owned by U.S. residents and (ii) a majority of our directors or executive officers are U.S. citizens or residents, or we fail to meet additional requirements necessary to avoid loss of foreign private issuer status. If we lose our foreign private issuer status, we will be required to file with the SEC periodic reports and registration statements on U.S. domestic issuer forms, which are more detailed and extensive than the forms available to a foreign private issuer. We will also have to mandatorily comply with U.S. federal proxy requirements, and our officers, directors and principal shareholders will become subject to the short-swing profit disclosure and recovery provisions of Section 16 of the Exchange Act. In addition, we will lose our ability to rely upon exemptions from certain corporate governance requirements under the listing rules of the New York Stock Exchange (“NYSE”). As a U.S. listed public company that is not a foreign private issuer, we will incur significant additional legal, accounting and other expenses that we will not incur as a foreign private issuer, and accounting, reporting and other expenses in order to maintain a listing on a U.S. securities exchange. These expenses will relate to, among other things, the obligation to present our financial information in accordance with U.S. GAAP in the future.
As we are a “foreign private issuer” and intend to follow certain home country corporate governance practices, our shareholders may not have the same protections afforded to shareholders of companies that are subject to all NYSE corporate governance requirements.
As a foreign private issuer, we have the option to follow certain home country corporate governance practices rather than those of the NYSE, provided that we disclose the requirements we are not following and describe the home country practices we are following. We intend to rely on this “foreign private issuer exemption” with respect to the NYSE rules for shareholder meeting quorums and record dates and the NYSE rules requiring shareholders to approve equity compensation plans and material revisions thereto, neither of which is required under the Cayman Islands law. We may in the future elect to follow home country practices with regard to other matters, including the requirement that listed companies have a majority of independent directors unless the company is a “controlled company” and the requirement that listed companies have a compensation and nominating and corporate governance committee comprised entirely of independent directors. As a result, our shareholders may not have the same protections afforded to shareholders of companies that are subject to all NYSE corporate governance requirements.
We cannot assure you that a market for our ordinary shares will be sustained to provide adequate liquidity, and public trading markets may experience volatility. Investors may not be able to resell their ordinary shares at or above the price they pay.
We cannot assure you that an active trading market for our ordinary shares will be sustained. If a market is not sustained, it may be difficult for you to sell your ordinary shares. Public trading markets may also experience volatility and disruption. This may affect the pricing of the ordinary shares in the secondary market, the transparency and availability of trading prices, the liquidity of the ordinary shares and the extent of regulation applicable to us. We cannot predict the prices at which our ordinary shares will trade. It is possible that, in future quarters, our operating results may be below the expectations of securities analysts and investors. As a result of these and other factors, the price of our ordinary shares may decline, possibly materially.
Our operating results and ordinary share price may be volatile, and the market price of our ordinary shares may drop below the price you pay.
Our quarterly operating results are likely to fluctuate in the future in response to numerous factors, many of which are beyond our control, including each of the factors set forth above.
In addition, securities markets worldwide have experienced, and are likely to continue to experience, significant price and volume fluctuations. This market volatility, as well as general economic, market or political conditions, could subject the
48
market price of our ordinary shares to wide price fluctuations regardless of our operating performance. Our operating results and the trading price of our ordinary shares may fluctuate in response to various factors, including the risks described above.
These and other factors, many of which are beyond our control, may cause our operating results and the market price and demand for our ordinary shares to fluctuate substantially.
Fluctuations in our quarterly operating results could limit or prevent investors from readily selling their ordinary shares and may otherwise negatively affect the market price and liquidity of ordinary shares. In addition, in the past, when the market price of a stock has been volatile, holders of that stock have sometimes instituted securities class action litigation against the company that issued the shares. If any of our shareholders brought a lawsuit against us, we could incur substantial costs defending the lawsuit. Such a lawsuit could also divert the time and attention of our management from our business, which could significantly harm our profitability and reputation.
A significant portion of our total issued and outstanding ordinary shares are eligible to be sold into the market, which could cause the market price of our ordinary shares to drop significantly, even if our business is doing well.
Sales of a substantial number of our ordinary shares in the public market, or the perception in the market that the holders of a large number of ordinary shares intend to sell, could reduce the market price of our ordinary shares. As of December 31, 2021, we had 327,820,418 ordinary shares outstanding. All of our ordinary shares are freely tradable without restriction under the Securities Act, except as described in the next paragraph with respect to the lock-up arrangements and for any of our ordinary shares that may be held or acquired by our directors, executive officers and other affiliates, as that term is defined in the Securities Act, which will be restricted securities under the Securities Act. Restricted securities may not be sold in the public market unless the sale is registered under the Securities Act or an exemption from registration is available.
We, our executive officers, directors and existing holders of substantially all of our existing ordinary shares have agreed with the underwriters of our initial public offering, subject to certain exceptions, not to dispose of or hedge any of our ordinary shares or securities convertible into or exchangeable for shares of ordinary shares during the period from the date of the final prospectus, dated October 13, 2021, filed with the Securities and Exchange Commission (“SEC”) in accordance with Rule 424(b) of the Securities Act on October 15, 2021 (the “Prospectus”) continuing through the date 180 days after the date of the Prospectus, except with the prior written consent of the representatives. Such ordinary shares will, however, be able to be resold after the expiration of the lock-up period, as well as pursuant to customary exceptions thereto or upon the waiver of the lock-up arrangements.
In addition, our Shareholders’ Agreement also sets out certain restrictions on our shareholders’ ability to sell or otherwise transfer their respective shares. See Item 7.B. “Related Party Transactions — Shareholders’ Agreement.”
We also entered into a registration rights agreement, pursuant to which we agreed under certain circumstances to file a registration statement to register the resale of the ordinary shares held by certain of our existing shareholders who combined hold 94.5% of our ordinary shares, as well as to cooperate in certain public offerings of such ordinary shares and to reimburse such shareholders for certain expenses incurred in connection therewith. See Item 7.B. “Related Party Transactions — Registration Rights Agreement.”
In the future, we may also issue additional securities if we need to raise capital or make acquisitions, which could constitute a material portion of our then-issued and outstanding ordinary shares and would result in the dilution of our existing shareholders, which could have a material adverse effect on our business, prospects, financial condition and/or results of operation.
We continue to incur increased costs and have additional obligations as a result of operating as a public company, and our management is required to devote substantially more time to new compliance initiatives and corporate governance practices.
As a public company, we continue to incur significantly more legal, accounting and other expenses than we did as a private company, and have additional obligations such as regulatory financial reporting requirements. The Sarbanes-Oxley Act, the Dodd-Frank Wall Street Reform and Consumer Protection Act, the listing requirements of the NYSE and other applicable securities rules and regulations impose various requirements on public companies, including establishment and maintenance of effective disclosure and financial controls and corporate governance practices. Our management and other personnel need to devote a substantial amount of time to these compliance initiatives. Moreover, these rules and regulations continue to increase our legal and financial compliance costs and will make some activities more time-consuming and
49
costly. For example, these rules and regulations may make it more difficult and more expensive for us to obtain director and officer liability insurance, and could also make it more difficult for us to attract and retain qualified members of our board of directors. We may also face challenges in complying with our increased obligations in the required or expected timeframes.
We continue to evaluate these rules and regulations, and cannot predict or estimate the amount of additional costs we may incur or the timing of such costs. These rules and regulations are often subject to varying interpretations, in many cases due to their lack of specificity, and, as a result, their application in practice may evolve over time as new guidance is provided by regulatory and governing bodies. This could result in continuing uncertainty regarding compliance matters and higher costs necessitated by ongoing revisions to disclosure and governance practices.
We are required to comply with the SEC’s rules implementing Sections 302 and 404 of the Sarbanes-Oxley Act (as it relates to Section 404, beginning with our annual report on Form 20-F for the year ending December 31, 2022), which requires (or will require) management to certify financial and other information in our annual reports and provide an annual management report on the effectiveness of internal control over financial reporting. To achieve compliance with Section 404 within the prescribed period, we are engaged in a process to document and evaluate our internal control over financial reporting, which is both costly and challenging. In this regard, we will need to continue to dedicate internal resources, engage outside consultants and adopt a detailed work plan to assess and document the adequacy of internal control over financial reporting, continue steps to improve control processes as appropriate, validate through testing that controls are functioning as documented and implement a continuous reporting and improvement process for internal control over financial reporting. We currently have limited accounting personnel with specific Sarbanes-Oxley experience so we have begun the process of strengthening in that area. Despite our efforts, there is a risk that we will not be able to conclude, within the prescribed timeframe or at all, that our internal control over financial reporting is effective as required by Section 404. If we continue to identify one or more material weaknesses, it could result in an adverse reaction in the financial markets due to a loss of confidence in the reliability of our financial statements. As a result, the market price of our ordinary shares could be negatively affected, and we could become subject to investigations by the stock exchange on which our securities are listed, the SEC or other regulatory authorities, which could require additional financial and management resources.
Management has identified material weaknesses in our internal control over financial reporting, which could affect our ability to produce accurate financial statements on a timely basis.
We are required to comply with the SEC’s rules implementing Sections 302 and 404 of the Sarbanes-Oxley Act (as it relates to Section 404, beginning with our annual report on Form 20-F for the year ending December 31, 2022), which requires (or will require) management to certify financial and other information in our annual reports and provide an annual management report on the effectiveness of internal control over financial reporting.
In connection with the audits of our historic consolidated financial statements, we identified three material weaknesses in our internal control over financial reporting (see Item 15. Controls and Procedures). Under PCAOB standards, a “material weakness” is a deficiency, or a combination of deficiencies, in internal control over financial reporting, such that there is a reasonable possibility that a material misstatement of our annual or interim consolidated financial statements will not be prevented or detected on a timely basis.
We have been working to remediate these material weaknesses as quickly and efficiently as possible (see Item 15. Controls and Procedures) However, we cannot assure you that the measures we have taken to date or that we are taking will be sufficient to remediate in their entirety the material weaknesses we identified or avoid the identification of additional material weaknesses in the future. We cannot provide an estimate of the time required or costs expected to be incurred in connection with implementing a remediation plan. Remediation measures may be time consuming, costly, and might place significant demands on our financial and operational resources. If we are unable to successfully remediate these material weaknesses or if we identify additional material weaknesses, and if we are unable to produce accurate and timely financial statements, our financial statements could contain material misstatements that, when discovered in the future, could cause us to fail to meet our future reporting obligations.
Beginning with our annual report on Form 20-F for the year ending December 31, 2022, we will be required to make a formal assessment of the effectiveness of our internal control over financial reporting. Even after an assessment that our internal control over financial reporting is effective, we cannot guarantee that our internal control over financial reporting will prevent all possible errors and all fraud. A control system, no matter how well designed and operated, can provide only reasonable, not absolute, assurance that the control system’s objectives will be met. Because of the inherent limitations in all control systems, no evaluation of controls can provide absolute assurance that misstatements due to error or fraud will not occur or that all control issues and instances of fraud will be detected.
50
We are subject to the independent registered public accounting firm reporting requirements of the Exchange Act and the Sarbanes-Oxley Act. The Sarbanes-Oxley Act requires, among other things, that we maintain effective disclosure controls and procedures and internal control over financial reporting. If we are not able to establish and maintain an effective system of internal controls and otherwise implement the requirements of Section 404 in a timely manner or with adequate compliance, our independent registered public accounting firm may issue an adverse opinion with respect to internal control over financial reporting and we may be subject to sanctions or investigation by regulatory authorities, such as the SEC or the NYSE on which our ordinary shares are listed. As a result of misstatements or restatements in our financial statements or adverse assessment by management or our independent registered public accounting firm about the effectiveness of our internal controls, there could be an adverse reaction to the financial statements or the Company due to a loss of confidence in the reliability of our financial statements which could materially adversely affect our business, prospects, financial condition and/or results of operations, and could also cause the price or trading volume of our ordinary shares to decline and there could be a delay in delivering financial statements, which may result in a default under agreements governing our indebtedness.
Inaccurate assumptions in respect of critical accounting judgments could materially adversely affect financial results.
In the course of preparing financial statements our management necessarily makes judgments and estimates that can have a significant impact on our financial statements. The most critical of these relate to impairment of assets, share-based payment obligations, fair value of embedded derivatives and options, contingent liabilities and certain regulatory accruals. The use of inaccurate assumptions in calculations for any of these estimates could have a material adverse effect on our business, prospects, financial condition and/or results of operations.
Because we have no current plans to pay regular cash dividends on our ordinary shares, you may not receive any return on investment unless you sell your ordinary shares for a price greater than that which you paid for it.
We do not currently anticipate paying any regular cash dividends on our ordinary shares. Any decision to declare and pay dividends in the future will be made at the discretion of our board of directors and will depend on, among other things, our results of operations, financial condition, cash requirements, contractual restrictions and other factors that our board of directors may deem relevant. In addition, our ability to pay dividends is, and may be, limited by covenants of existing and any future outstanding indebtedness we or our subsidiaries incur. Therefore, any return on investment in our ordinary shares is solely dependent upon the appreciation of the price of our ordinary shares on the open market, which may not occur, which could, in turn, have a material adverse effect on our business, prospects, financial condition and/or results of operations. See Item 8.A. “Financial Information—Consolidated Statements and Other Financial Information—Dividend Policy” for more detail.
Our shareholders may face difficulties in protecting their interests because we are a Cayman Islands exempted company.
Our corporate affairs are governed by our amended and restated memorandum and articles of association (our “Articles”), the Companies Act and the common law of the Cayman Islands. The rights of shareholders to take legal action against our directors and us, actions by minority shareholders and the fiduciary responsibilities of our directors to us under Cayman Islands law are to a large extent governed by the common law of the Cayman Islands. The common law of the Cayman Islands is derived in part from judicial precedent in the Cayman Islands as well as from English common law, which has persuasive, but not binding, authority on a court in the Cayman Islands. The rights of our shareholders and the fiduciary responsibilities of our directors under the laws of the Cayman Islands are not as clearly defined as under statutes or judicial precedent in existence in jurisdictions in the United States. Therefore, you may have more difficulty protecting your interests than would shareholders of a corporation incorporated in a jurisdiction in the United States, due to the comparatively less well developed Cayman Islands law in this area.
A merger or consolidation may proceed under Cayman Islands law in one of two ways: by a court-sanctioned scheme of arrangement or by a statutory merger. While Cayman Islands law allows a shareholder objecting to a court sanctioned scheme of arrangement to express a view that such scheme of arrangement would not provide fair value for the shareholder’s shares, Cayman Islands statutory and common law in respect of schemes of arrangement does not specifically provide for shareholder appraisal rights in connection with a merger or consolidation effected by a scheme of arrangement of a company that has otherwise received the prescribed shareholder approval. This may make it more difficult for you to assess the value of any consideration you may receive in a merger or consolidation effected by a scheme of arrangement or to require that the acquirer gives you additional consideration if you believe the consideration offered is insufficient. However, in the event of a merger or consolidation under the statutory merger regime, Cayman Islands law
51
does provide a mechanism for a dissenting shareholder to require us to apply to the Grand Court for a determination of the fair value of the dissenter’s shares if it is not possible for the company and the dissenter to agree on a fair price within the time limits prescribed.
Shareholders of Cayman Islands exempted companies such as ours, have no general rights under Cayman Islands law to inspect corporate records and accounts or to obtain copies of lists of shareholders. Our directors have discretion under our Articles to determine whether or not, and under what conditions, our corporate records may be inspected by our shareholders, but are not obliged to make them available to our shareholders. This may make it more difficult for you to obtain information needed to establish any facts necessary for a shareholder motion or to solicit proxies from other shareholders in connection with a proxy contest.
It should be noted that the Cayman Islands law has no legislation specifically dedicated to the rights of investors in securities, and thus no statutorily defined private causes of action to investors in securities such as those found under the Securities Act or the Exchange Act in the United States. Subject to limited exceptions, under Cayman Islands law, a shareholder may not bring a derivative action against the board of directors. Class actions are not recognized in the Cayman Islands, but groups of shareholders with identical interests may bring representative proceedings, which are similar.
As a result of all of the above, our public shareholders may have more difficulty in protecting their interests in the face of actions taken by our management or members of the board of directors than they would as public shareholders of a company incorporated in the United States.
Our Articles provide, unless we consent in writing to the selection of an alternative forum, the federal courts of the United States shall have exclusive jurisdiction to hear, settle and/or determine any dispute, controversy or claim arising under the provisions of the Securities Act or the Exchange Act, which could increase a shareholder’s cost and limit such shareholder’s ability to bring a claim in a judicial forum that it finds favorable for disputes with us or our directors, officers or other employees, which may discourage lawsuits against us and our directors, officers and other employees.
Our Articles provide unless we consent in writing to the selection of an alternative forum (a) the federal courts of the United States shall have exclusive jurisdiction to hear, settle and/or determine any dispute, controversy or claim arising under the provisions of the Securities Act or the Exchange Act, which are referred to as the U.S. Actions; and (b) save for such U.S. Actions, the courts of the Cayman Islands shall have exclusive jurisdiction over any claim or dispute arising out of or in connection with the Articles or otherwise related in any way to each member’s shareholding in us, including but not limited to (i) any derivative action or proceeding brought on behalf of us; (ii) any action asserting a claim of breach of a fiduciary duty owed by any of our directors, officers or other employees to us (iii) any action asserting a claim arising pursuant to any provision of the Companies Act of the Cayman Islands or the Articles; or (iv) any action asserting a claim against us concerning our internal affairs.
This choice of forum provision may increase a shareholder’s cost and limit the shareholder’s ability to bring a claim in a judicial forum that it finds favorable for disputes with us or our directors, officers or other employees, which may discourage lawsuits against us and our directors, officers and other employees. Any person or entity purchasing or otherwise acquiring any of our shares or other securities, whether by transfer, sale, operation of law or otherwise, shall be deemed to have notice of and have irrevocably agreed and consented to these provisions. The enforceability of similar choice of forum provisions in other companies’ charter documents has been challenged in legal proceedings. It is possible that a court could find this type of provision to be inapplicable or unenforceable, and if a court were to find this provision in our Articles to be inapplicable or unenforceable in an action, we may incur additional costs associated with resolving the dispute in other jurisdictions, which could have a material adverse effect on our financial condition and/or results of operations.
Anti-takeover provisions in our organizational documents and Cayman Islands law may discourage or prevent a change of control, even if an acquisition would be beneficial to our shareholders, which could depress the price of our ordinary shares and prevent attempts by our shareholders to replace or remove our current management.
Our Articles contain provisions that may discourage unsolicited takeover proposals that shareholders may consider to be in their best interests. Our board of directors has the ability to designate the terms of and issue preferred shares without shareholder approval. In addition, Board vacancies may be filled by an affirmative vote of the remaining Board members. The directors are divided into three classes designated as Class I, Class II and Class III, respectively, and directors will generally be elected to serve staggered three year terms. The term of the Class I Directors shall expire at the third annual general meeting of the Company. The term of office of the Class II Directors shall expire at the fourth annual general meeting of the Company. The term of office of the Class III Directors shall expire at the fifth annual general meeting of the Company.
52
A Director whose term has expired may be reappointed in accordance with the terms of the Articles. These provisions may make it more difficult to remove directors.
Our Articles contain a prohibition on business combinations with any “interested” shareholder for a period of three years after such person becomes an interested shareholder unless (1) there is advance approval of our Board, (2) the interested shareholder owns at least 85% of our voting shares at the time the business combination commences or (3) the combination is approved by shareholders holding at least two-thirds of the votes attaching to the ordinary shares that are not held by the interested shareholder.
Taken together, these provisions may discourage transactions that otherwise could involve payment of a premium over prevailing market prices for our ordinary shares.
There may be difficulties in enforcing foreign judgments against our management or us.
Certain of our directors and management and certain of the other parties named in this Annual Report reside outside the United States. Most of our assets and such persons’ assets are located outside the United States. As a result, it may be difficult or impossible for investors to effect service of process upon us within the United States or other jurisdictions, including judgments predicated upon the civil liability provisions of the federal securities laws of the United States.
In particular, investors should be aware that there is uncertainty as to whether the courts of the Cayman Islands or any other applicable jurisdictions would recognize and enforce judgments of U.S. courts obtained against us or our directors or management predicated upon the civil liability provisions of the securities laws of the United States or any state in the United States or entertain original actions brought in the Cayman Islands or any other applicable jurisdictions courts against us or our directors or officers predicated upon the securities laws of the United States or any state in the United States.
IHS Holding Limited is a holding company with no operations of its own and, as such, it depends on its subsidiaries for cash to fund its operations and expenses, including future dividend payments, if any.
As a holding company, our principal source of cash flow is distributions or payments from our operating subsidiaries. Therefore, our ability to fund and conduct our business, service our debt and pay dividends, if any, in the future depends on the ability of our subsidiaries and intermediate holding companies to make upstream cash distributions or payments to us, which may be impacted, for example, by their ability to generate sufficient cash flow or limitations on the ability to repatriate funds whether as a result of currency liquidity restrictions, monetary or exchange controls or otherwise. Our operating subsidiaries and intermediate holding companies are separate legal entities, and although they are directly or indirectly wholly owned and/or controlled by us, they have no obligation to make any funds available to us, whether in the form of loans, dividends or otherwise. The ability of our operating subsidiaries and intermediate holding companies to distribute cash to us will also be subject to, among other things, restrictions that may be contained in the agreements governing our indebtedness as entered into from time to time, including the IHS Holding Revolving Credit Facility and the Notes, and the facilities of our operating subsidiaries, availability of sufficient funds in such subsidiaries and applicable laws, taxes and regulatory restrictions, including monetary or fiscal controls and restrictions. Claims of any creditors of any of our subsidiaries generally will have priority as to the assets of such subsidiaries over our claims and claims of our creditors and shareholders. To the extent the ability of any of our subsidiaries to distribute dividends or other payments to us is limited in any way, our ability to fund and conduct our business, service our debt and pay dividends, if any, could be harmed.
If securities or industry analysts do not publish or cease publishing research or reports about us, our business or our market, or if they change their recommendations regarding our ordinary shares adversely, the price and trading volume of our ordinary shares could decline.
The trading market for our ordinary shares is influenced by the research and reports that industry or securities analysts publish about us, our business, our market or our competitors. If any of the analysts who cover us or may cover us in the future change their recommendation regarding our ordinary shares adversely, or provide more favorable relative recommendations about our competitors, the price of our ordinary shares would likely decline. If any analyst who covers us or may cover us in the future were to cease coverage of our company or fail to regularly publish reports on us, we could lose visibility in the financial markets, which in turn could cause the price or trading volume of our ordinary shares to decline.
53
Item 4. Information on the Company.
A. History and Development of the Company
IHS Holding Limited was incorporated in the Republic of Mauritius as a private company limited by shares on July 26, 2012 under the Mauritian Companies Act 2001. On October 13, 2021, IHS Holding Limited ceased to be incorporated in the Republic of Mauritius and was incorporated and registered by way of continuation as an exempted company with limited liability under the Companies Act (as amended) of the Cayman Islands. Our legal name is IHS Holding Limited and our commercial name is IHS Towers. Our principal executive offices are located at 1 Cathedral Piazza, 123 Victoria Street, London SW1E 5BP, United Kingdom. Our telephone number at this address is +44 20 8106 1600. Our website address is www.ihstowers.com. The information contained on, or that can be accessed through, our website is not a part of, and shall not be incorporated by reference into, this Annual Report. We have included our website address as an inactive textual reference only. The SEC maintains an Internet site that contains reports, proxy and information statements, and other information regarding issuers, such as we, that file electronically, with the SEC at www.sec.gov. Our agent for service of process in the United States is C T Corporation System and its address is 28 Liberty Street, New York, New York 10005.
For a description of our principal capital expenditures and divestitures for the three years ended December 31, 2021 and for those currently in progress, see Item 5. “Operating and Financial Review and Prospects.”
B. Business Overview
We are one of the largest independent owners, operators and developers of shared telecommunications infrastructure in the world, providing our customers, most of whom are leading MNOs, with critical infrastructure that facilitates mobile communications coverage and connectivity for approximately 600 million people in emerging markets, across three regions and nine countries. We are the largest independent multinational emerging-market-only tower operator and one of the largest independent multinational tower operators globally, in each case by tower count. As of December 31, 2021, we operated 31,043 Towers across five countries in Africa, three countries in Latin America and one country in the Middle East. We are the largest tower operator in six of the nine markets in which we operate and we are the only independent tower operator of scale in five of these markets.
We have a well-defined organic and inorganic expansion strategy designed to grow in existing markets with our existing and new customers and, given the significant global emerging market opportunities in telecommunications infrastructure, enter carefully selected growth oriented markets with compelling underlying fundamentals. Historically, our business has been predominantly focused on Towers, however we recently started complementing this with investment into adjacent telecommunications infrastructure offerings for our customers such as fiber connectivity. Aligned to this inorganic growth strategy, in February 2020 we completed the first closing of 1,022 towers in Kuwait through a controlling investment pursuant to the Kuwait Acquisition for the acquisition of up to 1,620 towers in the aggregate, with a further 333 towers transferred in subsequent closings. Also in February 2020 we completed the acquisition of 2,312 towers through a 100% investment pursuant to the CSS Acquisition with towers primarily in Brazil, as well as Peru and Colombia. In 2021, we acquired 1,005 towers in Brazil pursuant to the Skysites Acquisition, 819 towers in Brazil and Colombia pursuant to the Centennial Acquisition and also acquired certain fiber assets from TIM Brasil pursuant to the TIM Fiber Acquisition where TIM Brasil will be the anchor tenant on the fiber network. In October 2021, we signed an agreement pursuant to the Egypt Transaction and obtained a license to construct, operate and lease telecom towers in Egypt. More recently, in November 2021 and January 2022, we signed definitive transaction documentation to acquire 5,709 and 2,115 towers pursuant to the MTN SA Acquisition and GTS SP5 Acquisition, respectively. Each of these acquisitions supports our inorganic growth strategy of expanding into additional regions that meet our investment criteria, which opens up new markets that we believe will provide future organic and inorganic growth opportunities.
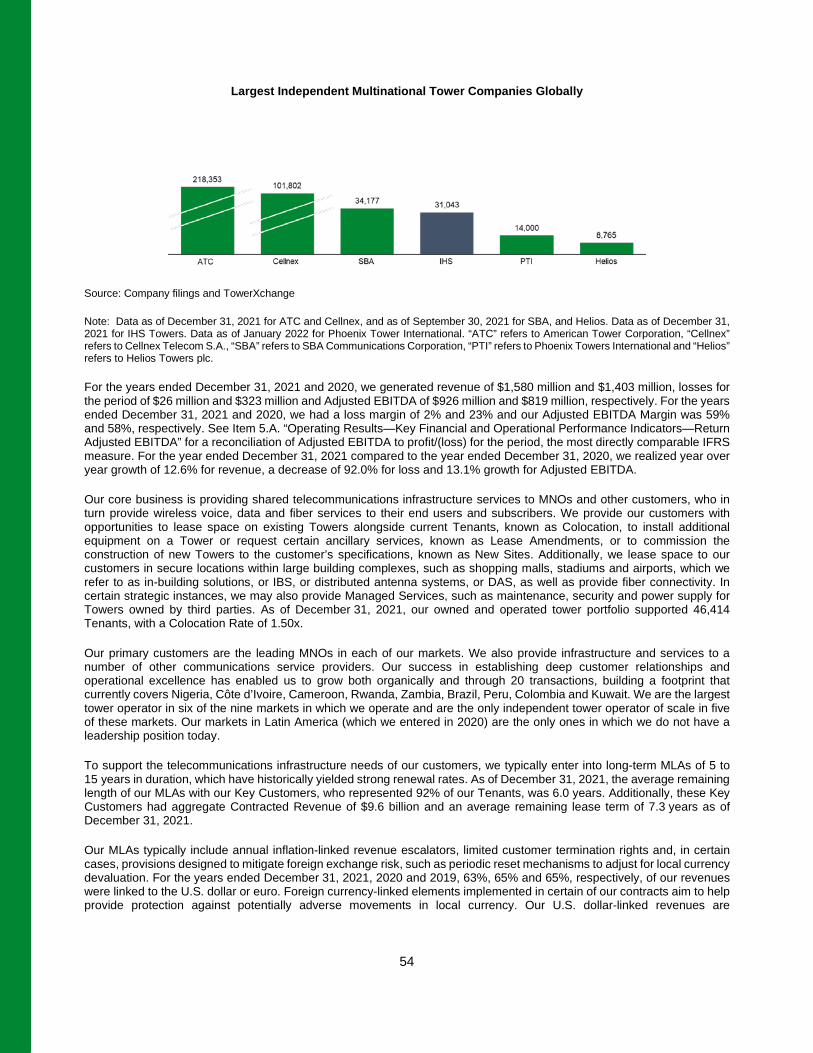
54
Largest Independent Multinational Tower Companies Globally
Source: Company filings and TowerXchange
Note: Data as of December 31, 2021 for ATC and Cellnex, and as of September 30, 2021 for SBA, and Helios. Data as of December 31, 2021 for IHS Towers. Data as of January 2022 for Phoenix Tower International. “ATC” refers to American Tower Corporation, “Cellnex” refers to Cellnex Telecom S.A., “SBA” refers to SBA Communications Corporation, “PTI” refers to Phoenix Towers International and “Helios” refers to Helios Towers plc.
For the years ended December 31, 2021 and 2020, we generated revenue of $1,580 million and $1,403 million, losses for the period of $26 million and $323 million and Adjusted EBITDA of $926 million and $819 million, respectively. For the years ended December 31, 2021 and 2020, we had a loss margin of 2% and 23% and our Adjusted EBITDA Margin was 59% and 58%, respectively. See Item 5.A. “Operating Results—Key Financial and Operational Performance Indicators—Return Adjusted EBITDA” for a reconciliation of Adjusted EBITDA to profit/(loss) for the period, the most directly comparable IFRS measure. For the year ended December 31, 2021 compared to the year ended December 31, 2020, we realized year over year growth of 12.6% for revenue, a decrease of 92.0% for loss and 13.1% growth for Adjusted EBITDA.
Our core business is providing shared telecommunications infrastructure services to MNOs and other customers, who in turn provide wireless voice, data and fiber services to their end users and subscribers. We provide our customers with opportunities to lease space on existing Towers alongside current Tenants, known as Colocation, to install additional equipment on a Tower or request certain ancillary services, known as Lease Amendments, or to commission the construction of new Towers to the customer’s specifications, known as New Sites. Additionally, we lease space to our customers in secure locations within large building complexes, such as shopping malls, stadiums and airports, which we refer to as in-building solutions, or IBS, or distributed antenna systems, or DAS, as well as provide fiber connectivity. In certain strategic instances, we may also provide Managed Services, such as maintenance, security and power supply for Towers owned by third parties. As of December 31, 2021, our owned and operated tower portfolio supported 46,414 Tenants, with a Colocation Rate of 1.50x.
Our primary customers are the leading MNOs in each of our markets. We also provide infrastructure and services to a number of other communications service providers. Our success in establishing deep customer relationships and operational excellence has enabled us to grow both organically and through 20 transactions, building a footprint that currently covers Nigeria, Côte d’Ivoire, Cameroon, Rwanda, Zambia, Brazil, Peru, Colombia and Kuwait. We are the largest tower operator in six of the nine markets in which we operate and are the only independent tower operator of scale in five of these markets. Our markets in Latin America (which we entered in 2020) are the only ones in which we do not have a leadership position today.
To support the telecommunications infrastructure needs of our customers, we typically enter into long-term MLAs of 5 to 15 years in duration, which have historically yielded strong renewal rates. As of December 31, 2021, the average remaining length of our MLAs with our Key Customers, who represented 92% of our Tenants, was 6.0 years. Additionally, these Key Customers had aggregate Contracted Revenue of $9.6 billion and an average remaining lease term of 7.3 years as of December 31, 2021.
Our MLAs typically include annual inflation-linked revenue escalators, limited customer termination rights and, in certain cases, provisions designed to mitigate foreign exchange risk, such as periodic reset mechanisms to adjust for local currency devaluation. For the years ended December 31, 2021, 2020 and 2019, 63%, 65% and 65%, respectively, of our revenues were linked to the U.S. dollar or euro. Foreign currency-linked elements implemented in certain of our contracts aim to help provide protection against potentially adverse movements in local currency. Our U.S. dollar-linked revenues are
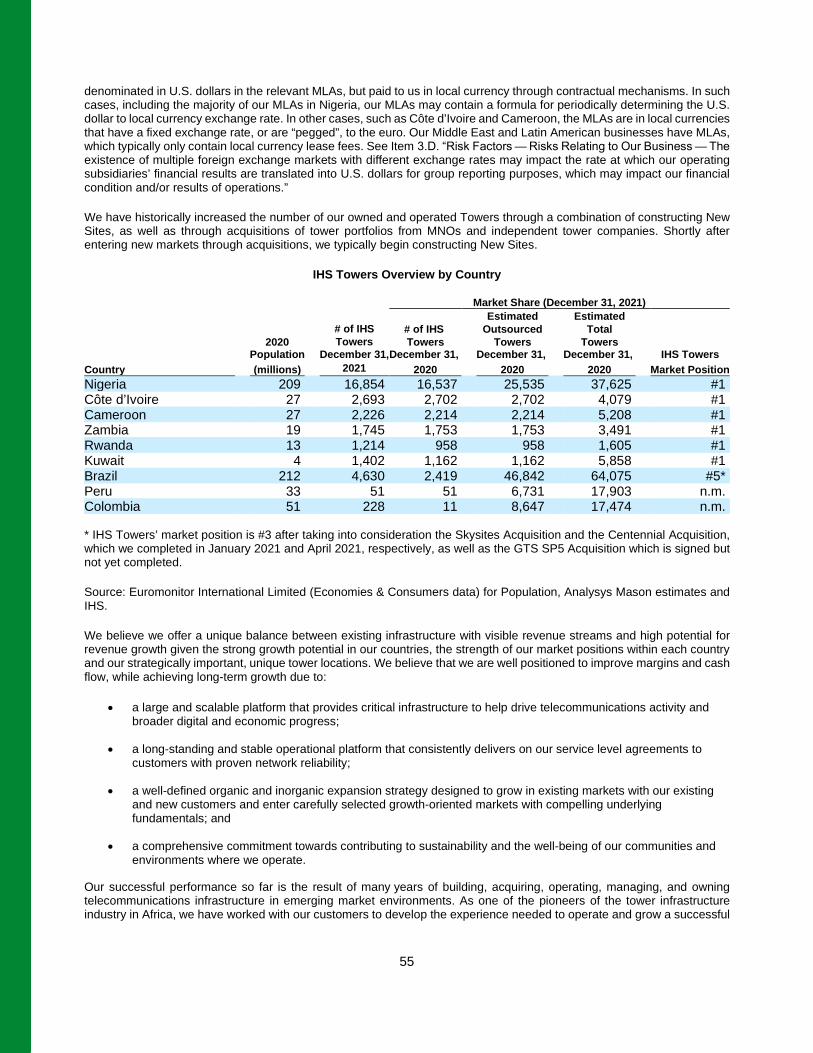
55
denominated in U.S. dollars in the relevant MLAs, but paid to us in local currency through contractual mechanisms. In such cases, including the majority of our MLAs in Nigeria, our MLAs may contain a formula for periodically determining the U.S. dollar to local currency exchange rate. In other cases, such as Côte d’Ivoire and Cameroon, the MLAs are in local currencies that have a fixed exchange rate, or are “pegged”, to the euro. Our Middle East and Latin American businesses have MLAs, which typically only contain local currency lease fees. See Item 3.D. “Risk Factors — Risks Relating to Our Business — The existence of multiple foreign exchange markets with different exchange rates may impact the rate at which our operating subsidiaries’ financial results are translated into U.S. dollars for group reporting purposes, which may impact our financial condition and/or results of operations.”
We have historically increased the number of our owned and operated Towers through a combination of constructing New Sites, as well as through acquisitions of tower portfolios from MNOs and independent tower companies. Shortly after entering new markets through acquisitions, we typically begin constructing New Sites.
IHS Towers Overview by Country
Market Share (December 31, 2021) Estimated Estimated
# of IHS # of IHS Outsourced Total 2020 Towers Towers Towers Towers Population December 31, December 31, December 31, December 31, IHS Towers Country (millions) 2021 2020 2020 2020 Market Position Nigeria 209 16,854 16,537 25,535 37,625 #1 Côte d’Ivoire 27 2,693 2,702 2,702 4,079 #1 Cameroon 27 2,226 2,214 2,214 5,208 #1 Zambia 19 1,745 1,753 1,753 3,491 #1 Rwanda 13 1,214 958 958 1,605 #1 Kuwait 4 1,402 1,162 1,162 5,858 #1 Brazil 212 4,630 2,419 46,842 64,075 #5* Peru 33 51 51 6,731 17,903 n.m. Colombia 51 228 11 8,647 17,474 n.m. * IHS Towers’ market position is #3 after taking into consideration the Skysites Acquisition and the Centennial Acquisition, which we completed in January 2021 and April 2021, respectively, as well as the GTS SP5 Acquisition which is signed but not yet completed.
Source: Euromonitor International Limited (Economies & Consumers data) for Population, Analysys Mason estimates and IHS.
We believe we offer a unique balance between existing infrastructure with visible revenue streams and high potential for revenue growth given the strong growth potential in our countries, the strength of our market positions within each country and our strategically important, unique tower locations. We believe that we are well positioned to improve margins and cash flow, while achieving long-term growth due to:
• a large and scalable platform that provides critical infrastructure to help drive telecommunications activity and broader digital and economic progress;
• a long-standing and stable operational platform that consistently delivers on our service level agreements to customers with proven network reliability;
• a well-defined organic and inorganic expansion strategy designed to grow in existing markets with our existing and new customers and enter carefully selected growth-oriented markets with compelling underlying fundamentals; and
• a comprehensive commitment towards contributing to sustainability and the well-being of our communities and environments where we operate.
Our successful performance so far is the result of many years of building, acquiring, operating, managing, and owning telecommunications infrastructure in emerging market environments. As one of the pioneers of the tower infrastructure industry in Africa, we have worked with our customers to develop the experience needed to operate and grow a successful
56
business in our sector. Our experience has provided us with years of insight, deep operational expertise, and strong relationships with various stakeholders that we believe will allow us to enhance our leadership position in existing and new markets. Our track record is highlighted by the following milestones:
• 2001: Founded as a builder of telecommunication Towers for MNOs in Nigeria; our founders continue to lead the business today.
• 2004: Launched our Managed Services operations for MNO-owned Towers with services including maintenance, security and power supply.
• 2009: Began owning Towers and leasing space to MNOs in Nigeria and launched our Colocation operations through which we lease space to other MNOs.
• 2013: Acquired MTN Côte d’Ivoire’s tower portfolio of 911 Towers and MTN Cameroon’s 818 Towers. Additionally, completed MLL agreements for Orange Côte d’Ivoire’s tower portfolio of 1,191 Towers and Orange Cameroon’s 819 Towers.
• 2014: Successfully completed a $2.0 billion equity raise, which was drawn down in 2014 and 2015.
• 2014: Entered Zambia and Rwanda through the acquisitions of MTN’s tower portfolios of 719 Towers in Zambia and 550 Towers in Rwanda. These transactions helped establish us as the largest independent tower company in EMEA by tower count.
• 2014: Executed landmark transactions in Nigeria to acquire a total of 10,966 Towers. We acquired 4,154 of these Towers from MTN Nigeria and 2,116 of these Towers from 9mobile in 2014 and the balance of 4,696 Towers from MTN Nigeria the following year.
• 2015: Expanded through the acquisitions of Airtel Zambia’s 949 Towers and Airtel Rwanda’s 200 Towers and further expanded in Nigeria through the acquisition of an additional 555 Towers from 9mobile.
• 2016: Acquired HTN Towers which owned 1,211 Towers, the first tower company-to-tower company transaction in Africa, which reinforced our leadership in Africa’s largest market.
• 2016: Issued our debut $800 million 9.500% senior notes due 2021 (now fully refinanced and redeemed as noted below under 2019), the largest African corporate high yield bond single issue offering at the time.
• 2019: Refinanced outstanding debt of our Nigeria operations (approximately $1.8 billion), including issuing $1.3 billion of new senior notes, as well as new senior credit facilities, resulting in a more simplified debt capital structure, extended maturities and lower cost of debt.
• 2020: Expanded our footprint by entering the Middle East through the completion of the Kuwait Acquisition, a controlling investment in Zain Kuwait’s 1,620 towers in Kuwait, of which we completed the first closing of 1,022 towers in February 2020 and 140 towers in October 2020.
• 2020: Expanded our footprint by entering Latin America through the completion of the CSS Acquisition, for 2,312 towers primarily across Brazil, as well as Peru and Colombia.
• 2020: Completed a tack-on transaction for $150 million in aggregate principal amount of senior notes and upsized our IHS Holding Revolving Credit Facility to $225 million in available borrowing capacity.
• 2021: Expanded our Latam business through the acquisitions of Skysites in Brazil, Centennial Brazil and Centennial Colombia, acquiring 1,005 towers, 602 towers and 217 towers, respectively.
• 2021: Completed third and fourth closings of 67 towers and 126 towers in April 2021 and October 2021 in Kuwait, respectively, pursuant to the Kuwait Acquisition, with the remainder of the towers currently managed and operated under a Managed Services agreement until they can be legally transferred to us. Completed acquisition of 162 towers in April 2021 from Airtel Rwanda.
• 2021: Expanded the restricted group for our $1,450 million senior notes to encompass IHS Holing Limited and all of IHS Holding Limited’s subsidiaries (other than any unrestricted subsidiaries).
57
• 2021: Entered into a $500 million bridge facility in August 2021 that can be used for certain acquisitions. Upsized IHS Holding Revolving Credit Facility by $20 million to $245 million in July 2021 and a further $25 million to $270 million in October 2021. As of December 31, 2021, the IHS Holding Revolving Credit Facility and the IHS Holding Bridge Facility remain undrawn.
• 2021: Completed our initial public offering (“IPO”) by issuing 18,000,000 ordinary shares at a price to the public of $21 per share, resulting in net proceeds to us of $357.7 million, after deducting the underwriting discount and commission of $21.7 million and net reimbursements of offering expenses of $1.4 million.
• 2021: Completed the TIM Fiber Acquisition with TIM Brasil for the acquisition of existing fiber assets and future deployment of fiber assets in Brazil.
• 2021: Announced our further expansion in Africa, with the signing of an agreement to enter Egypt pursuant to the Egypt Transaction and to acquire 5,709 towers in South Africa pursuant to the MTN SA Acquisition.
• 2022: Signed definitive transaction documentation to acquire 2,115 towers in Brazil pursuant to the GTS SP5 Acquisition.
We believe that the underlying telecommunications trends in our markets will continue to drive the need for additional infrastructure and enable us to further augment our growth through continued Colocation, Lease Amendments, New Site construction, adjacent telecommunications infrastructure investments such as fiber and acquisition activity. New telecommunication infrastructure services such as small cells will further add to our growth opportunities with the roll-out of 5G in some of our markets. As of December 31, 2021, with an average age of our tower portfolio of 6.2 years, based on the date of integration of the sites, and a Colocation Rate of 1.50x, we believe that we have a young portfolio with ample capacity to continue growing organically, as well as to realize further gains on operating margins from operational efficiencies. We believe this organic growth will help drive enhanced cash flow generation from our existing assets.
Our Competitive Strengths
We believe the following strengths position us to deliver operationally for our customers as well as generate strong financial returns and growth:
We are a clear leader in the majority of our current markets, which we support with a high quality asset base and service.
Large and Growing Telecommunications Markets. We believe the markets in which we currently operate are structurally favorable, as a result of having large, growing populations and low mobile penetration, particularly relating to 4G and 5G SIM penetration. Our nine markets covered approximately 604 million SIMs as of December 31, 2020. Our African markets are generally characterized by low mobile penetration, and a high number of subscribers per tower compared with the U.S. and Western Europe. These markets are also attractive due to an increasing need for 3G and 4G coverage and capacity, with 55% 3G SIM penetration and only 9% 4G SIM penetration as of December 31, 2020. Over the longer term, we also expect 5G technology to become available in these markets. To meet the anticipated telecommunications growth in our African markets, it is expected that these markets will require over 22,000 new towers and over 30,000 new MNO points of presence over the period December 2020 to December 2025. We also opened up new growth markets in 2020 with the completion of the Kuwait Acquisition and the CSS Acquisition in Latin America, giving us additional exposure to the growth and technology trends in these markets as well. It is estimated that these markets in Latin America will require over 19,000 new towers and over 42,000 new MNO points of presence over the period December 2020 to December 2025. As telecommunication networks in our markets evolve, we believe that there may also be increasing demand for other telecommunications infrastructure, such as fiber connectivity and data centers.
Significant Market Scale. We are the number one tower operator in six of our nine markets. As of December 31, 2020, we had an estimated 65% market share of independently owned or operated sites in Nigeria, which is the largest telecommunications market in Africa by subscribers, and we are the only independent tower operator in five more of our current markets. As of December 31, 2021, we are the largest tower operator in Africa, measured by tower count. In the Middle East, we are the first independent tower company to enter the region with the completion of the Kuwait Acquisition.
As a leader in many of our markets, we benefit from operational efficiencies that help drive financial performance. We have strategically acquired multiple tower portfolios in each of our African markets and have selectively consolidated Towers, where we move Tenants from one Tower to another, to reduce costs. Follow-on transactions in new markets are an
58
important element of our inorganic growth strategy, and we have reinforced our position in our markets, completing follow-on transactions in each of our African markets, as well as Brazil and Colombia. We own or operate approximately 47% of all Towers (73% of independent Towers) in our combined African markets and therefore benefit when MNOs invest in additional coverage and capacity, either on our existing sites or through the share of new sites we deliver in the market. We believe our scale and market position gives us a unique opportunity to increase our revenue per tower through Colocation and Lease Amendments as MNOs upgrade their networks from 2G and 3G to 4G and 5G further in the future.
Substantial and Defensible Market Share. Given the size and scale of our business and our track record of growth and service to our customers, we believe we are well positioned to maintain or even grow our market share. Our market position is backed by long-term contracts that we have a history of successfully maintaining. We have a presence across all the states of Nigeria, with coverage estimated at 80% of the population. We believe that in Nigeria, we have delivered the majority of estimated demand for new site deployments by independent tower companies in the market over the last two years, and we are the only independent tower operator in five of our other markets. For the period covering 2019, 2020 and 2021, we have added 10,113 Tenants, 17,141 Lease Amendments and constructed 2,015 New Sites. As of December 31, 2021, we have built over 7,600 New Sites since our inception. We continue to provide quality service and take a partnership approach with our customers in radio frequency planning. We also benefit from high barriers to entry in our industry, including the capital intensive nature of building new tower portfolios and, in certain instances, zoning rules that restrict Towers and masts from being built within a certain radius of each other. We believe these factors underpin the strength of our market leadership and position us to take advantage of opportunities in our markets.
We have a proven business model with high quality revenue visibility that is backed by long-term, inflation-linked contracts.
Proven business model coupled with recurring revenues and long-term contracts. We offer MNOs reliable services in exchange for monthly lease fees that are underpinned by long-term contracts, creating long-term revenue visibility. For MNOs, there are high costs and potential service interruptions associated with switching tower infrastructure and, historically, we have had a track record of successfully renegotiating and extending our contracts with MNOs. As of December 31, 2021, we had $9.6 billion of Contracted Revenue from an average remaining lease term of 7.3 years and an average remaining length of our MLAs of 6.0 years. In many cases, our contracts also include limited customer termination rights, inflation-linked revenue escalators and power indexation clauses to mitigate against certain increases in diesel prices. In certain cases, our contracts also include provisions designed to mitigate foreign exchange risk, such as periodic reset mechanisms to adjust for local currency devaluations.
The majority of our revenue comes from MNOs that are subsidiaries of large, publicly listed multi-national MNOs, including MTN Group and MTN Nigeria, Orange Group, Airtel Africa, Zain Group, Telecom Italia and TIM S.A., Telefonica and America Movil. Many of our customers enjoy the support of their broader organizations and our multi-country partnerships help facilitate strong relationships throughout our markets.
Structurally favorable unit economics. The absence of competing infrastructure in the vicinity of our Towers helps enable strong demand from existing customers and positions our Towers as the preferred location for potential new demand. Time to market advantages for New Site construction, cost-to-build considerations and in some cases, regulatory restrictions create natural and high barriers to entry into our markets. We are able to achieve favorable unit economics through additional Tenants and Lease Amendments via colocation that allow us to improve our margins and our return on invested capital. When we add additional Tenants via Colocation and Lease Amendments, we generally incur limited incremental costs and typically do not provide additional tenant discounts. We also have the ability to reduce certain of our costs per Tenant, which are mostly fixed, with the exception of power costs in our African and Middle East markets, which are variable. For example, in Nigeria where we invested in hybrid power solutions (which combine diesel generators with solar and/or battery systems) on more than 9,000 sites, we achieved a reduction in diesel consumption on those sites. Our new business in Latin America does not have the same operational requirements as our African or Middle Eastern businesses, given power is generally the responsibility of the customers and land lease costs are typically passed through to them. With a Colocation Rate of 1.50x across our portfolio as of December 31, 2021, our sites have the capacity to add additional Tenants before reaching a similar Colocation Rate as our older tower vintages. For example, as of December 31, 2021, our tower vintages up to 2012 had a Colocation Rate of 2.17x. We believe our success in leasing up and colocating on our older Towers is a strong indicator of our ability to lease-up, grow revenue and expand margins on our newer Towers.
We have contractual protections against macroeconomic volatility. For the years ended December 31, 2021, 2020 and 2019, 63%, 65% and 65%, respectively, of our revenues were linked to the U.S. dollar or euro. Most of our operating costs are in local currency, and we have structured our contracts to provide protection against inflation and, in some cases, local currency devaluation.
59
Our MLAs in the Middle East and Latin America have local currency lease fees with annual inflation linked escalators. In our African markets the local currency components of our lease fees typically adjust with local currency linked inflation provisions and U.S. dollar components of our lease fees typically adjust with U.S.-linked inflation provisions. The majority of our costs do not have mechanical indexation, enabling us to both grow our revenue and manage our cost base. With the exception of the cost of diesel, which is typically paid in local currency, but linked to the U.S. dollar through the international price of oil, substantially all of our direct and indirect operating expenses are denominated in and incurred in local currency. Capital expenditures may be linked to U.S. dollars in some instances, but are also incurred in local currency, providing further resilience to macroeconomic volatility.
We have a track record of both organic and inorganic growth.
We have a number of organic growth opportunities. There are a number of avenues that have driven our historical organic growth and that we believe will continue to drive future organic growth, including Colocation, Lease Amendments and New Sites. These opportunities are typically the result of our customers looking to densify their networks, improve their network coverage and capacity and upgrade their networks with new technologies, in response to growing populations and data demand from end users in our markets. Our MLAs also typically include annual inflation-linked escalations, ensuring contractual increases to revenue.
In response to these growing needs, we benefit from customers choosing Colocation in order to get to market quickly on an existing site of ours. Colocations are a highly attractive opportunity as they enable us to lease-up our existing assets with minimal incremental capital expenditure and operating expenses required. As of December 31, 2021, 2020 and 2019, we achieved a Colocation Rate of 1.50x, 1.54x and 1.56x, respectively. When we acquire towers from mobile operators, these typically have a low Colocation Rate that reduces our overall Colocation Rate, but at the same time these towers result in a further colocation opportunity for our other customers.
Lease Amendments represent an opportunity for existing Tenants to enhance their existing position or upgrade technology at a Tower by installing additional equipment on that Tower or requesting certain ancillary services. For the years ended December 31, 2021, 2020 and 2019, we added 9,141, 4,379 and 3,621 Lease Amendments, respectively. Colocation and Lease Amendments both support our growth by increasing our operating leverage.
We typically construct New Sites after obtaining a commitment for a long-term lease with an initial tenant and, in general, if we are aware of, or believe there is, commercial potential for Colocation. Since our inception, we have built over 7,600 New Sites. For the years ended December 31, 2021, 2020 and 2019, we built 1,348, 362 and 305 New Sites, respectively.
We also benefit from the opportunity to generate revenue from adjacent services, including fiber, DAS and small cells. These opportunities do not constitute a material contribution to our revenues today, although we will look to continue to expand these opportunities as an area of growth in the future, particularly in our new markets in Brazil and Kuwait where 5G roll-out is close to commencing and has already commenced, respectively.
We have a track record of inorganic growth through acquiring, consolidating and integrating tower portfolios. Since our inception, we have completed 20 transactions for more than 24,500 Towers and fiber assets across nine countries. These transactions have enabled us to achieve our strong in-market positioning, which is key to both our ability to provide high quality services and to ensure the sustainability of the fundamentals of our business. Our recently completed acquisitions demonstrate our desire to expand into structurally favorable emerging and less developed markets around the world.
Our inorganic growth strategy focuses on entering carefully selected growth oriented markets with compelling underlying fundamentals. A key component of this inorganic growth lies in our strategy to then develop each of the markets that we enter. We aim to execute follow-on, in-market transactions upon entering a new market, in order to solidify our presence as well as extract cost synergies from our operational platform across our large asset base. In addition to building our market presence, this strategy has allowed us to better service our customers through our extensive platform.
We have an established history of delivering high quality service to our customers.
We have long-term relationships with leading MNOs. Our sites are, for most of our customers, the primary tower infrastructure that supports their operations, making us a key long-term partner of our customers. Through these partnerships, we have developed deep ties with our customers’ key decision makers.
60
We have a long track record of delivering quality service to MNOs through deeply integrated relationships. Our customers entrust us with this critical infrastructure in part due to our proven record. For example, in our African businesses, we had average power uptimes of 99.7% and average time to repair below two hours for the year ended December 31, 2021. In our African businesses, our innovative power availability solutions are a critical component of our quality service offering in our current markets, which lack a robust power grid.
We have a modern and efficient global operational management platform. We have differentiated ourselves from our tower competitors over time through our advanced network operating centers, or NOCs, in our six African and Middle Eastern businesses, with bespoke remote monitoring at 88% of sites covered by these NOCs as of December 31, 2021 (with monitoring of almost all remaining sites through MNO network operating centers), site acquisition and maintenance teams, and a network of partners in the fields of security, power management equipment, site deployment / construction and diesel supply. Our NOCs operate 24 hours a day, seven days a week and monitor a variety of data sent from our Towers. Such data include access and gate status, diesel supply, usage and quality, cabinet temperature and overall power uptime, consumption and supply. We have demonstrated significant uptime improvement in the sites that we have purchased and enabled improved quality of service levels across our portfolio. Given the current operating environment in Latin America with limited service level agreement obligations (such as power uptime or average time to repair) to customers, our businesses in Brazil, Peru and Colombia generally do not require NOCs or remote monitoring services.
We have a track record of resilience to volatility.
We have a track record of growth during periods of macro-economic volatility, including in relation to foreign exchange rates. Despite the significant shortage of U.S. dollar liquidity in Nigeria in 2015 and 2016, Naira devaluations and the economic slowdown in Nigeria in 2017, 2018, 2019, 2020 and 2021, when real GDP growth was 0.8%, 1.9%, 2.3%, (1.9)% and 3.4%, respectively, our revenue and Segment Adjusted EBITDA for our Nigeria segment continued to grow during that same period. Revenue for our Nigeria segment increased 10.5%, 12.1% and 8.6% for the years ended December 31, 2021, 2020 and 2019, compared to the years ended December 31, 2020, 2019 and 2018, respectively, and Segment Adjusted EBITDA for our Nigeria segment increased by 11.7%, 25.5% and 14.2% over the same periods, despite the Naira depreciating from an average rate of ₦362 to $1.00 for the year ended December 31, 2018 to an average rate of ₦410 to $1.00 for the year ended December 31, 2021.
We have a disciplined capital allocation policy. We employ a prudent approach to discretionary capital allocation. We have a strong focus on maintaining a healthy capital structure through a mix of debt and equity financing. As of December 31, 2021 we had $3.0 billion of debt and IFRS 16 lease liabilities and $916.5 million of cash on our balance sheet. We continue to maintain a prudent approach to leverage, which we believe provides us with strong flexibility to evaluate future investment opportunities and other potential capital allocation alternatives.
We have a founder-led, experienced management team with a differentiated operational skillset and track record, supported by committed, seasoned investors.
Our executive team is led by our founders and other seasoned senior executives with strong relevant experience. Our founders remain in lead executive positions and are deeply involved in day-to-day operations, strategy and leadership. We have a highly experienced management team with a track record of delivering operational performance and strategic growth for our business. With a background in site construction, site management as well as site operation, our management team has experience across the full telecommunications infrastructure value chain. We have added to our leadership team over the years, and together, our management team has deep experience in both developed and emerging markets, towers, telecommunications, finance, governance and mergers and acquisitions. In addition to a strong executive management team, we have developed a seasoned team of in-country managers that help run the day-to-day operations, manage local relationships and expand effectively into new markets.
We have benefited from the consistent commitment of experienced, long-term investors that actively support our management. Since our inception in 2001, we have established a rigorous framework, which includes a focus on corporate governance, ethics, environment and sustainability and risk management policies and a platform that combines the strong fundamentals of the towers business with attractive long-term growth potential. Our global shareholder base includes strategic and financial investors, such as African Infrastructure Investment Managers, Emerging Capital Partners, Nederlandse Financierings-Maatschappij Voor Ontwikkelingslanden N.V., or FMO, Goldman Sachs, International Finance Corporation, or IFC, Investec, Korea Investment Corporation, MTN Group and Wendel, among others.
Our governance and control frameworks underpin our dedication to operational best practices. We have implemented governance practices at the board of directors and executive levels, including committees focused on ethics
61
and risk management. We have ten directors, seven of whom are independent directors, on our board of directors. We have also developed an ethical compliance framework aligned with converging best practice methodologies.
Our Strategy
Since our inception in 2001, we have established a reputation as a leader in the high growth, emerging market telecommunications infrastructure sector, servicing MNOs and ultimately the growing end-consumer market with critical telecommunications infrastructure, which also benefits the broader communities in our markets through enabling accelerated access to communications. Through the growth of 2G, 3G and 4G, we have helped the MNOs in our markets provide services to subscribers by owning, operating, sharing and constructing telecommunications infrastructure. We are pursuing the following key strategies to grow our cash flow and continue to take advantage of our competitive strengths:
Increase revenue, improve margins and grow cash flows by maximizing the use of our existing network infrastructure and driving organic growth through Colocation, Lease Amendments and New Sites or other telecommunications infrastructure
Our primary strategy is to expand our revenue-generating asset base and improve utilization on new and existing Towers and other telecommunications infrastructure. We aim to drive organic revenue growth and cash flow generation through Colocation, Lease Amendments, contractual lease fee escalations and New Site or other telecommunications infrastructure construction. In addition, we believe strong operating leverage and initiatives, such as selective decommissioning, will help us drive margins and increase cash flows. As our customers ready themselves for 5G roll-out, we believe existing services such as DAS, small cells and fiber services will likely increase in prevalence, and will become a core component to our growth thesis.
Seek attractive rates of return through disciplined organic and inorganic investment
We intend to continue investing capital at attractive rates of return. We pursue carefully selected strategies, including New Site or other telecommunications infrastructure construction and selective decommissioning, and have a strong track record of delivering value-enhancing incremental investments that have helped grow our asset base, secure our market leading positions and provide the scale and market share necessary to sustain our growth. We assess acquisition and investment opportunities in both existing and new markets using our (i) country attractiveness framework, (ii) strategic importance analysis and (iii) investment appraisal methodologies.
Within existing markets, we focus on growing our scale advantages by acquiring portfolios and other existing tower companies, which offer opportunity for operational improvements, potential synergy realization and potentially decommissioning opportunities, leading to potentially higher returns than comparable standalone investments. Additionally, we assess adjacent components of the telecommunications infrastructure value chain, such as fiber, to be able to offer more infrastructure services to our customers, generate incremental operating synergies across our assets and deliver potentially higher returns.
In new markets, we seek attractive telecommunications infrastructure opportunities with contractual agreements that aim to maximize returns on our investments. We also seek balanced telecommunications market dynamics with service and technology growth opportunities and demand for telecommunications infrastructure services. We consider markets attractive if we believe we can achieve significant scale, and even more so, if we can leverage relationships with multi-national MNOs with whom we may have existing relationships in other markets. If we deem a market attractive, we aim to apply our disciplined approach to acquisitions, establish a path to scale, gain market leadership within that country or more broadly within that region and diversify our overall portfolio by market and by customer. In contrast, we avoid markets which do not offer near-term chances for meaningful scale or ones that we do not believe have the right fundamental drivers to support our growth strategy.
In addition to acquiring tower portfolios or seeking to consolidate existing tower companies, we also see the potential for new and related services that will help enhance our value proposition to our customers, reduce their capital expenditure, stabilize their operating costs, help improve their quality of service and enable faster deployment of their networks. We expect to continue to generate cash flows from newly developed service propositions, such as fiber infrastructure services, where we see significant potential in our markets. We will continually consider opportunities to expand our offering beyond the current infrastructure services, which support MNOs in their intention to build 4G and 5G enabled networks of the future, notably with small cells in urban areas and DAS. We believe that there are opportunities to expand the types of infrastructure partnerships that we could form with our customers, such as investments in fiber networks, Internet-of-Things or edge
62
computing, which could fall within our investment criteria, our infrastructure focus and our business model. We are committed to anticipating and responding to new technology trends and evolving customer needs.
Our investment appraisal of inorganic opportunities includes targeting long term revenue and Adjusted EBITDA growth rates and strong Adjusted EBITDA margins increasing cash flow generation over the long term. While these metrics, together with return metrics, form the basis of our investment appraisal, we also assess inorganic opportunities for individual strategic merit.
Continued focus on operational excellence, service delivery for customers and adopting an innovative approach to new technology
We plan to continue delivering high levels of performance to our customers in terms of site power availability, site access, equipment monitoring and servicing. We have done this consistently for years and we are increasingly leveraging new technology to expand the scope of how we monitor and improve the sites while reducing our dependence on diesel-powered generators. Our extensive use of alternative power solutions in our African markets helps reduce our operating costs and is more environmentally friendly given the reduction in diesel consumption that these solutions deliver. We will also look to leverage this expertise in other markets in which we operate where services such as power or site monitoring may be requested from customers in the future.
Continue improving our impact on our communities and on the environment
Our business model is inherently sustainable given we promote infrastructure sharing, drive connectivity across our markets and have invested in hybrid power solutions that reduce greenhouse gas (GHG) emissions. Additionally, we continuously aim to improve and develop our Sustainability strategy, which focuses on four pillars: (i) environment and climate change; (ii) education and economic growth; (iii) our people and communities; and (iv) ethics and governance. By supporting local schools, education initiatives, health clinics and wider programs, such as improving rural telephony, we seek to make a positive impact in the communities in which we operate and further contribute to the growth and development of our markets.
Having become a Signatory of the UN Global Compact in 2020, we are expected to produce an annual ‘Communication on Progress (CoP)’ covering how we are supporting the Compact’s ten principles in areas such as human rights, labor standards, the environment and anti-corruption, and our 2020 Sustainability Report serves as our first CoP. We believe that our sustainability programs contribute to nine of the 17 United Nations Sustainable Development Goals, or UN SDGs. Each of these goals feeds into our four-pillar sustainability strategy, which guides our everyday performance and underpins our business. We have been active in our communities throughout the COVID-19 pandemic, working in conjunction with organizations such as UNICEF, the Nigerian Red Cross and the Nigeria Center for Disease Control, delivering hundreds of thousands of items of personal protective equipment and testing kits, as well as by donating funds.
The success of our Sustainability strategy has also been recognized externally. In 2021, IHS Nigeria was recognized for the third year running at the Sustainability, Enterprise and Responsibility Awards, winning in the Best Company in Rural Integration and, in the Education Intervention category. At the Nigeria Innovation and Tech Awards 2021, IHS Nigeria was also recognized in two categories: Innovative Tower Company and Telecom Infrastructure Company for the essential service it delivers to the Nigerian people.
We are committed to supporting the professional development of all our employees. Our aim is to enable them to build the skills and knowledge required to enhance their careers at IHS. In support of this, in 2017, we launched the IHS Academy, an online training portal which, as of December 31, 2021, had more than 9,800 training items available including e-learning courses, videos, how-to guides and other training materials across a variety of areas including professional skills, personal development skills, management, leadership and teamworking skills, as well as a selection of health, safety, environment and compliance courses. In 2021, our employees completed 51,371 e-learning items, which in combination with our compliance training modules, resulted in 27,682 hours of training.
Our Tower Portfolio
Size of portfolio As of December 31, 2021, we had a portfolio of 29,139 owned Towers and 1,904 Towers that we operate under MLL agreements totaling 31,043 Towers owned and operated. With 46,414 Tenants as of December 31, 2021, we had a Colocation Rate of 1.50 x. Additionally, as of December 31, 2021, we had 27,124 Lease Amendments. We have historically increased the number of our Towers through a combination of constructing New Sites, along with the acquisition of site portfolios from MNOs and independent tower companies, namely HTN Towers, CSS, Skysites and Centennial.
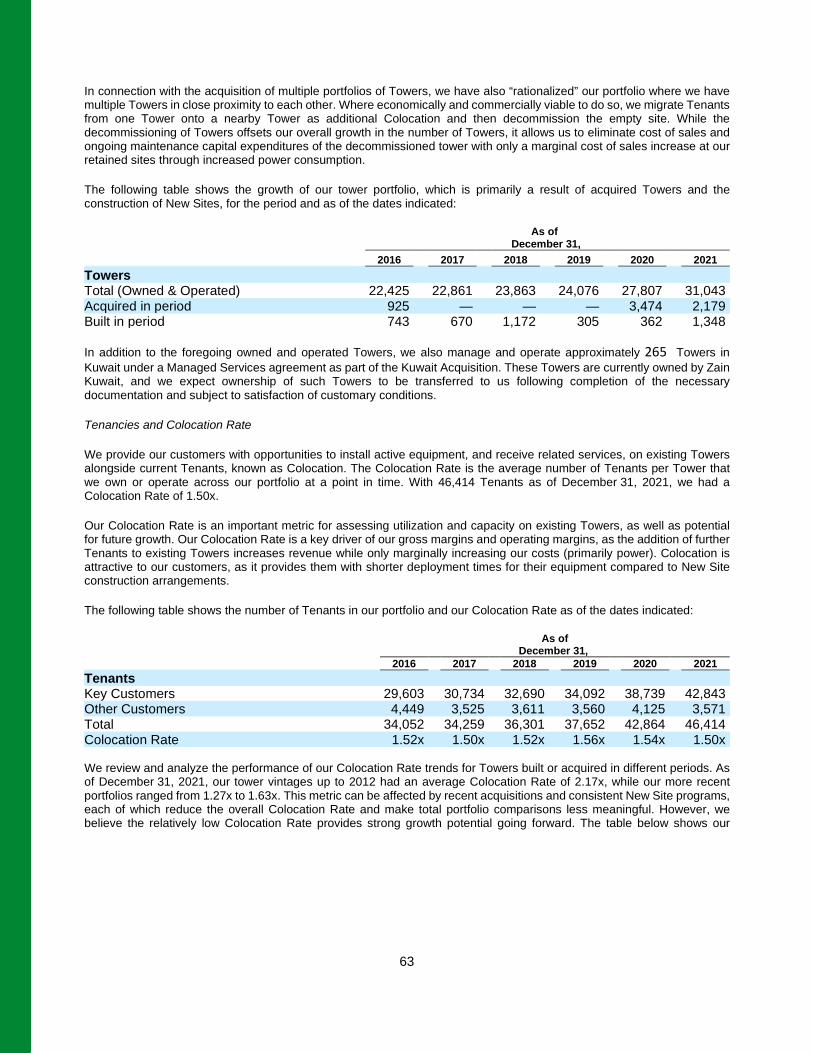
63
In connection with the acquisition of multiple portfolios of Towers, we have also “rationalized” our portfolio where we have multiple Towers in close proximity to each other. Where economically and commercially viable to do so, we migrate Tenants from one Tower onto a nearby Tower as additional Colocation and then decommission the empty site. While the decommissioning of Towers offsets our overall growth in the number of Towers, it allows us to eliminate cost of sales and ongoing maintenance capital expenditures of the decommissioned tower with only a marginal cost of sales increase at our retained sites through increased power consumption.
The following table shows the growth of our tower portfolio, which is primarily a result of acquired Towers and the construction of New Sites, for the period and as of the dates indicated:
As of December 31, 2016 2017 2018 2019 2020 2021 Towers Total (Owned & Operated) 22,425 22,861 23,863 24,076 27,807 31,043 Acquired in period 925 — — — 3,474 2,179 Built in period 743 670 1,172 305 362 1,348 In addition to the foregoing owned and operated Towers, we also manage and operate approximately 265 Towers in Kuwait under a Managed Services agreement as part of the Kuwait Acquisition. These Towers are currently owned by Zain Kuwait, and we expect ownership of such Towers to be transferred to us following completion of the necessary documentation and subject to satisfaction of customary conditions.
Tenancies and Colocation Rate
We provide our customers with opportunities to install active equipment, and receive related services, on existing Towers alongside current Tenants, known as Colocation. The Colocation Rate is the average number of Tenants per Tower that we own or operate across our portfolio at a point in time. With 46,414 Tenants as of December 31, 2021, we had a Colocation Rate of 1.50x.
Our Colocation Rate is an important metric for assessing utilization and capacity on existing Towers, as well as potential for future growth. Our Colocation Rate is a key driver of our gross margins and operating margins, as the addition of further Tenants to existing Towers increases revenue while only marginally increasing our costs (primarily power). Colocation is attractive to our customers, as it provides them with shorter deployment times for their equipment compared to New Site construction arrangements.
The following table shows the number of Tenants in our portfolio and our Colocation Rate as of the dates indicated:
As of December 31, 2016 2017 2018 2019 2020 2021 Tenants Key Customers 29,603 30,734 32,690 34,092 38,739 42,843 Other Customers 4,449 3,525 3,611 3,560 4,125 3,571 Total 34,052 34,259 36,301 37,652 42,864 46,414 Colocation Rate 1.52x 1.50x 1.52x 1.56x 1.54x 1.50x We review and analyze the performance of our Colocation Rate trends for Towers built or acquired in different periods. As of December 31, 2021, our tower vintages up to 2012 had an average Colocation Rate of 2.17x, while our more recent portfolios ranged from 1.27x to 1.63x. This metric can be affected by recent acquisitions and consistent New Site programs, each of which reduce the overall Colocation Rate and make total portfolio comparisons less meaningful. However, we believe the relatively low Colocation Rate provides strong growth potential going forward. The table below shows our
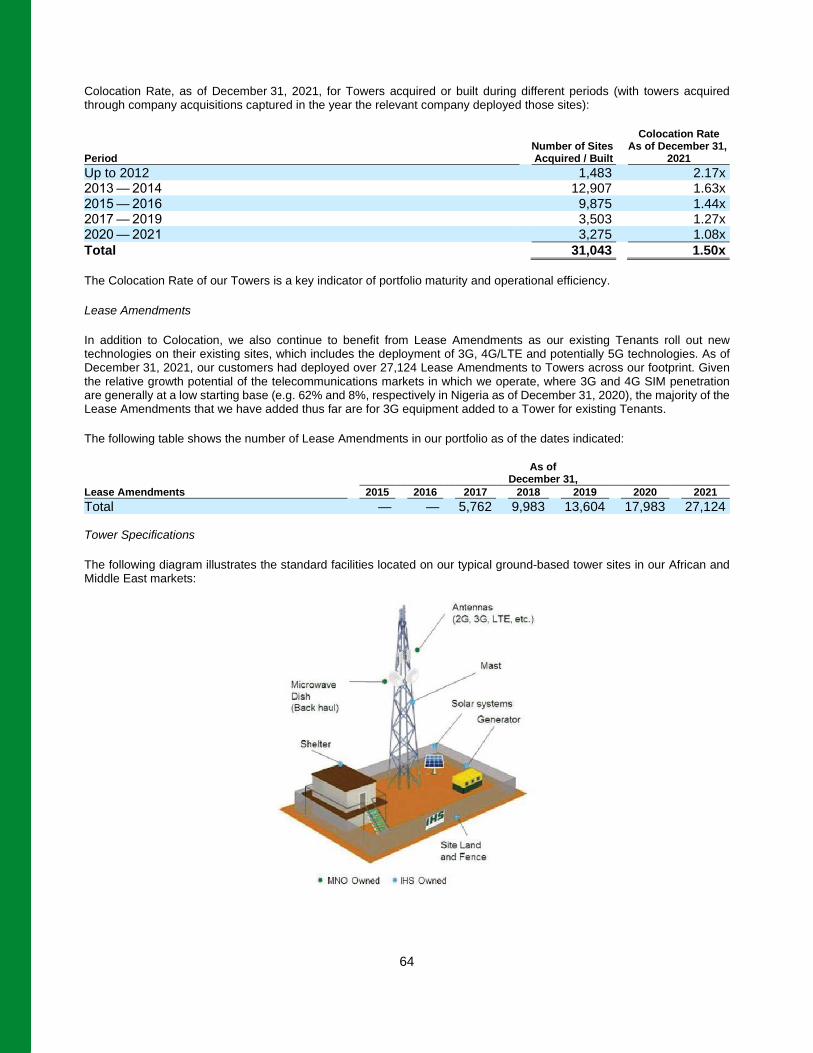
64
Colocation Rate, as of December 31, 2021, for Towers acquired or built during different periods (with towers acquired through company acquisitions captured in the year the relevant company deployed those sites):
Colocation Rate Number of Sites As of December 31, Period Acquired / Built 2021 Up to 2012 1,483 2.17x 2013 — 2014 12,907 1.63x 2015 — 2016 9,875 1.44x 2017 — 2019 3,503 1.27x 2020 — 2021 3,275 1.08x Total 31,043 1.50x The Colocation Rate of our Towers is a key indicator of portfolio maturity and operational efficiency.
Lease Amendments
In addition to Colocation, we also continue to benefit from Lease Amendments as our existing Tenants roll out new technologies on their existing sites, which includes the deployment of 3G, 4G/LTE and potentially 5G technologies. As of December 31, 2021, our customers had deployed over 27,124 Lease Amendments to Towers across our footprint. Given the relative growth potential of the telecommunications markets in which we operate, where 3G and 4G SIM penetration are generally at a low starting base (e.g. 62% and 8%, respectively in Nigeria as of December 31, 2020), the majority of the Lease Amendments that we have added thus far are for 3G equipment added to a Tower for existing Tenants.
The following table shows the number of Lease Amendments in our portfolio as of the dates indicated:
As of December 31, Lease Amendments 2015 2016 2017 2018 2019 2020 2021 Total — — 5,762 9,983 13,604 17,983 27,124 Tower Specifications
The following diagram illustrates the standard facilities located on our typical ground-based tower sites in our African and Middle East markets:
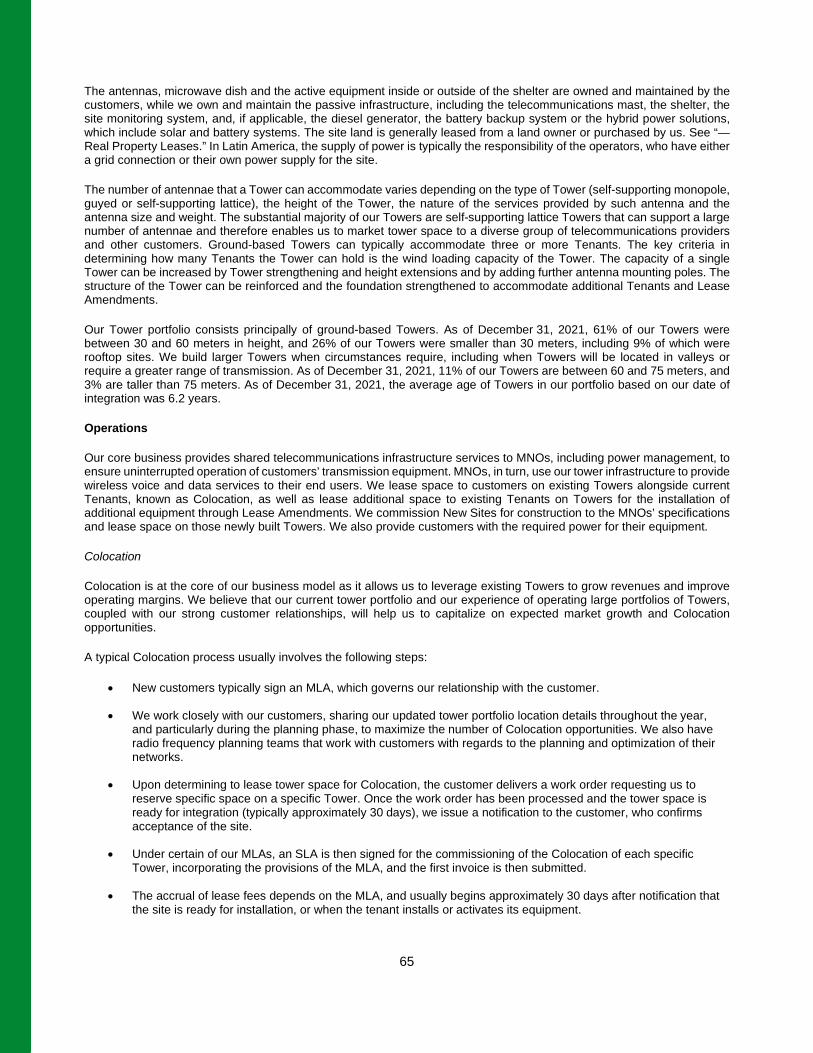
65
The antennas, microwave dish and the active equipment inside or outside of the shelter are owned and maintained by the customers, while we own and maintain the passive infrastructure, including the telecommunications mast, the shelter, the site monitoring system, and, if applicable, the diesel generator, the battery backup system or the hybrid power solutions, which include solar and battery systems. The site land is generally leased from a land owner or purchased by us. See “— Real Property Leases.” In Latin America, the supply of power is typically the responsibility of the operators, who have either a grid connection or their own power supply for the site.
The number of antennae that a Tower can accommodate varies depending on the type of Tower (self-supporting monopole, guyed or self-supporting lattice), the height of the Tower, the nature of the services provided by such antenna and the antenna size and weight. The substantial majority of our Towers are self-supporting lattice Towers that can support a large number of antennae and therefore enables us to market tower space to a diverse group of telecommunications providers and other customers. Ground-based Towers can typically accommodate three or more Tenants. The key criteria in determining how many Tenants the Tower can hold is the wind loading capacity of the Tower. The capacity of a single Tower can be increased by Tower strengthening and height extensions and by adding further antenna mounting poles. The structure of the Tower can be reinforced and the foundation strengthened to accommodate additional Tenants and Lease Amendments.
Our Tower portfolio consists principally of ground-based Towers. As of December 31, 2021, 61% of our Towers were between 30 and 60 meters in height, and 26% of our Towers were smaller than 30 meters, including 9% of which were rooftop sites. We build larger Towers when circumstances require, including when Towers will be located in valleys or require a greater range of transmission. As of December 31, 2021, 11% of our Towers are between 60 and 75 meters, and 3% are taller than 75 meters. As of December 31, 2021, the average age of Towers in our portfolio based on our date of integration was 6.2 years.
Operations
Our core business provides shared telecommunications infrastructure services to MNOs, including power management, to ensure uninterrupted operation of customers’ transmission equipment. MNOs, in turn, use our tower infrastructure to provide wireless voice and data services to their end users. We lease space to customers on existing Towers alongside current Tenants, known as Colocation, as well as lease additional space to existing Tenants on Towers for the installation of additional equipment through Lease Amendments. We commission New Sites for construction to the MNOs’ specifications and lease space on those newly built Towers. We also provide customers with the required power for their equipment.
Colocation
Colocation is at the core of our business model as it allows us to leverage existing Towers to grow revenues and improve operating margins. We believe that our current tower portfolio and our experience of operating large portfolios of Towers, coupled with our strong customer relationships, will help us to capitalize on expected market growth and Colocation opportunities.
A typical Colocation process usually involves the following steps:
• New customers typically sign an MLA, which governs our relationship with the customer.
• We work closely with our customers, sharing our updated tower portfolio location details throughout the year, and particularly during the planning phase, to maximize the number of Colocation opportunities. We also have radio frequency planning teams that work with customers with regards to the planning and optimization of their networks.
• Upon determining to lease tower space for Colocation, the customer delivers a work order requesting us to reserve specific space on a specific Tower. Once the work order has been processed and the tower space is ready for integration (typically approximately 30 days), we issue a notification to the customer, who confirms acceptance of the site.
• Under certain of our MLAs, an SLA is then signed for the commissioning of the Colocation of each specific Tower, incorporating the provisions of the MLA, and the first invoice is then submitted.
• The accrual of lease fees depends on the MLA, and usually begins approximately 30 days after notification that the site is ready for installation, or when the tenant installs or activates its equipment.
66
• Subsequent invoicing depends upon the particular MLA, and in most cases occurs monthly or quarterly in advance.
Lease Amendments
In addition to Colocation, we drive our revenue and operating margins by leasing additional space or equipment or providing certain ancillary services to existing Tenants on sites through Lease Amendments. For example, an existing Tenant may choose to deploy an additional technology, such as 3G, 4G/LTE or potentially 5G technology at the same site the Tenant is leasing, or an existing Tenant may seek to connect fiber to the Tower, which requires the provision of additional power for that connection.
Our customers utilize different technologies, though active GSM technologies comprise the most prevalent type of technology on our Towers to date. Data demands continue to be a key factor in our markets and certain large MNOs have recently announced plans to launch, or have already begun deploying 4G/LTE networks. In the future 5G networks are also expected to be deployed. These technologies require increased density for Towers and equipment, increasing the need for additional points of service and amplifying the need for Colocation.
As subscriber density increases, tower operators deploy additional infill sites to deliver further capacity to areas of demand. This densification of the network is driven further by the deployment of 3G and 4G services, which are typically carried over higher frequency spectrum bands. This is also the case for 5G services which may be provided in the future. The cell-sizes for these higher frequency bands are much smaller than, for example, a GSM 900 MHz cell, but the capacity that is delivered over a similar area is much higher and can therefore support high subscriber density and deliver higher voice and data traffic. The recent deployment of 3G/4G in lower frequency bands does not negate the need for densification, as it allows 3G and 4G coverage to be extended into more rural areas similar to 2G coverage. We expect MNOs in our markets to continue to service 2G, 3G and 4G technologies for many more years.
New Sites
We believe that the timely deployment of New Sites, which includes site acquisition, construction and structural and electrical engineering, has been a critical component in obtaining and completing site orders. We have extensive experience in deploying over 7,600 New Sites and have been a major provider to the market in New Sites since 2011. The average cost to build a typical macro New Site is in the range of $75,000 to $100,000 in our African and Middle Eastern businesses, and in the range of $40,000 to $60,000 in Latin America.
New Sites constructed consist primarily of ground-based towers, but can also include in-building solutions, rooftop and wall-mounted towers and cells-on-wheels. For New Sites, we retain ownership as well as the exclusive right to colocate additional Tenants on the tower. These New Sites always begin operations with at least a single tenant, with Colocation and Lease Amendments expected at future dates. We seek to construct New Sites only in locations where Key Customers are committed to be the initial tenant with optimal additional Colocation capacity, and therefore generally aim to only build Towers for customers in locations that have the potential to attract other customers. We strive to realize the operating leverage inherent in the tower business by leasing up the New Sites with additional tenancies. In Africa and the Middle East, we aim to construct New Sites with the appropriate power systems for their location, which may include hybrid batteries and solar systems. See “— Power and Power Management.” Given the operating model in Latin America, power systems are less relevant in these markets where the provision of power is a responsibility of the customer.
The entire process from receipt of work order to completion of New Site construction typically takes approximately 90 to 125 days. The actual time taken and the detailed steps followed can vary depending on the country, customer, the location of the specific site and issues, if any, identified during the site acquisition process.
A typical New Site process, including additional value-added services, involves the following steps:
• A new customer will sign an MLA, or have an existing MLA with the relevant optionality to roll-out New Sites, and inform the marketing unit that it requires a New Site in a certain location (usually a location within a 200 meter radius of a precise coordinate, referred to as a search ring).
• Mapping specialists select the most suitable sites based on a number of factors, including (i) the proximity to central coordinates provided by the customer, (ii) appropriate terrain most suited to broadcasting of uninterrupted signals, (iii) which sites provide the most attractive property lease or purchase terms, with a preference for purchasing the land, (iv) which sites have the highest potential to be approved for aviation and environmental
67
permits in the shortest time frame and (v) which sites may be the most viable location for additional Tenants. Final sites selected are submitted to the customer or to our site acquisition department pursuant to the customer’s request.
• Once a location is accepted by the customer, we negotiate and enter into either (i) a long-term ground lease pursuant to which we acquire a leasehold interest in the property, (ii) a contract of sale pursuant to which we acquire title to the property, (iii) an easement agreement pursuant to which we acquire an easement over the property, or (iv) an option to purchase or lease the property in the future. Concurrent with the negotiation of appropriate property rights, we obtain a title report on the site, conduct a survey of the site, perform soil analysis of the site and obtain an environmental survey of the site (if relevant). The resultant plan is then submitted to the relevant regulatory authority for approval. We also obtain land use permits necessary to commence construction on the site or install equipment on the site.
• Upon the customer’s acceptance of the completion of the tower construction, under certain MLAs, a separate SLA is then signed for the commissioning of the individual site, which incorporates the provisions of the MLA.
The accrual of the lease and maintenance fees generally starts at the time of the customer’s acceptance of the completion of the tower construction. Subsequent invoicing depends on the particular MLA but generally commences within 30 days of the customer’s acceptance or delivery of the site.
Decommissioning sites
Historically, we have grown our portfolio through constructing New Sites, along with the acquisition of site portfolios from HTN Towers and MNOs. As a result of acquisitions of multiple tower portfolios in the same markets, we often have multiple Towers in close proximity to each other. If it is economically and commercially viable to do so, and if agreed to by the tenant, we migrate Tenants from one Tower onto a nearby Tower as additional Colocation and then decommission the empty site. While the decommissioning of Towers offsets our overall growth in the number of Towers, it allows us to eliminate duplicative cost of sales and ongoing maintenance capital expenditures of the decommissioned tower with only a marginal cost of sales increase at our retained sites through increased power consumption. We aim to continue working with our customers to determine if we can improve our service offerings through further decommissioning.
Site management and maintenance
We deploy a combination of in-house personnel and third-party contractors to manage and maintain our Towers. In-house personnel are responsible for oversight and supervision of all aspects of preventative and corrective maintenance and site management, including managing the operational aspects of customer relationships, managing structural engineering and tower capacity issues, ensuring proper signage, and supervision of independent contractors. We engage numerous suppliers to provide various services in connection with site acquisition, construction, access management, security and preventative and corrective maintenance of tower sites, as well as the supply of diesel to certain of our sites. As of December 31, 2021, we had entered into outsourcing arrangements for certain services in respect of 71% of our sites.
For example, we have outsourced power management, refurbishment, operations and maintenance and security functions at some of our sites to third-party contractors. These power management functions include the supply of diesel to certain sites and deployment of alternative power technologies that we configure and design, such as hybrid and solar power technologies, on certain sites, to help reduce diesel consumption to a contracted volume. Third-party contractors providing material operational services are subject to strict contractual execution targets for both financial and operational performance. By entering into these agreements, we are able to ensure the proper functioning of our sites and fix our costs by setting maximum costs per site (subject to typical inflation escalation) with the third-party contractor providing the services. In addition to the service level agreements that need to be maintained, outsourcing to contractors allows us to budget more effectively.
Site maintenance and management activities include:
Site monitoring and control
Our NOCs are 24-hour fully operational management centers from which our personnel monitor and control the tower sites from a central location. Remote monitoring systems allow us to better monitor, regulate and control site conditions, including, among other things, site AC, DC, load, power consumption per tenant, diesel usage and tank levels, environmental alarms (shelter temperatures, smoke detectors, etc.) and remote access control. We have remote monitoring systems installed in
68
six of our nine markets covering 88% of our sites within these six countries (with monitoring of almost all remaining sites through MNO network operating centers). Our NOCs are operated 24 hours a day, seven days a week and monitor a variety of data sent from our Towers. Such data includes access and gate status, diesel supply, usage and quality, cabinet temperature and overall power uptime, consumption and supply. Given the current operating environment in Latin America and no provision of service levels to customers, our businesses in Brazil, Peru and Colombia do not require NOCs.
The activities conducted in the NOCs ensure that we provide our customers with quality service and uptimes. We have averaged a power uptime of 99.7% across our tower portfolio in our African markets for the year ended December 31, 2021, with an average mean time to repair of under two hours for the year ended December 31, 2021.
Security
The protection of our sites is key to ensuring the sustainability of our business. We ensure that our Towers generally have fencing and security lights and, where relevant, such as in our African markets, our sites are guarded by outsourced security guards. We apply rigorous access control policies at the sites and require each visitor to be pre-approved with customer representatives. Our remote monitoring systems also allow us to track all access to restricted areas on the sites.
Power and Power Management
The reliability of main grid electricity varies considerably across our footprint and determines, along with the requirements of any one site, the most appropriate power system for that site. Specifically in our African markets where there can be a lack of reliable main grid electricity supply, we currently source a substantial amount of our power needs for daily operations from a combination of diesel generators, solar panels, and deep cycle batteries. As of December 31, 2021, 42% of our sites in our African markets were powered with hybrid power systems (a combination of diesel generators with solar and / or battery systems), 28% with only generators, 24% with grid connectivity and back-up generators, with the remaining 7% powered through only grid connectivity or solar power and other systems. As of December 31, 2021, 8,829 of sites in Africa had solar power solutions, representing 36% of our Towers in Africa. In Latin America and Kuwait our sites are typically powered by the grid solutions, with back-up power systems in certain instances. We, or third-party contractors we have engaged for certain sites, are responsible for monitoring the diesel levels of our generator tanks and scheduling diesel deliveries. Given the importance of diesel for the operation of our sites in many of our African markets, we may purchase diesel in large quantities, which is then stored at our facilities.
To address the costs associated with diesel generator usage and maintenance in our African markets, we introduced hybrid battery power systems, which involve alternating between power storage sources, such as batteries (VRLA and lithium ion) and diesel generators. On certain sites, we have also switched from using 3-phase AC generators to DC generators or single phase generators, which consume less diesel. We have also begun deploying hybrid solar power systems on certain sites.
We continuously evaluate innovative power management technologies and solutions, including more efficient generators, hybrid battery systems and solar systems. We outsource certain services, including power management and site maintenance for our sites, which includes over 9,000 sites in Nigeria where we have deployed hybrid power systems. These systems use batteries and/or solar power systems, along with traditional generators, to reduce fuel costs and create a more consistent energy supply to increase network uptime for our customers. In Nigeria, the deployment of these power management solutions resulted in, on average, an approximately 50% reduction in diesel consumption per tower at the time of deployment on the more than 7,400 sites where we have deployed hybrid power solutions that include solar power.
Given the reliable grid connectivity and power pass through nature of most customer contracts in Kuwait and our Latin American markets, power management is less of a focus in these markets.
Replacement of power systems in cycles forms a significant part of our annual maintenance capital expenditures, which are in the range of $2,000 to $7,000 per Tower per year in our African and Middle Eastern businesses. Given the different power environment in our Latin America business, annual maintenance capital expenditures are currently less than $500 per tower per year.
69
Fiber Services
In certain of our markets, we have begun providing certain fiber services, including the deployment and operation of fiber access networks and infrastructure. In Brazil, through our I-Systems subsidiary, we deploy and operate a fiber infrastructure that is primarily rented back to TIM Brasil for its provision of residential broadband services to consumers, which is referred to as a Fiber-to-the-Home (“FTTH”) network. I-Systems is responsible for the deployment of the relevant fiber node as well as the secondary fiber network connected to that node, including the fiber drop at a consumer’s premise. I-Systems is also responsible for the ongoing management and maintenance of that fiber network. In certain of our African markets, we also provide Fiber-to-the-Tower services, where we deploy fiber to towers that we own or operate.
Customer Lease Agreements
We lease space on Towers to our customers pursuant to a combination of MLAs, which provide the commercial terms governing the lease of tower space, MLL agreements, and individual SLAs, where relevant, which act as an appendix to the relevant MLA, and include site-specific terms for each relevant tower.
Customer lease agreements, whether long-term lease agreements, master tower space use agreements or other MLAs such as Managed with License to Lease Agreements, or MLLs, are the principal agreement between the customer and us. These govern the ongoing and long-term customer relationship and provide the commercial terms governing the lease of tower space. As of December 31, 2021, the average remaining length of our MLAs was 6.0 years. An MLA typically has an initial term of 5 to 15 years and will stay in effect until the parties renew or sign a new tower lease agreement. When we acquire portfolios of towers or construct towers for customers in new markets, we typically sign an MLA with a minimum duration of 10 years. A number of the MLAs with our customers are deemed automatically renewed if not cancelled by the stated expiration date. The material commercial terms of our MLAs are typical for the tower infrastructure industry in our markets and include contractual provisions setting out, among other things, pricing, renewal clauses, termination clauses, inflation-linked price escalations and, in certain cases, provisions designed to mitigate foreign exchange risk.
In addition to the other types of MLA described above, we also operate sites owned by an MNO through Managed with License to Lease Agreements. Where there is an MLL agreement, we have the right to lease out space on the tower to other MNOs and provide services, generating further revenue for us. The site owner reduces its operating costs, eliminates capital expenditures and frees up management time.
Our MLL agreements typically have a term of 15 years with a five-year renewal period. Our two current MLL Agreements also grant the Tenant the option to withdraw from five sites per year, not to exceed 50 sites across the full term, and provided there is no other Tenant on each site. As of December 31, 2021, the average remaining duration of our two MLL agreements was 6.2 years and the total number of Tenants on sites operated under MLL agreements is approximately 3,413.
The table below outlines collectively the typical key contract terms of our customer lease agreements with our Key Customers as of December 31, 2021:
Remaining Duration of Current Extension Country Duration of MLA Term Option Nigeria 5 – 15 years 6.7 years 5 years extendable terms Côte d’Ivoire 10 – 15 years 3.7 years 5 years extendable terms Cameroon 10 – 15 years 3.7 years 5 years extendable terms Zambia 10 years 2.9 years 3 – 5 years extendable terms Rwanda 10 years 4.1 years 3 – 5 years extendable terms Kuwait 10 years 8.1 years 5 years extendable term Brazil, Peru and Colombia* 5 – 20 years 7.4 years 5 – 20 years on a site by site basis * Includes I-Systems, with remaining MLA term weighted by OLTs
For the year ended December 31, 2021, 48% of our revenues were linked to the U.S. dollar, 15% of our revenues were linked to the euro and 5% of our revenues were linked to the cost of diesel. However, the manner in which these revenues are linked differs by lease agreement. The U.S. dollar-linked contracts with U.S. dollar revenue components typically have
70
a formula for determining the U.S. dollar to local currency exchange rate over a period of time. For example, for the majority of MLAs in Nigeria, the U.S. dollar component of the monthly lease fee is converted to Naira for settlement at a fixed conversion rate for a stated period of time. The conversion rate in such MLAs is reset after a period of three months, six months or a maximum of 12 months. Of our 48% of revenues linked to the U.S. dollar for the year ended December 31, 2021, 3% reset on a monthly basis, 78% reset on a quarterly basis, 3% reset on a semi-annual basis and 16% reset on an annual basis. While we reached agreement in 2020 with our Key Customers in Nigeria to update the reference exchange rate in our contracts to the prevailing market rate available on Bloomberg (which has typically been aligned to the NAFEX rate), historically, the conversion rates included in some of our MLAs was different to the rates at which our financial results have been translated into U.S. dollars for reporting purposes. For example, as described under Item 3.D. “Risk Factors — Risk Relating to our Business — The existence of multiple foreign exchange markets with different exchange rates may impact the rate at which our operating subsidiaries’ financial results are translated into U.S. dollars for group reporting purposes, which may impact our financial condition and/or results of operations,” in April 2017, the CBN introduced a new foreign exchange window for investors and exporters that resulted in the conversion rates for our MLAs for our Nigerian operations to be different from the rates at which our financial results were translated into U.S. dollars for reporting purposes. As of January 1, 2018, our financial results in Nigeria are translated into U.S. dollars based on the NAFEX rate, which differed from the rates included in some of our MLAs until the recent amendments to the contracts with certain of our Key Customers in Nigeria to update the reference exchange rates therein to the prevailing market rate available on Bloomberg. Certain of our other contracts, such as in Côte d’Ivoire and Cameroon, are linked to foreign currencies such as the euro because they are based on local currencies that are “pegged” to such foreign currencies. In Kuwait and Latin America, our MLAs are based on local currency pricing with no direct foreign exchange link or conversion mechanism. See also Item 3.D. “Risk Factors — Risks Relating to Our Business — We and our customers face foreign exchange risks, which may be material.”
We also benefit from power indexation clauses in some of our MLAs, which provide pass-through provisions in relation to increased diesel prices. These provisions help us mitigate exposure to volatility in diesel prices. For example, in certain MLAs where there is a certain percentage increase or decrease in the per liter price of diesel above or below an agreed base price, such percentage increase or decrease is also applied to a portion of the full monthly lease fee. For the year ended December 31, 2021, 5% of revenue was linked to the cost of diesel through power indexation clauses.
Except for certain material events of default, our MLAs may only be terminated prior to the agreed termination date according to the agreed notice period. As a result, we believe that revenue earned from lease fees provide a highly visible and recurring revenue stream. As of December 31, 2021, the average remaining length of our MLAs was 6.0 years, with an average remaining lease term of 7.3 years.
We expect that our MLAs and MLLs will generally experience a high renewal rate because (i) the locations of many of the Towers are critical to the efficient and cost effective operation of the Tenants’ telecommunications networks, (ii) there are cost and time implications to our customers associated with re-configuring antenna equipment across multiple towers when relocating, (iii) there is often a lack of alternative sites and other operators within a required proximity, and (iv) there are site acquisition, regulatory compliance issues and other barriers associated with the construction of New Sites and the relocation of antenna equipment.
Site Lease Agreements
In addition to the MLA, where a customer requests new space for additional Colocation or New Sites, pursuant to some of our existing MLAs, we sometimes also enter into one or more SLAs with that customer, which include certain site-specific arrangements. The tenure of an SLA varies between 5 and 10 years depending on the length of the underlying MLA and typically includes renewal clauses based on certain agreed conditions. The material commercial terms will be agreed in the relevant MLA, with the SLA including site-specific terms such as equipment loading.
Renewals of SLAs are generally linked to the extension of the term of the related MLA.
Lease Fees
Lease fees for the services we provide are normally invoiced to Tenants in advance or arrears on a monthly or quarterly basis. The average lease fee received from a new tenant is generally fixed for the initial term of the MLA or MLL, which generally include an annual inflation-linked escalation, and cover:
• Power requirements;
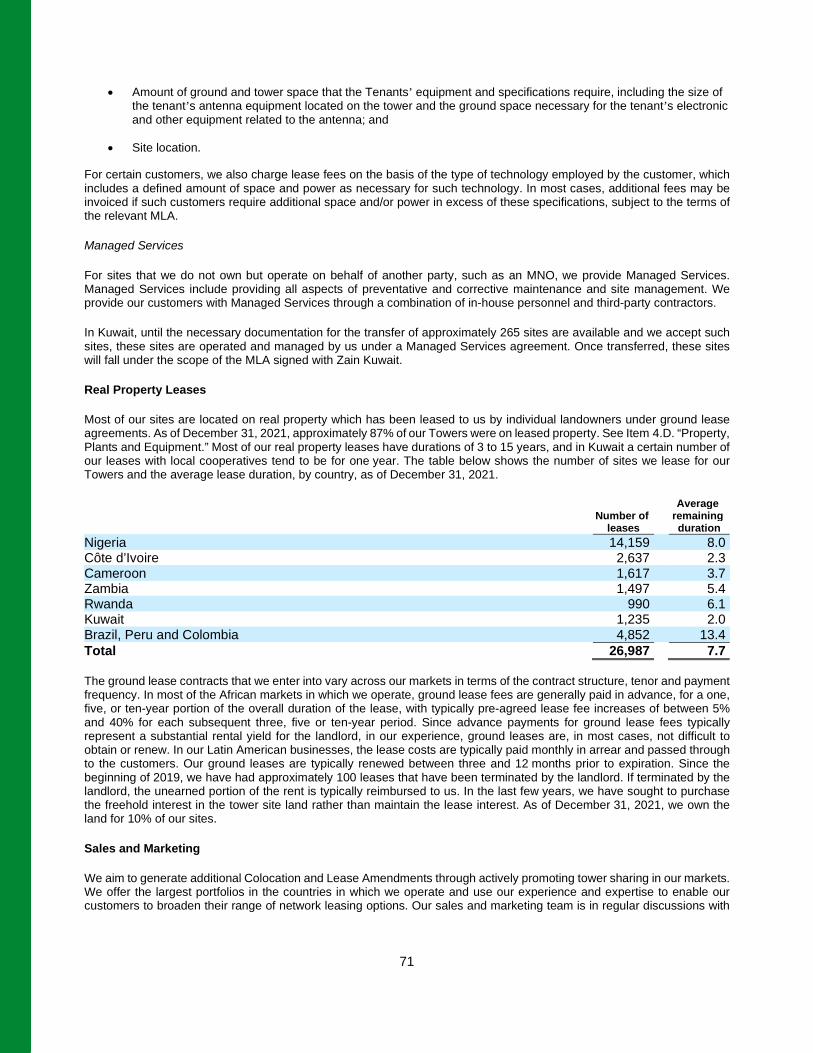
71
• Amount of ground and tower space that the Tenants’ equipment and specifications require, including the size of the tenant’s antenna equipment located on the tower and the ground space necessary for the tenant’s electronic and other equipment related to the antenna; and
• Site location.
For certain customers, we also charge lease fees on the basis of the type of technology employed by the customer, which includes a defined amount of space and power as necessary for such technology. In most cases, additional fees may be invoiced if such customers require additional space and/or power in excess of these specifications, subject to the terms of the relevant MLA.
Managed Services
For sites that we do not own but operate on behalf of another party, such as an MNO, we provide Managed Services. Managed Services include providing all aspects of preventative and corrective maintenance and site management. We provide our customers with Managed Services through a combination of in-house personnel and third-party contractors.
In Kuwait, until the necessary documentation for the transfer of approximately 265 sites are available and we accept such sites, these sites are operated and managed by us under a Managed Services agreement. Once transferred, these sites will fall under the scope of the MLA signed with Zain Kuwait.
Real Property Leases
Most of our sites are located on real property which has been leased to us by individual landowners under ground lease agreements. As of December 31, 2021, approximately 87% of our Towers were on leased property. See Item 4.D. “Property, Plants and Equipment.” Most of our real property leases have durations of 3 to 15 years, and in Kuwait a certain number of our leases with local cooperatives tend to be for one year. The table below shows the number of sites we lease for our Towers and the average lease duration, by country, as of December 31, 2021.
Average Number of remaining leases duration Nigeria 14,159 8.0 Côte d’Ivoire 2,637 2.3 Cameroon 1,617 3.7 Zambia 1,497 5.4 Rwanda 990 6.1 Kuwait 1,235 2.0 Brazil, Peru and Colombia 4,852 13.4 Total 26,987 7.7 The ground lease contracts that we enter into vary across our markets in terms of the contract structure, tenor and payment frequency. In most of the African markets in which we operate, ground lease fees are generally paid in advance, for a one, five, or ten-year portion of the overall duration of the lease, with typically pre-agreed lease fee increases of between 5% and 40% for each subsequent three, five or ten-year period. Since advance payments for ground lease fees typically represent a substantial rental yield for the landlord, in our experience, ground leases are, in most cases, not difficult to obtain or renew. In our Latin American businesses, the lease costs are typically paid monthly in arrear and passed through to the customers. Our ground leases are typically renewed between three and 12 months prior to expiration. Since the beginning of 2019, we have had approximately 100 leases that have been terminated by the landlord. If terminated by the landlord, the unearned portion of the rent is typically reimbursed to us. In the last few years, we have sought to purchase the freehold interest in the tower site land rather than maintain the lease interest. As of December 31, 2021, we own the land for 10% of our sites.
Sales and Marketing
We aim to generate additional Colocation and Lease Amendments through actively promoting tower sharing in our markets. We offer the largest portfolios in the countries in which we operate and use our experience and expertise to enable our customers to broaden their range of network leasing options. Our sales and marketing team is in regular discussions with
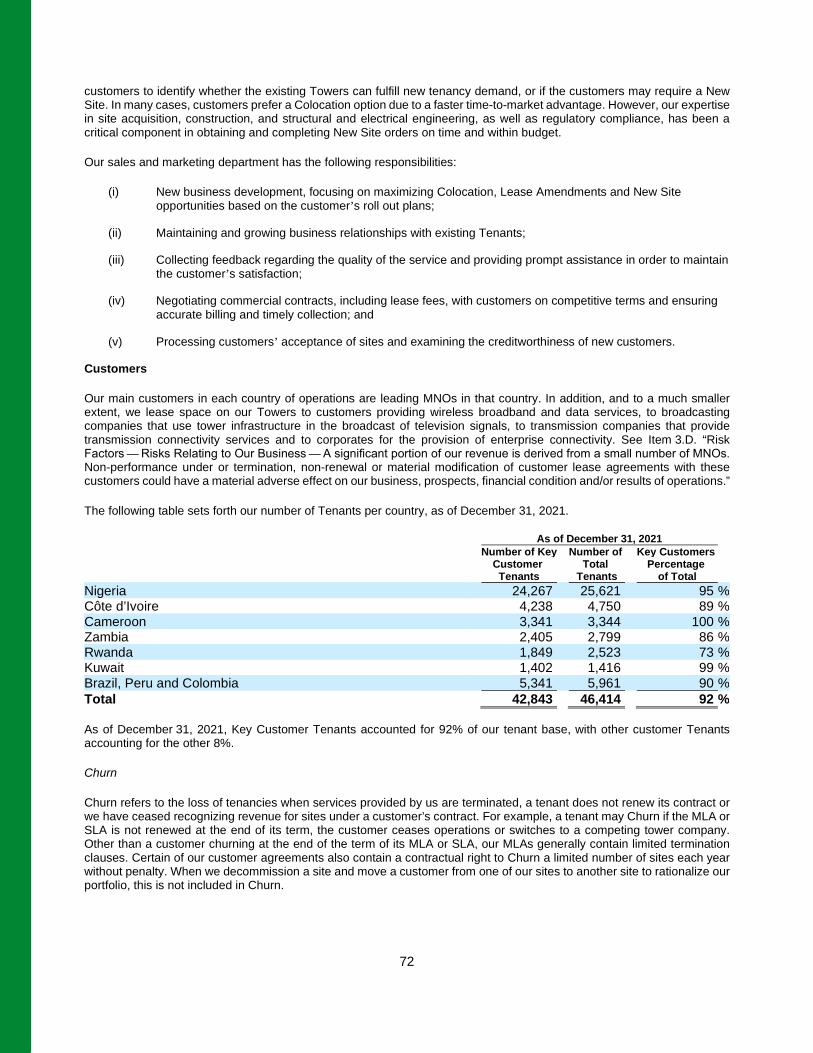
72
customers to identify whether the existing Towers can fulfill new tenancy demand, or if the customers may require a New Site. In many cases, customers prefer a Colocation option due to a faster time-to-market advantage. However, our expertise in site acquisition, construction, and structural and electrical engineering, as well as regulatory compliance, has been a critical component in obtaining and completing New Site orders on time and within budget.
Our sales and marketing department has the following responsibilities:
(i) New business development, focusing on maximizing Colocation, Lease Amendments and New Site opportunities based on the customer’s roll out plans;
(ii) Maintaining and growing business relationships with existing Tenants;
(iii) Collecting feedback regarding the quality of the service and providing prompt assistance in order to maintain the customer’s satisfaction;
(iv) Negotiating commercial contracts, including lease fees, with customers on competitive terms and ensuring accurate billing and timely collection; and
(v) Processing customers’ acceptance of sites and examining the creditworthiness of new customers.
Customers
Our main customers in each country of operations are leading MNOs in that country. In addition, and to a much smaller extent, we lease space on our Towers to customers providing wireless broadband and data services, to broadcasting companies that use tower infrastructure in the broadcast of television signals, to transmission companies that provide transmission connectivity services and to corporates for the provision of enterprise connectivity. See Item 3.D. “Risk Factors — Risks Relating to Our Business — A significant portion of our revenue is derived from a small number of MNOs. Non-performance under or termination, non-renewal or material modification of customer lease agreements with these customers could have a material adverse effect on our business, prospects, financial condition and/or results of operations.”
The following table sets forth our number of Tenants per country, as of December 31, 2021.
As of December 31, 2021 Number of Key Number of Key Customers Customer Total Percentage Tenants Tenants of Total Nigeria 24,267 25,621 95 % Côte d’Ivoire 4,238 4,750 89 % Cameroon 3,341 3,344 100 % Zambia 2,405 2,799 86 % Rwanda 1,849 2,523 73 % Kuwait 1,402 1,416 99 % Brazil, Peru and Colombia 5,341 5,961 90 % Total 42,843 46,414 92 % As of December 31, 2021, Key Customer Tenants accounted for 92% of our tenant base, with other customer Tenants accounting for the other 8%.
Churn
Churn refers to the loss of tenancies when services provided by us are terminated, a tenant does not renew its contract or we have ceased recognizing revenue for sites under a customer’s contract. For example, a tenant may Churn if the MLA or SLA is not renewed at the end of its term, the customer ceases operations or switches to a competing tower company. Other than a customer churning at the end of the term of its MLA or SLA, our MLAs generally contain limited termination clauses. Certain of our customer agreements also contain a contractual right to Churn a limited number of sites each year without penalty. When we decommission a site and move a customer from one of our sites to another site to rationalize our portfolio, this is not included in Churn.
73
We experienced Churn in the years ended December 31, 2019, 2020 and 2021, of 305, 381 and 1,283 Tenants, respectively. The Churn that we have historically experienced from our Key Customers has been limited.
Competition
We believe that competition in the tower infrastructure industry in emerging and less developed markets (including markets such as the Middle East and Latin America) is based on, among other things, power management expertise, tower location, relationships with telecommunications operators, tower quality and height, pricing and ability to offer additional services to tenants and operational performance, as well as the size of a company’s site portfolio and its ability to access efficient capital. We compete with other global tower companies, both for new business and for the acquisition of assets.
For example, in 2014, certain MNOs, including MTN Nigeria, Airtel Nigeria and Etisalat Nigeria (now known as 9mobile) concluded sale and lease back transactions of their previously owned site portfolios in Nigeria.
These transactions led to the emergence of ATC as the other major independent tower company in Nigeria, with a site portfolio of approximately 5,400 towers following the acquisition. ATC is our primary competitor in Nigeria and Africa. We are the market leader in Africa by tower count with 24,732 towers as of December 31, 2021, compared to ATC with 22,165 towers and SBA Communications with approximately 1,000 towers as of December 31, 2021 and Helios Towers Plc with 8,765 towers as of September 30 2021. In Brazil, the competitive landscape is wider with ATC and SBA owning approximately 23,000 and 10,000 towers, respectively, and numerous smaller tower companies of similar size or smaller to the CSS business we acquired. The Brazilian competitive landscape presents opportunities for consolidation. We also compete to a lesser extent with telecommunications operators who have retained their own towers and continue to manage them and make them available for colocation. In certain circumstances, we also compete with owners of alternative site structures such as building rooftops, outdoor and indoor DAS networks, billboards and electric transmission towers. In addition, there may be increased competition in the future from other independent tower companies operating in, or that may enter, our markets. In particular, we may face competition in Latin America from other telecommunication operators who may have a substantially larger site portfolio or have operated in the region for a longer period of time than we have.
In relation to building New Sites, in Africa we have typically been the only company that is building for our major customers. In Brazil, New Sites forms a key part of our organic growth strategy and prior to the CSS Acquisition, the CSS business was a market leader in New Site volumes. For further information regarding the competitive landscape of the tower industry and related risks, please refer to Item 3.D. “Risk Factors — Risks Relating to Our Business — Increased competition in the tower infrastructure industry may materially and adversely affect our business.”
Permits and Regulation
Overview
We are subject to regulatory requirements relating to licensing and registration in most of the countries in which we operate. The regulations and procedures guiding the operation, location and leasing of telecommunications towers are generally drawn from national, state and local legislation, regulations and administrative consents from the relevant government or governmental authorities in each jurisdiction in which we operate.
In each relevant jurisdiction, specific consents and/or permits are required to erect and own masts and towers. These consents generally relate to building or construction permits, property or land use permits, environmental permits and aviation clearance permits. As we continue to expand our offering to include services like fiber connectivity, rural offerings and other verticals, we may be subject to increased regulatory, license and permit obligations (including in respect of active telecommunications elements that may comprise part of the arrangements with customers). Non-compliance with applicable regulatory requirements, licenses, consents and permits may lead to shut down and/or decommissioning orders relating to the sites and/or monetary fines and/or an inability to continue our business or pursue new business lines or investments.
License to operate
Most of the jurisdictions in which we currently operate have a license or authorization regime to operate a passive telecommunications infrastructure business. Where applicable, licenses or authorizations are issued by the relevant national
74
regulator which regulates our operations in such country. A summary of some of these key licenses and/or authorizations is as follows:
• Cameroon. The Ministry of Posts and Telecommunications (Ministere des Postes et Telecommunications) issued a five-year renewable license to IHS Cameroon from November 2017.
• Côte d’Ivoire. While the licensing regime for the passive telecommunications infrastructure sector is currently in the process of being finalized by the government, IHS Côte d’Ivoire operates under a General Authorization (Autorisation Générale) issued for two years by ARTCI. On July 27, 2021 we received a notification letter from ARTCI confirming their decision to renew our General Authorization for two years, pending the issuance of a final signed decree (the “ARTCI Decision Renewal”). As of the date of this Annual Report, we have not received the signed decree or definitive General Authorization. The ARTCI Decision Renewal allows us to continue to operate even after the expiration of the existing authorization in June 2021 whilst we wait for delivery of definitive General Authorization.
• Nigeria. The NCC has issued Infrastructure Sharing and Colocation Licenses to each of IHS Nigeria Limited, INT Towers Limited and IHS Towers NG Limited. Each such license is granted for a period of 10 years and is renewable at its expiration for a subsequent period of 10 years. The NCC has also issued a Unified Access Service Licence to Global Independent Connect Limited for a period of 15 years, which is renewable at its expiration for a subsequent period of 15 years. None of our operating subsidiaries’ licenses are due for renewal before December 2024.
• Rwanda. The Rwanda Utilities Regulatory Authority, or RURA, has issued a license to each of our Rwanda operating entities. These licenses are valid for an initial period of 15 years and each license can be renewed for successive five year periods.
• Zambia. ZICTA has issued a Network (National) License to IHS Zambia, which is valid for an initial period of 15 years and can be renewed for subsequent periods of 10 years after the expiration of its initial term.
• Kuwait. IHS Kuwait Limited operates under (1) a commercial license issued by the Kuwait Ministry of Commerce and Industry valid until July 8, 2023; (2) an investment license issued by the Kuwait Direct Investment Promotion Authority valid until July 8, 2023; and (3) an operational license issued by the Communication and Information Technology Regulatory Authority valid until July 7, 2034.
• Egypt. The National Telecom Regulatory Authority (“NTRA”) has issued IHS Egypt a license to construct, operate and lease wireless communication towers within the Arab Republic of Egypt in accordance with the rules, conditions and specifications specified in the regulatory framework issued by NTRA in 2020. The license is valid for an initial period of 15 years from October 2021 and can be renewed for subsequent periods of 10 years after the expiration of its initial term (or any renewed term) upon a written request submitted by the licensee to the NTRA at least three years before the end of the original license period or any renewed periods thereof.
• Brazil. Tower operators do not require any tower company specific license, authorizations, registrations, notifications and consents issued by the Brazilian regulatory authorities. All providers of multimedia communications services (Serviço de Comunicação Multimídia), which includes providers of fiber connectivity, are required to have a license issued by Anatel (Licença SCM — Serviço de Comunicação Multimídia) in order to operate in Brazil. I-Systems holds the required license.
• Colombia. Our Colombian entities do not require any tower company specific license.
• Peru. Our Peruvian entity holds an infrastructure provider registration certificate issued by the Peruvian Ministry of Communications which permits us to provide tower space to MNOs. It was renewed in July 2021 for an indefinite term.
Land Use
In most of the countries in which we operate, a building permit from the relevant public authority, such as the municipality or local district, is sufficient for building a telecommunications tower. The number of permits, payments and consents relating to land usage tends to be higher in Nigeria and Brazil, largely due to the administrative structure of the Nigerian government (generally divided between federal, state and local government authorities). In Rwanda, RURA operates as the single
75
provider of all relevant permits and grants any relevant building permit relating to sites after permissions or non-objections have been received from local and environmental authorities.
Consequences for failure to obtain building or construction permits may include a requirement to dismantle a tower which, in some areas, such as Lagos state in Nigeria, may be at the expense of the owner of the tower.
In addition to the permits and authorizations referred to above, we must enter into agreements relating to the right of land usage for each site on which a tower is located. This can take the form of a lease agreement, a concession agreement or title documentation for those sites where we have acquired the underlying land. In some countries, such as Cameroon, Côte d’Ivoire and Nigeria, a lease agreement needs to be registered with the relevant authorities. See “— Real Property Leases.”
Civil Aviation
Aviation regulations may apply to the building and operation of towers. While in the majority of cases, aviation regulations provide for a one-off clearance by the respective civil aviation authority prior to the construction of a site located in the vicinity of an airport, the Nigerian Civil Aviation Authority has a broader remit and requires a yearly renewal approval certificate in addition to prior consent before the construction of towers and masts installed within 15 kilometers of any airport, or within the proximity of helicopter pads and their approaches.
The Brazilian Civil Aviation Authority requires tower sites to obtain an approval certificate that must be renewed yearly. The Civil Aviation regulation in our other countries of operation typically encompasses an obligation to provide security lighting on towers and/or to paint them a certain color.
Others
In most of the countries where we operate, zoning restrictions and certain other restrictions may apply to tower construction. Any applicable radius requirements will largely depend on whether the construction is in an urban or rural area, and sometimes on the height of the structure. For example, in Nigeria, towers in excess of 55 meters in height may not be built within a one kilometer radius of another tower without the Nigerian Communications Commission’s prior consent, and there may also be set-back requirements based on distance to certain controlled access areas, roads or high voltage power transmission lines; in Cameroon, the minimum distance required between sites is generally 750 meters in residential areas and two kilometers in non-residential areas; and in Rwanda, the minimum distance required between sites is generally 500 meters in urban areas and one kilometer in rural areas.
In addition to the main licenses, permits and consents listed above, additional regulations may also apply to certain operations. For example, depending on the location of a site, a Lagos State Infrastructure Maintenance Agency (previously the Urban Furniture Regulatory Unit) consent may be required in Nigeria, which may require a tower to be painted a certain color or to be disguised, and the Federal Capital Development Authority may require a tower situated in Abuja to be disguised.
Sustainability Program
Through our business model, we aim to make a positive impact in society and in promoting shared values. Our investment in telecommunication infrastructure aims to help connect individuals, businesses and communities to one another. As telecommunication connectivity reaches more people, and is consumed in more diverse modes, it creates more jobs, and greater opportunities for people, businesses and communities to thrive and prosper. As a critical element of the telecommunications value chain in our markets, we help deliver connectivity to almost 600 million people across our current nine-country footprint. This is crucial in emerging and less developed markets where the need for digital infrastructure and connectivity is particularly high. We provide infrastructure to be shared by multiple customers, rather than duplicating investment and infrastructure build.
Additionally, our business model allows us to tackle significant community issues through providing our infrastructure, such as a lack of reliable power in our African markets and an over reliance on GHG emitting diesel generators, as well as a lack of digital connectivity in rural communities.
To reduce our carbon footprint and provide better end service to our customers, we have historically invested in carbon reductions solutions such as batteries, solar and other clean energy sources at our sites. As of December 31, 2021,
76
approximately 36% of our African sites had solar power available to them, with the remainder relying on a combination of generators, hybrid and recycled batteries, and the grid.
In 2021, we continued to expand our rural telephony network services, launched in 2020, in Nigeria. This solution aims to provide remote communities with 2G and 3G voice and data access so that they can benefit from the socioeconomic opportunities made available by mobile connectivity. By deploying an efficient solar powered network solution, connected by dedicated very-small-aperture terminal transmission links, we had established a total of 245 operational rural telephony sites, all powered exclusively by solar, as of December 2021.
During 2021, we also continued advancing our sustainability efforts on multiple fronts across our markets. We finalized our first Group-level sustainability partnership for a three-year period with UNICEF on their Giga initiative. To be implemented from Q1 2022, this partnership includes a financial donation of $4.5 million and contribution-in-kind in four IHS markets to accelerate school connectivity mapping.
In September 2021, we launched IHS’ Frontline Workers Initiative across all our African markets for employees in grades 7-10 as new philanthropic program designed to recognize and reward the outstanding contribution made during the COVID-19 pandemic by our frontline workers. For IHS, this included our field engineers, drivers and security personnel. This cohort went above and beyond to maintain our towers and network uptime throughout the pandemic, in the face of extreme challenges. In recognition of their contribution, we committed ourselves to delivering a program of appropriate scope, scale, and impact, that seeks to improve the lives of this group by addressing inequalities in socio-economic status and education. The initiative’s first phase focuses on providing the children of our frontline workers, and lower-income employees in our four lowest pay grades, with financial scholarships to top level in-country and international universities. We are committed to both recognizing the important role frontline workers, who traditionally inhabit the low-income roles, play in society and how COVID-19 has further deepened global income inequality.
Our four-pillar strategy
In addition to the inherent sustainability in our business model and helping the digital agenda in our nine countries of operation advance through infrastructure provision, to support further sustainable growth, we have also developed a Sustainability strategy built on four pillars: (i) environment and climate change, (ii) education and economic growth, (iii) our people and communities and (iv) ethics and governance. Having become a Signatory of the UN Global Compact in 2020, we are expected to produce an annual ‘Communication on Progress’ covering how we are supporting the Compact’s ten principles in areas such as human rights, labor standards, the environment and anti-corruption, and our 2020 sustainability report serves as our first CoP. We believe that our sustainability programs contribute to nine out of the 17 United Nations Sustainable Development Goals, or UN SDGs. The UN SDGs call for governments, business and society “to end poverty and create a life of dignity and opportunity for all within the boundaries of the planet,” and we intend to use these goals to inform future targets and programs so we can track and better measure our impact.
Each year, our in-country teams assess local community needs through the lens of our four-pillar Sustainability strategy to help develop our in-country Sustainability programs, aiming to identify clear actions and commitments for relevant projects.
Education is a significant priority for our in-country teams, as we believe education is key to social and economic development. We concentrate many of our community-building initiatives on strengthening local education systems, particularly in the areas of science, technology, engineering and mathematics, or STEM, in part to help foster the future talent of our industry. Across the Group, we partner with local universities to provide undergraduate students with practical exposure to the telecommunications sector. For example, in Kuwait, we hosted three graduate interns with Engineering degrees in partnership with the Kuwait Fund for Arabic Development, while in Rwanda we continued a STEM-subject focused partnership with the University of Rwanda. Under this program, we host undergraduates who are studying STEM-related subjects at the University to take a three-month internship in IHS Rwanda’s Technical department for first-hand exposure to telecommunications engineering.
Similarly, we signed a partnership with the African Institute for Computer Science in Cameroon to support the training of 150 young people in Computer Science. In Côte d’Ivoire, we marked the International Day of Women and Girls in Science on February 11 by organizing a careers day, in partnership with MTN Côte d’Ivoire, for more than 600 female pupils.
In Nigeria, we partnered with Save the Children International to help more girls in the north-eastern regions, such as Borno and Yobe, access education. Despite the 2004 Nigeria Universal Basic Education Act, many girls in the region are still not in school, putting them at increased risk of gender-based violence and child marriage. Under this partnership, IHS Nigeria will be helping provide approximately 24,000 girls, aged between 6 and 14, with access to quality education.
77
We also believe in improving educational facilities. Since 2017, we have refurbished approximately 50 classrooms. This includes the Queen Amina Girls School in Kaduna State Nigeria, which we first refurbished in 2017 and re-visited in 2021 to help transform its ICT laboratory into a Center of Excellence to improve digital literacy. In Rwanda, we committed to constructing six classrooms as part of the government’s initiative to build 22,505 new facilities to reduce overcrowding and the distance children travel to school.
Under our Group-wide Generator Recycling Program, we refurbish old generators from our sites and donate them to schools, orphanages, hospitals, medical and community centers. Since the program launched in 2017, we have donated approximately 270 generators, across our five African markets providing a power source where electricity grids are often intermittent and unreliable. In Kuwait, we launched our first air-conditioning recycling program, donating 15 recycled units to the public-benefit society Balad Al-Khair to help support vulnerable residents during extreme heat.
We also support the professional development of our employees. Through our online learning platform through the IHS Academy, launched in 2017, we provide thousands of training items for employees to access 24/7 wherever they are in the world. Content is available in multiple different formats including e-learning courses, videos, workshop recordings, self-guided handouts and more. We have continued to expand our Women In IHS Network, or WIIN, mentoring program, which was launched in 2020, as part of our commitment to increase gender diversity in our workforce. With over 220 mentoring pairs formed in the first year, this program provides opportunity for all IHS female employees to be mentored and aims to help facilitate new professional relationships, enabling mentees to build networks and improve skillsets.
During the COVID-19 pandemic, we have supported relief efforts in multiple ways. First, mobile connectivity has been important for people worldwide during the pandemic, enabling them to work, study and access virtual medical support. As a critical component and starting point of that infrastructure, our role in providing connectivity has been vital. While we have continued to support our local communities in their COVID-19 relief efforts, we have broadened the health initiatives to assist communities on multiple fronts. In Nigeria, our ‘Project Clinic without Walls’ takes mobile health center into underserved communities, so inhabitants have better access to doctors and, where needed, hospital referrals. In 2021, we upscaled this to become the Project Clinic Without Walls, offering assistance to 2,083 individuals in eight communities across four states in 2021 alone.
In 2021, our business continued to expand and, as part of this growth, we remain cognizant of our commitment to protecting and minimizing the impact of our operations on the environment. Throughout 2021, we have worked to quantify Scope 1 (direct emissions) and Scope 2 (indirect emissions), a workstream which will continue as we work to quantify our Scope 3 (value chain emissions) and work towards establishing a carbon reduction roadmap for the business. We continually work with our local communities to protect the environment. In Cameroon, we partnered with the environmental NGO WasteAid. Over 890kg of plastic waste was collected by IHS volunteers in one morning from a local area in Douala. We also strive to help educate the next generation and promote the importance of the circular economy. For example, we delivered a waste-management program across ten schools in Cote d’Ivoire in partnership with the NGO, Moi Jeu Tri. This program aims to tackle domestic waste issues by educating children on the importance of recycling. Children, teachers and volunteers organized waste, which was then deposited in a collection point, to be sent to a sorting center for integration into a new production process.
Finally, ethics is at the heart of all we do, and we are committed to acting with integrity and honesty in everything we do. Our corporate structure provides a strong governance foundation, which is driven from the Board down through the organization. Our Board committee structure is detailed in Item 6.C. “Board Practices.” We also publish an annual Sustainability Report.
Environmental Regulation
Our operations are subject to various national, state and local environmental laws and regulations, including those relating to the management, use, storage, disposal, emission and remediation of, and exposure to, hazardous and non-hazardous substances, materials and wastes and the siting of our Towers. We may be required to obtain permits, pay additional property taxes, comply with regulatory requirements and make certain informational filings related to hazardous substances or devices used to provide power such as batteries, generators and diesel at our sites. See Item 3.D. “Risk Factors — Risks Relating to our Business — We could have liability under health, safety and environmental laws.”
While no specific environmental authorizations are required to build or operate Towers in Cameroon, Côte d’Ivoire and Kuwait, specific regulations and authorizations apply in our other markets. In Rwanda and Zambia, the construction of a site requires a one-off prior approval from several environmental and local government authorities (the permit is ultimately granted by RURA, which is the single approver for all regulatory authorizations for our activities in Rwanda) and the Zambia
78
Environmental Management Agency, respectively. Similarly, in Brazil, Colombia and Peru, prior approval from the local environmental agency may be required before any new site is built and additional environmental authorizations might be required for sites built in protected areas. In Nigeria, environmental authorizations are required at two stages: the Federal Ministry of Environment requires an Environmental Impact Assessment to be issued prior to the construction of a site and every three years after a site is built an Environmental Audit Certificate needs to be issued or renewed by the National Environmental Standards and Regulations Enforcement Agency in respect of such site.
Insurance
We have insurance policies in relation to (i) property damage, business interruption and erection/construction, (ii) political violence, (iii) third-party liability and (iv) directors’ and officers’ liability.
We maintain an all-risks policy for property damage, business interruption and erection/construction. This policy covers against losses that might arise from damage or loss to the tower infrastructure, including earthquakes, windstorms and floods. A political violence policy was also purchased to cover material damage and business interruption caused by terrorist or sabotage acts. We also carry a general third-party liability policy, covering third-party property damage and third-party personal injury where we are found to be legally liable.
Each of our insurance policies is subject to contractual terms and conditions, limits of indemnity, deductibles and exclusions and therefore we may be prevented from recovering in full for losses or damages that we may suffer.
C. Organizational Structure
The legal name of our company is IHS Holding Limited and we are organized under the laws of the Cayman Islands. We are a holding company and conduct substantially all of our business through our operating subsidiaries. Note 30.1 to our consolidated financial statements contains our subsidiary names, principal activity, place of incorporation and legal ownership at December 31, 2021.
D. Property, Plant and Equipment
As of December 31, 2021:
• We lease a total of 4,137 square meters of office space and 31,152 square meters of warehouse space across Nigeria, and we own our Lagos office, at Plots 934 and 935 Idejo Street, Victoria Island, Lagos Nigeria;
• We lease a total of 12,450 square meters of office and warehouse space across Côte d’Ivoire;
• We lease a total of 10,232 square meters of office and warehouse space across Cameroon;
• We own our main office at Stand 12/1494 Corner Makishi and Mwalule Roads, Northmead Lusaka, Zambia and lease 4,296 square meters of warehouse space across Zambia;
• We lease 2,800 square meters of office and warehouse space in Kigali, Rwanda;
• We lease a total of 896 square meters of office space in the United Kingdom;
• We lease a total of 42 square meters of office space in the Netherlands;
• We lease a total of 1,442 square meters of office space in Dubai;
• We lease a total of 700 square meters of office and warehouse space in Kuwait;
• We lease a total of 2,799 square meters of office space in Brazil;
• We lease a total of 95 square meters of office space for our offices in Colombia; and
• We lease a total of 118 square meters of office space for our offices in Peru.
79
See Item 4.B. “Business Overview—Our Tower Portfolio” for information regarding the Towers owned and operated by us and Item 4.B. “Business Overview—Real Property Leases” for information regarding our ground lease agreements for the real property on which our Tower sites are located.
Item 4A. Unresolved Staff Comments
None.
Item 5. Operating and Financial Review and Prospects
A. Operating Results
You should read the following discussion of our operating and financial review in conjunction with our consolidated financial statements and the related notes included elsewhere in this Annual Report. The following discussion is based on our financial information prepared in accordance with International Financial Reporting Standards, or IFRS, as issued by the International Accounting Standards Board. Where appropriate these discussions are based on non-IFRS measures which are reconciled to an IFRS measure (refer to the Key Financial and Operational Performance Indicators).
This discussion contains forward-looking statements and involves numerous risks and uncertainties, including, but not limited to, those described in the “Risk Factors” section of this Annual Report. See “Cautionary Statement Regarding Forward-Looking Statements.” Our actual results could differ materially from those contained in any forward-looking statements.
The information called for by this Item 5, including a discussion of the year ended December 31, 2019 compared to the year ended December 31, 2020 has been reported previously in our final prospectus filed pursuant to Rule 424(b)(4) on October 15, 2021 under the Section “Management’s discussion and analysis of financial condition and results of operations”.
Overview
We are one of the largest independent owners, operators and developers of shared telecommunications infrastructure in the world, providing our customers, most of whom are leading MNOs, with critical infrastructure that facilitates mobile communications coverage and connectivity for approximately 600 million people in emerging markets, across three regions and nine countries. We are the largest independent multinational emerging-market-only tower operator and one of the largest independent multinational tower operators globally, in each case by tower count. As of December 31, 2021, we operated 31,043 Towers across five countries in Africa, three countries in Latin America and one country in the Middle East. We are the largest tower operator in six of the nine markets in which we operate and we are the only independent tower operator of scale in five of these markets.
We have a well-defined organic and inorganic expansion strategy designed to grow in existing markets with our existing and new customers and, given the significant global emerging market opportunities in telecommunications infrastructure, enter carefully selected growth oriented markets with compelling underlying fundamentals. Historically, our business has been predominantly focused on Towers, however we recently started complementing this with investment into adjacent telecommunications infrastructure offerings for our customers such as fiber connectivity. Aligned to this inorganic growth strategy, in February 2020 we completed the first closing of 1,022 towers in Kuwait through a controlling investment pursuant to the Kuwait Acquisition for the acquisition of up to 1,620 towers in the aggregate, with a further 333 towers transferred in subsequent closings. Also in February 2020 we completed the acquisition of 2,312 towers through a 100% investment pursuant to the CSS Acquisition with towers primarily in Brazil, as well as Peru and Colombia. In 2021, we acquired 1,005 towers in Brazil pursuant to the Skysites Acquisition, 819 towers in Brazil and Colombia pursuant to the Centennial Acquisition and also acquired certain fiber assets from TIM Brasil pursuant to the TIM Fiber Acquisition where TIM Brasil will be the anchor tenant on the fiber network. In October 2021, we signed an agreement pursuant to the Egypt Transaction and obtained a license to construct, operate and lease telecom towers in Egypt. More recently, in November 2021 and January 2022, we signed definitive transaction documentation to acquire 5,709 and 2,115 towers pursuant to the MTN SA Acquisition and GTS SP5 Acquisition, respectively. Each of these acquisitions supports our inorganic growth strategy of expanding into additional regions that meet our investment criteria, which opens up new markets that we believe will provide future organic and inorganic growth opportunities.
Our core business is providing shared telecommunications infrastructure services to MNOs and other customers, who in turn provide wireless voice, data and fiber access services to their end users and subscribers. We provide our customers
80
with opportunities to lease space on existing Towers alongside current Tenants, known as Colocation, to install additional equipment on a Tower or request certain ancillary services, known as Lease Amendments, or to commission the construction of new Towers to the customer’s specifications, known as New Sites. Additionally, we lease space to our customers in secure locations within large building complexes, such as shopping malls, stadiums and airports, which we refer to as in-building solutions, or IBS, or distributed antenna systems, or DAS, as well as provide fiber connectivity. In certain strategic instances, we may also provide Managed Services, such as maintenance, security and power supply for Towers owned by third parties. As of December 31, 2021, our owned and operated tower portfolio supported 46,414 Tenants, with a Colocation Rate of 1.5x.
Our primary customers are the leading MNOs in each of our markets. We also provide infrastructure and services to a number of other communications service providers. Our success in establishing deep customer relationships and operational excellence has enabled us to grow both organically and through 20 transactions, building a footprint that currently covers Nigeria, Côte d’Ivoire, Cameroon, Rwanda, Zambia, Brazil, Peru, Colombia and Kuwait. Our markets in Latin America (which we entered in 2020) are the only ones in which we do not have a leadership position today.
Initial Public Offering
On October 14, 2021, we completed our initial public offering (“IPO”) by issuing 18,000,000 ordinary shares at a price to the public of $21 per share, resulting in net proceeds to us of $357.7 million, after deducting the underwriting discount and commission of $21.7 million and net reimbursements of offering expenses of $1.4 million.
Reportable Segments
Our operations are organized into four segments, which reflect the way our chief operating decision maker, or CODM, is provided with financial information which aligns to internal regional management organizational reporting lines and responsibilities and the way in which the CODM analyzes performance and allocates resources. Our operating segments are Nigeria, which comprises our operations in Nigeria; Sub Saharan Africa, or SSA, which comprises our operations in Cameroon, Côte d’Ivoire, Rwanda and Zambia; and, subsequent to our acquisitions made in February 2020, Latin America, or Latam, which comprises our operations in Brazil, Colombia and Peru; and the Middle East and North Africa, or MENA, which comprises our operations in Kuwait and Egypt. Although full operations in Egypt have not commenced, the business has incurred some startup costs.
We use revenue and Segment Adjusted EBITDA to assess the performance of our reportable segments. Segment Adjusted EBITDA is our principal segment measure of profitability.
Our Revenue
We measure revenue in three categories, namely (i) organic, (ii) inorganic and (iii) non-core.
Organic revenue captures the performance of our existing business without the impact of new tower portfolios or businesses acquired since the beginning of the prior year period (except as described below). Specifically, organic revenue captures the impact of (i) new Colocation and Lease Amendments; (ii) changes in pricing including from contractual lease fee escalation and foreign exchange resets; (iii) New Site construction; and (iv) any impact of Churn and decommissioning. In the case of an acquisition of new tower portfolios or businesses, the impact of any incremental revenue after the date of acquisition from new Colocation and Lease Amendments or changes in pricing on the Towers acquired, including from contractual lease fee escalation and foreign exchange resets, is also captured within organic revenue.
Inorganic revenue captures the impact on revenue from existing Tenants of new tower portfolios or businesses that we have acquired since the beginning of the prior period (except as described above). Where tower portfolios or businesses were acquired during the current period under review, inorganic revenue is calculated as the revenue contribution from those acquisitions in their “at acquisition” state (measured as the local currency revenue generated during the first full month following the acquisition) in the current period. This treatment continues for 12 months following acquisition. We acquired an aggregate of 333 Towers and 347 Tenants from Zain Kuwait in October 2020, April 2021 and October 2021. In January 2021, we acquired 1,005 towers in Brazil pursuant to the Skysites Acquisition, which added 1,012 Tenants. In March and April 2021, we acquired an aggregate of 819 towers in Colombia and Brazil, pursuant to the Centennial Acquisition, which added 994 Tenants. In April 2021, we acquired a Tower portfolio in Rwanda which added 162 Towers and 283 Tenants. We therefore have inorganic revenue for the twelve months ended December 31, 2021.
81
Non-core captures the impact of movements in foreign exchange rates on the translation of the results of our local operations from their local functional currency into U.S. dollars, which is measured by the difference in U.S. dollars between (i) revenue in local currency converted at the average foreign exchange rate for that period and (ii) revenue in local currency converted at the average foreign exchange rate for the prior period. This foreign currency impact is then partially compensated for in subsequent periods by foreign exchange reset mechanisms, which are captured in organic revenue.
The organic and non-core components of our revenue cannot be considered independently from each other in assessing, for instance, what the impact on organic revenue would have been in the absence of change in the foreign exchange rate. In fact, the periodic (quarterly, semi-annually or annually) nature of our reset mechanisms is such that there is a delay between the period during which a change in foreign exchange rate occurs and the next contractual reset occurs.
Foreign exchange resets are generally included in MLAs where lease fees are linked to currencies other than the local currency (for example, MLAs in Nigeria with U.S. dollar components). MLAs with foreign exchange resets typically contain a mechanism for determining the foreign exchange rate for a set period at which the lease fee linked to the non-local currency (such as U.S. dollar) is translated into local currency and invoiced to the customer. In such cases, the foreign exchange rate determined by this mechanism is reset quarterly, semi-annually or annually.
The foreign exchange resets function such that the portion of lease fees that is linked to U.S. dollars and the portion of lease fees that is linked to local currency are fixed in local currency for the contractual period between reset dates (for example, for a period of one year if the reset is annual). As a result, in the event of a devaluation, there is a delay between the timing of the devaluation and the next contractual reset.
During the period between the date of the devaluation and the date of the reset, all of our revenues (i.e., both those revenues that are contractually linked to the U.S. dollar and those that are contractually linked to local currency) would reflect the new, devalued foreign exchange rate. When the reset is effected, the amount relating to the portion of the lease fees linked to the U.S. dollar, which is invoiced in local currency, is adjusted upward.
In addition, the conversion rates included in our MLAs may also be different from the rates at which our financial results are translated into U.S. dollars for reporting purposes.
This has resulted in a situation where there are differing exchange rates in the market and we are required to regularly monitor and evaluate which exchange rate is most appropriate to apply in the translation of the Naira books of our Nigerian operations to U.S. dollars for our consolidated group reporting purposes. The determination of which is the most appropriate rate to use at the relevant time we produce financial information will depend on a number of factors, including, but not limited to, availability and liquidity in the market generally. The foreign exchange rate that we determine to be the most appropriate for the translation of our results for group reporting purposes may also differ from the conversion rates contained within our contracts.
While we have reached agreement with some of our Key Customers in Nigeria to update the reference exchange rate in our contracts to the prevailing market rate available on Bloomberg (which has typically been aligned to the NAFEX rate), should similar circumstances arise again (or continue to exist where there is a divergence between the applicable market rate or translation rates for our financial results and the exchange rates reflected in our contracts with customers, or a divergence between the prevailing market rate on Bloomberg and other exchange rates in the market, including NAFEX), there is no guarantee that we will be able to renegotiate these contracts or enter into new contracts to fully protect against such foreign exchange risks. In addition, other measures taken by the relevant authorities and/or the CBN may further impact the rates available in the market, and we may need to consider such measures for the purposes of our accounts.
Factors Affecting Our Financial Condition and Results of Operations
Our financial condition and results of operations have been, and will continue to be, affected by a number of important factors, including the following:
New Colocation and Lease Amendments
Colocation and Lease Amendments are key drivers of incremental organic revenue in telecommunications infrastructure sharing. Colocation involves adding new tenants to existing sites, where the addition of an incremental tenant to an existing site can introduce a full additional lease fee. Lease Amendments involve adding additional equipment or providing certain ancillary services at existing sites for existing Tenants and for a recurring lease fee. Examples of Lease Amendments include an existing customer taking more space on a tower, adding equipment for new technologies, such as 3G, 4G/LTE
82
or 5G, adding additional microwave transmission or fiber infrastructure services, as well as certain ancillary services. A Lease Amendment typically increases revenue by a proportionally lower amount than a Colocation given such equipment typically consumes less space and power than a Colocation. However, gross margin contribution of a Lease Amendment is generally comparable to a Colocation.
Colocation and Lease Amendments improve overall gross margins, operating margins and cash flow given the limited incremental cost to deliver such services. Typically, the main incremental cost to deliver Colocation or Lease Amendments is $6,000 to $10,000 in one-off augmentation capital expenditure. Additionally, in our African markets, the main incremental ongoing cost for Colocation and Lease Amendments is power cost for the additional equipment or services. We continually seek to increase Colocation and Lease Amendments for our existing sites through an active sales and marketing process. Our sites that are either at or near structural capacity can also be strengthened to meet future leasing capacity with relatively minor capital investments.
The demand for Colocation and Lease Amendments from MNOs is driven by multiple telecommunications industry characteristics within our individual markets. These characteristics include the MNOs’ need for greater network coverage and network density due to existing capacity- constrained networks, a desire to improve quality-of-service, increasing subscriber demand for wireless voice and data services requiring a denser network than is the case for voice services, as well as changes in and the development of technologies in those markets.
Contractual lease fee escalation and foreign exchange resets
Our MLAs generally contain annual inflation-linked escalation provisions under which the underlying lease fees, and therefore our revenue, may increase each year. These contractual escalators are typically linked to the consumer price index, or CPI, of the country of operation and/or the United States, depending on the underlying currency denomination of the lease fee. Lease fee components priced in local currency typically have escalators linked to local CPI applied annually for the subsequent 12 months. Lease fee components priced in U.S. dollars typically have escalators linked to U.S. CPI applied annually for the subsequent 12 months. Our MLAs with certain customers are subject to fixed, capped or floored escalators.
Foreign exchange resets are generally included in MLAs where lease fees are linked to currencies other than the local currency (for example, MLAs in Nigeria with U.S. dollar components). For further discussion on these foreign exchange resets, please refer to “— Our Revenue.”
New Site construction
New Site construction is a key driver of incremental organic revenue through the customer revenue we invoice from the date the New Site becomes ready for service. New Site construction is also a component of discretionary capital expenditure. Building New Sites requires capital expenditure, principally including materials for the tower, power equipment, land lease fees or land purchase fees, tower construction activities, including civil work, transportation and labor, as well as ongoing operational expenditures for site operation and maintenance. Therefore, construction of New Sites increases our capital expenditures and cost of sales. We pursue construction of New Sites as a key strategy in growing our tower portfolio and providing future capacity for Colocation and Lease Amendments. We do not engage in speculative building and only construct New Sites after obtaining a commitment for a long-term lease with an initial tenant and, in general, if we are aware of, or believe there is, commercial potential for Colocation.
Demand for New Sites from MNOs is typically driven by multiple telecommunications industry characteristics within our individual markets. These characteristics include the MNOs’ need for greater network coverage and network density due to existing capacity-constrained networks, a desire to improve quality-of-service, increasing subscriber demand for wireless voice and data services requiring a denser network than is the case for voice services, as well as changes in and the development of technologies in those markets. For example, we often see an increase in demand for New Sites as new technology is rolled out in markets, such as 3G or 4G.
New Sites constructed consist primarily of ground-based towers, but can also include in-building solutions / distributed antenna systems, rooftop towers and cells-on-wheels. These New Sites always begin operations with at least a single Tenant, with Colocation and Lease Amendments expected at future dates. The average cost to build a New Site in our African and Middle East markets is typically in the range of between $75,000 and $100,000, while in Latin America the cost is typically in the range of between $40,000 and $60,000 depending on the market of operation and specification of the tower.
83
Consequently, the construction of New Sites has a positive effect on revenue, and as Colocation and Lease Amendments occur on the tower, we expect to drive incremental organic revenue and have a positive effect on gross margins and operating margins.
Churn
Churn refers to the loss of tenancies when services provided by us are terminated, a Tenant does not renew its contract or we have ceased recognizing revenue on a site in any particular period. For example, a Tenant may churn if the relevant MLA or SLA is not renewed at the end of its term, the customer ceases operations or switches to a competing tower company. Other than a customer churning at the end of the term of its MLA or SLA, our MLAs generally contain limited termination clauses. Certain of our customer agreements also contain a contractual right to churn a limited number of sites each year without penalty.
We experienced net Churn in the year ended December 31, 2021 of 1,283 Tenants. The Churn that we have historically experienced from our Key Customers has been limited.
Decommissioning
In connection with the acquisition of portfolios of sites, we rationalize our portfolio where we have multiple towers in close proximity to each other. Where economically and commercially viable, we migrate Tenants from one tower onto a nearby tower as an additional Colocation and then subsequently decommission the empty site. Decommissioning spend is a component of discretionary capital expenditure. While the decommissioning of towers offsets our overall growth in the number of towers, it allows us to eliminate cost of sales and ongoing maintenance capital expenditures at the decommissioned towers. The retained sites benefit from lease fees relocated from the decommissioned site and generally only experience a marginal increase in cost of sales due to increased power consumption. The spend associated with decommissioning a site is approximately between $20,000 to $30,000. Since the beginning of 2018, we have decommissioned 144 Towers, and we continue to review our portfolio for further decommissioning opportunities.
Acquisitions of tower portfolios
The acquisition of tower portfolios and businesses from MNOs and independent tower companies results in incremental inorganic revenue during the period in which the acquisitions occur. Acquisitions of tower portfolios result in the immediate increase in the size of our overall portfolio and help expand our footprint in existing and new markets. Once towers are acquired, we receive revenue from the Tenants and Lease Amendments on such sites and we are responsible for future capital expenditures and costs of sales related to the sites. As we acquire new portfolios of towers, we may incur additional administrative expenses, particularly from acquisitions in new markets, which may impact our operating margins.
Currency exchange rate
Our operations are conducted by subsidiaries in Nigeria, Côte d’Ivoire, Cameroon, Zambia, Rwanda, Kuwait, Brazil, Colombia and Peru, and the functional currency of our operating subsidiaries are the Nigerian Naira (₦), West African CFA Franc (XOF), Central African CFA Franc (XAF), Zambian Kwacha (ZMW), Rwandan Franc (RWF), Kuwaiti Dinar (KWD), Brazilian Real (BRL), Colombian Peso (COP), and Peruvian Sol (PEN), respectively. A foreign currency transaction is translated into the functional currency using the exchange rate prevailing at the date of the transaction (or the date of valuation where an item is re-measured). The foreign exchange gain or loss resulting from (i) the settlement of such transaction or (ii) the translation of a monetary asset or liability denominated in a foreign currency is recognized at the exchange rate at period end in the statement of income and comprehensive income.
Our operating subsidiaries’ financial results are then translated into U.S. dollars for reporting purposes. Income and expenses are translated at the monthly average exchange rates (unless this average is not a reasonable approximation of the cumulative effect of the rates prevailing on the transaction dates, in which case income and expenses are translated at the rate on the dates of the transactions). Assets and liabilities are translated at the exchange rate at period end.
As a result of the translations described above, our results are impacted by fluctuations in foreign exchange rates. During the years ended December 31, 2020, we experienced depreciation of the Nigerian Naira, BRL, ZMW and RWF currencies compared to the U.S. dollar, being the primary reason for net foreign exchange losses of $380.3 million, reflected in financing costs. During the year ended December 31, 2021, we experienced depreciation of the Nigerian Naira, BRL, XAF, XOF and RWF currencies and experienced and appreciation of the Zambian Kwacha, being the primary reasons for net foreign exchange losses of $163.6 million.
84
The reduction of foreign currency reserves in Nigeria, among other factors, led to a depreciation of the Naira NAFEX rate against the U.S. dollar from ₦364.7 to $1.00 as of January 1, 2020 to ₦410.3 to $1.00 as of December 31, 2020 and to ₦435 to $1.00 as of December 31, 2021. The Brazilian Real also depreciated against the U.S. dollar, from BRL4.2 to $1.00 as of January 31, 2020 to BRL5.2 to $1.00 as of December 31, 2020, and to BRL5.6 to $1.00 as of December 31, 2021. The revaluation losses resulted because the functional currency of our operating subsidiaries is not U.S. dollars, but the loans at such operating subsidiaries are denominated in U.S. dollars.
Multiple foreign exchange markets with different exchange rates
In Nigeria, there are multiple exchange rates available and/or referenced by the applicable banking authorities. Where such differences exist, we may be required to change the exchange rate applied to the translation of the local currency books of our operating subsidiaries to U.S. dollars for our consolidated group reporting purposes. Where multiple official exchange rates exist, we assess the appropriate rate to use in accordance with the requirements of IFRS in translating foreign operations or foreign transactions. In determining the appropriate rate, we assess factors such as access to those rates in the future in order to meet payments or make dividends in the appropriate currency. In determining whether it is appropriate to move from one official rate to another, we consider the available rates in official markets for settlement of transactions.
For example, during 2017, CBN introduced a new foreign exchange window, which includes the NAFEX rate. This resulted in the use of several different official exchange rates in the market, leading us to assess that the NAFEX rate was the most appropriate exchange rate to apply in translating foreign currency transactions in our Nigerian businesses and in translating Naira amounts for group reporting purposes from December 31, 2017 onwards. As of May 31, 2021, the CBN ceased publishing what was the CBN rate, although with limited impact on us given that the NAFEX rate was the most widely used rate at this time. The CBN now publishes the NAFEX rate on its website.
As a result of switching to the NAFEX rate for translation of U.S. dollar denominated balances in our Nigerian subsidiaries and for consolidation purposes at December 31, 2019 and 2020, prior to the agreements that we reached with certain of our Key Customers in Nigeria to update the reference exchange rate in our contracts to the prevailing market rate available on Bloomberg, the rate used for translating our results for group reporting purposes had historically been higher than the conversion rates contained within our contracts in Nigeria. Most significantly, our contracts with MTN Nigeria previously contained clauses which determined that a portion of the lease fee paid to IHS was based on a pre-agreed U.S. dollar lease fee converted into Naira at the time of invoicing at the prevailing CBN rate. On July 23, 2020, we amended these contracts with MTN Nigeria so that, among other things, the reference foreign exchange rate for converting the U.S. dollar portion of the lease fees into Naira was changed to the prevailing USD exchange rate of NAFEX, defined within the contracts with a reference to the USD/Naira rate published by Bloomberg. The effective date of the agreement with MTN Nigeria is April 1, 2020. However, the agreement with MTN Nigeria was concluded in July 2020 and, as such, the financial impact of any amendments to billing in the second quarter of 2020 resulting from the agreement were reflected in our results for the third quarter of 2020.
In 2020, the CBN rate that was used as the reference foreign exchange rate for determining the majority of our lease fees subject to the relevant reset mechanism was an average of ₦352.6 to $1.00, while the NAFEX rate used for our accounts was an average of ₦382.0 to $1.00. As a result, our revenue for the year ended December 31, 2020 of $1,403 million, respectively, was negatively impacted by the reduction in our lease fees received from MTN of approximately $19 million, respectively, as a result of using the CBN exchange rate as the reference exchange rate rather than the NAFEX exchange rate.
For further discussion on the impact of this change in exchange rates, please refer to “— Our Revenue.”
Maintenance of sites
We incur capital expenditure in relation to the maintenance of our towers, which is non- discretionary in nature and required in order for us to optimally run our portfolio and to perform in line with our service level agreements with customers. Maintenance capital expenditure includes the periodic repair and replacement of fixtures and fittings and power equipment at existing sites. A large component of maintenance capital expenditure is for the replacement and servicing of generators and batteries at our sites, which may decrease, should the grid availability in our markets improve. Maintenance capital expenditure per Tower is typically in the range of $2,000 to $7,000 per year in our African and Middle East markets. In addition to this corrective maintenance capital expenditure, maintenance costs are also incurred in cost of sales where these relate to preventive maintenance that includes the replacement of spare parts and routine checks. Maintenance capital expenditure in Latin America is typically lower given the current scope of maintenance required on Towers.
85
Typically, when we acquire a tower portfolio, it may be necessary to refurbish the newly acquired Towers in order to bring them to the standard of the rest of our portfolio.
Refurbishment capital expenditures typically involve the deployment of a suitable power system for that site, repairs to the site or improvements to the site structure in order to be in line with our safety obligations, and adaptations to site security and monitoring abilities. Refurbishment capital expenditures are one-off in nature, following which those sites should then have normalized maintenance capital expenditure requirements related to the maintenance of sites as described above. Refurbishment capital expenditure is a component of discretionary capital expenditure since it is typically considered in conjunction with the acquisition of tower portfolios. The capital expenditure associated with refurbishment varies from market to market and tower to tower.
Cost and consumption of diesel
Power is our largest single operating expense and, in particular, diesel pricing typically has the largest impact on changes in our operating expense. The largest impact is in our Nigerian operations due to low power grid availability in that country. Fluctuations in the price of oil and foreign exchange effects have a direct correlation to the price of diesel that we pay to suppliers in our markets. Falling oil prices will lower our costs, with the degree of reduction dependent on both foreign exchange effects and our diesel requirements. In the case of rising oil prices and the associated cost of diesel, we benefit in limited situations from power indexation clauses in some of our MLAs, which provide pass-through provisions in relation to increased diesel prices and conversely falling diesel prices. However, as the majority of our contracts do not have such pass-through provisions, we remain exposed to diesel price volatility, which may result in substantial increases in our operating costs and reduced profits if prices rise significantly and/or we are unable to enter into adequate cost pass-through arrangements. In Nigeria, to help mitigate against fluctuations in the price of diesel, we bulk buy diesel from time to time to take advantage of suitable pricing. Furthermore, we have been reducing our overall diesel consumption through targeted investment in power system solutions to provide power to sites more efficiently, including the use of hybrid and solar systems.
Cost of ground leases
The majority of towers we own and operate are on land that we lease from individual landlords. Ground lease fees are generally paid in advance for a one, five, or ten-year portion of the overall duration of the lease, with typically pre-agreed lease fee increases of between 5% and 40% or variable increases for each subsequent three, five or ten-year period. As we roll out additional sites, we are often required to either enter into leases with new landlords, which we endeavor to do under similar terms to those of our existing leases, or acquire the land.
Customer concentration
A significant portion of our revenue in each of our markets of operation is derived from a small number of customers who usually constitute some of the largest MNOs in those markets. In particular, in the year ended December 31, 2021, revenue from our top three MNO customers, considered in each of our individual markets of operation, collectively accounted for 98% of our consolidated revenue, with MTN Nigeria and Airtel Nigeria accounting for 55% and 11%, respectively, of our consolidated revenue for the year ended December 31, 2021. Should there be any negative impact on the businesses of our major customers, including these key MNOs, this in turn could adversely affect their demand for tower space and/or ability to perform their obligations under their lease agreements with us.
Market volatility
We and our customers operate in various international markets, particularly in emerging markets such as in Africa. As a result, we are exposed to economic, political and other uncertainties prevailing in such markets, particularly Nigeria, which is our largest market of operation. For example, in addition to the currency exchange rate and other factors noted above, our business has been negatively impacted by the fall of copper prices that adversely affected Zambia’s economy, and the tensions between the “Anglophone” and “Francophone” regions of Cameroon.
Impact of the COVID-19 Pandemic
The COVID 19 outbreak and resulting measures taken by the federal and state governments in the countries where we operate to contain the virus have required some changes to how we operate (for example travel restrictions, increased working from home, practicing social distancing, increased hygiene measures and enhanced risk and contingency planning). During the prior and current year however, and during the period after December 31, 2021 the financial impact
86
on our business has not been significant as our operational teams were allowed to fulfil their responsibilities and visit sites even when local travel restrictions were in place.
However, in addition to the already known effects, the macroeconomic uncertainty causes disruption to economic activity and it is unknown what the longer-term impact on our business may be. The remaining duration of this pandemic remains uncertain but is expected to continue to impact the way we run our business, in particular in relation to office working and the ability to travel internationally without restriction.
Key Financial and Operational Performance Indicators
We believe that revenue growth, Adjusted EBITDA, Adjusted EBITDA Margin, non-discretionary capital expenditure, Recurring Levered Free Cash Flows (“RLFCF”), Consolidated RLFCF and Return Adjusted EBITDA, the number of Towers in our portfolio and Colocation Rate are key measures to assess our financial and operational performance. These measures demonstrate our ability to grow and generate strong positive cash flows over time. Adjusted EBITDA, Adjusted EBITDA Margin, non-discretionary capital expenditure, RLFCF and Return Adjusted EBITDA are not measures defined by IFRS. The most directly comparable IFRS measure to Adjusted EBITDA, RLFCF and Return Adjusted EBITDA is our profit/ (loss) for the period. Adjusted EBITDA, Adjusted EBITDA Margin, RLFCF and Return Adjusted EBITDA are not necessarily comparable to similarly referenced measures used by other companies. As a result, investors should not consider these performance measures in isolation from, or as a substitute analysis for, our results of operations as determined in accordance with IFRS.
Adjusted EBITDA and Adjusted EBITDA Margin
We believe Adjusted EBITDA and Adjusted EBITDA Margin are useful to investors and are used by our management for measuring profitability and allocating resources, because they exclude the impact of certain items that have less bearing on our core operating performance such as interest expense and taxes. We believe that utilizing Adjusted EBITDA and Adjusted EBITDA Margin allows for a more meaningful comparison of operating fundamentals between companies within our industry by eliminating the impact of capital structure and taxation differences between the companies.
We define Adjusted EBITDA as profit/(loss) for the period, before income tax expense/(benefit), finance costs and income, depreciation and amortization, impairment of withholding tax receivables, business combination transaction costs, impairment of property, plant and equipment and related prepaid land rent on the decommissioning of sites, net (profit)/loss on sale of assets, share-based payment (credit)/expense, insurance claims, listing costs and certain other items that management believes are not indicative of the core performance of our business.
We define Adjusted EBITDA Margin as Adjusted EBITDA divided by revenue for the applicable period, expressed as a percentage.
Non-discretionary capital expenditure
Non-discretionary capital expenditure is non-revenue generating in nature and relates to capital expenditure required to run ordinary course operations, including the delivery of our contracted service level agreements to customers. It consists primarily of maintenance capital expenditure, as well as routine corporate capital expenditure, being primarily spending on information technology infrastructure.
Recurring Levered Free Cash Flow
We believe that it is important to measure the free cash flows we have generated from operations, after accounting for the cash cost of funding and recurring capital expenditure required to generate those cash flows. In this respect, we monitor RLFCF which we define as cash flows from operating activities, before certain items of income or expenditure that management believes are not indicative of the core performance of our business (to the extent that these items of income and expenditure are included within cash flow from operating activities), and after taking into account loss allowances on trade receivables, impairment of inventory, net working capital movements, net interest paid or received, revenue withholding tax, income taxes paid, lease payments made, maintenance capital expenditures, and routine corporate capital expenditures. We define Consolidated RLFCF as RLFCF, after taking into account non-controlling interest.
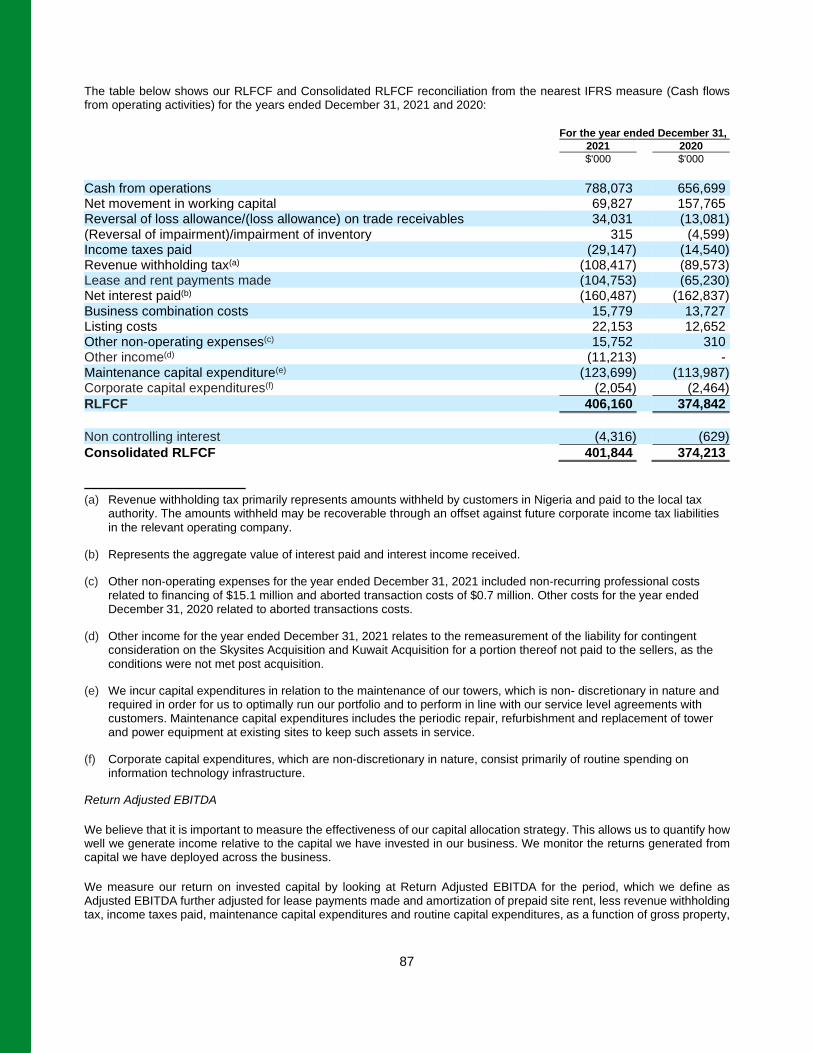
87
The table below shows our RLFCF and Consolidated RLFCF reconciliation from the nearest IFRS measure (Cash flows from operating activities) for the years ended December 31, 2021 and 2020:
For the year ended December 31, 2021 2020 $'000 $'000 Cash from operations 788,073 656,699 Net movement in working capital 69,827 157,765 Reversal of loss allowance/(loss allowance) on trade receivables 34,031 (13,081) (Reversal of impairment)/impairment of inventory 315 (4,599) Income taxes paid (29,147) (14,540) Revenue withholding tax(a) (108,417) (89,573) Lease and rent payments made (104,753) (65,230) Net interest paid(b) (160,487) (162,837) Business combination costs 15,779 13,727 Listing costs 22,153 12,652 Other non-operating expenses(c) 15,752 310 Other income(d) (11,213) - Maintenance capital expenditure(e) (123,699) (113,987) Corporate capital expenditures(f) (2,054) (2,464) RLFCF 406,160 374,842 Non controlling interest (4,316) (629) Consolidated RLFCF 401,844 374,213
(a) Revenue withholding tax primarily represents amounts withheld by customers in Nigeria and paid to the local tax
authority. The amounts withheld may be recoverable through an offset against future corporate income tax liabilities in the relevant operating company.
(b) Represents the aggregate value of interest paid and interest income received.
(c) Other non-operating expenses for the year ended December 31, 2021 included non-recurring professional costs related to financing of $15.1 million and aborted transaction costs of $0.7 million. Other costs for the year ended December 31, 2020 related to aborted transactions costs.
(d) Other income for the year ended December 31, 2021 relates to the remeasurement of the liability for contingent consideration on the Skysites Acquisition and Kuwait Acquisition for a portion thereof not paid to the sellers, as the conditions were not met post acquisition.
(e) We incur capital expenditures in relation to the maintenance of our towers, which is non- discretionary in nature and required in order for us to optimally run our portfolio and to perform in line with our service level agreements with customers. Maintenance capital expenditures includes the periodic repair, refurbishment and replacement of tower and power equipment at existing sites to keep such assets in service.
(f) Corporate capital expenditures, which are non-discretionary in nature, consist primarily of routine spending on information technology infrastructure.
Return Adjusted EBITDA
We believe that it is important to measure the effectiveness of our capital allocation strategy. This allows us to quantify how well we generate income relative to the capital we have invested in our business. We monitor the returns generated from capital we have deployed across the business.
We measure our return on invested capital by looking at Return Adjusted EBITDA for the period, which we define as Adjusted EBITDA further adjusted for lease payments made and amortization of prepaid site rent, less revenue withholding tax, income taxes paid, maintenance capital expenditures and routine capital expenditures, as a function of gross property,
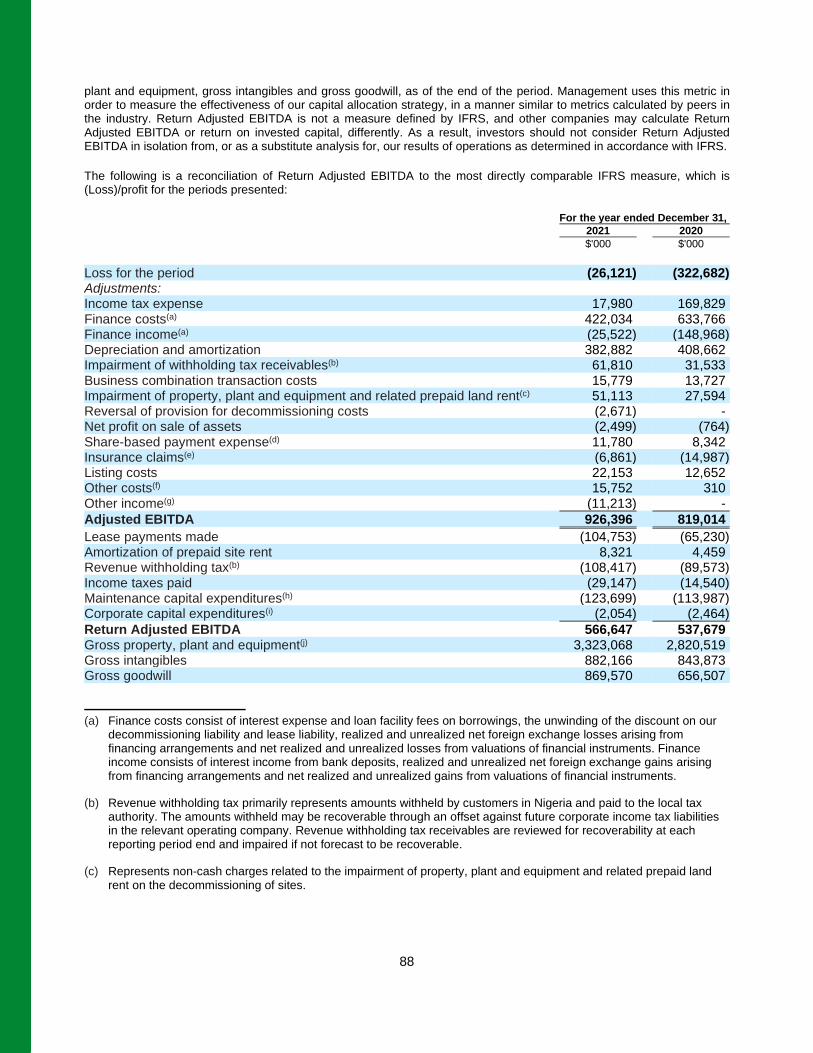
88
plant and equipment, gross intangibles and gross goodwill, as of the end of the period. Management uses this metric in order to measure the effectiveness of our capital allocation strategy, in a manner similar to metrics calculated by peers in the industry. Return Adjusted EBITDA is not a measure defined by IFRS, and other companies may calculate Return Adjusted EBITDA or return on invested capital, differently. As a result, investors should not consider Return Adjusted EBITDA in isolation from, or as a substitute analysis for, our results of operations as determined in accordance with IFRS.
The following is a reconciliation of Return Adjusted EBITDA to the most directly comparable IFRS measure, which is (Loss)/profit for the periods presented:
For the year ended December 31, 2021 2020 $'000 $'000 Loss for the period (26,121) (322,682) Adjustments: Income tax expense 17,980 169,829 Finance costs(a) 422,034 633,766 Finance income(a) (25,522) (148,968) Depreciation and amortization 382,882 408,662 Impairment of withholding tax receivables(b) 61,810 31,533 Business combination transaction costs 15,779 13,727 Impairment of property, plant and equipment and related prepaid land rent(c) 51,113 27,594 Reversal of provision for decommissioning costs (2,671) - Net profit on sale of assets (2,499) (764) Share-based payment expense(d) 11,780 8,342 Insurance claims(e) (6,861) (14,987) Listing costs 22,153 12,652 Other costs(f) 15,752 310 Other income(g) (11,213) - Adjusted EBITDA 926,396 819,014 Lease payments made (104,753) (65,230) Amortization of prepaid site rent 8,321 4,459 Revenue withholding tax(b) (108,417) (89,573) Income taxes paid (29,147) (14,540) Maintenance capital expenditures(h) (123,699) (113,987) Corporate capital expenditures(i) (2,054) (2,464) Return Adjusted EBITDA 566,647 537,679 Gross property, plant and equipment(j) 3,323,068 2,820,519 Gross intangibles 882,166 843,873 Gross goodwill 869,570 656,507
(a) Finance costs consist of interest expense and loan facility fees on borrowings, the unwinding of the discount on our
decommissioning liability and lease liability, realized and unrealized net foreign exchange losses arising from financing arrangements and net realized and unrealized losses from valuations of financial instruments. Finance income consists of interest income from bank deposits, realized and unrealized net foreign exchange gains arising from financing arrangements and net realized and unrealized gains from valuations of financial instruments.
(b) Revenue withholding tax primarily represents amounts withheld by customers in Nigeria and paid to the local tax authority. The amounts withheld may be recoverable through an offset against future corporate income tax liabilities in the relevant operating company. Revenue withholding tax receivables are reviewed for recoverability at each reporting period end and impaired if not forecast to be recoverable.
(c) Represents non-cash charges related to the impairment of property, plant and equipment and related prepaid land rent on the decommissioning of sites.
89
(d) Represents credits and expense related to share-based compensation, which vary from period to period depending on timing of awards and changes to valuation inputs assumptions.
(e) Represents insurance claims included as non-operating income.
(f) Other costs for the year ended December 31, 2021 included non-recurring professional costs related to financing of $15.1 million and aborted transaction costs of $0.7 million. Other costs for the year ended December 31, 2020 related to aborted transaction costs.
(g) Other income for the year ended December 31, 2021 relates to the remeasurement of the liability for contingent consideration on the Skysites Acquisition and Kuwait Acquisition for a portion thereof not paid to the sellers, as the conditions were not met post acquisition.
(h) We incur capital expenditures in relation to the maintenance of our towers, which is non- discretionary in nature and required in order for us to optimally run our portfolio and to perform in line with our service level agreements with customers. Maintenance capital expenditures includes the periodic repair, refurbishment and replacement of tower and power equipment at existing sites to keep such assets in service.
(i) Corporate capital expenditures, which are non-discretionary in nature, consist primarily of routine spending on information technology infrastructure.
(j) Excludes the cost of right-of-use assets resulting from leases accounted for under IFRS 16.
Towers
We measure the number of towers in our portfolio at a given time by counting the number of towers that we own or operate with at least one Tenant. The number of towers in our portfolio excludes towers for which we provide Managed Services. We have historically increased the number of towers in our portfolio through a combination of building New Sites, along with the acquisition of towers from MNOs and an independent tower company. Rationalizing the portfolio through decommissioning towers reduces the number of towers we own and operate.
Colocation Rate
We define Colocation Rate as the average number of Tenants per tower that we own or operate across our tower portfolio at a given point in time, excluding Managed Services. Colocation Rate is an important metric for assessing utilization and capacity on existing Towers. Our Colocation Rate is a key driver of our Adjusted EBITDA Margin, as the addition of further Tenants increases revenue for a proportionally smaller increase in power, our primary variable cost per site. Colocation is achieved at a relatively low incremental capital expense, and is also attractive to our customers as it provides them with shorter deployment times for their equipment compared to New Site alternatives.
Explanation of key line items in the historical consolidated statements of income
Revenue
Our revenue is derived from fees paid by our customers for services from our Colocation business and its ancillary managed services. The Colocation business involves the lease of space on our owned and operated towers, which are shared by various MNOs and other communication service providers. A portion of Colocation arrangements for the rental of space on the towers and other assets on tower sites, on which the use of space is dependent, is within the scope of IFRS 16 “Leases”. A portion of Colocation arrangements for the provision of services and energy charges is within the scope of IFRS 15 “Revenue from Contracts with Customers” as a provision of service. Revenue from leasing arrangements is recognized on a straight-line basis over the current lease term of the related lease agreements, when collectability is reasonably assured. We also derive revenue from non-lease services, which includes maintenance, security and power supply for Towers owned by third parties. Non-lease revenues are recognized when control of the services is transferred to the customer at an amount that reflects the consideration to which we expect to be entitled in exchange for those services. Such revenue is recognized in the accounting period in which the services are rendered. We assess the probability that defaulting customers will not settle amounts billed and accordingly treat any component that we deem may not be collected as variable consideration, contingent upon the receipt of funds from the customer, an event that is not wholly within our control.
90
Cost of sales
Cost of sales consists of power generation (including diesel costs), which after depreciation, is our largest single cost item, ground lease rental, tower repairs and maintenance, depreciation and amortization in relation to sites and right of use assets, staff costs and other costs directly related to the provision of services to customers and other site related costs, such as security services, regulatory permits and license costs, insurance, including for customer and network related assets. Depreciation of a tower is calculated using the straight-line method over an estimated useful life of 10 to 20 years. Depreciation of alarms, batteries and generators are also calculated using the straight-line method over a range of estimated useful lives between three and five years, depending on the equipment. Right of use assets are depreciated on a straight-line basis over the shorter of the remaining estimated useful life of the tower and the lease term.
Administrative expenses
Administrative expenses are costs not directly related to provision of services to customers, but which support our business as a whole. These overhead expenses primarily consist of administrative staff costs (including key management compensation), office rent and related property expenses, insurance, travel costs, professional fees, depreciation and amortization of administrative assets and right of use assets where such assets are leased, net loss or gains from sale of assets, allowance for trade and other receivables and other sundry costs. Administrative expenses also includes other corporate overhead expenses related to our acquisition efforts and costs associated with new business initiatives.
Loss allowance on trade receivables
We account for our trade receivables credit risk by appropriately providing for expected credit losses. Loss allowance on trade receivables represents the expected loss from non-payment of amounts due from customers in accordance with the accounting standards applicable to each period. The loss allowance is determined based on our policy for evaluating expected credit losses and any subsequent impairment taking into account historical loss rates, the available information on a customer’s financial position and forward-looking macroeconomic data.
Other income
Other income includes proceeds from insurance claims and the remeasurement of contingent consideration arising from acquisitions.
Finance costs and income
Finance costs consist of interest expense and loan facility fees on borrowings, the unwinding of the discount on our decommissioning liability and lease liability, realized and unrealized net foreign exchange losses arising from financing arrangements and net realized and unrealized losses from valuations of financial instruments. Finance income consists of interest income from bank deposits, realized and unrealized net foreign exchange gains arising from financing arrangements and net realized and unrealized gains from valuations of financial instruments.
Taxation
Taxation consists of income tax, education tax and deferred taxes. Income tax is calculated at the domestic tax rate applicable to profits in our respective countries of business. Current and deferred tax is recognized on taxes that are regarded as taxes on corporate income under relevant IFRS accounting standards. This includes Nigerian education tax, which arises at the rate of 2.5% (2020: 2%) on taxable profits determined on a basis similar to income tax. Deferred income tax assets are recognized for deductible temporary differences, including tax losses carried forward, arising between the tax bases of assets and liabilities and their carrying amounts in the financial statements, but only to the extent that the realization of the related tax benefits are expected to be met through the reversal of taxable temporary differences and that it is probable that future taxable profits will be available against which the temporary differences can be utilized. As of December 31, 2021, in Nigeria and certain other jurisdictions that have taxable losses brought forward or arising in the present period, deferred tax assets in respect of those losses are recognized only to the extent they are forecast to be applied against (i) the reversal of taxable temporary differences, or (ii) additional forecast future taxable income over a five-year period.
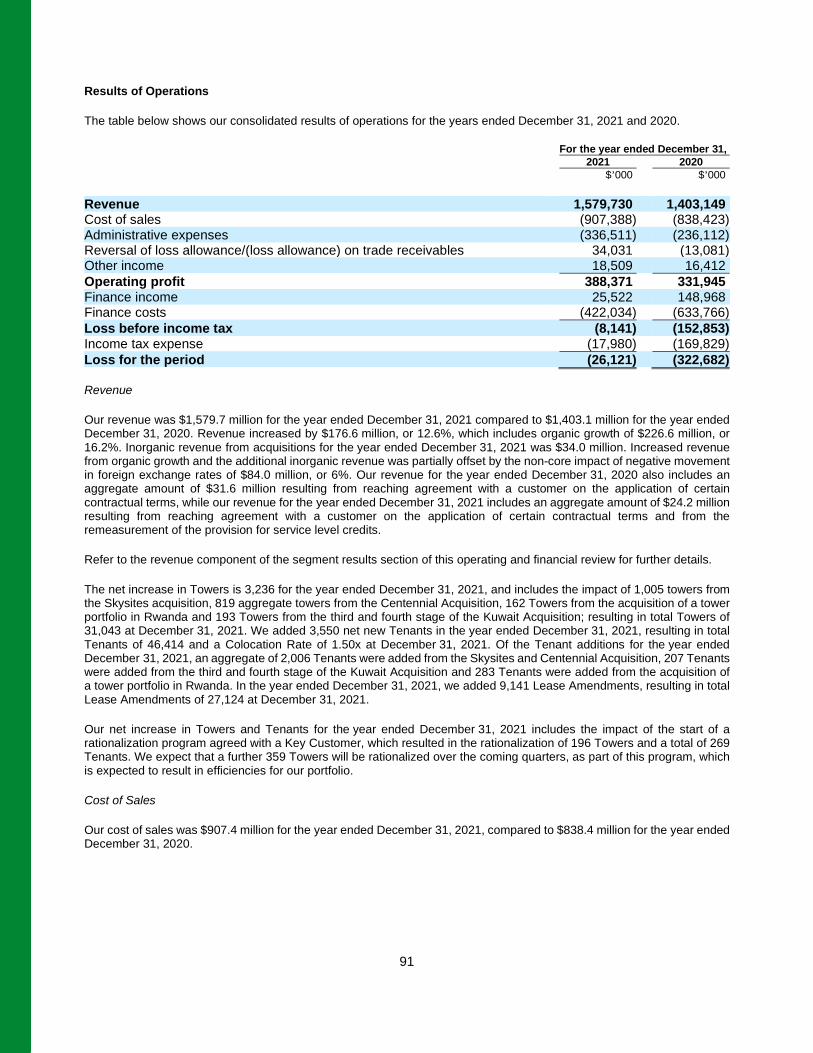
91
Results of Operations
The table below shows our consolidated results of operations for the years ended December 31, 2021 and 2020.
For the year ended December 31, 2021 2020 $’000 $’000 Revenue 1,579,730 1,403,149 Cost of sales (907,388) (838,423) Administrative expenses (336,511) (236,112) Reversal of loss allowance/(loss allowance) on trade receivables 34,031 (13,081) Other income 18,509 16,412 Operating profit 388,371 331,945 Finance income 25,522 148,968 Finance costs (422,034) (633,766) Loss before income tax (8,141) (152,853) Income tax expense (17,980) (169,829) Loss for the period (26,121) (322,682) Revenue
Our revenue was $1,579.7 million for the year ended December 31, 2021 compared to $1,403.1 million for the year ended December 31, 2020. Revenue increased by $176.6 million, or 12.6%, which includes organic growth of $226.6 million, or 16.2%. Inorganic revenue from acquisitions for the year ended December 31, 2021 was $34.0 million. Increased revenue from organic growth and the additional inorganic revenue was partially offset by the non-core impact of negative movement in foreign exchange rates of $84.0 million, or 6%. Our revenue for the year ended December 31, 2020 also includes an aggregate amount of $31.6 million resulting from reaching agreement with a customer on the application of certain contractual terms, while our revenue for the year ended December 31, 2021 includes an aggregate amount of $24.2 million resulting from reaching agreement with a customer on the application of certain contractual terms and from the remeasurement of the provision for service level credits.
Refer to the revenue component of the segment results section of this operating and financial review for further details.
The net increase in Towers is 3,236 for the year ended December 31, 2021, and includes the impact of 1,005 towers from the Skysites acquisition, 819 aggregate towers from the Centennial Acquisition, 162 Towers from the acquisition of a tower portfolio in Rwanda and 193 Towers from the third and fourth stage of the Kuwait Acquisition; resulting in total Towers of 31,043 at December 31, 2021. We added 3,550 net new Tenants in the year ended December 31, 2021, resulting in total Tenants of 46,414 and a Colocation Rate of 1.50x at December 31, 2021. Of the Tenant additions for the year ended December 31, 2021, an aggregate of 2,006 Tenants were added from the Skysites and Centennial Acquisition, 207 Tenants were added from the third and fourth stage of the Kuwait Acquisition and 283 Tenants were added from the acquisition of a tower portfolio in Rwanda. In the year ended December 31, 2021, we added 9,141 Lease Amendments, resulting in total Lease Amendments of 27,124 at December 31, 2021.
Our net increase in Towers and Tenants for the year ended December 31, 2021 includes the impact of the start of a rationalization program agreed with a Key Customer, which resulted in the rationalization of 196 Towers and a total of 269 Tenants. We expect that a further 359 Towers will be rationalized over the coming quarters, as part of this program, which is expected to result in efficiencies for our portfolio.
Cost of Sales
Our cost of sales was $907.4 million for the year ended December 31, 2021, compared to $838.4 million for the year ended December 31, 2020.
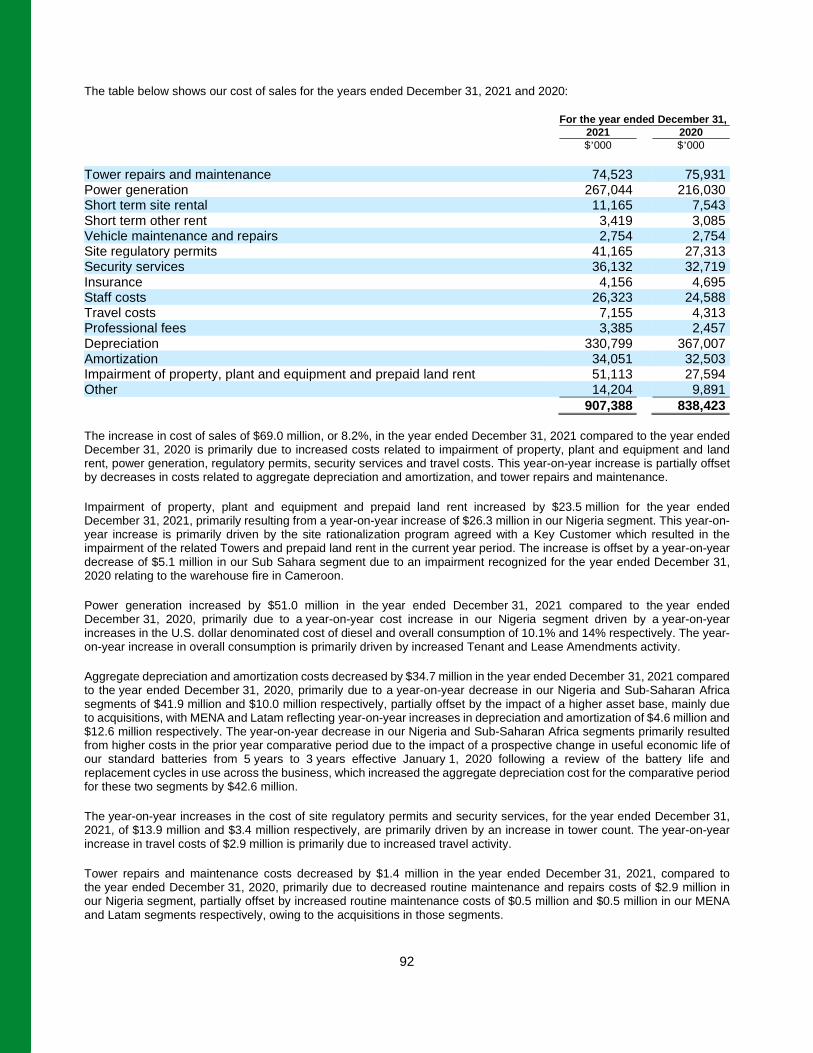
92
The table below shows our cost of sales for the years ended December 31, 2021 and 2020:
For the year ended December 31, 2021 2020 $’000 $’000 Tower repairs and maintenance 74,523 75,931 Power generation 267,044 216,030 Short term site rental 11,165 7,543 Short term other rent 3,419 3,085 Vehicle maintenance and repairs 2,754 2,754 Site regulatory permits 41,165 27,313 Security services 36,132 32,719 Insurance 4,156 4,695 Staff costs 26,323 24,588 Travel costs 7,155 4,313 Professional fees 3,385 2,457 Depreciation 330,799 367,007 Amortization 34,051 32,503 Impairment of property, plant and equipment and prepaid land rent 51,113 27,594 Other 14,204 9,891 907,388 838,423 The increase in cost of sales of $69.0 million, or 8.2%, in the year ended December 31, 2021 compared to the year ended December 31, 2020 is primarily due to increased costs related to impairment of property, plant and equipment and land rent, power generation, regulatory permits, security services and travel costs. This year-on-year increase is partially offset by decreases in costs related to aggregate depreciation and amortization, and tower repairs and maintenance.
Impairment of property, plant and equipment and prepaid land rent increased by $23.5 million for the year ended December 31, 2021, primarily resulting from a year-on-year increase of $26.3 million in our Nigeria segment. This year-on-year increase is primarily driven by the site rationalization program agreed with a Key Customer which resulted in the impairment of the related Towers and prepaid land rent in the current year period. The increase is offset by a year-on-year decrease of $5.1 million in our Sub Sahara segment due to an impairment recognized for the year ended December 31, 2020 relating to the warehouse fire in Cameroon.
Power generation increased by $51.0 million in the year ended December 31, 2021 compared to the year ended December 31, 2020, primarily due to a year-on-year cost increase in our Nigeria segment driven by a year-on-year increases in the U.S. dollar denominated cost of diesel and overall consumption of 10.1% and 14% respectively. The year-on-year increase in overall consumption is primarily driven by increased Tenant and Lease Amendments activity.
Aggregate depreciation and amortization costs decreased by $34.7 million in the year ended December 31, 2021 compared to the year ended December 31, 2020, primarily due to a year-on-year decrease in our Nigeria and Sub-Saharan Africa segments of $41.9 million and $10.0 million respectively, partially offset by the impact of a higher asset base, mainly due to acquisitions, with MENA and Latam reflecting year-on-year increases in depreciation and amortization of $4.6 million and $12.6 million respectively. The year-on-year decrease in our Nigeria and Sub-Saharan Africa segments primarily resulted from higher costs in the prior year comparative period due to the impact of a prospective change in useful economic life of our standard batteries from 5 years to 3 years effective January 1, 2020 following a review of the battery life and replacement cycles in use across the business, which increased the aggregate depreciation cost for the comparative period for these two segments by $42.6 million.
The year-on-year increases in the cost of site regulatory permits and security services, for the year ended December 31, 2021, of $13.9 million and $3.4 million respectively, are primarily driven by an increase in tower count. The year-on-year increase in travel costs of $2.9 million is primarily due to increased travel activity.
Tower repairs and maintenance costs decreased by $1.4 million in the year ended December 31, 2021, compared to the year ended December 31, 2020, primarily due to decreased routine maintenance and repairs costs of $2.9 million in our Nigeria segment, partially offset by increased routine maintenance costs of $0.5 million and $0.5 million in our MENA and Latam segments respectively, owing to the acquisitions in those segments.
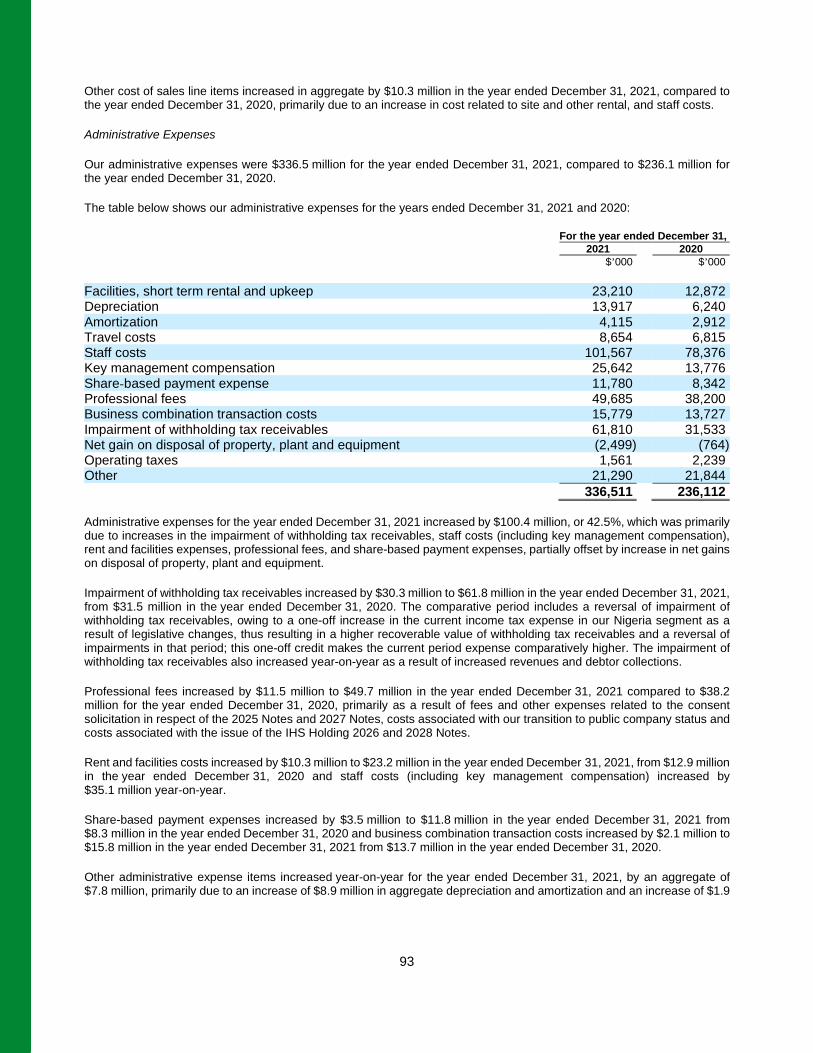
93
Other cost of sales line items increased in aggregate by $10.3 million in the year ended December 31, 2021, compared to the year ended December 31, 2020, primarily due to an increase in cost related to site and other rental, and staff costs.
Administrative Expenses
Our administrative expenses were $336.5 million for the year ended December 31, 2021, compared to $236.1 million for the year ended December 31, 2020.
The table below shows our administrative expenses for the years ended December 31, 2021 and 2020:
For the year ended December 31, 2021 2020 $’000 $’000 Facilities, short term rental and upkeep 23,210 12,872 Depreciation 13,917 6,240 Amortization 4,115 2,912 Travel costs 8,654 6,815 Staff costs 101,567 78,376 Key management compensation 25,642 13,776 Share‑based payment expense 11,780 8,342 Professional fees 49,685 38,200 Business combination transaction costs 15,779 13,727 Impairment of withholding tax receivables 61,810 31,533 Net gain on disposal of property, plant and equipment (2,499) (764) Operating taxes 1,561 2,239 Other 21,290 21,844 336,511 236,112 Administrative expenses for the year ended December 31, 2021 increased by $100.4 million, or 42.5%, which was primarily due to increases in the impairment of withholding tax receivables, staff costs (including key management compensation), rent and facilities expenses, professional fees, and share-based payment expenses, partially offset by increase in net gains on disposal of property, plant and equipment.
Impairment of withholding tax receivables increased by $30.3 million to $61.8 million in the year ended December 31, 2021, from $31.5 million in the year ended December 31, 2020. The comparative period includes a reversal of impairment of withholding tax receivables, owing to a one-off increase in the current income tax expense in our Nigeria segment as a result of legislative changes, thus resulting in a higher recoverable value of withholding tax receivables and a reversal of impairments in that period; this one-off credit makes the current period expense comparatively higher. The impairment of withholding tax receivables also increased year-on-year as a result of increased revenues and debtor collections.
Professional fees increased by $11.5 million to $49.7 million in the year ended December 31, 2021 compared to $38.2 million for the year ended December 31, 2020, primarily as a result of fees and other expenses related to the consent solicitation in respect of the 2025 Notes and 2027 Notes, costs associated with our transition to public company status and costs associated with the issue of the IHS Holding 2026 and 2028 Notes.
Rent and facilities costs increased by $10.3 million to $23.2 million in the year ended December 31, 2021, from $12.9 million in the year ended December 31, 2020 and staff costs (including key management compensation) increased by $35.1 million year-on-year.
Share-based payment expenses increased by $3.5 million to $11.8 million in the year ended December 31, 2021 from $8.3 million in the year ended December 31, 2020 and business combination transaction costs increased by $2.1 million to $15.8 million in the year ended December 31, 2021 from $13.7 million in the year ended December 31, 2020.
Other administrative expense items increased year-on-year for the year ended December 31, 2021, by an aggregate of $7.8 million, primarily due to an increase of $8.9 million in aggregate depreciation and amortization and an increase of $1.9
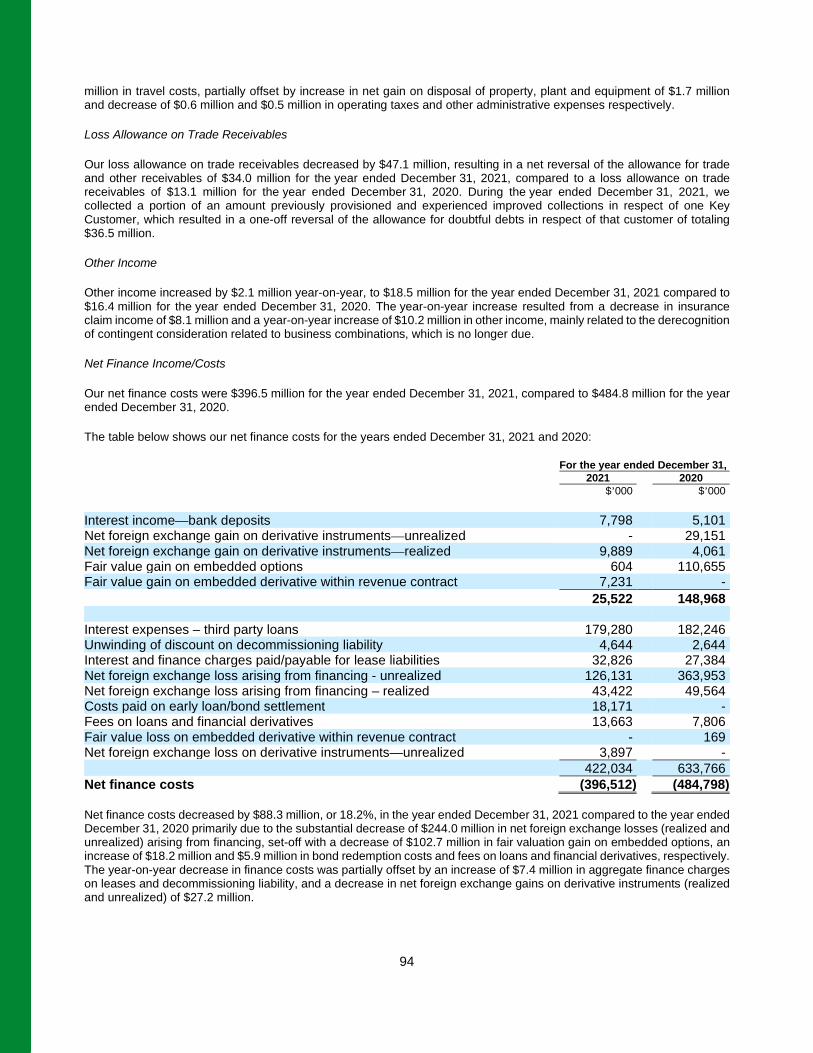
94
million in travel costs, partially offset by increase in net gain on disposal of property, plant and equipment of $1.7 million and decrease of $0.6 million and $0.5 million in operating taxes and other administrative expenses respectively.
Loss Allowance on Trade Receivables
Our loss allowance on trade receivables decreased by $47.1 million, resulting in a net reversal of the allowance for trade and other receivables of $34.0 million for the year ended December 31, 2021, compared to a loss allowance on trade receivables of $13.1 million for the year ended December 31, 2020. During the year ended December 31, 2021, we collected a portion of an amount previously provisioned and experienced improved collections in respect of one Key Customer, which resulted in a one-off reversal of the allowance for doubtful debts in respect of that customer of totaling $36.5 million.
Other Income
Other income increased by $2.1 million year-on-year, to $18.5 million for the year ended December 31, 2021 compared to $16.4 million for the year ended December 31, 2020. The year-on-year increase resulted from a decrease in insurance claim income of $8.1 million and a year-on-year increase of $10.2 million in other income, mainly related to the derecognition of contingent consideration related to business combinations, which is no longer due.
Net Finance Income/Costs
Our net finance costs were $396.5 million for the year ended December 31, 2021, compared to $484.8 million for the year ended December 31, 2020.
The table below shows our net finance costs for the years ended December 31, 2021 and 2020:
For the year ended December 31, 2021 2020 $’000 $’000 Interest income—bank deposits 7,798 5,101 Net foreign exchange gain on derivative instruments—unrealized - 29,151 Net foreign exchange gain on derivative instruments—realized 9,889 4,061 Fair value gain on embedded options 604 110,655 Fair value gain on embedded derivative within revenue contract 7,231 - 25,522 148,968 Interest expenses – third party loans 179,280 182,246 Unwinding of discount on decommissioning liability 4,644 2,644 Interest and finance charges paid/payable for lease liabilities 32,826 27,384 Net foreign exchange loss arising from financing - unrealized 126,131 363,953 Net foreign exchange loss arising from financing – realized 43,422 49,564 Costs paid on early loan/bond settlement 18,171 - Fees on loans and financial derivatives 13,663 7,806 Fair value loss on embedded derivative within revenue contract - 169 Net foreign exchange loss on derivative instruments—unrealized 3,897 - 422,034 633,766 Net finance costs (396,512) (484,798) Net finance costs decreased by $88.3 million, or 18.2%, in the year ended December 31, 2021 compared to the year ended December 31, 2020 primarily due to the substantial decrease of $244.0 million in net foreign exchange losses (realized and unrealized) arising from financing, set-off with a decrease of $102.7 million in fair valuation gain on embedded options, an increase of $18.2 million and $5.9 million in bond redemption costs and fees on loans and financial derivatives, respectively. The year-on-year decrease in finance costs was partially offset by an increase of $7.4 million in aggregate finance charges on leases and decommissioning liability, and a decrease in net foreign exchange gains on derivative instruments (realized and unrealized) of $27.2 million.
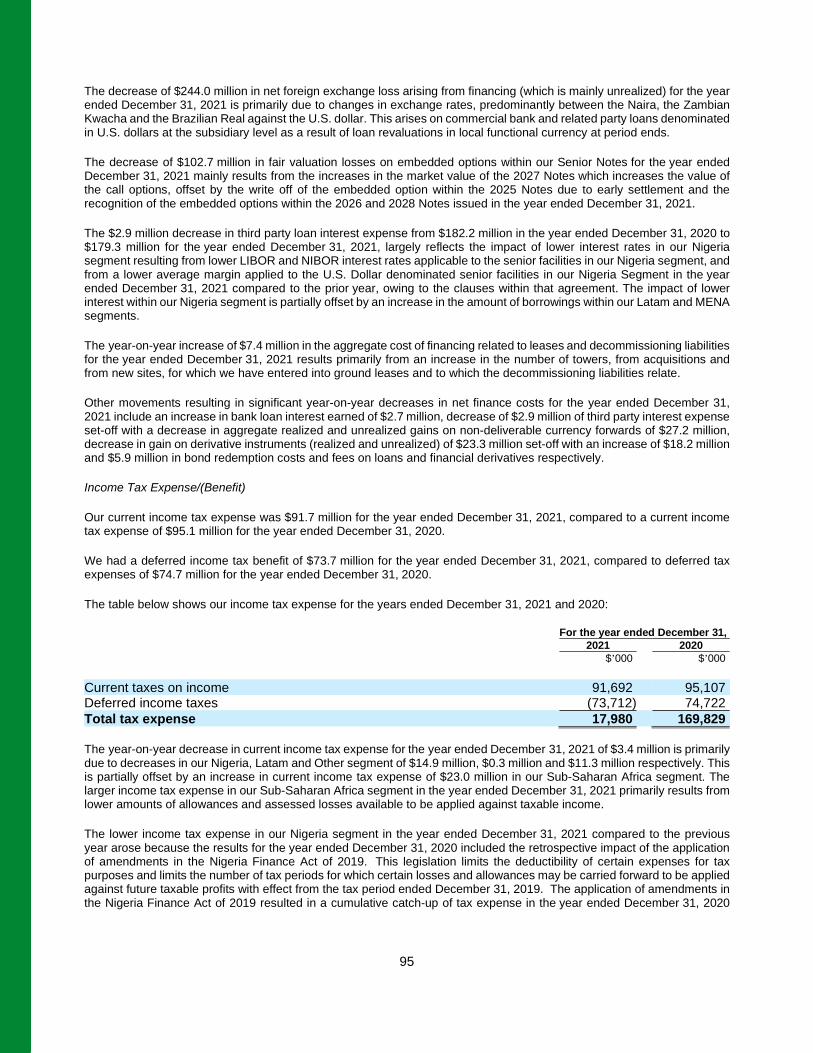
95
The decrease of $244.0 million in net foreign exchange loss arising from financing (which is mainly unrealized) for the year ended December 31, 2021 is primarily due to changes in exchange rates, predominantly between the Naira, the Zambian Kwacha and the Brazilian Real against the U.S. dollar. This arises on commercial bank and related party loans denominated in U.S. dollars at the subsidiary level as a result of loan revaluations in local functional currency at period ends.
The decrease of $102.7 million in fair valuation losses on embedded options within our Senior Notes for the year ended December 31, 2021 mainly results from the increases in the market value of the 2027 Notes which increases the value of the call options, offset by the write off of the embedded option within the 2025 Notes due to early settlement and the recognition of the embedded options within the 2026 and 2028 Notes issued in the year ended December 31, 2021.
The $2.9 million decrease in third party loan interest expense from $182.2 million in the year ended December 31, 2020 to $179.3 million for the year ended December 31, 2021, largely reflects the impact of lower interest rates in our Nigeria segment resulting from lower LIBOR and NIBOR interest rates applicable to the senior facilities in our Nigeria segment, and from a lower average margin applied to the U.S. Dollar denominated senior facilities in our Nigeria Segment in the year ended December 31, 2021 compared to the prior year, owing to the clauses within that agreement. The impact of lower interest within our Nigeria segment is partially offset by an increase in the amount of borrowings within our Latam and MENA segments.
The year-on-year increase of $7.4 million in the aggregate cost of financing related to leases and decommissioning liabilities for the year ended December 31, 2021 results primarily from an increase in the number of towers, from acquisitions and from new sites, for which we have entered into ground leases and to which the decommissioning liabilities relate.
Other movements resulting in significant year-on-year decreases in net finance costs for the year ended December 31, 2021 include an increase in bank loan interest earned of $2.7 million, decrease of $2.9 million of third party interest expense set-off with a decrease in aggregate realized and unrealized gains on non-deliverable currency forwards of $27.2 million, decrease in gain on derivative instruments (realized and unrealized) of $23.3 million set-off with an increase of $18.2 million and $5.9 million in bond redemption costs and fees on loans and financial derivatives respectively.
Income Tax Expense/(Benefit)
Our current income tax expense was $91.7 million for the year ended December 31, 2021, compared to a current income tax expense of $95.1 million for the year ended December 31, 2020.
We had a deferred income tax benefit of $73.7 million for the year ended December 31, 2021, compared to deferred tax expenses of $74.7 million for the year ended December 31, 2020.
The table below shows our income tax expense for the years ended December 31, 2021 and 2020:
For the year ended December 31, 2021 2020 $’000 $’000 Current taxes on income 91,692 95,107 Deferred income taxes (73,712) 74,722 Total tax expense 17,980 169,829 The year-on-year decrease in current income tax expense for the year ended December 31, 2021 of $3.4 million is primarily due to decreases in our Nigeria, Latam and Other segment of $14.9 million, $0.3 million and $11.3 million respectively. This is partially offset by an increase in current income tax expense of $23.0 million in our Sub-Saharan Africa segment. The larger income tax expense in our Sub-Saharan Africa segment in the year ended December 31, 2021 primarily results from lower amounts of allowances and assessed losses available to be applied against taxable income.
The lower income tax expense in our Nigeria segment in the year ended December 31, 2021 compared to the previous year arose because the results for the year ended December 31, 2020 included the retrospective impact of the application of amendments in the Nigeria Finance Act of 2019. This legislation limits the deductibility of certain expenses for tax purposes and limits the number of tax periods for which certain losses and allowances may be carried forward to be applied against future taxable profits with effect from the tax period ended December 31, 2019. The application of amendments in the Nigeria Finance Act of 2019 resulted in a cumulative catch-up of tax expense in the year ended December 31, 2020
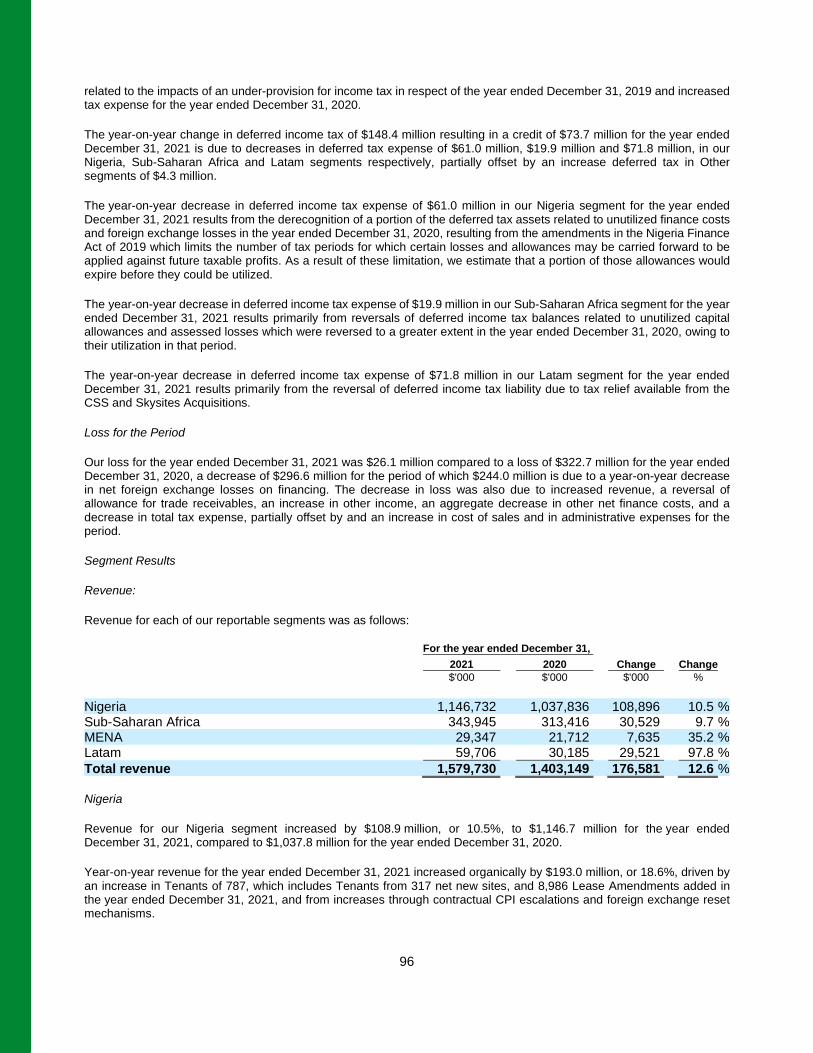
96
related to the impacts of an under-provision for income tax in respect of the year ended December 31, 2019 and increased tax expense for the year ended December 31, 2020.
The year-on-year change in deferred income tax of $148.4 million resulting in a credit of $73.7 million for the year ended December 31, 2021 is due to decreases in deferred tax expense of $61.0 million, $19.9 million and $71.8 million, in our Nigeria, Sub-Saharan Africa and Latam segments respectively, partially offset by an increase deferred tax in Other segments of $4.3 million.
The year-on-year decrease in deferred income tax expense of $61.0 million in our Nigeria segment for the year ended December 31, 2021 results from the derecognition of a portion of the deferred tax assets related to unutilized finance costs and foreign exchange losses in the year ended December 31, 2020, resulting from the amendments in the Nigeria Finance Act of 2019 which limits the number of tax periods for which certain losses and allowances may be carried forward to be applied against future taxable profits. As a result of these limitation, we estimate that a portion of those allowances would expire before they could be utilized.
The year-on-year decrease in deferred income tax expense of $19.9 million in our Sub-Saharan Africa segment for the year ended December 31, 2021 results primarily from reversals of deferred income tax balances related to unutilized capital allowances and assessed losses which were reversed to a greater extent in the year ended December 31, 2020, owing to their utilization in that period.
The year-on-year decrease in deferred income tax expense of $71.8 million in our Latam segment for the year ended December 31, 2021 results primarily from the reversal of deferred income tax liability due to tax relief available from the CSS and Skysites Acquisitions.
Loss for the Period
Our loss for the year ended December 31, 2021 was $26.1 million compared to a loss of $322.7 million for the year ended December 31, 2020, a decrease of $296.6 million for the period of which $244.0 million is due to a year-on-year decrease in net foreign exchange losses on financing. The decrease in loss was also due to increased revenue, a reversal of allowance for trade receivables, an increase in other income, an aggregate decrease in other net finance costs, and a decrease in total tax expense, partially offset by and an increase in cost of sales and in administrative expenses for the period.
Segment Results
Revenue:
Revenue for each of our reportable segments was as follows:
For the year ended December 31, 2021 2020 Change Change $'000 $'000 $'000 % Nigeria 1,146,732 1,037,836 108,896 10.5 % Sub-Saharan Africa 343,945 313,416 30,529 9.7 % MENA 29,347 21,712 7,635 35.2 % Latam 59,706 30,185 29,521 97.8 % Total revenue 1,579,730 1,403,149 176,581 12.6 % Nigeria
Revenue for our Nigeria segment increased by $108.9 million, or 10.5%, to $1,146.7 million for the year ended December 31, 2021, compared to $1,037.8 million for the year ended December 31, 2020.
Year-on-year revenue for the year ended December 31, 2021 increased organically by $193.0 million, or 18.6%, driven by an increase in Tenants of 787, which includes Tenants from 317 net new sites, and 8,986 Lease Amendments added in the year ended December 31, 2021, and from increases through contractual CPI escalations and foreign exchange reset mechanisms.
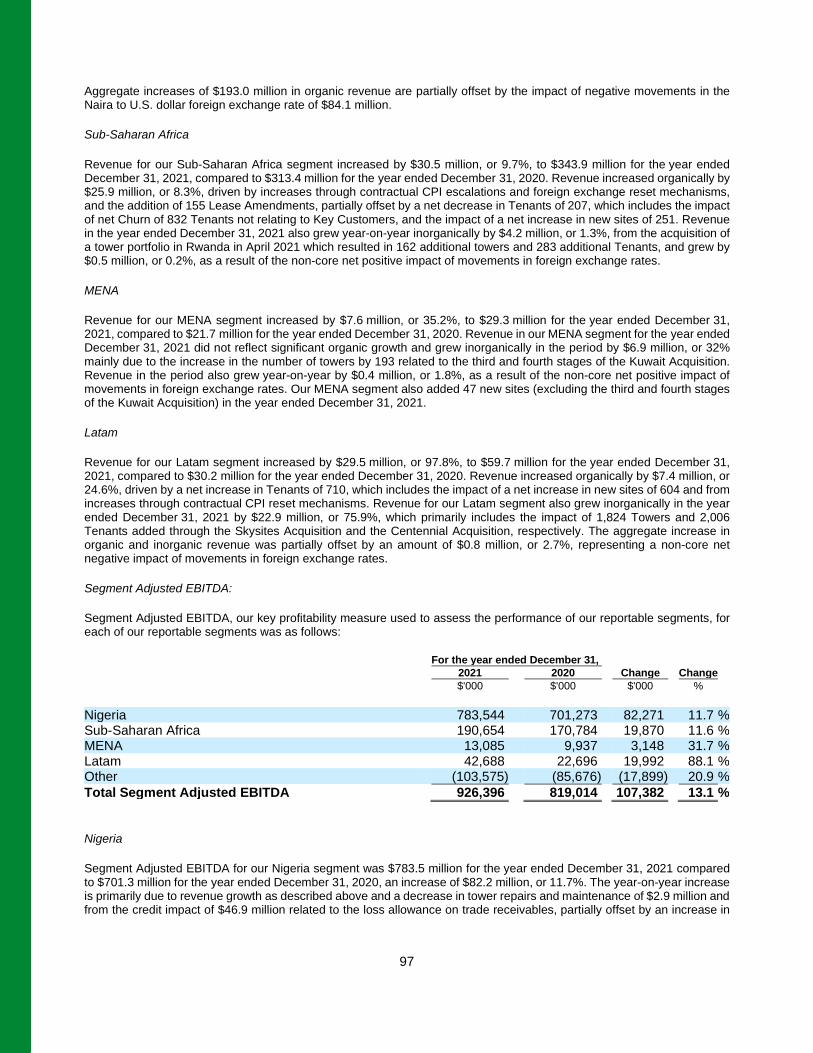
97
Aggregate increases of $193.0 million in organic revenue are partially offset by the impact of negative movements in the Naira to U.S. dollar foreign exchange rate of $84.1 million.
Sub-Saharan Africa
Revenue for our Sub-Saharan Africa segment increased by $30.5 million, or 9.7%, to $343.9 million for the year ended December 31, 2021, compared to $313.4 million for the year ended December 31, 2020. Revenue increased organically by $25.9 million, or 8.3%, driven by increases through contractual CPI escalations and foreign exchange reset mechanisms, and the addition of 155 Lease Amendments, partially offset by a net decrease in Tenants of 207, which includes the impact of net Churn of 832 Tenants not relating to Key Customers, and the impact of a net increase in new sites of 251. Revenue in the year ended December 31, 2021 also grew year-on-year inorganically by $4.2 million, or 1.3%, from the acquisition of a tower portfolio in Rwanda in April 2021 which resulted in 162 additional towers and 283 additional Tenants, and grew by $0.5 million, or 0.2%, as a result of the non-core net positive impact of movements in foreign exchange rates.
MENA
Revenue for our MENA segment increased by $7.6 million, or 35.2%, to $29.3 million for the year ended December 31, 2021, compared to $21.7 million for the year ended December 31, 2020. Revenue in our MENA segment for the year ended December 31, 2021 did not reflect significant organic growth and grew inorganically in the period by $6.9 million, or 32% mainly due to the increase in the number of towers by 193 related to the third and fourth stages of the Kuwait Acquisition. Revenue in the period also grew year-on-year by $0.4 million, or 1.8%, as a result of the non-core net positive impact of movements in foreign exchange rates. Our MENA segment also added 47 new sites (excluding the third and fourth stages of the Kuwait Acquisition) in the year ended December 31, 2021.
Latam
Revenue for our Latam segment increased by $29.5 million, or 97.8%, to $59.7 million for the year ended December 31, 2021, compared to $30.2 million for the year ended December 31, 2020. Revenue increased organically by $7.4 million, or 24.6%, driven by a net increase in Tenants of 710, which includes the impact of a net increase in new sites of 604 and from increases through contractual CPI reset mechanisms. Revenue for our Latam segment also grew inorganically in the year ended December 31, 2021 by $22.9 million, or 75.9%, which primarily includes the impact of 1,824 Towers and 2,006 Tenants added through the Skysites Acquisition and the Centennial Acquisition, respectively. The aggregate increase in organic and inorganic revenue was partially offset by an amount of $0.8 million, or 2.7%, representing a non-core net negative impact of movements in foreign exchange rates.
Segment Adjusted EBITDA:
Segment Adjusted EBITDA, our key profitability measure used to assess the performance of our reportable segments, for each of our reportable segments was as follows:
For the year ended December 31, 2021 2020 Change Change $'000 $'000 $'000 % Nigeria 783,544 701,273 82,271 11.7 % Sub-Saharan Africa 190,654 170,784 19,870 11.6 % MENA 13,085 9,937 3,148 31.7 % Latam 42,688 22,696 19,992 88.1 % Other (103,575) (85,676) (17,899) 20.9 % Total Segment Adjusted EBITDA 926,396 819,014 107,382 13.1 %
Nigeria
Segment Adjusted EBITDA for our Nigeria segment was $783.5 million for the year ended December 31, 2021 compared to $701.3 million for the year ended December 31, 2020, an increase of $82.2 million, or 11.7%. The year-on-year increase is primarily due to revenue growth as described above and a decrease in tower repairs and maintenance of $2.9 million and from the credit impact of $46.9 million related to the loss allowance on trade receivables, partially offset by an increase in
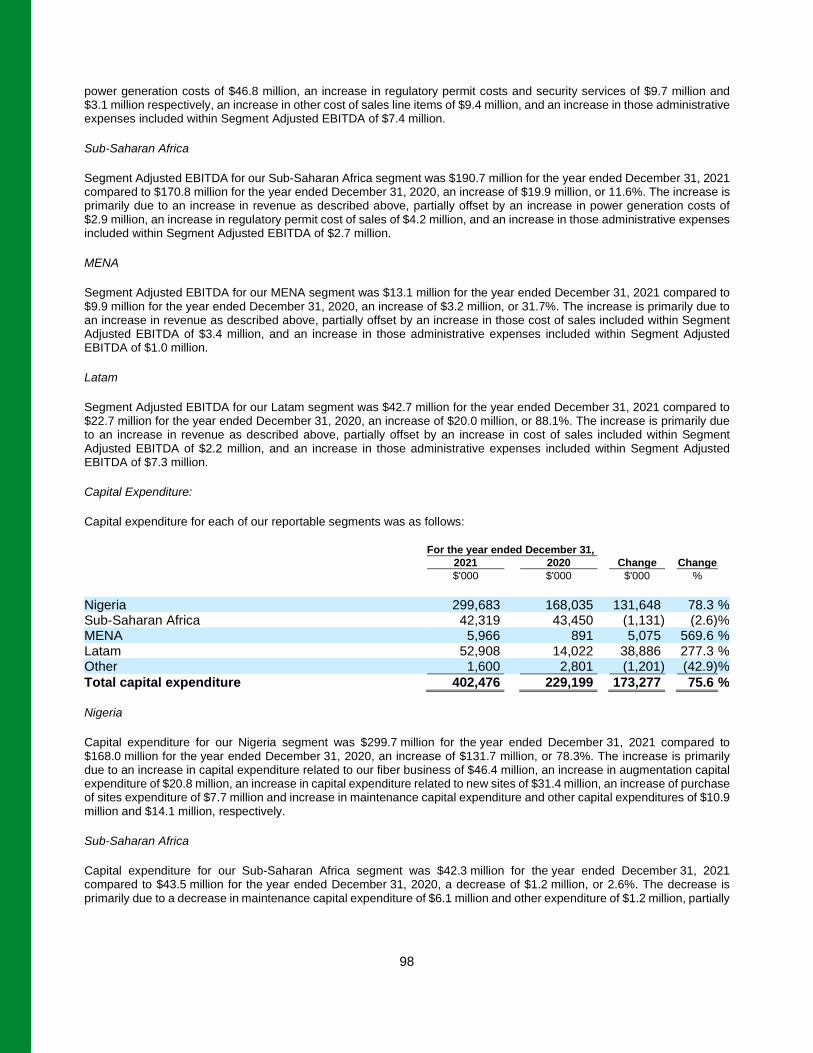
98
power generation costs of $46.8 million, an increase in regulatory permit costs and security services of $9.7 million and $3.1 million respectively, an increase in other cost of sales line items of $9.4 million, and an increase in those administrative expenses included within Segment Adjusted EBITDA of $7.4 million.
Sub-Saharan Africa
Segment Adjusted EBITDA for our Sub-Saharan Africa segment was $190.7 million for the year ended December 31, 2021 compared to $170.8 million for the year ended December 31, 2020, an increase of $19.9 million, or 11.6%. The increase is primarily due to an increase in revenue as described above, partially offset by an increase in power generation costs of $2.9 million, an increase in regulatory permit cost of sales of $4.2 million, and an increase in those administrative expenses included within Segment Adjusted EBITDA of $2.7 million.
MENA
Segment Adjusted EBITDA for our MENA segment was $13.1 million for the year ended December 31, 2021 compared to $9.9 million for the year ended December 31, 2020, an increase of $3.2 million, or 31.7%. The increase is primarily due to an increase in revenue as described above, partially offset by an increase in those cost of sales included within Segment Adjusted EBITDA of $3.4 million, and an increase in those administrative expenses included within Segment Adjusted EBITDA of $1.0 million.
Latam
Segment Adjusted EBITDA for our Latam segment was $42.7 million for the year ended December 31, 2021 compared to $22.7 million for the year ended December 31, 2020, an increase of $20.0 million, or 88.1%. The increase is primarily due to an increase in revenue as described above, partially offset by an increase in cost of sales included within Segment Adjusted EBITDA of $2.2 million, and an increase in those administrative expenses included within Segment Adjusted EBITDA of $7.3 million.
Capital Expenditure:
Capital expenditure for each of our reportable segments was as follows:
For the year ended December 31, 2021 2020 Change Change $'000 $'000 $'000 % Nigeria 299,683 168,035 131,648 78.3 % Sub-Saharan Africa 42,319 43,450 (1,131) (2.6) % MENA 5,966 891 5,075 569.6 % Latam 52,908 14,022 38,886 277.3 % Other 1,600 2,801 (1,201) (42.9) % Total capital expenditure 402,476 229,199 173,277 75.6 % Nigeria
Capital expenditure for our Nigeria segment was $299.7 million for the year ended December 31, 2021 compared to $168.0 million for the year ended December 31, 2020, an increase of $131.7 million, or 78.3%. The increase is primarily due to an increase in capital expenditure related to our fiber business of $46.4 million, an increase in augmentation capital expenditure of $20.8 million, an increase in capital expenditure related to new sites of $31.4 million, an increase of purchase of sites expenditure of $7.7 million and increase in maintenance capital expenditure and other capital expenditures of $10.9 million and $14.1 million, respectively.
Sub-Saharan Africa
Capital expenditure for our Sub-Saharan Africa segment was $42.3 million for the year ended December 31, 2021 compared to $43.5 million for the year ended December 31, 2020, a decrease of $1.2 million, or 2.6%. The decrease is primarily due to a decrease in maintenance capital expenditure of $6.1 million and other expenditure of $1.2 million, partially
99
offset by increases in augmentation capital expenditure, new site capital expenditure and refurbishment capital expenditure of $0.9 million, $4.1 million and $1.1 million, respectively.
MENA
Capital expenditure for our MENA segment was $6.0 million for the year ended December 31, 2021 compared to $0.9 million for the year ended December 31, 2020, an increase of $5.1 million, or 569.6%. The year-on-year increase is primarily due to an increase of $0.6 million in refurbishment capital expenditure, increase of $3.0 million relating to the Egypt license fee and an increase in new site capital expenditure of $1.5 million.
Latam
Capital expenditure for our Latam segment was $52.9 million for the year ended December 31, 2021 compared to $14.0 million for the year ended December 31, 2020, an increase of $38.9 million, or 277.3%. The year-on-year increase is primarily due to a net increase of $24.5 million in new site capital expenditure, an increase of maintenance capital expenditure of $4.9 million and an increase of $9.3 million as a result of our new fiber business.
B. Liquidity and Capital Resources
Overview
We generally fund our operations, which include operating expenses and debt service requirements (principal and interest payments), through cash flow from operating activities. We have historically funded acquisitions and other investments in our business, including large scale New Site construction and site improvements, from a combination of external equity raised from shareholders, long-term debt financings and internally generated cash from operations. External equity funding was raised at the IHS Holding Limited level, where it was held in U.S. dollars until required by operating subsidiaries or for acquisitions. As and when operating subsidiaries required these funds, the funding was allocated through intercompany loans to those subsidiaries. The proportion of intercompany loans to equity is unique to each operation and determined by commercial funding requirements, local taxation and corporate legislation.
As of December 31, 2021, we had $1,186 million of total liquidity, which was equal to our unrestricted cash and cash equivalents of $916 million and availability under the IHS Holding revolving credit facility (see “— Indebtedness” for more information) of $270 million. Our centralized treasury team supervises our cash management. Our cash and cash equivalents are generated within our operating subsidiaries and held either locally or up streamed to IHS Holding Limited (or intermediaries thereof). As a holding company, our only source of cash to pay our obligations will be distributions with respect to our ownership interests in our subsidiaries or repayment of intercompany loans from (i) the net earnings and cash flow generated by these subsidiaries and (ii) any excess funds from the refinancing of operating company debt financings.
We believe that our available liquidity and cash from operations will be sufficient to satisfy our operating expenses, debt service, capital expenditure requirements and organic growth strategies for the next 12 months. However, our ability to satisfy our operating expenses, debt service, capital requirements and growth strategies will depend on our future performance, which is subject to general economic, financial, competitive, regulatory and other factors, including those described in the “Risk Factors” section of this Annual Report on Form 20-F. If we are unable to generate sufficient cash flow from operating activities in the future, we may have to obtain additional financing. If we obtain additional capital by issuing equity, the current interests of our existing shareholders will be diluted. If we incur additional indebtedness, that indebtedness may contain significant financial and other covenants that may significantly restrict our operations. There can be no assurance that such financing will be available to us on commercially reasonable terms or at all.
Additionally, we continuously review our funding and maturity profile. As part of this review, we regularly explore opportunities in the global bond markets to try and ensure that we are well positioned to avail ourselves of any refinancing opportunities, including for our 2027 Notes and our other facilities.
100
Statements of cash flows
Net cash generated from operating activities
Net cash generated from operating activities increased by $114.9 million year-on year in the year ended December 31, 2021, to $750.2 million, from $635.3 million in the year ended December 31, 2020. The year-on-year increase is primarily due to increased cash from operations of $131.4 million, partially offset by increased income tax paid of $14.6 million and an increase in cash outflows from payment of rent of $1.7 million.
The year-on-year increase in cash from operations for the year ended December 31, 2021, is primarily due to the increase in cash profits, represented by the increase in Adjusted EBITDA after excluding the impact of the reversal of the loss allowance on trade and other receivables.
Net cash used in investing activities
Net cash used in investing activities increased by $119.4 million, to $877.9 million in the year ended December 31, 2021, from $758.5 million in the year ended December 31, 2020, primarily due to an increase in capital expenditure for property, plant and equipment (including advance payments) $170.7 million and increase in deposits of short term deposits of $103.6 million, partially offset by an increase of cash inflows from insurance claims of $10.4 million and decrease in consideration paid for business acquisitions of $141.9 million. The year-on-year decrease in cash paid for business acquisitions is due to larger expenditures in the year ended December 31, 2020 related to the CSS Acquisition and the first and second phase of the Kuwait Acquisition, compared to expenditures in the year ended December 31, 2021 which include the Skysites acquisition, the Centennial Columbia and Centennial Brazil acquisition, the third and fourth phase of the Kuwait Acquisition and the TIM Fiber Acquisition. The year-on-year increase in capital expenditures for property, plant and equipment (including advance payments) is described in more detail in Item 5.A. “Operating Results—Results of Operations—Segment Results.”
Net cash used in/generated from financing activities
Net cash generated from financing activities increased by $652.4 million, to $524.3 million in the year ended December 31, 2021, from net cash used in financing activities of $128.1 million in the year ended December 31, 2020. The year-on-year increase in cash inflows is primarily due to an increase of $290.2 million in loans received from third parties net of principal repayments, an increase of $79.7 million in aggregate gains received and deposits refunded on non-deliverable forward derivative instruments, and an increase in cash inflows for capital raised (net of costs) of $349.8 million. These increased inflows are partially offset by an increase of $37.9 million in cash outflows from aggregate payments of lease liability principal and interest, and an increase of $29.2 million in fees on loans and derivative instruments.
The year-on-year increase in cash generated from loans received from third parties, net of principal repayments, is primarily due to the issue of the 2026 Notes and 2028 Notes issued in the year ended December 31, 2021.
Indebtedness
Approximate U.S. dollar equivalent values for non-USD denominated facilities stated below are translated from the currency of the debt at the relevant exchange rates on December 31, 2021.
IHS Holding Revolving Credit Facility
IHS Holding Limited entered into an amendment and restatement agreement dated June 2, 2021 with Citibank Europe Plc, UK Branch as facility agent, or the RCF Amendment and Restatement Agreement, which amended and restated the $225 million revolving credit facility agreement dated March 30, 2020, or the Original IHS Holding Revolving Credit Facility and, as amended and restated under the RCF Amendment and Restatement Agreement, the Restated IHS Holding Revolving Credit Facility, between, amongst others, IHS Holding Limited, Citibank, N.A., London Branch as global coordinator, Citibank, N.A., London Branch, Absa Bank Limited (acting through its Corporate and Investment Banking division), Goldman Sachs Lending Partners LLC, JPMorgan Chase Bank, N.A., London Branch and Standard Chartered Bank Dubai International Financial Centre Branch, regulated by the Dubai Financial Services Authority, as mandated lead arrangers, Citibank Europe Plc, UK Branch, as facility agent, and the financial institutions listed therein as the original lenders. The Restated IHS Holding Revolving Credit Facility was amended and restated to align with the proposed amendments to the
101
indenture governing the IHS Netherlands Holdco B.V. Notes, as set forth in a consent solicitation statement dated June 14, 2021.
The commitments under the Restated IHS Holding Revolving Credit Facility were subsequently increased to $270 million, pursuant to an increase confirmation entered into by IHS Holding Limited and RMB International (Mauritius Limited) on July 23, 2021, and a further increase confirmation between IHS Holding Limited and the Royal Bank of Canada that became effective on October 14, 2021.
The Restated IHS Holding Revolving Credit Facility was further amended pursuant to an amendment letter dated September 29, 2021, which amended certain terms to align with the amendments made to the Senior Credit Facilities pursuant to the Senior Credit Facilities Amendment and Restatement Agreement (in each case as defined below).
The Restated IHS Holding Revolving Credit Facility is denominated in U.S. dollars and is governed by English law. Each of IHS Netherlands Holdco B.V., IHS Netherlands NG1 B.V., IHS Towers NG Limited, IHS Netherlands NG2 B.V., Nigeria Tower Interco B.V., INT Towers Limited and IHS Nigeria are guarantors under the Restated IHS Holding Revolving Credit Facility.
The interest rate per annum applicable to loans made under the Restated IHS Holding Revolving Credit Facility is, prior to a rate switch date, equal to LIBOR plus a margin of 3.00% per annum and, after a rate switch date is equal to a compounded reference rate based on SOFR (calculated on a five Risk-Free Rate, or RFR, banking day lookback), and a credit adjustment spread plus a margin of 3.00% per annum. IHS Holding Limited also pays certain other fees and costs, including fees for undrawn commitments, fees for utilization and fees to the agents.
Funds borrowed under the Restated IHS Holding Revolving Credit Facility can be applied towards general corporate purposes including, but not limited to, the financing of (a) New Site programs and (b) the repayment of indebtedness (including interest and fees on that indebtedness).
Subject to certain conditions, IHS Holding Limited may voluntarily prepay its utilizations and/or permanently cancel all or part of the available commitments under the Restated IHS Holding Revolving Credit Facility by giving three business days’ prior notice (or, in relation to a compounded rate loan, on five RFR banking days’ prior notice, or in any case any such shorter period as the majority lenders may agree). In addition to voluntary prepayments, the Restated IHS Holding Revolving Credit Facility requires mandatory cancellation, and if applicable, prepayment in full or in part in certain circumstances, including, but not limited to: (i) with respect to any lender, if it becomes unlawful for such lender to perform any of its obligations under the IHS Holding Revolving Credit Facility; and (ii) upon the occurrence of a change of control as defined in the credit agreement governing the Restated IHS Holding Revolving Credit Facility.
The credit agreement governing the Restated IHS Holding Revolving Credit Facility contains customary information undertakings, affirmative covenants and negative covenants (including, without limitation, a negative pledge), in each case subject to certain agreed exceptions and materiality carve-outs). The covenants include an interest cover ratio (the ratio of EBITDA for the relevant period to interest expense for the relevant period) and a leverage ratio (the ratio of net financial debt for the relevant period to EBITDA in respect of that relevant period) as financial covenants. These financial covenants are tested quarterly (except where compliance is required at any time and where testing is required upon incurrence) in arrear based on the previous 12 months, by reference to the financial statements delivered and/or each compliance certificate delivered. The credit agreement governing the Restated IHS Holding Revolving Credit Facility contains customary events of default (subject in certain cases to agreed grace periods, thresholds and other qualifications).
The Restated IHS Holding Revolving Credit Facility will terminate in March 2023 unless further extended in accordance with its terms for successive 12 month periods up to and including March 2025. As of December 31, 2021, the Restated IHS Holding Revolving Credit Facility was undrawn and had $270 million in available borrowing capacity, which could be increased to up to $300 million.
IHS Holding Bridge Facility
IHS Holding Limited entered into a $500 million bridge facility agreement dated August 10, 2021, or the IHS Holding Bridge Facility, between, amongst others, IHS Holding Limited, Goldman Sachs Lending Partners LLC, JPMorgan Chase Bank, N.A., London Branch and Standard Chartered Bank, as mandated lead arrangers and original lenders, Standard Chartered Bank, as facility agent and the financial institutions. The IHS Holding Bridge Facility is denominated in U.S. dollars and is governed by English law. Funds borrowed under the IHS Holding Bridge Facility can be applied only toward certain acquisitions listed therein.
102
The IHS Holding Bridge Facility will terminate 12 months from the signing date of the IHS Holding Bridge Facility (being August 10, 2021), unless extended for a period of six months after the original termination date on the request of IHS Holding Limited.
The IHS Holding Bridge Facility was amended pursuant to an amendment letter dated September 29, 2021, which amended certain terms to align with the corresponding terms of the Restated Senior Credit Facilities pursuant to the Senior Credit Facilities Amendment and Restatement Agreement (in each case as defined below).
The interest rate per annum applicable to loans made under the IHS Holding Bridge Facility is equal to LIBOR plus a margin of 3.50% per annum increasing by 0.50% every three months for a period of 18 months up to a maximum of 6.00% per annum and, after a rate switch date, is equal to a compounded reference rate based on SOFR (calculated on a five RFR banking day lookback). IHS Holding Limited also pays certain other fees and costs, including fees for undrawn commitments, arrangement fees and fees to the facility agent.
Subject to certain conditions, IHS Holding Limited may voluntarily prepay its utilizations and/or permanently cancel all or part of the available commitments under the IHS Holding Bridge Facility by giving three business days’ prior notice or on five RFR Banking Days’ notice following the replacement of USD LIBOR in accordance with the terms of the IHS Holding Bridge Facility, or such shorter period as the majority lenders may agree. In addition to voluntary prepayments, the IHS Holding Bridge Facility requires mandatory cancellation, and if applicable, prepayment in full or in part in certain circumstances, including, but not limited to: (i) with respect to any lender, if it becomes unlawful for such lender to perform any of its obligations under the IHS Holding Bridge Facility; (ii) upon the occurrence of a change of control and (iii) disposal proceeds, acquisition claims and takeout financing and equity issuance proceeds as defined in the credit agreement governing the IHS Holding Bridge Facility.
The credit agreement governing the IHS Holding Bridge Facility contains customary information, undertakings, affirmative covenants and negative covenants (including, without limitation, a negative pledge) in each case, subject to certain agreed exceptions and materiality carve-outs. The IHS Holding Bridge Facility includes an interest cover ratio (the ratio of EBITDA for the relevant period to interest expense for the relevant period) and a leverage ratio (the ratio of net financial debt for the relevant period to EBITDA in respect of that relevant period) as financial covenants. These financial covenants are tested quarterly in arrear based on the previous 12 months, ending on each relevant financial quarter date, by reference to the annual or quarterly (as applicable) financial statements delivered and/or each compliance certificate delivered. The credit agreement governing the IHS Holding Bridge Facility also contains customary events of default (subject in certain cases to agreed grace periods, thresholds and other qualifications).
IHS Netherlands Holdco B.V. Notes
On September 18, 2019, our wholly owned subsidiary, IHS Netherlands Holdco B.V., issued $500 million of 7.125% Senior Notes due 2025 (the “2025 Notes”), and $800 million of 8.0% Senior Notes due 2027 (the “2027 Notes”, and, together with the 2025 Notes, the “IHS Netherlands Holdco B.V. Notes”), which are guaranteed by IHS Netherlands NG1 B.V., IHS Netherlands NG2 B.V., Nigeria Tower Interco B.V., IHS Nigeria, IHS Towers NG Limited and INT Towers, and (since June 22, 2021) IHS Holding Limited. The issuance of the IHS Netherlands Holdco B.V. Notes was part of a refinancing transaction (that also included the Senior Credit Facilities, as described below), the proceeds of which were used to, inter alia, repay (a) the outstanding $800 million 9.5% Senior Notes due 2021 previously issued by IHS Netherlands Holdco B.V. in 2016, (b) the INT Towers Bank Loan and (c) the IHS Nigeria Bank Loan.
We used the proceeds from the IHS Netherlands Holdco B.V. Notes to refinance existing indebtedness, including the $800 million aggregate principal amount of 9.500% Senior Notes due 2021 issued by IHS Netherlands Holdco B.V., the IHS Nigeria Bank Loan and the INT Towers Bank Loan, pay transaction fees and expenses, to fund a partial settlement of intercompany loans and for general corporate purposes.
On July 31, 2020, IHS Netherlands Holdco B.V. issued an additional $140 million in aggregate principal amount of 2027 Notes and an additional $10 million in aggregate principal amount of 2025 Notes, resulting in an aggregate principal amount of $510 million of 2025 Notes and $940 million of 2027 Notes. The proceeds of the issuance of the additional notes were used for general corporate purposes.
On June 14, 2021, IHS Netherlands Holdco B.V. announced that it had commenced a consent solicitation in respect of all of its outstanding IHS Netherlands Holdco B.V. Notes, soliciting consents to proposed amendments to the indenture governing the IHS Netherlands Holdco B.V. Notes to, among other things, expand the “restricted group” to encompass IHS Holding Limited and all of IHS Holding Limited’s subsidiaries (other than any unrestricted subsidiaries), which would then
103
be subject to the covenants and events of default under the indenture governing the IHS Netherlands Holdco B.V. Notes (as amended). The proposed amendments also included certain other consequential changes to the negative covenants and restrictions in the indenture governing the IHS Netherlands Holdco B.V. Notes resulting from the larger group structure. On June 17, 2021, IHS Netherlands Holdco B.V. announced that it had obtained the consents from holders of a majority in aggregate principal amount of its outstanding IHS Netherlands Holdco B.V. Notes to effect the proposed amendments and announced on June 22, 2021, that the amendments to the indenture governing the IHS Netherlands Holdco B.V. Notes had become operative.
On November 16, 2021, IHS Netherlands Holdco B.V. issued a conditional notice of redemption (“Conditional Notice of Redemption”) in respect of the 2025 Notes. IHS Netherlands Holdco B.V.’s obligation to redeem any of the 2025 Notes was conditioned upon the successful issuance by IHS Holding Limited of $500 million 5.625% Senior Notes due 2026 (the “2026 Notes”) and $500 million 6.250% Senior Notes due 2028 (the “2028 Notes” together with the 2026 Notes, the “IHS Holding Limited Notes”) to fund the redemption of the 2025 Notes (including, without limitation, the redemption premium, additional amounts (if any) and accrued interest to the redemption date) (the “Financing Condition”).
On November 29, 2021, IHS Netherlands Holdco B.V. issued an irrevocable notice of redemption (“Final Notice of Redemption”) confirming that the conditions specified in the Conditional Notice of Redemption including the Financing Condition had been met and the 2025 Notes would be redeemed on November 30, 2021. On November 30, 2021, pursuant to the Final Notice of Redemption, IHS Netherlands Holdco B.V. redeemed the full principal amount of the 2025 Notes. The 2027 Notes mature on September 18, 2027. The 2027 Notes pay interest semi-annually and the principal is repayable in full on maturity. At any time prior to September 18, 2022, IHS Netherlands Holdco B.V. may redeem up to 40% of the 2027 Notes at a redemption price equal to 108.000% of the principal amount of the 2027 Notes, plus accrued and unpaid interest and additional amounts, if any, to the redemption date, so long as at least 50% of the aggregate original principal amount of the applicable series of 2027 Notes remains outstanding immediately after each such redemption. In addition, IHS Netherlands Holdco B.V. may redeem all or a part of the 2027 Notes at a redemption price equal to 100% of the principal amount of the notes redeemed plus a “make-whole” premium. On or after September 18, 2022, 2023 or 2024, IHS Netherlands Holdco B.V. may redeem all or a part of the 2027 Notes at 104.000%, 102.000% and 100.000%, respectively. The indenture governing the IHS Netherlands Holdco B.V. Notes contains customary negative covenants and restrictions, including, but not limited to, our ability to: incur or guarantee additional indebtedness and issue certain preferred stock; make certain restricted payments and investments, including dividends or other distributions; create or incur certain liens; enter into agreements that restrict the ability of restricted subsidiaries to pay dividends; transfer or sell certain assets; merge or consolidate with other entities and enter into certain transactions with affiliates. Additionally, the indenture provides the flexibility to substitute IHS Holding Limited, or any parent holding company of IHS Netherlands Holdco B.V., as the issuer of the IHS Netherlands Holdco B.V. Notes upon a qualifying initial public offering, subject to certain conditions.
IHS Holding Limited Notes
On November 29, 2021, IHS Holding Limited issued the IHS Holding Limited Notes, which are guaranteed by IHS Netherlands Holdco B.V., IHS Netherlands NG1 B.V., IHS Netherlands NG2 B.V., Nigeria Tower Interco B.V., IHS Nigeria Limited, IHS Towers NG Limited and INT Towers Limited. At any time prior to November 29, 2023 for the 2026 Notes and November 29, 2024 for the 2028 Notes, IHS Holding Limited may redeem up to 40% of the notes at a redemption price equal to 105.625% of the principal amount of the 2026 Notes and 106.250% of the principal amount of the 2028 Notes, plus accrued and unpaid interest and additional amounts, if any, to the redemption date, so long as at least 50% of the aggregate original principal amount of the applicable series of IHS Holding Limited Notes remains outstanding immediately after each such redemption. In addition, IHS Holding Limited may redeem all or a part of the IHS Holding Limited Notes at a redemption price equal to 100% of the principal amount of the notes redeemed plus a “make-whole” premium. On or after November 29, 2023, 2024 or 2025, IHS Holding Limited may redeem all or a part of the 2026 Notes at 102.81250%, 101.40625% and 100.00000%, respectively. On or after November 29, 2024, 2025 or 2026, IHS Holding Limited may redeem all or a part of the 2028 Notes at 103.1250%, 101.5625% and 100.0000%, respectively.
The indenture governing the IHS Holding Limited Notes contains customary negative covenants and restrictions, including, but not limited to, our ability to: incur or guarantee additional indebtedness and issue certain preferred stock; make certain restricted payments and investments, including dividends or other distributions; create or incur certain liens; enter into agreements that restrict the ability of restricted subsidiaries to pay dividends; transfer or sell certain assets; merge or consolidate with other entities and enter into certain transactions with affiliates.
104
We used the proceeds of the issuance of the IHS Holding Limited Notes to redeem the entire principal amount of the 2025 Notes including any accrued and unpaid interest, pay the redemption premium for the 2025 Notes and fees and expenses related to the offering of the IHS Holding Limited Notes, and for general corporate purposes. The IHS Holding Limited Notes pay interest semi-annually and the principal is repayable in full on maturity.
Senior Credit Facilities
IHS Netherlands Holdco B.V., IHS Nigeria, IHS Towers NG Limited, INT Towers and IHS Holding Limited entered into an amendment and restatement agreement dated September 29, 2021 with Ecobank Nigeria Limited as agent, or the Senior Credit Facilities Amendment and Restatement Agreement, which amended and restated the facilities agreement dated September 3, 2019, or the Original Senior Credit Facilities, and, as amended and restated under the Senior Credit Facilities Amendment and Restatement Agreement, the Restated Senior Credit Facilities, between, among others, IHS Netherlands Holdco B.V. as holdco and guarantor, and, IHS Nigeria, IHS Towers NG Limited and INT Towers as borrowers and guarantors, each of IHS Netherlands NG1 B.V., IHS Nigeria, IHS Netherlands NG2 B.V., IHS Towers NG Limited, Nigeria Tower Interco B.V. and INT Towers as guarantors, Absa Bank Limited (acting through its Corporate and Investment Banking division), Citibank, N.A., London Branch, Goldman Sachs Bank USA, J.P. Morgan Securities plc, FirstRand Bank Limited (London Branch) (acting through its Merchant Bank division) and Standard Chartered Bank, as mandated lead arrangers, Ecobank Nigeria Limited as agent and the financial institutions listed therein as the original lenders. The Restated Senior Credit Facilities was amended and restated to align with the amendments to the indenture governing the 2027 Notes (as defined above) issued by IHS Netherlands Holdco B.V., as set forth in a consent solicitation statement dated June 14, 2021, and to add IHS Holding Limited as a guarantor. The Restated Senior Credit Facilities were entered into as part of a wider refinancing exercise (that also included the issuance of the IHS Netherlands Holdco B.V. Notes, as described above) of our Nigeria group debt. The Restated Senior Credit Facilities are governed by English law. The Restated Senior Credit Facilities also include customary negative and financial covenants that limit certain activities of IHS Netherlands Holdco B.V., IHS Nigeria, IHS Towers NG Limited and INT Towers. This facility was fully drawn down in 2019.
The interest rate per annum applicable to loans made under the Restated Senior Credit Facilities is equal to: (a) in relation to the U.S. dollar facility, prior to a rate switch date, LIBOR (subject to a zero floor) plus a margin of 4.25% per annum (subject to a margin ratchet where the level of margin may be increased (up to a maximum of 4.50)% or decreased subject to certain tests, including the relevant leverage ratio of the IHS Holding Limited group) and, after a rate switch date for U.S. dollars, is equal to a compounded reference rate based on SOFR (calculated on a five day RFR banking day lookback) and a credit adjustment spread plus the margin; and (b) in relation to the Naira facility, NIBOR (subject to a zero floor) plus a margin of 2.50% per annum. IHS Netherlands Holdco B.V. also pays certain other fees and costs, including fees for undrawn commitments, management fees, participation fees and fees to the agent.
The U.S. dollar facility had an original principal amount of $110.0 million, and the Naira facility had an original principal amount of ₦141.3 billion (approximately $325 million).
Funds borrowed under the Restated Senior Credit Facilities were to be applied towards, inter alia, refinancing certain indebtedness of INT Towers, general corporate and working capital purposes, and funding a partial settlement of intercompany loans.
Each facility under the Restated Senior Credit Facilities will terminate on the date falling 60 months after the date of the first utilization of that facility. The Restated Senior Credit Facilities will be repayable in instalments. Subject to certain conditions, IHS Netherlands Holdco B.V. and the borrowers may voluntarily prepay utilizations and/or permanently cancel all or part of the available commitments under the Restated Senior Credit Facilities by giving five business days’ prior notice (or such shorter period as the majority lenders may agree). In addition to voluntary prepayments, the Restated Senior Credit Facilities requires mandatory cancellation, and if applicable, prepayment in full or in part in certain circumstances.
IHS Côte d’Ivoire S.A. Facility
On June 30, 2015, IHS Côte d’Ivoire S.A. entered into a credit agreement with Citibank Côte d’Ivoire, Ecobank Côte d’Ivoire, Société Genérale de Banques en Côte d’Ivoire, The Standard Bank of South Africa Limited and Standard Chartered Bank, as amended and restated on August 11, 2017, split into one tranche with a total commitment of €52 million (approximately $59 million), or the IHS Côte d’Ivoire Euro Tranche, and one tranche with a total commitment of XOF 44.6 billion (approximately $77 million), or the IHS Côte d’Ivoire XOF Tranche, collectively the IHS Côte d’Ivoire S.A. Facility. The IHS Cote d’Ivoire S.A. Facility is guaranteed by IHS Holding Limited. The IHS Côte d’Ivoire Euro Tranche was issued at an interest rate of 3.75% plus EURIBOR, (subject to a zero floor), and the IHS Côte d’Ivoire XOF Tranche was issued at an interest rate of 6%. The IHS Côte d’Ivoire S.A. Facility contains customary information and negative covenants and requires
105
IHS Côte d’Ivoire S.A. to observe certain customary affirmative covenants, subject to certain agreed exceptions and materiality carve-outs. The covenants include that IHS Côte d’Ivoire S.A. maintain specified net debt to EBITDA ratios and interest coverage ratios, each as defined in the IHS Côte d’Ivoire S.A. Facility. The IHS Côte d’Ivoire S.A. Facility will expire in August 2022. This facility was fully drawn down in 2017.
IHS Zambia Limited Facility
On December 23, 2020, IHS Zambia Limited entered into a common terms agreement with the International Finance Corporation and Standard Chartered Bank, with a total commitment of $95.0 million, or the IHS Zambia Limited Facility, split into two different facilities, the first facility for an aggregate commitment representing $75.0 million, or the IFC Facility, and the second facility for an aggregate commitment representing $20.0 million, or the SCB Facility. The IHS Zambia Limited Facility was amended and restated on February 13, 2021.
The IHS Zambia Limited Facility is guaranteed by IHS Holding Limited. As of March 4, 2021, the IHS Zambia Limited Facility was fully utilized. The IHS Zambia Limited Facility was issued at an interest rate of 5.0% plus LIBOR (subject to a zero floor). The IHS Zambia Limited Facility contains customary information and negative covenants and requires IHS Zambia Limited to observe certain customary affirmative covenants, subject to certain agreed exceptions and materiality carve-outs. The covenants include that IHS Zambia Limited maintain specified net debt to EBITDA ratios and interest coverage ratios, each as defined in the IHS Zambia Limited Facility. The respective facilities comprising the IHS Zambia Limited Facility will expire in December 2027.
IHS Rwanda Limited Facility
On June 4, 2014, IHS Rwanda Limited entered into a common terms agreement, or the CTA, with IFC, FMO, Access Bank (Rwanda) Ltd, Ecobank Rwanda Limited, Guaranty Trust Bank (Rwanda) Ltd, I&M Bank (Rwanda) Limited and KCB Bank Rwanda, or collectively the Commercial Lenders, as amended from time to time. Pursuant to the CTA, IHS Rwanda Limited entered into the following credit agreements: a credit agreement with IFC with a total commitment of up to $25 million, or the IFC Facility, a credit agreement with FMO with a total commitment of up to $20 million, or the FMO Facility and, together with the IFC Facility, the USD Facility, and a credit agreement with the Commercial Lenders with a total commitment of up to RWF 13.8 billion (approximately $14 million), or the RWF Facility, together with the IFC Facility and the FMO Facility, collectively, the IHS Rwanda Limited Facility. The IHS Rwanda Facility is guaranteed by IHS Holding Limited. As of December 31, 2018, the IHS Rwanda Limited Facility was only partially utilized as follows: $15.7 million was utilized of the IFC Facility, $12.7 million was utilized of the FMO Facility and RWF8.7 billion was utilized of the RWF Facility. The remainder of the IHS Rwanda Limited Facility was cancelled. The IFC Facility and FMO Facility were issued at an interest rate of 6.5% plus LIBOR (subject to a zero floor), and the RWF Facility was issued at an interest rate of 16.0%. The IHS Rwanda Limited Facility contains customary information and negative covenants and requires IHS Rwanda Limited to observe certain customary affirmative covenants, subject to certain agreed exceptions and materiality carve-outs. The covenants include that IHS Rwanda Limited maintain specified net debt to EBITDA ratios, prospective debt service coverage ratios, financial debt to contributed capital ratios and restrictions on capital expenditures, each as defined in the CTA governing the IHS Rwanda Limited Facility. The outstanding commitment on the RWF Facility and the USD Facility were fully repaid as of March 30, 2021 and July 20, 2021 respectively.
IHS Kuwait Facility
On April 19, 2020, IHS Kuwait Limited entered into a credit agreement with Al Ahli Bank of Kuwait K.S.C.P and Mashreq Bank PSC, Kuwait Branch, with a total commitment of KWD equivalent of $85 million, or the IHS Kuwait Limited Facility. The IHS Kuwait Limited Facility was issued at an interest rate of 2.00% plus 3 Month KIBOR. The IHS Kuwait Limited Facility contains customary information and negative covenants and requires IHS Kuwait Limited to observe certain customary affirmative covenants, subject to certain agreed exceptions and materiality carve outs. The covenants include that IHS Kuwait Limited maintain specified net debt to EBITDA ratios, a debt service cover ratio and restrict capital expenditures to levels established within the credit agreement, each as defined in the IHS Kuwait Limited Facility. The IHS Kuwait Limited Facility will expire in April 2029. As at December 31, 2021, KWD21 million (approximately $69 million) of this facility was drawn down. The proceeds of the drawdown were used to reduce the cash funded investment in the acquisition by IHS, which was funded entirely with cash at the initial closing, as well as for general corporate purposes.
CSS Facilities
On February 5, 2020, IHS Brasil — Cessão De Infraestruturas S.A. (previously known as Cell Site Solutions — Cessão de Infraestruturas S.A.) entered into a credit agreement with Itaú Unibanco S.A., with a total commitment of BRL 170 million
106
(approximately $30.5 million), or the Itau Cell Site Solutions — Cessão de Infraestruturas S.A. Facility, or Itaú CSS Facility. On June 10, 2020, IHS Brasil — Cessão de Infraestruturas S.A. extended the termination date with Itau Unibanco S.A., with the total commitment of BRL 170 million (approximately $30.5 million) remaining unchanged. The Itaú CSS Facility was issued at an interest rate of 3.85% plus CDI. The Itaú CSS Facility contains restrictions on the total debt allowed, dividends, intercompany loans and capital reductions. The Itaú CSS Facility expired in June 2021. This facility was fully drawn down in February 2020, and fully repaid in May 2021.
On May 30, 2019, IHS Brasil — Cessão de Infraestruturas S.A. entered into a credit agreement with Banco Safra S.A., with a total commitment of BRL 30 million (approximately $5.4 million), or the Safra Cell Site Solutions — Cessão de Infraestruturas S.A. Facility, or the Safra CSS Facility. On May 30, 2020, IHS Brasil — Cessão de Infraestruturas S.A. extended the termination date with Banco Safra S.A., with the total commitments of BRL 30 million (approximately $5.4 million) remaining unchanged. The Safra CSS Facility was issued at an interest rate of 3.85% plus CDI. The Safra CSS Facility contains restrictions on dividends, intercompany loans and capital reductions. The Safra CSS Facility was fully drawn down in May 2019, and fully repaid in May 2021.
IHS Brasil Participacoes Ltda Facilities
On May 21, 2021, IHS Brasil Participacoes Ltda entered into a credit agreement with Itaú Unibanco S.A., with a total commitment of BRL 300 million (approximately $54 million), which we refer to as the Itaú IHS Brasil Participacoes Limitada Facility. The Itaú IHS Brasil Participacoes Limitada Facility is guaranteed by IHS Brasil Cessão de Infraestruturas S.A. and contains customary information and negative covenants. The covenants include that IHS Brasil Participacoes Ltda maintains specified net debt to EBITDA and interest cover ratios. The Itaú IHS Brasil Participacoes Limitada Facility was issued at an interest rate of 3.65% plus CDI. The Itaú IHS Brasil Participacoes Limitada Facility contains restrictions on the total debt allowed, dividends, intercompany loans and capital reductions. The Itaú IHS Brasil Participacoes Limitada Facility will expire in May 2029. This facility was fully drawn down in May 2021. In December 2021, the Itaú IHS Brasil Participacoes Limitada Facility was assigned to IHS Brasil - Cessão de Infraestruturas S.A. following an internal corporate reorganisation, pursuant to which IHS Brasil Participacoes Ltda and Skysites Holding S.A. merged into IHS Brasil - Cessão de Infraestruturas S.A. (the surviving entity).
On June 28, 2021, IHS Brasil Participacoes Ltda entered into a credit agreement with Banco do Brasil S.A., with a total commitment of BRL 100 million (approximately $18 million), which we refer to as the Banco do Brasil IHS Brasil Participacoes Ltda Facility. The Banco do Brasil IHS Brasil Participacoes Ltda Facility is guaranteed by IHS Brasil — Cessão de Infraestruturas S.A. and contains customary information and negative covenants. The covenants include that IHS Brasil Participacoes Ltda maintains specified net debt to EBITDA and interest cover ratios. The Banco do Brasil IHS Brasil Participacoes Ltda Facility was issued at an interest rate of 3.65% plus CDI. The Banco do Brasil IHS Brasil Participacoes Ltda Facility contains restrictions on the total debt allowed, dividends, intercompany loans and capital reductions. The Banco do Brasil IHS Brasil Participacoes Ltda Facility will expire in May 2029. This facility was fully drawn down in June 2021. In December 2021, the Itaú IHS Brasil Participacoes Limitada Facility was assigned to IHS Brasil - Cessão de Infraestruturas S.A. following an internal corporate rerganisation, pursuant to which IHS Brasil Participacoes Ltda and Skysites Holding S.A. merged into IHS Brasil - Cessão de Infraestruturas S.A. (the surviving entity).
C. Research and Development, Patents and Licenses, etc.
The Company does not have any research and development policies or patents. See Note 2.13(b) to our consolidated financial statements included in this Annual Report for a discussion of our licenses.
D. Trend Information
Other than as disclosed elsewhere in this Annual Report, we are not aware of any trends, uncertainties, demands, commitments or events since December 31, 2021 that are reasonably likely to have a material adverse effect on our revenues, income, profitability, liquidity or capital resources, or that would cause the disclosed financial information to be not necessarily indicative of future operating results or financial conditions.
E. Critical Accounting Estimates
The preparation of our financial information requires management to make judgments, estimates and assumptions that affect the application of policies and reported amounts of assets and liabilities, revenues and expenses. The estimates and associated assumptions are based on historical experience and various other factors that are believed to be reasonable
107
under the circumstances. The key sources of estimation uncertainty that have a significant risk of causing material adjustments to the carrying amounts of assets and liabilities are discussed below.
Impairment of non-financial assets
The Group assesses its non-financial assets including property, plant and equipment, goodwill, and other intangible assets for possible impairment if there are events or changes in circumstances that indicate that carrying values of the assets may not be recoverable, or at least at the end of every reporting period. Such indicators include changes in the Group’s business plans, changes in diesel prices, evidence of physical damage and technological changes and impacts of obsolescence. If there are rapid changes in technology of the existing telecommunication infrastructure, the Group may need to recognize significant impairment charges.
The Group tests annually whether goodwill has suffered any impairment, in accordance with the accounting policy stated in this Annual Report.
An impairment loss is recognized for the amount by which the asset’s carrying amount exceeds its recoverable amount. The recoverable amount is the higher of an asset’s fair value less costs of disposal and its value in use. For the purposes of assessing impairment, assets are grouped at the lowest levels for which there are separately identifiable cash flows. Refer to note 15 for Goodwill and intangible assets impairment considerations.
The assessment for impairment entails comparing the carrying value of the cash generating unit with its recoverable amount, that is, the higher of the value in use and the fair value less costs of disposal. Value in use is determined on the basis of discounted estimated future net cash flows. Fair value less costs of disposal is determined on the basis of tower cash flow multiples from recent comparable transactions. Determination as to whether and how much an asset is impaired involves management estimates on highly uncertain matters such as future revenue (taking into account tenancy rates), and the direct effect these have on gross profit margins in the initial five-year forecast period, discount rates, terminal growth rates, valuation multiples observed in comparable transactions and cost related to the disposal of a business.
In determining value in use the Group makes estimates and assumptions concerning the future. The assumptions adopted in the computation of the value in use are considered reasonable to the circumstance of each CGU. The resulting accounting estimates will, by definition, seldom equal the related actual results. Such estimates and assumptions are continually evaluated and are based on historical experience and other factors, including expectations of future events that are believed to be reasonable under the circumstances.
Share-based payment valuation
The Group initially measures the cost of share-based payment transactions with employees using an option pricing model to determine the fair value of the liability incurred. Estimating fair value for share-based payment transactions require determination of the most appropriate valuation model, which is dependent on the terms and conditions of the grant. This estimate also requires determination of the most appropriate inputs to the valuation model including the expected life of the share option, volatility and weighted average share price of each option and making assumptions about them.
Equity settled share-based payment obligations granted to employees are measured at their fair value (at the date of grant or the date of amendment in the case of modification of terms) and are recognized as an expense, with a corresponding increase in equity, over the vesting period of the awards. The amount recognized as an expense is adjusted to reflect the number of awards for which the related service and non-market performance conditions are expected to be met, such that the amount ultimately recognized is based on the number of awards that meet the related service and non-market performance conditions at the vesting date. This requires a reassessment of the expectation of the likelihood of meeting the non-market performance conditions used at the end of each reporting period.
Regulatory accruals
The Group requires a variety of regulatory approvals and permits related to its license to operate and meets its compliance requirements in respect of individual tower sites. These charges are levied by various national and state authorities. There is uncertainty over the level of charges where rates (e.g. percentage of revenue) remain under negotiation with the relevant authorities and also over the period for which charges will apply where demands have not yet been received from authorities on a site by site basis. State authorities may also make claims on an ad-hoc basis for additional charges relating to new compliance requirements or charges significantly in excess of levels previously charged for an existing requirement. These ad-hoc claims may be made on a prospective or retrospective basis.
108
The Group recognizes an accrual for unbilled regulatory costs based on management estimates of the rates per permit/approval type, periods for which permits/approvals potentially relate and the probability of charges being raised resulting in a cash outflow. The most significant accrual relates to the Group’s operations in Nigeria, where the amount accrued is $30.1 million (2020: $28.3 million, 2019: $43.8 million). The accrual is based both on permits where rates are known amounts and those where amounts are based on management estimates including:
• the assumed percentage of maximum “claimed” liability related to “ad hoc” state level claims;
• the assumption that the risk related to potentially unpaid “regular” claims reduces over time and is accrued at 100% but reduced to 0% for balance over a certain number of years;
• assumptions regarding the risk of liabilities arising in respect of one-off site development related charges in respect of sites acquired by the group.
A 10 percentage point change in management’s estimate of the amount of the potential liability that, subject to these estimates, will eventually be demanded and paid to the relevant authorities would alter the accrual at December 31, 2021 by approximately $3.3 million (2020: $2.9 million, 2019: $3.5 million). Management has only considered items in the sensitivity analysis that are subject to management’s rates estimate in the total amount accrued.
Revenue recognition Variable consideration Initial recognition of revenue includes an assessment of the recoverability of revenue. Amounts not expected to be recovered at the point of initial recognition are considered to be variable consideration, contingent upon the receipt of funds from the customer, and are therefore subject to measurement constraints as such payments are not wholly within the control of the Group. A 10-percentage point change in management’s estimate of the amount of variable consideration that will eventually be received would alter revenue recognized by approximately $16.8 million (2020: $14.2 million, 2019: $nil).
Delayed invoicing Revenue also includes estimates in respect of services provided where billing is not completed, including in respect of tower sites coming into service, or changes in customer implemented technologies since the most recent invoicing cycle and in respect of services subject to ongoing negotiation regarding price or other contract interpretation disputes with customers. For each of these scenarios, revenue is accrued based on management’ expectation of the final billable amounts.
A 20-percentage point change in management’s estimate of the amount of accrued revenue, subject to these delayed billing estimates would alter revenue recognized by approximately $5.0 million (2020: $3.3 million, 2019: $0.8 million).
For a summary of all of our significant accounting policies, see Note 2 to the consolidated financial statements included elsewhere in this Annual Report.Recent Accounting Pronouncements
New standards and interpretations not yet adopted are also disclosed in Note 2.1 to the consolidated financial statements included elsewhere in this Annual Report.
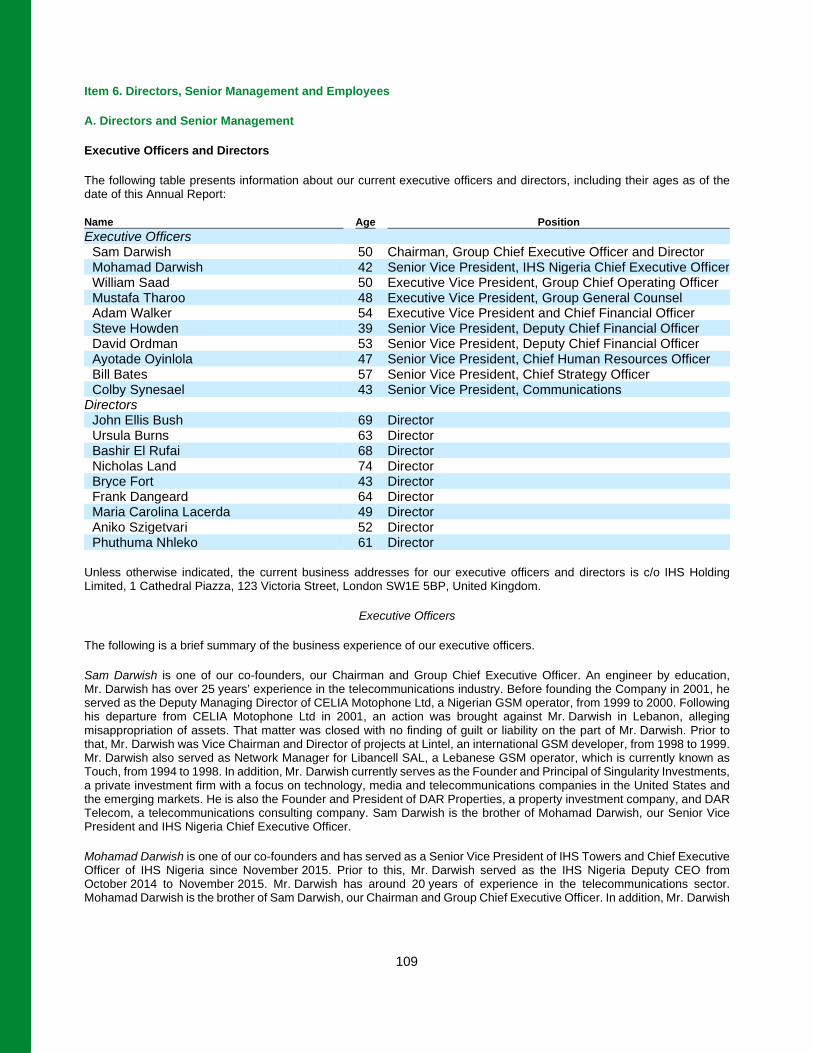
109
Item 6. Directors, Senior Management and Employees
A. Directors and Senior Management
Executive Officers and Directors
The following table presents information about our current executive officers and directors, including their ages as of the date of this Annual Report:
Name Age Position Executive Officers
Sam Darwish 50 Chairman, Group Chief Executive Officer and Director Mohamad Darwish 42 Senior Vice President, IHS Nigeria Chief Executive Officer William Saad 50 Executive Vice President, Group Chief Operating Officer Mustafa Tharoo 48 Executive Vice President, Group General Counsel Adam Walker 54 Executive Vice President and Chief Financial Officer Steve Howden 39 Senior Vice President, Deputy Chief Financial Officer David Ordman 53 Senior Vice President, Deputy Chief Financial Officer Ayotade Oyinlola 47 Senior Vice President, Chief Human Resources Officer Bill Bates 57 Senior Vice President, Chief Strategy Officer Colby Synesael 43 Senior Vice President, Communications
Directors John Ellis Bush 69 Director Ursula Burns 63 Director Bashir El Rufai 68 Director Nicholas Land 74 Director Bryce Fort 43 Director Frank Dangeard 64 Director Maria Carolina Lacerda 49 Director Aniko Szigetvari 52 Director Phuthuma Nhleko 61 Director
Unless otherwise indicated, the current business addresses for our executive officers and directors is c/o IHS Holding Limited, 1 Cathedral Piazza, 123 Victoria Street, London SW1E 5BP, United Kingdom.
Executive Officers
The following is a brief summary of the business experience of our executive officers.
Sam Darwish is one of our co-founders, our Chairman and Group Chief Executive Officer. An engineer by education, Mr. Darwish has over 25 years’ experience in the telecommunications industry. Before founding the Company in 2001, he served as the Deputy Managing Director of CELIA Motophone Ltd, a Nigerian GSM operator, from 1999 to 2000. Following his departure from CELIA Motophone Ltd in 2001, an action was brought against Mr. Darwish in Lebanon, alleging misappropriation of assets. That matter was closed with no finding of guilt or liability on the part of Mr. Darwish. Prior to that, Mr. Darwish was Vice Chairman and Director of projects at Lintel, an international GSM developer, from 1998 to 1999. Mr. Darwish also served as Network Manager for Libancell SAL, a Lebanese GSM operator, which is currently known as Touch, from 1994 to 1998. In addition, Mr. Darwish currently serves as the Founder and Principal of Singularity Investments, a private investment firm with a focus on technology, media and telecommunications companies in the United States and the emerging markets. He is also the Founder and President of DAR Properties, a property investment company, and DAR Telecom, a telecommunications consulting company. Sam Darwish is the brother of Mohamad Darwish, our Senior Vice President and IHS Nigeria Chief Executive Officer.
Mohamad Darwish is one of our co-founders and has served as a Senior Vice President of IHS Towers and Chief Executive Officer of IHS Nigeria since November 2015. Prior to this, Mr. Darwish served as the IHS Nigeria Deputy CEO from October 2014 to November 2015. Mr. Darwish has around 20 years of experience in the telecommunications sector. Mohamad Darwish is the brother of Sam Darwish, our Chairman and Group Chief Executive Officer. In addition, Mr. Darwish
110
currently serves as the Founder and Principal of Singularity Investments, a private investment firm with a focus on technology, media and telecommunications companies in the United States and the emerging markets.
William Saad is one of our co-founders and has served as Executive Vice President and Group Chief Operating Officer of IHS Towers since July 2012 and has over 25 years’ experience in the telecommunications industry. Before co-founding the Company, Mr. Saad was the Operations Director at CELIA Motophone, a Nigerian GSM operator, from 1998 to 2001. Before joining CELIA, Mr. Saad served as project manager at Lintel SAL, an international GSM operator, from 1998 to 1999 and prior to that as OMC Network Administrator with Libancell SAL, the first Lebanese GSM operator, from 1995 to 1998. Mr. Saad also serves on the board of several private companies as well as the Lebanese-Nigerian Initiative, a non-profit organization.
Mustafa Tharoo has served as an Executive Vice President and the Group General Counsel since 2012. Before joining the Company, Mr. Tharoo was a Consultant at ADEPT Chambers in Tanzania from 2009 to 2011. Previously, Mr. Tharoo served as a consultant at Ringo & Associates in Tanzania from 2003 to 2009 and a Partner at Anjarwalla & Khanna in Kenya from 2000 to 2003. Mr. Tharoo has over 20 years of experience in corporate, compliance and regulatory matters as well as major transactions across Africa and the Middle East.
Adam Walker has served as Executive Vice President and Chief Financial Officer of IHS Towers since November 2017. Prior to joining the Company, Mr. Walker served as Group Finance Director of GKN plc from February 2014 to November 2017 and held the role of Chief Executive of GKN Land Systems from September 2015 to December 2016. Before then, Mr. Walker served as Group Finance Director of Informa plc from 2008 to 2013 and Group Finance Director of National Express Group plc from 2003 to 2008. Mr. Walker began his career at Deloitte and qualified as a Chartered Accountant in 1988. Mr. Walker also served as a non-executive director of Kier Group plc between January 2016 and December 2019. In June 2021, Mr. Walker announced his intention to retire from his position as Chief Financial Officer of IHS Towers in March 2022.
Steve Howden has served as a Senior Vice President and Deputy Chief Financial Officer of IHS Towers since June 2019. Since joining the Company in January 2013, Mr. Howden has also served as SVP and Group Head of M&A as well as a variety of other senior finance positions. Prior to joining IHS Towers, Mr. Howden was a member of the Ernst & Young M&A department from 2006 to 2013 and in the Corporate Restructuring team at Ernst & Young and Andersen prior to that. Mr. Howden has approximately 15 years of finance and corporate finance experience. Mr. Howden is a qualified Chartered Accountant. Upon Mr. Walker’s retirement, it has been announced that Mr. Howden will succeed Mr. Walker as Chief Financial Officer of IHS Towers.
David Ordman serves as Senior Vice President and Deputy Chief Financial Officer of IHS Towers and joined the Company in January 2012. Mr. Ordman trained at PricewaterhouseCoopers in the United Kingdom and qualified as a Chartered Accountant. Mr. Ordman has over 20 years’ experience working in the international telecommunications and infrastructure business.
Ayotade Oyinlola has served as a Senior Vice President and the Chief Human Resources Officer of IHS Towers since July 2015. Prior to joining IHS Towers, Mr. Oyinlola served as Millicom Services UK Head of HR for Africa and Europe from 2013 to 2015. He also served as Ericsson’s West Africa HR Director from 2011 to 2013 and Ericsson’s Sub-Sahara Africa Director for Learning and Development from 2009 to 2011. In addition, Mr. Oyinlola has previously held multiple senior positions at Shell Petroleum, Bristow Helicopters and Resourcery Limited. Mr. Oyinlola has over 20 years of Human Resources, IT and Telecommunications industry experience.
Bill Bates has served as a Senior Vice President and the Group Chief Strategy Officer since January 2022. Mr. Bates is responsible for the Group’s mergers and acquisitions and commercial strategy. Before joining the Company, Mr. Bates served as Senior Vice President at Brookfield Asset Management from 2017 to 2021, where he was responsible for investing in towers, fiber and data centers. Prior to Brookfield, Mr. Bates was a Vice President on the Business Development team at SBA Communications from 2001 to 2016, where he focused on driving growth in emerging markets. Colby Synesael has served as a Senior Vice President of Communications since March 2022. Mr. Synesael is responsible for IHS Towers’ corporate communications including Investor Relations, Communications, and ESG reporting. Before joining IHS Towers, Mr. Synesael spent twelve years as a managing director and senior research analyst specializing in the communications infrastructure (towers, data centers, fiber) and telecom services industries at the investment bank Cowen. Prior to joining Cowen in March 2010, he was a senior research analyst at Kaufman Brothers and before that spent nearly three years at Merriman Curhan Ford. Between 2001 to January 2006 he worked at Thomas Weisel Partners, focusing as a research associate from 2003 onwards covering communications infrastructure and telecom services.
111
Directors
The following is a brief summary of the business experience of our directors.
John Ellis (Jeb) Bush joined the Board of Directors of IHS Holding Limited as a Non-Executive Independent Director in August 2019. Mr. Bush has served as the President of Jeb Bush & Associates LLC since 2007 and as the Chairman of Dock Square Capital since 2016, as Chairman of Foundation for Excellence in Education since 2007 and as Chairman and Co-founder of Finback Investment Partners LLC since 2019. Mr. Bush was also a senior adviser for Barclays in 2014 and a board member of Tenet Healthcare Corp. from 2007 to 2014. Prior to that, Mr. Bush served as Governor of Florida from 1999 to 2007 and as the Florida Secretary of Commerce from 1986 to 1988. Mr. Bush received a bachelor’s degree magna cum laude in Latin American Studies from the University of Texas at Austin.
Ursula Burns joined the Board of Directors of IHS Holding Limited as a Non-Executive Independent Director in July 2020. Ms. Burns most recently held the position of Chair and CEO of VEON, Ltd, where she was appointed Chair from June 2017 and then made Chair and CEO from December 2018 to June 2020. Ms. Burns is also a founding partner of Integrum Holdings, a private equity firm. She currently serves as a member of the boards of directors of Endeavor Group Holdings Inc., Exxon Mobil Corporation, Uber Technologies Inc., Plum Acquisition Corp I and Teneo Holdings LLC, amongst others, and provides leadership counsel to several community, educational and non-profit organizations. Ms. Burns served as Chair of the President’s Export Council from 2015 to 2016 after holding the position of Vice Chair from 2010 to 2015. In February 2022, Ms. Burns joined the Biden Administration’s U.S. Department of Commerce’s Advisory Council on Supply Chain Competitiveness. Ms. Burns also has 35 years of experience with Xerox, joining the organization as a mechanical engineer before moving into management, where she served in a number of strategic roles across the company, including as CEO from 2009 to 2016 and as Chair from 2010 to 2017.
Mallam Bashir Ahmad El-Rufai joined the Board of Directors of IHS Holding Limited in June 2013 and has served as Chairman of the Board of Directors for IHS Nigeria since 2002. Prior to joining IHS Nigeria, Mr. El-Rufai served as Training and Development Officer and later Assistant Production Manager at Kano State Oil & Allied Product Limited from 1977 to 1979, before joining Nigerian Cereals Processing Company Ltd as Group Marketing Manager from 1981 to 1983. He served as Chief Commercial Officer for the Northern District of Nigerian External Telecommunications Limited from 1983 to 1985 and held several positions at Nigerian Telecommunications Ltd from 1985 to 1996. Mr. El-Rufai was also a co-founder and President of Intercellular Nigeria Limited from 1997 to 2009. Mr. El-Rufai currently serves as Chairman of IHS Nigeria and Intercellular Nigeria Plc and has served as Vice Chairman and Corporate Advisor of Intercellular (Nigeria) Limited in 2009. He also served as an Independent Director of FSDH Merchant Bank Limited. Mr. El-Rufai has also chaired several boards, including Channel Distribution (an ICT company), MFB fertilizer and Chemical Co. Ltd, Systemtech (an IT company), Alpha Aluminium and Northstar Chemicals, among others.
Nicholas Land joined the Board of Directors of IHS Holding Limited in August 2019 as a Non-Executive Independent Director and Chair of our Audit Committee. Mr. Land has also served as the Deputy Chair of Thames Water Utilities Ltd and Chair of their Audit and Risk Committee since 2017 and as Chair of The Instant Group Ltd since 2019. Mr. Land has also served on the board of Astro Lighting Holdings Ltd since 2017 and has been a member of the Board of Trustees of the Vodafone Group Foundation since 2008, serving as Chair from 2011. He has also served as an adviser to the Board of Dentons UK EMEA LLP since 2007 and has been Chair of the Private Equity Reporting Group of the British Venture Capital Association since 2012. Mr. Land has previously served as a Non-Executive Director of Vodafone Group plc, Royal Dutch Shell plc, Alliance Boots GmbH, Ashmore Group plc and BBA Aviation plc. Mr. Land was a Non-Executive Director of the Financial Reporting Council, chairing its Codes and Standards Committee, from 2011 to 2020. Mr. Land is qualified as a UK Chartered Accountant and had a 36-year career with Ernst & Young LLP, retiring as Executive Chairman of the firm in 2006.
Bryce Fort joined the Board of Directors of IHS Holding Limited in June 2013. Mr. Fort is a Managing Director and founding partner of Emerging Capital Partners, or ECP. With over $3.1 billion under management, ECP is a leading private equity manager focused exclusively on Africa. In his capacity as Managing Director, Mr. Fort is responsible for identifying, analyzing, and recommending investments, performing due diligence and leading transaction teams. Managing Director joined the ECP investment team in 2002 prior to ECP’s spinout from Emerging Markets Partnership. In addition to serving on the Board of Directors of IHS Holding Limited, he has served on the boards of Mukuru, Wananchi Group, Java House, Artcaffé and Maarifa Education, among others. Before his employment with ECP, Mr. Fort worked for Deutsche Bank AG’s European Healthcare Corporate Finance Group. Mr. Fort received a bachelor’s degree cum laude in computer engineering with a minor in economics from Lehigh University.
112
Frank Dangeard joined the Board of Directors of IHS Holding Limited in September 2020. Mr. Dangeard was Chairman & CEO of Thomson from September 2004 to February 2008. Prior to that he was Deputy CEO of France Telecom from September 2002 to September 2004, Deputy CEO and Deputy Chairman of Thomson Multimedia from June 1997 to September 2002, and Managing Director of the investment bank SG Warburg & Co. Ltd from October 1988 to June 1997. He currently serves as Chairman of the boards of NatWest Markets, NortonLifelock and (since November 2021) of Spear Investments BV, and as a director of the NatWest Group, as a board observer of Arqiva and has previously served on the boards of RPX, Orange, Equant, Wanadoo, Eutelsat, SonaeCom, and on the board of Telenor as Deputy Chairman. He has been a member of the Advisory Boards of the Harvard Business School and of Ecole des Hautes Etudes Commerciales, and was a founding board member of Bruegel, the European think-tank.
Maria Carolina Lacerda joined the Board of Directors of IHS Holding Limited in October 2021 as a Non-Executive Independent Director. She currently serves as a board member of Hypera Pharma since October 2016, Vibra Energia (formerly BR Distribuidora) since September 2019 and Rumo Logistica since May 2021. Ms. Lacerda has worked for more than 20 years at financial institutions such as UBS, Merrill Lynch, Deutsche Bank, Unibanco, Bear Stearns and ING Barings in capital markets, credit and mergers and acquisitions. She has previously served as a director of Anbima — Associação Brasileira das Entidades dos Mercados Financeiros e de Capitais from May 2012 to May 2016, representative of CNF — Confederação Nacional das Instituições Financeiras from May 2014 to May 2016 and member of the Advisory Board of the BM&FBovespa Listing Chamber from January 2015 to May 2016. Ms. Lacerda is also a mentor of the IBGC Diversity Program for Corporate Directors and a member of the Investment Committee of SempreFEA, the endowment fund for the Economics and Business School of the University of São Paulo.
Aniko Szigetvari served on the Board of Directors of IHS Holding Limited from July 2014 to February 2021 and rejoined the Board of Directors in October 2021. She is the founding partner of Atlantica Ventures, an African impact focused venture capital fund investing in early-stage startups building technology and technology-enabled businesses. She serves as board committee chair and advisory board member of various investee companies. Prior to this, Ms. Szigetvari also had 20 years’ experience with the International Finance Corporation, or IFC, beginning in 1998, where she focused on emerging markets principal investing and financing, primarily in the telecommunication, media, and technology, or TMT, sectors. For eight years she managed IFC’s TMT business, first as the Head of the Africa and Latin America TMT businesses, then including four years as Global Head of the TMT group from 2015 to 2019, leading investment and portfolio activities across all emerging markets. Prior to joining IFC, Ms. Szigetvari held roles at DHL, Kraft Foods and McKinsey & Company. Ms. Szigetvari holds various graduate degrees, including a Master of Business Administration degree from the Wharton School of the University of Pennsylvania.
Phuthuma Nhleko joined the Board of Directors of IHS Holding Limited in October 2021 as a Non-Executive Independent Director. Mr. Nhleko previously served as Chief Executive of MTN Group from 2002 to 2011 and continued to serve as Non-Executive Director and Chair of the MTN Group board from 2013 to 2019. He also currently as Chairman of the Pembani Group (PTY) Ltd, a position he has held since 2011. He currently serves as Chairman of Tullow Oil Plc and on the board of the Johannesburg Stock Exchange, or the JSE, and is expected to serve as the Chairman of the JSE from May 2022. He also serves as the director of Engen Holding Limited and Phembani Remgro Infrastructure Fund Managers. Previously, he served on the boards of BP plc from 2011 to 2016 and Anglo American from 2011 to 2015. In addition, during his tenure as MTN Group CEO, he was a non-executive director at the GSM Association, the global trade association for mobile phone operators. Prior to joining MTN Group, he served as a director of Nedbank Group Limited and Old Mutual Life (SA).
Appointment Rights
Pursuant to our shareholders’ agreement with certain of our shareholders, certain of our shareholders have rights to appoint members of our board of directors. Frank Dangeard was appointed by Oranje-Nassau Développement S.C.A. FIAR and Africa Telecom Towers S.C.S. (“Wendel”), and Bryce Fort was appointed by ECP.
B. Compensation
We set out below the amount of compensation paid and benefits in kind provided by us or our subsidiaries to our executive officers and members of our board for services in all capacities to us or our subsidiaries for the year ended December 31, 2021, as well as the amount contributed by us or our subsidiaries to retirement benefit plans for our executive officers and members of our board.
113
Executive Officer and Director Compensation
The compensation for each of our executive officers is comprised of the following elements: base salary, bonus, and contractual benefits such as pension, allowances and, where legally obligated, end of service contributions. Total amount of compensation paid and benefits in kind provided to our executive officers and members of our board for the year ended December 31, 2021 was $25,642,320. We do not currently maintain any deferred compensation, bonus or profit-sharing plan for the benefit of our executive officers; however, our executive officers are eligible to receive annual bonuses pursuant to the terms of their service agreements, and our executive officers received rights under the LTIP (as defined below) over a total of 24,000 ordinary shares and under the 2021 Omnibus Incentive Plan (as defined below) over a total of 75,000 ordinary shares during the year ended December 31, 2021. Additionally, during the year ended December 31, 2021 certain non-employee directors received restricted stock unit grants over a total of 259,784 ordinary shares of which 92,780 ordinary shares were issued and rights over 167,004 ordinary shares remained subject to vesting. In the year ended December 31, 2021, we did not set aside or accrue any amounts to provide pension, retirement or similar benefits to our executive officers and members of our board.
Share Incentive Plans
Long Term Incentive Plan
Prior to the consummation of our IPO and adoption of the 2021 Omnibus Incentive Plan, we established (and currently maintain, until full vesting) a Long Term Incentive Plan, or LTIP, pursuant to which we have granted options to purchase ordinary shares of IHS Holding Limited, to our executive officers, directors and other employees. The LTIP is administered by our board of directors or a committee of our board of directors. The plan administrator selected the individuals who would receive awards under the plan, as well as the amount of the award to be granted to each individual, in each case consistent with the terms of the LTIP. As of December 31, 2021, conditional rights had vested over 15,875,902 ordinary shares. As of December 31, 2021, there were subsisting conditional rights under the LTIP over a total of 7,940,489 ordinary shares, including awards originally granted in the form of options. The remaining rights will vest in two tranches of up to 3,970,193 ordinary shares after the end of the financial year of the Company ending on December 31, 2021 and up to 3,970,296 ordinary shares after the end of the financial year of the Company ending on December 31, 2022, subject, in each case, to attainment of additional performance conditions based on the financial performance of the Group in such financial year.
2021 Omnibus Incentive Plan
We adopted the IHS Holding Limited 2021 Omnibus Incentive Plan, or the 2021 Omnibus Incentive Plan, on September 30, 2021, and it became effective upon the approval of our shareholders on October 4, 2021, or the Effective Date. If not previously terminated by the Board, the 2021 Omnibus Incentive Plan will terminate on the close of business on the ten-year anniversary of the Effective Date. Under the 2021 Omnibus Incentive Plan, subject to adjustments for certain changes in our capital structure (described below under “Adjustments”), a maximum of 22,120,000 of our ordinary shares may be issued to our eligible employees, consultants, and non-employee directors and of our affiliates. Only our employees or employees of our affiliates are eligible to receive incentive stock options. All shares reserved for issuance under the 2021 Omnibus Incentive Plan may be used for incentive stock options. As of February 2022, there are subsisting conditional rights under the 2021 Omnibus Incentive Plan over a total of 1,147,500 ordinary shares. Rights over up to 898,772 ordinary shares will vest after the end of the financial year of the Company ending on December 31, 2022, subject to the fulfillment of certain conditions (and in the case of certain awards, the attainment of additional performance conditions based on the financial performance of the Group over certain relevant periods).
Types of Awards. The 2021 Omnibus Incentive Plan provides for grants of incentive stock options, non-statutory options, stock appreciation rights, restricted stock, restricted stock units, other stock-based awards, and other-cash awards, each an Award, and, collectively, Awards. Each Award will be evidenced by an award agreement which will govern that Award’s terms and conditions.
Plan Administration. The 2021 Omnibus Incentive Plan is generally administered by our Board unless and until the Board delegates administration to a committee of the Board (the “Committee”). The Committee will make all determinations in respect of the 2021 Omnibus Incentive Plan, and will have no liability for any action taken in good faith. The 2021 Omnibus Incentive Plan is administered by our Board with respect to Awards to non-employee directors.
Adjustments. In the event of a change in the number or class of the outstanding ordinary shares due to split-ups, combinations, mergers, consolidations or recapitalizations, or by reason of stock dividends, the number or class of shares
114
which thereafter may be issued pursuant to Awards granted under the 2021 Omnibus Incentive Plan, both in the aggregate and as to any grantee, and the number and class of shares then subject to outstanding Awards and the exercise price per share of outstanding options or stock appreciation rights, will be adjusted to reflect such change, all as determined by the Committee. In the event of any other change in the number or kind of outstanding shares, or of any stock or other securities or property into which such shares will have been changed, or for which it will have been exchanged, if the Committee determines that such change equitably requires an adjustment in any Award that has been or may be granted under the 2021 Omnibus Incentive Plan, such adjustment will be made in accordance with such determination subject to certain limitations set out in the 2021 Omnibus Incentive Plan. In addition, in the event that (i) we merge or are consolidated with another entity and in connection therewith consideration other than equity is provided to our shareholders or outstanding Awards are not to be assumed by the resulting entity, (ii) all or substantially all of our assets are acquired by another person, (iii) we are reorganized or liquidated or (iv) we enter into a written agreement to undergo a transaction specified in (i), (ii) or (iii) above, the Committee may, in its discretion and upon advance notice to the affected persons, cancel any outstanding Awards and cause the holders thereof to be paid in cash, stock or other property (or any combination thereof) the value of the Awards based on the price per share received or to be received by other shareholders of our company in such event.
Change in Control. In the event of a change in control, notwithstanding any provision in the 2021 Omnibus Incentive Plan to the contrary, the Committee may, in its sole discretion, take any action with respect to all or any portion of a particular outstanding Award, including, but not limited to, the following, in each case, except as otherwise provide in a written agreement between the grantee and the Company: (i) if Awards are not converted, assumed, or replaced by a successor, the Awards will become fully exercisable and vested, with any performance conditions to become satisfied based on the achievement of an assumed level of performance (which may be actual, target or maximum performance), as determined by the Committee; (ii) if the Award is assumed or replaced by a successor with a comparable award, then the new award must (a) provide the grantee with substantially equivalent terms and conditions; and (b) become fully vested and exercisable immediately upon an involuntary termination of the grantee’s employment or service, as applicable, by the Company without cause within eighteen (18) months following the Change in Control, with any performance conditions to be converted based on the achievement of an assumed level of performance (which may be actual, target or maximum performance), as determined by the Committee; (iii) settle Awards previously deferred; (iv) adjust, substitute, convert, settle and/or terminate outstanding Awards as the Committee, in its sole discretion, deems appropriate and consistent with the plan’s purposes; and (v) in the case of any Award with an exercise price that equals or exceeds the price paid for a share of ordinary shares in connection with the change in control, the Committee may cancel the Award without the payment of consideration therefor. To the extent practicable, any actions taken by the Committee may occur in a manner and at a time which allows affected grantees the ability to participate in the change in control transactions with respect to the ordinary shares subject to their Awards. In addition, in the event of a change in control, the Committee may, in its sole discretion and upon at least ten (10) days’ advance notice to the affected persons, cancel any outstanding Awards and pay to the holders thereof, in cash or stock, or any combination thereof, the value of the Awards based upon the price per share of ordinary shares received or to be received by other shareholders of the Company in such change in control.
Amendment. In general, the Board can modify, alter, amend or terminate the 2021 Omnibus Incentive Plan (at any time and with or without retroactive effect) in whole or in part in its discretion without approval of the shareholders or any other person, except that no amendment will become effective unless approved by our shareholders to the extent shareholder approval is necessary to satisfy any applicable law or securities exchange listing requirements. However, no amendment to or termination of the 2021 Omnibus Incentive Plan may materially and adversely affect any rights of any grantee without his or her written consent. The Board may, at any time, amend the terms of an outstanding Award, except that no amendment may impair the rights under any Award without the written consent of the affected grantee.
Indemnification
Executive officers and directors have the benefit of indemnification provisions in our Articles. These provisions provide that our board of directors and officers shall be indemnified from and against all liability which they incur in execution of their duty in their respective offices, except liability incurred by reason of such director’s or officer’s dishonesty, willful default or fraud.
Insofar as indemnification of liabilities arising under the Securities Act may be permitted to executive officers and directors or persons controlling us pursuant to the foregoing provisions, we have been informed that, in the opinion of the SEC, such indemnification is against public policy as expressed in the Securities Act and is therefore unenforceable.
115
C. Board Practices
Board Composition
Our Articles provide that directors are divided into three classes designated as Class I, Class II and Class III, respectively, and directors will generally be elected to serve staggered three year terms. The term of the Class I Directors shall expire at the third annual general meeting of the Company in 2024. The term of office of the Class II Directors shall expire at the fourth annual general meeting of the Company in 2025. The term of office of the Class III Directors shall expire at the fifth annual general meeting of the Company in 2026. A Director whose term has expired may be reappointed in accordance with the terms of the Articles. At any annual general meeting where a resolution for the election of directors is proposed a plurality of the votes cast shall be sufficient to elect a director. In addition, our directors may appoint any person to be a director and assign such director to a class either as a result of a casual vacancy or as an additional director.
Our Articles provide that a director may be removed by special resolution of the shareholders or for “cause” (as defined therein) by notice from not less than 75% of the directors then in office. Each of our directors holds office until he or she resigns or is removed from office as discussed above. See Item 6.A. “Directors and Senior Management” for information regarding the periods during which our directors have served on the board of directors.
Foreign Private Issuer Status
We are a “foreign private issuer” (as such term is defined in Rule 3b-4 under the Exchange Act), and our shares are listed on the NYSE. We believe the following to be the significant differences between our corporate governance practices and those applicable to U.S. companies under the NYSE listing standards.
Under the NYSE rules, NYSE listed companies that are foreign private issuers are permitted to follow home country practice in lieu of the corporate governance provisions specified by the NYSE with limited exceptions. The NYSE rules require that the quorum for any meeting of the holders of shares should be sufficiently high to ensure a representative vote and give careful consideration to provisions fixing any proportion less than a majority of the outstanding shares as the quorum for shareholders’ meetings. We follow the corporate governance practice of our home country, the Cayman Islands, which permits less than a majority of the outstanding shares as the quorum for shareholders’ meetings. The NYSE rules also require shareholder approval for equity compensation plans and material revisions to those plans. We follow the corporate governance practice of our home country, the Cayman Islands, which does not require shareholder approval for these matters.
We may in the future decide to use other foreign private issuer exemptions with respect to some or all of the other NYSE listing requirements. For example, under the NYSE rules, U.S. domestic listed, non-controlled companies are required to have a majority independent board, which is not required under the Companies Act of the Cayman Islands, our home country. NYSE rules also require U.S. domestic listed, non-controlled companies to have a compensation committee and a nominating and corporate governance committee, each composed entirely of independent directors, which are not required under our home country laws.
Following our home country governance practices may provide less protection than is given to investors under the NYSE listing requirements applicable to domestic issuers. For more information, see Item 3.D. “Risk Factors — Risks Relating to Ownership of our Ordinary Shares — As we are a “foreign private issuer” and follow certain home country corporate governance practices, our shareholders may not have the same protections afforded to shareholders of companies that are subject to all NYSE corporate governance requirements.”
Audit Committee
Listing requirements
Under the NYSE corporate governance rules, we are required to maintain an audit committee consisting of at least three independent directors, each of whom is financially literate and one of whom has accounting or related financial management expertise.
116
Audit committee role
The audit committee, which consists of Nicholas Land, Ursula Burns and Aniko Szigetvari, assists the board in overseeing our accounting and financial reporting processes and the audits of our financial statements. Nicholas Land serves as Chair of the committee. The audit committee consists exclusively of members of our board who are financially literate, and Nicholas Land is considered an “audit committee financial expert” as defined by the SEC. Our board has determined that Nicholas Land, Ursula Burns and Aniko Szigetvari each satisfy the “independence” requirements set forth in Rule 10A 3 under the Exchange Act, and that the simultaneous service by Ursula Burns on the audit committees of three other public companies would not impair her ability to serve on the audit committee. The audit committee is governed by a charter that complies with NYSE rules.
The audit committee is responsible for, among other things:
• the appointment, compensation, retention and oversight of any accounting firm engaged for the purpose of preparing or issuing an audit report or performing other audit services;
• pre-approving the audit services and non-audit services to be provided by our independent auditor before the auditor is engaged to render such services;
• evaluating the independent auditor’s qualifications, performance and independence, and presenting its conclusions to the full board on at least an annual basis;
• reviewing and discussing with the board and the independent auditor our annual audited financial statements and any quarterly financial statements prior to the filing of the respective SEC reports;
• reviewing our compliance with laws and regulations; and
• approving or ratifying any related party transaction (as defined in our related party transaction policy) in accordance with our related party transaction policy.
The audit committee meets at least four times per year. The audit committee meets at least once per year with our independent accountant, without our executive officers being present.
Remuneration Committee
The remuneration committee, which consists of Aniko Szigetvari, John Ellis Bush and Bryce Fort, assists the board in determining CEO remuneration. Aniko Szigetvari serves as Chair of the committee.
The remuneration committee is responsible for, among other things:
• identifying, reviewing and approving corporate goals and objectives relevant to the compensation of our Chief Executive Officer, evaluating the Chief Executive Officer’s performance in light of these objectives and goals and, based upon that evaluation, setting the Chief Executive Officer’s compensation;
• reviewing and setting or making recommendations to the Board regarding compensation for our other executive officers;
• reviewing and setting or making recommendations to the Board regarding director compensation; and
• overseeing and administering our incentive compensation and equity incentive plans.
Nominations and Corporate Governance Committee
The nominations and corporate governance committee, which consists of John Ellis Bush, Ursula Burns and Nicholas Land, assists our board in identifying individuals qualified to become members of our board consistent with criteria established by our board and in developing our corporate governance principles. John Ellis Bush serves as Chair of the committee.
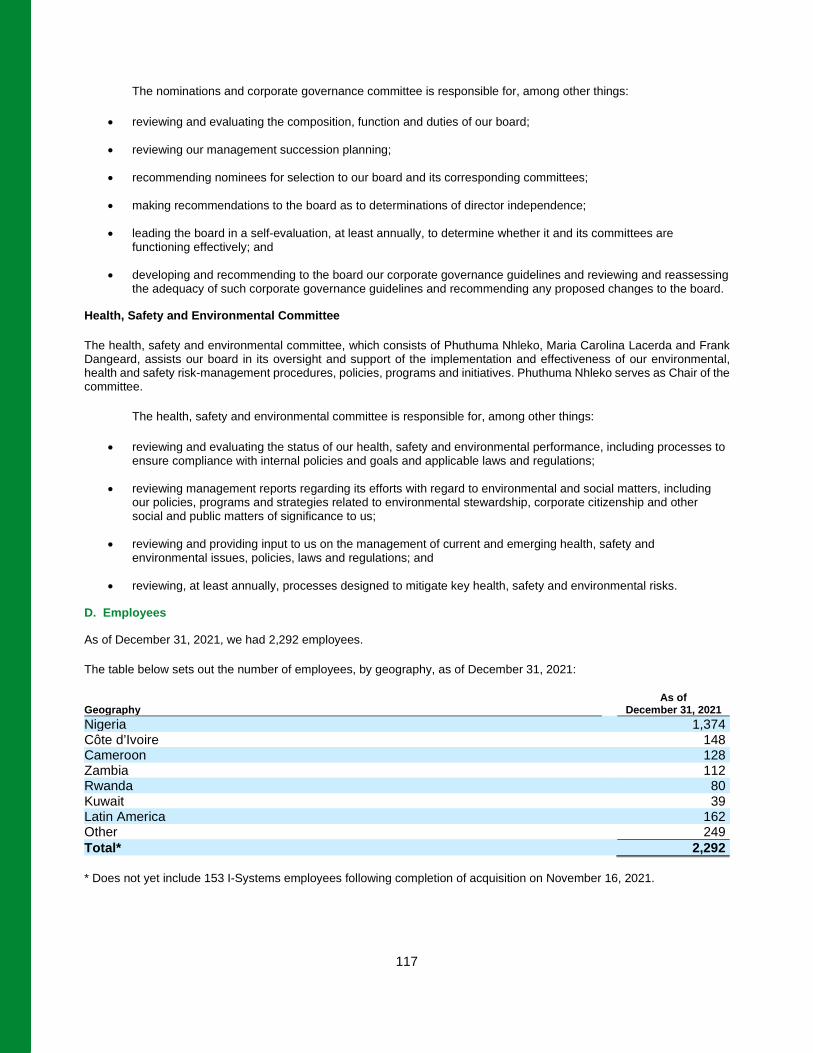
117
The nominations and corporate governance committee is responsible for, among other things:
• reviewing and evaluating the composition, function and duties of our board;
• reviewing our management succession planning;
• recommending nominees for selection to our board and its corresponding committees;
• making recommendations to the board as to determinations of director independence;
• leading the board in a self-evaluation, at least annually, to determine whether it and its committees are functioning effectively; and
• developing and recommending to the board our corporate governance guidelines and reviewing and reassessing the adequacy of such corporate governance guidelines and recommending any proposed changes to the board.
Health, Safety and Environmental Committee
The health, safety and environmental committee, which consists of Phuthuma Nhleko, Maria Carolina Lacerda and Frank Dangeard, assists our board in its oversight and support of the implementation and effectiveness of our environmental, health and safety risk-management procedures, policies, programs and initiatives. Phuthuma Nhleko serves as Chair of the committee.
The health, safety and environmental committee is responsible for, among other things:
• reviewing and evaluating the status of our health, safety and environmental performance, including processes to ensure compliance with internal policies and goals and applicable laws and regulations;
• reviewing management reports regarding its efforts with regard to environmental and social matters, including our policies, programs and strategies related to environmental stewardship, corporate citizenship and other social and public matters of significance to us;
• reviewing and providing input to us on the management of current and emerging health, safety and environmental issues, policies, laws and regulations; and
• reviewing, at least annually, processes designed to mitigate key health, safety and environmental risks.
D. Employees
As of December 31, 2021, we had 2,292 employees.
The table below sets out the number of employees, by geography, as of December 31, 2021:
As of Geography December 31, 2021 Nigeria 1,374 Côte d’Ivoire 148 Cameroon 128 Zambia 112 Rwanda 80 Kuwait 39 Latin America 162 Other 249 Total* 2,292 * Does not yet include 153 I-Systems employees following completion of acquisition on November 16, 2021.
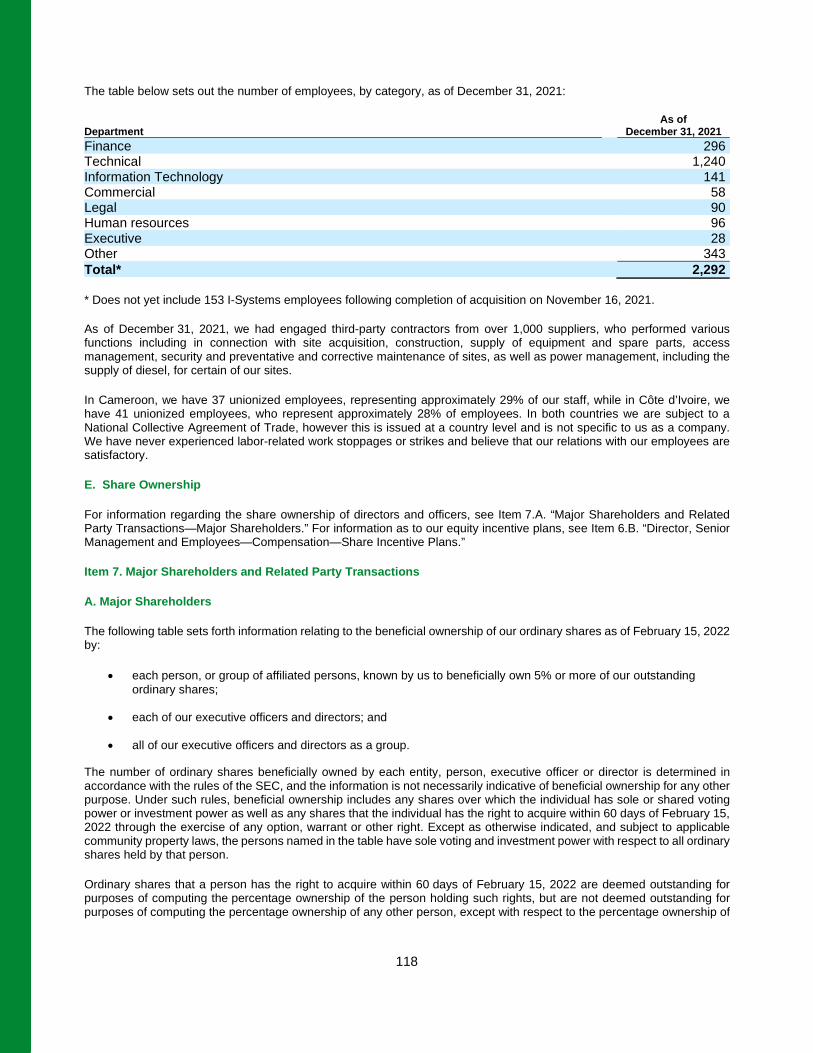
118
The table below sets out the number of employees, by category, as of December 31, 2021:
As of Department December 31, 2021 Finance 296 Technical 1,240 Information Technology 141 Commercial 58 Legal 90 Human resources 96 Executive 28 Other 343 Total* 2,292 * Does not yet include 153 I-Systems employees following completion of acquisition on November 16, 2021. As of December 31, 2021, we had engaged third-party contractors from over 1,000 suppliers, who performed various functions including in connection with site acquisition, construction, supply of equipment and spare parts, access management, security and preventative and corrective maintenance of sites, as well as power management, including the supply of diesel, for certain of our sites.
In Cameroon, we have 37 unionized employees, representing approximately 29% of our staff, while in Côte d’Ivoire, we have 41 unionized employees, who represent approximately 28% of employees. In both countries we are subject to a National Collective Agreement of Trade, however this is issued at a country level and is not specific to us as a company. We have never experienced labor-related work stoppages or strikes and believe that our relations with our employees are satisfactory.
E. Share Ownership
For information regarding the share ownership of directors and officers, see Item 7.A. “Major Shareholders and Related Party Transactions—Major Shareholders.” For information as to our equity incentive plans, see Item 6.B. “Director, Senior Management and Employees—Compensation—Share Incentive Plans.”
Item 7. Major Shareholders and Related Party Transactions
A. Major Shareholders
The following table sets forth information relating to the beneficial ownership of our ordinary shares as of February 15, 2022 by:
• each person, or group of affiliated persons, known by us to beneficially own 5% or more of our outstanding ordinary shares;
• each of our executive officers and directors; and
• all of our executive officers and directors as a group.
The number of ordinary shares beneficially owned by each entity, person, executive officer or director is determined in accordance with the rules of the SEC, and the information is not necessarily indicative of beneficial ownership for any other purpose. Under such rules, beneficial ownership includes any shares over which the individual has sole or shared voting power or investment power as well as any shares that the individual has the right to acquire within 60 days of February 15, 2022 through the exercise of any option, warrant or other right. Except as otherwise indicated, and subject to applicable community property laws, the persons named in the table have sole voting and investment power with respect to all ordinary shares held by that person.
Ordinary shares that a person has the right to acquire within 60 days of February 15, 2022 are deemed outstanding for purposes of computing the percentage ownership of the person holding such rights, but are not deemed outstanding for purposes of computing the percentage ownership of any other person, except with respect to the percentage ownership of
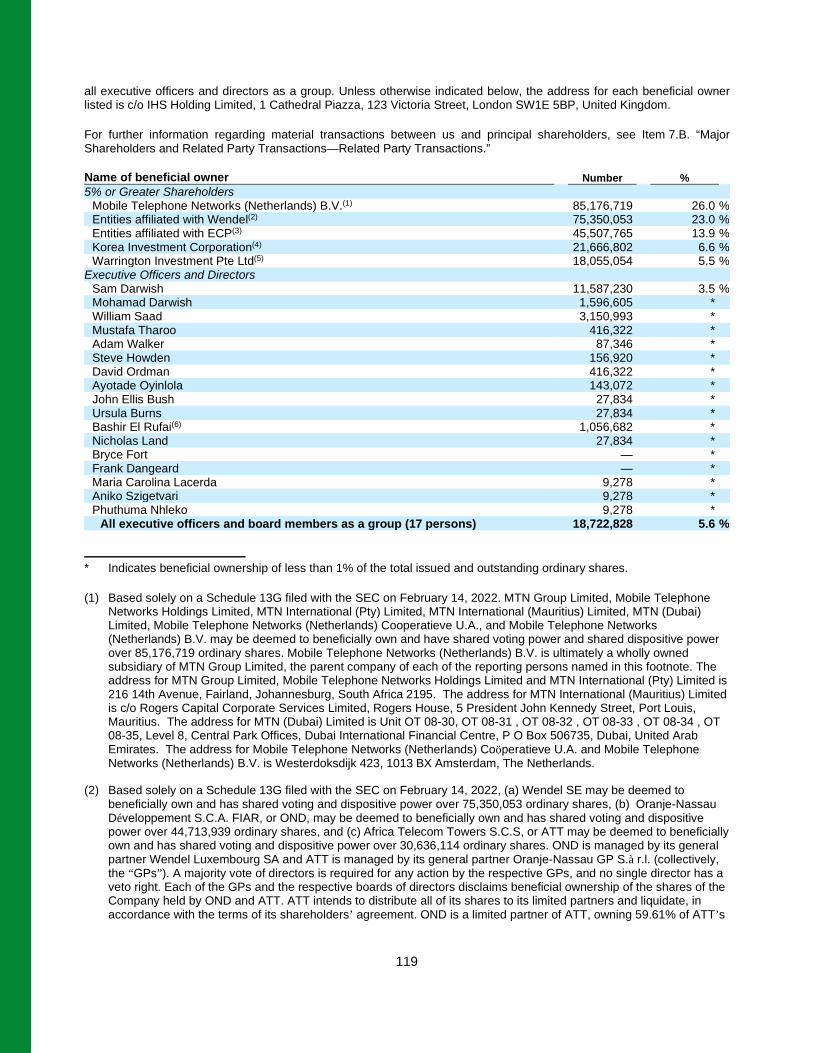
119
all executive officers and directors as a group. Unless otherwise indicated below, the address for each beneficial owner listed is c/o IHS Holding Limited, 1 Cathedral Piazza, 123 Victoria Street, London SW1E 5BP, United Kingdom.
For further information regarding material transactions between us and principal shareholders, see Item 7.B. “Major Shareholders and Related Party Transactions—Related Party Transactions.”
Name of beneficial owner Number % 5% or Greater Shareholders
Mobile Telephone Networks (Netherlands) B.V.(1) 85,176,719 26.0 % Entities affiliated with Wendel(2) 75,350,053 23.0 % Entities affiliated with ECP(3) 45,507,765 13.9 % Korea Investment Corporation(4) 21,666,802 6.6 % Warrington Investment Pte Ltd(5) 18,055,054 5.5 %
Executive Officers and Directors Sam Darwish 11,587,230 3.5 % Mohamad Darwish 1,596,605 * William Saad 3,150,993 * Mustafa Tharoo 416,322 * Adam Walker 87,346 * Steve Howden 156,920 * David Ordman 416,322 * Ayotade Oyinlola 143,072 * John Ellis Bush 27,834 * Ursula Burns 27,834 * Bashir El Rufai(6) 1,056,682 * Nicholas Land 27,834 * Bryce Fort — * Frank Dangeard — * Maria Carolina Lacerda 9,278 * Aniko Szigetvari 9,278 * Phuthuma Nhleko 9,278 *
All executive officers and board members as a group (17 persons) 18,722,828 5.6 %
* Indicates beneficial ownership of less than 1% of the total issued and outstanding ordinary shares.
(1) Based solely on a Schedule 13G filed with the SEC on February 14, 2022. MTN Group Limited, Mobile Telephone Networks Holdings Limited, MTN International (Pty) Limited, MTN International (Mauritius) Limited, MTN (Dubai) Limited, Mobile Telephone Networks (Netherlands) Cooperatieve U.A., and Mobile Telephone Networks (Netherlands) B.V. may be deemed to beneficially own and have shared voting power and shared dispositive power over 85,176,719 ordinary shares. Mobile Telephone Networks (Netherlands) B.V. is ultimately a wholly owned subsidiary of MTN Group Limited, the parent company of each of the reporting persons named in this footnote. The address for MTN Group Limited, Mobile Telephone Networks Holdings Limited and MTN International (Pty) Limited is 216 14th Avenue, Fairland, Johannesburg, South Africa 2195. The address for MTN International (Mauritius) Limited is c/o Rogers Capital Corporate Services Limited, Rogers House, 5 President John Kennedy Street, Port Louis, Mauritius. The address for MTN (Dubai) Limited is Unit OT 08-30, OT 08-31 , OT 08-32 , OT 08-33 , OT 08-34 , OT 08-35, Level 8, Central Park Offices, Dubai International Financial Centre, P O Box 506735, Dubai, United Arab Emirates. The address for Mobile Telephone Networks (Netherlands) Coöperatieve U.A. and Mobile Telephone Networks (Netherlands) B.V. is Westerdoksdijk 423, 1013 BX Amsterdam, The Netherlands.
(2) Based solely on a Schedule 13G filed with the SEC on February 14, 2022, (a) Wendel SE may be deemed to beneficially own and has shared voting and dispositive power over 75,350,053 ordinary shares, (b) Oranje-Nassau Développement S.C.A. FIAR, or OND, may be deemed to beneficially own and has shared voting and dispositive power over 44,713,939 ordinary shares, and (c) Africa Telecom Towers S.C.S, or ATT may be deemed to beneficially own and has shared voting and dispositive power over 30,636,114 ordinary shares. OND is managed by its general partner Wendel Luxembourg SA and ATT is managed by its general partner Oranje-Nassau GP S.à r.l. (collectively, the “GPs”). A majority vote of directors is required for any action by the respective GPs, and no single director has a veto right. Each of the GPs and the respective boards of directors disclaims beneficial ownership of the shares of the Company held by OND and ATT. ATT intends to distribute all of its shares to its limited partners and liquidate, in accordance with the terms of its shareholders’ agreement. OND is a limited partner of ATT, owning 59.61% of ATT’s
120
shares, and is expected to receive a pro rata proportion of the shares from ATT. Because of the relationship between OND and ATT, OND may be deemed to beneficially own the ordinary shares beneficially owned by ATT. OND disclaims beneficial ownership of the ordinary shares beneficially owned by ATT or any future distributees, except to the extent of OND’s pecuniary interest therein, if any. The address for each of OND and ATT is 5, rue Pierre d’Aspelt L1142 Luxembourg. The address for Wendel SE is 89, rue Taitbout, Paris, France, 75009.
(3) Based solely on a Schedule 13G filed with the SEC on February 15, 2022, (a) Towers Three Limited may be deemed to beneficially own and has shared voting and dispositive power over 25,414,720 ordinary shares and (b) ECP Manager LP may be deemed to beneficially own and has shared voting power over 45,467,558 ordinary shares and sole voting power and sole dispositive power over 40,207 ordinary shares. ECP Manager LP is the investment adviser of Towers Three Limited. The address for Towers Three Limited is Sanne House, Bank Street, TwentyEight Cybercity, Ebene 72201, Mauritius. The address for ECP Manager LP is 1909 K Street, NW, Suite 340 Washington, DC 20006.
(4) Based solely on a Schedule 13G filed with the SEC on February 15, 2022, Korea Investment Corporation may be deemed to beneficially own and has sole voting power and dispositive power over 21,666,802 ordinary shares. Korea Investment Corporation is a statutory juridical corporation established under the Korea Investment Corporation Act of the Republic of Korea. The address for Korea Investment Corporation is 17F-18F State Tower Namsan, 100 Toegye-ro, Jung-gu, Seoul, 04631, South Korea.
(5) Based solely on a Schedule 13G filed with the SEC on February 15, 2022, each of GIC Private Limited (“GIC PL”), GIC Special Investments Private Limited (“GIC SI”) and Warrington Investment Pte Ltd. (“Warrington”) may be deemed to beneficially own and have shared voting and dispositive power over 18,055,054 ordinary shares. GIC SI is wholly owned by GIC PL and is the private equity investment arm of GIC PL. GIC PL is wholly owned by the Government of Singapore (“GoS”) and was set up with the sole purpose of managing Singapore’s foreign reserves. The GoS disclaims beneficial ownership of such shares. The address for each of GIC PL, GIC SI and Warrington is 168 Robinson Road, #3701 Capital Tower, Singapore 068912.
(6) Includes 1,047,404 ordinary shares owned by African Tower Investment Limited over which Mr. El Rufai has beneficial ownership. The address for Mr. El Rufai is c/o IHS GCC Limited, Unit 802, Level 8, The Exchange, Dubai International Financial Centre, P.O. Box 506528, Dubai, United Arab Emirates.
As a number of our shares are held in book-entry form, we are not aware of the identity of all our shareholders. To our knowledge, as of February 28, 2022, we had 52,949,595 ordinary shares held by five US resident shareholders of record.
To our knowledge, other than as provided in the table above, our other filings with the SEC and this Annual Report, there has been no significant change in the percentage ownership held by any major shareholder since January 1, 2019. The major shareholders listed above do not have voting rights with respect to their ordinary shares that are different from the voting rights of other holders of our ordinary shares.
We are not aware of any arrangement whereby we are directly or indirectly owned or controlled by another corporation, by any foreign government or by any other natural or legal person severally or jointly, not are we aware of any arrangement that may, at a subsequent date, result in a change of control of our company.
B. Related Party Transactions
The following is a description of related party transactions we have entered into since January 1, 2019.
Shareholders’ Agreement
In connection with our IPO, we and certain of our shareholders entered into a shareholders’ agreement, or the Shareholders’ Agreement. The Shareholders’ Agreement provides certain rights to our shareholders party to it, including rights to designate directors, add matters to the agenda for shareholder meetings and approval rights with respect to certain proposed actions of the Company, and sets out certain restrictions on our shareholders’ ability to sell or otherwise transfer their respective shares, as described below.
121
Shareholder Lock-Up
Our shareholders party to the Shareholders’ Agreement and any Locked-up Transferees, which we collectively refer to as the Locked-up Shareholders, will be prohibited from selling any shares owned directly or indirectly by them immediately prior to our IPO, or the Subject Shares, for a period of up to 30 months after the date of the Prospectus, or the Lock-up Period, other than as described below and subject to a number of exceptions set out in the Shareholders’ Agreement.
The Subject Shares will become sellable in the following tranches:
(a) during the period from the date that is the day following six months following the date of the Prospectus and ending on the date that is twelve (12) months following the date of the Prospectus, the Additional MTN Non-Voting Shares will be Unblocked and may be sold by MTN in a registered offering, and each Locked-up Shareholder’s pro rata share (as calculated in accordance with the Shareholders’ Agreement) of the Block A Shares will be Unblocked and may be sold by such Locked-up Shareholder in a registered offering;
(b) during the period commencing on the date that is the day following twelve (12) months following the date of the Prospectus and ending on the date that is eighteen (18) months following the date of the Prospectus, an additional 20% of the Post Greenshoe Shares, or the Block B Shares, will be Unblocked, and each Locked-up Shareholder may sell its pro rata share (as calculated in accordance with the Shareholders’ Agreement) of the Block B Shares in a registered offering. 18 months after the date of the Prospectus, the Block A Shares and the Block B Shares may be sold without restriction under the Shareholders’ Agreement subject to compliance with securities law;
(c) during the period commencing on the date that is the day following eighteen (18) months following the date of the Prospectus and ending on the date that is twenty four (24) months following the date of the Prospectus, an additional 20% of the Post Greenshoe Shares, or the Block C Shares, will be Unblocked, and each Locked-up Shareholder may sell its pro rata share (as calculated in accordance with the Shareholders’ Agreement) of the Block C Shares in a registered offering. 24 months after the date of the Prospectus, the Block C Shares (as well as the Block A Shares and the Block B Shares) may be sold without restriction under the Shareholders’ Agreement subject to compliance with securities law;
(d) during the period commencing on the date that is the day following twenty four (24) months following the date of the Prospectus and ending on the date that is thirty (30) months following the date of the Prospectus, an additional 20% of the Post Greenshoe Shares, or the Block D Shares, will be Unblocked, and each Locked-up Shareholder may sell its pro rata share (as calculated in accordance with the Shareholders’ Agreement) of the Block D Shares (as well as the Block A Shares, the Block B Shares and the Block C Shares) without restriction under the Shareholders’ Agreement subject to compliance with securities law; and
(e) any time after the expiry of the Lock-up Period, any remaining Subject Shares may be sold without restriction under the Shareholders’ Agreement subject to compliance with securities law.
The Shareholders’ Agreement permits a sub-committee of the Board to waive or shorten the restrictions described above.
The Locked-up Shareholders may, at any time, transfer their Subject Shares to any of their respective affiliates and certain other entities listed in the Shareholders’ Agreement. In addition, the Shareholders’ Agreement allows each Locked-up Shareholder to sell Subject Shares at any time following the date that is six months following the date of the Prospectus in one or more private transactions exempt from the requirements of the Securities Act (other than Rule 144 thereunder), subject to the purchaser agreeing to be bound by the terms of the Shareholders’ Agreement applicable to such Locked-up Shareholder and subject to certain other pricing-related requirements.
Any Subject Shares held by a Locked-up Shareholder holding Subject Shares representing less than 2% of our total issued shares may be sold without restriction under the Shareholders’ Agreement subject to compliance with securities law at any time 24 months after the date of the Prospectus.
Management Shareholders
In connection with our IPO, Management Shareholders received 14,229,690 ordinary shares pursuant to the terms of the LTIP, following which the Management Shareholders also had remaining rights over up to 7,117,004 share options pursuant
122
to the terms of the LTIP. The remaining share options will vest in two tranches, subject to certain financial targets being met, as further described in Item 6.B. “Director, Senior Management and Employees—Compensation — Share Incentive Plans — Long Term Incentive Plan.” Upon receipt of the underlying ordinary shares by the Management Shareholders upon the exercise of the share options, the ordinary shares will be treated as “Subject Shares” and therefore subject to the selling restrictions of the Shareholders’ Agreement described above. However, they will be excluded from the calculation of the Block A Shares, the Block B Shares, the Block C Shares and the Block D Shares. Instead, the Management Shareholders will be entitled to sell the ordinary shares received upon the exercise of the options in addition to the Block A Shares, the Block B Shares, the Block C Shares and the Block D Shares, in the manner described in the Shareholders’ Agreement.
Director Designation
For so long as the Locked-up Shareholders beneficially own, directly or indirectly, in aggregate, at least 20% of our issued shares, our Board will consist of a minimum of five and a maximum of 15 directors. Additionally, each of ECP and Wendel is entitled to designate one director for so long as it beneficially owns, directly or indirectly, 10% of our issued shares.
Consent Rights
For so long as the Locked-up Shareholders beneficially own, directly or indirectly, in aggregate, 20% or more of our issued shares, the approval of a resolution passed by a simple majority of the votes cast by the holders of our ordinary shares at a duly convened general assembly (and including the votes of Locked-up Shareholders collectively holding at least 20% or more our issued shares) is required for us to take certain actions, including: (a) entry into or material revisions of certain equity compensation plans; (b) the issuance of shares, or securities convertible into or exchangeable for shares, above certain thresholds; and (c) the issuance of shares, or securities convertible into or exchangeable for shares, to directors, officers and the beneficial owners of more than 5% of our shares above certain thresholds.
Shareholder Meetings
Any two or more Locked-up Shareholders together holding at least 25% in aggregate of our issued shares are entitled to request additional business be included in the agenda for any general meeting.
As used in this section:
“Additional MTN Non-Voting Shares” refers to the lesser of: (a) 50% of the total number of MTN Non-Voting Shares held by MTN immediately prior to our IPO; and (b) the total number of MTN Non-Voting Shares that remain after any sales of MTN Non-Voting Shares in our IPO and the Over-Allotment Option.
“Additional Sold MTN Non-Voting Shares” refers to the number of Additional MTN Non-Voting Shares sold in the first sale period noted above.
“Block A Shares” refers to the number of shares (rounded up to the nearest whole share) equal to (i) 20% of the Post Greenshoe Shares, less (ii) the Additional Sold MTN Non-Voting Shares.
“Initial Shares” refers to a number of shares equal to the sum of all of the Locked-up Shareholder’s Initial Shares held by all existing shareholders.
“Locked-up Shareholder’s Initial Shares” refers to:
(a) in respect of any Locked-up Shareholder other than (A) MTN or (B) any Management Shareholder, the number of shares held by that Locked-up Shareholder immediately prior to our IPO less the number of shares sold by that Locked-up Shareholder in our IPO(including pursuant to the Over-Allotment Option);
(b) in respect of any Management Shareholder, such Management Shareholder’s portion of the total number of shares to be received by the Management Shareholders upon our IPO pursuant to the terms of the LTIP (excluding, for the avoidance of doubt, any shares subject to future vesting on performance or similar conditions) less any shares that such Management Shareholder has sold in our IPO (including pursuant to the Over-Allotment Option); and
123
(c) in respect of MTN, the number of shares held by MTN immediately prior to our IPO less (A) the number of shares sold by MTN in our IPO (including pursuant to the Over-Allotment Option); and (B) the number of Additional MTN Non-Voting Shares.
“Locked-up Shareholder’s Post Greenshoe Shares” refers to:
(a) in respect of any Locked-up Shareholder other than (A) MTN or (B) any Management Shareholder, the number of shares held by that Locked-up Shareholder immediately prior to our IPO less the number of shares sold by that Locked-up Shareholder in our IPO(including pursuant to the Over-Allotment Option);
(b) in respect of any Management Shareholder, such Management Shareholder’s portion of the total number of shares to be received by the Management Shareholders upon our IPO pursuant to the terms of the LTIP (excluding, for the avoidance of doubt, any shares subject to future vesting on performance or similar conditions) less any shares that such Management Shareholder has sold in our IPO (including pursuant to the Over-Allotment Option); and
(c) in respect of MTN, the number of shares held by MTN immediately prior to our IPO less the number of shares sold by MTN in our IPO (including pursuant to the Over-Allotment Option).
“Locked-up Transferee” refers to any person who receives Subject Shares transferred in compliance with the Shareholders’ Agreement and is required to comply with the sell-down arrangements contained in the Shareholders’ Agreement.
“Management Shareholders” refers to certain members of management.
“MTN” refers to Mobile Telephone Networks (Netherlands) B.V.
“MTN Non-Voting Shares” refers to the shares redesignated from Class B ordinary shares held by MTN immediately prior to our IPO.
“Post Greenshoe Shares” refers to a number equal to the sum of all of the Locked-up Shareholder’s Post Greenshoe Shares held by all Locked-up Shareholders.
“Unblocked” refers to actions taken by us with respect to shares such that our registrar will no longer prevent such Shares from being registered on the public trading system. For the avoidance of doubt, reference to such shares being Unblocked shall not alter any status of such shares as restricted securities (within the meaning of Rule 144 under the Securities Act) or other restrictions on transfer to which such shares may be subject by operation of law or regulation.
“Wendel” refers to Oranje-Nassau Développement S.C.A. FIAR and Africa Telecom Towers S.C.S.
Registration Rights Agreement
In connection with our IPO, we and certain of our shareholders entered into a registration rights agreement, or the Registration Rights Agreement. The Registration Rights Agreement entitles the Holders (as defined in the Registration Rights Agreement) to certain “demand” and “piggyback” registration rights as described below.
The Registration Rights Agreement allows one or more Holders together holding at least 5% of the Registrable Securities (as defined in the Registration Rights Agreement) up to three demand registrations (in the aggregate) over any 12-month period; provided, that there shall only be two demand registrations (in the aggregate) in the first 12 months following the date of the Prospectus. The Registration Rights Agreement allows the Holders to request registration for all or any portion of their Registrable Securities, subject to customary underwriter cutbacks and certain arrangements with the MTN Group, which we refer to as the MTN Shareholder Arrangements. The Holders representing a majority of the Registrable Securities included in such offering may select the underwriters. In addition, MTN and Wendel may jointly nominate for appointment one bookrunner. Subject to certain requirements, we may suspend a request for registration for 90 days in the aggregate up to two times in any 12-month period.
Subject to eligibility, the Registration Rights Agreement also grants one or more Holders holding, alone or in the aggregate, at least 5% of the Registrable Securities the right to require us to file a shelf registration statement on Form F-3 (or any successor form). Additionally, in the event such a shelf registration statement is effective, upon the request of (i) one or more Holders representing, individually or in the aggregate, at least 5% of the Registrable Securities or (ii) any Holder to
124
the extent requested beginning 24 months following the date of the Prospectus, we shall be required to undertake an underwritten takedown offering.
When we or another Holder propose to register any of our ordinary shares subject to the terms of the Registration Rights Agreement, each Holder then holding Registrable Securities has the right to request that its Registrable Securities be included in such registration, subject to customary underwriter cutbacks and the MTN Shareholder Arrangements.
Pursuant to the Registration Rights Agreement, we have agreed to pay the fees and expenses associated with registration (excluding stock transfer taxes, underwriting fees, commissions or discounts). The Registration Rights Agreement contains customary provisions with respect to registration proceedings, underwritten offerings, and indemnity and contribution rights.
Relationship with MTN Group
One of our shareholders, MTN Group, is a related party of the MTN Customers. We have entered into MLAs separately with each of the MTN Customers in our relevant countries of operation, that expire in December 2024 and 2029 in Nigeria, March 2023 in Cameroon, April 2023 in Côte d’Ivoire, March 2024 in Zambia and April 2024 in Rwanda. In addition to the MLAs, we also enter into SLAs from time to time with the MTN Customers. The MTN Customers accounted for 55%, 4%, 4%, 1% and 1% of our revenue for the year ended December 31, 2021; 55%, 4%, 5%, 1% and 1% of our revenue for the year ended December 31, 2020; 50%, 5%, 5%, 2% and 1% of our revenue for the year ended December 31, 2019; 50%, 5%, 5%, 2% and 1% of our revenue for the year ended December 31, 2018 and 48%, 5%, 5%, 2% and 1% of our revenue for the year ended December 31, 2017.
DAR Telecom
During the year ended December 31, 2021, DAR Telecom Consulting LLC (“DAR Telecom”) was paid $1,125,384 (2020 - Nil, 2019 - $ 2,588,087) for services provided by Mr Sam Darwish, the Chairman & Group Chief Executive Officer. DAR Telecom is controlled by Mr Darwish. These amounts are included in Key Management Compensation.
During the year ended December 31, 2021, DAR Telecom invoiced the Group for medical insurance premiums it had paid on behalf of the Group for $85,163 (2020 - $85,338, 2019 - $111,136). Included in these amounts are $38,330 (2020 - $36,648, 2019 - $38,341) that relate to Mr Darwish and are included in Key Management Compensation.
During the year ended December 31, 2021, the Group incurred costs on behalf of Mr Darwish of $551,574 (2020 - $196,340, 2019 - $23,556) which were subsequently repaid by DAR Telecom.
At December 31, 2021, the Group had a receivable of $551,574 (2020 - Nil) from DAR Telecom which was repaid on February 24, 2022.
CKLB
During the year ended December 31, 2021, the Group was provided corporate administration services by CKLB International Management Limited (“CKLB”) and paid fees of $300,935 (2020 - $252,615, 2019 - $242,100). Mr Christian Li and Mrs Kathleen Lai, who served as directors of IHS Holding Limited until October 13, 2021, are directors of CKLB.
Transactions with Other Related Parties
Indemnification agreements
We entered into indemnification agreements with our executive officers and directors.
Our Articles provide for us to indemnify our directors and officers from and against all liability which they incur in execution of their duty in their respective offices, except liability incurred by reason of such director’s or officer’s dishonesty, willful default or fraud. See Item 6.B. “Director, Senior Management and Employees—Compensation — Indemnification” for a description of these indemnification agreements.
125
Related party transaction policy
Our board of directors has adopted a written related party transaction policy that sets forth the policies and procedures for the review and approval or ratification of related person transactions. This policy covers related party transactions that may be required to be reported under the disclosure rules applicable to us.
C. Interests of Experts and Counsel
Not applicable.
Item 8. Financial Information
A. Consolidated Statements and Other Financial Information
Consolidated Financial Statements
See Item 18. “Financial Statements.”
Legal and Arbitration Proceedings
We are subject to various legal and regulatory proceedings, claims and actions. Although the outcome of these proceedings, claims and actions cannot be predicted with certainty, we do not believe that the outcome of any such proceedings, claims and actions would, in our management’s judgment, have a material adverse effect on our financial condition or results of operation, nor are we aware of any material legal and regulatory proceedings, claims and actions threatened against us.
Dividend Policy
We do not anticipate paying any cash dividends on our ordinary shares in the foreseeable future. We intend to retain all available funds and any future earnings to fund the development and expansion of our business. However, if we do pay a cash dividend on our ordinary shares in the future, we will pay such dividend out of our profits or share premium (subject to solvency requirements) as permitted under Cayman Islands law.
The amount of any future dividend payments we may make will depend on, among other factors, our strategy, future earnings, financial condition, cash flow, availability or ability under our existing financing arrangements, working capital requirements, capital expenditures and applicable provisions of our Articles. Any profits or share premium we declare as dividends will not be available to be reinvested in our operations.
Moreover, we are a holding company that does not conduct any business operations of our own. As a result, we are dependent upon cash dividends, distributions and other transfers from our subsidiaries to make dividend payments. The ability of certain of our subsidiaries to pay dividends is currently restricted by the terms of the 2027 Notes and IHS Holding Limited Notes and certain of our other debt agreements and instruments and may be further restricted by any future indebtedness we or they incur. See Item 5.B. “Operating and Financial Review and Prospects—Liquidity and Capital Resources—Indebtedness.”
We did not propose or pay dividends in the year ended December 31, 2021.
B. Significant Changes
None.
Item 9. The Offer and Listing
A. Offer and Listing Details
Our ordinary shares commenced trading on the NYSE on October 14, 2021. Prior to this, no public market existed for our ordinary shares.
126
B. Plan of Distribution
Not applicable.
C. Markets
Our ordinary shares commenced trading on the NYSE on October 14, 2021 under the symbol “IHS.”
D. Selling Shareholders
Not Applicable.
E. Dilution
Not applicable.
F. Expenses of the Issue
Not applicable.
Item 10. Additional Information
A. Share Capital
Not applicable.
B. Memorandum and Articles of Association
A copy of our amended and restated memorandum and articles of association is attached as Exhibit 1.1 to this Annual Report. The information called for by this Item is set forth in Exhibit 2.5 to this Annual Report and is incorporated by reference into this Annual Report.
C. Material Contracts
The following is a summary of each material contract, other than material contracts entered into in the ordinary course of business, to which we are or have been a party, for the two years immediately preceding the date of this Annual Report:
• Long-Term Incentive Plan (incorporated by reference to Exhibit 10.1 to Amendment No. 1 to the Company’s Registration Statement on Form F-1 (File No. 333-259593) filed with the SEC on October 4, 2021).
• Form of 2021 Omnibus Incentive Plan (incorporated by reference to Exhibit 10.2 to Amendment No. 1 to the Company’s Registration Statement on Form F-1 (File No. 333-259593) filed with the SEC on October 4, 2021).
• Amended and Restated Revolving Credit Agreement, dated as of June 2, 2021, among IHS Holding Limited, as borrower, Citibank, N.A., London Branch as global coordinator, Citibank, N.A., London Branch, Absa Bank Limited (acting through its Corporate and Investment Banking division), Goldman Sachs Lending Partners LLC, JPMorgan Chase Bank, N.A., London Branch and Standard Chartered Bank Dubai International Financial Centre Branch, regulated by the Dubai Financial Services Authority, as mandated lead arrangers, Citibank Europe Plc, UK Branch, as facility agent, and the financial institutions listed therein as the original lenders (incorporated by reference to Exhibit 10.3 to Amendment No. 1 to the Company’s Registration Statement on Form F-1 (File No. 333-259593) filed with the SEC on October 4, 2021).
• Amendment Letter to Amended and Restated Revolving Credit Agreement, dated as of September 29, 2021, among IHS Holding Limited, as borrower, Citibank, N.A., London Branch as global coordinator, Citibank, N.A., London Branch, Absa Bank Limited (acting through its Corporate and Investment Banking division), Goldman Sachs Lending Partners LLC, JPMorgan Chase Bank, N.A., London Branch and Standard Chartered Bank Dubai International Financial Centre Branch, regulated by the Dubai Financial Services Authority, as mandated lead
127
arrangers, Citibank Europe Plc, UK Branch, as facility agent, and the financial institutions listed therein as the original lenders (incorporated by reference to Exhibit 10.4 to Amendment No. 1 to the Company’s Registration Statement on Form F-1 (File No. 333-259593) filed with the SEC on October 4, 2021).
• Bridge Facility Agreement, dated August 10, 2021, among IHS Holding Limited, Goldman Sachs Lending Partners LLC, JPMorgan Chase Bank, N.A., London Branch and Standard Chartered Bank, as mandated lead arrangers, Standard Chartered Bank, as facility agent, and the financial institutions listed therein as the original lenders (incorporated by reference to Exhibit 10.5 to the Company’s Registration Statement on Form F-1 (File No. 333-259593) filed with the SEC on September 16, 2021).
• Amendment Letter to Bridge Facility Agreement, dated September 29, 2021, among IHS Holding Limited, Goldman Sachs Lending Partners LLC, JPMorgan Chase Bank, N.A., London Branch and Standard Chartered Bank, as mandated lead arrangers, Standard Chartered Bank, as facility agent, and the financial institutions listed therein as the original lenders (incorporated by reference to Exhibit 10.6 to Amendment No. 1 to the Company’s Registration Statement on Form F-1 (File No. 333-259593) filed with the SEC on October 4, 2021).
• Amendment and Restatement Credit Agreement, dated September 29, 2021, among IHS Netherlands Holdco B.V. as holdco and guarantor, and, IHS Nigeria, IHS Towers NG Limited and INT Towers as borrowers and guarantors, each of IHS Holding Limited, IHS Netherlands NG1 B.V., IHS Nigeria, IHS Netherlands NG2 B.V., IHS Towers NG Limited, Nigeria Tower Interco B.V. and INT Towers as guarantors, Absa Bank Limited (acting through its Corporate and Investment Banking division), Citibank, N.A., London Branch, Goldman Sachs Bank USA, J.P. Morgan Securities plc, FirstRand Bank Limited (London Branch) (acting through its Merchant Bank division) and Standard Chartered Bank, as mandated lead arrangers, Ecobank Nigeria Limited as agent and the financial institutions listed therein as the original lenders (incorporated by reference to Exhibit 10.7 to Amendment No. 1 to the Company’s Registration Statement on Form F-1 (File No. 333-259593) filed with the SEC on October 4, 2021).
• Supplemental Indenture, dated as of June 17, 2021, among IHS Netherlands Holdco B.V., as issuer, IHS Holding Limited, IHS Netherlands NG1 B.V., IHS Netherlands NG2 B.V., IHS Nigeria Limited, IHS Towers NG Limited, Nigeria Tower Interco B.V., INT Towers Limited, as guarantors, and Citibank N.A. London Branch, as Trustee, Principal Paying Agent, Transfer Agent and Registrar (incorporated by reference to Exhibit 4.5 to Amendment No. 1 to the Company’s Registration Statement on Form F 1 (File No. 333 259593) filed with the SEC on October 4, 2021).
• Indenture, dated as of November 29, 2021, among IHS Holding Limited., as issuer, IHS Netherlands Holdco B.V., IHS Netherlands NG1 B.V., IHS Netherlands NG2 B.V., IHS Nigeria Limited, IHS Towers NG Limited, INT Towers Limited, Nigeria Tower Interco B.V., as guarantors, Lucid Trustee Services Limited, as Trustee, and Citibank N.A. London Branch, as Principal Paying Agent, Transfer Agent and Registrar.
D. Exchange Controls
There are no Cayman Islands exchange control regulations that would affect the import or export of capital or the remittance of dividends, interest or other payments to non-resident holders of our shares.
E. Taxation
The following summary contains a description of certain Cayman Islands, United Kingdom and U.S. federal income tax consequences of the ownership and disposition of ordinary shares, but it does not purport to be a comprehensive description of all the tax considerations that may be relevant to the ownership of ordinary shares. The summary is based upon the tax laws of the Cayman Islands and regulations thereunder, the tax laws of the United Kingdom and regulations thereunder and on the tax laws of the United States and regulations thereunder as of the date hereof, which are subject to change.
Material Cayman Islands Tax Considerations
The following discussion is a summary of the material Cayman Islands tax considerations relating to the purchase, ownership and disposition of our ordinary shares. There is, at present, no direct taxation in the Cayman Islands and interest, dividends and gains payable to the Company will be received free of all Cayman Islands taxes. The Company has applied for and expects to receive an undertaking from the Government of the Cayman Islands to the effect that, for a period of thirty years from the date of the undertaking, no law that thereafter is enacted in the Cayman Islands imposing any tax to be levied on profits, income or on gains or appreciation shall apply to the Company or its operations, and in addition that no
128
tax to be levied on profits, income gains or appreciations, or which is in the nature of estate duty or inheritance tax shall be payable (i) on or in respect of the shares, debentures or other obligation of the Company; or (ii) by way of the withholding in whole or in part of any relevant payment as defined under the Cayman Islands Tax Concessions Act.
No stamp duty in the Cayman Islands is payable in respect of the issue of any ordinary shares or an instrument of transfer in respect of an ordinary share.
Material UK Tax Considerations
The following statements are of a general nature and do not purport to be a complete analysis of all potential UK tax consequences of acquiring, holding and disposing of ordinary shares. The statements are based on current UK tax law and on the current published practice of Her Majesty’s Revenue and Customs, or HMRC (which may not be binding on HMRC), as of the date of this Annual Report, all of which are subject to change, possibly with retrospective effect. They are intended to address only certain UK tax consequences for holders of ordinary shares who are tax resident in (and only in) the United Kingdom, and in the case of individuals, domiciled in (and only in) the United Kingdom (except where expressly stated otherwise) who are the absolute beneficial owners of ordinary shares and any dividends paid on them and who hold ordinary shares as investments (other than in an individual savings account or a self-invested personal pension). They do not address the UK tax consequences which may be relevant to certain classes of holders of ordinary shares such as traders, brokers, dealers, banks, financial institutions, insurance companies, investment companies, collective investment schemes, tax-exempt organizations, trustees, persons connected with the Company or any member of the IHS Towers group for tax purposes, persons holding their ordinary shares as part of hedging or conversion transactions, holders of ordinary shares who have (or are deemed to have) acquired their ordinary shares by virtue of an office or employment, and holders of ordinary shares who are or have been officers or employees of the Company or a company forming part of the IHS Towers group for tax purposes. The statements do not apply to any holders of ordinary shares who either directly or indirectly hold or control 10% or more of the Company’s share capital (or class thereof), voting power or profits.
The following is intended only as a general guide and is not intended to be, nor should it be considered to be, legal or tax advice to any particular prospective subscriber for, or purchaser of, ordinary shares. Accordingly, prospective subscribers for, or purchasers of, ordinary shares who are in any doubt as to their tax position regarding the acquisition, ownership and disposition of ordinary shares or who are subject to tax in a jurisdiction other than the United Kingdom should consult their own tax advisers.
The Company
It is the intention of the directors to conduct the affairs of the Company so that the central management and control of the Company is exercised in the United Kingdom. As a result, the Company is expected to be treated as resident in the United Kingdom for UK tax purposes. Accordingly we expect to be subject to UK taxation on our income and gains, except where an exemption applies.
We may be treated as a dual resident company for UK tax purposes. As a result, our right to claim certain reliefs from UK tax may be restricted, and changes in law or practice in the United Kingdom could result in the imposition of further restrictions on our right to claim UK tax reliefs.
Taxation of Dividends — Withholding tax
The Company will not be required to withhold UK tax at source when paying dividends. The amount of any liability to UK tax on dividends paid by the Company will depend on the individual circumstances of a Shareholder.
Taxation of Dividends — UK Resident Shareholders
An individual holder of ordinary shares who is resident for tax purposes in the UK may, depending on his or her particular circumstances, be subject to UK tax on dividends received from the Company.
All dividends received by a UK resident individual holder of ordinary shares from the Company or from other sources will form part of such holder’s total income for income tax purposes and will constitute the top slice of that income. A nil rate of income tax will apply to the first £2,000 (tax year 2021/22) of taxable dividend income received by the holder of ordinary shares in a tax year. Income within the nil rate band will be taken into account in determining whether income in excess of the nil rate band falls within the basic rate, higher rate or additional rate tax bands. Where the dividend income is above the
129
£2,000 dividend allowance, the first £2,000 of the dividend income will be charged at the nil rate and any excess amount will be taxed at 7.5 per cent. (tax year 2021/22) to the extent that the excess amount falls within the basic rate tax band, 32.5 per cent. (tax year 2021/22) to the extent that the excess amount falls within the higher rate tax band and 38.1 per cent. (tax year 2021/22) to the extent that the excess amount falls within the additional rate tax band. From April 6, 2022, these rates are expected to increase to 8.75%, 33.75% and 39.35%, respectively.
Corporate holders of ordinary shares which are resident for tax purposes in the UK should not be subject to UK corporation tax on any dividend received from the Company so long as the dividends qualify for exemption (as is likely) and certain conditions are met (including anti-avoidance conditions). By way of example, dividends paid on shares that are not redeemable and do not carry any present or future preferential rights to dividends or to the Company’s assets on its winding up will generally be exempt.
Taxation of Dividends — Non-UK Resident Shareholders
An individual holder of ordinary shares who is not resident for tax purposes in the United Kingdom should not be chargeable to UK income tax on dividends received from the Company unless he or she carries on (whether solely or in partnership) any trade, profession or vocation in the United Kingdom through a branch or agency to which the ordinary shares are attributable. There are certain exceptions for trading in the United Kingdom through independent agents, such as some brokers and investment managers.
Corporate holders of ordinary shares who are not resident in the United Kingdom will not generally be subject to UK corporation tax on dividends unless they are carrying on a trade, profession or vocation in the United Kingdom through a permanent establishment in connection with which their ordinary shares are used, held, or acquired.
Taxation of Capital Gains — UK Resident Shareholders
A disposal or deemed disposal of ordinary shares by an individual or corporate holder of such ordinary shares who is tax resident in the United Kingdom may, depending on that holder’s circumstances and subject to any available exemptions or reliefs, give rise to a chargeable gain or allowable loss for the purposes of UK taxation of chargeable gains.
Any chargeable gain (or allowable loss) will generally be calculated by reference to the consideration received for the disposal of ordinary shares less the allowable cost to that holder of acquiring such ordinary shares.
The applicable tax rates for UK resident individual holders of ordinary shares realizing a gain on the disposal of ordinary shares is, broadly, 10% for basic rate taxpayers (tax year 2021/22) and 20% for higher and additional rate taxpayers (tax year 2021/22).
For UK resident corporate holders of ordinary shares, the applicable tax rate is 19% (tax year 2021/22) on realizing a gain on the disposal of ordinary shares.
Taxation of Capital Gains — Non-UK Shareholders
Holders of ordinary shares who are not resident in the United Kingdom and, in the case of an individual holder of ordinary shares, not temporarily non-resident, should not be liable for UK tax on capital gains realized on a sale or other disposal of ordinary shares unless (i) such ordinary shares are used, held or acquired for the purposes of a trade, profession or vocation carried on in the United Kingdom through a branch or agency or, in the case of a corporate holder of ordinary shares, through a permanent establishment or (ii) where certain conditions are met, the Company derives 75% or more of its gross value from UK land.
Generally, an individual holder of ordinary shares who has ceased to be resident in the United Kingdom for tax purposes for a period of five years or less and who disposes of ordinary shares during that period may be liable on their return to the United Kingdom to UK taxation on any capital gain realized (subject to any available exemption or relief).
UK Stamp Duty and UK Stamp Duty Reserve Tax
No UK Stamp Duty, or UK Stamp Duty Reserve Tax, or SDRT, will be payable on the issue of ordinary shares, subject to the comments below.
130
UK Stamp Duty will in principle be payable on any instrument of transfer of ordinary shares that is executed in the United Kingdom or that relates to any property situated, or to any matter or thing done or to be done, in the United Kingdom. An exemption from UK Stamp Duty is available on an instrument transferring ordinary shares where the amount or value of the consideration is £1,000 or less and it is certified on the instrument that the transaction effected by the instrument does not form part of a larger transaction or series of transactions in respect of which the aggregate amount or value of the consideration exceeds £1,000. Holders of ordinary shares should be aware that, even where an instrument of transfer is in principle subject to UK Stamp Duty, UK Stamp Duty is not required to be paid unless it is necessary to rely on the instrument for legal purposes, for example to register a change of ownership or in litigation in a UK court.
Provided that ordinary shares are not registered in any register maintained in the United Kingdom by or on behalf of us and are not paired with any shares issued by a UK incorporated company, any agreement to transfer ordinary shares will not be subject to SDRT. We currently do not intend that any register of ordinary shares will be maintained in the United Kingdom.
If ordinary shares were to be registered in a register maintained in the United Kingdom by or on behalf of us or paired with any shares issued by a UK incorporated company then, where ordinary shares are transferred or issued to, or to a nominee or agent for, a person whose business is or includes the provision of clearance services or issuing depositary receipts (but not including CREST), SDRT may be payable at a rate of 1.5% of the amount or value of the consideration payable for or, in certain circumstances, the market value of the ordinary shares. This liability for SDRT will strictly be accountable by the clearance service or depositary receipt system, as the case may be, but will, in practice, generally be reimbursed by participants in the clearance service or depositary receipt system.
Material United States Federal Income Taxation Considerations
The following discussion describes material U.S. federal income tax consequences to U.S. Holders (as defined below) of the ownership and disposition of ordinary shares. This summary applies only to U.S. Holders that hold ordinary shares as capital assets within the meaning of Section 1221 of the Code (as defined below) and have the U.S. dollar as their functional currency.
This discussion is based on the tax laws of the United States as in effect on the date of this Annual Report, including the Internal Revenue Code of 1986, as amended, or the Code, and U.S. Treasury regulations in effect or, in some cases, proposed, as of the date of this Annual Report, as well as judicial and administrative interpretations thereof available on or before such date. All of the foregoing authorities are subject to change, and any such change could apply retroactively and could affect the U.S. federal income tax consequences described below. The statements in this Annual Report are not binding on the U.S. Internal Revenue Service, or the IRS, or any court, and thus we can provide no assurance that the U.S. federal income tax consequences discussed below will not be challenged by the IRS or will be sustained by a court if challenged by the IRS. Furthermore, this summary does not address any estate or gift tax consequences, any state, local or non-U.S. tax consequences, the Medicare tax on net investment income or any other tax consequences other than U.S. federal income tax consequences.
The following discussion does not describe all the tax consequences that may be relevant to any particular holder of our ordinary shares or to persons in special tax situations such as:
• banks and certain other financial institutions;
• regulated investment companies;
• real estate investment trusts;
• insurance companies;
• broker-dealers;
• traders that elect to mark to market;
• tax-exempt entities;
• persons liable for alternative minimum tax;
• U.S. expatriates;
131
• persons holding ordinary shares as part of a straddle, hedging, constructive sale, conversion or integrated transaction;
• persons that actually or constructively own 10% or more of the Company’s stock (by vote or value);
• persons that are resident or ordinarily resident in or have a permanent establishment in a jurisdiction outside the United States;
• persons who acquired ordinary shares pursuant to the exercise of any employee share option or otherwise as compensation;
• persons subject to special tax accounting rules as a result of any item of gross income with respect to the ordinary shares being taken into account in an applicable financial statement; or
• persons holding ordinary shares through partnerships or other pass-through entities.
HOLDERS OF OUR ORDINARY SHARES ARE URGED TO CONSULT THEIR TAX ADVISORS ABOUT THE APPLICATION OF THE U.S. FEDERAL TAX RULES TO THEIR PARTICULAR CIRCUMSTANCES AS WELL AS THE STATE, LOCAL AND NON-U.S. TAX CONSEQUENCES TO THEM OF THE OWNERSHIP AND DISPOSITION OF ORDINARY SHARES.
As used herein, the term “U.S. Holder” means a beneficial owner of ordinary shares that, for U.S. federal income tax purposes, is or is treated as:
• an individual who is a citizen or resident of the United States;
• a corporation (or other entity treated as a corporation for U.S. federal income tax purposes) created or organized in or under the laws of the United States, any state thereof or the District of Columbia;
• an estate whose income is subject to U.S. federal income taxation regardless of its source; or
• a trust that (1) is subject to the supervision of a court within the United States and the control of one or more U.S. persons or (2) has a valid election in effect under applicable U.S. Treasury regulations to be treated as a U.S. person.
The tax treatment of a partner in an entity or arrangement treated as a partnership for U.S. federal income tax purposes that holds ordinary shares generally will depend on such partner’s status and the activities of the partnership. A U.S. Holder that is a partner in such partnership should consult its tax advisor.
Dividends and Other Distributions on Ordinary Shares
Subject to the passive foreign investment company considerations discussed below, the gross amount of distributions made by the Company with respect to ordinary shares (including the amount of any non-U.S. taxes withheld therefrom, if any) generally will be includible as dividend income in a U.S. Holder’s gross income in the year received, to the extent such distributions are paid out of the Company’s current or accumulated earnings and profits, as determined under U.S. federal income tax principles. Because the Company does not maintain calculations of its earnings and profits under U.S. federal income tax principles and does not expect to do so in the future, a U.S. Holder should expect all cash distributions will be reported as dividends for U.S. federal income tax purposes. Such dividends will not be eligible for the dividends-received deduction allowed to U.S. corporations with respect to dividends received from other U.S. corporations. Dividends paid to a non-corporate U.S. Holder may be treated as “qualified dividend income” eligible for the lower capital gains tax rate with respect to non-corporate U.S. Holders. The dividends will not be eligible for the dividends received deduction available to corporations in respect of dividends received from other U.S. corporations.
The amount of any distribution paid in foreign currency will be equal to the U.S. dollar value of such currency, translated at the spot rate of exchange on the date such distribution is received, regardless of whether the payment is in fact converted into U.S. dollars at that time. Any gain or loss realized on a subsequent conversion or other disposition of such foreign currency will be treated as U.S. source ordinary income or loss.
132
Dividends on the ordinary shares generally will constitute foreign source income for foreign tax credit limitation purposes. Subject to certain complex conditions and limitations, any foreign taxes withheld on any distributions on the ordinary shares may be eligible for credit against a U.S. Holder’s federal income tax liability. For foreign tax credit purposes, dividends distributed by the Company with respect to ordinary shares will generally constitute “passive category income.”
Sale or Other Taxable Disposition of Ordinary Shares
Subject to the passive foreign investment company considerations discussed below, upon a sale or other taxable disposition of ordinary shares, a U.S. Holder will recognize capital gain or loss in an amount equal to the difference between the amount realized and the U.S. Holder’s adjusted tax basis in such ordinary shares. Any such gain or loss generally will be treated as long-term capital gain or loss if the U.S. Holder’s holding period in the ordinary shares exceeds one year.
Non-corporate U.S. Holders (including individuals) generally will be subject to U.S. federal income tax on long-term capital gain at preferential rates. The deductibility of capital losses is subject to significant limitations. Gain or loss, if any, realized by a U.S. Holder on the sale or other disposition of ordinary shares generally will be treated as U.S. source gain or loss for U.S. foreign tax credit limitation purposes.
Passive Foreign Investment Company Considerations
The Company will be classified as a passive foreign investment company, or a PFIC, for any taxable year if either: (a) at least 75% of its gross income is “passive income” for purposes of the PFIC rules or (b) at least 50% of the value of its assets (determined on the basis of a quarterly average) is attributable to assets that produce or are held for the production of passive income. For this purpose, the Company will be treated as owning its proportionate share of the assets and earning its proportionate share of the income of any other corporation in which it owns, directly or indirectly, 25% or more (by value) of the stock.
Under the PFIC rules, if the Company were considered a PFIC at any time that a U.S. Holder holds the ordinary shares, the Company would continue to be treated as a PFIC with respect to such investment unless (i) the Company ceased to be a PFIC and (ii) the U.S. Holder made a “deemed sale” election under the PFIC rules.
Based on the composition of the income, assets and operations of the Company and its subsidiaries, the Company does not believe that it currently is or has been a PFIC for the year ending December 31, 2021, and the Company does not expect to be a PFIC in the future. This is a factual determination, however, that can only be made annually after the close of each taxable year. In addition, the principles and methodology used in determining whether a company is a PFIC are subject to ambiguities and different interpretations. Therefore we cannot assure you that the Company will not be classified as a PFIC for the current taxable year. Furthermore, even if the Company is not a PFIC for the current year, the Company may become a PFIC in a future year depending on, for example, the operations of the Company and its subsidiaries.
If the Company is considered a PFIC at any time that a U.S. Holder holds ordinary shares, any gain recognized by the U.S. Holder on a sale or other disposition of the ordinary shares, as well as the amount of any “excess distribution” (defined below) received by the U.S. Holder, would be allocated ratably over the U.S. Holder’s holding period for the ordinary shares. The amounts allocated to the taxable year of the sale or other disposition (or the taxable year of receipt, in the case of an excess distribution) and to any year before the Company became a PFIC would be taxed as ordinary income. The amount allocated to each other taxable year would be subject to tax at the highest rate in effect for individuals or corporations, as appropriate, for that taxable year, and an interest charge would be imposed. For the purposes of these rules, an excess distribution is the amount by which any distribution received by a U.S. Holder on ordinary shares exceeds 125% of the average of the annual distributions on the ordinary shares received during the preceding three years or the U.S. Holder’s holding period, whichever is shorter. In addition, if the Company is a PFIC and any of its subsidiaries is also a PFIC, a U.S. Holder may also be subject to the adverse tax consequences described above with respect to any gain or “excess distribution” realized or deemed realized in respect of such subsidiary PFIC. Certain elections may be available that would result in alternative treatments (such as mark-to-market treatment) of the ordinary shares if the Company is considered a PFIC.
If the Company is considered a PFIC, a U.S. Holder will also be subject to annual information reporting requirements. U.S. Holders should consult their tax advisors about the potential application of the PFIC rules to the ordinary shares.
133
Information Reporting and Backup Withholding
Dividend payments with respect to ordinary shares and proceeds from the sale, exchange or redemption of ordinary shares may be subject to information reporting to the IRS and U.S. backup withholding. A U.S. Holder may be eligible for an exemption from backup withholding if the U.S. Holder furnishes a correct taxpayer identification number and makes any other required certification or is otherwise exempt from backup withholding. U.S. Holders who are required to establish their exempt status may be required to provide such certification on IRS Form W-9. U.S. Holders should consult their tax advisors regarding the application of the U.S. information reporting and backup withholding rules.
Backup withholding is not an additional tax. Amounts withheld as backup withholding may be credited against a U.S. Holder’s U.S. federal income tax liability, and such U.S. Holder may obtain a refund of any excess amounts withheld under the backup withholding rules by timely filing an appropriate claim for refund with the IRS and furnishing any required information.
Additional Information Reporting Requirements
Certain U.S. Holders who are individuals (and certain entities) that hold an interest in “specified foreign financial assets” (which may include the ordinary shares) are required to report information relating to such assets, subject to certain exceptions (including an exception for ordinary shares held in accounts maintained by certain financial institutions). Penalties can apply if U.S. Holders fail to satisfy such reporting requirements. U.S. Holders should consult their tax advisors regarding the applicability of these requirements to their acquisition and ownership of ordinary shares.
Transfer Reporting Requirements
A U.S. Holder (including a U.S. tax-exempt entity) that acquires equity of a non-U.S. corporation may be required to file a Form 926 or a similar form with the IRS reporting the payment of the offering price if (i) such person owned, directly or by attribution, immediately after the transfer at least 10.0% by vote or value of the corporation or (ii) if the transfer, when aggregated with all transfers made by such person (or any related person) within the preceding 12-month period, exceeds $100,000. Substantial penalties may be imposed upon a U.S. Holder that fails to comply.
Also, in the event a U.S. Holder does not file IRS Form 926, the statute of limitations on the assessment and collection of U.S. federal income taxes of such U.S. Holder for the related tax year may not close until three years after the date the required information is filed. Each U.S. Holder should consult its own tax advisor as to the possible obligation to file IRS Form 926.
THE DISCUSSION ABOVE IS A GENERAL SUMMARY. IT DOES NOT COVER ALL TAX MATTERS THAT MAY BE IMPORTANT TO YOU. EACH HOLDER OF ORDINARY SHARES SHOULD CONSULT ITS OWN TAX ADVISOR ABOUT THE TAX CONSEQUENCES OF OWNING ORDINARY SHARES UNDER THE HOLDER’S OWN CIRCUMSTANCES.
F. Dividends and Paying Agents
Not applicable.
G. Statement by Experts
Not applicable.
H. Documents on Display
We are subject to the informational requirements of the Exchange Act. Accordingly, we will be required to file reports and other information with the SEC, including annual reports on Form 20-F and reports on Form 6-K. The SEC maintains an internet website that contains reports and other information about issuers, like us, that file electronically with the SEC. The address of that website is www.sec.gov.
As a foreign private issuer, we are exempt under the Exchange Act from, among other things, the rules prescribing the furnishing and content of proxy statements, and our officers, directors and principal shareholders are exempt from the reporting and short swing profit recovery provisions contained in Section 16 of the Exchange Act. In addition, we will not be required under the Exchange Act to file periodic reports and financial statements with the SEC as frequently or as promptly
134
as U.S. companies whose securities are registered under the Exchange Act. We are required to make certain filings with the SEC. The SEC maintains an internet website that contains reports, proxy statements and other information about issuers, like us, that file electronically with the SEC. The address of that site is www.sec.gov.
I. Subsidiary Information
Not applicable.
Item 11. Quantitative and Qualitative Disclosures About Market Risk
Our activities expose us to a variety of market risks. Our primary market risk exposures relate to foreign exchange rates, interest rates and counterparty credit risks. Where appropriate, we use derivative financial instruments solely for the purpose of hedging the currency risks arising from our operations and sources of financing. We do not enter into derivative financial instruments for speculative purposes.
The following discussion and analysis only addresses our market risk and does not address other financial risks we face in the normal course of business, including credit and liquidity risk. There has been no material change to our market risk in the year ended December 31, 2021. See Item 3.D. “Risk Factors — Shortage of U.S. dollar, euro or other hard currency liquidity in the markets in which we operate may adversely affect our ability to service our foreign currency liabilities.”
Foreign exchange risk
We operate internationally, predominantly in emerging and less developed markets, and are exposed to foreign exchange risk as a result. A material change in the value of any such foreign currency could adversely affect our cash flow and results of operations. We are exposed to exchange rate risk to the extent that balances and transactions are denominated in a currency other than the functional currency in which they are measured. In managing foreign exchange risk, we aim to reduce the impact of short term fluctuations on earnings. We have no export sales but we have customers that are either contracted using lease fees quoted in U.S. dollars or other foreign currencies but with foreign exchange indexation. Our significant exposure to currency risk relates to our loan facilities that are mainly in U.S. dollars or euro. We manage foreign exchange rate risk through our revenue contract foreign exchange resets, the use of derivative financial instruments such as currency swaps and forward contracts. We monitor the movement in the currency rates on an ongoing basis. The currency exposure arising from cash and cash equivalent assets denominated in foreign currencies is managed primarily by setting limits on the percentage of net assets that may be invested in such deposits.
During the year ended December 31, 2021, we had $163.6 million in net foreign exchange losses, of which $167.6 million related to our Nigeria segment. Our exposure to foreign exchange rate fluctuations is primarily in the Nigeria segment, which has the largest value of U.S. dollar denominated debt. Based on foreign exchange rates existing as of December 31, 2021, a 1% appreciation in each of the Naira, the Zambian Kwacha, and the Brazilian Real compared to the U.S. dollar would have resulted in approximately $25.6 million lower net foreign exchange losses during the year ended December 31, 2021 (with $20.3 million of the lower foreign exchange loss coming from the Naira). Conversely, a 1% depreciation of the Naira, the Zambian Kwacha, and the Brazilian Real compared to the U.S. dollar would have resulted in approximately $25.6 million of net foreign exchange losses during the year ended December 31, 2021.
Interest rate risk
Our main interest rate risk arises from long-term borrowings with variable rates. Our borrowings at variable rate are mainly denominated in U.S. dollars. Our fixed rate borrowings and receivables are carried at amortized cost. They are therefore not subject to interest rate risk as defined by IFRS, since neither the carrying amount nor the future cash flows will fluctuate because of a change in market interest rates.
During the year ended December 31, 2021, our loss for the year was $26.1 million. If interest rates increased by 1%, our loss for the year would have increased by $6.3 million during the year ended December 31, 2021. Conversely, a 1% decrease in interest rates would have resulted in a $6.1 million decrease in losss for the year during the year ended December 31, 2021.
Further information about our financial risk management can be found in Note 4 to the audited consolidated financial statements included elsewhere in this Annual Report.
135
Counterparty Credit Risk
Counterparty credit risk relates to the risk of loss resulting from nonperformance or nonpayment by counterparties pursuant to the terms of their contractual obligations. We utilize data and market knowledge to determine the concentration of risk by reference to independent and internal ratings of customers. Risks surrounding counterparty performance could ultimately impact the amount and timing of our cash flow and future profits. We seek to mitigate counterparty credit risk by having a diversified portfolio of counterparties.
Liquidity Risk
Liquidity risk is the risk that we will encounter difficulty in meeting the obligations associated with our financial liabilities that are settled by delivering cash or another financial asset. Our approach to managing liquidity is to ensure, as far as possible, that we will always have sufficient liquidity to meet our liabilities when due, under both normal and stressed conditions, without incurring unacceptable losses or risking damage to our reputation.
We have a clear focus on ensuring we have sufficient access to capital to finance growth and to refinance maturing debt obligations. As part of the liquidity management process, we have various credit arrangements that can be utilized to meet our liquidity requirements. At December 31, 2021, we had utilized $2.6 billion of $3.5 billion credit facilities.
Typically, our credit terms with customers are more favorable compared to payment terms to our suppliers in order to help provide sufficient cash on demand to meet expected operational expenses, including the servicing of financial obligations. This excludes the potential impact of extreme circumstances that cannot be reasonably predicted, such as natural disasters.
Item 12. Description of Securities Other than Equity Securities
A. Debt Securities
Not applicable.
B. Warrants and Rights
Not applicable.
C. Other Securities
Not applicable.
D. American Depositary Shares
Not applicable.
136
PART II
Item 13. Defaults, Dividend Arrearages and Delinquencies
None.
Item 14. Material Modifications to the Rights of Security Holders and Use of Proceeds
On October 13, 2021, we adopted our amended and restated memorandum and articles of association according to our board of directors’ proposal. As a consequence of the adoption of the amended and restated memorandum and articles of association, our share capital was reorganized, and all of our outstanding Class A and Class B shares were exchanged on a 500 to 1 basis for ordinary shares. A copy of our amended and restated memorandum and articles of association is being filed as Exhibit 1.1 to this Annual Report. See Item 10.B. “Additional Information—Memorandum and Articles of Association.”
Use of Proceeds
On October 13, 2021, the SEC declared effective our registration statement on Form F-1 (File No. 333-259593), as amended, filed in connection with our IPO (the “Registration Statement”). Pursuant to the Registration Statement, we registered the offer and sale of 22,500,000 of our ordinary shares with a proposed maximum aggregate offering price of approximately $540.0 million. We offered 18,000,000 ordinary shares, and certain of our existing shareholders (the “Selling Shareholders”) offered 4,500,000 ordinary shares (including the underwriters’ option to purchase an additional 2,700,000 ordinary shares from us and an additional 675,000 ordinary shares from the Selling Shareholders). Goldman Sachs & Co. LLC, J.P. Morgan Securities LLC and Citigroup Global Markets Inc. acted as representatives of the underwriters for the offering.
On October 14, 2021, we issued and sold 18,000,000 ordinary shares at a price to the public of $21.00 per share. The aggregate offering price of the shares sold was approximately $378.0 million. Upon completion of the IPO on October 14, 2021, we received net proceeds of $357.7 million, after deducting underwriting discounts and commissions of $21.7 million and net reimbursements of offering expenses of $1.4 million.
There has been no material change in the expected use of the net proceeds from our initial public offering as described in the Prospectus.
Item 15. Controls and Procedures
Inherent Limitations on Effectiveness of Controls and Procedures
We maintain disclosure controls and procedures (as that term is defined in Rules 13a-15(e) and 15d-15(e) under the Securities Exchange Act of 1934, as amended (“Exchange Act”)) that are designed to ensure that information required to be disclosed in the Company’s reports under the Exchange Act is recorded, processed, summarized and reported within the time periods specified in the SEC’s rules and forms and that such information is accumulated and communicated to our management, including our Chief Executive Officer and Chief Financial Officer, as appropriate, to allow timely decisions regarding required disclosures. Any controls and procedures, no matter how well designed and operated, can provide only reasonable assurance of achieving the desired control objectives.
Evaluation of Disclosure Controls and Procedures
Our management, with the participation of our Chief Executive Officer and Chief Financial Officer, has evaluated the effectiveness of the design and operation of our disclosure controls and procedures as of December 31, 2021. Based upon that evaluation and as a result of the material weaknesses described below, our Chief Executive Officer and Chief Financial Officer concluded that, as of December 31, 2021, our disclosure controls and procedures were not effective to accomplish their objectives at the reasonable assurance level. In light of this fact, our management has performed additional analyses, reconciliations, and other post-closing procedures and has concluded that, notwithstanding the material weaknesses in our internal control over financial reporting, the consolidated financial statements for the periods covered by and included in this Annual Report on Form 20-F fairly state, in all material respects, our financial position, results of operations and cash flows for the periods presented in conformity with IFRS.
137
Previously Identified Material Weaknesses
A material weakness is a deficiency, or combination of deficiencies, in internal control over financial reporting, such that there is a reasonable possibility that a material misstatement of a company’s annual and interim financial statements will not be detected or prevented on a timely basis. Internal control over financial reporting is a process designed to provide reasonable assurance regarding the reliability of financial reporting and the preparation of financial statements in accordance with IFRS.
In connection with the audits of our historic consolidated financial statements, we identified three material weaknesses in internal control over financial reporting. These material weaknesses were previously reported in our Prospectus.
Two of the material weaknesses identified related to the lack of key accounting personnel with the requisite knowledge and experience to account for complex transactions, particularly in the areas of foreign exchange, business combinations and other complex, judgmental areas, and the lack of an adequate process and procedures surrounding the accounting for the acquisition of property, plant and equipment and utilization of advance payments made to contractors for the provision and construction of property, plant and equipment impacting the timely recognition of assets and commencement of depreciation. Another material weakness in our internal controls over financial reporting was identified during the course of the audit for the year ended December 31, 2020. While no audit adjustment was required to the financial statements, the material weakness identified is in the lack of appropriate internal communication, documentation of the facts, circumstances and judgements taken by management. This material weakness resulted in the incomplete recording of transactions related to the recognition and settlement of revenues and receivables where the amounts concerned were subject to dispute or deferred invoicing.
Remediation Activities
We continue to take steps to remediate these material weaknesses and have hired additional qualified accounting and financial reporting personnel and engaged external temporary resources as needed. In addition, we have implemented new controls designed to prevent the future occurrence of similar issues. We are also working to modify and implement policies and procedures centrally to develop effective internal control through a shared service center along with improvements to controls across the finance function.
We are satisfied, as a result of the testing of the design and operating effectiveness of controls that the previously identified control deficiency related to the accounting for foreign exchange in our Prospectus has been remediated at December 31, 2021. Equally, we are satisfied that progress is being made on the other aspects of the material weaknesses historically identified.
While we believe these efforts can remediate the three material weaknesses, these material weaknesses cannot be considered fully remediated until the applicable remedial controls are fully implemented, operate for a sufficient period of time and management has concluded, through testing, that these controls are operating effectively.
Management’s Annual Report on Internal Control over Financial Reporting
This Annual Report does not include a report of management’s assessment regarding internal control over financial reporting due to a transition period established by rules of the SEC for newly-public companies.
Attestation Report of Independent Registered Public Accounting Firm
This Annual Report does not include an attestation report of our independent registered public accounting firm due to a transition period established by rules of the SEC for newly-public companies.
Changes in Internal Control over Financial Reporting
Other than the remediation efforts described above, there were no changes in our internal controls over financial reporting (as such term is defined in Rules 13a-15(f) and 15d-15(f) under the Securities Exchange Act) that occurred during the period covered by this Annual Report that have materially affected, or are reasonably likely to materially affect, our internal control over financial reporting.
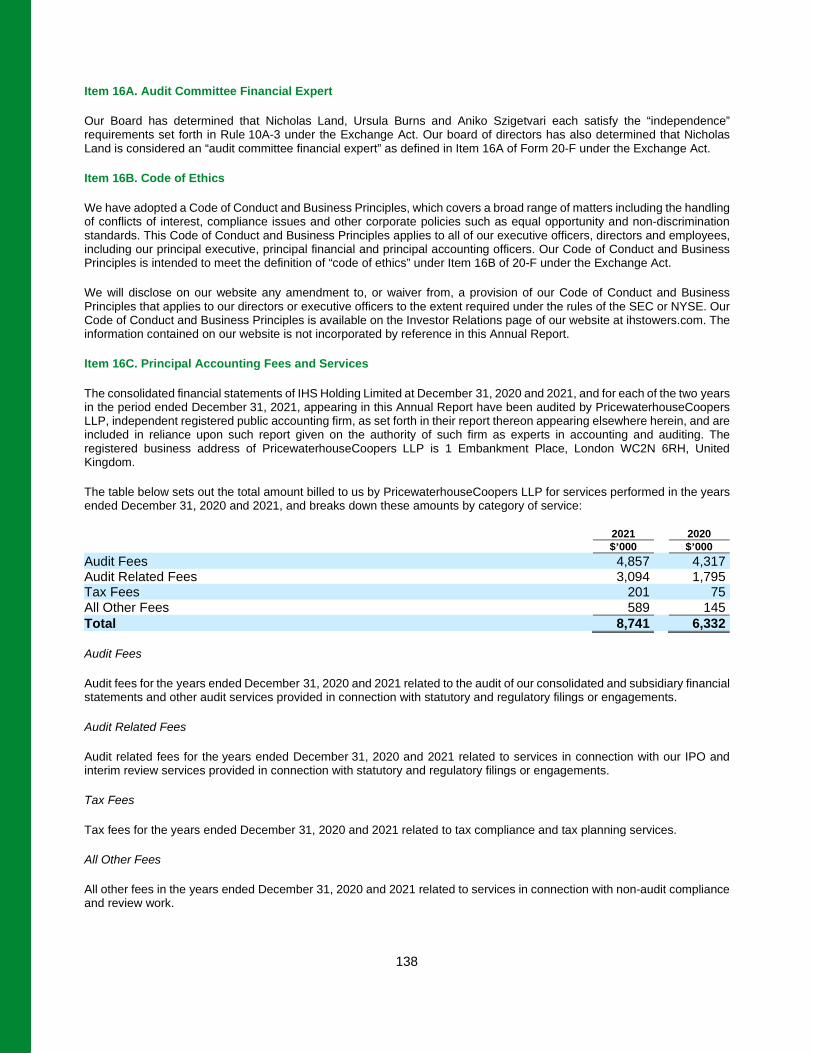
138
Item 16A. Audit Committee Financial Expert
Our Board has determined that Nicholas Land, Ursula Burns and Aniko Szigetvari each satisfy the “independence” requirements set forth in Rule 10A-3 under the Exchange Act. Our board of directors has also determined that Nicholas Land is considered an “audit committee financial expert” as defined in Item 16A of Form 20-F under the Exchange Act.
Item 16B. Code of Ethics
We have adopted a Code of Conduct and Business Principles, which covers a broad range of matters including the handling of conflicts of interest, compliance issues and other corporate policies such as equal opportunity and non-discrimination standards. This Code of Conduct and Business Principles applies to all of our executive officers, directors and employees, including our principal executive, principal financial and principal accounting officers. Our Code of Conduct and Business Principles is intended to meet the definition of “code of ethics” under Item 16B of 20-F under the Exchange Act.
We will disclose on our website any amendment to, or waiver from, a provision of our Code of Conduct and Business Principles that applies to our directors or executive officers to the extent required under the rules of the SEC or NYSE. Our Code of Conduct and Business Principles is available on the Investor Relations page of our website at ihstowers.com. The information contained on our website is not incorporated by reference in this Annual Report.
Item 16C. Principal Accounting Fees and Services
The consolidated financial statements of IHS Holding Limited at December 31, 2020 and 2021, and for each of the two years in the period ended December 31, 2021, appearing in this Annual Report have been audited by PricewaterhouseCoopers LLP, independent registered public accounting firm, as set forth in their report thereon appearing elsewhere herein, and are included in reliance upon such report given on the authority of such firm as experts in accounting and auditing. The registered business address of PricewaterhouseCoopers LLP is 1 Embankment Place, London WC2N 6RH, United Kingdom.
The table below sets out the total amount billed to us by PricewaterhouseCoopers LLP for services performed in the years ended December 31, 2020 and 2021, and breaks down these amounts by category of service:
2021 2020 $’000 $’000 Audit Fees 4,857 4,317 Audit Related Fees 3,094 1,795 Tax Fees 201 75 All Other Fees 589 145 Total 8,741 6,332 Audit Fees
Audit fees for the years ended December 31, 2020 and 2021 related to the audit of our consolidated and subsidiary financial statements and other audit services provided in connection with statutory and regulatory filings or engagements.
Audit Related Fees
Audit related fees for the years ended December 31, 2020 and 2021 related to services in connection with our IPO and interim review services provided in connection with statutory and regulatory filings or engagements.
Tax Fees
Tax fees for the years ended December 31, 2020 and 2021 related to tax compliance and tax planning services.
All Other Fees
All other fees in the years ended December 31, 2020 and 2021 related to services in connection with non-audit compliance and review work.
139
Pre-Approval Policies and Procedures
The advance approval of the Audit Committee or members thereof, to whom approval authority has been delegated, is required for all audit and non-audit services provided by our auditors.
All services provided by our auditors are approved in advance by either the Audit Committee or members thereof, to whom authority has been delegated, in accordance with the Audit Committee’s pre-approval policy.
Item 16D. Exemptions from the Listing Standards for Audit Committees
Not applicable.
Item 16E. Purchases of Equity Securities by the Issuer and Affiliated Purchasers
None.
Item 16F. Change in Registrant’s Certifying Accountant
None.
Item 16G. Corporate Governance
We are a “foreign private issuer” (as such term is defined in Rule 3b-4 under the Exchange Act), and our shares are listed on the NYSE. We believe the following to be the significant differences between our corporate governance practices and those applicable to U.S. companies under the NYSE listing standards.
Under the NYSE rules, NYSE listed companies that are foreign private issuers are permitted to follow home country practice in lieu of the corporate governance provisions specified by the NYSE with limited exceptions. The NYSE rules require that the quorum for any meeting of the holders of shares should be sufficiently high to ensure a representative vote and give careful consideration to provisions fixing any proportion less than a majority of the outstanding shares as the quorum for shareholders’ meetings. We follow the corporate governance practice of our home country, the Cayman Islands, which permits less than a majority of the outstanding shares as the quorum for shareholders’ meetings. The NYSE rules also require shareholder approval for equity compensation plans and material revisions to those plans. We follow the corporate governance practice of our home country, the Cayman Islands, which does not require shareholder approval for these matters.
We may in the future decide to use other foreign private issuer exemptions with respect to some or all of the other NYSE listing requirements. For example, under the NYSE rules, U.S. domestic listed, non-controlled companies are required to have a majority independent board, which is not required under the Companies Act of the Cayman Islands, our home country. NYSE rules also require U.S. domestic listed, non-controlled companies to have a compensation committee and a nominating and corporate governance committee, each composed entirely of independent directors, which are not required under our home country laws.
Following our home country governance practices may provide less protection than is given to investors under the NYSE listing requirements applicable to domestic issuers. For more information, see Item 3.D. “Risk Factors — Risks Relating to Ownership of our Ordinary Shares — We are a foreign private issuer and, as a result, we are not subject to U.S. proxy rules and are not subject to Exchange Act reporting obligations that, to some extent, are more lenient and less frequent than those of a U.S. domestic public company” and “Risk Factors — Risks Relating to Ownership of our Ordinary Shares — As we are a “foreign private issuer” and follow certain home country corporate governance practices, our shareholders may not have the same protections afforded to shareholders of companies that are subject to all NYSE corporate governance requirements.”
Item 16H. Mine Safety Disclosure
Not applicable.
140
Item 16I. Disclosure Regarding Foreign Jurisdictions that Prevent Inspections
Not applicable.
PART III
Item 17. Financial Statements
We have provided financial statements pursuant to Item 18.
Item 18. Financial Statements
The audited consolidated financial statements as required under Item 18 are attached hereto starting on page F-1 of this Annual Report. The audit report of PricewaterhouseCoopers LLP, an independent registered public accounting firm, is included herein preceding the audited consolidated financial statements.
Item 19. Exhibits
List all exhibits filed as part of the registration statement or annual report, including exhibits incorporated by reference.
Incorporation by Reference
Exhibit No. Description Form File No. Exhibit No. Filing Date Filed /
Furnished
1.1 Amended and Restated Memorandum and Articles of Association of the Registrant
F-1/A 333-259593 3.1 10/4/2021
2.1 Specimen Ordinary Share Certificate of the Registrant F-1/A 333-259593 4.1 10/4/2021 2.2 Registration Rights Agreement by and between IHS
Holding Limited and certain security holders of IHS Holding Limited
*
2.3 Shareholders’ Agreement by and between IHS Holding Limited and certain security holders of IHS Holding Limited
*
2.4 Indenture, dated as of September 18, 2019, among IHS Netherlands Holdco B.V., as issuer, IHS Netherlands NG1 B.V., IHS Netherlands NG2 B.V., IHS Nigeria Limited, IHS Towers NG Limited, Nigeria Tower Interco B.V., INT Towers Limited, as guarantors, and Citibank N.A. London Branch, as Trustee, Principal Paying Agent, Transfer Agent and Registrar
F-1/A 333-259593 4.4 10/4/2021
2.5 Supplemental Indenture, dated as of June 17, 2021, among IHS Netherlands Holdco B.V., as issuer IHS Holding Limited, IHS Netherlands NG1 B.V., IHS Netherlands NG2 B.V., IHS Nigeria Limited, IHS Towers NG Limited, Nigeria Tower Interco B.V., INT Towers Limited, as guarantors, and Citibank N.A. London Branch, as Trustee, Principal Paying Agent, Transfer Agent and Registrar.
F-1/A 333-259593 4.5 10/4/2021
2.6 Indenture, dated as of November 29, 2021, among IHS Holding Limited., as issuer, IHS Netherlands Holdco B.V., IHS Netherlands NG1 B.V., IHS Netherlands NG2 B.V., IHS Nigeria Limited, IHS Towers NG Limited, INT Towers Limited, Nigeria Tower Interco B.V., as guarantors, Lucid Trustee Services Limited, as Trustee, and Citibank N.A. London Branch, as Principal Paying Agent, Transfer Agent and Registrar
*
2.7 Description of Securities
*
4.1† Long Term Incentive Plan F-1/A 333-259593 10.1 10/4/2021
141
Incorporation by Reference
Exhibit No. Description Form File No. Exhibit No. Filing Date Filed /
Furnished
4.2† Form of 2021 Omnibus Incentive Plan F-1/A 333-259593 10.2 10/4/2021
4.3 Amended and Restated Revolving Credit Agreement, dated as of June 2, 2021, among IHS Holding Limited, as borrower, Citibank, N.A., London Branch as global coordinator, Citibank, N.A., London Branch, Absa Bank Limited (acting through its Corporate and Investment Banking division), Goldman Sachs Lending Partners LLC, JPMorgan Chase Bank, N.A., London Branch and Standard Chartered Bank Dubai International Financial Centre Branch, regulated by the Dubai Financial Services Authority, as mandated lead arrangers, Citibank Europe Plc, UK Branch, as facility agent, and the financial institutions listed therein as the original lenders
F-1/A 333-259593 10.3 10/4/2021
4.4 Amendment Letter to Amended and Restated Revolving Credit Agreement, dated as of September 29, 2021, among IHS Holding Limited, as borrower, Citibank, N.A., London Branch as global coordinator, Citibank, N.A., London Branch, Absa Bank Limited (acting through its Corporate and Investment Banking division), Goldman Sachs Lending Partners LLC, JPMorgan Chase Bank, N.A., London Branch and Standard Chartered Bank Dubai International Financial Centre Branch, regulated by the Dubai Financial Services Authority, as mandated lead arrangers, Citibank Europe Plc, UK Branch, as facility agent, and the financial institutions listed therein as the original lenders
F-1/A 333-259593 10.4 10/4/2021
4.5# Bridge Facility Agreement, dated August 10, 2021, among IHS Holding Limited, Goldman Sachs Lending Partners LLC, JPMorgan Chase Bank, N.A., London Branch and Standard Chartered Bank, as mandated lead arrangers, Standard Chartered Bank, as facility agent, and the financial institutions listed therein as the original lenders
F-1/A 333-259593 10.5 10/4/2021
4.6 Amendment Letter to Bridge Facility Agreement, dated September 29, 2021, among IHS Holding Limited, Goldman Sachs Lending Partners LLC, JPMorgan Chase Bank, N.A., London Branch and Standard Chartered Bank, as mandated lead arrangers, Standard Chartered Bank, as facility agent, and the financial institutions listed therein as the original lenders
F-1/A 333-259593 10.6 10/4/2021
4.7 Amendment and Restatement Credit Agreement, dated September 29, 2021, among IHS Netherlands Holdco B.V. as holdco and guarantor, and, IHS Nigeria, IHS Towers NG Limited and INT Towers as borrowers and guarantors, each of IHS Holding Limited, IHS Netherlands NG1 B.V., IHS Nigeria, IHS Netherlands NG2 B.V., IHS Towers NG Limited, Nigeria Tower Interco B.V. and INT Towers as guarantors, Absa Bank Limited (acting through its Corporate and Investment Banking division), Citibank, N.A., London Branch, Goldman Sachs Bank USA, J.P. Morgan Securities plc, FirstRand Bank Limited (London Branch) (acting through its Merchant Bank division) and Standard Chartered Bank, as mandated lead arrangers, Ecobank Nigeria Limited as agent and the financial institutions listed therein as the original lenders
F-1/A 333-259593 10.7 10/4/2021
8.1 List of Subsidiaries. * 12.1 Principal Executive Officer Certification Pursuant to
Section 302 of the Sarbanes-Oxley Act of 2002.
*
142
Incorporation by Reference
Exhibit No. Description Form File No. Exhibit No. Filing Date Filed /
Furnished
12.2 Principal Financial Officer Certification Pursuant to Section 302 of the Sarbanes-Oxley Act of 2002.
*
13.1 Principal Executive Officer Certification Pursuant to Section 906 of the Sarbanes-Oxley Act of 2002.
**
13.2 Principal Financial Officer Certification Pursuant to Section 906 of the Sarbanes-Oxley Act of 2002.
**
15.1 Consent of PricewaterhouseCoopers LLP, an independent registered public accounting firm.
*
101.INS Inline XBRL Instance Document. * 101.SCH Inline XBRL Taxonomy Extension Schema Document. * 101.CAL Inline XBRL Taxonomy Extension Calculation Linkbase
Document. *
101.DEF Inline XBRL Taxonomy Definition Linkbase Document. * 101.LAB Inline XBRL Taxonomy Extension Label Linkbase
Document. *
101.PRE Inline XBRL Taxonomy Extension Presentation Linkbase Document
*
104 Cover Page Interactive Data File (formatted as inline XBRL and contained in Exhibit 101).
* Filed herewith.
** Furnished herewith.
† Indicates management contract or compensatory plan or arrangement.
# Certain confidential portions (indicated by brackets and asterisks) have been omitted from this exhibit pursuant to Item 601(b)(10)(iv) of Regulation S-K.
Certain agreements filed as exhibits to this Annual Report contain representations and warranties that the parties thereto made to each other. These representations and warranties have been made solely for the benefit of the other parties to such agreements and may have been qualified by certain information that has been disclosed to the other parties to such agreements and that may not be reflected in such agreements. In addition, these representations and warranties may be intended as a way of allocating risks among parties if the statements contained therein prove to be incorrect, rather than as actual statements of fact. Accordingly, there can be no reliance on any such representations and warranties as characterizations of the actual state of facts. Moreover, information concerning the subject matter of any such representations and warranties may have changed since the date of such agreements.
143
SIGNATURES
The registrant hereby certifies that it meets all of the requirements for filing on Form 20-F and that it has duly caused and authorized the undersigned to sign this annual report on its behalf.
IHS HOLDING LIMITED Date: March 15, 2022 By: /s/ Sam Darwish Name: Sam Darwish Title: Chief Executive Officer By: /s/ Adam Walker Name: Adam Walker Title: Chief Financial Officer

F-1
INDEX TO CONSOLIDATED FINANCIAL STATEMENTS
Report of Independent Registered Public Accounting Firm (PCAOB ID: 876) F-2 Consolidated statements of income/(loss) and other comprehensive income F-5 Consolidated statements of financial position F-6 Consolidated statements of changes in equity F-7 Consolidated statements of cash flows F-8 Notes to consolidated financial statements F-9
F-2
Report of Independent Registered Public Accounting Firm
To the Board of Directors and Shareholders of IHS Holding Limited Opinion on the Financial Statements We have audited the accompanying consolidated statement of financial position of IHS Holding Limited and its subsidiaries (the “Company”) as of December 31, 2021 and 2020, and the related consolidated statements of loss and other comprehensive income, of changes in equity and of cash flows for each of the three years in the period ended December 31, 2021, including the related notes (collectively referred to as the “consolidated financial statements”). In our opinion, the consolidated financial statements present fairly, in all material respects, the financial position of the Company as of December 31, 2021 and 2020, and the results of its operations and its cash flows for each of the three years in the period ended December 31, 2021 in conformity with International Financial Reporting Standards as issued by the International Accounting Standards Board. Basis for Opinion These consolidated financial statements are the responsibility of the Company’s management. Our responsibility is to express an opinion on the Company’s consolidated financial statements based on our audits. We are a public accounting firm registered with the Public Company Accounting Oversight Board (United States) (PCAOB) and are required to be independent with respect to the Company in accordance with the U.S. federal securities laws and the applicable rules and regulations of the Securities and Exchange Commission and the PCAOB. We conducted our audits of these consolidated financial statements in accordance with the standards of the PCAOB. Those standards require that we plan and perform the audit to obtain reasonable assurance about whether the consolidated financial statements are free of material misstatement, whether due to error or fraud. Our audits included performing procedures to assess the risks of material misstatement of the consolidated financial statements, whether due to error or fraud, and performing procedures that respond to those risks. Such procedures included examining, on a test basis, evidence regarding the amounts and disclosures in the consolidated financial statements. Our audits also included evaluating the accounting principles used and significant estimates made by management, as well as evaluating the overall presentation of the consolidated financial statements. We believe that our audits provide a reasonable basis for our opinion. Critical Audit Matters The critical audit matters communicated below are matters arising from the current period audit of the consolidated financial statements that were communicated or required to be communicated to the audit committee and that (i) relate to accounts or disclosures that are material to the consolidated financial statements and (ii) involved our especially challenging, subjective, or complex judgments. The communication of critical audit matters does not alter in any way our opinion on the consolidated financial statements, taken as a whole, and we are not, by communicating the critical audit matters below, providing separate opinions on the critical audit matters or on the accounts or disclosures to which they relate.
F-3
Revenue Recognition As described in notes 2.5, and 6 to the consolidated financial statements, revenue is derived from fees paid by customers for services from the colocation business and its ancillary managed services. Total revenues for the year ended December 31, 2021 were US$1.6 billion and accrued revenue as of December 31, 2021 amounted to US$103.4 million. The Company determines the transaction price at contract inception. On initial recognition of revenue, the Company assesses the recoverability of revenue and recognises the revenue, in respect of satisfied performance obligations, which is expected to be recovered. Amounts not expected to be recovered at the point of initial recognition are considered to be variable consideration, contingent upon the receipt of funds from the customer, and are therefore subject to measurement constraints as such payments are not wholly within the control of the Company. The assessment of amounts expected to be recovered and, indirectly, the variable consideration component, are closely aligned with the assumed credit risk of the customer, determined as part of the assessment of expected credit losses made in accordance with the Company’s IFRS 9 expected credit loss policy. Under this policy, the Company assesses the credit risk of the customer to evaluate the customer’s capacity to meet its contractual cash flow obligations in the near term. The Company also recognises revenue in respect of services provided where billing is not completed, including in respect of tower sites coming into service, or changes in customer implemented technologies since the most recent invoicing cycle and in respect of services subject to ongoing negotiation regarding price or other contract interpretation disputes with customers. The Company assesses the expected outcome of such disputed matters in respect of satisfied performance obligations recognising revenue to the extent that customer acceptance and payment is expected. The principal considerations for our determination that performing procedures relating to revenue recognition is a critical audit matter are the significant judgement and estimation required by management in determining (i) the amount of variable consideration expected to be recovered and (ii) the expected outcome of negotiations with customers regarding unbilled and disputed amounts. This in turn led to a high degree of subjectivity, judgement and effort in performing procedures relating to management’s assessment of the amounts expected to be invoiced and recovered and significant assumptions related to credit risk of the customer. As disclosed by management, a material weakness existed related to this matter. Addressing the matter involved performing procedures and evaluating audit evidence in connection with forming our overall opinion on the consolidated financial statements. These procedures included, among others: (i) inspection of a sample of contracts to confirm the existence of the arrangements and evaluation of the treatment of any unusual terms; (ii) testing of the estimated value and timing of recognition of accrued revenue including in respect of the resolution of disputes with customers; (iii) testing the accuracy of underlying data used in the calculation of revenue for a sample of contracts; and (iv) evaluating variable consideration amounts assigned to those contracts at initial recognition based on management’s assessment of recoverability including evaluating whether the customer credit risk assumption used by management was reasonable. Goodwill Impairment Testing As described in notes 2.13, 3.4 and 15 to the consolidated financial statements, goodwill impairment reviews are undertaken annually or more frequently if events or changes in circumstances indicate a potential impairment. The aggregate carrying value of goodwill as of December 31, 2021 was US$869.5 million. The carrying value of the cash generating unit (CGU) or group of CGUs containing the goodwill is compared to the recoverable amount, which is the higher of its value in use and its fair value less costs of disposal. The recoverable amount of each of the CGUs other than the IHS Latam group of CGUs was determined based on their estimated value in use whereas the IHS Latam group of CGUs was determined based on fair value less costs of disposal. The key assumptions to which these recoverable amount calculations are most sensitive are:
• assumptions impacting forecast cash flows including tenancy rates and gross margins; • terminal growth rates; • discount rates; • monthly tower cash flows for the IHS Latam group of CGUs; • tower cash flow multiples relating to recent comparable transactions; and • estimated costs of disposal.
F-4
The principal considerations for our determination that performing procedures relating to goodwill impairment testing is a critical audit matter are (i) the significant judgement and estimation required by management in developing the recoverable amount estimates and (ii) the complexity of the related valuation models. This, in turn, led to a high degree of auditor judgement, subjectivity and effort in performing procedures and in evaluating management’s valuation calculations and significant assumptions related to forecast cash flows, terminal growth rates, discount rates, monthly tower cash flows, tower cash flow multiples and estimated costs of disposal. In addition, the audit effort involved the use of professionals with specialised skill and knowledge to assist in performing these procedures and evaluating the audit evidence obtained. Addressing the matter involved performing procedures and evaluating audit evidence in connection with forming our overall opinion on the consolidated financial statements. These procedures included, among others: (i) assessing management’s process for developing the recoverable amount estimate; (ii) evaluating the appropriateness of the value in use and fair value less costs of disposal calculations; (iii) testing the completeness, accuracy and relevance of underlying data used in the estimate; and (iv) evaluating significant assumptions used by management, including assumptions impacting forecast cash flows, terminal growth rates, discount rates, monthly tower cash flows, tower cash flow multiples and estimated costs of disposal. Evaluating significant assumptions used by management involved evaluating whether the assumptions used by management were reasonable considering: (i) the current and past performance of the relevant CGUs; (ii) the consistency with external market; and (iii) whether those assumptions were consistent with other evidence obtained in other areas of the audit. Professionals with specialised skill and knowledge were used to assist in the evaluation of the discount rate and terminal growth rate assumptions within management’s value in use models and the tower cash flow multiple assumption within management’s fair value less costs of disposal model. /s/ PricewaterhouseCoopers LLP London, United Kingdom March 15, 2022 We have served as the Company's auditor since 2017.
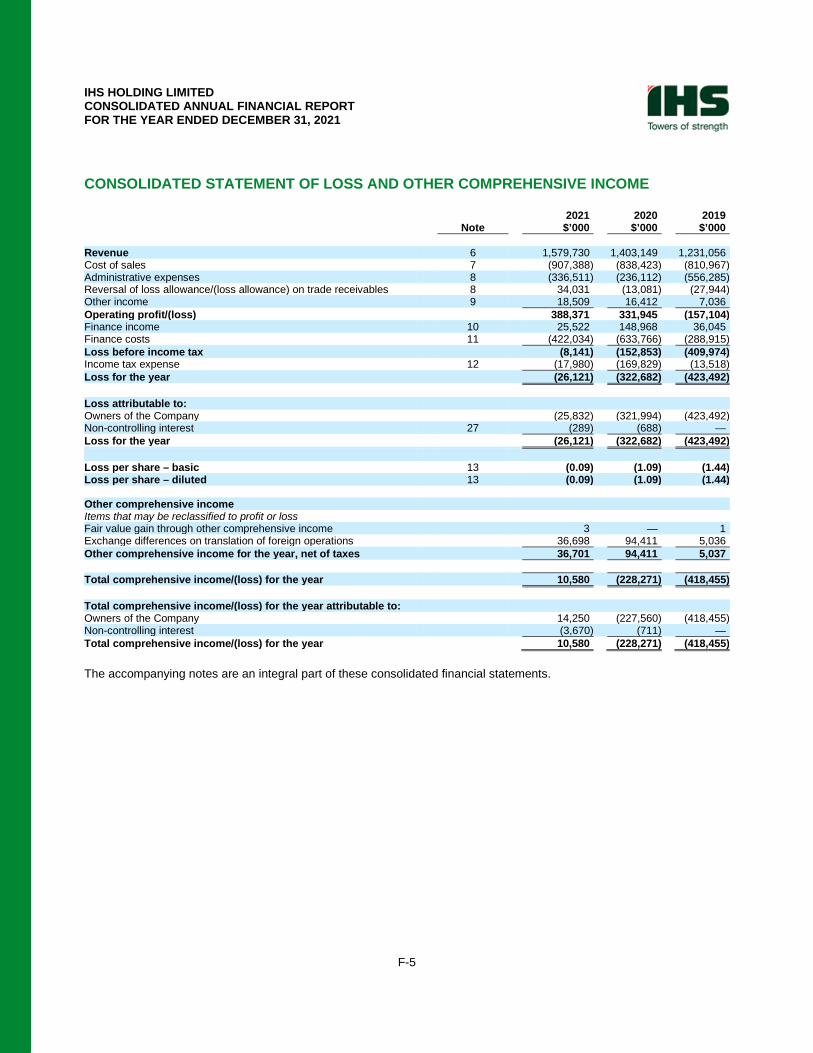
IHS HOLDING LIMITED CONSOLIDATED ANNUAL FINANCIAL REPORT FOR THE YEAR ENDED DECEMBER 31, 2021
F-5
CONSOLIDATED STATEMENT OF LOSS AND OTHER COMPREHENSIVE INCOME
2021 2020 2019 Note $’000 $’000 $’000 Revenue 6 1,579,730 1,403,149 1,231,056 Cost of sales 7 (907,388) (838,423) (810,967) Administrative expenses 8 (336,511) (236,112) (556,285) Reversal of loss allowance/(loss allowance) on trade receivables 8 34,031 (13,081) (27,944) Other income 9 18,509 16,412 7,036 Operating profit/(loss) 388,371 331,945 (157,104) Finance income 10 25,522 148,968 36,045 Finance costs 11 (422,034) (633,766) (288,915) Loss before income tax (8,141) (152,853) (409,974) Income tax expense 12 (17,980) (169,829) (13,518) Loss for the year (26,121) (322,682) (423,492) Loss attributable to: Owners of the Company (25,832) (321,994) (423,492) Non-controlling interest 27 (289) (688) — Loss for the year (26,121) (322,682) (423,492) Loss per share – basic 13 (0.09) (1.09) (1.44) Loss per share – diluted 13 (0.09) (1.09) (1.44) Other comprehensive income Items that may be reclassified to profit or loss Fair value gain through other comprehensive income 3 — 1 Exchange differences on translation of foreign operations 36,698 94,411 5,036 Other comprehensive income for the year, net of taxes 36,701 94,411 5,037 Total comprehensive income/(loss) for the year 10,580 (228,271) (418,455) Total comprehensive income/(loss) for the year attributable to: Owners of the Company 14,250 (227,560) (418,455) Non-controlling interest (3,670) (711) — Total comprehensive income/(loss) for the year 10,580 (228,271) (418,455) The accompanying notes are an integral part of these consolidated financial statements.
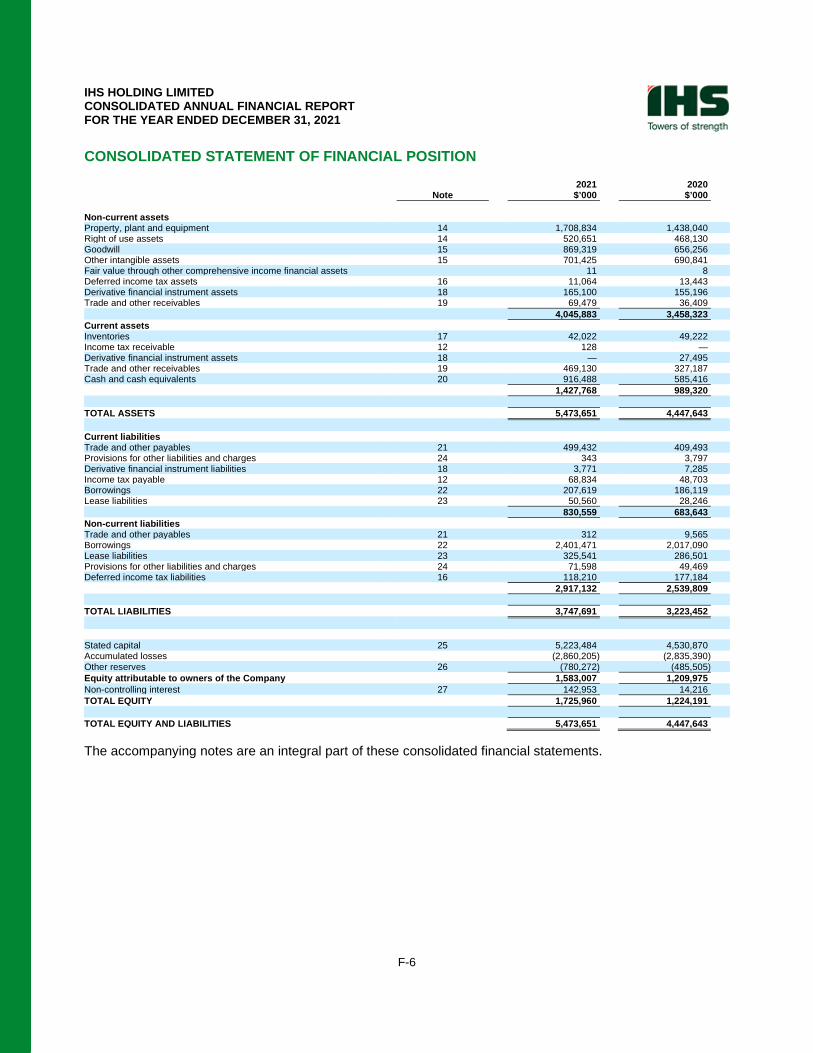
IHS HOLDING LIMITED CONSOLIDATED ANNUAL FINANCIAL REPORT FOR THE YEAR ENDED DECEMBER 31, 2021
F-6
CONSOLIDATED STATEMENT OF FINANCIAL POSITION
2021 2020 Note $’000 $’000 Non-current assets Property, plant and equipment 14 1,708,834 1,438,040 Right of use assets 14 520,651 468,130 Goodwill 15 869,319 656,256 Other intangible assets 15 701,425 690,841 Fair value through other comprehensive income financial assets 11 8 Deferred income tax assets 16 11,064 13,443 Derivative financial instrument assets 18 165,100 155,196 Trade and other receivables 19 69,479 36,409 4,045,883 3,458,323 Current assets Inventories 17 42,022 49,222 Income tax receivable 12 128 — Derivative financial instrument assets 18 — 27,495 Trade and other receivables 19 469,130 327,187 Cash and cash equivalents 20 916,488 585,416 1,427,768 989,320 TOTAL ASSETS 5,473,651 4,447,643 Current liabilities Trade and other payables 21 499,432 409,493 Provisions for other liabilities and charges 24 343 3,797 Derivative financial instrument liabilities 18 3,771 7,285 Income tax payable 12 68,834 48,703 Borrowings 22 207,619 186,119 Lease liabilities 23 50,560 28,246 830,559 683,643 Non-current liabilities Trade and other payables 21 312 9,565 Borrowings 22 2,401,471 2,017,090 Lease liabilities 23 325,541 286,501 Provisions for other liabilities and charges 24 71,598 49,469 Deferred income tax liabilities 16 118,210 177,184 2,917,132 2,539,809 TOTAL LIABILITIES 3,747,691 3,223,452 Stated capital 25 5,223,484 4,530,870 Accumulated losses (2,860,205) (2,835,390) Other reserves 26 (780,272) (485,505) Equity attributable to owners of the Company 1,583,007 1,209,975 Non-controlling interest 27 142,953 14,216 TOTAL EQUITY 1,725,960 1,224,191 TOTAL EQUITY AND LIABILITIES 5,473,651 4,447,643 The accompanying notes are an integral part of these consolidated financial statements.
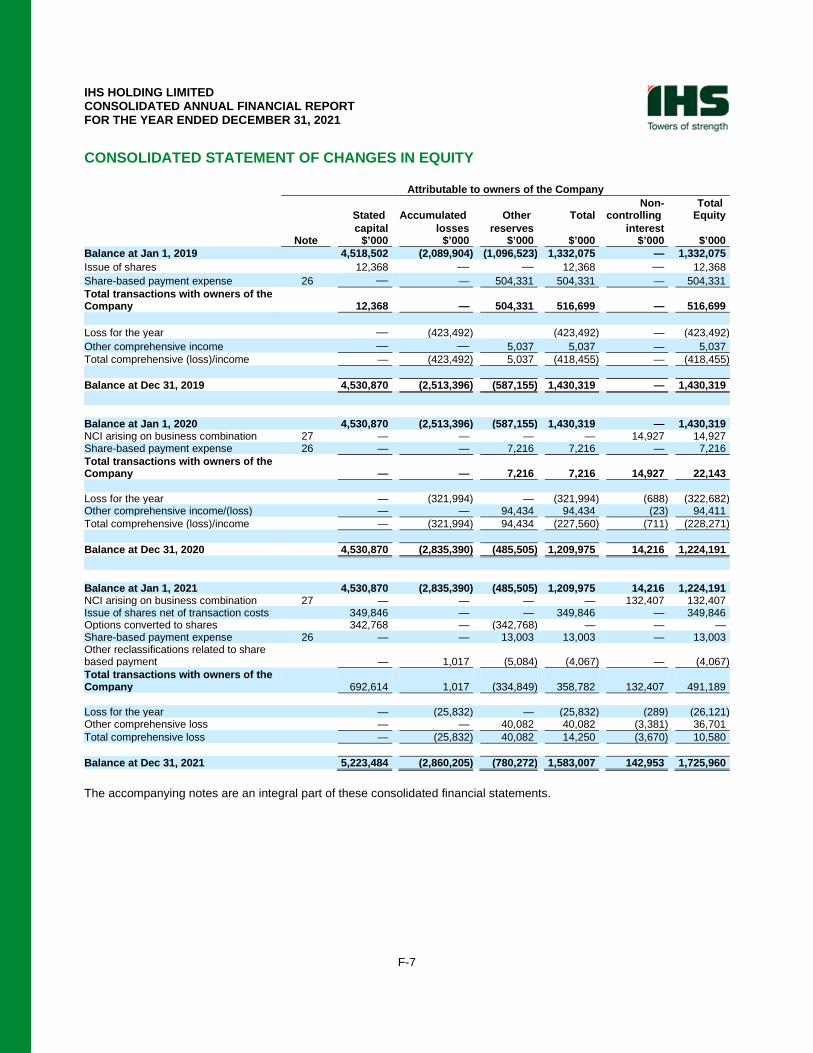
IHS HOLDING LIMITED CONSOLIDATED ANNUAL FINANCIAL REPORT FOR THE YEAR ENDED DECEMBER 31, 2021
F-7
CONSOLIDATED STATEMENT OF CHANGES IN EQUITY
Attributable to owners of the Company Non- Total Stated Accumulated Other Total controlling Equity capital losses reserves interest Note $’000 $’000 $’000 $’000 $’000 $’000 Balance at Jan 1, 2019 4,518,502 (2,089,904) (1,096,523) 1,332,075 — 1,332,075 Issue of shares 12,368 — — 12,368 — 12,368 Share-based payment expense 26 — — 504,331 504,331 — 504,331 Total transactions with owners of the Company 12,368 — 504,331 516,699 — 516,699 Loss for the year — (423,492) (423,492) — (423,492) Other comprehensive income — — 5,037 5,037 — 5,037 Total comprehensive (loss)/income — (423,492) 5,037 (418,455) — (418,455) Balance at Dec 31, 2019 4,530,870 (2,513,396) (587,155) 1,430,319 — 1,430,319 Balance at Jan 1, 2020 4,530,870 (2,513,396) (587,155) 1,430,319 — 1,430,319 NCI arising on business combination 27 — — — — 14,927 14,927 Share-based payment expense 26 — — 7,216 7,216 — 7,216 Total transactions with owners of the Company — — 7,216 7,216 14,927 22,143 Loss for the year — (321,994) — (321,994) (688) (322,682) Other comprehensive income/(loss) — — 94,434 94,434 (23) 94,411 Total comprehensive (loss)/income — (321,994) 94,434 (227,560) (711) (228,271) Balance at Dec 31, 2020 4,530,870 (2,835,390) (485,505) 1,209,975 14,216 1,224,191 Balance at Jan 1, 2021 4,530,870 (2,835,390) (485,505) 1,209,975 14,216 1,224,191 NCI arising on business combination 27 — — — — 132,407 132,407 Issue of shares net of transaction costs 349,846 — — 349,846 — 349,846 Options converted to shares 342,768 — (342,768) — — — Share-based payment expense 26 — — 13,003 13,003 — 13,003 Other reclassifications related to share based payment — 1,017 (5,084) (4,067) — (4,067) Total transactions with owners of the Company 692,614 1,017 (334,849) 358,782 132,407 491,189 Loss for the year — (25,832) — (25,832) (289) (26,121) Other comprehensive loss — — 40,082 40,082 (3,381) 36,701 Total comprehensive loss — (25,832) 40,082 14,250 (3,670) 10,580 Balance at Dec 31, 2021 5,223,484 (2,860,205) (780,272) 1,583,007 142,953 1,725,960 The accompanying notes are an integral part of these consolidated financial statements.
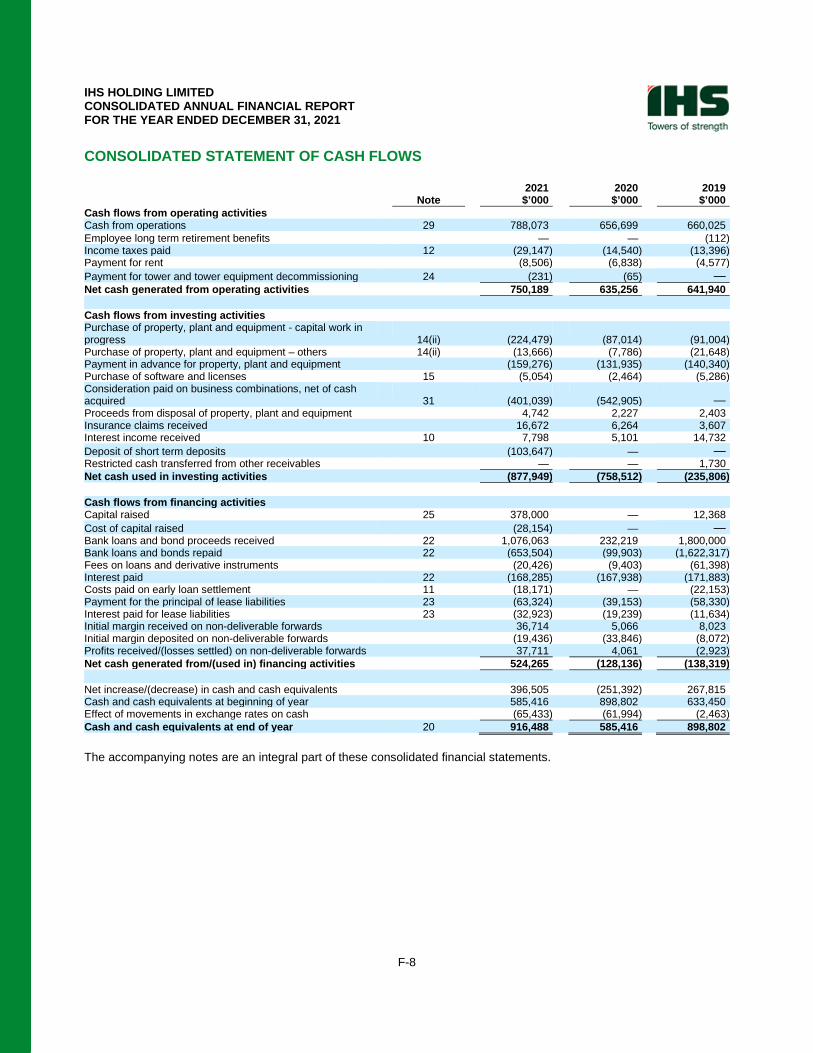
IHS HOLDING LIMITED CONSOLIDATED ANNUAL FINANCIAL REPORT FOR THE YEAR ENDED DECEMBER 31, 2021
F-8
CONSOLIDATED STATEMENT OF CASH FLOWS
2021 2020 2019 Note $’000 $’000 $’000 Cash flows from operating activities Cash from operations 29 788,073 656,699 660,025 Employee long term retirement benefits — — (112) Income taxes paid 12 (29,147) (14,540) (13,396) Payment for rent (8,506) (6,838) (4,577) Payment for tower and tower equipment decommissioning 24 (231) (65) — Net cash generated from operating activities 750,189 635,256 641,940 Cash flows from investing activities Purchase of property, plant and equipment - capital work in progress 14(ii) (224,479) (87,014) (91,004) Purchase of property, plant and equipment – others 14(ii) (13,666) (7,786) (21,648) Payment in advance for property, plant and equipment (159,276) (131,935) (140,340) Purchase of software and licenses 15 (5,054) (2,464) (5,286) Consideration paid on business combinations, net of cash acquired 31 (401,039) (542,905) — Proceeds from disposal of property, plant and equipment 4,742 2,227 2,403 Insurance claims received 16,672 6,264 3,607 Interest income received 10 7,798 5,101 14,732 Deposit of short term deposits (103,647) — — Restricted cash transferred from other receivables — — 1,730 Net cash used in investing activities (877,949) (758,512) (235,806) Cash flows from financing activities Capital raised 25 378,000 — 12,368 Cost of capital raised (28,154) — — Bank loans and bond proceeds received 22 1,076,063 232,219 1,800,000 Bank loans and bonds repaid 22 (653,504) (99,903) (1,622,317) Fees on loans and derivative instruments (20,426) (9,403) (61,398) Interest paid 22 (168,285) (167,938) (171,883) Costs paid on early loan settlement 11 (18,171) — (22,153) Payment for the principal of lease liabilities 23 (63,324) (39,153) (58,330) Interest paid for lease liabilities 23 (32,923) (19,239) (11,634) Initial margin received on non-deliverable forwards 36,714 5,066 8,023 Initial margin deposited on non-deliverable forwards (19,436) (33,846) (8,072) Profits received/(losses settled) on non-deliverable forwards 37,711 4,061 (2,923) Net cash generated from/(used in) financing activities 524,265 (128,136) (138,319) Net increase/(decrease) in cash and cash equivalents 396,505 (251,392) 267,815 Cash and cash equivalents at beginning of year 585,416 898,802 633,450 Effect of movements in exchange rates on cash (65,433) (61,994) (2,463) Cash and cash equivalents at end of year 20 916,488 585,416 898,802 The accompanying notes are an integral part of these consolidated financial statements.
IHS HOLDING LIMITED CONSOLIDATED ANNUAL FINANCIAL REPORT FOR THE YEAR ENDED DECEMBER 31, 2021
F-9
NOTES TO THE CONSOLIDATED FINANCIAL STATEMENTS
1. General information
These consolidated financial statements are the financial statements of IHS Holding Limited (‘the Company’) and its subsidiaries (together hereafter referred to as ‘the Group’ or ‘IHS’). IHS Holding Limited is incorporated in the Cayman Islands under the Companies Act (as amended) as a limited liability company. The Company is domiciled in the Cayman Islands and the address of its registered office is 190 Elgin Avenue, George Town, Grand Cayman KY1-9008, Cayman Islands.
IHS is principally involved in providing infrastructure for the telecommunications industry. The consolidated financial statements are presented in US Dollars ($) and all values are rounded to the nearest thousands, except where otherwise indicated.
These consolidated financial statements have been authorized for issue on March 15, 2022 by the Board of Directors.
2. Summary of significant accounting policies
The principal accounting policies applied in the preparation of these financial statements are set out below. These policies have been consistently applied to all the periods presented, unless otherwise stated.
2.1 Basis of preparation
The consolidated financial statements of IHS have been prepared in accordance with International Financial Reporting Standards (IFRS) as issued by the International Accounting Standards Board (IASB).
The consolidated financial statements have been prepared under the historical cost convention, as modified by financial assets and liabilities (including derivative financial instruments) which are recognized at fair value.
2.1.1 Changes in accounting policies and disclosures
(a) New standards, amendments and interpretations adopted by the Group
The Group has applied the following standards and amendments for the first time for its annual reporting period commencing January 1, 2021:
• Interest Rate Benchmark Reform – Phase 2 (Amendments to IFRS 9, IAS 39 and IFRS 7)
• Annual Improvements to IFRS Standards 2018-2020 Cycle
The amendments to standards listed above did not have any material impact on the Group’s financial statements.
(b) New standards, amendments and interpretations not yet adopted by the Group
Certain new accounting standards, interpretations and amendments have been published that are not effective for December 31, 2021 reporting period and have not been early adopted by the Group. They are:
• Annual Improvements to IFRS Standards 2018–2020 (subsidiary as a first-time adopter) (Amendment to IFRS 1)
• Reference to the Conceptual Framework (Amendment to IFRS 3)
• IFRS Standards 2018–2020 (fees in the ‘10 per cent’ test for derecognition of financial liabilities) (Amendment to IFRS 9)
IHS HOLDING LIMITED CONSOLIDATED ANNUAL FINANCIAL REPORT FOR THE YEAR ENDED DECEMBER 31, 2021
F-10
• Classification of liabilities (Amendment to IAS 1)
• Defer the effective date of the January 2020 amendments (Amendment to IAS 1)
• Disclosure of accounting policies (Amendment to IAS 1)
• Deferred tax on leases and decommissioning obligations (Amendment to IAS 12)
• Prohibiting a company from deducting from the cost of property, plant and equipment amounts received from selling items produced while the company is preparing the asset for its intended use (Amendment to IAS 16)
• Costs which should be included in the cost of fulfilling a contract when determining whether a contract is onerous (Amendment to IAS 37)
None of the above amendments to standards are expected to have a material effect on the Group’s financial statements.
2.2. Consolidation
(a) Subsidiaries
The consolidated financial statements include the financial information and results of the Company and those entities in which it has a controlling interest. The Group controls an entity when the Group is exposed to, or has rights to, variable returns from its involvement with the entity and has the ability to affect those returns through its power over the entity. Subsidiaries are all entities (including structured entities) over which the Group has control. Subsidiaries are fully consolidated from the date on which control is transferred to the Group. They are deconsolidated from the date the control ceases. All intercompany balances and transactions have been eliminated.
(b) Business Combinations
For acquisitions that meet the definition of a business combination, the Group applies the acquisition method of accounting where assets acquired and liabilities assumed are recorded at fair value at the date of each acquisition, and the results of operations are included with those of the Group from the dates of the respective acquisitions. Any excess of the purchase price paid by the Group over the amounts recognized for assets acquired and liabilities assumed is recorded as goodwill and any acquisition related costs are expensed as incurred. The Group recognizes any non-controlling interest in the acquiree either at fair value or at the non-controlling interest’s proportionate share of the recognized amounts of acquiree’s identifiable net assets.
The consideration transferred for the acquisition comprises the fair value of the assets transferred, liabilities incurred, equity interests issued by the Group and any contingent consideration. Where settlement of any part of cash consideration is deferred, the amounts payable in the future are discounted to their present value as at the date of exchange. The discount rate used is the entity’s incremental borrowing rate, being the rate at which a similar borrowing could be obtained from an independent financier under comparable terms and conditions.
If the Group gains control in a business combination in stages, the acquisition date carrying value of the acquirer’s previously held equity interest in the acquiree is remeasured to fair value at the acquisition date; any gains or losses arising from such remeasurement are recognized in profit or loss.
The Group has considered whether any of its business combinations represent a sale and leaseback transaction from a lessor perspective. It has been determined that since the space on towers and associated assets are able to be leased to multiple tenants without restriction, that no such arrangement of the entire tower site portfolio acquired exists.
IHS HOLDING LIMITED CONSOLIDATED ANNUAL FINANCIAL REPORT FOR THE YEAR ENDED DECEMBER 31, 2021
F-11
(c) Transactions with non-controlling interests
The Group treats transactions with non-controlling interests as transactions with equity owners of the Company. A change in ownership interest results in an adjustment between the carrying amounts of the controlling and non-controlling interests to reflect their relative interests in the subsidiary. Any difference between the amount of the adjustment to non-controlling interests and any consideration paid or received is recognized in a separate reserve within equity attributable to owners of the Company.
2.3 Segment reporting
Operating segments are components of IHS’s business activities about which separate financial information is available and reported internally to the chief operating decision maker. The Group’s Executive Committee has been identified as the chief operating decision maker, responsible for allocating resources and assessing performance of the operating segments.
The Group’s Executive Committee consists of: the Chief Executive Officer (“CEO”), the Chief Operating Officer (“COO”), the Chief Financial Officer (“CFO”), the General Counsel, both Deputy CFOs, the IHS Nigeria CEO, and the Chief Human Resource Officer.
Latam and MENA are operating segments effective from February 2020 following the acquisition of IHS Brasil Cessão de Infraestruturas S.A. and IHS Kuwait Limited (refer to note 31). This reflects the way the Company’s chief operating decision maker (‘‘CODM’’) is provided with financial information which aligns to internal regional management organizational reporting lines and responsibilities. All reporting to the CODM analyzes performance in this way and resources are allocated on this basis.
2.4 Foreign currency translation
(a) Functional and presentation currency
Items included in the financial statements of each of the Group’s entities are measured using the currency of the primary economic environment in which the entity operates (the “functional currency”). The consolidated financial statements are presented in US Dollars.
(b) Existence of multiple official exchange rates
During the year ended December 31, 2017, the Central Bank of Nigeria introduced a new foreign exchange window, which includes the NAFEX (Nigerian Autonomous Foreign Exchange Fixing). This resulted in a situation where there are several different official exchange rates in the market, thereby requiring the Company to monitor and evaluate which exchange rate is most appropriate to apply in translating foreign currency transactions in its Nigeria businesses and in translating Naira amounts for Group reporting purposes.
Where multiple official exchange rates exist, the Group assesses the appropriate rate to use and takes into account relevant factors. In the case of translating foreign operations or foreign transactions, such factors include access to those rates in the future to meet payments or dividends. In determining whether it is appropriate to move from one official rate to another, the Group considers the available rates in official markets for settlement of transactions. Refer to note 3 for further information.
(c) Transactions and balances
Foreign currency transactions are translated into the functional currency using the exchange rates prevailing at the dates of the transactions or valuation where items are remeasured. Foreign exchange gains and losses resulting from the settlement of such transactions and from the translation at year end exchange rates of monetary assets and liabilities denominated in foreign currencies are recognized in profit or loss. Foreign exchange gains and losses that relate to borrowings and cash and cash equivalents are presented in the statement of income and other comprehensive income within “finance income” or “finance cost.” Foreign exchange gains and losses that relate to other monetary items are
IHS HOLDING LIMITED CONSOLIDATED ANNUAL FINANCIAL REPORT FOR THE YEAR ENDED DECEMBER 31, 2021
F-12
presented in the statement of income and other comprehensive income within “cost of sales,” “administrative expense” and “other income” as appropriate.
Non-monetary items that are measured at fair value in a foreign currency are translated using the exchange rates at the date when the fair value was determined. Translation differences on assets and liabilities carried at fair value are reported as part of the fair value gain or loss. For example, translation differences on non-monetary assets and liabilities such as equities designated as fair value through other comprehensive income are recognized in other comprehensive income.
The subsidiaries based in Nigeria translated their foreign currency transactions into the functional currency, Nigerian Naira, at the Nigerian Autonomous Foreign Exchange Fixing (“NAFEX”) prevailing rate at the date of the transaction. Monetary items and liabilities denominated in foreign currencies were also translated at the NAFEX rate.
The NAFEX rate was between 394.13 and 435.00 during 2021 (2020: 363.2 and 410.25, 2019: 360.4 and 364.7) and at December 31, 2021 was 435.00 (December 31, 2020: 410.25, December 31, 2019: 364.7). Both years experienced a spike in the month of December of that year, with the average rate for December 2021 being 415.6 (2020: 394.3). Refer to note 3 for further information on foreign exchange rate assessment.
The results and financial position of all the Group entities (none of which has the currency of a hyper inflationary economy) that have a functional currency different from the presentation currency are translated into the presentation currency as follows:
• assets and liabilities for each statement of financial position presented are translated at the closing rate at the date of that statement of financial position,
• income and expenses for each statement of income and other comprehensive income are translated at the monthly average exchange rates (unless this average is not a reasonable approximation of the cumulative effect of the rates prevailing on the transaction dates, in which case income and expenses are translated at the rate on the dates of the transactions), and
• all resulting exchange differences are recognized in other comprehensive income.
On consolidation, exchange differences arising from the translation of the net investment in foreign operations and of borrowings are taken to other comprehensive income.
Goodwill and fair value adjustments arising on the acquisition of a foreign entity are treated as assets and liabilities of the foreign entity and translated at the closing rate. Exchange differences arising are recognized in other comprehensive income.
The results of the subsidiaries based in Nigeria were translated into US Dollars at the NAFEX monthly average exchange rate for income and expenses and the assets and liabilities at the NAFEX closing rate at the date of the statement of financial position with rates as noted above. Refer to note 3 for further information.
2.5 Revenue recognition
Our revenue is derived from fees paid by our customers for services from our colocation business and its ancillary managed services.
The colocation business involves the lease of space on IHS owned and leased towers, which are shared by various operators and data service providers. Revenue is generated on towers either from anchor tenants (original tenants on towers) or colocation tenants (subsequent tenants) when they install equipment on towers. A portion of colocation arrangements for the rental of space on the towers and other assets on tower sites, on which the use of space is dependent, is within the scope of IFRS 16 Leases. A portion of colocation arrangements for the provision of services and energy charges is within the scope of IFRS 15 ‘Revenue from contracts with customers’ as a provision of service. The Group also offers
IHS HOLDING LIMITED CONSOLIDATED ANNUAL FINANCIAL REPORT FOR THE YEAR ENDED DECEMBER 31, 2021
F-13
ancillary services to manage tenant operations of existing customers on a limited basis. Revenue from such managed services is within the scope of IFRS 15 ‘Revenue from contracts with customers’.
In determining the amounts of colocation revenue from our contracts with customers that fall within the scope of IFRS 15 or IFRS 16, the Group considers whether there are separate performance obligations to which a portion of the transaction price needs to be allocated and revenue recognized separately.
For colocation services the Group determines the transaction price (including lease and non-lease elements) at contract inception and considers the effects of:
• Variable consideration - The contractual price may be subject to service credits, price indexation, discounts provided on site consolidation and discounts associated with site occupancy. All of these items of variable consideration are considered to relate to individual service periods of series performance obligations, or represent contingent rentals, and are therefore recognized in the future periods in which they arise rather than when estimating the transaction price at contract inception.
• The existence of significant financing components - Financing components are not expected to be significant as services and payments are generally in line over the period of the contract.
• Consideration payable to the customer (if any) - Payments to customers (such as rebates and discounts refunded to the customer and payments for exit fees) are deducted from transaction price unless they are payments for a distinct good or service supplied to the Group in return for the payments.
At the date of contract inception, the Group determines the stand-alone selling prices of the performance obligations (including the lease elements of the contract) using a combination of data on observable prices from comparable managed service arrangements, supplemented by the cost plus a margin approach. The Group allocates the transaction price to these non-lease elements of the contract and between performance obligations within the non-lease element of the contract on the basis of relative stand-alone selling price.
Revenue is typically invoiced quarterly in advance except where a deferral of invoicing has been agreed with a customer such as where there is an ongoing dispute over pricing in which case revenue is accrued on the basis of the expected outcome for performance obligations satisfied in the period. Customer contracts typically require payment within 30 to 60 days.
(a) Colocation services revenue (non-lease)
For non-lease revenue, two separate performance obligations have typically been identified, one in respect of the operation of tower infrastructure and one in respect of the provision of maintenance services and power, with each being a series of performance obligations to stand ready to deliver the required services.
The identification of these two performance obligations does not change the timing of revenue recognition of the non-lease component as both are typically satisfied over the same time period. In limited cases, contracts may provide the customer with a right to purchase additional services at a significant discount. In these cases, the material right is also identified as a performance obligation.
On initial recognition of revenue, the Group assesses the recoverability of revenue and recognizes the revenue, in respect of satisfied performance obligations, which is expected to be recovered. Amounts not expected to be recovered at the point of initial recognition are considered to be variable consideration, contingent upon the receipt of funds from the customer and are therefore subject to measurement constraints as such payments are not wholly within the control of the Group. The assessment of amounts expected to be recovered, and indirectly the variable consideration component, are closely aligned with the assumed credit risk of the customer, determined as part of the assessment of expected credit losses made in accordance with the Group’s IFRS 9 expected credit loss policy as described in note 2.17.4.
IHS HOLDING LIMITED CONSOLIDATED ANNUAL FINANCIAL REPORT FOR THE YEAR ENDED DECEMBER 31, 2021
F-14
(b) Colocation services revenue for which the Group is a lessor
The portion of colocation revenue, for which IHS is the lessor, is treated as a lease. Revenue from these operating lease arrangements, including fixed escalation clauses present in non-cancellable lease agreements is recognized on a straight line basis over the current lease term of the related lease agreements, when collectability is reasonably assured. The duration of these lease arrangements is typically between 5 and 10 years. Escalation clauses tied to the Consumer Price Index (“CPI”) or other inflation based indices, are excluded from the straight line calculation, however, any fixed increases are included.
Revenue is recognized in the accounting period in which the rental income is earned and services are rendered. Amounts billed or received for services prior to being earned are deferred and reflected in deferred revenue until the criteria for recognition have been met.
(c) Managed services revenue
Revenue from managed services contracts with customers is recognized when control of the services is transferred to the customer at an amount that reflects the consideration to which the Group expects to be entitled in exchange for those services.
Revenue is recognized in the accounting period in which the services are rendered by reference to the stage of completion based on the terms of each contract. Services revenues are derived under contracts or arrangements with customers that provide for billings either on a fixed price basis or a variable price basis, which includes factors such as time and expenses. Revenues are recognized as services are performed. Amounts billed or received for services prior to being earned are deferred and reflected in deferred revenue in the accompanying statement of financial position until the criteria for recognition have been met.
2.6 Embedded derivatives in revenue contracts
Certain revenue contracts and subsequent amendments include fees that are priced in $ but are invoiced and settled in the relevant local currency of the operation using foreign exchange rates calculated in accordance with the contractual terms.
Where the contractual foreign exchange rates are reset at regular intervals in arrears, management evaluates and determines at the date of inception, or at the date of material modification, of the contracts whether the reset features are closely related to the host contracts or not.
In making the evaluation, management assessed that the $ is a commonly used currency in the local operation, and that the reset interval was sufficiently frequent to approximate the local currency spot exchange rate given economic conditions at that time. Management also considers whether, at the time of inception or material modification, contract rates reference a liquid market exchange rate. If reference rates are assessed as liquid the embedded derivative is assessed as closely related and no accounting bifurcation is made.
Where such fees that are priced in $ are translated to local currency at the time of billing using a fixed, pre-determined exchange rate or an exchange rate which is not referenced to a liquid market exchange rate, this results in an embedded derivative which is not closely related to the host contract and is thus bifurcated, fair valued and disclosed separately. The fair values of these embedded derivatives are determined by reference to the discounted forecast billings under the contractual rates compared to those under the forecast liquid market rates.
Upon initial recognition of the revenue embedded derivative asset or liability, the Group recognizes a contract liability or asset, respectively. The contract liability or asset is released to revenue over the shorter of the term of the contract or the term over which the conditions that result in the embedded derivative expire. The release to revenue is recognized on the same basis that those contractual conditions materialize, to match the release of the contract liability or asset to the recognition of revenue from the underlying contract.
IHS HOLDING LIMITED CONSOLIDATED ANNUAL FINANCIAL REPORT FOR THE YEAR ENDED DECEMBER 31, 2021
F-15
2.7 Leases
The Group is a lessee of various assets, comprising land and building, towers, equipment and motor vehicles. The determination whether an arrangement is, or contains, a lease is based on whether the contract conveys a right to control the use of an identified asset for a period of time in exchange for consideration.
The following sets out the Group’s lease accounting policy for all leases with the exception of leases with low-value (i.e. < $5,000) and short term of less than 12 months for which the Group has taken the exemption under the standard and are expensed to profit or loss as incurred.
(a) Lease assets
The Group recognizes right of use assets at the commencement date of the lease (i.e., the date the underlying asset is available for use under the contract). Right of use assets are measured at cost, less any accumulated depreciation and impairment losses, and adjusted for any remeasurement of lease liabilities. The cost of right of use assets includes the amount of lease liabilities recognized, initial direct costs incurred, and lease payments made at or before the commencement date (which do not form part of the lease liability value at the commencement date). Right of use assets are depreciated on a straight-line basis over the shorter of their estimated useful life and the lease term.
The right-of-use assets are tested for impairment in accordance with IAS 36 “Impairment of Assets”.
(b) Lease liabilities
At the commencement date of the lease, the Group recognizes lease liabilities measured at the present value of all remaining lease payments to be made over the lease term. The lease payments include fixed payments (including in-substance fixed payments where the contracts specify fixed or minimum uplifts) and variable lease payments that depend on an index or a rate.
The variable lease payments that do not depend on an index or a rate are recognized as an expense in the period in which the event or condition that triggers the payment occurs.
Due to the nature of our leased assets the interest rate implicit in the lease is usually not readily determinable, the Group therefore uses the incremental borrowing rate in calculating the present value of lease payments at the lease commencement date. The incremental borrowing rate is calculated using a series of inputs, including: a local currency cost of debt for each country based on local borrowing (or where not available, an inflation adjusted US$ cost of debt which encompasses the country specific adjustment), an adjustment for the duration of the referenced borrowings to arrive at an interest rate for a one-year facility, and an adjustment for the lease term based on local government, US or Eurozone bond yields, as appropriate in the context of each country’s debt markets.
The finance cost is charged to profit or loss over the lease period so as to produce a constant periodic rate of interest on the remaining balance of the liability for each period. In addition, the carrying amount of lease liabilities is remeasured if there is a modification, a change in the lease term or a change in the in-substance fixed lease payments.
The Group determines the lease term as the non-cancellable term of the lease, together with any periods covered by an option to extend the lease if it is reasonably certain to be exercised and any periods covered by an option to terminate the lease, if it is reasonably certain that the termination options will not to be exercised.
The Group has the option under some of its leases to lease the assets for additional periods of up to 10 years. The Group applies judgement in evaluating whether it has a unilateral option to renew the lease for a further period and is reasonably certain to exercise the option to renew (note 3). That is, it considers all relevant factors that create an economic incentive for it to exercise the renewal. After the commencement date, the Group reassesses the lease term if there is a significant event or change in circumstances that is within its control and affects its ability to exercise (or not to exercise) the option to renew.
IHS HOLDING LIMITED CONSOLIDATED ANNUAL FINANCIAL REPORT FOR THE YEAR ENDED DECEMBER 31, 2021
F-16
2.8 Cost of sales
Cost of sales is mainly comprised of power generation costs, depreciation, tower repairs and maintenance costs, operational staff and costs, site rental costs.
2.9 Administrative expenses
Administrative expenses are costs not directly related to provision of services to customers, but which support our business as a whole. These overhead expenses primarily consist of administrative staff costs (including key management compensation), office rent and related property expenses, insurance, travel costs, professional fees, depreciation and amortization of administrative assets, net (gain)/loss on disposal of property, plant and equipment and other sundry costs.
Administrative expenses also includes other corporate overhead expenses related to the Group’s acquisition efforts and costs associated with new business initiatives.
2.10 Other income
Other income includes proceeds from insurance claims and the remeasurement of contingent consideration arising from acquisitions.
2.11 Interest income
Interest income is recognized in profit or loss and is calculated using the effective interest method as set out in IFRS 9.
2.12 Property, plant and equipment
These are mainly towers and towers equipment, fiber telecommunications network cables and equipment, land and buildings, furniture and office equipment, motor vehicles and capital work in progress that are used directly by the Group in the provision of services to customers, or for administrative purposes. The assets are carried at historical cost less accumulated depreciation and accumulated impairment losses. Historical cost includes expenditure that is directly attributable to the acquisition of the assets including amounts related to the cost of future decommissioning and site restoration obligations.
Subsequent costs are included in the asset’s carrying amount or recognized as a separate asset, as appropriate, only when it is probable that future economic benefits associated with the asset will flow to the Group and the cost can be measured reliably.
The carrying amount of the replaced asset is derecognized. All other repairs and maintenance are charged to profit or loss during the financial period in which they are incurred.
IHS HOLDING LIMITED CONSOLIDATED ANNUAL FINANCIAL REPORT FOR THE YEAR ENDED DECEMBER 31, 2021
F-17
Freehold land is not depreciated. Depreciation on other assets is calculated using the straight-line method to allocate their cost to their residual values over their estimated useful lives, as follows:
Towers and tower equipment Base station towers (including civil costs and overheads) • Base station equipment (including civil costs and overheads) 10-20 years • Base station equipment (other equipment) 15 years • Base station equipment (rectifier and solar power) 10 years • Base station equipment (alarm and battery) 3-5 years • Base station equipment (generator & generator overhaul) 1-3 years
Fiber assets • Fixed line network equipment (including civil works, duct system, cable system and survey costs) 25 years • Outdoor cabinet 10 years Land and buildings, furniture and office equipment, and motor vehicles • Office complex 40 years • Furniture and office equipment 3 years • Motor vehicles 4 years Asset residual values and useful lives are reviewed and adjusted if appropriate, at the end of each reporting period. Where an indication of impairment exists, an asset’s carrying amount is written down immediately to its recoverable amount if the asset’s carrying amount is greater than its estimated recoverable amount. The gain or loss arising on the disposal or retirement of an asset is determined as the difference between the sales proceeds and the carrying amount of the asset and is recognized in profit or loss for the period. The Group assesses its property, plant and equipment for possible impairment if there are events or changes in circumstances that indicate that carrying values of the assets may not be recoverable, or at least at the end of every reporting period. Such indicators include changes in the Group’s business plans, changes in diesel prices, evidence of physical damage and technological changes and impacts of obsolescence including those driven by climate change.
2.13 Intangible assets and goodwill
Goodwill arises on the acquisition of businesses and represents the excess of the consideration transferred, the amount of any non-controlling interest in the acquiree and the acquisition-date fair value of any previous equity interest in the acquiree over the fair value of the identifiable net assets acquired. If the total of consideration transferred, non-controlling interest recognized and previously held interest measured at fair value is less than the fair value of the net assets of the subsidiary acquired, in the case of a bargain purchase, the difference is recognized directly in profit or loss.
For the purpose of impairment testing, goodwill acquired in a business combination is allocated to each of the cash-generating units (“CGUs”), or groups of CGUs, that is expected to benefit from the synergies of the combination. Each unit or group of units to which the goodwill is allocated represents the lowest level within the entity at which the goodwill is monitored for internal management purposes. Goodwill is monitored at or below the operating segment level. Goodwill impairment reviews are undertaken annually or more frequently if events or changes in circumstances indicate a potential impairment. The carrying value of the CGU containing the goodwill is compared to the recoverable amount, which is the higher of value in use and the fair value less costs of disposal. Any impairment is recognized immediately as an expense and is not subsequently reversed.
(a) Network and customer related intangible assets
Network related intangible assets represent future income from leasing excess tower capacity to new tenants. Customer related intangible assets represent customer contracts and relationships. Network and customer-related intangible assets acquired in a business combination are recognized at fair value at the acquisition date. Network and customer-related intangible assets have a finite useful life and are carried at cost less accumulated amortization. Amortization is calculated using the straight-line method to allocate the cost of network and customer related intangible assets over their estimated useful lives of 14-26 years (2020: 14-20 years, 2019: 14-16 years) and 5-37 years (2020: 5-30 years, 2019: 5-30 years) respectively. The remaining amortization period for network and customer related assets are between 5-26 years (2020: 6-26 years, 2019: 7-10 years) and 21-36 years (2020: 1-27 years, 2019: 1-26 years) respectively.
IHS HOLDING LIMITED CONSOLIDATED ANNUAL FINANCIAL REPORT FOR THE YEAR ENDED DECEMBER 31, 2021
F-18
(b) Licenses
Separately acquired licenses are shown at historical cost. Licenses acquired in a business combination are recognized at fair value at the acquisition date. Licenses have a finite useful life and are carried at cost less accumulated amortization. Amortization is calculated using the straight-line method over their estimated useful lives of 3-15 years (2020: 3-15 years, 2019: 3-15 years).
(c) Computer software
Costs associated with maintaining computer software programs are recognized as expenses as incurred. Acquired computer software licenses are capitalized at the cost incurred to acquire and bring into use the software. Amortization is calculated using the straight-line method over their estimated useful lives of three to five years.
2.14 Impairment of non-financial assets
Goodwill and intangible assets that have an indefinite useful life are not subject to amortization and are tested annually for impairment, or more frequently if events or changes in circumstances indicate that they might be impaired (note 3). Other assets are tested for impairment whenever events or changes in circumstances indicate that the carrying amount may not be recoverable. An impairment loss is recognized for the amount by which the asset’s carrying amount exceeds its recoverable amount. The recoverable amount is the higher of an asset’s fair value less costs of disposal and its value in use. For the purposes of assessing impairment, assets are grouped at the lowest levels for which there are separately identifiable cash inflows which are largely independent of the cash inflows from other assets or groups of assets (cash-generating units). Non-financial assets other than goodwill that suffered an impairment are reviewed for possible reversal of the impairment at the end of each reporting period.
2.15 Inventories
Inventories are stated at the lower of cost and estimated net realizable value. Cost comprises direct materials costs and where applicable, direct labor costs and those overheads that have been incurred in bringing the inventories to their present location and condition. Cost is calculated using the first-in, first-out method. Net realizable value represents the estimated selling price less all estimated costs of completion and costs to be incurred in marketing, selling and distribution. If the carrying value exceeds net realizable amount, a write down is recognized. The write-down may be reversed in a subsequent period if the circumstances which caused it no longer exist. In other instances, where the net realizable value of an inventory item is not readily determinable, management assesses the age and the risk of obsolescence of such items in determining net realizable value of such items using an appropriate age/obsolescence factor model.
2.16 Financial assets
2.16.1 Classification
The Group classifies its financial assets in the following measurement categories:
• those to be measured subsequently at fair value (either through other comprehensive income (OCI) or through profit or loss), and
• those to be measured at amortized cost.
The classification depends on the entity’s business model for managing the financial assets and the contractual terms of the cash flows. The Group reclassifies debt investments when and only when its business model for managing those assets changes.
IHS HOLDING LIMITED CONSOLIDATED ANNUAL FINANCIAL REPORT FOR THE YEAR ENDED DECEMBER 31, 2021
F-19
2.16.2 Recognition and derecognition
Regular way purchases and sales of financial assets are recognized on trade-date, the date on which the Group commits to purchase or sell the asset. Financial assets are derecognized when the rights to receive cash flows from the financial assets have expired or have been transferred and the Group has transferred substantially all the risks and rewards of ownership.
2.16.3 Measurement
At initial recognition, the Group measures a financial asset at its fair value plus, in the case of a financial asset not at fair value through profit or loss (FVPL), transaction costs that are directly attributable to the acquisition of the financial asset. Transaction costs of financial assets carried at FVPL are expensed in profit or loss.
a) Debt instruments
Subsequent measurement of debt instruments depends on the Group’s business model for managing the asset and the cash flow characteristics of the asset. The Group measures its debt instruments at amortized cost as assets are held for collection of contractual cash flows where those cash flows represent solely payments of principal and interest. Interest income from these financial assets is included in finance income using the effective interest rate method. Any gain or loss arising on derecognition is recognized directly in profit or loss and presented in other gains/(losses) together with foreign exchange gains and losses. Impairment losses are presented as separate line item in the statement of income and other comprehensive income.
For the purpose of presentation in the statement of cash flows, cash and cash equivalents includes cash on hand, deposits held at call with financial institutions, other short term, highly liquid investments with original maturities of three months or less that are readily convertible to known amounts of cash and which are subject to an insignificant risk of changes in value, and bank overdrafts. Bank overdrafts are reflected within borrowings in current liabilities in the statement of financial position.
b) Equity instruments
The Group subsequently measures all equity investments at fair value. The Group has elected to present fair value gains and losses on equity investments in OCI. There is no subsequent reclassification of fair value gains and losses to profit or loss following the derecognition of the investment.
2.16.4 Impairment
The Group evaluates each customer individually for the purpose of estimating the impairment at the reporting date rather than using a portfolio approach. The Group has limited history of losses and given the short duration of receivables, the Group uses the experienced credit judgement (ECJ) approach to estimate the impairment of trade receivables in accordance with the expected credit loss (ECL) requirement of IFRS 9.
The ECJ approach assesses the credit risk of the customer at the reporting date to evaluate the customer’s capacity to meet its contractual cash flow obligations in the near term and combines this with an evaluation of the impact of changes in economic and business conditions on the customer’s ability to pay.
2.17 Financial liabilities
2.17.1 Classification
The Group’s financial liabilities are classified at amortized cost. Financial liabilities are recognized initially at fair value and inclusive of directly attributable transaction costs. The Group’s financial liabilities are borrowings and trade and other payables.
IHS HOLDING LIMITED CONSOLIDATED ANNUAL FINANCIAL REPORT FOR THE YEAR ENDED DECEMBER 31, 2021
F-20
(a) Borrowings
Borrowings are initially recognized at fair value, net of transaction costs incurred. Borrowings are subsequently measured at amortized cost. Any difference between the proceeds (net of transaction costs) and the redemption amount is recognized in the statement of income and other comprehensive income over the period of the borrowings using the effective interest method. Fees paid on the establishment of loan facilities are recognized as transaction costs of the loan to the extent that it is probable that some or all of the facility will be drawn down. In this case, the fee is deferred until the draw down occurs. To the extent there is no evidence that it is probable that some or all of the facility will be drawn down, the fee is capitalized as a prepayment for liquidity services and amortized over the period of the facility to which it relates.
A day one gain or loss on a related party loan at a non-market interest rate is included in investments.
Borrowings are removed from the statement of financial position when the obligation specified in the contract is discharged, cancelled or expired. The difference between the carrying amount of a financial liability that has been extinguished or transferred to another party and the consideration paid, including any non-cash assets transferred or liabilities assumed, is recognized in the statement of income and other comprehensive income as other income or finance costs. Where the terms of a financial liability are renegotiated and the entity issues equity instruments to a creditor to extinguish all or part of the liability (debt for equity swap), a gain or loss is recognized in the statement of income and other comprehensive income, which is measured as the difference between the carrying amount of the financial liability and the fair value of the equity instruments issued.
Borrowings are classified as current liabilities unless the Group has an unconditional right to defer settlement of the liability for at least 12 months after the reporting period.
(b) Trade payables
Trade payables are obligations to pay for goods or services that have been acquired in the ordinary course of business from suppliers. Accounts payable are classified as current liabilities if payment is due within one year or less. If not, they are presented as non-current liabilities.
Trade payables are recognized initially at fair value and subsequently measured at amortized cost using the effective interest method.
2.18 Derivative financial instruments
Derivatives are financial instruments that derive their value from an underlying price or index. A derivative instrument gives one party a contractual right to exchange financial assets and financial liabilities with another party under conditions that are potentially favorable or financial liabilities with another party under conditions that are potentially unfavorable. Derivatives are initially recognized at fair value on the date a derivative contract is entered into and are subsequently remeasured to their fair value at the end of each reporting period.
Where we have an obligation to purchase non-controlling interest that will be settled for a variable number of own shares, rather than cash, another financial asset, or a fixed number of shares, our policy is to treat this as a derivative transaction and measure it at fair value in the statement of income.
2.19 Embedded derivatives
An embedded derivative is a component of a hybrid (combined) instrument that also includes a non-derivative host contract. An embedded derivative causes some or all of the cash flows that otherwise would be required by the contract to be modified according to a specified interest rate, financial instrument price, commodity price, foreign exchange rate, index of prices or rates or other variable (provided in the case of a non-financial variable that the variable is not specific to a party to the contract).
IHS HOLDING LIMITED CONSOLIDATED ANNUAL FINANCIAL REPORT FOR THE YEAR ENDED DECEMBER 31, 2021
F-21
An embedded derivative is only separated and reported at fair value with gains and losses being recognized in the statement of income and other comprehensive income when the following requirements are met:
• where the economic characteristics and risks of the embedded derivative are not clearly and closely related to those of the host contract;
• the terms of the embedded derivative are the same as those of a stand-alone derivative; and
• the combined contract is not held for trading or designated at fair value through profit or loss.
The Group’s listed bonds include embedded put and call features which are bifurcated at the time of issuance of the bonds.
The Group has analyzed the 2027 Notes issued in September 2019 along with the 2026 and 2027 notes issued in November 2021 and has identified free standing call and put options embedded in the listed bonds that required separate valuation. The Group employed valuation techniques commonly used by market participants to evaluate bonds with embedded options, including discounted cash flow and option pricing models, and makes maximum reference to market inputs. The techniques adopted include the major factors that market participants would consider in setting a price and are consistent with accepted economic methodologies for pricing financial instruments. The options are valued equivalent to an American Receiver Swaption under the Hull & White Model. A significant portion of the Group’s contracted revenue pricing is denominated in US Dollars and the amount of local currency due is determined by reference to the US Dollar amount invoiced, translated at the spot rate or an average rate to the respective subsidiary. This represents an embedded foreign currency derivative in a host contract.
Management’s judgement is that where fees that are priced in US$ are translated to local currency at the time of billing using a liquid market exchange rate, derivatives are not bifurcated as at the time the contracts are entered into. They are considered closely related to the host contract since they are denominated in a currency that is commonly used in the regions that the Group operates in (US Dollar being a relatively stable and liquid currency that is commonly used for pricing in local business transactions and trade).
Where fees priced in US$ are translated to local currency at the time of billing using a fixed, pre-determined exchange rate, or an exchange rate which is not referenced to a liquid market exchange rate, derivatives are bifurcated at the time the contracts are entered into.
2.20 Current and deferred income tax
(a) Deferred income tax
Deferred income tax is recognized in full, using the liability method, on all temporary differences arising between the tax bases of assets and liabilities and their carrying amounts in the financial statements. Deferred income tax is determined using tax rates (and laws) that have been enacted or substantively enacted by the end of the reporting period and are expected to apply when the related deferred income tax asset is realized or the deferred income tax liability is settled.
Deferred income tax liabilities are not recognized if they arise from initial recognition of goodwill and deferred income tax is not accounted for if it arises from initial recognition of an asset or liability, in a transaction other than a business combination that at the time of the transaction affects neither accounting nor taxable profit or loss.
Deferred income tax assets and liabilities are offset when there is a legally enforceable right to offset current tax assets against current tax liabilities and when the deferred income taxes assets and liabilities relate to income taxes levied by the same taxation authority on either the same taxable entity or different taxable entities where there is an intention to settle the balances on a net basis. Deferred income tax assets are recognized only to the extent that it is probable that future taxable profit will be available against which the temporary differences can be utilized.
IHS HOLDING LIMITED CONSOLIDATED ANNUAL FINANCIAL REPORT FOR THE YEAR ENDED DECEMBER 31, 2021
F-22
(b) Current income tax
Current income tax is recognized in profit or loss, except to the extent that it relates to items recognized in other comprehensive income or directly in equity. In this case, the tax is also recognized in other comprehensive income or directly in equity, respectively.
The current income tax charge is calculated on the basis of the tax laws enacted or substantively enacted by the end of the reporting period in the countries where the Company and its subsidiaries operate and generate taxable income. Management periodically evaluates positions taken in tax returns with respect to situations in which applicable tax regulation is subject to interpretation and considers whether it is probable that a taxation authority will accept an uncertain tax treatment. The Group measures its tax balances either based on the most likely amount or the expected value, depending on which method provides a better prediction of the resolution of the uncertainty.
2.21 Employee benefits
(a) Defined contribution schemes
The Group operates a number of defined contribution plans which are funded by contributions from the Group and the employees based on the law ruling in each country. The amounts contributed by the Group is recognized as employee benefit expenses and are charged to profit or loss in the period to which the contributions relate. The Group has no further payment obligation once the contributions have been paid. Prepaid contributions are recognized as an asset to the extent that a cash refund or a reduction in the future payment is available.
(b) Short-term employee benefits
Short term employee benefit obligations are measured on an undiscounted basis and are expensed as the related service is provided. A liability is recognized for the amount expected to be paid if the Group has a present legal or constructive obligation to pay this amount as a result of past service provided by the employee, and the obligation can be estimated reliably.
(c) Other long-term employee benefits
The Group’s net obligation in respect of long-term employee benefits is the amount of future benefit that employees have earned in return for their service in the current and prior periods. That benefit is discounted to determine its present value. Remeasurements are recognized in the statement of income and other comprehensive income in the period in which they arise.
2.22 Share-based payments
The Group operates a number of equity settled, share-based compensation plans, under which the entity receives services from employees as consideration for equity instruments (options) of the Company. Equity settled share-based payment obligations granted to employees are measured at their fair value (at the date of grant or the date of amendment in the case of modification of terms) and the fair value is recognized as an expense in profit or loss, with a corresponding increase in equity, over the vesting period of the awards. The amount recognized as an expense is adjusted to reflect the number of awards for which the related service and non-market performance conditions (for example, profitability, sales growth targets are expected to be met), such that the amount ultimately recognized is based on the number of awards that meet the related service and non-market performance conditions at the vesting date (note 3).
In the event of a modification of the terms of the share-based instruments, if the fair value of the new amended instruments is greater than the fair value of the original instruments as at the modification date, then for options vested at the modification date, the incremental fair value is recognized in profit or loss immediately and for unvested options, the incremental amount is recognized in profit or loss over the remaining vesting period.
In prior periods, and up to the 10 July 2019, the share-based compensation plans operated by the Group were classified and accounted for as cash-settled instruments. Options were measured at their fair value (at the date of grant) and the fair
IHS HOLDING LIMITED CONSOLIDATED ANNUAL FINANCIAL REPORT FOR THE YEAR ENDED DECEMBER 31, 2021
F-23
value was recognized as an expense in profit or loss with a corresponding liability recognized. Cash settled share-based payment liabilities were remeasured at the end of each reporting period up to the date of settlement, with any changes in fair value recognized in profit or loss. At the end of each reporting period and up to 10 July 2019, the Group revised its estimates of the number of options that were expected to vest based on the non-market vesting conditions and service conditions and recognized the impact of the revision to original estimates, if any, in profit or loss, with a corresponding adjustment to liability. Refer to note 28 for further information.
2.23 Decommissioning and site restoration obligations
The Group makes provision for any future cost of decommissioning of its telecommunication towers where required by regulation or land lease terms. These costs are expected to be incurred within a period of up to 20 years depending on the term of the leasehold. The Group estimates this provision using existing technology at current prices as quoted by decommissioning experts, escalated at the relevant inflation factor. The inflated decommissioning provision is subsequently discounted to present value using the Group’s incremental borrowing rate for borrowings over the expected term of the leasehold. The timing of each decommissioning will depend on the term of the lease and whether or not the lessor intends to renew the rental contract. A corresponding amount is recognized as part of property, plant and equipment. This is subsequently depreciated as part of the tower. Other than the unwinding discount on the provision, any change in the present value of the estimated expenditure is reflected as an adjustment to the provision and the corresponding item of property, plant and equipment.
3. Critical accounting estimates and judgements
The preparation of financial statements requires management to make certain judgements, accounting estimates and assumptions that affect the amounts reported for the assets and liabilities as at the end of the reporting period and the amounts reported for revenues and expenses during the year. The nature of the estimation means that actual outcomes could differ from those estimates. The key sources of judgment and estimation uncertainty that have a significant risk of causing material adjustments to the carrying amounts of assets and liabilities are discussed below.
In preparing these consolidated financial statements, the significant judgements made by management in applying the Group’s accounting policies and the key sources of estimation uncertainty were the same as those that applied to the consolidated financial statements for the year ended December 31, 2020.
(a) Key accounting judgements
3.1 Going concern - Coronavirus
The COVID-19 outbreak and resulting measures taken, from time to time by the federal and state governments in the countries where we operate to contain the virus have required some changes to how we operate (for example travel restrictions, increased working from home, practicing social distancing, increased hygiene measures and enhanced risk and contingency planning). During the prior and current year however, and during the period after December 31, 2021 the financial impact on our business has not been significant as our operational teams were allowed to fulfil their responsibilities and visit sites even when local travel restrictions were in place.
However, in addition to the already known effects, the macroeconomic uncertainty causes disruption to economic activity and it is unknown what the longer-term impact on our business may be. The remaining duration of this pandemic remains uncertain but is expected to continue to impact the way we run our business, in particular in relation to office working and the ability to travel internationally without restriction. The below table outlines Management’s assessment of and response
IHS HOLDING LIMITED CONSOLIDATED ANNUAL FINANCIAL REPORT FOR THE YEAR ENDED DECEMBER 31, 2021
F-24
to the main risks arising from the current uncertain situation regarding COVID-19. These risks inherently impact the significant judgements and estimates made by management.
Assessment Risk discussion and response Revenue and profitability
• Limited impact on revenue collections thus far.
• Customers continue to perform, and we have not experienced significant deterioration in payments.
• The Group has long-term revenue contracts with its customers amounting to $10.0 billion in contracted revenue.
• Our ability to collect revenue from our customers is impacted by our customers’ ability to generate and collect revenues from their operations. Our customers have, in the main, seen an increased demand for their services.
• The impact on collections has thus far been limited and the Group remains in constant conversation with customers regarding their liquidity and ability to meet their obligations.
• The Group regularly reviews measures for cost savings whilst maintaining its ability to operate effectively and towards strategic goals.
• The Group has continued to invest in capital expenditure which supports revenue growth, albeit at lower levels than initially planned for the year ended December 31, 2021, largely affected by a slow down in supply chain. The Group will continue to invest in capital expenditure relating to revenue growth during 2022.
Liquidity • Sufficient liquidity is available.
• No current impact on going concern.
• The Group has cash and cash equivalents of $916 million as at December 31, 2021.
• Management has assessed current cash reserves and the availability of undrawn facilities and continues to monitor available liquidity in the context of ongoing operational requirements and planned capital expenditure.
• In the context of current commitments and available liquidity, management believes that the going concern assumption remains appropriate.
• All of the Group’s operations are cash generative.
Assessment Risk discussion and response Access to USD • Moderate risk due to
decreased availability.
• While there has been a reduction in US Dollar liquidity in the Nigerian market, we were still able to source US Dollars locally to fund our semi-annual coupons during the year, and management remain confident that we will be able to do so for the foreseeable future.
Workforce and internal controls
• Minimal impact to date.
• Employees have returned to office following guidance by local regulations. The periods of remote working have had limited impact on the operation of and management oversight over internal controls which continue to operate effectively.
• Operational employees continue to operate in the field while observing strict safety guidelines.
• Our IT team monitors the increased risk of fraud, data or security breaches, loss of data and the potential for other cyber-related attacks and utilises security measures to mitigate such risks.
Supply chain • Moderate risk due to
delays. • The Group works closely with suppliers and contractors to ensure
availability of supplies on site, especially diesel supplies which are critical to many of our operations.
• Regular maintenance of our towers continues while observing strict safety guidelines for our employees and our suppliers and contractors.
IHS HOLDING LIMITED CONSOLIDATED ANNUAL FINANCIAL REPORT FOR THE YEAR ENDED DECEMBER 31, 2021
F-25
Due to the uncertainty of COVID-19, we will continue to assess the situation, including abiding by any government-imposed restrictions, market by market. As part of their regular assessment of the Group’s liquidity and financing position, the Directors have prepared detailed forecasts for a period which extends beyond 12 months after the date of approval of the financial statements. In assessing the forecasts, in addition to the impact of COVID-19 on the group’s operations, the Directors have considered:
• the current economic conditions in the operating markets and how that impacts trading;
• the impact of macroeconomic factors, particularly interest rates and foreign exchange rates;
• the status of the Group’s financial arrangements (see also note 22);
• mitigating actions available should business activities fall behind current expectations; and
• additional sensitivity analysis under a stressed scenario to assess the impact of a severe but plausible downside case.
Whilst inherently uncertain, and we expect some impact to our operations and performance, we currently do not believe that the COVID-19 outbreak will directly have a material adverse effect on our financial condition or liquidity for the foreseeable future. Having carefully considered this and the other factors noted above, the Directors have a reasonable expectation that the Group and the Company have adequate resources to continue in operational existence for at least 12 months from the date of issuance of these financial statements and to operate within the covenant levels of its current debt facilities. The Directors therefore continue to consider it appropriate to adopt the going concern basis of accounting in preparing the financial statements.
3.2 Assessment of appropriate foreign exchange rate
The Group had been using the relevant central bank rate, being the relevant official rate in each jurisdiction for foreign currency translation. On April 24, 2017, the Central Bank of Nigeria (CBN) introduced a special foreign exchange window for investors and exporters, known as the NAFEX market.
By introducing the NAFEX window, the CBN created a situation where there are multiple differing official rates in the market. This resulted in a need for the Group to reach a judgement regarding the appropriate exchange rates for translating foreign denominated transactions and balances for Nigerian subsidiaries and for the translation of Nigerian results on consolidation. The Group considered the requirements of IAS 21 ‘The Effects of Changes in Foreign Exchange Rates’ and performed an assessment of the availability of the NAFEX rate in that market. The Group concluded that access to US Dollar in Nigeria in the future to meet payments or dividends is expected to be obtained via the NAFEX market, which has since May 2021 been adopted by the CBN.
From January 1, 2018, the NAFEX rate has been used for the translation of USD transactions and denominated balances in the Nigerian subsidiaries and also for consolidation purposes.
3.3 Determining the lease term of contracts with renewal options
The Group determines the lease term as the non-cancellable term of the lease, together with any periods covered by an option to extend the lease if it is reasonably certain to be exercised and any periods covered by an option to terminate the lease, if it is reasonably certain that the termination options will not be exercised.
The Group has the option under some of its leases to lease the assets for additional periods of up to 10 years. The Group applies judgement in evaluating whether it has a unilateral option to renew the lease for a further period or is otherwise provided that option under the laws governing the lease agreement and is reasonably certain to exercise the option to renew. That is, it considers all relevant factors that create an economic incentive for it to exercise the renewal or for the landlord to accept a renewal, including the nature of the underlying asset, the availability of a similar asset in a similar
IHS HOLDING LIMITED CONSOLIDATED ANNUAL FINANCIAL REPORT FOR THE YEAR ENDED DECEMBER 31, 2021
F-26
location, and the expected business impact or relocating its towers. After the commencement date, the Group reassesses the lease term if there is a significant event or change in circumstances that is within its control and affects its intention or ability to exercise (or not to exercise) the option to renew.
(b) Key accounting estimates
3.4 Impairment of non-financial assets
The Group assesses its non-financial assets including property, plant and equipment, goodwill, and other intangible assets for possible impairment if there are events or changes in circumstances that indicate that carrying values of the assets may not be recoverable, or at least at the end of every reporting period. Such indicators include changes in the Group’s business plans, changes in diesel prices, evidence of physical damage and technological changes and impacts of obsolescence. If there are rapid changes in technology of the existing telecommunication infrastructure, the Group may need to recognize significant impairment charges.
The Group tests annually whether goodwill has suffered any impairment, in accordance with the accounting policy stated in note 2.13.
An impairment loss is recognized for the amount by which the asset’s carrying amount exceeds its recoverable amount. The recoverable amount is the higher of an asset’s fair value less costs of disposal and its value in use. For the purposes of assessing impairment, assets are grouped at the lowest levels for which there are separately identifiable cash flows. Refer to note 15 for Goodwill and intangible assets impairment considerations.
The assessment for impairment entails comparing the carrying value of the cash generating unit with its recoverable amount, that is, the higher of the value in use and the fair value less costs of disposal. Value in use is determined on the basis of discounted estimated future net cash flows. Fair value less costs of disposal is determined on the basis of tower cash flow multiples from recent comparable transactions. Determination as to whether and how much an asset is impaired involves management estimates on highly uncertain matters such as future revenue (taking into account tenancy rates), and the direct effect these have on gross profit margins in the initial five-year forecast period, discount rates, terminal growth rates, valuation multiples observed in comparable transactions and cost related to the disposal of a business.
In determining value in use the Group makes estimates and assumptions concerning the future. The assumptions adopted in the computation of the value in use are considered reasonable to the circumstance of each CGU. The resulting accounting estimates will, by definition, seldom equal the related actual results. Such estimates and assumptions are continually evaluated and are based on historical experience and other factors, including expectations of future events that are believed to be reasonable under the circumstances.
3.5 Share-based payment valuation
The Group initially measures the cost of share-based payment transactions with employees using an option pricing model to determine the fair value of the liability incurred. Estimating fair value for share-based payment transactions require determination of the most appropriate valuation model, which is dependent on the terms and conditions of the grant. This estimate also requires determination of the most appropriate inputs to the valuation model including the expected life of the share option, volatility and weighted average share price of each option and making assumptions about them.
Equity settled share-based payment obligations granted to employees are measured at their fair value (at the date of grant or the date of amendment in the case of modification of terms) and are recognized as an expense, with a corresponding increase in equity, over the vesting period of the awards. The amount recognized as an expense is adjusted to reflect the number of awards for which the related service and non-market performance conditions are expected to be met, such that the amount ultimately recognized is based on the number of awards that meet the related service and non-market performance conditions at the vesting date. This requires a reassessment of the expectation of the likelihood of meeting the non-market performance conditions used at the end of each reporting period. The assumptions and models used for estimating fair value for share-based payment transactions are disclosed in note 28.
IHS HOLDING LIMITED CONSOLIDATED ANNUAL FINANCIAL REPORT FOR THE YEAR ENDED DECEMBER 31, 2021
F-27
3.6 Regulatory accruals
The Group requires a variety of regulatory approvals and permits related to its license to operate and meets its compliance requirements in respect of individual tower sites. These charges are levied by various national and state authorities. There is uncertainty over the level of charges where rates (e.g. percentage of revenue) remain under negotiation with the relevant authorities and also over the period for which charges will apply where demands have not yet been received from authorities on a site by site basis. State authorities may also make claims on an ad-hoc basis for additional charges relating to new compliance requirements or charges significantly in excess of levels previously charged for an existing requirement. These ad-hoc claims may be made on a prospective or retrospective basis.
The Group recognizes an accrual for unbilled regulatory costs based on management estimates of the rates per permit/approval type, periods for which permits/approvals potentially relate and the probability of charges being raised resulting in a cash outflow. The most significant accrual relates to the Group’s operations in Nigeria, where the amount accrued is $31.9 million (2020: $28.3 million, 2019: $43.8 million). The accrual is based both on permits where rates are known amounts and those where amounts are based on management estimates including:
• the assumed percentage of maximum “claimed” liability related to “ad hoc” state level claims;
• the assumption that the risk related to potentially unpaid “regular” claims reduces over time and is accrued at 100% but reduced to 0% for balance over a certain number of years;
• assumptions regarding the risk of liabilities arising in respect of one-off site development related charges in respect of sites acquired by the group.
A 10 percentage point change in management’s estimate of the amount of the potential liability that, subject to these estimates, will eventually be demanded and paid to the relevant authorities would alter the accrual at December 31, 2021 by approximately $3.2 million (2020: $2.9 million, 2019: $3.5 million). Management has only considered items in the sensitivity analysis that are subject to management’s rates estimate in the total amount accrued.
3.7 Revenue recognition
(a) Variable consideration
Initial recognition of revenue includes an assessment of the recoverability of revenue. Amounts not expected to be recovered at the point of initial recognition are considered to be variable consideration, contingent upon the receipt of funds from the customer, and are therefore subject to measurement constraints as such payments are not wholly within the control of the Group (see note 2.5(a)). A 10-percentage point change in management’s estimate of the amount of variable consideration that will eventually be received would alter revenue recognized by approximately $16.8 million (2020: $14.2 million, 2019: $nil).
(b) Delayed invoicing
Revenue also includes estimates in respect of services provided where billing is not completed, including in respect of tower sites coming into service, or changes in customer implemented technologies since the most recent invoicing cycle and in respect of services subject to ongoing negotiation regarding price or other contract interpretation disputes with customers. For each of these scenarios, revenue is accrued based on management’ expectation of the final billable amounts.
A 20-percentage point change in management’s estimate of the amount of accrued revenue, subject to these delayed billing estimates would alter revenue recognized by approximately $5.0 million (2020: $3.3 million, 2019: $0.8 million).
IHS HOLDING LIMITED CONSOLIDATED ANNUAL FINANCIAL REPORT FOR THE YEAR ENDED DECEMBER 31, 2021
F-28
4. Introduction and overview of Group’s risk management
The Group’s activities expose it to a variety of financial risks including market risk (foreign exchange risk and interest rate risk), credit risk and liquidity risk. The Board of Directors has overall responsibility for the establishment and oversight of the Group’s risk management framework. The Group’s Executive Committee is responsible for developing and monitoring the Group’s risk management policies.
The Group’s risk management policies are established to identify and analyze the risks faced by the Group, to establish appropriate risk appetite and controls, and to monitor risks and adherence to our risk appetite. Risk management policies and systems are reviewed regularly by the executive management to reflect changes in market conditions and the Group’s activities. The Group, through its training and management standards and procedures, aims to develop a disciplined and constructive control environment in which all employees understand their roles and obligations.
The Board, through the Audit Committee, oversees how management monitors compliance with the Group’s risk management policies and procedures and reviews the adequacy of the risk management framework in relation to the risks faced by the Group. The Board is supported by various management functions that check and undertake both regular and ad hoc reviews of compliance with established controls and procedures.
(a) Derivative instruments
Derivatives are only used for economic hedging purposes and not as speculative investments. Derivatives do not meet the criteria for hedge accounting and are therefore classified as financial instruments through fair value through profit or loss.
• Non-deliverable forwards (NDFs) — The calculation of an NDF fair value is based on the difference between the contracted exchange rate and the anticipated spot exchange rate at the relevant period. The rate applied to represent the anticipated spot exchange rate requires judgement given the limited market liquidity in Nigeria. The Group has determined that the spot NAFEX exchange rate obtained from FMDQ OTC securities exchange is the most appropriate rate. The gain or loss at the settlement date is calculated by taking the difference between the agreed upon contract exchange rate (NGN/USD) and the spot rate at the time of settlement, for an agreed upon notional amount of funds.
• Embedded options within listed bonds — The bonds issued by IHS Netherlands Holdco B.V. in October 2016 and September 2019 and the bonds issued by IHS Holding Limited in November 2021 have embedded options which allow early redemption at the option of the issuer and holder upon the occurrence of specified events. These are accounted for as derivatives at fair value through profit or loss.
• Embedded derivatives within revenue contracts — The embedded derivatives within revenue contracts represent the fair value of the US$ linked components of the Group’s revenue contracts with customers, where such US$ linked components are translated to local currency at the time of billing using a fixed, pre-determined exchange rate or an exchange rate which is not referenced to a liquid market exchange rate. These are accounted for as derivatives at fair value through profit or loss.
(b) Market risk
Market risk is the risk that changes in market prices, such as foreign exchange rates and interest rates will affect the Group’s income or the value of its holdings of financial instruments. The objective of market risk management is to manage and control market risk exposures within acceptable parameters, while optimizing the return.
The Group manages market risks by keeping costs low through various cost optimization programs. Moreover, market developments are monitored and discussed regularly, and mitigating actions are taken where necessary.
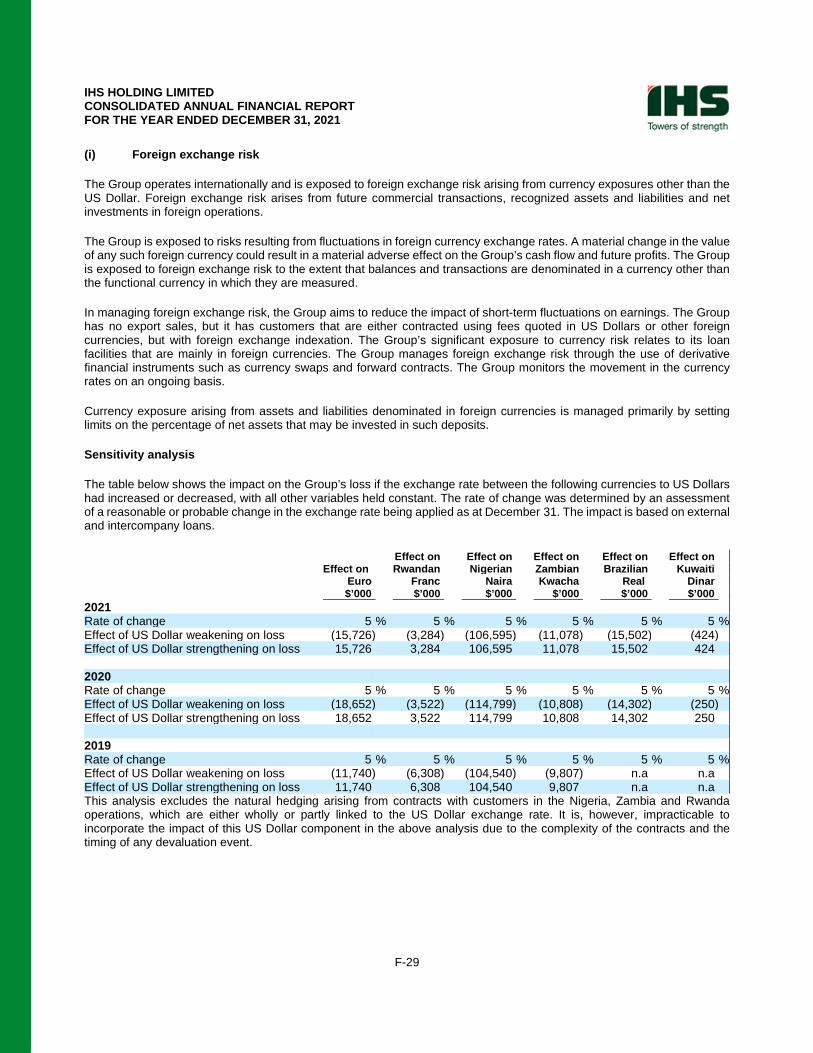
IHS HOLDING LIMITED CONSOLIDATED ANNUAL FINANCIAL REPORT FOR THE YEAR ENDED DECEMBER 31, 2021
F-29
(i) Foreign exchange risk
The Group operates internationally and is exposed to foreign exchange risk arising from currency exposures other than the US Dollar. Foreign exchange risk arises from future commercial transactions, recognized assets and liabilities and net investments in foreign operations.
The Group is exposed to risks resulting from fluctuations in foreign currency exchange rates. A material change in the value of any such foreign currency could result in a material adverse effect on the Group’s cash flow and future profits. The Group is exposed to foreign exchange risk to the extent that balances and transactions are denominated in a currency other than the functional currency in which they are measured.
In managing foreign exchange risk, the Group aims to reduce the impact of short-term fluctuations on earnings. The Group has no export sales, but it has customers that are either contracted using fees quoted in US Dollars or other foreign currencies, but with foreign exchange indexation. The Group’s significant exposure to currency risk relates to its loan facilities that are mainly in foreign currencies. The Group manages foreign exchange risk through the use of derivative financial instruments such as currency swaps and forward contracts. The Group monitors the movement in the currency rates on an ongoing basis.
Currency exposure arising from assets and liabilities denominated in foreign currencies is managed primarily by setting limits on the percentage of net assets that may be invested in such deposits.
Sensitivity analysis
The table below shows the impact on the Group’s loss if the exchange rate between the following currencies to US Dollars had increased or decreased, with all other variables held constant. The rate of change was determined by an assessment of a reasonable or probable change in the exchange rate being applied as at December 31. The impact is based on external and intercompany loans.
Effect on Effect on Effect on Effect on Effect on Effect on Rwandan Nigerian Zambian Brazilian Kuwaiti Euro Franc Naira Kwacha Real Dinar $’000 $’000 $’000 $’000 $’000 $’000
2021 Rate of change 5 % 5 % 5 % 5 % 5 % 5 % Effect of US Dollar weakening on loss (15,726) (3,284) (106,595) (11,078) (15,502) (424) Effect of US Dollar strengthening on loss 15,726 3,284 106,595 11,078 15,502 424 2020 Rate of change 5 % 5 % 5 % 5 % 5 % 5 % Effect of US Dollar weakening on loss (18,652) (3,522) (114,799) (10,808) (14,302) (250) Effect of US Dollar strengthening on loss 18,652 3,522 114,799 10,808 14,302 250 2019 Rate of change 5 % 5 % 5 % 5 % 5 % 5 % Effect of US Dollar weakening on loss (11,740) (6,308) (104,540) (9,807) n.a n.a Effect of US Dollar strengthening on loss 11,740 6,308 104,540 9,807 n.a n.a This analysis excludes the natural hedging arising from contracts with customers in the Nigeria, Zambia and Rwanda operations, which are either wholly or partly linked to the US Dollar exchange rate. It is, however, impracticable to incorporate the impact of this US Dollar component in the above analysis due to the complexity of the contracts and the timing of any devaluation event.
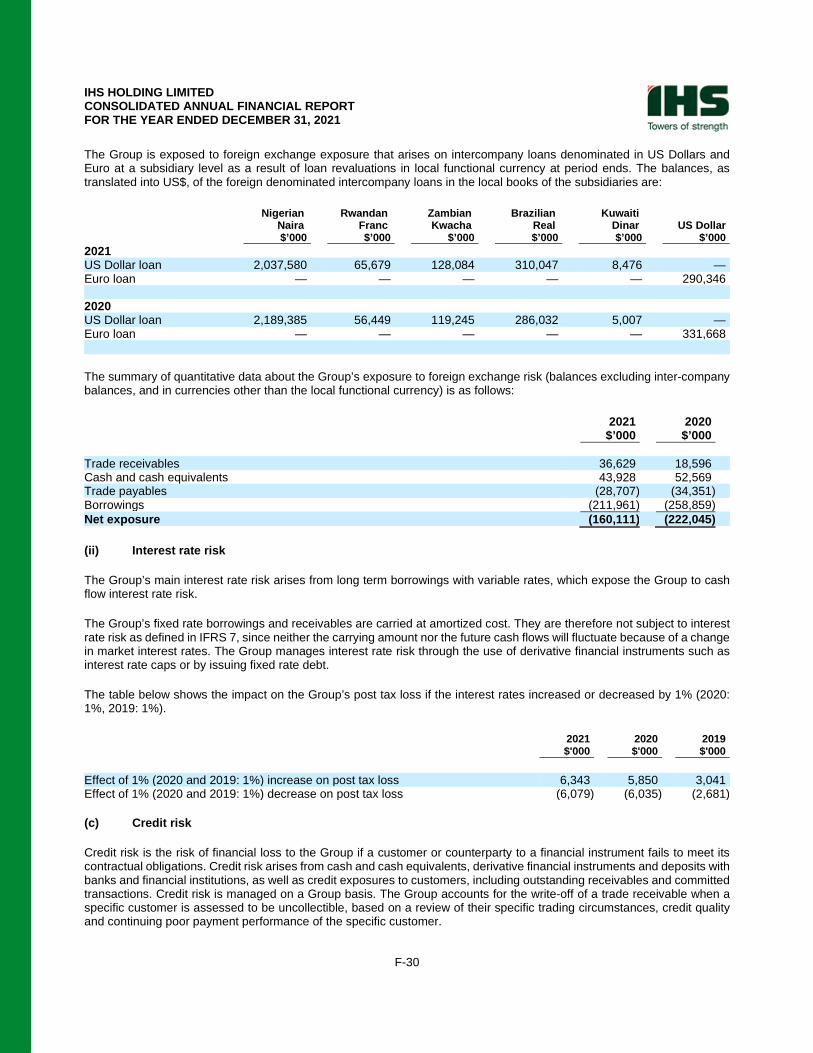
IHS HOLDING LIMITED CONSOLIDATED ANNUAL FINANCIAL REPORT FOR THE YEAR ENDED DECEMBER 31, 2021
F-30
The Group is exposed to foreign exchange exposure that arises on intercompany loans denominated in US Dollars and Euro at a subsidiary level as a result of loan revaluations in local functional currency at period ends. The balances, as translated into US$, of the foreign denominated intercompany loans in the local books of the subsidiaries are:
Nigerian Rwandan Zambian Brazilian Kuwaiti Naira Franc Kwacha Real Dinar US Dollar $’000 $’000 $’000 $’000 $’000 $’000 2021 US Dollar loan 2,037,580 65,679 128,084 310,047 8,476 — Euro loan — — — — — 290,346 2020 US Dollar loan 2,189,385 56,449 119,245 286,032 5,007 — Euro loan — — — — — 331,668 The summary of quantitative data about the Group’s exposure to foreign exchange risk (balances excluding inter-company balances, and in currencies other than the local functional currency) is as follows:
2021 2020 $’000 $’000 Trade receivables 36,629 18,596 Cash and cash equivalents 43,928 52,569 Trade payables (28,707) (34,351) Borrowings (211,961) (258,859) Net exposure (160,111) (222,045) (ii) Interest rate risk
The Group’s main interest rate risk arises from long term borrowings with variable rates, which expose the Group to cash flow interest rate risk.
The Group’s fixed rate borrowings and receivables are carried at amortized cost. They are therefore not subject to interest rate risk as defined in IFRS 7, since neither the carrying amount nor the future cash flows will fluctuate because of a change in market interest rates. The Group manages interest rate risk through the use of derivative financial instruments such as interest rate caps or by issuing fixed rate debt.
The table below shows the impact on the Group’s post tax loss if the interest rates increased or decreased by 1% (2020: 1%, 2019: 1%).
2021 2020 2019 $'000 $'000 $'000 Effect of 1% (2020 and 2019: 1%) increase on post tax loss 6,343 5,850 3,041 Effect of 1% (2020 and 2019: 1%) decrease on post tax loss (6,079) (6,035) (2,681) (c) Credit risk
Credit risk is the risk of financial loss to the Group if a customer or counterparty to a financial instrument fails to meet its contractual obligations. Credit risk arises from cash and cash equivalents, derivative financial instruments and deposits with banks and financial institutions, as well as credit exposures to customers, including outstanding receivables and committed transactions. Credit risk is managed on a Group basis. The Group accounts for the write-off of a trade receivable when a specific customer is assessed to be uncollectible, based on a review of their specific trading circumstances, credit quality and continuing poor payment performance of the specific customer.
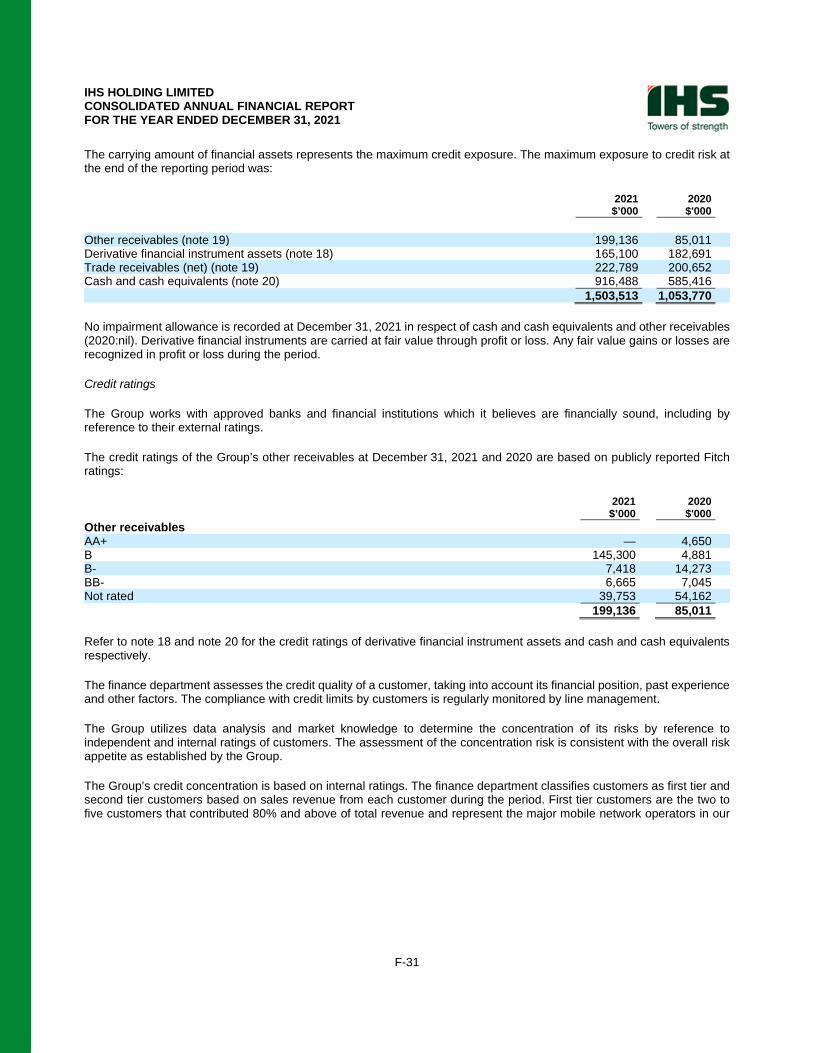
IHS HOLDING LIMITED CONSOLIDATED ANNUAL FINANCIAL REPORT FOR THE YEAR ENDED DECEMBER 31, 2021
F-31
The carrying amount of financial assets represents the maximum credit exposure. The maximum exposure to credit risk at the end of the reporting period was:
2021 2020 $’000 $'000 Other receivables (note 19) 199,136 85,011 Derivative financial instrument assets (note 18) 165,100 182,691 Trade receivables (net) (note 19) 222,789 200,652 Cash and cash equivalents (note 20) 916,488 585,416 1,503,513 1,053,770 No impairment allowance is recorded at December 31, 2021 in respect of cash and cash equivalents and other receivables (2020:nil). Derivative financial instruments are carried at fair value through profit or loss. Any fair value gains or losses are recognized in profit or loss during the period.
Credit ratings
The Group works with approved banks and financial institutions which it believes are financially sound, including by reference to their external ratings.
The credit ratings of the Group’s other receivables at December 31, 2021 and 2020 are based on publicly reported Fitch ratings:
2021 2020 $’000 $'000 Other receivables AA+ — 4,650 B 145,300 4,881 B- 7,418 14,273 BB- 6,665 7,045 Not rated 39,753 54,162 199,136 85,011 Refer to note 18 and note 20 for the credit ratings of derivative financial instrument assets and cash and cash equivalents respectively.
The finance department assesses the credit quality of a customer, taking into account its financial position, past experience and other factors. The compliance with credit limits by customers is regularly monitored by line management.
The Group utilizes data analysis and market knowledge to determine the concentration of its risks by reference to independent and internal ratings of customers. The assessment of the concentration risk is consistent with the overall risk appetite as established by the Group.
The Group’s credit concentration is based on internal ratings. The finance department classifies customers as first tier and second tier customers based on sales revenue from each customer during the period. First tier customers are the two to five customers that contributed 80% and above of total revenue and represent the major mobile network operators in our
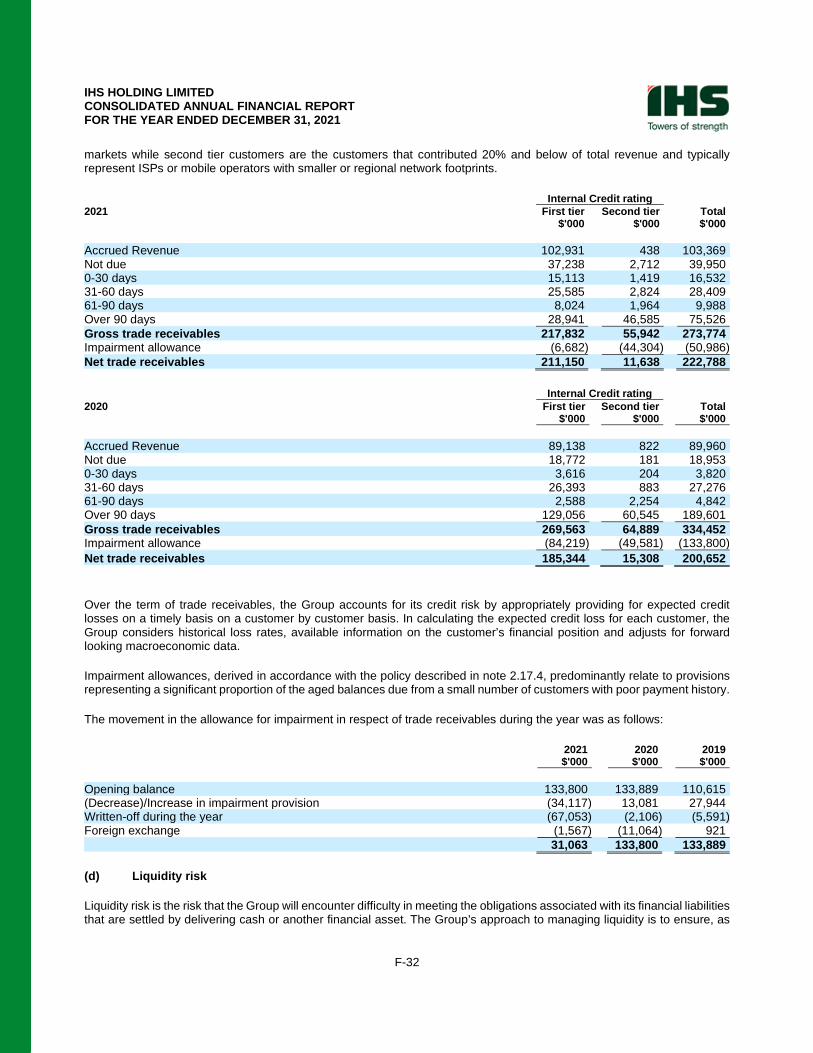
IHS HOLDING LIMITED CONSOLIDATED ANNUAL FINANCIAL REPORT FOR THE YEAR ENDED DECEMBER 31, 2021
F-32
markets while second tier customers are the customers that contributed 20% and below of total revenue and typically represent ISPs or mobile operators with smaller or regional network footprints.
Internal Credit rating 2021 First tier Second tier Total $'000 $'000 $'000 Accrued Revenue 102,931 438 103,369 Not due 37,238 2,712 39,950 0-30 days 15,113 1,419 16,532 31-60 days 25,585 2,824 28,409 61-90 days 8,024 1,964 9,988 Over 90 days 28,941 46,585 75,526 Gross trade receivables 217,832 55,942 273,774 Impairment allowance (6,682) (44,304) (50,986) Net trade receivables 211,150 11,638 222,788
Internal Credit rating 2020 First tier Second tier Total $'000 $'000 $'000 Accrued Revenue 89,138 822 89,960 Not due 18,772 181 18,953 0-30 days 3,616 204 3,820 31-60 days 26,393 883 27,276 61-90 days 2,588 2,254 4,842 Over 90 days 129,056 60,545 189,601 Gross trade receivables 269,563 64,889 334,452 Impairment allowance (84,219) (49,581) (133,800) Net trade receivables 185,344 15,308 200,652 Over the term of trade receivables, the Group accounts for its credit risk by appropriately providing for expected credit losses on a timely basis on a customer by customer basis. In calculating the expected credit loss for each customer, the Group considers historical loss rates, available information on the customer’s financial position and adjusts for forward looking macroeconomic data.
Impairment allowances, derived in accordance with the policy described in note 2.17.4, predominantly relate to provisions representing a significant proportion of the aged balances due from a small number of customers with poor payment history.
The movement in the allowance for impairment in respect of trade receivables during the year was as follows:
2021 2020 2019 $'000 $'000 $'000 Opening balance 133,800 133,889 110,615 (Decrease)/Increase in impairment provision (34,117) 13,081 27,944 Written-off during the year (67,053) (2,106) (5,591) Foreign exchange (1,567) (11,064) 921 31,063 133,800 133,889 (d) Liquidity risk
Liquidity risk is the risk that the Group will encounter difficulty in meeting the obligations associated with its financial liabilities that are settled by delivering cash or another financial asset. The Group’s approach to managing liquidity is to ensure, as
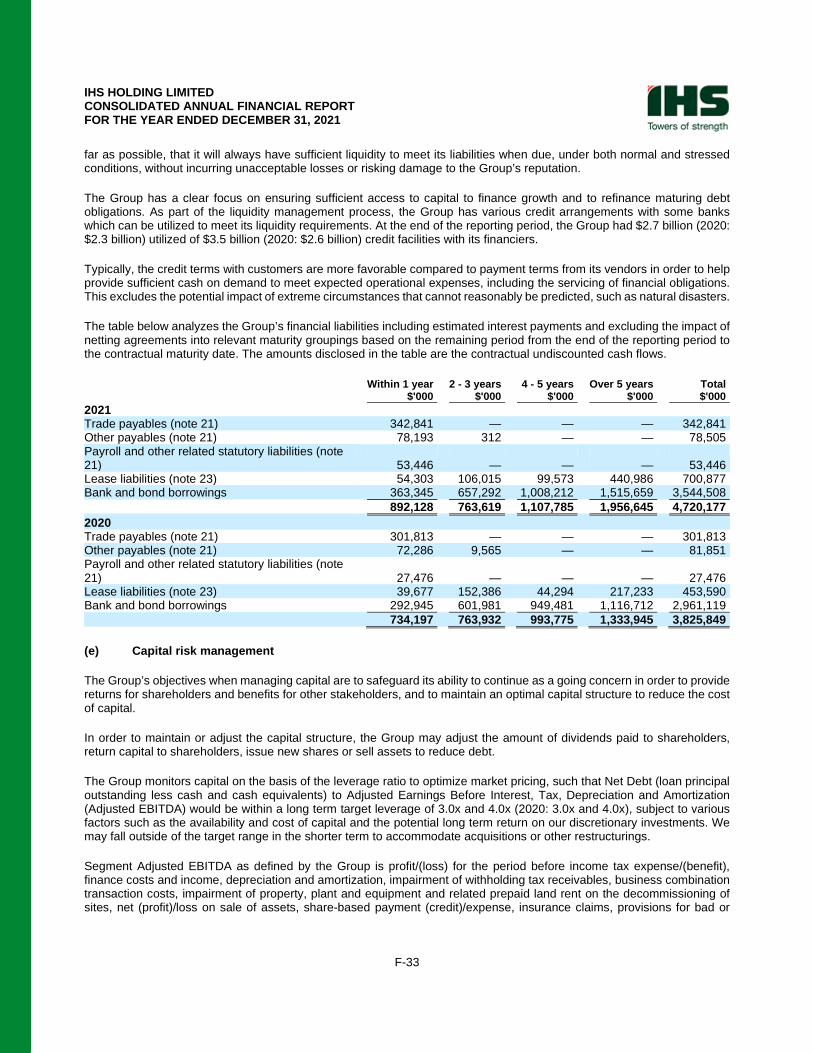
IHS HOLDING LIMITED CONSOLIDATED ANNUAL FINANCIAL REPORT FOR THE YEAR ENDED DECEMBER 31, 2021
F-33
far as possible, that it will always have sufficient liquidity to meet its liabilities when due, under both normal and stressed conditions, without incurring unacceptable losses or risking damage to the Group’s reputation.
The Group has a clear focus on ensuring sufficient access to capital to finance growth and to refinance maturing debt obligations. As part of the liquidity management process, the Group has various credit arrangements with some banks which can be utilized to meet its liquidity requirements. At the end of the reporting period, the Group had $2.7 billion (2020: $2.3 billion) utilized of $3.5 billion (2020: $2.6 billion) credit facilities with its financiers.
Typically, the credit terms with customers are more favorable compared to payment terms from its vendors in order to help provide sufficient cash on demand to meet expected operational expenses, including the servicing of financial obligations. This excludes the potential impact of extreme circumstances that cannot reasonably be predicted, such as natural disasters.
The table below analyzes the Group’s financial liabilities including estimated interest payments and excluding the impact of netting agreements into relevant maturity groupings based on the remaining period from the end of the reporting period to the contractual maturity date. The amounts disclosed in the table are the contractual undiscounted cash flows.
Within 1 year 2 - 3 years 4 - 5 years Over 5 years Total $'000 $'000 $'000 $'000 $'000 2021 Trade payables (note 21) 342,841 — — — 342,841 Other payables (note 21) 78,193 312 — — 78,505 Payroll and other related statutory liabilities (note 21) 53,446 — — — 53,446 Lease liabilities (note 23) 54,303 106,015 99,573 440,986 700,877 Bank and bond borrowings 363,345 657,292 1,008,212 1,515,659 3,544,508 892,128 763,619 1,107,785 1,956,645 4,720,177 2020 Trade payables (note 21) 301,813 — — — 301,813 Other payables (note 21) 72,286 9,565 — — 81,851 Payroll and other related statutory liabilities (note 21) 27,476 — — — 27,476 Lease liabilities (note 23) 39,677 152,386 44,294 217,233 453,590 Bank and bond borrowings 292,945 601,981 949,481 1,116,712 2,961,119 734,197 763,932 993,775 1,333,945 3,825,849 (e) Capital risk management
The Group’s objectives when managing capital are to safeguard its ability to continue as a going concern in order to provide returns for shareholders and benefits for other stakeholders, and to maintain an optimal capital structure to reduce the cost of capital.
In order to maintain or adjust the capital structure, the Group may adjust the amount of dividends paid to shareholders, return capital to shareholders, issue new shares or sell assets to reduce debt.
The Group monitors capital on the basis of the leverage ratio to optimize market pricing, such that Net Debt (loan principal outstanding less cash and cash equivalents) to Adjusted Earnings Before Interest, Tax, Depreciation and Amortization (Adjusted EBITDA) would be within a long term target leverage of 3.0x and 4.0x (2020: 3.0x and 4.0x), subject to various factors such as the availability and cost of capital and the potential long term return on our discretionary investments. We may fall outside of the target range in the shorter term to accommodate acquisitions or other restructurings.
Segment Adjusted EBITDA as defined by the Group is profit/(loss) for the period before income tax expense/(benefit), finance costs and income, depreciation and amortization, impairment of withholding tax receivables, business combination transaction costs, impairment of property, plant and equipment and related prepaid land rent on the decommissioning of sites, net (profit)/loss on sale of assets, share-based payment (credit)/expense, insurance claims, provisions for bad or
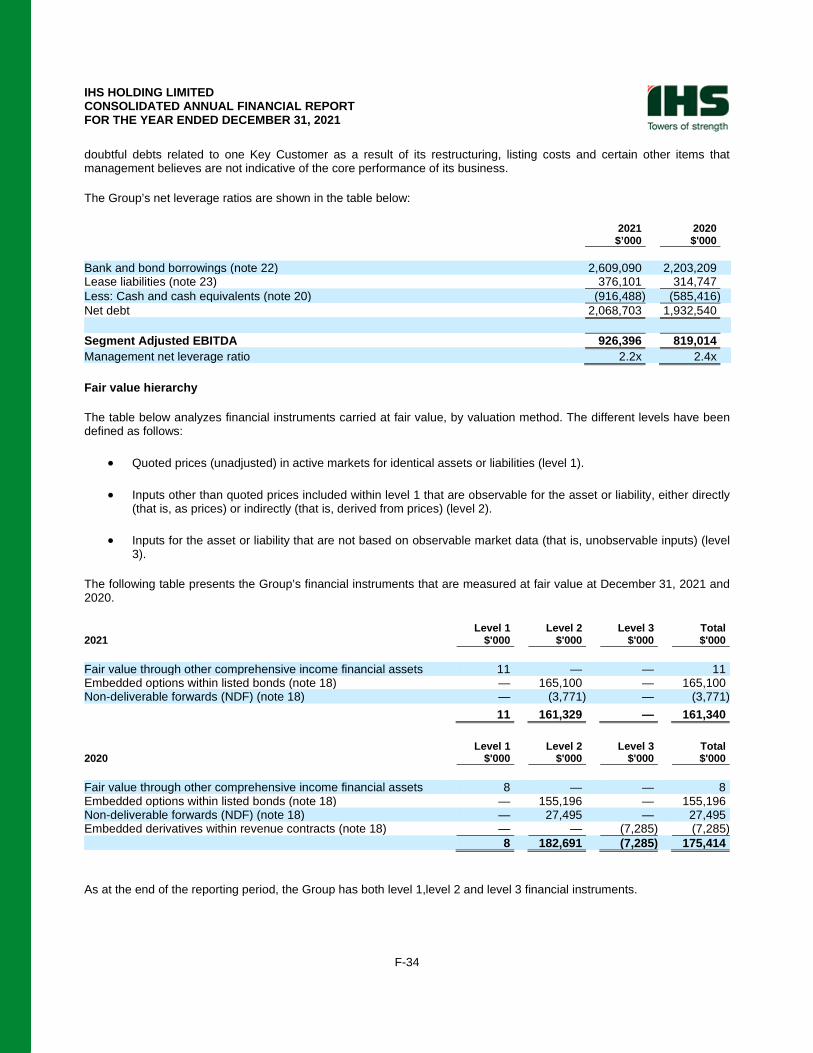
IHS HOLDING LIMITED CONSOLIDATED ANNUAL FINANCIAL REPORT FOR THE YEAR ENDED DECEMBER 31, 2021
F-34
doubtful debts related to one Key Customer as a result of its restructuring, listing costs and certain other items that management believes are not indicative of the core performance of its business.
The Group’s net leverage ratios are shown in the table below:
2021 2020 $’000 $'000 Bank and bond borrowings (note 22) 2,609,090 2,203,209 Lease liabilities (note 23) 376,101 314,747 Less: Cash and cash equivalents (note 20) (916,488) (585,416) Net debt 2,068,703 1,932,540 Segment Adjusted EBITDA 926,396 819,014 Management net leverage ratio 2.2x 2.4x Fair value hierarchy
The table below analyzes financial instruments carried at fair value, by valuation method. The different levels have been defined as follows:
• Quoted prices (unadjusted) in active markets for identical assets or liabilities (level 1).
• Inputs other than quoted prices included within level 1 that are observable for the asset or liability, either directly (that is, as prices) or indirectly (that is, derived from prices) (level 2).
• Inputs for the asset or liability that are not based on observable market data (that is, unobservable inputs) (level 3).
The following table presents the Group’s financial instruments that are measured at fair value at December 31, 2021 and 2020.
Level 1 Level 2 Level 3 Total 2021 $'000 $'000 $'000 $'000 Fair value through other comprehensive income financial assets 11 — — 11 Embedded options within listed bonds (note 18) — 165,100 — 165,100 Non-deliverable forwards (NDF) (note 18) — (3,771) — (3,771) 11 161,329 — 161,340
Level 1 Level 2 Level 3 Total 2020 $'000 $'000 $'000 $'000 Fair value through other comprehensive income financial assets 8 — — 8 Embedded options within listed bonds (note 18) — 155,196 — 155,196 Non-deliverable forwards (NDF) (note 18) — 27,495 — 27,495 Embedded derivatives within revenue contracts (note 18) — — (7,285) (7,285) 8 182,691 (7,285) 175,414 As at the end of the reporting period, the Group has both level 1,level 2 and level 3 financial instruments.
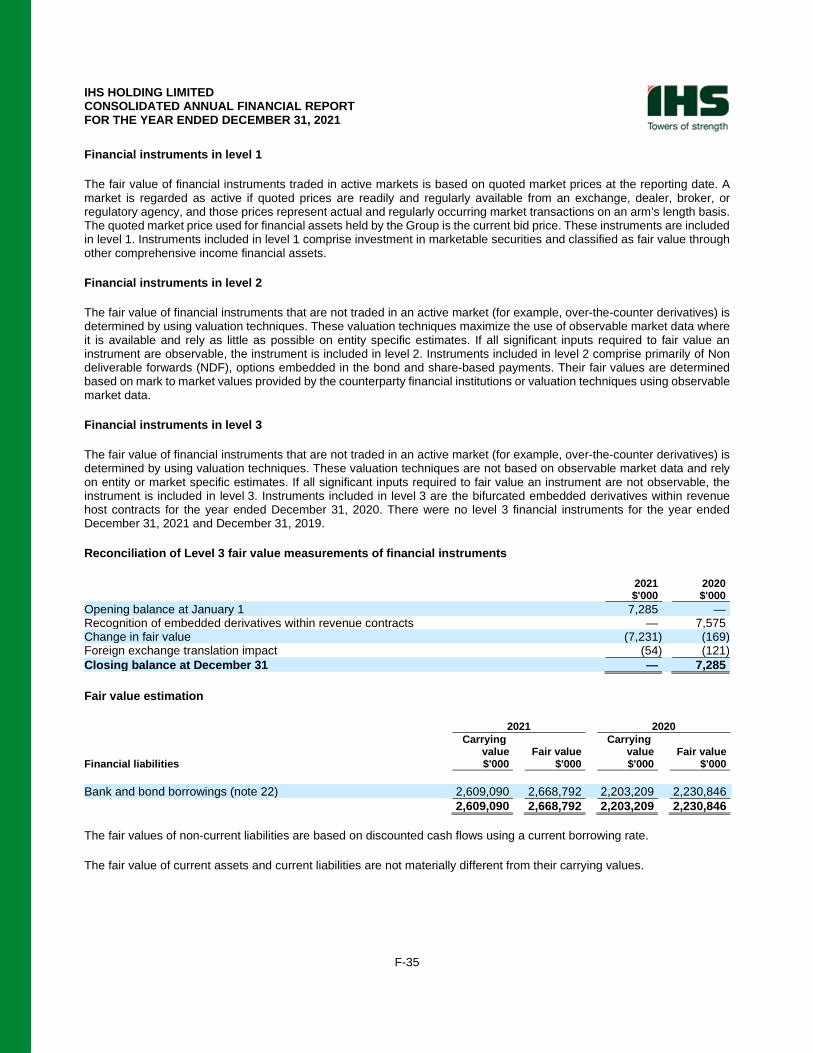
IHS HOLDING LIMITED CONSOLIDATED ANNUAL FINANCIAL REPORT FOR THE YEAR ENDED DECEMBER 31, 2021
F-35
Financial instruments in level 1
The fair value of financial instruments traded in active markets is based on quoted market prices at the reporting date. A market is regarded as active if quoted prices are readily and regularly available from an exchange, dealer, broker, or regulatory agency, and those prices represent actual and regularly occurring market transactions on an arm’s length basis. The quoted market price used for financial assets held by the Group is the current bid price. These instruments are included in level 1. Instruments included in level 1 comprise investment in marketable securities and classified as fair value through other comprehensive income financial assets.
Financial instruments in level 2
The fair value of financial instruments that are not traded in an active market (for example, over-the-counter derivatives) is determined by using valuation techniques. These valuation techniques maximize the use of observable market data where it is available and rely as little as possible on entity specific estimates. If all significant inputs required to fair value an instrument are observable, the instrument is included in level 2. Instruments included in level 2 comprise primarily of Non deliverable forwards (NDF), options embedded in the bond and share-based payments. Their fair values are determined based on mark to market values provided by the counterparty financial institutions or valuation techniques using observable market data.
Financial instruments in level 3
The fair value of financial instruments that are not traded in an active market (for example, over-the-counter derivatives) is determined by using valuation techniques. These valuation techniques are not based on observable market data and rely on entity or market specific estimates. If all significant inputs required to fair value an instrument are not observable, the instrument is included in level 3. Instruments included in level 3 are the bifurcated embedded derivatives within revenue host contracts for the year ended December 31, 2020. There were no level 3 financial instruments for the year ended December 31, 2021 and December 31, 2019.
Reconciliation of Level 3 fair value measurements of financial instruments
2021 2020 $'000 $'000 Opening balance at January 1 7,285 — Recognition of embedded derivatives within revenue contracts — 7,575 Change in fair value (7,231) (169) Foreign exchange translation impact (54) (121) Closing balance at December 31 — 7,285 Fair value estimation
2021 2020 Carrying Carrying value Fair value value Fair value Financial liabilities $'000 $'000 $'000 $'000 Bank and bond borrowings (note 22) 2,609,090 2,668,792 2,203,209 2,230,846 2,609,090 2,668,792 2,203,209 2,230,846 The fair values of non-current liabilities are based on discounted cash flows using a current borrowing rate.
The fair value of current assets and current liabilities are not materially different from their carrying values.
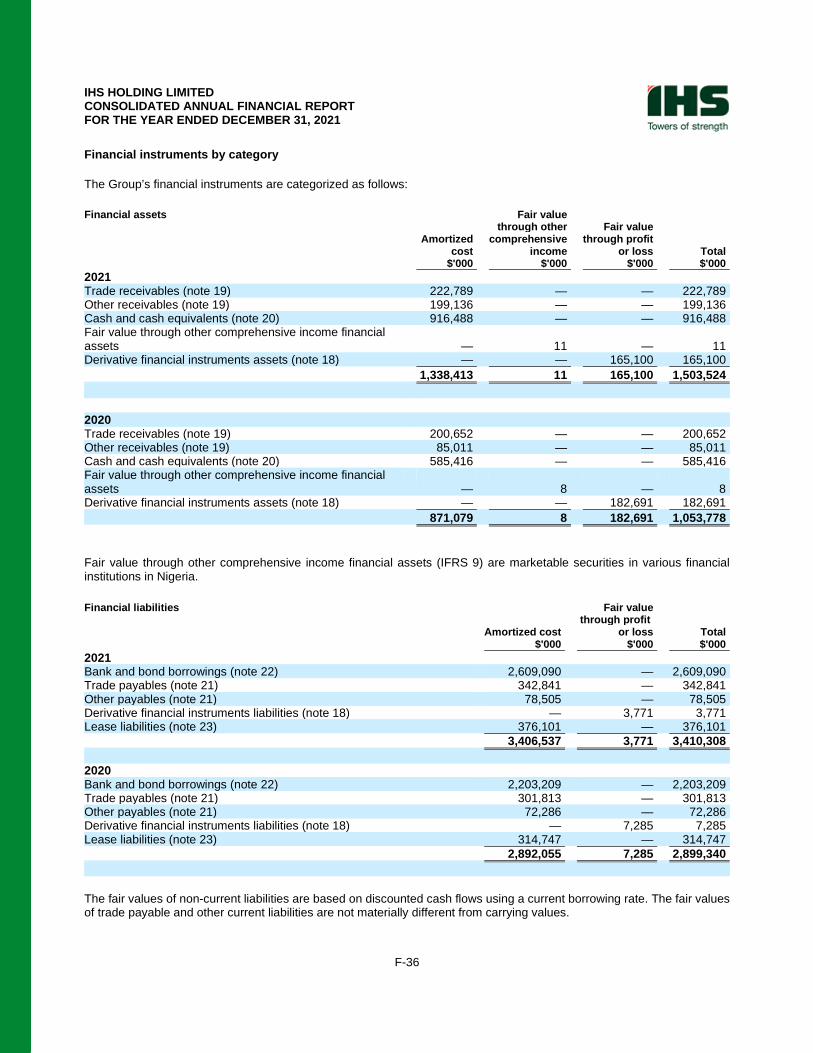
IHS HOLDING LIMITED CONSOLIDATED ANNUAL FINANCIAL REPORT FOR THE YEAR ENDED DECEMBER 31, 2021
F-36
Financial instruments by category
The Group’s financial instruments are categorized as follows:
Financial assets Fair value through other Fair value Amortized comprehensive through profit cost income or loss Total $'000 $'000 $'000 $'000 2021 Trade receivables (note 19) 222,789 — — 222,789 Other receivables (note 19) 199,136 — — 199,136 Cash and cash equivalents (note 20) 916,488 — — 916,488 Fair value through other comprehensive income financial assets — 11 — 11 Derivative financial instruments assets (note 18) — — 165,100 165,100 1,338,413 11 165,100 1,503,524 2020 Trade receivables (note 19) 200,652 — — 200,652 Other receivables (note 19) 85,011 — — 85,011 Cash and cash equivalents (note 20) 585,416 — — 585,416 Fair value through other comprehensive income financial assets — 8 — 8 Derivative financial instruments assets (note 18) — — 182,691 182,691 871,079 8 182,691 1,053,778 Fair value through other comprehensive income financial assets (IFRS 9) are marketable securities in various financial institutions in Nigeria.
Financial liabilities Fair value through profit Amortized cost or loss Total $'000 $'000 $'000 2021 Bank and bond borrowings (note 22) 2,609,090 — 2,609,090 Trade payables (note 21) 342,841 — 342,841 Other payables (note 21) 78,505 — 78,505 Derivative financial instruments liabilities (note 18) — 3,771 3,771 Lease liabilities (note 23) 376,101 — 376,101 3,406,537 3,771 3,410,308 2020 Bank and bond borrowings (note 22) 2,203,209 — 2,203,209 Trade payables (note 21) 301,813 — 301,813 Other payables (note 21) 72,286 — 72,286 Derivative financial instruments liabilities (note 18) — 7,285 7,285 Lease liabilities (note 23) 314,747 — 314,747 2,892,055 7,285 2,899,340 The fair values of non-current liabilities are based on discounted cash flows using a current borrowing rate. The fair values of trade payable and other current liabilities are not materially different from carrying values.
IHS HOLDING LIMITED CONSOLIDATED ANNUAL FINANCIAL REPORT FOR THE YEAR ENDED DECEMBER 31, 2021
F-37
5. Segment reporting
The Group’s Executive Committee, identified as the chief operating decision maker (“CODM”), reviews and evaluates the Group’s performance from a business perspective according to how the geographical locations are managed. Regional and operating company management are responsible for managing performance, underlying risks, and effectiveness of operations. Regions are broadly based on a scale and geographic basis because the Group’s risks and rates of return are affected predominantly by the fact that the Group operates in different geographical areas, namely Nigeria as the major market, Cameroon, Côte d’Ivoire, Rwanda and Zambia, as our Sub Saharan Africa business (“SSA”), Kuwait and Egypt as our Middle East and North Africa business (“MENA”) and Brazil, Colombia and Peru as our Latin America business (“Latam”).
The Executive Committee reviews the Company’s internal reporting to assess performance and allocate resources. Management has determined the operating segments based on these reports.
The CODM has identified four operating segments:
• Nigeria
• SSA, which comprises operations in Cameroon, Côte d’Ivoire, Rwanda and Zambia
• Latam, which comprises operations in Brazil, Colombia and Peru
• MENA, which comprises operations in Kuwait and Egypt. Although full operations in Egypt have not commenced, the business has incurred some startup costs.
Latam and MENA are operating segments effective from February 2020 following the acquisition of IHS Brasil Cessão de Infraestruturas Limitada and IHS Kuwait Limited (refer to note 31).
All operating segments are engaged in the business of leasing tower space for communication equipment and capacity leasing and services on fixed broadband networks to Mobile Network Operators (MNOs) and other customers (internet service providers, security functions or private corporations) and provide managed services in limited situations, such as maintenance, operations and leasing services, for certain towers owned by third parties within their respective geographic areas. However, they are managed and grouped within the four operating segments, which are primarily distinguished by reference to the scale of operations, to the similarity of their future prospects and long-term financial performance (i.e. margins and geographic basis).
The CODM primarily uses a measure of Segment Adjusted EBITDA (as defined in note 4(e)) to assess the performance of the business. The CODM also regularly receives information about the Group’s revenue, assets and liabilities. The Group has additional corporate costs which do not meet the quantitative thresholds to be separately reported and which are aggregated in ‘Other’ in the reconciliation of financial information presented below. These include costs associated with centralized Group functions including Group executive, legal, finance, tax and treasury services.
There are no revenue transactions which occur between operating segments. Intercompany finance income, finance costs and loans are not included in the amounts below.
The segment’s assets and liabilities are comprised of all assets and liabilities attributable to the segment, based on the operations of the segment and the physical location of the assets, including goodwill and other intangible assets and are measured in the same way as in the financial statements. Other assets and liabilities that are not attributable to Nigeria, SSA, Latam and MENA segments consist principally of amounts excluded from specific segments including costs incurred for and by Group functions not attributable directly to the operations of the reportable segments, share-based payment and any amounts due on debt held at Group level as the balances are not utilized in assessing each segment’s performance.
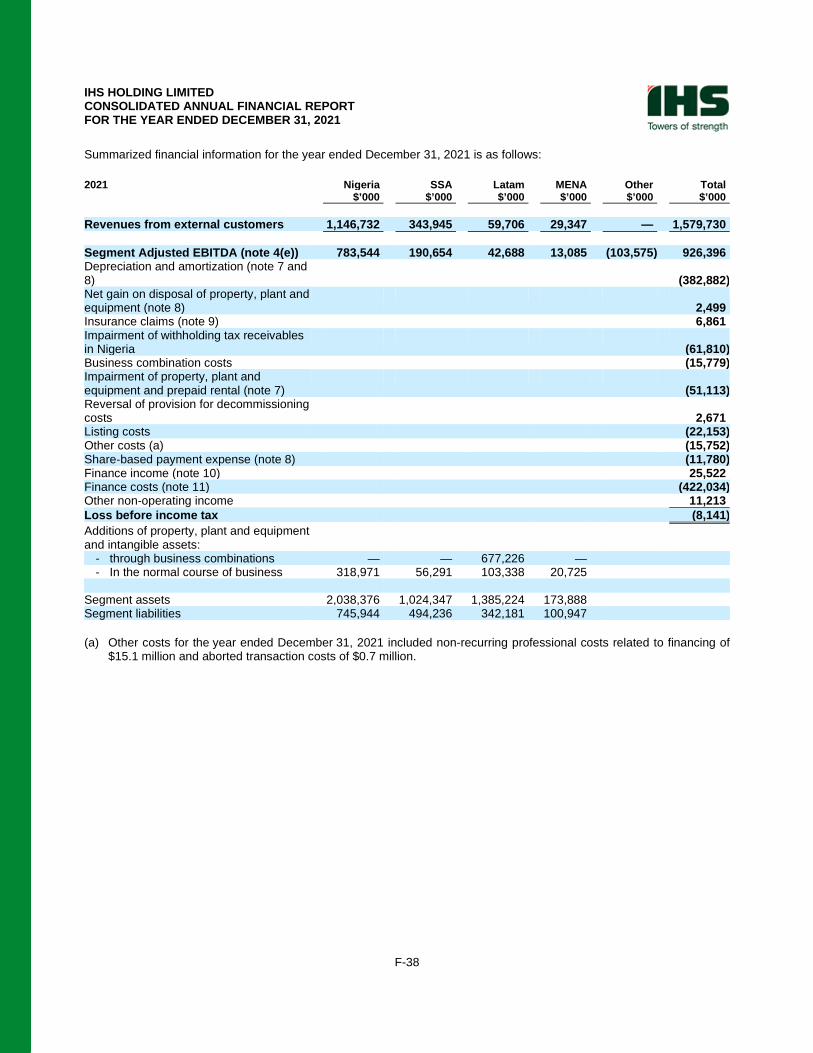
IHS HOLDING LIMITED CONSOLIDATED ANNUAL FINANCIAL REPORT FOR THE YEAR ENDED DECEMBER 31, 2021
F-38
Summarized financial information for the year ended December 31, 2021 is as follows:
2021 Nigeria SSA Latam MENA Other Total $’000 $’000 $’000 $’000 $’000 $’000 Revenues from external customers 1,146,732 343,945 59,706 29,347 — 1,579,730 Segment Adjusted EBITDA (note 4(e)) 783,544 190,654 42,688 13,085 (103,575) 926,396 Depreciation and amortization (note 7 and 8) (382,882) Net gain on disposal of property, plant and equipment (note 8) 2,499 Insurance claims (note 9) 6,861 Impairment of withholding tax receivables in Nigeria (61,810) Business combination costs (15,779) Impairment of property, plant and equipment and prepaid rental (note 7) (51,113) Reversal of provision for decommissioning costs 2,671 Listing costs (22,153) Other costs (a) (15,752) Share‑based payment expense (note 8) (11,780) Finance income (note 10) 25,522 Finance costs (note 11) (422,034) Other non-operating income 11,213 Loss before income tax (8,141) Additions of property, plant and equipment and intangible assets:
- through business combinations — — 677,226 — - In the normal course of business 318,971 56,291 103,338 20,725
Segment assets 2,038,376 1,024,347 1,385,224 173,888 Segment liabilities 745,944 494,236 342,181 100,947 (a) Other costs for the year ended December 31, 2021 included non-recurring professional costs related to financing of
$15.1 million and aborted transaction costs of $0.7 million.
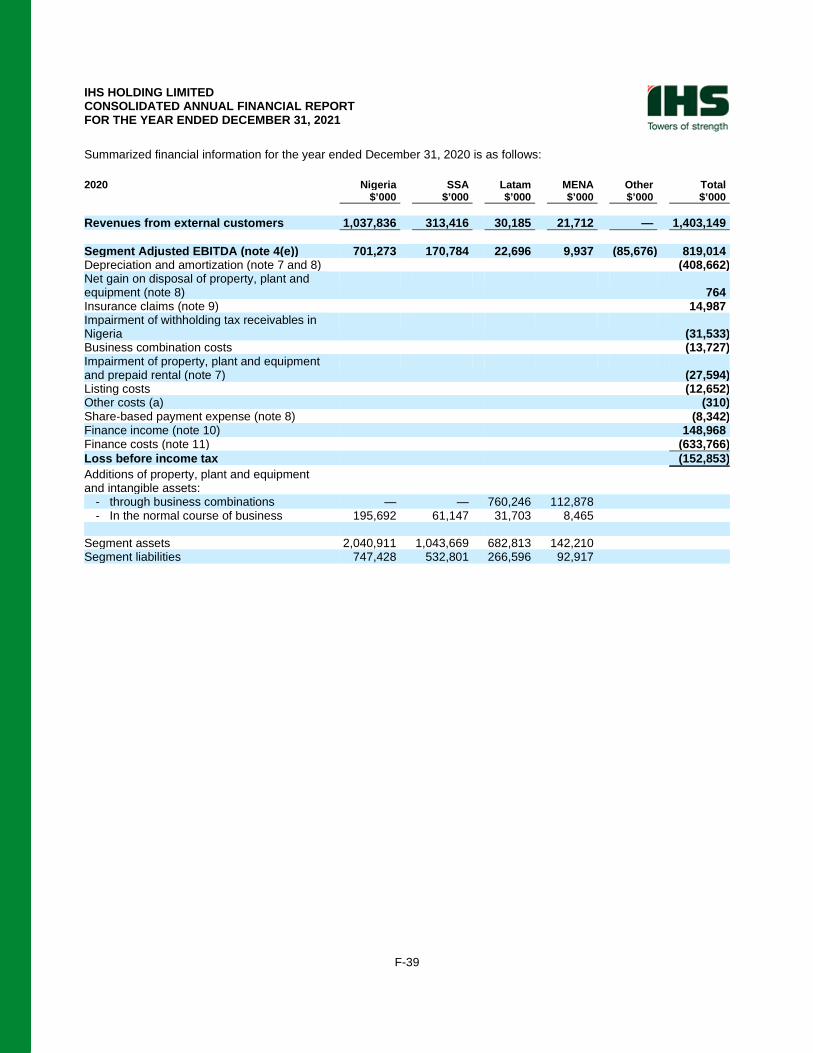
IHS HOLDING LIMITED CONSOLIDATED ANNUAL FINANCIAL REPORT FOR THE YEAR ENDED DECEMBER 31, 2021
F-39
Summarized financial information for the year ended December 31, 2020 is as follows:
2020 Nigeria SSA Latam MENA Other Total $’000 $’000 $’000 $’000 $’000 $’000 Revenues from external customers 1,037,836 313,416 30,185 21,712 — 1,403,149 Segment Adjusted EBITDA (note 4(e)) 701,273 170,784 22,696 9,937 (85,676) 819,014 Depreciation and amortization (note 7 and 8) (408,662) Net gain on disposal of property, plant and equipment (note 8) 764 Insurance claims (note 9) 14,987 Impairment of withholding tax receivables in Nigeria (31,533) Business combination costs (13,727) Impairment of property, plant and equipment and prepaid rental (note 7) (27,594) Listing costs (12,652) Other costs (a) (310) Share‑based payment expense (note 8) (8,342) Finance income (note 10) 148,968 Finance costs (note 11) (633,766) Loss before income tax (152,853) Additions of property, plant and equipment and intangible assets:
- through business combinations — — 760,246 112,878 - In the normal course of business 195,692 61,147 31,703 8,465
Segment assets 2,040,911 1,043,669 682,813 142,210 Segment liabilities 747,428 532,801 266,596 92,917
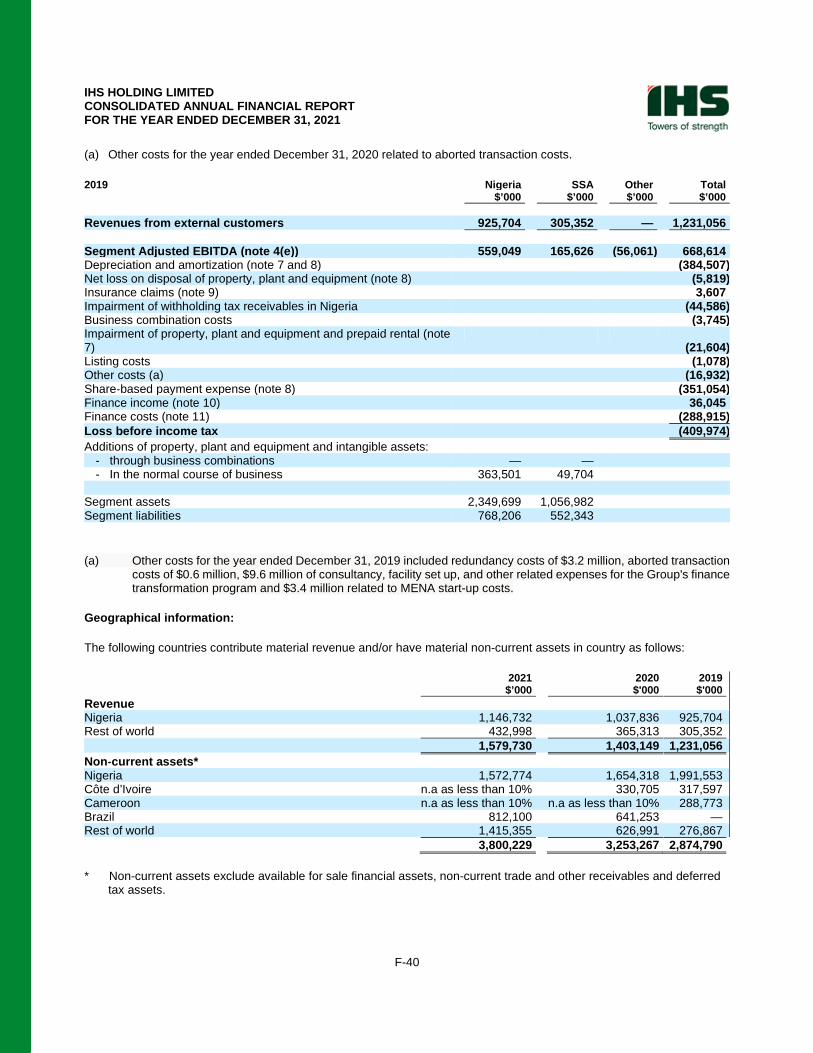
IHS HOLDING LIMITED CONSOLIDATED ANNUAL FINANCIAL REPORT FOR THE YEAR ENDED DECEMBER 31, 2021
F-40
(a) Other costs for the year ended December 31, 2020 related to aborted transaction costs.
2019 Nigeria SSA Other Total $’000 $’000 $’000 $’000 Revenues from external customers 925,704 305,352 — 1,231,056 Segment Adjusted EBITDA (note 4(e)) 559,049 165,626 (56,061) 668,614 Depreciation and amortization (note 7 and 8) (384,507) Net loss on disposal of property, plant and equipment (note 8) (5,819) Insurance claims (note 9) 3,607 Impairment of withholding tax receivables in Nigeria (44,586) Business combination costs (3,745) Impairment of property, plant and equipment and prepaid rental (note 7) (21,604) Listing costs (1,078) Other costs (a) (16,932) Share‑based payment expense (note 8) (351,054) Finance income (note 10) 36,045 Finance costs (note 11) (288,915) Loss before income tax (409,974) Additions of property, plant and equipment and intangible assets:
- through business combinations — — - In the normal course of business 363,501 49,704
Segment assets 2,349,699 1,056,982 Segment liabilities 768,206 552,343
(a) Other costs for the year ended December 31, 2019 included redundancy costs of $3.2 million, aborted transaction costs of $0.6 million, $9.6 million of consultancy, facility set up, and other related expenses for the Group's finance transformation program and $3.4 million related to MENA start-up costs.
Geographical information:
The following countries contribute material revenue and/or have material non-current assets in country as follows:
2021 2020 2019 $’000 $'000 $'000 Revenue Nigeria 1,146,732 1,037,836 925,704 Rest of world 432,998 365,313 305,352 1,579,730 1,403,149 1,231,056 Non‑current assets* Nigeria 1,572,774 1,654,318 1,991,553 Côte d’Ivoire n.a as less than 10% 330,705 317,597 Cameroon n.a as less than 10% n.a as less than 10% 288,773 Brazil 812,100 641,253 — Rest of world 1,415,355 626,991 276,867 3,800,229 3,253,267 2,874,790 * Non-current assets exclude available for sale financial assets, non-current trade and other receivables and deferred
tax assets.
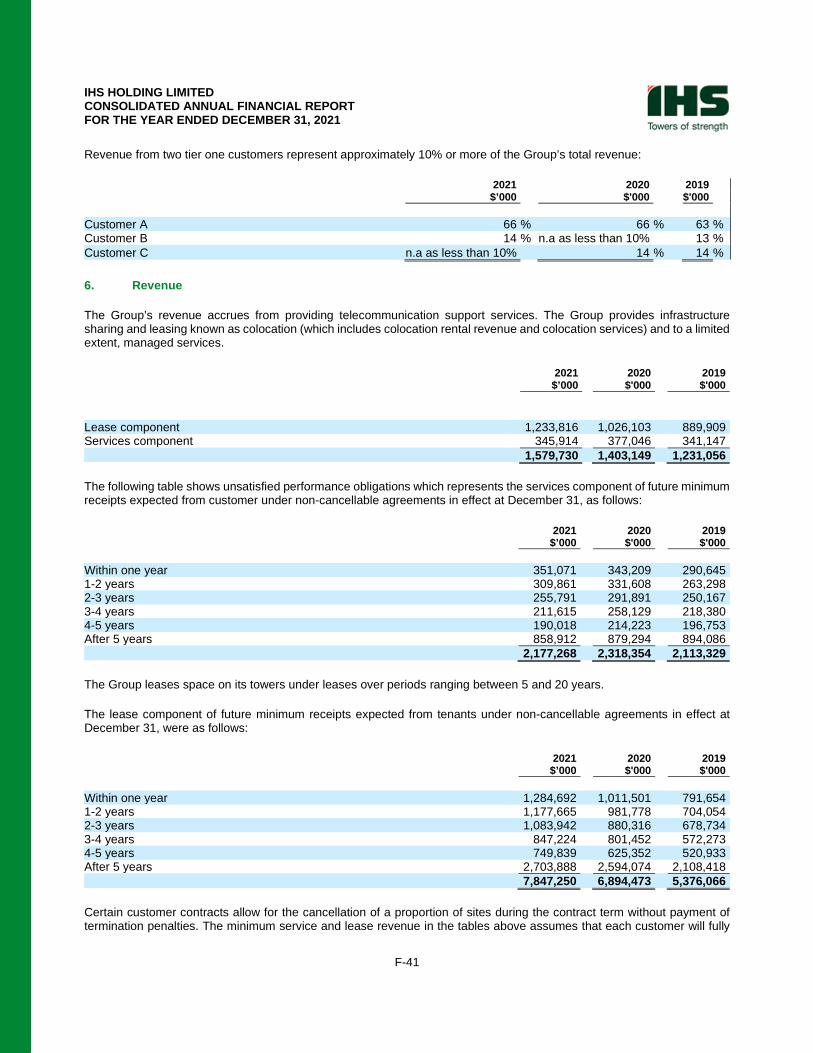
IHS HOLDING LIMITED CONSOLIDATED ANNUAL FINANCIAL REPORT FOR THE YEAR ENDED DECEMBER 31, 2021
F-41
Revenue from two tier one customers represent approximately 10% or more of the Group’s total revenue:
2021 2020 2019 $’000 $'000 $'000 Customer A 66 % 66 % 63 % Customer B 14 % n.a as less than 10% 13 % Customer C n.a as less than 10% 14 % 14 %
6. Revenue
The Group’s revenue accrues from providing telecommunication support services. The Group provides infrastructure sharing and leasing known as colocation (which includes colocation rental revenue and colocation services) and to a limited extent, managed services.
2021 2020 2019 $’000 $'000 $'000 Lease component 1,233,816 1,026,103 889,909 Services component 345,914 377,046 341,147 1,579,730 1,403,149 1,231,056 The following table shows unsatisfied performance obligations which represents the services component of future minimum receipts expected from customer under non-cancellable agreements in effect at December 31, as follows:
2021 2020 2019 $’000 $'000 $'000 Within one year 351,071 343,209 290,645 1-2 years 309,861 331,608 263,298 2-3 years 255,791 291,891 250,167 3-4 years 211,615 258,129 218,380 4-5 years 190,018 214,223 196,753 After 5 years 858,912 879,294 894,086 2,177,268 2,318,354 2,113,329 The Group leases space on its towers under leases over periods ranging between 5 and 20 years.
The lease component of future minimum receipts expected from tenants under non-cancellable agreements in effect at December 31, were as follows:
2021 2020 2019 $’000 $'000 $'000 Within one year 1,284,692 1,011,501 791,654 1-2 years 1,177,665 981,778 704,054 2-3 years 1,083,942 880,316 678,734 3-4 years 847,224 801,452 572,273 4-5 years 749,839 625,352 520,933 After 5 years 2,703,888 2,594,074 2,108,418 7,847,250 6,894,473 5,376,066 Certain customer contracts allow for the cancellation of a proportion of sites during the contract term without payment of termination penalties. The minimum service and lease revenue in the tables above assumes that each customer will fully
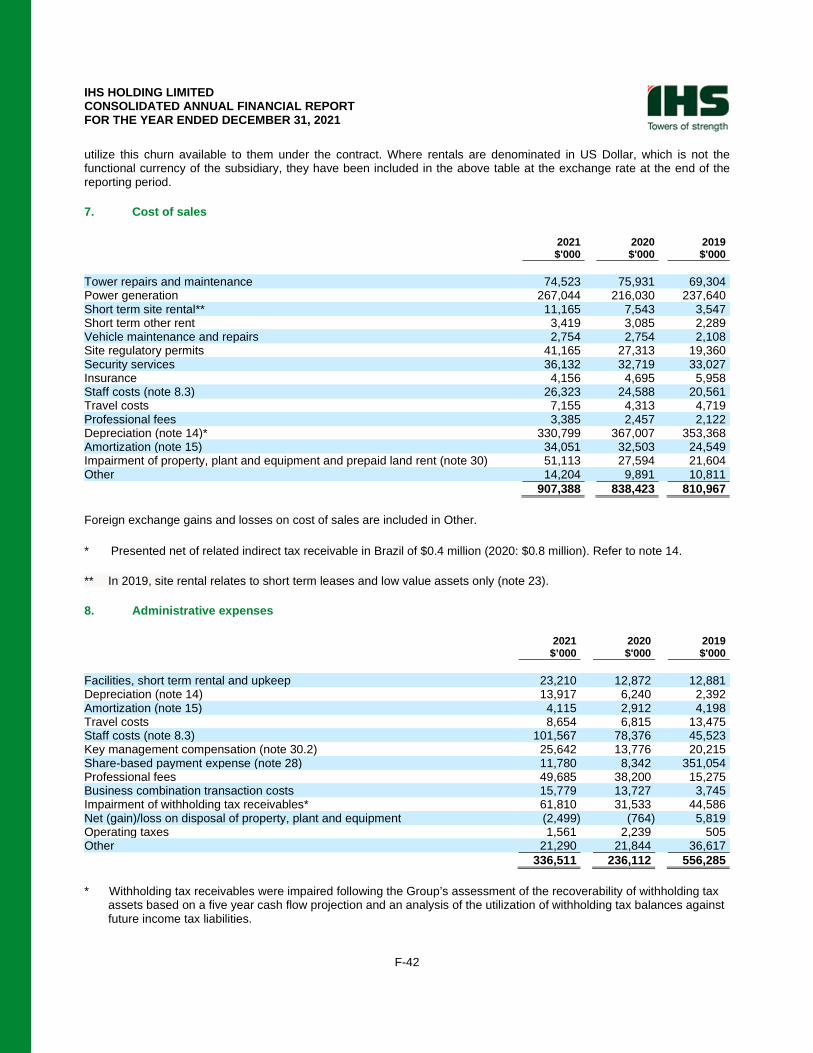
IHS HOLDING LIMITED CONSOLIDATED ANNUAL FINANCIAL REPORT FOR THE YEAR ENDED DECEMBER 31, 2021
F-42
utilize this churn available to them under the contract. Where rentals are denominated in US Dollar, which is not the functional currency of the subsidiary, they have been included in the above table at the exchange rate at the end of the reporting period.
7. Cost of sales
2021 2020 2019 $'000 $'000 $'000 Tower repairs and maintenance 74,523 75,931 69,304 Power generation 267,044 216,030 237,640 Short term site rental** 11,165 7,543 3,547 Short term other rent 3,419 3,085 2,289 Vehicle maintenance and repairs 2,754 2,754 2,108 Site regulatory permits 41,165 27,313 19,360 Security services 36,132 32,719 33,027 Insurance 4,156 4,695 5,958 Staff costs (note 8.3) 26,323 24,588 20,561 Travel costs 7,155 4,313 4,719 Professional fees 3,385 2,457 2,122 Depreciation (note 14)* 330,799 367,007 353,368 Amortization (note 15) 34,051 32,503 24,549 Impairment of property, plant and equipment and prepaid land rent (note 30) 51,113 27,594 21,604 Other 14,204 9,891 10,811 907,388 838,423 810,967 Foreign exchange gains and losses on cost of sales are included in Other.
* Presented net of related indirect tax receivable in Brazil of $0.4 million (2020: $0.8 million). Refer to note 14.
** In 2019, site rental relates to short term leases and low value assets only (note 23).
8. Administrative expenses
2021 2020 2019 $’000 $'000 $'000 Facilities, short term rental and upkeep 23,210 12,872 12,881 Depreciation (note 14) 13,917 6,240 2,392 Amortization (note 15) 4,115 2,912 4,198 Travel costs 8,654 6,815 13,475 Staff costs (note 8.3) 101,567 78,376 45,523 Key management compensation (note 30.2) 25,642 13,776 20,215 Share-based payment expense (note 28) 11,780 8,342 351,054 Professional fees 49,685 38,200 15,275 Business combination transaction costs 15,779 13,727 3,745 Impairment of withholding tax receivables* 61,810 31,533 44,586 Net (gain)/loss on disposal of property, plant and equipment (2,499) (764) 5,819 Operating taxes 1,561 2,239 505 Other 21,290 21,844 36,617 336,511 236,112 556,285 * Withholding tax receivables were impaired following the Group’s assessment of the recoverability of withholding tax
assets based on a five year cash flow projection and an analysis of the utilization of withholding tax balances against future income tax liabilities.
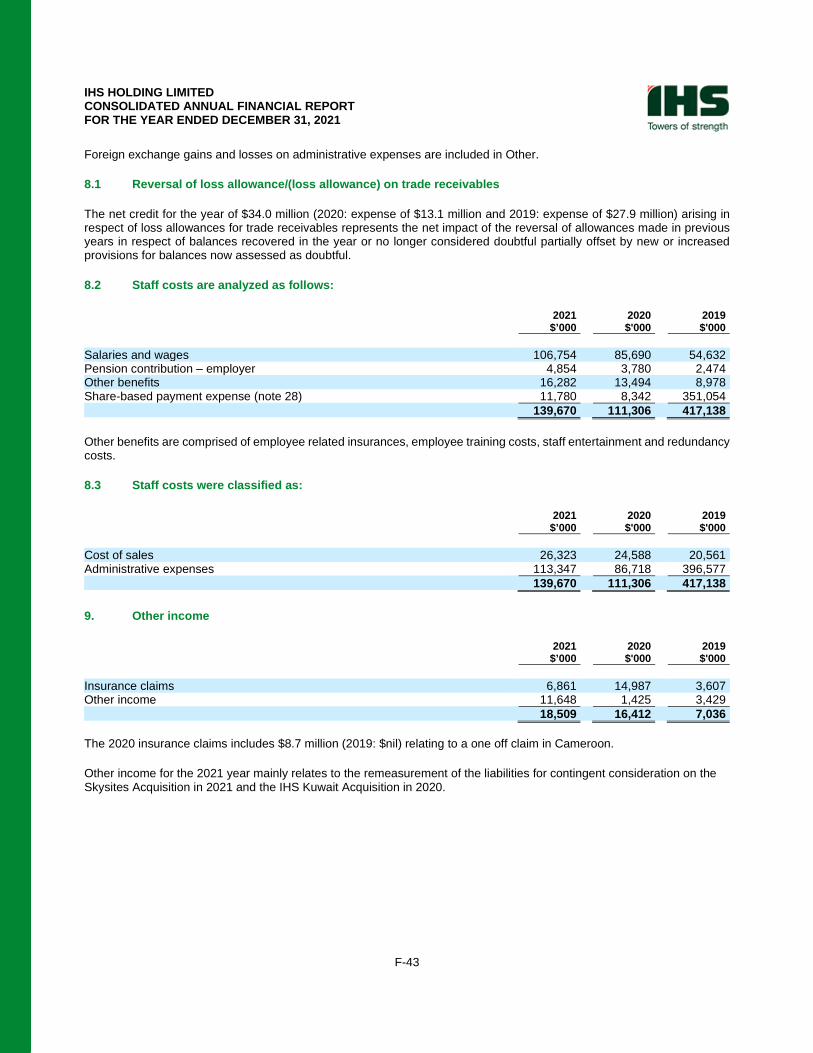
IHS HOLDING LIMITED CONSOLIDATED ANNUAL FINANCIAL REPORT FOR THE YEAR ENDED DECEMBER 31, 2021
F-43
Foreign exchange gains and losses on administrative expenses are included in Other.
8.1 Reversal of loss allowance/(loss allowance) on trade receivables
The net credit for the year of $34.0 million (2020: expense of $13.1 million and 2019: expense of $27.9 million) arising in respect of loss allowances for trade receivables represents the net impact of the reversal of allowances made in previous years in respect of balances recovered in the year or no longer considered doubtful partially offset by new or increased provisions for balances now assessed as doubtful.
8.2 Staff costs are analyzed as follows:
2021 2020 2019 $’000 $'000 $'000 Salaries and wages 106,754 85,690 54,632 Pension contribution – employer 4,854 3,780 2,474 Other benefits 16,282 13,494 8,978 Share-based payment expense (note 28) 11,780 8,342 351,054 139,670 111,306 417,138 Other benefits are comprised of employee related insurances, employee training costs, staff entertainment and redundancy costs.
8.3 Staff costs were classified as:
2021 2020 2019 $’000 $'000 $'000 Cost of sales 26,323 24,588 20,561 Administrative expenses 113,347 86,718 396,577 139,670 111,306 417,138
9. Other income
2021 2020 2019 $’000 $'000 $'000 Insurance claims 6,861 14,987 3,607 Other income 11,648 1,425 3,429 18,509 16,412 7,036 The 2020 insurance claims includes $8.7 million (2019: $nil) relating to a one off claim in Cameroon.
Other income for the 2021 year mainly relates to the remeasurement of the liabilities for contingent consideration on the Skysites Acquisition in 2021 and the IHS Kuwait Acquisition in 2020.
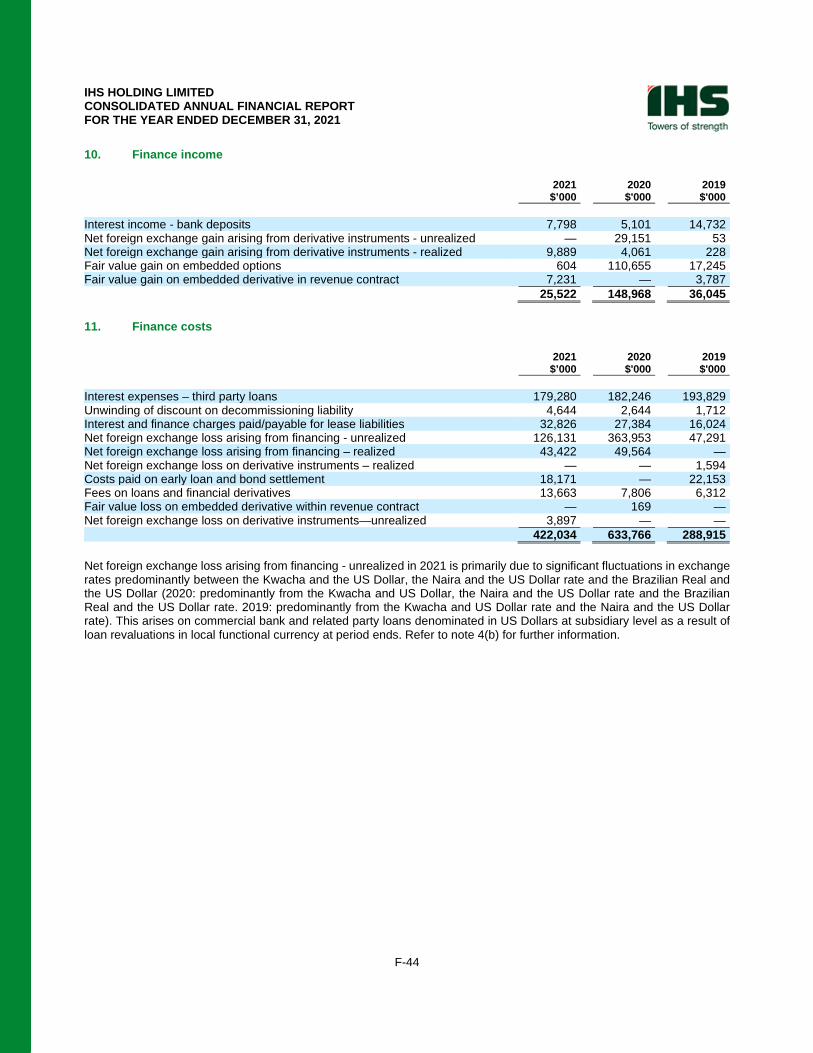
IHS HOLDING LIMITED CONSOLIDATED ANNUAL FINANCIAL REPORT FOR THE YEAR ENDED DECEMBER 31, 2021
F-44
10. Finance income
2021 2020 2019 $’000 $'000 $'000 Interest income - bank deposits 7,798 5,101 14,732 Net foreign exchange gain arising from derivative instruments - unrealized — 29,151 53 Net foreign exchange gain arising from derivative instruments - realized 9,889 4,061 228 Fair value gain on embedded options 604 110,655 17,245 Fair value gain on embedded derivative in revenue contract 7,231 — 3,787 25,522 148,968 36,045
11. Finance costs
2021 2020 2019 $’000 $'000 $'000 Interest expenses – third party loans 179,280 182,246 193,829 Unwinding of discount on decommissioning liability 4,644 2,644 1,712 Interest and finance charges paid/payable for lease liabilities 32,826 27,384 16,024 Net foreign exchange loss arising from financing - unrealized 126,131 363,953 47,291 Net foreign exchange loss arising from financing – realized 43,422 49,564 — Net foreign exchange loss on derivative instruments – realized — — 1,594 Costs paid on early loan and bond settlement 18,171 — 22,153 Fees on loans and financial derivatives 13,663 7,806 6,312 Fair value loss on embedded derivative within revenue contract — 169 — Net foreign exchange loss on derivative instruments—unrealized 3,897 — — 422,034 633,766 288,915 Net foreign exchange loss arising from financing - unrealized in 2021 is primarily due to significant fluctuations in exchange rates predominantly between the Kwacha and the US Dollar, the Naira and the US Dollar rate and the Brazilian Real and the US Dollar (2020: predominantly from the Kwacha and US Dollar, the Naira and the US Dollar rate and the Brazilian Real and the US Dollar rate. 2019: predominantly from the Kwacha and US Dollar rate and the Naira and the US Dollar rate). This arises on commercial bank and related party loans denominated in US Dollars at subsidiary level as a result of loan revaluations in local functional currency at period ends. Refer to note 4(b) for further information.
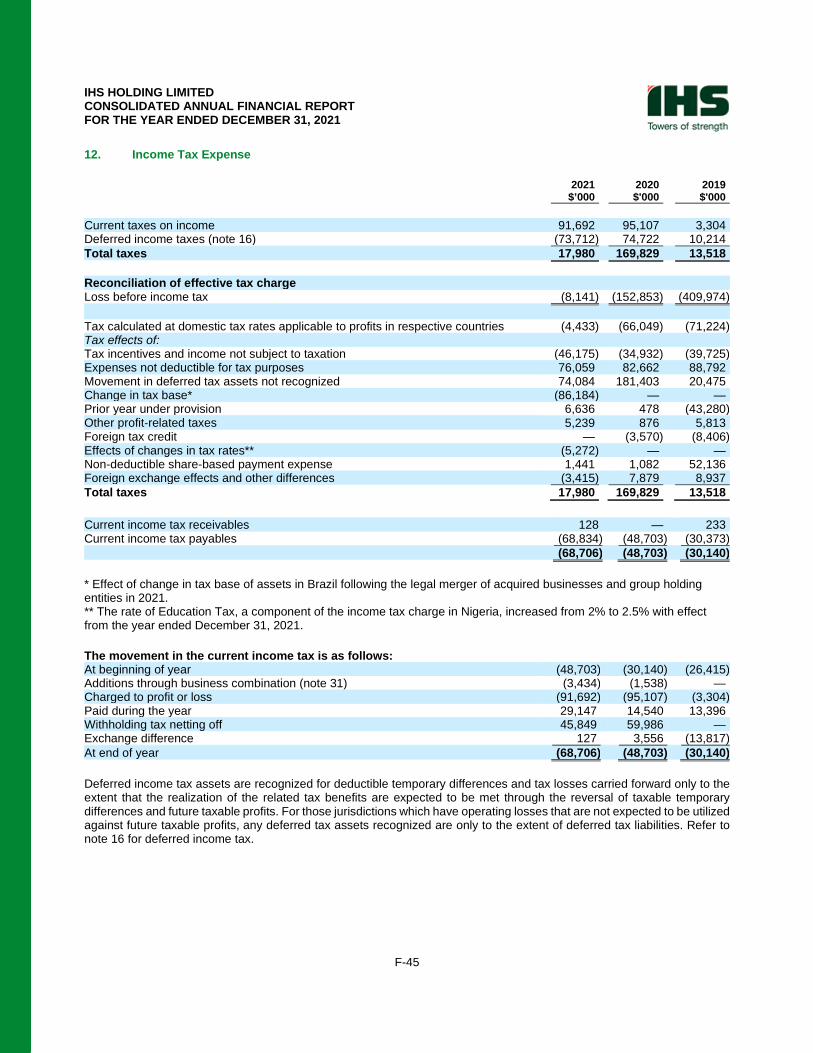
IHS HOLDING LIMITED CONSOLIDATED ANNUAL FINANCIAL REPORT FOR THE YEAR ENDED DECEMBER 31, 2021
F-45
12. Income Tax Expense
2021 2020 2019 $’000 $'000 $'000 Current taxes on income 91,692 95,107 3,304 Deferred income taxes (note 16) (73,712) 74,722 10,214 Total taxes 17,980 169,829 13,518 Reconciliation of effective tax charge Loss before income tax (8,141) (152,853) (409,974) Tax calculated at domestic tax rates applicable to profits in respective countries (4,433) (66,049) (71,224) Tax effects of: Tax incentives and income not subject to taxation (46,175) (34,932) (39,725) Expenses not deductible for tax purposes 76,059 82,662 88,792 Movement in deferred tax assets not recognized 74,084 181,403 20,475 Change in tax base* (86,184) — — Prior year under provision 6,636 478 (43,280) Other profit‑related taxes 5,239 876 5,813 Foreign tax credit — (3,570) (8,406) Effects of changes in tax rates** (5,272) — — Non-deductible share-based payment expense 1,441 1,082 52,136 Foreign exchange effects and other differences (3,415) 7,879 8,937 Total taxes 17,980 169,829 13,518
Current income tax receivables 128 — 233 Current income tax payables (68,834) (48,703) (30,373) (68,706) (48,703) (30,140) * Effect of change in tax base of assets in Brazil following the legal merger of acquired businesses and group holding entities in 2021. ** The rate of Education Tax, a component of the income tax charge in Nigeria, increased from 2% to 2.5% with effect from the year ended December 31, 2021.
The movement in the current income tax is as follows: At beginning of year (48,703) (30,140) (26,415) Additions through business combination (note 31) (3,434) (1,538) — Charged to profit or loss (91,692) (95,107) (3,304) Paid during the year 29,147 14,540 13,396 Withholding tax netting off 45,849 59,986 — Exchange difference 127 3,556 (13,817) At end of year (68,706) (48,703) (30,140) Deferred income tax assets are recognized for deductible temporary differences and tax losses carried forward only to the extent that the realization of the related tax benefits are expected to be met through the reversal of taxable temporary differences and future taxable profits. For those jurisdictions which have operating losses that are not expected to be utilized against future taxable profits, any deferred tax assets recognized are only to the extent of deferred tax liabilities. Refer to note 16 for deferred income tax.
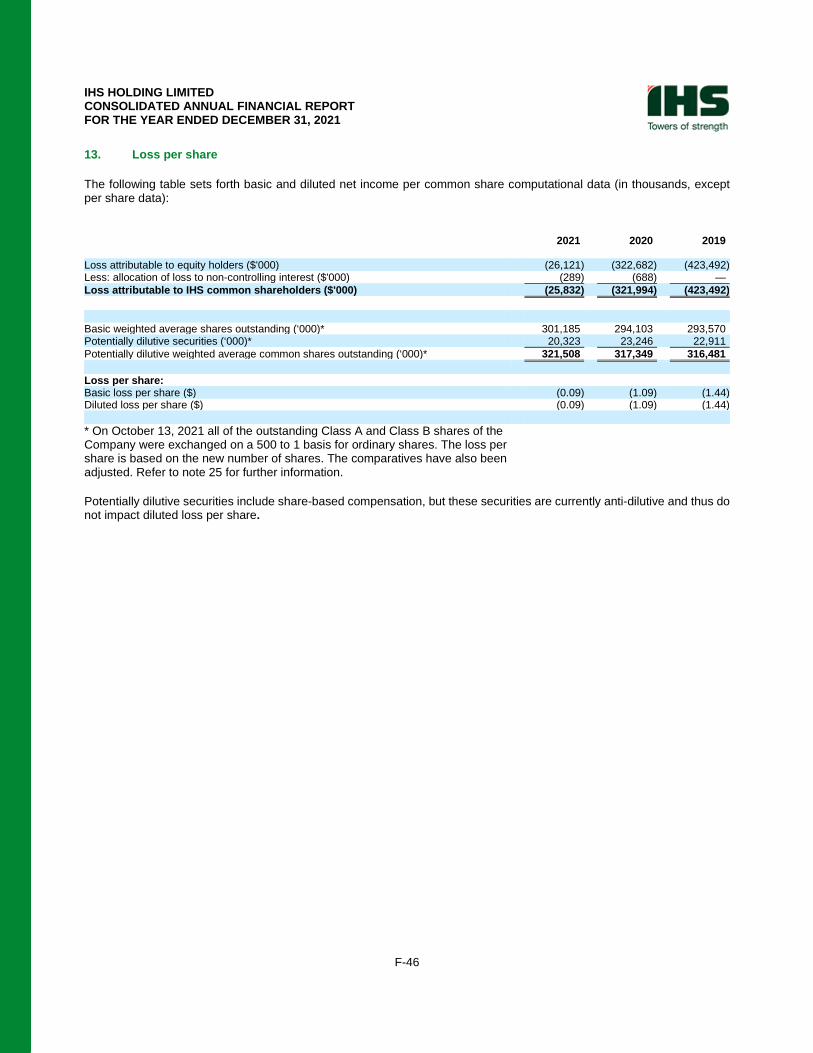
IHS HOLDING LIMITED CONSOLIDATED ANNUAL FINANCIAL REPORT FOR THE YEAR ENDED DECEMBER 31, 2021
F-46
13. Loss per share
The following table sets forth basic and diluted net income per common share computational data (in thousands, except per share data):
2021 2020 2019 Loss attributable to equity holders ($'000) (26,121) (322,682) (423,492) Less: allocation of loss to non-controlling interest ($'000) (289) (688) — Loss attributable to IHS common shareholders ($'000) (25,832) (321,994) (423,492) Basic weighted average shares outstanding (‘000)* 301,185 294,103 293,570 Potentially dilutive securities (‘000)* 20,323 23,246 22,911 Potentially dilutive weighted average common shares outstanding (‘000)* 321,508 317,349 316,481 Loss per share: Basic loss per share ($) (0.09) (1.09) (1.44) Diluted loss per share ($) (0.09) (1.09) (1.44) * On October 13, 2021 all of the outstanding Class A and Class B shares of the Company were exchanged on a 500 to 1 basis for ordinary shares. The loss per share is based on the new number of shares. The comparatives have also been adjusted. Refer to note 25 for further information. Potentially dilutive securities include share-based compensation, but these securities are currently anti-dilutive and thus do not impact diluted loss per share.
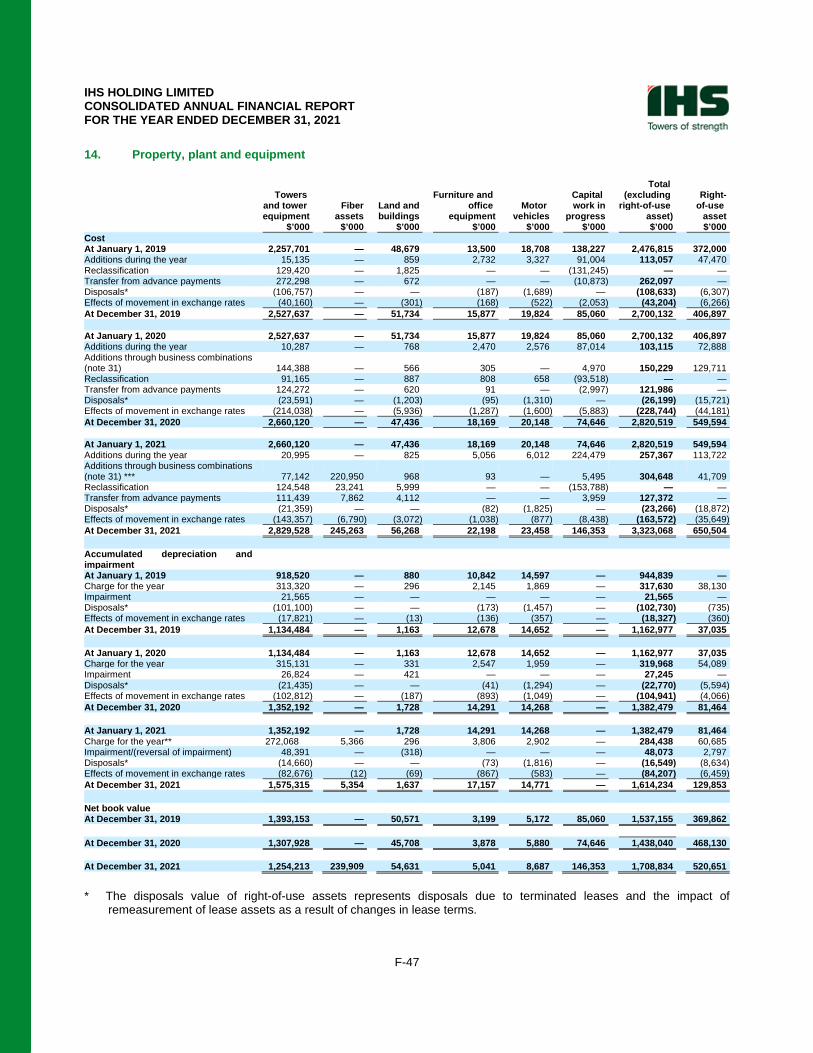
IHS HOLDING LIMITED CONSOLIDATED ANNUAL FINANCIAL REPORT FOR THE YEAR ENDED DECEMBER 31, 2021
F-47
14. Property, plant and equipment
Total Towers Furniture and Capital (excluding Right- and tower Fiber Land and office Motor work in right-of-use of-use equipment assets buildings equipment vehicles progress asset) asset $’000 $’000 $’000 $’000 $’000 $’000 $’000 $’000 Cost At January 1, 2019 2,257,701 — 48,679 13,500 18,708 138,227 2,476,815 372,000 Additions during the year 15,135 — 859 2,732 3,327 91,004 113,057 47,470 Reclassification 129,420 — 1,825 — — (131,245) — — Transfer from advance payments 272,298 — 672 — — (10,873) 262,097 — Disposals* (106,757) — — (187) (1,689) — (108,633) (6,307) Effects of movement in exchange rates (40,160) — (301) (168) (522) (2,053) (43,204) (6,266) At December 31, 2019 2,527,637 — 51,734 15,877 19,824 85,060 2,700,132 406,897 At January 1, 2020 2,527,637 — 51,734 15,877 19,824 85,060 2,700,132 406,897 Additions during the year 10,287 — 768 2,470 2,576 87,014 103,115 72,888 Additions through business combinations (note 31) 144,388 — 566 305 — 4,970 150,229 129,711 Reclassification 91,165 — 887 808 658 (93,518) — — Transfer from advance payments 124,272 — 620 91 — (2,997) 121,986 — Disposals* (23,591) — (1,203) (95) (1,310) — (26,199) (15,721) Effects of movement in exchange rates (214,038) — (5,936) (1,287) (1,600) (5,883) (228,744) (44,181) At December 31, 2020 2,660,120 — 47,436 18,169 20,148 74,646 2,820,519 549,594 At January 1, 2021 2,660,120 — 47,436 18,169 20,148 74,646 2,820,519 549,594 Additions during the year 20,995 — 825 5,056 6,012 224,479 257,367 113,722 Additions through business combinations (note 31) *** 77,142 220,950 968 93 — 5,495 304,648 41,709 Reclassification 124,548 23,241 5,999 — — (153,788) — — Transfer from advance payments 111,439 7,862 4,112 — — 3,959 127,372 — Disposals* (21,359) — — (82) (1,825) — (23,266) (18,872) Effects of movement in exchange rates (143,357) (6,790) (3,072) (1,038) (877) (8,438) (163,572) (35,649) At December 31, 2021 2,829,528 245,263 56,268 22,198 23,458 146,353 3,323,068 650,504 Accumulated depreciation and impairment At January 1, 2019 918,520 — 880 10,842 14,597 — 944,839 — Charge for the year 313,320 — 296 2,145 1,869 — 317,630 38,130 Impairment 21,565 — — — — — 21,565 — Disposals* (101,100) — — (173) (1,457) — (102,730) (735) Effects of movement in exchange rates (17,821) — (13) (136) (357) — (18,327) (360) At December 31, 2019 1,134,484 — 1,163 12,678 14,652 — 1,162,977 37,035 At January 1, 2020 1,134,484 — 1,163 12,678 14,652 — 1,162,977 37,035 Charge for the year 315,131 — 331 2,547 1,959 — 319,968 54,089 Impairment 26,824 — 421 — — — 27,245 — Disposals* (21,435) — — (41) (1,294) — (22,770) (5,594) Effects of movement in exchange rates (102,812) — (187) (893) (1,049) — (104,941) (4,066) At December 31, 2020 1,352,192 — 1,728 14,291 14,268 — 1,382,479 81,464 At January 1, 2021 1,352,192 — 1,728 14,291 14,268 — 1,382,479 81,464 Charge for the year** 272,068 5,366 296 3,806 2,902 — 284,438 60,685 Impairment/(reversal of impairment) 48,391 — (318) — — — 48,073 2,797 Disposals* (14,660) — — (73) (1,816) — (16,549) (8,634) Effects of movement in exchange rates (82,676) (12) (69) (867) (583) — (84,207) (6,459) At December 31, 2021 1,575,315 5,354 1,637 17,157 14,771 — 1,614,234 129,853 Net book value At December 31, 2019 1,393,153 — 50,571 3,199 5,172 85,060 1,537,155 369,862 At December 31, 2020 1,307,928 — 45,708 3,878 5,880 74,646 1,438,040 468,130 At December 31, 2021 1,254,213 239,909 54,631 5,041 8,687 146,353 1,708,834 520,651 * The disposals value of right-of-use assets represents disposals due to terminated leases and the impact of
remeasurement of lease assets as a result of changes in lease terms.
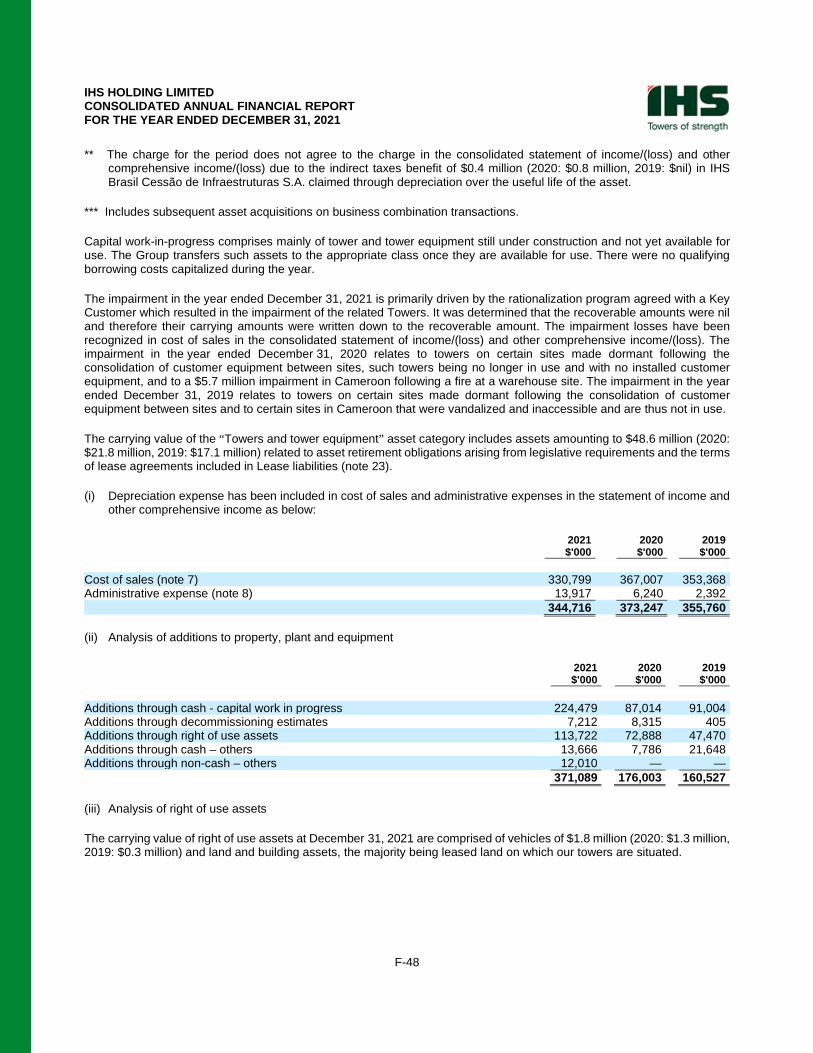
IHS HOLDING LIMITED CONSOLIDATED ANNUAL FINANCIAL REPORT FOR THE YEAR ENDED DECEMBER 31, 2021
F-48
** The charge for the period does not agree to the charge in the consolidated statement of income/(loss) and other comprehensive income/(loss) due to the indirect taxes benefit of $0.4 million (2020: $0.8 million, 2019: $nil) in IHS Brasil Cessão de Infraestruturas S.A. claimed through depreciation over the useful life of the asset.
*** Includes subsequent asset acquisitions on business combination transactions.
Capital work-in-progress comprises mainly of tower and tower equipment still under construction and not yet available for use. The Group transfers such assets to the appropriate class once they are available for use. There were no qualifying borrowing costs capitalized during the year.
The impairment in the year ended December 31, 2021 is primarily driven by the rationalization program agreed with a Key Customer which resulted in the impairment of the related Towers. It was determined that the recoverable amounts were nil and therefore their carrying amounts were written down to the recoverable amount. The impairment losses have been recognized in cost of sales in the consolidated statement of income/(loss) and other comprehensive income/(loss). The impairment in the year ended December 31, 2020 relates to towers on certain sites made dormant following the consolidation of customer equipment between sites, such towers being no longer in use and with no installed customer equipment, and to a $5.7 million impairment in Cameroon following a fire at a warehouse site. The impairment in the year ended December 31, 2019 relates to towers on certain sites made dormant following the consolidation of customer equipment between sites and to certain sites in Cameroon that were vandalized and inaccessible and are thus not in use.
The carrying value of the “Towers and tower equipment” asset category includes assets amounting to $48.6 million (2020: $21.8 million, 2019: $17.1 million) related to asset retirement obligations arising from legislative requirements and the terms of lease agreements included in Lease liabilities (note 23).
(i) Depreciation expense has been included in cost of sales and administrative expenses in the statement of income and other comprehensive income as below:
2021 2020 2019 $'000 $'000 $'000 Cost of sales (note 7) 330,799 367,007 353,368 Administrative expense (note 8) 13,917 6,240 2,392 344,716 373,247 355,760 (ii) Analysis of additions to property, plant and equipment
2021 2020 2019 $'000 $'000 $'000 Additions through cash - capital work in progress 224,479 87,014 91,004 Additions through decommissioning estimates 7,212 8,315 405 Additions through right of use assets 113,722 72,888 47,470 Additions through cash – others 13,666 7,786 21,648 Additions through non-cash – others 12,010 — — 371,089 176,003 160,527 (iii) Analysis of right of use assets
The carrying value of right of use assets at December 31, 2021 are comprised of vehicles of $1.8 million (2020: $1.3 million, 2019: $0.3 million) and land and building assets, the majority being leased land on which our towers are situated.
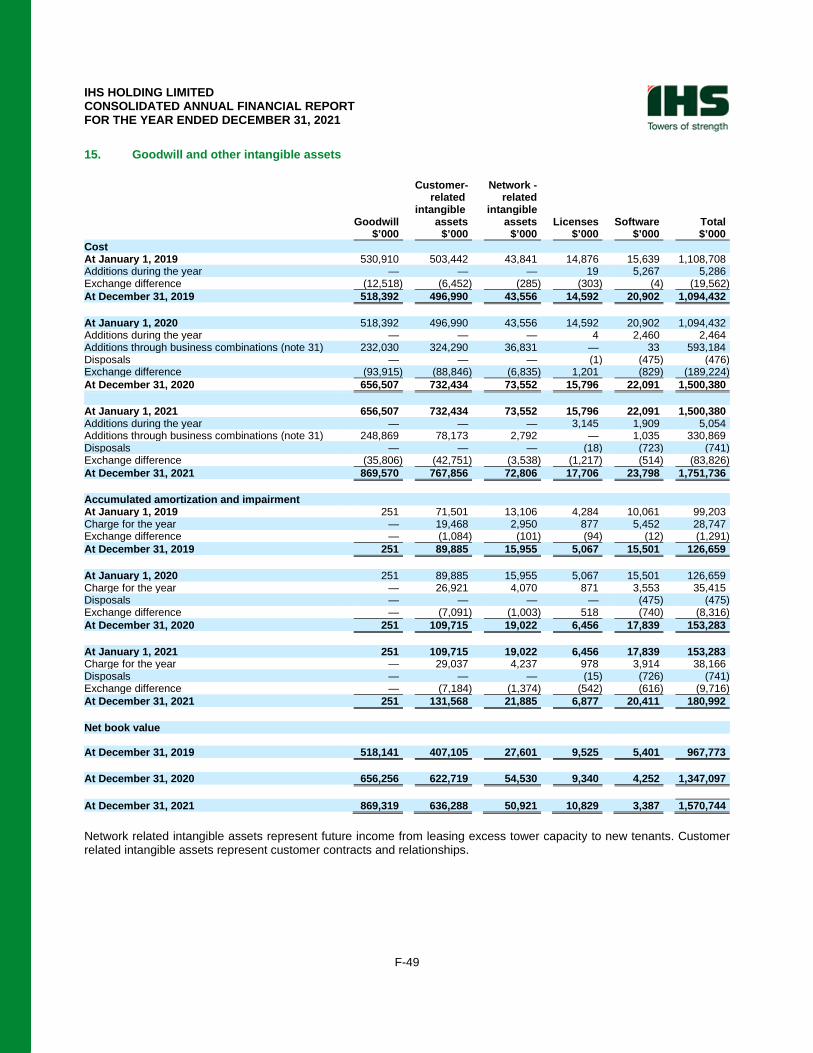
IHS HOLDING LIMITED CONSOLIDATED ANNUAL FINANCIAL REPORT FOR THE YEAR ENDED DECEMBER 31, 2021
F-49
15. Goodwill and other intangible assets
Customer- Network - related related intangible intangible Goodwill assets assets Licenses Software Total $’000 $’000 $’000 $’000 $’000 $’000 Cost At January 1, 2019 530,910 503,442 43,841 14,876 15,639 1,108,708 Additions during the year — — — 19 5,267 5,286 Exchange difference (12,518) (6,452) (285) (303) (4) (19,562) At December 31, 2019 518,392 496,990 43,556 14,592 20,902 1,094,432 At January 1, 2020 518,392 496,990 43,556 14,592 20,902 1,094,432 Additions during the year — — — 4 2,460 2,464 Additions through business combinations (note 31) 232,030 324,290 36,831 — 33 593,184 Disposals — — — (1) (475) (476) Exchange difference (93,915) (88,846) (6,835) 1,201 (829) (189,224) At December 31, 2020 656,507 732,434 73,552 15,796 22,091 1,500,380 At January 1, 2021 656,507 732,434 73,552 15,796 22,091 1,500,380 Additions during the year — — — 3,145 1,909 5,054 Additions through business combinations (note 31) 248,869 78,173 2,792 — 1,035 330,869 Disposals — — — (18) (723) (741) Exchange difference (35,806) (42,751) (3,538) (1,217) (514) (83,826) At December 31, 2021 869,570 767,856 72,806 17,706 23,798 1,751,736 Accumulated amortization and impairment At January 1, 2019 251 71,501 13,106 4,284 10,061 99,203 Charge for the year — 19,468 2,950 877 5,452 28,747 Exchange difference — (1,084) (101) (94) (12) (1,291) At December 31, 2019 251 89,885 15,955 5,067 15,501 126,659 At January 1, 2020 251 89,885 15,955 5,067 15,501 126,659 Charge for the year — 26,921 4,070 871 3,553 35,415 Disposals — — — — (475) (475) Exchange difference — (7,091) (1,003) 518 (740) (8,316) At December 31, 2020 251 109,715 19,022 6,456 17,839 153,283 At January 1, 2021 251 109,715 19,022 6,456 17,839 153,283 Charge for the year — 29,037 4,237 978 3,914 38,166 Disposals — — — (15) (726) (741) Exchange difference — (7,184) (1,374) (542) (616) (9,716) At December 31, 2021 251 131,568 21,885 6,877 20,411 180,992 Net book value At December 31, 2019 518,141 407,105 27,601 9,525 5,401 967,773 At December 31, 2020 656,256 622,719 54,530 9,340 4,252 1,347,097 At December 31, 2021 869,319 636,288 50,921 10,829 3,387 1,570,744 Network related intangible assets represent future income from leasing excess tower capacity to new tenants. Customer related intangible assets represent customer contracts and relationships.
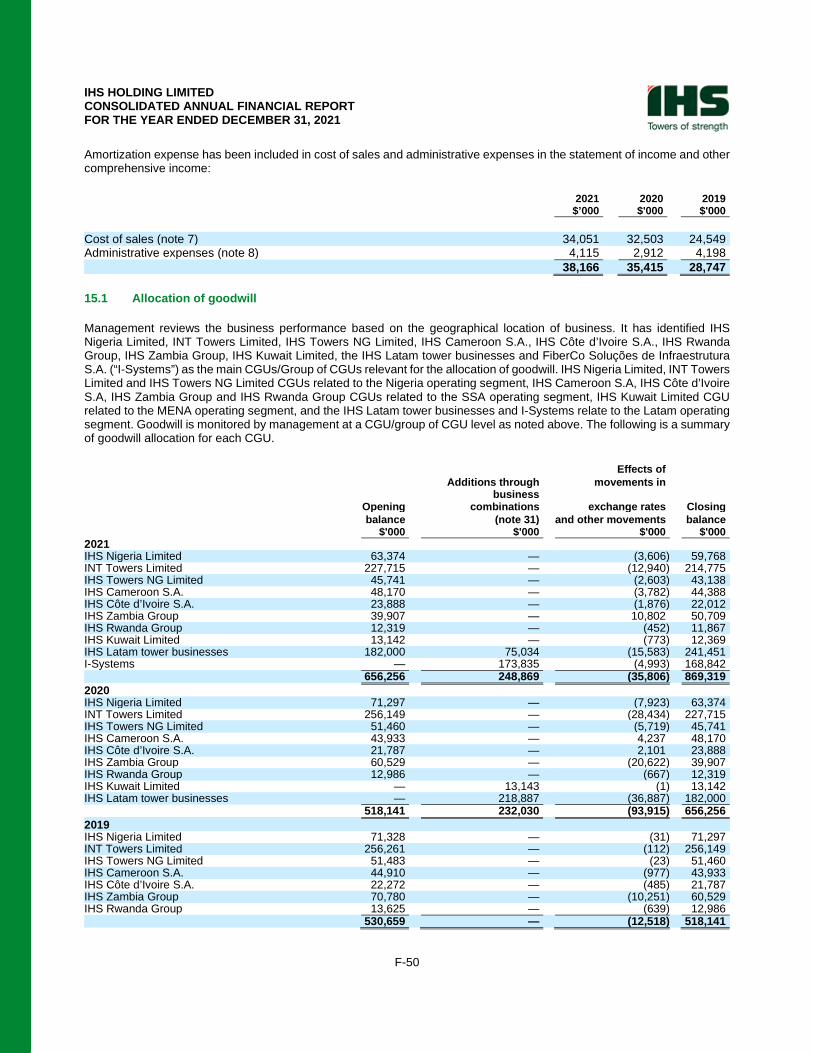
IHS HOLDING LIMITED CONSOLIDATED ANNUAL FINANCIAL REPORT FOR THE YEAR ENDED DECEMBER 31, 2021
F-50
Amortization expense has been included in cost of sales and administrative expenses in the statement of income and other comprehensive income:
2021 2020 2019 $’000 $'000 $'000 Cost of sales (note 7) 34,051 32,503 24,549 Administrative expenses (note 8) 4,115 2,912 4,198 38,166 35,415 28,747 15.1 Allocation of goodwill
Management reviews the business performance based on the geographical location of business. It has identified IHS Nigeria Limited, INT Towers Limited, IHS Towers NG Limited, IHS Cameroon S.A., IHS Côte d’Ivoire S.A., IHS Rwanda Group, IHS Zambia Group, IHS Kuwait Limited, the IHS Latam tower businesses and FiberCo Soluções de Infraestrutura S.A. (“I-Systems”) as the main CGUs/Group of CGUs relevant for the allocation of goodwill. IHS Nigeria Limited, INT Towers Limited and IHS Towers NG Limited CGUs related to the Nigeria operating segment, IHS Cameroon S.A, IHS Côte d’Ivoire S.A, IHS Zambia Group and IHS Rwanda Group CGUs related to the SSA operating segment, IHS Kuwait Limited CGU related to the MENA operating segment, and the IHS Latam tower businesses and I-Systems relate to the Latam operating segment. Goodwill is monitored by management at a CGU/group of CGU level as noted above. The following is a summary of goodwill allocation for each CGU.
Effects of Additions through movements in
Opening business
combinations exchange rates Closing balance (note 31) and other movements balance $'000 $'000 $'000 $'000 2021 IHS Nigeria Limited 63,374 — (3,606) 59,768 INT Towers Limited 227,715 — (12,940) 214,775 IHS Towers NG Limited 45,741 — (2,603) 43,138 IHS Cameroon S.A. 48,170 — (3,782) 44,388 IHS Côte d’Ivoire S.A. 23,888 — (1,876) 22,012 IHS Zambia Group 39,907 — 10,802 50,709 IHS Rwanda Group 12,319 — (452) 11,867 IHS Kuwait Limited 13,142 — (773) 12,369 IHS Latam tower businesses 182,000 75,034 (15,583) 241,451 I-Systems — 173,835 (4,993) 168,842 656,256 248,869 (35,806) 869,319 2020 IHS Nigeria Limited 71,297 — (7,923) 63,374 INT Towers Limited 256,149 — (28,434) 227,715 IHS Towers NG Limited 51,460 — (5,719) 45,741 IHS Cameroon S.A. 43,933 — 4,237 48,170 IHS Côte d’Ivoire S.A. 21,787 — 2,101 23,888 IHS Zambia Group 60,529 — (20,622) 39,907 IHS Rwanda Group 12,986 — (667) 12,319 IHS Kuwait Limited — 13,143 (1) 13,142 IHS Latam tower businesses — 218,887 (36,887) 182,000 518,141 232,030 (93,915) 656,256 2019 IHS Nigeria Limited 71,328 — (31) 71,297 INT Towers Limited 256,261 — (112) 256,149 IHS Towers NG Limited 51,483 — (23) 51,460 IHS Cameroon S.A. 44,910 — (977) 43,933 IHS Côte d’Ivoire S.A. 22,272 — (485) 21,787 IHS Zambia Group 70,780 — (10,251) 60,529 IHS Rwanda Group 13,625 — (639) 12,986 530,659 — (12,518) 518,141
IHS HOLDING LIMITED CONSOLIDATED ANNUAL FINANCIAL REPORT FOR THE YEAR ENDED DECEMBER 31, 2021
F-51
The recoverable amount of each CGU, except for the IHS Latam tower businesses group of CGUs, was determined based on value in use calculations. The recoverable amount of the IHS Latam tower businesses group of CGUs was determined based on fair value less costs of disposal.
(a) Recoverable amounts based on value in use
These calculations used pre-tax cash flow projections based on the financial budgets approved by management covering a five-year period. Within the five-year period, revenue growth rates are based on past experience and expected future developments in the Group’s CGUs. The weighted average growth rates used are consistent with the forecasts included in industry reports. Cash flows beyond the five-year period were valued using the estimated terminal growth rates stated below. The terminal growth rates did not exceed the long-term average growth rate for the infrastructure business in which each CGU operates.
The key assumptions to which the value-in-use calculations are most sensitive are:
• revenue assumptions (taking into account tenancy rates), and the direct effect these have on gross profit margins in the five year forecast period;
• discount rates;
• gross margins; and
• terminal growth rates.
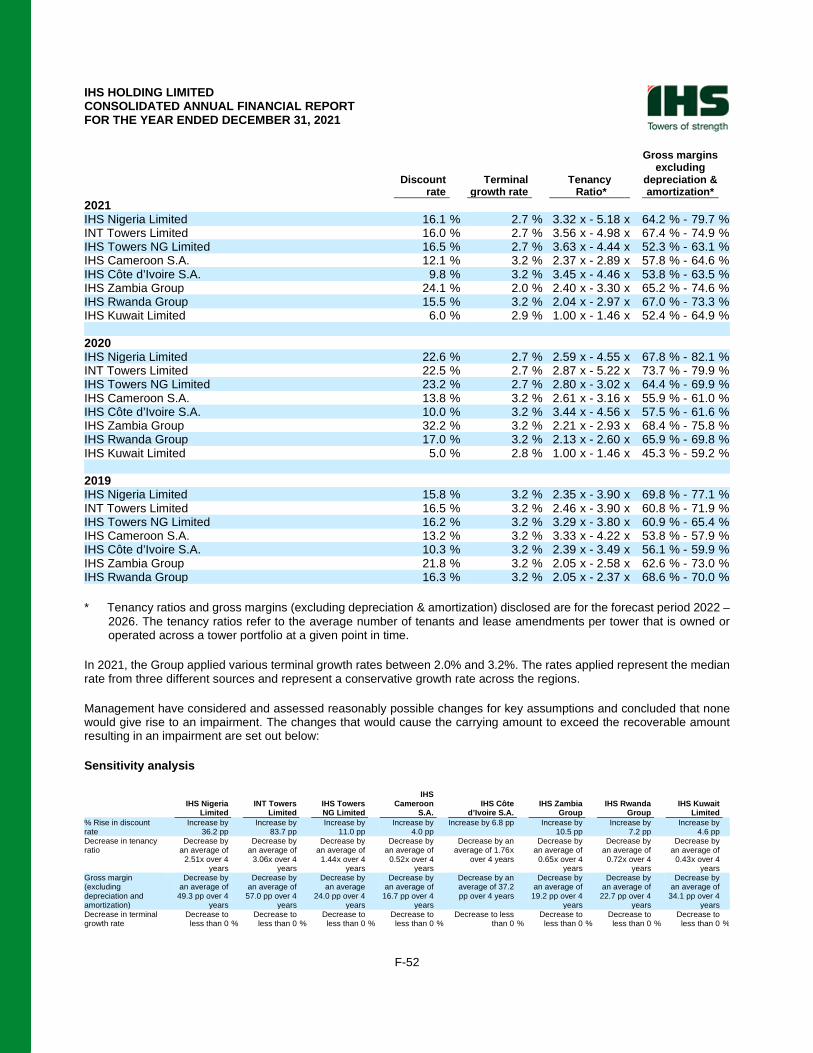
IHS HOLDING LIMITED CONSOLIDATED ANNUAL FINANCIAL REPORT FOR THE YEAR ENDED DECEMBER 31, 2021
F-52
Discount Terminal Tenancy
Gross margins excluding
depreciation & rate growth rate Ratio* amortization* 2021 IHS Nigeria Limited 16.1 % 2.7 % 3.32 x - 5.18 x 64.2 % - 79.7 % INT Towers Limited 16.0 % 2.7 % 3.56 x - 4.98 x 67.4 % - 74.9 % IHS Towers NG Limited 16.5 % 2.7 % 3.63 x - 4.44 x 52.3 % - 63.1 % IHS Cameroon S.A. 12.1 % 3.2 % 2.37 x - 2.89 x 57.8 % - 64.6 % IHS Côte d’Ivoire S.A. 9.8 % 3.2 % 3.45 x - 4.46 x 53.8 % - 63.5 % IHS Zambia Group 24.1 % 2.0 % 2.40 x - 3.30 x 65.2 % - 74.6 % IHS Rwanda Group 15.5 % 3.2 % 2.04 x - 2.97 x 67.0 % - 73.3 % IHS Kuwait Limited 6.0 % 2.9 % 1.00 x - 1.46 x 52.4 % - 64.9 % 2020 IHS Nigeria Limited 22.6 % 2.7 % 2.59 x - 4.55 x 67.8 % - 82.1 % INT Towers Limited 22.5 % 2.7 % 2.87 x - 5.22 x 73.7 % - 79.9 % IHS Towers NG Limited 23.2 % 2.7 % 2.80 x - 3.02 x 64.4 % - 69.9 % IHS Cameroon S.A. 13.8 % 3.2 % 2.61 x - 3.16 x 55.9 % - 61.0 % IHS Côte d’Ivoire S.A. 10.0 % 3.2 % 3.44 x - 4.56 x 57.5 % - 61.6 % IHS Zambia Group 32.2 % 3.2 % 2.21 x - 2.93 x 68.4 % - 75.8 % IHS Rwanda Group 17.0 % 3.2 % 2.13 x - 2.60 x 65.9 % - 69.8 % IHS Kuwait Limited 5.0 % 2.8 % 1.00 x - 1.46 x 45.3 % - 59.2 % 2019 IHS Nigeria Limited 15.8 % 3.2 % 2.35 x - 3.90 x 69.8 % - 77.1 % INT Towers Limited 16.5 % 3.2 % 2.46 x - 3.90 x 60.8 % - 71.9 % IHS Towers NG Limited 16.2 % 3.2 % 3.29 x - 3.80 x 60.9 % - 65.4 % IHS Cameroon S.A. 13.2 % 3.2 % 3.33 x - 4.22 x 53.8 % - 57.9 % IHS Côte d’Ivoire S.A. 10.3 % 3.2 % 2.39 x - 3.49 x 56.1 % - 59.9 % IHS Zambia Group 21.8 % 3.2 % 2.05 x - 2.58 x 62.6 % - 73.0 % IHS Rwanda Group 16.3 % 3.2 % 2.05 x - 2.37 x 68.6 % - 70.0 % * Tenancy ratios and gross margins (excluding depreciation & amortization) disclosed are for the forecast period 2022 –
2026. The tenancy ratios refer to the average number of tenants and lease amendments per tower that is owned or operated across a tower portfolio at a given point in time.
In 2021, the Group applied various terminal growth rates between 2.0% and 3.2%. The rates applied represent the median rate from three different sources and represent a conservative growth rate across the regions.
Management have considered and assessed reasonably possible changes for key assumptions and concluded that none would give rise to an impairment. The changes that would cause the carrying amount to exceed the recoverable amount resulting in an impairment are set out below:
Sensitivity analysis
IHS IHS Nigeria INT Towers IHS Towers Cameroon IHS Côte IHS Zambia IHS Rwanda IHS Kuwait Limited Limited NG Limited S.A. d’Ivoire S.A. Group Group Limited
% Rise in discount rate
Increase by 36.2 pp
Increase by 83.7 pp
Increase by 11.0 pp
Increase by 4.0 pp
Increase by 6.8 pp
Increase by 10.5 pp
Increase by 7.2 pp
Increase by 4.6 pp
Decrease in tenancy ratio
Decrease by an average of
2.51x over 4 years
Decrease by an average of
3.06x over 4 years
Decrease by an average of
1.44 x over 4 years
Decrease by an average of
0.52 x over 4 years
Decrease by an average of 1.76 x
over 4 years
Decrease by an average of
0.65 x over 4 years
Decrease by an average of
0.72 x over 4 years
Decrease by an average of
0.43 x over 4 years
Gross margin (excluding depreciation and amortization)
Decrease by an average of
49.3 pp over 4 years
Decrease by an average of
57.0 pp over 4 years
Decrease by an average
24.0 pp over 4 years
Decrease by an average of
16.7 pp over 4 years
Decrease by an average of 37.2 pp over 4 years
Decrease by an average of
19.2 pp over 4 years
Decrease by an average of
22.7 pp over 4 years
Decrease by an average of
34.1 pp over 4 years
Decrease in terminal growth rate
Decrease to less than 0 %
Decrease to less than 0 %
Decrease to less than 0 %
Decrease to less than 0 %
Decrease to less than 0 %
Decrease to less than 0 %
Decrease to less than 0 %
Decrease to less than 0 %
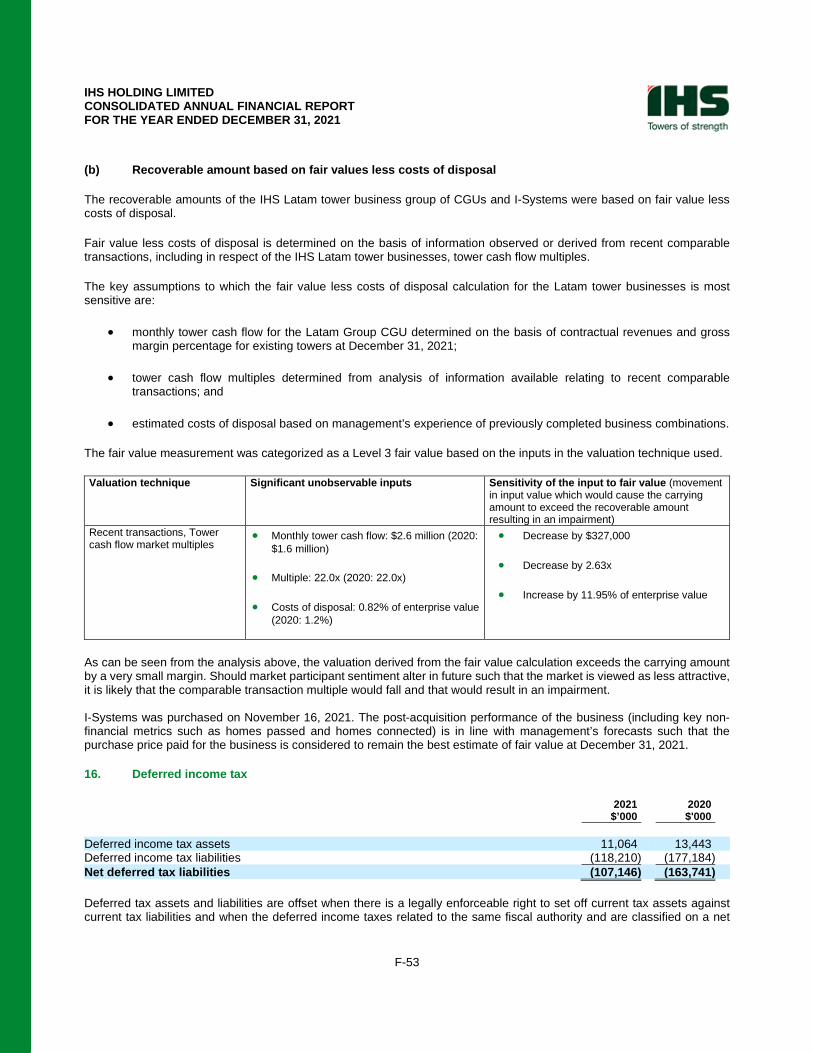
IHS HOLDING LIMITED CONSOLIDATED ANNUAL FINANCIAL REPORT FOR THE YEAR ENDED DECEMBER 31, 2021
F-53
(b) Recoverable amount based on fair values less costs of disposal
The recoverable amounts of the IHS Latam tower business group of CGUs and I-Systems were based on fair value less costs of disposal.
Fair value less costs of disposal is determined on the basis of information observed or derived from recent comparable transactions, including in respect of the IHS Latam tower businesses, tower cash flow multiples.
The key assumptions to which the fair value less costs of disposal calculation for the Latam tower businesses is most sensitive are:
• monthly tower cash flow for the Latam Group CGU determined on the basis of contractual revenues and gross margin percentage for existing towers at December 31, 2021;
• tower cash flow multiples determined from analysis of information available relating to recent comparable transactions; and
• estimated costs of disposal based on management’s experience of previously completed business combinations.
The fair value measurement was categorized as a Level 3 fair value based on the inputs in the valuation technique used.
Valuation technique Significant unobservable inputs Sensitivity of the input to fair value (movement in input value which would cause the carrying amount to exceed the recoverable amount resulting in an impairment)
Recent transactions, Tower cash flow market multiples
• Monthly tower cash flow: $2.6 million (2020: $1.6 million)
• Multiple: 22.0x (2020: 22.0x)
• Costs of disposal: 0.82% of enterprise value (2020: 1.2%)
• Decrease by $327,000
• Decrease by 2.63x
• Increase by 11.95% of enterprise value
As can be seen from the analysis above, the valuation derived from the fair value calculation exceeds the carrying amount by a very small margin. Should market participant sentiment alter in future such that the market is viewed as less attractive, it is likely that the comparable transaction multiple would fall and that would result in an impairment. I-Systems was purchased on November 16, 2021. The post-acquisition performance of the business (including key non-financial metrics such as homes passed and homes connected) is in line with management’s forecasts such that the purchase price paid for the business is considered to remain the best estimate of fair value at December 31, 2021. 16. Deferred income tax
2021 2020 $’000 $'000 Deferred income tax assets 11,064 13,443 Deferred income tax liabilities (118,210) (177,184) Net deferred tax liabilities (107,146) (163,741) Deferred tax assets and liabilities are offset when there is a legally enforceable right to set off current tax assets against current tax liabilities and when the deferred income taxes related to the same fiscal authority and are classified on a net
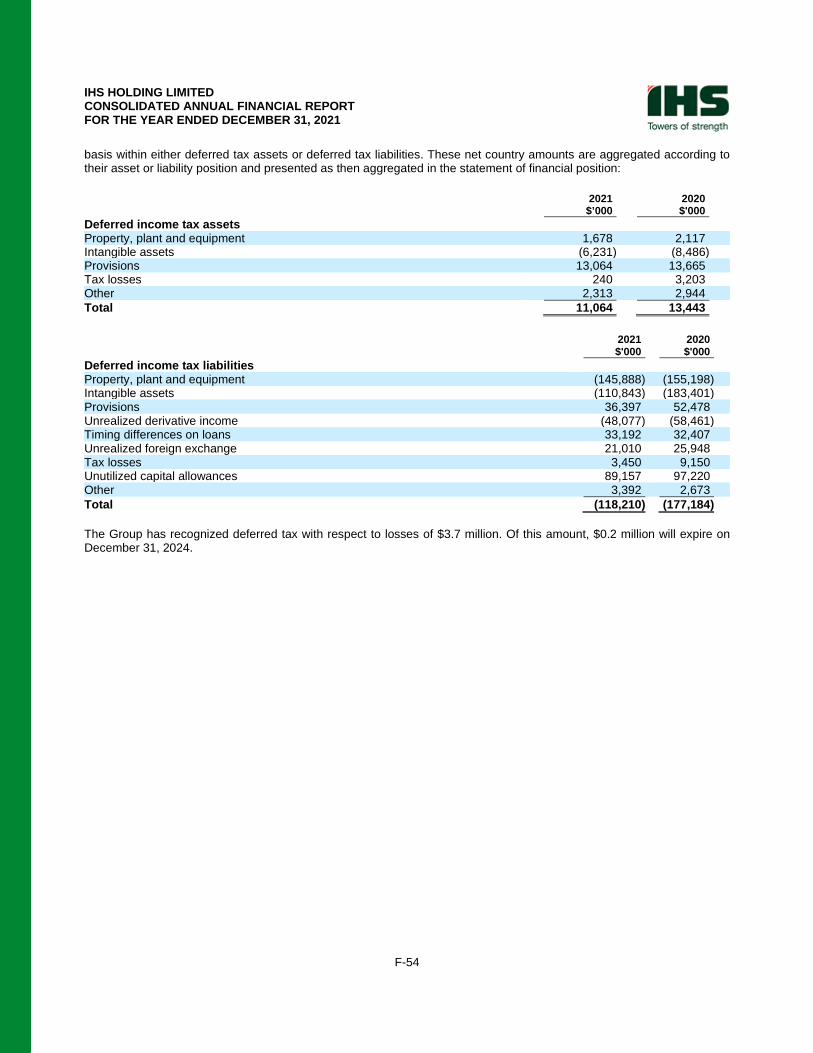
IHS HOLDING LIMITED CONSOLIDATED ANNUAL FINANCIAL REPORT FOR THE YEAR ENDED DECEMBER 31, 2021
F-54
basis within either deferred tax assets or deferred tax liabilities. These net country amounts are aggregated according to their asset or liability position and presented as then aggregated in the statement of financial position:
2021 2020 $’000 $'000 Deferred income tax assets Property, plant and equipment 1,678 2,117 Intangible assets (6,231) (8,486) Provisions 13,064 13,665 Tax losses 240 3,203 Other 2,313 2,944 Total 11,064 13,443
2021 2020 $'000 $'000 Deferred income tax liabilities Property, plant and equipment (145,888) (155,198) Intangible assets (110,843) (183,401) Provisions 36,397 52,478 Unrealized derivative income (48,077) (58,461) Timing differences on loans 33,192 32,407 Unrealized foreign exchange 21,010 25,948 Tax losses 3,450 9,150 Unutilized capital allowances 89,157 97,220 Other 3,392 2,673 Total (118,210) (177,184) The Group has recognized deferred tax with respect to losses of $3.7 million. Of this amount, $0.2 million will expire on December 31, 2024.
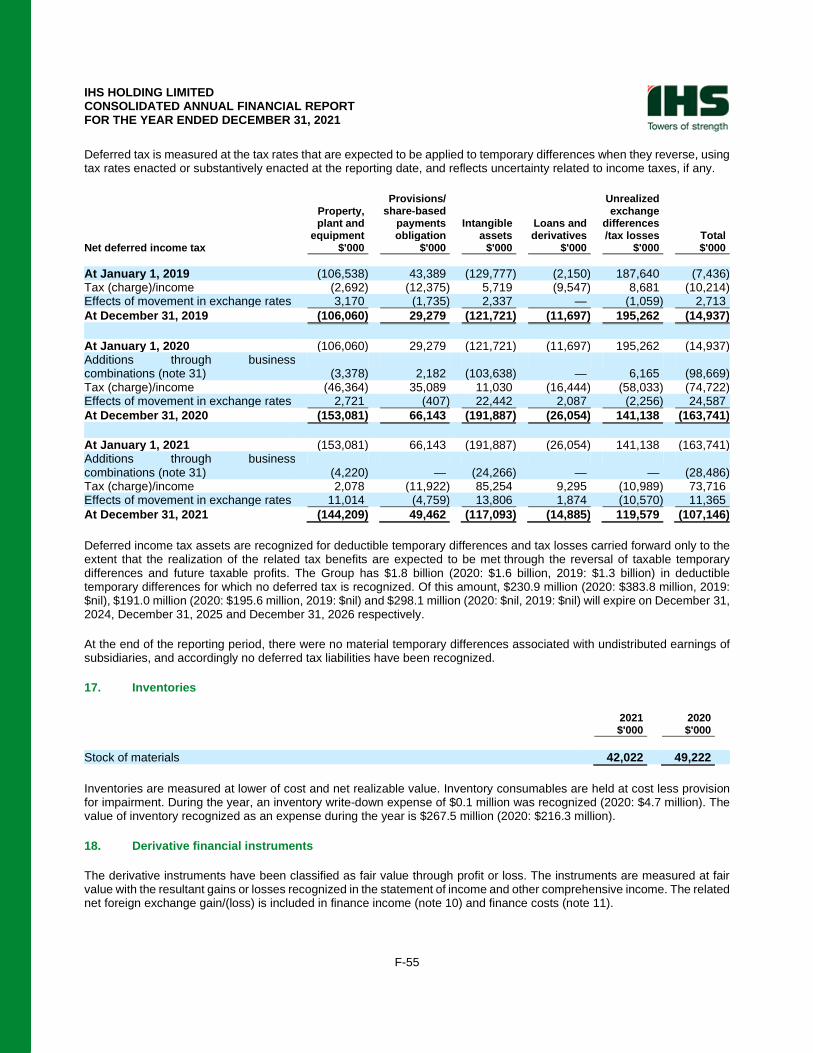
IHS HOLDING LIMITED CONSOLIDATED ANNUAL FINANCIAL REPORT FOR THE YEAR ENDED DECEMBER 31, 2021
F-55
Deferred tax is measured at the tax rates that are expected to be applied to temporary differences when they reverse, using tax rates enacted or substantively enacted at the reporting date, and reflects uncertainty related to income taxes, if any.
Provisions/ Unrealized Property, share‑based exchange plant and payments Intangible Loans and differences equipment obligation assets derivatives /tax losses Total Net deferred income tax $'000 $'000 $'000 $'000 $'000 $'000 At January 1, 2019 (106,538) 43,389 (129,777) (2,150) 187,640 (7,436) Tax (charge)/income (2,692) (12,375) 5,719 (9,547) 8,681 (10,214) Effects of movement in exchange rates 3,170 (1,735) 2,337 — (1,059) 2,713 At December 31, 2019 (106,060) 29,279 (121,721) (11,697) 195,262 (14,937) At January 1, 2020 (106,060) 29,279 (121,721) (11,697) 195,262 (14,937) Additions through business combinations (note 31) (3,378) 2,182 (103,638) — 6,165 (98,669) Tax (charge)/income (46,364) 35,089 11,030 (16,444) (58,033) (74,722) Effects of movement in exchange rates 2,721 (407) 22,442 2,087 (2,256) 24,587 At December 31, 2020 (153,081) 66,143 (191,887) (26,054) 141,138 (163,741) At January 1, 2021 (153,081) 66,143 (191,887) (26,054) 141,138 (163,741) Additions through business combinations (note 31) (4,220) — (24,266) — — (28,486) Tax (charge)/income 2,078 (11,922) 85,254 9,295 (10,989) 73,716 Effects of movement in exchange rates 11,014 (4,759) 13,806 1,874 (10,570) 11,365 At December 31, 2021 (144,209) 49,462 (117,093) (14,885) 119,579 (107,146) Deferred income tax assets are recognized for deductible temporary differences and tax losses carried forward only to the extent that the realization of the related tax benefits are expected to be met through the reversal of taxable temporary differences and future taxable profits. The Group has $1.8 billion (2020: $1.6 billion, 2019: $1.3 billion) in deductible temporary differences for which no deferred tax is recognized. Of this amount, $230.9 million (2020: $383.8 million, 2019: $nil), $191.0 million (2020: $195.6 million, 2019: $nil) and $298.1 million (2020: $nil, 2019: $nil) will expire on December 31, 2024, December 31, 2025 and December 31, 2026 respectively.
At the end of the reporting period, there were no material temporary differences associated with undistributed earnings of subsidiaries, and accordingly no deferred tax liabilities have been recognized.
17. Inventories
2021 2020 $'000 $'000 Stock of materials 42,022 49,222 Inventories are measured at lower of cost and net realizable value. Inventory consumables are held at cost less provision for impairment. During the year, an inventory write-down expense of $0.1 million was recognized (2020: $4.7 million). The value of inventory recognized as an expense during the year is $267.5 million (2020: $216.3 million).
18. Derivative financial instruments
The derivative instruments have been classified as fair value through profit or loss. The instruments are measured at fair value with the resultant gains or losses recognized in the statement of income and other comprehensive income. The related net foreign exchange gain/(loss) is included in finance income (note 10) and finance costs (note 11).
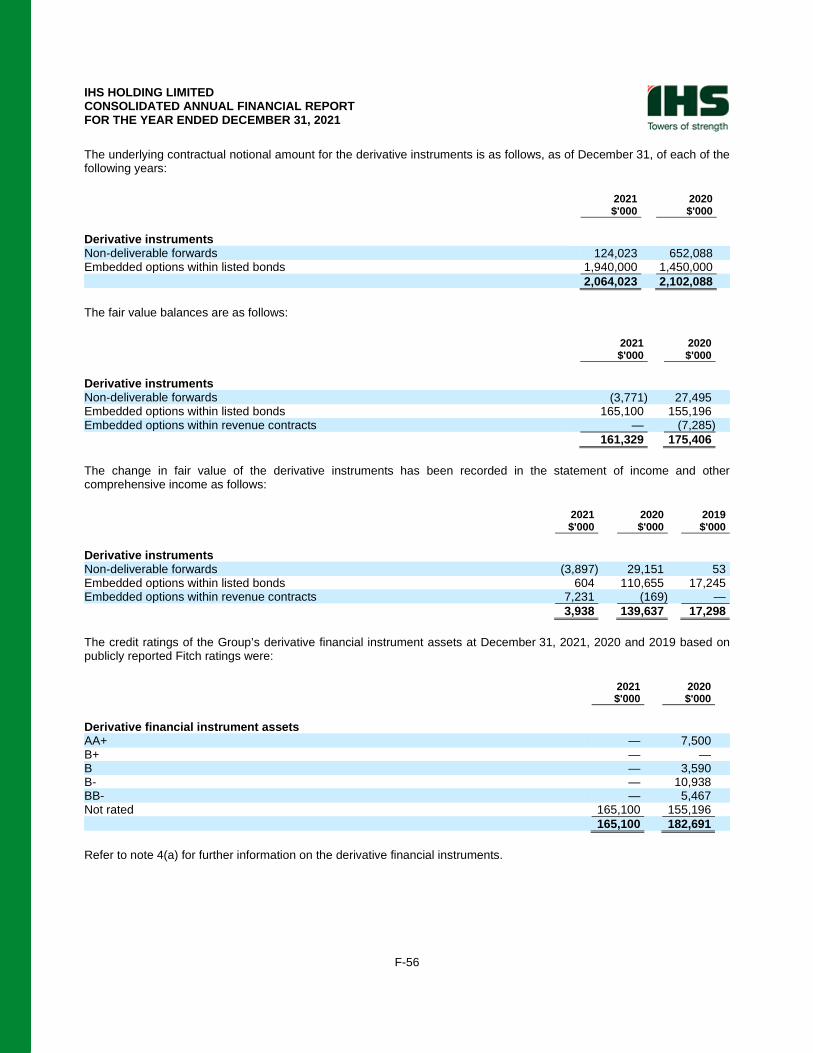
IHS HOLDING LIMITED CONSOLIDATED ANNUAL FINANCIAL REPORT FOR THE YEAR ENDED DECEMBER 31, 2021
F-56
The underlying contractual notional amount for the derivative instruments is as follows, as of December 31, of each of the following years:
2021 2020 $'000 $'000 Derivative instruments Non‑deliverable forwards 124,023 652,088 Embedded options within listed bonds 1,940,000 1,450,000 2,064,023 2,102,088 The fair value balances are as follows:
2021 2020 $'000 $'000 Derivative instruments Non‑deliverable forwards (3,771) 27,495 Embedded options within listed bonds 165,100 155,196 Embedded options within revenue contracts — (7,285) 161,329 175,406 The change in fair value of the derivative instruments has been recorded in the statement of income and other comprehensive income as follows:
2021 2020 2019 $'000 $'000 $'000
Derivative instruments Non‑deliverable forwards (3,897) 29,151 53 Embedded options within listed bonds 604 110,655 17,245 Embedded options within revenue contracts 7,231 (169) — 3,938 139,637 17,298 The credit ratings of the Group’s derivative financial instrument assets at December 31, 2021, 2020 and 2019 based on publicly reported Fitch ratings were:
2021 2020 $'000 $'000 Derivative financial instrument assets AA+ — 7,500 B+ — — B — 3,590 B- — 10,938 BB- — 5,467 Not rated 165,100 155,196 165,100 182,691 Refer to note 4(a) for further information on the derivative financial instruments.
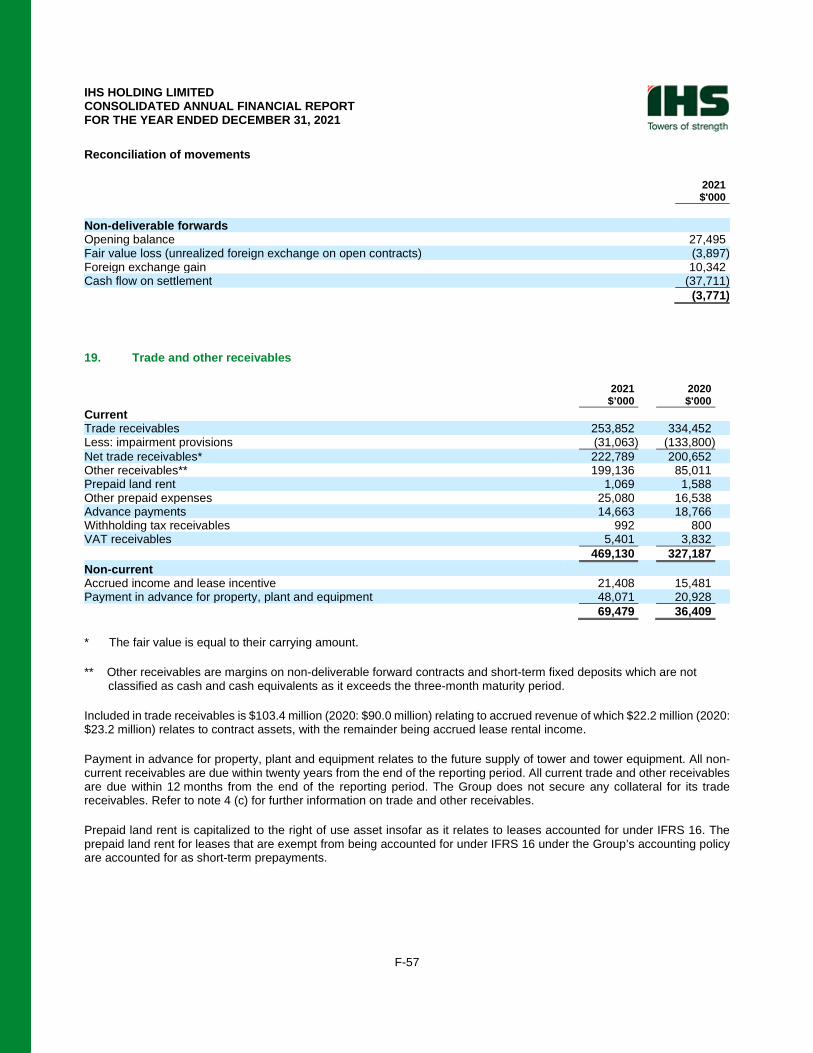
IHS HOLDING LIMITED CONSOLIDATED ANNUAL FINANCIAL REPORT FOR THE YEAR ENDED DECEMBER 31, 2021
F-57
Reconciliation of movements
2021 $'000
Non-deliverable forwards Opening balance 27,495 Fair value loss (unrealized foreign exchange on open contracts) (3,897) Foreign exchange gain 10,342 Cash flow on settlement (37,711) (3,771)
19. Trade and other receivables
2021 2020 $’000 $'000 Current Trade receivables 253,852 334,452 Less: impairment provisions (31,063) (133,800) Net trade receivables* 222,789 200,652 Other receivables** 199,136 85,011 Prepaid land rent 1,069 1,588 Other prepaid expenses 25,080 16,538 Advance payments 14,663 18,766 Withholding tax receivables 992 800 VAT receivables 5,401 3,832 469,130 327,187 Non-current Accrued income and lease incentive 21,408 15,481 Payment in advance for property, plant and equipment 48,071 20,928 69,479 36,409 * The fair value is equal to their carrying amount.
** Other receivables are margins on non-deliverable forward contracts and short-term fixed deposits which are not classified as cash and cash equivalents as it exceeds the three-month maturity period.
Included in trade receivables is $103.4 million (2020: $90.0 million) relating to accrued revenue of which $22.2 million (2020: $23.2 million) relates to contract assets, with the remainder being accrued lease rental income.
Payment in advance for property, plant and equipment relates to the future supply of tower and tower equipment. All non-current receivables are due within twenty years from the end of the reporting period. All current trade and other receivables are due within 12 months from the end of the reporting period. The Group does not secure any collateral for its trade receivables. Refer to note 4 (c) for further information on trade and other receivables.
Prepaid land rent is capitalized to the right of use asset insofar as it relates to leases accounted for under IFRS 16. The prepaid land rent for leases that are exempt from being accounted for under IFRS 16 under the Group’s accounting policy are accounted for as short-term prepayments.
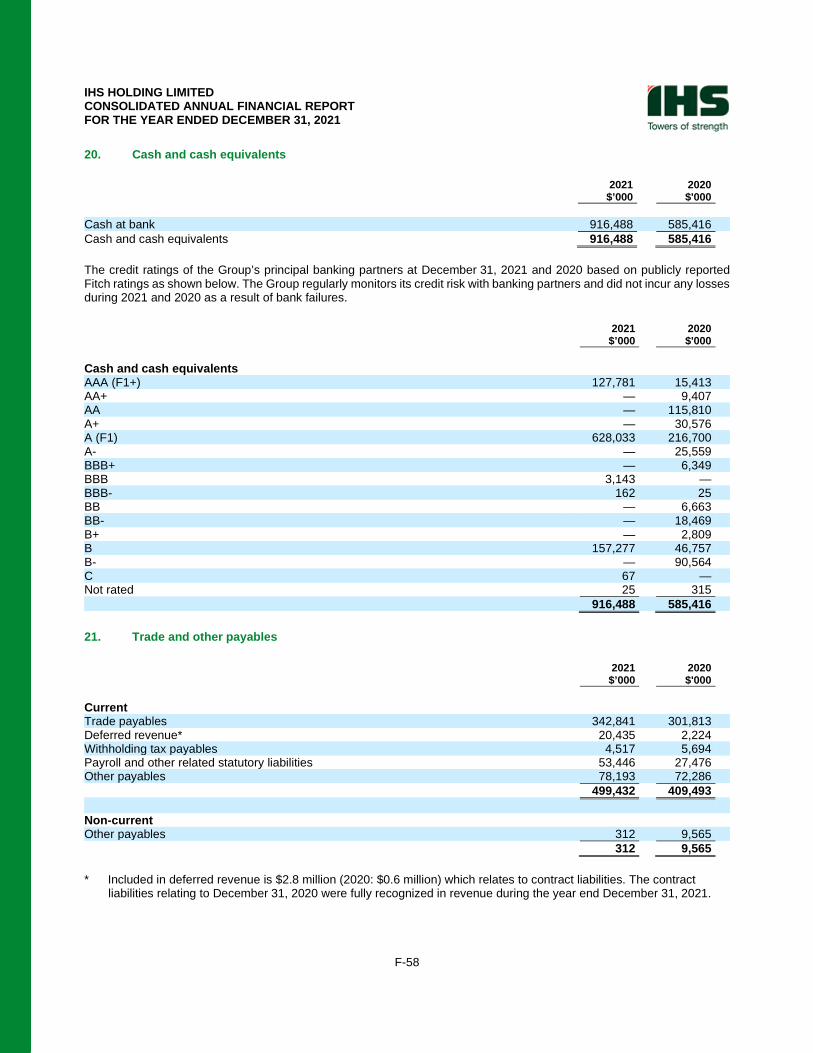
IHS HOLDING LIMITED CONSOLIDATED ANNUAL FINANCIAL REPORT FOR THE YEAR ENDED DECEMBER 31, 2021
F-58
20. Cash and cash equivalents
2021 2020 $’000 $'000 Cash at bank 916,488 585,416 Cash and cash equivalents 916,488 585,416 The credit ratings of the Group’s principal banking partners at December 31, 2021 and 2020 based on publicly reported Fitch ratings as shown below. The Group regularly monitors its credit risk with banking partners and did not incur any losses during 2021 and 2020 as a result of bank failures.
2021 2020 $’000 $'000 Cash and cash equivalents AAA (F1+) 127,781 15,413 AA+ — 9,407 AA — 115,810 A+ — 30,576 A (F1) 628,033 216,700 A- — 25,559 BBB+ — 6,349 BBB 3,143 — BBB- 162 25 BB — 6,663 BB- — 18,469 B+ — 2,809 B 157,277 46,757 B- — 90,564 C 67 — Not rated 25 315 916,488 585,416
21. Trade and other payables
2021 2020 $’000 $'000 Current Trade payables 342,841 301,813 Deferred revenue* 20,435 2,224 Withholding tax payables 4,517 5,694 Payroll and other related statutory liabilities 53,446 27,476 Other payables 78,193 72,286 499,432 409,493 Non-current Other payables 312 9,565 312 9,565 * Included in deferred revenue is $2.8 million (2020: $0.6 million) which relates to contract liabilities. The contract
liabilities relating to December 31, 2020 were fully recognized in revenue during the year end December 31, 2021.
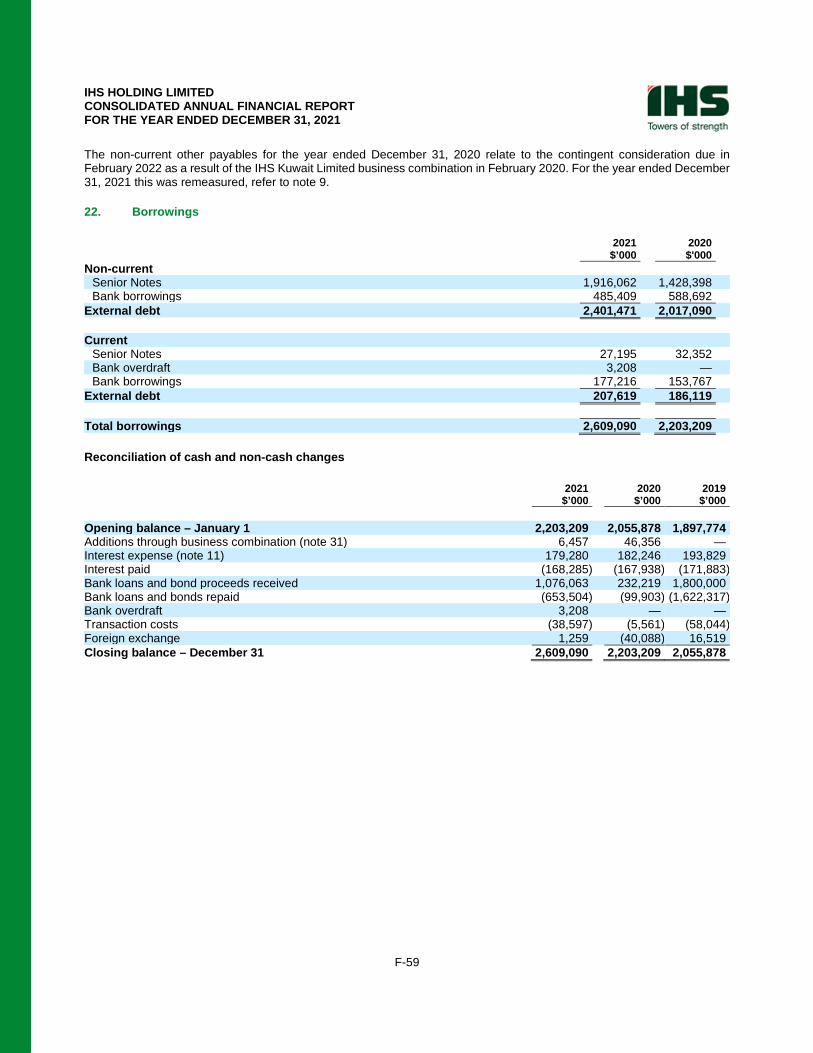
IHS HOLDING LIMITED CONSOLIDATED ANNUAL FINANCIAL REPORT FOR THE YEAR ENDED DECEMBER 31, 2021
F-59
The non-current other payables for the year ended December 31, 2020 relate to the contingent consideration due in February 2022 as a result of the IHS Kuwait Limited business combination in February 2020. For the year ended December 31, 2021 this was remeasured, refer to note 9.
22. Borrowings
2021 2020 $’000 $'000 Non-current
Senior Notes 1,916,062 1,428,398 Bank borrowings 485,409 588,692
External debt 2,401,471 2,017,090 Current
Senior Notes 27,195 32,352 Bank overdraft 3,208 — Bank borrowings 177,216 153,767
External debt 207,619 186,119 Total borrowings 2,609,090 2,203,209 Reconciliation of cash and non-cash changes
2021 2020 2019 $’000 $’000 $’000 Opening balance – January 1 2,203,209 2,055,878 1,897,774 Additions through business combination (note 31) 6,457 46,356 — Interest expense (note 11) 179,280 182,246 193,829 Interest paid (168,285) (167,938) (171,883) Bank loans and bond proceeds received 1,076,063 232,219 1,800,000 Bank loans and bonds repaid (653,504) (99,903) (1,622,317) Bank overdraft 3,208 — — Transaction costs (38,597) (5,561) (58,044) Foreign exchange 1,259 (40,088) 16,519 Closing balance – December 31 2,609,090 2,203,209 2,055,878
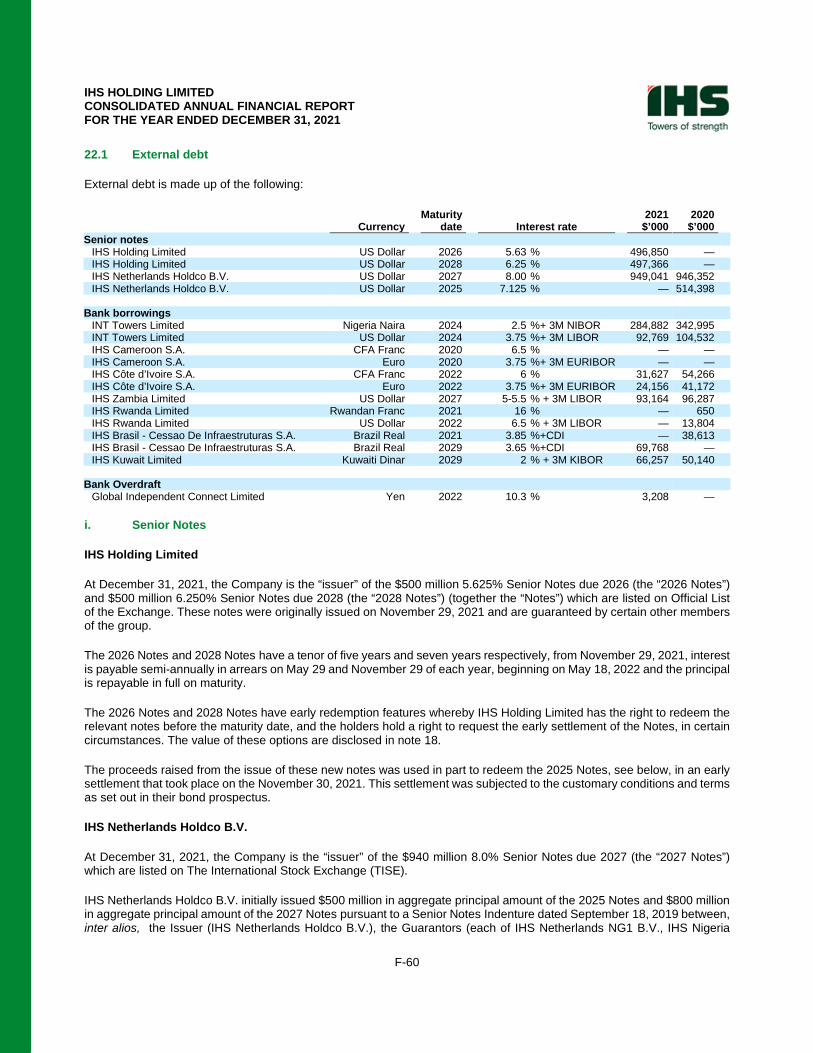
IHS HOLDING LIMITED CONSOLIDATED ANNUAL FINANCIAL REPORT FOR THE YEAR ENDED DECEMBER 31, 2021
F-60
22.1 External debt
External debt is made up of the following:
Maturity 2021 2020 Currency date Interest rate $’000 $’000 Senior notes
IHS Holding Limited US Dollar 2026 5.63 % 496,850 — IHS Holding Limited US Dollar 2028 6.25 % 497,366 — IHS Netherlands Holdco B.V. US Dollar 2027 8.00 % 949,041 946,352 IHS Netherlands Holdco B.V. US Dollar 2025 7.125 % — 514,398
Bank borrowings
INT Towers Limited Nigeria Naira 2024 2.5 %+ 3M NIBOR 284,882 342,995 INT Towers Limited US Dollar 2024 3.75 %+ 3M LIBOR 92,769 104,532 IHS Cameroon S.A. CFA Franc 2020 6.5 % — — IHS Cameroon S.A. Euro 2020 3.75 %+ 3M EURIBOR — — IHS Côte d’Ivoire S.A. CFA Franc 2022 6 % 31,627 54,266 IHS Côte d’Ivoire S.A. Euro 2022 3.75 %+ 3M EURIBOR 24,156 41,172 IHS Zambia Limited US Dollar 2027 5-5.5 % + 3M LIBOR 93,164 96,287 IHS Rwanda Limited Rwandan Franc 2021 16 % — 650 IHS Rwanda Limited US Dollar 2022 6.5 % + 3M LIBOR — 13,804 IHS Brasil - Cessao De Infraestruturas S.A. Brazil Real 2021 3.85 %+CDI — 38,613 IHS Brasil - Cessao De Infraestruturas S.A. Brazil Real 2029 3.65 %+CDI 69,768 — IHS Kuwait Limited Kuwaiti Dinar 2029 2 % + 3M KIBOR 66,257 50,140
Bank Overdraft Global Independent Connect Limited Yen 2022 10.3 % 3,208 —
i. Senior Notes
IHS Holding Limited
At December 31, 2021, the Company is the “issuer” of the $500 million 5.625% Senior Notes due 2026 (the “2026 Notes”) and $500 million 6.250% Senior Notes due 2028 (the “2028 Notes”) (together the “Notes”) which are listed on Official List of the Exchange. These notes were originally issued on November 29, 2021 and are guaranteed by certain other members of the group.
The 2026 Notes and 2028 Notes have a tenor of five years and seven years respectively, from November 29, 2021, interest is payable semi-annually in arrears on May 29 and November 29 of each year, beginning on May 18, 2022 and the principal is repayable in full on maturity.
The 2026 Notes and 2028 Notes have early redemption features whereby IHS Holding Limited has the right to redeem the relevant notes before the maturity date, and the holders hold a right to request the early settlement of the Notes, in certain circumstances. The value of these options are disclosed in note 18.
The proceeds raised from the issue of these new notes was used in part to redeem the 2025 Notes, see below, in an early settlement that took place on the November 30, 2021. This settlement was subjected to the customary conditions and terms as set out in their bond prospectus.
IHS Netherlands Holdco B.V.
At December 31, 2021, the Company is the “issuer” of the $940 million 8.0% Senior Notes due 2027 (the “2027 Notes”) which are listed on The International Stock Exchange (TISE).
IHS Netherlands Holdco B.V. initially issued $500 million in aggregate principal amount of the 2025 Notes and $800 million in aggregate principal amount of the 2027 Notes pursuant to a Senior Notes Indenture dated September 18, 2019 between, inter alios, the Issuer (IHS Netherlands Holdco B.V.), the Guarantors (each of IHS Netherlands NG1 B.V., IHS Nigeria
IHS HOLDING LIMITED CONSOLIDATED ANNUAL FINANCIAL REPORT FOR THE YEAR ENDED DECEMBER 31, 2021
F-61
Limited, IHS Netherlands NG2 B.V., IHS Towers NG Limited, INT Towers Limited and Nigeria Tower Interco B.V.) and the Trustee (Citibank N.A., London branch).
On July 31, 2020 the Company issued an additional $150 million in aggregate principal amount across its 2025 Notes and 2027 Notes, split as $10 million in aggregate principal amount of its 2025 Notes and $140 million in aggregate principal amount of its 2027 Notes.
The 2025 notes were redeemed on the November 29, 2021. This redemption was funded by the issuance of the 2026 & 2028 Notes. The redemption included amounts related to principal of $510 million, accrued interest of $7.3 million and an early redemption premium of $18.2 million.
Tower Infrastructure Company Limited, which is an immaterial subsidiary, was not a Guarantor under the 2025 Notes or 2027 Notes. The 2027 Notes are the senior obligations of the Issuer and rank equal in right of payment with all of the issuer’s existing and future indebtedness that is not subordinated in right of payment to the Notes.
The 2027 Notes have a tenor of eight years from September 18, 2019, with interest payable semi-annually in arrears on March 18 and September 18 of each year, beginning on March 18, 2020 and principal repayable in full on maturity.
Negative covenants of the 2027 Notes, among other things, restrict the ability of IHS Holding Limited and its subsidiaries to:
• incur or guarantee additional indebtedness and issue certain preferred stock;
• make certain restricted payments and investments, including dividends or other distributions;
• create or incur certain liens;
• enter into agreements that restrict the ability of restricted subsidiaries to pay dividends;
• transfer or sell certain assets;
• merge or consolidate with other entities; and
• enter into certain transactions with affiliates.
In addition, IHS Netherlands Holdco B.V. must provide to the Trustee, and to holders of the 2027 Notes, certain annual and quarterly reports.
The 2027 Notes have early redemption features whereby IHS Netherlands Holdco B.V. has the right to redeem the relevant notes before the maturity date, and the holders hold a right to request the early settlement of the Notes, in certain circumstances. The value of these options are disclosed in note 18.
IHS HOLDING LIMITED CONSOLIDATED ANNUAL FINANCIAL REPORT FOR THE YEAR ENDED DECEMBER 31, 2021
F-62
ii. Bank borrowings
Bank borrowings is made up of the following:
Senior Credit Facilities
On September 29, 2021 IHS Netherlands Holdco B.V, IHS Nigeria Limited, IHS Towers NG Limited and IHS Holding Limited entered into an amendment and restatement agreement with Ecobank Nigeria Limited as agent, or the Senior Credit Facilities Amendment and Restatement Agreement, which amended and restated the facilities agreement dated September 3, 2019, or the Original Senior Credit Facilities, and, as amended and restated under the Senior Credit Facilities Amendment and Restatement Agreement, the Restated Senior Credit Facilities, between, among others, IHS Netherlands Holdco B.V. as intermediate holding company and guarantor, and, IHS Nigeria, IHS Towers NG Limited and INT Towers as borrowers and guarantors, each of IHS Holding Limited, IHS Netherlands NG1 B.V., IHS Nigeria, IHS Netherlands NG2 B.V., IHS Towers NG Limited, Nigeria Tower Interco B.V. and INT Towers as guarantors, Absa Bank Limited (acting through its Corporate and Investment Banking division), Citibank, N.A., London Branch, Goldman Sachs Bank USA, J.P. Morgan Securities plc, FirstRand Bank Limited (London Branch) (acting through its Merchant Bank division) and Standard Chartered Bank, as mandated lead arrangers, Ecobank Nigeria Limited as agent and the financial institutions listed therein as the original lenders. The Restated Senior Credit Facilities was amended and restated to align with the amendments to the indenture governing the Notes issued by IHS Netherlands Holdco B.V., as set forth in a consent solicitation statement dated June 14, 2021, and to add IHS Holding Limited as a guarantor. The Restated Senior Credit Facilities also include customary negative and financial covenants that limit certain activities of IHS Netherlands Holdco B.V., IHS Nigeria, IHS Towers NG Limited and INT Towers. This facility was fully drawn down in 2019.
The interest rate per annum applicable to loans made under the Restated Senior Credit Facilities is equal to:
(a) in relation to the US dollar facility, prior to a rate switch date, LIBOR (subject to a zero floor) plus a margin of 4.25% per annum (subject to a margin ratchet where the level of margin may be increased (up to a maximum of 4.50)% or decreased (limited to a floor of 3.50)% subject to certain tests, including the relevant leverage ratio of the IHS Holding Limited group) and, after a rate switch date for US dollars, is equal to a compounded reference rate based on SOFR (calculated on a five day RFR banking day lookback) and a credit adjustment spread plus the margin; and
(b) in relation to the Naira facility, NIBOR (subject to a zero floor) plus a margin of 2.50% per annum.
IHS Netherlands Holdco B.V. also pays certain other fees and costs, including fees for undrawn commitments, management fees, participation fees and fees to the agent.
The US Dollar facility had an original principal amount of $110.0 million, and the Naira facility had an original principal amount of ₦141.3 billion (approximately $325 million).
Each facility under the Restated Senior Credit Facilities will terminate on the date falling 60 months after the date of the first utilization of that facility. The Restated Senior Credit Facilities are repayable in instalments. Subject to certain conditions, IHS Netherlands Holdco B.V. and the borrowers may voluntarily prepay utilizations and/or permanently cancel all or part of the available commitments under the Restated Senior Credit Facilities by giving five business days’ prior notice (or such shorter period as the majority lenders may agree). In addition to voluntary prepayments, the Restated Senior Credit Facilities requires mandatory cancellation, and if applicable, prepayment in full or in part in certain circumstances.
IHS Côte d’Ivoire S.A.
IHS Côte d’Ivoire S.A. had a FCFA 18.3 billion (2020: FCFA 44.6 billion) and €52 million (2020: €52 million) loan facility as at December 31, 2021. The facility will expire in August 2022 and was fully drawn down in 2017.
IHS HOLDING LIMITED CONSOLIDATED ANNUAL FINANCIAL REPORT FOR THE YEAR ENDED DECEMBER 31, 2021
F-63
IHS Zambia Limited
On March 4, 2021 IHS Zambia Limited made a one-off payment of $0.6 million and extended the term of the remaining fully drawn down loan facility of $95.0 million. The lenders were replaced with the development finance institution (“IFC”) and commercial bank (“SCB”). The maturity was extended to December 2027 for both lenders and the principal payments were also deferred by 24 months.
IHS Rwanda Limited
On March 30, 2021 and July 20, 2021 IHS Rwanda Limited fully repaid the Rwandan Franc (RWF) and U.S. Dollar loan facilities respectively. No new loan facilities were obtained and no amounts remain outstanding under any third party loan facilities in Rwanda.
IHS Brasil Participações Ltda
On May 21, 2021 and June 28, 2021 IHS Brasil Participações Ltda. obtained loan facilities for R$300 million (approximately $53.8 million) with Itaú bank and R$100 million (approximately $17.9 million) from Banco do Brasil respectively. The loan facilities have an annual interest rate of CDI + 3.65% and are repayable in May 2029. Interest payments are due monthly and principal payments have a grace period of 1 year from inception of the loan facilities. IHS Brasil – Cessão de Infraestruturas S.A. is a guarantor to the loan facilities. In December 2021, this loan was assigned to IHS Brasil – Cessão de Infraestruturas S.A. following an internal corporate reorganization pursuant to which IHS Brasil Participações Ltda. and Skysites Holding S.A. were merged into IHS Brasil – Cessão de Infraestruturas S.A. (which remained the surviving entity).
IHS Brasil – Cessão de Infraestruturas S.A.
IHS Brasil - Cessão De Infraestruturas S.A. had fully drawn down R$30 million (approximately $5.4 million) and R$170 million (approximately $30.5 million) of the loan facilities with Banco Safra and Itau BBA respectively, at December 31, 2020. Both loan facilities were fully repaid in May 2021. No new loan facilities were obtained directly by this entity.
IHS Kuwait Limited
On April 19, 2020 IHS Kuwait Limited obtained a loan facility for KWD 26 million which matures in April 2029 and has an annual interest rate of 2.00% + 3M KIBOR. On December 31, 2021 IHS Kuwait had drawn down KWD21 million ($69 million) of the total facility and as at December 31, 2020 KWD15.8 million ($ 52.1 million).
Except for facilities in IHS Nigeria Limited, INT Towers Limited, IHS Towers Nigeria Limited and IHS Brasil Cessão de Infraestruturas Limitada the Group has pledged all assets as collateral for the bank borrowings in each relevant jurisdiction.
The Group is in compliance with the restrictive debt covenants related to the listed bonds and covenants related to external borrowings as at the year end.
iii. Bank Overdraft
Global Independent Connect Limited
Global Independent Connect Limited utilised an overdraft facility of ¥21.6 million ($3.2 million) from Ecobank to support the Letters of credit used for equipment importation from overseas vendors. This facility is for a period of 90 days from the date payment is made to the vendor. The repayment represents utilisation of cash cover of ¥ 0.6 million ($0.1 million) against the total LC amount presented of ¥ 22.2 million ($3.3 million).
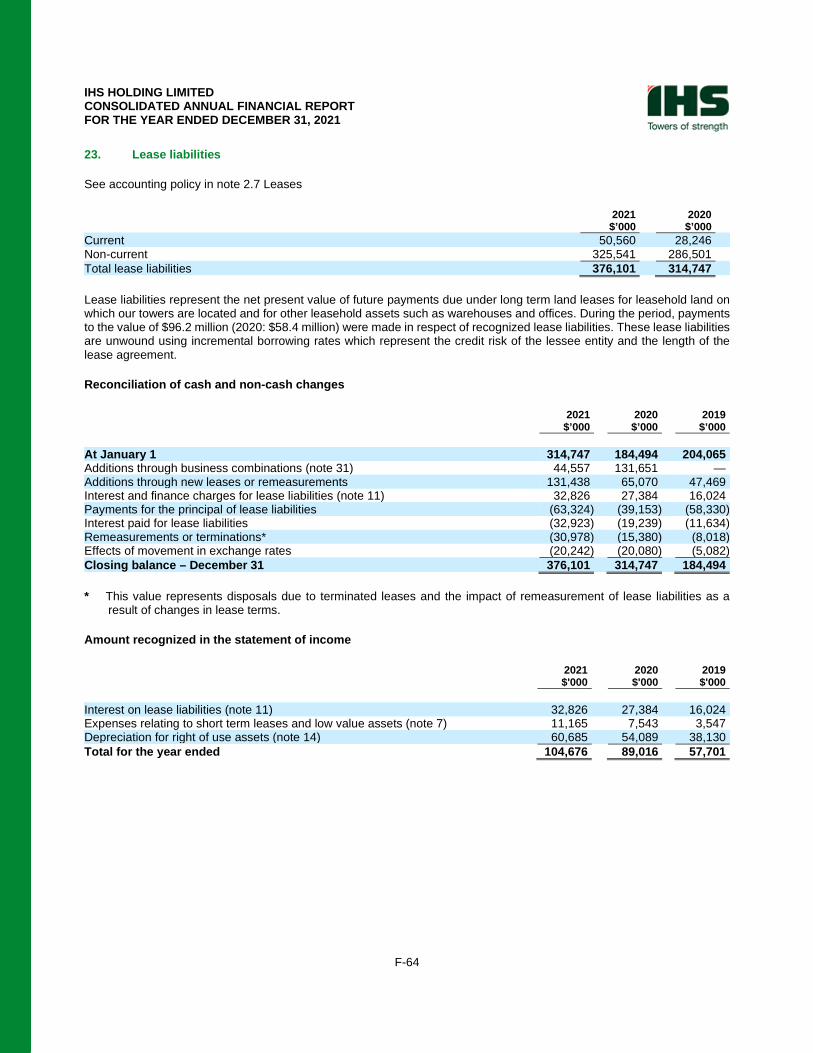
IHS HOLDING LIMITED CONSOLIDATED ANNUAL FINANCIAL REPORT FOR THE YEAR ENDED DECEMBER 31, 2021
F-64
23. Lease liabilities
See accounting policy in note 2.7 Leases
2021 2020 $’000 $’000 Current 50,560 28,246 Non-current 325,541 286,501 Total lease liabilities 376,101 314,747 Lease liabilities represent the net present value of future payments due under long term land leases for leasehold land on which our towers are located and for other leasehold assets such as warehouses and offices. During the period, payments to the value of $96.2 million (2020: $58.4 million) were made in respect of recognized lease liabilities. These lease liabilities are unwound using incremental borrowing rates which represent the credit risk of the lessee entity and the length of the lease agreement.
Reconciliation of cash and non-cash changes
2021 2020 2019 $’000 $’000 $’000 At January 1 314,747 184,494 204,065 Additions through business combinations (note 31) 44,557 131,651 — Additions through new leases or remeasurements 131,438 65,070 47,469 Interest and finance charges for lease liabilities (note 11) 32,826 27,384 16,024 Payments for the principal of lease liabilities (63,324) (39,153) (58,330) Interest paid for lease liabilities (32,923) (19,239) (11,634) Remeasurements or terminations* (30,978) (15,380) (8,018) Effects of movement in exchange rates (20,242) (20,080) (5,082) Closing balance – December 31 376,101 314,747 184,494 * This value represents disposals due to terminated leases and the impact of remeasurement of lease liabilities as a
result of changes in lease terms.
Amount recognized in the statement of income
2021 2020 2019 $'000 $'000 $'000 Interest on lease liabilities (note 11) 32,826 27,384 16,024 Expenses relating to short term leases and low value assets (note 7) 11,165 7,543 3,547 Depreciation for right of use assets (note 14) 60,685 54,089 38,130 Total for the year ended 104,676 89,016 57,701
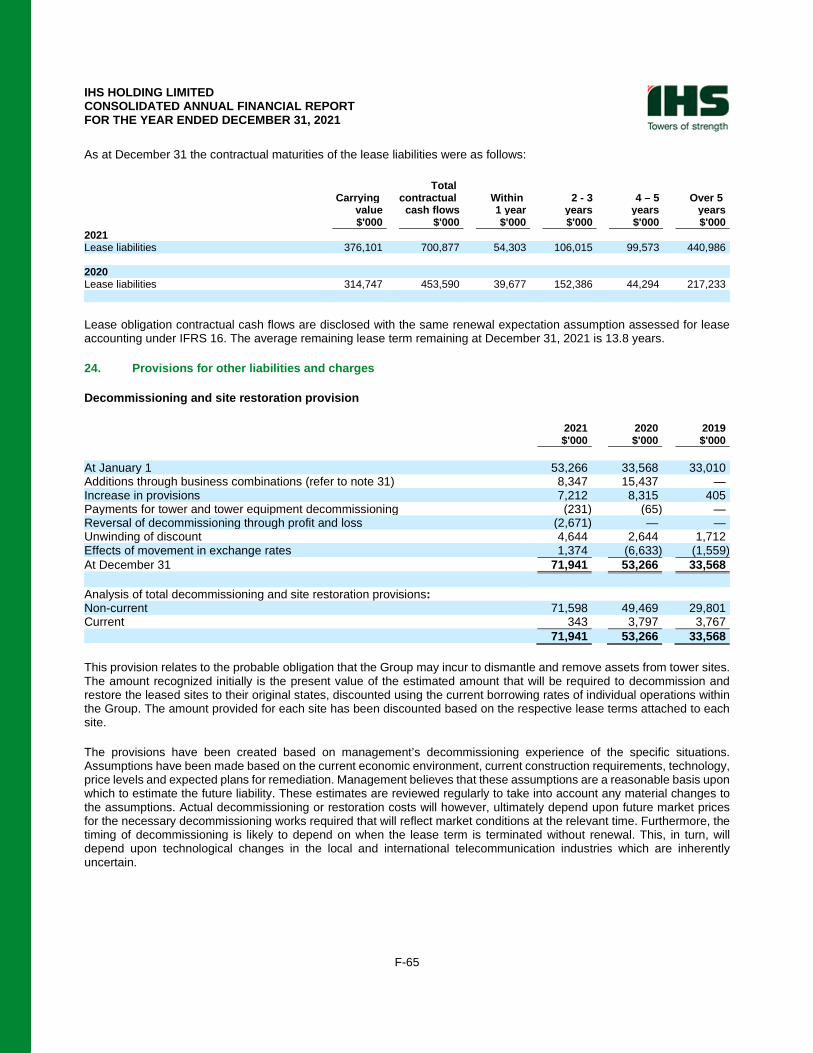
IHS HOLDING LIMITED CONSOLIDATED ANNUAL FINANCIAL REPORT FOR THE YEAR ENDED DECEMBER 31, 2021
F-65
As at December 31 the contractual maturities of the lease liabilities were as follows:
Total Carrying contractual Within 2 - 3 4 – 5 Over 5 value cash flows 1 year years years years $'000 $'000 $'000 $'000 $'000 $'000 2021 Lease liabilities 376,101 700,877 54,303 106,015 99,573 440,986 2020 Lease liabilities 314,747 453,590 39,677 152,386 44,294 217,233 Lease obligation contractual cash flows are disclosed with the same renewal expectation assumption assessed for lease accounting under IFRS 16. The average remaining lease term remaining at December 31, 2021 is 13.8 years.
24. Provisions for other liabilities and charges
Decommissioning and site restoration provision
2021 2020 2019 $'000 $'000 $'000 At January 1 53,266 33,568 33,010 Additions through business combinations (refer to note 31) 8,347 15,437 — Increase in provisions 7,212 8,315 405 Payments for tower and tower equipment decommissioning (231) (65) — Reversal of decommissioning through profit and loss (2,671) — — Unwinding of discount 4,644 2,644 1,712 Effects of movement in exchange rates 1,374 (6,633) (1,559) At December 31 71,941 53,266 33,568 Analysis of total decommissioning and site restoration provisions: Non-current 71,598 49,469 29,801 Current 343 3,797 3,767 71,941 53,266 33,568 This provision relates to the probable obligation that the Group may incur to dismantle and remove assets from tower sites. The amount recognized initially is the present value of the estimated amount that will be required to decommission and restore the leased sites to their original states, discounted using the current borrowing rates of individual operations within the Group. The amount provided for each site has been discounted based on the respective lease terms attached to each site.
The provisions have been created based on management’s decommissioning experience of the specific situations. Assumptions have been made based on the current economic environment, current construction requirements, technology, price levels and expected plans for remediation. Management believes that these assumptions are a reasonable basis upon which to estimate the future liability. These estimates are reviewed regularly to take into account any material changes to the assumptions. Actual decommissioning or restoration costs will however, ultimately depend upon future market prices for the necessary decommissioning works required that will reflect market conditions at the relevant time. Furthermore, the timing of decommissioning is likely to depend on when the lease term is terminated without renewal. This, in turn, will depend upon technological changes in the local and international telecommunication industries which are inherently uncertain.
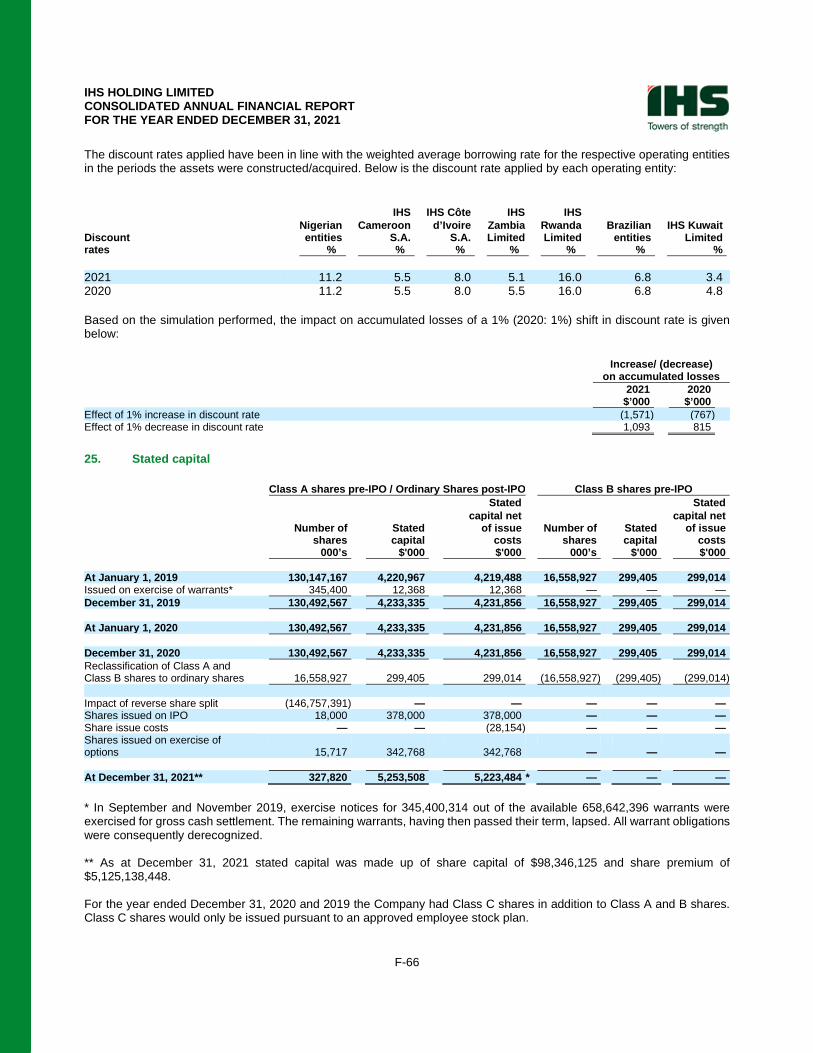
IHS HOLDING LIMITED CONSOLIDATED ANNUAL FINANCIAL REPORT FOR THE YEAR ENDED DECEMBER 31, 2021
F-66
The discount rates applied have been in line with the weighted average borrowing rate for the respective operating entities in the periods the assets were constructed/acquired. Below is the discount rate applied by each operating entity:
IHS IHS Côte IHS IHS
Nigerian Cameroon d’Ivoire Zambia Rwanda Brazilian IHS Kuwait Discount entities S.A. S.A. Limited Limited entities Limited rates % % % % % % % 2021 11.2 5.5 8.0 5.1 16.0 6.8 3.4 2020 11.2 5.5 8.0 5.5 16.0 6.8 4.8 Based on the simulation performed, the impact on accumulated losses of a 1% (2020: 1%) shift in discount rate is given below:
Increase/ (decrease) on accumulated losses 2021 2020 $’000 $’000 Effect of 1% increase in discount rate (1,571) (767) Effect of 1% decrease in discount rate 1,093 815
25. Stated capital
Class A shares pre-IPO / Ordinary Shares post-IPO Class B shares pre-IPO Stated Stated capital net capital net Number of Stated of issue Number of Stated of issue shares capital costs shares capital costs 000’s $'000 $'000 000’s $'000 $'000 At January 1, 2019 130,147,167 4,220,967 4,219,488 16,558,927 299,405 299,014 Issued on exercise of warrants* 345,400 12,368 12,368 — — — December 31, 2019 130,492,567 4,233,335 4,231,856 16,558,927 299,405 299,014 At January 1, 2020 130,492,567 4,233,335 4,231,856 16,558,927 299,405 299,014 December 31, 2020 130,492,567 4,233,335 4,231,856 16,558,927 299,405 299,014 Reclassification of Class A and Class B shares to ordinary shares 16,558,927 299,405 299,014 (16,558,927) (299,405) (299,014) Impact of reverse share split (146,757,391) — — — — — Shares issued on IPO 18,000 378,000 378,000 — — — Share issue costs — — (28,154) — — — Shares issued on exercise of options 15,717 342,768 342,768 — — — At December 31, 2021** 327,820 5,253,508 5,223,484 * — — — * In September and November 2019, exercise notices for 345,400,314 out of the available 658,642,396 warrants were exercised for gross cash settlement. The remaining warrants, having then passed their term, lapsed. All warrant obligations were consequently derecognized. ** As at December 31, 2021 stated capital was made up of share capital of $98,346,125 and share premium of $5,125,138,448. For the year ended December 31, 2020 and 2019 the Company had Class C shares in addition to Class A and B shares. Class C shares would only be issued pursuant to an approved employee stock plan.
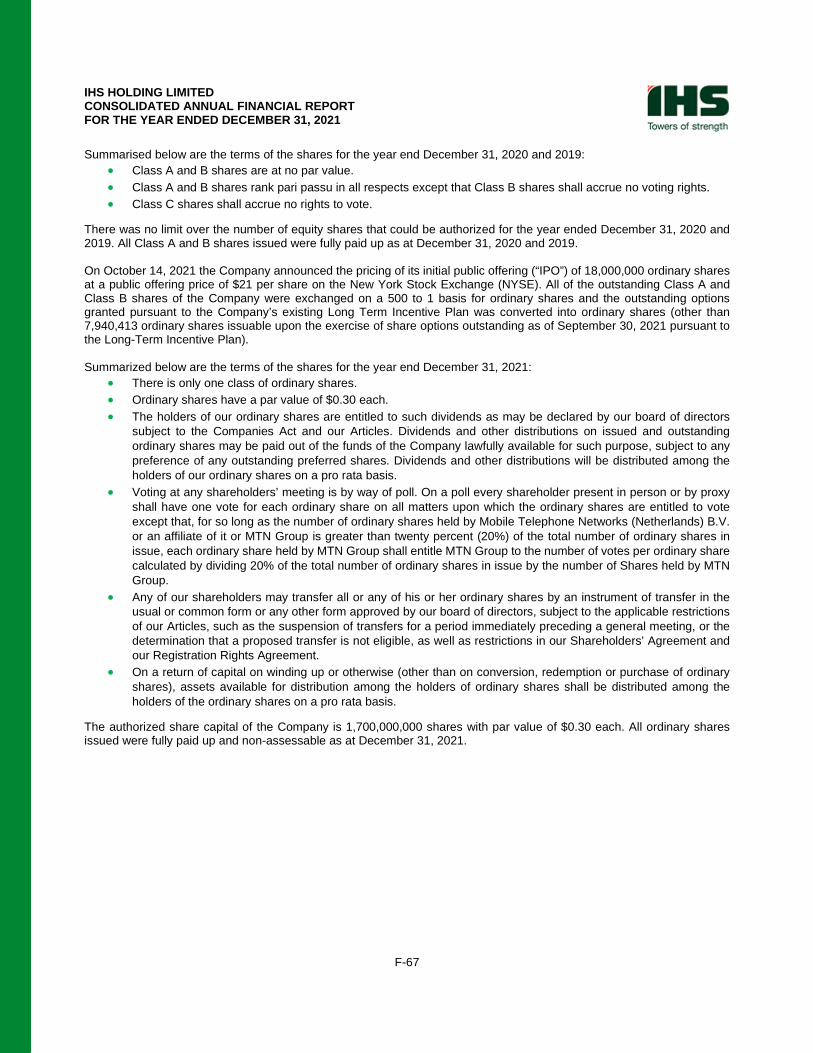
IHS HOLDING LIMITED CONSOLIDATED ANNUAL FINANCIAL REPORT FOR THE YEAR ENDED DECEMBER 31, 2021
F-67
Summarised below are the terms of the shares for the year end December 31, 2020 and 2019: • Class A and B shares are at no par value. • Class A and B shares rank pari passu in all respects except that Class B shares shall accrue no voting rights. • Class C shares shall accrue no rights to vote.
There was no limit over the number of equity shares that could be authorized for the year ended December 31, 2020 and 2019. All Class A and B shares issued were fully paid up as at December 31, 2020 and 2019. On October 14, 2021 the Company announced the pricing of its initial public offering (“IPO”) of 18,000,000 ordinary shares at a public offering price of $21 per share on the New York Stock Exchange (NYSE). All of the outstanding Class A and Class B shares of the Company were exchanged on a 500 to 1 basis for ordinary shares and the outstanding options granted pursuant to the Company’s existing Long Term Incentive Plan was converted into ordinary shares (other than 7,940,413 ordinary shares issuable upon the exercise of share options outstanding as of September 30, 2021 pursuant to the Long-Term Incentive Plan). Summarized below are the terms of the shares for the year end December 31, 2021:
• There is only one class of ordinary shares. • Ordinary shares have a par value of $0.30 each. • The holders of our ordinary shares are entitled to such dividends as may be declared by our board of directors
subject to the Companies Act and our Articles. Dividends and other distributions on issued and outstanding ordinary shares may be paid out of the funds of the Company lawfully available for such purpose, subject to any preference of any outstanding preferred shares. Dividends and other distributions will be distributed among the holders of our ordinary shares on a pro rata basis.
• Voting at any shareholders’ meeting is by way of poll. On a poll every shareholder present in person or by proxy shall have one vote for each ordinary share on all matters upon which the ordinary shares are entitled to vote except that, for so long as the number of ordinary shares held by Mobile Telephone Networks (Netherlands) B.V. or an affiliate of it or MTN Group is greater than twenty percent (20%) of the total number of ordinary shares in issue, each ordinary share held by MTN Group shall entitle MTN Group to the number of votes per ordinary share calculated by dividing 20% of the total number of ordinary shares in issue by the number of Shares held by MTN Group.
• Any of our shareholders may transfer all or any of his or her ordinary shares by an instrument of transfer in the usual or common form or any other form approved by our board of directors, subject to the applicable restrictions of our Articles, such as the suspension of transfers for a period immediately preceding a general meeting, or the determination that a proposed transfer is not eligible, as well as restrictions in our Shareholders’ Agreement and our Registration Rights Agreement.
• On a return of capital on winding up or otherwise (other than on conversion, redemption or purchase of ordinary shares), assets available for distribution among the holders of ordinary shares shall be distributed among the holders of the ordinary shares on a pro rata basis.
The authorized share capital of the Company is 1,700,000,000 shares with par value of $0.30 each. All ordinary shares issued were fully paid up and non-assessable as at December 31, 2021.
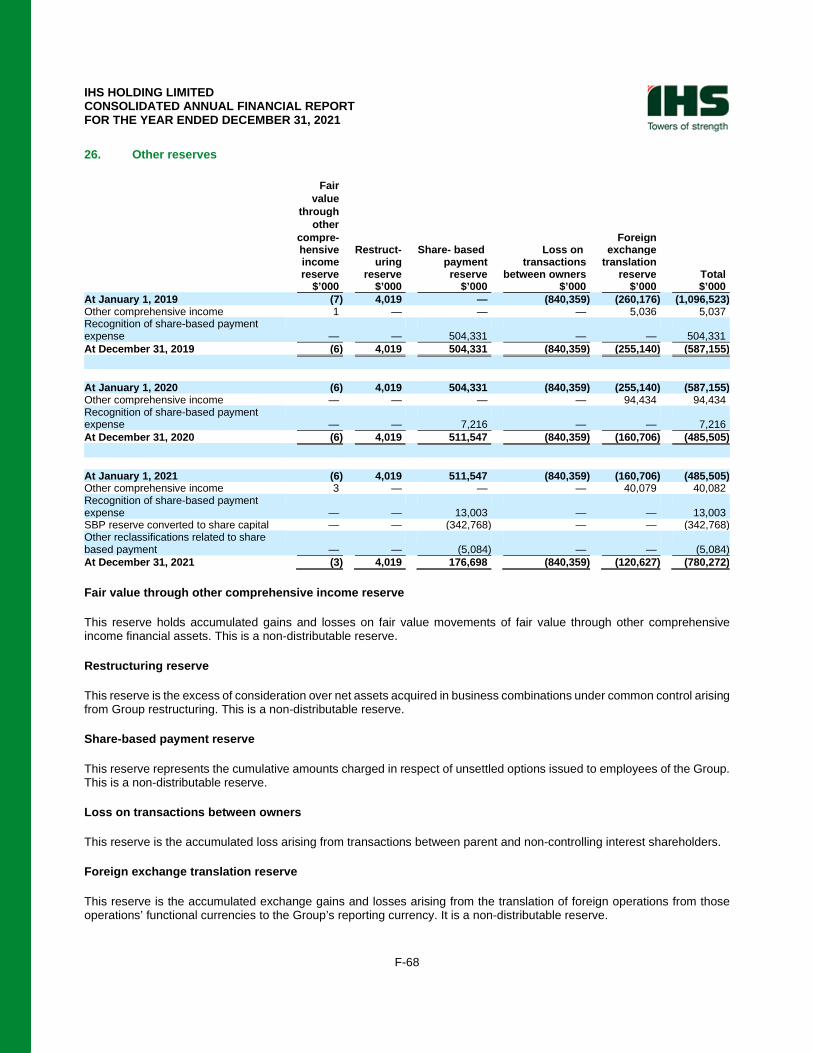
IHS HOLDING LIMITED CONSOLIDATED ANNUAL FINANCIAL REPORT FOR THE YEAR ENDED DECEMBER 31, 2021
F-68
26. Other reserves
Fair value through other compre- Foreign hensive Restruct- Share- based Loss on exchange income uring payment transactions translation reserve reserve reserve between owners reserve Total $’000 $’000 $’000 $’000 $’000 $’000 At January 1, 2019 (7) 4,019 — (840,359) (260,176) (1,096,523) Other comprehensive income 1 — — — 5,036 5,037 Recognition of share-based payment expense — — 504,331 — — 504,331 At December 31, 2019 (6) 4,019 504,331 (840,359) (255,140) (587,155) At January 1, 2020 (6) 4,019 504,331 (840,359) (255,140) (587,155) Other comprehensive income — — — — 94,434 94,434 Recognition of share-based payment expense — — 7,216 — — 7,216 At December 31, 2020 (6) 4,019 511,547 (840,359) (160,706) (485,505) At January 1, 2021 (6) 4,019 511,547 (840,359) (160,706) (485,505) Other comprehensive income 3 — — — 40,079 40,082 Recognition of share-based payment expense — — 13,003 — — 13,003 SBP reserve converted to share capital — — (342,768) — — (342,768) Other reclassifications related to share based payment — — (5,084) — — (5,084) At December 31, 2021 (3) 4,019 176,698 (840,359) (120,627) (780,272) Fair value through other comprehensive income reserve
This reserve holds accumulated gains and losses on fair value movements of fair value through other comprehensive income financial assets. This is a non-distributable reserve.
Restructuring reserve
This reserve is the excess of consideration over net assets acquired in business combinations under common control arising from Group restructuring. This is a non-distributable reserve.
Share-based payment reserve
This reserve represents the cumulative amounts charged in respect of unsettled options issued to employees of the Group. This is a non-distributable reserve.
Loss on transactions between owners
This reserve is the accumulated loss arising from transactions between parent and non-controlling interest shareholders.
Foreign exchange translation reserve
This reserve is the accumulated exchange gains and losses arising from the translation of foreign operations from those operations’ functional currencies to the Group’s reporting currency. It is a non-distributable reserve.
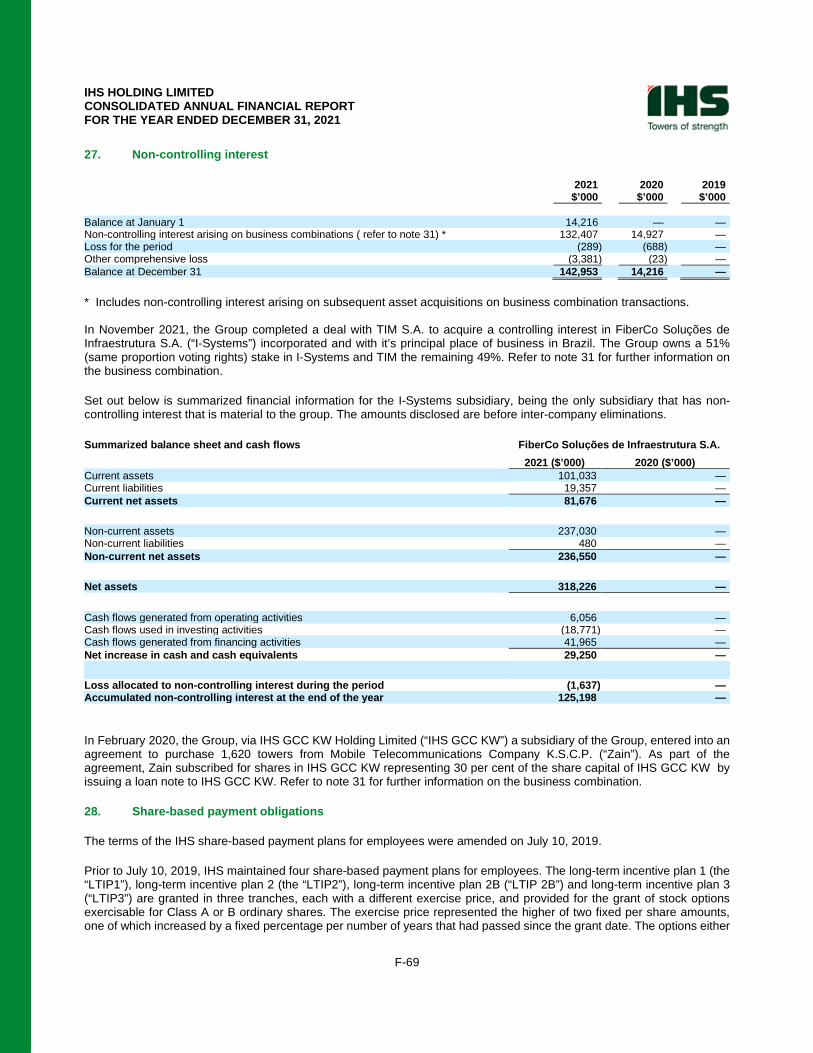
IHS HOLDING LIMITED CONSOLIDATED ANNUAL FINANCIAL REPORT FOR THE YEAR ENDED DECEMBER 31, 2021
F-69
27. Non-controlling interest
2021 2020 2019 $’000 $’000 $’000 Balance at January 1 14,216 — — Non-controlling interest arising on business combinations ( refer to note 31) * 132,407 14,927 — Loss for the period (289) (688) — Other comprehensive loss (3,381) (23) — Balance at December 31 142,953 14,216 — * Includes non-controlling interest arising on subsequent asset acquisitions on business combination transactions. In November 2021, the Group completed a deal with TIM S.A. to acquire a controlling interest in FiberCo Soluções de Infraestrutura S.A. (“I-Systems”) incorporated and with it’s principal place of business in Brazil. The Group owns a 51% (same proportion voting rights) stake in I-Systems and TIM the remaining 49%. Refer to note 31 for further information on the business combination.
Set out below is summarized financial information for the I-Systems subsidiary, being the only subsidiary that has non-controlling interest that is material to the group. The amounts disclosed are before inter-company eliminations.
Summarized balance sheet and cash flows FiberCo Soluções de Infraestrutura S.A. 2021 ($’000) 2020 ($’000) Current assets 101,033 — Current liabilities 19,357 — Current net assets 81,676 — Non-current assets 237,030 — Non-current liabilities 480 — Non-current net assets 236,550 — Net assets 318,226 — Cash flows generated from operating activities 6,056 — Cash flows used in investing activities (18,771) — Cash flows generated from financing activities 41,965 — Net increase in cash and cash equivalents 29,250 — Loss allocated to non-controlling interest during the period (1,637) — Accumulated non-controlling interest at the end of the year 125,198 —
In February 2020, the Group, via IHS GCC KW Holding Limited (“IHS GCC KW”) a subsidiary of the Group, entered into an agreement to purchase 1,620 towers from Mobile Telecommunications Company K.S.C.P. (“Zain”). As part of the agreement, Zain subscribed for shares in IHS GCC KW representing 30 per cent of the share capital of IHS GCC KW by issuing a loan note to IHS GCC KW. Refer to note 31 for further information on the business combination.
28. Share-based payment obligations
The terms of the IHS share-based payment plans for employees were amended on July 10, 2019.
Prior to July 10, 2019, IHS maintained four share-based payment plans for employees. The long-term incentive plan 1 (the “LTIP1”), long-term incentive plan 2 (the “LTIP2”), long-term incentive plan 2B (“LTIP 2B”) and long-term incentive plan 3 (“LTIP3”) are granted in three tranches, each with a different exercise price, and provided for the grant of stock options exercisable for Class A or B ordinary shares. The exercise price represented the higher of two fixed per share amounts, one of which increased by a fixed percentage per number of years that had passed since the grant date. The options either
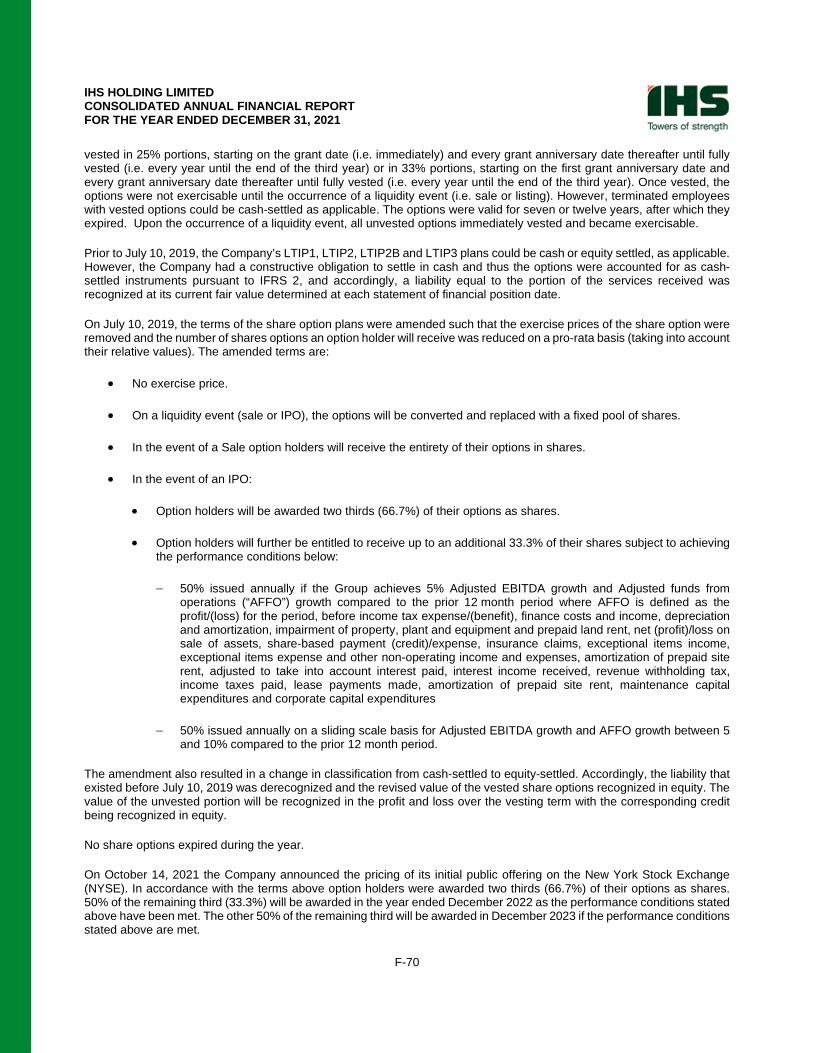
IHS HOLDING LIMITED CONSOLIDATED ANNUAL FINANCIAL REPORT FOR THE YEAR ENDED DECEMBER 31, 2021
F-70
vested in 25% portions, starting on the grant date (i.e. immediately) and every grant anniversary date thereafter until fully vested (i.e. every year until the end of the third year) or in 33% portions, starting on the first grant anniversary date and every grant anniversary date thereafter until fully vested (i.e. every year until the end of the third year). Once vested, the options were not exercisable until the occurrence of a liquidity event (i.e. sale or listing). However, terminated employees with vested options could be cash-settled as applicable. The options were valid for seven or twelve years, after which they expired. Upon the occurrence of a liquidity event, all unvested options immediately vested and became exercisable.
Prior to July 10, 2019, the Company’s LTIP1, LTIP2, LTIP2B and LTIP3 plans could be cash or equity settled, as applicable. However, the Company had a constructive obligation to settle in cash and thus the options were accounted for as cash-settled instruments pursuant to IFRS 2, and accordingly, a liability equal to the portion of the services received was recognized at its current fair value determined at each statement of financial position date.
On July 10, 2019, the terms of the share option plans were amended such that the exercise prices of the share option were removed and the number of shares options an option holder will receive was reduced on a pro-rata basis (taking into account their relative values). The amended terms are:
• No exercise price.
• On a liquidity event (sale or IPO), the options will be converted and replaced with a fixed pool of shares.
• In the event of a Sale option holders will receive the entirety of their options in shares.
• In the event of an IPO:
• Option holders will be awarded two thirds (66.7%) of their options as shares.
• Option holders will further be entitled to receive up to an additional 33.3% of their shares subject to achieving the performance conditions below:
− 50% issued annually if the Group achieves 5% Adjusted EBITDA growth and Adjusted funds from operations (“AFFO”) growth compared to the prior 12 month period where AFFO is defined as the profit/(loss) for the period, before income tax expense/(benefit), finance costs and income, depreciation and amortization, impairment of property, plant and equipment and prepaid land rent, net (profit)/loss on sale of assets, share-based payment (credit)/expense, insurance claims, exceptional items income, exceptional items expense and other non-operating income and expenses, amortization of prepaid site rent, adjusted to take into account interest paid, interest income received, revenue withholding tax, income taxes paid, lease payments made, amortization of prepaid site rent, maintenance capital expenditures and corporate capital expenditures
− 50% issued annually on a sliding scale basis for Adjusted EBITDA growth and AFFO growth between 5 and 10% compared to the prior 12 month period.
The amendment also resulted in a change in classification from cash-settled to equity-settled. Accordingly, the liability that existed before July 10, 2019 was derecognized and the revised value of the vested share options recognized in equity. The value of the unvested portion will be recognized in the profit and loss over the vesting term with the corresponding credit being recognized in equity.
No share options expired during the year.
On October 14, 2021 the Company announced the pricing of its initial public offering on the New York Stock Exchange (NYSE). In accordance with the terms above option holders were awarded two thirds (66.7%) of their options as shares. 50% of the remaining third (33.3%) will be awarded in the year ended December 2022 as the performance conditions stated above have been met. The other 50% of the remaining third will be awarded in December 2023 if the performance conditions stated above are met.
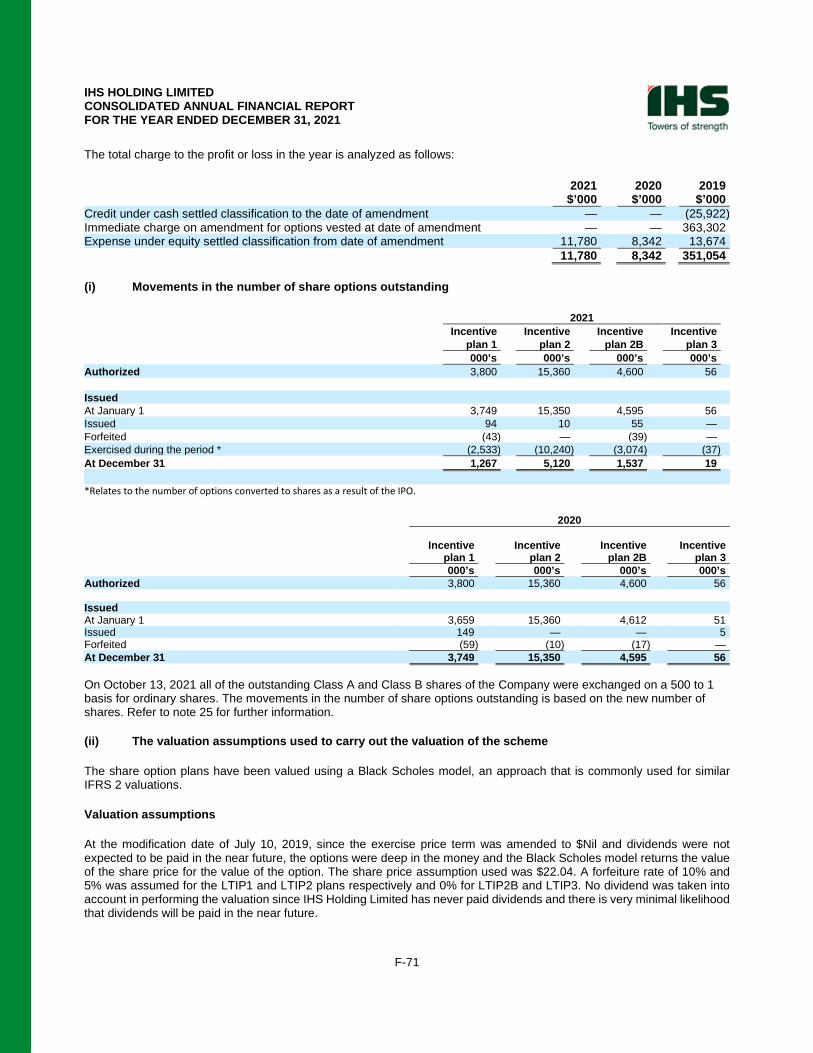
IHS HOLDING LIMITED CONSOLIDATED ANNUAL FINANCIAL REPORT FOR THE YEAR ENDED DECEMBER 31, 2021
F-71
The total charge to the profit or loss in the year is analyzed as follows:
2021 2020 2019 $’000 $’000 $’000 Credit under cash settled classification to the date of amendment — — (25,922) Immediate charge on amendment for options vested at date of amendment — — 363,302 Expense under equity settled classification from date of amendment 11,780 8,342 13,674 11,780 8,342 351,054 (i) Movements in the number of share options outstanding
2021 Incentive Incentive Incentive Incentive plan 1 plan 2 plan 2B plan 3 000’s 000’s 000’s 000’s Authorized 3,800 15,360 4,600 56 Issued At January 1 3,749 15,350 4,595 56 Issued 94 10 55 — Forfeited (43) — (39) — Exercised during the period * (2,533) (10,240) (3,074) (37) At December 31 1,267 5,120 1,537 19 *Relates to the number of options converted to shares as a result of the IPO.
2020 Incentive Incentive Incentive Incentive plan 1 plan 2 plan 2B plan 3 000’s 000’s 000’s 000’s Authorized 3,800 15,360 4,600 56 Issued At January 1 3,659 15,360 4,612 51 Issued 149 — — 5 Forfeited (59) (10) (17) — At December 31 3,749 15,350 4,595 56 On October 13, 2021 all of the outstanding Class A and Class B shares of the Company were exchanged on a 500 to 1 basis for ordinary shares. The movements in the number of share options outstanding is based on the new number of shares. Refer to note 25 for further information. (ii) The valuation assumptions used to carry out the valuation of the scheme
The share option plans have been valued using a Black Scholes model, an approach that is commonly used for similar IFRS 2 valuations.
Valuation assumptions
At the modification date of July 10, 2019, since the exercise price term was amended to $Nil and dividends were not expected to be paid in the near future, the options were deep in the money and the Black Scholes model returns the value of the share price for the value of the option. The share price assumption used was $22.04. A forfeiture rate of 10% and 5% was assumed for the LTIP1 and LTIP2 plans respectively and 0% for LTIP2B and LTIP3. No dividend was taken into account in performing the valuation since IHS Holding Limited has never paid dividends and there is very minimal likelihood that dividends will be paid in the near future.
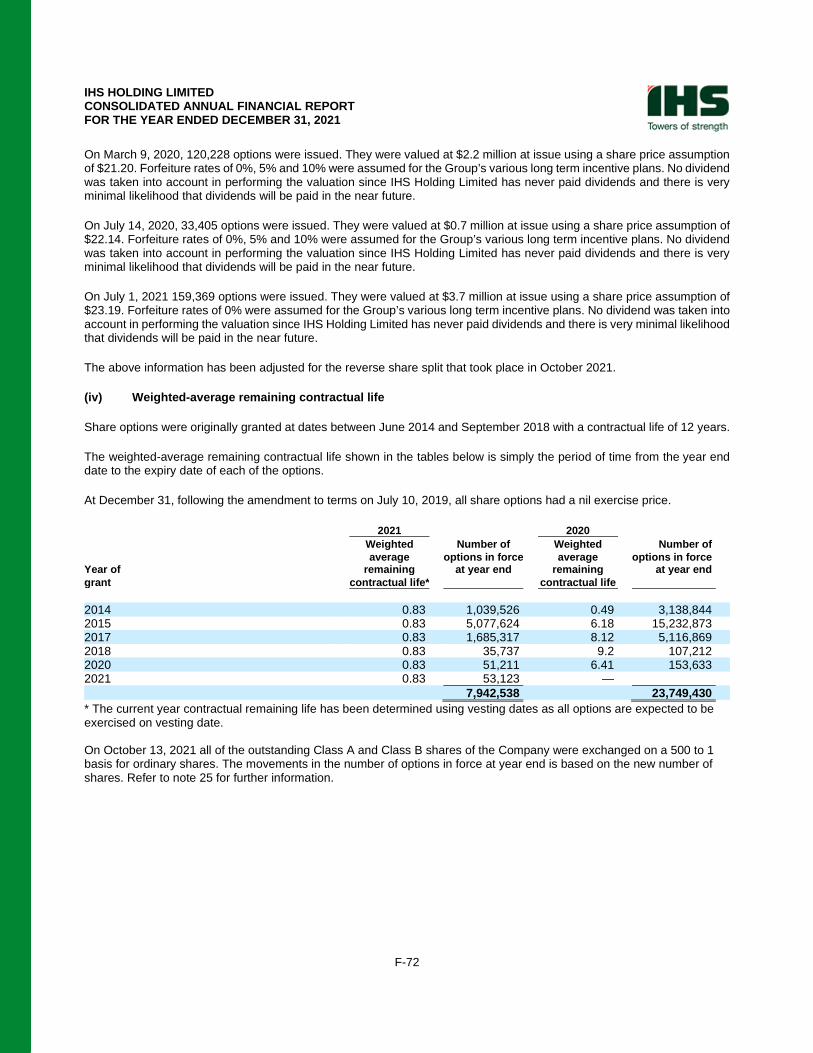
IHS HOLDING LIMITED CONSOLIDATED ANNUAL FINANCIAL REPORT FOR THE YEAR ENDED DECEMBER 31, 2021
F-72
On March 9, 2020, 120,228 options were issued. They were valued at $2.2 million at issue using a share price assumption of $21.20. Forfeiture rates of 0%, 5% and 10% were assumed for the Group’s various long term incentive plans. No dividend was taken into account in performing the valuation since IHS Holding Limited has never paid dividends and there is very minimal likelihood that dividends will be paid in the near future.
On July 14, 2020, 33,405 options were issued. They were valued at $0.7 million at issue using a share price assumption of $22.14. Forfeiture rates of 0%, 5% and 10% were assumed for the Group’s various long term incentive plans. No dividend was taken into account in performing the valuation since IHS Holding Limited has never paid dividends and there is very minimal likelihood that dividends will be paid in the near future.
On July 1, 2021 159,369 options were issued. They were valued at $3.7 million at issue using a share price assumption of $23.19. Forfeiture rates of 0% were assumed for the Group’s various long term incentive plans. No dividend was taken into account in performing the valuation since IHS Holding Limited has never paid dividends and there is very minimal likelihood that dividends will be paid in the near future.
The above information has been adjusted for the reverse share split that took place in October 2021.
(iv) Weighted-average remaining contractual life
Share options were originally granted at dates between June 2014 and September 2018 with a contractual life of 12 years.
The weighted-average remaining contractual life shown in the tables below is simply the period of time from the year end date to the expiry date of each of the options.
At December 31, following the amendment to terms on July 10, 2019, all share options had a nil exercise price.
2021 2020 Weighted Number of Weighted Number of average options in force average options in force
Year of remaining at year end remaining at year end grant contractual life* contractual life 2014 0.83 1,039,526 0.49 3,138,844 2015 0.83 5,077,624 6.18 15,232,873 2017 0.83 1,685,317 8.12 5,116,869 2018 0.83 35,737 9.2 107,212 2020 0.83 51,211 6.41 153,633 2021 0.83 53,123 — 7,942,538 23,749,430 * The current year contractual remaining life has been determined using vesting dates as all options are expected to be exercised on vesting date. On October 13, 2021 all of the outstanding Class A and Class B shares of the Company were exchanged on a 500 to 1 basis for ordinary shares. The movements in the number of options in force at year end is based on the new number of shares. Refer to note 25 for further information.
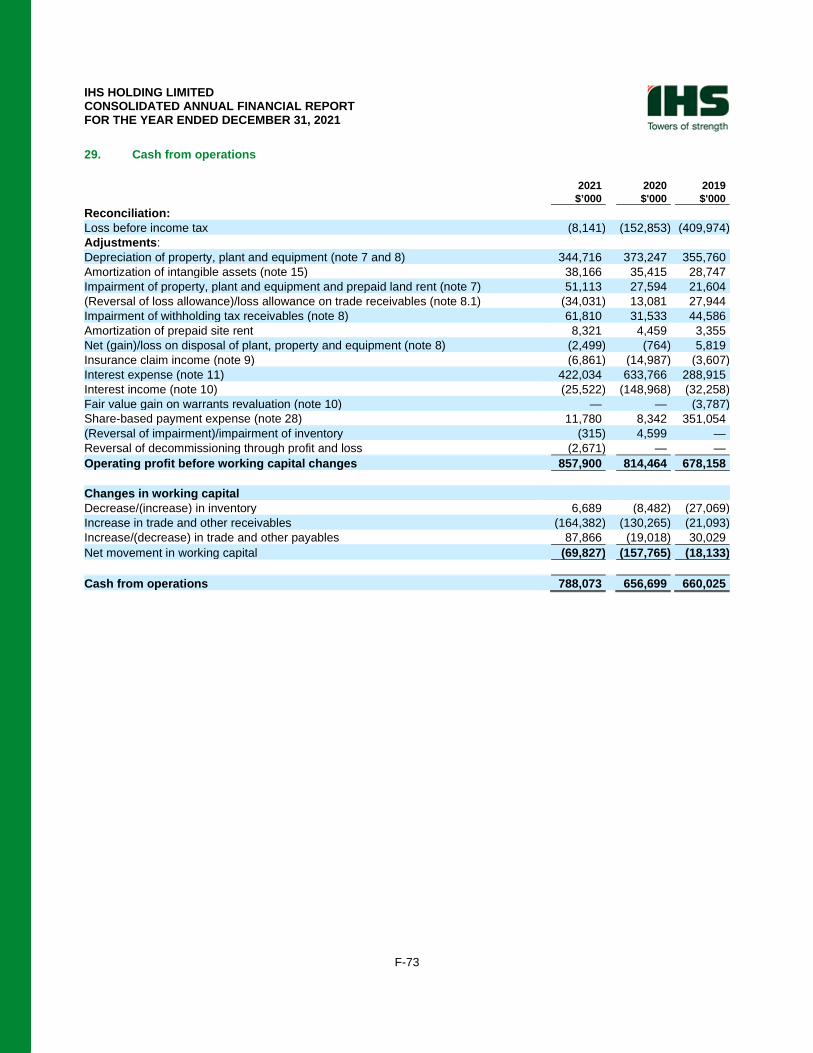
IHS HOLDING LIMITED CONSOLIDATED ANNUAL FINANCIAL REPORT FOR THE YEAR ENDED DECEMBER 31, 2021
F-73
29. Cash from operations
2021 2020 2019 $’000 $'000 $'000 Reconciliation: Loss before income tax (8,141) (152,853) (409,974) Adjustments: Depreciation of property, plant and equipment (note 7 and 8) 344,716 373,247 355,760 Amortization of intangible assets (note 15) 38,166 35,415 28,747 Impairment of property, plant and equipment and prepaid land rent (note 7) 51,113 27,594 21,604 (Reversal of loss allowance)/loss allowance on trade receivables (note 8.1) (34,031) 13,081 27,944 Impairment of withholding tax receivables (note 8) 61,810 31,533 44,586 Amortization of prepaid site rent 8,321 4,459 3,355 Net (gain)/loss on disposal of plant, property and equipment (note 8) (2,499) (764) 5,819 Insurance claim income (note 9) (6,861) (14,987) (3,607) Interest expense (note 11) 422,034 633,766 288,915 Interest income (note 10) (25,522) (148,968) (32,258) Fair value gain on warrants revaluation (note 10) — — (3,787) Share‑based payment expense (note 28) 11,780 8,342 351,054 (Reversal of impairment)/impairment of inventory (315) 4,599 — Reversal of decommissioning through profit and loss (2,671) — — Operating profit before working capital changes 857,900 814,464 678,158 Changes in working capital Decrease/(increase) in inventory 6,689 (8,482) (27,069) Increase in trade and other receivables (164,382) (130,265) (21,093) Increase/(decrease) in trade and other payables 87,866 (19,018) 30,029 Net movement in working capital (69,827) (157,765) (18,133) Cash from operations 788,073 656,699 660,025
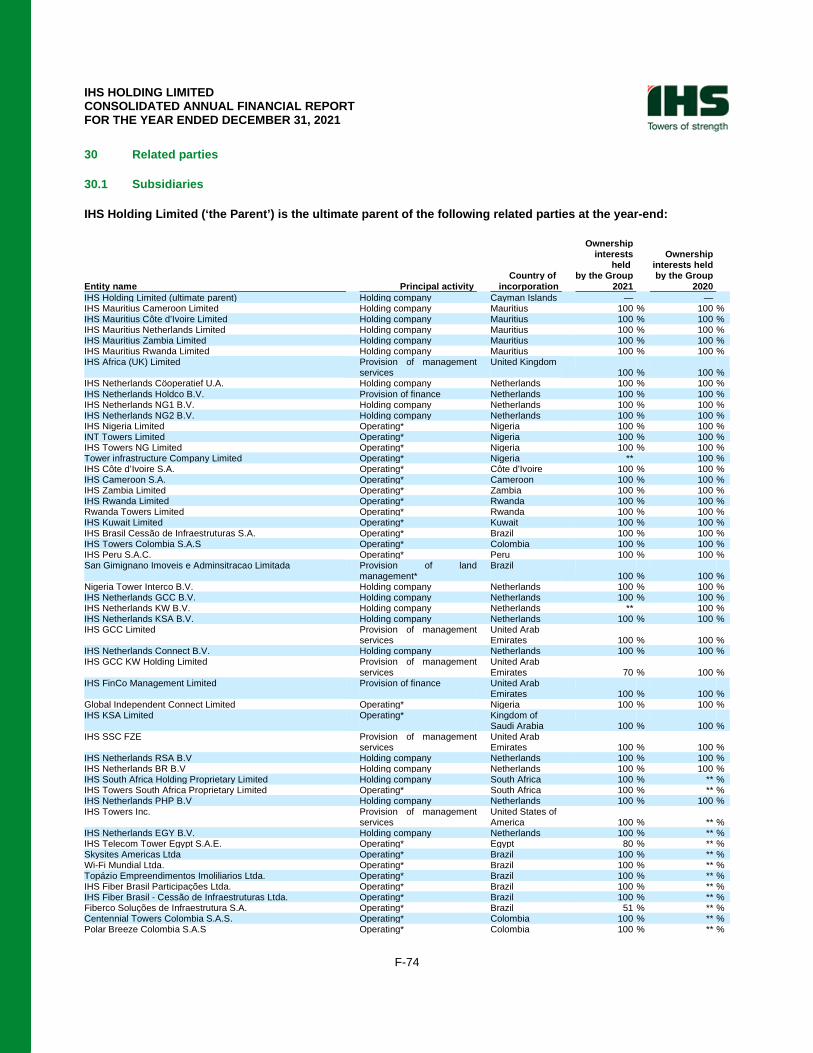
IHS HOLDING LIMITED CONSOLIDATED ANNUAL FINANCIAL REPORT FOR THE YEAR ENDED DECEMBER 31, 2021
F-74
30 Related parties
30.1 Subsidiaries
IHS Holding Limited (‘the Parent’) is the ultimate parent of the following related parties at the year-end:
Ownership interests Ownership held interests held Country of by the Group by the Group Entity name Principal activity incorporation 2021 2020 IHS Holding Limited (ultimate parent) Holding company Cayman Islands — — IHS Mauritius Cameroon Limited Holding company Mauritius 100 % 100 % IHS Mauritius Côte d’Ivoire Limited Holding company Mauritius 100 % 100 % IHS Mauritius Netherlands Limited Holding company Mauritius 100 % 100 % IHS Mauritius Zambia Limited Holding company Mauritius 100 % 100 % IHS Mauritius Rwanda Limited Holding company Mauritius 100 % 100 % IHS Africa (UK) Limited
Provision of management services
United Kingdom 100 % 100 %
IHS Netherlands Cöoperatief U.A. Holding company Netherlands 100 % 100 % IHS Netherlands Holdco B.V. Provision of finance Netherlands 100 % 100 % IHS Netherlands NG1 B.V. Holding company Netherlands 100 % 100 % IHS Netherlands NG2 B.V. Holding company Netherlands 100 % 100 % IHS Nigeria Limited Operating* Nigeria 100 % 100 % INT Towers Limited Operating* Nigeria 100 % 100 % IHS Towers NG Limited Operating* Nigeria 100 % 100 % Tower infrastructure Company Limited Operating* Nigeria ** 100 % IHS Côte d’Ivoire S.A. Operating* Côte d’Ivoire 100 % 100 % IHS Cameroon S.A. Operating* Cameroon 100 % 100 % IHS Zambia Limited Operating* Zambia 100 % 100 % IHS Rwanda Limited Operating* Rwanda 100 % 100 % Rwanda Towers Limited Operating* Rwanda 100 % 100 % IHS Kuwait Limited Operating* Kuwait 100 % 100 % IHS Brasil Cessão de Infraestruturas S.A. Operating* Brazil 100 % 100 % IHS Towers Colombia S.A.S Operating* Colombia 100 % 100 % IHS Peru S.A.C. Operating* Peru 100 % 100 % San Gimignano Imoveis e Adminsitracao Limitada
Provision of land management*
Brazil 100 % 100 %
Nigeria Tower Interco B.V. Holding company Netherlands 100 % 100 % IHS Netherlands GCC B.V. Holding company Netherlands 100 % 100 % IHS Netherlands KW B.V. Holding company Netherlands ** 100 % IHS Netherlands KSA B.V. Holding company Netherlands 100 % 100 % IHS GCC Limited
Provision of management services
United Arab Emirates 100 % 100 %
IHS Netherlands Connect B.V. Holding company Netherlands 100 % 100 % IHS GCC KW Holding Limited
Provision of management services
United Arab Emirates 70 % 100 %
IHS FinCo Management Limited
Provision of finance
United Arab Emirates 100 % 100 %
Global Independent Connect Limited Operating* Nigeria 100 % 100 % IHS KSA Limited
Operating*
Kingdom of Saudi Arabia 100 % 100 %
IHS SSC FZE
Provision of management services
United Arab Emirates 100 % 100 %
IHS Netherlands RSA B.V Holding company Netherlands 100 % 100 % IHS Netherlands BR B.V Holding company Netherlands 100 % 100 % IHS South Africa Holding Proprietary Limited Holding company South Africa 100 % ** % IHS Towers South Africa Proprietary Limited Operating* South Africa 100 % ** % IHS Netherlands PHP B.V Holding company Netherlands 100 % 100 % IHS Towers Inc.
Provision of management services
United States of America 100 % ** %
IHS Netherlands EGY B.V. Holding company Netherlands 100 % ** % IHS Telecom Tower Egypt S.A.E. Operating* Egypt 80 % ** % Skysites Americas Ltda Operating* Brazil 100 % ** % Wi-Fi Mundial Ltda. Operating* Brazil 100 % ** % Topázio Empreendimentos Imoliliarios Ltda. Operating* Brazil 100 % ** % IHS Fiber Brasil Participações Ltda. Operating* Brazil 100 % ** % IHS Fiber Brasil - Cessão de Infraestruturas Ltda. Operating* Brazil 100 % ** % Fiberco Soluções de Infraestrutura S.A. Operating* Brazil 51 % ** % Centennial Towers Colombia S.A.S. Operating* Colombia 100 % ** % Polar Breeze Colombia S.A.S Operating* Colombia 100 % ** %
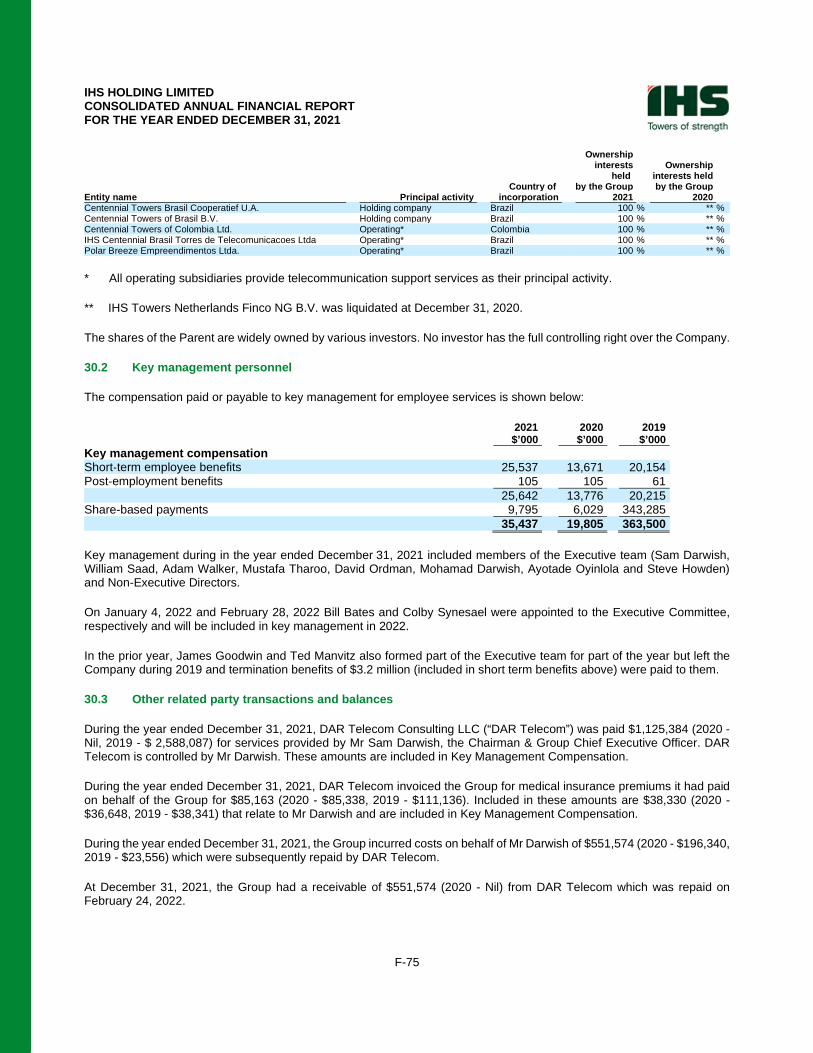
IHS HOLDING LIMITED CONSOLIDATED ANNUAL FINANCIAL REPORT FOR THE YEAR ENDED DECEMBER 31, 2021
F-75
Ownership interests Ownership held interests held Country of by the Group by the Group Entity name Principal activity incorporation 2021 2020 Centennial Towers Brasil Cooperatief U.A. Holding company Brazil 100 % ** % Centennial Towers of Brasil B.V. Holding company Brazil 100 % ** % Centennial Towers of Colombia Ltd. Operating* Colombia 100 % ** % IHS Centennial Brasil Torres de Telecomunicacoes Ltda Operating* Brazil 100 % ** % Polar Breeze Empreendimentos Ltda. Operating* Brazil 100 % ** % * All operating subsidiaries provide telecommunication support services as their principal activity.
** IHS Towers Netherlands Finco NG B.V. was liquidated at December 31, 2020.
The shares of the Parent are widely owned by various investors. No investor has the full controlling right over the Company.
30.2 Key management personnel
The compensation paid or payable to key management for employee services is shown below:
2021 2020 2019 $’000 $’000 $’000 Key management compensation Short‑term employee benefits 25,537 13,671 20,154 Post‑employment benefits 105 105 61 25,642 13,776 20,215 Share-based payments 9,795 6,029 343,285 35,437 19,805 363,500 Key management during in the year ended December 31, 2021 included members of the Executive team (Sam Darwish, William Saad, Adam Walker, Mustafa Tharoo, David Ordman, Mohamad Darwish, Ayotade Oyinlola and Steve Howden) and Non-Executive Directors.
On January 4, 2022 and February 28, 2022 Bill Bates and Colby Synesael were appointed to the Executive Committee, respectively and will be included in key management in 2022.
In the prior year, James Goodwin and Ted Manvitz also formed part of the Executive team for part of the year but left the Company during 2019 and termination benefits of $3.2 million (included in short term benefits above) were paid to them.
30.3 Other related party transactions and balances
During the year ended December 31, 2021, DAR Telecom Consulting LLC (“DAR Telecom”) was paid $1,125,384 (2020 - Nil, 2019 - $ 2,588,087) for services provided by Mr Sam Darwish, the Chairman & Group Chief Executive Officer. DAR Telecom is controlled by Mr Darwish. These amounts are included in Key Management Compensation.
During the year ended December 31, 2021, DAR Telecom invoiced the Group for medical insurance premiums it had paid on behalf of the Group for $85,163 (2020 - $85,338, 2019 - $111,136). Included in these amounts are $38,330 (2020 - $36,648, 2019 - $38,341) that relate to Mr Darwish and are included in Key Management Compensation.
During the year ended December 31, 2021, the Group incurred costs on behalf of Mr Darwish of $551,574 (2020 - $196,340, 2019 - $23,556) which were subsequently repaid by DAR Telecom.
At December 31, 2021, the Group had a receivable of $551,574 (2020 - Nil) from DAR Telecom which was repaid on February 24, 2022.
IHS HOLDING LIMITED CONSOLIDATED ANNUAL FINANCIAL REPORT FOR THE YEAR ENDED DECEMBER 31, 2021
F-76
During the year ended December 31, 2021 the Group was provided corporate administration services by CKLB International Management Limited (“CKLB”) and paid fees of $300,935 (2020 - $252,615, 2019 - $242,100). Mr Christian Li and Mrs Kathleen Lai, who served as directors of IHS Holding Limited until October 13, 2021, are directors of CKLB.
There were no other material transactions or balances between the Group and its key management personnel or members of their close family.
31. Business Combinations
For acquisitions that meet the definition of a business combination, the Group applies the acquisition method of accounting where assets acquired and liabilities assumed are recorded at fair value at the date of each acquisition, and the results of operations are included with those of the Group from the dates of the respective acquisitions. Where acquisitions are completed close to the end of the reporting period accounting for the business combination may be incomplete for valuation of assets and liabilities such that the amounts recognized in the financial statements for the business combination are determined only provisionally. There were three acquisitions during the year ended December 31, 2021. Had these businesses been acquired on January 1, 2021, the amount of revenue and loss after tax for the year ended December 31, 2021 for the Group would have been approximately $1,583 million and $24 million, respectively.
Skysites Holdings S.A.
IHS Holding Limited acquired 100% of the share capital of Skysites Holdings S.A. (“Skysites”), a telecommunications services provider, with related passive infrastructure and ground leases on January 6, 2021. The acquisition is consistent with the Group’s strategy to expand in selected geographic areas.
The goodwill of $26.9 million arising from the acquisition is attributable to the enhanced market presence in Brazil, the complementary service offering and closer alignment to certain customers as it relates to their future deployments. The goodwill recognized is currently expected to be deductible for income tax purposes.
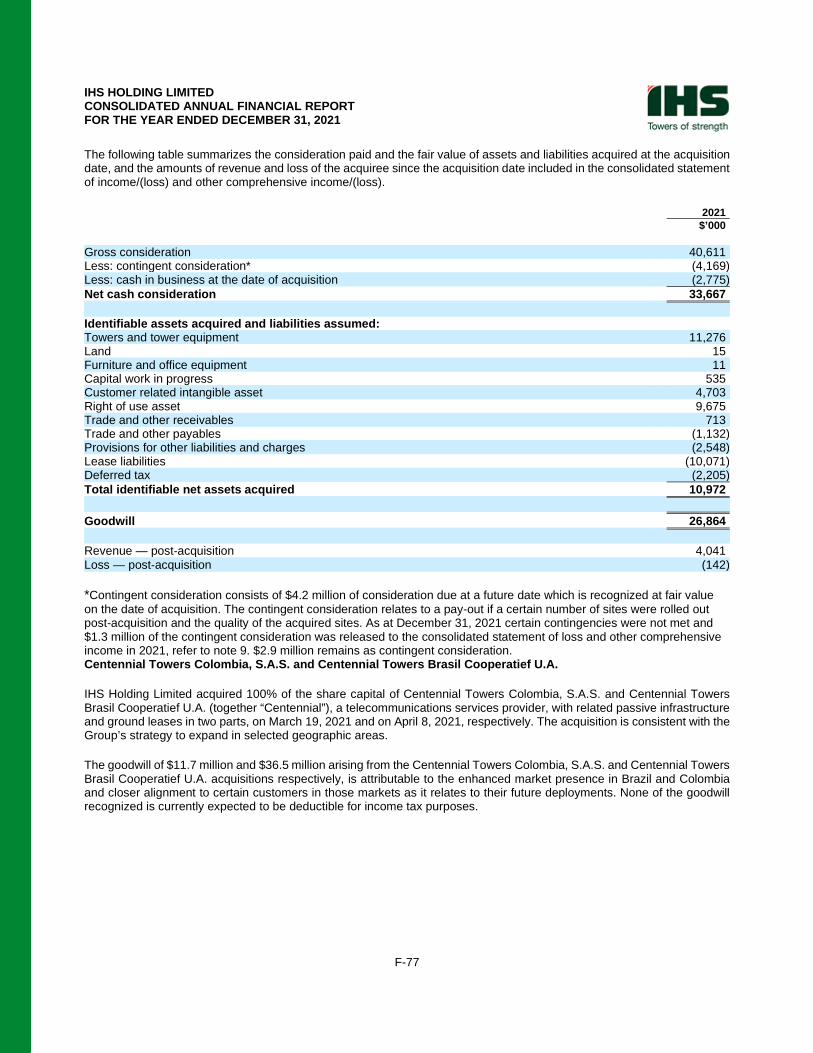
IHS HOLDING LIMITED CONSOLIDATED ANNUAL FINANCIAL REPORT FOR THE YEAR ENDED DECEMBER 31, 2021
F-77
The following table summarizes the consideration paid and the fair value of assets and liabilities acquired at the acquisition date, and the amounts of revenue and loss of the acquiree since the acquisition date included in the consolidated statement of income/(loss) and other comprehensive income/(loss).
2021 $’000 Gross consideration 40,611 Less: contingent consideration* (4,169) Less: cash in business at the date of acquisition (2,775) Net cash consideration 33,667 Identifiable assets acquired and liabilities assumed: Towers and tower equipment 11,276 Land 15 Furniture and office equipment 11 Capital work in progress 535 Customer related intangible asset 4,703 Right of use asset 9,675 Trade and other receivables 713 Trade and other payables (1,132) Provisions for other liabilities and charges (2,548) Lease liabilities (10,071) Deferred tax (2,205) Total identifiable net assets acquired 10,972 Goodwill 26,864 Revenue — post‑acquisition 4,041 Loss — post‑acquisition (142) *Contingent consideration consists of $4.2 million of consideration due at a future date which is recognized at fair value on the date of acquisition. The contingent consideration relates to a pay-out if a certain number of sites were rolled out post-acquisition and the quality of the acquired sites. As at December 31, 2021 certain contingencies were not met and $1.3 million of the contingent consideration was released to the consolidated statement of loss and other comprehensive income in 2021, refer to note 9. $2.9 million remains as contingent consideration. Centennial Towers Colombia, S.A.S. and Centennial Towers Brasil Cooperatief U.A.
IHS Holding Limited acquired 100% of the share capital of Centennial Towers Colombia, S.A.S. and Centennial Towers Brasil Cooperatief U.A. (together “Centennial”), a telecommunications services provider, with related passive infrastructure and ground leases in two parts, on March 19, 2021 and on April 8, 2021, respectively. The acquisition is consistent with the Group’s strategy to expand in selected geographic areas.
The goodwill of $11.7 million and $36.5 million arising from the Centennial Towers Colombia, S.A.S. and Centennial Towers Brasil Cooperatief U.A. acquisitions respectively, is attributable to the enhanced market presence in Brazil and Colombia and closer alignment to certain customers in those markets as it relates to their future deployments. None of the goodwill recognized is currently expected to be deductible for income tax purposes.
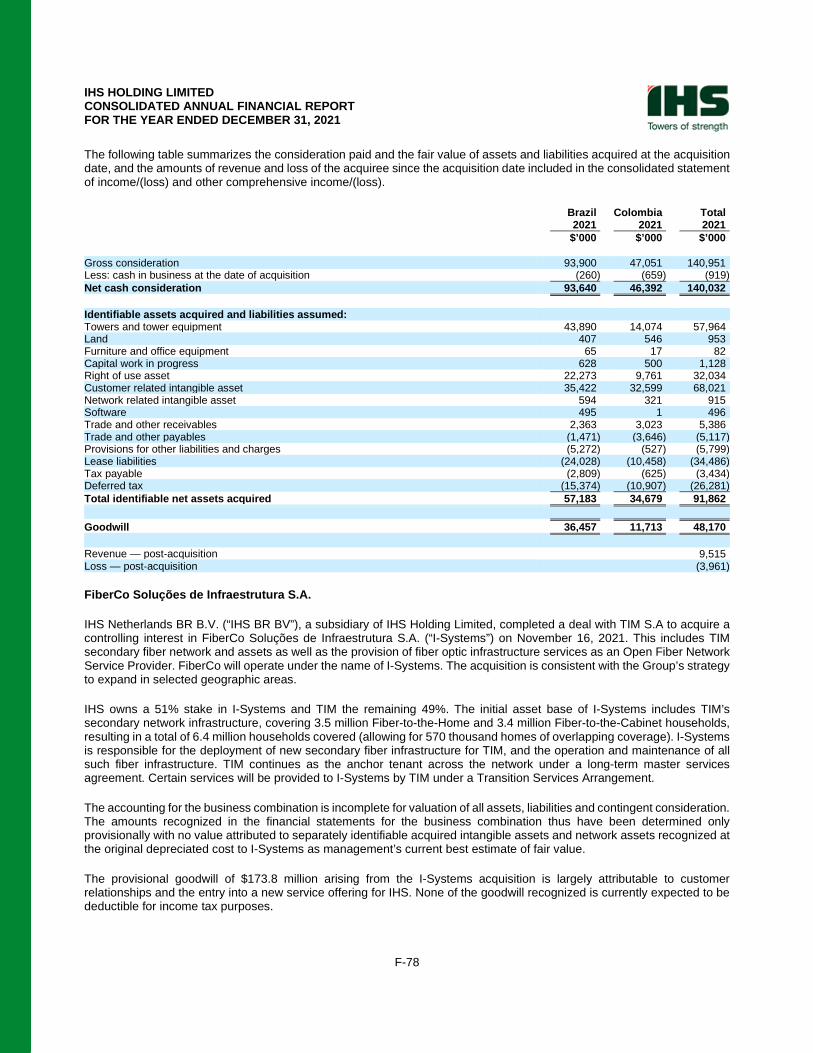
IHS HOLDING LIMITED CONSOLIDATED ANNUAL FINANCIAL REPORT FOR THE YEAR ENDED DECEMBER 31, 2021
F-78
The following table summarizes the consideration paid and the fair value of assets and liabilities acquired at the acquisition date, and the amounts of revenue and loss of the acquiree since the acquisition date included in the consolidated statement of income/(loss) and other comprehensive income/(loss).
Brazil Colombia Total 2021 2021 2021 $’000 $’000 $’000 Gross consideration 93,900 47,051 140,951 Less: cash in business at the date of acquisition (260) (659) (919) Net cash consideration 93,640 46,392 140,032 Identifiable assets acquired and liabilities assumed: Towers and tower equipment 43,890 14,074 57,964 Land 407 546 953 Furniture and office equipment 65 17 82 Capital work in progress 628 500 1,128 Right of use asset 22,273 9,761 32,034 Customer related intangible asset 35,422 32,599 68,021 Network related intangible asset 594 321 915 Software 495 1 496 Trade and other receivables 2,363 3,023 5,386 Trade and other payables (1,471) (3,646) (5,117) Provisions for other liabilities and charges (5,272) (527) (5,799) Lease liabilities (24,028) (10,458) (34,486) Tax payable (2,809) (625) (3,434) Deferred tax (15,374) (10,907) (26,281) Total identifiable net assets acquired 57,183 34,679 91,862 Goodwill 36,457 11,713 48,170 Revenue — post‑acquisition 9,515 Loss — post‑acquisition (3,961) FiberCo Soluções de Infraestrutura S.A.
IHS Netherlands BR B.V. (“IHS BR BV”), a subsidiary of IHS Holding Limited, completed a deal with TIM S.A to acquire a controlling interest in FiberCo Soluções de Infraestrutura S.A. (“I-Systems”) on November 16, 2021. This includes TIM secondary fiber network and assets as well as the provision of fiber optic infrastructure services as an Open Fiber Network Service Provider. FiberCo will operate under the name of I-Systems. The acquisition is consistent with the Group’s strategy to expand in selected geographic areas.
IHS owns a 51% stake in I-Systems and TIM the remaining 49%. The initial asset base of I-Systems includes TIM’s secondary network infrastructure, covering 3.5 million Fiber-to-the-Home and 3.4 million Fiber-to-the-Cabinet households, resulting in a total of 6.4 million households covered (allowing for 570 thousand homes of overlapping coverage). I-Systems is responsible for the deployment of new secondary fiber infrastructure for TIM, and the operation and maintenance of all such fiber infrastructure. TIM continues as the anchor tenant across the network under a long-term master services agreement. Certain services will be provided to I-Systems by TIM under a Transition Services Arrangement.
The accounting for the business combination is incomplete for valuation of all assets, liabilities and contingent consideration. The amounts recognized in the financial statements for the business combination thus have been determined only provisionally with no value attributed to separately identifiable acquired intangible assets and network assets recognized at the original depreciated cost to I-Systems as management’s current best estimate of fair value.
The provisional goodwill of $173.8 million arising from the I-Systems acquisition is largely attributable to customer relationships and the entry into a new service offering for IHS. None of the goodwill recognized is currently expected to be deductible for income tax purposes.
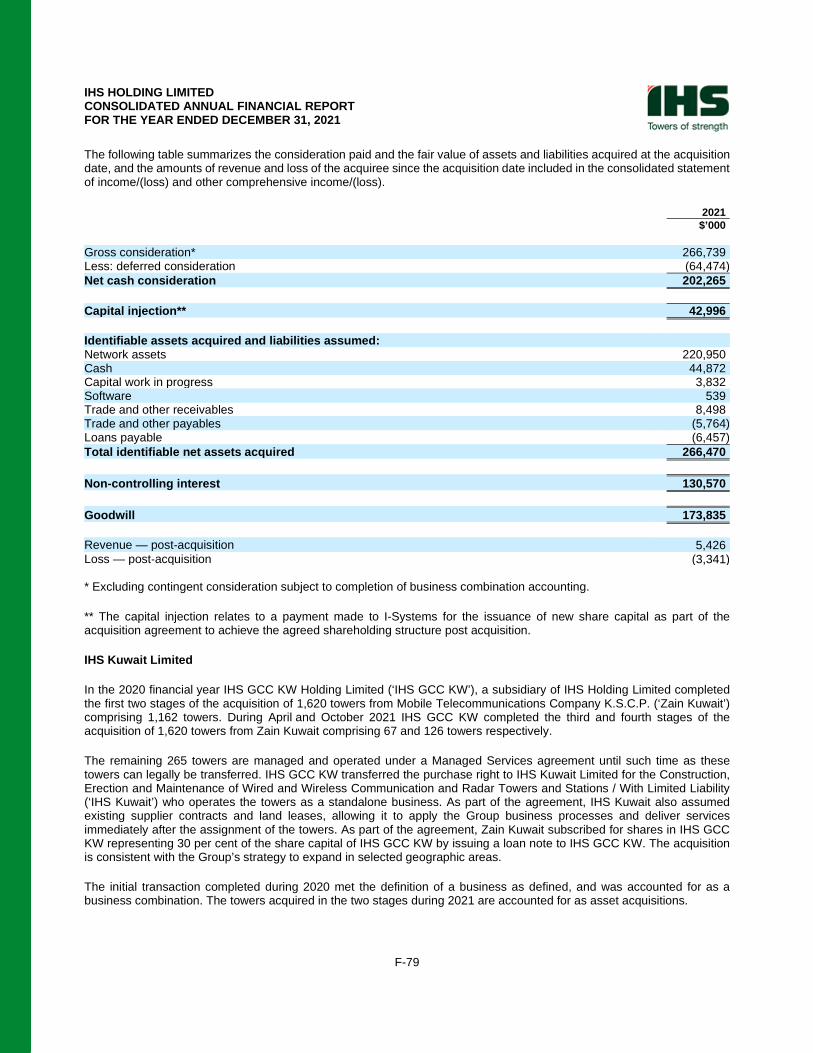
IHS HOLDING LIMITED CONSOLIDATED ANNUAL FINANCIAL REPORT FOR THE YEAR ENDED DECEMBER 31, 2021
F-79
The following table summarizes the consideration paid and the fair value of assets and liabilities acquired at the acquisition date, and the amounts of revenue and loss of the acquiree since the acquisition date included in the consolidated statement of income/(loss) and other comprehensive income/(loss).
2021 $’000 Gross consideration* 266,739 Less: deferred consideration (64,474) Net cash consideration 202,265 Capital injection** 42,996 Identifiable assets acquired and liabilities assumed: Network assets 220,950 Cash 44,872 Capital work in progress 3,832 Software 539 Trade and other receivables 8,498 Trade and other payables (5,764) Loans payable (6,457) Total identifiable net assets acquired 266,470 Non-controlling interest 130,570 Goodwill 173,835 Revenue — post‑acquisition 5,426 Loss — post‑acquisition (3,341) * Excluding contingent consideration subject to completion of business combination accounting.
** The capital injection relates to a payment made to I-Systems for the issuance of new share capital as part of the acquisition agreement to achieve the agreed shareholding structure post acquisition.
IHS Kuwait Limited
In the 2020 financial year IHS GCC KW Holding Limited (‘IHS GCC KW’), a subsidiary of IHS Holding Limited completed the first two stages of the acquisition of 1,620 towers from Mobile Telecommunications Company K.S.C.P. (‘Zain Kuwait’) comprising 1,162 towers. During April and October 2021 IHS GCC KW completed the third and fourth stages of the acquisition of 1,620 towers from Zain Kuwait comprising 67 and 126 towers respectively.
The remaining 265 towers are managed and operated under a Managed Services agreement until such time as these towers can legally be transferred. IHS GCC KW transferred the purchase right to IHS Kuwait Limited for the Construction, Erection and Maintenance of Wired and Wireless Communication and Radar Towers and Stations / With Limited Liability (‘IHS Kuwait’) who operates the towers as a standalone business. As part of the agreement, IHS Kuwait also assumed existing supplier contracts and land leases, allowing it to apply the Group business processes and deliver services immediately after the assignment of the towers. As part of the agreement, Zain Kuwait subscribed for shares in IHS GCC KW representing 30 per cent of the share capital of IHS GCC KW by issuing a loan note to IHS GCC KW. The acquisition is consistent with the Group’s strategy to expand in selected geographic areas.
The initial transaction completed during 2020 met the definition of a business as defined, and was accounted for as a business combination. The towers acquired in the two stages during 2021 are accounted for as asset acquisitions.
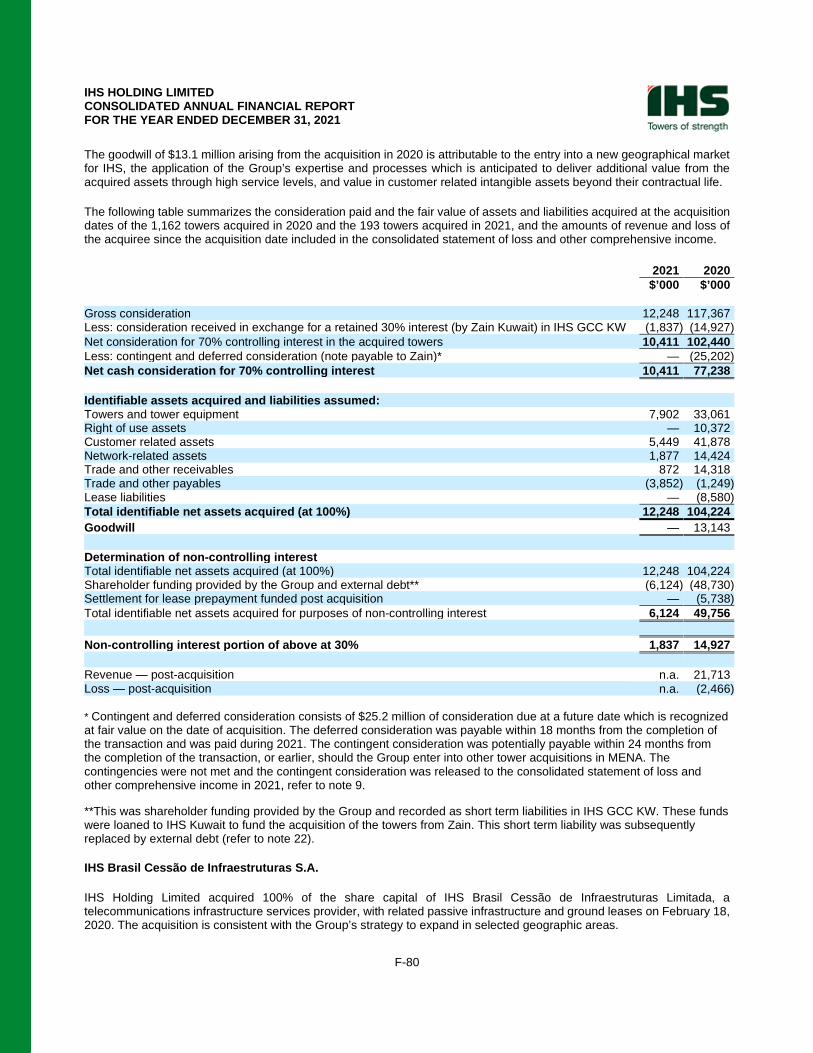
IHS HOLDING LIMITED CONSOLIDATED ANNUAL FINANCIAL REPORT FOR THE YEAR ENDED DECEMBER 31, 2021
F-80
The goodwill of $13.1 million arising from the acquisition in 2020 is attributable to the entry into a new geographical market for IHS, the application of the Group’s expertise and processes which is anticipated to deliver additional value from the acquired assets through high service levels, and value in customer related intangible assets beyond their contractual life.
The following table summarizes the consideration paid and the fair value of assets and liabilities acquired at the acquisition dates of the 1,162 towers acquired in 2020 and the 193 towers acquired in 2021, and the amounts of revenue and loss of the acquiree since the acquisition date included in the consolidated statement of loss and other comprehensive income.
2021 2020 $’000 $’000 Gross consideration 12,248 117,367 Less: consideration received in exchange for a retained 30% interest (by Zain Kuwait) in IHS GCC KW (1,837) (14,927) Net consideration for 70% controlling interest in the acquired towers 10,411 102,440 Less: contingent and deferred consideration (note payable to Zain)* — (25,202) Net cash consideration for 70% controlling interest 10,411 77,238 Identifiable assets acquired and liabilities assumed: Towers and tower equipment 7,902 33,061 Right of use assets — 10,372 Customer related assets 5,449 41,878 Network-related assets 1,877 14,424 Trade and other receivables 872 14,318 Trade and other payables (3,852) (1,249) Lease liabilities — (8,580) Total identifiable net assets acquired (at 100%) 12,248 104,224 Goodwill — 13,143 Determination of non-controlling interest Total identifiable net assets acquired (at 100%) 12,248 104,224 Shareholder funding provided by the Group and external debt** (6,124) (48,730) Settlement for lease prepayment funded post acquisition — (5,738) Total identifiable net assets acquired for purposes of non-controlling interest 6,124 49,756 Non-controlling interest portion of above at 30% 1,837 14,927 Revenue — post‑acquisition n.a. 21,713 Loss — post‑acquisition n.a. (2,466) * Contingent and deferred consideration consists of $25.2 million of consideration due at a future date which is recognized at fair value on the date of acquisition. The deferred consideration was payable within 18 months from the completion of the transaction and was paid during 2021. The contingent consideration was potentially payable within 24 months from the completion of the transaction, or earlier, should the Group enter into other tower acquisitions in MENA. The contingencies were not met and the contingent consideration was released to the consolidated statement of loss and other comprehensive income in 2021, refer to note 9. **This was shareholder funding provided by the Group and recorded as short term liabilities in IHS GCC KW. These funds were loaned to IHS Kuwait to fund the acquisition of the towers from Zain. This short term liability was subsequently replaced by external debt (refer to note 22). IHS Brasil Cessão de Infraestruturas S.A.
IHS Holding Limited acquired 100% of the share capital of IHS Brasil Cessão de Infraestruturas Limitada, a telecommunications infrastructure services provider, with related passive infrastructure and ground leases on February 18, 2020. The acquisition is consistent with the Group’s strategy to expand in selected geographic areas.
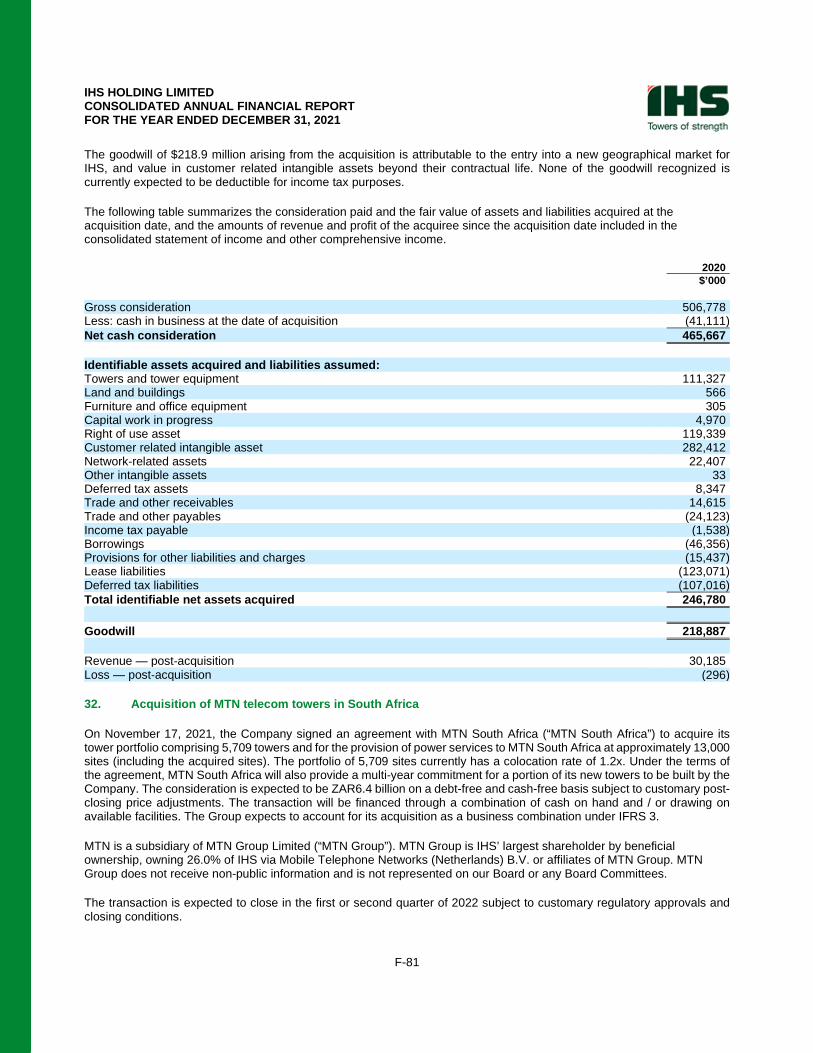
IHS HOLDING LIMITED CONSOLIDATED ANNUAL FINANCIAL REPORT FOR THE YEAR ENDED DECEMBER 31, 2021
F-81
The goodwill of $218.9 million arising from the acquisition is attributable to the entry into a new geographical market for IHS, and value in customer related intangible assets beyond their contractual life. None of the goodwill recognized is currently expected to be deductible for income tax purposes.
The following table summarizes the consideration paid and the fair value of assets and liabilities acquired at the acquisition date, and the amounts of revenue and profit of the acquiree since the acquisition date included in the consolidated statement of income and other comprehensive income.
2020 $’000 Gross consideration 506,778 Less: cash in business at the date of acquisition (41,111) Net cash consideration 465,667 Identifiable assets acquired and liabilities assumed: Towers and tower equipment 111,327 Land and buildings 566 Furniture and office equipment 305 Capital work in progress 4,970 Right of use asset 119,339 Customer related intangible asset 282,412 Network-related assets 22,407 Other intangible assets 33 Deferred tax assets 8,347 Trade and other receivables 14,615 Trade and other payables (24,123) Income tax payable (1,538) Borrowings (46,356) Provisions for other liabilities and charges (15,437) Lease liabilities (123,071) Deferred tax liabilities (107,016) Total identifiable net assets acquired 246,780 Goodwill 218,887 Revenue — post‑acquisition 30,185 Loss — post‑acquisition (296) 32. Acquisition of MTN telecom towers in South Africa
On November 17, 2021, the Company signed an agreement with MTN South Africa (“MTN South Africa”) to acquire its tower portfolio comprising 5,709 towers and for the provision of power services to MTN South Africa at approximately 13,000 sites (including the acquired sites). The portfolio of 5,709 sites currently has a colocation rate of 1.2x. Under the terms of the agreement, MTN South Africa will also provide a multi-year commitment for a portion of its new towers to be built by the Company. The consideration is expected to be ZAR6.4 billion on a debt-free and cash-free basis subject to customary post-closing price adjustments. The transaction will be financed through a combination of cash on hand and / or drawing on available facilities. The Group expects to account for its acquisition as a business combination under IFRS 3.
MTN is a subsidiary of MTN Group Limited (“MTN Group”). MTN Group is IHS’ largest shareholder by beneficial ownership, owning 26.0% of IHS via Mobile Telephone Networks (Netherlands) B.V. or affiliates of MTN Group. MTN Group does not receive non-public information and is not represented on our Board or any Board Committees. The transaction is expected to close in the first or second quarter of 2022 subject to customary regulatory approvals and closing conditions.
IHS HOLDING LIMITED CONSOLIDATED ANNUAL FINANCIAL REPORT FOR THE YEAR ENDED DECEMBER 31, 2021
F-82
33 Capital commitments and contingent liabilities
33.1 Capital commitments
The Group was committed to the purchase of property, plant and equipment of about $206.7 million as at December 31, 2021 (2020: $109.9 million).
33.2 Contingent liabilities
The Group has contingent liabilities in respect of legal claims arising in the ordinary course of business. The Group reviews these matters in consultation with internal and external legal counsel to determine on a case-by-case basis whether a loss from each of these matters is probable, possible or remote.
The Group’s possible contingent liabilities in respect of litigations and claims amounted to $2.0 million at the end of the reporting period (2020: $2.6 million).
Based on legal advice received, the Group’s liability is not considered probable, thus no provisions have been made in these financial statements.
34. Events after the reporting period
(a) Acquisition of São Paulo Cinco Locação de Torres Ltda. (“SP5”)
On January 21, 2022, the Company (via its subsidiary IHS Brasil – Cessão de Infraestruturas S.A.) signed an agreement to acquire 100% of São Paulo Cinco Locação de Torres Ltda. (“SP5”), a Grupo Torresur (“GTS”) portfolio company. The SP5 portfolio includes 2,115 towers across Brazil. The purchase price of the transaction, on a cash and debt free basis, is $315 million.
The Group expects to account for this acquisition as a business combination under IFRS 3.
The transaction is expected to close imminently.
(b) New employee share-based payment scheme
On February 4, 2022, a total of 1,147,500 options were issued as part of the new employee share-based payment plan. The plan will be deemed equity settled and comprise of:
Restricted stock units, which do not include performance conditions and vest on a straight-line basis over three years
Performance stock units, with a Recurring Leverage Free Cash Flow target and a cumulative total shareholder return target. Recurring Leverage Free Cash flow target is a non-market-based performance condition, assessed annually over a three-year period. A cumulative total shareholder return target is market-based, will be valued based on a Monte Carlo model for a three-year performance period, an approach that is commonly used for IFRS 2 valuations
(c) Legacy employee share-based payment scheme
The performance conditions relating to the 50% of the remaining third (33.3%) of the legacy employee share-based payment scheme (refer to note 28) have been met. 3.9 million shares will be issued in March and April 2022.