
WILLIS TOWERS WATSON PLC
164
Following our redomicile to Ireland in 2009, we are required to produce Irish statutory accounts prepared under applicable Irish company law, to be filed with the Irish Companies Registration Office. We are also required to send this document to the shareholders in advance of the Annual General Meeting. These are in addition to our financial statements prepared under applicable US securities laws, filed with the Securities and Exchange Commission on our Annual Form 10-K and sent to shareholders.
-
Upload
khangminh22 -
Category
Documents
-
view
1 -
download
0
Transcript of WILLIS TOWERS WATSON PLC

Following our redomicile to Ireland in 2009, we are required to produce Irish statutory accounts prepared under rapplicable Irish company law, to be filed with the Irish Companies Registration Office. We are also required to send this document to the shareholders in advance of the Annual General Meeting.
These are in addition to our financial statements prepared under applicable US securities laws, filed with the Securities and Exchange Commission on our Annual Form 10-K and sent to shareholders.


2019 2018 2017 2016 2015 Revenue (3) $ 9,039 $ 8,513 $ 8,202 $ 7,887 $ 3,829 Total operating expenses (2) (3) (4) $ 7,710 $ 7,704 $ 7,686 $ 7,489 $ 3,566 Operating income (2) (3) (4) $ 1,329 $ 809 $ 516 $ 398 $ 263 Operating margin (2) (3) (4) 14.7% 9.5% 6.3% 5.0% 6.9%% Net income attributable to Willis Towers Watson (2) (3) (4) $ 1,044 $ 695 $ 568 $ 450 $ 343 Net income per diluted share (1) (2) (3) (4) $ 8.02 $ 5.27 $ 4.18 $ 3.26 $ 4.97 Total debt $ 5,617 $ 4,575 $ 4,535 $ 3,865 $ 3,266
(2) (3) (4) $ 10,249 $ 9,852 $ 10,126 $ 10,065 $ 2,199 Capitalization ratio (2) (3) (4) 35% 32% 31% 28% 60%%
Revenue From Contracts With Customers
Leases


Year ended December 31, 2019 2018 2017
Human Capital and Benefits 37 % 38% 39 %Corporate Risk and Broking 33 % 34% 34 %Investment, Risk and Reinsurance 18 % 19% 18 %Benefits Delivery and Administration 12 % 9% 9%
December 31, 2019 Human Capital and Benefits 15,000 Corporate Risk and Broking 13,500 Investment, Risk and Reinsurance 4,100 Benefits Delivery and Administration 6,100 Corporate and Other 7,900 Total Employees 46,600

Human Capital and Benefits
Retirementt
Health and Benefits
Talent & Rewards

Technology and Administration Solutions
Corporate Risk and Broking
Property and Casualty
Financial Lines
Transportt
Investment, Risk and Reinsurance

Willis Re
Insurance Consulting and Technology
Investments
Wholesale Insurance Brokingg
Innovisk —
Willis Re Securities —
Max Matthiessen
Benefits Delivery and Administration
Benefits Outsourcing

Individual Marketplace
Benefits Accounts

United States
are subject to various federal and state laws and regulations that prescribe when and how we may market to consumers (including, without limitation, the Telephone Consumer Protection Act and other telemarketing laws and the Medicare Communications and Marketing Guidelines issued by the Center for Medicare Services)
United Kingdom

European Union
Other

Internal Control — Integrated Framework (2013)

This discussion includes forward-looking statements. See ‘Disclaimer Regarding Forward-Looking Statements’ for certain cautionary information regarding forward-looking statements and ‘Principal Risks and Uncertainties’ below for a list of factorsthat could cause actual results to differ materially from those predicted in those statements.
This discussion includes references to non-GAAP financial measures as defined in the rules of the Securities and Exchange Commission (‘SEC’). We present such non-GAAP financial measures, specifically, adjusted, constant currency and organicnon-GAAP financial measures, as we believe such information is of interest to the investment community because it provides additional meaningful methods of evaluating certain aspects of the Company’s operating performance from period to period on a basis that may not be otherwise apparent under U.S. GAAP, and these provide a measure against which our businesses mayPPbe assessed in the future.
Our methods of calculating these measures may differ from those used by other companies and therefore comparability may be limited. These financial measures should be viewed in addition to, not in lieu of, the consolidated financial statements for the year ended December 31, 2019.
See ‘Non-GAAP Financial Measures’ below for further discussion of our adjusted, constant currency and organic non-GAAP financial measures.
Business Overview
Market Conditions

Business Strategy

Years ended December 31, 2019 2018
Revenue $ 9,039 100 % $ 8,513 100 %Costs of providing services
Salaries and benefits 5,249 58% 5,123 60%Other operating expenses 1,719 19% 1,637 19%Depreciation 240 3% 208 2%Amortization 489 5% 534 6%Transaction and integration expenses 13 % 202 2%
Total costs of providing services 7,710 7,704 Income from operations 1,329 15% 809 10%Interest expense (234) (3)% (208) (2)% Other income, net 227 3% 250 3%Provision for income taxes (249) (3)% (136) (2)% Income attributable to non-controlling interests (29) % (20) %NET INCOME ATTRIBUTABLE TO WILLIS TOWERS WATSON $ 1,044 12% $ 695 8%Diluted earnings per share $ 8.02 $ 5.27
Consolidated Revenue
Geographic Region % of Revenue United States 48%United Kingdom 21%France 4 %Germany 3 %Canada 3 %
Transactional Currency Revenue Expenses (i) U.S. dollars 57% 50 %Pounds sterling 12% 20 %Euro 15% 13 %Other currencies 16% 17 %

Components of Revenue Change (i) As Constant Years Ended December 31, Reported Currency Currency Acquisitions/ Organic 2019 2018 Change Impact Change Divestitures Change ($ in millions)
Revenue $ 9,039 $ 8,513 6% (2)% 9% 3% 5%
Human Capital and Benefits (‘HCB’)
Retirementt
Health and Benefits
Talent & Rewards
Technology and Administration Solutions

Components of Revenue Change (i) As Constant
Years Ended December 31, Reported Currency Currency Acquisitions/ Organic 2019 2018 Change Impact Change Divestitures Change ($ in millions)
Segment revenue $ 3,298 $ 3,233 2% (2)% 4% % 4%
(i)
Corporate Risk and Broking (‘CRB’)
Property and Casualty
Financial Lines
Transportt
Components of Revenue Change (i) As Constant Years Ended December 31, Reported Currency Currency Acquisitions/ Organic 2019 2018 Change Impact Change Divestitures Change
($ in millions)g p g g
Segment revenue $ 2,946 $ 2,852 3% (3)% 6% % 6%
(i)

Investment, Risk and Reinsurance (‘IRR’)
Willis Re
Insurance Consulting and Technology
Investments
Wholesale Insurance Brokingg
Innoviskk
Willis Re Securities
Max Matthiessen
Components of Revenue Change (i) As Constant Years Ended December 31, Reported Currency Currency Acquisitions/ Organic 2019 2018 Change Impact Change Divestitures Change ($ in millions)
Segment revenue $ 1,637 $ 1,556 5% (3)% 8% 1% 7%
Benefit Delivery and Administration (‘BDA’)

Benefits Outsourcingg
Individual Marketplace
Benefits Accounts
Components of Revenue Change (i) As Constant Years Ended December 31, Reported Currency Currency Acquisitions/ Organic 2019 2018 Change Impact Change Divestitures Change ($ in millions)
Segment revenue $ 1,035 $ 758 37% % 37% 32% 4%
(i)
Salaries and Benefits
Other Operating Expenses
Depreciation

Amortization
Transaction and integration expenses

Executive Summary
Cash and Cash Equivalents

Summarized Consolidated Cash Flowsdd
Years ended December 31, 2019 2018 (in millions)
Net cash from/(used in): Operating activities $ 1,081 $ 1,288 Investing activities (1,614) (341)Financing activities 397 (903)
(DECREASE)/INCREASE IN CASH, CASH EQUIVALENTS AND RESTRICTED CASH (136) 44 Effect of exchange rate changes on cash, cash equivalents and restricted cash (2 ) (41 )CASH AND CASH EQUIVALENTS, BEGINNING OF YEAR (i) 1,033 1,030 CASH, CASH EQUIVALENTS AND RESTRICTED CASH, END OF YEAR (i) $ 895 $ 1,033
Cash Flows From Operating Activities
Cash Flows Used In Investing Activities
Cash Flows From/(Used In) Financing Activities

December 31, 2019 2018 (in millions)
Long-term debt $ 5,301 $ 4,389 Current debt 316 186 Total debt $ 5,617 $ 4,575 Total Willis Towers Watson shareholders equity $ 10,249 $ 9,852 Capitalization ratio 35.4 % 31.7%
Year ended
December 31, 2019 Shares repurchased 787,744Average price per share $190.42 Aggregate repurchase cost (excluding broker costs) $150 million

Year Ended
December 31, 2019 Ordinary shares, $0.000304635 nominal value
Number of
shares
Percentage of the called-up
sharecapital
Nominalvalue
(thousands) Number of
shares
gPercentage of the share
class
Nominal value
(thousands) Balance at January 1, 2019 17,519 Under 0.01% $ 40,000 100% 40 Shares repurchased 787,744 Shares canceled (787,744) Balance at December 31, 2019 17,519 Under 0.01% $ 40,000 100% 40
Leases

Off-Balance Sheet Transactions
16 to the Consolidated Financial Statements
Contractual Obligations
Payments due by Total 2020 2021-2022 2023-2024 After 2024 (in millions)
Debt and related interest obligations Senior notes $ 5,281 $ $ 1,556 $ 900 $ 2,825 Revolving $1.25 billion credit facilityTerm loan due 2020 295 295 Collateralized facility 79 24 39 16 Interest on senior notes 2,362 215 351 285 1,511
Total debt and related interest obligations 8,017 534 1,946 1,201 4,336 Operating and finance leases 1,357 198 340 288 531 U.K. pension contractual obligations 310 73 134 90 13 Acquisition liabilities 54 12 32 10 Other contractual obligations 40 27 13 Total contractual obligations $ 9,778 $ 844 $ 2,452 $ 1,589 $ 4,893
Debt Obligations and Facilities ——
Leases ——
Pension Contributions ——
Acquisition Liabilities and Other Contractual Obligations ——
16 to the Consolidated Financial Statements
Claims, Lawsuits and Other Proceedings, including Stanford Financial Group Litigation ——
16 to the Consolidated Financial Statements
Uncertain Tax Positions —— Income Taxes

Most Directly Comparable U.S. GAAP Measure Non-GAAP Measure As reported change Constant currency change As reported change Organic changeIncome from operations/margin Adjusted operating income/margin Net income/margin Adjusted EBITDA/marginNet income attributable to Willis Towers Watson Adjusted net incomeDiluted earnings per share Adjusted diluted earnings per shareIncome from operations before income taxes Adjusted income before taxes Provision for income taxes/U.S. GAAP tax rate Adjusted income taxes/tax rate Net cash from operating activities Free cash flow
Constant Currency Change and Organic Change
Constant Currency Change -
Organic Change -

p gComponents of Revenue Change (i) As Constant
p g
Years ended December 31, Reported Currency Currency /Acquisitions/ Organic 2019 2018 Change Impact Change Divestitures Change ($ in millions)
Revenue $ 9,039 $ 8,513 6% (2)% 9% 3% 5%
Adjusted Operating Income/Margin
Years Ended December 31, 2019 2018 (in millions)
Income from operations $ 1,329 $ 809 Adjusted for certain items:
Amortization 489 534 Transaction and integration expenses 13 202
Adjusted operating income $ 1,831 $ 1,545 Income from operations margin 14.7% 9.5%Adjusted operating income margin 20.3% 18.1%
Adjusted EBITDA/Margin

Years Ended December 31, 2019 2018
(in millions) NET INCOME $ 1,073 $ 715
Provision for income taxes 249 136 Interest expense 234 208 Depreciation 240 208 Amortization 489 534 Transaction and integration expenses 13 202 Pension settlement and curtailment gains and losses 24 Loss on disposal of operations 2 9
Adjusted EBITDA $ 2,300 $ 2,036 Net income margin 11.9% 8.4%Adjusted EBITDA margin 25.4% 23.9%
Adjusted Net Income and Adjusted Diluted Earnings Per Share

Years Ended December 31, 2019 2018 ($ and weighted-average shares in millions)
NET INCOME ATTRIBUTABLE TO WILLIS TOWERS WATSON $ 1,044 $ 695 Adjusted for certain items:
Amortization 489 534 Transaction and integration expenses 13 202 Pension settlement and curtailment gains and losses 24 Loss on disposal of operations 2 9 Tax effect on certain items listed above (i) (121) (184)Tax effects of internal reorganizations 4
Adjusted net income $ 1,427 $ 1,284 Weighted-average shares of common stock diluted 130 132 Diluted earnings per share $ 8.02 $ 5.27 Adjusted for certain items (ii):
Amortization 3.75 4.04 Transaction and integration expenses 0.10 1.53 Pension settlement and curtailment gains and losses 0.18 Loss on disposal of operations 0.02 0.07 Tax effect on certain items listed above (i) (0.93 ) (1.39)Tax effects of internal reorganizations 0.03
Adjusted diluted earnings per share $ 10.96 $ 9.73
Adjusted Income Before Taxes and Adjusted Income Taxes/Tax Rate

Years Ended December 31, 2019 2018 ($ in millions)
INCOME FROM OPERATIONS BEFORE INCOME TAXES $ 1,322 $ 851 Adjusted for certain items:
Amortization 489 534 Transaction and integration expenses 13 202 Pension settlement and curtailment gains and losses 24 Loss on disposal of operations 2 9
Adjusted income before taxes $ 1,826 $ 1,620 Provision for income taxes $ 249 $ 136
Tax effect on certain items listed above (i) 121 184 Tax effects of internal reorganizations (4)
Adjusted income taxes $ 370 $ 316
U.S. GAAP tax rate 18.8% 16.0%Adjusted income tax rate 20.3% 19.5%
Free Cash Flow
Years ended December 31, 2019 2018 (in millions) Cash flows from operating activities $ 1,081 $ 1,288 Less: Additions to fixed assets and software for internal use (246) (268)Free cash flow $ 835 $ 1,020

Our success largely depends on our ability to achieve our global business strategy as it evolves, and our results of operationsggand financial condition could suffer if the Company were unable to successfully establish and execute on its strategy and generate anticipated revenue growth and cost savings and efficiencies.
Demand for our services could decrease for various reasons, including a general economic downturn, increased competition, or a decline in a client’s or an industry’s financial condition or prospects, all of which could materially radversely affect us.

Data security breaches or improper disclosure of confidential company or personal data could result in material financial llloss, regulatory actions, reputational harm or legal liability.


We could be subject to claims and lawsuits arising from our work, which could ii materially adversely affect our reputation, business and financial condition.

As a highly-regulated company, we are subject from time to time to inquiries or investigations by governmental agencies or regulators that could have a material adverse effect on our business or results of operations.
16 to the Consolidated Financial Statements
Our growth strategy depends, in part, on our ability to make acquisitions and we face risks when we acquire or divest businesses, and could have difficulty in acquiring, integrating or managing acquired businessesr , or with effecting internal sreorganizations, all of which could harm our business, financial condition, results ofii operations or reputation.f

We have been impacted by the COVID-19 pandemic, and may be materially and adversely impacted by it in the future.

Our pending combination with Aon creates incremental business, regulatory and reputational risks.
Our inability to comply with complex and evolving laws and regulations related to data privacy and cyber security could result in material financial loss, regulatory actions, reputational harm or legal liability.
Our ability to successfully manage ongoing organizational chana ges could impact our business n results, where the level of costs and/or disruption may be significant and change over time and t the benefits may be less than we originally expect.

Our inability to successfully recover should we experience a disaster or other business continuity problem could causettmaterial financial loss, loss of human capital, regulatory actions, reputational harm or legal liability.ee
Interruption to or loss of our information processing capabilities or failure to effectively maintain and upgrade our information processing hardware or systems could cause material financial loss, regulatory actions, reputational harm or legal liability.
The United Kingdom’s exit from the European Union on January 31, 2020, and the risk that other countries may follow,rcould adversely affect us.

Allegations of conflicts of interest, including in connection with accepting market derived income (‘MDI’), may have admaterial adverse effect on our business, financial condition, results of operation or reputation.f

Damage to our reputation, including due to the failure of third parties on whom we rely to perform services or public rropinions of third parties with whom we associate, could adversely affect our businesses.ll
The loss of key colleagues could damage or result in the loss of client relationshipsr and could result in such colleaguescompeting against us.
In conducting our businesses around the world, we are subject to political, economic, legal, regulatory, cultural, market, yyoperational and other risks that are inherent in operating in many countries.

Sanctions imposed by governments, or changes to such sanction regulations, cos uld have a material adverse impact on our operations or financial results.
Our business will be negatively affected if we are not able to anticipate and keep f pace with rapid changes in government nlaws or regulations, or if government laws or regulations decrease the need for our services or increase our costs.
are subject to variousfederal and state laws and regulations that prescribe when and how we may market to consumers (including, without limitation,the Telephone Consumer Protection Act and other telemarketing laws and the Medicare a Communications and Marketing Guidelines issued by the Center for Medicare Services of ). Changes to theselaws could negatively affect our ability to market directly to consumers or increase our costs or liabilities

Our compliance systems and controls cannot guarantee that we comply wt ith all applicable federal and state or foreign laws and regulations, and actions by regulatory authorities or changes in applicable laws and regulations in the jurisdictions in which we operate could have an adverse effect on our business.
Our business performance and growth plans could be negatively affected if we ll are not able to effectively apply technology,data and analytics to drive value for our clients through technology-based solutions or gain internal efficiencies through the effective application of technology, analytics and related tools.yy

Our business may be harmed by any negative developments that may occur in the insurance industry or if we fail to maintain good relationships with insurance carriers.
Changes and developments in the health insurance system in the United States could harm our business.

Limited protection of our intellectual property could harm our business and our ability to compete effectively, and we face the risk that our services or products may infringe upon the intellectual property rights of others.
We have material pension liabilities that can fluctuate significantly and adversely affect our financial position or net incomeor result in other financial impacts.
Our outstanding debt could adversely affect our cash flows and financial flexibility and we may not be able to obtainfinancing on favorable terms or at all.

A downgrade to our corporate credit rating and thrr e credit ratings of our outstanding debt may adversely affect our borrowing costs and financial flexibility and, under certain circumstances, may reff quire us to offer to buy back some of our outstanding debt.
If a U.S. person is treated as owning at least 10% of our shares, such a holder may be subject to adverse U.S. federal income tax consequences.
Legislative or regulatory action in the U.S. or abroad could materially adversely affect our ability to maintain a competitive worldwide effective corporate tax rate.

Our significant non-U.S. operations, particularly our London market operations, expose us to exchange rate fluctuationsand various other risks that could impact our business.
Changes in accounting principles or in our accounting estimates and assumptions could negatively affect our financial position and results of operations.

Our quarterly revenue and cash flow could fluctuate, including as a result of factors outsidn e of our control, while our ddexpenses may remain relatively fixed or be higher than expected.
It is unclear how increased regulatory oversight and changes in the method for determining the London Interbank Offered Rate (‘LIBOR’) may affect the value of the financial obligations to be held or issued by us that are linked to LIBOR, or how such changes could affect our results of operations or financial condition.

The laws of Ireland differ from the laws in effect in the United States and may afford less protectiona to holders of our securities.
We are a holding company and, therefore, may not be able to receive dividends or other distributions in needed amountsiifrom our subsidiaries.
to theConsolidated Financial Statements

U.S.dollars
Pounds gsterling Euro
Othercurrencies
Revenue 57% 12% 15% 16%Expenses (i) 50% 20% 13% 17%

Settlement date before December 31, 2020 2021
December 31, 2019 Contract amount
Average contractualexchange
rate Contract amount
Average contractualexchange
rate (millions) (millions)
Foreign currency sold U.S. dollars sold for Poundssterling $ 243 $1.33 = 1 $ 114 $1.30 = 1 Euros sold for U.S. dollars 72 1 = $1.16 30 1 = $1.15 Japanese yen sold for U.S.dollars 16 105.82 = $1 7 104.94 = $1Euros sold for Pounds sterling 12 1 = 1.12 5 1 = 1.12 Total $ 343 $ 156 Fair value (i) $ 4 $ 4
Expected to mature before December 31,
2020 2021 2022 2023 2024 Thereafter Total Fair
Value (i)
($ in millions) Fixed rate debt
Principal $ 950 $ 606 $ 250 $ 650 $ 2,825 $ 5,281 $ 5,634Fixed rate payable 4.684% 2.125% 4.625% 3.600 % 4.348% 4.074%
Floating rate debt Principal $ 319 $ 22 $ 17 $ 13 $ 3 $ 374 $ 379 Variable rate payable (ii) 3.047% 5.450% 5.450% 5.530% 5.600 % 3.404%


Non-Financial Statement
Environmental Matters
Our clients, colleagues and other stakeholders expect us to conduct our business with integrity and in an environmentally andsocially responsible manner. We take these expectations seriously and have embraced principles that are aligned with our business priorities, are consistent with our commitment to ethical and sustainable practices and demonstrate our respect for those communities in which we operate across the globe. Our Code of Conduct requires us to conduct our business with integrity and in accordance with the applicable laws and regulations of the countries where we do business, including compliance with localenvironmental-related legislation.
We recognize the importance of our environmental responsibilities and our impact on the environment on a location-by-location basis, and are in the process of designing and implementing processes to reduce damage that might be caused by Willis Towers
porting system.This will allow us to track our emissions and carbon footprint across our global operations.
In addition to the development work happening at the global level, the below illustrates some notable activities that are further helping reduce our environmental impact:
Reduced paper use and increased recycling have been a focus for several years throughout the Company. This has included a focus on reducing print volumes, and therefore paper and equipment usage, by implementing print on-demand technology and scanning capabilities and by offering fewer printers in our office spaces. We have also increased the availability (and use) of online meeting and records management tools that reduce their overall reliance on paper-based materials. This has resulted in our ability to reduce paper consumption while alsott recycling several million pounds of paper each year.
We encourage our colleagues to participate in office-based recycling programs and paperless recordkeeping, our offices are planning to replace personal printers with network multi-function devices and procure recycled supplies, and our ITprograms are set to ensure proper disposal and recycling of obsolete computer equipment.
We raise awareness for and provide information about environmental sustainability and corporate social responsibility to our colleagues through internal news stories, communications and a forum.
s to environmental sustainability. We encouragethis commitment through increasing our demand for and use of goods that are developed in a sustainable way and contribute to a reduced carbon footprint. Since our direct impact on the environment largely comes from office-based operations, our priorityffis procuring sustainable choices by negotiating a wide variety of office product options that focus on reducing our carbon footprint. Recycled office supplies, paper, toner, kitchen and pantry products, and cleaning products can be found in the product dlistings of our main corporate agreements with suppliers who provide such commodities.
Social and Employee Matters and Respect for Human Rights
We are committed to demonstrating to our shareholders and communities that we are a responsible and ethical business partner and good corporate citizen by conducting our business based on our global Code of Conduct, Respect at Work and Anti-rHarassment Policy, and our Company values, which emphasize managing our relationships, inside the Company and out, with fairness, decency and good citizenship. Our policy is that adherence is compulsory and enforced, with reported violationsinvestigated promptly, and demonstration of values formally assessed during annual performance reviews and incorporated into
rformance rating. Colleagues may raise concerns anonymously or confidentially through our Code of Conduct Hotline, online or by phone. As discussed further below, mandatory training on our Code of Conduct is delivered to allfcolleagues annually and completion rates are monitored.
We partner with our clients and communities to help address their social and economic challenges. For example, we participate in the Insurance Development Forum, a public/private partnership led by the insurance industry and international organizations (such as the United Nations and the World Bank) that aims to optimize and extend the use of insurance and its related risk management capabilities to build greater resilience and protection for people, communities, businesses and public institutionsthat are vulnerable to disasters and their associated economic shocks.
Additionally, as a professional services company, we endeavor to enable our colleagues to reach their full potential by fostering a culture of mutual respect, an inclusive and diverse work environment, professional development opportunities, safe working

conditions and fair hiring and labor standards. Each year, our leaders cascade diversity and inclusion-focused objectives throughout the organization, and we continue to look for ways to provide for an objective and fair proceb ss that mitigates humanbiases in our talent programs and processes. Highlights of our inclusion and diversity activities include the following:
Globally: Our business-led Inclusion and Diversity Council leads geographically-based councils to help align regional inclusion and diversity objectives with Company priorities, including how we attract, hire, develop, promote and retain diverse talent and foster an inclusive environment. Additionally, the Multicultural Inclusion Network and TalentAcquisition teams partner with the International Association of Black Actuaries and other organizations to source diverse talent. We have also implemented Unconscious Bias and Inclusive Leadership workshops in the U.S. and the U.K. and have launched an online, interactive unconscious bias module available across the globe to leadership teams and colleagues. For several years running, Willis Towers Watson was a gold sponsor of the Dive In festival for inclusion and diversity in insurance, holding events across the Company globally.
In North America and the U.K.: We launched a comprehensive set of actions to address and ameliorate gender imbalancein leadership levels, with an integrated, business-sponsored approach targeted at hiring, devn eloping, retaining and promoting senior women.
In the U.S.: Talent Management magazine acknowledged our Developing Inclusive Behaviors learning framework for
In certain cities, we have also launched a pilot program that seeks to increase representation of Black, African American and Latinx talent. Leadership teams and Multicultural Inclusion Network representatives will support a collection of focused efforts to attract, hire, develop, promote and retain colleagues, in partnership with select external organizations. h
In the U.K.sexual orientation and gender identity equality.
We help strengthen our communities through charitable giving and volunteering by offering:
Matching Gifts Program that matches our colleagues contributions to charitable organizations focused on healthcare, inclusion and diversity, post-secondary education and disaster relief; rr
Volunteer Day Program that provides our colleagues with paid opportunities to volunteer their time and talents toimprove our communities; and
a global charitable giving policy that benefits the Company by providing consistent new Company-wide governance and expenditure recording for all business and office charitable expenditures in this area.
While we believe the nature of our business as a professional services provider to predominantly corporate clients means that we are not directly exposed to a high risk of modern slavery and human trafficking, we are nonetheless aware that the possibilitydoes exist within our global supply chains. We do not have a formal global human rights policy; however our approach to modern slavery reflects our overall approach to human rights. Seven of our U.K. subsidiaries (includif ng Willis Limited and TowersWatson Limited) have produced Modern Slavery Act Transparency Statements, most recently for the financial year ending 31 December 2018. These U.K. entities work with other Willis Towers Watson entities to combat modern slavery and human trafficking in the business structure and have a cross-functional modern slavery working group that continues to coordinate a Company-wide approach to the matter. As part of Willis Towers Watson, these U.K. entities are committed to maintaining and improving practices to combat the human rights violations of slavery and human trafficking. The U.K. Modern Slavery WorkingGroup has continued investigations into our supply chain to advance a standardized approach to assessing the risk of modern aslavery and human trafficking.
Anti-Bribery and Anti-Corruption

Risk Factors
Business Model


/s/ Anna C. Catalano /s/ Brendan illDirector Director
Date: April 17, 2020 Date: April 17, 2020
Elm Park Merrion Road Dublin 4, Ireland

(This page has been left blank intentionally)

Revenue from Contracts withCustomers


(This page has been left blank intentionally)

Years ended December 31, Note 2019 2018 2017
(millions, except per share data) REVENUE 4 $ 9,039 $ 8,513 $ 8,202 EXPENSES
Salaries and benefits 18 5,249 5,123 4,967 Other operating expenses 1,719 1,637 1,534 Depreciation 9 240 208 203 Amortization 8 489 534 581 Restructuring costs 6 132 Transaction and integration expenses 13 202 269
Total expenses 7,710 7,704 7,686 OPERATING INCOME 1,329 809 516
Other income, net 20 227 250 164 Interest expense 11 (234) (208 ) (188 )
INCOME FROM OPERATIONS BEFORE INCOME TAXES 1,322 851 492 (Provision for)/benefit from income taxes 7 (249) (136 ) 100
NET INCOME 1,073 715 592 Less: net income attributable to non-controlling interests (29 ) (20 ) (24 )
NET INCOME ATTRIBUTABLE TO WILLIS TOWERSWATSON $ 1,044 $ 695 $ 568
EARNINGS PER SHARE 23 Basic earnings per share $ 8.05 $ 5.29 $ 4.21 Diluted earnings per share $ 8.02 $ 5.27 $ 4.18

Years ended December 31, Note 2019 2018 2017
(millions)NET INCOME $ 1,073 $ 715 $ 592 Other comprehensive (loss)/income, net of tax:
Foreign currency translation 21 $ 78 $ (251) 295 Defined pension and post-retirement benefits 21 (329) (199) 14 Derivative instruments 21 21 2 75
Other comprehensive (loss)/income, net of tax, before non-controlling interests (230) (448) 384 Comprehensive income before non-controlling interests 843 267 976 Comprehensive income attributable to non-controlling interests (29 ) (20) (37) Comprehensive income attributable to Willis Towers Watson $ 814 $ 247 $ 939

December 31,Note 2019 2018
(millions, except share data) ASSETS NON-CURRENT ASSETS
Intangible assets Goodwill 8 $ 11,194 $ 10,465 Other intangible assets, net 8 3,478 3,318
Tangible assets Right-of-use assets 15 968Fixed assets, net 9 1,046 942
Financial assets Investments in associates 26 23 Pension benefits assets 13 868 773
Deferred tax assets 7 72 59 Other non-current assets 17 737 385
Total fixed assets 18,389 15,965 CURRENT ASSETS
Accounts receivable, net 4 2,621 2,379 Fiduciary assets 13,004 12,604 Other current assets 17 525 404 Cash and cash equivalents 887 1,033
Total current assets 17,037 16,420 TOTAL ASSETS $ 35,426 $ 32,385 LIABILITIES, CAPITAL AND RESERVES CREDITORS: AMOUNTS FALLING DUE WITHIN ONE YEAR
Current debt 11 $ 316 $ 186 Fiduciary liabilities 13,004 12,604Current lease liabilities 15 164Deferred revenue 17 538 448 Accrued expenses 17 1,246 1,199 Income taxes payable 7 85 81 Other current liabilities 17 717 783
Total creditors: amounts falling due within one year 16,070 15,301 CREDITORS: AMOUNTS FALLING DUE AFTER MORE THAN ONE YEAR
Long-term debt 11 5,301 4,389 Retirement benefit obligations 13 1,324 1,170 Long-term lease liabilities 15 964Deferred tax liabilities 7 526 559 Other non-current liabilities 17 335 429
Total creditors: amounts falling due after more than one year 8,450 6,547 PROVISIONS FOR LIABILITIES 14 537 540
Total liabilities 25,057 22,388

December 31, Note 2019 2018
(millions, except share data) COMMITMENTS AND CONTINGENCIES 16 REDEEMABLE NON-CONTROLLING INTEREST (i) 26 CAPITAL AND RESERVES (ii)
Share premium 9,465 9,420 Profit and loss account 1,612 1,021 Other reserves 1,399 1,372 Accumulated other comprehensive loss, net of tax 21 (2,227) (1,961)
10,249 9,852 Non-controlling interests 120 119
Total equity 10,369 9,971 TOTAL LIABILITIES, CAPITAL AND RESERVES $ 35,426 $ 32,385
/s/ Anna C. Catalano Director
/s/ Brendan R. Director

Years ended December 31, Note 2019 2018 2017
(millions) CASH FLOWS FROM OPERATING ACTIVITIES
NET INCOME $ 1,073 $ 715 $ 592 Adjustments to reconcile net income to total net cash from operating activities:
Depreciation 9 240 213 252 Amortization 8 489 534 581 Non-cash lease expense 148 Net periodic benefit of defined benefit pension plans (135) (163) (91)Provision for doubtful receivables from clients 9 8 17 Benefit from deferred income taxes 7 (72) (115) (285)Share-based compensation 22 74 50 67Net loss/(gain) on disposal of operations 2 9 (13)Non-cash foreign exchange loss 26 26 77 Other, net 17 8 (57)
Changes in operating assets and liabilities, net of effects from purchase of subsidiaries:
Accounts receivable (261) 68 (64)Fiduciary assets (365) (839) (1,167)Fiduciary liabilities 365 839 1,167 Other assets (269) (22) (128)Other liabilities (264) (20) (51)Provisions 4 (23) (35)
Net cash from operating activities 1,081 1,288 862 CASH FLOWS USED IN INVESTING ACTIVITIES
Additions to fixed assets and software for internal use (246) (268) (300)Capitalized software costs (59 ) (54) (75)Acquisitions of operations, net of cash acquired (1,329 ) (36) (13)Net proceeds from sale of operations 17 4 57Other, net 3 13 (4)
Net cash used in investing activities (1,614 ) (341) (335)CASH FLOWS FROM/(USED IN) FINANCING ACTIVITIES
Net (payments)/borrowings on revolving credit facility (131) (754) 642 Senior notes issued 997 998 649 Proceeds from issuance of other debt 1,100 32 Debt issuance costs (13 ) (8) (9)Repayments of debt (995) (170) (734)Repurchase of shares (150) (602) (532)Proceeds from issuance of shares 45 45 61 Payments related to share cancellation (177)Payments of deferred and contingent consideration related to acquisitions (57 ) (50) (65)Cash paid for employee taxes on withholding shares (15) (30) (18)Dividends paid (329) (306) (277)Acquisitions of and dividends paid to non-controlling interests (55 ) (26) (51)
Net cash from/(used in) financing activities 397 (903) (479)(DECREASE)/INCREASE IN CASH, CASH EQUIVALENTS ANDRESTRICTED CASH (136) 44 48 Effect of exchange rate changes on cash, cash equivalents and restricted cash (2 ) (41) 112 CASH AND CASH EQUIVALENTS, BEGINNING OF YEAR (i) 1,033 1,030 870CASH, CASH EQUIVALENTS AND RESTRICTED CASH, END OF YEAR (i) $ 895 $ 1,033 $ 1,030

Sharesoutstanding
Sharepremium
Profit andloss account
Otherreserves AOCL (i)
Total WTW
equity
Non-controlling
interests Total equity
Redeemablenon-
controllinginterest (ii) Total
(thousands) (millions)
Balance at December 31, 2016 136,297 $ 9,313 $ 1,353 $ 1,283 $ (1,884) $ 10,065 $ 118 $ 10,183 $ 51 pAdoption of ASU 2016-16 (3 ) (3) (3)
pShares repurchased (3,797) (532) (532) (532) Shares canceled (iii) (1,415) (177) (177) (177) Net income 568 568 16 584 8 $ 592
( p )Dividends ($2.12 per share) (285) (285) (285) Dividends attributable to non-controlling interests (15) (15) (3 ) Other comprehensive income 371 371 7 378 6 $ 384 Issuance of shares under employeestock compensation plans 1,055 62 62 62Share-based compensation and netsettlements 67 67 67 Acquisition of non-controllinginterests (3) (3) (34) Foreign currency translation (10) (10 ) (10 ) Balance at December 31, 2017 132,140 $ 9,375 $ 924 $ 1,340 $ (1,513) $ 10,126 $ 123 $ 10,249 $ 28 Adoption of ASC 606 (see Note 2 to these ConsolidatedFinancial Statements) 317 317 317
pShares repurchased (3,919) (602) (602) (602) Net income 695 695 18 713 2 $ 715
( p )Dividends ($2.40 per share) (313 ) (313) (313 ) Dividends attributable to non-controlling interests (24) (24 (2)
pOther comprehensive loss (448) (448) 2 (446) (2 ) $ (448))Issuance of shares under employeestock compensation plans 701 45 45 45 Share-based compensation and netsettlements 27 27 27 Foreign currency translation 5 5 5 Balance at December 31, 2018 128,922 $ 9,420 $ 1,021 $ 1,372 $ (1,961) $ 9,852 $ 119 $ 9,971 $ 26Adoption of ASU 2018-02 (see Note 2 to these Consolidated Financial Statements) 36 (36)
pShares repurchased (788) (150) (150) (150Net income 1,044 1,044 23 1,067 6 $ 1,073
( p )Dividends ($2.60 per share) (339) (339) (339)Dividends attributable to non-controlling interests (21) (21) (2)
pOther comprehensive loss (230) (230) (230) $ (230))Issuance of shares under employeestock compensation plans 556 45 45 45Share-based compensation and netsettlements 32 32 32Acquisition of non-controllinginterests (6) (6) (1) (7) (30)
g yForeign currency translation 1 1 1Balance at December 31, 2019 128,690 $ 9,465 $ 1,612 $ 1,399 $ (2,227 ) $ 10,249 $ 120 $ 10,369 $
(i) Addition(ii) The non-controlling interest was related to Max Matthiessen Holding AB. The Company purchased the remaining non-controlling interest of Max Matthiessen Holding AB
during the year ended December 31, 2019. (iii) 1,415,199 shares were surrendered by shareholders in 2017 following Merger-related appraisal demands.


Principles of Consolidationp f
Use of Estimatesf
Going Concerng

Fair Value of Financial Instrumentsf
Investments in Associates ——
Cash and Cash Equivalentsq
Fiduciary Assets and Liabilitiesy
Fiduciary Funds ––
Fiduciary receivables ––

Accounts Receivable
Income Taxes
Foreign Currencyg y
Derivatives

Commitments, Contingencies and Provisions for Liabilities, g f
Share-Based Compensationp
Fixed Assets
Leases (effective from January 1, 2019)( ff f y , )Leases

Operating Leases (effective before January 1, 2019)p g ( ff f y , )
Goodwill and Other Intangible Assetsg
Irish Law requires the amortization of goodwill. However, the Company believes the amortization of goodwill would not give a true and fair view because:
not all goodwill declines in value; and
goodwill that does decline in value rarely does so on a straight-line basis.
Consequently, straight-line amortization of goodwill over an arbitrary period does not reflect economic reality and thus does not provide useful information to financial statement users. Furthermore, under both U.S. and International generally acceptedaccounting principles, goodwill is considered an indefinite lived asset and not amortized. The Company is therefore invoking

The Company is not able to reliably estimate the impact on the financial statements of the true and fair override on the basis that the useful life of goodwill cannot be predicted with a satisfactory level of reliability, nor can the pattern in which goodwill diminishes be known.
Consequently, the Company does not amortize goodwill but tests it
8 to these Consolidated Financial Statements
Pensions
to these Consolidated Financial Statements
Revenue Recognition (effective from January 1, 2018)g ( ff f y , )Revenue From Contracts With Customers

Brokingg

to these Consolidated Financial Statements
Consultingg
• Annual recurring projects projects of short duration.

• Stand-ready obligations.
Outsourced Administration
Implementation phase.
Ongoing administration phase.

Reimbursed expenses
Revenue Recognition (effective before January 1, 2018) ——g ( ff f y , )
Commissions revenue.
Consulting revenue.
• Annual recurring projects projects of short duration.
• Stand-ready obligations.
• Non-recurring system projects.

Hosted software.
Delivered software.
Surveys.
Interest income ——
Other income ——
Cost to obtain or fulfill contracts (effective from January 1, 2018) — f f ( ff f y , )

Recent Accounting Pronouncements
Not adopted for 2019
Simplifying the Test for Goodwill Impairment
Simplifying the Accounting for Income Taxes
Disclosure Framework—Changes to the Disclosure Requirements for Fair Value Measurement. rr
Financial Instruments—Credit Losses: Measurement of Credit Losses on Financial Instruments,
Financial Instruments—Credit Losses
Facilitation of the Effects of Reference Rate Reform on Financial rrReporting

Adopted for 2019
Leases
Leases15 to these Consolidated Financial Statements
Derivatives and Hedging: Targeted Improvements to Accounting for Hedging Activities
Income Statement - Reporting Comprehensive Income: Reclassificationof Certain Tax Effects from Accumulated Other Comprehensive Income ,
Disclosure Framework—Changes to the Disclosure Requirements for Defined Benefit Plans.
TRANZACT Acquisition
to these Consolidated FinancialStatements

Cash and cash equivalents $ 7 Restricted cash 2 Accounts receivable, net 3 Renewal commissions receivable, current (i) 36 Prepaid and other current assets 22 Renewal commissions receivable, non-current (i) 130 Fixed assets 9 Intangible assets 646 Goodwill 727 Right-of-use assets 19 Other non-current assets 2 Collateralized facility (ii) (91 ) Other current liabilities (55 ) Deferred tax liabilities, net (109) Lease liabilities (19 ) Net assets acquired $ 1,329
to these Consolidated Financial StatementsBusiness Combinations
to these Consolidated Financial Statements
The registered office of was (now .
Alston Gayler Acquisition
The registered office of Alston Gayler & Co Limited was 100 Leadenhall Street, London, EC3A 3BP (now.
Other Acquisitions
Related Party Transaction -
2017 Cumulative Divestiture Impact -
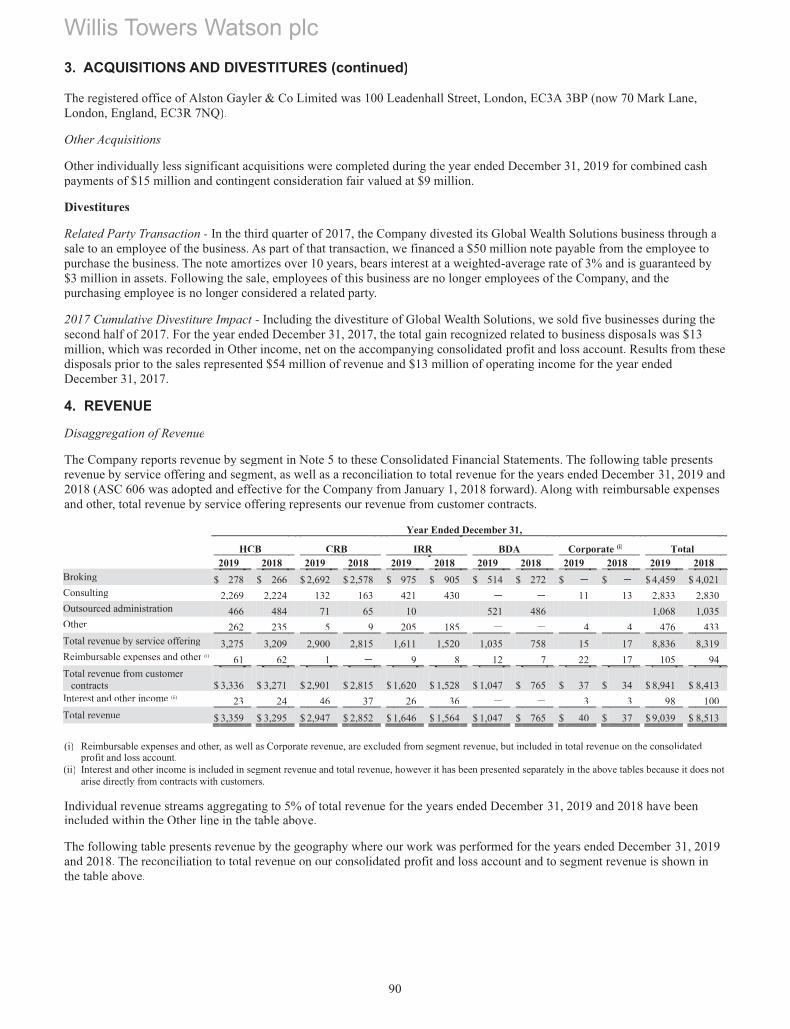
Disaggregation of Revenue
Year Ended December 31,
HCB CRB IRR BDA Corporate (i) Total 2019 2018 2019 2018 2019 2018 2019 2018 2019 2018 2019 2018
gBroking $ 278 $ 266 $ 2,692 $ 2,578 $ 975 $ 905 $ 514 $ 272 $ $ $ 4,459 $ 4,021 gConsulting 2,269 2,224 132 163 421 430 11 13 2,833 2,830
Outsourced administration 466 484 71 65 10 521 486 1,068 1,035 Other 262 235 5 9 205 185 4 4 476 433
y gTotal revenue by service offering 3,275 3,209 2,900 2,815 1,611 1,520 1,035 758 15 17 8,836 8,319 pReimbursable expenses and other (i) 61 62 1 9 8 12 7 22 17 105 94
Total revenue from customer contracts $ 3,336 $ 3,271 $ 2,901 $ 2,815 $ 1,620 $ 1,528 $ 1,047 $ 765 $ 37 $ 34 $ 8,941 $ 8,413 Interest and other income (ii) 23 24 46 37 26 36 3 3 98 100 Total revenue $ 3,359 $ 3,295 $ 2,947 $ 2,852 $ 1,646 $ 1,564 $ 1,047 $ 765 $ 40 $ 37 $ 9,039 $ 8,513
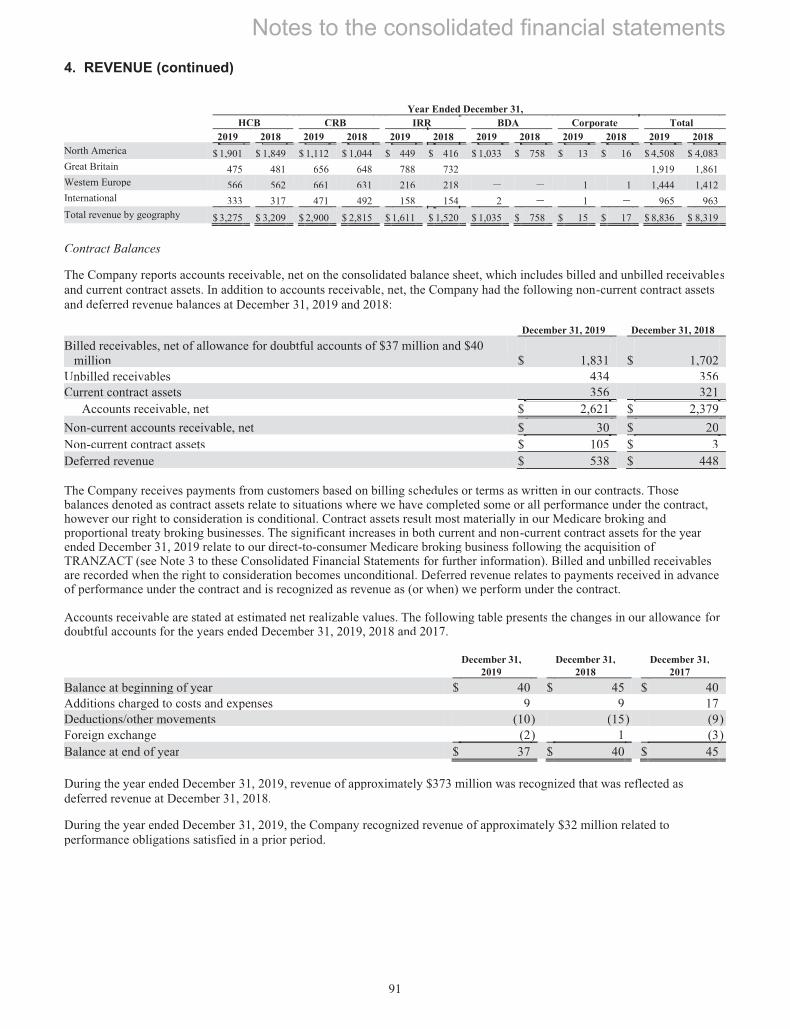
Year Ended December 31, HCB CRB IRR BDA Corporate Total 2019 2018 2019 2018 2019 2018 2019 2018 2019 2018 2019 2018
North America $ 1,901 $ 1,849 $ 1,112 $ 1,044 $ 449 $ 416 $ 1,033 $ 758 $ 13 $ 16 $ 4,508 $ 4,083 Great Britain 475 481 656 648 788 732 1,919 1,861
pWestern Europe 566 562 661 631 216 218 1 1 1,444 1,412 International 333 317 471 492 158 154 2 1 965 963
y g g p yTotal revenue by geography $ 3,275 $ 3,209 $ 2,900 $ 2,815 $ 1,611 $ 1,520 $ 1,035 $ 758 $ 15 $ 17 $ 8,836 $ 8,319
Contract Balances
December 31, 2019 December 31, 2018 Billed receivables, net of allowance for doubtful accounts of $37 million and $40 million $ 1,831 $ 1,702 Unbilled receivables 434 356 Current contract assets 356 321
Accounts receivable, net $ 2,621 $ 2,379 Non-current accounts receivable, net $ 30 $ 20 Non-current contract assets $ 105 $ 3 Deferred revenue $ 538 $ 448
to these Consolidated Financial Statements
December 31,
2019 December 31,
2018 December 31,
2017 Balance at beginning of year $ 40 $ 45 $ 40 Additions charged to costs and expenses 9 9 17 Deductions/other movements (10) (15) (9) Foreign exchange (2) 1 (3) Balance at end of year $ 37 $ 40 $ 45

Performance Obligations
2020 2021 2022 onward Total p gRevenue expected to be recognized on contracts as of December 31, 2019 $ 492 $ 367 $ 420 $ 1,279
Costs to obtain or fulfill a contract
Costs to fulfill
December 31,
2019 December 31,
2018 Balance at beginning of the year $ 148 $ 126 New capitalized costs 488 465 Amortization (460) (442) Impairments Foreign currency translation 1 (1) Balance at end of the year $ 177 $ 148

Segment revenue Segment operating income Years ended December 31 Years ended December 31 2019 2018 2017 2019 2018 2017
HCB $ 3,298 $ 3,233 $ 3,176 $ 848 $ 789 $ 774 CRB 2,946 2,852 2,709 578 528 483 IRR 1,637 1,556 1,474 420 384 329 BDA 1,035 758 734 244 144 153 Total $ 8,916 $ 8,399 $ 8,093 $ 2,090 $ 1,845 $ 1,739
Years ended December 31, 2019 2018 2017
Revenue: Total segment revenue $ 8,916 $ 8,399 $ 8,093 Reimbursable expenses and other 123 114 109
Revenue $ 9,039 $ 8,513 $ 8,202 Total segment operating income $ 2,090 $ 1,845 $ 1,739 Amortization (489) (534) (581) Restructuring costs (132) Transaction and integration expenses (i) (13) (202) (269) Provisions for significant litigation (11 ) Unallocated, net (ii) (259) (300) (230) Income from operations 1,329 809 516 Interest expense (234) (208) (188) Other income, net 227 250 164 Income from operations before income taxes $ 1,322 $ 851 $ 492

Revenue Long-Lived Assets (i) 2019 2018 2017 2019 2018 2017
Ireland $ 144 $ 138 $ 107 $ 103 $ 78 $ 127 United States 4,370 3,970 3,821 12,786 11,068 9,988 United Kingdom 1,934 1,926 1,815 2,901 2,349 3,173 Rest of World 2,591 2,479 2,459 2,527 2,411 3,263 Total Foreign Countries 8,895 8,375 8,095 18,214 15,828 16,424 $ 9,039 $ 8,513 $ 8,202 $ 18,317 $ 15,906 $ 16,551
Operational Improvement Program -p p g
HCB CRB IRR BDA Corporate Total (i)
Year ended December 31, 2017 Termination benefits $ $ 25 $ 4 $ $ 17 $ 46 Professional services and other (ii) 3 63 6 14 86 Total $ 3 $ 88 $ 10 $ $ 31 $ 132
HCB CRB IRR BDA Corporate Total Year ended December 31, 2017
p
Termination benefits $ $ 25 $ 4 $ $ 19 $ 48 Professional services and other (i) 3 63 6 14 86
Total Termination benefits $ 3 $ 82 $ 15 $ $ 23 $ 123 Professional services and other (i) 5 204 12 97 318
Total $ 8 $ 286 $ 27 $ $ 120 $ 441

Termination
Benefits
Professional Services and
Other Total Balance at January 1, 2017 $ 7 $ 18 $ 25 Charges incurred 48 86 134 Cash payments (41) (97) (138) Balance at December 31, 2017 14 7 21 Cash payments (12) (6) (18 ) Balance at December 31, 2018 2 1 3Cash payments (2) (1) (3) Balance at December 31, 2019 $ $ $
Income Taxes
Provision for income taxes
Years ended December 31, 2019 2018 2017
Ireland $ (11) $ (16) $ (23 ) U.S. 178 (101) (198) U.K. 337 182 31 Rest of World 818 786 682 Total $ 1,322 $ 851 $ 492
Years ended December 31, 2019 2018 2017
Current tax expense: U.S. federal taxes $ (108) $ (98) $ (65 ) U.S. state and local taxes (43) (25) (7) U.K. corporation tax (43) (16) (14 ) Other jurisdictions (127) (112) (99 )
Total current tax expense (321) (251) (185) Deferred tax benefit:
U.S. federal taxes 56 79 268 U.S. state and local taxes 14 12 (6) U.K. corporation tax (15) (6) 9 Other jurisdictions 17 30 14
Total deferred tax benefit 72 115 285 Total (provision for)/benefit from income taxes $ (249) $ (136) $ 100

Effective tax rate reconciliation
Years ended December 31, 2019 2018 2017
INCOME FROM OPERATIONS BEFORE INCOME TAXES $ 1,322 $ 851 $ 492 U.S. federal statutory income tax rate 21% 21% 35 % Income tax expense at U.S. federal tax rate (278) (179) (172 ) Adjustments to derive effective tax rate: Non-deductible expenses and dividends (34 ) (44) (68 ) Non-deductible acquisition costs (2) (2) (11 ) Disposal of non-deductible goodwill 1 (11 ) Impact of change in rate on deferred tax balances 7 Effect of foreign exchange and other differences 1 1 (3) Non-deductible Venezuelan foreign exchange loss (2) Changes in valuation allowances 6 80 (13 ) Net tax effect of intra-group items 93 99 97 Tax differentials of non-U.S. jurisdictions (2) (2) 69 Tax differentials of U.S. state taxes and local taxes (21 ) (77) 6 Global Intangible Low-Taxed Income (GILTI) (7) (15) Impact of U.S. Tax Reform 204 Other items, net (5) (5) 4(Provision for)/benefit from income taxes $ (249) $ (136) $ 100
Deferred income taxes

December 31, 2019 2018
Deferred tax assets: Accrued expenses not currently deductible $ 201 $ 177 Net operating losses 116 91 Capital loss carryforwards 33 30 Accrued retirement benefits 326 285 Operating lease liabilities 181 Deferred compensation 86 82 Stock options 18 22 Financial derivative transactions 1
Gross deferred tax assets 961 688 Less: valuation allowance (76) (81 ) Net deferred tax assets $ 885 $ 607 Deferred tax liabilities:
Cost of intangible assets, net of related amortization $ 865 $ 825 Operating lease right-of-use assets 177 Cost of tangible assets, net of related depreciation 53 37 Prepaid retirement benefits 121 101 Financial derivative transactions 3 Accrued revenue not currently taxable 120 144Deferred tax liabilities $ 1,339 $ 1,107
Net deferred tax liabilities $ 454 $ 500
December 31, 2019 2018
Balance sheet classifications: Other non-current assets $ 72 $ 59 Deferred tax liabilities 526 559 Net deferred tax liability $ 454 $ 500

Years ended December 31, 2019 2018 2017
Balance at beginning of year $ 81 $ 162 $ 134 Additions charged to costs and expenses 7 18 35 Deductions (12) (99) (7) Balance at end of year $ 76 $ 81 $ 162
Uncertain tax positions
2019 2018 2017 Balance at beginning of year $ 49 $ 59 $ 56 Increases related to tax positions in prior years 2 2 2 Decreases related to tax positions in prior years (1) (4) (5) Decreases related to settlements (4) Decreases related to lapse in statute of limitations (1) (5) (2) Increases related to current year tax positions 3 9 Cumulative translation adjustment and other adjustments (2) (1) Balance at end of year $ 49 $ 49 $ 59


HCB CRB IRR BDA Total Balance at December 31, 2017 Goodwill, gross $ 4,342 $ 2,261 $ 1,851 $ 2,557 $ 11,011 Accumulated impairment losses (130) (362) (492) Goodwill, net - December 31, 2017 4,212 1,899 1,851 2,557 10,519
Goodwill reassigned in segment realignment (i) 72 (72 ) Goodwill acquired during the period 9 29 38 Goodwill disposed of during the period (5) (5) Foreign exchange (42) (34 ) (11 ) (87 )
Balance at December 31, 2018 Goodwill, gross 4,300 2,308 1,792 2,557 10,957 Accumulated impairment losses (130) (362) (492) Goodwill, net - December 31, 2018 4,170 1,946 1,792 2,557 10,465
Goodwill acquired during the period 10 727 737 Goodwill disposed of during the period (6 ) (6) Foreign exchange (2 ) (3 ) 3 (2)
Balance at December 31, 2019 Goodwill, gross 4,298 2,309 1,795 3,284 11,686 Accumulated impairment losses (130) (362) (492) Goodwill, net - December 31, 2019 $ 4,168 $ 1,947 $ 1,795 $ 3,284 $ 11,194
Balance at December 31,
2018 ASC 842
reclassification (i)
Intangibleassets
acquired (ii)
Intangibleassets
disposed Amortization Foreign
exchange
Balance at December 31,
2019 Client relationships $ 1,986 $ $ 626 $ (9) $ (313) $ 8 $ 2,298 Software 328 (1) (125) 202 Trademark and trade name 920 (45) 875 Favorable agreements 9 (9 ) Other 75 34 (6 ) 103 Total amortizable intangible assets $ 3,318 $ (9 ) $ 660 $ (10) $ (489) $ 8 $ 3,478

Balance at December 31,
2017
Intangible assets
acquired
Intangibleassets
disposed Amortization (i) Foreign
exchange
Balance at December 31,
2018 Client relationships $ 2,342 $ 39 $ (7) $ (341) $ (47) $ 1,986 Software 473 (140) (5) 328 Trademark and trade name 966 (44 ) (2) 920 Favorable agreements 10 (2) 1 9 Other 91 (9) (7) 75 Total amortizable intangible assets $ 3,882 $ 39 $ (7) $ (536) $ (60) $ 3,318
(i)
December 31, 2019 December 31, 2018
Gross Carrying
Amount Accumulated Amortization
Gross CarryingAmount
AccumulatedAmortization
Client relationships $ 4,029 $ (1,731) $ 3,401 $ (1,415 ) Software 753 (551) 749 (421) Trademark and trade name 1,051 (176) 1,052 (132) Favorable agreements (i) 14 (5) Other 134 (31 ) 102 (27 ) Total finite-lived assets $ 5,967 $ (2,489) $ 5,318 $ (2,000 ) Unfavorable agreements (i) $ $ $ 34 $ (13 ) Total finite-lived intangible liabilities $ $ $ 34 $ (13 )
Years ended December 31, Amortization 2020 $ 455 2021 378 2022 319 2023 269 2024 236 Thereafter 1,821 Total $ 3,478

Furniture, equipment and
software Leasehold
improvements Land and buildings Total
Cost: at January 1, 2018 $ 1,300 $ 468 $ 94 $ 1,862 Additions 249 70 319 Disposals (278) (35) (313) Reclassification due to ASC 606 (i) (102) (102) Foreign exchange (39) (15) (2) (56 )
Cost: at December 31, 2018 1,130 488 92 1,710 Additions 268 68 336 Acquisitions 7 3 10 Disposals (117) (15) (132) Reclassification due to ASC 842 (ii) (3) (3) Foreign exchange 14 6 1 21
Cost: at December 31, 2019 $ 1,302 $ 550 $ 90 $ 1,942 Depreciation: at January 1, 2018 $ (652) $ (176) $ (49) $ (877)
Depreciation expense (iii) (155) (54) (4) (213) Disposals 250 27 277 Reclassification due to ASC 606 (i) 19 19 Foreign exchange 19 6 1 26
Depreciation: at December 31, 2018 (519) (197) (52) (768) Depreciation expense (179) (57) (4) (240) Disposals 109 11 120 Foreign exchange (5) (2) (1) (8)
Depreciation: at December 31, 2019 $ (594) $ (245) $ (57) $ (896) Net book value: At December 31, 2018 $ 611 $ 291 $ 40 $ 942 At December 31, 2019 $ 708 $ 305 $ 33 $ 1,046
to these Consolidated Financial Statements
December 31, 2019 2018 Finance leases $ 29 $ 31 Accumulated depreciation (19) (16 ) $ 10 $ 15

Foreign Currency Risk
Gain/(loss) recognized in OCI (effective element) 2019 2018 2017
Foreign exchange contracts $ 15 $ (22) $ 39
Location of loss reclassified from Accumulated OCL into income(effective element) Loss reclassified from Accumulated OCL into income (effective element)
2019 2018 2017
Revenue $ (5) $ $ Salaries and benefits (4) Other income, net (28 ) (53)
$ (9) $ (28 ) $ (53)
Location of gain Gain recognized in income Derivatives not designated as hedging instruments: recognized in income 2019 2018 2017
Foreign exchange contracts Other income, net $ 18 $ $ 11

December 31, 2019 2018
Term loan due 2020 $ 292 $ Current portion of collateralized facility 24 7.000% senior notes due 2019 186 $ 316 $ 186
December 31, 2019 2018
Revolving $1.25 billion credit facility $ $ 130 Collateralized facility 60 5.750% senior notes due 2021 499 498 3.500% senior notes due 2021 448 448 2.125% senior notes due 2022 (i) 604 615 4.625% senior notes due 2023 249 248 3.600% senior notes due 2024 646 645 4.400% senior notes due 2026 546 544 4.500% senior notes due 2028 595 595 2.950% senior notes due 2029 446 6.125% senior notes due 2043 271 271 5.050% senior notes due 2048 395 395 3.875% senior notes due 2049 542 $ 5,301 $ 4,389
$1.25 billion revolving credit facility

2.950% senior notes due 2029 and 3.875% senior notes due 2049
4.500% senior notes due 2028 and 5.050% senior notes due 2048
3.600% senior notes due 2024
2.125% senior notes due 2022
3.500% senior notes due 2021 and 4.400% senior notes due 2026

4.625% senior notes due 2023 and 6.125% senior notes due 2043
5.750% senior notes due 2021
7.000% senior notes due 2019
$800 million revolving credit facility

Term loan due December 2019
7-year term loan facility
2020 2021 2022 2023 2024 Thereafter Total Senior notes $ $ 950 $ 606 $ 250 $ 650 $ 2,825 $ 5,281 Interest on senior notes 215 188 163 153 132 1,511 2,362RCF Term loan due 2020 295 295 Collateralized facility (i) 24 22 17 13 3 79 Total $ 534 $ 1,160 $ 786 $ 416 $ 785 $ 4,336 $ 8,017
to these Consolidated Financial Statements
Interest Expense
Years ended December 31, 2019 2018 2017
Senior notes $ 206 $ 166 $ 148 Term loans 9 4 8 RCF 8 26 17 Other (i) 11 12 15
Total interest expense $ 234 $ 208 $ 188

Fair Value Measurements on a Recurring Basis at
December 31, 2019 Balance Sheet Location Level 1 Level 2 Level 3 Total Assets: Available-for-sale securities:
Mutual funds / exchange traded funds
Prepaid and other current assets d andother non-current assets $ 20 $ $ $ 20
Derivatives: Derivative financial instruments (i)
Prepaid and other current assets d andother non-current assets $ $ 32 $ $ 32
Liabilities: Contingent consideration:
gContingent consideration (ii)
Other current liabilities and other non-current liabilities $ $ $ 17 $ 17
Derivatives: Derivative financial instruments (i)
Other current liabilities and other non-current liabilities $ $ 3 $ $ 3

Fair Value Measurements on a Recurring Basis at
December 31, 2018 Balance Sheet Location Level 1 Level 2 Level 3 Total
Assets: Available-for-sale securities:
Mutual funds / exchange traded funds
Prepaid and other current assets d andother non-current assets $ 18 $ $ $ 18
Derivatives: Derivative financial instruments (i)
Prepaid and other current assets d andother non-current assets $ $ 5 $ $ 5
Liabilities: Contingent consideration:
Contingent consideration (ii)
Other current liabilities and other non-current liabilities $ $ $ 51 $ 51
Derivatives: Derivative financial instruments (i)
Other current liabilities and other non-current liabilities $ $ 17 $ $ 17
to these Consolidated Financial Statements
Fair Value Measurements Using Significant Unobservable Inputs (Level 3) December 31, 2019 Balance at December 31, 2018 $ 51
Obligations assumed 13 Payments (45) Realized and unrealized gains (3) Foreign exchange 1
Balance at December 31, 2019 $ 17
December 31, 2019 December 31, 2018 Carrying Value Fair Value Carrying Value Fair Value Liabilities:
Current debt $ 316 $ 319 $ 186 $ 191 Long-term debt $ 5,301 $ 5,694 $ 4,389 $ 4,458
Defined Benefit Plans and Post-retirement Welfare Plans

United States
United Kingdom
Other
Post-retirement Welfare Plan

Amounts Recognized in our Consolidated Financial StatementsCC
2019 2018 U.S. U.K. Other PRW U.S. U.K. Other PRW
Change in Benefit Obligation Benefit obligation, beginning of year $ 4,187 $ 3,666 $ 728 $ 87 $ 4,476 $ 4,165 $ 822 $ 123
Service cost 65 14 20 1 66 18 21 1 Interest cost 157 93 18 3 140 95 18 4
p yEmployee contributions 15 6 14 1 7 Actuarial losses/(gains) 535 472 88 5 (313) (176) (7 ) (3)Settlements (6 ) (8) (3) (11) (152) (26) Curtailments (20) Benefits paid (185) (140) (26) (12) (185) (96) (28) (14)Plan amendments 40 (31)Transfers in 2 1
g y gForeign currency changes 162 15 (229) (53) Benefit obligation, end of year $ 4,768 $ 4,259 $ 842 $ 90 $ 4,187 $ 3,666 $ 728 $ 87
Change in Plan Assets Fair value of plan assets, beginning of year $ 3,403 $ 4,402 $ 486 $ 1 $ 3,654 $ 4,910 $ 562 $ 2
pActual return on plan assets 557 561 85 (157) (69) (9 ) Employer contributions 89 77 31 5 88 85 22 6
p yEmployee contributions 15 6 14 1 7 Settlements (6 ) (8 ) (3 ) (11 ) (152 ) (26) Benefits paid (185) (140) (26) (12) (185) (96) (28) (14)Transfers in 2 1
g y jForeign currency adjustment 194 13 (277) (36) p yFair value of plan assets, end of year $ 3,873 $ 5,086 $ 588 $ $ 3,403 $ 4,402 $ 486 $ 1
Funded status at end of year $ (895) $ 827 $ (254) $ (90) $ (784) $ 736 $ (242) $ (86)Accumulated Benefit Obligation $ 4,768 $ 4,259 $ 810 $ 90 $ 4,187 $ 3,666 $ 698 $ 87 Components on the Consolidated Balance Sheet
Pension benefits assets $ $ 835 $ 22 $ $ $ 745 $ 17 $ Current liability for pension benefits $ (33) $ (1) $ (6) $ (6 ) $ (49) $ (1 ) $ (6 ) $ (5)Non-current liability for pension benefits $ (862) $ (7) $ (270) $ (84) $ (735) $ (8 ) $ (253) $ (81)
$ (895) $ 827 $ (254) $ (90 ) $ (784 ) $ 736 $ (242 ) $ (86 )

2019 2018 U.S. U.K. Other PRW U.S. U.K. Other PRW
Net actuarial loss $ 982 $ 1,133 $ 128 $ 20 $ 769 $ 955 $ 98 $ 16 p gNet prior service gain (61) (27) (76) (31)
Accumulated other comprehensiveloss/(income) $ 982 $ 1,072 $ 128 $ (7) $ 769 $ 879 $ 98 $ (15)
2019 2018 U.S. U.K. Other U.S. U.K. Other
Projected benefit obligation at end of year $ 4,768 $ 7 $ 784 $ 4,187 $ 9 $ 672 Fair value of plan assets at end of year $ 3,873 $ $ 509 $ 3,403 $ $ 413
2019 2018 U.S. U.K. Other U.S. U.K. Other
Projected benefit obligation at end of year $ 4,768 $ 7 $ 784 $ 4,187 $ 9 $ 672 Accumulated benefit obligation at end of year $ 4,768 $ 7 $ 752 $ 4,187 $ 9 $ 642 Fair value of plan assets at end of year $ 3,873 $ $ 509 $ 3,403 $ $ 413
2019 2018 2017 U.S. U.K. Other PRW U.S. U.K. Other PRW U.S. U.K. Other PRW
Components of net periodic benefit (income)/cost:
Service cost $ 65 $ 14 $ 20 $ 1 $ 66 $ 18 $ 21 $ 1 $ 66 $ 32 $ 20 $Interest cost 157 93 18 3 140 95 18 4 139 93 17 4 Expected return on plan assets (254) (246) (29) (273) (298) (31) (245) (284) (30) Amortization of unrecognized prior service credit (16) (4 ) (19) (18) Amortization of unrecognized actuarial loss 19 21 2 1 11 45 2 13 53 2 Settlement 1 1 41 2 1 37 1 Curtailment gain (16)
Net periodic benefit (income)/cost $ (13) $ (134) $ 12 $ 1 $ (55) $ (118) $ (4) $ 5 $ (26) $ (87) $ 10 $ 4 Other changes in plan assets and benefit obligations recognized in other comprehensive loss/(income): Net actuarial loss/(gain) $ 232 $ 157 $ 32 $ 5 $ 117 $ 191 $ 13 $ (3) $ 74 $ (4 ) $ (7 ) $ 14 Amortization of unrecognized actuarial loss (19) (21) (2) (1) (11) (45) (2) (13) (53) (2 )Prior service cost/(credit) 40 (31) Amortization of unrecognized prior service credit 16 4 19 18 Settlement (1) (1) (41) (2) (1 ) (37) (1 ) Curtailment gain 16
Total recognized in other comprehensive loss/(income) 213 152 29 8 105 164 25 (34) 60 (76) (10) 14 Total recognized in net periodic benefit (income)/cost and other comprehensive loss/(income) $ 200 $ 18 $ 41 $ 9 $ 50 $ 46 $ 21 $ (29) $ 34 $ (163) $ $ 18

Assumptions Used in the Valuations of the Defined Benefit Pension Plans and PRW Plan
Years ended December 31, 2019 2018 2017 U.S. U.K. Other PRW U.S. U.K. Other PRW U.S. U.K. Other PRW
Discount rate - PBO 4.2% 2.8% 2.8% 4.2% 3.6% 2.6% 2.6% 3.5% 4.0 % 2.6% 2.7% 4.0%Discount rate - service cost 4.3% 2.9% 3.0% 4.2% 3.5% 2.7% 2.9% 3.5% 3.9 % 2.6% 3.0% 3.9%Discount rate - interest cost on service cost 3.8% 2.8% 2.9% 3.9% 3.1% 2.5% 2.7% 3.2% 3.2 % 2.4% 2.8% 3.5%Discount rate - interest cost on PBO 3.9% 2.6% 2.5% 3.9% 3.2% 2.3% 2.3% 3.1% 3.4 % 2.3% 2.3% 3.3%Expected long-term rate of return on assets 7.6% 5.6% 6.0% 2.0% 7.6% 6.2% 5.7% 2.0% 7.6 % 6.3% 6.1% 2.0%Rate of increase in compensation levels 4.3% 3.0% 2.3% N/A 4.3% 3.0% 2.3% N/A 4.3 % 3.2% 2.3% N/A Healthcare cost trend
Initial rate 6.0% 6.5% 7.0%Ultimate rate 5.0% 5.0% 5.0%Year reaching ultimate rate 2022 2022 2022
December 31, 2019 December 31, 2018 U.S. U.K. Other PRW U.S. U.K. Other PRW
Discount rate 3.3% 2.0 % 2.1% 3.2% 4.2% 2.8% 2.8% 4.2% Rate of increase in compensation levels 4.3% 3.0 % 2.3% N/A 4.3% 3.0% 2.3% N/A

U.S. U.K. Canada Germany Ireland
Asset Category Willis
Willis Towers Watson Willis
TowersWatson Miller
Towers Watson
Towers Watson Willis
Towers Watson
Equity securities 30% 23% 18% 4 % 19% 40% 35% 30% 40% Debt securities 33% 33% 64% 23 % 21% 50% 60% 29% 30% Real estate 11% 6 % % 1 % % 5% % 3 % % Other 26% 38% 18% 72 % 60% 5% 5% 38% 30%
Total 100% 100 % 100 % 100% 100% 100% 100% 100 % 100 %
Fair Value of Plan Assets

December 31, 2019 December 31, 2018 Level 1 Level 2 Level 3 Total Level 1 Level 2 Level 3 Total
Asset category: Cash (i) $ 172 $ $ $ 172 $ 6 $ $ $ 6 Short-term securities 99 99 78 78 Equity securities 156 156 Government bonds 4 4 2 2 Corporate bonds 354 354 Pooled / commingled funds 2,033 1,467 Private equity 487 357 Hedge funds 1,084 984 Total assets $ 176 $ 99 $ $ 3,879 $ 164 $ 432 $ $ 3,404
December 31, 2019 December 31, 2018 Level 1 Level 2 Level 3 Total Level 1 Level 2 Level 3 Total
Asset category:Cash $ 253 $ $ $ 253 $ 229 $ $ $ 229 Government bonds 1,865 1,865 1,804 1,804 Corporate bonds 741 741 297 297 Other fixed income 350 350 248 248 Pooled / commingled funds 1,828 934Mutual funds 34 16 Private equity 34 33 Derivatives 246 246 96 96 Real estate 161 184 Hedge funds 54 1,232 Total assets $ 2,118 $ 1,337 $ $ 5,566 $ 2,033 $ 641 $ $ 5,073 Liability category: Repurchase agreements 480 480 684 684 Net assets/(liabilities) $ 2,118 $ 857 $ $ 5,086 $ 2,033 $ (43 ) $ $ 4,389
December 31, 2019 December 31, 2018 Level 1 Level 2 Level 3 Total Level 1 Level 2 Level 3 Total
Asset category: Cash $ 2 $ $ $ 2 $ 1 $ $ $ 1 Pooled / commingled funds 444 294 Mutual funds 106 185 Hedge funds 34 4 Insurance contracts 2 2 2 2 Total assets $ 2 $ $ 2 $ 588 $ 1 $ $ 2 $ 486

Fair Value Measurement and Disclosures
Short-term securities
Equity securities and mutual funds:
Government bonds
Corporate bonds:
Other fixed income
Pooled / commingled funds and mutual funds
Derivative investments
Private equity funds, real estate funds, hedge funds:
Insurance contracts:
Repurchase agreements:
December 31, 2019 2018
Net assets held in investments $ 9,553 $ 8,279 PRW plan assets 1 Net (payable)/receivable for investments purchased (7) (1) Dividend and interest receivable 1 1 Other adjustments 12
Fair value of plan assets $ 9,547 $ 8,292
Level 3 investments

Level 3
Roll Forward Beginning balance at December 31, 2018 $ 2 Foreign exchange Ending balance at December 31, 2019 $ 2
Contributions and Benefit Payments
2020
(Projected) 2019
(Actual) 2018
(Actual) U.S. $ 60 $ 60 $ 50 U.K. $ 80 $ 76 $ 84 Other $ 23 $ 22 $ 14
Benefit Payments Financial Year U.S. U.K. Other PRW Total 2020 $ 234 $ 116 $ 27 $ 10 $ 387 2021 264 119 24 10 417 2022 252 121 27 11 411 2023 260 129 28 11 428 2024 268 138 30 11 447 Years 2025 2029 1,375 768 171 60 2,374 $ 2,653 $ 1,391 $ 307 $ 113 $ 4,464
Defined Contribution Plans

Claims,lawsuits and
otherproceedings(i)
Otherprovisions(ii) Total
Balance at January 1, 2018 $ 474 $ 84 $ 558 Net provisions made during the year 45 9 54 Utilized in the year (59) (3) (62) Foreign currency translation adjustment (5) (5 ) (10)
Balance at December 31, 2018 $ 455 $ 85 $ 540 Net provisions made during the year 39 (1) 38 Provisions disposed of, net of provisions acquired, during the year (1) (1 ) Utilized in the year (40 ) (2 ) (42) Foreign currency translation adjustment 2 2
Balance at December 31, 2019 $ 456 $ 81 $ 537 (i)
(ii)

Operating Leases Finance Leases Total Leases Right-of-use assets $ 968 $ 10 $ 978 Current lease liabilities 164 3 167 Long-term lease liabilities 964 22 986
Year Ended
December 31, 2019 Finance lease cost:
Amortization of right-of-use assets $ 2 Interest on lease liabilities 3
Operating lease cost 191 Short-term lease cost 2 Variable lease cost 51 Sublease income (16)
Total lease cost, net $ 233
Year Ended
December 31, 2019 Cash flows from operating activities:
Operating leases $ 205 Finance leases 3
Cash flows used in financing activities: Finance leases 2 Total lease payments $ 210
to these Consolidated Financial Statements

Land and buildings
Cost: at January 1, 2019 (on adoption of ASC 842) 984 Additions (excluding remeasurements) 53 Remeasurements 71Foreign exchange 10
Cost: at December 31, 2019 $ 1,118 Depreciation: at January 1, 2019
Depreciation expense (148) Foreign exchange (2 )
Depreciation: at December 31, 2019 $ (150) Net book value: At December 31, 2018 $ At December 31, 2019 $ 968
Operating Leases Finance Leases Weighted-average term (in years) 8.8 6.0 Weighted-average discount rate 3.6% 12.9%
Operating Leases Finance Leases Total Leases 2020 $ 192 $ 6 $ 198 2021 172 6 1782022 156 6 162 2023 146 6 152 2024 130 6 136 Thereafter 524 7 531 Total future lease payments 1,320 37 1,357 Interest (192) (12 ) (204) Total lease liabilities $ 1,128 $ 25 $ 1,153
Operating Leases Finance Leases Total Leases 2019 $ 197 $ 5 $ 202 2020 180 6 186 2021 159 6 165 2022 142 6 148 2023 131 6 137 Thereafter 542 14 556 Total future lease payments 1,351 43 1,394 Interest (202) (14 ) (216) Total lease liabilities $ 1,149 $ 29 $ 1,178

Guarantees
Acquisition liabilities
Other contractual obligations
Indemnification Agreements
Legal Proceedings
14 to these Consolidated Financial Statements

Contingencies,
Merger-Related Securities Litigation
en banc

Stanford Financial Group
Troice, et al. v. Willis of Colorado, Inc., et al.,
inter alia
Roland v. GreenRoland
TroiceRolandd
TroiceTroice Rolandd Troice, et al. v. Proskauer Rose LLP,
Rolandd
en bancen banc
Troice

Troice
Troice Janvey, et al. v. Willis of Colorado, Inc., et al.
Troice Janvey
Troice Janvey
Ranni v. Willis of Colorado, Inc., et al., C.A.
RanniTroice
Ranni
Canabal, et al. v. Willis of Colorado, Inc., et al., C.A.Troice
Troice CanabalTroice
Canaball
Rupert, et al. v. Winter, et al.,
Rupertt
RuperttRupertt
Rishmague, et ano. v. Winter, et al.

Rupert
Casanova, et al. v. Willis of Colorado, Inc., et al.,
TroiceJanvey
Casanova
Rishmague, et ano. v. Winter, et al.,
Rishmague
Rishmague
Rupertt RuperttRishmague
Rupertt
Rishmague
MacArthur v. Winter, et al.,
MacArthur
MacArthurr
MacArthurrRishmague
MacArthur
Florida suits
Barbar, et al. v. Willis Group Holdings Public Limited Company, et al.de Gadala-
Maria, et al. v. Willis Group Holdings Public Limited Company, et al.Ranni, et ano. v. Willis Group
Holdings Public Limited Company, et al.Tisminesky, et al. v. Willis Group Holdings Public Limited
Company, et al.Zacarias, et al. v. Willis Group Holdings Public Limited Company, et al.
Tismineskysua sponte

ZacariasTisminesky de Gadala Maria
Barbarr Ranni
Barbarr Ranni
Barbarr Ranni sua sponteRanni Barbar
Zacarias Tisminesky de Gadala-MariaZacarias Tisminesky de Gadala-Maria
ZacariasTisminesky de Gadala-Maria
Zacarias Tisminesky de Gadala-Maria
Janvey, et al. v. Willis of Colorado, Inc., et al.
Janvey
Troice Janvey
Troice Janvey
Troice Janvey
Troice Janvey
Janvey

Troice Janvey
Martin v. Willis of Colorado, Inc., et al.
Martin.
Abel, et al. v. Willis of Colorado, Inc.
Abel.
Janveyy Troice
for this adjusting subsequent event in the Consolidated Financial Statementsfor 2015. This increase in the litigation provision was recognized in Annual Form 10-K for the following year, 2016
Settlement
Janvey Troice
en banc
en banc
Aviation Broking Competition Investigations
U.K. Investment Consulting Investigation

December 31,
2019 December 31,
2018 Prepayments and accrued income $ 145 $ 136Deferred contract costs 101 102Derivatives and investments 49 25 Deferred compensation plan assets 18 18 Retention incentives 11 5 Corporate income and other taxes 56 61 Restricted cash 8 Acquired renewal commissions receivable 25 Other current assets 112 57 Total prepaid and other current assets $ 525 $ 404
December 31,
2019 December 31,
2018 Prepayments and accrued income $ 12 $ 14 Deferred contract costs 76 46 Deferred compensation plan assets 150 125 Accounts receivable, net 30 20 Acquired renewal commissions receivable 125 Other investments 23 7 Insurance recovery receivables 119 86 Non-current contract assets 105 3 Other non-current assets 97 84 Total other non-current assets $ 737 $ 385
December 31,
2019 December 31,
2018 Accounts payable, accrued liabilities and deferred income $ 856 $ 691 Accrued discretionary and incentive compensation 727 758 Accrued vacation 137 111 Other employee-related liabilities 64 87 Total deferred revenue and accrued expenses $ 1,784 $ 1,647

December 31,
2019 December 31,
2018 Dividends payable $ 100 $ 87 Other taxes payable 53 48 Interest payable 65 59 Deferred compensation plan liabilities 14 14 Contingent and deferred consideration on acquisitions 12 61 Payroll-related liabilities 216 210 Derivatives 3 13 Third party commissions 179 169 Other current liabilities 75 122 Total other current liabilities $ 717 $ 783
December 31,
2019 December 31,
2018 Incentives from lessors $ $ 120 Deferred compensation plan liability 150 125Contingent and deferred consideration on acquisitions 26 22 Liabilities for uncertain tax positions 48 46 Finance leases 22 26 Other non-current liabilities 89 90 Total other non-current liabilities $ 335 $ 429
Years ended December 31, 2019 2018 2017
(average number) (average number) (average number)Human Capital and Benefits 14,300 14,200 12,800Corporate Risk and Broking 13,500 13,800 14,600Investment, Risk and Reinsurance 3,900 3,800 4,900Benefits Delivery and Administration 4,900 4,000 3,200
Total operating segments 36,600 35,800 35,500Corporate and Other 7,800 8,000 7,900
Total average number of employees for the year 44,400 43,800 43,400

Years ended December 31, 2019 2018 2017
Salaries and other compensation (i) $ 4,513 $ 4,421 $ 4,240 Share-based compensation 74 50 67 Severance costs 35 13 15 Social security costs 378 372 360 Retirement benefits defined benefit plan expense 99 117 131 Retirement benefits defined contribution plan expense 150 150 154
Total salaries and benefits expense $ 5,249 $ 5,123 $ 4,967 Restructuring costs termination benefits 46 Transaction and integration expenses 1 38
Total salaries and benefits expense, including termination benefits $ 5,249 $ 5,124 $ 5,051
Staff costs capitalized 110 86 102 Total staff costs $ 5,359 $ 5,210 $ 5,153
(i)
Years ended December 31, 2019 2018 2017
Aggregate emoluments in respect of qualifying services (i) (ii) Director services (iii) $ 3 $ 3 $ 4 Managerial services (iv) 52 4 12
Total emoluments $ 55 $ 7 $ 16 Defined contribution retirement scheme contributions managerial services (iv) (v) 2 1
(vi) (vii) (viii) (ix) $ 57 $ 8 $ 16
(iii)
(iv)

Years ended December 31, 2019 2018 2017
Audit fees $ 16 $ 15 $ 15 Audit-related fees 2 2 3 Tax advisory services and Other non-audit services
$ 18 $ 17 $ 18
An analysis of Deloitte LLP remuneration is as follows: Years ended December 31,
2019 2018 2017 $ 1 $ 1 $ 1
Other assurance services 3 3 3 Tax advisory services and Other non-audit services
(i) $ 4 $ 4 $ 4
Years ended December 31, 2019 2018 2017 (Loss)/gain on disposal of operations $ (2) $ (9) $ 13 Net periodic pension and postretirement benefit credits 234 280 222 Interest in earnings of associates and other investments 21 3 3 Impact of Venezuelan currency devaluation (2) Foreign exchange loss (26 ) (24) (72 ) Other income, net $ 227 $ 250 $ 164
December 31, 2019 December 31, 2018 December 31, 2017
Before tax
amount Tax
Net of tax
amount
Before tax
amount Tax
Net of tax
amount
Beforetax
amount Tax
Net of tax
amount p ( )Other comprehensive (loss)/income:
g yForeign currency translation $ 78 $ $ 78 $ (251 ) $ $ (251) $ 295 $ $ 295 p pDefined pension and post-retirement benefits (412) 83 (329) (258 ) 59 (199) 3 11 14
Derivative instruments 23 (2) 21 5 (3) 2 90 (15) 75 p ( )Other comprehensive (loss)/income (311) 81 (230) (504 ) 56 (448) 388 (4) 384
pLess: Other comprehensive income attributable to non-controlling interests (13) (13 ) Other comprehensive (loss)/income attributable to Willis Towers Watson $ (311) $ 81 $ (230) $ (504 ) $ 56 $ (448) $ 375 $ (4) $ 371

Foreign currency
translation (i) Derivative
instruments (i)
Defined pensionand post-
retirementbenefit costs (ii) Total
Balance, January 1, 2017 $ (650) $ (82) $ (1,152) $ (1,884 )Other comprehensive income/(loss) before reclassifications 285 28 (26) 287 Loss reclassified from accumulated other comprehensive loss (net of income tax benefit of $18) 44 40 84 Net other comprehensive income 285 72 14 371
Balance, December 31, 2017 $ (365) $ (10) $ (1,138) $ (1,513 )Other comprehensive loss before reclassifications (251) (22) (241) (514 )Loss reclassified from accumulated other comprehensive loss (net of income tax benefit of $17) 24 42 66 Net other comprehensive (loss)/income (251) 2 (199) (448 )
Balance, December 31, 2018 $ (616) $ (8 ) $ (1,337) $ (1,961 )Other comprehensive income/(loss) before reclassifications 78 12 (343) (253 )Loss reclassified from accumulated other comprehensive loss (net of income tax benefit of $9) 9 14 23 Net other comprehensive income/(loss) 78 21 (329) (230 )Reclassification of tax effects per ASU 2018-02 (iii) (36) (36 )
Balance, December 31, 2019 $ (538) $ 13 $ (1,702) $ (2,227 )
to these Consolidated Financial Statements
to theseConsolidated Financial Statements
to these ConsolidatedFinancial Statements
Plan Summaries
2012 Equity Incentive Plan

Towers Watson Share Plans
Options
Valuation Assumptions
Compensation Stock Compensation
Year ended December 31, 2017
Expected volatility 19.8%Expected dividends 1.4%Expected life (years) 4.2Risk-free interest rate 1.6%

Award Activity
pOptions
(thousands)
Weighted-AverageExercisePrice (i)
Weighted-Average
RemainingContractual
Term
Aggregate Intrinsic
Value Time-based stock options
Balance as of December 31, 2018 449 $ 102.36 Granted $ Exercised 182 $ 98.91 Forfeited 7 $ 117.96
Balance as of December 31, 2019 260 $ 104.38 1.6 years $ 25 Options vested or expected to vest at December 31, 2019 260 $ 104.38 1.6 years $ 25 Options exercisable at December 31, 2019 196 $ 98.46 1.4 years $ 20
Performance-based stock options Balance as of December 31, 2018 542 $ 110.55
Granted $ Exercised 245 $ 110.62 Cancelled 10 $ 107.87
Balance as of December 31, 2019 287 $ 110.58 2.7 years $ 26 Options vested or expected to vest at December 31, 2019 287 $ 110.58 2.7 years $ 26 Options exercisable at December 31, 2019 287 $ 110.58 2.7 years $ 26

Equity-settled RSUs
Valuation Assumptions
Years ended December 31, 2019 2018 2017
Expected volatility 25.6% 17.9 % 20.2% Expected dividend yield % % % Expected life (years) 2.7 2.5 2.4 Risk-free interest rate 2.1% 2.6% 1.4%
Award Activity
Shares
(thousands)
Weighted- Average
Grant DateFair Value
Nonvested shares (time-based RSUs) Balance as of December 31, 2018 19 $ 141.19
Granted 14 $ 179.04 Vested 21 $ 150.64 Forfeited 1 $ 136.17
Balance as of December 31, 2019 11 $ 172.25Nonvested shares (performance-based RSUs)
Balance as of December 31, 2018 758 $ 91.02 Granted 186 $ 198.49 Vested 178 $ 123.86 Forfeited 25 $ 204.68 Cancelled 234 $ 10.62
Balance as of December 31, 2019 507 $ 150.22

Phantom RSUs
Years ended December 31, 2019 2018 2017
Net income attributable to Willis Towers Watson $ 1,044 $ 695 $ 568 Basic weighted-average number of shares outstanding 130 131 135 Dilutive effect of potentially issuable shares 1 1 Diluted weighted-average number of shares outstanding 130 132 136 Basic earnings per share $ 8.05 $ 5.29 $ 4.21Dilutive effect of potentially issuable shares (0.03 ) (0.02) (0.03 ) Diluted earnings per share $ 8.02 $ 5.27 $ 4.18
Years Ended December 31, 2019 2018 2017
Supplemental disclosures of cash flow information: Cash payments for income taxes, net $ 299 $ 178 $ 203 Cash payments for interest $ 210 $ 176 $ 169 Cash acquired $ 11 $ 13 $
Supplemental disclosures of non-cash investing and financing activities: Fair value of deferred and contingent consideration related to acquisitions $ 13 $ 36 $
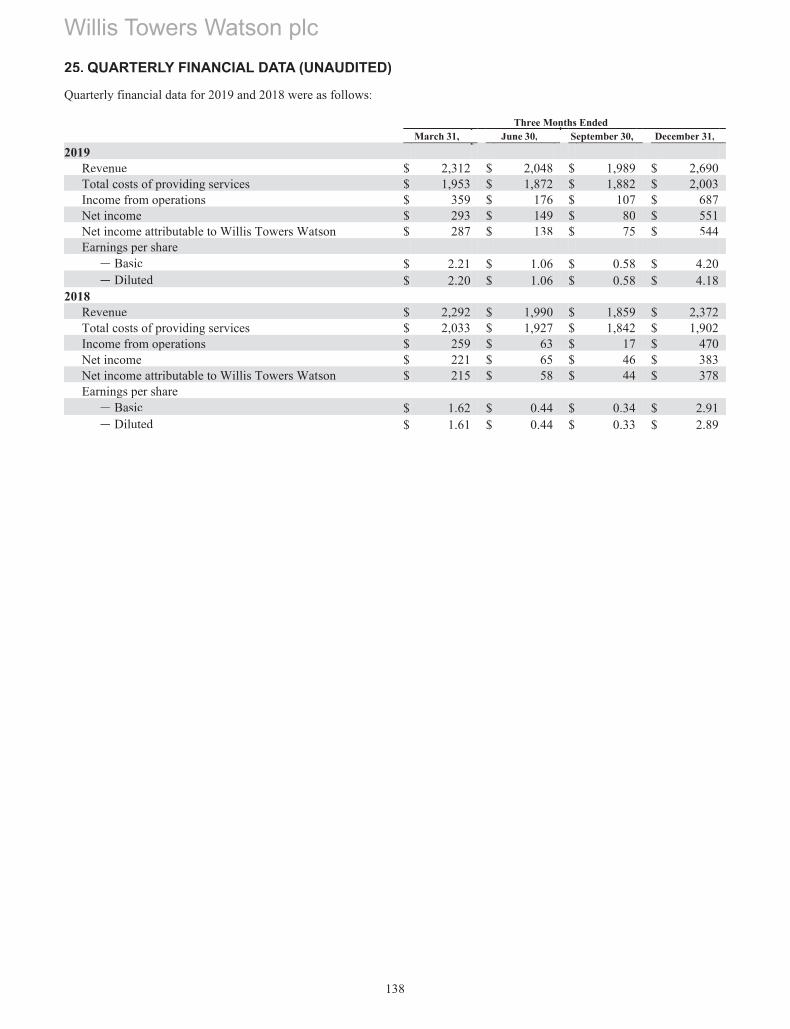
Three Months Ended March 31, June 30, September 30, December 31,
2019 Revenue $ 2,312 $ 2,048 $ 1,989 $ 2,690 Total costs of providing services $ 1,953 $ 1,872 $ 1,882 $ 2,003Income from operations $ 359 $ 176 $ 107 $ 687 Net income $ 293 $ 149 $ 80 $ 551 Net income attributable to Willis Towers Watson $ 287 $ 138 $ 75 $ 544 Earnings per share
Basic $ 2.21 $ 1.06 $ 0.58 $ 4.20 Diluted $ 2.20 $ 1.06 $ 0.58 $ 4.18
2018 Revenue $ 2,292 $ 1,990 $ 1,859 $ 2,372 Total costs of providing services $ 2,033 $ 1,927 $ 1,842 $ 1,902 Income from operations $ 259 $ 63 $ 17 $ 470Net income $ 221 $ 65 $ 46 $ 383 Net income attributable to Willis Towers Watson $ 215 $ 58 $ 44 $ 378 Earnings per share
Basic $ 1.62 $ 0.44 $ 0.34 $ 2.91 Diluted $ 1.61 $ 0.44 $ 0.33 $ 2.89

Indirect subsidiaries:
Holding companies
Trinity Acquisition plc 51 Lime Street, London EC3M 7DQ England and Wales Ordinary shares 100%
WTW Delaware Holdings LLC 251 Little Falls Drive, Wilmington, New Castle County, DE 19808 U.S.A. Membershipinterest 100%
Willis US Holding Company, LLC 251 Little Falls Drive, Wilmington, New Castle County, DE 19808 U.S.A. Membership
interest 100%
GS & Cie Groupe S.A.S. 33/34 Quai de Dion-Bouton, 92800 Puteaux France Ordinary shares 100%
Willis Towers Watson (Düsseldorf) GmbH Habsburgerring 2, 50674 Köln Germany Ordinary shares 100%
Insurance broking entities
Willis Limited 51 Lime Street, London EC3M 7DQ England and Wales Ordinary shares 100%
Willis HRH, Inc. 200 Liberty Street, New York, NY 10281 U.S.A. Common shares 100%
Willis North America, Inc. 200 Liberty Street, New York, NY 10281 U.S.A. Common shares 100%
Willis Towers Watson Northeast, Inc. (formerly Willis of NewYork, Inc.)
200 Liberty Street, New York, NY 10281 U.S.A. Common shares 100%
Willis Re, Inc. 200 Liberty Street, New York, NY 10281 U.S.A. Common shares 100%
Gras Savoye S.A.S. 33/34 Quai de Dion-Bouton, 92800 Puteaux France Ordinary shares 100%
Miller Insurance Services LLP 70 Mark Lane, London, EC3R 7NQ England and Wales Membershipinterest 85%
Actuarial, consulting and benefit exchange companies
Willis Towers Watson US LLC 251 Little Falls Drive, Wilmington, New Castle County, DE 19808 U.S.A. Membershipinterest 100%
Towers Watson Limited Watson House, London Road, Reigate, Surrey, RH2 9PQ England and Wales Ordinary shares 100%
Extend Health LLC 251 Little Falls Drive, Wilmington, New Castle County, DE 19808 U.S.A. Membershipinterest 100%
MG LLC 251 Little Falls Drive, Wilmington, New Castle County, DE 19808 U.S.A. Membershipinterest 100%

(This page has been left blank intentionally)

significant


(This page has been left blank intentionally)

December 31, Note 2019 2018 (millions) NON-CURRENT ASSETS
Investments in subsidiaries 8 $ 7,782 $ 7,327 7,782 7,327 CURRENT ASSETS
Receivables 10 4,644 4,755 Cash at bank and in hand
4,644 4,755 CURRENT LIABILITIES
Payables 11 101 96 101 96 NET CURRENT ASSETS 4,543 4,659 TOTAL ASSETS LESS CURRENT LIABILITIES 12,325 11,986 NON-CURRENT LIABILITIES
Long-term debt 12 499 498 499 498 NET ASSETS $ 11,826 $ 11,488 EQUITY
Called up share capital 13 $ $ Share premium account 9,465 9,420 Other reserves 562 530 Profit and loss account (i) 1,799 1,538
$ 11,826 $ 11,488
/s/ Anna C. Catalano /s/ Director Director

Years ended December 31,2019 2018
(millions) CASH FLOWS FROM OPERATING ACTIVITIES Profit before tax $ 750 $ 632 Adjustments for:
Movement in other assets (397) (1,171) Movement in other liabilities (5) 2
Net cash provided by/(used in) operating activities 348 (537) CASH FLOWS FROM INVESTING ACTIVITIES
Proceeds, net of repayments, from intercompany investing activities 86 1,398 Net cash provided by investing activities 86 1,398
CASH FLOWS FROM FINANCING ACTIVITIES Repurchase of shares (150) (602) Proceeds from issuance of shares 45 45 Dividends paid (329) (306)
Net cash used in financing activities (434) (863 ) DECREASE IN CASH AND CASH EQUIVALENTS (2) CASH AND CASH EQUIVALENTS, BEGINNING OF YEAR 2 CASH AND CASH EQUIVALENTS, END OF YEAR (i) $ $

Share capital
Shareppremiumaccount
Profit and loss account
Otherreserves Total
(millions) At December 31, 2017 $ $ 9,375 $ 1,821 $ 503 $ 11,699
Shares repurchased (i) (602) (602) Net profit 632 632 Dividends paid and payable (313) (313) Issue of shares under employee share compensation plans 45 45 Share-based compensation and net settlements 27 27
At December 31, 2018 $ $ 9,420 $ 1,538 $ 530 $ 11,488 Shares repurchased (i) (150) (150) Net profit 750 750Dividends paid and payable (339) (339) Issue of shares under employee share compensation plans 45 45Share-based compensation and net settlements 32 32
At December 31, 2019 $ $ 9,465 $ 1,799 $ 562 $ 11,826 (i)


asset or financial liability to the gross carrying amount of a financial asset or to the amortised cost of afinancial liability

Financial InstrumentsRevenue From Contracts With Customers
Leases
Uncertainty over Income Tax Treatments Income Taxes
-
-
Annual Improvements to IFRS Standards 2015-2017 CycleIncome Taxes
that became effective for the Parent Company during the financial year t

Insurance Contracts
Amendments to References to the Conceptual Framework in IFRS Standards Amendments to IAS 1 and IAS 8: Definition of Material Amendments to IFRS 9, IAS 39 and IFRS 7: Interest Rate Benchmark ReformFF
Amendments to IFRS 3: Definition of a BusinessAmendments to IAS 1: Classification of Liabilities as Current or Non-Current
Impairment of investments in subsidiaries
Impairment of financial assets at amortized cost
Financial Instruments
Taxation

Year ended December 31, 2019 2018
(thousands) Audit of individual financial statements $ 12 $ 12 Other assurance services (i) 1,309 1,271 Tax advisory servicesOther non-audit services Total remuneration (ii) $ 1,321 $ 1,283 (i)
(ii)

Years ended December 31, 2019 2018
(millions) Analysis of tax charge for the year Current tax
Irish corporation tax on non-trading profit at 25% (2018: 25%) $ $ Current tax charge on profit on ordinary activities $ $
Factors affecting tax charge for the year The tax assessed for the year is lower than the standard rate of corporation tax on non-trading activities in Ireland (25%). The differences are explained below: Profit before taxation $ 750 $ 632 Profit multiplied by the standard rate of corporation tax on non-trading activities in Ireland of 25% $ 187 $ 158 Effects of:
Intercompany dividend income not taxable (196) (167) Non-deductible financing expenses 8 8 Disallowable expenditure 1 1Losses surrendered for nil consideration
Total current tax charge for the year $ $
Years ended December 31, 2019 2018 (millions) First interim payable April $ 85 $ 79 Second interim payable July 84 76 Third interim payable October 85 80 Fourth interim payable January (i) 85 78 Total dividends (i) (ii) (iii) $ 339 $ 313 (i)
(ii)
(iii)

Subsidiaryundertakings
(millions) Cost and carrying amount Balance at December 31, 2017 $ 6,079
Increase in investment in Willis Towers Watson Sub Holdings Unlimited Company by way of contribution 1,257 Share-based compensation (i) (9)
Balance at December 31, 2018 $ 7,327Increase in investment in Willis Towers Watson Sub Holdings Unlimited Company by way of contribution 423 Share-based compensation 32
Balance at December 31, 2019 $ 7,782 (i)

Indirect subsidiaries:
Holding companies
Trinity Acquisition plc 51 Lime Street, London EC3M 7DQ England and Wales Ordinary shares 100%
WTW Delaware Holdings LLC 251 Little Falls Drive, Wilmington, New Castle County, DE 19808 U.S.A. Membershipinterest 100%
Willis US Holding Company,LLC 251 Little Falls Drive, Wilmington, New Castle County, DE 19808 U.S.A. Membership
interest 100%
GS & Cie Groupe S.A.S. 33/34 Quai de Dion-Bouton, 92800 Puteaux France Ordinary shares 100%
Willis Towers Watson(Düsseldorf) GmbH Habsburgerring 2, 50674 Köln Germany Ordinary shares 100%
Insurance broking entities
Willis Limited 51 Lime Street, London EC3M 7DQ England and Wales Ordinary shares 100%
Willis HRH, Inc. 200 Liberty Street, New York, NY 10281 U.S.A. Common shares 100%
Willis North America, Inc. 200 Liberty Street, New York, NY 10281 U.S.A. Common shares 100%
Willis Towers Watson Northeast,Inc. (formerly Willis of New York, Inc.)
200 Liberty Street, New York, NY 10281 U.S.A. Common shares 100%
Willis Re, Inc. 200 Liberty Street, New York, NY 10281 U.S.A. Common shares 100%
Gras Savoye S.A.S. 33/34 Quai de Dion-Bouton, 92800 Puteaux France Ordinary shares 100%
Miller Insurance Services LLP 70 Mark Lane, London, EC3R 7NQ England and Wales Membershipinterest 85%
Actuarial, consulting and benefit exchange companies
Willis Towers Watson US LLC 251 Little Falls Drive, Wilmington, New Castle County, DE 19808 U.S.A. Membershipinterest 100%
Towers Watson Limited Watson House, London Road, Reigate, Surrey, RH2 9PQ England and Wales Ordinary shares 100%
Extend Health LLC 251 Little Falls Drive, Wilmington, New Castle County, DE 19808 U.S.A. Membershipinterest 100%
MG LLC 251 Little Falls Drive, Wilmington, New Castle County, DE 19808 U.S.A. Membershipinterest 100%

December 31, 2019 2018
(millions) Amounts due from subsidiary undertakings (i) $ 4,644 $ 4,755 Total debtors $ 4,644 $ 4,755
December 31, 2019 2018 (millions) Payables:
Accrued dividends payable (i) $ 93 $ 84 Accrued expenses 1 Interest payable 8 8 Other creditors 3
Total current liabilities (ii) $ 101 $ 96
December 31, 2019 2018 (millions) Long-term debt, net of debt issuance costs (i):
5.750% senior notes due 2021 $ 499 $ 498 Total non-current liabilities (ii) $ 499 $ 498
December 31, 2019 2018 Number (thousands)
Authorized share capital 40 40
Ordinary shares of $0.000304635 (i) (ii) 1,510,004 1,510,004 Preferred shares of $0.000115 1,000,000 1,000,000

December 31, 2019 2018
(thousands)Allotted, called up and fully paid 128,689,930 ordinary shares in 2019 of $0.000304635 each (2018: 128,921,530) (i) (ii) $ 39 $ 39 40,000 59 59 Balance at December 31 $ 98 $ 98
The following ended December 31, 2019:
Year ended
December 31, 2019 Shares repurchased 787,744 Average price per share $190.42 Aggregate repurchase cost (excluding broker costs) $150 million
Year Ended
December 31, 2019 Ordinary shares, $0.000304635 nominal value
Number of shares
Percentage of the called-up
sharecapital
Nominalvalue
(thousands)Number of
shares
Percentage of the share
class
Nominal value
(thousands)Balance at January 1, 2019 17,519 Under 0.01% $ 40,000 100% 40 Shares repurchased 787,744 Shares canceled (787,744) Balance at December 31, 2019 17,519 Under 0.01% $ 40,000 100% 40
Year ended December 31, 2019 2018 (millions)
Short-term employment benefits (Executive Director basic salary) $ 1 $ 1 Total remuneration of Key Management Personnel (i) $ 1 $ 1 (i)

Year ended December 31, 2019 2018
Balance at the end of
the financialyear
Transactionsin the
financialyear (i)
Balance at the end of
the financialyear
Transactionsin the
financialyear (i)
(millions) Willis Netherlands Holdings B.V. $ 4,088 (423) $ 4,511 $ (1,257) Willis Group Services Limited 445 312 133 (226) Other subsidiaries 111 111 36Total $ 4,644 (111) $ 4,755 $ (1,447) (i)


kMarket risk
kCredit risk

kLiquidity risk
Payments due byObligations Total 2020 2021
5.750% senior notes due 2021 $ 500 $ $ 500 Interest on senior notes 34 29 5 Total senior notes and related interest $ 534 $ 29 $ 505