Investor Presentation - Axis Bank
73
Investor Presentation Annual Results FY17-18 1 NSE: AXISBANK BSE: 532215 LSE (GDR): AXB
-
Upload
khangminh22 -
Category
Documents
-
view
2 -
download
0
Transcript of Investor Presentation - Axis Bank

Investor Presentation
Annual Results FY17-18
1 NSE: AXISBANK BSE: 532215 LSE (GDR): AXB

Except for the historical information contained herein, statements in this release which
contain words or phrases such as “will”, “aim”, “will likely result”, “would”, “believe”, “may”,
“expect”, “will continue”, “anticipate”, “estimate”, “intend”, “plan”, “contemplate”, “seek to”,
“future”, “objective”, “goal”, “strategy”, “philosophy”, “project”, “should”, “will pursue” and
similar expressions or variations of such expressions may constitute "forward-looking
statements". These forward-looking statements involve a number of risks, uncertainties and
other factors that could cause actual results to differ materially from those suggested by the
forward-looking statements. These risks and uncertainties include, but are not limited to
our ability to successfully implement our strategy, future levels of non-performing loans,
our growth and expansion, the adequacy of our allowance for credit losses, our provisioning
policies, technological changes, investment income, cash flow projections, our exposure to
market risks as well as other risks. Axis Bank Limited undertakes no obligation to update
forward-looking statements to reflect events or circumstances after the date thereof.
Safe Harbor
2

Investor Presentation - Annual Results FY17-18
o This investor presentation is being uploaded on the website of the Bank on 16th May 2018 post approval of consolidated financial results of the Bank for the year ended 31st March 2018
o This presentation includes slides on subsidiaries performance (Refer Slides 61 to 67)
o All other slides in this presentation are same as the slides contained in the investor presentation for Annual Results FY17-18 uploaded by the Bank on its website earlier on 26th April 2018 post declaration of the standalone financial results of the Bank for the year ended 31st March 2018
3

Major Highlights
o Asset Quality recognition cycle nearing an end, Bank significantly accelerated NPA recognition in Q4
• Most of the corporate slippages (90%) in Q4 came from disclosed BB & Below book • New guidelines for Resolution of Stressed Assets drove recognition in restructured book • Accelerated recognition in the Bank’s stressed Power sector loan book • Provision Coverage Ratio has been retained at high levels
o Capital Adequacy Ratio (CAR) remains healthy to support future growth
• CET 1 ratio stood at 11.68%
o Loan growth during the quarter was strong across all segments
• Retail, SME and Corporate loan book grew 23%, 19% and 12% YOY respectively • Retail and SME loans constituted 60% of total loans
o Strong Retail franchise continues to deliver • CASA grew 14% and constitutes 54% of the total deposits • Retail fees in FY18 grew 22% and constitutes almost 48% of the total fee income • Digital Payments continue to witness strong growth
o P&L performance impacted by high slippages and resultant provisions
• Net interest income growth restricted by high slippages • Healthy PCR levels strengthen the balance sheet
o Subsidiaries deliver steady performance • Total subsidiaries’ contribution to Bank’s consolidated profit after tax stood at `180 crores
4

48%
54%
Snapshot (As on March 31, 2018) (in `Crores)
Total Assets 691,330
Net Advances 439,650
Total Deposits 453,623
Net Profit/(Loss) (Q4/FY18) (2,189) / 276
Shareholders’ Funds 63,445
Diluted EPS* (in `) (Q4/FY18) (34.52) / 1.12
Book Value per share (in `) 247
ROA* (in %) (Q4/FY18) (1.31) / 0.04
ROE* (in %) (Q4/FY18) (15.28) / 0.53
Net NPA Ratio 3.40%
Basel III Tier I CAR 13.04%
Basel III Total CAR 16.57%
Branches1 3,703
International Presence2 10
ATMs 13,814
CASA 18% YOY (CDAB*) 14% YOY (End balance)
SA
Deposits 9% YOY
47%
Retail Advances
23% YOY
Retail Fee Income
22% YOY
Fee Income (FY18) 12% YOY
Advances 18% YOY
Key Metrics for Q4FY18 & FY18
5
3,679
276
FY17 FY18
Net Profit 93% YOY
1 Includes extension counters 2 Includes overseas subsidiary in UK
* Annualized
All figures in ` Crores unless stated
16% YOY (CDAB*) 18% YOY (End balance)
*CDAB – Cumulative Daily Average Balance

Financial Highlights 6
Business Segment performance 20
Asset Quality 48
Shareholder Returns and Capital Position 57
Subsidiaries’ Performance 61
Other important information 68

10%
12%
16%
21%
18%
Mar-17 Jun-17 Sep-17 Dec-17 Mar-18
Advances
Loan growth momentum remains strong
11% 11%
13%
11%
15%
Mar-17 Jun-17 Sep-17 Dec-17 Mar-18
Total Assets
7
All figures represent YOY growth

Low Cost Deposit growth remains healthy
19%
22% 21%
11%
18%
24%
22% 22%
18%
16%
Mar-17 Jun-17 Sep-17 Dec-17 Mar-18
Savings Bank Deposits
End Balance CDAB*
All figures represent YOY growth
8
37%
30%
28%
21%
10%
22%
29%
29%
26%
23%
Mar-17 Jun-17 Sep-17 Dec-17 Mar-18
Current Account Deposits
End balance CDAB*
*CDAB – Cumulative Daily Average Balance

126,048 122,010 130,265 131,219 148,202
87,002 71,573
79,792 70,492
95,650
213,050 193,583
210,057 201,711
243,852
Mar-17 Jun-17 Sep-17 Dec-17 Mar-18
CASA Deposits
Savings Account Current Account .
19% YOY
37% YOY
26% YOY
All figures in ` Crores
9
18% YOY
10% YOY
23% 24% 21%
18%
26% 25% 24%
14% 14%
Mar-17 Jun-17 Sep-17 Dec-17 Mar-18
Growth in CASA Deposits
CDAB End Balance
Base effect continues to influence Deposit growth
All figures represent YOY growth
14% YOY
*CDAB – Cumulative Daily Average Balance
YOY growth in Mar-17
YOY growth in Mar-18

51% 49% 50% 49% 54%
81% 83% 83% 84% 84%
Mar-17 Jun-17 Sep-17 Dec-17 Mar-18
Granular Deposits comprising CASA and Retail Term deposits form 84%
** as % of total deposits
CASA**
CASA+RTD**
All figures in ` Crores
Retail forms dominant share of deposits at the Bank
123,925 132,764 134,501 140,643 137,795
Mar-17 Jun-17 Sep-17 Dec-17 Mar-18
10
Retail Term Deposits
11% YOY

155,904 162,284 173,197 172,744 174,446
49,172 47,919 52,718 54,884 58,740
167,993 175,278 184,256 193,295
206,464
373,069 385,481
410,171 420,923
439,650
Mar-17 Jun-17 Sep-17 Dec-17 Mar-18
Corporate SME Retail
Loan Mix (As on March 31, 2018)
Retail and SME now form 60% of the Bank’s Loans All figures in ` Crores
Total Advances
Corporate 40%
SME 13%
Retail 47%
18% YOY
11

167,993
206,464
Mar-17 Mar-18
Retail Advances
49,172
58,740
Mar-17 Mar-18
SME Advances
155,904
174,446
Mar-17 Mar-18
Corporate Advances
Loan growth trend is now more balanced across all segments
All figures in ` Crores
12% YOY
12
23% YOY 19% YOY

2.13% 2.17% 2.17% 2.17% 2.17%
Q4FY17 Q1FY18 Q2FY18 Q3FY18 Q4FY18
Opex to Average Assets*
Trading income has contracted y-o-y; Opex ratio has been steady All figures in ` Crores
13
* annualized
4,729 4,616 4,540 4,732 4,730
2,585 2,176 2,208 2,393 2,573
428 824 377 200 215
7,742 7,616 7,125 7,325 7,519
Q4FY17 Q1FY18 Q2FY18 Q3FY18 Q4FY18
Operating Revenue
Net Interest Income Non-Interest Income (Excl. trading income) Trading Income
0% YOY
50% YOY
0% YOY
3% YOY

4,375 4,291
3,777 3,854 3,672
Q4FY17 Q1FY18 Q2FY18 Q3FY18 Q4FY18
Operating Profit and Operating Profit Margin*
3.01% 2.87%
2.39% 2.32% 2.20%
Operating Profit Margin
Core Operating Profit impacted by lower NII growth All figures in ` Crores
14
16% YOY
3,947
3,467 3,400 3,654
3,457
Q4FY17 Q1FY18 Q2FY18 Q3FY18 Q4FY18
Core Operating Profit ^
12% YOY
* annualized
^ computed as operating profit less trading profit

1,225 1,306
432
726
-2,189
Q4FY17 Q1FY18 Q2FY18 Q3FY18 Q4FY18
Net Profit
15
278% YOY
Earnings impacted by one time provisioning requirement

Domestic NIM has been stable q-o-q
5.42%
5.24% 5.18%
5.08% 5.11%
Q4FY17 Q1FY18 Q2FY18 Q3FY18 Q4FY18
Cost of Funds
3.83% 3.63%
3.45% 3.38% 3.33%
4.11% 3.85%
3.71% 3.60% 3.59%
Q4FY17 Q1FY18 Q2FY18 Q3FY18 Q4FY18
NIM - Global NIM - Domestic
16
FY18 NIM – 3.44%
Q4FY18 NIM – 3.33%

14% 14% 15% 16% 14% 14% 14% 14% 13%
17% 17% 17% 16% 15% 16% 17% 19% 20%
0% 4%
11% 18% 29%
36% 40%
43% 49%
69% 65%
57% 50%
42% 34% 29%
24% 18%
Foreign currency- floating* Fixed
MCLR linked Base Rate linked
About half of our advances have now migrated to MCLR. MCLR rate moved up by 15 bps in Q4
Advances mix by Rate type
* Libor linked
9.50
9.30 9.25 9.20 9.05
8.90
8.25 8.25 8.25 8.25 8.25 8.40
17
Trend in 1 year MCLR (%)
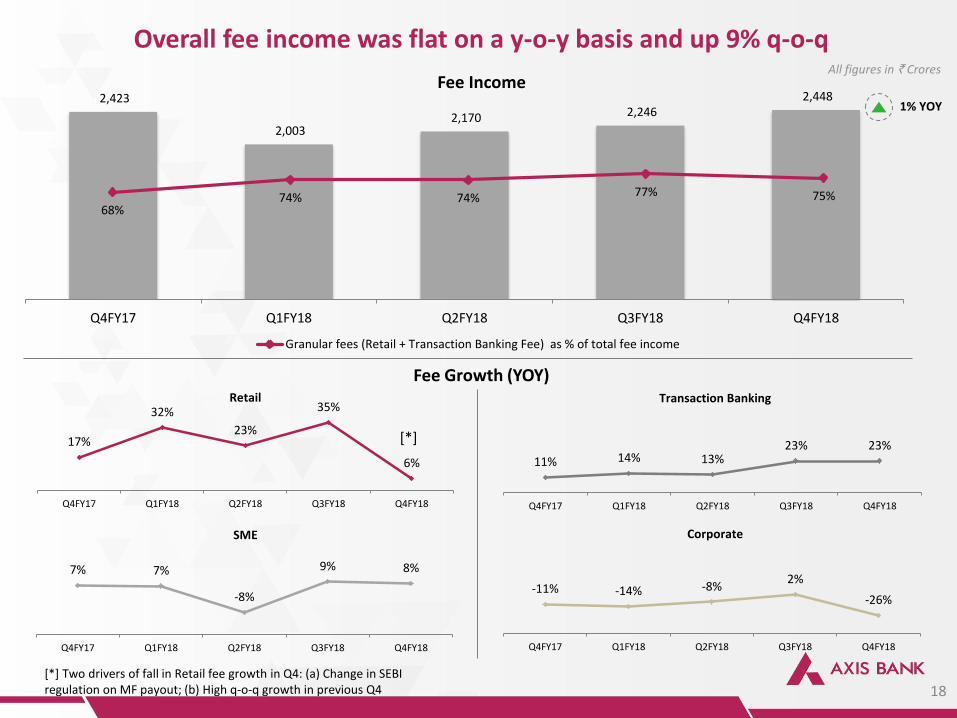
2,423
2,003 2,170 2,246
2,448
Q4FY17 Q1FY18 Q2FY18 Q3FY18 Q4FY18
Fee Income
68% 74% 74% 77% 75%
Granular fees (Retail + Transaction Banking Fee) as % of total fee income
Overall fee income was flat on a y-o-y basis and up 9% q-o-q
18
17%
32%
23%
35%
6%
Q4FY17 Q1FY18 Q2FY18 Q3FY18 Q4FY18
Retail
11% 14% 13% 23% 23%
Q4FY17 Q1FY18 Q2FY18 Q3FY18 Q4FY18
Transaction Banking
7% 7%
-8%
9% 8%
Q4FY17 Q1FY18 Q2FY18 Q3FY18 Q4FY18
SME
-11% -14% -8% 2%
-26%
Q4FY17 Q1FY18 Q2FY18 Q3FY18 Q4FY18
Corporate
Fee Growth (YOY)
All figures in ` Crores
1% YOY
[*]
[*] Two drivers of fall in Retail fee growth in Q4: (a) Change in SEBI regulation on MF payout; (b) High q-o-q growth in previous Q4
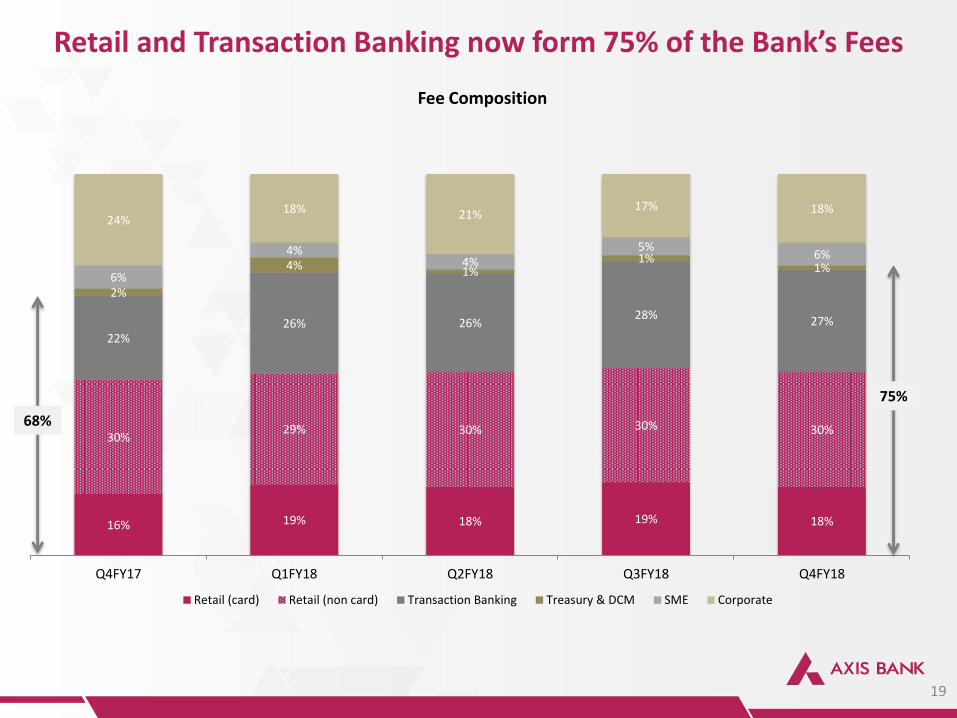
16% 19% 18% 19% 18%
30% 29% 30% 30% 30%
22% 26% 26%
28% 27%
2%
4% 1% 1%
1% 6%
4% 4%
5% 6%
24% 18% 21%
17% 18%
Q4FY17 Q1FY18 Q2FY18 Q3FY18 Q4FY18
Retail (card) Retail (non card) Transaction Banking Treasury & DCM SME Corporate
Retail and Transaction Banking now form 75% of the Bank’s Fees
19
Fee Composition
68%
75%

Business Segment performance
Asset Quality
Shareholder Returns and Capital Position
Subsidiaries’ Performance
Other important information
20
Financial Highlights

The Bank’s strengths revolve around four key themes
• Fast growing NBFC • Offers complimentary
product offerings to Bank customers
• Product offerings include Structured Financing, Special Situations Funding
• Fastest growing AMC since launch in ‘09
• More than 2.7mn client folios
• Has market share of ~ 3.35%
• Leading player in Investment banking
• Ranked no. 1 ECM Banker, executed equity deals worth over `1000 bn since April ’15
• Fastest growing equity broker in India
• Among top 3 brokers in India with cumulative client base of 1.84 mn
Offering full-service solutions to SME businesses
Best in class Retail Banking franchise
Partner of choice in Corporate Banking
State of the art products aided by cutting edge technology to
meet Payments solutions
…with subsidiaries complementing the strategy
21

Business Performance – Retail
22
• Retail Lending has shown strong growth with significant diversification in loan mix over time
• Our identified “new growth engines” continue to drive loan growth
• Analytics and internal customer sourcing are core to our strategy to drive Retail Assets growth
• Granular Retail Fees remain a major revenue driver
• Continue to pursue steady branch expansion strategy with focus on cost optimization
• Axis Bank ranks amongst the most valuable brands in India
Summary

65,497
88,028
111,932
138,521
167,993
206,464
Mar-13 Mar-14 Mar-15 Mar-16 Mar-17 Mar-18
26% CAGR*
33%
38% 40%
41%
45% 47%
Share of Retail Advances
54% 50% 48% 45% 44% 40%
18% 15%
16% 17% 16%
15%
11%
10% 8% 9% 10%
11%
6%
6% 7% 8% 8%
10%
6%
7% 7% 8% 8%
8%
2%
2% 2% 3% 4%
4% 1% 2% 3%
3% 9% 12% 9% 8% 9%
Mar-13 Mar-14 Mar-15 Mar-16 Mar-17 Mar-18
…with significant dispersion in mix over time
Home loans Rural lending Auto loans PL LAP CC SBB Others
Retail Loans form the largest part of the Bank book and are well diversified
* 5yr CAGR (FY13-FY18)
Retail Advances have shown strong growth…
23
Superior growth in Retail loan product distribution achieved by deepening business relationships within existing branches, coupled with expansion in new geographies, where the Bank already had seasoned branches.
This strategy was augmented by deep data analytics capabilities, used to identify, market to, and underwrite to the most appropriate pockets of our customer base.
PL – Personal Loan, SBB – Small Business Banking, LAP – Loan against Property, CC – Credit Cards
All figures in ` Crores

12%
18% 21%
27% 28%
41%
45%
62%
81%
Home Loan Rural LAP Auto Loan Gold Loan Credit Cards PL EL SBB
Our identified “new engines” continue to see disproportionate growth
23%
Growth in Retail book
New engines of growth
Sourcing Strategy 71% of sourcing in Q4 was from existing customers 51% of overall sourcing was through Bank branches
24
EL – Education Loan, PL – Personal Loan, SBB – Small Business Banking, LAP – Loan Against Property
Personal & Auto Loans Continuous traction driven through acquisition from digital channels and branches.

1,731
2,008
2,603
3,027
3,481
4,257
FY13 FY14 FY15 FY16 FY17 FY18
Retail Fees has shown strong growth
31%
32%
38% 40% 44%
48%
Share of Retail Fees Retail Fees
26% 27% 29% 34% 36% 38%
30% 33% 33%
29% 29% 25%
44% 40% 38% 37% 35% 37%
FY13 FY14 FY15 FY16 FY17 FY18
Card Fees has steadily grown over time in Retail Fee Mix
Cards MF & Insurance Distribution^ Others*
Granular Retail Fees have been a major revenue driver
25
(in ` Crores)
20% CAGR**
** 5yr CAGR (FY13-FY18)
^ Includes distribution fees of others like bonds, gold coins, etc * Includes other retail assets and liability products

24%
19%
20%
24%
13%
North East West South Central
Geographical distribution based on RBI classification
93
81
100 104 114
Q4FY17 Q1FY18 Q2FY18 Q3FY18 Q4FY18
New Branches Opened*
* Includes extension counters 26
Network expansion continues at a steady pace…
Why are we continuing to invest in Branches?
• India continues to be a growth economy
• New customer acquisition is a larger growth driver than deepening of existing customer wallet share
• Physical distribution continues to be central to new customer acquisition (even as transactions and cross-sell have shifted to Digital channels).
Very well distributed branch presence across regions and categories
30%
23%
30%
17%
Metro Urban Semi-Urban Rural
• Our network has been completely organic, built over last 24 years
• Total no of branches* as on 31st March 2018 stood at 3,703
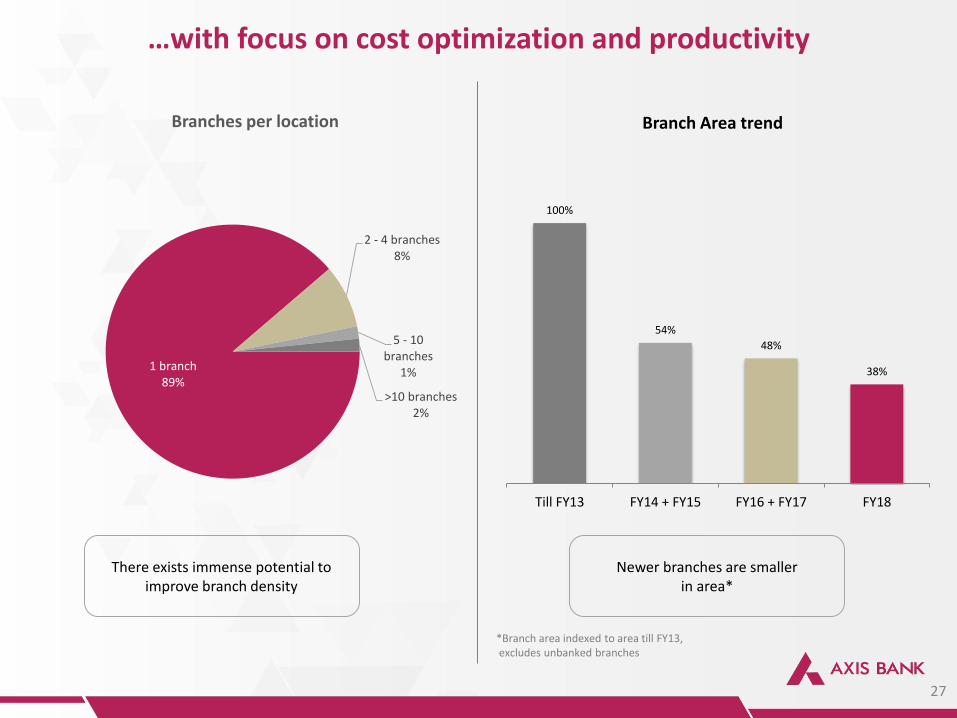
…with focus on cost optimization and productivity
27
*Branch area indexed to area till FY13, excludes unbanked branches
There exists immense potential to improve branch density
Newer branches are smaller in area*
100%
54%
48%
38%
Till FY13 FY14 + FY15 FY16 + FY17 FY18
Branch Area trend
1 branch 89%
2 - 4 branches 8%
5 - 10 branches
1%
>10 branches 2%
Branches per location

We have created a differentiated identity and are amongst the most valuable Brands in India
Amongst Top10 most valuable brands in India CII Awards 2016
• Customer Obsession
• Leveraging digital
transformation to
deliver superior
customer experience
Ranked #2 on Functionality in Forrester’s Mobile Banking Benchmark, 2017 (India Banks)
72 Axis Bank
56 India Avg.
65 Global Avg.
Global Ranking 20 in 2017 vs. 37 in 2016
28

Business Performance – Digital Payments
29
• Digital Payments are a key strategic thrust for the Bank
• We have a strong position across most digital payment products
• We are among the top 4 in Cards business, that continues to grow strongly
• We rank amongst the top 3 players in Mobile Banking spends and volumes
• Our customers continue to move their transactions to digital channels
• The Bank has emerged as a leading partnership-driven innovator on payments used cases
• Post acquisition activities at Freecharge remain on track
Summary

We have strong market position across most Digital Payment products
2nd 4th 4th
7% 16% 12% 16% 17% Market share
Point of Sale Terminals ^
Credit Cards2
Debit Cards1
Mobile Banking3
UPI4
Product
Ranking
1 – based on card spends at point of sale terminals ; 2 – based on cards issued (RBI Feb. 2018 data) ^ Feb 2018 data 3 – based on value (RBI Nov. 2017 data), 4 – ranking data (Q4FY18) on UPI not available from authenticated sources
Axis Bank Market Standing Across Products
Source: RBI, Internal Data
30
3rd
1st
47%
Forex Cards

8,551
9,520 9,915
11,725
13,167
Q4FY17 Q1FY18 Q2FY18 Q3FY18 Q4FY18
Trends in Spends for Credit Cards in force
8,606 7,958 7,564
8,722 8,678
Trends in Spends for Debit Cards in force
3.3 3.5 3.8
4.2 4.5
Card Spends continue to show strong growth
54% YOY
31
1% YOY*
20.2
20.9
21.5
22.1 22.3
Q4FY17 Q1FY18 Q2FY18 Q3FY18 Q4FY18
All figures in ` Crores
Credit Cards in force (mn) Debit Cards in force (mn)
11% YOY
34% YOY
* Debit Card spends saw demonetization-led growth of 149% YOY in Q4FY17

8.7%
15.9%
15.9%
19.8%
HDFC Bank
Axis Bank
ICICI Bank
State Bank of India
Mobile Transactions Market Share by Value
36,745 37,536 41,394
51,030
62,775
Q4FY17 Q1FY18 Q2FY18 Q3FY18 Q4FY18
33.2 31.4
38.7
99.8
85.7
Mobile transaction volumes (in mn)
32
We are amongst the top players in Mobile banking spends and volumes
Source: RBI data, November 2017
71% YOY
(in ` Crores)
Axis Bank
158% YOY
Mobile Banking volume continue to remain strong led by UPI
Axis Bank Mobile Banking Spends and Volumes

66% 67% 65% 66% 66%
21% 23%
26% 26% 26%
13% 10% 9% 8%
8%
Q4FY17 Q1FY18 Q2FY18 Q3FY18 Q4FY18
Transaction Mix* Digital
ATM
Branches
Adoption of digital channels remains robust
* Based on all financial transactions by individual customers
33

83
70 69 71 70 77 76
47
77 83 81
84 86 90
Q2FY17 Q3FY17 Q4FY17 Q1FY18 Q2FY18 Q3FY18 Q4FY18
ATM Credit & Debit Cards (POS & E-Com)
Our customers continue to move their transactions to digital channels
34
Digital transactions continue to outpace ATM transactions
(Volumes in Million)
During the quarter….. 58% of Bank’s active customers are Digitally active 42% of Mobile Banking customers bank only on Mobile App Mobile Banking logins stand at 6.5 times of Internet Banking logins

Analytics on Payment data has enabled cross-selling of financial and investment products
Investments in analytics have helped build and sustain this strong position
35
Cross-sell metrics remain healthy aided by big data led analytics of the known retail customer base
81% 79% 78% 76% 74%
74% 73% 73% 72% 71%
97% 97% 97% 96% 97%
Q4FY17 Q1FY18 Q2FY18 Q3FY18 Q4FY18
Sourcing from internal customers
Personal Loans Entire Retail book Credit Cards
Lending Deposits & Investments
Risk Management
Payments at the core

We are leveraging UPI to attract non-Axis Bank customers and broadbase payments
36
~870 Mn Debit Cards User Base
~300 Mn Smartphone
User Base
~150 Mn Potential UPI
User Base1
10%
650 Mn by 2020
1) Assumption 50% of Smartphone base. * A customer registering once in Axis Pay and once in Google Tez is counted as one user and not 2. #Debit transactions for Axis Pay, Axis MB UPI, Samsung Pay, Google Tez, Merchant transactions and fulfilment transactions from Tez have been considered.
Unified Payments Interface (UPI)… …Is a huge opportunity For Axis Bank
India’s innovation to the Payments world
Axis Bank’s Progress So Far
1 2 Over 13.95 mn registered base* Over 190 mn transactions# 3 Over 16,150 merchants on boarded
Is for
Any Banked Customer
With a Smartphone
Analytics
With a Unique Identifier: As simple as an email
address (Example: ajay@axisbank)
Payments Transactions
Source: BCG – Google Digital Payments 2020 Report July 2016
Customer Product Penetration

KMRL Axis Bank ‘Kochi1’ Card
Axis Bank BMTC Smart Card
Ripple-powered Instant Payment Services
• Automated Fare Collection system
• 1st time “open loop” smart cards used in metro
• India's first prepaid transit card with shopping at over 15 million merchant outlets
• Over 130,200+ cards issued till date
• Uses Ripple’s enterprise blockchain technology
• Makes international remittances faster and transparent for customers
The Bank has emerged as a leading partnership-driven innovator on payments used cases
37
• Enabled for Credit & Debit Card across Visa & Master Card
• 161,800+ registered cards in 13 months • Users added close to 0.87 million bank
accounts using @pingpay VPA
• Partnered with Amazon, BPCL, IOCL • 11.50 mn VPAs* across apps • 190.38 mn UPI transactions^ across
apps till date
• No internet connectivity required
• Available in 6 languages • Get balance and recharge
Samsung Pay Axis Pay UPI Axis OK
*VPAs created using Axis Pay, Axis MB UPI, Axis UPI SDKs, Samsung Pay and Google Tez ^ Debit transactions for Axis Pay, Axis MB UPI, Samsung Pay, Google Tez, Merchant transactions anf fulfillment transactions from Tez have been considered KMRL - Kochi Metro Rail Corporation , BMTC - Bangalore Metropolitan Transport Corporation

o Spends per user 12% o Platform engagement ^ 68% o App installation 45%
o Total Payments Volumes 36% o Monthly Active Users 44% o Transaction volumes 24%
38
The acquisition of Freecharge can potentially leapfrog our digital journey by multiple years
Through we intend to…
Leverage Payments as a Hook (UPI, QR
etc)
Target digitally-native, mobile-first SA
customers
Source and service loans (PL, Cards, Consumer
Loans) digitally
Post acquisition activities remain on track
Focused campaigns have helped to improve all top line metrics since acquisition*
* The growth numbers are for period Oct’17 to Mar’18 ^ Defined as percentage increase in unique visitors

Business Performance - SME
39
• SME loan growth continues to improve further
• Focus remains on building a high rated SME Book
Summary

10% 10%
15%
27%
19%
YOY Growth
49,172 47,918 52,718 54,884 58,740
Mar-17 Jun-17 Sep-17 Dec-17 Mar-18
10,327 13,264
38,846
45,476
49,172
58,740
Mar-17 Mar-18
Term loan Working Capital loan
40
SME Loan growth
• Our SME business is divided into 3 business verticals: Medium Enterprises Group (MEG), Small Enterprises Group
(SEG) and Supply Chain Finance (SCF)
• The Bank extends Working Capital, Term Loan, Trade Finance, Bill / Invoice Discounting and Project Finance
facilities to SMEs.
SME loan growth continues to improve, partly aided by a low base
Loan Mix
17% YOY
19% YOY
28% YOY
All figures in ` Crores

Focus remains on building a high rated SME book
41
5% 6% 9% 6%
66% 66%
14% 16%
6% 6%
Mar-17 Mar-18
SME 1 SME 2 SME 3 SME 4 SME 5-7
88% of SME exposure* is rated at least ‘SME3’
* Only includes standard exposure
• Our SME segment continues to focus towards lending to the Priority sector.
• The Bank’ s SME Awards event “SME 100” acknowledges the best performers in the SME segment. It is aligned with the Government’s Make in India, Skill India and Digital India initiatives.
• The Bank’s 4th edition of SME Knowledge Series ‘Evolve’ brought forward owners of successful family businesses to share managerial insights that can help SMEs
5% 5% 6% 5% 8% 9% 9% 8%
66% 66% 64% 65%
14% 14% 14% 15%
7% 6% 7% 6%
Dec-16 Mar-17 Jun-17 Sep-17 Dec-17
SME 1 SME 2 SME 3 SME 4 SME 5-7
• This rating distribution excludes NPA exposure as on previous quarter.
• Do we have to disclose this and mark asterisk.

Business Performance - Corporate
42
• Rebound in Corporate loan growth driven by domestic working capital loans
• Continued increase in share of transaction banking revenues
• Significant reduction in concentration risk with incremental sanctions to better rated corporates
• Leadership in DCM places us well to benefit from vibrant corporate bond markets
Summary

Corporate loan growth driven by Working Capital loans…
43
121,572 118,418
34,332 56,028
155,904
174,446
Mar-17 Mar-18
Term loan Working Capital loan
63% YOY
3%
6%
10%
15% 15%
-6% -7%
9%
3% 4%
Q4FY17 Q1FY18 Q2FY18 Q3FY18 Q4FY18
Domestic advances Overseas advances
Working Capital loan growth has been strong Trend in domestic and overseas corporate loan growth (YOY)
12% YOY
3% YOY
All figures in ` Crores

10% 5%
22%
18%
31%
30%
25%
34%
12% 13%
Mar-17 Mar-18
BB or below BBB A AA AAA
541 530 568 633 665
577
361
447 372
429
Q4FY17 Q1FY18 Q2FY18 Q3FY18 Q4FY18
Steady growth in Transaction Banking fees
Transaction Banking Fee Corporate Credit Fee
…resulting in higher transaction based business to better rated corporates
All figures in ` Crores
44
77% of corporate exposure* is rated ‘A’ or better
* Only includes standard exposure
23% YOY
26% YOY

68%
74%
81% 79% 79%
85% 86%
FY12 FY13 FY14 FY15 FY16 FY17 FY18
Percentage of sanctions rated A- & above
Significant reduction in concentration risk with incremental sanctions to better rated corporates
Concentration Risk is reducing Incremental sanctions have been to better rated corporates
287%
209%
155% 154% 162%
142%
124% 121%
Mar-11 Mar-12 Mar-13 Mar-14 Mar-15 Mar-16 Mar-17 Mar-18
45
Exposure to Top 20 single borrowers as a % of Tier I Capital

Rank Outstanding1 as on Mar. 2018
Sectors
Fund-based Exposure Non-fund based Exposure Total Exposure
Value (in % terms) Value (in % terms) Value (in % terms)
1. Financial Companies2 40,428 9.62% 17,087 15.77% 57,515 10.22%
2. Engineering & Electronics 11,244 2.68% 23,922 22.08% 35,166 6.25%
3. Infrastructure Construction3 12,214 2.91% 11,510 10.63% 23,724 4.21%
4. Petroleum & Petroleum Products 5,207 1.24% 13,412 12.38% 18,619 3.31%
5. Trade 13,647 3.25% 3,425 3.16% 17,072 3.03%
6. Real Estate 14,180 3.37% 983 0.91% 15,163 2.69%
7. Power Generation & Distribution 9,776 2.33% 4,405 4.07% 14,181 2.52%
8. Telecommunication Services 5,437 1.29% 8,732 8.06% 14,169 2.52%
9. Food Processing 11,651 2.77% 1,560 1.44% 13,211 2.35%
10. Other Metal & Metal Products 10,639 2.53% 2,081 1.92% 12,720 2.26%
1 Figures stated represent only standard fund and non-fund based outstanding across all loan segments 2 Includes Housing Finance Companies and other NBFCs 3 Financing of projects (roads, ports, airports, etc.)
2.9% 2.7% 2.6% 2.5%
2.0%
5.1% 5.2% 4.4%
4.0%
2.5%
Mar-17 Jun-17 Sep-17 Dec-17 Mar-18
Iron & Steel Power
46
Concentration1 to stressed sectors
Concentration to stressed sectors has declined All figures in ` Crores

We remain well placed to benefit from a vibrant Corporate Bond market
Placement & Syndication of Debt Issues
Acted as arranger for some of the major PSUs and
Corporates during the quarter.
Ranked No. 1 arranger for rupee denominated bonds
as per Bloomberg for calendar year ended 2017 and
for quarter ended March 2018.
Ranked No. 1 arranger for rupee denominated bonds
as per Bloomberg for 11 consecutive years now
Ranked No. 1 mobilizer as per PRIME Database for
nine months ended December 2017.
Bank has been honoured with “Best Bond Adviser –
Domestic, India” at The Asset Triple A Country Awards
2017
All figures in ` Crores
62,043
74,887
Q4FY17 Q4FY18
47
17.24%
32.55%
Q4FY17 Q4FY18
Market share and Rank*
*As per Bloomberg League Table for India Bonds
1st 1st
21% YOY 199,620 189,104
FY17 FY18
5% YOY
19.60% 20.29%
CY16 CY17
1st 1st

Financial Highlights
Business Segment performance
Asset Quality
Shareholder Returns and Capital Position
Subsidiaries’ Performance
Other important information
48

49
Summary of Asset Quality position – Mar 2018
• We significantly accelerated NPA recognition in the corporate lending book in Q4
• Most of the slippages (90%) came from the disclosed BB & Below pool
• The vulnerable (BB & Below) pool reduced by 44% during the quarter, to Rs. 8,994 crores: 1.8% of gross customer assets
• BB & Below % is now 1/4th of what it was at its peak
• We have continued to maintain high levels of provision coverage
• With a much smaller pool of potential stress and high provision coverage to start FY19, we continue to expect credit cost normalization in H2 FY19

Slippages accelerated significantly in Q4. A large part of the stress in Power sector was recognized as NPA.
50
4,210
2,008
3,213
7,888
420
13,135
4,560 4,811
3,519
8,936
4,428
16,536
Q3 FY17 Q4 FY17 Q1 FY18 Q2 FY18 Q3 FY18 Q4 FY18
Net Slippages Gross Slippages
Net Slippage
Gross Slippage
Slippages were significantly accelerated in the quarter … … with most of the slippage coming from the Power sector
Corporate slippage in Q4, by sector
*Total FB Outstanding (non NPA) in Power sector remaining is Rs.9,776 crores. Of this, 29% is rated BB & Below and 35% is rated BBB.
6%
1%
1%
2%
2%
2%
3%
3%
4%
4%
5%
6%
6%
14%
41%
Others
Chemicals & Chemical Products
Other Metal and Metal Products
Telecommunication Services
Hotels
IT & ITES
Cement & Cement Products
Gems & Jewellery
Real Estate
Financial Companies
Iron and Steel
Textiles
Engineering & Electronics
Infrastructure Construction
Power Generation & Distribution

New NPA formation in corporate lending continued to be from the disclosed BB & Below pool, due to which …
51
Proportion of Corporate slippages from BB & Below
98% 94%
90% 91%
73% 73%
93% 90%
0%
20%
40%
60%
80%
100%
120%
Q1FY 17 Q2FY 17 Q3FY 17 Q4FY 17 Q1FY 18 Q2FY 18 Q3FY 18 Q4FY 18

12,492 11,764 10,422 9,905 9,645 7,390 6,985 2,065
3.3% 3.0%
2.7% 2.3% 2.2%
1.6% 1.5%
0.4%
0.0 %
1.0 %
2.0 %
3.0 %
4.0 %
5.0 %
6.0 %
7.0 %
8.0 %
-
5,00 0
10,0 00
15,0 00
20,0 00
25,0 00
30,0 00
Q1FY17 Q2FY17 Q3FY17 Q4FY17 Q1FY18 Q2FY18 Q3FY18 Q4FY18
27,411 21,929 20,788 19,685 19,460 15,815 16,120 8,994
7.3%
5.6% 5.3%
4.7% 4.4%
3.4% 3.4%
1.8%
0.0%
1.0%
2.0%
3.0%
4.0%
5.0%
6.0%
7.0%
8.0%
0
5000
10000
15000
20000
25000
30000
Q1FY17 Q2FY17 Q3FY17 Q4FY17 Q1FY18 Q2FY18 Q3FY18 Q4FY18
As a % to Gross Customer Assets
… The pool of vulnerable assets has reduced significantly
All figures in ` Crores
Outstanding under restructuring dispensations*
Low Rated Corporate portfolio (BB and Below)
Size of ‘BB and Below’ portfolio reflects cumulative impact of Rating Upgrades / Downgrades and Slippages from the pool.
52 * Includes Restructured Corporate Accounts, SDR, S4A, 5:25, etc

Q4FY16 Q1FY17 Q2FY17 Q3FY17 Q4FY17 Q1FY18 Q2FY18 Q3FY18 Q4FY18
Net Customer Assets (NCA) 3,59,741 3,70,526 3,83,987 3,79,853 4,09,708 4,25,355 4,50,854 4,60,164 4,87,979
Stress already recognized as NPA
Gross NPA 6,088 9,553 16,379 20,467 21,280 22,031 27,402 25,001 34,249
Provisions held (incl FITL) 3,565 5,543 8,618 12,172 12,654 12,265 13,350 13,231 17,657
Net NPA 2,522 4,010 7,761 8,295 8,627 9,766 14,052 11,769 16,592
Net NPA % 0.7% 1.1% 2.0% 2.2% 2.1% 2.3% 3.1% 2.6% 3.4%
Vulnerable pool in non-NPA book
BB & Below Advances 19,412 27,411 21,930 20,788 19,685 19,460 15,815 16,120 8,994
Watch List 22,628 20,295 13,789 11,091 9,436 7,941 6,052 5,309 428
Corporate Restructured Advances 8,479 7,665 6,883 6,242 5,489 5,487 3,860 3,525 1,081
SDR / S4A / 5-25 Advances 4,189 5,263 5,158 4,351 4,609 4,972 5,277 5,288 1,089
Total (adjusted for overlaps) 30,392 33,468 26,858 23,545 20,761 21,560 17,442 17,457 9,106
Provisions held 525 568 679 614 835 747 884 825 245
Net Outstanding 29,866 32,901 26,180 22,931 19,926 20,813 16,558 16,632 8,861
Non-NPA Stress (% of Customer Assets) 8.3% 8.9% 6.8% 6.0% 4.9% 4.9% 3.7% 3.6% 1.8%
53
Vulnerable pool in the non-NPA portfolio has reduced to 1/5th of its peak level All figures in ` Crores

Net NPA + Net Restructured assets ratio remains stable
5.04% 5.03%
5.90%
5.28%
6.77%
2.11% 2.30%
3.12%
2.56%
3.40%
Mar-17 Jun-17 Sep-17 Dec-17 Mar-18
GNPA% NNPA%
54
Gross and Net NPA ratio
2.11% 2.30%
3.12%
2.56%
3.40%
1.32% 1.25%
0.84%
0.76%
0.22%
Mar-17 Jun-17 Sep-17 Dec-17 Mar-18
NNPA% Net Restructured Assets %
Net NPA + Net Restructured Assets ratio

60%
64% 65% 65%
60%
66% 65%
Sep-16 Dec-16 Mar-17 Jun-17 Sep-17 Dec-17 Mar-18
Provision Coverage Ratio
4.09%
3.61%
1.73%
1.95%
3.16%
2.33%
6.73%
Q2FY17 Q3FY17 Q4FY17 Q1FY18 Q2FY18 Q3FY18 Q4FY18
Credit Cost (Annualised)
We have retained high Provision Coverage during the quarter
55
PCR to be maintained in the 60-65% range

1.11%
2.30%
0.02%
0.50%
0.21%
0.61%
0.99%
1.35%
0.70% 0.54% 0.61% 0.62% 0.61%
1.11%
2.82%
3.57%
FY03 FY04 FY05 FY06 FY07 FY08 FY09 FY10 FY11 FY12 FY13 FY14 FY15 FY16 FY17 FY18
Trend in Credit Cost : FY03 to FY18
Our long term average credit cost has been ~110 bps
Long Term Average* = 110 bps
* For the period from FY03 to FY18
56
We continue to expect normalization in credit costs by the second half of FY19

Financial Highlights
Business Segment performance
Asset Quality
Shareholder Returns and Capital Position
Subsidiaries’ Performance
Other important information
57

Shareholder return metrics have seen moderation
58
1.78 1.83 1.72
0.65
0.04
FY14 FY15 FY16 FY17 FY18
Return on Assets (in %)
18.23 18.57 17.49
7.22
0.53
FY14 FY15 FY16 FY17 FY18
Return on Equity (in %)
26.45
30.85
34.93
15.34
1.12
FY14 FY15 FY16 FY17 FY18
Diluted EPS (`)
163 188
223 233 247
Mar-14 Mar-15 Mar-16 Mar-17 Mar-18
Book Value Per Share (`)

Capital Ratios remain healthy to pursue growth opportunities
11.87% 12.60% 12.36% 14.13%
13.04%
3.08%
# 4.03%
3.96%
3.87%
3.53%
14.95%
16.63% 16.32%
18.00%
16.57%
Mar-17 Jun-17* Sep-17* Dec-17* Mar-18
Tier 1 CAR Tier 2 CAR CET1
~ Includes capital raise of `8,680 crores through preferential allotment in Q3FY18 * including unaudited Net Profit for the quarter / half year / nine-months # includes the impact of `3,500 crores and `5,000 crores mobilized through issuance of AT1 bonds and subordinated debt, respectively
Trend in Capital Adequacy Ratio
59
11.13% 12.71% 10.95% 11.15% 11.68%
79% 80%
78% 77% 75%
Mar-17 Jun-17 Sep-17 Dec-17 Mar-18
RWA to Total Assets
162 bps YOY
~
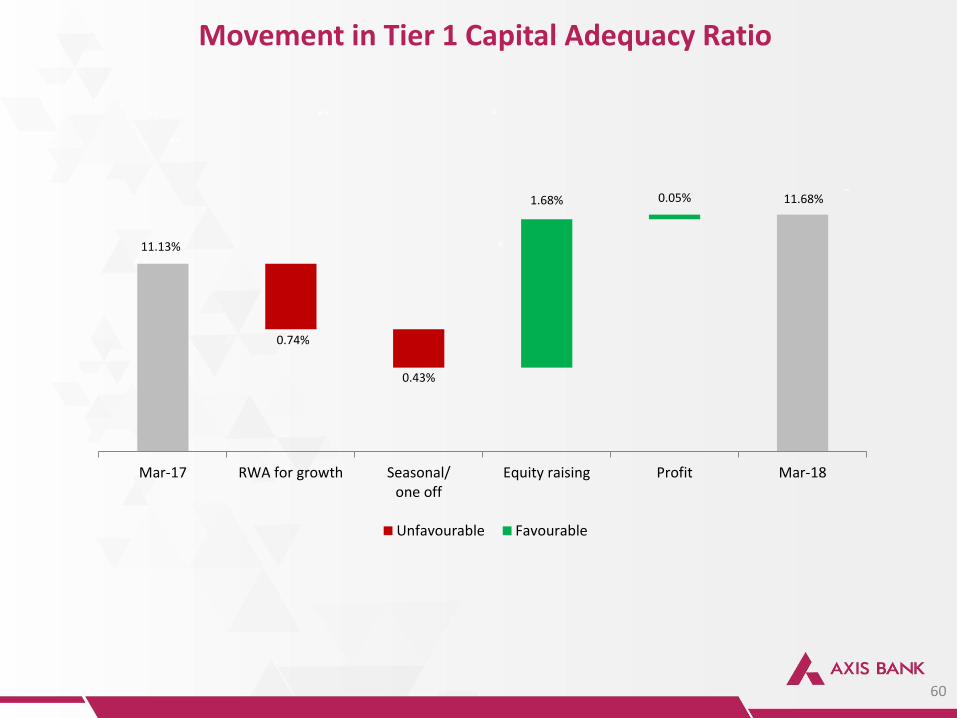
Movement in Tier 1 Capital Adequacy Ratio
60
**
**
#
# **
~
11.13%
11.68%
0.74%
0.43%
1.68% 0.05%
Mar-17 RWA for growth Seasonal/one off
Equity raising Profit Mar-18
Unfavourable Favourable

Financial Highlights
Business Segment performance
Asset Quality
Shareholder Returns and Capital Position
Subsidiaries’ Performance
Other important information
61

62
Key Subsidiaries’ Performance - FY18 PAT
100% 100% 100% 75%
`209 Cr
27%
` 139 Cr
23%
` 60 Cr
15%
` 43 Cr
24%
Holding of the Bank %
76
224
373
575
722
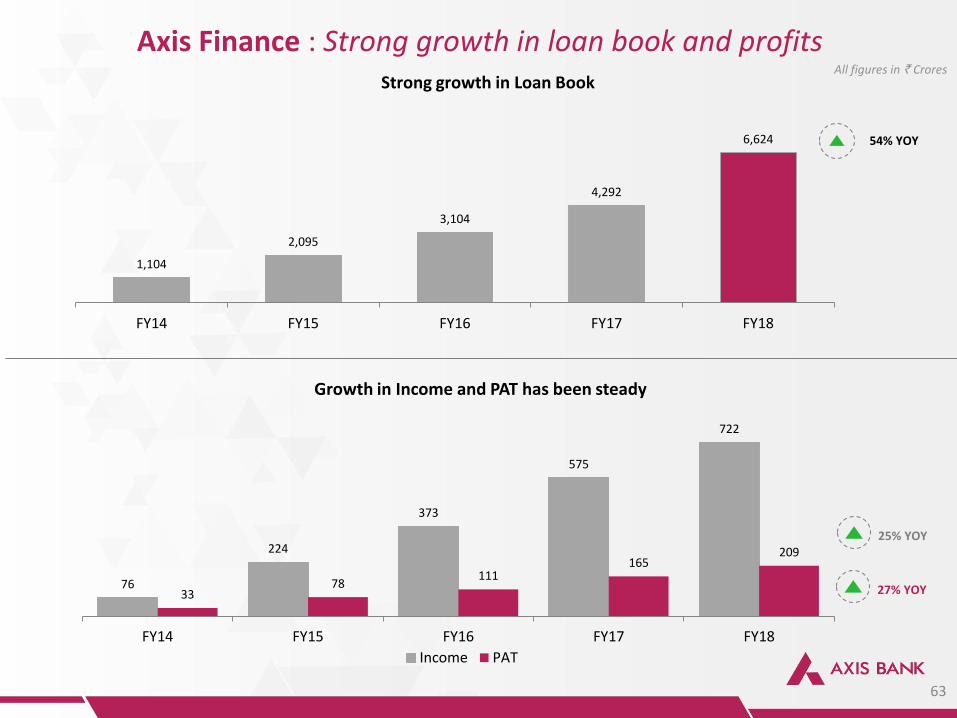
33 78
111 165
209
FY14 FY15 FY16 FY17 FY18
Income PAT
27% YOY
1,104
2,095
3,104
4,292
6,624
FY14 FY15 FY16 FY17 FY18
Strong growth in Loan Book
Axis Finance : Strong growth in loan book and profits All figures in ` Crores
54% YOY
Growth in Income and PAT has been steady
63
25% YOY

289 309 319
402
108 128 113
139
FY15 FY16 FY17 FY18Revenue from Operations PAT
23% YOY
Axis Capital : Continues to maintain its leadership position All figures in ` Crores
Trend in Income and PAT
64
26% YOY
Rank Banker No of deals
1 Axis Capital 19
2 Edelweiss 12
3 SBI Caps 12
4 ICICI Securities 11
5 IIFL Holdings 10
Rank Banker No of deals
1 Axis Capital 31
2 SBI Caps 29
3 ICICI Securities 26
4 Kotak Mahindra 25
5 Edelweiss 20
FY18 Ranking - based on IPO FY18 Ranking based on IPO, QIP, Rights, OFS & IPP
Source: Primedatabase

14
44
36
52
60
FY14 FY15 FY16 FY17 FY18
15% YOY
0.44
0.68
1.00
1.39
1.84
FY14 FY15 FY16 FY17 FY18
All figures in ` Crores
33% YOY
Trend in PAT
65
Trend in customer base
Axis Securities : Significant growth in customer additions
(in mn)

2
8
32
57
43
FY14 FY15 FY16 FY17 FY18
13,939
23,483
33,163
48,829
70,902
FY14 FY15 FY16 FY17 FY18
Average AUM has shown strong growth
Axis AMC : Consistently gaining market share All figures in ` Crores
45% YOY
Trend in PAT
66
24% YOY
* Total income has grown 42% YOY. PAT has declined YOY on account of lower tax expense in earlier years due to availment of Minimum Alternate Tax (MAT) credit
*

A.TReDs: The Invoicemart product continues to be a market leader
Axis Bank was one of the three entities allowed by RBI to set up the Trade Receivables Discounting System (TReDS), an electronic platform for facilitating cash flows for MSMEs TReDS is an electronic platform that connects MSME sellers with buyers and financiers Our digital invoice discounting platform ‘Invoicemart’ continues to be India’s leading TReDS platform with market share of nearly 43% Invoicemart was the first TReDS exchange to reach INR 100 crore in financed throughput, and reached the milestone within just 100 days of starting operations
10 Financiers on-boarded on the platform
Progress so far
Throughput
` 410 cr +
No. of Invoices Discounted
~14,300
67
Participants
350+

Financial Highlights
Business Segment performance
Asset Quality
Shareholder Returns and Capital Position
Subsidiaries’ Performance
Other important information
68

Treasury Portfolio and Non-SLR Corporate Bonds
Investment Bifurcation Book Value* (` Crores)
Government Securities1 104,053
Corporate Bonds2 30,863
Others 18,960
Total Investments 153,876
Category Proportion
Held Till Maturity (HTM) 59%
Available For Sale (AFS) 30%
Held For Trading (HFT) 11%
* as on Mar 31, 2018 1 85% classified under HTM category 2 79% classified under AFS category
5% 12%
3% 2% 4% 1% 7%
5% 3% 10%
7% 5% 12%
12%
41% 34%
30% 24% 22%
43% 44% 55% 57% 59%
Mar-17 Jun-17 Sep-17 Dec-17 Mar-18
93% of Corporate bonds* have rating of at least ‘A’
AAA AA A BBB <BBB or Unrated
3%
69 *Only includes standard investments
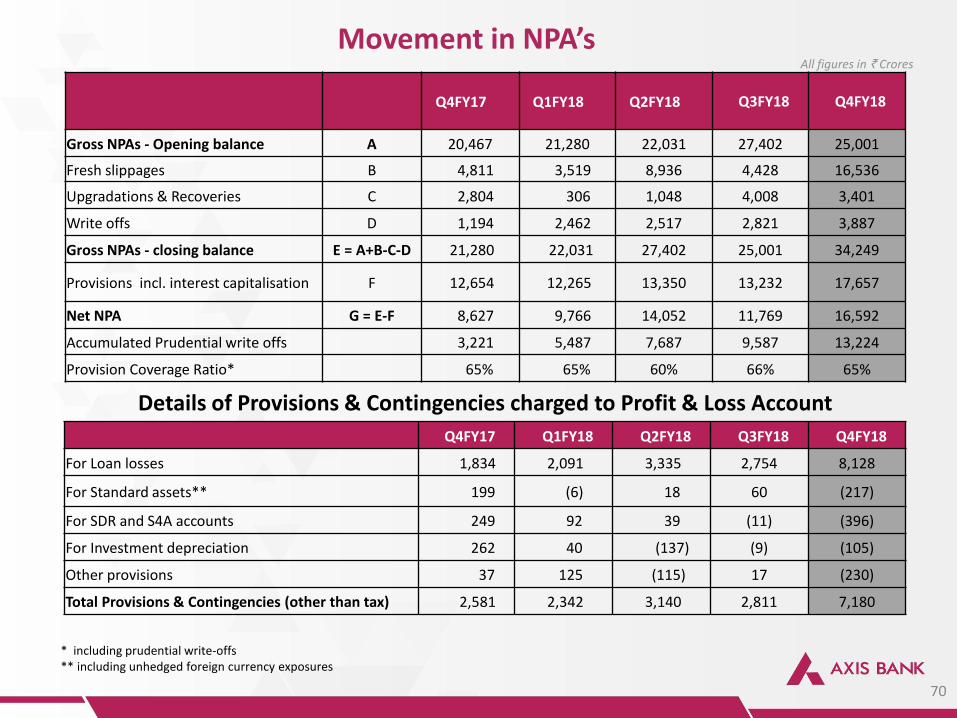
Q4FY17 Q1FY18 Q2FY18 Q3FY18
Q4FY18
Gross NPAs - Opening balance A 20,467 21,280 22,031 27,402 25,001
Fresh slippages B 4,811 3,519 8,936 4,428 16,536
Upgradations & Recoveries C 2,804 306 1,048 4,008 3,401
Write offs D 1,194 2,462 2,517 2,821 3,887
Gross NPAs - closing balance E = A+B-C-D 21,280 22,031 27,402 25,001 34,249
Provisions incl. interest capitalisation F 12,654 12,265 13,350 13,232 17,657
Net NPA G = E-F 8,627 9,766 14,052 11,769 16,592
Accumulated Prudential write offs 3,221 5,487 7,687 9,587 13,224
Provision Coverage Ratio* 65% 65% 60% 66% 65%
Movement in NPA’s
Q4FY17 Q1FY18 Q2FY18 Q3FY18 Q4FY18
For Loan losses 1,834 2,091 3,335 2,754 8,128
For Standard assets** 199 (6) 18 60 (217)
For SDR and S4A accounts 249 92 39 (11) (396)
For Investment depreciation 262 40 (137) (9) (105)
Other provisions 37 125 (115) 17 (230)
Total Provisions & Contingencies (other than tax) 2,581 2,342 3,140 2,811 7,180
All figures in ` Crores
Details of Provisions & Contingencies charged to Profit & Loss Account
* including prudential write-offs ** including unhedged foreign currency exposures
70

Shareholding Pattern (as on March 31, 2018)
Share Capital `513 crores
Shareholders’ Funds `63,445 crores
Book Value Per Share `247
Diluted EPS (FY18) `1.12
Market Capitalization ` 127,967 crores (as on April 25, 2018)
& 1 GDR = 5 shares As on March 31, 2018, against GDR issuance of 62.70 mn, outstanding GDRs stood at 23.06 mn
Foreign Institutional Investors 47.66%
Indian Institutions 10.38%
GDR's 4.49%
SUUTI 9.87%
Life Insurance Corporation
13.62%
General Insurance Corp & Others
2.87%
Others 11.11%
71

72
Major awards won by the Bank and its subsidiaries
Customer Service Excellence Award for Transformation
Dale Carnegie Global Leadership Award for 2017
Excellence in Corporate
Social Responsibility
Banking Technology
Excellence Award 2017 for
Digital Banking
Most Innovative Emerging
Technologies Project, India
- Ripple Blockchain project
For Excellence in Operations
CX Innovator Best Omnichannel
Customer Success Story
• Best use of Analytics for
Business Outcome
• Best use of Digital and
Channels Technology

Thank You
73