Investor Presentation - HDFC Ltd
59
Investor Presentation Housing Development Finance Corporation
-
Upload
khangminh22 -
Category
Documents
-
view
5 -
download
0
Transcript of Investor Presentation - HDFC Ltd

InvestorPresentation
Housing Development Finance Corporation

2
CONTENTS
• Who we Are
• Material Developments
• HDFC Snapshot
• Mortgage Market in India
• Operational and Financial Highlights: Mortgages
• Shareholding
• Financials: Standalone
• Key Subsidiaries and Associates
• Financials: Consolidated
• Environmental, Social & Governance & Other Initiatives
2

3
WHO WE ARE…
• Incorporated in 1977 as the
first specialised mortgage
company in India
• A financial conglomerate with
interests beyond mortgages
• 69% shares held by foreign
investors
*As at March 31, 2022US$ amounts converted based on exchange rate of US$ 1 = Rs. 75.90
21.00%
Market capitalisation*: US$ 107 bn
ADRs listed on NYSE
Market capitalisation*:US$ 57 bn
47.81%
Market capitalisation*: US$ 15 bn
Ranks 2nd in overall new business premium amongst private players
52.60%
Market capitalisation*:US$ 6 bn
Ranks amongst the top3 AMCs with total AUM
of US$ 57 bn
49.98%
Ranks amongst the top3 private players in general insurance
100%
Financial services distribution company
Sources more than half ofHDFC’s home loans
100%
India's first dedicated education loan company with
outstanding loan book of US$ 1.2 bn
100%
Property funds: of whichUS$ 3 bn is committed for development of affordable
housing
3

MATERIAL DEVELOPMENTS

5
MATERIAL DEVELOPMENTSProposed Transformational Combination of HDFC with HDFC Bank
• On April 4, 2022, the Board of Directors of HDFC and HDFC Bank at their respective meetings,approved a composite scheme of amalgamation (Scheme) for:
The amalgamation of HDFC's wholly owned subsidiaries, HDFC Investments Limited and HDFCHoldings Limited, with and into HDFC; and
HDFC with and into HDFC Bank
• Subsidiary/associates of HDFC Limited will become subsidiary/associates of HDFC Bank
• Shareholders of HDFC as on the record date will receive 42 shares of HDFC Bank (FV Re. 1 each) for 25
shares of HDFC (FV Rs. 2 each)
• HDFC's shareholding in HDFC Bank will be extinguished upon the Scheme becoming effective
• Post the above, HDFC Bank will be 100% owned by public shareholders and existing shareholders of
HDFC will own 41% of HDFC Bank
• Transaction completion is subject to shareholders, creditors and regulatory approvals as applicable
5

6
RATIONALEProposed Transformational Combination of HDFC with HDFC Bank
• The option to merge has been evaluated from time to time
• In the recent period, various regulatory changes for banks and NBFCs have considerably reduced the barriers for a potential merger:
• Cash Reserve Ratio (CRR) and Statutory Liquidity Ratio (SLR) of banks have reduced from 27%
to 22%
• Prevailing interest rates give spreads on reserves
• RBI permits Priority Sector Lending Certificates to meet Priority Sector Lending (PSL) norms
• Long tenor infrastructure & affordable housing bonds are exempt from CRR, SLR and PSL
• Recent harmonisation of regulations between banks and NBFCs:
RBI roadmap for conversion of large NBFCs into full scale commercial banks
Harmonisation of asset quality norms
Introduction of Liquidity Coverage Ratio for NBFCs
Scale Based Regulations - especially for NBFCs categorised as NBFC Upper Layer
Further alignment of regulations for NBFCs with banks on:
Capital assessment, risk, compliance, large exposure framework, remuneration,
core financial services solution, amongst others 6
7
BENEFITS OF A COMBINED ENTITYProposed Transformational Combination of HDFC with HDFC Bank
• Synergies
Access to lower cost of funds Wider distribution network; presently HDFC Bank does not source mortgages from all its offices HDFC Bank to have access to 45 years of expertise in mortgage origination and loan servicing
processes of HDFC Operational efficiencies: will be able to offer the mortgage product seamlessly Cross-selling: 70% of HDFC customers do not bank with HDFC Bank; of the 68 million customers
of HDFC Bank, only 8% have a mortgage and only 2% have a mortgage from HDFC
• Overcome issues of a holding company discount
• Cancellation of shares of HDFC Bank held by HDFC - will be EPS accretive for HDFC Bank; provide leg
room for foreign shareholding (HDFC’s equity in HDFC Bank qualifies as indirect foreign investment)
• Through mortgages, HDFC Bank will get longer duration assets on its books
• HDFC Bank can build a housing loan portfolio and enhance product offerings to its existing customer
base
• Overcome drag on Return on Equity 7

HDFC SNAPSHOT

9
BUSINESS SUMMARY
• Loans Outstanding (Gross loans) : Rs. 6,539.02 bn(As at March 31, 2022) : US$ 86.15 bn
• Individual Loans Originated CAGR (5 years) : 16%
• Cumulative Housing Units Financed : 9.3 million
• Cost to Income Ratio : 8.1%(excluding notional cost of Employee Stock Option Scheme & Corporate Social Responsibility Expenses)
• Unaccounted gains on listed investments : Rs. 2,342.48 bnin subsidiary and associate companies : US$ 30.86 bn
• Consolidated Profit After Tax CAGR (5 years) : 15%
9

10
IMPACT OF COVID-19
• Q1 FY22 witnessed an eruption of a second wave of Covid-19 in India. Post that, there was a sharprecovery in business. In Q4 FY22, the third wave of Covid-19 resulted in a rise in infections, but withconsiderable less severity and did not result in any material impact on business
• The demand for housing continues to remain strong
Approvals and disbursements grew by 38% and 37% respectively in FY22
• Scale up on all digital platforms for borrowers, depositors, channel partners and deposit agents,amongst others
91% of new loan applications were received through the digital mode
67% of retail deposits digitally on-boarded
• Credit costs for the year stood at 33 basis points compared to 56 basis points in the previous year
• Total loans restructured under the RBI’s Resolution Framework - OTR 1.0 & 2.0, amounted to 0.80%of the loan book.
The largest restructured account under the resolution framework of Rs 27.64 billion was fullyrepaid as at March 31, 2022.
10

11
HIGHLIGHTS – Q4 FY22
• Continued momentum in housing sales, especially across major metros
• Increase in new project launches in the mid range and luxury market segment
• Highest ever monthly individual housing loan disbursements in the month of Mar-21
• The collection efficiency for individual loans on a cumulative basis stood at over 99% during the quarter ended March 31, 2022
• Improvement in individual non-performing loans: 0.99% (Q3: 1.44%), based on newnorms i.e. Reserve Bank of India's November 12, 2021 notification
Based on earlier norms, individual non-performing loans: 0.78% (Q3: 1.14%)
• Reduction in aggregate of Stage 2 and Stage 3 assets to 6.7% of the Exposure atDefault as at March 31, 2022 from 9.2% in June 30, 2021
• Credit costs trended downwards each quarter -- Q4: 0.27% compared to 0.50% in Q1
• Higher growth in net interest income at 14%
11

MORTGAGE MARKETIN INDIA

13
DRIVERS OF MORTGAGE GROWTH
• Improved Affordability
• Low Penetration
• Government Incentives
Enhanced Fiscal Benefits
Incentives for Affordable Housing
• Other Demand Drivers
13

14
IMPROVED AFFORDABILITY
Best affordability in 2.5 decadesGovernment support towards housing has helped improve affordability
Representation of property price estimates Affordability equals property prices by annual income
Based on customer data
21.7
15.6
11.18.3
6.6 5.9 5.3 5.1 4.7 4.3 4.7 5.0 5.1 5.1 4.5 4.7 4.8 4.6 4.7 4.6 4.4 4.1 3.8 3.7 3.5 3.3 3.2 3.2
0.00
2.00
4.00
6.00
8.00
10.00
12.00
14.00
16.00
18.00
0
10
20
30
40
50
60
An
nu
al In
com
e (
Rs.
10
0,0
00
)
Pro
pe
rty
Val
ue
(R
s. 1
00
,00
0)
&A
ffo
rdab
ility
Property Cost Affordability Annual Income
14

15
MORTGAGES AS A PERCENT OF NOMINAL GDP
Source: European Mortgage Federation, Hofinet & HDFC estimates for India.
Note: India’s lower GDP resulted in an increase in the mortgage to GDP ratio.
0%
20%
40%
60%
80%
100%
11%18% 20%
34%39%
44% 45%52% 56%
68%
83%89%
LOW PENETRATION IMPLIES ROOM FOR GROWTH
15

16
GOVERNMENT/REGULATORY INITIATIVES
Tax incentives on interest and principal
amount for home loan borrowers
Increased budget allocations for housing for affordable housing
LiquidityMeasures
Special refinance facilities for
Non-Banking Financial Companies -
Housing Finance Companies
Supply Side Incentives
Incentives to developers to build affordable housing
‘Infrastructure’ status accorded to affordable housing
External Commercial Borrowings/Rupee
Denominated Bonds Issued Overseas
Government Incentives
16

17
TAX INCENTIVES HAVE LOWEREDTHE EFFECTIVE RATES ON MORTGAGES
FY 2022 FY 2002 FY 2000
Loan amount 3,300,000 3,300,000 3,300,000
Nominal Interest Rate (%) 6.70% 10.75% 13.25%
Max deduction for interest allowed 200,000 150,000 75,000
Deduction on principal 150,000 20,000 20,000
Tax rate 30.90% 31.50% 34.50%
Tenor (years) 20 20 20
Total amount paid per year 371,100 359,400 421,068
Interest component 221,100 354,750 437,250
Principal repaid 150,000 4,650 (16,182)
Tax amount saved 108,150 53,550 32,775
Effective interest paid on home loan 112,950 301,200 404,475
Effective interest on home loan 3.4% 9.1% 12.3%
17
18
OTHER DEMAND DRIVERS
• Favourable Demographics: 66% of India’s population is below 35 years of age, hence large potential for home loans
• Nuclear Households: Rise in the number of households with a shift towards nuclear families
• Urbanisation: Currently 32% of the Indian population reside in cities; estimated to be 40% by 2030
• Interest Rates: Improved affordability through rising disposable incomes and lowest ever interest rates on home loans
18

OPERATIONAL &FINANCIAL HIGHLIGHTS:MORTGAGES

20
Individuals 79%
Corporate 5%
Construction Finance 9%
Lease Rental Discounting 7%
Individuals Corporate Construction Finance Lease Rental Discounting
CORE BUSINESS – LENDING
INDIVIDUAL LOANS
• Home Loans-
Fixed rate loans
Floating rate loans
• Home Improvement Loans
• Home Extension Loans
• Home Equity Loans
• Rural Home Loans
• Loans to NRIs
(As at March 31, 2022: Gross Loans - US$ 86.15 bn)
Individual loans sold (outstanding):. Rs. 838.80 bn (US$ 11.05 bn)
As at March 31, 2022
Rs. bn US$ bn % Growth Rs. bn US$ bn % Growth Rs. bn US$ bn % Growth
Individuals 4,316 57 17% 4,600 61 25% 5,154 68 17%
Non-Individuals 1,368 18 6% 1,383 18 7% 1,385 18 7%
Total 5,684 75 14% 5,983 79 20% 6,539 86 15%
Loan Book Outstanding
(After Sell Down)
Loan Book o/s Before Sell Down
in last 12 monthsAssets Under Management
20

21
HOUSING ACROSS INCOME GROUPS
LIG / EWS13%
MIG42%
HIG 45%
LIG / EWS 29%
MIG48%
HIG 23%
Housing Loan Approvals Based on Income Slabs FY22
In Number termsIn Value terms
Economically Weaker Section: Up to Rs. 0.3 mn p.a Low Income Group: Above Rs. 0.3 mn to Rs. 0.6 mn p.a.Middle Income Group: Above Rs. 0.6 mn to Rs. 1.8 mn p.a. High Income Group: Above Rs. 1.8 mn p.a.
Housing Loans to EWS & LIG Segments
• 29% of home loan approvals in volume terms and 13% in value terms has been to the EWS & LIG segments• Average home loan – EWS: Rs. 1.12 mn, LIG: Rs. 1.97 mn
Credit Linked Subsidy Scheme (CLSS): HDFC has the highest number of beneficiaries at over 310,000, with cumulative disbursements of Rs. 521 bn and a subsidy amount of Rs. 72 bn.
21

22
Employed78%
Self-Employed
(incl: professionals)
22%
Employment
Employed Self-Employed (incl: professionals)
INDIVIDUAL LOANS: FY22*
Resale37%
Self-construction
8%
First Purchase
55%
Acquisition Mode
Resale Self-construction First Purchase
East 4%
West 35%
North 27%
South 34%
Geographic Spread
East West North South
* Based on value of approvals
22
23
SCALE & SPEED THROUGH DIGITALISATION
• Growing trend of digital on-boarding of customers
Reimagined on-boarding journey with both, mobile and web
Digital on–boarding enabled for channel partners
Customers digitally on-boarded and go through a paperless approval process
Use of QR codes to help customers access the digital platform
91% of new loan customers and 67% retail deposits on-boarded digitally
• Focused targeting and lead nurturing across multiple digital channels/platforms using SaaS based marketing solutions, thereby increasing effectiveness of marketing campaigns
• Use of technology solutions and fintech integrations at various stages of underwriting, enabling speedy processing of applications and fraud detection
• Machine Learning (ML) based lead scoring model
• Advanced conversational chatbot with Natural Language Processing (NLP) and ML technology, backed by live chat to address customers’ servicing and new loan requirements 24X7
• HDFC’s website in six vernacular languages, besides English to serve the needs of customers in Tier II, Tier-III cities and rural areas
23

24
Deposit & loan products offered at several locations through outreach programmes.
Total number of offices: 675 which is inclusive of 211 outlets of HDFC Sales Limited
HDFC Bank28%
HDFC Sales Private Limited 52%
Direct Walk-ins2%
Other Direct Selling Agents 18%
March 31, 2022
82% OF OUR MORTGAGES ARE SOURCED BYOURSELVES OR THROUGH OUR AFFILIATES
DIGITAL CHANNELS FOR CUSTOMERS
• Using digital and social media marketing strategies and tools to reach out to customers
• Lifecycle management for upselling and cross-selling products to HDFC's existing customers using advanced predictive analytical tools and marketing automation platforms
• Customer queries and service requests fulfilled through ‘Customer Connect’ –HDFC’s digital servicing platform
24

25
OUR CONSERVATIVE LOAN PROFILEUNDERLIES OUR HIGH CREDIT QUALITY
• Average Loan Size : Rs. 3.30 mn (~US$ 43,500)
• Average Loan to Value : 70% (at origination)
• Average Loan Term : 12 years
• Average Age : 38 years
• Primary Security : Mortgage of property financed
• Repayment Type : Amortising
25

26
*Mar-21 NPLs are not comparable due to change in classification norms by the Reserve Bank of India in Nov-21.Dec-21 and Mar-22 are based on RBI's Nov. 12, 2021 circular - daily stamping of NPLs & upgradation of NPLs less than 90 dpd to standard accounts provided all outstanding dues are fully repaid.**EAD: Exposure at Default
As at March 31, 2022 (Rs. in bn)
NPLs (90 days): 107.41
Provisions Carried: 135.06
0.00%
1.00%
2.00%
3.00%
Mar-21 * Dec-21 Mar-22
1.98%2.32%
1.91%
2.62%2.45% 2.38%
GROSS NPLs PROVISIONS CARRIED AS % OF EAD**
NPLs As at Mar 31, 2022 As at Dec 31, 2021 As at Mar 31, 2021
Individual Loans 0.99% 1.44% 0.99%
Non-Individual Loans 4.76% 5.04% 4.77%
Overall NPLs 1.91% 2.32% 1.98%
Per
cen
tage
GROSS NON-PERFORMING LOANS(NPLs) & PROVISIONS CARRIED As per RBI's Revised Norms (i.e. November 12, 2021)
26
* As at March 31, 2022:Based on the earlier norms, the NPAs are as follows:• Individuals: 0.78%• Total NPLs: 1.74%

27
EXPECTED CREDIT LOSS (ECL) BASED ON EXPOSURE AT DEFAULT (EAD)
As per IndAS
Exposure at Default Mar-22 Dec-21 Mar-21
Stage 1 93.3% 92.2% 91.4%
Stage 2 4.4% 5.1% 6.3%
Stage 3 2.3% 2.7% 2.3%
Coverage Ratio (ECL/EAD)
Stage 1 0.26% 0.27% 0.24%
Stage 2 20.35% 17.05% 18.64%
Stage 3 54.33% 48.93% 52.07%
ECL/EAD 2.38% 2.45% 2.62%
27

28
Total Borrowings: Rs. 4,996.81 bn (US$ 65.83 bn)
(As at March 31, 2022: Total Borrowings - US$ 65.83 bn)
MULTIPLE SOURCES OF BORROWINGS
32% 34% 32%
21% 21% 25%
43% 42% 40%
4% 3% 3%
0%
20%
40%
60%
80%
100%
Mar-20 Mar-21 Mar-22
External Commercial Borrowings
Debentures & Securities
Term Loans
Deposits
Perc
enta
ge
28

29
10.29% 10.18%
8.99%8.06%
7.99% 7.91%
6.70% 5.77%
2.30%
2.27%2.29%
2.29%
2.10%
2.15%
2.20%
2.25%
2.30%
2.35%
2.40%
0.00%
2.00%
4.00%
6.00%
8.00%
10.00%
12.00%
FY19 FY20 FY21 FY22
Return on Loans Cost of Borrowings Spread
FY22Spread earned on:
Individual Loans 1.93%Non-individual Loans 3.40%Loan Book 2.29%
LOAN SPREADS
29

30
(As at March 31, 2022)
Rs.
in b
illio
n
1,424
2,879
2,106
1,151
2,546 2,712
0
500
1,000
1,500
2,000
2,500
3,000
3,500
Up to 1 yr >1-5 yrs Over 5 yrs
Assets Liabilities
The above graph reflects adjustments for prepayments and renewals in accordance with the guidelines issued by the regulator.
MATURITY PROFILE
30

31
PRODUCTIVITY RATIOS
Mar-22 Mar-21
Number of employees 3,599 3,226
Number of outlets 464 390
Profit per employee (US$ '000)* 501 491
Assets per employee (US$ mn) 22.7 22.5
Admin costs/assets (%)^ 0.23 0.21
Cost income ratio (%)^ 8.1 7.7
^Excluding notional cost of ESOS and CSR expenses
31

32
KEY FINANCIAL METRICS
Mar-22 Mar-21
Net Interest Margin (%) 3.5 3.5
Pre-Tax RoAA (%) 2.9 2.8
Post Tax RoAA (%) 2.3 2.3
Return on Tier 1 Capital (%) 15.0 14.8
Capital Adequacy (%) 22.8 22.2
Of which Tier I (%) 22.2 21.5
Tier II (%) 0.6 0.7
32

VALUATION & SHAREHOLDING

34
VALUATION – METHOD 1
• Number of shares outstanding: 1.81 billion
• Share Price (CMP as at March 31, 2022): Rs. 2,390
• Market Capitalisation: Rs. 4,333 billion (~US$ 57 bn)
Particulars Rs. bn US$ bn
Net Worth 1,203 15.8
Add: Unaccounted gains on strategic
l isted investments2,342 30.9
Add: Unaccounted gains on unlisted
investments258 3.4
Adjusted Networth 3,803 50.1
Market Capitalisation 4,333 57.1
Adjusted Price to Book Ratio 1.1 1.1
34

35
VALUATION – METHOD 2
• Number of shares outstanding: 1.81 billion
• Share Price (CMP as at March 31, 2022): Rs. 2,390
• Market Capitalisation: Rs. 4,333 billion (~US$ 57 bn)
Particulars Rs. bn US$ bn
Market Capitalisation 4,333 57.1
Less: Unaccounted gains on strategic
l isted investments2,342 30.9
Less: Unaccounted gains on unlisted
investments258 3.4
Adjusted Market Capitalisation 1,733 22.8
Net Worth (adjusted for dividend) 1,203 15.8
Adjusted Price to Book Ratio 1.4 1.4
35

36
SHAREHOLDING PATTERN (As at March 31, 2022)
69%
10%
11%
8%2%
Foreign Shareholders - 69%
Individuals - 10%
Mutual Funds - 11%
Financial Institutions, Banks & Insurance Companies - 8%
Companies - 2%
36

FINANCIALS STANDALONE(BASED ON INDIAN ACCOUNTING STANDARDS)

38
BALANCE SHEET (Standalone)
Mar-22 Mar-21 Growth
(Rs. in bil l ion) (Rs. in bil l ion) (%)
Sources of Funds
Shareholders' Funds 1,202.51 1,087.83
Borrowings 4,996.81 4,413.65 13%
Current Liabilities & Provisions 209.30 174.51
6,408.62 5,675.99 13%
Application of Funds
Loans (before provisions) ̂ 5,683.63 4,982.98 14%
Investments 685.93 686.37
Current/ Fixed Assets 39.06 6.64
6,408.62 5,675.99 13%
^Net of loans sold during the preceding 12 months amounting to Rs. 284.55 billion of individual loans and Rs 15.00 billion ofstandard, non individual loans. If these loans were included, the growth in loans would have been 20%.
38

39
STATEMENT OF PROFIT AND LOSS – FY22 (Standalone)
FY22 FY21 Growth (Rs. in bil l ion) (Rs. in bil l ion) (%)
Net Interest Income 171.19 149.70 14.4%
Add: Income on derecognised (assigned) loans 10.56 11.90
Add: Other Operating Income 3.30 2.87
Net Operating Income 185.05 164.47 12.5%
Less: Non Interest Expenses 14.92 12.70
Less: Amortisation of ESOS and CSR Expenses 5.81 5.28
Add: Other Income 0.33 0.26
Profit Before Sale of Investments, Dividend, Fair Value
Changes and ECL164.66 146.75 12.2%
Add: Net gain/(loss) on Fair Value Changes 9.38 9.56
Add: Dividend 15.11 7.34
Add: Profit on Sale of Investments 2.63 13.98
Less: Expected Credit Loss (ECL) 19.32 29.48
Profit Before Tax 172.46 148.15 16.4%
Provision for Tax 35.04 27.88
Profit After Tax 137.42 120.27 14.3%
Effective tax rate (%) 20.3% 18.8%
39

40
STATEMENT OF PROFIT AND LOSS – Q4FY22(Standalone)
Jan - Mar 22 Jan - Mar 21 Growth (Rs. in bil l ion) (Rs. in bill ion) (%)
Net Interest Income 46.01 40.27 14.3%
Add: Income on derecognised (assigned) loans 4.36 4.38
Add: Other Operating Income 0.97 0.90
Net Operating Income 51.34 45.55 12.7%
Less: Non Interest Expenses 4.05 3.07
Less: Amortisation of ESOS and CSR Expenses 1.09 1.92
Add: Other Income 0.08 0.10
Profit Before Sale of Investments, Dividend, Fair
Value Changes and ECL46.28 40.66 13.8%
Add: Net gain/(loss) on Fair Value Changes 2.67 4.66
Add: Dividend 1.28 1.11
Less: Expected Credit Loss (ECL) 4.01 7.19
Profit Before Tax 46.22 39.24 17.8%
Provision for Tax 9.22 7.44
Profit After Tax 37.00 31.80 16.4%Effective tax rate (%) 19.9% 19.0%
40

KEY ASSOCIATESAND SUBSIDIARIES
42
HDFC BANK LIMITED
• 21% owned by HDFC
• ADRs listed on NYSE
• 6,342 banking outlets, 18,130 ATMs
• Key business areas-
Wholesale banking | Retail banking | Treasury operations
• Financials (as per Indian GAAP) for the year ended March 31, 2022
Advances as at March 31, 2022, stood at Rs. 13,688 bn – an increase of 21% over the previous year
Total deposits stood at Rs. 15,592 bn – an increase of 17% over the previous year
PAT (Indian GAAP): Rs. 369.61 bn – an increase of 19% over the previous year
• Arrangement between HDFC & HDFC Bank
HDFC Bank sources home loans for a fee
Loans originated in the books of HDFC
HDFC offers a part of the disbursed loans for assignment to HDFC Bank (up to 70% of loans sourced by HDFC Bank)
HDFC retains a spread on the loans that have been assigned
• Market Capitalisation (March 31, 2022): ~US$ 107 bn42

43
HDFC LIFE INSURANCE COMPANY LIMITED (HDFC LIFE)
• 47.81% owned by HDFC
• With effect from January 2022, Exide Life Insurance Company (Exide Life) has become a wholly owned subsidiary of HDFC Life
• Total premium income for the year ended March 31, 2022 stood at Rs. 459.6 bn – growth of 19% over the previous year
• HDFC Life recorded a growth of 16% in terms of individual weighted received premium (WRP) during FY22 with a market share of 14.8% in the private sector.
During the year ended March 31, 2022, the new business premium grew 20%.
New Business Margin for the year ended March 31, 2022: 27.4% (PY: 26.1%)
Indian Embedded Value stood at Rs. 300 bn as at March 31, 2022 (PY: Rs. 266 bn)
Assets Under Management as at March 31, 2022 stood at Rs. 2 trillion, an increase of 17% over the PY
Solvency Ratio as at March 31, 2022 – 176% (regulatory requirement: 150%)
PAT for the year ended March 31, 2022 (Indian GAAP): Rs. 12.1 bn (PAT impacted due to elevated claims during the pandemic and reserving for excess mortality)
Product mix - Unit Linked: 26%, Non-Par Savings: 33%, Annuity: 5%, Non-Par Protection: 6%, Par: 30%
• Market capitalisation (March 31, 2022): ~US$ 15 bn43

44
HDFC ASSET MANAGEMENT COMPANY LIMITED
• 52.60% owned by HDFC and Abrdn Investment Management holds 16.21% of the equity of HDFC Asset Management
• Quarterly Average Assets under Management as at March 31, 2022, stood at Rs. 4.3 trillion (US$ 57 bn), with an overall market share of 11.3%
• Amongst India’s largest actively managed equity mutual fund, with a market share of 11.5% as on March 31, 2022
Equity-oriented assets of HDFC MF as a proportion of total AUM was 51%
• Individual accounts of HDFC MF as at March 31, 2022
9.9 million live accounts
62% of total monthly average AUM is contributed by individuals
Market share of 12.5% of individual monthly average AUM
• PAT for the year ended March 31, 2022 (as per Ind AS): Rs. 13.9 bn
• Market capitalisation (March 31, 2022): ~US$ 6 bn
44
45
HDFC ERGO GENERAL INSURANCE COMPANY LTD.
• HDFC holds 49.98% and ERGO International AG holds 48.99% of the equity of HDFC ERGO General Insurance Company Limited (HDFC ERGO)
• Gross direct premium for the year ended March 31, 2022 stood at Rs. 135 bn(PY: Rs. 123 bn)
• Products: Motor, health, travel, home and personal accident in the retail segment; property, marine, aviation and liability insurance in the corporate segment; and crop insurance in rural segment
Retail accounts for 61% of the total business
• Market share of 10.3% (private sector) and 6.1% (overall) in terms of gross direct premium for the year ended March 31, 2022 (Source: GI Council)
• As at March 31, 2022: Solvency Ratio – 164% (as against regulatory requirement of 150%)
• Profit after tax for the year ended March 31, 2022: Rs. 5 bn (impacted due to higher Covid-19 losses)
45

46
HDFC CAPITAL ADVISORS LIMITED
• HDFC Capital Affordable Real Estate Fund (HCARE)
Set up as a SEBI registered AIF in 2016
Objective: To provide long-term flexible funding across the lifecycle of affordable and mid-income housing projects, including early-stage funding. The HCARE platform will also invest in technology companies engaged in the affordable housing ecosystem.
HCARE 1 & 2 is a US$ 1.1 bn platform targeting affordable & mid-income residential projects
In January 2022, HCARE achieved the initial closure of HCARE 3. Investors have committedUS$ 1.22 bn to HCARE 3, focused on affordable and mid-income residential projects. Combined with potential re-investments, the total fund corpus will increase to an estimated US$ 1.88 bn.
HCARE 3 combined with HCARE 1 & 2 will create a US$ 3 bn funding platform, focused on the development of affordable housing
Primary investors in HCARE 1, 2 & 3 is a wholly owned subsidiary of Abu Dhabi Investment Authority (ADIA), along with the National Investment and Infrastructure Fund (NIIF) in HCARE 2
HDFC Capital Advisors is the investment manager for the funds and is one of the largest real estate fund managers in the country
In April 2022, HDFC entered into an agreement to sell 10% of the fully diluted paid-up share capital of HDFC Capital Advisors to a wholly-owned subsidiary of ADIA for Rs 1.84 bn
46

47
HDFC CREDILA
• HDFC holds 100% in HDFC Credila
• HDFC Credila is a non-banking finance company and was the first Indian lender to exclusively focus on education loans
• The company lends to under-graduate and post-graduate students studying in India or abroad
• As at March 31, 2022
Profit After Tax (as per Ind AS): Rs. 2.06 bn – 33% growth
Cumulative loans disbursed: Rs. 164 bn
Loan book outstanding: Rs. 88 bn
• 34% of the loan book is collateralised
Gross non-performing assets: 0.22%
47

FINANCIALS CONSOLIDATED(BASED ON INDIAN ACCOUNTING STANDARDS)
49
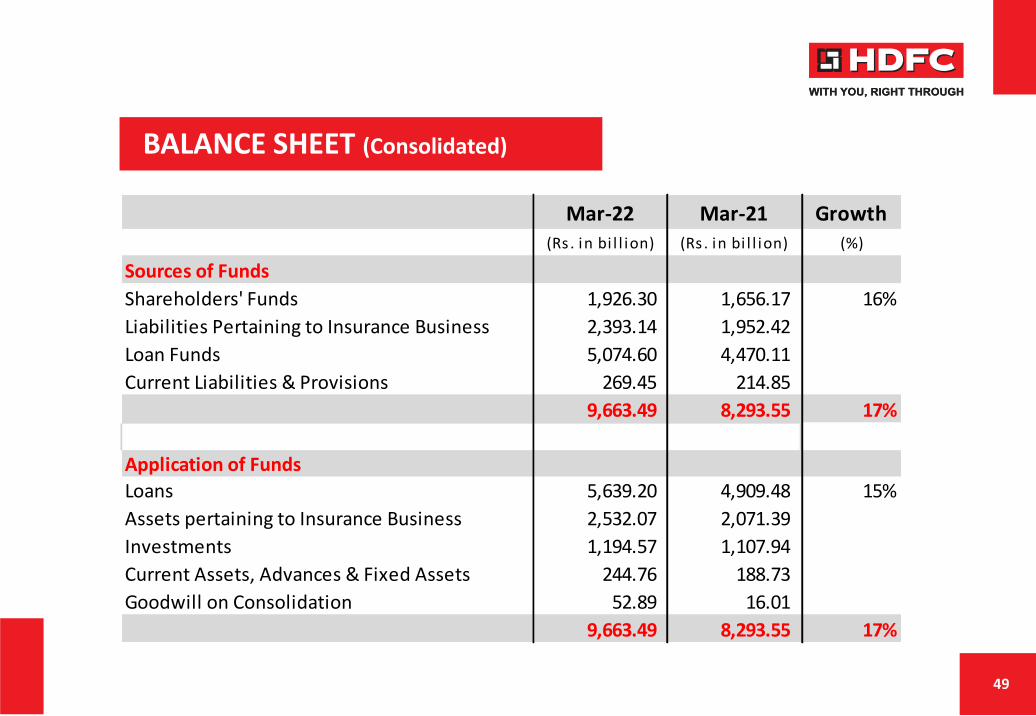
Mar-22 Mar-21 Growth
(Rs . in bi l l ion) (Rs . in bi l l ion) (%)
Sources of Funds
Shareholders' Funds 1,926.30 1,656.17 16%
Liabilities Pertaining to Insurance Business 2,393.14 1,952.42
Loan Funds 5,074.60 4,470.11
Current Liabilities & Provisions 269.45 214.85
9,663.49 8,293.55 17%
Application of Funds
Loans 5,639.20 4,909.48 15%
Assets pertaining to Insurance Business 2,532.07 2,071.39
Investments 1,194.57 1,107.94
Current Assets, Advances & Fixed Assets 244.76 188.73
Goodwill on Consolidation 52.89 16.01
9,663.49 8,293.55 17%
BALANCE SHEET (Consolidated)
49

50
FY22 FY21 Growth
Interest & Other Operating Income 480.86 473.36
Income from Insurance Business 852.19 886.25
Profit on Sale of Investment & Investment Properties 0.71 (0.02)
Net gain on fair value changes 15.65 19.72
Income on derecognised (assigned) loans 9.85 11.03
Other Income 0.42 0.37
Total Income 1,359.68 1,390.71
Finance costs 272.30 290.81
Expenses from Insurance Business 837.22 865.84
Non-Interest Expenses 36.91 30.59
Impairment on financial instruments 20.43 30.31
Total Expenses 1,166.86 1,217.55
Share of profit of associates (equity method) 89.70 69.21
Profit Before Tax 282.52 242.37 17%
Total tax expense 42.10 37.49
Net Profit After Tax 240.42 204.88 17%
Profit Attributable to the Corporation 225.95 187.40 21%
Rs. in bill ion
STATEMENT OF PROFIT AND LOSS –FY22 (Consolidated)
50

51
CONSOLIDATED PROFIT AFTER TAX – FY22(As per Ind-AS)
FY22 FY21 Growth
(Rs. in billion) (Rs. in billion)
HDFC Profit After Tax 137.42 120.27 14%
HDFC Life 5.74 8.45
HDFC Ergo 2.59 3.36
HDFC Bank 85.17 66.51
HDFC AMC 7.33 6.98
HDFC Credila 2.06 1.55
Other Companies 2.64 0.01
Adjustments:
Dilution gain / loss from Associates 4.53 2.81
Profit on Sale of Investments (1.42) (13.76)
Dividend & Other Adjustments (20.11) (8.78)
Net Profit Attributable to the Corporation 225.95 187.40 21%
51

ESG & OTHER INITIATIVES

53
THE ESG WAY: ENCOMPASSING ALL STAKEHOLDERS
• ESG Ratings: HDFC’s environmental impact is minimal/low risk
• Long-term commitment to finance affordable & green housing
• Focus on responsible lending
• ~ 2/3rd of the lease rental discounting portfolio is certified as green by Indian Green Building Council or the Leadership in Energy and Environmental Design
• Supporting programmes for environmental sustainability, recycling, conservation, animal & wildlife protection and the ecology
• Employee sensitisation on environmental impact; initiatives to facilitate carbon offsets
• Recycling efforts at HDFC – paper, plastic, wet waste, e-waste
• Launched green deposits for retail depositors in Aug 21
• Recognised amongst India’s Top Sustainable Companies by Business World Magazine in association with Sustain Labs, Paris in FY22
ENVIRONMENTAL
Contd…
53

54
THE ESG WAY: ENCOMPASSING ALL STAKEHOLDERS
• Shelter Assistance Reserve created in 1987: Set aside a portion of profits each year to support socially high impact projects
• Cumulatively financed 9.3 million housing units
• Focus on inclusion & diversity; employee engagement, training and wellbeing
• Institution with the largest number of beneficiaries under the Government’s Credit Linked Subsidy Scheme at 0.31 mn
• HDFC primarily implements its CSR initiatives through the H T Parekh Foundation, a charitable institution set up by HDFC
• CSR focus areas: COVID-19 relief, healthcare, education, skilling & livelihoods, environmental sustainability
Contd…
SOCIAL
54

55
THE ESG WAY: ENCOMPASSING ALL STAKEHOLDERS
• Founding principles of kindness, fairness, efficiency & effectiveness
• Recent Awards
Felicitated under the ‘Leadership’ category in the Corporate Governance Score Card, 2021 under a joint initiative byIFC-IiAS-BSE
Best Integrated Report 2020 by Asian Centre for Corporate Governance & Sustainability
‘Leadership in Employee Development’ by ESGRisk.ai,India’s 1st ESG rating company
'Company of the Year' at The Economic Times Awards for Corporate Excellence 2020
Golden Peacock Award for Excellence in Corporate Governance 2020
• No promoter holding
• Well reputed, independent directors since inception; core competencies directly linked to the strategy of HDFC
GOVERNANCE
55

56
ESG REPORTS
• Report of Directors on Corporate Governance
• Annual Report on Corporate Social Responsibility (CSR) Activities
• Business Responsibility Report
• Business Responsibility and Sustainability Report - prescribed by SEBI in May 21, voluntary for the top 1,000 companies by market cap for FY22, and mandatory from FY23 onwards. HDFC voluntarily adopted this format in FY21 and FY22
• Integrated Report
• HDFC COVID-19 Relief Response: Impact Assessment Report
• Social Initiatives Report
• Independent Review of HDFC’s Sustainability Initiatives
Reports are available on the website:
https://www.hdfc.com/investor-relations#environmental-social-and-governance
56

57
DASH PHILOSOPHY & DIGITALISATION OBJECTIVES
Re-imagine and transform the customer journey across the lifecycle to improve customer experience and create market differentiation
D A S HDigital First
Personalised and digital borrower experience
Agile Methods
Customer centric designs, teams collaborate with IT & User Support Groups
Seamless
Automate document ingestion; leverage cloud architecture and APIs to facilitate scalability
HDFC For You
Organisation-wide thrust on identification and tracking of outcomes and input metrics to drive impact
WAVE 2
WAVE 1
57

58
DASH PHILOSOPHY & DIGITALISATION INITIATIVES
• Board level Information Technology Committee - comprising two independent directors, a whole-time director and members of senior management
• Information Security and Steering Committee monitors the progress of information security and cyber security
• Emphasis on regulation and compliance with respect to consent management, data protection & privacy
58

May 13, 202259