Investor Presentation - Investor Relations | OneWater Marine Inc
23
1 CONFIDENTIAL Investor Presentation May 2021
-
Upload
khangminh22 -
Category
Documents
-
view
2 -
download
0
Transcript of Investor Presentation - Investor Relations | OneWater Marine Inc

1CONFIDENTIAL
Investor PresentationMay 2021

2CONFIDENTIAL
DISCLAIMER
Cautionary Statement Concerning Forward-Looking Statements
Information in this presentation of OneWater Marine Inc. (“OneWater,” “ONEW,” the “Company,” “we,” or “us”), and any oral statements made in connection therewith, may contain “forward-looking statements”
within the meaning of the Private Securities Litigation Reform Act of 1995, including regarding our strategy, future operations, financial position, prospects, plans and objectives of management, growth rate and
its expectations regarding future revenue, operating income or loss or earnings or loss per share. In some cases, you can identify forward-looking statements because they contain words such as “may,” “will,”
“will be,” “will likely result,” “should,” “expects,” “plans,” “anticipates,” “could,” “would,” “foresees,” “intends,” “target,” “projects,” “contemplates,” “believes,” “estimates,” “predicts,” “potential,” “outlook” or “continue”
or the negative of these words or other similar terms or expressions that concern our expectations, strategy, plans or intentions. These forward-looking statements are not guarantees of future performance, but
are based on management’s current expectations, assumptions and beliefs concerning future developments and their potential effect on us, which are inherently subject to uncertainties, risks and changes in
circumstances that are difficult to predict. Our expectations expressed or implied in these forward-looking statements may not turn out to be correct.
Important factors, some of which are beyond our control, that could cause actual results to differ materially from our historical results or those expressed or implied by these forward-looking statements include the
following: decline in demand for our products and services, the seasonality and volatility of the boat industry, our acquisition strategies, the inability to comply with the financial and other covenants and metrics in
our credit facilities, cash flow and access to capital, the timing of development expenditures, and other risks. More information on these risks and other potential factors that could affect our financial results is
included in our filings with the Securities and Exchange Commission, including in the “Risk Factors” and “Management’s Discussion and Analysis of Financial Condition and Results of Operations” sections of our
annual on Form 10-K filed on December 3,2020. Any forward-looking statement speaks only as of the date as of which such statement is made, and, except as required by law, we undertake no obligation to
update or revise publicly any forward-looking statements, whether because of new information, future events, or otherwise.
Non-GAAP Financial Measures
This presentation includes financial measures that are not presented in accordance with generally accepted accounting principles (“GAAP”), including Adjusted EBITDA. While management believes Adjusted
EBITDA may be useful in performing meaningful comparisons of past and present operating results, to understand the performance of its ongoing operations and how management views the business, it is not a
measure of our financial performance under GAAP and should not be considered in isolation or as an alternative to any measure of such performance derived in accordance with GAAP. Adjusted EBITDA is
calculated as net income (loss) before interest expense – other, income tax expense, depreciation and amortization and other (income) expense, further adjusted to eliminate the effects of items such as the
change in the fair value of warrants, the (loss) gain on contingent consideration, (loss) gain on extinguishment of debt and transaction costs.
Amounts excluded from these non-GAAP measures in future periods could be significant and our current presentation of these non-GAAP measures should not be construed as an inference that our future
results will be unaffected by unusual or non-recurring items. These non-GAAP measures have limitations as analytical tools and you should not consider them in isolation or as substitutes for analysis of our
results as reported under GAAP. Because our non-GAAP financial measures may be defined differently by other companies, our definition of these non-GAAP financial measures may not be comparable to
similarly titled measures of other companies, thereby diminishing its utility. We have not reconciled non‐GAAP forward-looking measures to their corresponding GAAP measures because certain items that impact
these measures are unavailable or cannot be reasonably predicted without unreasonable efforts. See the Appendix for a reconciliation to directly comparable GAAP financial measures.
Industry and Market Data
This presentation includes market data and other statistical information from third-party sources, including independent industry publications or other published independent sources. Although we believe these
third-party sources are reliable as of their respective dates, we have not independently verified the accuracy or completeness of this information. Some of the data is also based on our good faith estimates, which
are derived from our review of internal sources as well as the third-party sources described above.
Trademarks and Trade Names
OneWater owns or has rights to various trademarks, service marks and trade names that it uses in connection with the operation of its business. This presentation also contains trademarks, service marks and
trade names of third parties, which are the property of their respective owners. OneWater’s use or display of third parties’ trademarks, service marks, trade names or products in this presentation is not intended
to, and does not imply, a relationship with OneWater (except as stated herein) or an endorsement or sponsorship by or of OneWater. Solely for convenience, the trademarks, service marks and trade names
referred to in this prospectus may appear without the ®, TM or SM symbols, but such references are not intended to indicate, in any way, that OneWater will not assert, to the fullest extent under applicable law,
its rights or the right of the applicable licensor to these trademarks, service marks and trade names.
Other
Certain monetary amounts, percentages and other figures included in this presentation have been subject to rounding adjustments. Percentage amounts included in this presentation have not in all cases been
calculated on the basis of such rounded figures, but on the basis of such amounts prior to rounding. For this reason, percentage amounts in this roadshow may vary from those obtained by performing the same
calculations using the figures in our consolidated financial statements included elsewhere. Certain other amounts that appear in this presentation may not sum due to rounding.

3CONFIDENTIAL
KEY INVESTMENT HIGHLIGHTS
Diversified Product Portfolio and Revenue Streams4
Core Focus on the Best-Performing Industry Segments5
Proprietary Technology Infrastructure6
Experienced and Entrepreneurial Management Team7
One of the Largest Marine Retailers in a Highly Fragmented Premium Boat Retail Market1
Consistent Track Record of Leading Same-Store Sales Growth2
Proven Acquisition-Driven Growth Strategy3

4CONFIDENTIAL
$18
$41$46
$83
FY17 FY18 FY19 FY20
GROWTH COMPANY WITH PROVEN TRACK RECORD
Note: Company has a September 30 fiscal year end; YTD represents the period ended March 31.
1. See reconciliation of non-GAAP financial measures in the appendix.
$11
$57
YTD'20 YTD'21
Same-Store Sales Growth 22% 12% 24% 5% 49%
Total YoY Growth 54% 27% 33% 21% 58%
Margin 5% 7% 6% 8% 3% 10%
Revenue ($MM)
Adj. EBITDA ($MM) 1
$391
$603
$768
$1,023
FY 17 FY 18 FY 19 FY 20
$344
$544
YTD'20 YTD'21
5CONFIDENTIAL
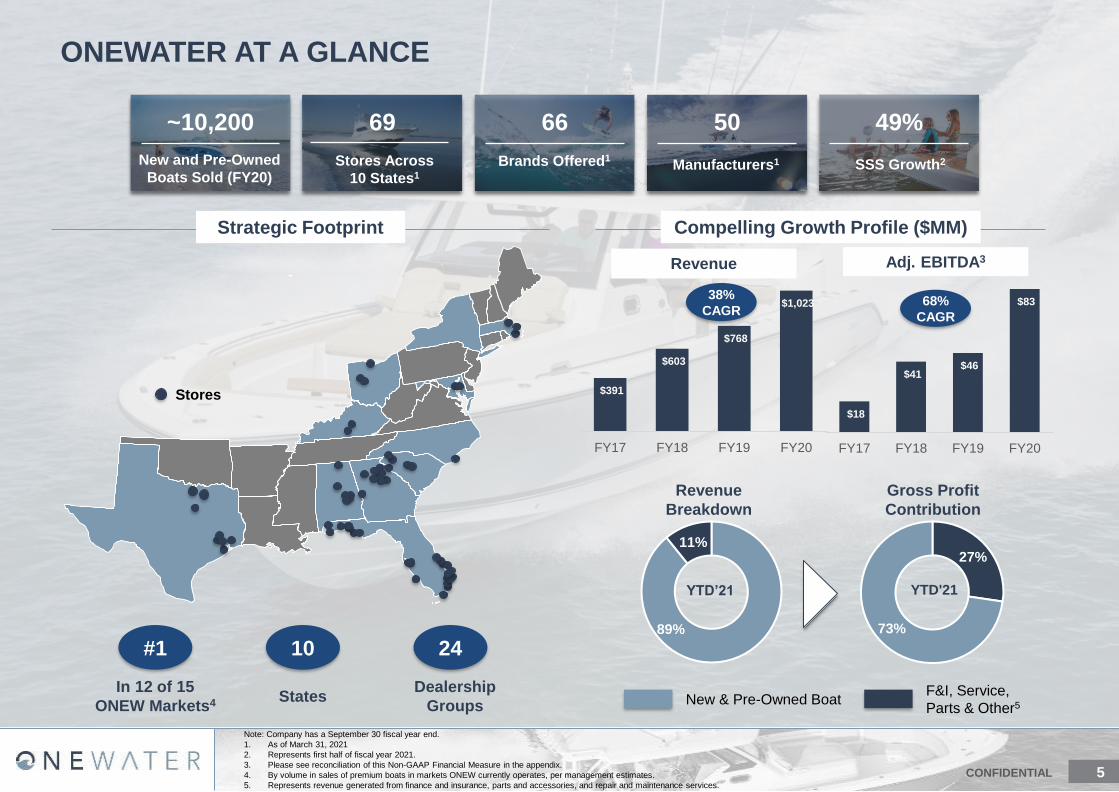
89%
11%
$18
$41 $46
$83
FY17 FY18 FY19 FY20
69
Stores Across
10 States1
ONEWATER AT A GLANCE
66
Brands Offered1
49%
SSS Growth2
Note: Company has a September 30 fiscal year end.
1. As of March 31, 2021
2. Represents first half of fiscal year 2021.
3. Please see reconciliation of this Non-GAAP Financial Measure in the appendix.
4. By volume in sales of premium boats in markets ONEW currently operates, per management estimates.
5. Represents revenue generated from finance and insurance, parts and accessories, and repair and maintenance services.
~10,200
New and Pre-Owned
Boats Sold (FY20)
50
Manufacturers1
Strategic Footprint
Stores
68%
CAGR
F&I, Service,
Parts & Other5New & Pre-Owned Boat
$391
$603
$768
$1,023
FY17 FY18 FY19 FY20
38%
CAGR
Revenue Adj. EBITDA3
Revenue
Breakdown
Gross Profit
Contribution
YTD’21 YTD'21
Compelling Growth Profile ($MM)
10
States
24
Dealership
Groups
#1
In 12 of 15
ONEW Markets4
27%
73%

6CONFIDENTIAL
ONEWATER’S EVOLUTION INTO A MARKET LEADER
Note: Figures in bar chart represent store count at fiscal year end (September 30).
Mr. Aisquith
joins Singleton
Marine
Singleton family
founded
# Stores
Mr. Ezzell joins
OneWater
1 9
15
23
29
45
53
6361
69
1987 2008 2014 2015 2016 2017 2018 2019 2020 2021

7CONFIDENTIAL
Top 5
States
FY
2019
YoY
Growth
FY
2020
YoY
Growth
Florida 37% 29% 41% 49%
Texas 18% 45% 17% 22%
Georgia 12% 17% 11% 19%
Alabama 10% 15% 9% 22%
Ohio 8% 34% 7% 25%
STRATEGIC FOOTPRINT IN HIGHLY ATTRACTIVE MARKETS
69 stores across 10 states, 7 of which are top 20 boating states1
Note: Store count as of March 2021.
1. 2019 NMMA Recreational Boating Statistical Abstract. Top 20 states, in order,
include Florida, Texas, Michigan, North Carolina, Minnesota, California, New
York, Wisconsin, Georgia, South Carolina, Alabama, Louisiana, Washington,
Tennessee, Illinois, Ohio, Missouri, Virginia, New Jersey and Pennsylvania.
2
Denotes ONEW as market leader
1
2
2
2
1
3
7
1
17
1
3
1
311
3
4
3
2
1
Stores
# Number of stores per dealer group2
2. Figures in circles by dealership group denote number of stores.
Revenue Contribution & Growth
5
2
1

8CONFIDENTIAL
1.6%3
~4,300 boat
dealerships
nationwide
69Stores as
of March-2021
1. ONEW believes that it is one of the largest and one of the fastest-growing premium recreational
boat retailers in the United States based on number of stores as of March 31, 2021.
2. Sourced from Dun & Bradstreet’s “Boat Dealers Industry Profile” report, March 2021.
3. Represents market share (% of total stores).
77 Stores as
of March-20214
2
ONE OF THE LARGEST RETAILERS IN A HIGHLY FRAGMENTED MARKET1
$1.0BFY20
Sales
$19B Marine Retail in
Existing States5,6
$43B Total U.S.
Marine Retail
Sales6
Highly Fragmented Market with Two Leading PlayersSignificant Consolidation
Opportunity
1.8%3
4. MarineMax FY Q2 21 10-Q filed April 27, 2021.
5. States include Texas, Florida, Alabama, North Carolina, South Carolina, Georgia,
Ohio, Maryland, Kentucky, and Massachusetts.
6. Estimates derived from 2019 NMMA Recreational Boating Statistical Abstract,
Boating Industry.

9CONFIDENTIAL
Current Locations
(As of 3/31/2021) 69 77 ~4,300
Net New Locations
(FY17 – Q2 21) 42 21
Estimated Units Sold
(New and Pre-Owned)4 ~10,200 ~7,400 ~1,010,000
Total Revenue CAGR 38% 13% 8%
Same-Store Sales Growth
(FY18, FY19, FY20) 22%, 12%, 24% 10%, 1%, 25%
Adjusted EBITDA CAGR6 68% 33%
Adjusted EBITDA Margin
(FY20)6 8.1% 7.3%
Local Branding Strategy ✓ No
Top Manufacturer
% Concentration 16% 33%
New Boat Average Selling
Price ~$107,000 ~$215,000 $56,000
Estimated % Yacht
Concentration7 12% ~30-35%
Note: Company has a September 30 fiscal year end.
1. Source: MarineMax FY 20 10-K, FY19 10-K. MarineMax also has a September 30 fiscal year end.
2. Source: NMMA and Boating Industry Magazine. Based on industry estimates from 2019 NMMA Recreational Boating
Statistical Abstract, unless noted otherwise.
3. Source: Dun & Bradstreet’s “Boat Dealers Industry Profile” report, March 2021.
1
ONE OF THE FASTEST GROWING BOAT RETAILERS OF SCALE IN THE U.S.
Scale
Financial
(FY17 – FY20)
Business &
Operational
Industry2
3
4. Represents FYE20 for ONEW, FYE20 for HZO and CYE19 for Industry.
5. Represents powerboat sales for the period from CYE17 to CYE19
6. Please see reconciliation of this Non-GAAP Financial Metric Measure in Appendix section.
7. Represents percentage of new unit sales that comprise of yachts. MarineMax percentage based on
equity research estimate.
8
8
8. Represents powerboat sales for CYE19
5

10CONFIDENTIAL
BROAD PRODUCT PORTFOLIO
Diversification provides flexibility to meet customer demand across all markets
Brand
Boat
Type
Saltwater Fishing
Runabout
Pontoon
Wake/Ski
Yacht &
Other
#1 brand accounts for 10% of New
Boat sales
#1 customer for each of our top 5
brands
Top 3 customer for 28 of our 66
brands
Scale & diversification drives
best inventory and pricing
Note: Brand and boat type pie charts reflect the fiscal year ended September 30, 2020 New Boat revenue composition.
35%
22%
20%
15%
8%
42%
10%8%7%
7%
6%
5%
4%4%
4% 3%
All Other
Brands

11CONFIDENTIAL
New Boat Sales
Contribution
Parts &
Accessories
Contribution
Repair &
Maint. Services
Finance &
Insurance
Contribution
Pre-Owned Boat Sales
Contribution
Revenue
Gross Profit
Revenue
Gross Profit
Revenue
Gross Profit
Revenue
Gross Profit
DIVERSIFIED INCOME STREAMS ACROSS THE BOAT LIFE CYCLE
Note: Represents figures for trailing 12 months ended March 31, 2021.
57% 16% 14% 13%
71% 19% 3% 7%

12CONFIDENTIAL
CRM DashboardInventory Management Online Portal
▪ Internally-developed software
integrated with sales processes
that allows for efficient lead
generation and tracking
▪ CRM and the integrated
quoting tool can be accessed in
the office or on the water,
wherever business is
conducted
▪ Supports dynamic pricing at the
dealership level
▪ Provides nationwide visibility of
available and on order
inventory
▪ Allows for dynamic pricing at
the dealership level
▪ Tools help manage inventory
on the ground and on order
from manufacturers getting the
right boats to the stores on time
▪ Developed for managers to
monitor KPIs and other
operational metrics
▪ Used in measuring sales
performance and budget
monitoring
▪ Internally-developed intranet
provides employees with
information, training /
certifications, best practices
and other resources
COMPREHENSIVE VIRTUAL MARINE RETAIL PLATFORM
Proprietary consumer-driven platform for the entire boat life cycle
Purchase Ownership Sale
Key Elements of Our Proprietary Technology Infrastructure
▪ Innovative platform that simplifies how people buy and sell their boats
‒ Nearly 1 million boats are sold person-to-person every year
▪ Serves as an extension of our store footprint including new and pre-owned boats and
finance & insurance services
13CONFIDENTIAL
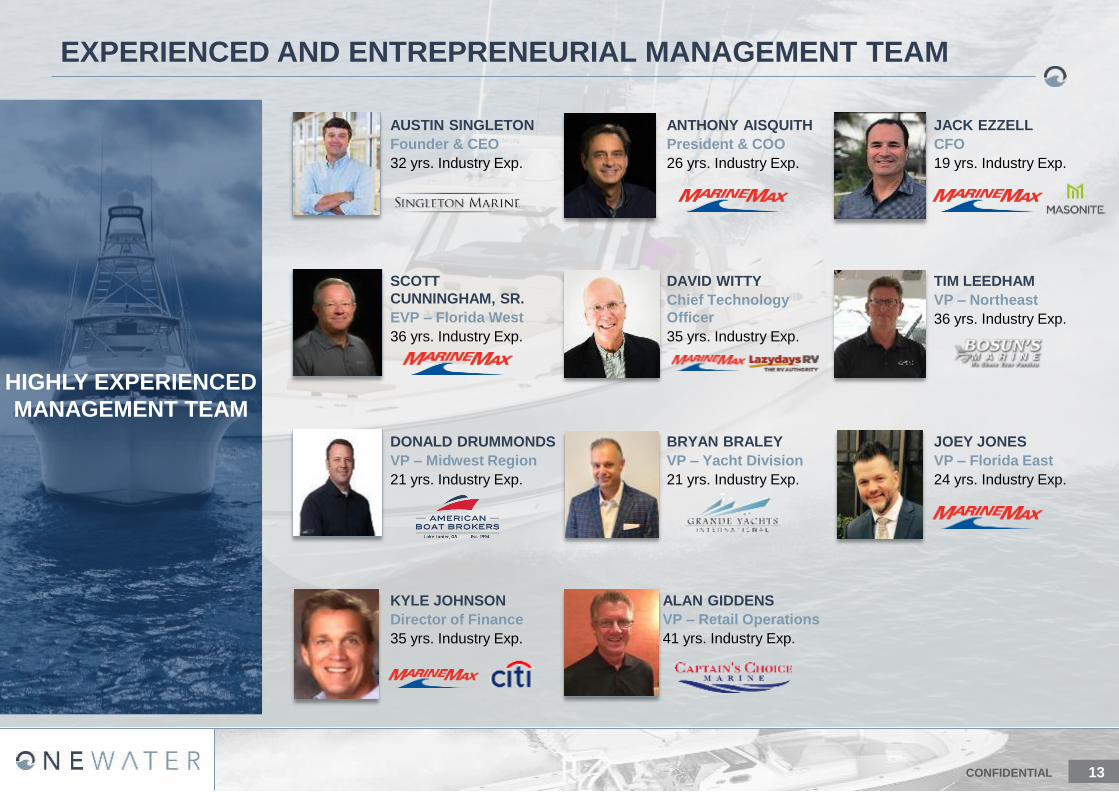
EXPERIENCED AND ENTREPRENEURIAL MANAGEMENT TEAM
HIGHLY EXPERIENCED
MANAGEMENT TEAM
SCOTT
CUNNINGHAM, SR.
EVP – Florida West
36 yrs. Industry Exp.
DAVID WITTY
Chief Technology
Officer
35 yrs. Industry Exp.
TIM LEEDHAM
VP – Northeast
36 yrs. Industry Exp.
AUSTIN SINGLETON
Founder & CEO
32 yrs. Industry Exp.
ANTHONY AISQUITH
President & COO
26 yrs. Industry Exp.
JACK EZZELL
CFO
19 yrs. Industry Exp.
DONALD DRUMMONDS
VP – Midwest Region
21 yrs. Industry Exp.
BRYAN BRALEY
VP – Yacht Division
21 yrs. Industry Exp.
JOEY JONES
VP – Florida East
24 yrs. Industry Exp.
ALAN GIDDENS
VP – Retail Operations
41 yrs. Industry Exp.
KYLE JOHNSON
Director of Finance
35 yrs. Industry Exp.

14CONFIDENTIAL
Target Dealership Criteria
$20 – $30mm✓ Aim to pay < 4.0x EV / EBITDA multiple
✓ Only top dealers in top markets
✓ Independent brands only
✓ Multi-year pipeline
✓ Continually evaluate geographic expansion
Key Acquisition Criteria
✓ Retain name, logo and goodwill
✓ Preserves brand equity and loyal customer base
PROVEN ACQUISITION-DRIVEN GROWTH STRATEGY
Revenue
$1 – $2mm
Adj. EBITDA
1 – 3
Stores
Acquisition Strategy1 Acquisition Criteria¹
Local Branding Strategy
4 – 6 acquisitions per year
1. These targets represent our goals and are not projections of future performance. There is no guarantee that the company completes any
acquisitions in any given year. See “Disclaimer–Cautionary Statement Concerning Forward-Looking Statements.”
✓ Strong management team and staff
✓ Leading brand portfolio
✓ Attractive / expansion geography
✓ Financial profile meets or exceeds average target metrics
✓ Strong local presence and engagement
Tom George Yacht
Group acquired 2020
Walker Marine Group
acquired 2020
Roscioli Yachting
Center acquired 2020

15CONFIDENTIAL
1 2Acquisition
Multiple
Post-
Improvements
Multiple
ACCRETIVE POST-ACQUISITION STRATEGY
Targeted Multiple
Transformation
Post-Acquisition
Improvements1
4.0x
2.0x
✓ Implement F&I
✓ Introduce new brands
and boat types
✓ Upgrade systems
✓ Execute on synergies
and best practices
✓ Reduce expenses
✓ Free up owners to focus
on selling
Note: These examples of past performance may not be indicative of improvements made with respect to any other current or future acquisitions.
1. These targeted improvements represent our goals and there can be no assurance that all or any of these improvements will be
accomplished. See "Disclaimer – Cautionary Statement Concerning Forward-Looking Statements."
✓ Implemented F&I
✓ Expanded Pre-Owned process
✓ Added Tiara Sport and Tiara
Yacht brands
✓ Expanded floorplan capacity to
support growth
✓ Implemented technologies
(CRM, Inventory management,
Dashboard)
Acquired FY18
Opportunity Opportunity Opportunity
Improvements Improvements Improvements
Acquired FY18 Acquired FY18
▪ Expansion into new state
establishing a Northeast
presence
▪ Virtually no Finance &
Insurance sales
▪ Little focus on Pre-Owned
Boats
▪ Strong management team
▪ Premium brands (Pursuit,
Edgewater, Regal, Cruisers)
Recent Case Studies
✓ Implemented F&I
✓ Established Pre-Owned process
✓ Established a strong back office
to support the business
✓ Implemented technologies
(CRM, Inventory management,
Dashboard)
▪ 2 additional locations in the
Ohio market
▪ Virtually no Finance &
Insurance sales
▪ Little focus on Pre-Owned
Boats
▪ Retiring owner with a rising third
generation
▪ Quality brands (Bennington,
Godfrey, Sea Ray, Tracker)
✓ Expanded New Boat offerings
(Barletta, Chris-Craft and
Everglades)
✓ Established Service and Parts
as a business with appropriate
billing process
✓ Expanded Pre-Owned process
(with expanded floorplan)
✓ Established a strong back office
to support the business
✓ Implemented technologies
(CRM, Inventory management,
Dashboard)
▪ 3 additional locations in the
Texas market
▪ Strong Finance & Insurance
capabilities
▪ Good focus on Pre-Owned
Boats
▪ Quality brands (Avalon,
Chaparral, NauticStar,
Shoalwater)

16CONFIDENTIAL
FINANCIAL SUMMARY

17CONFIDENTIAL
YTD’21 FINANCIAL SUMMARY
($ in thousands) YTD’21 YTD’20 % Change YoY YTD’21 YTD’20
Revenue
New Boat $391,482 $235,571 66.2% 72.0% 68.5%
Pre-owned Boat 94,662 71,257 32.8% 17.4% 20.7%
Finance and Insurance 17,752 12,408 43.1% 3.3% 3.6%
Service, Parts and Other 39,798 24,425 62.9% 7.3% 7.1%
Total Revenue $543,694 $343,661 58.2% 100% 100%
Gross Profit
New Boat $81,803 $41,362 97.8% 20.9% 17.6%
Pre-Owned Boat 21,662 12,048 79.8% 22.9% 16.9%
Finance and Insurance 17,752 12,408 43.1% 100.0% 100.0%
Service, Parts and Other 20,005 10,955 82.6% 50.3% 44.9%
Total Gross Profit $141,222 $76,773 83.9% 26.0% 22.3%
SG&A $83,208 $60,688 37.1%
% Revenue 15.3% 17.7%
Interest Expense – Floorplan 1,250 5,184 (75.9%)
% Revenue 0.2% 1.5%
Adjusted EBITDA1 $56,764 $10,901 420.7%
Margin 10.4% 3.2%
Net Income $42,367 $1,912 2,115.8%
% Contribution
% Gross Margin
1. Please see reconciliation of this Non-GAAP Financial Measure in the appendix.
18CONFIDENTIAL
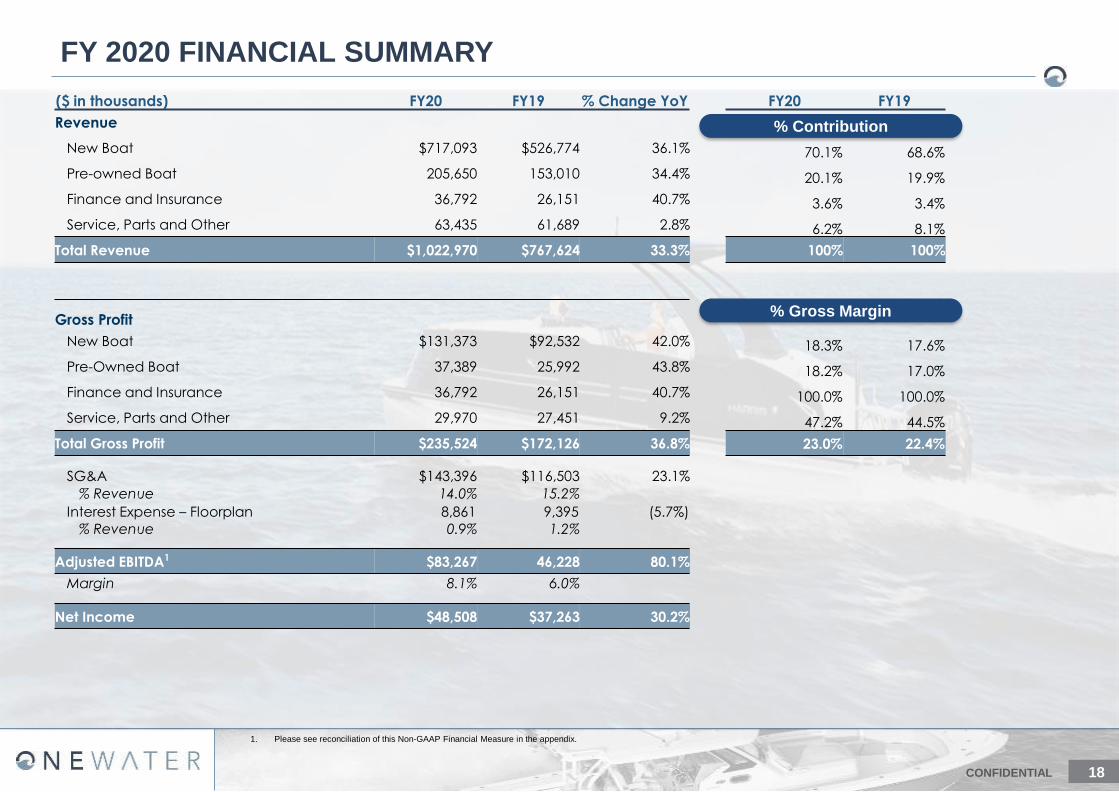
FY 2020 FINANCIAL SUMMARY
($ in thousands) FY20 FY19 % Change YoY FY20 FY19
Revenue
New Boat $717,093 $526,774 36.1% 70.1% 68.6%
Pre-owned Boat 205,650 153,010 34.4% 20.1% 19.9%
Finance and Insurance 36,792 26,151 40.7% 3.6% 3.4%
Service, Parts and Other 63,435 61,689 2.8% 6.2% 8.1%
Total Revenue $1,022,970 $767,624 33.3% 100% 100%
Gross Profit
New Boat $131,373 $92,532 42.0% 18.3% 17.6%
Pre-Owned Boat 37,389 25,992 43.8% 18.2% 17.0%
Finance and Insurance 36,792 26,151 40.7% 100.0% 100.0%
Service, Parts and Other 29,970 27,451 9.2% 47.2% 44.5%
Total Gross Profit $235,524 $172,126 36.8% 23.0% 22.4%
SG&A $143,396 $116,503 23.1%
% Revenue 14.0% 15.2%
Interest Expense – Floorplan 8,861 9,395 (5.7%)
% Revenue 0.9% 1.2%
Adjusted EBITDA1 $83,267 46,228 80.1%
Margin 8.1% 6.0%
Net Income $48,508 $37,263 30.2%
% Contribution
% Gross Margin
1. Please see reconciliation of this Non-GAAP Financial Measure in the appendix.

19CONFIDENTIAL
Comparable Store Inventory Turns3
HEALTHY INVENTORY LEVELS
OneWater is able to maintain healthy inventory levels through proactive management
1. Calculated as cost of goods sold for the period divided by average inventory.
2. Based on industry commentary from public filings, earnings calls and other public sources.
3. “New Boat” inventory turns are calculated as New Boat cost of goods sold for the period, subtracting contributions from mid-year acquisitions, divided by average New Boat
inventory without contributions from mid-year acquisitions. “Pre-Owned Boat” inventory turns are calculated as cost of purchased or traded-in Pre-Owned Boats sold for the
period, subtracting contributions from mid-year acquisitions, divided by average traded-in or Pre-Owned Boats inventory without contributions from mid-year acquisitions.
Industry participants have recently
provided commentary on inventories,
including:
‒ Given recent sustained
demand, elevated
production levels over time
will be required to rebuild
pipelines
‒ Continuing to increase
production early in the third
quarter because of
significantly higher dealer
and consumer demand
‒ OEMs operating at full
capacity to replenish
inventory as selling season
concludes
Inventory Turns1 Industry Commentary2
3.1x
2.6x
3.7x 3.6x
FY18 FY19 FY20 TTM Mar 2021
2.6x 2.4x
3.3x 3.4x
New Boat
FY18 FY19 FY20 TTM Mar 2021
4.7x
3.6x
4.8x5.1x
Pre-owned Boat
FY18 FY19 FY20 TTM Mar 2021
20CONFIDENTIAL
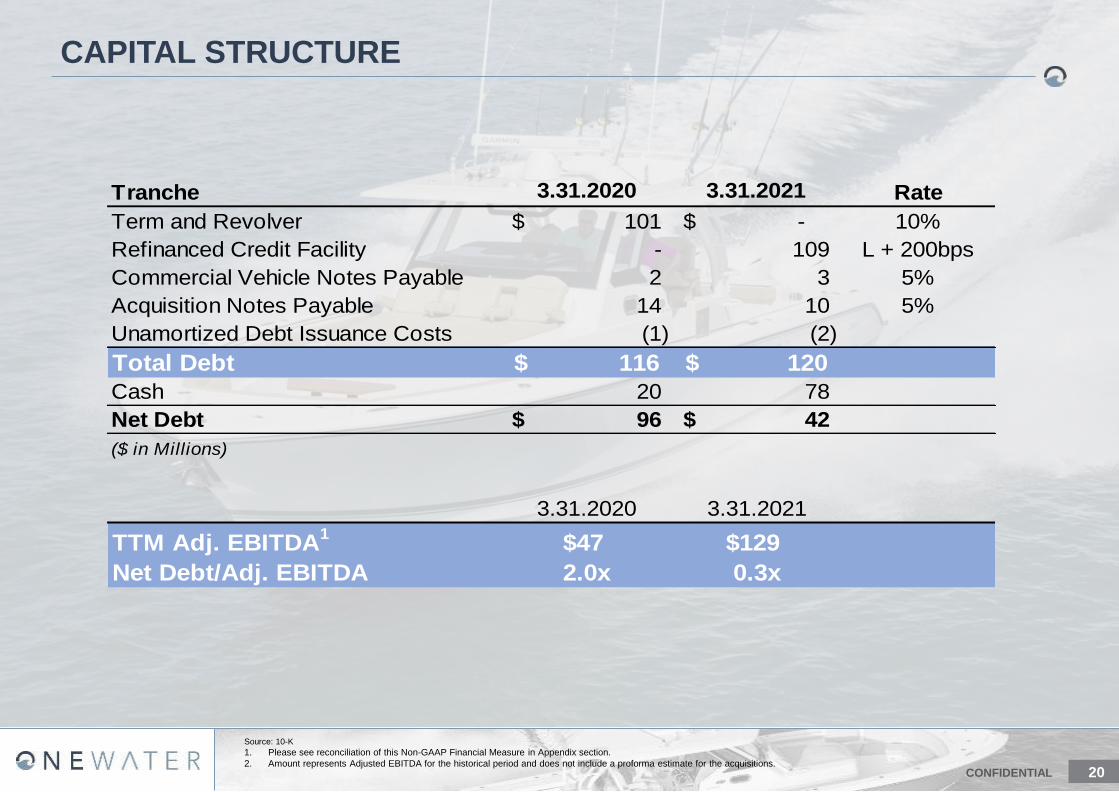
CAPITAL STRUCTURE
Source: 10-K
1. Please see reconciliation of this Non-GAAP Financial Measure in Appendix section.
2. Amount represents Adjusted EBITDA for the historical period and does not include a proforma estimate for the acquisitions.
Tranche 3.31.2020 3.31.2021 Rate
Term and Revolver 101$ -$ 10%
Refinanced Credit Facility - 109 L + 200bps
Commercial Vehicle Notes Payable 2 3 5%
Acquisition Notes Payable 14 10 5%
Unamortized Debt Issuance Costs (1) (2)
Total Debt 116$ 120$
Cash 20 78
Net Debt 96$ 42$
($ in Millions)
3.31.2020 3.31.2021
TTM Adj. EBITDA1
$47 $129
Net Debt/Adj. EBITDA 2.0x 0.3x

21CONFIDENTIAL
APPENDIX

22CONFIDENTIAL
RECONCILIATION OF ADJUSTED EBITDA
($ in millions)
2017 2018 2019 2020 YTD'21 YTD'20 YTD'19 TTM MAR'21 TTM MAR'20
Net (Loss) Income (4,259)$ 1,946$ 37,263$ 48,508$ 42,367$ 1,912$ (441)$ 88,963$ 39,616$
Interest Expense - Other 2,266 3,836 6,568 8,828 2,139 4,310 2,522 6,657 8,356
Income Tax Expense - - - 6,329 9,061 472 - 14,918 472
Depreciation and Amortization 1,055 1,685 2,682 3,249 2,341 1,551 1,192 4,039 3,041
Change in Fair Value of Warrant Liability 18,057 33,187 (1,336) (771) - (771) 7,600 - (9,707)
(Gain) Loss on Extinguishment of Debt - (209) - 6,559 - - - 6,559 -
(Gain) Loss on Contingent Consideration - - (1,674) 6,762 377 - (1,655) 7,139 (19)
Transaction Costs 327 438 1,323 3,648 568 3,362 742 854 3,943
Other Expense (Income) 217 (60) 1,402 155 (89) 65 (90) 1 1,557
Adjusted EBITDA 17,663$ 40,823$ 46,228$ 83,267$ 56,764$ 10,901$ 9,870$ 129,130$ 47,259$
EBITDA Margin 4.5% 6.8% 6.0% 8.1% 10.4% 3.2% 3.5% 11.3% 5.7%

23CONFIDENTIAL
0
50
100
150
200
250
300
350
400
1990 1994 1998 2002 2006 2010 2014 2018
Note: This slide includes a hypothetical downside discussion. This discussion is not meant to be a projection of future performance and is based upon assumptions that may change. Actual results
are subject to significant business, economic, regulatory and competitive uncertainties and contingencies, many of which are beyond the control of ONEW and its management. Nothing included in
this slide should be regarded as a representation by any persons that these events will occur, and any variation may be material.
1. Charts sourced from NMMA.
2. Revenue breakdown and gross margins based on FY20 results.
3. New Boat recession performance of -10% to -20% inferred from chart on top left-hand side. Pre-Owned Boat recession performance of 0% to +5% inferred from chart on top right-hand side.
HYPOTHETICAL DOWNSIDE DISCUSSIONU
nit S
ale
s (
in t
ho
usa
nd
s)
Unit S
ale
s (
in t
ho
usa
nd
s)
-18% -9% -50%
Historical New Powerboat Market Recession Performance1 Last Pre-Owned Powerboat Market Recession Performance1
Commentary2,3
▪ Typical New Boat recession performance is -10% to -20%
▪ Historical industry recession data suggests that the most
recent recession was an outlier
▪ Solid industry fundamentals today provide underlying
support for more resilient performance
New Boat (70% of Revenue)18%
GP Margin
▪ Correlated with New Boat and Pre-Owned Boat sales
▪ Consistent expansion of product offerings provide
opportunity to enhance F&I revenue
Finance & Insurance (4% of Revenue)
▪ Typical Pre-Owned Boat recession performance is 0% to +5%
▪ Demonstrated track record of stability through cycles
▪ Consumers turn to less expensive boats, and opportunity to
act as clearinghouse for repossessed boats
Pre-Owned Boat (20% of Revenue)
▪ As consumers defer purchases, they may instead opt to
repair and maintain existing boats
▪ Demonstrated track record of stability through cycles
▪ Opportunity to grow higher-margin segment in a downturn
Service, Parts & Other (6% of Revenue)
18%
GP Margin
47%
GP Margin
100%
GP Margin
650
700
750
800
850
900
2004 2007 2010 2013 2016 2019