Investor Presentation - BSE
34
Investor Presentatio BSE: 524404 | NSE: MARKSANS | ISIN: INE750C01026 ©2019 – Marksans Pharma Limited, All Rights Reserved. Q 1 FY20 9 th August 2019 on
-
Upload
khangminh22 -
Category
Documents
-
view
0 -
download
0
Transcript of Investor Presentation - BSE

Investor Presentation
BSE: 524404 | NSE: MARKSANS | ISIN: INE750C01026©2019 – Marksans Pharma Limited, All Rights Reserved.
Investor PresentationQ1 FY209th August 2019
Investor PresentationInvestor Presentation
Forward looking statementCertain statements in this presentation concerning our future growth prospects are forward
looking statements, which involve a number of risks, and uncertainties that could cause looking statements, which involve a number of risks, and uncertainties that could cause
actual results to differ materially from those in such forward looking statements. The risks and
uncertainties relating to these statements include, but are not limited to, fluctuations in
earnings, our ability to successfully integrate acquisitions, competition in our areas of
business, client concentration, liability for damages in our contracts, withdrawal of tax
incentives, political instability, unauthorized use of our intellectual property and general
economic conditions affecting our industry
Marksans Pharma Limited, All Rights Reserved.
Forward looking statementCertain statements in this presentation concerning our future growth prospects are forward
looking statements, which involve a number of risks, and uncertainties that could cause looking statements, which involve a number of risks, and uncertainties that could cause
actual results to differ materially from those in such forward looking statements. The risks and
uncertainties relating to these statements include, but are not limited to, fluctuations in
earnings, our ability to successfully integrate acquisitions, competition in our areas of
business, client concentration, liability for damages in our contracts, withdrawal of tax
incentives, political instability, unauthorized use of our intellectual property and general

Agenda Company at a glance
Revenue composition
History & acquisition track record
Long-term strategy
Research & development
Operational review and financials
Quarterly review
Investment rationale
Marksans Pharma Limited, All Rights Reserved.
Company at a glance
Revenue composition
History & acquisition track record
term strategy
Research & development
Operational review and financials
Quarterly review - Q1 FY20
Investment rationale

Company at a glance
Marksans Pharma Limited, All Rights Reserved.
Company at a glance

Company overview
Business Description
Marksans Pharma Ltd., headquartered at Mumbai, is engaged in Research, Manufacturing & Marketing of generic pharmaceutical formulation
Company’s key focus areas lie in the OTC & prescription drugs and it manufactures tablets (plain, enteric coated and film coated), hard & soft gelatin capsule, oral liquids and ointments
Revenue Mix
OTC46.06%
Marksans Pharma Limited, All Rights Reserved.
Its manufacturing facilities are accredited by USFDA, UKMHRA and Australian TGA
Business Model Geographic Mix
US & North America40.96%
Australia & NZ
11.94%
RoW6.00%• 94% of revenues comes from
regulated markets
• Forward-integrated business model
• Presence in niche softgel segment
Revenue Mix
Rx53.94%
2955
86107115
139156
Anti-AllergicMiscellaneous
GastrointestinalAnti-Daibetic
Central Nervous System (CNS)Cough & Cold
Cardiovascular System (CVS)Pain Management
Product Portfolio Rs. Cr.
Financial Snapshot
Rs. Cr. FY19 FY18 Growth (%)
Revenue 1004.7 921.17 9.1%
EBITDA 136.8 86.9 57.5%
PAT 80.4 35.8 124.7%
Geographic Mix
Europe, UK41.11
%
RoW6.00%
2129
Anti-BioticAnti-Allergic

Company timeline
Acquired Bell Sons &
Company Ltd. in the UK
2007
Spun-off into a separate entity as Marksans Pharma Ltd.
2003
Marksans Pharma Limited, All Rights Reserved.
2001
Incorporated as a subsidiary of
Glenmark Pharmaceutical
Acquired Nova Pharmaceutical
s in Australia
2005
Received first ANDA approval
in the USA
2011
Revenue crossed Rs
1000 crore for the first time
2019
Acquired TimeCap
Laboratories Inc. in the US
2015
Acquired Relonchem
Limited in the UK
2008
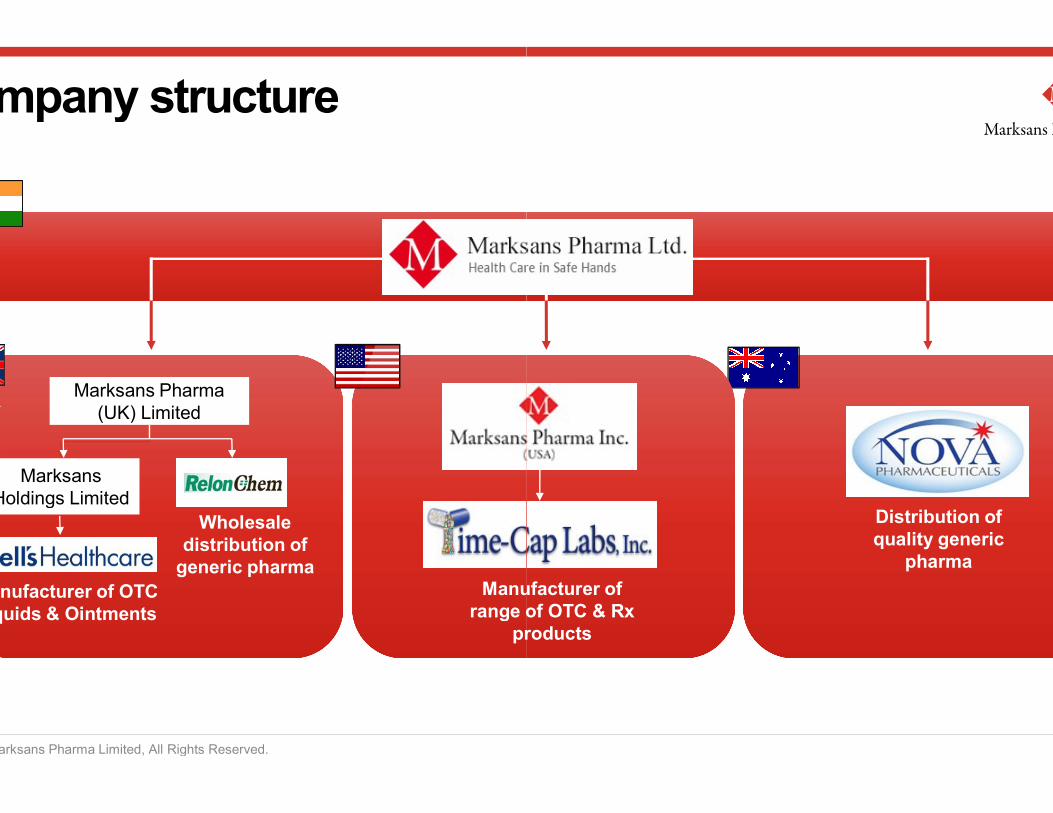
Company structure
Marksans Pharma(UK) Limited
Marksans Pharma Limited, All Rights Reserved.
(UK) Limited
Marksans Holdings Limited
Manufacturer of OTC Liquids & Ointments
Wholesale distribution of
generic pharmaManufacturer of
range of OTC & Rx products
Distribution of quality generic
pharma
Manufacturer of range of OTC & Rx
products

Manufacturing capabilitiesGoa, IndiaGoa, India
Manufactures oral solid tablets and soft gelatin capsules
One of the biggest manufacturing facility in Asia, an 18,000 square feet campus
Southport, UKSouthport, UK
• Manufactures nonliquids, ointments and powder product
• Supplies to UK, West Africa & Middle East
Marksans Pharma Limited, All Rights Reserved.
campus
Accreditations Accreditations
Middle East
Capacity Capacity
2.4 bn softgel and hard gelatin capsules per annum5 bn tablets per annum
• 13.6 mn bottles per annum• 7.8 mn tubes per annum• 5.7 mn sachets per annum
Southport, UKSouthport, UK Farmingdale, USAFarmingdale, USA
Manufactures non-sterile liquids, ointments and powder
Supplies to UK, West Africa &
• Manufactures soft gels, tablets and capsules
• "Made in the USA” product offering
Accreditations
Capacity
mn bottles per annummn tubes per annummn sachets per annum
• 5 bn tablets and hard capsules per annum

Revenue composition
Marksans Pharma Limited, All Rights Reserved.
Revenue composition

Company’s business is classified under 4 heads:
North America/ US generics
Europe/UK generics
The US, North America has increased its share in revenue over the past years
20%
11%
7%
Europe, UK
Marksans Pharma Limited, All Rights Reserved.
Europe/UK generics
Australia and New Zealand
Rest of the world (RoW) generics (CIS, Middle Eastern, African and South-East Asian countries)
62%
FY15
The US, North America has increased its share in revenue over the past years
36% 41%
12% 14% 11% 12%
6% 4% 3% 6%
REVENUE MIX
Europe, UK US, North America Australia, NZ RoW
46%37%
45% 41%
36%45%
41%41%
FY16 FY17 FY18 FY19

The UK is the highest contributor to Marksans Pharma’ s revenues
The UK413.0Total revenues(र Cr.)
Overview
Company
• One• UK
• The~USDCAGRindustry
The UK
(0.52)%y growth
(र Cr.)
41.10%Contribution to total revenues
Marksans Pharma Limited, All Rights Reserved.
Outlook
• UKBell
• Bell• Relonchem’s
products
• Companyto cater
• Company
The UK is the highest contributor to Marksans Pharma’ s
Overview of the market
Company presence
One of the top 5 Indian pharma companies in the UKUK business is driven by its two subsidiaries, Relonchem
The UK pharmaceutical market is estimated to grow from~USD 29 billion in 2015 to ~USD 43 billion by 2020, atCAGR of 8.4%, driven primarily by a robust life sciencesindustry
Outlook
UK business is driven by its two subsidiaries, RelonchemBellBell has a strong OTC portfolio with 50+ productsRelonchem’s portfolio comprises high-end Rx portfolio of 100products
Company has 50+ products in the pipeline in different stagescater UK market
Company is awaiting approval for ~20 MAs in the UK market

Marksans is among a few Indian players with a proprietary marketing presence in the US
The United States
411.5Total revenues(र Cr.)
Overview
Company
• Inenabled
• Themarketprojectedgovernment
States
10.76%y growth
(र Cr.)
40.96%Contribution to total revenues
Marksans Pharma Limited, All Rights Reserved.
Outlook
enabled• 30+• Proprietary
Cap• Strong
products
• Strengthen• Add
review
Marksans is among a few Indian players with a proprietary marketing presence in the US
Overview of the market
Company presence
June 2015, Marksans acquired Time-Cap Labs whichenabled Marksans to expand its offering in US market
The US holds over 30-40% of the global pharmaceuticalmarket. It is expected to reach USD 190.4 billion by 2024,projected CAGR of 10.6% during 2019-2024, due to favoringgovernment programs and policies
Outlook
enabled Marksans to expand its offering in US market+ products, positioned in the niche soft gel category
Proprietary marketing presence with 100% integration of TimeCap LaboratoriesStrong distribution channel marketing for both OTC andproducts
Strengthen company’s US operations in the coming yearsAdd 4-5 new products to its portfolio during the year underreview

Australia and NZ region registered highest growth among regulated markets in FY19
Australia and New Zealand
119.9Total Revenues(र Cr.)
Overview
Company
• MarksansNew
• Australia’sbillion2%
Zealand
21.05%y growth
(र Cr.)
11.94%Contribution to total revenues
Marksans Pharma Limited, All Rights Reserved.
Outlook
New• Nova
in Australia• Tie
WoolworthsFauldings
• Presence
• Australiamarkets
Australia and NZ region registered highest growth among regulated markets in FY19
Overview of the market
Company presence
Marksans carries out business operations in AustraliaNew Zealand through its subsidiary Nova Pharmaceuticals
Australia’s pharmaceutical market is set to rise from >$22billion in 2016 to $25.2 billion by 2020 registering a CAGR
%
Outlook
New Zealand through its subsidiary Nova PharmaceuticalsNova is one of the leading generics and private label suppliers
AustraliaTie-ups with topmost retailers & pharmacies in Australia,Woolworths Ltd., Coles Mayer Ltd., Aldis, MetcashFauldingsPresence in key therapeutic areas
Australia and New Zealand will continue to remain focusmarkets for the Company

After harnessing the regulated markets, Marksans is venturing out in the emerging countries
Rest of the world
60.3 Total Revenues(र Cr.)
Overview
Company
• Targetingand
• ROWFederation
the world
70.03%y growth
(र Cr.)
6.00%Contribution to total revenues
Marksans Pharma Limited, All Rights Reserved.
Outlook
and• In
Iraq,• Started
• CompanyandFY
After harnessing the regulated markets, Marksans is venturing out in the emerging countries
Overview of the markets
Company presence
Targeting four major clusters such as South East Asia, Russiaand the CIS, Middle East and Africa
ROW includes markets of South East Asia, MENA, RussianFederation & Africa
Outlook
and the CIS, Middle East and Africathese four clusters, specific countries
Iraq, Kenya, Ukraine, Sri Lanka and Myanmar are targetedStarted filing for approvals in these countries
Company is strengthening its presence in the target marketsand expects to generate 10% of the Company’s revenueFY22

History & acquisition track record
Marksans Pharma Limited, All Rights Reserved.
History & acquisition track record
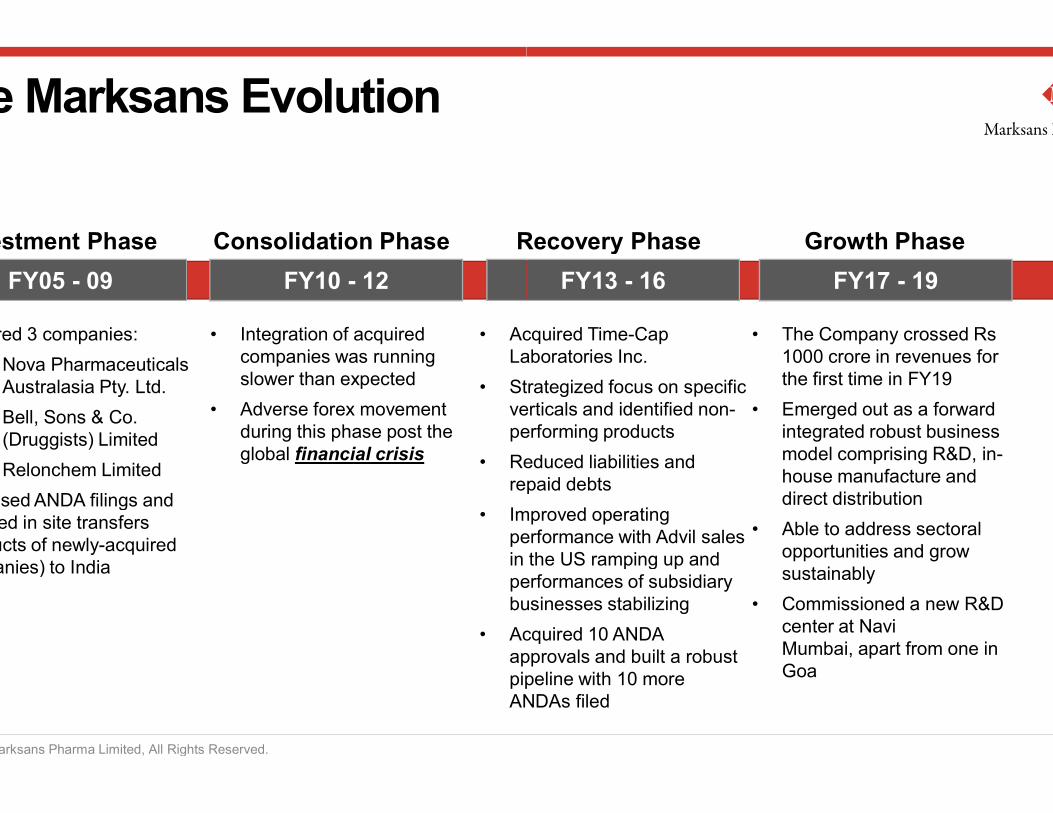
The Marksans Evolution
FY05 - 09
Investment Phase
Acquired 3 companies:
Nova Pharmaceuticals Australasia Pty. Ltd.
FY10 - 12
Consolidation Phase Recovery Phase
• Integration of acquired companies was running slower than expected
• Adverse forex movement
• Acquired TimeLaboratories Inc.
• Strategized focus on specific verticals and identified non
Marksans Pharma Limited, All Rights Reserved.
Bell, Sons & Co. (Druggists) Limited
Relonchem Limited
Increased ANDA filings and invested in site transfers (products of newly-acquired companies) to India
• Adverse forex movement during this phase post the global financial crisis
verticals and identified nonperforming products
• Reduced liabilities and repaid debts
• Improved operating performance with Advil sales in the US ramping up and performances of subsidiary businesses stabilizing
• Acquired 10 ANDA approvals and built a robust pipeline with 10 more ANDAs filed
FY13 - 16
Recovery Phase
Acquired Time-Cap Laboratories Inc.
Strategized focus on specific verticals and identified non-
FY17 - 19
Growth Phase
• The Company crossed Rs 1000 crore in revenues for the first time in FY19
• Emerged out as a forward verticals and identified non-performing products
Reduced liabilities and repaid debts
Improved operating performance with Advil sales in the US ramping up and performances of subsidiary businesses stabilizing
Acquired 10 ANDA approvals and built a robust pipeline with 10 more ANDAs filed
• Emerged out as a forward integrated robust business model comprising R&D, in-house manufacture and direct distribution
• Able to address sectoral opportunities and grow sustainably
• Commissioned a new R&D center at Navi Mumbai, apart from one in Goa
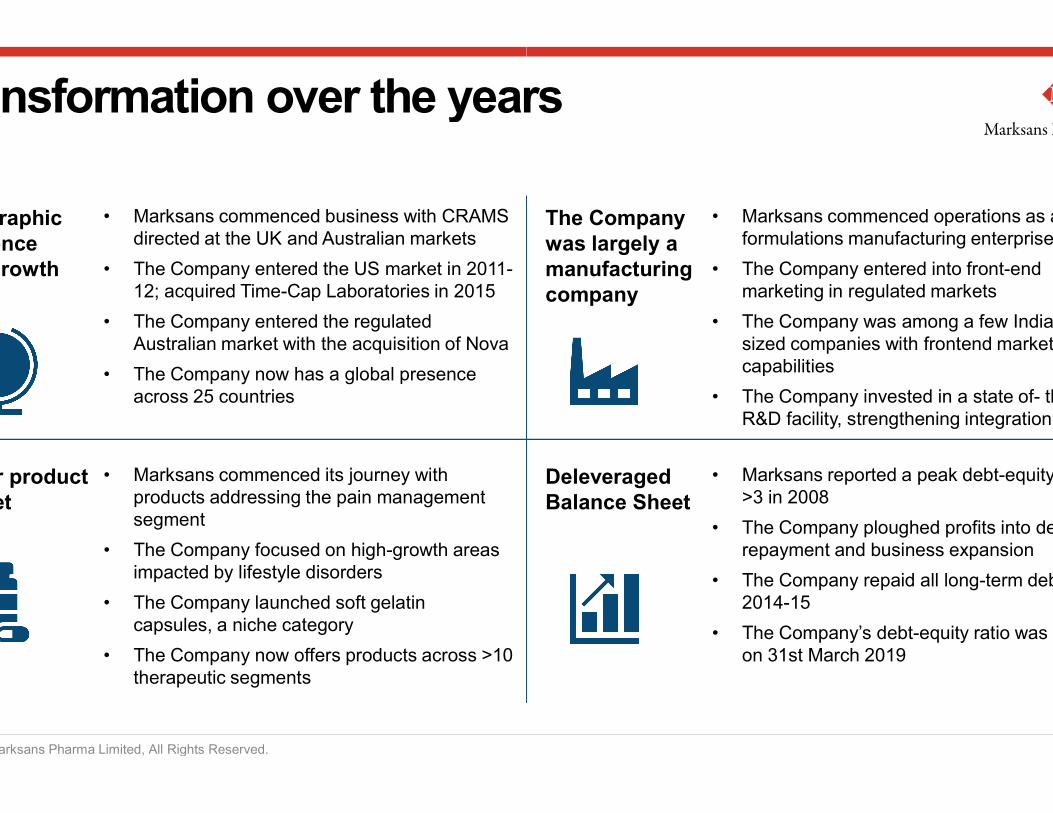
Transformation over the years
Geographicpresenceand growth
• Marksans commenced business with CRAMS directed at the UK and Australian markets
• The Company entered the US market in 2011-12; acquired Time-Cap Laboratories in 2015
• The Company entered the regulated Australian market with the acquisition of Nova
• The Company now has a global presence across 25 countries
Marksans Pharma Limited, All Rights Reserved.
across 25 countries
Wider productbasket
• Marksans commenced its journey with products addressing the pain management segment
• The Company focused on high-growth areas impacted by lifestyle disorders
• The Company launched soft gelatin capsules, a niche category
• The Company now offers products across >10 therapeutic segments
Transformation over the years
The Companywas largely amanufacturingcompany
• Marksans commenced operations as a formulations manufacturing enterprise
• The Company entered into front-end marketing in regulated markets
• The Company was among a few Indian midsized companies with frontend marketing capabilities
• The Company invested in a state of- the
DeleveragedBalance Sheet
• The Company invested in a state of- theR&D facility, strengthening integration
• Marksans reported a peak debt-equity ratio of >3 in 2008
• The Company ploughed profits into debt repayment and business expansion
• The Company repaid all long-term debt in 2014-15
• The Company’s debt-equity ratio was 0.12 as on 31st March 2019

Long-term strategy
Marksans Pharma Limited, All Rights Reserved.
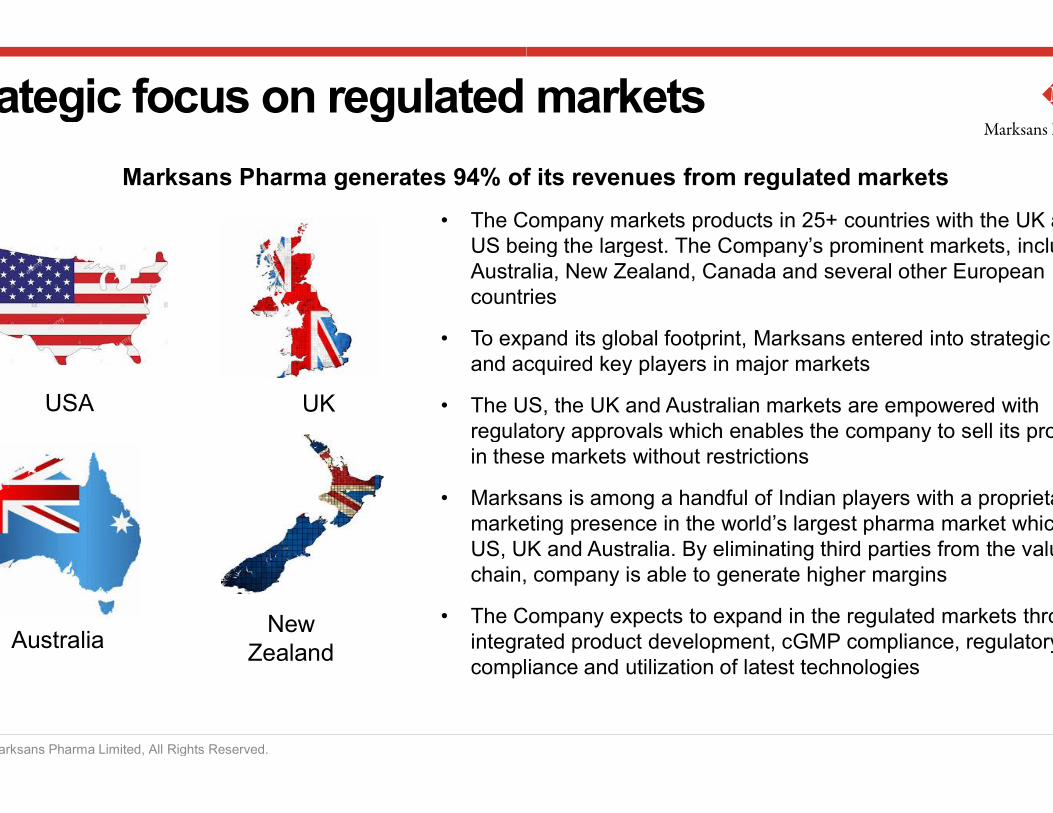
Strategic focus on regulated markets
• The Company markets products in 25+ countries with the UK and the US being the largest. The Company’s prominent markets, include Australia, New Zealand, Canada and several other European countries
• To expand its global footprint, Marksans entered into strategic tieand acquired key players in major markets
• The US, the UK and Australian markets are empowered with USA UK
Marksans Pharma generates 94% of its revenues from regulated markets
Marksans Pharma Limited, All Rights Reserved.
• The US, the UK and Australian markets are empowered with regulatory approvals which enables the company to sell its products in these markets without restrictions
• Marksans is among a handful of Indian players with a proprietary marketing presence in the world’s largest pharma market which is US, UK and Australia. By eliminating third parties from the value chain, company is able to generate higher margins
• The Company expects to expand in the regulated markets through integrated product development, cGMP compliance, regulatory compliance and utilization of latest technologies
USA
New Zealand
UK
Australia
Strategic focus on regulated markets
The Company markets products in 25+ countries with the UK and the US being the largest. The Company’s prominent markets, include Australia, New Zealand, Canada and several other European countries
To expand its global footprint, Marksans entered into strategic tieand acquired key players in major markets
The US, the UK and Australian markets are empowered with
Marksans Pharma generates 94% of its revenues from regulated markets
The US, the UK and Australian markets are empowered with regulatory approvals which enables the company to sell its products in these markets without restrictions
Marksans is among a handful of Indian players with a proprietary marketing presence in the world’s largest pharma market which is US, UK and Australia. By eliminating third parties from the value chain, company is able to generate higher margins
The Company expects to expand in the regulated markets through integrated product development, cGMP compliance, regulatory compliance and utilization of latest technologies

Niche formulations with few competitors
• Differentiated offeringsdifferentiated set of offerings in the crowded generics market
• Limited competition plus other economic, technical and patent constraints there are not many players in this segment
• High barriers to entry
Marksans is currently one of the most active Indian firms focused in Softgel segment
Marksans Pharma Limited, All Rights Reserved.
further restrict entry
• Selectively targeted larger marketsall major markets including USA, UK, Europe, Canada, Australia & Russia. Of this, US alone is potentially a USD9 billion market
• New approvals
• Manufacturing capabilities with regulatory approvalsfacility has a capacity to turn out 2.4 billion softgel capsules per annum, and has all the necessary approvals by USFDA, UKMHRA, TGA & other key regulatory authorities
Niche formulations with few competitors
Differentiated offerings: Focused on softgel capsules with a view to build a differentiated set of offerings in the crowded generics market
Limited competition - Given the challenges in preparing Softgel formulations plus other economic, technical and patent constraints there are not many players in this segment
High barriers to entry – High capex requirements and operational costs
Marksans is currently one of the most active Indian firms focused in Softgel segment
further restrict entry
Selectively targeted larger markets: Marksans has filed softgel products in all major markets including USA, UK, Europe, Canada, Australia & Russia. Of this, US alone is potentially a USD9 billion market
New approvals: 6 new approvals are awaited in US
Manufacturing capabilities with regulatory approvals: Marksans’ Goa facility has a capacity to turn out 2.4 billion softgel capsules per annum, and has all the necessary approvals by USFDA, UKMHRA, TGA & other key regulatory authorities

One of the few mid and small-sized pharma companiesto have a forward integrated business model
R&D and Manufacturing
Goa & Mumbai* (India)
Marksans Pharma Limited, All Rights Reserved.
End Consumers
Supply chain and distribution
Retail chains
Australasia EMEA
sized pharma companiesto have a forward integrated business model
Southport (UK) Farmingdale (US)
*Mumbai has only R&D center in Navi Mumbai
EXPORT
Pharmacy stores Hospitals
UK & Europe North America / Canada ROW
Research & development
Marksans Pharma Limited, All Rights Reserved.
Research & development
R&D continues to be the backbone of the Marksans
Marksans has India’s leading R&D facilities for generic molecules:
• The Company invested in R&D facilities to strengthen the integration
• In FYat Navi Mumbai, apart from one in Goa
• The new R&D facility enhanced the company’s capability to accelerate product development and address a growing demand for new products in USA, UK/EU, Canada, Australia and
Marksans Pharma Limited, All Rights Reserved.
for new products in USA, UK/EU, Canada, Australia and marked by faster turnaround in the generic and OTC segments
• Team of over delivery systems, formulation development and analytical development
• The company continues to maintain regulatory certifications with MHRA, TGA and USFDA, based on recent inspections
• Marksanspossible lead time has given the business a critical competitive advantage
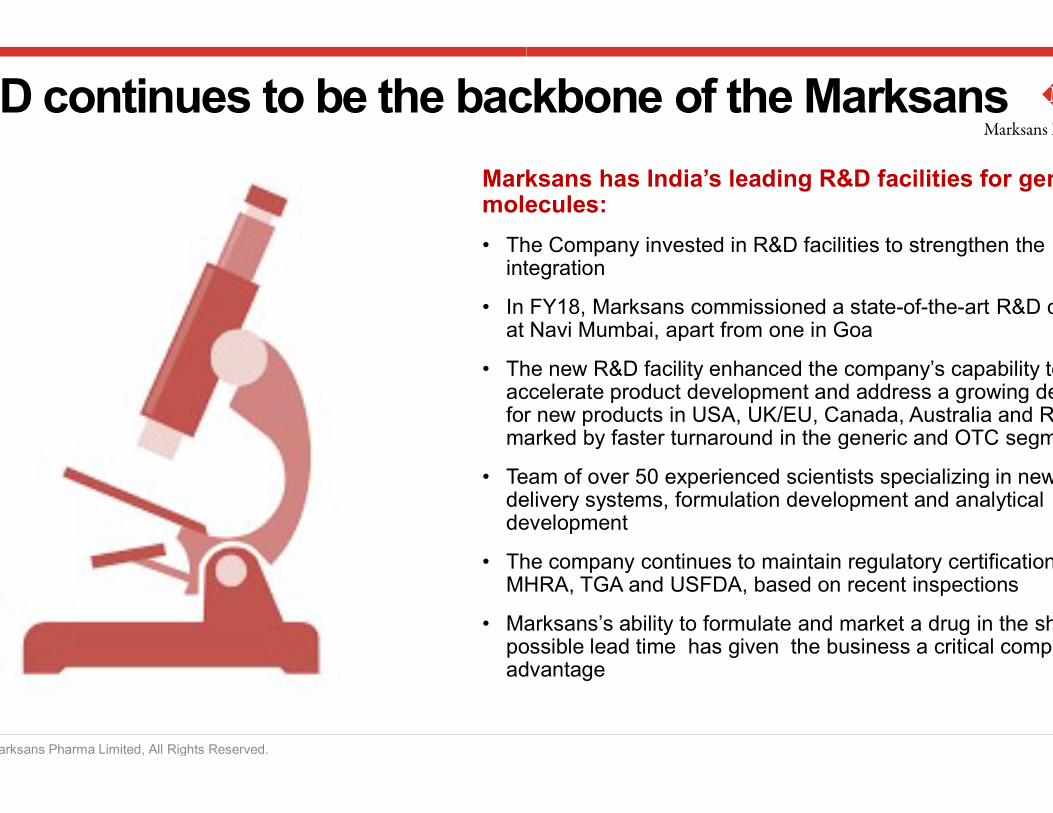
R&D continues to be the backbone of the Marksans
Marksans has India’s leading R&D facilities for generic molecules:
The Company invested in R&D facilities to strengthen the integration
In FY18, Marksans commissioned a state-of-the-art R&D center at Navi Mumbai, apart from one in Goa
The new R&D facility enhanced the company’s capability to accelerate product development and address a growing demand for new products in USA, UK/EU, Canada, Australia and RoWfor new products in USA, UK/EU, Canada, Australia and RoWmarked by faster turnaround in the generic and OTC segments
Team of over 50 experienced scientists specializing in new drug delivery systems, formulation development and analytical development
The company continues to maintain regulatory certifications with MHRA, TGA and USFDA, based on recent inspections
Marksans’s ability to formulate and market a drug in the shortest possible lead time has given the business a critical competitive advantage

Operational review and financials
Marksans Pharma Limited, All Rights Reserved.
Operational review and financials

774.2
913.1
1,004.7
Revenue (₹ Cr.)
Consolidated revenue crossed INR 1000 Cr. in FY19
13.9%
CA
GR
Marksans Pharma Limited, All Rights Reserved.
286.2415.2 413.0
349.4371.5 411.5
105.6
99.1 119.933.0
35.460.3
FY17 FY18 FY19
Revenue by market (₹ Cr.)Europe, UK US & North America Australia & NZ RoW
Consolidated revenue crossed INR 1000 Cr. in FY19
Topline driven by key geographies
• The revenue growth in FY19 was driven by increasing market share in the US & North American region
US Region:• Revenue from the US market grew 10.76% over
FY18, contributing to ~41% of the total revenues• Completed 100% integration with Time-Cap Laboratories • Completed 100% integration with Time-Cap Laboratories
in FY18• Time Cap Labs Inc has achieved revenue of USD 57.91
Millions (FY 18-USD 52.48 Millions)
UK Europe:• Strong product pipeline followed by successful launches
every quarter• In Europe, UK, company targets a focused segments
where competition is low• There is a consistency in the top line generation and will
be followed by existing pipeline and future launches
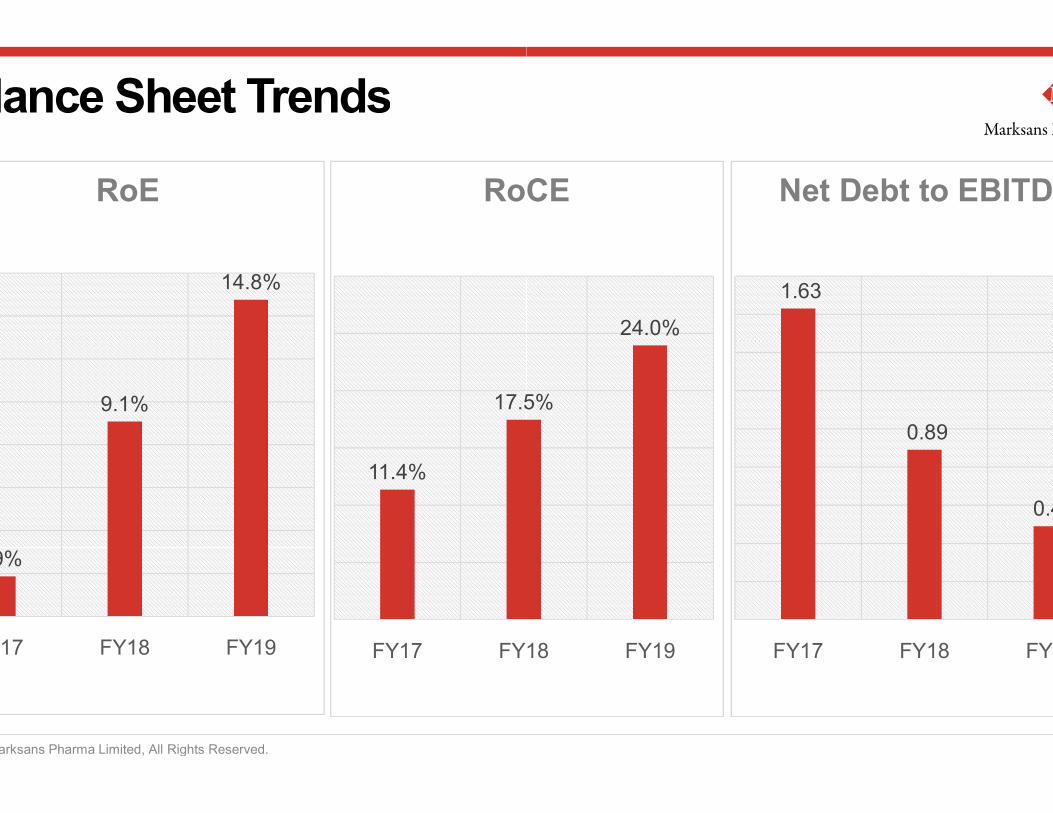
17.5
RoCE
9.1%
14.8%
RoE
Balance Sheet Trends
11.4%
17.5
FY17 FY18
9%
9.1%
FY17 FY18 FY19
Marksans Pharma Limited, All Rights Reserved.
1.63
Net Debt to EBITDA
5%
24.0%
RoCE
0.89
0.49
FY17 FY18 FY19
5%
FY18 FY19

51.8
86.9
136.8
EBITDA (₹ Cr.)C
AG
R
EBITDA margin increased by 418 bps during FY19
6.7%
9.5%
13.6%
EBITDA Margin (%)
62.5%
51.8
FY17 FY18 FY19
Marksans Pharma Limited, All Rights Reserved.
8.8
35.8
80.4
PAT (₹ Cr.)
CA
GR
1.1%
4.3%
7.6%
FY17 FY18 FY19
PAT Margin (%)
201.7%
EBITDA margin increased by 418 bps during FY19
Steady growth in the profitability
• Gross margin improved from 42.68% during FYto 50.20% in FY19 due to better product mix in
• The company reported a 418 bps increaseEBIDTA margin in FY19. This was the resultenriching its product basket with superior productsand higher improved operating efficiency acrossthe businessthe business
• The company reported a 330 bps increase in PATmargin in FY19.
Quarterly Review - Q
Marksans Pharma Limited, All Rights Reserved.
Q1 FY20

Growth in Profitability
“We have had a satisfactory quarter in terms of revenue growth while our EBITDA margins continues to be at a healthy level. We will continue to focus on our strategy of niche products that have minimal competition to drive revenue growth. UK along with US markets will drive the revenue contribution of the Company going forward.”
New product launches in the US and UK markets in the current fiscal would be key to further establishing our
Marksans Pharma Limited, All Rights Reserved.
current fiscal would be key to further establishing our presence in those markets.”
Mark Saldanha, Managing Director, Marksans
Pharma
257.14
247.21
Q4 FY19
Q1 FY20
Revenue (₹ Cr.) 3.86%
Q1
EBITDA (₹ Cr.) 36.31
25.38
34.60
Q4 FY19
Q1 FY20
9.85
22.48
Q4 FY19
Q1 FY20
PAT (₹ Cr.) 128.24%

Business Review
25.4
32.9
21.2 40.5 30.812.8
2.4
25.824.6 12.0
Revenue by market (₹ Cr.)
Column1 RoW Australia & NZ US & North America
Marksans Pharma Limited, All Rights Reserved.
108.2133.9
81.0 89.9 100.9
.1
99.1
118.1 102.2103.6
25.4 21.2 40.5 30.8
Q1 FY19 Q2 FY19 Q3 FY19 Q4 FY19 Q1FY20
Company achieved revenue of Rs. 100.9 crores from Europe, UK: Formulation business as compared to Rs. 108.24 crores achieved during last year same period registering degrowth of 6.8% during the quarter, mainly on account of currency fluctuations
US & North America Formulation business reported growth of 12.5% to Rs. 103.6 crores during the quarter. Time Cap Laboratories Inc (company's 100% Wholly Owned Subsidiary) offers Marksans an ideal platform to further expand its operations in US
Australia & NZ Formulation business revenue was at Rs. 30.8 crores for the quarter registering growth of 21.5% over June quarter in previous year
Rest of World Formulation business was Rs. 11.95 crores
Almost 95.2% of company's total revenue came from regulated markets of US, Europe, Australia and New Zealand

FinancialsPARTICULARS (₹ Cr.) Q1’20
Revenue from Operations 245.03 Other Income 2.18
Total Revenue 247.21
Material Consumption 124.28
Gross Profit 120.76
Gross Margin % 49.28%
Marksans Pharma Limited, All Rights Reserved.
Operating Expenses 88.34
EBITDA 34.60
EBITDA Margin % 13.99%
Finance Cost 2.25
Depreciation and amortization 4.73
Earnings Before Tax 27.61
5.13
Earnings After Tax 22.48
PAT Margin % 9.09%
Q4’19 Q1’19 FY19247.41 235.25 1,000.07 912.69
9.73 3.23 4.62
257.14 238.49 1,004.69 921.17
122.76 115.89 498.00 523.13
124.65 119.36 502.07 389.57
50.38% 50.74% 50.20% 42.68%
109.00 83.88 369.92 311.18
25.38 38.72 136.76
9.87% 16.23% 13.61% 9.43%
2.44 2.40 9.66
6.27 5.96 22.80
16.68 30.36 104.30
6.82 5.48 23.87
9.85 24.88 80.44 35.80
3.83% 10.43% 8.01% 3.89%
Investment Rationale
Marksans Pharma Limited, All Rights Reserved.
Investment Rationale

Company is widening its products portfolio in the complex and highmargin generics segment
The US, the UK and Australian are the key Marksans’ markets with all of them being now empowered with all regulatory approvals
Marksans is among a handful of Indian players with a proprietary marketing presence in the US which is world’s largest pharma market
Marksans is among a few mid and smallhave created an integrated business model by engaging R&D team in creating and filing dossiers across major markets
The new state-of-
Investment Rationale
Marksans Pharma Limited, All Rights Reserved.
The new state-of-on formulations and novel drug delivery systems
Company has repaid longand reinvested the surplus in R&D, capacity creation and brownfield expansion
Company is widening its products portfolio in the complex and highmargin generics segment
The US, the UK and Australian are the key Marksans’ markets with all of them being now empowered with all regulatory approvals
Marksans is among a handful of Indian players with a proprietary marketing presence in the US which is world’s largest pharma market
Marksans is among a few mid and small-sized pharma companies to have created an integrated business model by engaging R&D team in creating and filing dossiers across major markets
-the-art R&D center in Navi Mumbai (Nerul) is focused -the-art R&D center in Navi Mumbai (Nerul) is focused on formulations and novel drug delivery systems
Company has repaid long-term loans, deleveraged the Balance Sheet and reinvested the surplus in R&D, capacity creation and brownfield

© 2019 Marksans Pharma Limited, All Rights Reserved. Marksans Pharma” and The Marksans Pharma Logo are trademarks of Marksans Pharma Limited. In addition to Company data, data from market research agencies, Stock Exchanges and industry publications ha
presentation. This material was used during an oral presentation; it is not a complete record of the discussion. This work maor in any media without the prior written consent. All product names and company names and logos mentioned herein are the tra
Corporate Office: 11th Floor Grandeur, Off Opp Gundecha Symphony, Andheri (W), Mumbai 400 053. Maharashtra
Marksans Pharma Limited, All Rights Reserved.
Pharma Limited, All Rights Reserved. Pharma Limited. In addition to Company data, data from market research agencies, Stock Exchanges and industry publications has been used for this
presentation. This material was used during an oral presentation; it is not a complete record of the discussion. This work may not be used, sold, transferred, adapted, abridged, copied or reproduced in whole on or in part in any manner or form or in any media without the prior written consent. All product names and company names and logos mentioned herein are the trademarks or registered trademarks of their respective owners.
11th Floor Grandeur, Off Veera Desai Road, Symphony, Andheri (W), Mumbai 400 053. Maharashtra - India