INVESTOR PRESENTATION - Seeking Alpha
21
S-0 INVESTOR PRESENTATION OCTOBER 2021 NYSE: LADR A Leading Commercial Real Estate Investment Trust DRAFT (09/30/2021; 4:30 PM) SUPPLEMENTAL DATA FOR THE QUARTER ENDED SEPTEMBER 30, 2021 NYSE: LADR A Leading Commercial Real Estate Investment Trust
-
Upload
khangminh22 -
Category
Documents
-
view
0 -
download
0
Transcript of INVESTOR PRESENTATION - Seeking Alpha

S-0
INVESTOR PRESENTATION
OCTOBER 2021NYSE: LADR
A Leading Commercial Real Estate Investment Trust
DRAFT(09/30/2021;
4:30 PM)
SUPPLEMENTAL DATA FOR THE QUARTER ENDED SEPTEMBER 30, 2021
NYSE: LADR
A Leading Commercial Real Estate Investment Trust
S-1
DISCLAIMERSThis presentation contains forward-looking statements regarding possible or assumed future results of the business, financial condition, plans and objectives of Ladder Capital Corp and its subsidiaries and affiliates (collectively, “Ladder Capital,” “Ladder,” “LADR,” or the “Company”). Any statement concerning future events or expectations, express or implied, is a forward-looking statement. Words such as “may,” “will,” “seek,” “should,” “expect,” “anticipate,” “project,” “estimate,” “intend,” “continue,” or “believe” or the negatives thereof or other variations thereon or comparable terminology are intended to identify forward-looking statements that are subject to risk and uncertainties. Such risks and uncertainties include, among others, the impact of the COVID-19 pandemic and the responsive measures implemented by various governmental authorities, businesses and other third parties, and the risks and uncertainties discussed in the Company’s Annual Report on Form 10-K for the year ended December 31, 2020, and its other filings with the U.S. Securities and Exchange Commission. There can be no assurance that any expectations, express or implied, in a forward-looking statement will prove correct or that the contemplated event or result will occur as anticipated. In particular, there can be no assurance that Ladder will achieve any performance objectives set forth in this presentation. Further, any forward-looking statement speaks only as of the date on which it is made. New risks and uncertainties arise over time, and it is not possible for Ladder to predict those events or their effects on the Company. Except as required by law, Ladder is not obligated to, and does not intend to, update or revise any forward-looking statements, whether as a result of new information, future events or otherwise.
This presentation is strictly for informational purposes. It is not intended to be relied upon as investment advice and is not, and should not be assumed to be, complete. The contents herein are not to be construed as legal, business or tax advice, and each recipient should consult its own attorney, business advisor and tax advisor as to legal, business and tax advice.
Certain information contained herein is based on, or derived from, information provided by independent third-party sources. Ladder believes that such information is accurate and that the sources from which it has been obtained are reliable. However, Ladder cannot guarantee the accuracy of such information and has not independently verified the assumptions on which such information is based. All data is presented as of September 30, 2021, unless otherwise indicated.
This presentation includes certain non-GAAP financial measures. These non-GAAP financial measures should be considered only as supplemental to, and not as superior to, financial measures prepared in accordance with GAAP. Please refer to the Company’s September 30, 2021 Form 10-Q filing and earnings press release, which are available on Ladder’s website (www.laddercapital.com), as well as the supplemental financial tables included herein, for a reconciliation of the non-GAAP financial measures included in this presentation to the most directly comparable financial measures prepared in accordance with GAAP.
Totals may not equal the sum of components due to rounding.

S-2
Earnings andDividends
Investment Activity
Liquidity, Leverage, Financing and Book Value
Portfolio Composition
$5.4 billion in assets, including $2.8 billion of loans (52% of total), $914 million of real estate equity (17%), and $725 million of securities (13%)
79% of assets are senior secured and/or investment grade-rated
86% of loans are floating-rate
Originated $628 million of first mortgage loans, $546 million of which were funded at closing, and also funded $7 million of pre-existing loan commitments
Loan fundings comprised of $503 million of balance sheet loans and $51 million of conduit loans
Received $220 million of repayments of balance sheet loans and sold $73 million of conduit loans
Over $1.2 billion of additional loans currently under application in the pipeline, with $161 million of loans originated in the fourth quarter through 10/27/2021
Sold three CRE equity investments for $64 million of net sales proceeds, contributing $8 million to distributable earnings
Distributable Earnings of $17.0 million and Distributable EPS of $0.14
Declared Q3 2021 cash dividend of $0.20 per LADR share, which represents a 6.8% annual dividend yield2
Increased utilization of non-recourse, non-mark-to-market financing at attractive cost – issued managed CLO with $498 million of financing at L+155 bps weighted-average coupon
$2.8 billion of unencumbered assets (51% of total assets), including $758 million of unrestricted cash
Adjusted Leverage Ratio of 2.1x, or 1.6x net of cash
$1.5 billion GAAP book equity value and $1.7 billion undepreciated book equity value
$13.78 undepreciated book value per share
Note: As of 09/30/2021, unless noted otherwise1. For a description of certain financial and non-GAAP financial measures, see Selected Definitions on page S-202. Based on $11.72 LADR closing stock price on 10/27/2021
THIRD QUARTER 2021 HIGHLIGHTS1

S-3
$2.8 billion total loan portfolio –10% increase vs. 06/30/2021
Note: As of 09/30/20211. Amounts in these charts shown before $33.6 million allowance for loan losses2. Includes mezzanine and subordinate loans
Loan Type1
Property TypeGeography
LOAN PORTFOLIO OVERVIEWLoan Size1
Middle-market focus – $22 million avg. loan size
2

S-4
Q3 2021 Q2 2021 Q1 2021 Q4 2020 Q3 2020
Balance Sheet First Mortgage Loans Carrying Value of Assets (end of quarter) $2,709 $2,414 $1,887 $2,233 $2,609
Origination Volume 578 803 114 – –
Funding Volume 503 689 119 11 9
Weighted-Average Coupon (end of quarter) 5.4% 5.6% 6.0% 6.1% 6.1%
Weighted-Average LTV (end of quarter) 67% 68% 69% 67% 67%
Loan Sale Volume – – $47 $101 $7
Other (Mezzanine/Subordinate) Loans Carrying Value of Assets (end of quarter) $102 $117 $121 $121 $122
Origination / Funding Volume – – – – –
Mezz. / Subordinate Loans % of Total Assets 1.9% 2.1% 2.2% 2.1% 1.9%
Weighted-Average Coupon (end of quarter) 10.9% 10.9% 10.8% 10.9% 10.9%
Weighted-Average LTV (end of quarter) 68% 68% 67% 67% 67%
Conduit First Mortgage Loans Carrying Value of Assets (end of quarter) $38 $59 $71 $31 $31
Origination / Funding Volume 51 35 41 – –
Weighted-Average Coupon (end of quarter) 3.9% 4.2% 4.2% 4.1% 4.1%
Loan Sale Volume $73 $48 – – $60
Allowance for Loan Losses ($34) ($36) ($36) ($42) ($47)
Total Loan Portfolio
Carrying Value of Assets (end of quarter) $2,815 $2,554 $2,043 $2,343 $2,715
Weighted-Average Yield (end of quarter) 6.0% 6.1% 6.5% 6.7% 7.0%
($ in millions)
LOANS SEGMENT SUMMARY
1. Excludes the impact of non-accrual loans. For additional details on non-accrual loans, please refer to the Company’s 10-Q and 10-K filings
1
1
1

S-5
09/30/2021 06/30/2021 03/31/2021 12/31/2020 09/30/2020
Carrying Value of Assets $725 $719 $764 $1,058 $1,448
Weighed-Average Yield 1.8% 1.7% 1.7% 1.7% 1.6%
Number of CUSIPs 103 105 111 123 134
Average CUSIP Size $7.0 $6.8 $6.9 $8.6 $10.8
Weighted-Average Duration 2.2 Years 2.0 Years 1.9 Years 2.0 Years 2.1 Years
% AAA-Rated or Agency-Backed 86% 89% 85% 89% 92%
% Investment Grade-Rated 99% + 99% + 99% + 99% + 99% +
40% 40%
13%
1% 6%
40%
80%
93% 94%100%
0%
20%
40%
60%
80%
100%
0-1 year 1-3 years 3-5 years 5-7.5 years >7.5 years
($ in millions)
Securities Portfolio Duration Profile (as of 09/30/2021)
Cumulative Portfolio Weighting
$287million
$578million
$680 million$671
million
$725million
$45million
$291million
$291million
Category Portfolio Weighting
$9million
Highly-rated, short-duration, highly-liquid securities portfolio
SECURITIES SEGMENT SUMMARY
$93million

S-6
Q3 2021 Q2 2021 Q1 2021 Q4 2020 Q3 2020
Net Leased Commercial Real Estate (100% Owned)
Acquisitions – – – $1 –
Net Sales Proceeds 38 39 – – 19
Carrying Value of Assets (end of quarter) 613 642 669 675 679
Square Feet (end of quarter) 5,187,011 5,367,071 5,470,751 5,470,751 5,461,651
Net Operating Income (Rental Income) $13.9 $13.8 $14.3 $14.1 $14.4
Diversified Commercial Real Estate 1
Acquisitions $20 – $44 $4 –
Net Sales Proceeds 26 – 44 4 44
Carrying Value of Assets (end of quarter) 302 306 308 310 311
Square Feet (end of quarter) 2,327,271 2,258,433 2,258,433 2,258,433 2,258,433
Net Operating Income $5.3 $5.4 $3.7 $3.9 $2.9
Condominium Residential Real Estate 1
Net Sales Proceeds – – – $1 $0.3
Carrying Value of Assets (end of quarter) – – – – 1
Remaining Condo Units (end of quarter) – – – – 2
Unit Sale Price as % of GAAP Book Value – – – 82% 92%
Total Real Estate Portfolio
Carrying Value of Assets (end of quarter) $914 $948 $977 $985 $991
($ in millions)
REAL ESTATE SEGMENT SUMMARY09/30/2021 Real Estate
Portfolio Snapshot
1. All metrics shown on a consolidated basis2. Includes additions to portfolio from foreclosure
2
Geography
Property Type

S-7
($ in millions)
INVESTMENT PORTFOLIO SUMMARY
Investment Portfolio Distributable Earnings Contribution(as of 09/30/2021) (Nine Months Ended 09/30/2021)
Carrying Value % of Total Amount of % of TotalInvestment Type of Assets Assets Contribution Contribution
Conduit First Mortgage Loans $38 1% $5.2 4% Balance Sheet First Mortgage Loans 2,709 50% 67.8 52% Other (Mezzanine / Subordinate) Loans 102 2% 10.5 8% Allowance for Loan Losses (34) (1%) – – Total Loans $2,815 52% $83.5 65%
Securities $725 13% $4.1 3%
Net Leased Commercial Real Estate $613 11% $36.7 28% Diversified Commercial Real Estate 302 6% 5.1 4% Total Real Estate Equity Properties $914 17% $41.8 32%
Investments in Unconsolidated Joint Ventures $26 0% – –
Total Investment Assets $4,480 83% $129.4 100%
Cash and Cash Equivalents (unrestricted) $758 14% Restricted Cash 85 2% Accrued Interest Receivable & Other Assets 92 2%
Total Assets $5,416 100% $129.4 100%
Corporate Bond & Revolver Interest Expense (67.2) (52%) Corporate Operating Expenses / Other (28.5) (22%)
Total Distributable Earnings $33.6 26%

S-8
Snapshot of Business Lines Total Assets & Liabilities, Book Equity, Leverage and ROE
Balance Sheet Loans Net Leased Commercial Real Estate (100% Owned) Total AssetsCarrying Value of Assets $2,811 Carrying Value of Assets $613 Cash & Cash Equivalents $758Secured Financing on Assets 859 Undepreciated Book Value of Assets 773 Loans, Securities & Real Estate 4,727Net Equity Invested (excl. Corporate Debt) 1,952 Secured Financing on Assets 502 Accumulated Depreciation & Amortization (240)% First Mortgage 96% Net Equity Invested (excl. Corporate Debt) 271 Other
5 170% Other (Mezzanine / Subordinate) 4% Total Square Feet 5,187,011 Total Assets 5,416Weighted-Average Coupon 5.6% Weighted-Average % Leased 100%Origination Volume (LTM) $1,495 In-Place Annual Net Operating Income (NOI) $49.7 Total LiabilitiesFunding Volume (LTM) 1,321 Accounting method: carried at depreciated book value Unsecured Corporate Bonds $1,630
Accounting method: carried at amortized cost Unsecured Revolving Credit Facility –Total Unsecured Debt 1,630
Conduit Loans Diversified Commercial Real Estate 2,
3 Secured Financing 2,135Carrying Value of Assets $38 Carrying Value of Assets $302 Total Debt 3,766Secured Financing on Assets – Undepreciated Book Value of Assets 381 Other
6 141Net Equity Invested (excl. Corporate Debt) 38 Secured Financing on Assets 221 Total Liabilities 3,906Weighted-Average Coupon 3.9% Net Equity Invested (excl. Corporate Debt) 160Origination Volume (LTM) $127 Total Square Feet 2,327,271 Book Equity ValueLoan Sale Volume (LTM) 121 Weighted-Average Occupancy
4 87.6% GAAP Book Equity Value (excl. NCI in JVs) $1,503Accounting method: carried at lower of cost or FMV In-Place Annual Net Operating Income (NOI) $21.2 Total Shares Outstanding (mm) 125.5
Weighted-Average % Owned by Ladder 84.0% GAAP Book Value per Share 7 $11.98
Accounting method: carried at depreciated book value Undepreciated Book Value per Share 7 $13.78
SecuritiesCarrying Value of Assets $725 LeverageSecured Financing on Assets 553 Adjusted Debt (for Adjusted Leverage Ratio)
7 $3,208Net Equity Invested (excl. Corporate Debt) 172 Total GAAP Book Equity (incl. NCI in JVs) 1,510% First Mortgage Secured 100% Adjusted Leverage Ratio
7 2.1x% AAA-Rated or Agency-Backed 86%% Investment Grade-Rated 99% + Return on Average Equity
7
Average CUSIP Size $7.0 Distributable Earnings (LTM) $39Weighted-Average Duration 2.2 Years Average Book Equity Value (LTM) 1,523
Accounting method: carried at FMV After-Tax Distributable ROAE (LTM) 2.7%
Note: As of 09/30/20211. Pre-tax and pre-overhead allocation2. All metrics shown on a consolidated basis, except weighted-average % owned by Ladder, which excludes the potential effects of partnership /joint venture promote/sharing arrangements3. Excludes two unconsolidated joint venture investments with total book value of $26.1 million as of 09/30/20214. Excludes hotel assets5. Includes restricted cash, investments in unconsolidated joint ventures, accrued interest receivable, allowance for loan losses and other assets6. Includes derivative instruments, dividends payable, accrued expenses and other liabilities7. For a description of these GAAP and non-GAAP financial measures, see Selected Definitions on page S-20
B
C
D
E
A B C D E
($ in millions, except per share amounts)
A
LADDER SNAPSHOT

S-9
CAPITAL STRUCTURE UPDATE

S-10
09/30/2021 Capitalization Summary ($mm)
$5.3BTotal
Capitalization
Adjusted Debt/Equity (Adjusted Leverage Ratio):
Net Adjusted Debt1 (excluding Cash) /Equity Ratio:
Net Adjusted Debt (excluding Cash) & Excluding Securities2 /Equity Ratio:
Non-Mark-to-Market Financing3 + Book Equity :
Non-Recourse & Unsecured Debt + Book Equity :
2.1x
1.6x
1.1x
87%4
87%4
1. Excludes total cash on balance sheet of $844 million2. Excludes total cash on balance sheet of $844 million and securities of $725 million3. Non-mark-to-market financing includes financing that is subject to credit events only4. Represents percentage of total capitalization
DIVERSE AND ROBUST CAPITAL STRUCTUREWITH MODEST LEVERAGE

S-11
Superior access to capital with diversified financing sources and substantial undrawn capacity
1. Includes extensions at Company’s option2. Secured by stock of selected unrestricted subsidiaries3. Includes $493 million of matched-term financing. Maturity shown is illustrative and based on expected duration of assets financed4. Includes $147 million of outstanding committed loan repurchase financing and $52 million of outstanding committed securities repurchase financing
LONG & STRONG LIABILITY STRUCTURE
Remaining Debt Maturities by Financing Type 1
($mm; as of 09/30/2021)
4
3
Maturity Year (weighted-average, where applicable)
Facility Size Outstanding 2021 2022 2023 2024 2025 2026 2027 2028 2029
$1,916 $1,630 Total Unsecured Debt (43% of total debt)
$5,227 $3,528 Total Unsecured & Committed Secured Debt (94% of total debt)
$5,227 $3,766 Total Financing
– 238 Uncommitted Repo
263 263 FHLB Financing
1,600 199
161 154
563 558
Committed Bilateral Bank Facilities (7 facilities) 4
Non-Recourse CLO Financing 3
Non-Recourse Koch Financing
348 346 5.250% Unsecured Bonds
4.250% Unsecured Bonds645652
723 723 Non-Recourse Mortgage Debt on Owned Real Estate
Unsecured Syndicated Revolving Credit Facility 2
Issuance / Debt
266 –
$650 $640 4.750% Unsecured Bonds
S-12
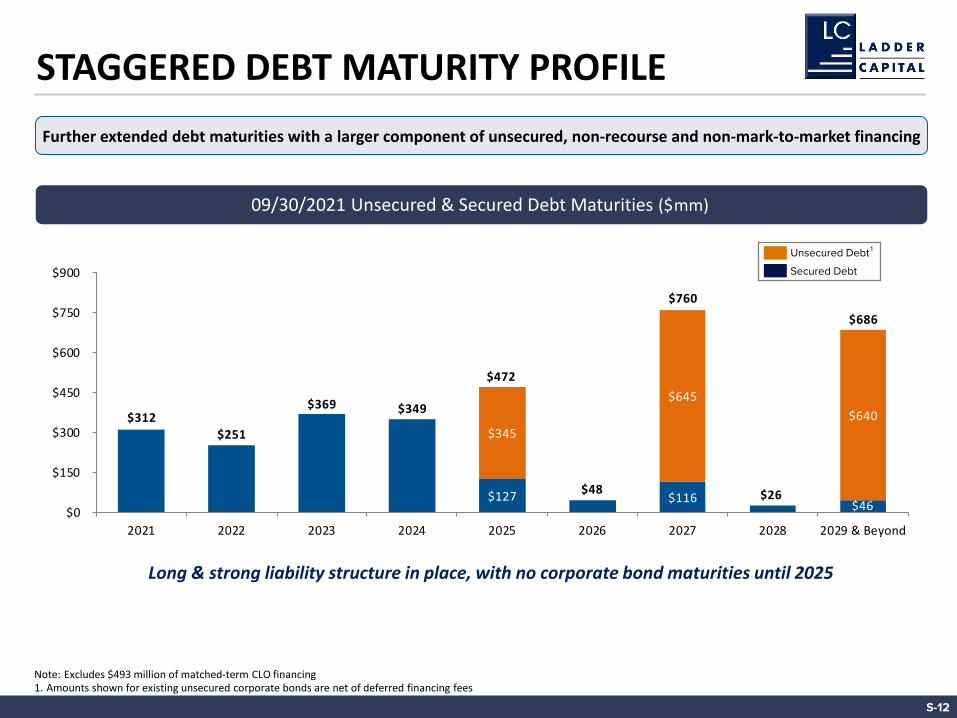
STAGGERED DEBT MATURITY PROFILEFurther extended debt maturities with a larger component of unsecured, non-recourse and non-mark-to-market financing
Note: Excludes $493 million of matched-term CLO financing1. Amounts shown for existing unsecured corporate bonds are net of deferred financing fees
Secured Debt
Unsecured Debt 1
09/30/2021 Unsecured & Secured Debt Maturities ($mm)
Long & strong liability structure in place, with no corporate bond maturities until 2025
$127 $116 $46
$345
$645 $640 $312
$251
$369 $349
$472
$48
$760
$26
$686
$0
$150
$300
$450
$600
$750
$900
2021 2022 2023 2024 2025 2026 2027 2028 2029 & Beyond

S-13
$2.8BTotal
UnencumberedAssets
SUBSTANTIAL, HIGH-QUALITY UNENCUMBERED ASSET POOL
Total Unencumbered Asset Pool ($mm) Key Unencumbered Asset Pool Highlights
✓ 51% of total asset base is composed of unencumbered assets
✓ 82% of unencumbered assets are cash, first mortgage loans or investment grade securities
Note: As of 09/30/20211. Represents undepreciated asset value2. Calculated by deducting unrestricted cash from the numerator and denominator
Predominantly senior, financeable, oversized unencumbered asset base
1.69x unencumbered asset/unsecured debt ratio ($805 million in excess of the 1.20x covenant)
2.27x unencumbered asset/unsecured debt ratio net of unrestricted cash2
$1.4 billion of unencumbered senior secured first mortgage loans
$758 million of unencumbered unrestricted cash
1

S-14
1. Excludes $5.4 million of noncontrolling interest in consolidated joint ventures2. Includes purchase of treasury stock and acquisition of shares to satisfy tax withholding on vesting restricted stock3. Excludes $6.6 million of noncontrolling interest in consolidated joint ventures
BOOK EQUITY VALUE ROLL-FORWARD
$13.79$12.00
$13.78$11.98
Book Value per Share(Undepreciated & GAAP)
1 32
= Undepreciated Book Value
Book Value per Share(Undepreciated & GAAP)
Summary of Changes to Book Equity Value During Q3 2021 ($mm)
$1,514 $1,503 $19
$3
$1,741
($25) ($1) ($7)
$1,729
06/30/2021Book Equity Value
Net Income /(Loss)
Distributions & Dividends
Other ComprehensiveIncome
(Securities PortfolioMark-to-Market)
Equity-BasedCompensation
Stock Repurchases/Other
09/30/2021Book Equity Value

S-15
DETAILED QUARTERLY FINANCIALS

S-16
INCOME STATEMENT BY QUARTER
1. For a description of these non-GAAP financial measures, see Selected Definitions on page S-20
($ in millions, except per share values) Q3 2021 Q2 2021 Q1 2021 Q4 2020 Q3 2020
Net interest incomeInterest income $46.2 $37.6 $39.3 $50.5 $54.6Interest expense 49.3 45.2 46.0 51.2 56.4
Net interest income ($3.1) ($7.6) ($6.7) ($0.7) ($1.8)Provision for (release of) loan loss reserves (2.4) (0.3) (4.3) (5.1) (2.5)
Net interest income after provision for (release of) loan losses ($0.7) ($7.3) ($2.4) $4.4 $0.7Other income
Real estate operating income 26.6 26.6 24.2 24.7 25.5Sale of loans, net 3.3 3.4 – (3.0) 1.1Realized gain (loss) on securities 0.3 0.0 0.6 (0.3) (0.3)Unrealized gain (loss) on Agency interest-only securities (0.0) (0.0) (0.0) 0.1 0.0Realized gain on sale of real estate, net 17.8 19.4 – (0.0) 21.6Fee and other income 2.7 2.5 3.3 4.6 3.1Net result from derivative transactions 0.1 (3.8) 4.8 0.7 0.3Earnings (loss) from investment in unconsolidated joint ventures 0.5 0.2 0.4 0.5 0.4Gain (loss) on extinguishment / defeasance of debt – – – 0.0 1.2
Total other income $51.2 $48.1 $33.2 $27.2 $52.8Costs and expenses
Salaries and employee benefits 9.4 8.5 9.5 26.2 7.9Operating expenses 4.4 4.2 4.2 4.3 3.9Real estate operating expenses 7.0 6.3 6.2 6.5 8.1Fee expense 1.6 2.2 1.6 1.4 2.5Depreciation and amortization 9.3 9.5 9.5 9.4 9.8
Total costs and expenses $31.8 $30.7 $31.1 $47.9 $32.1Income (loss) before taxes $18.7 $10.1 ($0.3) ($16.3) $21.4
Income tax expense (benefit) (0.2) (0.3) (0.8) (4.7) 0.0Net income (loss) $18.9 $10.5 $0.4 ($11.6) $21.4
Net (income) loss attributable to noncontrolling interest in consolidated joint ventures (0.0) (0.2) (0.2) (0.1) (4.1)Net (income) loss attributable to noncontrolling interest in operating partnership – – – (0.0) (0.0)
Net income (loss) attributable to Class A common shareholders $18.9 $10.3 $0.2 ($11.7) $17.2Earnings per share:
Basic $0.15 $0.08 $0.00 ($0.10) $0.15Diluted 0.15 0.08 0.00 (0.10) 0.14
Weighted average shares outstanding (mm): Basic 123.7 124.0 124.0 118.9 117.5Diluted 124.5 124.5 124.3 118.9 118.8
Distributable Earnings (pre-tax) 1 $17.0 $13.4 $3.2 $4.9 $19.7
Distributable EPS (after-tax) 1 $0.14 $0.10 $0.04 $0.05 $0.16

S-17
DISTRIBUTABLE EARNINGS, EPS AND ROAE RECONCILIATIONS BY QUARTER1
1. For a description of these non-GAAP financial measures, see Selected Definitions on page S-202. For additional detail on these adjustments, please refer to the Company’s public filings and earnings press releases
($ in millions, except per share values) Q3 2021 Q2 2021 Q1 2021 Q4 2020 Q3 2020
Net income (loss) $18.9 $10.5 $0.4 ($11.6) $21.4
Income tax expense (benefit) (0.2) (0.3) (0.8) (4.7) 0.0Income (loss) before taxes $18.7 $10.1 ($0.3) ($16.3) $21.4
(0.0) (0.2) (0.2) (0.1) (4.2)Our share of real estate depreciation, amortization and gain adjustments (0.8) (2.4) 8.4 7.7 4.5Adjustments for unrecognized derivative results (2.4) 1.8 (6.1) (2.0) (4.2)Unrealized (gain) loss on fair value securities 0.0 0.0 0.0 (0.1) (0.0)
0.9 0.8 0.4 0.4 0.5
Adjustment for impairment (2.4) (0.3) (4.3) (6.2) (2.5)Non-cash stock-based compensation 3.1 3.5 5.3 22.2 4.1Transactional adjustments
2 – – – (0.7) –Distributable earnings $17.0 $13.4 $3.2 $4.9 $19.7
Distributable estimated corporate tax benefit (expense) (0.0) (1.0) 1.8 1.5 (0.4)After-tax distributable earnings $17.0 $12.4 $5.0 $6.4 $19.4
Adjusted weighted average shares outstanding (diluted) (mm) 124.5 124.5 124.3 118.9 118.8Distributable EPS $0.14 $0.10 $0.04 $0.05 $0.16
Last TwelveMonths (LTM) Year-to-Date:
Ended 09/30/2021 09/30/2021
Distributable earnings $38.6 $33.6 $17.0 $13.4 $3.2 $4.9 $19.7Average book equity 1,523.2 1,521.0 1,508.7 1,520.0 1,534.4 1,529.8 1,509.0
Pre-tax Distributable ROAE 2.5% 2.9% 4.5% 3.5% 0.8% 1.3% 5.2%
After-tax distributable earnings $40.9 $34.4 $17.0 $12.4 $5.0 $6.4 $19.4Average book equity 1,523.2 1,521.0 1,508.7 1,520.0 1,534.4 1,529.8 1,509.0
After-tax Distributable ROAE 2.7% 3.0% 4.5% 3.3% 1.3% 1.7% 5.1%
Adjustment for economic gain on loan sales not recognized under GAAP for which risk has been substantially transferred, net of reversal / amortization
Net (income) loss attributable to noncontrolling interest in consolidated joint ventures (GAAP)

S-18
BALANCE SHEET BY QUARTER
1. The Company reclassified its FHLB stock into other assets as of January 1, 2021. As such, the amount of $31.0 million from December 31, 2020 was reclassified into other assets on the 1. Company’s consolidated balance sheet. As of September 30, 2021, the book value of our investment in FHLB Stock was $11.8 million2. For a description of these non-GAAP financial measures, see Selected Definitions on page S-203. For a description of these financial measures, see Selected Definitions on page S-20
($ in millions, except per share values) 09/30/2021 06/30/2021 03/31/2021 12/31/2020 09/30/2020
AssetsCash and cash equivalents $758.1 $1,169.8 $1,305.7 $1,254.4 $875.8Restricted cash 85.5 115.8 146.4 29.9 41.9Mortgage loan receivables held for investment, net, at amortized cost 2,777.5 2,495.2 1,971.5 2,312.6 2,684.2Mortgage loan receivables held for sale 37.5 59.2 71.5 30.5 30.6Real estate securities 724.7 719.2 764.1 1,058.3 1,447.6Real estate and related lease intangibles, net 914.4 948.4 977.0 985.3 990.6Investments in unconsolidated joint ventures 26.1 37.8 44.5 46.3 49.2Derivative instruments 0.2 – 0.3 0.3 0.4Accrued interest receivable 14.0 12.8 13.3 16.1 18.3Other assets
1 78.1 58.6 111.6 147.6 220.9Total assets $5,416.0 $5,616.8 $5,405.8 $5,881.2 $6,359.5
LiabilitiesDebt obligations, net $3,765.8 $3,975.7 $3,767.8 $4,209.9 $4,714.5Dividends payable 27.2 27.0 26.5 27.5 26.2Accrued expenses 39.0 38.2 27.0 43.9 36.2Other liabilities 74.5 56.1 53.6 51.5 60.7
Total liabilities $3,906.5 $4,096.9 $3,875.0 $4,332.8 $4,837.7Equity
Class A common stock, par value $0.001 per share $0.1 $0.1 $0.1 $0.1 $0.1Additional paid-in capital 1,791.9 1,788.9 1,785.3 1,780.1 1,726.3Treasury stock (76.2) (68.6) (67.5) (62.9) (54.5)Retained earnings (dividends in excess of earnings) (209.8) (203.7) (188.8) (163.7) (127.0)Accumulated other comprehensive income (loss) (3.1) (2.2) (3.6) (10.5) (28.4)
Total shareholders' equity $1,502.9 $1,514.5 $1,525.6 $1,543.2 $1,516.5
Noncontrolling interest in consolidated joint ventures 6.6 5.4 5.2 5.3 5.3Total equity $1,509.6 $1,519.9 $1,530.8 $1,548.4 $1,521.8Total liabilities and equity $5,416.0 $5,616.8 $5,405.8 $5,881.2 $6,359.5
Adjusted Leverage Ratio 2 2.1x 2.5x 2.3x 2.5x 2.9x
Total Shares Outstanding (mm) 125.5 126.2 126.3 126.4 120.3
GAAP Book Value per Share 3 $11.98 $12.00 $12.08 $12.21 $12.61
Undepreciated Book Value per Share 2 $13.78 $13.79 $13.88 $13.94 $14.35
Distributions per LADR Share $0.20 $0.20 $0.20 $0.20 $0.20

S-19
BOOK EQUITY, SHARECOUNT, AND ADJUSTEDLEVERAGE GAAP RECONCILIATION BY QUARTER
1. For a description of these financial measures, see Selected Definitions on page S-202. For a description of these non-GAAP financial measures, see Selected Definitions on page S-20
($ in millions, except per share values) 09/30/2021 06/30/2021 03/31/2021 12/31/2020 09/30/2020
Beginning book equity balance $1,519.9 $1,530.8 $1,548.4 $1,521.8 $1,508.4Net income (loss) 18.9 10.5 0.4 (11.6) 21.4Dividends / distributions (25.2) (25.3) (25.5) (25.2) (30.4)Changes in other comprehensive income (OCI) (0.9) 1.4 6.8 18.0 18.7Issuance of common stock, net of offering costs – – – 32.0 –Other (3.2) 2.4 0.6 13.5 3.7
Ending book equity balance (Total equity) $1,509.6 $1,519.9 $1,530.8 $1,548.4 $1,521.8
Noncontrolling interest in consolidated joint ventures (JVs) (6.6) (5.4) (5.2) (5.3) (5.3)Total shareholders' equity $1,502.9 $1,514.5 $1,525.6 $1,543.2 $1,516.5
Average book equity balance excluding noncontrolling interest in consolidated JVs $1,508.7 $1,520.0 $1,534.4 $1,529.8 $1,509.0
Accumulated depreciation & amortization – net leased commercial real estate 160.4 161.4 158.2 151.8 145.5Accumulated depreciation & amortization – diversified commercial real estate 79.2 78.1 82.3 79.1 75.9Accumulated depreciation & amortization – condominium residential real estate – – – – 0.1Less: JV noncontrolling interests' share of accumulated real estate depreciation & amortization (13.3) (12.9) (12.6) (12.2) (11.9)
Accumulated real estate depreciation & amortization – our share $226.4 $226.6 $228.0 $218.7 $209.6
Undepreciated book value $1,729.3 $1,741.1 $1,753.6 $1,761.8 $1,726.1
Class A shares outstanding (mm) 125.5 126.2 126.3 126.4 120.3Class B shares outstanding (mm) – – – – –
Total shares outstanding (mm) 125.5 126.2 126.3 126.4 120.3
GAAP Book Value per Share 1 $11.98 $12.00 $12.08 $12.21 $12.61
Undepreciated Book Value per Share 2 $13.78 $13.79 $13.88 $13.94 $14.35
Debt obligations GAAP reconciliationCommitted loan repurchase facilities $146.9 $218.4 $238.6 $255.4 $353.8Committed securities repurchase facility 52.3 62.9 63.1 149.6 352.2Uncommitted securities repurchase facility 237.5 244.4 275.0 415.8 471.0Revolving Credit Facility – – 256.4 266.4 266.4Mortgage loan financing, net of unamortized debt issuance costs 723.4 746.0 765.1 766.1 770.0Other secured loan financing facility 154.5 152.1 194.7 192.6 190.6CLO debt, net of unamortized debt issuance costs 557.9 168.8 233.2 276.5 281.6Borrowings from the FHLB 263.0 288.0 288.0 288.0 326.0Senior unsecured notes, net of unamortized debt issuance costs 1,630.3 2,095.1 1,453.7 1,599.4 1,702.9
Debt obligations, net $3,765.8 $3,975.7 $3,767.8 $4,209.9 $4,714.5
Less: CLO debt (557.9) (168.8) (233.2) (276.5) (281.6)Adjusted debt obligations $3,207.8 $3,806.9 $3,534.6 $3,933.3 $4,432.9
Total equity $1,509.6 $1,519.9 $1,530.8 $1,548.4 $1,521.8
Adjusted leverage ratio 2.1x 2.5x 2.3x 2.5x 2.9x

S-20
SELECTED DEFINITIONS• Adjusted Leverage Ratio (non-GAAP)
Total debt obligations, net of deferred financing costs, adjusted for non-recourse indebtedness related to securitizations that is consolidated on our GAAP balance sheet and liability for transfers not considered sales, divided by GAAP total equity.
• After-Tax Distributable Return on Average Equity (After-Tax Distributable ROAE) (non-GAAP)
After-Tax Distributable Earnings divided by average book equity balance excluding total noncontrolling interest in consolidated joint ventures.
• Distributable Earnings (non-GAAP)
Income before taxes adjusted for: (i) real estate depreciation and amortization; (ii) the impact of derivative gains and losses related to the hedging of assets on our balance sheet as of the end of the specified accounting period; (iii) unrealized gains/(losses) related to our investments in fair value securities and passive interest in unconsolidated joint ventures; (iv) economic gains on loan sales not recognized under GAAP accounting for which risk has substantially transferred during the period and the exclusion of resultant GAAP recognition of the related economics during the subsequent periods; (v) unrealized provision for loan losses and unrealized real estate impairment; (vi) realized provisions for loan losses and realized real estate impairment; (vii) non-cash stock-based compensation; and (viii) certain transactional items.
• Distributable EPS (non-GAAP)
After-Tax Distributable Earnings divided by adjusted weighted-average shares outstanding.
• GAAP Book Value per Share Total shareholders’ equity divided by Class A common shares outstanding.
• Pre-Tax Distributable Return on Average Equity (Pre-Tax Distributable ROAE) (non-GAAP)
Distributable Earnings divided by average book equity balance excluding total noncontrolling interest in consolidated joint ventures.
• Undepreciated Book Equity and Undepreciated Book Value per Share (non-GAAP)
Total equity, adjusted to exclude total noncontrolling interest in consolidated joint ventures and adjusted to include our share of total real estate accumulated depreciation and amortization. Per share information is derived by dividing the preceding amount by total diluted shares outstanding.