Investor Presentation 4Q21
25
Investor Presentation 4Q21
-
Upload
khangminh22 -
Category
Documents
-
view
0 -
download
0
Transcript of Investor Presentation 4Q21

Investor Presentation
4Q21
2
DisclaimerThis presentation has been prepared by Cango Inc. (the “Company”) solely for information purpose and has not been independently verified. By viewing or accessing the information contained in this material, the recipient hereby acknowledges and agrees that no representations, warranties or undertakings, express or implied, are made by the Company or any of its directors, shareholders, employees, agents, affiliates, advisors or representatives or the underwriters as to, and no reliance should be placed upon, the accuracy, fairness, completeness or correctness of the information or opinions presented or contained in this presentation. None of the Company or any of its directors, shareholders, employees, agents, affiliates, advisors or representatives or the underwriters accept any responsibility whatsoever (in negligence or otherwise) for any loss howsoever arising from any information presented or contained in this presentation or otherwise arising in connection with the presentation. The information presented or contained in this presentation is subject to change without notice and its accuracy is not guaranteed.
Certain statements in this presentation, and other statements that the Company may make, are forward-looking statements within the meaning of Section 27A of the Securities Act and Section 21E of the Securities Exchange Act of 1934, as amended. These statements reflect the Company’s intent, beliefs or current expectations about the future. These statements can be recognized by the use of words such as “expects,” “plans,” “will,” “estimates,” “projects,” “intends,” “anticipates,” “believes,” “confident” or words of similar meaning. These forward-looking statements are not guarantees of future performance and are based on a number of assumptions about the Company’s operations and other factors, many of which are beyond the Company’s control, and accordingly, actual results may differ materially from these forward-looking statements. The Company or any of its affiliates, advisers or representatives or the underwriters has no obligation and does not undertake to revise forward-looking statements to reflect future events or circumstances.
This presentation does not constitute an offer to sell or issue or an invitation or recommendation to purchase or subscribe for any securities of the Company for sale in the United States or anywhere else. No securities of the Company may be sold in the United States without registration with the United States Securities and Exchange Commission (the “SEC”) or an exemption from such registration pursuant to the Securities Act of 1933, as amended (the “Securities Act”) and the rules and regulations thereunder. No part of this presentation shall form the basis of or be relied upon in connection with any contract or commitment whatsoever. Specifically, these materials do not constitute a “prospectus” within the meaning of the Securities Act. This presentation does not contain all relevant information relating to the Company or its securities, particularly with respect to the risks and special considerations involved with an investment in the securities of the Company and is qualified in its entirety by reference to the detailed information in the Company’s latest annual report on Form 20-F.
In evaluating our business, we use certain non-GAAP measures as supplemental measures to review and assess our operating performance. These non-GAAP financial measures have limitations as analytical tools, and when assessing our operating performances, investors should not consider them in isolation, or as a substitute for net income attributable to the Company or other consolidated statement of operations data prepared in accordance with U.S. GAAP.
THE INFORMATION CONTAINED IN THIS DOCUMENT IS HIGHLY CONFIDENTIAL AND IS BEING GIVEN SOLELY FOR YOUR INFORMATION AND ONLY FOR YOUR USE IN CONNECTION WITH THIS PRESENTATION. THE INFORMATION CONTAINED HEREIN MAY NOT BE COPIED, REPRODUCED, REDISTRIBUTED, OR OTHERWISE DISCLOSED, IN WHOLE OR IN PART, TO ANY OTHER PERSON IN ANY MANNER. Any forwarding, distribution or reproduction of this presentation in whole or in part is unauthorized.
By viewing, accessing or participating in this presentation, participants hereby acknowledge and agree to keep the contents of this presentation and these materials confidential. Participants agree not to remove these materials, or any materials provided in connection herewith, from the conference room where such documents are provided. Participants agree further not to photograph, copy or otherwise reproduce this presentation in any form or pass on this presentation to any other person for any purpose, during the presentation or while in the conference room. Participants must return this presentation and all other materials provided in connection herewith to the Company upon completion of the presentation. By viewing, accessing or participating in this presentation, participants agree to be bound by the foregoing limitations. Any failure to comply with these restrictions may constitute a violation of applicable securities laws.

3
Our Mission
To Make Car Purchase Simple and Enjoyable

Business Overview
Section 1
Transforming Automotive Transactions and Purchases
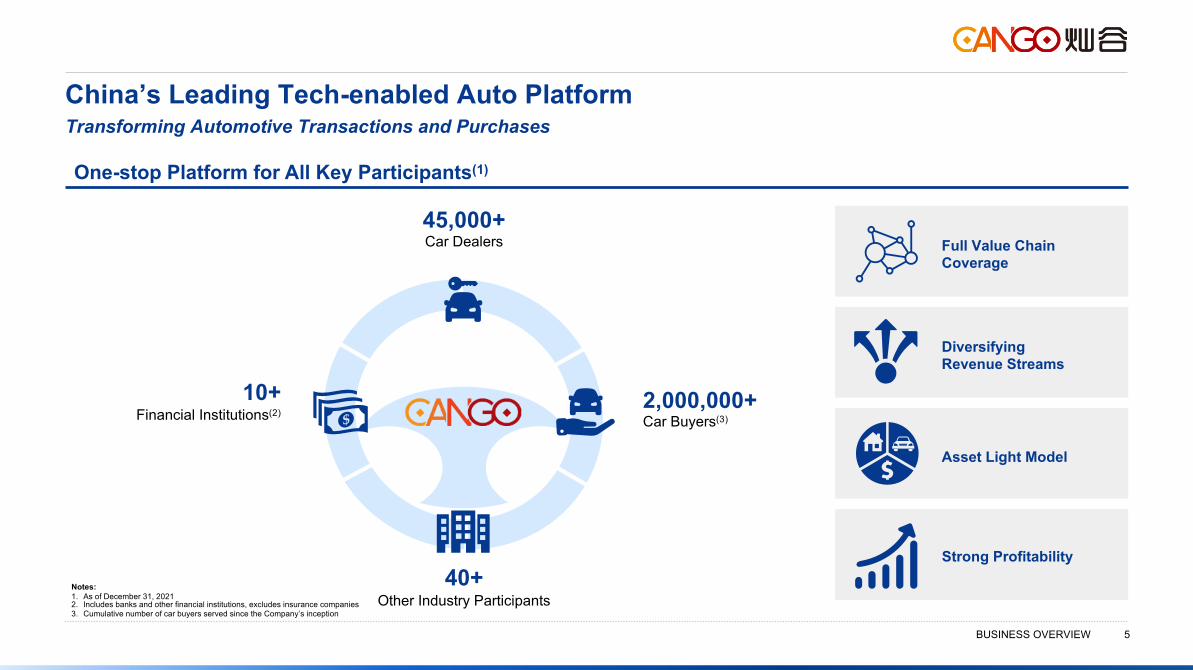
Notes:1. As of December 31, 20212. Includes banks and other financial institutions, excludes insurance companies3. Cumulative number of car buyers served since the Company’s inception
BUSINESS OVERVIEW 5
China’s Leading Tech-enabled Auto Platform
Strong Profitability
One-stop Platform for All Key Participants(1)
45,000+ Car Dealers
2,000,000+Car Buyers(3)
40+Other Industry Participants
10+Financial Institutions(2)
Full Value Chain Coverage
Asset Light Model
Diversifying Revenue Streams

BUSINESS OVERVIEW 6
Products and Services Highlights
Automotive Financing Facilitation
Core Revenue Driver (24.0%) (1)
After-market Services Facilitation
Long-term Revenue Driver (3.5%) (1)
Automotive Transaction Facilitation
Fast Growing Revenue Contribution (67.0%) (1)
• Addresses key pain points of mid-to-small size car dealers
• Establishes infrastructure for automotive new retail model in lower-tier cities
• Facilitates synergies with existing auto financing and after-market services segments in terms of channel expansion and cross-selling
• Rapid growth since launch
• Diversified insurance product offerings and expanded insurance partnerships (e.g. non-life to life)
• Acquisition of an insurance brokerage license to fuel growth
• Optimizing efficiency in dealer network
• Dedicated sales team to penetrate high-end 4S channels
• Major ICBC financing partner platform
Online Platforms
Car Buyers
Dealers Financial Institutions Car Buyers
Other Participants
Insurance Companies /
Brokers
Dealers Car Buyers
Other Platforms
OEM / Wholesalers
1 2 3
Notes:1. Revenue contribution in 2021Q4

BUSINESS OVERVIEW 7
Disrupting the China’s NEV Market
Standardized & efficient supporting services
Realize “last mile” ofonline transaction
Leverage Cango’s 45,000+ dealernetwork to facilitate transactions
Strategic Synergies with NEV Partners
298569
1,037 1,0381,347
1,7992,441
3,374
4,700
0
1,000
2,000
3,000
4,000
5,000
2016 2017 2018 2019E 2020E 2021E 2022E 2023E 2024E
Robust Growth in NEV MarketSales Volume (000s)
2016–2018 CAGR: 86.5%2019E–2022E CAGR: 35.3%
NEV as % of Total PV Sales
1.2% 2.2% 4.3% 4.7% 6.2% 8.1% 10.6% 13.9% 18.2%
Rapid Advancement of
NEV Technology
Favorable Government Policy
Upcoming Technological
Automotive Transaction Services Platform
• Strategic partnershipsin automotivetransaction, automotivefinancing and after-market services
• Cango insurance service portal in Li Auto and HiPhi car owner APPs
Source: CIC
BUSINESS OVERVIEW 8
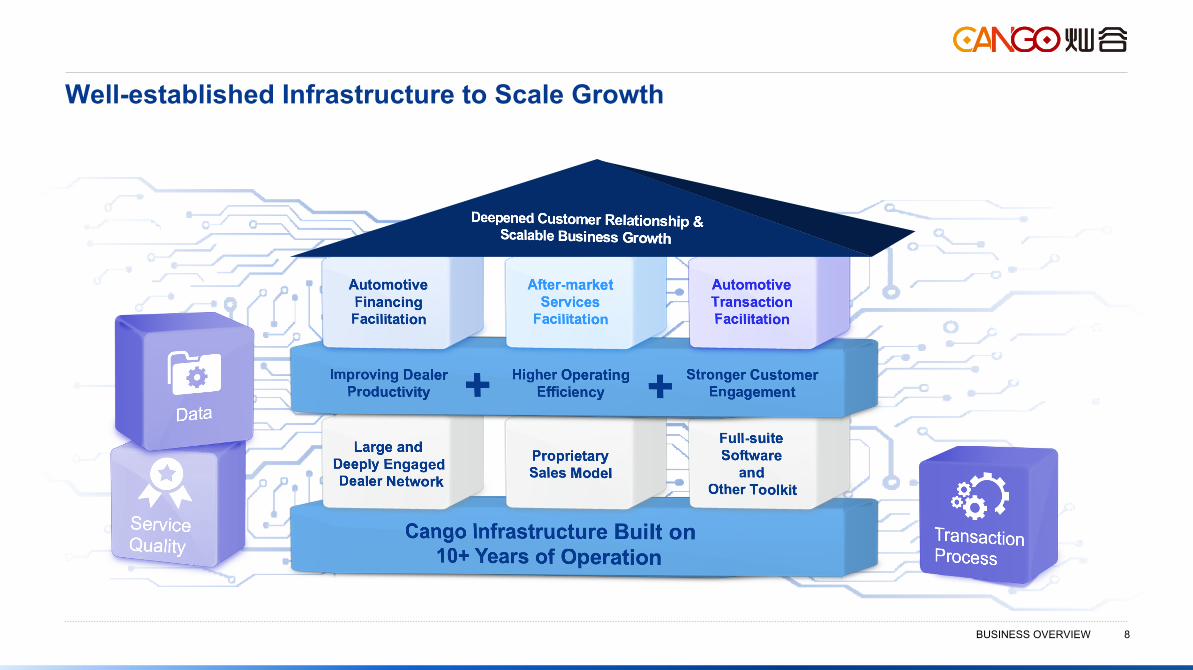
Well-established Infrastructure to Scale Growth
BUSINESS OVERVIEW 9
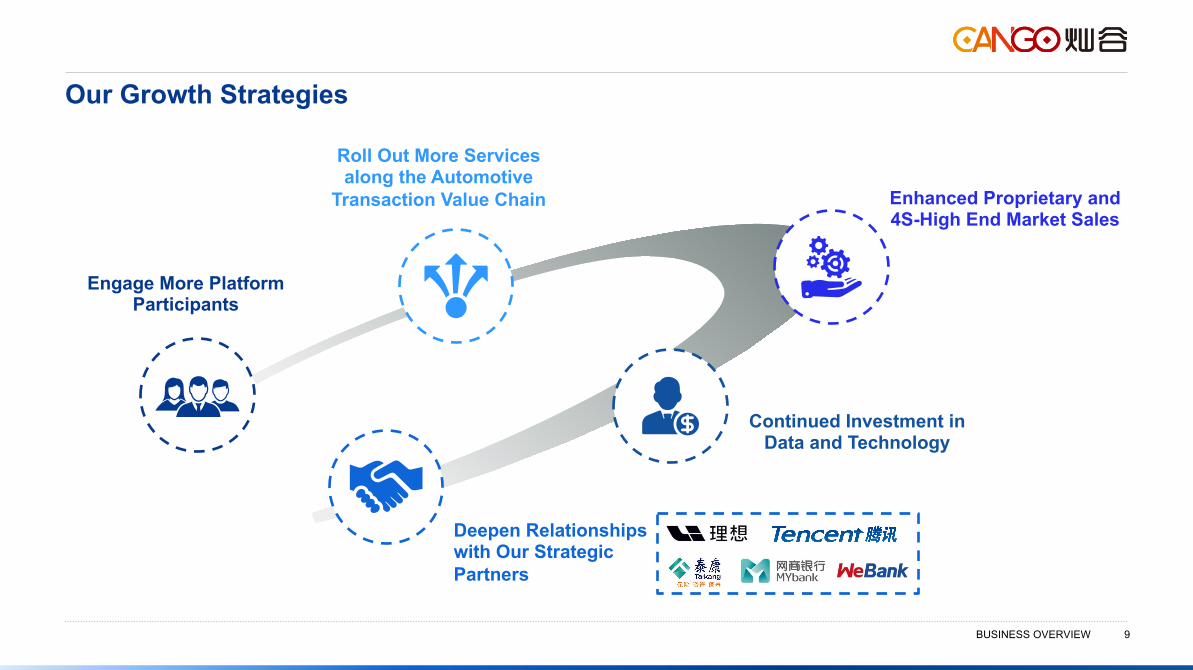
Our Growth Strategies
Engage More Platform Participants
Enhanced Proprietary and 4S-High End Market Sales
Deepen Relationshipswith Our Strategic Partners
Roll Out More Services along the Automotive
Transaction Value Chain
Continued Investment in Data and Technology
BUSINESS OVERVIEW 10
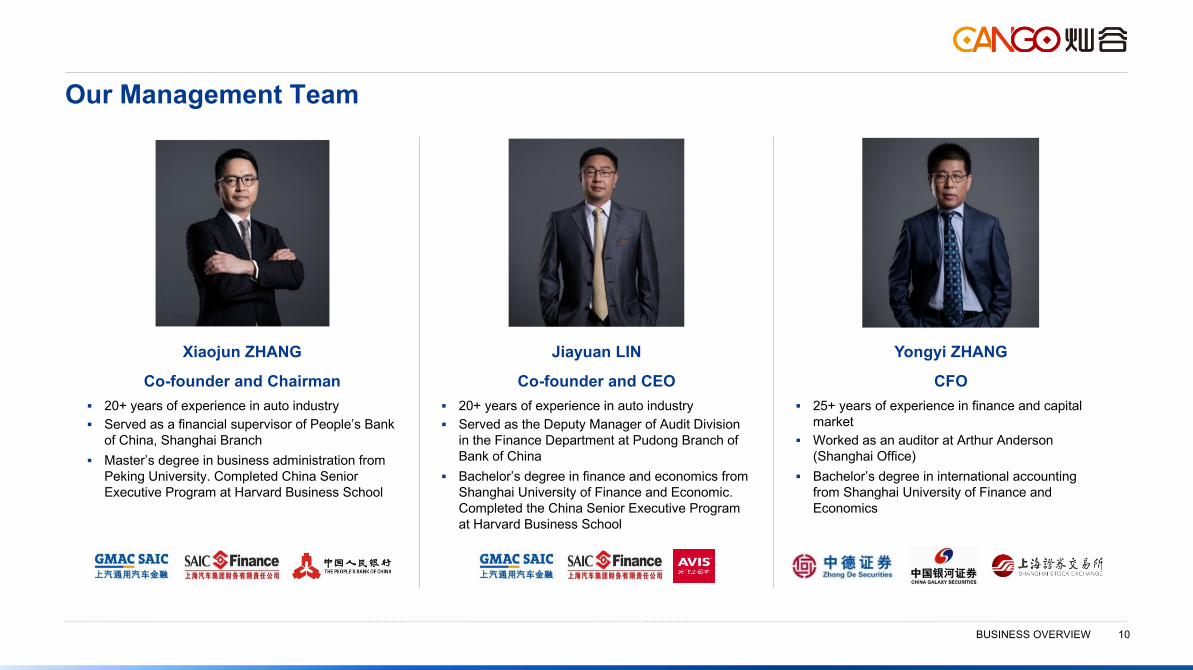
Our Management Team
Xiaojun ZHANG
Co-founder and Chairman§ 20+ years of experience in auto industry§ Served as a financial supervisor of People’s Bank
of China, Shanghai Branch§ Master’s degree in business administration from
Peking University. Completed China Senior Executive Program at Harvard Business School
Jiayuan LIN
Co-founder and CEO§ 20+ years of experience in auto industry§ Served as the Deputy Manager of Audit Division
in the Finance Department at Pudong Branch of Bank of China
§ Bachelor’s degree in finance and economics from Shanghai University of Finance and Economic. Completed the China Senior Executive Program at Harvard Business School
Yongyi ZHANG
CFO§ 25+ years of experience in finance and capital
market§ Worked as an auditor at Arthur Anderson
(Shanghai Office)§ Bachelor’s degree in international accounting
from Shanghai University of Finance and Economics
Investment Highlights
Section 2

INVESTMENT HIGHLIGHTS 12
Investment Highlights
Leading Auto Transaction Enabler 1234
Unparalleled Expertise across Value Chain
End-to-end Technology-enabled Auto Platform
Asset Light Model with Diversified Funding Sources
Powerful Dealer Network
Best Participant Experience
Diversified Customer Acquisition Network
5678 Prudent Risk Management System

INVESTMENT HIGHLIGHTS 13
Leading Auto Transaction Enabler in China1
Auto Transaction Aggregator
Proprietary Sales Model
Infrastructure of Auto New Retail in Lower-tier Cities
EV Revolution
Vast Dealer Network Scalable Leadership in Auto Financing Facilitation Pioneer in Product and Service InnovationRMB Bn
34.3
40.0
43.5
45.8
FY 2018 FY 2019 FY 2020 FY 2021Outstanding Balance
46.6
49.2 48.5
45.9
FY 2018 FY 2019 FY 2020 FY 2021No. of Dealers (‘000)
Optimized network by terminating relationships
with underperforming dealers

INVESTMENT HIGHLIGHTS 14
End-to-end Technology-enabled Auto Platform2
Automotive Transaction Facilitation(Since 2017)
After-market Services Facilitation(Since 2017)
Automotive Financing Facilitation(Since 2010)
DealerDealers Car Buyers
Financial Institutions
After-market Service
Providers
OEMs /Wholesalers
• Data insights• Digital application• Credit risk model
• Digitalized trading platform for registered dealers
• Dealer training
• Telematics insights• Paperless repossession

INVESTMENT HIGHLIGHTS 15
Unparalleled Expertise across Value Chain3
• Knowledge on automotive value chain
• Knowledge on financial products and services
• Experience in working with various financial institutions
• Strong data and insights
• Advanced technology services and solutions
• Strategic collaboration with Tencent
• Launch in auto financing
• Steady expansion into after-market services facilitation
• Future growth fromautomotive transaction facilitation
+ +
INDUSTRY KNOW-HOW RICHNESS OF EXPERIENCE TECHNOLOGY EXPERTISE

Asset Light Model with Diversified Funding Sources
INVESTMENT HIGHLIGHTS 16
4
Diversified Funding with Limited Risk ExposureLoan Origination By Funding PartnersFY2021
Co-partnership: Financial institutions led by
More to come…
Direct Partnership
Steady Growth of Funding Partners
12
Reduced Funding Cost
~7% to ~6%

Notes:1. As of December 31, 20212. As of March 31, 2018
INVESTMENT HIGHLIGHTS 17
Powerful Dealer Network 5
30 provinces
Features of Our Dealers Strategic Value to Cango
Gain First-mover Advantage in an Underserved Market
Build up Network Effect
Access Auto Transaction Value Chain
Closed Transaction Loop
45,000+dealers
(1)
344cities
(1)
(1)
94.5%self-operated dealer coverage
(1)
21,000+independent sales agents
(1)
2734
11 13
IPO NowLower-tier citiesTier-one and tier-two cities
3036
8 10
IPO Now
Non-4S dealers 4S dealers
(1)(2)
No. of Dealers (‘000)
(1)(2)
INVESTMENT HIGHLIGHTS 18
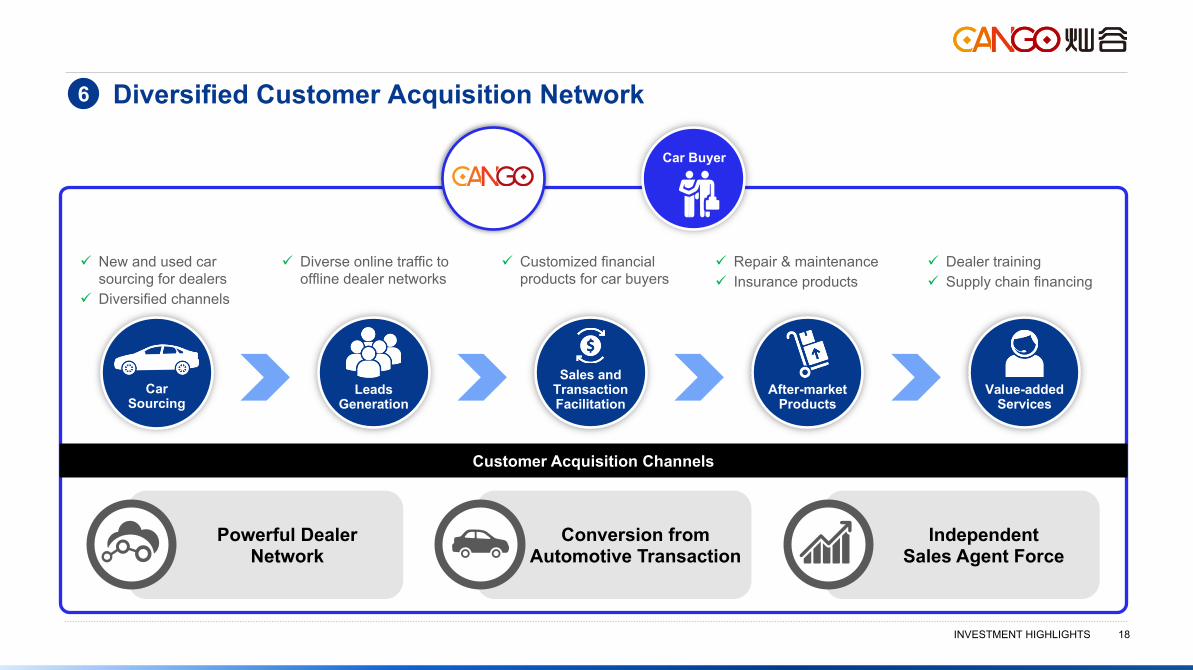
Diversified Customer Acquisition Network6
ü New and used car sourcing for dealers
ü Diversified channels
ü Dealer trainingü Supply chain financing
ü Repair & maintenanceü Insurance products
CarSourcing
Value-addedServices
After-market Products
Leads Generation
Sales and Transaction Facilitation
Customer Acquisition Channels
Powerful Dealer Network
Independent Sales Agent Force
Conversion from Automotive Transaction
ü Diverse online traffic to offline dealer networks
ü Customized financial products for car buyers
Car Buyer
Notes:1. Operating profit over revenue
INVESTMENT HIGHLIGHTS 19
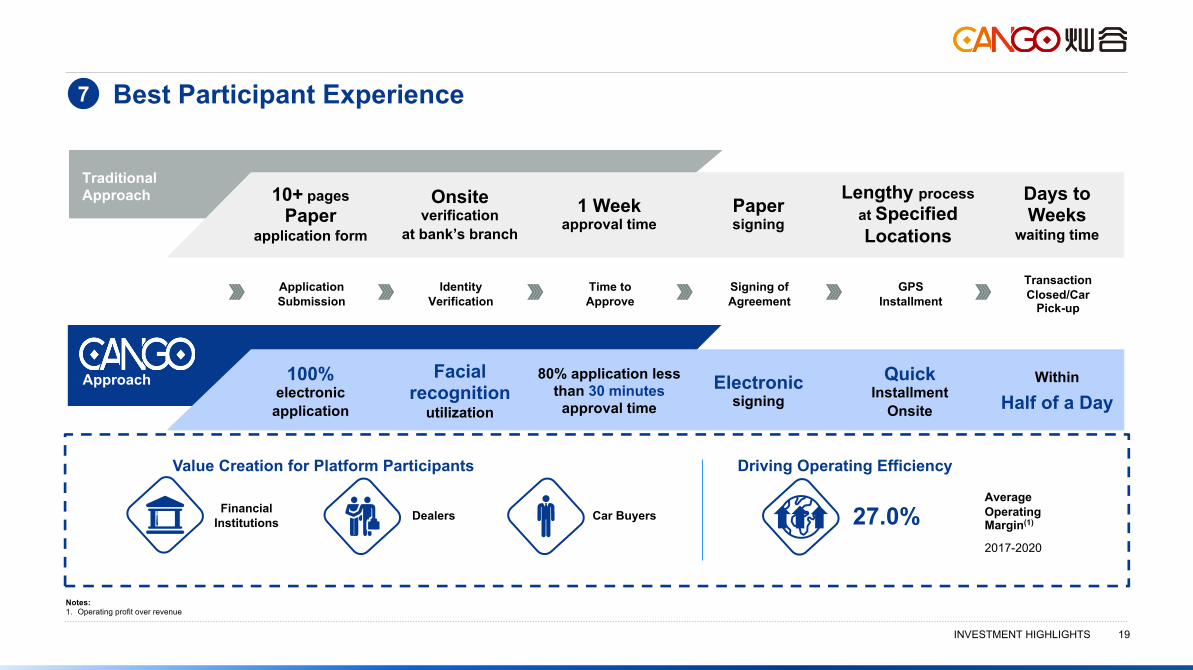
Best Participant Experience7
Application Submission
Time to Approve
Identity Verification
Signing of Agreement
GPS Installment
Transaction Closed/Car
Pick-up
10+ pages Paper
application form
1 Week approval time
Onsiteverification
at bank’s branch
Papersigning
Lengthy process at Specified Locations
Days to Weeks
waiting time
Traditional Approach
100%electronic
application
80% application less than 30 minutes
approval time
Facial recognition
utilization
Electronic signing
Quick Installment
Onsite
Within
Half of a DayApproach
Value Creation for Platform Participants
Financial Institutions Dealers Car Buyers
Driving Operating Efficiency
27.0%Average Operating Margin(1)
2017-2020

Notes:1. 4Q21
INVESTMENT HIGHLIGHTS 20
Prudent Risk Management System8
Rigorous DealerScreening Procedure
Credit Underwriting
Internal Blacklist of Fraudulent Dealers
Significant Lawsuits Check Leveraging Third-party Databases
On-site Visits
100% GPS Installation
Credit Assessment Collateral Registration
Automobiles Required to be Registered with Local Government Authorities
Manual Evaluation If Necessary
Proprietary Credit Assessment Model
Machine Learning Algorithms
Loan Applicant Data
Dealer Data
Proprietary Model
Proprietary Data
1 2 Six-stage DelinquentAsset Management
AutomatedReminder1
Live Phone Calls2
In-person Visits3
Professional Repossession 4
Disposal5
Legal Actions6
3
40.9% /4.3%
Automatic Approval/Rejection
1.62%vs. 3Q21: 1.58%
M1+ ratio(1)
0.86%vs. 3Q21: 0.76%
M3+ ratio(1)

Financial Performance
Section 3

FINANCIAL PERFORMANCE 22
Stable Business Growth with More Input in Automotive Transaction Amount of Financing Transactionsthe Company facilitatedRMB Bn
Total RevenuesRMB MM
Cost of RevenueRMB MM
Operating ExpensesRMB MM
27.7 30.1
10.8
5.7
FY2020 FY2021 4Q2020 4Q2021
2,052
3,922
1,097 1,051
FY2020 FY2021 4Q2020 4Q2021
1,098
2,958
724 881
FY2020 FY2021 4Q2020 4Q2021
196 239 66 74
266276
90 86
6370
23 24
FY2020 FY2021 4Q2020 4Q2021Sales and marketing General and administrative Research and development
1.9x
2.7x 1.2x
FINANCIAL PERFORMANCE 23
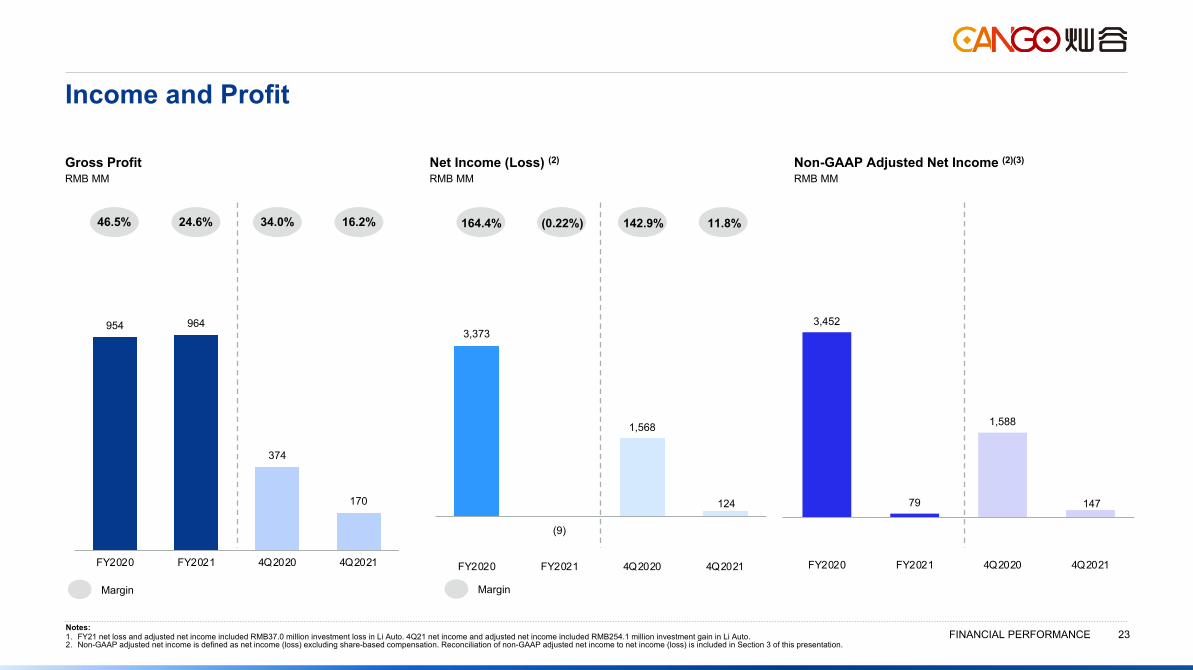
Income and Profit
Gross ProfitRMB MM
Net Income (Loss) (2)RMB MM
Non-GAAP Adjusted Net Income (2)(3)RMB MM
3,373
(9)
1,568
124
FY2020 FY2021 4Q2020 4Q2021
3,452
79
1,588
147
FY2020 FY2021 4Q2020 4Q2021
954 964
374
170
FY2020 FY2021 4Q2020 4Q2021
46.5% 24.6% 34.0% 16.2% 164.4% (0.22%) 142.9% 11.8%
Margin Margin
Notes:1. FY21 net loss and adjusted net income included RMB37.0 million investment loss in Li Auto. 4Q21 net income and adjusted net income included RMB254.1 million investment gain in Li Auto.2. Non-GAAP adjusted net income is defined as net income (loss) excluding share-based compensation. Reconciliation of non-GAAP adjusted net income to net income (loss) is included in Section 3 of this presentation.

FINANCIAL PERFORMANCE 24
Balance Sheet SummaryIn RMB million 31-Dec-20 31-Dec-21Assets
Cash and cash equivalents 1,426.9 1,434.8Restricted cash 9.7 61.3 Short-term investments 4,342.4 2,598.9Short-term finance leasing receivable, net 2,035.4 1,414.2Others 1,084.6 2,098.7
Total current assets 8,899.0 7,607.9 Restricted Cash 878.3 1,114.2 Long-term finance leasing receivable, net 1,454.5 1,029.3 Others 914.1 1,195.7
Total non-current assets 3,246.9 3,339.2 Total Assets 12,145.9 10,947.1
LiabilitiesShort-term borrowings 355.8 579.8 Long-term debts-current 1,228.8 938.0 Accrued expenses and other current liabilities 324.7 719.0 Risk assurance liabilities 460.8 699.0 Income tax payable 87.1 481.9
Total current liabilities 2,457.3 3,417.7 Long-term borrowings 977.8 486.4 Deferred tax liability 330.8 51.5 Other non-current liabilities 4.9 1.0
Total non-current liabilities 1,313.4 538.8 Total Liabilities 3,770.7 3,956.5
Cango's equity 8,375.2 6,990.6 Non-controlling interests - -
Total shareholders’ equity 8,375.2 6,990.6
Total liabilities and shareholders’ equity 12,145.9 10,947.1

THANK YOU!
NYSE:CANG
Yihe LiuCango Inc.Tel: +86 21 3183 5088 ext.5581Email: [email protected]
Emilie WuThe Piacente GroupTel: +86 21 6039 8363 Email: [email protected]