Investor Presentation - Tata Communications
30
Investor Presentation September 2020
-
Upload
khangminh22 -
Category
Documents
-
view
1 -
download
0
Transcript of Investor Presentation - Tata Communications

Investor Presentation
September 2020

Index
Business overview 3
Strategic overview 15
Our key stakeholders 21
Performance highlights 24

Business overview

We are Tata CommunicationsIntroduction
A digital ecosystem enabler, part of
India’s multibillion-dollar conglomerate,
the prestigious Tata Group.
We enable the digital transformation of enterprises, globally
– unlocking opportunities for businesses by enabling
borderless growth, boosting product innovation and customer
experience, improving productivity and efficiency, embedding
agility and managing risk. Both today and in the future.
With a customer solutions orientated approach, proven
managed service capabilities and cutting edge infrastructure,
we drive the next level of intelligence powered by cloud,
mobility, IoT, collaboration, security and network services.
12,000+employees
worldwide
~7,000+customers (including
300 of the Fortune 500)
37+diverse
nationalities
200+countries
of operation
50+entities across
the globe
Toppercentile
of NPS®

Providing connectivity to the worldIntroduction
30%Global internet routes
carried by us
#1 Enterprise data and
colocation services in India
#1 Wholesale voice provider
submarine cable owner on-net
mobile signaling (globally)
4 of 5Global mobile subscribers
connected through our
network
60%Cloud giants are connected to
their businesses through us
LeaderIn Gartner’s Magic Quadrant
for Network Services (Global)
2020 – 7 years in a row

975
67
Numbers that matterKey Performance Indicators
Our voice business continues to be strong and our data business remains instrumental to our overall revenue.
As we grow scale, we are confident of an upward momentum in our profit trajectory in the coming quarters.
Rs. 258 crorePAT
Rs. 372 croreCAPEX
2.6 timesNet debt/EBITDA
Data Voice
3,604
799
(Rs. in crore)
4,403
Revenue(Rs. in crore)
EBITDA
1,042
TCL Consolidated figures for Q1’ FY 21
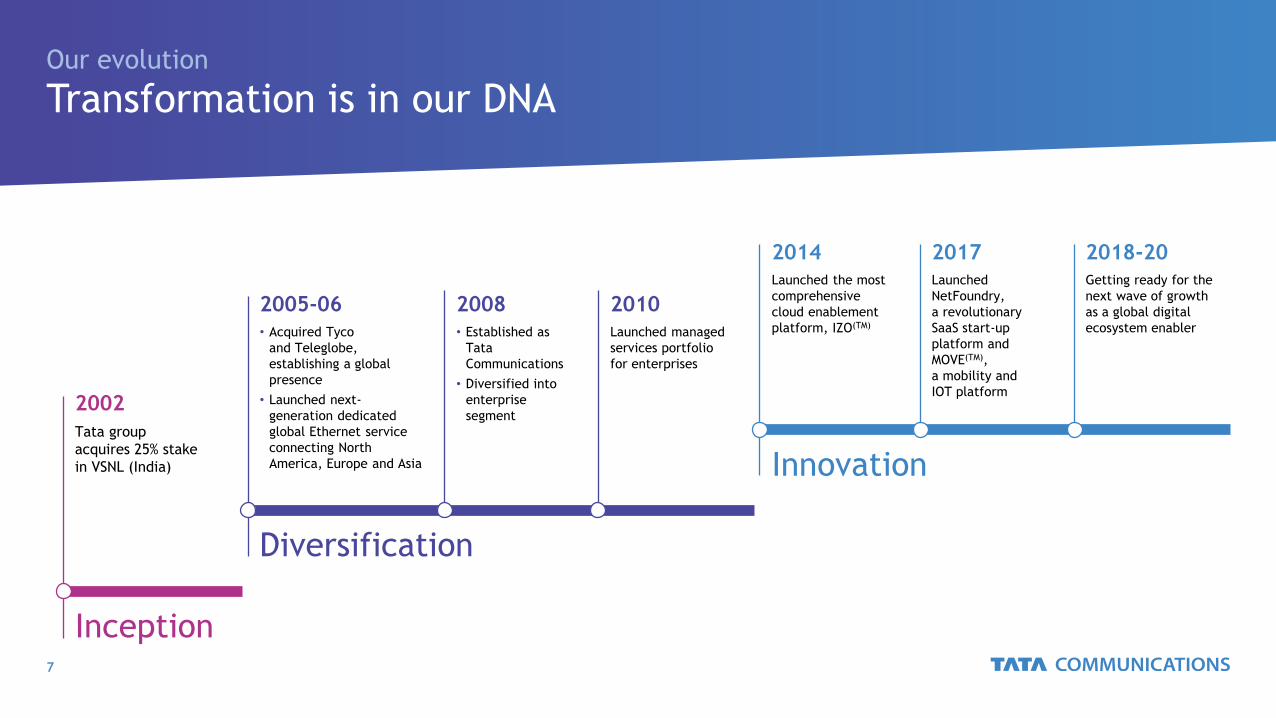
Transformation is in our DNAOur evolution
Tata group
acquires 25% stake
in VSNL (India)
2002
• Acquired Tyco
and Teleglobe,
establishing a global
presence
• Launched next-
generation dedicated
global Ethernet service
connecting North
America, Europe and Asia
2005-06• Established as
Tata
Communications
• Diversified into
enterprise
segment
2008Launched managed
services portfolio
for enterprises
2010
Launched the most
comprehensive
cloud enablement
platform, IZO(TM)
2014Getting ready for the
next wave of growth
as a global digital
ecosystem enabler
2018-20
Inception
Diversification
Innovation
Launched
NetFoundry,
a revolutionary
SaaS start-up
platform and
MOVE(TM),
a mobility and
IOT platform
2017

Tata Communications at a glanceWhat, why and how
CUSTOMER DRIVERS
PLATFORMS
AND EXPERIENCE
COMMITMENTS
Deliver a new world of communications to the industry and our customersWhy we exist
Our DRIVE cultureDaring | Responsive | Inclusivity | Venturing | Ethical
How we do it
Enabling borderless growth
Boosting product innovation and customer experience
Enhancing productivity
and efficiency
Managing riskBuilding agility
Sustainability Innovation Artificial Intelligence
Mobility and IOT Collaboration NetFoundry
Next generation connectivity
Cloud, edge and security
Voice
Cust
om
er
inti
macy
Serv
ices W
rap

Providing solutions for every stage of digital maturityWhat we do
Helping customers unlock opportunities through digital transformation - enabling borderless growth,
boosting product innovation and customer experience, improving productivity and efficiency, building
agility and managing risk.
Primarily out of a
trading office
PHYSICAL Internet trading through
websites and mobile apps
Mobile apps, social media,
online trading portals,
client portals, tablet app
Collaboration between
physical and digital;
cloud infrastructure
Highly customer-centric;
real-time trading; AI/ML,
Big Data and advanced
analytics, etc.
ONLINE
OMNI-CHANNEL
DIGITAL
CONTEXTUAL

We cater to multiple industriesOur customers
AUTOMOTIVE INSURANCE HEALTHCARE
REAL ESTATE E-COMMERCE
ENERGY
IT/ITES
MANUFACTURING
RETAIL
SERVICES
CONSULTING
BANKING
PHARMACEUTICAL
TELECOM CONSTRUCTION FINANCE
E-LEARNING GOVERNMENT
MEDIA &
ENTERTAINMENTSPORTS

Representing some of the biggest brandsOur customers

Our globally local digital infrastructureHow we do it
• Our end-to-end capabilities in servicing
and delivery make us a preferred
partner for businesses everywhere.
• All of our products and services are
underpinned by our global network, the
largest world’s largest wholly-owned
subsea fibre backbone and a Tier-1 IP
network.

Our DRIVE cultureHow we do it
Our people reflect our ethos
Lives impacted by our employees, through 59,184 volunteering
hours as part of our CSR initiatives
1,64,000
90%Learning via digital mode in Tata
Communications Learning Academy
5,300+Certifications completed by employees
with minimum 16 hours of effort
We view our success as a result of the unstinting commitment of our
people and their efforts.
Our greatest asset? Our people.
Can-do
attitude
Collaboration Continuous
learning
Innovation
Mindset for growth
and agility
Ownership and
accountability
Problem
solving
Skills
transformation
Certified as a Great Place to Work
by Great Place to Work Institute
(India, Hong Kong, Canada and USA)
• ‘Best Workplaces in Asia’ for the year 2019 (Hong Kong)
• 2019 Best Employer in India by Aon
• Best Companies for Women in India – Working Mother and Avtar
• Best Workplaces for Women by Great Place to Work Institute
(India and Canada)

Our commitmentsHow we do it
Artificial Intelligence
We are bringing enhanced focus on
leveraging the power of AI and ML
technologies and embedding a
framework to make AI an integral
part of our capability and offerings.
Sustainability
We strive to make a positive,
tangible impact on the environment
and wider society through our
actions, and through our products
& services for our customers.
Innovation
We continue to innovate to stay
relevant for our customers as a
long-term partner in their digital
transformation journeys.
Strategic overview

Trends shaping the industryOperating context
We facilitate businesses to pursue digital transformation through navigating new and emerging technologies, to transition
seamlessly into a more intelligent future.
Platform economy
(Source: Bloomberg and Google)
7 of 10Most valuable companies based
on platforms
Managed services
(Source: Mordor Intelligence)
11.5%Growth of global managed
services between 2018 and 2023
(Source: GSMA Intelligence)
Enterprise mobility
6 billionMobile subscriptions
by 2025
Internet of Things (IoT)
(Source: IDC)
79.4 ZBData will be generated globally,
by 41.6 billion IoT devices by 2025
Cloud computing
28%Of the IT spending will shift to the
cloud by 2022, affecting US$1.3 trillion
(Source: Gartner)
Hybrid SDN
60%Of enterprises will have
implemented SD-WAN by 2023
(Source: Gartner)
Cybersecurity awareness
(Source: Gartner)
41.2%Growth in spending on cloud
security over the next 5 years
Artificial Intelligence (AI)
37%
(Source: Gartner)
of organizations adopted AI in some
form in 2019

Our opportunity landscapeMarket we address
While all areas of our portfolio are expected to
grow, 6 key pillars have been identified to
significantly contribute to our growth in revenue.
Available Market 2023
Mobility & IoT
CAGR +3.9%
2022 $243Bn
2019 $217Bn
Collaboration
CAGR +12.2%
2022 $35Bn
2019 $25Bn
Voice
CAGR (6.6)%
2022 $8Bn
2019 $7Bn
NetFoundry
CAGR +25.5%
2022 $109Bn
2019 $55Bn
Next Generation Connectivity
CAGR +0.2%
2022 $145Bn
2019 $145Bn
Cloud, Edge & Security
CAGR +12.0%
2022 $224Bn
2019 $159Bn
MOBILITY & IoT COLLABORATION
NEXT GENERATION
CONNECTIVITY
CLOUD, EDGE &
SECURITY
VOICE NETFOUNDRY

What helps us turn opportunities into a realityKey strategic enablers
Our own agility in adopting
digitally transformative
technologies in order to
provide the same to our
customers is the key to our
consistent business growth.
Prudent
foresightOur ability to anticipate change and
transform to meet and exceed the
expectations of the business and the
industry has paved the way for
sustained growth.
Customer
centricityWe help our customers make the
most of the latest digital innovations
and be agile, flexible and
responsive.
Skilled,
engaged teamsWe believe it is critical for
employees to continuously learn and
re-educate themselves; and we
provide the right platforms for
employees to be able to do so.
Continuous
innovationTechnology is constantly evolving;
thus, we need to constantly
challenge ourselves and innovate to
invest in our future.
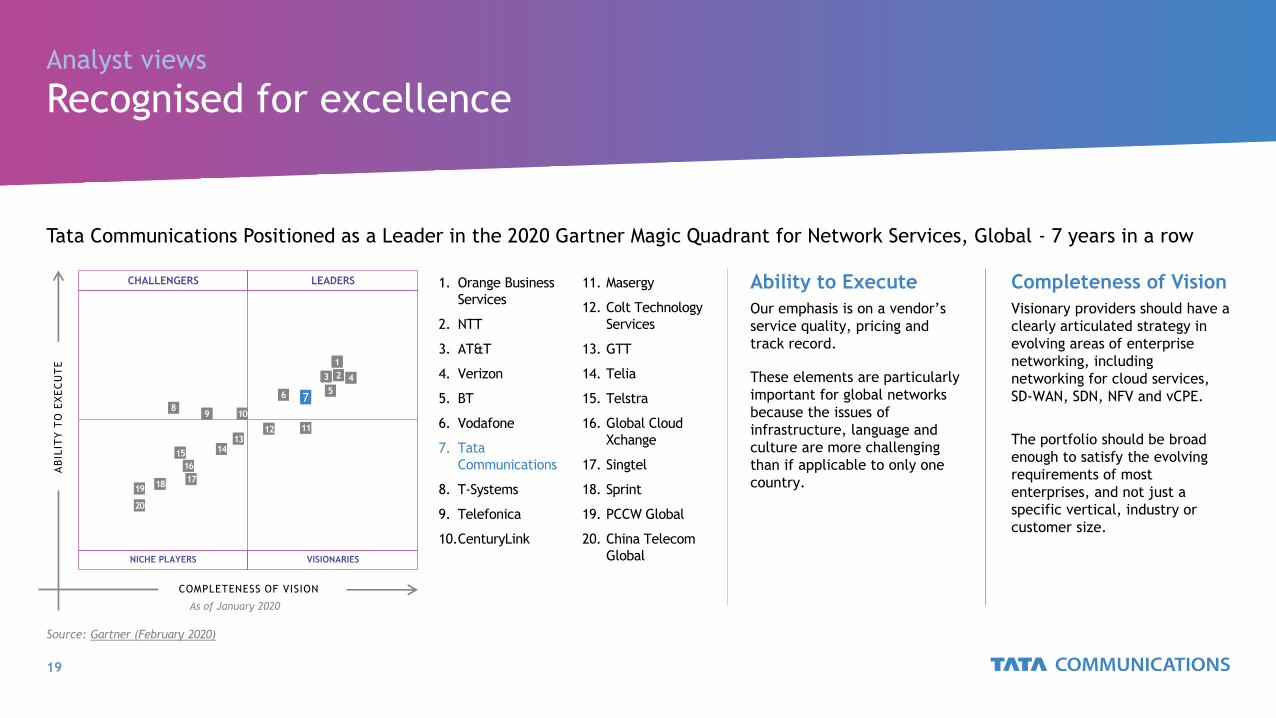
Recognised for excellenceAnalyst views
Tata Communications Positioned as a Leader in the 2020 Gartner Magic Quadrant for Network Services, Global - 7 years in a row
1. Orange Business
Services
2. NTT
3. AT&T
4. Verizon
5. BT
6. Vodafone
7. Tata
Communications
8. T-Systems
9. Telefonica
10.CenturyLink
Ability to Execute
Our emphasis is on a vendor’s
service quality, pricing and
track record.
These elements are particularly
important for global networks
because the issues of
infrastructure, language and
culture are more challenging
than if applicable to only one
country.
Completeness of Vision
Visionary providers should have a
clearly articulated strategy in
evolving areas of enterprise
networking, including
networking for cloud services,
SD-WAN, SDN, NFV and vCPE.
The portfolio should be broad
enough to satisfy the evolving
requirements of most
enterprises, and not just a
specific vertical, industry or
customer size.
1
COMPLETENESS OF VISION
AB
ILIT
Y T
O E
XE
CU
TE
CHALLENGERS LEADERS
NICHE PLAYERS VISIONARIES
Source: Gartner (February 2020)
As of January 2020
23 4
576
89 10
111213
1415
16
1718
19
20
11. Masergy
12. Colt Technology
Services
13. GTT
14. Telia
15. Telstra
16. Global Cloud
Xchange
17. Singtel
18. Sprint
19. PCCW Global
20. China Telecom
Global

Recognised for excellenceIndustry accolades
APAC Top 10 IoT Solution
Companies 2019
• Most Innovative IoT Project
• Most Innovative Telecom Project
Magic Quadrant for Network Services,
Global
Enterprise Telecom service provider
Company of the Year – Large
Enterprise Segment
Enterprise Data Service Provider
Company of the Year
Managed Multi Cloud Service
Provider Company of the Year
SDWAN Service Provider Company of
the Year
Unified Communications Service
Provider Company of the Year
Managed Security Service Provider
Telecom Company of the Year
Cloud Interconnect Service
Provider Company of the Year
Video Managed Service Provider
Company of the Year

Our key stakeholders

48.9%
26.1%
17.5%
1.4%
6.0%
TATA Sons GOI Foreign Institutions
Domestic Institutions Non-institutional
Maximising long-term intrinsic valueOur shareholders
The sustained trust and confidence of our shareholders enable us to remain focused on achieving our strategic objectives and
maximising long-term returns.
Shareholding pattern as of 30 June 2020Drive capital efficiency
• Recalibrate investments
• Co-create with partners
• Inculcate strong discipline and governance
around capital allocation and expenditure
Improve margin profile
• Improve operating efficiency and drive
operating leverage
• Accelerate growth in high margin data segment
and new services
Invest for long-term growth
• Reshape portfolio
• Invest in new services/ innovation to
differentiate and accelerate growth
Create strategic flexibility
• Generate free cash flow and deleverage
balance sheet
• Pursue opportunities to unlock intrinsic value
• Rationalise businesses with sub-par return
profiles

Sustainability and CSR
• We are uniquely positioned to deliver the digital future now while doing good for People, the Planet and Communities
• Our goal is to make a positive, tangible impact on the environment and society through our actions and through our
products and services for our customers
ENABLING SUSTAINABILITY AS KEY DRIVER FOR BUSINESS INNOVATION & GROWTH
9 lakhUNITS OF ENERGY
CONSERVATION GLOBALLY
Focused solutions (IoT, Mobility,
MOVE, Cloud and UCC) for
customers leading to cost saving,
business optimisation, avoidance
of travel, automation etc.
~15 Million UNITS'
49% increase In water recycling as compared to
FY20
ZeroFATAL/MAJOR INCIDENTS
Since last 3 years
32.7%DIVERSITY
mix for new hires
increased from 19% (FY14)
5,300+ CERTIFICATIONS
COMPLETED BY EMPLOYEESwith minimum 16 hours
of effort
MULTIPLE BEST EMPLOYER RECOGNITIONS
2,19,166LIVES IMPACTED
16LONG-TERM
PROJECTS
59,194VOLUNTEERING HOURS
62% women and girls
62% - affirmative action
communities
Presence across 9 states in India
International presence -
Singapore
Contributed by 11,030
volunteers to reach 50,000 lives
Renewable energy sourced
Our community

Performance overview

Revenue | EBITDA | FCFKey financials (Quarterly)
3,278
3,595
3,604
890
803
799
4,169
4,398
4,403
Q1 FY 20
Q4 FY 20
Q1 FY 21
REVENUE*
736
823
975
89
46
67
826
869
1,042
Q1 FY 20
Q4 FY 20
Q1 FY 21
EBITDA*
FCF*
485
579
664
89
45
54
516
526
670
Q1 FY 20
Q4 FY 20
Q1 FY 21
• Consolidated revenues were up 5.6% YoY and flat
sequentially.
• •EBITDA grew by 26.2% YoY and 19.9% QoQ with a
margin of 23.7% which expanded by 390BPs
sequentially on the back of strong profitable growth
in data business and focus on cost efficiencies. We
received one-off cost benefits this quarter on
operating costs like travel and office related, due to
lockdown.
• •Profit for the quarter was INR 258 crore as
compared to a loss of INR 275 crore in the previous
quarter, this profit is on the back of strong revenue
and EBITDA performance.
Revenue Growth % QoQ YoY
Data 0.2% 9.9%
Voice (0.5%) (10.2%)
Consol 0.1% 5.6%
EBITDA Growth % QoQ YoY
Data 18.4% 32.4%
Voice 46.7% (24.8%)
Consol 19.9% 26.2%
FCF Growth % QoQ YoY
Data 14.8% 37.0%
Voice 21.2% (39.0%)
Consol 27.3% 30.0%Data Voice Consol*All figures in Rs. crore
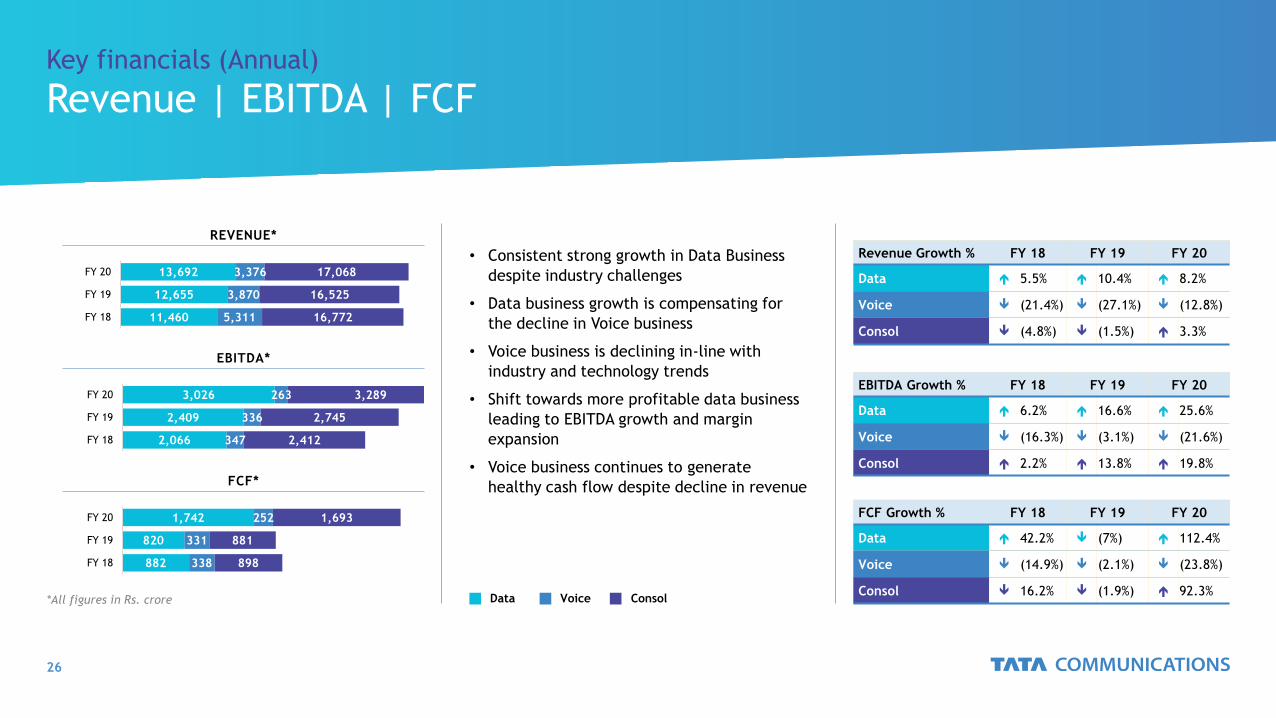
Revenue | EBITDA | FCFKey financials (Annual)
11,460
12,655
13,692
5,311
3,870
3,376
16,772
16,525
17,068
FY 18
FY 19
FY 20
REVENUE*
2,066
2,409
3,026
347
336
263
2,412
2,745
3,289
FY 18
FY 19
FY 20
EBITDA*
FCF*
882
820
1,742
338
331
252
898
881
1,693
FY 18
FY 19
FY 20
• Consistent strong growth in Data Business
despite industry challenges
• Data business growth is compensating for
the decline in Voice business
• Voice business is declining in-line with
industry and technology trends
• Shift towards more profitable data business
leading to EBITDA growth and margin
expansion
• Voice business continues to generate
healthy cash flow despite decline in revenue
Revenue Growth % FY 18 FY 19 FY 20
Data 5.5% 10.4% 8.2%
Voice (21.4%) (27.1%) (12.8%)
Consol (4.8%) (1.5%) 3.3%
EBITDA Growth % FY 18 FY 19 FY 20
Data 6.2% 16.6% 25.6%
Voice (16.3%) (3.1%) (21.6%)
Consol 2.2% 13.8% 19.8%
FCF Growth % FY 18 FY 19 FY 20
Data 42.2% (7%) 112.4%
Voice (14.9%) (2.1%) (23.8%)
Consol 16.2% (1.9%) 92.3%Data Voice Consol*All figures in Rs. crore

1,3271,438
1,150 1,1511,232 1,248 1,262 1,257 1,216 1,193
0
400
800
1,200
1,600
Mar-15 Mar-16 Mar-17 Mar-18 Mar-19 Jun-19 Sep-19 Dec-19 Mar-20 Jun-20
Performance Highlights | Net DEBTKey financials (Annual)
Net Debt to EBITDA
USD Mn
3.3 3.4 3.2 3.2 3.1 2.9 2.8 2.9 2.8 2.6
0
2
4
6
Mar-15 Mar-16 Mar-17 Mar-18 Mar-19 Jun-19 Sep-19 Dec-19 Mar-20 Jun-20
3.80% 3.41% 3.12%3.87% 3.86% 3.93% 3.77% 3.55% 3.73%
3.03%
0.00%
1.50%
3.00%
4.50%
6.00%
Mar-15 Mar-16 Mar-17 Mar-18 Mar-19 Jun-19 Sep-19 Dec-19 Mar-20 Jun-20
Cost of Debt %
Net Debt to EBITDA
USD Mn
• Net debt was at USD 1,193 Mn, a decrease of USD 23 Mn over last quarter, aided by improved collections and lower Capex.
• Average cost of borrowing for Q4 was 3.03%, a decrease by 70 BPS over Q4 FY20 primarily due to decline in Average LIBOR from 1.18% in Q4 to 0.36% in Q1 FY21.
Note: USD-Rs.: FY15 – 61.13; FY16 – 65.44; FY17 – 67.07; FY18 – 64.47, FY19 – 69.9; Q1FY18 – 64.48; Q2FY18 – 64.30; Q3FY18 – 64.77; Q4FY18 – 64.35; Q1FY19 – 66.94; Q2 FY19 – 70.10; Q3
FY19 – 72.13, Q4 FY19 – 70.47; Q1 FY20 – 69.6; Q2 FY20 – 70.4; Q3 FY20- 71.24; Q4 FY20- 72.32; Q1 FY21- 72.32; FY15, FY16 are reported numbers, and include Data centre business
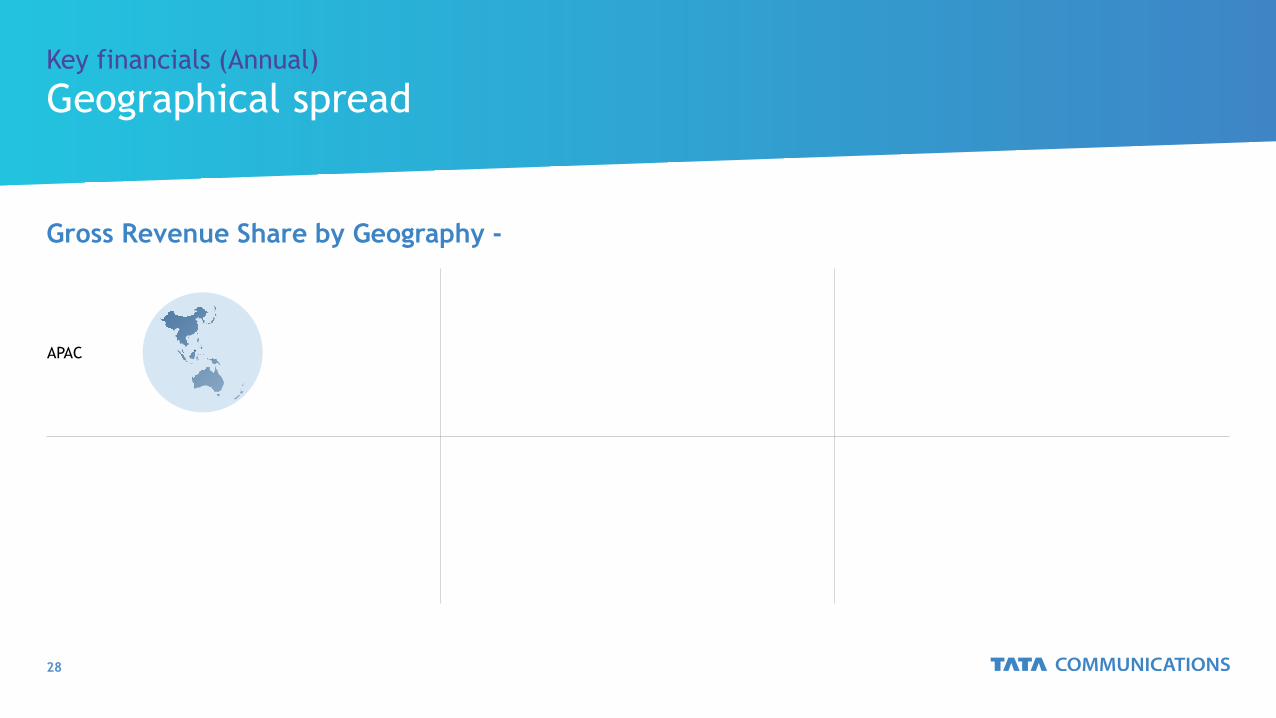
Geographical spreadKey financials (Annual)
Gross Revenue Share by Geography -
APAC
8.7%
11.2%
0.0%
3.0%
6.0%
9.0%
12.0%
15.0%
FY 15 FY 20
Europe
24.6%
13.1%
0.0%
5.0%
10.0%
15.0%
20.0%
25.0%
30.0%
FY 15 FY 20
India
30.6%
41.1%
0.0%
10.0%
20.0%
30.0%
40.0%
50.0%
FY 15 FY 20
America
22.5%25.4%
0.0%
5.0%
10.0%
15.0%
20.0%
25.0%
30.0%
FY 15 FY 20
MENA
8.6%
6.6%
0.0%
2.0%
4.0%
6.0%
8.0%
10.0%
FY 15 FY 20
Global
5.0%
2.6%
0.0%
2.0%
4.0%
6.0%
FY 15 FY 20

Key reflectionsConcluding remarks
Digital Transformation and
Cloud adoption to drive the
business growth
Riding on global
data growth
Positioned as “Leader” in
Gartner magic quadrant for
network services, global for
7th consecutive year
Transformation driving demand
for hosting, SD WAN and
network virtualisation services
Digital push through
partnerships with Microsoft,
Cisco, Amazon
FY20 Dividend of Rs. 4/-
share which is 40% of face
value of each share
The revamped GTM strategy
has started to show positive
results with an improvement
both in funnel adds as well as
in closed sales.
Product penetration ratio *
(which is the number of
products sold to each
customer) of Top 300 customer
has improved from 5.51 in Q1
FY20 to 5.62 in
Q1 FY21
The Scheme for Demerger of Surplus Land has been approved
by the NCLT, Mumbai on July 12, 2018. The Scheme filed by
HPIL, has been approved by the Ministry of Corporate Affairs,
New Delhi on 5 August 2019. The Record Date for the Scheme
was September 18, 2019. HPIL has allocated the shares to all
its eligible shareholders and they are in process of listing the
company, this process has been delayed due to COVID-19
lockdown
Significant land bank with
the company (~740 acres)
post transfer of surplus land
to HPIL

Thank youwww.tatacommunications.com
©2020 Tata Communications. All rights reserved.
TATA COMMUNICATIONS and TATA are trademarks of Tata Sons Private Limited.
Contact for investor queries: