Investor Presentation - Covestro AG
155
Investor Presentation London, June 2018 #PushingBoundaries
-
Upload
khangminh22 -
Category
Documents
-
view
0 -
download
0
Transcript of Investor Presentation - Covestro AG

#PushingBoundaries
Investor PresentationLondon, June 2018
00_545891_Pushingboundaries_Titelseite_Booklet_297x182mm_0518.indd 1 01.06.18 10:03
#PushingBoundaries
Investor PresentationLondon, June 2018
00_545891_Pushingboundaries_Titelseite_Booklet_297x182mm_0518.indd 1 01.06.18 10:03
#PushingBoundaries
Investor PresentationLondon, June 2018
00_545891_Pushingboundaries_Titelseite_Booklet_297x182mm_0518.indd 1 01.06.18 10:03

DisclaimerThis presentation may contain forward-looking statements based on current assumptions and forecasts made by Covestro AG.
Various known and unknown risks, uncertainties and other factors could lead to material differences between the actual future results, financial situation, development or performance of the company and the estimates given here.
These factors include those discussed in Covestro’s public reports, which are available on the Covestro website at www.covestro.com. The company assumes no liability whatsoever to update these forward-look-ing statements or to adjust them to future events or developments.

Table of content
Strategy (CEO)
Financial Performance (CFO)
Polyurethanes (PUR)
Polycarbonates (PCS)
Coatings, Adhesives, Specialties (CAS)
CEO
Dr. Markus SteilemannChief Executive Officer
Dr. Markus Steilemann has been Chief Executive Officer of Covestro since June 2018. His area of responsibility covers all commercial functions, including the three divisions Polyu-rethanes, Polycarbonates and Coatings, Adhesives, Specialties. In addition, central areas such as strategy, personnel and communications fall within his remit.
Born in Geilenkirchen, Germany in 1970, Steilemann graduated with a PhD in chemistry from RWTH Aachen University. He began his career with the Bayer Group in 1999. From 2008, Steilemann held various management positions in the Polycarbonates business unit at Bayer MaterialScience, the predecessor company of Covestro. Between 2013 and 2015, Steilemann headed the entire business unit headquartered in China, where he lived for several years.
Steilemann returned to Germany and joined the Covestro Board of Management in 2015 with res-ponsibility for innovation. In addition to this role, he became head of the Polyurethanes business unit in the following year. From 2017 until his appointment as CEO, he was Chief Commercial Officer (CCO), responsible for innovation, marketing and sales.

Innovation and sustainability driving growth
CMD 2018 │ Strategy 4
Global leader in high-tech material solutions
Above GDP volume growth driven by innovation and sustainability trends
Balanced supply and demand outlook for all our businesses
More than half of sales generated by resilient businesses as global leader in highly attractive niches
Leading innovation in materials and operations and pushing boundaries in digitalization
Non-financial targets support growth strategy
aligned with UN Sustainable Development Goals

5 5
Average core volume
growth per annum
~4%
CMD 2018 │ Strategy

Higher global GDP expectation leads to higher industry growth
CMD 2018 │ Strategy 6
Structural growth above GDP driven by sustainability trends
Notes: (a) Most impacted goals out of 17 Sustainable Development Goals, set by the United Nations’ “2030 Agenda for Sustainable Development” (b) Assumes global GDP CAGR 2017–2022e of ~3%; (c) Comprises MDI, TDI and polyether polyols (d) Shows PU raw materials industry demand in coatings, adhesives and sealants; additionally TPU, elastomers and PC/TPU films Source: Covestro estimates
• Zero emission concepts
• Low-energy buildings
related to climate change:
• Energy-efficient mobility
• Lightweight transportation
• E-mobility, autonomous driving
related to increasing mobility:
• Food preservation
• Low-cost durable goods
• Medical applications
related to growing population:
• Affordable housing
• Living comfort
• Public infrastructure
related to increasing urbanization: 3.3 ~3.9
2017 2022e
16.9
2017 2022e
4.3 ~5.3
2017 2022e
Needs to be served UN SDGs(a) Industry demand outlook(b) 2017 – 2022e
PC
P
U(c
) C
AS
(d)
CAGR
~5%
CAGR
~4%
CAGR
3-4%
('000kt)
~21.3

Refrigeration: Gaining share in a strongly growing market
CMD 2018 │ Strategy 7
Lower energy consumption and higher consumer satisfaction
Sources: (a) Euromonitor Consumer Appliance Annual Report, 2017, for 2016-2021e based on retail units (b) IAL PU Global Database, 2017, for 2016 -2019e based on consumption in kt
Trend Need Growth Covestro contribution
More and better
cooling devices
Raw materials for
particularly effective
insulating foams
• 40% smaller pores allow
up to 10%
better insulation
• Support refrigerators with
higher energy efficiency
• Less material cost and
higher production
speed
Number of
refrigerators(a)
CAGR: ~3%
Refrigeration
insulation
foam(b)
CAGR: ~8%
Covestro
in 2015-2017
CAGR: 12%
Population & prosperity growth

Auto: Benefitting from E-vehicles and autonomous driving
CMD 2018 │ Strategy 8
Significant outperformance of car industry growth
Source: (a) LMC 01/2017 for 2016-2021e and Covestro estimate
Trend Need Market Covestro contribution
Reduced weight, increased comfort
and freedom of design
Pioneering all-around
material concept
• Efficient thermal
management to reduce
energy demand
• New lighting functions
revolutionize design and
safety
• Most stringent weight
reductions
• Attractive alternatives to
conventional materials:
polymers to replace
glass and metal
Global car
production(a)
CAGR: ~3%
Global hybrid
and electrical
car production(a)
CAGR: ~25%
Relevant car
applications(a)
CAGR: ~5%
Covestro
2015-2017
CAGR: ~7%
Increasing mobility

Wind power: Substitution drives growth
CMD 2018 │ Strategy 9
Novel materials replacing existing solutions
Sources: (a) BP, Energy Outlook, 2017, for 2015-2020e based on million tons oil equivalent (b) Navigant, World Wind Energy Market Update, 2017, for 2016 -2021e based on mega watt
Trend Need Growth Covestro contribution
More durable and economical wind
power plants
Novel components for wind
power plants
• Rotor blades:
polyurethane resins for
more stability and
durability, to replace
epoxy resins
• Towers:
polyurethane materials
for anti-corrosion
coatings
• Sea cables: elastomers
for protection systems
Energy
consumption(a)
CAGR: ~3%
Offshore wind
energy(b)
CAGR: ~19%
Covestro in 2015-2017
CAGR: 29%
Climate change

Strong growth track record
CMD 2018 │ Strategy 10
Broad-based core volume growth of +5.5% CAGR in 2015-2017
Notes: Based on Covestro Annual Report 2017 ; EMLA = Europe, Middle East, Africa, Latin America; NAFTA = USA, Canada, Mexico; APAC = Asia, Pacific (a) Automotive with core volume CAGR 2015-2017 of +7% (b) Growth of core and non-core volumes
Sales split by regions Sales split by end-market
% of 2017 Group sales
Core volume growth in %, CAGR 2015-2017
2017 Group sales in € million
Core volume growth in %, CAGR 2015-2017
19%
18%
17% 12%
8%
26%
Sports / Leisure,
Cosmetics, Health,
diverse industries
Vol. +8%
Chemicals(b)
Vol. +4%
Electrical/
Electronics
Vol. +6% Construction
Vol. +3%
Wood/
Furniture
Vol. +5%
Automotive(a) /
Transportation
Vol. +5%
China
3,062
Vol. +13%
US
2,777
Vol. 3%
Germany
1,723
Vol. +3%
NAFTA
3,398
Vol. +4%
EMLA
5,997
Vol. +3% APAC
4,743
Vol. +10%
GLOBAL
14,138
Vol. +5.5%
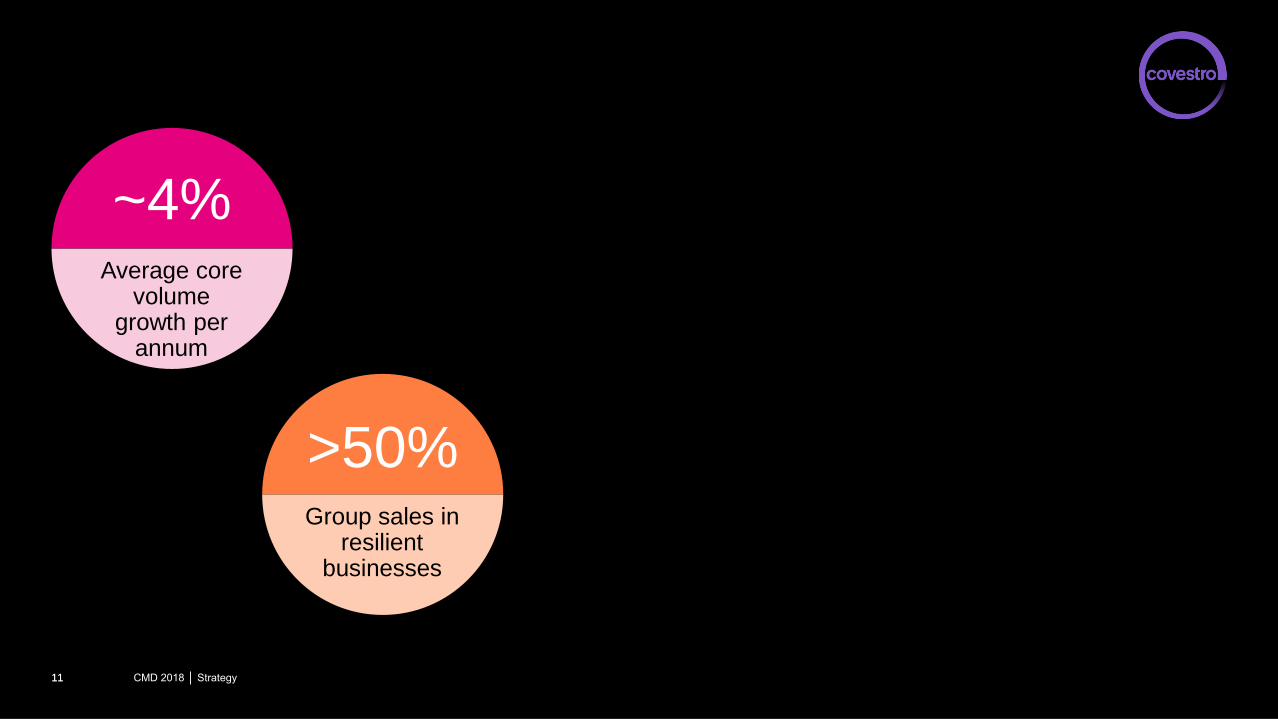
CMD 2018 │ Strategy 11 11
~4%
>50% Group sales in
resilient businesses
Average core volume
growth per annum

Over 50% of sales generated with resilient businesses
CMD 2018 │ Strategy 12
Resilient business contains highly differentiated products
Sales by segments Highlights
• Resilient portion of PCS business is driven by
high-end industry applications e.g. automotive,
electrical, healthcare
• CAS business is resilient in sales and earnings
due to characteristics of niche ingredient
chemicals
• Polyols business is resilient in sales and earnings
as demonstrated over the last decade
• Resilient portion of MDI business consists of
special grades for downstream products requiring
formulation know-how and customer interaction
along the value chain
Resilient businesses
Polyols
MDI(a) resilient
MDI
TDI Others
PCS ~11%
PCS resilient ~16%
CAS(a) 16%
% of 2017 Group sales
Note: (a) Adjusted prior-year figures to reflect the transfer of the specialty elastomers business from the Polyurethanes segment to the Coatings, Adhesives, Specialties segment as of January 1, 2018 Resilience measured as standard deviation of contribution margin per kg versus respective average portfolio
Resilience
in PCS
~60%
Resilience
in MDI
~25%
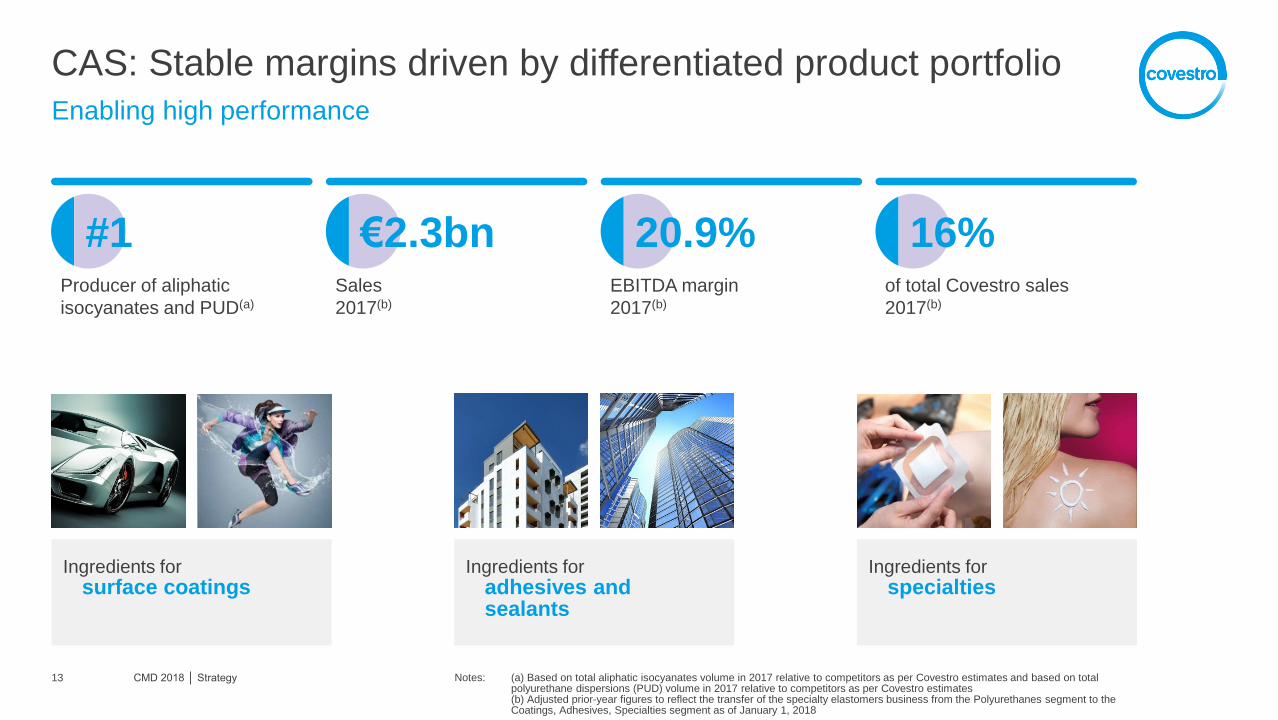
CAS: Stable margins driven by differentiated product portfolio
CMD 2018 │ Strategy 13
Enabling high performance
Notes: (a) Based on total aliphatic isocyanates volume in 2017 relative to competitors as per Covestro estimates and based on total polyurethane dispersions (PUD) volume in 2017 relative to competitors as per Covestro estimates (b) Adjusted prior-year figures to reflect the transfer of the specialty elastomers business from the Polyurethanes segment to the Coatings, Adhesives, Specialties segment as of January 1, 2018
#1 Producer of aliphatic
isocyanates and PUD(a)
€2.3bn Sales
2017(b)
20.9% EBITDA margin
2017(b)
16% of total Covestro sales
2017(b)
Ingredients for surface coatings
Ingredients for specialties
Ingredients for adhesives and sealants
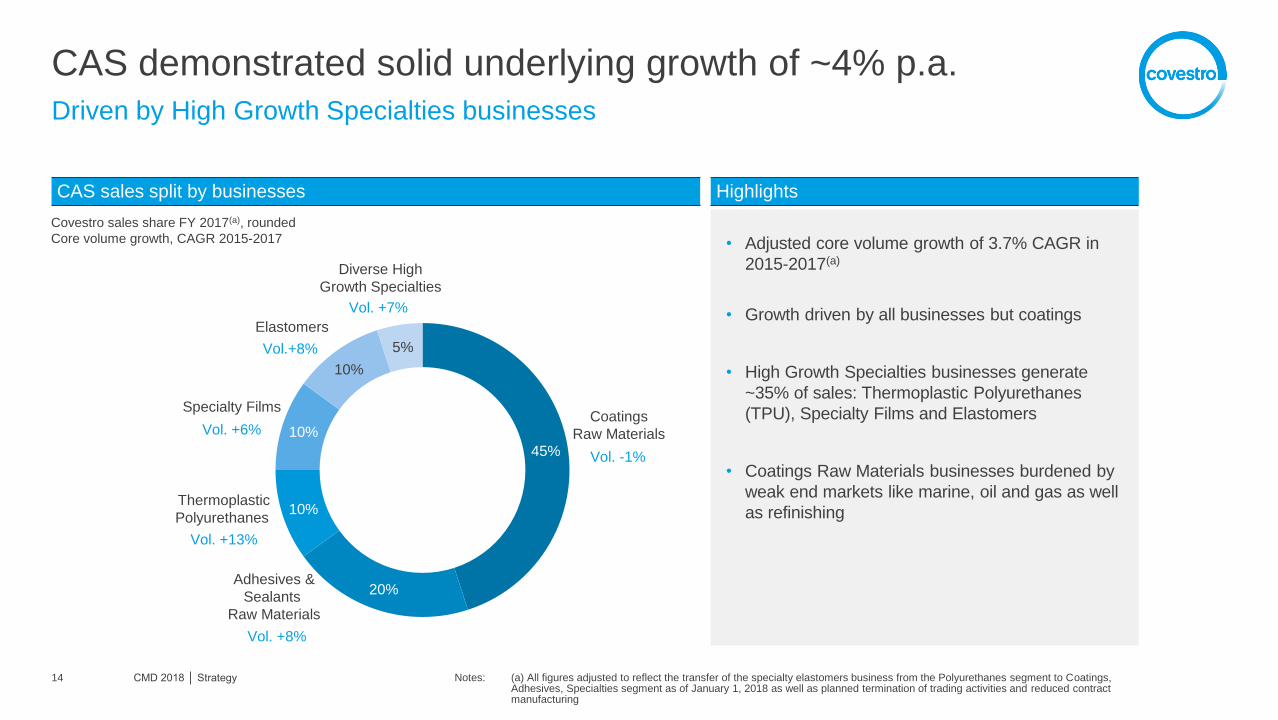
CAS demonstrated solid underlying growth of ~4% p.a.
CMD 2018 │ Strategy 14
Driven by High Growth Specialties businesses
Notes: (a) All figures adjusted to reflect the transfer of the specialty elastomers business from the Polyurethanes segment to Coatings, Adhesives, Specialties segment as of January 1, 2018 as well as planned termination of trading activities and reduced contract manufacturing
45%
20%
10%
10%
10%
5%
CAS sales split by businesses
Covestro sales share FY 2017(a), rounded
Core volume growth, CAGR 2015-2017
Vol. -1%
Vol. +8%
Vol. +13%
Vol.+8%
Vol. +6%
Vol. +7%
Coatings
Raw Materials
Adhesives &
Sealants
Raw Materials
Thermoplastic
Polyurethanes
Elastomers
Specialty Films
Diverse High
Growth Specialties
Highlights
• Adjusted core volume growth of 3.7% CAGR in
2015-2017(a)
• Growth driven by all businesses but coatings
• High Growth Specialties businesses generate
~35% of sales: Thermoplastic Polyurethanes
(TPU), Specialty Films and Elastomers
• Coatings Raw Materials businesses burdened by
weak end markets like marine, oil and gas as well
as refinishing

TPU: Leading supplier for high-performance resins
CMD 2018 │ Strategy 15
Core volume growth of 13% (CAGR 2015-2017)
Notes: (a) Global thermoplastic polyurethanes market (b) Incl. 50/50 JV with DIC in Japan Source: Covestro estimates
#3 Producer of Thermoplastic
Polyurethanes
Market growth
CAGR 2017-2022e(a)
~10% of total CAS
sales 2017
~6%
6 Production facilities
globally(b)
Competitive landscape of key TPU producers in 2017 Thermoplastic Polyurethanes (TPU) highlights
Bubble size indicates
2017 sales volumes
Narrow Wide
Local
Global
APAC & EMEA SMEs
(e.g. Innov, Miracll, Bangtai)
Coim
Huntsman
Lubrizol
Wanhua
Huafon
BASF Covestro
Ge
og
rap
hic
pre
se
nce
Product portfolio

Specialty Films: Leading solution provider for PC- & TPU-films
CMD 2018 │ Strategy 16
Core volume growth of 6% (CAGR 2015-2017)
Notes: (a) Global PC- and TPU-films market Source: Covestro estimates
#1or #2 Producer of PC- and TPU-
films, depending on region
Market growth
CAGR 2017-2022e(a)
~10% of total CAS
sales 2017
6-7%
5 Production facilities
globally
Competitive landscape of key films producers in 2017(a) Specialty Films highlights
Commodity Specialties
SWM
Mitsubishi
Gerlinger
API
Longhua
Dingzing
Sabic
Teijin
3M Covestro
Global
Ge
og
rap
hic
pre
se
nc
e
Market attractiveness
Local
Bubble size indicates
2017 sales volumes

Elastomers: Leading supplier for PU cast elastomer systems
CMD 2018 │ Strategy 17
Core volume growth of 8% (CAGR 2015-2017)
Notes: (a) Global PU elastomers market Source: Covestro estimates
#2 Producer of
PU elastomer systems
Market growth
CAGR 2017-2022e(a)
~10% of total CAS
sales 2017
3-4%
Production sites
globally
Competitive landscape of PU elastomer producers in 2017(a) Elastomers highlights
Narrow
Wide
Commodity Specialty
Pro
du
ct
po
rtfo
lio
Market attractiveness
Lanxess
BASF
ERA
Covestro
Dow
COIM
Multiple local
Chinese
competitors
Huntsman
Notedome
Anderson-
Mitsui
11
Bubble size indicates
2017 sales volumes
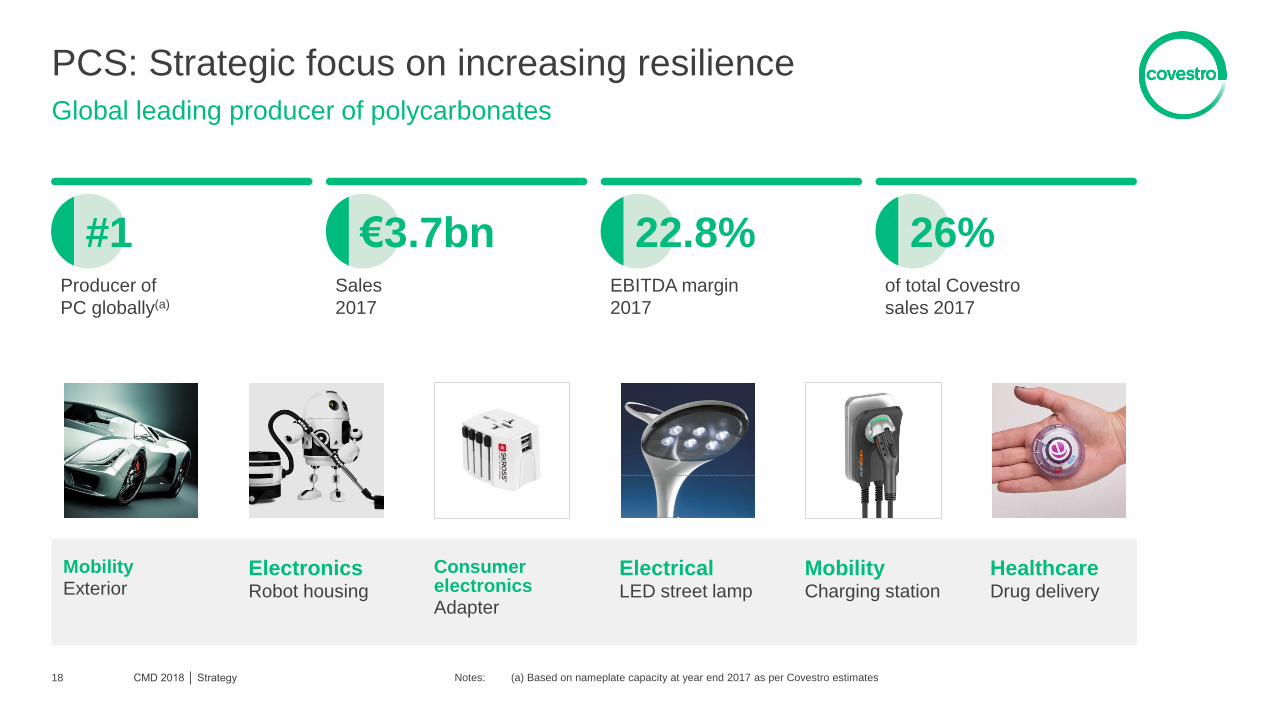
PCS: Strategic focus on increasing resilience
CMD 2018 │ Strategy 18
Global leading producer of polycarbonates
Notes: (a) Based on nameplate capacity at year end 2017 as per Covestro estimates
#1 Producer of
PC globally(a)
€3.7bn Sales
2017
22.8% EBITDA margin
2017
26% of total Covestro
sales 2017
Electronics Robot housing
Mobility Exterior
Consumer electronics Adapter
Mobility Charging station
Healthcare Drug delivery
Electrical LED street lamp

Growing share of resilient business
CMD 2018 │ Strategy 19
Covestro targets to outgrow PC industry in differentiated business
Notes: (a) Nameplate capacity for PC resins at year end
Covestro highlights Development of resilient portion of PCS volumes
Product portfolio improvement
• Goal to increase resilient portion of PC volumes to 65%
long term
• Capacity growth and increasing share of resilient
business result in significantly higher volumes in
differentiated, high-requirement applications
• Structural improvement of average contribution margin
Higher asset utilization
• Volume leverage through significant improvement of
capacity utilization by ~15 percentage points
• Significantly higher output from unchanged number of
primary production sites
Covestro sales volumes in kt
2013 2017 2022e
<50% ~55%
>60%
8%
CAGR
>4%
CAGR
Resilient business
>600kt additional volumes sold
in 2022e vs 2013
Standard business
>200kt additional volumes sold
in 2022e vs 2013
1,270kt 1,480kt >1,700kt
5 5 5 No. of primary
PC production sites
9%
CAGR
~10%
CAGR
Covestro utilization
+15pp
~ flat
Covestro capacity(a)

Growing share of compounded resins
CMD 2018 │ Strategy 20
Formulations with tailored property profiles and significant added value for customers
Blend
partner
Fillers and
reinforcement
Functional
additives
Compounding
Processor
Application
ABS or ASA e.g. to improve
toughness at low temperature
Colorants &
special effects
e.g. glass fiber to provide high
stiffness
e.g. UV / light stabilizers to
improve long-term stability
e.g. flame retardants
e.g. colors to provide optical
effects
PC resins
PBT or PET e.g. to improve
chemical resistance and flow
Internally sourced Externally sourced
Concept of compounding
PCS sales split by product group
Share of compounded resins
FY 2010
FY 2017
Compounded
resins
35%
Resins
65%
Compounded
resins
46%
Resins
54%
Notes: Majority of compounded resins are part of the resilient portion of PCS sales
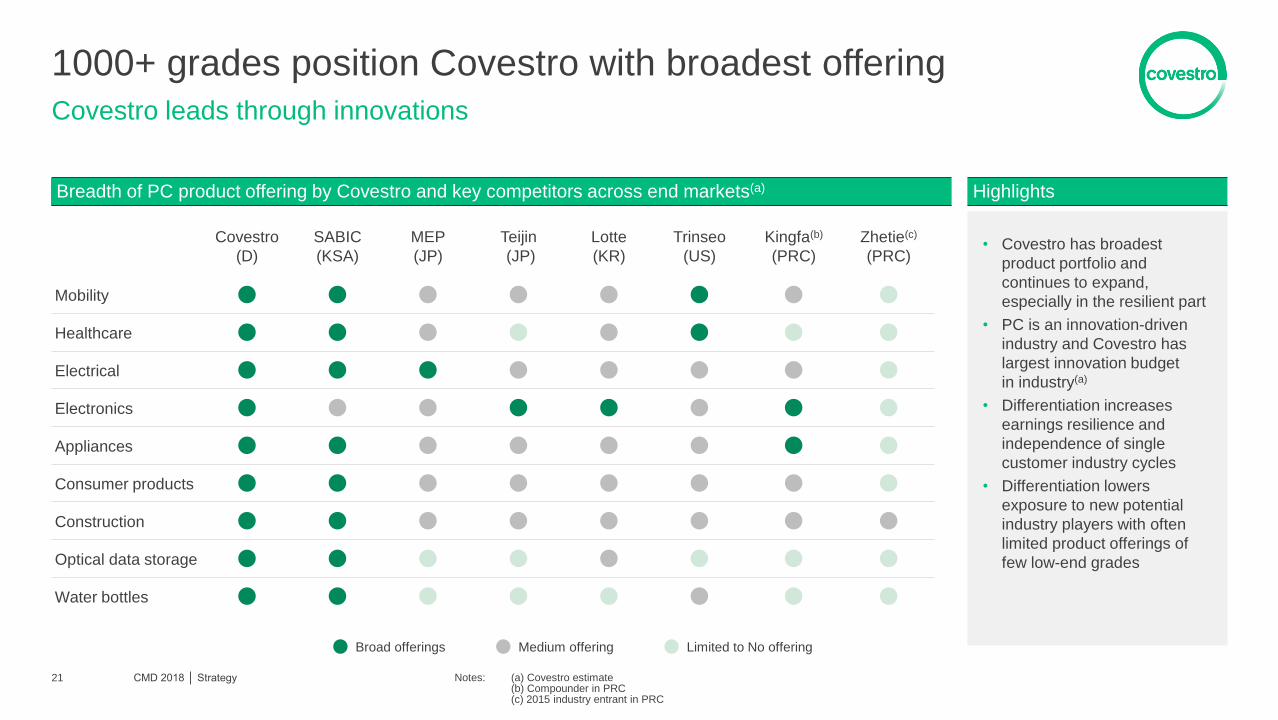
1000+ grades position Covestro with broadest offering
CMD 2018 │ Strategy 21
Covestro leads through innovations
Notes: (a) Covestro estimate (b) Compounder in PRC (c) 2015 industry entrant in PRC
Highlights Breadth of PC product offering by Covestro and key competitors across end markets(a)
• Covestro has broadest
product portfolio and
continues to expand,
especially in the resilient part
• PC is an innovation-driven
industry and Covestro has
largest innovation budget
in industry(a)
• Differentiation increases
earnings resilience and
independence of single
customer industry cycles
• Differentiation lowers
exposure to new potential
industry players with often
limited product offerings of
few low-end grades
Covestro
(D)
SABIC
(KSA)
MEP
(JP)
Teijin
(JP)
Lotte
(KR)
Trinseo
(US)
Kingfa(b)
(PRC)
Zhetie(c)
(PRC)
Mobility
Healthcare
Electrical
Electronics
Appliances
Consumer products
Construction
Optical data storage
Water bottles
Medium offering Limited to No offering Broad offerings

PUR: Almost half of sales in resilient businesses
CMD 2018 │ Strategy 22
Inventor of and leader in polyurethanes
Notes: (a) Based on total combined nameplate capacity for MDI, TDI and polyether polyols at year end 2017 as per Covestro estimates (b) Adjusted prior-year figures to reflect the transfer of the specialty elastomers business from the Polyurethanes segment to the Coatings, Adhesives, Specialties segment as of January 1, 2018
#1 PU producer globally(a)
€7.4bn Sales
2017(b)
29.5% EBITDA margin
2017(b)
52% of total Covestro
sales 2017(b)
Construction e.g. metal panel
Cold Chain e.g. refrigerator
Cost leadership e.g. process
technology
Comfort e.g. furniture
upholstery
Automotive e.g. instrument
panel
Sustainability e.g. CO2-based
polyether polyols

Notes: (a) The global average polyols / propylene prices have been calculated based on the polyols / propylene prices in Europe, US and China and weighting this average against the respective demand in those regions
Polyether polyols demonstrate inherently stable margins
CMD 2018 │ Strategy 23
Resilience of polyether polyols business confirmed in 2017
Spread development
2006 2007 2008 2009 2010 2011 2012 2013 2014 2015 2016 2017
Global propylene price(a) Global polyols price(a)
2005 – 2017 Spreads
from around 800US$/t to 1,000US$/t
• Resilient industry margins over the last
decade reflective of overall Covestro polyether
polyols profitability
• Single capacity addition with little influence
on supply and demand dynamics
• Spreads not materially impacted by high
volatility of propylene prices, particularly
during the financial crisis
• Propylene oxide supply and demand
dynamics create local pricing opportunities
in the short term
Highlights

Resilient portion of MDI business accounts for ~25% of sales
CMD 2018 │ Strategy 24
Consistently higher earnings than standard grades
Notes: (a) Resilience measured as standard deviation of gross margin vs average portfolio (b) CASE: Coatings, adhesives, sealants and elastomers
Resilient MDI applications(a)
• Focus on three large-scale innovation hubs in Pittsburgh,
Leverkusen and Shanghai
Formulation know-how and tailor-made systems
Full scope of application development
Cost-efficient business structures
• Centralized systems hubs in Europe and North America benefit
from economies of scale and cost-efficient feed from world-scale
MDI and polyether polyols assets
• Systems business in Middle East and APAC handled by local
system houses
Large-scale innovation
Resilient share of MDI volumes has ~20% higher gross margin
(2006-2017 average)
Joint sales of polyols and MDI
e.g. CASE(b), automotive,
construction, appliance
Formulations as market access
requirement
e.g. automotive, appliances
Specialty or downstream products
e.g. selected MDI grades (pre-
polymers, blends, monomeric)
Strong interaction with customers
along value chain
joint projects for e.g. window frames,
wind mills

CMD 2018 │ Strategy 25 25
Solid overall
industry margins outlook
~4%
>50% Group sales in
resilient businesses
Average core volume
growth per annum

Less than 50% of sales are supply and demand driven
CMD 2018 │ Strategy 26
Normal global GDP growth to support a balanced outlook
Sales by segments Highlights
• TDI industry expected to rebalance to a normal
supply and demand situation, fly-up margin
expected to fade away short term
• MDI industry supply and demand expected to
remain balanced
• PC industry supply and demand expected to
remain balanced mid term
Polyols
MDI(a) resilient
MDI
TDI Others
PCS ~11%
PCS resilient ~16%
CAS(a) 16%
% of 2017 Group sales
Note: (a) Adjusted prior-year figures to reflect the transfer of the specialty elastomers business from the Polyurethanes segment to the Coatings, Adhesives, Specialties segment as of January 1, 2018 Resilience measured as standard deviation of contribution margin per kg versus respective average portfolio
Supply-demand-
driven businesses

MDI industry supply and demand to remain balanced
CMD 2018 │ Strategy 27
Above GDP demand growth supports solid industry utilization
Notes: (a) Assumes global GDP CAGR 2017–2022e of ~3% (b) Based on historical and announced future nameplate capacities Source: Covestro estimates
• Budgeted demand growth of ~5% may be conservative given strong demand trends • Demand growth of 7% (high case) would require two additional world-scale plants compared to base case • Structurally sound demand for the foreseeable future, driven by solid GDP growth and substitution trend
• Major additions expected until 2022e: BASF, Covestro, Dow/Sadara, SLIC and Wanhua
5,130
6,710
~8,600
2012 2017 2022e
5,900
7,490
~9,600
2012 2017 2022e
MDI demand development (2012 – 2022e) MDI supply development (2012 – 2022e)
Industry highlights
(kt)(a)
% growth as CAGR (kt)(b)
% growth as CAGR BASE
5.5%
~5% 4.9%
~5%
BASE
HIGH ~6%
~4% LOW
~7% HIGH
~4% LOW

TDI supply additions to rebalance industry
CMD 2018 │ Strategy 28
Moving to a balanced industry with fly-up margin expected to fade away short term
Notes: (a) Assumes global GDP CAGR 2017–2022e of ~3% (b) Based on historical and announced future nameplate capacities Source: Covestro estimates
• Demand growth of ~4% may be conservative in light of 4.4% actual growth in 2017 • TDI margins currently above long-term average due to delayed start-up of major investments • Margins expected to normalize mid 2018 based on new world-scale capacities
• Major additions expected until 2022e: BASF, Dow/Sadara, Wanhua • Possible industry consolidation in APAC
(kt)(a)
% growth as CAGR (kt)(b)
% growth as CAGR
TDI demand development (2012 – 2022e) TDI supply development (2012 – 2022e)
1,980 2,280
~2,770
2012 2017 2022e
2,400 2,540
~3,450
2012 2017 2022e
BASE
2.8%
~4% 1.1%
~6%
BASE
4.5% HIGH
3.5% LOW
HIGH 7%
5% LOW
Industry highlights

PC industry supply and demand to remain balanced mid term
CMD 2018 │ Strategy 29
Capacity additions announced for end of forecasting period with high uncertainties
Notes: (a) Assumes global GDP CAGR 2017–2022e of ~3% (b) Based on historical and announced future nameplate capacities Source: Covestro estimates
• Electric mobility and autonomous driving could accelerate demand growth above base case • Major additions expected until 2022e: Covestro, Heng Yuan, Lotte, Luxi, Ningbo Zhetie Dafeng, SABIC-Sinopec,
Wanhua, ZPC
• Supply CAGR at 4-5% in 2017-2022e provided that announced capacity additions for 2022 would not materialize • New industry players likely to penetrate low-end applications
3,680 4,310
~5,240
2012 2017 2022e
(kt)(a)
% growth as CAGR (kt)(b)
% growth as CAGR
PC demand development (2012 – 2022e) PC supply development (2012 – 2022e)
Industry highlights
5% 4,750 5,050
~6,760
2012 2017 2022e
BASE
3.2%
~4% 1.2%
~6%
HIGH
3% LOW
BASE
HIGH 7%
4% LOW
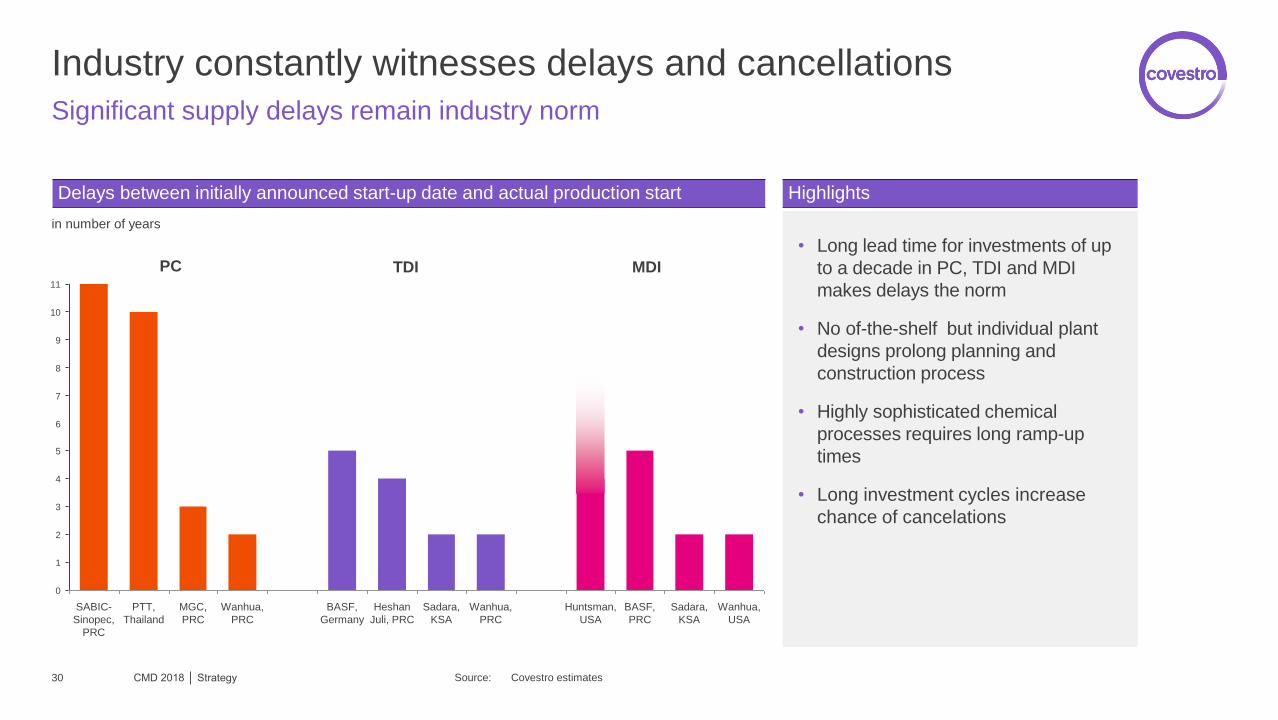
Industry constantly witnesses delays and cancellations
CMD 2018 │ Strategy 30
Significant supply delays remain industry norm
Highlights
• Long lead time for investments of up
to a decade in PC, TDI and MDI
makes delays the norm
• No of-the-shelf but individual plant
designs prolong planning and
construction process
• Highly sophisticated chemical
processes requires long ramp-up
times
• Long investment cycles increase
chance of cancelations
Delays between initially announced start-up date and actual production start
PC TDI MDI
in number of years
11
10
9
8
4
1
7
3
5
6
2
0
Huntsman,
USA
Sadara,
KSA
PTT,
Thailand
BASF,
PRC
Sadara,
KSA
Heshan
Juli, PRC
SABIC-
Sinopec,
PRC
MGC,
PRC
BASF,
Germany
Wanhua,
USA
Wanhua,
PRC
Wanhua,
PRC
Source: Covestro estimates

Historic forecasts always overstated supply additions
CMD 2018 │ Strategy 31
Significant supply delays remain industry norm
Source: (a) Nexant 2015 (at Covestro IPO) (b) Covestro estimates
• Delays and cancellations are
commonly neither announced by
companies nor publically available
• Difficult chemical production process
like TDI, MDI and PC increase the
likelihood of significant start-up delays
• A world-scale TDI plant represents
~10% of the overall industry supply
• Limited capacity additions in PC
industry explain small difference
Highlights
4%
-7%
-1%
11%
4%
18%
-20%
16%
-4%
Industry supply growth 2017 versus 2014, based on nameplate capacities (kt)
Global net supply additions between 2014 and 2017
TDI MDI PC
Difference
Actual 2017 supply(b)
Nexant(a)
Difference
Actual 2017 supply(b)
Nexant(a)
Difference
Actual 2017 supply(b)
Nexant(a)

Plant closures considered as “wild cards”
CMD 2018 │ Strategy 32
Unrecognized plant closures lead to systematic supply overstatements
Source: Covestro estimates
• TDI industry with steepest cash cost
differences shows highest decrease in
industry capacities through closures
• PC industry with accentuated cash
cost differences shows strong
decrease in industry capacities
through closures
• MDI industry with relatively small cash
cost differences shows minor
decrease in industry capacities
through closures
Plant closures between 2014 and 2017
Reduction of global nameplate capacity (in kt)
Highlights
-16%
-4%
-6%
MDI PCS TDI

33 33
#1 Global leader
Solid overall
industry margins outlook
Group sales in resilient
businesses
Average core volume
growth per annum
~4%
>50%
CMD 2018 │ Strategy

Covestro is a leader across its entire portfolio
CMD 2018 │ Strategy 34
Global industry positions
Note: (a) Based on total nameplate capacity at year end 2017 relative to competitors Source: Covestro estimates
29%
Others 19%
Others 10%
20%
Others 24%
30% Others
48%
13%
19%
Others 58%
Ca
pa
city s
ha
re in
20
17
(a)
2022e: Industry structure expected to remain stable
2022e: Top 5 share expected to remain stable at 90%
2022e: Top 5 share expected to remain stable at 76%
2022e: Further consolidation expected, especially in China
Top 5: 90% Top 5: 76% Top 5: 52%
2022e: Top 5 expected to account for ~70%
Top 5: 81%
Aliphatic isocyanate derivatives
Polyurethane dispersions PC Polyether polyols TDI MDI
Polyurethanes Polycarbonates Coatings, Adhesives, Specialties
Top 5: 42% Top 5: 90%
2022e: Industry structure expected to remain stable
#1 in PC #1 in PUR #1 in CAS
49%
Others
10%

Pushing boundaries in polymer innovation
CMD 2018 │ Strategy 35
Innovation leadership in materials
Notes: CFRTP: Continuous Fiber Reinforced Thermoplastics Composites
• Recticel manufactures KAPUA® foam mattresses with more than one-seventh of oil content replaced by CO2-based chemicals (e.g. cardyon®)
• Covestro is developing more CO2-based products for applications in sport, appliances, construction and others
• Heat-resistant, tough and elastic PC film Makrofol® ID is designed for passport data page (inlay) that may carry other security features like a chip and antenna
• The passport inlay is held securely by a thin hinge, made of multilayer composite TPU film Platilon®
• Mid double-digit million Euro amount invested in first commercial production in Germany
• Commercial application in e.g. Haier’s Casarte premium air conditioner housing
Film solutions for forgery-proof ID cards
CO2-based polyols in first commercial application (market testing) by
CFRTP commercial production inaugurated
Highlights Benefits

Pushing boundaries in making business
CMD 2018 │ Strategy 36
Innovation in business models
• Reliable, simple and efficient purchasing experience for small- and medium-sized customers (with maximum quantity orders)
• covestrochina.1688.com makes available polycarbonate as well as pre-products for polyurethane foams, coatings and adhesives
• Customers can efficiently purchase standard products online at current market prices
• Materials valued at up to €1bn to be sold via the platform by end of 2019
• Platform to be launched in 2018
• Utilize digitalization to deliver customers real time analysis of their performance and enable operational decisions, e.g. real-time quality and performance improvements
• Project using Covestro and customer data and self-learning AI algorithms in pilot phase
Digital marketplace for chemicals
Online business in Asia on Alibaba
Digital technical services (DTS)
Highlights Benefits

CMD 2018 │ Strategy 37 37
5 Non-financial targets 2025
#1
Global leader
Solid overall industry margins
outlook
Group sales in resilient
businesses
Average core volume
growth per annum
~4%
>50%

Non-financial ambition supports growth strategy
CMD 2018 │ Strategy 38
Covestro non-financial targets 2025
Our R&D project portfolio is aligned with UN Sustainable Development Goals
Reduce specific greenhouse gas emissions by 50% by 2025
100% of suppliers compliant with our sustainability requirements
Ten million people in underserved markets benefit from our business solutions
Getting the most out of carbon

Target N°1: Sustainability-related R&D
CMD 2018 │ Strategy 39
Increase share of sustainability-related R&D projects to 80% by 2025
Notes: By 2025, 80 % of R&D project spending of Covestro will be targeted in areas that contribute to achieving these goals, either undertaken in partnership or endorsed by recognized institutions
• Aligned with the People, Planet, Profit (PPP)
principle
• Strong focus on the UN Sustainable
Development Goals (SDGs)
• Capture promising growth opportunities with
innovative sustainable solutions
Key industries rely on sustainable solutions

Target N°2: External sourcing
CMD 2018 │ Strategy 40
100% of suppliers compliant with our sustainability requirements by 2025
Notes All suppliers of Covestro with recurrent annual spending exceeding €100,000 will be assessed and have to achieve compliance with Covestro’s sustainability requirements
• Dynamic and collaborative initiative founded in 2011, currently 19 members
• Offers the infrastructure to support high-quality, third-party sustainability assessments and audits by EcoVadis
Externally
audited by
Together For Sustainability

Target N°3: Emissions
CMD 2018 │ Strategy 41
Reduce specific greenhouse gas emissions by 50% by 2025
Notes: Covestro aims to reduce specific greenhouse gas emissions –those generated per metric ton of product produced– by 50% compared to year 2005 (a) The plant size for a given capacity is smaller, because the reaction time for the gas-phase phosgenation process is shorter than the conventional process and results in a significantly higher throughput (b) NaCl = Sodium Chloride; ODC = Oxygen Depolarized Cathode
Highlights
• Capex reduced by 20%(a)
• Reduced conversion cost due to lower energy demand and reduced solvent usage
• Reduced phosgene hold-up by 40% and energy consumption by 60% vs liquid phase
• Conversion cost advantage of around 20% vs. competitor technologies
• Raw material cost on par or better than competitive technologies
• Pushing economies of scale to new standard of 150kt/a per line in Caojing, China
• Consumes 30% less electricity vs. conventional processes
• Significant economic and ecological benefits vs conventional processes
• World-scale ODC plant planned in Tarragona, Spain
Benefits
Melt process in world-scale PC production
NaCl electrolysis with ODC(b)
TDI / HDI gas-phase phosgenation

• PIR technology based toilets
• Community and school toilets as the next step
• Locations: India, Malaysia
Target N°4: Inclusive business
CMD 2018 │ Strategy 42
Help ten million people in underserved markets with sustainable solutions by 2025
Notes: Covestro aims to help improve the living conditions of ten million people in underserved markets by the year 2025. Covestro focuses on affordable housing, sanitation and food security applications in which Covestro materials offer significant benefits
Highlights
• Based on polyurethane rigid foam (PIR)
• With outstanding insulation and mechanical properties
• Locations: Iraq, Malaysia, Philippines, India
• Food security: PCS solutions for smallholder farmers
• Avoid food wastage after harvest, benefitting farmers economically
• Locations: Thailand, Vietnam, Myanmar, India
Benefits
Solar dryer domes
Affordable houses
Hygienic sanitation

Target N°5: Return on carbon
CMD 2018 │ Strategy 43
Develop a significant and universally accepted metric to set a quantitative target for 2025
Our vision is to drive a new perspective on value creation through carbon
• Improving carbon productivity along the value chain means generating more value from less fossil fuel carbon
• The alternative ROCE measures the return on carbon employed in making materials and products
Our role as initiator of the Carbon Productivity Consortium:
• Promote a group of like-minded organizations who want to seed the breakthrough idea of carbon productivity across industry and beyond
• Catalyse new insights about carbon at various stakeholder levels
• Support the collaborative creation of a tool, soon available as open source
Highlights Partners

CMD 2018 │ Strategy 44 44
5
#1
Non-financial
targets 2025
Solid overall industry margins
outlook
Group sales in resilient
businesses
Global leader
Average core volume
growth per annum
~4%
>50%

CFO
Dr. Thomas ToepferChief Financial Officer
Dr. Thomas Toepfer is member of the Board of Management since April 2018. As Chief Financial Officer (CFO) at Covestro, he is responsible for Accounting, Controlling and Finance. He also oversees Investor Relations, Information Technology, Portfolio Development, Taxes and Law, Intellectual Property & Compliance.
Born in Hamburg, Germany, in 1972, Toepfer holds a PhD in Business Administration from Otto Beisheim Graduate School of Management (WHU), Koblenz. He worked as a consultant with McKinsey & Company, Inc. and in leading management positions for STILL GmbH, Karstadt Warenhaus GmbH amongst others. Before joining Covestro he was a member of the Executive Board, Chief Financial Officer and Labor Director of KION GROUP AG.
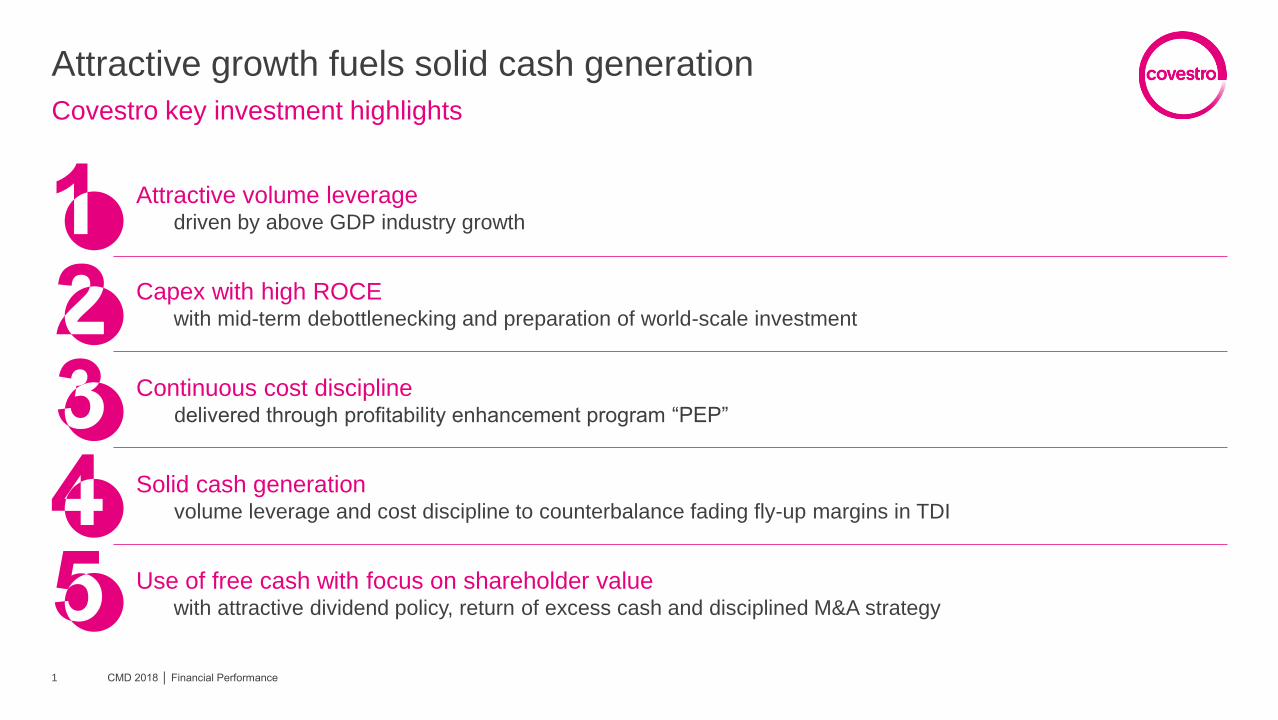
Attractive growth fuels solid cash generation
Covestro key investment highlights
Attractive volume leverage driven by above GDP industry growth
Continuous cost discipline delivered through profitability enhancement program “PEP”
Capex with high ROCE with mid-term debottlenecking and preparation of world-scale investment
Solid cash generation volume leverage and cost discipline to counterbalance fading fly-up margins in TDI
Use of free cash with focus on shareholder value with attractive dividend policy, return of excess cash and disciplined M&A strategy
CMD 2018 │ Financial Performance 1

2
~4% core volume growth
€200-300m volume leverage
CMD 2018 │ Financial Performance 2

Higher volumes generated €1.1bn additional sales
Covestro sales bridge 2015-2017
3
+1,298
+1,106
FY 2017
14,138
FX
-348
Price Volume FY 2015
12,082
4,956kt Core
volumes
4,458kt Core
volumes
in € million
CMD 2018 │ Financial Performance 3
+17.0%
+5.5%
CAGR
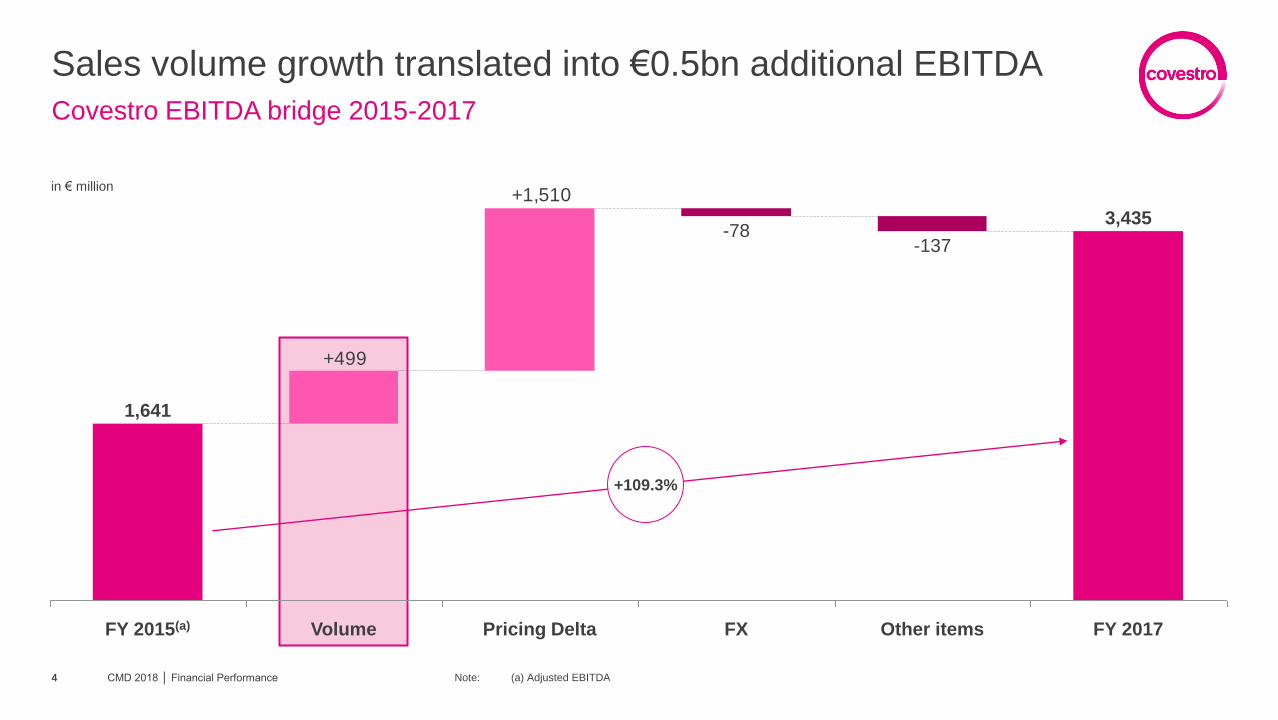
Sales volume growth translated into €0.5bn additional EBITDA
Covestro EBITDA bridge 2015-2017
+1,510
+499
FY 2017
3,435
Other items
-137
FX
-78
Pricing Delta Volume FY 2015(a)
1,641
4
+109.3%
in € million
CMD 2018 │ Financial Performance 4 Note: (a) Adjusted EBITDA

Core volume growth of 4% to contribute to EBITDA
Cumulative EBITDA volume leverage of more than €1bn in next 5 years
core
volume
growth
232
267
267
2022e 2021e 2020e 2019e 2018e 2017
499
2016
Cumulative volume effect Volume leverage per annum
+3.4% +7.5%
CMD 2018 │ Financial Performance 5
~4%
CAGR
in € million

6 CMD 2018 │ Financial Performance 6
€650-700m
capex expected in FY 2018
~4% core volume growth
€200-300m volume leverage

Mid-term debottlenecking projects
Highly competitive specific investment cost leads to high ROCE benefits
2009
Phase II
(+100kt)
2018e-2022e
Phase IV
(+200kt)
2005
Phase I
(+100kt)
2016
Phase III
(+200kt)
Lower specific capital investment required
due to:
• Process improvement through progress
on learning curve: technology progress
enables higher throughput
• Only adjustment or replacement of
selected equipment necessary, many
parts of the plants suitable for higher load
• Site infrastructure existing and only to be
adjusted to minor extent
PCS capacity expansion – Caojing MDI capacity expansions Advantages of debottlenecking projects
2022e
Tarragona
(+50kt)
2019e
Brunsbüttel
(+200kt)
2014 Caojing,
Phase II
(+150kt)
2008 Caojing,
Phase I
(+350kt)
Costs
-30%
Costs
-70%
Costs
-50%
Costs
-35%
Costs
-70%
Capex €/kt Capex €/kt
CMD 2018 │ Financial Performance 7

Covestro planned capacity additions
Mid-term growth through debottlenecking projects
2018 2019 2020 2021 2022
MDI +40kt Caojing(a)
PU
R
BA
CK
BO
NE
PET +60kt Channelview
PC
S
New chlorine plant Tarragona
MDI +50kt Tarragona
MDI +200kt Brunsbüttel
+130kt(b) site TBD
MDI +100kt Caojing
TDI +20kt Dormagen
PET +30kt St. Clara
+50kt Caojing
CMD 2018 │ Financial Performance 8
+50kt Caojing +50kt Caojing
OPTION
+50kt Caojing
OPTION OPTION
Note: (a) Installed end of 2017 (b) New PC line

Leading cost positions across business segments and regions
Capex projects further improves competitive cash cost position
Highlights
• Covestro is one of the low-cost
producers in MDI
• Capex for ongoing MDI
expansion projects reflected in
significant cash cost
improvements
• MDI industry with relatively flat
cost curves reflected by cash
cost advantage of ~20%
between the best and the
average of least competitive 5
plants
• Covestro is the global cost
leader in TDI and PCS
• Covestro cash cost advantage
of ~50% in TDI and ~30% in
PCS compared to the average
of least competitive 5 plants
MD
I(a)
TD
I(a)
PC
S(b
)
Europe North America Asia
Cash cost Cash cost Cash cost
Nort
h
Am
erican
laggard
Nort
h
Am
erican
follo
wer
Covestr
o
Bayt
ow
n
Euro
pean
laggard
Covestr
o
Bru
nsbuettel
Covestr
o
Tarr
agona
Covestr
o
Uerd
ingen
Euro
pean
leader
ME
pla
yer
(landed W
E)
ME
pla
yer
(landed
Chin
a)
Asia
n
laggard
Chin
ese
laggard
Covestr
o
Caojin
g
Chin
ese
leader
Nort
h
Am
erican
follo
wer
Covestr
o
Bayt
ow
n
Asia
n
laggard
Chin
ese
laggard
ME
pla
yer
(landed
Chin
a)
Chin
ese
follo
wer
Covestr
o
Caojin
g
ME
pla
yer
(landed W
E)
Euro
pean
laggard
Euro
pean
follo
wer
Covestr
o
Dorm
agen
Nort
h
Am
erican
laggard
Nort
h
Am
erican
follo
wer
Covestr
o
Bayt
ow
n
CMD 2018 │ Financial Performance Notes: (a) Cost of production based on total raw material costs less co-product credits, variable and fixed conversion costs at 100% utilization based on nameplate capacity for FY 2017 (b) FY2017 Cash cost ex gate, 82% utilization rate for all plants based on nameplate capacity. Integrated players are shown without any margins for BPA, phenol, acetone, etc.
Cash cost improvements based on debottlenecking projects
Euro
pean
laggard
Euro
pean
follo
wer
Covestr
o
Uerd
ingen
ME
pla
yer
(landed W
E)
Asia
n
laggard
ME
pla
yer
(landed C
hin
a)
Covestr
o
Caojin
g
Asia
n
follo
wer
Covestr
o
Map T
a P
hut
9

Capex with high ROCE
Mid-term debottlenecking capex and preparation of world-scale investment
Notes: (a) Cash-relevant capex, prior to initial application of new accounting standard IFRS 16 Leases, effective January 1st, 2019 (b) POT: pay-off time
Highlights 2018-2021e
Disciplined decision process
• Financial fit (ROCE, NPV, POT(b))
• Prioritization with focus on value creation
Maintenance capex at €250-300 p.a.
• Risk assessment
• Financial impact from project delay
Debottlenecking capex
• Accompany industry growth by adding
capacity through debottlenecking projects
• Capex with superior ROCE
Additional capex creates significant value
• New growth investment into world-scale
plants on existing sites
• Capex with high ROCE
• Spending depends on projects and timing
Covestro capex(a) development 2006-2021e
2021e 2020e 2019e 2017 2018e 2015 2014
509 518
2016
419
2007
889
2009 2013
512
2008
583
2006
753 831
2011
574 612
505
633
2012 2010
Debottlenecking capex Maintenance capex Additional capex into world-scale assets
149% 178% 165% 84% 88% 99% 95% 84% 101% 69% 61% 83% >100% >100% >100% >100%
% Capex as % of D&A in € million
CMD 2018 │ Financial Performance 10
650-700
upper end

11 CMD 2018 │ Financial Performance 11
€650-700m
capex expected in FY 2018
~4% core volume growth
€200-300m volume leverage
cost savings until 2019e
~€370m

Successful execution of “PEP”
Profitability enhancement program delivered €233m until end of 2017
Note: (a) PEP: Profitability Enhancement Program
53
194233
53
39
141
2019e
~370
~60
~310
2018e
~310
~80
2017
233
2016
194
2015
Cumulated cost savings Cost savings per annum
Highlights
• Achieved savings of €233m until
end of 2017
• Implemented projects expected to
deliver additional savings of
~€140m until end of 2019
• Difference between original target
of ~€420m and projected savings of
~€370m mainly due to decision to
reverse the planned closure of
Tarragona site
Cumulated savings achieved with “PEP”(a)
CMD 2018 │ Financial Performance 12
in € million

Commitment to limit additional operational cost
Counterbalancing operational cost increases with efficiency programs
-142
-283-142
-141
2021e 2020e 2019e 2018e 2017
-283
2016
Cumulative operational costs Operational costs per annum
Highlights Cumulative additional operational costs(a) impacting EBITDA
• In 2016-2018e, higher operational
costs due to:
Short-term incentive payments
Capex related operational costs
(e.g. engineering expertise)
Digitalization related costs
Logistics (e.g. inter-regional
transportation)
Inflation related costs (e.g.
salaries)
• In 2019e-2021e, increased efforts of
cost control limit operational cost
increases
CMD 2018 │ Financial Performance 13 Note: (a) Excluding one-time items
in € million

14
FOCF expected 2017-2019e
>€5bn
CMD 2018 │ Financial Performance 14
€650-700m
capex expected in FY 2018
~4% core volume growth
€200-300m volume leverage
cost savings until 2019e
~€370m

FOCF target of more than €2bn for FY 2018
CMD 2018 │ Financial Performance 15
Target for cumulative FOCF in 2017-2019e increased to more than €5bn
FOCF
Highlights
-509-518
1,161
1,641 2,014
3,435
-475-419
-418
-510
-612
2018e 2017 2016 2015 2014
Other effects Income taxes Capex Working Capital Special items Adj. EBITDA
+208% 313 +42% 964 +35% 1,367 1,843 >2,000
in € million • Increase of previous target of €5bn
for cumulative FOCF in 2017-2019e
to more than €5bn
• Sustainable high EBITDA to FOCF
conversion rate
• Working capital to sales ratio in the
target range of 15-17%, with limited
expected impact on FY 2018
• Capex of €650m to €700m up Y/Y
slightly up versus previous guidance
in order to secure production
reliability
• Tax rate expected at 25-27% for FY
2018
44 133
25
-89
-39 -157
-84
115
-222
-194
165
Around
previous
year‘s
level
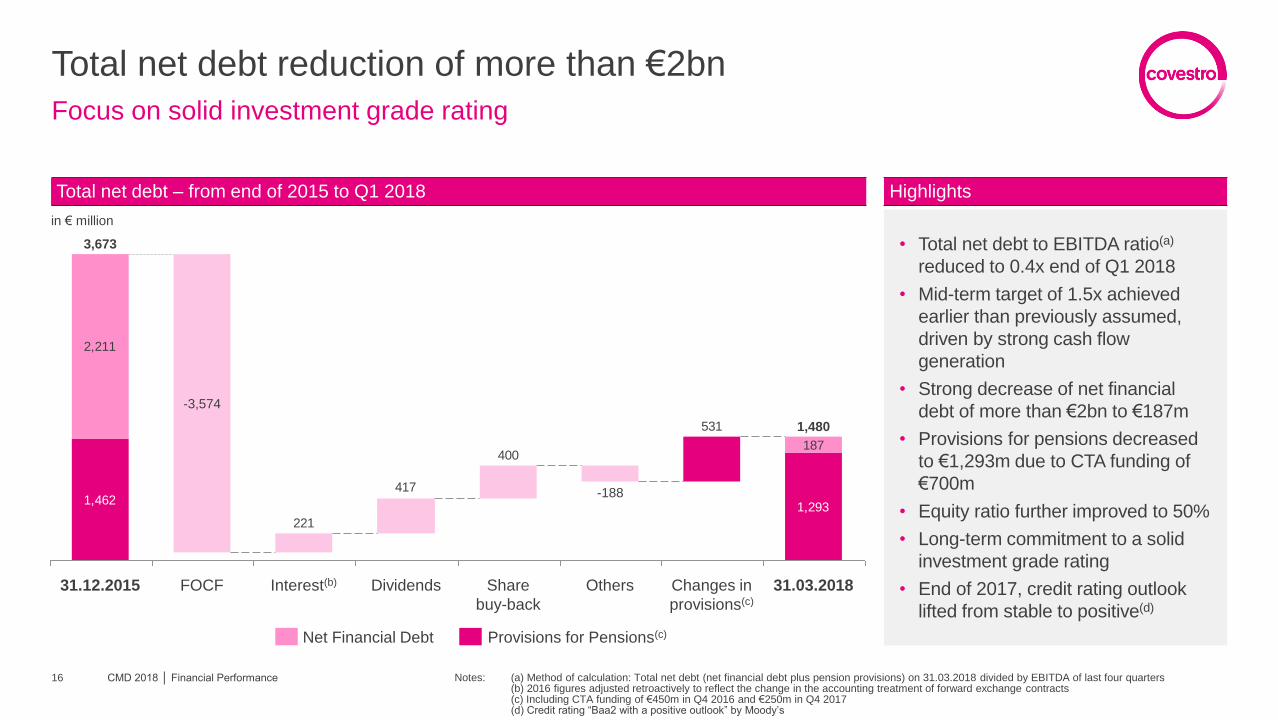
Total net debt reduction of more than €2bn
CMD 2018 │ Financial Performance 16
Focus on solid investment grade rating
Notes: (a) Method of calculation: Total net debt (net financial debt plus pension provisions) on 31.03.2018 divided by EBITDA of last four quarters (b) 2016 figures adjusted retroactively to reflect the change in the accounting treatment of forward exchange contracts (c) Including CTA funding of €450m in Q4 2016 and €250m in Q4 2017 (d) Credit rating “Baa2 with a positive outlook” by Moody’s
1,209
Provisions
for
Pensions
531
400
417
221
1,2931,462
187
2,211
1,480
Changes in
provisions(c)
31.03.2018 FOCF Interest(b) Dividends Share
buy-back
Others
-188
31.12.2015
-3,574
3,673
Highlights Total net debt – from end of 2015 to Q1 2018
Net Financial Debt Provisions for Pensions(c)
in € million
• Total net debt to EBITDA ratio(a)
reduced to 0.4x end of Q1 2018
• Mid-term target of 1.5x achieved
earlier than previously assumed,
driven by strong cash flow
generation
• Strong decrease of net financial
debt of more than €2bn to €187m
• Provisions for pensions decreased
to €1,293m due to CTA funding of
€700m
• Equity ratio further improved to 50%
• Long-term commitment to a solid
investment grade rating
• End of 2017, credit rating outlook
lifted from stable to positive(d)

17
€ Use of free cash
focused on shareholder
value
CMD 2018 │ Financial Performance 17
€650-700m
capex expected in FY 2018
FOCF expected 2017-2019e
>€5bn
~4% core volume growth
€200-300m volume leverage
cost savings until 2019e
~€370m

Use of free cash with focus on shareholder value
Decision for cash return to shareholders or portfolio based on best value creation
Note: (a) Either up to €1.5bn or up to 10% of stock capital, whichever is reached first
Dividend policy Return to shareholders
• Progressive dividend policy: increase or
keep at least stable
• FY 2017 dividend of €2.20 per share,
63% above prior year
• Total payout amount of €436m
€ €
• Policy to return excess cash either as
share buy-back or special dividend
• Share buy-back for up to €1.5bn(a) in
execution, with completion targeted by
mid 2019
CMD 2018 │ Financial Performance 18
Portfolio
• Disciplined and focused approach
• Acquisitions with focus on high margin
and differentiated business areas
• Ongoing portfolio optimization including
evaluation of potential disposals

Disciplined M&A approach
Clear strategic direction, defined process and strict financial criteria
Portfolio
• Disciplined and focused approach
• Acquisitions with focus on high
margin and differentiated business
areas
• Ongoing portfolio optimization
including evaluation of potential
disposals
Multiple criteria scorecard
• Positive NPV based on ramp-up of risk-adjusted synergies
• ROCE after synergies above WACC
• Positive contribution to FOCF through the cycle
• Maintain credit rating
• Focus on further upgrading internal M&A capabilities
• Limit risks on post-merger integration
• High revenue share in industries of the future
• Contributing to sustainable development goals
• Growth rate above GDP
• Increasing resilience
• Cultural fit
• Limited need for restructuring
Disciplined
financial impact
evaluation
“Walk, run, fly”
Strategic fit
Operational fit
CMD 2018 │ Financial Performance 19

Well on track
Updated 2018 guidance on FOCF and capex
Note: Basic assumptions FY 2018: Exchange rate of EUR/USD ~1.20 and a similar macroeconomic environment as in 2017 20
FY 2017 Guidance FY 2018
Core Volume Growth +3.4% Low- to mid-single-digit percentage increase Y/Y
FOCF €1,843m >€2bn
ROCE 33.4% Approaching previous year’s level
Additional financial expectations FY 2017 Guidance FY 2018
EBITDA FY €3,435m Around previous year’s level
EBITDA Q2 Q2 2017: €848m Above previous year’s level
D&A €627m €600-620m
Financial results €-150m €-100 to -120m
Effective tax rate 24.1% 25-27%
Capex €518m €650-700m
CMD 2018 │ Financial Performance 20

21
€ Use of free cash
focused on shareholder
value
CMD 2018 │ Financial Performance 21
€650-700m
capex expected in FY 2018
FOCF expected 2017-2019e
>€5bn
~4% core volume growth
€200-300m volume leverage
cost savings until 2019e
~€370m

PUR
Daniel MeyerHead of Business Unit Polyurethanes
Daniel Meyer is Head of the Polyurethanes (PUR) Business Unit from Covestro sinceSeptember 2017. Between July 2011 and August 2017, he was Head of the Coatings,Adhesives, Specialties (CAS) Business Unit.
Meyer was born in 1967 in Strasbourg, France. He graduated in International Trade & Commerce at the German-French school for Commerce and Industry (EFACI - Paris) and at the Industrie- und Handelskammer Aachen (IHK).
He entered the International Trade Department of Bayer France S.A. in 1992. In 1995, he took over the responsibility of Bayer’s titanium dioxide and lightfast pigment business in France. In 1997, he transferred to Bayer AG in Germany where he occupied several sales manager functions. Later, Meyer joined the Coatings and Adhesive business group as Global Key Account Manager and worked as Regional and Global Product Manager.
During his career he spent a total of eight years in Asia Pacific starting 2004. In 2007, he became Country Group Representative CAS Greater China. Two years later, Meyer took over as Head of Marketing and Business Development APAC. Afterwards, he headed the Coatings Adhesives and Specialties Business Unit in the Asia Pacific region.
Meyer is married and has two children.

PUR key investment highlights
CMD 2018 │ PUR 1
Global leader in a growth industry
Attractive industry growth and outlook based on robust structural demand drivers
Global #1 producer of PU with leading and defendable industry positions
Volume growth supported by mid-term debottlenecking and ongoing evaluation of investment options to capture long-term market growth
Cost leadership in TDI and competitive cost positions in MDI and polyols due to competitive process technologies, integrated production model and leading scale assets
Strong cash generation and target to achieve positive FOCF in any year across the cycle

PUR at a glance
CMD 2018 │ PUR 2
Inventor of and leader in polyurethanes
Notes: (a) Based on total combined nameplate capacity for MDI, TDI and polyether polyols at year end 2017 as per Covestro estimates (b) Adjusted prior-year figures to reflect the transfer of the specialty elastomers business from the Polyurethanes segment to the Coatings, Adhesives, Specialties segment as of January 1, 2018 (c) As well as integral foam, semi rigid foam, RIM, TPU and CASE (Coatings, Adhesives, Sealants and Elastomers) applications (d) Includes all MDI, TDI and polyether polyols facilities that partially reside at one site; feedstock and systems houses are excluded
• Inventor and producer of polyurethane raw materials and
formulations mainly for rigid and flexible foams(c)
• Broad portfolio spanning MDI and TDI (isocyanates) and
polyether polyols
• Competitive integration from key feedstock chlorine, aniline
and propylene oxide to formulations
• Global production platform comprising 18 facilities located in
Europe, USA and Asia(d)
• Total production capacity of ~3.5 million tons globally
• Solid cash conversion: €1.1bn FOCF from €2.2bn EBITDA
#1 PU producer globally(a)
€7.4bn Sales
2017(b)
29.5% EBITDA margin
2017(b)
52% of total Covestro
sales 2017(b)
Construction e.g. metal panel
Cold Chain e.g. refrigerator
Cost leadership e.g. process
technology
Comfort e.g. furniture upholstery
Automotive e.g. instrument panel
Sustainability e.g. CO2-based
polyether polyols

PU industry demand and growth drivers
CMD 2018 │ PUR 3
PU industry expected to grow ~5% annually until 2022
Notes: (a) Global PU market comprises combined MDI, TDI and polyether polyols industry demands as per Covestro estimates Source: IHS, UN, OECD, IPCC
Macro trend Impact on industries Covestro solution example
Resource
depletion
Increasing focus for sustainable
solutions Closing carbon cycle
cardyon® CO2-based polyols
Bio-aniline (Bio-based MDI)
Infusion technology for wind
Urbanization
New industry regulations on efficiency
Material for comfort adapted to higher
standard of living
Affordable appliance &
comfort
Baytherm® Microcell (high-
efficient microcellular foam)
Bed in box
Population
growth
Increasing need for more intelligently
insulated buildings Enhanced insulation
Energy-efficient insulation
based on Desmodur®
Mobility
Material for lightweight vehicles and
enhanced consumer driving
experience
Smart mobility
Baypreg® composite material
for load floor
Baynat® headliners with
improved acoustic
Digital
revolution
Unleash the power of artificial
intelligence to improve efficiency Intelligent solutions
BayCap® digital production
optimization and formulation
support
Global PU industry(a)
Demand ('000kt)
CAGR in %
2012 2017 2022e
16.9
13.5
21.3
4.6%
GDP 2.8%
~5%
GDP ~3%

PUR volume growth
CMD 2018 │ PUR 4
Core volume growth of 5.3% CAGR in 2015-2017
Notes: Based on Covestro Annual Report 2017; EMLA = Europe, Middle East Africa, Latin America; NAFTA = USA, Canada, Mexico; APAC = Asia, Pacific Adjusted prior-year figures to reflect the transfer of the specialty elastomers business from the Polyurethanes segment to the Coatings, Adhesives, Specialties segment as of January 1, 2018
PUR sales split by end-markets PUR sales split by regions
Growth driven by APAC Growth driven by several industries Growth driven by MDI and TDI
31%
20% 12%
8%
29% Vol. +5%
Vol. +3% Vol. +1%
Vol. +11%
Vol. +10%
TDI
Polyether polyols
MDI 43%
25%
32%
Vol. +7%
Vol. +2%
Vol. +8%
Vol. +10%
Vol. +4%
Vol. +3%
PUR volumes split by business
Comfort/
furniture
Construction Automotive
Appliances
~40% ~20%
~40%
EMLA
NAFTA
APAC
% of 2017 sales
Core volume growth, CAGR 2015-2017
% of 2017 sales
Core volume growth, CAGR 2015-2017 % of 2017 core volumes
Core volume growth, CAGR 2015-2017
Diverse industries
(incl. chemicals)

PUR competitive landscape
CMD 2018 │ PUR 5
Global #1 with full scope advantage and ability to shape the industry
Notes: (a) Excluding CASE - Coatings, Adhesives, Sealants and Elastomers (b) Including JV Source: Covestro estimates; nameplate capacities based on year end figures
Competitive position of key PU players in 2017 Top 5 PU competitors by name plate capacity
MDI MDI
MDI
MDI MDI
TDI TDI TDI
PET PET
PET
PET
PET
0
1
2
3
4
Covestro BASF DOW/Sadara Wanhua Huntsman
MDI MDI MDI
MDI
MDI
TDI TDI
TDI
PET PET
PET
PET
PET
0
1
2
3
4
Covestro BASF DOW/Sadara Wanhua Huntsman
2017
2022e
Size of bubble represents total MDI, TDI and polyether
polyols nameplate capacity
Covestro
BASF
DOW/Sadara
Huntsman
Wanhua
MCNS
Tosoh
Shell(b)
Dahua
Ge
og
rap
hic
fo
otp
rin
t
Regional
Global
Several additional small
local PU producers
PU chemistry scope(a) Limited Full spectrum
Hanwa
Bluestar
in mt

PUR margin resilience
CMD 2018 │ PUR 6
Polyether polyols demonstrate inherently stable margins
Notes: (a) The global average polyols / propylene prices have been calculated based on the polyols / propylene prices in Europe, US and China and weighting this average against the respective demand in those regions
Resilience of polyether polyols business confirmed in 2017
2006 2007 2008 2009 2010 2011 2012 2013 2014 2015 2016 2017
Global propylene price(a) Global polyols price(a)
2005 – 2017 Spreads
from around 800US$/t to 1,000US$/t
• Resilient industry margins over the last decade reflective of overall Covestro
polyether polyols profitability
• Spreads not materially impacted by high volatility of propylene prices, particularly
during the financial crisis
• Propylene oxide supply and demand dynamics create local pricing opportunities
in the short term
• Non-integrated polyether polyols producers
with limited competitiveness
• Single capacity addition with little influence
on supply and demand dynamics
• Distinct entry requirements for new players,
e.g. capex and technology
% of 2017 Group sales
Polyols
MDI resilient
MDI
TDI Others
PCS
PCS resilient
CAS Resilient
businesses

Polyols
MDI(a) resilient
MDI
TDI Others
PCS
PCS resilient
CAS(a)
PUR margin resilience
CMD 2018 │ PUR 7
Resilient portion of MDI business accounts for ~25% of sales
Notes: (a) Adjusted prior-year figures to reflect the transfer of the specialty elastomers business from the Polyurethanes segment to the Coatings, Adhesives, Specialties segment as of January 1, 2018 (b) Resilience measured as standard deviation of gross margin vs average portfolio (c) CASE: Coatings, adhesives, sealants and elastomers
Sales by segments Resilient MDI applications(b)
• Resilient share of MDI sales has ~20% higher gross margin
(2006-2017 average)
• Shift of elastomers business from MDI / PUR to CAS lowered resilient
part of MDI by ~5%-points to ~25% of total MDI sales
Resilient
businesses
% of 2017 Group sales
• Focus on three large-scale innovation hubs in Pittsburgh, Leverkusen
and Shanghai
Formulation know-how and tailor-made systems
Full scope of application development
Cost-efficient business structures
• Centralized systems hubs in Europe and North America benefit from
economies of scale and cost-efficient feed from world-scale MDI and
polyether polyols assets
• Systems business in Middle East and APAC handled by local system
houses
Large-scale innovation
~25% of
MDI sales
1
Joint sales of polyols and MDI
e.g. CASE(c), automotive, construction, appliance
Formulations as market access
requirement
e.g. automotive, appliances
Specialty or downstream products
e.g. selected MDI grades (pre-polymers,
blends, monomeric)
Strong interaction with customers
along value chain
joint projects for e.g. window frames, wind mills
1

PUR R&D highlights 2017
CMD 2018 │ PUR 8
Market-driven innovation as key value driver
Digital technologies enable new ways of production optimization by Covestro
customers
125 Mio €
R&D spend
172
official approvals for
product launches
~80%
of R&D spend going into
product innovation
90
patent
applications
R&D project examples
40% smaller cells allow up to 10% better insulation:
BAYTHERM® Microcell
Replacing epoxy resins by PU resins in wind turbine rotor blades
Bio-based aniline: biomass used as alternative raw
material to benzene
Innovative technology enables use of up to
20% CO2 as feedstock in polyether polyols
production

covestro.com
Polyurethanes
(PUR) MDI
TDI
Polyether polyols
CMD 2018 │ PUR 9

• Leading supplier in all key regions for MDI consuming industries
• Attractive industry growth of ~2pp above GDP supports stable industry utilization and margin outlook
• Covestro to grow volumes in line with industry growth supported by debottlenecking
• World-scale integrated production facilities support competitive cost position
• Proven track record of cost discipline with asset restructuring potential in Europe to deliver further efficiency upsides
MDI at a glance
CMD 2018 │ PUR 10
Leading global player with growth ~2pp above GDP
Notes: (a) Nameplate capacity based at year end 2017 as per Covestro estimates
#3 MDI producer globally(a)
1,450kt Capacity
2017(a)
~40% of PUR core volumes
2017
6 Production facilities
globally(b)

MDI industry demand
CMD 2018 │ PUR 11
Diverse end-markets in all regions support robust growth
Notes: (a) Figures represent CAGR 2017-2022e (b) CASE: Coatings, adhesives, sealants and elastomers Source: IHS, Covestro estimates
MDI demand by application
• Growing demand for insulation foam to comply with regional energy efficiency directives, particularly in developed economies
• Increase in global construction activity
‒ broader macro upturn
‒ high growth in emerging economies
• Higher consumption of appliances (refrigerators)
• Steady GDP-driven growth in other applications, e.g. CASE(b), textiles and footwear
Global ~5%
APAC ~6%
EMEA ~4-5%
NAFTA ~5%
LATAM ~3%
Underlying regional growth(a) CAGR 2017 – 2022e
CASE(b)
Apparel
Appliance
Construction
Automotive
Diverse
industries
4%
7%
4%
5%
4%
4%
Demand ('000kt)
CAGR in %
1.5 1.7 2.2
0.3 0.3
0.4 1.4
2.1
2.7 0.9
1.0
1.2
0.6
0.9
1.3
0.5
0.7
0.8
2012 2017 2022e
6.7
5.1
8.6
5.5%
GDP 2.8%
~5%
GDP ~3%

MDI competitive landscape
CMD 2018 │ PUR 12
Strong industry position supported by distinct entry requirements
Notes: (a) World-scale defined as MDI facility with capacity of 400-500kt p.a. (b) Nameplate capacity based on year end 2017 Source: Covestro estimates
2017
2007
2022e
Industry Covestro position
Capital
intensity
• Considerable investment required to develop world-
scale plants(a)
‒ Around €1.5bn investment for full train
‒ Approx. 5 years to full operation after completed
environmental impact assessment
• Well-invested, large- to world-scale asset base
• Economies of scale
• Total capacity 1,450kt(b)
Process
technology
• State-of-the-art technology along the process chain of
high importance
• Competitive process technology
• Cost leader in NAFTA and advantageous position
in Asia
• Efficiency improvements in EMLA underway
Feedstock
integration
• Security of precursor supply essential
• Backward integration as major value lever
• Favorable backward integration
• Long-term supply contracts for important precursors
Technical
capabilities
and expertise
• Systems demanding greater knowledge and expertise
• Permits required to handle hazardous feedstock,
e.g. phosgene
• Superior expertise and know-how in application
development and customer insight
• Reputation cemented through 60+ years’ experience
Proximity to
customer
markets
• Importance of proximity to customer markets
• Global asset base critical to support ambitions of global
customer base
• Diverse, global footprint
• Plants in all core regions
• Ability to service all key areas of demand
Global capacity by producer
Top 5 92%
Others 8%
91%
9%
92%
8%

Covestro Baytown North American follower North American laggard Europeanleader
CovestroUerdingen
CovestroTarragona
CovestroBrunsbuettel
Europeanlaggard
ME player(landed WE)
Chineseleader
CovestroCaojing
Chineselaggard
Asian laggard ME player(landed China)
MDI industry cost curves
CMD 2018 │ PUR 13
Leading cost position in US, efficiency improvements in other regions underway
Notes: (a) Cost of production based on total raw material costs less co-product credits, variable and fixed conversion costs at 100% utilization based on nameplate capacity for FY 2017 (b) ODC: oxygen-depolarized cathode Source: Covestro estimates
Covestro cost leadership through backward integration
European leader with large and energy-efficient MDI capacity plus cost-efficient raw material supply
Uerdingen more cost efficient relative to other Covestro facilities in Europe due to level of backward integration; expansion projects for BRU and TAR
Chinese leader with very strong backward integration including energy supply
Covestro ahead due to larger MDI train capacity and energy efficiency, further specific cost reduction through expansion projects
Benefits from low energy and natural gas prices, suffers from high investment level and required costly HCl recycling via ODC(b) electrolysis (no
benefit from caustic soda by-product sales); plus estimated 90-140 $/t bulk freight plus 6.5% import duty to WE and China
A B C F F
D E
A
B
C
D
E
North America
Cash cost(a) Cash cost(a) Cash cost(a)
F
COV BRU & TAR
ongoing expansion
projects
COV SHA
ongoing expansion
projects
EMEA Asia

MDI global operations
CMD 2018 │ PUR 14
Covestro MDI operations increase long-term ROCE through debottlenecking
Notes: All current nameplate capacities based on year end 2017
Covestro innovation centers
Covestro MDI facility
Pittsburgh, PA, USA
Leverkusen, Germany
Tarragona, Spain
• Nameplate capacity: 170kt
• Start of production: 1971
• New chlorine plant by 2020e
• Expansion to 220kt p.a.
by 2022e
Baytown, TX, USA
• Nameplate capacity: 330kt
• Start of production: 1974
• Continuous investments into
increased reliability
Uerdingen, Germany
• Nameplate capacity: 200kt
• Start of production: 1964
• Expansion in 2002
• EMEA facility with focus on
specialties production
Brunsbuettel, Germany
• Nameplate capacity: 200kt
• Start of production: 1988
• Economic expansion to
400kt p.a. in early 2019e
Caojing, China
• Nameplate capacity: 490kt
• Start of production: 2006
• Gradual debottlenecking to
600kt by 2021e
Niihama, Japan
• Nameplate capacity: 70kt
• Start of production:
MDI-1 1978, MDI-2 1995
• Covestro has 60% JV share
of Sumika Covestro
Urethane (SCU)
• 2010 shutdown of older
MDI train
Amagasaki, Japan
Shanghai, China

MDI capex projects
CMD 2018 │ PUR
15
Low specific investments due to established infrastructure and existing supply networks
Notes: All current nameplate capacities based on year end 2017 (a) ODC: oxygen-depolarized cathode
Caojing gradual debottlenecking
• World-scale plant with currently 490kt capacity to gradually reveal its full potential of 600kt p.a. by 2021e
• Mid-single digit Euro million investments backed by additional market demand
• Further dilute specific fixed costs
Brunsbuettel expansion of 200kt p.a.
• Re-usage of idle TDI infrastructure and precursors enables economic doubling of MDI capacity to 400kt p.a.
• Leverage existing site infrastructure and share of precursors
• Low triple-digit Euro million investment, start-up expected in first half of 2019e
Brunsbuettel Germany
Caojing China
Various options for additional MDI growth under investigation
• New world-scale plant investments operational approx. 5 years after initiated environmental impact assessment
• Debottlenecking can be realized with approx. 3 years lead time
Tarragona debottlenecking of 50kt p.a.
• Competitive debottlenecking from 170kt to 220kt p.a. by 2022e
• Investment of around €200m in own chlorine production by 2020e based on leading ODC(a) technology ensures a highly efficient, sustainable and independent supply
Tarragona Spain

covestro.com
Polyurethanes
(PUR) MDI
TDI
Polyether polyols
CMD 2018 │ PUR 16

• Globally leading producer of TDI with number one positions in all major regions
• Industry demand growth above GDP driven by all key end markets and regions, particularly APAC
• TDI margins volatile and currently above sustainable level due to temporary capacity constraints
• Superior cost position through backward integration, proprietary gas-phase phosgenation technology and integrated, world-scale production assets
TDI at a glance
CMD 2018 │ PUR 17
Global leader in long-term growth industry
Notes: (a) Nameplate capacity based at year end 2017 as per Covestro estimates
#1 TDI producer globally(a)
750kt Capacity
2017(a)
~20% of PUR core volumes
2017
3 Production facilities
globally

4%
4%
2%
8%
TDI industry demand
CMD 2018 │ PUR 18
Diverse end-markets across all regions support robust growth
Notes: (a) Figures represent CAGR 2017-2022e (b) CASE: Coatings, adhesives, sealants and elastomers Source: IHS, Covestro estimates
• Solid growth across all major applications
• Higher consumption of mattresses and furniture by emerging middle class in developing economies
• Favorable substitution trends in CASE(b) owing to relative advantages vs. competing materials
Global ~4%
APAC ~5%
EMEA ~3%
NAFTA ~3%
LATAM ~1%
Underlying regional growth(a)
Demand ('000kt)
CAGR in %
0.02 0.05 0.1
0.1 0.2 0.2
1.5
1.8
2.1
0.3
0.3
0.4
2012 2017 2022
2.3
2.0
2.8
CASE(b)
Wood/
Furniture
Automotive
Diverse
industries
TDI demand by application CAGR 2017 – 2022e
2.8%
GDP 2.8%
~4%
GDP ~3%

TDI competitive landscape
CMD 2018 │ PUR 19
Strong industry position supported by distinct entry requirements
Notes: (a) World-scale defined by company assessment as TDI facility with capacity of 250-300kt p.a Source: Covestro estimates
2017
2007
2022e
Industry Covestro position
Capital
intensity
• World-scale plant(a) requires:
‒ €0.8-1.1bn investment for full train
‒ Approx. 5 years to full operation after completed
environmental impact assessment
• 3 world-scale production facilities and total
capacity of 750kt
• Benefits from economies of scale
Process
technology
• Advanced technology along the process chain
important particularly in high cost locations
• Limited options for licensing
• State-of-the-art gas-phase phosgenation (GPP)
technology leading to global cost leadership
‒ highly cost efficient and high environmental standard
Feedstock
integration
• Supply contracts as standard option
• Backward integration advantageous
• Long-term supply contracts for important precursors
• Favorable backward integration
Technical
capabilities
and expertise
• Permits required to handle hazardous feedstock,
e.g. phosgene
• Track record and suitable infrastructure important
• World-class expertise and know-how in customer-
oriented application development
• Proven reputation with 60+ years’ experience
• Impeccable safety record
Proximity
to markets
• Benefits for established global players
• Required to service large global companies
with diverse operations
• Global footprint and customer insight
• Facilities in all core regions
Global capacity by producer
Top 5 73%
Others 27%
74%
26%
76%
24%
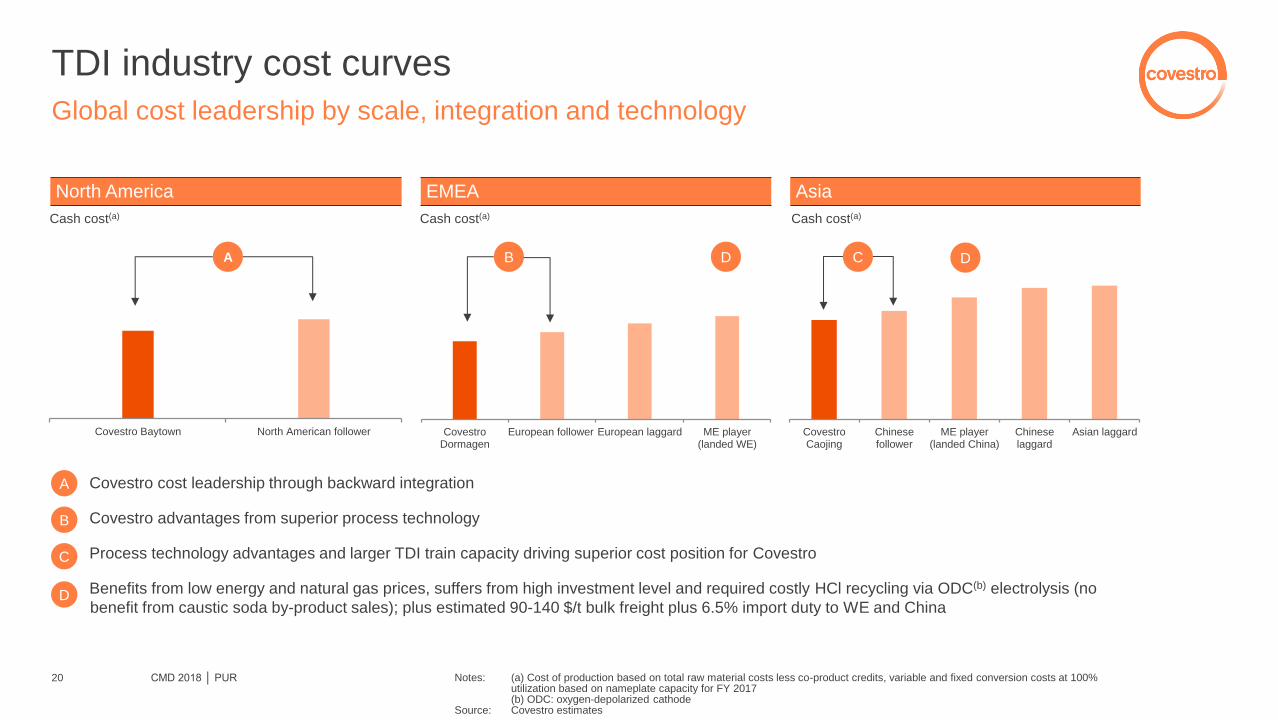
TDI industry cost curves
CMD 2018 │ PUR 20
Global cost leadership by scale, integration and technology
Notes: (a) Cost of production based on total raw material costs less co-product credits, variable and fixed conversion costs at 100% utilization based on nameplate capacity for FY 2017 (b) ODC: oxygen-depolarized cathode Source: Covestro estimates
Covestro Baytown North American follower
A
CovestroCaojing
Chinesefollower
ME player(landed China)
Chineselaggard
Asian laggardCovestroDormagen
European follower European laggard ME player(landed WE)
A
B
C
North America EMEA Asia
Cash cost(a) Cash cost(a) Cash cost(a)
Covestro cost leadership through backward integration
Covestro advantages from superior process technology
Process technology advantages and larger TDI train capacity driving superior cost position for Covestro
Benefits from low energy and natural gas prices, suffers from high investment level and required costly HCl recycling via ODC(b) electrolysis (no
benefit from caustic soda by-product sales); plus estimated 90-140 $/t bulk freight plus 6.5% import duty to WE and China D
D D C B

TDI global operations
CMD 2018 │ PUR 21
Leading production network by technology and global footprint
Notes: All nameplate capacities based on year end 2017
Covestro innovation centers
Covestro TDI facility
Pittsburgh, PA, USA
Leverkusen, Germany
Amagasaki, Japan
Shanghai, China
Dormagen, Germany
• Nameplate capacity: 250kt
• Start up beginning 2015
• Technology used: Features
proprietary Covestro gas-
phase phosgenation
• Cost leader resilient to new
capacity additions in EMEA
• Debottlenecking of +20kt to
270kt in 2018e
Baytown, TX, USA
• Nameplate capacity: 225kt
• Start of production: 2000
• Technology used: Liquid-
phase phosgenation
• Serves both US and non-US
markets
Caojing, China
• Nameplate capacity: 275kt
• Start of production: 2011
• Technology used: Features
proprietary Covestro gas-
phase phosgenation
• Cost leader in APAC and
well-positioned to capture
strong demand in Asia
• Debottlenecking of +25kt to
275kt in 2017 completed

covestro.com
Polyurethanes
(PUR) MDI
TDI
Polyether polyols
CMD 2018 │ PUR 22
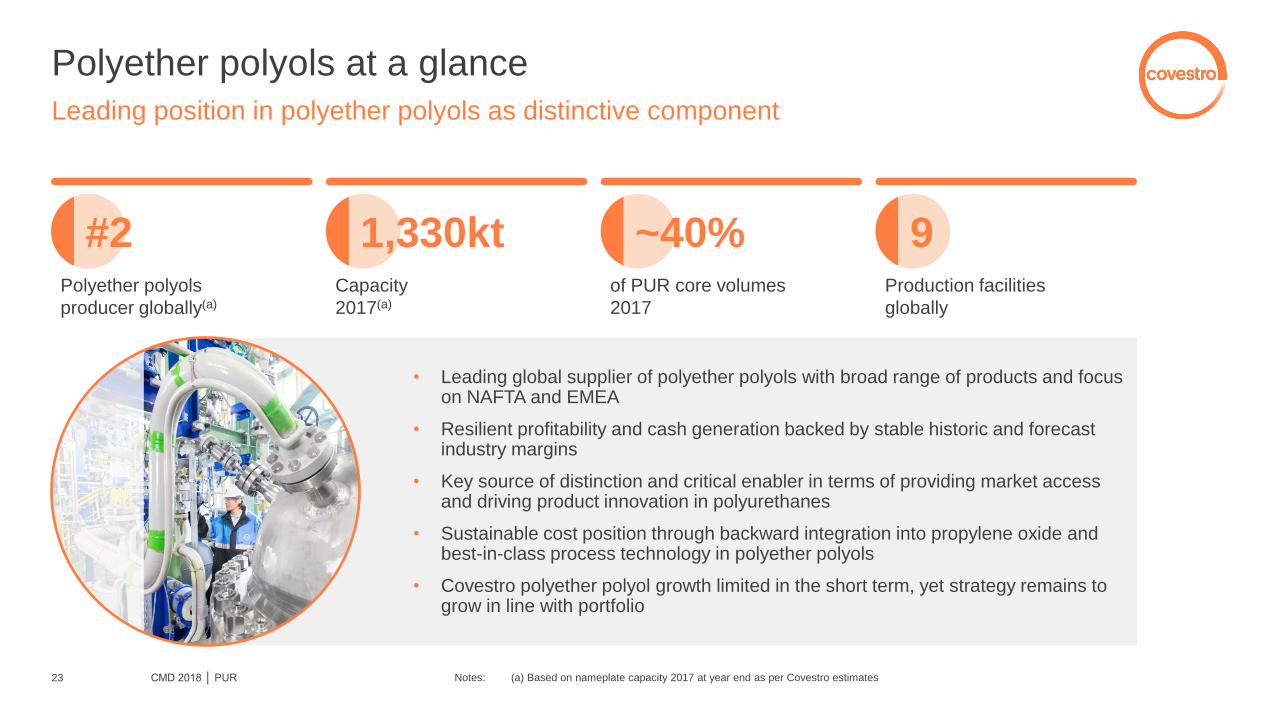
Polyether polyols at a glance
CMD 2018 │ PUR 23
Leading position in polyether polyols as distinctive component
Notes: (a) Based on nameplate capacity 2017 at year end as per Covestro estimates
• Leading global supplier of polyether polyols with broad range of products and focus on NAFTA and EMEA
• Resilient profitability and cash generation backed by stable historic and forecast industry margins
• Key source of distinction and critical enabler in terms of providing market access and driving product innovation in polyurethanes
• Sustainable cost position through backward integration into propylene oxide and best-in-class process technology in polyether polyols
• Covestro polyether polyol growth limited in the short term, yet strategy remains to grow in line with portfolio
#2 Polyether polyols
producer globally(a)
1,330kt Capacity
2017(a)
~40% of PUR core volumes
2017
9 Production facilities
globally

Role of polyether polyols in Covestro portfolio
CMD 2018 │ PUR 24
Key enabler for innovation in core applications
Notes: (a) Based on nameplate capacity at year end 2017
Polyether polyols reaction with isocyanates leads a broad range of applications
Propylene Propylene
oxide
by-product
styrene
Polyether
polyols(a)
1,330kt
~840kt
~350kt
Covestro production chain
Purchased raw material Contracts & JV activities Covestro activities
Building insulation • space and energy
efficient • flexible processing
Rigid foam
Flexible foam
Average mix = Molecular ratio: 1 MDI to ~0.7 polyether polyols
Average mix = Molecular ratio: 1 TDI to ~2 polyether polyols
Automotive parts • strong, durable and light • noise and heat insulation
Automotive parts • padding for auto
seating
Cold chain • affordable temperature
preservation
Furniture • durable and
supportive cushions
Bedding • design and comfort
driven mattress material

Polyether polyols competitive landscape
CMD 2018 │ PUR 25
Competitive industry position based on PO backward integration
Source: Covestro estimates
2017
2007
2022e
Industry Covestro position
Capital
intensity
• World-scale 300kt p.a. propylene oxide / polyether
polyols plant requires approx. €1bn investment
• PO production in USA and Europe and 9 polyether
polyol production sites in NAFTA, Europe and Asia
• Cost benefits and secured access from JV with leading
PO producer LyondellBasell
Process
technology
• PO technology relatively complex with limited options
for licensing
• Polyether polyol technology available through own
innovation or licensing
• JV based on cost competitive PO/TBA and PO/SM
technologies of LyondellBasell
• Leading proprietary polyols technology position,
licensor of IMPACT technology to major competitors
Feedstock
integration
• Propylene backward integration for propylene oxide
production advantageous
• PO backward integration for polyether polyols
production advantageous
• Long-term supply contract for important precursors, e.g.
ethylene oxide
• Backward integration on propylene oxide through
LyondellBasell JV
Technical
capabilities
and expertise
• Few players with broad product portfolio based on deep
polyols chemistry know-how
• Handling of propylene oxide and ethylene oxide require
high safety standards
• Leading position in long- and short-chain polyether
polyols as well as polymer polyols covering broad range
of applications
• World-class expertise in application development
providing innovative industry solutions
Proximity
to markets
• Application know-how and competitive product offering
to support customer
• Global customers, e.g. in appliance, prefer global
suppliers
• Low cost supply chain set-up requires regional
production
• Global footprint of production assets and resources
• Deep customer and market insights
Global capacity by producer
Top 5 62%
Others 38%
46% 54%
42% 58%

• Polyether polyols landscape comprising 4 major players; Covestro is #2 producer globally with strong positions in NAFTA and EMEA
• APAC is highly fragmented based on a large merchant propylene oxide market with > 25 producers
• Higher margins and distinct entry requirements for the business model of propylene oxide backward-integrated polyols vs. stand-alone
• Distinct entry requirements: capital intensity, propylene oxide access, advanced polyols process technology, R&D and technical infrastructure
Polyether polyols competitive landscape
CMD 2018 │ PUR 26
Global #2 producer with strong positions in NAFTA and EMEA
Notes: (a) Based on nameplate capacity as of year end 2017 (b) including JVs Source: Covestro estimates
Polyether polyols industry capacity share by region in 2017(a) Top polyether polyols producers globally in 2017(a)
28% 24% 1%
72% 76%
>95% 2.3
2.8
7.0
Americas EMEA APAC
Covestro
position #2 >#10 #2
Covestro Covestro Covestro
~15
other
players
~10
other
players
~60
other
players
('000kt) ('000kt)
(b) (b)
2.0
1.3 0.9 0.8
0.6
6.5
Dow Covestro Shell BASF Huntsman Others

Polyether polyols operations
CMD 2018 │ PUR 27
Global production network with proximity to propylene oxide supply
Shanghai, China
Leverkusen, Germany Amagasaki, Japan
Dormagen, Germany
Covestro innovation centers
Covestro polyether polyols facility
Niihama, Japan Antwerp, Belgium
Channelview, USA
Fos-sur-Mer, France
Lin Yuang, Taiwan
Santa Clara, Mexico South Charleston, USA
Pittsburgh, PA, USA
New Martinsville, USA

Joint venture with LyondellBasell
CMD 2018 │ PUR 28
Competitive cost position through propylene oxide backward integration
• Secure access of propylene oxide in Europe and US
• Producer cost economics vs. market price in a limited merchant market for propylene oxide
• Opportunity to explore debottlenecking options with LyondellBasell
• US propylene oxide JV not exposed to propylene oxide co-product volatility (TBA / MTBE or styrene monomer)
• Covestro responsible for certain styrene monomer sales from EMEA joint venture
US propylene oxide joint venture
• Started in 2000
• Long-term off-take of propylene oxide from JV plants
EMEA propylene oxide joint venture
• 50 / 50 manufacturing JV for world-scale facility in Rotterdam
• Propylene oxide output used captively by Covestro as feedstock; sells styrene monomer in merchant market
LyondellBasell agreements
Key benefits to Covestro

PCS
Michelle JouHead of Business Unit Polycarbonates
Michelle Jou is Head of the Polycarbonates (PCS) Business Unit from Covestro sinceJanuary 2016. Jou has more than 20 years of experience in Sales, Marketing and Supply Chain functions in the chemical industry in Asia.
She started her career within Bayer Material Science (BMS) in 2003 in Shanghai andassumed various management positions within the Regional Supply Chain Center, China Corporate Management and the Business Unit Polycarbonates. She was notably the Managing Director of Bayer MaterialScience Trading (Shanghai) Co., Ltd. where she was responsible for the local distribution of Bayer MaterialScience products. She also served as PCS Country Representative for China where she was in charge of overseeing the whole polycarbonates business in China. Afterwards, she was promoted to head of Strategic Marketing for Consumer & Industrial Solutions APAC. In 2012, she joined the PCS leadership team as senior vice president.
Prior to joining Bayer, Jou worked for a leading French petrochemical company for about 10 yearsin Hong Kong and Shanghai. She holds a Bachelor degree from Fu-Jen University in Taiwan and a Master’s degree in Management from EMLYON Business School in France and the INSEAD.
She is married with two children.

PCS key investment highlights
CMD 2018 │ PCS
Growth business with increasing product differentiation
Opportunity to outgrow the industry taking shares for four consecutive years, outgrowing in high value-added applications
Leading global player with broadest range of applications
Increasing share of high-value, differentiated business with more than 1,000 different PC grades with prices ranging from ~€2.0 to ~€15 per kg
Well-invested, young and highly efficient global production network allows cost-efficient and safe production as well as expansion through debottlenecking
Pushing boundaries through innovation creates access to new applications and new product offerings
1

PCS at a glance
CMD 2018 │ PCS
Global leading producer of polycarbonates
Notes: (a) Based on nameplate capacity at year end 2017 as per Covestro estimates
#1 PC producer globally(a)
€3.7bn Sales
2017
22.8% EBITDA margin
2017
26% of total Covestro
sales 2017
• Global leader and inventor of polycarbonates
• Offers products and solutions for a wide range of applications
• Integrated production processes along the value chain,
including wet sites (resins) and dry sites (compounded resins)
• Global platform with 5 production sites, 5 innovation centers,
7 compounding centers and business unit headquarters in
Shanghai, China
• Total production capacity of 1,480kt(a)
Electronics Robot housing
Mobility Exterior
Consumer electronics Adapter
Mobility Charging station
Healthcare Drug delivery
Electrical LED street lamp
2

1. Polycarbonates industry demand and growth drivers
CMD 2018 │ PCS
Macro trends support above GDP demand growth
Notes: (a) Appliance, medical, packaging Source: IHS; Covestro estimates
0.6 0.3 0.2
0.9 1.4 1.7
0.5 0.6
0.7 0.5 0.7
1.0 0.5
0.7
1.0
0.6
0.6
0.7
2012 2017 2022e
Continuous upgrades, substitution and new application development; selected examples:
• Trend towards design and aesthetics in devices
• New revolutionary technologies, e.g. wearables, audio devices, AR and VR, sensors, robotics, drones
• Electric vehicles and autonomous driving
• Increasing healthcare access in emerging markets
• Ageing population with longer life expectancy requiring healthcare solutions
APAC ~5%
EMEA ~3%
NAFTA ~3%
Accelerated growth 2017-2022e
CAGR in %
Polycarbonates demand by application CAGR 2017 – 2022e
Electronics
Electrical
Automotive
Construction
Consumer(a)
Optical
Media
4%
6%
6%
4%
5%
-7%
Demand ('000kt)
CAGR in %
4.3
3.7
5.3
3.3%
GDP 2.8%
~4%
GDP ~3%
3
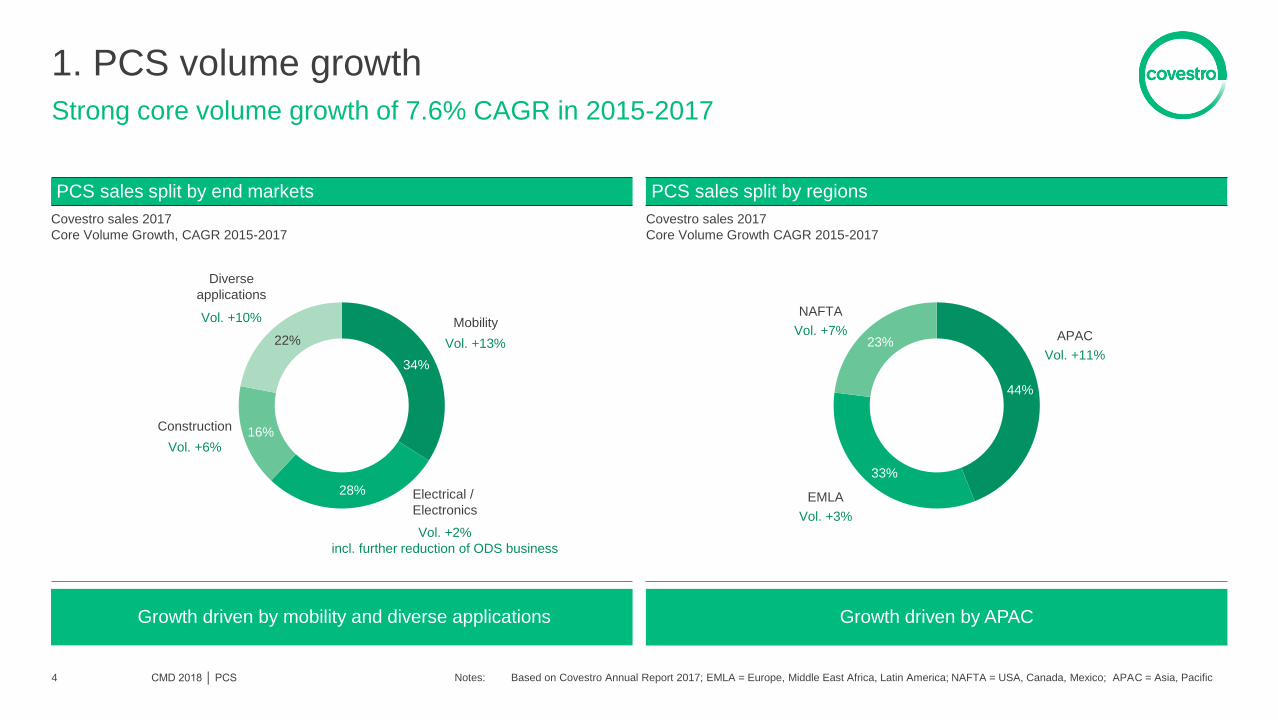
1. PCS volume growth
CMD 2018 │ PCS
Strong core volume growth of 7.6% CAGR in 2015-2017
Notes: Based on Covestro Annual Report 2017; EMLA = Europe, Middle East Africa, Latin America; NAFTA = USA, Canada, Mexico; APAC = Asia, Pacific
Growth driven by mobility and diverse applications Growth driven by APAC
PCS sales split by regions
34%
28%
16%
22% Vol. +13%
Vol. +2%
incl. further reduction of ODS business
Vol. +6%
Vol. +10%
44%
33%
23% Vol. +11%
Vol. +3%
Vol. +7%
Covestro sales 2017
Core Volume Growth, CAGR 2015-2017
Covestro sales 2017
Core Volume Growth CAGR 2015-2017
PCS sales split by end markets
Mobility
Electrical /
Electronics
Construction
Diverse
applications
APAC
EMLA
NAFTA
4
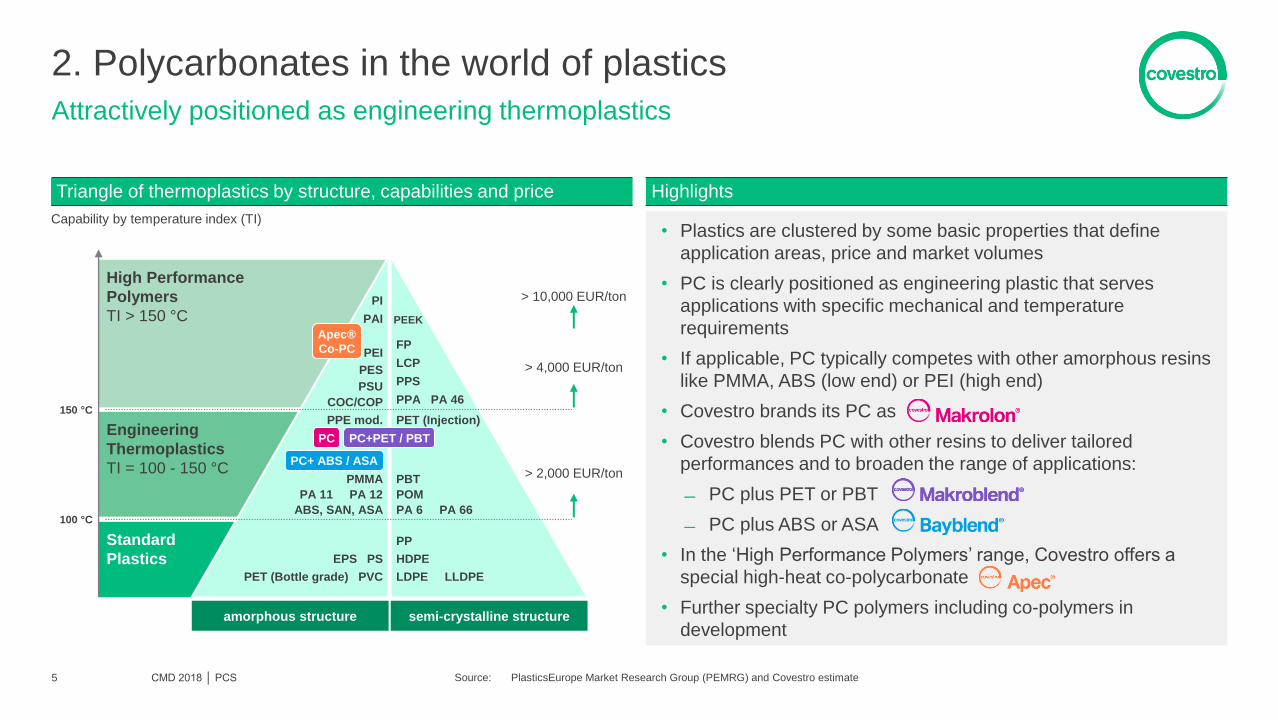
semi-crystalline structure
2. Polycarbonates in the world of plastics
CMD 2018 │ PCS
Attractively positioned as engineering thermoplastics
Highlights
• Plastics are clustered by some basic properties that define
application areas, price and market volumes
• PC is clearly positioned as engineering plastic that serves
applications with specific mechanical and temperature
requirements
• If applicable, PC typically competes with other amorphous resins
like PMMA, ABS (low end) or PEI (high end)
• Covestro brands its PC as
• Covestro blends PC with other resins to deliver tailored
performances and to broaden the range of applications:
PC plus PET or PBT
PC plus ABS or ASA
• In the ‘High Performance Polymers’ range, Covestro offers a
special high-heat co-polycarbonate
• Further specialty PC polymers including co-polymers in
development amorphous structure
Standard
Plastics
Engineering
Thermoplastics
TI = 100 - 150 °C
High Performance
Polymers
TI > 150 °C
100 °C
150 °C
> 2,000 EUR/ton
> 4,000 EUR/ton
> 10,000 EUR/ton
Apec®
Co-PC
PC PC+PET / PBT
PC+ ABS / ASA
PI
PAI
PEI
PES
PSU
PPE mod.
PMMA
PA 11 PA 12
ABS, SAN, ASA
EPS PS
PET (Bottle grade) PVC
PEEK
FP
LCP
PET (Injection)
PBT
POM
PA 6 PA 66
PP
HDPE
LDPE LLDPE
PPS
PPA PA 46
Capability by temperature index (TI)
Triangle of thermoplastics by structure, capabilities and price
Source: PlasticsEurope Market Research Group (PEMRG) and Covestro estimate 5
COC/COP

• Medical devices
• Robotics
• Personal safety, e.g. helmets, headgear, eyewear
• Packaging, e.g. water bottles, pitchers
2. Polycarbonates as engineering thermoplastics
CMD 2018 │ PCS
Serving numerous industries with a unique combination of properties
Notes: CFRTP: Continuous Fiber Reinforced Thermoplastics Composites
• Windows
• Conservatories
• Roof structures
• Partition walls
• Automotive interior and exterior panels
• Bodywork parts
• Lighting systems
• Glazing
• Outer door panels
• Radiator grills
• IT equipment
• Housing for mobile devices and consumer electronics
• Chargers
• Switchbox and other electrical systems
• Diffusion panel of LCD monitors
• LED parts
• Impact resistant
• Heat resistant
• Transparent
Resins
Compounded Resins
Composites (CFRTP)
• High dimensional stability
• High flame retardancy
• Good aesthetics
• High stiffness
• Light weight
• High-tech look and feel
Polycarbonates (PC) Key properties Key applications
6

2. PCS compounding
CMD 2018 │ PCS
Increasing demand for value-enhanced PC grades
Blend
partner
Fillers and
reinforcement
Functional
additives
Compounding
Processor
Application
ABS or ASA e.g. to improve
toughness at low temperature
Colorants &
special effects
e.g. glass fiber to provide high
stiffness
e.g. UV / light stabilizers to
improve long-term stability
e.g. flame retardants
e.g. colors to provide optical
effects
PC resins
PBT or PET e.g. to improve
chemical resistance and flow
Internally sourced Externally sourced
Concept of compounding
Covestro PCS sales split by product group
Share of compounded resins
Compounding of PC resins creates formulations with tailored
property profiles and significant added value for customers
FY 2010
FY 2017
Compounded
resins
35%
Resins
65%
Compounded
resins
46%
Resins
54%
Notes: Majority of compounded resins are part of the resilient portion of PCS sales
7

2. PCS margin resilience
CMD 2018 │ PCS
Benefits from global market access, innovation capabilities and high-quality product portfolio
Notes: (a) Bubble size represents PC volumes in one specific application in 2017
(b) Contribution margin per kg (c) Volatility measured as standard deviation of contribution margin
Goal: grow resilient portion of PCS volumes to ~65% long-term Resilient portion of PCS volumes at ~55% in 2017(a)
Resilient volumes increased from ~40% in FY 2011 to
~55% in FY 2017
• Focus on high-value and high-growth industry applications
• Greater technical requirements and longer lifecycles
• Comprehensive innovation capabilities and technical
services are key
• Mobility, electrical and electronics as main drivers
Focus to further grow in resilient end markets
• Healthcare as additional future key driver
• High differentiation potential
• Opportunistically serve low-requirement applications, exit
sheet operations
• Broaden portfolio toward higher margins and earnings resilience
• Distinct entry requirements in resilient portion of PCS portfolio for
potential new industry players
8
Growth applications Serve opportunistically
Shift to resilience Resilient business, defined as combination
of high margin and low volatility
Low Volatility(c) High Volatility
Hig
h m
arg
in(b
) L
ow
ma
rgin
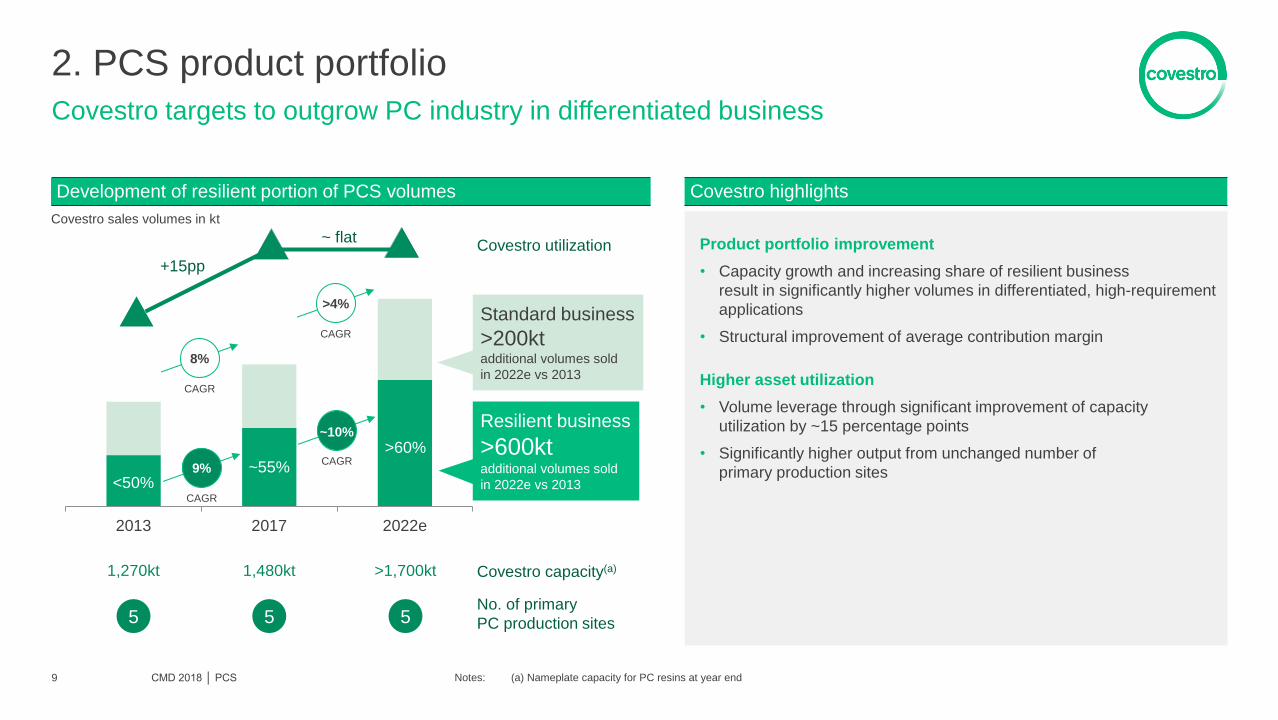
2. PCS product portfolio
CMD 2018 │ PCS
Covestro targets to outgrow PC industry in differentiated business
Notes: (a) Nameplate capacity for PC resins at year end
Covestro highlights Development of resilient portion of PCS volumes
Product portfolio improvement
• Capacity growth and increasing share of resilient business
result in significantly higher volumes in differentiated, high-requirement
applications
• Structural improvement of average contribution margin
Higher asset utilization
• Volume leverage through significant improvement of capacity
utilization by ~15 percentage points
• Significantly higher output from unchanged number of
primary production sites
Covestro sales volumes in kt
2013 2017 2022e
<50% ~55%
>60%
8%
CAGR
>4%
CAGR
Resilient business
>600kt additional volumes sold
in 2022e vs 2013
Standard business
>200kt additional volumes sold
in 2022e vs 2013
1,270kt 1,480kt >1,700kt
5 5 5 No. of primary
PC production sites
Covestro capacity(a)
9
Covestro utilization
+15pp
~ flat
9%
CAGR
~10%
CAGR

3. PCS competitive environment
CMD 2018 │ PCS
Global leader with growing share of business generated with global customers
Notes: (a) Bubbles represent 2017 global nameplate capacity, only largest competitors and competitor groups included Source: Covestro estimate
Covestro advantage of broad play Positions in the industry 2017(a)
• Covestro and SABIC are the only true global players –
important to serve global customers in e.g.
electrical/electronics and automotive
• Reduced exposure to cyclicality of single customer industries
• Higher flexibility in portfolio management
• Optimized risk distribution
• Optimized asset utilization
Key changes by 2022e
• No significant change among top 5 industry leaders expected
• New potential industry players expected mainly in China,
likely to increase competition in local markets with narrow
application spectrum
• Number of Chinese industry entrants may increase from
two in 2017 to announced ~10 by 2022e
• Potentially one Chinese industry entrant with long-term
ambition to enter high-requirement applications
Broad
range
Narrow
range
Local
footprint
Global
footprint
Bre
adth
of
applic
ations s
pectr
um
Geographic reach /
footprint
Multiple Chinese industry entrants
Trinseo
Teijin
SA
BIC
Mitsubishi
Lotte
Major
compounders
Co
vestr
o
10

3. PCS competitive positioning
CMD 2018 │ PCS
1000+ grades position Covestro with broadest product offering
Notes: (a) Covestro estimate (b) Compounder in PRC (c) 2015 industry entrant in PRC
Highlights Breadth of PC product offering by Covestro and key competitors across end markets(a)
• Covestro has broadest
product portfolio and
continues to expand,
especially in the resilient part
• PC is an innovation-driven
industry and Covestro has
largest innovation budget
in industry(a)
• Differentiation increases
earnings resilience and
independence of single
customer industry cycles
• Differentiation lowers
exposure to new potential
industry players with often
limited product offerings of
few low-end grades
Covestro
(D)
SABIC
(KSA)
MEP
(JP)
Teijin
(JP)
Lotte
(KR)
Trinseo
(US)
Kingfa(b)
(PRC)
Zhetie(c)
(PRC)
Mobility
Healthcare
Electrical
Electronics
Appliances
Consumer products
Construction
Optical data storage
Water bottles
Medium offering Limited to No offering Broad offerings
11

4. PCS value chain
CMD 2018 │ PCS
Selective backward and forward integration captures best value
Notes: Indicative product flow (a) LPC: Interface process (b) SPC: Melt process
Phenol / Acetone
• Easy to transport
• Dedicated production lines for phenol, by-product acetone
• Long and highly liquid merchant market
Chlorine / Carbon monoxide
• Preferably on site due to safety, transport logistics and economies of scale
• Used by multiple on-site consumers, ability to leverage economies of scale
• No merchant market
Covestro activities
Raw materials
(a)
(b)
Composites
Phenol
Chlorine
Carbon
monoxide
Compounding
BPA
Acetone
Phosgene
DPC
LPC
SPC
Polycarbonates
Injection
molding
(a)
(b)
• Optimized value creation in line with
requirements of application
• Polymer resin business
Standard mass applications
Long application lifecycles
High optical purity
Uncolored
• Compounded resin business
Tailored property profiles
Value-added applications
Dynamic application lifecycles
Special colors and optical effects
Extrusion
e.g. sheets / film
Application Processor Compounding Polymer
resin
12

4. PCS regional industry cost curves
CMD 2018 │ PCS
Leading cost positions in key regions
Notes: (a) FY2017 cash cost ex gate, 82% utilization rate for all plants based on nameplate capacity. Integrated players are shown without margin contributions from sales of BPA, phenol, acetone, etc. Source: Covestro estimate
Cash cost(a) Cash cost(a) Cash cost(a)
North America Europe Asia
Covestro is cost leader in North America mainly based on backward integration and technology
Covestro is cost leader in Europe-based production, mainly due to backward integration and technology
Covestro is cost leader in Asia mainly based on scale, backward integration and technology
Covestro is cost leader in China mainly based on scale, backward integration and technology
Benefits from feedstock integration as well as highly advantageous utility costs, suffers from bulk freight plus 6.5% import duty to WE and China
A
B
C
D
Covestro Baytown North American follower North American laggard
A
13
ME player(landed WE)
CovestroUerdingen
European follower European laggard
B E
E
Covestro MapTa Phut
Asian follower CovestroCaojing
ME player(landed China)
Asian laggard
C D E

4. PCS in China
CMD 2018 │ PCS
Caojing production complex to become scale and cost leader in industry
Notes: (a) Cash cost after 2022e: Covestro Caojing capacity expansion to 600kt p.a. completed, 82% utilization rate for all plants based on nameplate capacity. Integrated players are shown without margin contributions from sales of BPA, phenol, acetone, etc. Source: Covestro estimate
Nameplate capacity
Covestro future cost advantage versus Chinese competitors
Currently 400kt with planned expansions to 600kt, coming on stream in several stages from 2018 to 2022 through debottlenecking existing production lines
Economies of scale: Currently the only PC plant in China operating single
lines with 100kt or more, Becoming world’s largest PC site after debottlenecking
Benefit from raw material integration: Fully integrated into BPA and partially into chlorine
Process technology advantage Benefit from lower cost melt technology, compared to
interfacial technology Solvent-free product for key industries
Differentiating factors
Cash cost(a)
Nameplate capacities
after 2022e(a)
Cost index = 100
China
laggard
China
new
entrants 1
Covestro Caojing
after expansion
China
new
entrants 2
China
new
entrants 3
China
existing
follower
14

4. PCS global operations
CMD 2018 │ PCS
Reach and customer access is key competitive advantage
Shanghai,
CHN Guangzhou, CHN
Map Ta Phut, THA
Amagasaki, JP
Seoul,KOR
Greater Noida, IND
5 PC resin production sites
PC sheet operations(a)
7 compounding plants
5 Innovation centers
Business development centers
Process research centers
CFTRP manufacturing
Antwerp, BEL
Leverkusen, GER Tielt, BEL
Filago, ITA
Nera Montoro, ITA
Uerdingen, GER
Markt Bibart, GER
• Production of polycarbonate resin for either external sales or internal feedstock for compounding and sheet plants(a)
• Nameplate capacity as of year end 2017: Covestro 1,480kt, including Baytown (USA) 230kt, Antwerp (BE) 240kt, Uerdingen (D) 300kt, Map Ta Phut (THA) 310kt and Caojing (PRC) 400kt
Primary production plants
• Refinement of polycarbonate resin through blending with other polymers or addition of colorants, fillers or other functional additives
• Color matching, technical service and small-scale production capabilities
Compounding plants
• Production and sales of Continuous Fiber Reinforced Thermoplastics (CFRTP) as tapes and sheets for further processing by customers
Composites EMEA & LATAM
Office
Global PCS
Headquarters
APAC Office
Baytown, TX
Pittsburgh, PA
Sheffield, MA
Newark, OH
NAFTA Office
Notes: (a) Covestro to sell its PC sheets outlet in the USA, closing expected to be completed in the third quarter of 2018 15

5. PCS R&D highlights 2017
CMD 2018 │ PCS
Market-driven innovation as key value driver
R&D project examples
Seamless glass-like appearance
exterior parts – sensor transparent Thermoconductive heat sink
Flame retardant materials for
electric vehicle battery packing
€74m
R&D spend
22%
of PCS sales with new
products not older than 5 years
50
new grades, thereof around
90% compounding grades
39
patent
applications
16
High-end materials
for connected devices
for medical drug delivery

Scale up and customer production
New application technologies
Material and concept development
Definition of customer requirements
5. PCS innovation example
CMD 2018 │ PCS
Material, application and production know-how drive market access and development
Example of customer product development lifecycle
• Optimized and highly integrated manufacturing process
• Specialized material solutions providing function integration and safety
• Global competitive offerings
• Comprehensive and competent product support
• Distinctive and innovative automotive interior design
First choice development partner for leading OEM, component suppliers and design houses
Cutting-edge material and process innovation
Global manufacturing, supply and support network
High-end interior solutions with best-in-class product and technology portfolio
Creative concepts based on profound understanding of materials and applications
Support along the whole value chain
Best-in-class expertise in thermoplastics and processing technologies
Reduction of cost and complexity
Innovative polycarbonate grades, e.g. for infotainment display solutions
New designs for lifestyle colors, surface finish and soft touch and feel
Ductile materials for crash safety
Customer needs
Covestro solution
17

5. Continuous Fiber Reinforced Thermoplastics Composites
CMD 2018 │ PCS
Innovative composite material provides potential for future growth
Example of customer product development lifecycle Example of customer product development lifecycle
The world needs light-weight materials for next-
generation applications offering powerful
sustainability opportunities
Covestro combines continuous fibers (e.g.
carbon) with thermoplastic resins (e.g.
polycarbonate, TPU) to offer tapes and sheets
Strong, light and aesthetically attractive product
with fast cycle times compared to thermoset
composites
A diverse pipeline portfolio of commercial projects
with some of the largest consumer brands in the
world
Commercial scale production inaugurated in
March 2018.
Further scale-up planned based on market
success
Strong resonance with industry’s needs: Haier,
the world’s largest appliance manufacturer, uses
our CFRTP materials for its Casarte premium air
conditioner housing
Automotive
Electronics
Fashion & Sportswear
Health
18
CAS
Michael FriedeHead of Business Unit Coatings, Adhesives, Specialties
Michael Friede is Head of the Coatings, Adhesives, Specialties (CAS) Business Unit of Covestro since September 2017.
Friede was born in 1980 in Gronau (Leine), Germany. He holds an MBA from Instituto de Empresa, Madrid, Spain, completed his undergraduate studies in business as Diplom-Kaufmann (FH) at the Fachhochschule für Oekonomie & Management in Essen, Germany and studied at the Rotman School of Management at the University of Toronto, Canada. He holds the degree of Industriekaufmann from the Industrie- und Handelskam-mer Cologne (IHK).
He entered the Bayer Group as a trainee in 2001. Upon completion of the trainee program he worked in the Bayer AG Holding in Corporate Auditing. In 2008, he moved to Covestro (then Bayer MaterialSciene) as a Board Assistant. He then moved into the Procurement team of Covestro from 2009 until 2012, initially working as Head of Global Procurement Intelligence out of Leverkusen, moving to the USA to lead Procurement & Trading for the Americas region and global Procurement for energy, technical gases and basic chemicals including the global sales of chlorine, caustic soda and hydrochloric acid. In 2012, he moved back to Germany to lead the Global Key Accounts team in sales for the Business Unit CAS. In 2014, he took over the responsibility of Covestro’s global Elastomers business moving to France to become CEO & President of Covestro Elastomers SAS.
Since 2017, Friede moved back to Germany and is leading the Business Unit CAS of Covestro.
Friede is married and has two children.

CAS key investment highlights
CMD 2018 │ CAS 1
Global industry leader with high and resilient profitability
Above GDP growth based on solid demand from diverse customer industries
Global leading and defendable position in industries with distinct entry requirements
High-end solutions for added-value materials support high margin resilience
High level of backward integration and leading, proprietary technologies provide sustainable competitive cost advantage
External growth opportunities focused on value-creating, differentiated business areas

CAS at a glance
CMD 2018 │ CAS 2
Enabling high performance
Notes: (a) Based on total aliphatic isocyanates volume in 2017 relative to competitors as per Covestro estimates and based on total polyurethane dispersions (PUD) volume in 2017 relative to competitors as per Covestro estimates (b) All figures adjusted to reflect the transfer of the specialty elastomers business from the Polyurethanes segment to Coatings, Adhesives, Specialties segment as of January 1, 2018
#1 Producer of aliphatic
isocyanates and PUD(a)
€2.3bn Sales
2017(b)
20.9% EBITDA margin
2017(b)
16% of total Covestro sales
2017(b)
• Global leading supplier of high-performance materials to the coatings and
adhesives industry and other high-growth specialties
• Inventor of and technology leader in isocyanate derivatives for coatings, adhesives,
sealants and specialties
• 2,700+ products based primarily on six monomers, serving 10+ high-end industries
and 5,000+ customers
• Product pricing driven by added value to end-customers as CAS materials are
critical to the final product performance but form a small part of the overall cost
• Market-driven innovation in close collaboration with all partners in the value chain,
developing customized solutions for specific problems
• Efficient production processes benefitting from low-cost technology and high level
of backward integration
• High margin resilience and strong cash flows
Ingredients for surface coatings
Ingredients for adhesives and sealants
Ingredients for specialties

23%
15%
9% 8%
7%
4%
3%
31%
45%
20%
10%
10%
10%
5%
47%
22%
31%
CAS above GDP volume growth
CMD 2018 │ CAS 3
Adjusted core volume growth of 3.7% CAGR in 2015-2017(a)
Notes: (a) All figures adjusted to reflect the transfer of the specialty elastomers business from the Polyurethanes segment to Coatings, Adhesives, Specialties segment as of January 1, 2018 as well as planned termination of trading activities and reduced contract manufacturing
Covestro sales share FY 2017(a)
Core volume growth, CAGR 2015-2017
CAS sales split by industry groups CAS sales split by businesses CAS sales split by regions
Growth driven by APAC and EMLA Growth driven by almost all industry groups Growth driven by almost all businesses
Covestro sales share FY 2017(a), rounded
Core volume growth, CAGR 2015-2017
Covestro sales share FY 2017(a)
Core volume growth, CAGR 2015-2017
Vol. +5%
Vol. -3%
Vol. +3%
Vol. +6% Vol. +8% Vol. +8%
Vol. -1%
Vol. +8%
Vol. +13%
Vol. +8%
Vol. -1%
Vol. +3%
Vol. +8%
Vol. +6%
Vol. +7%
Vol. +2%
Diverse
industries
Automotive &
transportation
Construction &
engineering
Industrial
applications &
electronics Wood &
furniture
Medical,
sports and
leisure
Textiles,
clothing,
footwear
Coatings
Adhesives,
Sealants
Thermoplastic
Polyurethanes
Elastomers
Specialty Films
Diverse High Growth
Specialties
APAC
NAFTA
EMLA
Vol. +14%
Packaging

CAS financial performance
CMD 2018 │ CAS 4
High margin resilience reflects specialty character
Notes: (a) Defined as net sales proceeds less variable product costs per kg (b) Including specialty elastomers business transferred from Polyurethanes segment to Coatings, Adhesives, Specialties segment as of January 1, 2018
2009 2010 2011 2013 2012 2014 2015 2016
Resilient margin level
Q4 Q2 Q1 Q1 Q3 Q4 Q3 Q1 Q3 Q4 Q2 Q4 Q2 Q2 Q1 Q1 Q4 Q3 Q1 Q2 Q1 Q3 Q3 Q3 Q3 Q2 Q3 Q2 Q4 Q4 Q2 Q1 Q4 Q2 Q4 Q3 Q4 Q1 Q2 Q1 Q1
Core volumes(b) (kt) Margin(a)(b) (€ per kg)
2008 2017 2018
• Added value to customers and diversified applications secure stable margins
• Gross margin driven by high-value product portfolio as well as low-cost technology

Biuret
1960
PU
Dispersions
1972
CAS product innovation 2017
CMD 2018 │ CAS 5
Continuously creating new application spaces and competitive differentiation
Desmodur N
Trimer
1988
Aspartates
1989
Allophanates
1992
Bayhydur
1993
Bayhydrol UV
1996
Asymmetric
Trimer
1997
Desmodur
Eco N
2015
Bahydur
Eco
2017
Impranil
Eco
2018
€95m
R&D spend
22%
of CAS sales with new
products not older than 5 years
~90%
of R&D spend going into
product innovation
73
patent
applications
R&D project examples
1960 2018

CAS backward integration
CMD 2018 │ CAS 6
Significant synergies from Covestro chemical backbone
Notes: Simplified illustration (a) via Deacon or HCl-ODC technology and/or chloralkali electrolysis (b) produced from CO and Cl2
Toluene
Nitric acid (HNO3)
Benzene
Phenol
Acetone
C
hlo
rin
e(a
) H
Cl
NaO
H
TDI
Phosgene(b)
MDI
Phosgene(b)
PU
R/C
AS
P
UR
P
CS
HMDA
IPDA
PACM
PCS
Phosgene(b)
CA
S
Alip
hatic
derivatives
Aro
matic
deri
vatives
TP
U
TP
U film
s
PC
film
s
Adipic acid
HDO/BDO Polyester polyols
PO
EO Polyether polyols
PU
D HDI
Phosgene(b)
IPDI
H12MDI
• Premises
• Site development
• Streets
• Pipeline bridges
• Storage tanks
• Jetties
• Power supply & distribution
• Waste management
• Safety
Infrastructure Raw materials Covestro value chain
Covestro activities
Purchased raw
materials
Ela
sto
mers

covestro.com
Coatings, Adhesives,
Specialties (CAS)
Coatings
Raw Materials
CMD 2018 │ CAS 7

CAS Coatings raw materials at a glance
CMD 2018 │ CAS 8
High-performance polyurethane chemistry for coatings
Notes: (a) Polyurethane coatings raw materials (b) CAGR 2017-2022e for polyurethane coatings raw materials excl. solvent-borne polyacrylates Source: Orr & Boss 2017 and Covestro estimates
8
#1 Producer of PU coatings
raw materials(a)
3-4% Market growth(b)
~45% of total CAS sales 2017
>800 Customers globally
• Coatings raw materials are used in a wide range of end market
applications
• Applications require high-performance products that enable distinct
characteristics like abrasion resistance, durability or gloss retention
• Focus on higher-value components in the coatings market by providing
added-value solutions
• Global network to reliably supply customers, combined with leading
formulation know-how and technical expertise in coatings applications
• Innovation in coatings raw materials as core competency, enabling
competitive differentiation and growth
• Product portfolio offers sustainable materials like water-borne and bio-
based polyurethanes as well as materials that improve the industrial
hygiene for applicators
Transport & vehicles
Automotive
Industrial coatings
Corrosion protection
Construction
Wood & furniture

Coatings raw materials competitive landscape
CMD 2018 │ CAS 9
Covestro well positioned for success in differentiated markets
Notes: (a) Producers of aliphatic isocyanates and polyurethane dispersions coatings raw material Source: Covestro estimates
Industry Covestro position
Production
economies of
scale
• Cost efficiencies achieved by
benefitting from global assets
• Large scale production in all regions
• Efficient production processes
benefitting from low-cost technology
and integration
Production
know-how and
expertise
• Experience in isocyanate and
PUD production required to
develop necessary know-how
• Long history of process technology
and reliability
• Global network of process technology
expertise
Portfolio
diversification
• Diverse array of end markets
and applications requiring a
wide product offering
• Inventor of and technology leader in
isocyanate derivatives for coatings
• Focus on high added-value products
Technical
know-how and
expertise
• Expertise required to address
specific customer needs with
formulation and processing
know-how built over years
• Unique global experience in
formulation and application
development
• Market-driven innovation in close
collaboration with all partners in the
value chain
Long-term
customer
relationships
• Long-term relationships with
customers and
responsiveness to customer
needs are critical
• Proximity and long established
customer relationships
• Developing customized solutions for
specific problems (forward marketing)
Competitive position of key raw material producers(a) in 2017
Ge
og
rap
hic
pre
se
nc
e
Product portfolio
Bubble size indicative
in several sales clusters Polyurethane dispersions Aliphatic isocyanates
Narrow Wide
Local
Global
Lubrizol
DIC
Stahl
DSM
Allnex
Alberdingk
& Boley
Tosoh
Vencorex
Wanhua
Wanhua
Asahi Kasai
BASF
BASF
Covestro
Covestro
Evonik

Coatings raw materials industry growth
CMD 2018 │ CAS 10
CAS coatings raw materials serve growing end-use markets
Notes: (a) Polyurethane coatings raw materials market excl. solvent-borne polyacrylates (b) 2K PU: Two-component polyurethane (c) VOC: volatile organic compounds (d) Diverse industries Source: Orr & Boss and Covestro estimates
2022e
1,420
70(d)
130
120
170
210
250
280
310
2017
1,190
60(d)
120
150
170
190
230
270
2012
930
Innovation example Global PU coatings raw materials industry(a)
+ Conversion of auto OEM painting lines from other chemistries to high quality 2K PU(b) technology; refinish with lower growth expectation due to assistant systems
+ Participation in accelerated composites market growth through glass fiber sizing (water-borne fiber pretreatment)
+ Emerging markets growth favors water-borne PU solutions; durability against graffiti removal agents and low-temperature curing
+ Fast-curing PU systems meet market need for fast return to service
+ New infrastructure requirements for mobility; Implementation of workplace VOC(c) regulations favor new PU systems
+ China governmental push: Faster shift from solvent- to water-borne and UV-cured coatings products
Growth drivers CAGR 2017-2022e
1%
3%
5%
5%
4%
2%
Demand (in kt)
CAGR in % Automotive
Industrial
coatings
Construction
Transportation
Corrosion
protection
Wood &
Furniture
5.0%
GDP 2.8%
3-4%
GDP ~3%
Desmodur® Ultra N
• Isocyanate with reduced content of
residual monomers through
continuous process improvements
in our production plants
• Improving intrinsic safety of flagship
product line started in 2018
• Significant improvement of
industrial hygiene for coating
applicators
• Identical high performance as
replaced product lines

Covestro in the coatings value chain
CMD 2018 │ CAS 11
Resins and film formers enable distinct performance of final product
CAS delivers tailored solutions and has contact with all partners in the value chain
Characteristics of PU-based coatings raw materials Share of Covestro products in average coatings formulation
• Unique properties in high-performance coatings:
Abrasion resistance
Outdoor weathering
Corrosion and chemical resistance
Durability
Gloss retention
• Superior combination of performance and price compared to other coatings
technologies, e.g. epoxy-based coatings
CAS raw materials Original equipment
manufacturer
Tier 1
manufacturers
Coatings
formulators
End user
and brands
Additives
Extender and pigments
Organic solvents or water
Resins and film formers
3-5%
15-25%
20-30%
60-70%
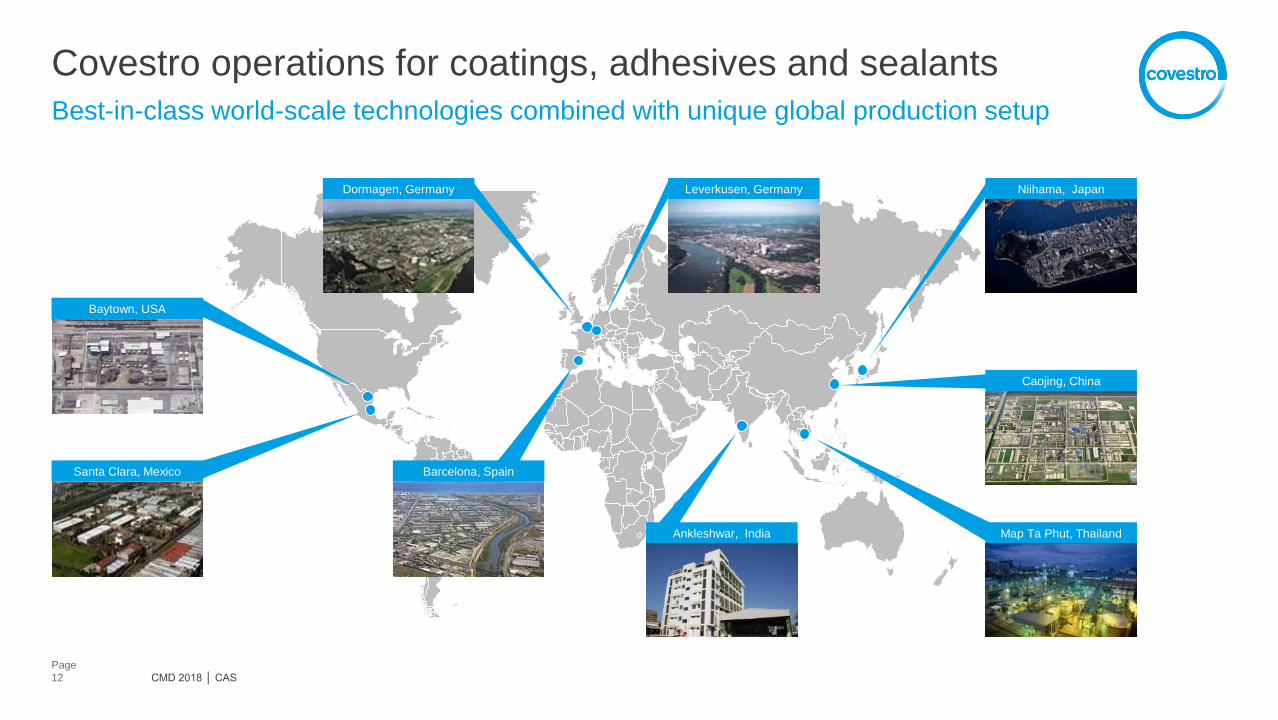
Covestro operations for coatings, adhesives and sealants
CMD 2018 │ CAS
Page
12
Best-in-class world-scale technologies combined with unique global production setup
Baytown, USA
Santa Clara, Mexico Barcelona, Spain
Dormagen, Germany Leverkusen, Germany
Ankleshwar, India Map Ta Phut, Thailand
Caojing, China
Niihama, Japan

covestro.com
Coatings, Adhesives,
Specialties (CAS)
Adhesives & Sealants
Raw Materials
CMD 2018 │ CAS 13
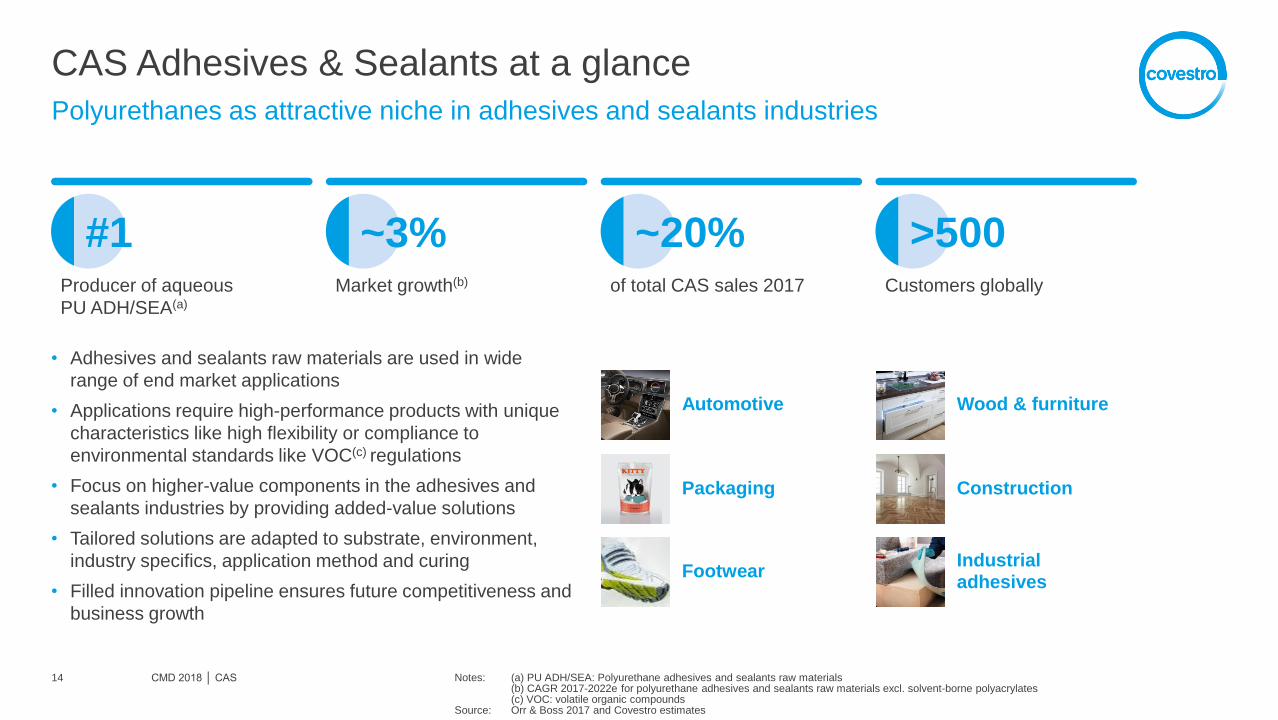
CAS Adhesives & Sealants at a glance
CMD 2018 │ CAS 14
Polyurethanes as attractive niche in adhesives and sealants industries
#1 Producer of aqueous
PU ADH/SEA(a)
~3% Market growth(b)
~20% of total CAS sales 2017
>500 Customers globally
• Adhesives and sealants raw materials are used in wide
range of end market applications
• Applications require high-performance products with unique
characteristics like high flexibility or compliance to
environmental standards like VOC(c) regulations
• Focus on higher-value components in the adhesives and
sealants industries by providing added-value solutions
• Tailored solutions are adapted to substrate, environment,
industry specifics, application method and curing
• Filled innovation pipeline ensures future competitiveness and
business growth
Packaging
Automotive
Footwear
Wood & furniture
Construction
Industrial adhesives
Notes: (a) PU ADH/SEA: Polyurethane adhesives and sealants raw materials (b) CAGR 2017-2022e for polyurethane adhesives and sealants raw materials excl. solvent-borne polyacrylates (c) VOC: volatile organic compounds Source: Orr & Boss 2017 and Covestro estimates

Adhesives and sealants supplier competitive landscape
CMD 2018 │ CAS 15
Covestro well positioned for success in differentiated markets
Notes: (a) Producers of aliphatic isocyanates and polyurethane dispersions adhesives and sealants raw materials Source: Covestro estimates
Narrow Wide
Local
Global
BASF
BASF
Covestro
Covestro
Wanhua
Wanhua
Alberdingk
& Boley
DIC
Industry Covestro position
Production
economies of
scale
• Cost efficiencies achieved by
benefitting from global assets
• Large scale production in all regions
• Efficient production processes
benefitting from low cost technology
and integration
Production
know-how and
expertise
• Long term experience in
isocyanate and PUD
production required to develop
necessary know-how
• Long history of process technology
and reliability
• Global network of process technology
expertise
Portfolio
diversification
• Diverse array of end markets
and applications requiring a
wide product offering
• Inventor of and technology leader in
isocyanate derivatives for adhesives
and sealants
• Focus on high added-value products
Technical
know-how and
expertise
• Expertise required to address
specific customer needs with
formulation and processing
know-how built over years
• Potential for wide variety of solutions
in an diverse field of applications
• Market-driven innovation in close
collaboration with all partners in the
value chain
Long-term
customer
relationships
• Long-term relationships with
customers and
responsiveness to customer
needs are critical
• Proximity and long established
customer relationships
• Developing customized solutions for
specific problems (forward marketing)
Competitive position of key raw material producers(a) in 2017
Ge
og
rap
hic
pre
se
nc
e
Product portfolio
Bubble size indicative in
several sales clusters(a) Aliphatic Isocyanates Polyurethane Dispersions

Adhesives and sealants industry growth
CMD 2018 │ CAS 16
CAS adhesives and sealants raw materials serve growing end-use markets
Notes: (a) PU ADH/SEA: Polyurethane adhesives and sealants raw materials (b) Diverse industries Source: Orr & Boss and Covestro estimates
2022e
230
2012 2017
160
100
190
180
250
20
90(b)
70
80 90
150
110(b)
930
800
20
650
Latently reactive adhesive films
• Superior performance of water-
borne polyurethane adhesives for
high-performance durable adhesive
films, which are resistant against
heat, water and chemicals
• Allows separation of adhesive
application and assembling and
bonding step
• Simple, clean and easy handling of
adhesive films: no liquid adhesive,
no metering, no overspray,
no drying
• Uniform and defined layer thickness
• Established in recent years and
growing in various industrial
applications, e.g. electronics, textile
and construction
Innovation example Global PU ADH/SEA raw materials industry(a)
+ Low-temperature curing favors PU adhesives, fast growth of exterior segment due to light-weight construction
+ Trend towards wood-based laminated construction materials
+ PU-based solution for flexible food packaging enabling faster throughput production process and food safety
+ Trend towards wind energy requires new bonding solutions
+ Increased need for high-performance materials, functionality and design; automated production in “speed factories”
+ Increased lamination adhesive demand; China consumption tax favors the use of water-based products
Growth drivers CAGR 2017-2022e
2%
4%
4%
4%
4%
2%
Demand (in kt)
CAGR in %
4.3%
GDP 2.8%
~3%
GDP ~3%
Automotive
Construction
Packaging
Footwear
Industrial
Adhesives
Wood &
Furniture

Covestro in the adhesives and sealants value chain
CMD 2018 │ CAS 17
Highly versatile chemistry enables tailor-made adhesives and sealants formulations
Notes: (a) VOC: volatile organic compounds
CAS delivers tailored solutions and has contact with all partners in the value chain
Characteristics of PU-based adhesives and sealants raw materials
• Unique properties in high-performance adhesives and sealants:
High flexibility
Low-temperature curing
Hydrolytic stability
• Offers solutions for environmental challenges, e.g. low VOC(a)
CAS raw materials Original equipment
manufacturer or brand owners
Tier 1 / contract
manufacturers
Adhesives
formulators
End user
and brands
Covestro products in average adhesives and sealants formulation
Additives
Extender and pigments
Organic solvents or water
Resins and film formers

covestro.com
Coatings, Adhesives,
Specialties (CAS)
High Growth Specialties
Thermoplastic Polyurethanes
(TPU)
CMD 2018 │ CAS 18

Thermoplastic Polyurethanes (TPU) at a glance
CMD 2018 │ CAS 19
Leading supplier for high-performance resins
Notes: (a) Thermoplastic polyurethanes (b) Incl. 50/50 JV with DIC in Japan (c) CAGR 2017-2022e for global thermoplastic polyurethanes market Source: Covestro estimates
#3 Producer of TPU(a)
~6% Market growth(c)
~10% of total CAS sales 2017
6 Production facilities
globally(b)
• High-performance resins covering diverse markets
from hard plastics to soft elastomers and rubber
• Core volume growth of 13% (CAGR 2015-2017)
• Opportunity to outgrow industry by constant re-specifications and
innovative market extension
• Covestro as global top 3 producer with leading positions in all major
regions and commitment to growth
• Leverage of formulation and processing know-how across global
production network as basis for planned capacity expansions
• Attractive internal synergies via backward integration in MDI and
polyester polyols as well as broad access to diverse customer industries
• Well-filled innovation pipeline including path to lower production costs
with CO2-based polyols
IT & electronics
Textiles
Sport & leisure
Agriculture
Automotive
Industrial

Source: Covestro estimates
TPU competitive landscape
CMD 2018 │ CAS 20
Covestro well positioned for success in differentiated markets
Narrow Wide
Local
Global
APAC & EMEA SMEs
(e.g. Innov, Miracll, Bangtai)
Coim
Huntsman
Lubrizol
Wanhua
Huafon
BASF Covestro
Industry Covestro position
Production
economies of
scale
• Cost efficiencies achieved by
benefitting from global assets and
backward integration
• Large scale production in all regions
• Backward integration and global supply
agreements on raw materials
Production
know-how and
expertise
• Long term experience in TPU
production required to develop
necessary know-how
• History of process technology experience
and know-how in reactive extrusion
• Global network of process technology
expertise
Portfolio
diversification
• Diverse array of end markets and
applications requiring a wide
product offering
• Greater than 100 end markets with over
400 products
• More than 700 primarily solution-based
customers
Technical
know-how and
expertise
• Expertise required to address
specific customer needs with
formulation and processing know-
how built over years
• Technology and know-how leader for
injection molding
• Unique global experience in formulation
and application development
Long-term
customer
relationships
• Long-term relationships with
customers and responsiveness to
customer needs are critical
• Diverse, global footprint with resources in
each region to support local market
• Proximity and long established customer
relationships
Competitive landscape of key TPU producers in 2017
Ge
og
rap
hic
pre
se
nc
e
Product portfolio
Bubble size indicates
2017 sales volumes

TPU industry growth
CMD 2018 │ CAS 21
Attractive growth based on multiple drivers and segments
70
10050
7060
80
80
110
140
70
110
504050
150
50
40
2022e
800
210(b)
2017
610
170(b)
2012
450
130(b)
30
cardyon™
• Polyol for the production of high-
performance TPU
• Innovative Covestro technology
enabling carbon capture and
utilization by partly substituting oil-
based raw materials with CO₂
• Helps to close the carbon loop by
bringing CO₂ back into the value
chain and reducing carbon footprint
• Enables manufacturers to look at
alternative and more sustainable
raw materials while reducing their
reliance on fossil fuels
• First small lots produced in 2018
and global sampling to selected
accounts initiated
Innovation example Global TPU industry(a)
+ Growth in electric cars and electronic products worldwide
+ Urbanization in emerging regions + Resistance against hydrolysis and grease make
TPU a material of choice for hoses in oil industry
+ Driven by desire for water resistance and breathability in fabric for fashion industry
+ Increasing demand in specialty and protective films in electrical/electronics and auto applications
+ Driven by growth of mobile and wearable devices + Wide range of hardness and good bonding with
other polymers make TPU a popular choice for various IT components
+ Rising income and desire for better living standards in emerging regions
+ Increasing demand for comfort in mature regions
+ Urbanization in emerging regions + Superior durability of TPU over other materials in
heavy-duty environment (e.g. castor, animal tag)
Growth drivers CAGR 2017-2022e
7%
7%
6%
5%
6%
5%
Demand (in kt)
CAGR in %
6.4%
GDP 2.8%
~6%
GDP ~3%
Extr
usio
n
Inje
ction
mold
ing
Cable
HTBP(c)
Films/
Sheets
Footwear
IT
Industrial
mechanics
Notes: (a) Covestro estimates (b) Diverse industries including healthcare, transportation, compounding, coatings & adhesives and off-grade (c) HTBP: Hoses, Tubes, Belts, Profiles

Covestro TPU operations
CMD 2018 │ CAS 22
Global asset footprint provides excellent market access and customer proximity
Notes: (a) DCP: DIC Covestro Polymer, a JV of Covestro and DIC, Japan
Dormagen, Germany
Leverkusen, Germany
New Martinsville, USA
Pittsburgh, USA
Taichung, Taiwan
Shenzhen, China Cuddalore, India
Sakai (DCP), Japan(a)
Innovation centers
TPU facility
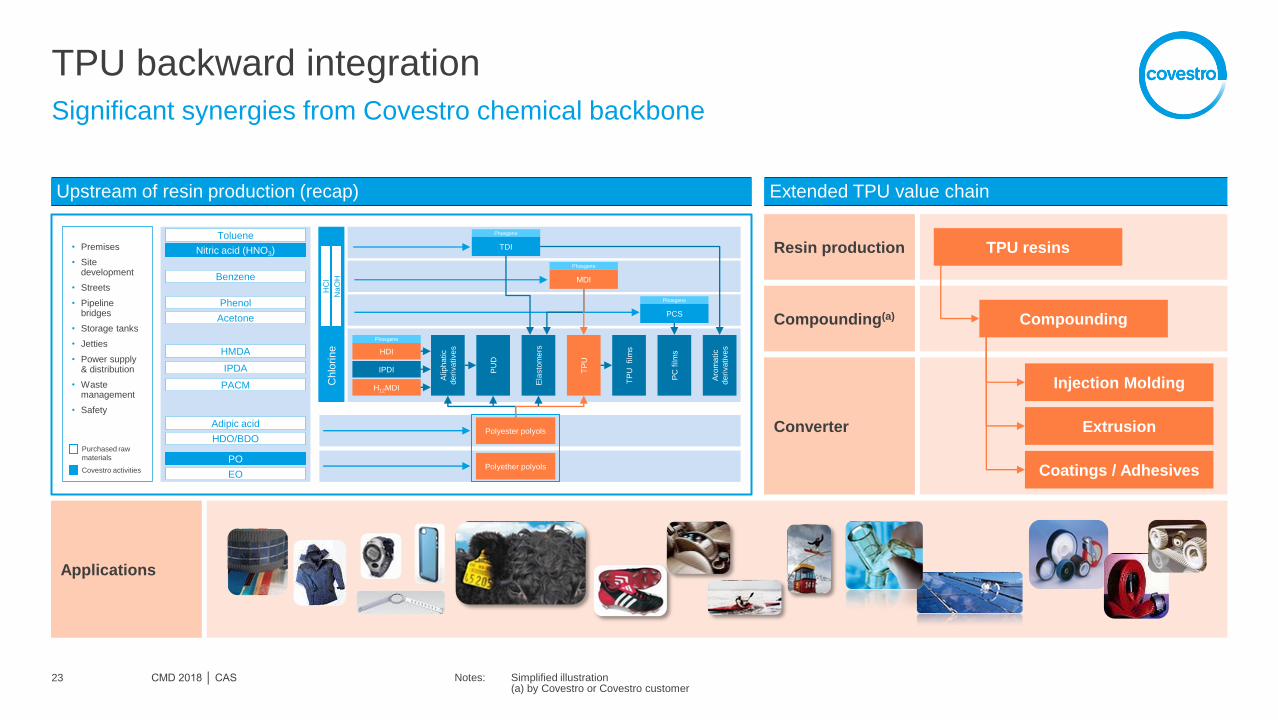
TPU backward integration
CMD 2018 │ CAS 23
Significant synergies from Covestro chemical backbone
Notes: Simplified illustration (a) by Covestro or Covestro customer
Upstream of resin production (recap) Extended TPU value chain
Applications
Resin production
Compounding(a)
Converter
Injection Molding
Extrusion
Coatings / Adhesives
TPU resins
Compounding
Toluene
Nitric acid (HNO3)
Benzene
Phenol
Acetone
C
hlo
rin
e
HC
l N
aO
H
TDI
Phosgene
MDI
Phosgene
HMDA
IPDA
PACM
PCS
Phosgene
Alip
ha
tic
de
riva
tive
s
Aro
ma
tic
de
riva
tive
s
TP
U
TP
U film
s
PC
film
s
Adipic acid
HDO/BDO Polyester polyols
PO
EO Polyether polyols
PU
D HDI
Phosgene
IPDI
H12MDI
• Premises
• Site development
• Streets
• Pipeline bridges
• Storage tanks
• Jetties
• Power supply & distribution
• Waste management
• Safety
Covestro activities
Purchased raw
materials
Ela
sto
me
rs

covestro.com
Coatings, Adhesives,
Specialties (CAS)
High Growth Specialties
Specialty Films
CMD 2018 │ CAS 24

Specialty Films at a glance
CMD 2018 │ CAS 25
Leading film solution provider focused on PC-, TPU- and holographic films
Notes: (a) CAGR 2017-2022e of global PC- and TPU-films market Source: Covestro estimates
#1or #2 Producer of PC- and TPU-
films, depending on region
6-7% Market growth(a)
~10% of total CAS sales 2017
5 Production facilities
globally
• Leading supplier in all key regions for PC- and TPU-films
• Supplying diverse, regional markets with customized films solutions
• Core volume growth of 6% (CAGR 2015-2017)
• Robust future growth expectation significantly above GDP supported by
innovative product portfolio
• Strong technology background in extruded films production, surface
modification and coatings technology
• Strong innovation pipeline offering solutions to future
industry trends
TPU films
PC films
Holographic films

Specialty Films competitive landscape
CMD 2018 │ CAS 26
Leading films producer with focus on high-end films applications
Notes: (a) Global PC- and TPU-films Source: Covestro estimates
Industry Covestro position
Process
technology
• State-of-the-art technology along
the process chain of high
importance
• Ability to combine different
technologies and offer multilayer
solutions
• IP-protected, competitive process
technology
• Ability to offer multilayer solutions and
combine PC- and TPU-Films
Integration
• Backward integration as major
value lever
• Conversion capabilities important
to offer broad product portfolio
• Favorable backward integration
• Long-term supply contracts for important
precursors
• Conversion capabilities in all regions
(slitting and sheeting)
Technical
capabilities and
expertise
• Systems demanding greater
knowledge and expertise
• Technical centers in all regions to
develop custom solutions
• Innovation capabilities to offer
solutions to industry
• Superior expertise and know-how in
application development
• Technical centers in main regions
• Strong R&D backbone based on films
and coatings know-how
Proximity to
customer
markets
• Importance of proximity to
customer markets
• Global asset base critical to
support ambitions of global
customer base
• Diverse, global footprint
• Production plants in all core regions
(except for TPU films in APAC)
Competitive landscape of key films producers in 2017(a)
Commodity Specialties
SWM
Mitsubishi
Gerlinger
API
Longhua
Dingzing
Sabic
Teijin
3M Covestro
Global
Ge
og
rap
hic
pre
se
nce
Market attractiveness
Bubble size indicates
2017 sales volumes
Local

Specialty Films industry growth
CMD 2018 │ CAS 27
Strong growth in core segments supported by future industry trends
2022e
130
1
75
55
2017
95
50
45
2012
75
40
35
Holographic filters
• Laser strikes on commercial
aircrafts are rising globally:
lasers can distract pilots during
critical phases of flight and can
cause temporary visual impairment
• Transparent laser protection filters
developed by Canadian company
Metamaterial Technologies Inc.
together with Covestro and partners
of the aircraft industry
• The filters are based on IP
protected photopolymer films
(Bayfol HX) of Covestro
• Start of production is planned for
2019e; additional potential is seen
for police visors
Innovation example Global films industry(a)
+ Growing population and increased demand for state-of-the-art identification
+ Upside potential by new PC-based identification projects
+ Integration of new display concepts and head-up displays combined with design freedom in automotive interior
+ Overall trend towards roll to roll manufacturing processes
+ TPU technology of choice for niche applications in textile, packaging, construction
+ Demographic change, trend towards highly sophisticated wound care solutions
+ Strong trend towards wearable solutions
+ Electronics: Strong market need for holographic films in head-mounted glasses
+ Strong value proposition for other industries (e.g. head-up displays for automotive)
+ New market to be developed for holographic films
Growth drivers CAGR 2017-2022e
Demand (in kt)
CAGR in % Security
Automotive
Div.
industries
Medical
Div.
industries
Div.
industries
5.2%
GDP 2.8%
6-7%
GDP ~3%
PC
film
s
Holo
gra
ph
ic
TP
U f
ilms
>10%
4%
10%
4%
5%
4-9%
Notes: (a) Global PC- and TPU-films market as per Covestro estimates

Covestro Specialty Films operations
CMD 2018 │ CAS 28
Global footprint with strong technical capabilities
Map Tha Put, Thailand
Dormagen, Germany
South Deerfield, USA
Bomlitz, Germany
Leverkusen, Germany
Technical centers
Films production facility
Pittsburgh,
USA
Leverkusen &
Dormagen,
Germany
Shanghai,
China

Specialty Films backward integration
CMD 2018 │ CAS 29
Significant synergies from Covestro chemical backbone
Notes: Simplified illustration (a) Other resins may include CO-PET, ABS, PEI, PA, TAC, PC and TPU (b) Monolayer or combined
Applications
Toluene
Nitric acid (HNO3)
Benzene
Phenol
Acetone
C
hlo
rin
e
HC
l N
aO
H
TDI
Phosgene
MDI
Phosgene
HMDA
IPDA
PACM
PCS
Phosgene
Alip
ha
tic
de
riva
tive
s
Aro
ma
tic
de
riva
tive
s
TP
U
TP
U film
s
PC
film
s
Adipic acid
HDO/BDO Polyester polyols
PO
EO Polyether polyols
PU
D HDI
Phosgene
IPDI
H12MDI
• Premises
• Site development
• Streets
• Pipeline bridges
• Storage tanks
• Jetties
• Power supply & distribution
• Waste management
• Safety
Covestro activities
Purchased raw
materials
Ela
sto
me
rs
Resin production
Film production
Coating may be applied to add additional
functionalities to the film Coater
TPU resins
Other Films(b)
Other resins(a)
PC resins
TPU Films
PC Films
TPU films PC films Holographic films
• Medical
• Construction
• Automotive
• Security
• Electronics
• Automotive
Upstream of resin production (recap) Extended Specialty Films value chain

covestro.com
Coatings, Adhesives,
Specialties (CAS)
High Growth Specialties
Elastomers
CMD 2018 │ CAS 30

Elastomers at a glance
CMD 2018 │ CAS 31
Leading supplier for PU cast elastomer systems and equipment
Notes: (a) CAGR 2017-2022e for global PU elastomers market Source: Covestro estimates
#2 Producer of
PU elastomer systems
3-4% Market growth(a)
~10% of total CAS sales 2017
11 Production sites
globally
• Globally leading supplier for elastomers systems with a comprehensive portfolio based on
NDI, MDI, TDI and aliphatic isocyanates
• Global number one position for casting equipment
• Core volume growth of 8% (CAGR 2015-2017)
• “One-stop shop” aiming for efficient customer support, particularly in growth markets
• Target to capture market growth and to ensure growth above GDP, based on already
available production capacities
• Production plants in main regions for optimized supply chain and to ensure cost efficiency
PU casting machines
Cyclone equipment for mines and quarries industry
Pipeline cleaning device for oil and gas industry

Elastomers competitive landscape
CMD 2018 │ CAS 32
Globally #2 position with a strong focus on growth
Source: Covestro estimates
Competitive landscape of PU elastomer producers in 2017 Industry Covestro position
Capital
intensity
• Intense investments required relative to
market size, especially for highly
technical product manufacturing (e.g.
low-free isocyanates technology)
• Combination of large Covestro
manufacturing sites and
dedicated production units in main
markets
Process
technology
• Beside low-free isocyanates
technology, relatively limited process
complexity
• Covestro owns key technologies:
low-free isocyanates, lower
reactivity amine-cured MDI-based
prepolymers, NDI-based stable
prepolymers, etc.
Feedstock
integration
• Security of precursor supply essential
• Backward integration as major
value lever
• Favorable backward integration
• Long-term supply contracts for
important precursors
Technical
capabilities
and
expertise
• Systems processing demand special
knowledge and expertise
• Suppliers have to provide molders not
only with products but with full technical
support
• Superior expertise and know-how
in application development and
processing
• Combined chemistry and
equipment solution
• Valued and recognized hands-on
expertise thanks to the heritage of
past molding activity
Proximity to
customer
markets
• Proximity to customer markets
important
• Global asset base critical to support
ambitions of global customers
• Global presence in more than 80
countries
• Production plants in all core
regions
Narrow
Wide
Commodity Specialty
Pro
du
ct
po
rtfo
lio
Market attractiveness
Lanxess
BASF
ERA
Covestro
Dow
COIM
Multiple local
Chinese
competitors
Huntsman
Notedome
Anderson-
Mitsui
Bubble size indicates
2017 sales volumes
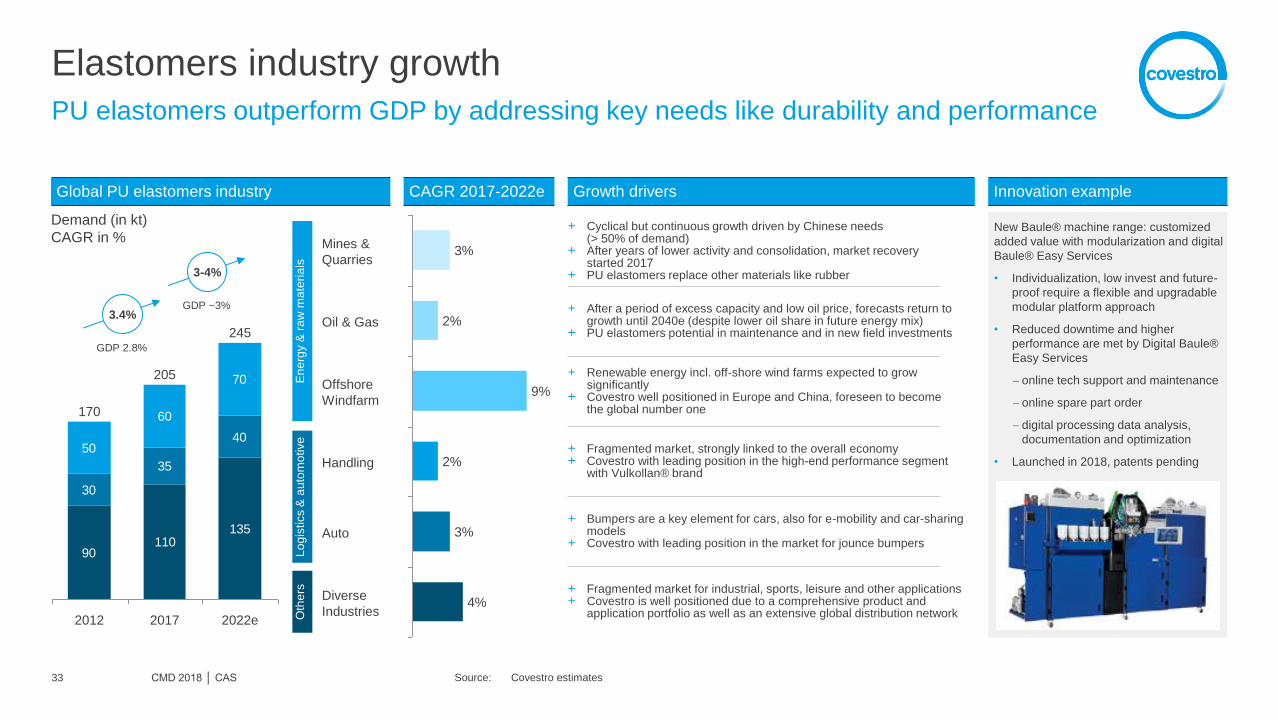
Elastomers industry growth
CMD 2018 │ CAS 33
PU elastomers outperform GDP by addressing key needs like durability and performance
Innovation example Global PU elastomers industry Growth drivers CAGR 2017-2022e
Source: Covestro estimates
30
35
4050
60
70
90110
135
2017
205
2012
170
2022e
245
New Baule® machine range: customized
added value with modularization and digital
Baule® Easy Services
• Individualization, low invest and future-
proof require a flexible and upgradable
modular platform approach
• Reduced downtime and higher
performance are met by Digital Baule®
Easy Services
online tech support and maintenance
online spare part order
digital processing data analysis,
documentation and optimization
• Launched in 2018, patents pending
+ Cyclical but continuous growth driven by Chinese needs (> 50% of demand)
+ After years of lower activity and consolidation, market recovery started 2017
+ PU elastomers replace other materials like rubber
+ After a period of excess capacity and low oil price, forecasts return to growth until 2040e (despite lower oil share in future energy mix)
+ PU elastomers potential in maintenance and in new field investments
+ Renewable energy incl. off-shore wind farms expected to grow significantly
+ Covestro well positioned in Europe and China, foreseen to become the global number one
+ Bumpers are a key element for cars, also for e-mobility and car-sharing models
+ Covestro with leading position in the market for jounce bumpers
+ Fragmented market, strongly linked to the overall economy + Covestro with leading position in the high-end performance segment
with Vulkollan® brand
+ Fragmented market for industrial, sports, leisure and other applications + Covestro is well positioned due to a comprehensive product and
application portfolio as well as an extensive global distribution network 4%
3%
3%
2%
9%
2%
Demand (in kt)
CAGR in % Mines &
Quarries
Oil & Gas
Offshore
Windfarm
Handling
Auto
Diverse
Industries
3.4%
GDP 2.8%
3-4%
GDP ~3% E
ne
rgy &
ra
w m
ate
ria
ls
Oth
ers
L
og
istics &
au
tom
otive

Covestro Elastomers operations
CMD 2018 │ CAS 34
Business and sales
representations
Co-production facilities
Technical centers
11 production sites and five dedicated technical centers support customers globally
Pittsburgh, USA
Romans, France
PRDC Shanghai, China
Baytown,
USA
Santa Clara, Mexico
New Martinsville,
USA
Tarragona,
Spain
Cheadle Hulme, UK
Dormagen, Germany
Tianjin, China
Caojing, China
Leverkusen, Germany

Elastomers backward integration
CMD 2018 │ CAS 35
Significant synergies from Covestro chemical backbone
Notes: Simplified illustration (a) by Covestro
Upstream of resin production (recap) Extended Elastomers value chain
Toluene
Nitric acid (HNO3)
Benzene
Phenol
Acetone
C
hlo
rin
e
HC
l N
aO
H
TDI
Phosgene
MDI
Phosgene
HMDA
IPDA
PACM
PCS
Phosgene
Alip
ha
tic
de
riva
tive
s
Aro
ma
tic
de
riva
tive
s
TP
U
TP
U film
s
PC
film
s
Adipic acid
HDO/BDO Polyester polyols
PO
EO Polyether polyols
PU
D HDI
Phosgene
IPDI
H12MDI
• Premises
• Site development
• Streets
• Pipeline bridges
• Storage tanks
• Jetties
• Power supply & distribution
• Waste management
• Safety
Covestro activities
Purchased raw
materials
Ela
sto
me
rs
Applications
Elastomer
production
Machine
Manufacturing(a)
Prepolymers (Desmodur®)
Chain extenders (Baytec®)
Polyols (Baytec®)
Baulé® machines
Desmodur® Systems
Casting equipment
Mines and quarries Automotive Material handling Oil and gas Renewable energies

covestro.com
Coatings, Adhesives,
Specialties (CAS)
High Growth Specialties
Textile Coatings
Medical
Cosmetics
Additive Manufacturing
CMD 2018 │ CAS 36

Medical Textile Coatings
CAS High Growth Specialties
CMD 2018 │ CAS 37
Developing above-average growth niches in adjacent industries
Notes: (a) Sources IAL / M&M / GVR / CPPIA and Covestro estimates (b) Covestro estimates
Market size 2017(a): ~60,000 tons (~200m€)
Market growth CAGR 2017-2022e(a): ~7%
Covestro growth target CAGR 2017-2022e: ~10%
High-quality polyurethane
dispersions and isocyanate
crosslinker materials for various
textile coating applications
Applications
• For automotive interior: polyurethane synthetics for car seats, dashboards,
door panels, etc.
• For sports and outdoor: coated textile with functions such as water-proof and
breathable; sports shoes; printings on shoe upper and sports wear; digital
printing on textiles
• For technical textiles: polyurethane dispersions dipping for protected gloves;
conveyor belts
Applications
• New two-component PU adhesives and PU prepolymers for foams allow
improved moisture management and higher efficiency in wound care
• Combination products and functionalization with active ingredients are
feasible
• Patches in wearable devices as strong growth area
New polyurethane-based
materials for wound care and
wearable devices
Market size 2017(b): ~24,000 tons (~250m€)
Market growth CAGR 2017-2022e(b): ~5%
Covestro growth target CAGR 2017-2022e: >20%

CAS High Growth Specialties
CMD 2018 │ CAS 38
Developing above-average growth niches in adjacent industries
Additive Manufacturing (3D Printing) Cosmetics
Notes: (a) Covestro estimates (b) Additive manufacturing material; Source: Wohlers Report 2017 by Wohlers Associates; Covestro estimates
Market size 2017(a): ~49,000 tons (~500 m€)
Market growth CAGR 2017-2022e(a): ~5%
Covestro growth target CAGR 2017-2022e: >40%
Sustainable film formers as
waterproofing as well as
conditioning and fixative agents
for cosmetic formulations
Applications
• High-performance polyurethanes for make-up, nail polish, hair, sun and skin
applications
• Baycusan® polymers achieve significantly higher bio-degradability rates than
benchmark film formers, reducing the impact on the environment
• Baycusan® Eco line based on renewable raw materials allows customers to
formulate cosmetic products with high natural origin content
Applications
• Tailor-made materials for core 3D printing technologies
• In-house expertise and partnerships to enable industrial production
• Strong potential in automotive, medical, sport and electronics sector
Innovative material
solutions for additive
manufacturing
Market size 2017(b): ~13,000 tons (~800 m€)
Market growth CAGR 2017-2022e(b): ~20%
Covestro growth target CAGR 2017-2022e: >50%
»Nobody can turn 80 years of experience into new perspectives.«
»Why not?«
#PushingBoundaries