Investor Presentation - Syngene
29
Investor Presentation October 2015 Strictly confidential & privileged
-
Upload
khangminh22 -
Category
Documents
-
view
1 -
download
0
Transcript of Investor Presentation - Syngene
Investor Presentation
October 2015
Strictly confidential & privileged

Safe Harbour
Certain statements in this release concerning our future growth prospects are forward-looking statements,which are subject to a number of risks, uncertainties and assumptions that could cause actual results todiffer materially from those contemplated in such forward-looking statements.
Important factors that could cause actual results to differ materially from our expectations include, amongstothers general economic and business conditions in India, business outlook of our clientele and theirresearch and development efforts our ability to successfully implement our strategy, our growth andexpansion plans and technological changes, changes in the value of the Rupee and other currencies,changes in the Indian and international interest rates, change in laws and regulations that apply to theIndian and global biotechnology and pharmaceuticals industries, increasing competition, changes in politicalconditions in India and changes in the foreign exchange control regulations in India.
Neither the company, nor its directors and any of the affiliates have any obligation to update or otherwiserevise any statements reflecting circumstances arising after this date or to reflect the occurrence ofunderlying events, even if the underlying assumptions do not come to fruition.
2
Strictly confidential & privileged
Introduction
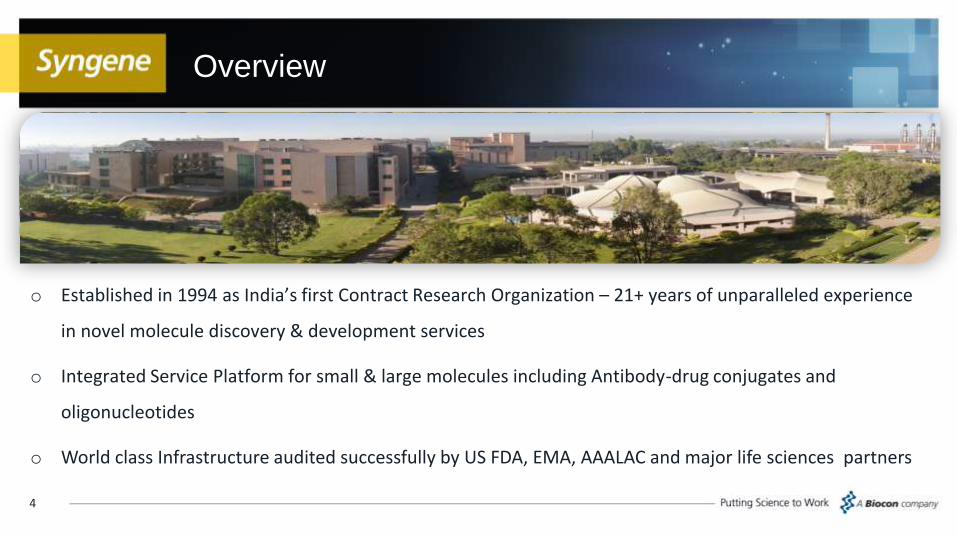
Overview
4
o Established in 1994 as India’s first Contract Research Organization – 21+ years of unparalleled experience
in novel molecule discovery & development services
o Integrated Service Platform for small & large molecules including Antibody-drug conjugates and
oligonucleotides
o World class Infrastructure audited successfully by US FDA, EMA, AAALAC and major life sciences partners
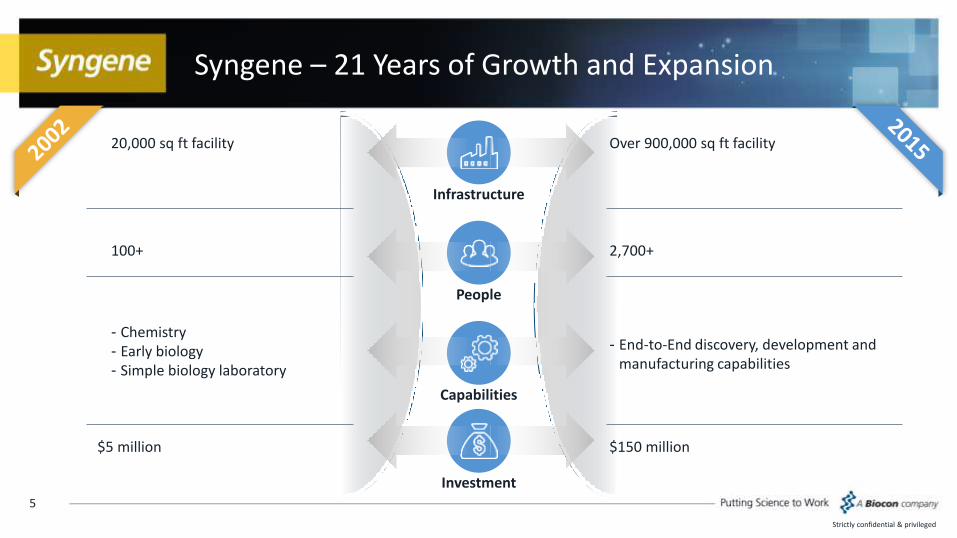
Syngene – 21 Years of Growth and Expansion
5
Strictly confidential & privileged
Infrastructure
People
Capabilities
Investment
Over 900,000 sq ft facility20,000 sq ft facility
2,700+100+
- Chemistry - Early biology- Simple biology laboratory
- End-to-End discovery, development and manufacturing capabilities
$150 million$5 million
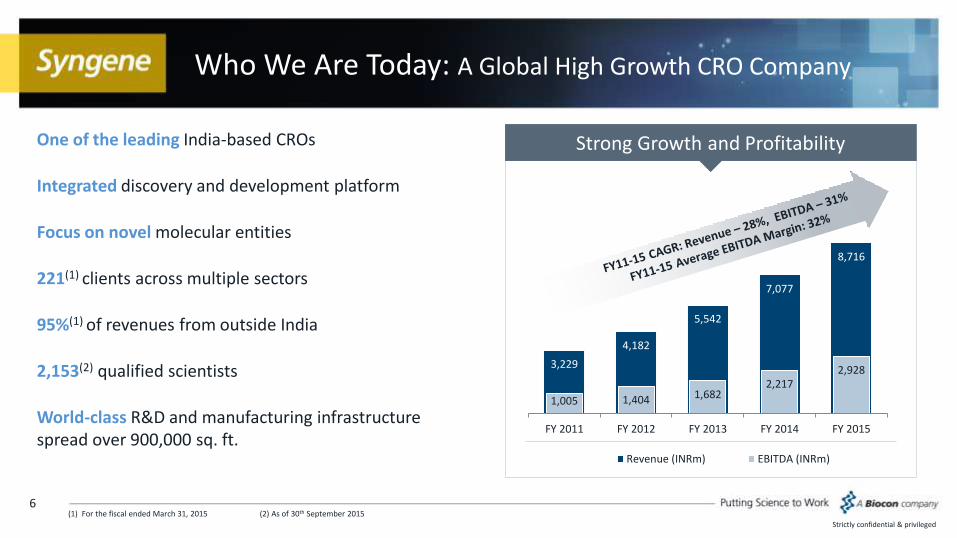
Who We Are Today: A Global High Growth CRO Company
One of the leading India-based CROs
Integrated discovery and development platform
Focus on novel molecular entities
221(1) clients across multiple sectors
95%(1) of revenues from outside India
2,153(2) qualified scientists
World-class R&D and manufacturing infrastructure spread over 900,000 sq. ft.
6
Strictly confidential & privileged
(1) For the fiscal ended March 31, 2015 (2) As of 30th September 2015
Strong Growth and Profitability
3,229
4,182
5,542
7,077
8,716
1,005 1,404 1,6822,217
2,928
FY 2011 FY 2012 FY 2013 FY 2014 FY 2015
Revenue (INRm) EBITDA (INRm)
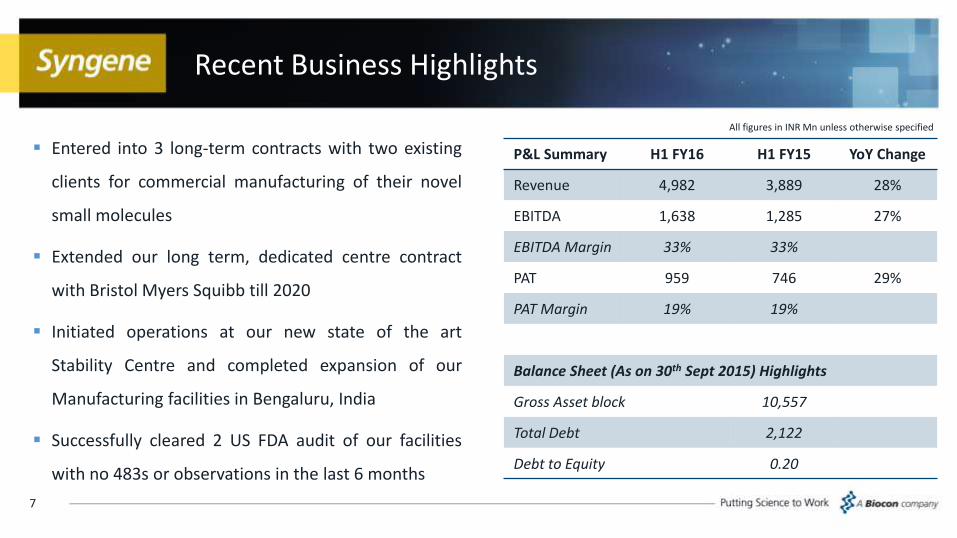
Recent Business Highlights
P&L Summary H1 FY16 H1 FY15 YoY Change
Revenue 4,982 3,889 28%
EBITDA 1,638 1,285 27%
EBITDA Margin 33% 33%
PAT 959 746 29%
PAT Margin 19% 19%
Balance Sheet (As on 30th Sept 2015) Highlights
Gross Asset block 10,557
Total Debt 2,122
Debt to Equity 0.20
7
All figures in INR Mn unless otherwise specified
Entered into 3 long-term contracts with two existing
clients for commercial manufacturing of their novel
small molecules
Extended our long term, dedicated centre contract
with Bristol Myers Squibb till 2020
Initiated operations at our new state of the art
Stability Centre and completed expansion of our
Manufacturing facilities in Bengaluru, India
Successfully cleared 2 US FDA audit of our facilities
with no 483s or observations in the last 6 months

Business Overview
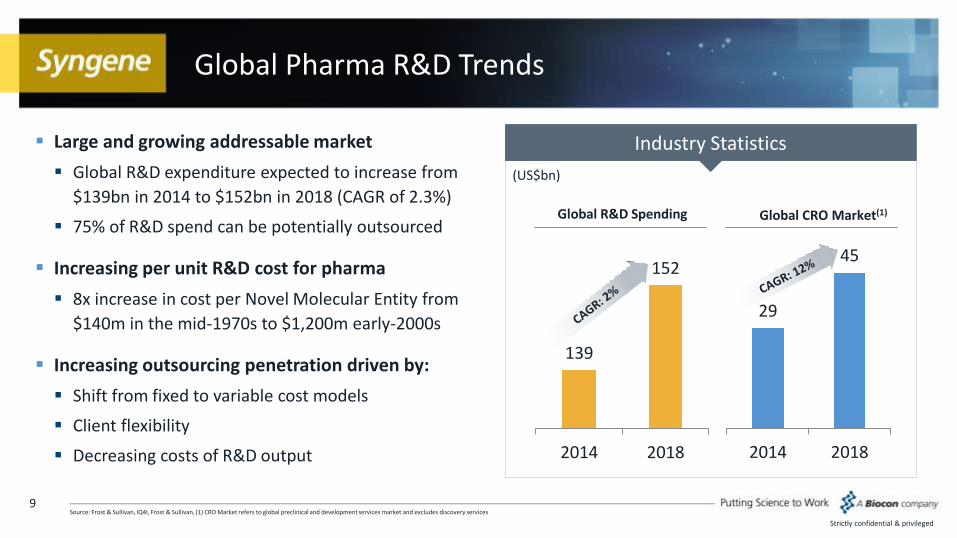
Global Pharma R&D Trends
Large and growing addressable market
Global R&D expenditure expected to increase from
$139bn in 2014 to $152bn in 2018 (CAGR of 2.3%)
75% of R&D spend can be potentially outsourced
Increasing per unit R&D cost for pharma
8x increase in cost per Novel Molecular Entity from
$140m in the mid-1970s to $1,200m early-2000s
Increasing outsourcing penetration driven by:
Shift from fixed to variable cost models
Client flexibility
Decreasing costs of R&D output
9
Strictly confidential & privileged
Industry Statistics
(US$bn)
139
152
2014 2018
29
45
2014 2018
Global R&D Spending Global CRO Market(1)
Source: Frost & Sullivan, IQ4I, Frost & Sullivan, (1) CRO Market refers to global preclinical and development services market and excludes discovery services
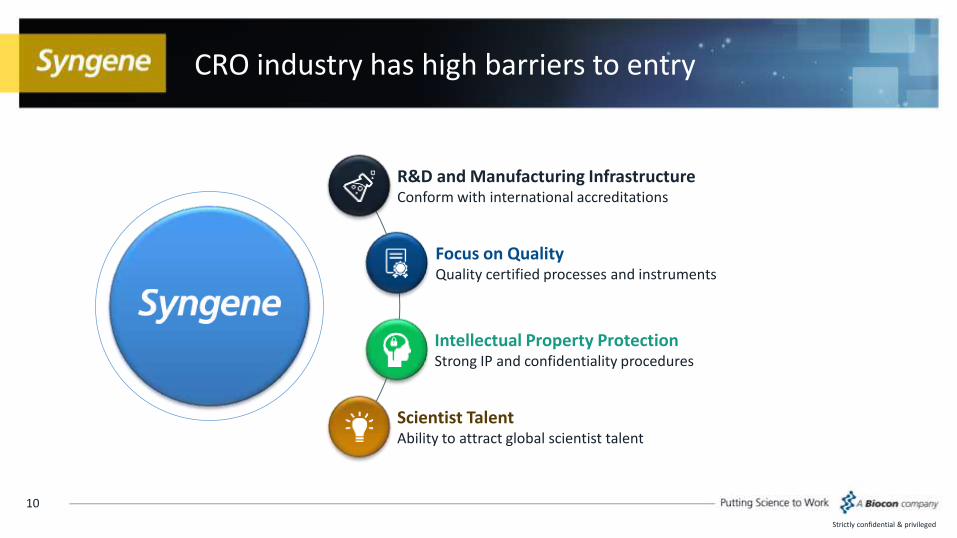
CRO industry has high barriers to entry
10
Strictly confidential & privileged
R&D and Manufacturing InfrastructureConform with international accreditations
Focus on QualityQuality certified processes and instruments
Intellectual Property ProtectionStrong IP and confidentiality procedures
Scientist TalentAbility to attract global scientist talent
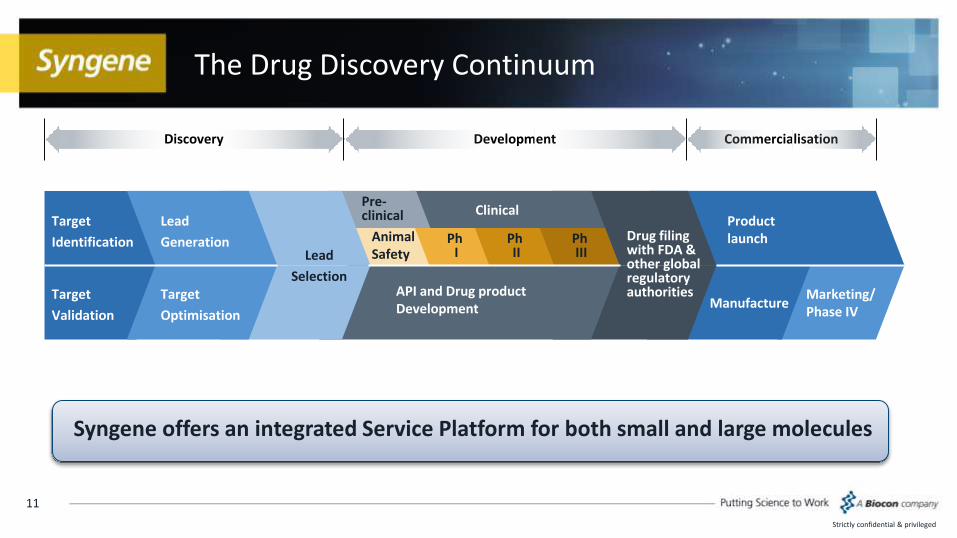
Syngene offers an integrated Service Platform for both small and large molecules
The Drug Discovery Continuum
11
Strictly confidential & privileged
Target
Identification
Target
Validation
Lead
Generation
Target
Optimisation
Lead
Selection
PhI
API and Drug productDevelopment
Pre-clinical Clinical
Animal Safety
PhII
PhIII
Drug filing with FDA & other global regulatory authorities
Product launch
ManufactureMarketing/ Phase IV
Discovery Development Commercialisation
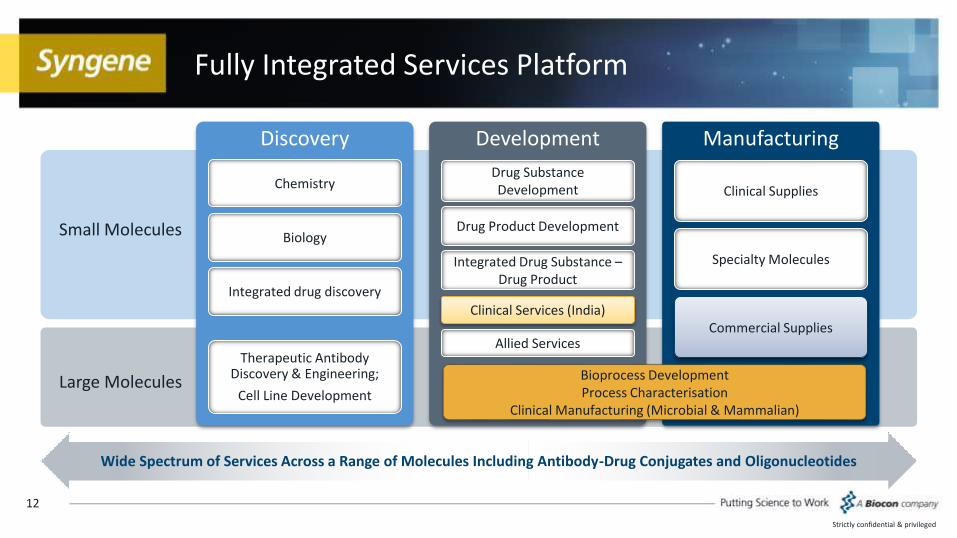
Discovery
Therapeutic Antibody Discovery & Engineering;
Cell Line Development
Development
Drug Substance Development
Drug Product Development
Manufacturing
Clinical Supplies
Specialty Molecules
Chemistry
Biology
Integrated drug discovery
Integrated Drug Substance –Drug Product
Bioprocess DevelopmentProcess Characterisation
Clinical Manufacturing (Microbial & Mammalian)
Small Molecules
Large Molecules
Commercial Supplies
Fully Integrated Services Platform
12
Strictly confidential & privileged
Wide Spectrum of Services Across a Range of Molecules Including Antibody-Drug Conjugates and Oligonucleotides
Allied Services
Clinical Services (India)
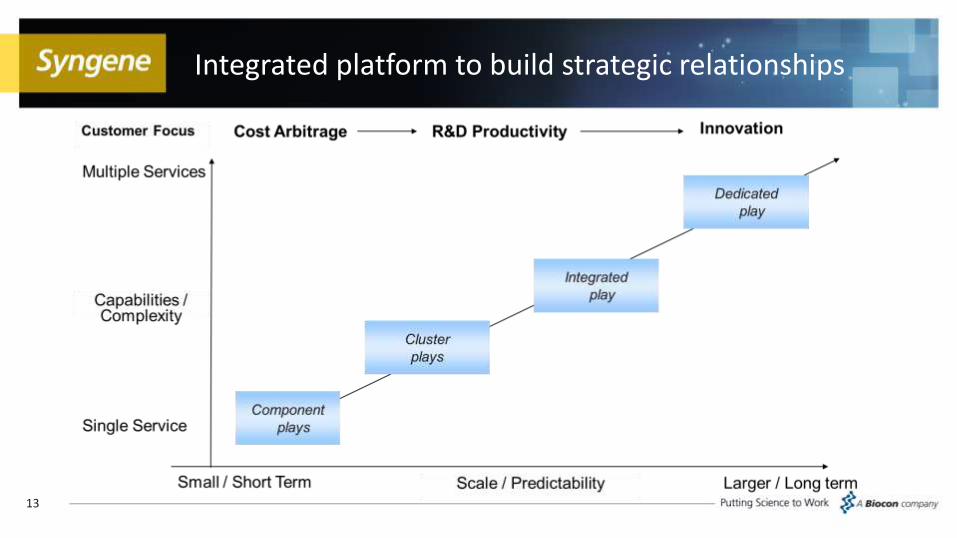
Integrated platform to build strategic relationships
13

World-class R&D & Manufacturing Facilities
Infrastructure Qualified to Meet International Standards
14
GLPCertificate
ISO9001
ISO14001
OHSAS8001
AAALACAccredited
USFDAaudited
EMAaudited
ISO15189
Strictly confidential & privileged
Key accreditations
Over 900,000 sq. ft. of labs and manufacturing facilities
INR 10,557 Mn(1) total tangible fixed assets (gross block)
End-to-end discovery and development services on a single platform
(1) As of September 30, 2015
Operate to standards that are consistent with large global clients
Successful audits by global regulators
Intention to evolve from a CRO into a CRAMS
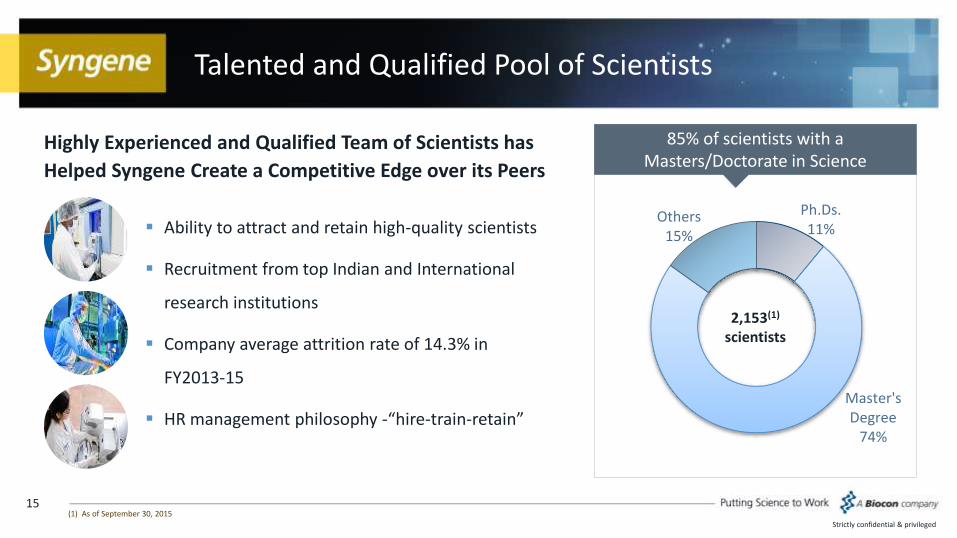
85% of scientists with a Masters/Doctorate in Science
Talented and Qualified Pool of Scientists
Highly Experienced and Qualified Team of Scientists has
Helped Syngene Create a Competitive Edge over its Peers
15
Ph.Ds.11%
Master's Degree
74%
Others15%
2,153(1)
scientists
Strictly confidential & privileged
(1) As of September 30, 2015
Ability to attract and retain high-quality scientists
Recruitment from top Indian and International
research institutions
Company average attrition rate of 14.3% in
FY2013-15
HR management philosophy -“hire-train-retain”
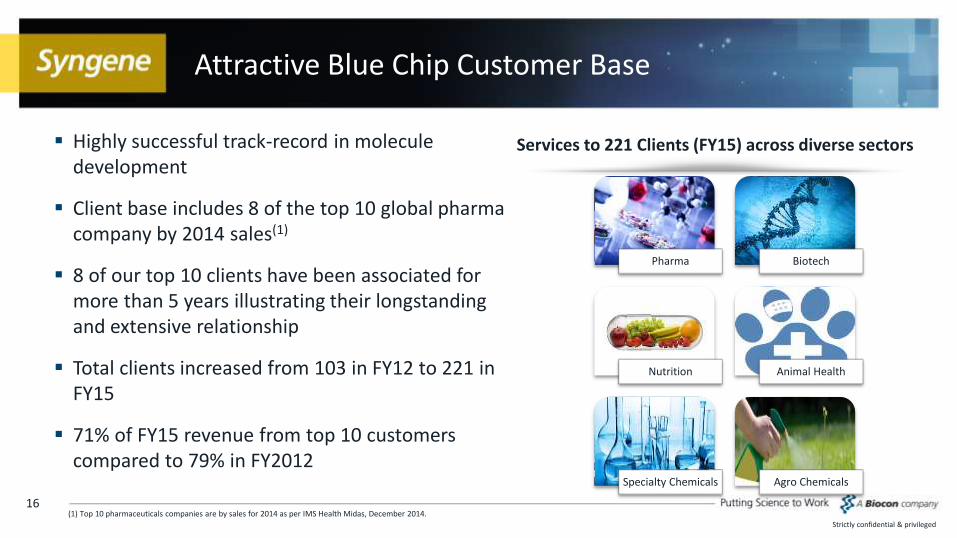
Attractive Blue Chip Customer Base
Highly successful track-record in molecule development
Client base includes 8 of the top 10 global pharma company by 2014 sales(1)
8 of our top 10 clients have been associated for more than 5 years illustrating their longstanding and extensive relationship
Total clients increased from 103 in FY12 to 221 in FY15
71% of FY15 revenue from top 10 customers compared to 79% in FY2012
16
Services to 221 Clients (FY15) across diverse sectors
Strictly confidential & privileged
(1) Top 10 pharmaceuticals companies are by sales for 2014 as per IMS Health Midas, December 2014.
Pharma Biotech
Nutrition Animal Health
Specialty Chemicals Agro Chemicals
Business Verticals

Verticals Overview
Dedicated centers
• Integrated Services
• Dedicated Infrastructure customized for client’s requirements
• Long term, FTE based contracts
• Currently 3 in place: BBRC, ANRD and BGRC
Discovery Services
• Discovery Chemistry, Discovery Biology and in-vivo services
• Multi-client infrastructure
• Largely FTE based engagements, typically renewed annually
• High renewal rates
Development Services
• Preclinical studies, Stability, formulation, CMC and Clinical supplies, Clinical development etc.
• Largely FFS based services (both short and long term)
• High renewal rates in Manufacturing services
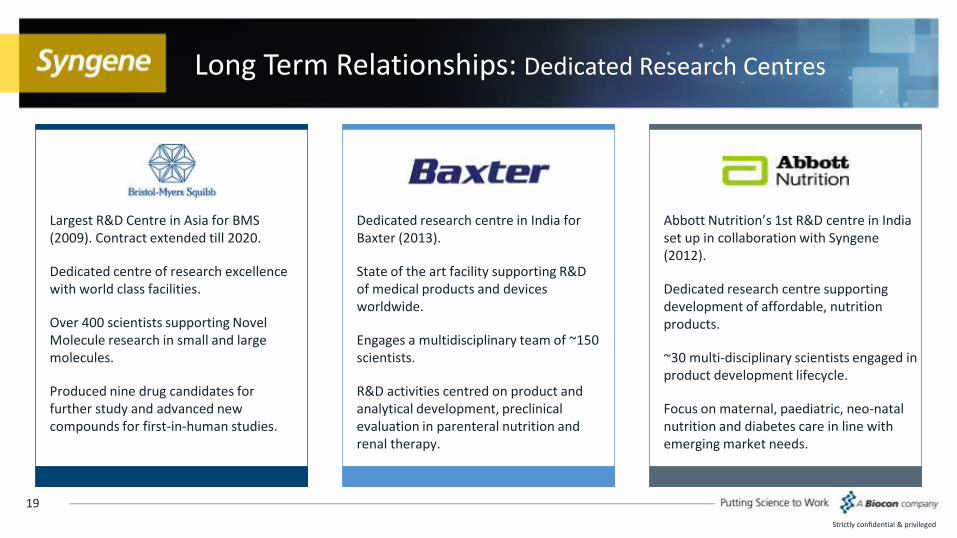
Long Term Relationships: Dedicated Research Centres
19
Strictly confidential & privileged
Largest R&D Centre in Asia for BMS (2009). Contract extended till 2020.
Dedicated centre of research excellence with world class facilities.
Over 400 scientists supporting Novel Molecule research in small and large molecules.
Produced nine drug candidates for further study and advanced new compounds for first-in-human studies.
Dedicated research centre in India for Baxter (2013).
State of the art facility supporting R&D of medical products and devices worldwide.
Engages a multidisciplinary team of ~150 scientists.
R&D activities centred on product and analytical development, preclinical evaluation in parenteral nutrition and renal therapy.
Abbott Nutrition’s 1st R&D centre in India set up in collaboration with Syngene(2012).
Dedicated research centre supporting development of affordable, nutrition products.
~30 multi-disciplinary scientists engaged in product development lifecycle.
Focus on maternal, paediatric, neo-natal nutrition and diabetes care in line with emerging market needs.
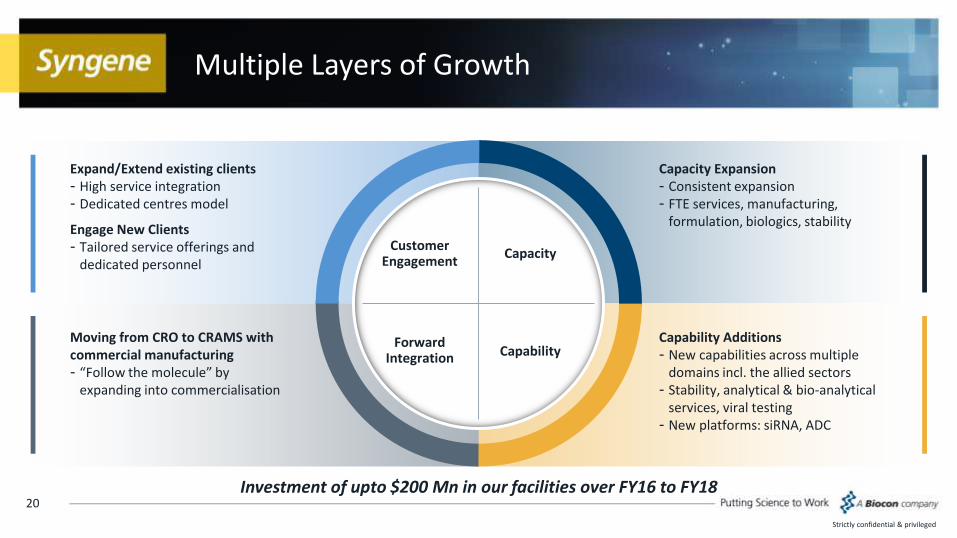
Multiple Layers of Growth
20
Strictly confidential & privileged
Forward Integration
Customer Engagement
Capacity
Capability
Expand/Extend existing clients- High service integration - Dedicated centres model
Engage New Clients- Tailored service offerings and
dedicated personnel
Capacity Expansion- Consistent expansion - FTE services, manufacturing,
formulation, biologics, stability
Capability Additions- New capabilities across multiple
domains incl. the allied sectors- Stability, analytical & bio-analytical
services, viral testing- New platforms: siRNA, ADC
Moving from CRO to CRAMS with commercial manufacturing- “Follow the molecule” by
expanding into commercialisation
Investment of upto $200 Mn in our facilities over FY16 to FY18
Financial Highlights
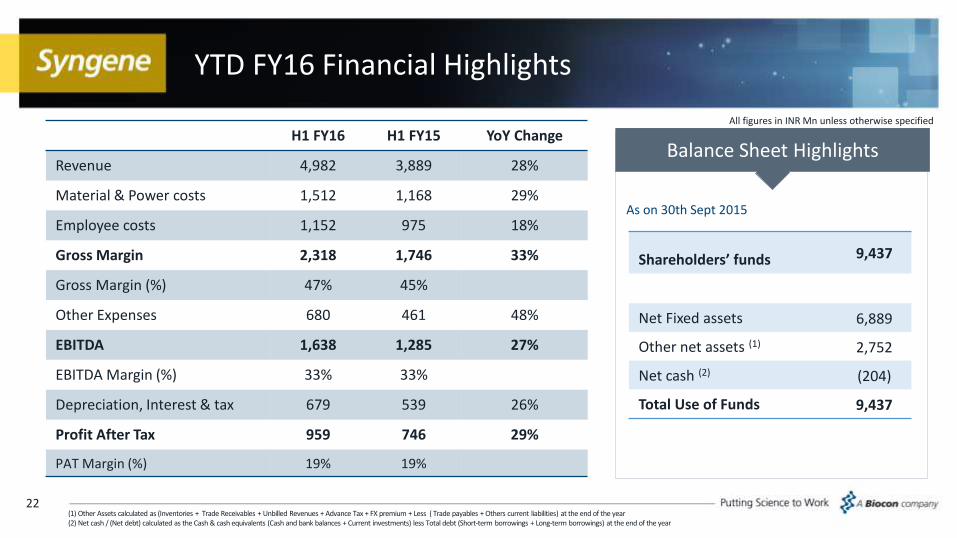
YTD FY16 Financial Highlights
H1 FY16 H1 FY15 YoY Change
Revenue 4,982 3,889 28%
Material & Power costs 1,512 1,168 29%
Employee costs 1,152 975 18%
Gross Margin 2,318 1,746 33%
Gross Margin (%) 47% 45%
Other Expenses 680 461 48%
EBITDA 1,638 1,285 27%
EBITDA Margin (%) 33% 33%
Depreciation, Interest & tax 679 539 26%
Profit After Tax 959 746 29%
PAT Margin (%) 19% 19%
22
Shareholders’ funds 9,437
Net Fixed assets 6,889
Other net assets (1) 2,752
Net cash (2) (204)
Total Use of Funds 9,437
As on 30th Sept 2015
Balance Sheet Highlights
(1) Other Assets calculated as (Inventories + Trade Receivables + Unbilled Revenues + Advance Tax + FX premium + Less ( Trade payables + Others current liabilities) at the end of the year(2) Net cash / (Net debt) calculated as the Cash & cash equivalents (Cash and bank balances + Current investments) less Total debt (Short-term borrowings + Long-term borrowings) at the end of the year
All figures in INR Mn unless otherwise specified
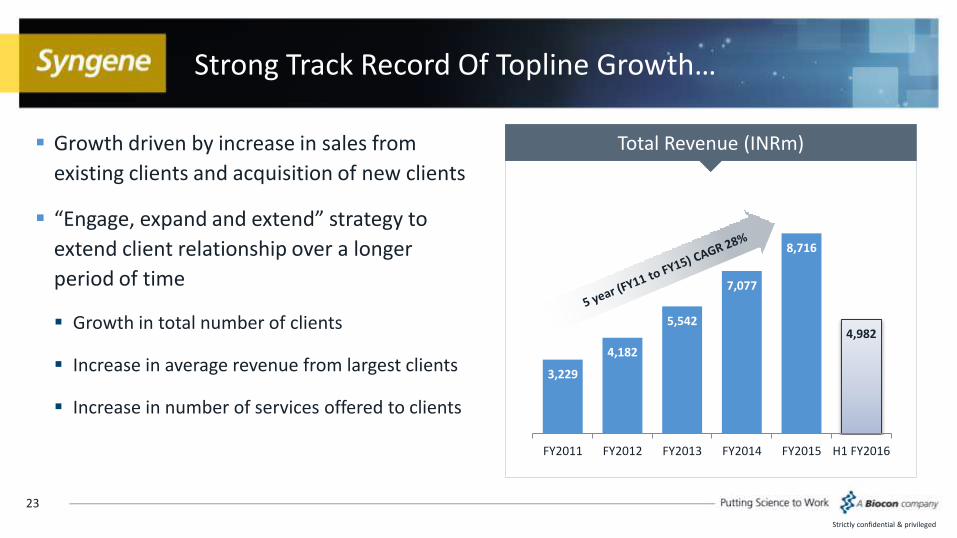
3,229
4,182
5,542
7,077
8,716
4,982
FY2011 FY2012 FY2013 FY2014 FY2015 H1 FY2016
Strong Track Record Of Topline Growth…
Growth driven by increase in sales from
existing clients and acquisition of new clients
“Engage, expand and extend” strategy to
extend client relationship over a longer
period of time
Growth in total number of clients
Increase in average revenue from largest clients
Increase in number of services offered to clients
23
Strictly confidential & privileged
Total Revenue (INRm)
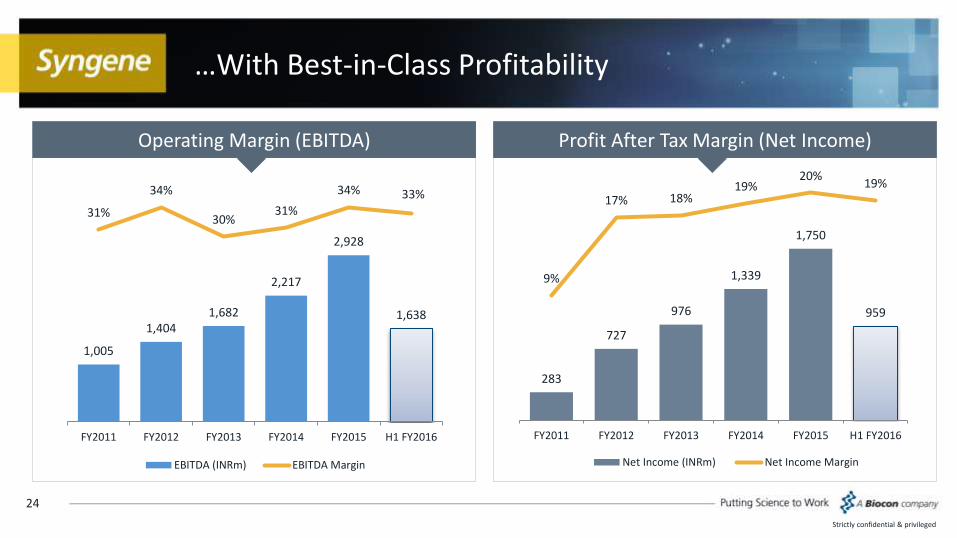
283
727
976
1,339
1,750
959
9%
17% 18%19%
20%19%
FY2011 FY2012 FY2013 FY2014 FY2015 H1 FY2016
Net Income (INRm) Net Income Margin
…With Best-in-Class Profitability
24
Strictly confidential & privileged
1,005
1,4041,682
2,217
2,928
1,638
31%
34%
30%31%
34% 33%
FY2011 FY2012 FY2013 FY2014 FY2015 H1 FY2016
EBITDA (INRm) EBITDA Margin
Operating Margin (EBITDA) Profit After Tax Margin (Net Income)

Capital Expenditure
25
Planned Capital Expenditure Capex of US$200 million envisaged over FY16 to FY18
Future funding requirements to be met through internal accruals and debt
Capex towards capacity expansions, capability additions and technology up-gradations
Key facility additions during the last three years include dedicated facility for Abbott and Baxter
Capex investment area
- Research centre
- Formulation centre
Late stage & commercial manufacturing
- Expansion of API plant
- Commercial NCE manufacturing plant
- Biologics manufacturing plant
Other services & new capabilities
- Oligonucleotides
- Viral testing services
- ADCs
Strictly confidential & privileged
Gross block turnover ratio calculated as the CRAMS revenue of last twelve months divided by average of Gross block at the beginning and end of the year
Historical Capital Investments – Average Gross Block (INRm)
5,216 5,610 6,149 6,8198,255
FY2011 FY2012 FY2013 FY2014 FY2015
Gross Block Turnover Ratio(1)
0.61 0.730.88
1.01 1.02
FY2011 FY2012 FY2013 FY2014 FY2015
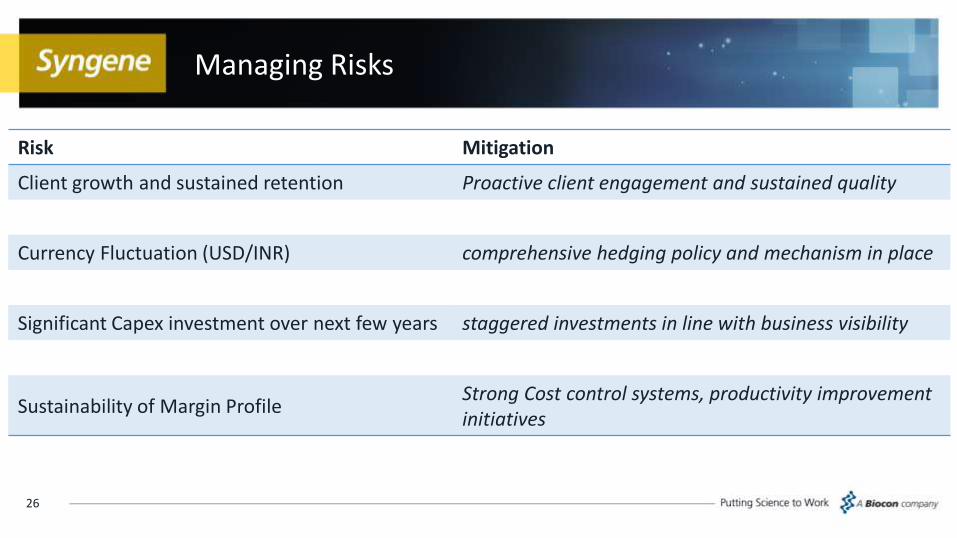
Managing Risks
26
Risk Mitigation
Client growth and sustained retention Proactive client engagement and sustained quality
Currency Fluctuation (USD/INR) comprehensive hedging policy and mechanism in place
Significant Capex investment over next few years staggered investments in line with business visibility
Sustainability of Margin ProfileStrong Cost control systems, productivity improvement initiatives
THANK YOUwww.syngeneintl.com
For more details
• Visit www.syngeneintl.com
• IR Contact : Sweta Pachlangiya +91 80 2808 [email protected]
Appendix
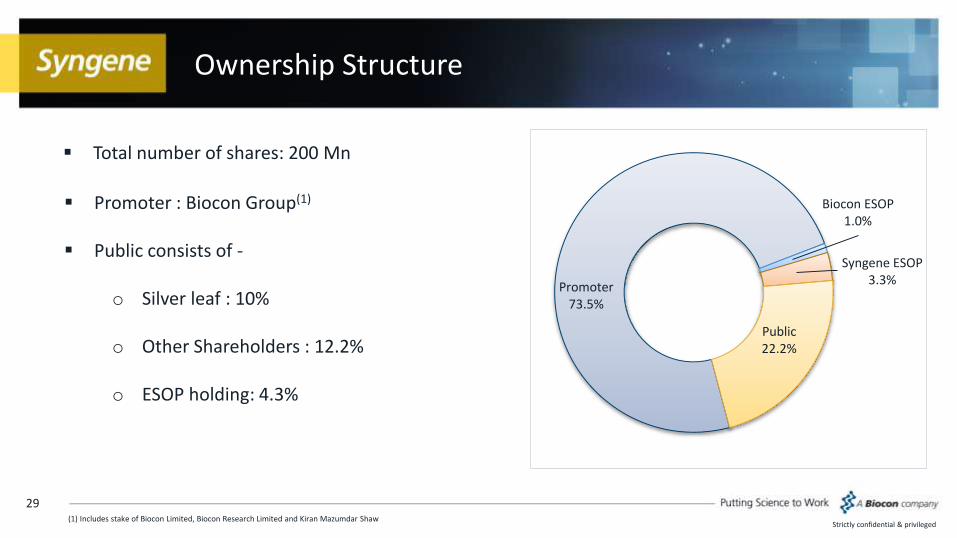
Ownership Structure
29
Strictly confidential & privileged(1) Includes stake of Biocon Limited, Biocon Research Limited and Kiran Mazumdar Shaw
Total number of shares: 200 Mn
Promoter73.5%
Biocon ESOP1.0%
Syngene ESOP3.3%
Public22.2%
Promoter : Biocon Group(1)
Public consists of -
o Silver leaf : 10%
o Other Shareholders : 12.2%
o ESOP holding: 4.3%