
Investor Presentation - ONGC
47
Investor Presentation July 2021 1
-
Upload
khangminh22 -
Category
Documents
-
view
3 -
download
0
Transcript of Investor Presentation - ONGC

Investor Presentation
July 2021
1

Disclaimer
2
• This presentation does not provide individually tailored advice but is an effort to express views that may be considered debatable,and may not conform to different views on the topic and does not contain any information of strategic nature emerging from theONGC group of Companies.
• The Company has prepared this presentation based on information available to it, including information derived from public sourcesthat have not been independently verified. While reasonable efforts have been made to provide reliable information through thispresentation, no representation or warranty, express or implied, is provided in relation to the fairness, accuracy, correctness,completeness or reliability of the information, opinions or conclusions expressed herein. Neither the Company nor anyone elseaccepts any liability whatsoever for any loss, howsoever, arising from use or reliance on this presentation or its contents or otherwisearising in connection therewith.
• This presentation had been prepared without regard to any pressure group, institution/ lobby on international affairs or relations andis not meant to aim at any individual, institution, group, country, government or political representatives, its ideology, thinking orprophesy.
• This presentation is not intended to be relied upon as advice to investors or potential investors and does not take into account theinvestment objectives, financial situation or needs of any investor. The information contained herein does not purport to be all-inclusive or to contain all of the information a prospective or existing investor may desire. All investors should conduct their owninvestigation and analysis of the Company and consider such factors in consultation with a professional advisor of their choosingwhen deciding if an investment is appropriate.
• This presentation may contain forward looking statements including statements regarding our intent, belief or current expectations.While due care has been used in the preparation of forecast information, actual results may vary in a materially positive or negativemanner.

> 58 MMTOE
UpstreamRefinery /
PetchemVAP RenewablesLNGPower
37 MMTPA / 4.2 MMTPA
> 3,100 KTA 726 MW 22.5 MMTPA 325 + MW
ONGC GroupIntegrated energy company
3

Evolution of ONGC Across Energy Value Chain: Integrated Energy Company
RefineryGas
1955-
59
1958-
631965
1974-
761984 2003 2004 2006 2018
First Oil in Cambay, other
Oil & Gas discoveries in
Gujarat
Hydrocarbon India
Limited (HIL) was
established
HIL rechristened as
ONGC Videsh on 15 June
1989
Has grown to be Second
Largest Petroleum
Company of India
1955 : Oil & Natural Gas
Directorate set up with
scientists' pool from GSI
1956 : Directorate was
raised to the status of
Commission
In October 1959, the
Commission was
converted into a statutory
body by an act of
Parliament
Discovered Mumbai High
and Bassein Gas field
Gas Authority of India
Limited (GAIL) formed out
of ONGC
Acquired majority stake in
MRPL and turned it
around
Major Oil Refiner in India
with 15 MMTPA capacity
Acquisition of 51.11%
stake in HPCL; Indirect
stake in HMEL - joint
venture between HPCL &
Mittal Energy Investments
Maharatna CPSE and a
Forbes 2000 company
2nd largest Oil marketing
company, Largest Lube
Marketer; 2nd Largest
Marketer in LPG Sales
Diversification into Petrochemicals
ONGC and MRPL jointly promoted OMPL
ONGC, GAIL and GSPC promoted OPaL
Promoted with 12.5%
equity stake
Started with 5MMTPA
plant at Dahej in 2004
Currently operates a 17.5
MMTPA LNG
regasification terminal at
Dahej and 5 MMTPA
regassification terminal at
Kochi, Kerala
Petro-
chemicalsGas MarketingExploration & Production
4
Acquired equity stake of 29% in PMHBL
Turned it around
Consolidated holding in 2019 with ~50% stake
362.36 km Petroleum products pipeline

ONGC Group: Snapshot
A Maharatna CPSE Vertically Integrated – Refining & Marketing
Production
~ 2 btoe since inception
~ 76% of domestic O+OEG
Holds
~ 60% of domestic reserves
~ 36 MMTPA of refining
Capacity from HPCL & MRPL
- Petchem capacity of 4.2 MMTPA
from OPaL & OMPL
– Extensive Network of
18,652 Retail Outlets
Redefining Value Chain through Petrochemicals Beyond E&P
OPaL
– One of the Largest Dual
Feed Cracker in the World
OMPL
– World-class Aromatic
Petchem Complex
OTPC
– 726.6 MW Gas based
Power Plant
Petronet LNG
– India’s largest LNG importer
Renewables : 325+ MW
– ONGC: 184 MW; HPCL: 134 MW; MRPL: 6MW; OMPL: 2.5MW
5

(* 71.63%, ** HPCL: 16.96%)
Overseas E&P
(100%)
Refinery
Subsidiaries Joint Ventures Associates
LNG
Logistics
(12.5%)
(49%)
Power
(49.36%)
Services
(50%)
Pipeline
(* 49.996%, ** HPCL: 49.996%)
SEZ
(50%)(26%)
Petrochemicals(49.98%)
( MRPL: 100%)
HPCL: Hindustan Petroleum Corporation Ltd.
MRPL: Mangalore Refinery & Petrochemicals Ltd.
OPaL: ONGC Petro-additions Ltd.
OMPL: ONGC Managlore Petrochemicals Ltd.
OTPC: ONGC Tripura Power Company Ltd.
OTBL: ONGC TERI Biotech Ltd.
(54.90%)
MSEZ: Mangalore SEZ Ltd.
DSL: Dahej SEZ Ltd.
PLL: Petronet LNG Ltd.
PHL: Pawan Hans Ltd.
* Directly; ** Indirectly through
Pipeline
(20%)6
ONGC Group: Holding Structure of Portfolio Companies
Rohini Heliport Pvt. Ltd.
(49%)
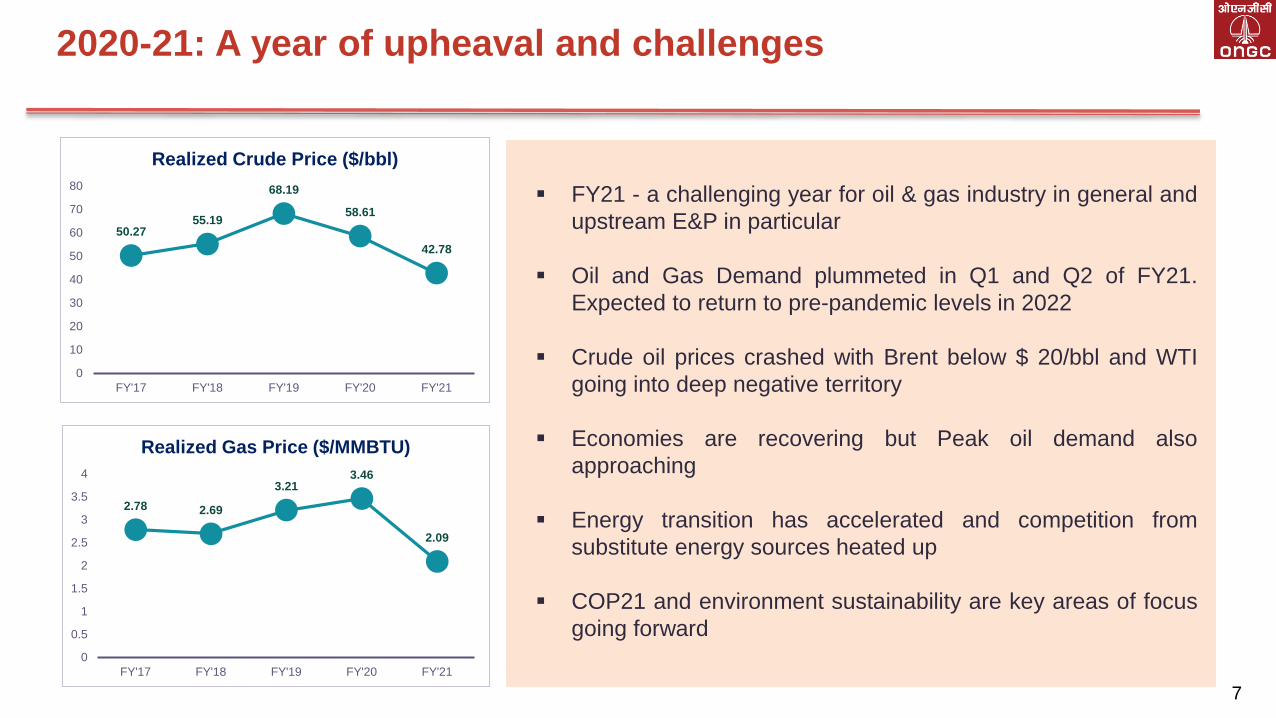
2020-21: A year of upheaval and challenges
7
50.2755.19
68.19
58.61
42.78
0
10
20
30
40
50
60
70
80
FY'17 FY'18 FY'19 FY'20 FY'21
Realized Crude Price ($/bbl)
2.78 2.69
3.213.46
2.09
0
0.5
1
1.5
2
2.5
3
3.5
4
FY'17 FY'18 FY'19 FY'20 FY'21
Realized Gas Price ($/MMBTU)
FY21 - a challenging year for oil & gas industry in general and
upstream E&P in particular
Oil and Gas Demand plummeted in Q1 and Q2 of FY21.
Expected to return to pre-pandemic levels in 2022
Crude oil prices crashed with Brent below $ 20/bbl and WTI
going into deep negative territory
Economies are recovering but Peak oil demand also
approaching
Energy transition has accelerated and competition from
substitute energy sources heated up
COP21 and environment sustainability are key areas of focus
going forward

Innovative solutions to combat, continue & grow…
8
Ensuring continuity and sustainability of operations for uninterrupted
availability of oil and gas to the nation
Safeguarding ‘People, Material and Resources’ through early
implementation of COVID appropriate protocols
Every employee served as an Energy Soldier and committed
beyond their mandate to ensure that organization and nation wins
Quantum leap in use of Digital Technologies for enhancing efficiency
and productivity through up-gradation of ERP, setting up Digital
Centre of Excellence, etc.
Innovative solutions like ‘Operation Nishtha’ conceptualized and
executed for crew change (~4,500) in Offshore & Onshore locations
Accelerated exploration and monetization of discoveries to upgrade
Basins and bring additional Basins under production
Significant thrusts and investments made by ONGC Group in new
energy sources like hydrogen, geothermal, solar, bio-fuels, etc.

ONGC Group: Resilient Performance in FY’21
2P Reserves Oil & Gas Production
Refinery Throughput Financials
9
1229.56
MMTOE
• Estimated 2P O+OEG Reserves
on PRMS basis (excluding 2C
Reserves of ~553 MMTOE)
• ONGC : 720.57 MMTOE
JV Share : 18.52 MMTOE
OVL : 490.47 MMTOE
27.92
MMT
• HPCL & MRPL refinery
throughputs stood at
16.42 MMT and 11.50 MMT
respectively
58.39
MMTOE
• Oil & gas production of
Group, including PSC-JVs
and from overseas Assets
• ONGC contributed 76.7% to
India’s Oil & Gas Production
(including JV’s share)
₹3,60,572
CRORE
• Revenue from Operations of
₹ 3,60,572 crore
• Profit after Tax of
₹ 21,343 crore

ONGC: Significant Petchem Presence
10
0
100
200
300
400
500
600
700
800
900
FY'18 FY'19 FY'20 FY'21
Paraxylene
0
50
100
150
200
250
300
350
FY'18 FY'19 FY'20 FY'21
Benzene
0
50
100
150
200
250
300
350
400
450
500
FY'18 FY'19 FY'20 FY'21
HDPE
0
100
200
300
400
500
600
FY'18 FY'19 FY'20 FY'21
LLDPE
0
100
200
300
400
500
600
700
800
FY'18 FY'19 FY'20 FY'21
PP
In ‘0
00
To
ns
2nd Rank 2nd Rank 3rd Rank 2nd Rank 3rd Rank
Ranking in India

Integrated Energy Company: Strong International Credit Ratings
11
Transformation of ONGC from an upstream oil & gas company into an integrated
energy company:
Diversification across value chain reducing earnings volatility and increasing
financial strength
Reflected in credit ratings
ONGC and OVL’s existing USD bonds now benefit from ratings by all three major
rating agencies:
Fitch rating also initiated for existing USD Notes of ONGC/OVL/OVVL
SACP by S&P as well as Fitch: bbb+
Accorded rating and outlook constrained by sovereign credit rating (Baa3/BBB-)
Negative outlook assigned by Moody’s and Fitch reflects that of the sovereign

Robust consolidated performance amid the pandemic
Parameter FY ’20
(₹ Cr)
FY’21
(₹ Cr)
Total Income
(Revenue + Other Income)
4,34,038 3,69,895
EBITDA 61,182 58,789
PAT 11,456 21,343
Total Debt 1,16,302 1,19,061
Total Equity (includes minority interest) 2,23,510 2,42,597
Total Capitalisation 3,39,813 3,61,658
Debt / Total capitalisation 34.2% 32.9%
Debt/EBITDA 1.9X 2.0X
12
ONGC - Standalone
13

Oil and Natural Gas Corp Ltd (ONGC)An integrated energy company operating along the hydrocarbon value chain
14
- 8th producing Basin of India (Bengal Basin) dedicated to the nation
- 10 new discoveries; 12 discoveries monetized, including 2 made during year
- Bagged 7 blocks in OALP V bidding rounds out of 11 blocks on offer
- 480 wells (100 Exploratory & 380 Development) drilled despite logistic challenges due to pandemic
- Drilling Non Productive Time (NPT) reduced to 11.9 % from 13.2 %
- Standalone O+OEG production of 45.35 Mmtoe
- Onshore oil production increased by 3.4% during last 5 years
- Value Added Products (VAP) production of 3.12 MMT
- 3 major projects costing around ₹ 3,720 Crore completed.
- Redevelopment of Nandasan Field (Onshore): Investment approval ₹ 445 Cr
- India’s maiden Geothermal Field Development Project in Ladakh taken up
- Acquired 5% equity in Indian Gas Exchange Ltd (IGX)
- MOU signed with NTPC to set up Joint Venture for Renewable Energy Business
- ONGC Board approved creation of wholly owned subsidiary for Gas & LNG business
Exploration
Drilling
Production
Projects
Beyond E&P
FY’21
Highlights

ONGC: Physical Performance
2P Reserves (MMTOE)ONGC migrated its reporting of reserves to PRMS w.e.f. 01.04.2019
Drilling (Number of wells)
Standalone Oil and Gas Production (incl. JV) Value Added Products Production
48.80 48.84 50.04 48.25
0
1000
2000
3000
4000
FY'17 FY'18 FY'19 FY'20 FY'21Naptha SKO HSD LPG C2-C3 Others*
3,235 3,3863,641 3,548
516503501 500
100 119 105 106 100
401 384 411 394 380
0
100
200
300
400
500
600
FY'17 FY'18 FY'19 FY'20 FY'21
Exploratory Development
15
480
45.353,120
25.53 24.23 24.23 23.35 22.53
23.27 24.61 25.81 24.90 22.82
0
10
20
30
40
50
60
FY'17 FY'18 FY'19 FY'20 FY'21
Oil (MMT) Gas (BCM)
464.62 459.22344.80 344.96 326.20
630.83 677.51
402.87 406.76 394.37
0.00
400.00
800.00
1200.00
FY'17 FY'18 FY'19 FY'20 FY'21
Oil Gas
As on 01.04.2021, Total 2P Reserves : 720.57 ; 2P CR : 447.93
1136.73
747.67 751.72 720.57
1095.45

ONGC : Standalone Financial Performance
Gross Revenue (₹ Crore) PAT (₹ Crore)
77,908
85,004
109,655
96,214
68,141
FY'17 FY'18 FY'19 FY'20 FY'21
16
17,900
19,945
26,765
13,464
11,246
FY'17 FY'18 FY'19 FY'20 FY'21
Net profit impacted due to low oil & gas prices and impairment considering future outlook on prices

ONGC: Growth Pursuits
Intensify exploration, monetize discoveries & maximize recovery from existing fields
17
Major Projects
KG-DWN-98/2 Cluster –II Development
Development of R-Series Fields including Revival of R-12 (Ratna)
Cluster-8 Marginal Fields (WO 24-3, D-30 and B-192) development
Development of Madanam NELP-IV Block CY-ONN-2002/2
Mumbai High South Redevelopment Phase-IV
Mumbai High North Redevelopment Phase-IV
Heera Re-development Phase-III
Redevelopment of Nandasan Field
Redevelopment of Santhal Field
Aggressive Investment in
Upstream
• E&P expenditure of about ₹ 1,50,000
Crore in last 5 years
16 Major Projects (> ₹ 100 Crore)
under execution
• 10 Development & 6 Infrastructure
Projects: Investment of ~ ₹ 61,000 Cr
• Envisaged lifecycle Gain of 112
MMTOE

ONGC: Short Term Action Plan
Oil Production Projections Gas Production Projections
18#Upside includes Concept-1, Concept-2, Indicative & YTF * Additional resources & CAPEX will be expended based on the feasibility of early exploitation $ JV figure as provided by operator/ DGH
0
5
10
15
20
25
30
FY'22 FY'23 FY'24 FY'25
JV$ Production (ONGC Share)Quoted Incremental profiles in 6 CA under 64 MNFThrough Additional PS Conversion*, Contingent Resources to Reserves conversion* & New DiscoveriesWith Additional InputsOil- Upside# Oil- FirmOil- Base
22.81
20.41
25.26 27.06 27.35
in M
MT
0
5
10
15
20
25
30
35
40
FY'22 FY'23 FY'24 FY'25
JV$ Production (ONGC Share)
Quoted Incremental profiles in 6 CA under 64 MNF
Through Additional PS Conversion*, Contingent Resources to Reserves conversion* & New Discoveries
With Additional Inputs
Gas-Upside#
Gas- Firm
Gas-Base
24.79
27.36
23.90
34.35
32.16
26.37
33.46
35.76
in B
CM
22.3324.01 23.35

Subsidiaries & Joint Ventures
19

ONGC Videsh
Presence across 35 projects in 15 countries*
20
Exploration: 14 Development: 4 Producing: 14 Pipeline: 3
Libya 1
South Sudan 2
Mozambique 1
Venezuela 1 1
Colombia 6 1
Brazil 1 1
Syria 1 1
Iraq 1
Iran 1
UAE 1
Middle East
Latin America
Africa
Vietnam 1 1
Myanmar 2 2 2
Bangladesh 2
South East Asia
Azerba
ijan
1 1
Russia 3
CIS & Russia
*As on 01.04.21

ONGC Videsh: Performance
2P Reserves (MMTOE) Oil and Gas Production
Turnover (₹ Crore) PAT (₹ Crore)
21
14.8314.16 14.9813.04
* PRMS adopted from FY’21; 2P-490, 2C 105
10,418
14,632 15,498
11,956
FY'18 FY'19 FY'20 FY'21
981
1,682
454
1,891
FY'18 FY'19 FY'20 FY'21
9.35 10.10 9.75 8.51
4.81 4.73 5.234.53
FY'18 FY'19 FY'20 FY'21
Oil (MMT) Gas (BCM)
332.61 340.36238.99 190.46
378.75 335.36
347.915300.01
FY'18 FY'19 FY'20 FY'21
Oil (MMT) Gas (BCM)
711 676587
490*
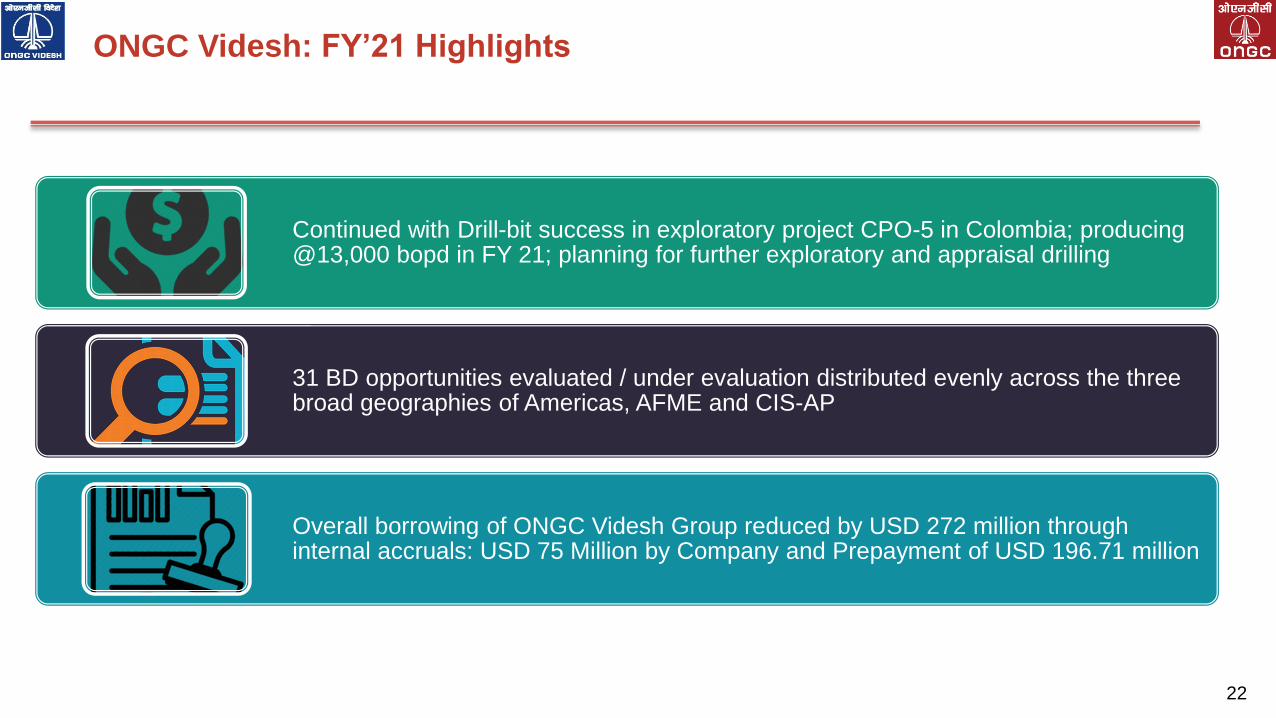
ONGC Videsh: FY’21 Highlights
22
Continued with Drill-bit success in exploratory project CPO-5 in Colombia; producing @13,000 bopd in FY 21; planning for further exploratory and appraisal drilling
31 BD opportunities evaluated / under evaluation distributed evenly across the three broad geographies of Americas, AFME and CIS-AP
Overall borrowing of ONGC Videsh Group reduced by USD 272 million through internal accruals: USD 75 Million by Company and Prepayment of USD 196.71 million

Hindustan Petroleum Corporation Ltd. (HPCL)A Maharatna Schedule “A” CPSE
23
• 18,634 retail outlets, # 1 Lube Marketer & # 2 LPG marketer of India
• Share Buy-back program successfully completed; 10.52 Crore
Equity Shares bought back utilizing ₹ 2954 Crore
• Acquired balance 50% stake of M/s SP Ports Pvt. Ltd. in JV
Company HPCL Shapoorji Energy Pvt Ltd ( HSEPL). Construction
work for Chhara LNG regasification terminal in full swing
• Commissioned 2,158 new retail outlets, highest ever in a year, 112
new LPG distributorships, CNG dispensing facilities at 203 retail
outlets, EV Charging facilities: 84 and Mobile Dispensers: 387
• 44 patents for new products/ technologies developed
• 51st LPG bottling plant at Rayagada in Odisha with 60 TMTPA
capacity commissioned. augmented capacity by ~ 270 TMTPA at
other plants
Ambitious plans for expansion and diversificationin tandem with increasing energy demand, technological upgradation and environment management

HPCL: Performance
Throughput (MMT) GRM ($/BBL)
Gross Sales (₹ Crore) PAT (₹ Crore)
24
18.44 17.18 16.42
FY'19 FY'20 FY'21
6,029
2,637
10,664
FY'19 FY'20 FY'21
295,713 286,250269,243
FY'19 FY'20 FY'21
38.7 MMT 39.6 MMT 36.6 MMT
5.01
1.02
3.86
FY'19 FY'20 FY'21

HPCL: Growth Pursuits
Chartering growth for stakeholders
25
Major projects in progress:
• Visakh Refinery Modernization Project (VRMP)
• Mumbai Refinery Expansion Project (MREP)
• Wind Power Project under Phase – II
• VVSPL Capacity Expansion and OSTT-SS Jetty Sub-sea Pipeline Project
• MDPL Capacity Expansion & Palanpur Vadodara Pipeline Extension Project
• Greenfield Refinery cum Petrochemical Complex at Pachpadra, Barmer District,
Rajasthan (9 MMTPA capacity) through a joint venture company, HPCL Rajasthan
Refinery Limited (HRRL)
• 5 LPG Bottling Plants
• CGD Network and LNG Regasification Terminal

Mangalore Refinery & Petrochemicals Ltd. (MRPL)A Category 1 Miniratna CPSE
26
• Acquired shares in OMPL held by ONGC, thereby making OMPL, a wholly owned subsidiary of MRPL
• Board has approved the merger of MRPL and OMPL
• 11 new Retail Outlets commissioned. With this, MRPL has 18 operating outlets
• Implementation of the project to set up marketing terminal in Devangounti (near Bengaluru) is underway
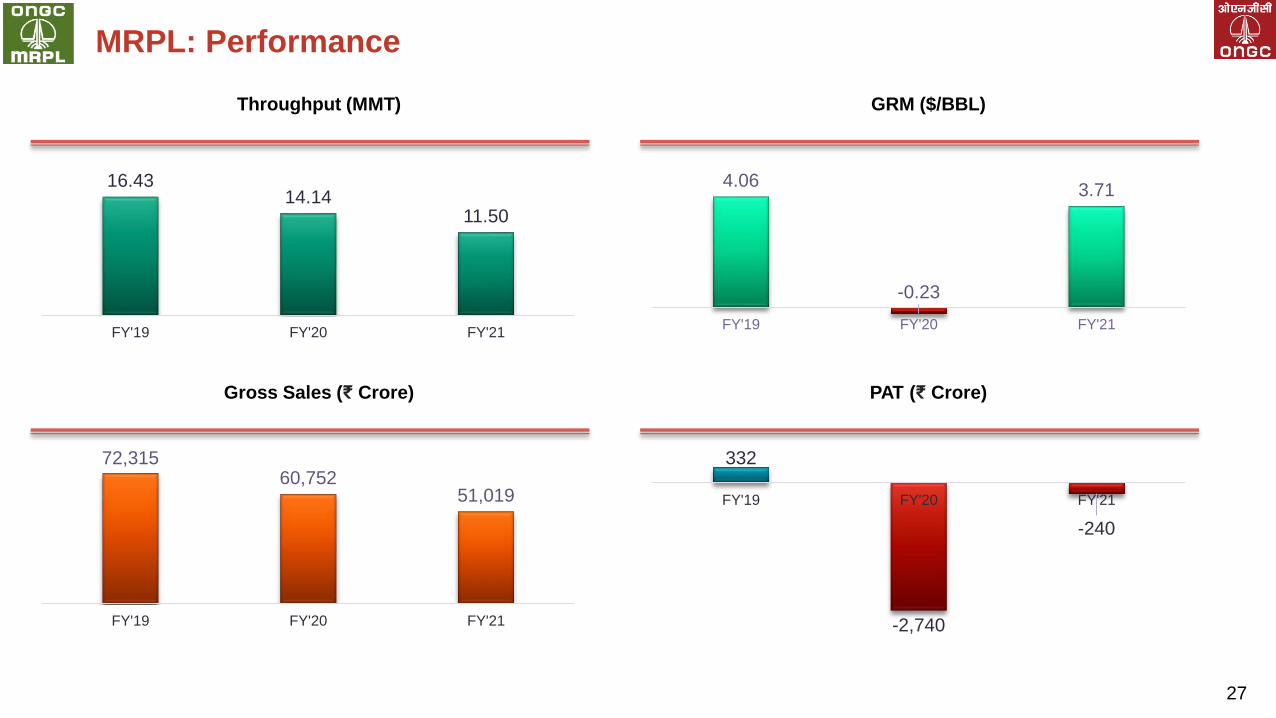
MRPL: Performance
Throughput (MMT) GRM ($/BBL)
Gross Sales (₹ Crore) PAT (₹ Crore)
27
16.4314.14
11.50
FY'19 FY'20 FY'21
72,31560,752
51,019
FY'19 FY'20 FY'21
332
-2,740
-240
FY'19 FY'20 FY'21
4.06
-0.23
3.71
FY'19 FY'20 FY'21

MRPL: Growth Pursuits
Multiple New initiatives to improve
revenue from marketing margins
• Domestic sales of petroleum
products increased by entering into
new agreements with OMCs
• To capture retail margins, MRPL is
focused on setting up and
expediting own retail outlets
Major projects
1. BS VI quality specifications for MS and HSD: Includes new
units - FGTU (FCC Gasoline Treatment Unit) and SRU (Sulphur
Recovery Unit) and its associated offsite and utilities
2. Desalination Plant of 30 MLD: To reduce dependence on river
water
3. Railway Siding: Dispatch of Petcoke by Railway Wagons
4. CCR-1 Revamp
6. Natural Gas conversion in Gas Turbine-1
28

ONGC Mangalore Petrochemicals Ltd. (OMPL) Aromatic Petrochemical Complex producing Paraxylene & Benzene
29
• Now a wholly owned subsidiary of MRPL
• Overall capacity utilisation for FY’21 was 63%.
• New intermediate product of 152 KT Reformate added to
revenue
• Commenced sale of Benzene in the domestic market since
Oct 2020 through gantry loading facility
• Commissioned energy savings scheme of 850kW through
conversion of motor driven Boiler Feed Water (BFW) Pump
to Turbine driven BFW Pump
• Commissioned Natural Gas facility in Feb 2021 replacing
HSD in both gas Turbines and all liquid fuels in the Complex

ONGC Petro Additions Ltd. (OPaL)A Joint venture with GAIL & GSPC
30
One of the Largest Dual Feed Crackers in the world
1.1 MMTPA Feedstock integration project of ONGC (Utilizing C2, C3 and C4 gas feed and Naphtha produced by ONGC)
• Overall capacity utilisation during FY’21 was 89.5%.
• Introduced PP Fibre & Filament grade "OPaLene RH38"
for mask/PPE kits application during the beginning of
the pandemic
• Commissioned Hydrogen generation unit
• Sold 1.82 Million tons of Polymers and Chemicals
• Revenue from Operation: ₹ 11,486 Crore
Q4-FY’21 PAT : ₹ 274.1 Crore ; Strong performance continues in FY’22

Only dividend paying standalone gas based power generation company in India
ONGC Tripura Power Company Ltd. (OTPC) A Joint venture with Govt. of Tripura
31
726.6 MW (363.3x2) Combined Cycle Gas Turbine (CCGT) Thermal Power Plant
• 5,090 Million Units of power generated
• Plant Availability Factor at 81%
• Revenue from Operation: ₹ 1,646 Crore; PAT: ₹ 221 crore
• Major Job of GTG rotor replacement carried out on Unit-
2 through planned shutdown from 16th Mar-22nd Apr 2021
• Major inspection of Unit -1 in progress

Petronet MHB Limited (PMHBL)
32
FY’21 performance:
Throughput 2.139 MMTPA
Revenue: ₹ 111 Crore
PAT: ₹ 52 Crore
Mangalore – Hassan – Bengaluru JV pipeline (362.3 Km) transporting products from MRPL to OMCs hinterland of Karnataka in cost effective and environment friendly manner.

Indradhanush Gas Grid Limited (IGGL)A Joint venture with IOCL, GAIL, OIL & NRL :-Shareholding: ONGC-20%; IOCL-20%; GAIL-20%; OIL-20%; NRL-20%
33
Indradhanush Gas Grid Limited (IGGL) was incorporated on
10th August 2018
IGGL is implementing prestigious Northeast Gas Grid
(NEGG), an approx. 1,656 Km long natural gas pipeline grid
spanning across all North-Eastern states, at an estimated cost
of INR 9,265 crores
CCEA, chaired by Hon’ble Prime Minister, has approved VGF/
Capital Grant of INR 5,559 Crore for NEGG project
The gas grid is planned to connect from upcoming Barauni-
Guwahati natural gas pipeline as part of Urja-Ganga scheme
3-phase implementation with expected completion by 2024:
Phase-1: 647 kms (in 5 sections)
Phase-2: 621 kms (in 7 sections)
Phase-3: 304 kmd (in 2 sections)
Physical progress of project is ~18%

Long Term Growth Strategy
34

ONGC Portfolio - 2040As laid out in ONGC Energy Strategy 2040
ONGC
Vision
2040
Upstream:
Domestic
Upstream:
International
Downstream &
PetrochemicalsRenewables New Frontiers
Production (mmtoe/year)
Production(mmtoe/year)
Refining Capacity (MMTPA / year)
Capacity (GW) Venture fund corpus ($M)
50
70
0
10
20
30
40
50
60
70
80
2019 2040
15
40
0
5
10
15
20
25
30
35
40
45
2019 2040
35
100
0
20
40
60
80
100
120
2019 2040
0.2
10
0
2
4
6
8
10
12
2019 2040
16
1000
0
200
400
600
800
1000
1200
2019 2040
Upstream Production 2x; refining capacity 3x; renewable 10 GW and $1B corpus for new
frontier opportunities
35

ONGC: ESG JourneySustainable Development – The overarching working template in ONGC
36
Pillars of Sustainability in ONGC
• Dedicated Carbon
Management & Sustainability
Group at Corporate level with
designated Sustainable
Development Officers at work
centres to drive sustainability
across the organization
• GRI based, Independently
assured Sustainability Report
being published since FY’10

ONGC: ESG PracticesCommitment towards Climate, Society and Ethical work practices
37
• Regular Greenhouse Gas (GHG) inventory
accounting and disclosures on scope-1
and scope-2 emissions; Implemented large
number of GHG mitigation projects across
the value chain for GHG abatement
• Implemented 15 Clean Development
Mechanism (CDM) Projects including
OTPC: 2.2 million Certified Emission
Reductions with OTPC having emission
reduction potential of 16 lakh ton CO2e per
annum. 3 new projects under validation.
• Renewable energy projects, Installation of
energy efficient lighting, Paperless office
and elimination of single use plastics
• Fresh water conservation: Water
Footprinting, Rainwater Harvesting,
Sewage Treatment Plants & Desalination
ENVIRONMENT
Committed for conserving Climate
• 1st signatory in India to the Integrity Pact
• IT enabled with SAP integration in most
functions, including e-procurement,
intranet, paperless office etc; thus,
minimizing human intervention
• The Board not only institutionalizes, and
reviews polices, but also focuses on
overall organizational practices, awareness
creation and monitoring.
• Strong and effective Whistle Blower
mechanism, Dedicated Vigilance
Department headed by CVO, who holds
rank of Functional Director and reports to
CVC, Government of India
GOVERNANCE
Committed to Integrity and ethical practices
• One of the first companies to issue
separate CSR Guidelines in 2009 which
prepared base for DPE Guidelines in 2010
& Companies Act 2013
• CSR activities aligned with needs of
community in respective geographies:
Initiatives implemented in project mode.
• CSR programs mainly in areas of
Healthcare, Education, Environment,
Women Empowerment and Heritage
preservation
• Every CSR project is Benchmarked to UN
Sustainable Development Goals (SDGs).
• CSR spend of ~ ₹ 500 Crore per year
SOCIAL
Committed to Social welfare & inclusion

Global Methane Initiative (GMI):
• Global Methane Initiative (GMI) is an action-oriented initiative from United States Environmental Protection Agency (US-
EPA). ONGC was first non-American Oil & Gas company to enter into MoU. Under this program, fugitive methane
emissions are identified through Hi-tech IR Camera and corrective actions taken to repair leakages/emissions. Till date
could prevent approximately 20.48 MMSCM of methane gas leakages into atmosphere with environmental benefit of
approximately 3,06,250 ton CO2 Equivalent (TCO2e)
Introduction of Dynamic Gas Blending technology in large Diesel Engines:
• The results shows that it replaced HSD consumption up to 50%, fuel cost up to 70% and reduced SO2, NO2 and PM
emissions by 49%, 28% and 78% respectively, apart from Carbon Emissions
Introduction of Micro Turbine technology for power generation at remote locations of ONGC:
• Micro-turbines are small gas turbines of capacity from 25 KW to 500 KW, used for stationary power generation. These
use low pressure gas, for power generation, which would otherwise be flared
Carbon Capture, Utilisation and Storage (CCUS) for CO2 Sequestration:
• ONGC signed an MoU with IOCL for a proposed CCSU project. Under this MOU, it is proposed to capture CO2 from the
IOCL’s Koyali refinery and inject into specially prepared well(s) in depleted oil fields of ONGC in Gandhar, Ankleshwar
Asset for Enhanced Oil Recovery from depleted fields. The project has the potential for oil gain of 10% and the estimated
cumulative sequestrated quantity is 5 to 6 million ton of CO2 by the year 2040
ESG: Other Ongoing Initiatives
38

0.234
0.230
0.228
2018-19 2019-20 2020-21
ESG : Status & Work PlanReducing Carbon Footprints and planning for Greener Future
39
Emis
sio
n In
ten
sity
(TC
O2
e/T
on
of
O+O
EG)
~ 12% Cut in Emission Intensity since 2015-16
• Verification of Scope-1 & Scope-2 emissions
through Independent Assurer
• Accounting of Scope-3 emissions and strategies
for Net Zero emission
• Launching of Integrated Report of ONGC in place
of Annual Report from FY’22 onwards
• Business Responsibility & Sustainability Report
(BR&SR) from FY’22 as per revised guidelines
• Engaging leading ESG Rating agency
• Formulation of Human Rights Policy in line with UN
Principles of Human Rights
• Greening of Vendor Chain
• GRI based ESG report introduced from FY’20
40
ONGC: Catalysing SDG Initiatives in India
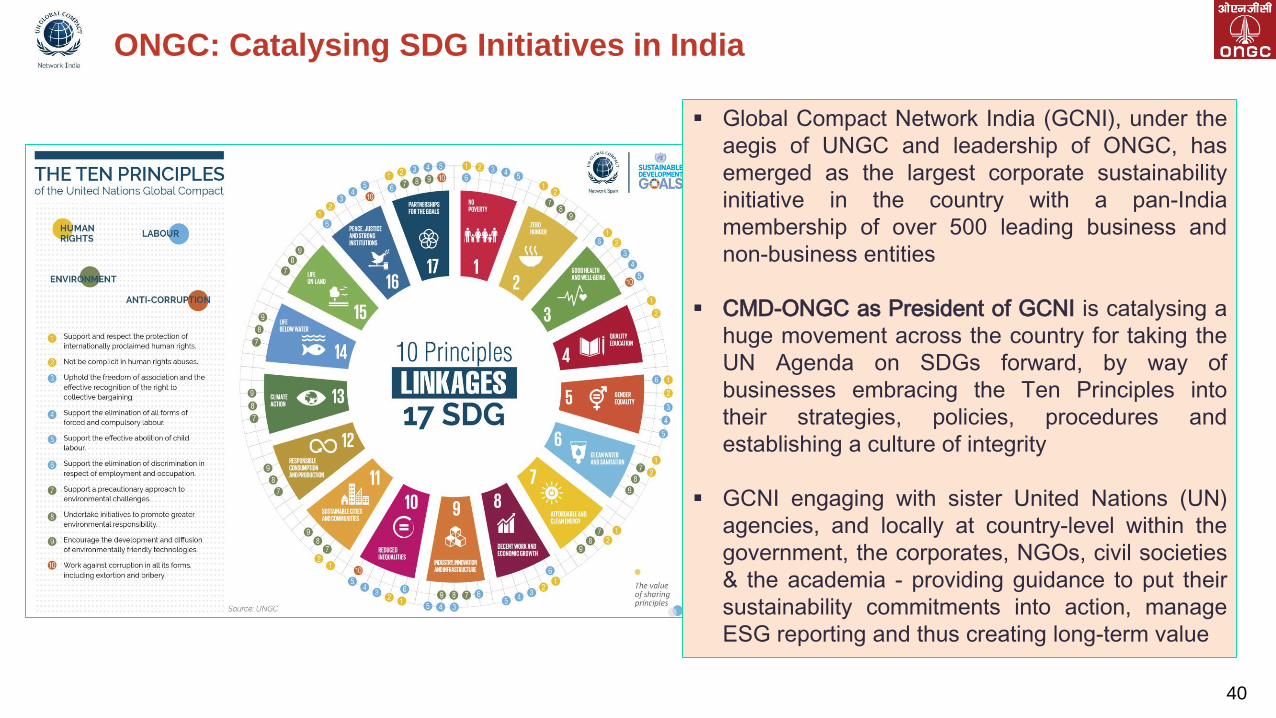
Global Compact Network India (GCNI), under the
aegis of UNGC and leadership of ONGC, has
emerged as the largest corporate sustainability
initiative in the country with a pan-India
membership of over 500 leading business and
non-business entities
CMD-ONGC as President of GCNI is catalysing a
huge movement across the country for taking the
UN Agenda on SDGs forward, by way of
businesses embracing the Ten Principles into
their strategies, policies, procedures and
establishing a culture of integrity
GCNI engaging with sister United Nations (UN)
agencies, and locally at country-level within the
government, the corporates, NGOs, civil societies
& the academia - providing guidance to put their
sustainability commitments into action, manage
ESG reporting and thus creating long-term value

ONGC Group: Transitioning to Clean Energy…
41
Setting up of wholly owned subsidiary for Gas Business approved by ONGC Board
ONGC acquired 5% equity in Indian Gas Exchange Ltd (IGX)
HPCL expands CGD business to 20 GAs in 34 districts across 9 states
HPCL has 84 EV Charging Stations. Plans to setup pan-India network of public EV charging points at retail outlets

42
A Responsible Corporate

Response to COVID-19Proactive all-inclusive response to protect People-Material-Resources and ensure continuity of oil and gas production for nation
43
Multi-layered, complex and evolving challenges on a daily basis –a situation that is unprecedented for our times
ONGC RESPONSE

COVID-19: Contribution towards Society
44
ONGC donated ₹ 300 crore to PM CARES Fund & voluntary employee contribution ~ ₹ 30 crore
CSR initiatives worth ₹ 30 Crore in FY 2020-21 and ₹ 50 Crore in FY 2021-22 for the benefit of 45
lakh people in the operational areas
Funding for Covid care Centres, creation of ICU beds, ventilators, Distribution of Food / Ration
kits / Masks / PPE kits / Sanitizers
Procurement of one lakh oxygen concentrators on behalf of Government of India out of PM
Cares Fund of ₹ 500 Cr
Procurement of 10,000 oxygen concentrators worth ₹ 65 Cr out of CSR funds of Oil PSEs.
ONGC’s contribution for 2,000 oxygen concentrators worth ₹ 13 Cr.
Medical grade oxygen generation plants in 11 government hospitals in 4 states of India at a cost
of ₹ 15.69 Cr
Provisioning of 6,000 oxygen cylinders worth ₹ 10.86 Cr
Vaccination camps at various work locations across the country for employees and secondary
workforce; Supported COVID vaccine logistics supply chain equipment in Tripura, Nagaland, Gujarat
and Uttarakhand
Setting up COVID Centers and support for conversion of oxygenated beds to ICU beds
44

CSR Expenditure ~ ₹ 500 Crore every year
ONGC promotes healthcare, preventive healthcare, education & skill development,
women empowerment& reducing inequality , environment sustainability initiatives
Corporate Social ResponsibilityA leader in CSR Spending
45
526 503
615 607553
0
175
350
525
700
FY'17 FY'18 FY'19 FY'20 FY'21
CSR Spend (₹ Crore)
Includes ₹ 14 crores carried forward in FY’21

Rankings & AwardsNational and International Recognitions
#11 in Platts Top 250 Global Energy Company
Rankings 2020
# 190 globally and # 3 in India in Fortune Global 500 List 2020
# 665 globally and # 13 in India in Forbes Global 2000 list 2021
PCRA- Best Overall Performance for Upstream Sector -2020
FIPI Oil & Gas – Best Project Management Company of the Year 2020
46
#377 in Forbes Worlds, Best Employers List 2020
Certified as a Great Place to Work for the second
time in 2021

Thank You
47