Investor Presentation - Royal Unibrew
18
Investor Presentation September 2012
-
Upload
khangminh22 -
Category
Documents
-
view
1 -
download
0
Transcript of Investor Presentation - Royal Unibrew

Investor Presentation
September 2012
PAGE 2ROYAL UNIBREW / INTERIM REPORT 1 JANUARY – 30 June 2012
Royal Unibrew is a regional player in the beer, malt and soft drinks markets with leading positions in the markets and segments in which it operates
Royal Unibrew
Western Europe Eastern Europe Malt Drinks
Denmark• Second largest supplier
of beer and soft drinks• Strong international,
national and regional brands
Italy• Market leader in super
premium beer segment
Germany• Niche player in
Germany
Lithuania• Second largest brewery• Strong beer and soft
drinks positions
Latvia• Market leader in fruit
juices and soft drinks• Third largest in beer
Estonia• Newly entry with small
sales organisation
AmericasExport and license business (Vitamalt and Faxe Royal)
Africa• Export and license
business (primarily Vitamalt and Powermalt) and Royal Faxe beer
Europe• Export (primarily
Supermalt)
Associates
25% Hansa Borg Brewery, Norway
20% Van Pur S.A., Poland
32% Nuuk Imeq, Nuuk, Greenland
ROYAL UNIBREW A/S – INVESTOR PRESENTATION

PAGE 3ROYAL UNIBREW / INTERIM REPORT 1 JANUARY – 30 June 2012
Key brands - Western Europe
Super premium
Premium
Mainstream
Lower mainstream
Alcoholic Non-alcoholic
ROYAL UNIBREW A/S – INVESTOR PRESENTATION

PAGE 4ROYAL UNIBREW / INTERIM REPORT 1 JANUARY – 30 June 2012
Key brands - Eastern Europe
Super premium
Premium
Mainstream
Lowermainstream
Alcoholic Non-alcoholic
ROYAL UNIBREW A/S – INVESTOR PRESENTATION

PAGE 5ROYAL UNIBREW / INTERIM REPORT 1 JANUARY – 30 June 2012
Key brands - Malt Drinks
Super premium
Premium
Mainstream
Alcoholic Non-alcoholic
Lower mainstream
ROYAL UNIBREW A/S – INVESTOR PRESENTATION

PAGE 6ROYAL UNIBREW / INTERIM REPORT 1 JANUARY – 30 June 2012
Largest shareholders
• Chr. Augustinus Fabrikker A/S – 10.4%
• ATP – 5.0%
• Skagen – 8.7%
• Approx 17,000 shareholders in total
ROYAL UNIBREW A/S – INVESTOR PRESENTATION

PAGE 7ROYAL UNIBREW / INTERIM REPORT 1 JANUARY – 30 June 2012
• Organic net revenue increase of 3%
• Commercial focus pays off
• EBIT increase of DKK 9%
• Strong free cash flow, above LY
• 2012 outlook confirmed
• Extraordinary distribution program of DKK 500m to the shareholders during the coming years, starting 2012
• Share buy-back program increased to DKK 210m
Satisfactory first half of 2012 – in line with expectations
ROYAL UNIBREW A/S – INVESTOR PRESENTATION

PAGE 8ROYAL UNIBREW / INTERIM REPORT 1 JANUARY – 30 June 2012
Margin: 15.4% 16.0%
Margin: 11.4% 12.4%
Organic EBIT increase of 9% to DKK 216m
• Gross margin increased 40bp to 50.9%
• Organic EBITDA up by DKK 12m to DKK278m (H1 2011: DKK 268m)
• Organic EBIT up by DKK 18m to DKK 216m (H1 2011: DKK 198m)
• EBIT-margin increased 100bp to 12.4%
EBITDA DKKm
EBIT DKKm
268 266
278 -2
12
1H2011 Structural 1H2011Rebased
Organic 1H2012
198 198
216
0
18
1H2011 Structural 1H2011Rebased
Organic 1H2012
ROYAL UNIBREW A/S – INVESTOR PRESENTATION

PAGE 9ROYAL UNIBREW / INTERIM REPORT 1 JANUARY – 30 June 2012
EBIT & EBIT-margin up in Western Europe and Malt Beverages
Western Europe Eastern Europe Malt Beverages
11.3% 13.1% 14.3% 1.5% 8.4% 6.3% 12.5% 14.0% 18.1%
Margin
Net revenueEBIT
1,242 1.222 1,229
141 161 176
1H2010 1H2011 1H2012
440
339
291
729 18
1H2010 1H2011 1H2012
201 178
213
25 25 39
1H2010 1H2011 1H2012
ROYAL UNIBREW A/S – INVESTOR PRESENTATION

PAGE 10ROYAL UNIBREW / INTERIM REPORT 1 JANUARY – 30 June 2012
Aarhus site – 37,500 m2 building rights sold
• 37,500 m2 building rights sold for the VIA project
• Execution at carrying amount – no effect on P&L and equity
• Cash Flow effect of execution - DKK 110m
• The sale expected closed in September as planned
• Aarhus property totaling 140,000 m2
building rights
• Important milestone – potential catalyst for further development of the Aarhus property
ROYAL UNIBREW A/S – INVESTOR PRESENTATION
PAGE 11ROYAL UNIBREW / INTERIM REPORT 1 JANUARY – 30 June 2012
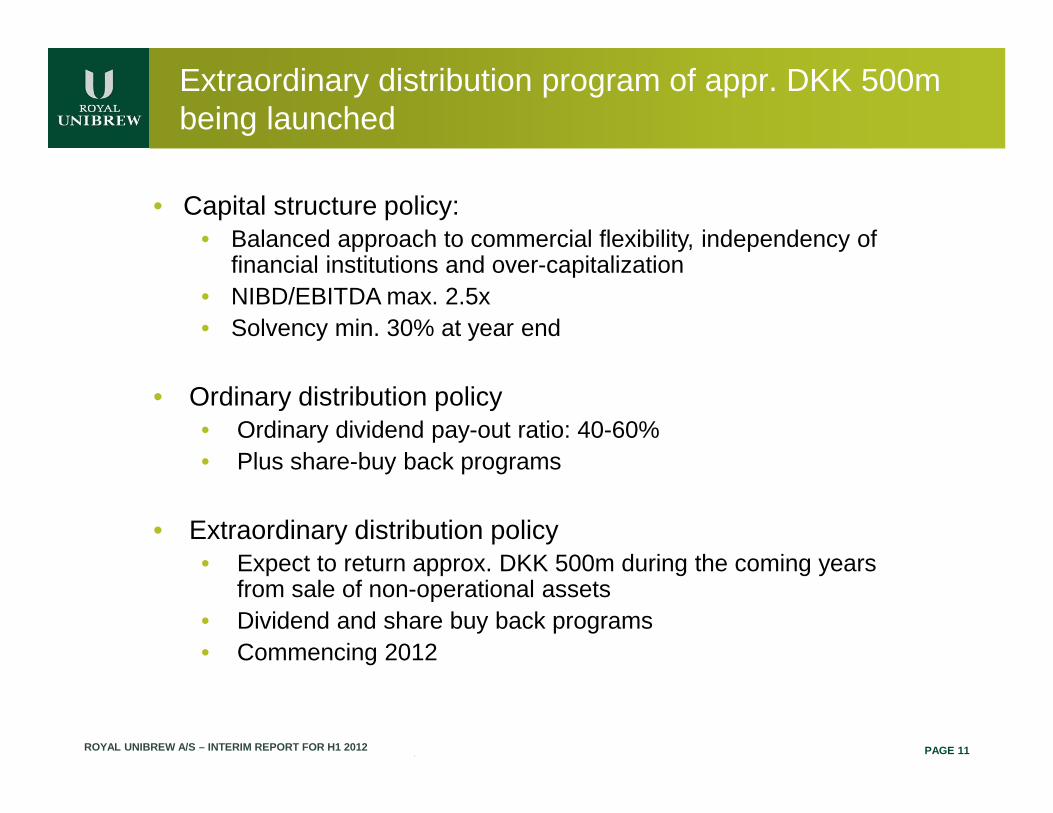
Extraordinary distribution program of appr. DKK 500m being launched
• Capital structure policy:• Balanced approach to commercial flexibility, independency of
financial institutions and over-capitalization• NIBD/EBITDA max. 2.5x• Solvency min. 30% at year end
• Ordinary distribution policy• Ordinary dividend pay-out ratio: 40-60%• Plus share-buy back programs
• Extraordinary distribution policy • Expect to return approx. DKK 500m during the coming years
from sale of non-operational assets• Dividend and share buy back programs• Commencing 2012
ROYAL UNIBREW A/S – INTERIM REPORT FOR H1 2012

PAGE 12ROYAL UNIBREW / INTERIM REPORT 1 JANUARY – 30 June 2012
Short term implications of the extraordinary distribution policy
• DKK 50m extraordinary dividend to be proposed to the AGM 2013 (DKK 4.75 per share)
• Share buy-back program of up to DKK 210m (previously DKK 125m) between AGM 2012 and AGM 2013, of which DKK 160m is ordinary and DKK 50m extraordinary
ROYAL UNIBREW A/S – INTERIM REPORT FOR H1 2012

PAGE 13ROYAL UNIBREW / INTERIM REPORT 1 JANUARY – 30 June 2012
Outlook for 2012 confirmed
DKKm Outlook 2012* 2011 Actual
Net revenue 3,375 – 3,500 3,431
EBITDA 580 – 630 601
EBIT 450 – 500 474
* In 2011 net revenue of DKK 50m, EBITDA of DKK 1m, and EBIT of DKK 0m was realized in Poland in the period not included in 2012
ROYAL UNIBREW A/S – INTERIM REPORT FOR H1 2012

PAGE 14ROYAL UNIBREW / INTERIM REPORT 1 JANUARY – 30 June 2012
Q & A
DISCLAIMER:This announcement contains “forward-looking statements”. Undue reliance should not be placed on forward-looking statements because they relate to and depend on circumstances that may or may not occur in the future and actual results may differ materially from those in forward-looking statements. Forward-looking statements include, without limitation, statements regarding our business, financial circumstances, strategy, results of operations, financing and other plans, objectives, assumptions, expectations, prospects, beliefs and other future events and prospects. We undertake no obligation, and do not intend to publicly update or revise any of these forward-looking statements, whether to reflect new information or future events or circumstances or otherwise.

PAGE 15ROYAL UNIBREW / INTERIM REPORT 1 JANUARY – 30 June 2012
Financial performance as expected
DKKm
P&L items: 1H2012 1H2011 % change
Net revenue 1.733 1.739 0%
Gross margin 50.9% 50,5% 1%
EBIT 216 198 9%
EBIT margin 12,4% 11,4% 9%
Profit before tax 210 180 16%
Consolidated profit 156 129 21%
Balance sheet items:
Net interest bearing debt 623 735 -15%
Net working capital -230 -138 -67%
Total assets 3.101 3.207 -3%
Equity 1.224 1.257 -3%
Solvency 39,5% 39,2% 1%
ROYAL UNIBREW A/S – INVESTOR PRESENTATION

PAGE 16ROYAL UNIBREW / INTERIM REPORT 1 JANUARY – 30 June 2012
Strong free cash flow performance
Cash flow - DKKm
1H2011: 268 -33 235 -12 -24 199
278
262271
-16
-5968
EBITDA Interest, tax,dividend received,
other non-cashitems
Cash fromoperations beforechanges in NWC
Changes in NWC Capex, net Free cash flow
ROYAL UNIBREW A/S – INVESTOR PRESENTATION

PAGE 17ROYAL UNIBREW / INTERIM REPORT 1 JANUARY – 30 June 2012
Appendix – Pro forma simulation 30.06.12 to highlight equity ratio effect of sale of non-operational items and extraordinary distribution
• Status 30.06.2012– Equity ratio 40%– NIBD/EBITDA 1x
• Simulation– Assuming DKK 500m in-flow from non-operational assets– Assuming DKK 500m extraordinary distribution
• Pro forma effect of simulation on 30.06.2012– Equity ratio 29%– NIBD/EBITDA 1x
ROYAL UNIBREW A/S – INVESTOR PRESENTATION

PAGE 18ROYAL UNIBREW / INTERIM REPORT 1 JANUARY – 30 June 2012
13.8%
10.5%
12.9%
9.4%
Royal Unibrew Peer 1 Peer 2 Peer 3
11.2%12.2%
6.2%
‐0.7%
Royal Unibrew Peer 1 Peer 2 Peer 3
18.4%
9.4%8.4%
10.7%
Royal Unibrew Peer 1 Peer 2 Peer 3
52%
34%
16%
80%
49%
Royal Unibrew Peer 1 Peer 2 Peer 3
Appendix - Solid full year 2011 performance vs. peers
EBIT margin (Comparable geography)
Return on invested capital
Free cash flow - % of revenue
Cash return to shareholders
Note: Where relevant, performance figures have been adjusted to eliminate differences caused by non-allocation of central costs
ROYAL UNIBREW A/S – INVESTOR PRESENTATION