Volkswagen Group
66
Volkswagen Group Frank Witter Chief Financial Officer US Roadshow with Goldman Sachs, New York & Boston, 30-31 October 2017
-
Upload
khangminh22 -
Category
Documents
-
view
0 -
download
0
Transcript of Volkswagen Group

Volkswagen GroupFrank WitterChief Financial Officer US Roadshow with Goldman Sachs, New York & Boston, 30-31 October 2017

Disclaimer
The following presentations contain forward-looking statements and information on the business development of the Volkswagen Group. These statements may be spoken or written and can be recognized by terms such as “expects”, “anticipates”, “intends”, “plans”, “believes”, “seeks”, “estimates”, “will” or words with similar meaning. These statements are based on assumptions relating to the development of the economies of individual countries, and in particular of the automotive industry, which we have made on the basis of the information available to us and which we consider to be realistic at the time of going to press. The estimates given involve a degree of risk, and the actual developments may differ from those forecast. The Volkswagen Group currently faces additional risks and uncertainty related to pending claims and investigations of Volkswagen Group members in a number of jurisdictions in connection with findings of irregularities relating to exhaust emissions from diesel engines in certain Volkswagen Group vehicles. The degree to which the Volkswagen Group may be negatively affected by these ongoing claims and investigations remains uncertain.
Consequently, a negative impact relating to ongoing claims or investigations, any unexpected fall in demand or economic stagnation in our key sales markets, such as in Western Europe (and especially Germany) or in the USA, Brazil or China, will have a corresponding impact on the development of our business. The same applies in the event of a significant shift in current exchange rates relative to the US dollar, sterling, yen, Brazilian real, Chinese renminbi and Czech koruna.
If any of these or other risks occur, or if the assumptions underlying any of these statements prove incorrect, the actual results may significantly differ from those expressed or implied by such statements.
We do not update forward-looking statements retrospectively. Such statements are valid on the date of publication and can be superseded.
This information does not constitute an offer to exchange or sell or an offer to exchange or buy any securities.
1) Figures excl. Volkswagen Commercial Vehicles, Scania and MAN Commercial Vehicles.3
Deliveries & Global Trends Key Financials & Cash Brands / RegionsStrategic Outlook &
Milestones Diesel Remuneration Integrity & Compliance Commitment
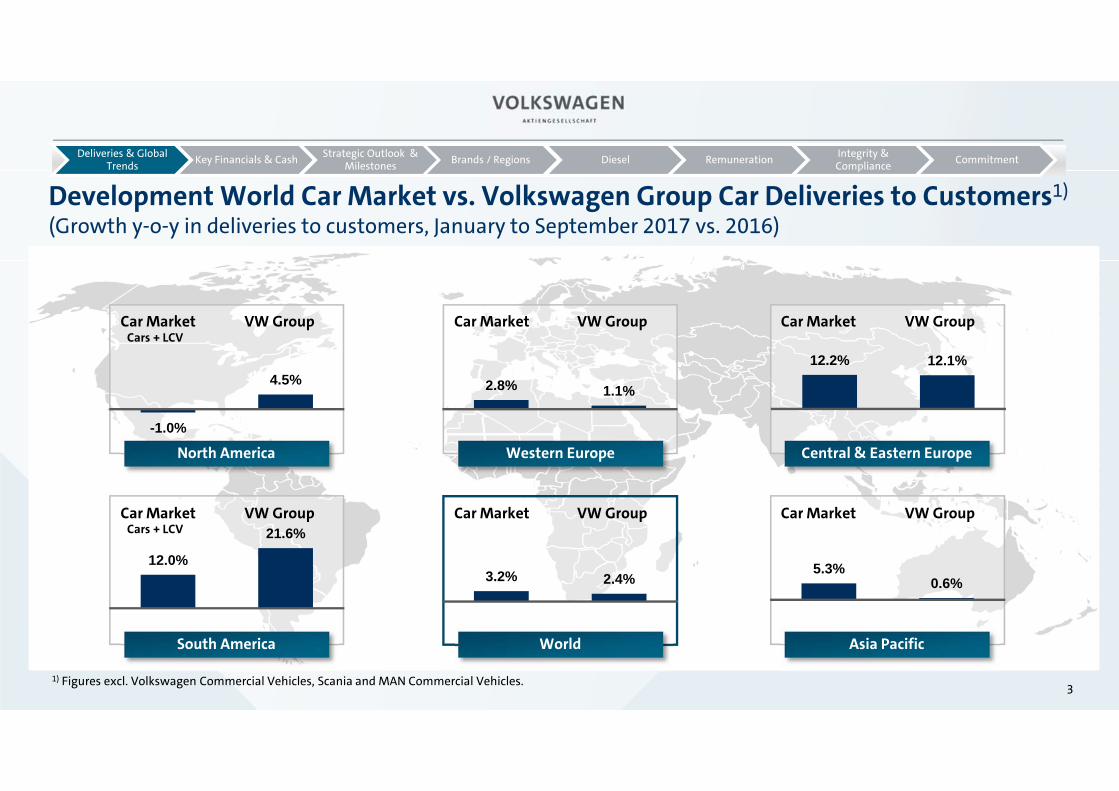
Development World Car Market vs. Volkswagen Group Car Deliveries to Customers1)
(Growth y-o-y in deliveries to customers, January to September 2017 vs. 2016) bf
World Asia PacificSouth America
Central & Eastern Europe
Car MarketCars + LCV
VW Group Car Market VW Group Car Market VW Group
Car Market VW Group Car Market VW Group Car Market VW Group
North America Western Europe
5.3%0.6%
2.8% 1.1%
-1.0%
4.5%
Cars + LCV
3.2% 2.4%12.0%
21.6%
12.2% 12.1%

Deliveries & Global Trends Key Financials & Cash Brands / RegionsStrategic Outlook &
Milestones Diesel Remuneration Integrity & Compliance Commitment
4
Volkswagen Group – Deliveries to Customers by Brands(January to September 2017 vs. 2016)
VolkswagenGroup
1) Incl. all brands of Volkswagen Group (Passenger Cars and Commercial Vehicles); +2.4% excl. Volkswagen Commercial Vehicles, Scania and MAN.2) MAN incl. MAN Latin America Trucks and Busses GVW > 5t
2)
7.609
4.375
1.409841
313 178 35174 59
7.807
4.491
1.381871
355 186 36880 64
1.000
2.000
3.000
4.000
5.000
6.000
7.000
8.000
´000 unitsJanuary – September 2016January – September 2017
Passenger Cars Commercial Vehicles
+2.7%
+4.9%+13.4%+3.6%-2.0%
+4.3% +8.4% +8.9%
1)+2.6%

Deliveries & Global Trends Key Financials & Cash Brands / RegionsStrategic Outlook &
Milestones Diesel Remuneration Integrity & Compliance Commitment
Volkswagen Group – Deliveries to Customers by Markets1)
(January to September 2017 vs. 2016)
5
7.609
2.700
482 686 320
3.112
310
7.807
2.734
542 719 390
3.135
2871.000
2.000
3.000
4.000
5.000
6.000
7.000
8.000
9.000
VolkswagenGroup
WesternEurope
Central & Eastern Europe
North America South America Asia Pacific Rest of World
January – September 2016January – September 2017
‘000 units
-7.2%+21.8%+4.8%+12.4%
+1.3%
+2.6%
+0.7%
1) Incl. all brands of Volkswagen Group (Passenger Cars and Commercial Vehicles); +2.4% excl. Volkswagen Commercial Vehicles, Scania and MAN.

Volkswagen Group: Environmental and Future Incentives Program• Promoting the renewal of the vehicle fleet through the changeover to Euro 6 and e-mobility• Improve air quality in cities• Incentives on purchasing a Volkswagen, Volkswagen Commercial Vehicles, Audi, SEAT, ŠKODA or Porsche with Euro 6 Standard Example Germany: • Program is available until December 31st, 2017 • Incentives for scrapping an old diesel vehicle of any brand with Euro 4 or older and purchase of a new vehicle
(Volkswagen: €2,000 to €10,000; Audi: €3,000 to €10,000; SEAT: €1,750 to €8,000; ŠKODA : €1,750 to €5,000; Porsche: €5,000)• Additional bonus for the purchase of alternative powertrain (electric, hybrid or natural gas)
Cost of Programs anticipated to be balanced through higher volumes, benefits of gaining new customersand raising customer loyalty
6
Model „Environmental“ Incentive
up! €2,000Polo €3,000Golf, Golf Sportsvan, Golf Estate, Tiguan, Tiguan Allspace, Beetle Cabrio
€5,000
Touran €6,000
Passat Sedan/Estate, Arteon, Sharan €8,000Touareg €10,000
Powertrain type „Future“ Incentive
Natural gas (e.g. Golf TGI) €1,000Hybrid (e.g. Golf GTE; Passat GTE) €1,785Electric (e.g. e-up!; e-Golf) €2,380
Example Incentive Volkswagen Brand1):
Deliveries & Global Trends Key Financials & Cash Brands / RegionsStrategic Outlook &
Milestones Diesel Remuneration Integrity & Compliance Commitment
1) Germany 2) existed already, only valid for electric vehicles
+
State subsidy²
Total support available per model=
+

7
Deliveries & Global Trends Key Financials & Cash Brands / RegionsStrategic Outlook &
Milestones Diesel Remuneration Integrity & Compliance Commitment
USA 1 Western Europe Russia
Brazil 1 World 1 China
-0.3%-3.0%
2020
16.9
2017
17.1
2016
17.6 -0.7%+2.7%
2020
14.1
2017
14.4
2016
14.0+13.0%+11.9%
2020
2.1
2017
1.5
2016
1.3
2.1
2016
2.08.8%6.9%
2020
2.7
2017
+2.2% 89.6
2017 2020
+2.3%
83.8
2016
82.0
2020
25.8
2017
23.4+3.2%+1.5%
2016
23.1
Actuals Forecast | Data source: IHS Automotive (10.2017) | 1 – Volume for North & South America includes light commercial vehicles (definition ‘Light Vehicles’) | growth 2017-2020 = CAGR
Global Passenger Car Market 2017/2020Slowdown in Western Europe; Stagnation in USA at a high level; Recovery in Brazil though from a low level; Strong growth in India; China remains largest driver of passenger car demandmillion units

8
Deliveries & Global Trends Key Financials & Cash Brands / RegionsStrategic Outlook &
Milestones Diesel Remuneration Integrity & Compliance Commitment
Volkswagen Group – Key Financial Figures 1)
(January to September 2017 vs. 2016)
thousand vehicles / € million 2017 2016 +/- (%)Vehicle Sales 2) 7,913 7,653 +3.4
Sales revenue 170,864 159,932 +6.8
Operating profit before Special Items 13,231 11,267 +17.4
% of sales revenue 7.7 7.0
Operating profit 10,636 8,647 +23.0%
% of sales revenue 6.2 5.4
Financial result -84 -488 X
of which: At-equity result2) 2,378 2,627 -9.5
of which: Other financial result -2,462 -3,116 -21.0
Profit before tax 10,552 8,159 +29.3
% Return on sales before tax 6.2 5.1
Profit after tax 7,735 5,915 +30.8
1) All figures shown are rounded, so minor discrepancies may arise from addition of these amounts. Including allocation of consolidation adjustments between the Automotive and Financial Services divisions.2) Volume data including the unconsolidated Chinese joint ventures. The joint venture companies in China are accounted for using the equity method and recorded an operating profit (proportionate) of €3,305 million (€3,594m).

9
Deliveries & Global Trends Key Financials & Cash Brands / RegionsStrategic Outlook &
Milestones Diesel Remuneration Integrity & Compliance Commitment
All figures shown are rounded, minor discrepancies may arise from addition of these amounts. *) without FS **) including PPA
2.2
1.72.3
2.6
Volkswagen Group – Analysis of Operating Profit1)
(January to September 2017 vs. 2016) € billion
Passenger Cars*/**
0
5
10
15
13.2
Financial Services Division
0.1
Power Engineering**
-0.1
Commercial Vehicles**
0.5
Fixed Costs
-1.6
Product Costs
0.4
Exchange Rates
0.3
Volume/ Mix/ Prices
2.3
Jan- Sept 2016 bef.
Spec. Items
11.3
Special Items
2.6
Jan- Sept 2016 incl.
Spec. Items
8.6
Special Items
Jan- Sept 2017 incl.
Spec. Items
Jan – Sept 2017 bef.
Spec. Items
10.6
-2.6

Deliveries & Global Trends Key Financials & Cash Brands / RegionsStrategic Outlook &
Milestones Diesel Remuneration Integrity & Compliance Commitment
10
Volkswagen Group – Analysis by Business Line 1)
(January to September 2017 vs. 2016)Vehicle sales Sales revenue Operating profit
thousand vehicles/ € million 2017 2016 2017 2016 2017 2016Volkswagen Passenger Cars2) 2,632 3,234 58,871 77,725 2,504 1,244Audi 1,147 1,166 44,235 44,017 3,941 3,918ŠKODA 700 606 12,338 10,113 1,206 940SEAT 436 400 7,255 6,535 154 137Bentley 7 8 1,321 1,411 31 54Porsche Automotive3) 180 177 15,703 15,291 2,890 2,760Volkswagen Commercial Vehicles 371 342 8,919 8,045 698 392Scania4) 65 60 9,304 8,272 947 802MAN Commercial Vehicles 80 74 7,970 7,213 269 204MAN Power Engineering - - 2,355 2,567 107 176VW China5) 2,917 2,803 - - - -Other6) -623 -1,217 -21,272 -41,592 -1,277 -896Volkswagen Financial Services7) - - 23,864 20,337 1,763 1,534Volkswagen Group before Special Items - - - - 13,231 11,267Special Items - - - - -2,595 -2,620Volkswagen Group 7,913 7,653 170,864 159,932 10,636 8,647
Automotive Division8) 7,913 7,653 145,553 136,889 8,717 6,841of which: Passenger Cars 7,400 7,178 117,441 111,044 7,308 6,359of which: Commercial Vehicles 513 475 25,757 23,278 1,484 491of which: Power Engineering - - 2,355 2,567 -75 -9
Financial Services Division - - 25,311 23,042 1,919 1,8061) All figures shown are rounded, minor discrepancies may arise from addition of these amounts. 2) 2017 figures take account of the reclassification of companies; prior-year figures were not adjusted. 3) Porsche (Automotive and Financial Services): sales revenue €17,120 (16,470) million, operating profit €3,006 (2,858 million). 4) Including financial services. 5) The sales revenue and operating profits of the joint venture companies in China are not included in the figures for the Group. These Chinese companies are accounted for using the equity method and recorded a proportionate operating profit of €3,305 (3,594) million. 6) Prior year adjusted. In operating profit mainly intragroup items recognized in profit or loss, in particular from the elimination of intercompany profits; the figure includes depreciation and amortization of identifiable assets as part of purchase price allocation for Scania, Porsche Holding Salzburg, MAN and Porsche. 7) Starting January 1, 2017, Porsche’s financial services business is reported as part of Volkswagen Financial Services. Prior-year figures were not adjusted.8) Including allocation of consolidation adjustments between the Automotive and Financial Services divisions.

11
Deliveries & Global Trends Key Financials & Cash Brands / RegionsStrategic Outlook &
Milestones Diesel Remuneration Integrity & Compliance Commitment
‘Best ever’ Automotive Division Net Cash Flow (ex Diesel payments) 1)
(January to September 2017)
-5
0
5
10
15
14.5
-2.9
Net Cash flow incl Diesel payments
11.62)
Diesel outflow Net Cash flow underlying business
€ billion
1) Including allocation of consolidation adjustments between Automotive and Financial Services divisions.2) Including Chinese dividends in the amount of €3bn.

12
Deliveries & Global Trends Key Financials & Cash Brands / RegionsStrategic Outlook &
Milestones Diesel Remuneration Integrity & Compliance Commitment
1) All figures shown are rounded, minor discrepancies may arise from addition of these amounts. 2) Including allocation of consolidation adjustments between Automotive and Financial Services divisions. 3) Capital expenditure for property, plant and equipment in % of Automotive sales revenue.
Automotive Division Net Cash Flow Development 1) 2)
(January to September 2017)
20163) 17.0 0.0 17.0 -7.8 (5.7%) -4.2 0.2 5.2 2.3 7.5
-5
0
5
10
15
20
25
22.5
-2.90.0-4.2
8.0
0.3 -2.9
-14.5
-7.1(4.9%)
Cash flow from operating activities
Capex 3) Capitalized development
costs
Other Acquisitionand disposal
of equityinvestments
Net cash flowDiesel Outflow
Cash flow before Diesel Outflow
Net cash flowbefore equityinvestments
€ billion

Automotive Division - Net Liquidity on a robust level at September 30th 1)
13
Deliveries & Global Trends Key Financials & Cash Brands / RegionsStrategic Outlook &
Milestones Diesel Remuneration Integrity & Compliance Commitment
3.5
1) All figures shown are rounded, minor discrepancies may arise from addition of these amounts.
3.5 3.0
Hybrid Bond Capital increase
Volkswagen FS AG
31.12.2016 Dividendpay-out to
Volkswagen AGshareholders
30.09.2017Diesel Outflow
0
5
10
15
20
25
30
35
-1.0
8.0
27.2
-1.0
-14.5
3.03.5
25.4
0.3
Chinese Dividends
Operating Business
€ billion
Other

Volkswagen Group – Outlook for 2017
Deliveries & Global Trends Key Financials & Cash Brands / RegionsStrategic Outlook &
Milestones Diesel Remuneration Integrity & Compliance Commitment
14
Deliveries to customers(‘000 vehicles)
+ 3.7%
Sales revenue(€ billion)
+ 1.9%
2015
Operating return on sales
(%)
2016
Deliveries to customersmoderately above prior year
Sales revenue Up more than 4% above prior year level
Operating return on sales Moderately above range of 6.0% to 7.0%
Full Year
6.06.7
9,93110,297
213.3217.3
**
*)before Special Items
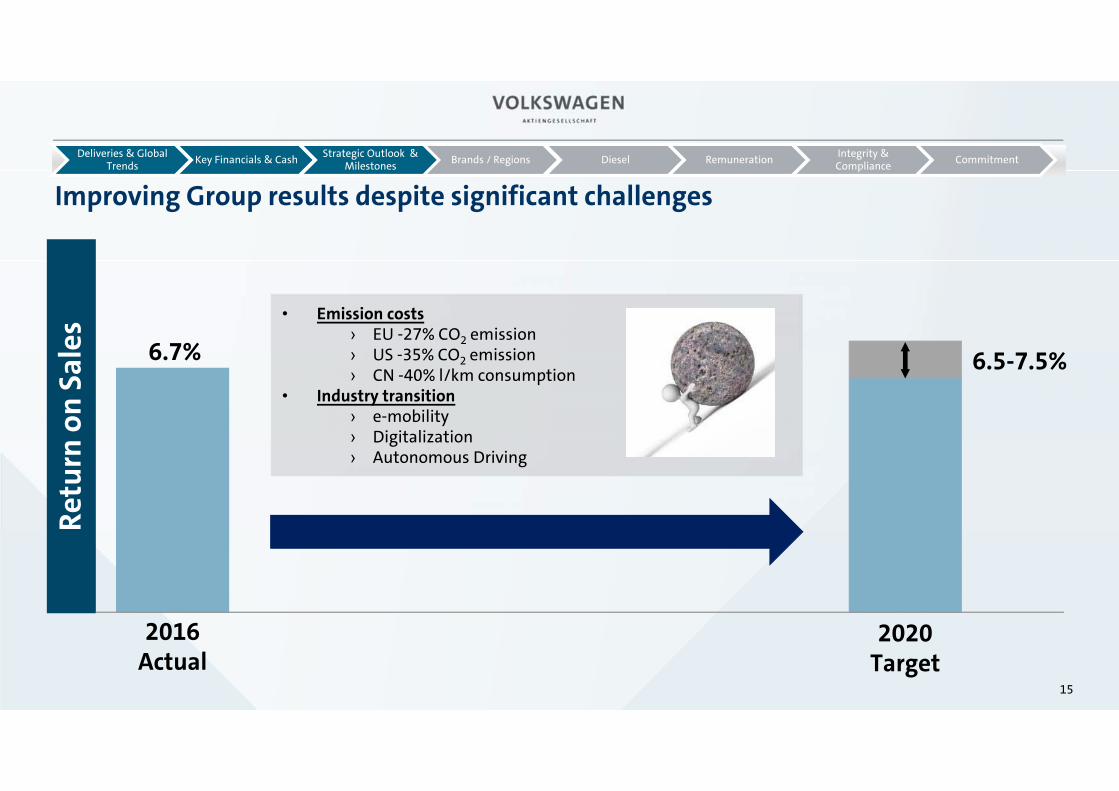
• Emission costs› EU -27% CO2 emission› US -35% CO2 emission› CN -40% l/km consumption
• Industry transition › e-mobility› Digitalization› Autonomous Driving
Improving Group results despite significant challenges
Retu
rn o
n Sa
les
6.7% 6.5-7.5%
2016 Actual
2020Target
15
Deliveries & Global Trends Key Financials & Cash Brands / RegionsStrategic Outlook &
Milestones Diesel Remuneration Integrity & Compliance Commitment
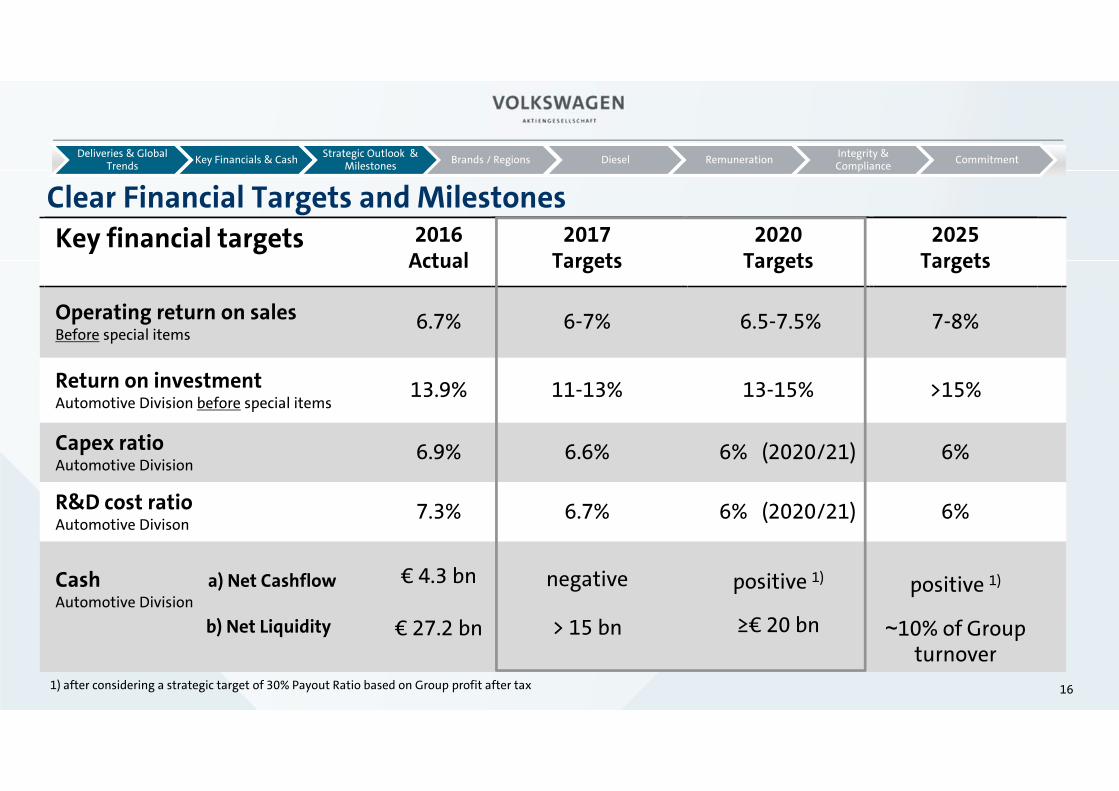
Clear Financial Targets and Milestones
1) after considering a strategic target of 30% Payout Ratio based on Group profit after tax
Key financial targets 2016Actual
2025Targets
Operating return on salesBefore special items
6.7% 7-8%
Return on investmentAutomotive Division before special items
13.9% >15%
Capex ratioAutomotive Division
6.9% 6%
R&D cost ratioAutomotive Divison
7.3% 6%
Cash a) Net CashflowAutomotive Division
b) Net Liquidity
€ 3.1 bn
€ 27.2 bn
positive 1
~10% of Group turnover
Key financial targets 2016Actual
Operating return on salesBefore special items
6.7%
Return on investmentAutomotive Division before special items
13.9%
Capex ratioAutomotive Division
6.9%
R&D cost ratioAutomotive Divison
7.3%
Cash a) Net CashflowAutomotive Division
b) Net Liquidity
€ 4.3 bn
€ 27.2 bn
2017Targets
6-7%
11-13%
6.6%
6.7%
negative
> 15 bn
2020Targets
6.5-7.5%
13-15%
6% (2020/21)
6% (2020/21)
positive 1)
≥€ 20 bn
2025Targets
7-8%
>15%
6%
6%
positive 1)
~10% of Group turnover
16
Deliveries & Global Trends Key Financials & Cash Brands / RegionsStrategic Outlook &
Milestones Diesel Remuneration Integrity & Compliance Commitment

CAPEX Automotive Division(€ bn, as % of sales revenue)
5.9%
6.9% 6.6%
6% 6%
2012 2013 2014 2015 Target
10.311 11.5
12.7 12.8 ~13
2016 2017 2018-2019 2020-2021 2025
6.9%
Stre
tch
17
Deliveries & Global Trends Key Financials & Cash Brands / RegionsStrategic Outlook &
Milestones Diesel Remuneration Integrity & Compliance Commitment
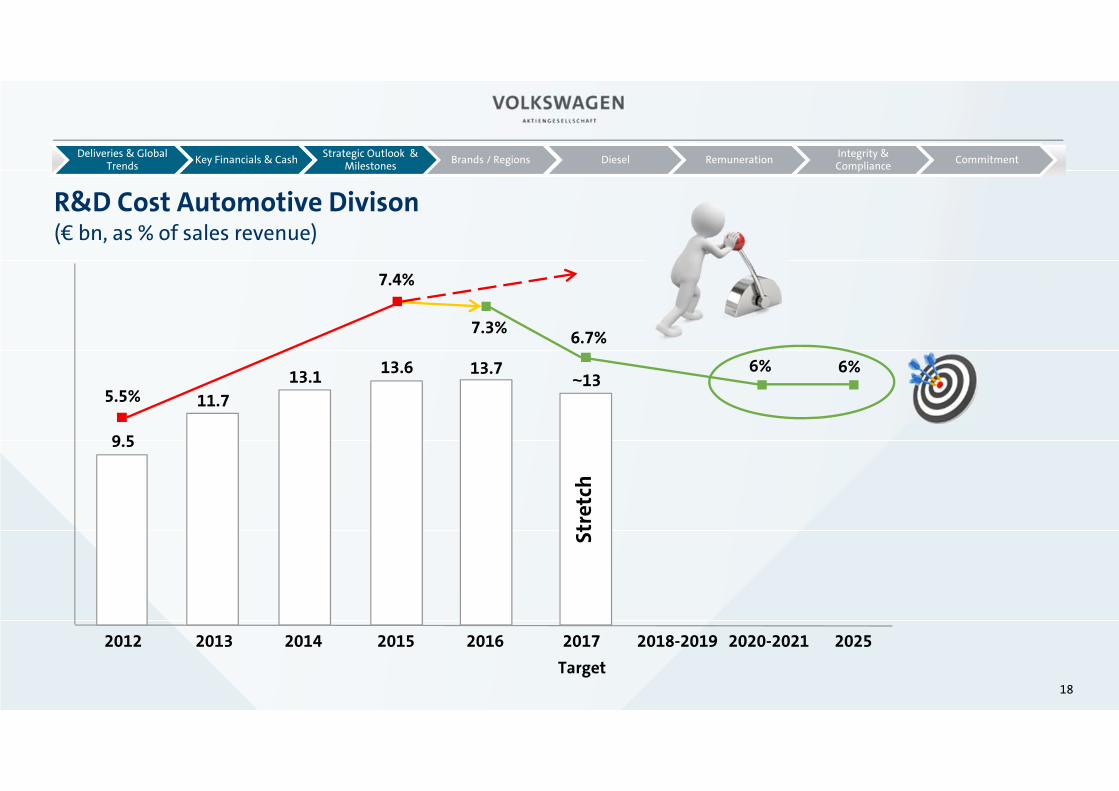
R&D Cost Automotive Divison(€ bn, as % of sales revenue)
5.5%
7.4%
7.3% 6.7%
6% 6%
2012 2013 2014 2015 2016 2017 2018-2019 2020-2021 2025Target
9.5
11.713.1 13.6 13.7
~13
Stre
tch
18
Deliveries & Global Trends Key Financials & Cash Brands / RegionsStrategic Outlook &
Milestones Diesel Remuneration Integrity & Compliance Commitment
19
Deliveries & Global Trends Key Financials & Cash Brands / RegionsStrategic Outlook &
Milestones Diesel Remuneration Integrity & Compliance Commitment
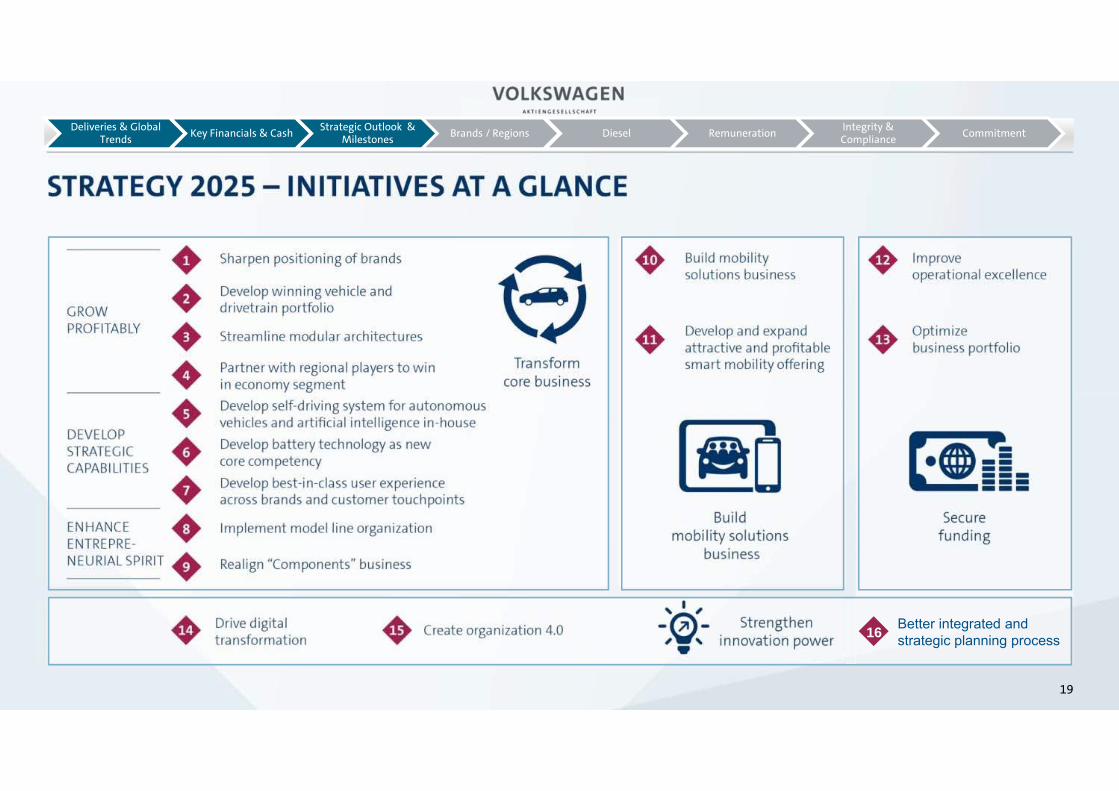
Better integrated and strategic planning process16
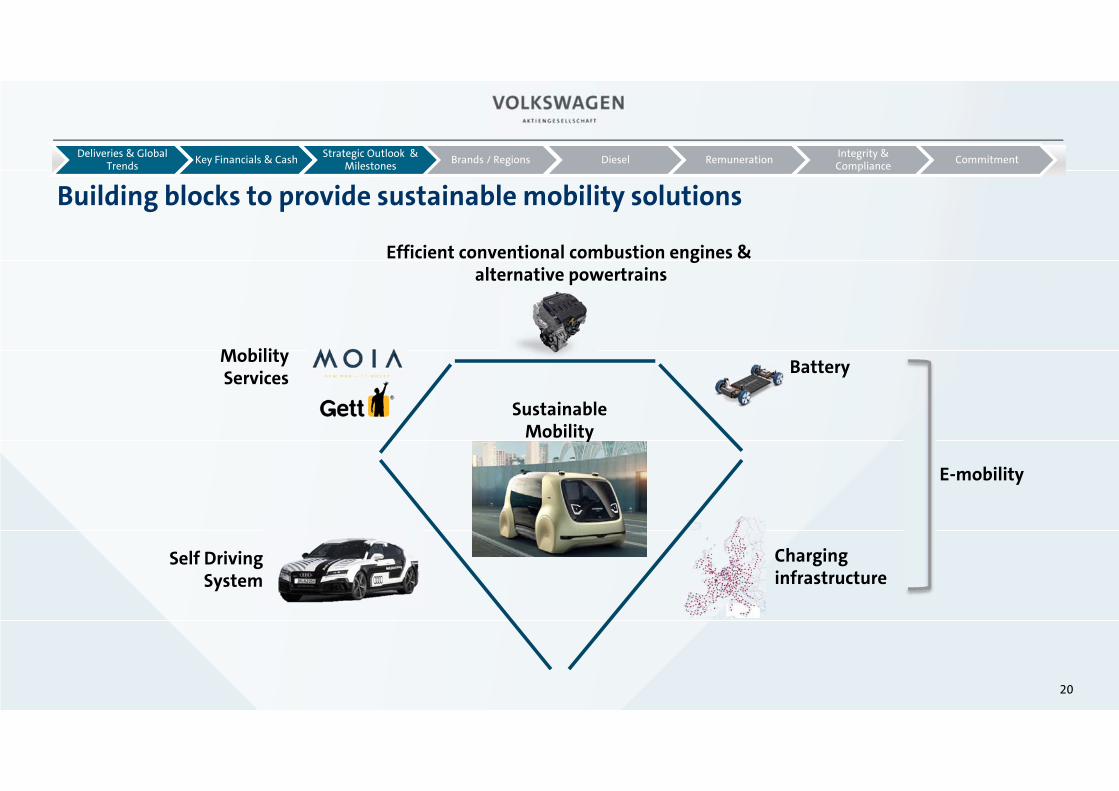
MobilityServices
Self DrivingSystem
Sustainable Mobility
Battery
Charging infrastructure
Building blocks to provide sustainable mobility solutions
E-mobility
Efficient conventional combustion engines &alternative powertrains
Deliveries & Global Trends Key Financials & Cash Brands / RegionsStrategic Outlook &
Milestones Diesel Remuneration Integrity & Compliance Commitment
20
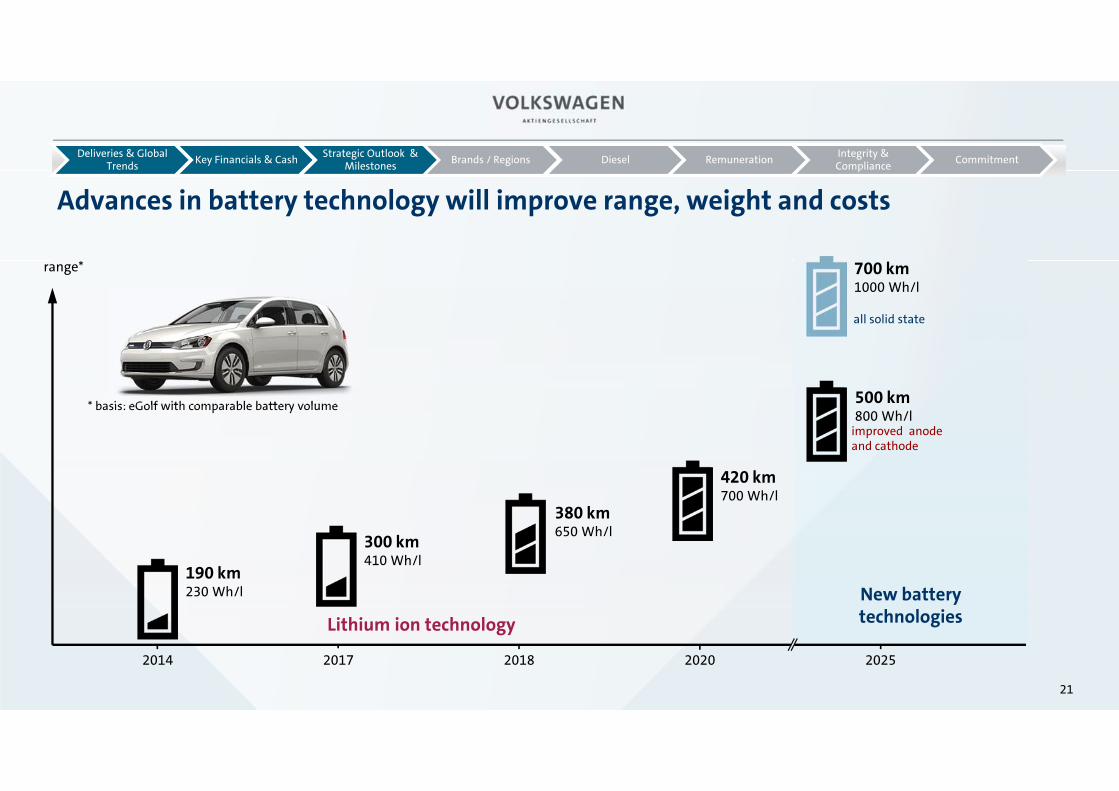
Advances in battery technology will improve range, weight and costs
range*
2014 2017 2018 2020 2025
* basis: eGolf with comparable battery volume
Lithium ion technology
all solid state
improved anode and cathode
190 km230 Wh/l
300 km410 Wh/l
380 km650 Wh/l
420 km700 Wh/l
New batterytechnologies
700 km1000 Wh/l
500 km800 Wh/l
Deliveries & Global Trends Key Financials & Cash Brands / RegionsStrategic Outlook &
Milestones Diesel Remuneration Integrity & Compliance Commitment
21

Battery costs will decrease significantly by 2020
battery cell
battery system100
200
300
Target:< 100€ / kWh
MQB
MEB
2013 2020
€ / kWh
Deliveries & Global Trends Key Financials & Cash Brands / RegionsStrategic Outlook &
Milestones Diesel Remuneration Integrity & Compliance Commitment
22

Roadmap E - E-mobility model offensive of the Volkswagen Group
2017 3 BEVs, 8 PHEVs
2025 80 new EVs,
thereof some 50 purely battery powered vehicles
and 30 plug-in-hybrids
€50bn battery cell procurement volume up to 2025
2030 >€20bn capex but in the period to 2030
Deliveries & Global Trends Key Financials & Cash Brands / RegionsStrategic Outlook &
Milestones Diesel Remuneration Integrity & Compliance Commitment
23

Multi OEM Joint Venture to deploy a HPC charging network in Europe
European High Power Charging GmbH & Co. KG
~ 400 charging stations
Unprecedented collaboration among automakers
Deployed power levels up to 350 kW
Network based on the Combined Charging System (CCS) international standard
Open brand-independent network
24
Deliveries & Global Trends Key Financials & Cash Brands / RegionsStrategic Outlook &
Milestones Diesel Remuneration Integrity & Compliance Commitment

Electrify America: Start to execute the National ZEV plan (Zero Emissions Vehicles)
First 30-month investment cycle – focus on EV infrastructure, including highway and community chargers
Phase 2 long-distance sitePotential metro area
Phase 1 long-distance site (initial implementation)
Electrify America first cycle network
▪ $2B total investment over 10 years at $500M per 30-month cycle
– $1.2B Nationally (EPA)– $800M in California (CARB)
Investment
▪ Goal to increase EV adoption for US market through brand-neutral and self-sustaining ZEV investments
Goal
Plan▪ 30-month investment, planning, and reporting cycles allow for
changes in technology, customer behavior, and car capabilities
Key features of Appendix C
25
Deliveries & Global Trends Key Financials & Cash Brands / RegionsStrategic Outlook &
Milestones Diesel Remuneration Integrity & Compliance Commitment
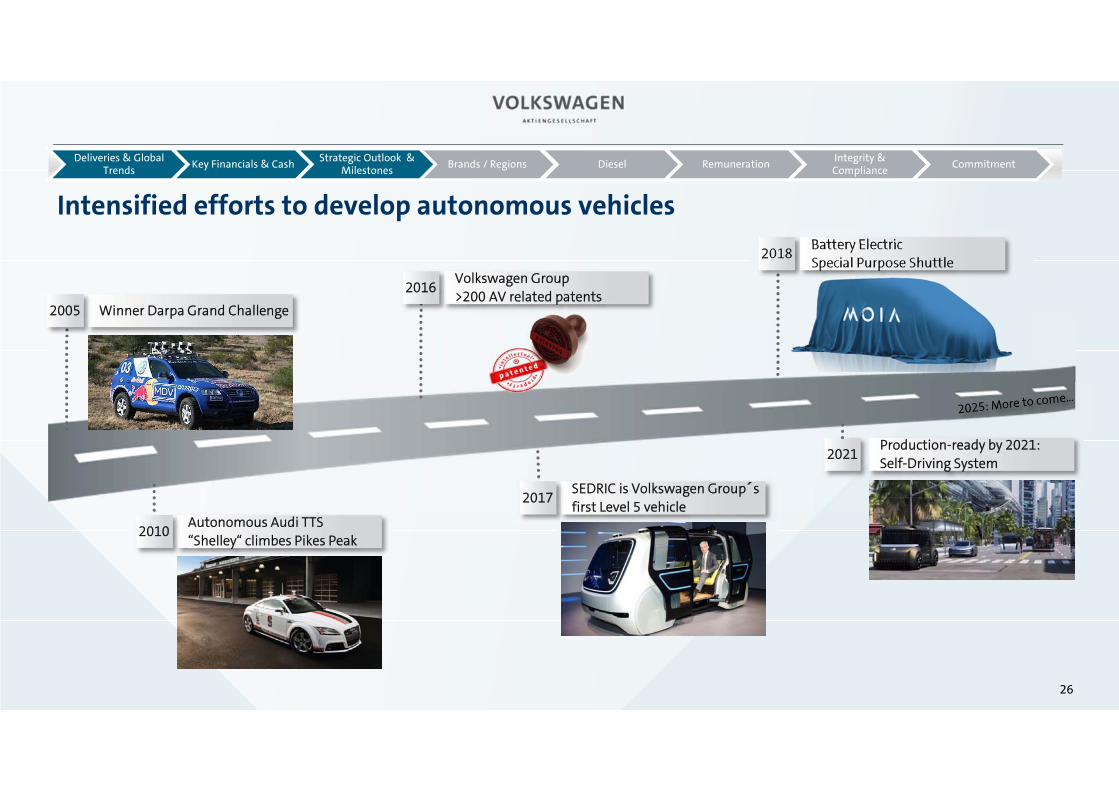
Intensified efforts to develop autonomous vehicles
SEDRIC is Volkswagen Group´s first Level 5 vehicle
2017
Volkswagen Group>200 AV related patents
2016
Production-ready by 2021: Self-Driving System
2021
2018Battery Electric Special Purpose Shuttle
Winner Darpa Grand Challenge2005
Autonomous Audi TTS“Shelley“ climbes Pikes Peak
2010
Deliveries & Global Trends Key Financials & Cash Brands / RegionsStrategic Outlook &
Milestones Diesel Remuneration Integrity & Compliance Commitment
26

Cascading Group Targets to Brands
Commitment
Brand KPIs Top-Down Targets Committed in Planning Rounds
Specific KPIs
Group KPIs RoS RoI R&D CF/LiquidityCapex
27
Deliveries & Global Trends Key Financials & Cash Brands / RegionsStrategic Outlook &
Milestones Diesel Remuneration Integrity & Compliance Commitment

Return on Sales in % 2016
Volkswagen Group 6.7Volkswagen Brand 1.8Audi 8.2Porsche 17.4ŠKODA 8.7Volkswagen Commercial Vehicles 4.1Truck & Bus Business1)
• Scania 9.5• MAN Commercial Vehicles 2.3
Return on Equity (norm. 8%) 2016
Volkswagen Financial Services 15.6%
Overview Brand Targets (RoS, RoE)
2025
7.0-8.0≥6
8-10>15≥7>6
2025
20%
2017
6.0-7.02.5-3.5
8-10>157-83-4
2017
14-16%
2020
6.5-7.5≥4
8-10>156-74-5
2020
14-16%
6-7 92) 92)
1) For peer-group analysis: Truck & Bus Business RoS is calculated as the sum of Scania and MAN Commercial Vehicles (equals ~6.1% in 2016)2) Through-cycle Target
28
Deliveries & Global Trends Key Financials & Cash Brands / RegionsStrategic Outlook &
Milestones Diesel Remuneration Integrity & Compliance Commitment

2015Diesel crisis
2% RoS*
* Before special items
Radical restructuring
Leap to the top of electric mobility
Major transformation
2020Leading & profitable volume manufacturer
4% RoS
2025Global leader in e-mobility
6% RoS
2030Global leader in auto-mobility
>6% RoS
1 2 3
• Brand positioning„top of volume“
• SUV offensive
• Regions (China, NAR, SAM)
• Economy markets
• Zukunftspakt
• Product margins
• Agile organisation
• Electro offensive
• Digital ecosystem
• Operational excellence
• Automated driving
• New fields of mobility
The „TRANSFORM 2025+“ strategy will put the brand to the top of the automotiveindustry
29
Deliveries & Global Trends Key Financials & Cash Brands / RegionsStrategic Outlook &
Milestones Diesel Remuneration Integrity & Compliance Commitment

Deliveries & Global Trends Key Financials & Cash Brands / RegionsStrategic Outlook &
Milestones Diesel Remuneration Integrity & Compliance Commitment
30
Result outlook for 2017 follows TRANSFORM 2025+ strategy path(Growth in operating return on sales as % of net earnings)
Implementation of the “Zukunftspakt”
Turnaround in NAR, Brazil, Russia
Growth in SUV portfolio
Future CO2 and emissions legislation
Transformation in the industry
2016 2017Outlook
2020Target
2025Target
1.8
2.5 – 3.5≥ 4.0
≥ 6.0
“at the upper end of the range”
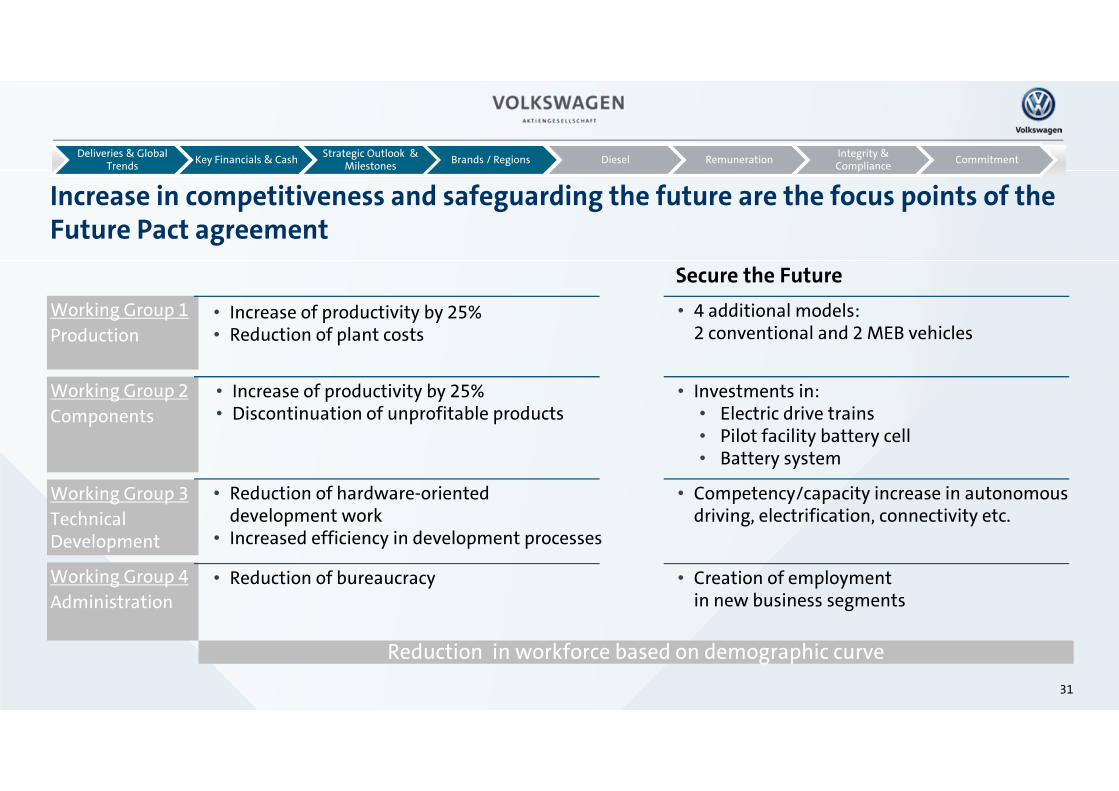
Increase in competitiveness and safeguarding the future are the focus points of the Future Pact agreement
• Increase of productivity by 25%• Reduction of plant costs
• Increase of productivity by 25%• Discontinuation of unprofitable products
Working Group 2Components
Working Group 1Production
• Reduction of hardware-orienteddevelopment work
• Increased efficiency in development processes
Working Group 3Technical Development
• Reduction of bureaucracyWorking Group 4Administration
Reduction in workforce based on demographic curve
Secure the Future• 4 additional models:
2 conventional and 2 MEB vehicles
• Investments in:• Electric drive trains• Pilot facility battery cell• Battery system
• Competency/capacity increase in autonomous driving, electrification, connectivity etc.
• Creation of employmentin new business segments
Deliveries & Global Trends Key Financials & Cash Brands / RegionsStrategic Outlook &
Milestones Diesel Remuneration Integrity & Compliance Commitment
31

Target2017
2016201520122007
-300 Mio.
Volkswagen brand: Productivity will increase by 7.5 percent this yearPRODUCTIVITY IMPROVEMENT (percent | Targets)
FIXED COSTS IN GERMANY (€ billion)
5,0
5,0
7,5
7,5
2019 202020182017 Target2020
≈
25.0
Deliveries & Global Trends Key Financials & Cash Brands / RegionsStrategic Outlook &
Milestones Diesel Remuneration Integrity & Compliance Commitment
32

Focus on US Core Segments
Volkswagen brand is planning a strong comeback in the USA
Atlas Tiguan LWB
Jetta Passat
Key measures
• Extend SUV offering,focus on US core segments (SUVs, sedans)
• Market-oriented pricing
• Market-oriented alignment to local standards and customer expectations
• Reduce material, product and fixed costs
• “Electrify America”: infrastructure and locally produced cars from 2021
Deliveries & Global Trends Key Financials & Cash Brands / RegionsStrategic Outlook &
Milestones Diesel Remuneration Integrity & Compliance Commitment
33
2014 2015 2016 2017 2018 2019 2020
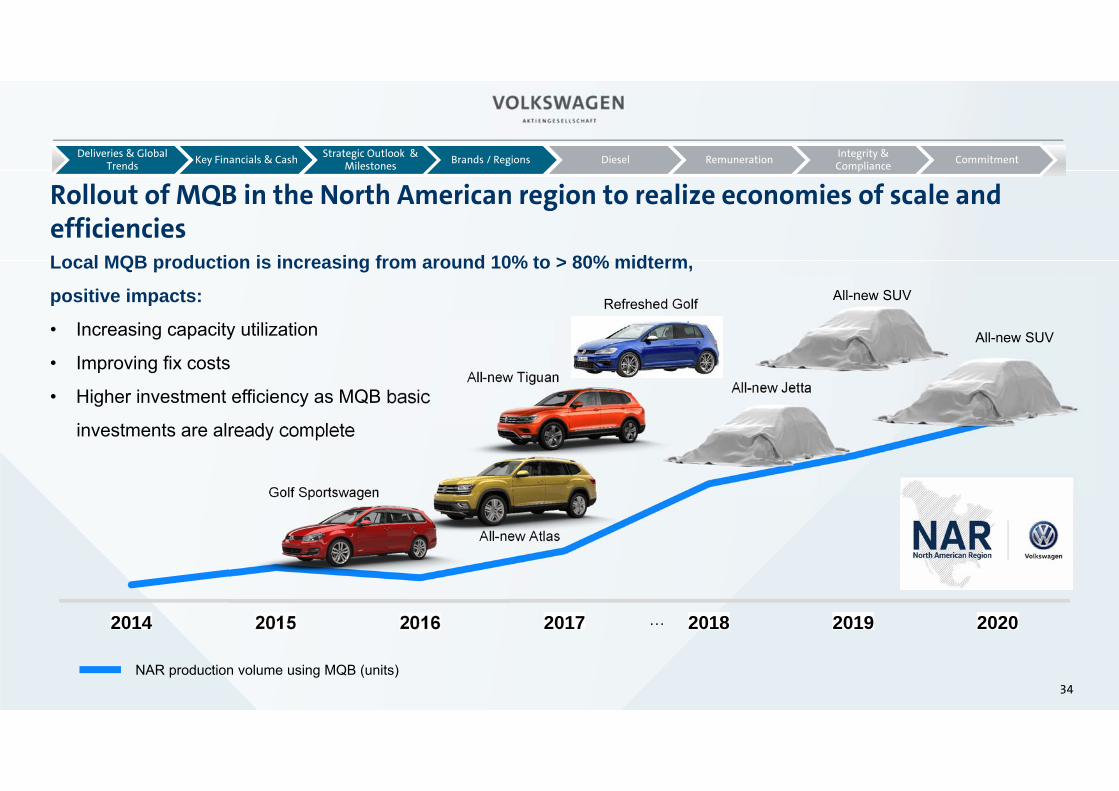
Rollout of MQB in the North American region to realize economies of scale and efficiencies
Golf Sportswagen
All-new Atlas
All-new Tiguan
Refreshed Golf
All-new Jetta
All-new SUV
…
NAR production volume using MQB (units)
Local MQB production is increasing from around 10% to > 80% midterm,
positive impacts:
• Increasing capacity utilization
• Improving fix costs
• Higher investment efficiency as MQB basic
investments are already complete
34
All-new SUV
Deliveries & Global Trends Key Financials & Cash Brands / RegionsStrategic Outlook &
Milestones Diesel Remuneration Integrity & Compliance Commitment

A product offensive will initiate a new growth phase in South America
Product offensive in South America
Polo Global Polo Sedan Global
Small SUV Global
Key measures
• Restructuring: reduce capacitiesand fixed costs
• Increase productivity, align products to local requirements
• Product offensive, €2.5 bn investment
• New brand positioning
• New growth strategy for Latin America
Deliveries & Global Trends Key Financials & Cash Brands / RegionsStrategic Outlook &
Milestones Diesel Remuneration Integrity & Compliance Commitment
35

2017 is being shaped by a high product momentum
Jan Feb March April May June July Aug Sept Oct Nov Dec
Atlas (NAR)
up! PA (SAM)
Arteon (EU) Phideon PHEV (CN)Polo (EU)
T-Roc (EU)
Touareg (EU)
Virtus (SAM) Jetta (NAR)Tiguan LWB (NAR)Dates: Start of Production
36
Deliveries & Global Trends Key Financials & Cash Brands / RegionsStrategic Outlook &
Milestones Diesel Remuneration Integrity & Compliance Commitment

Further roll-out of MQB offers substantial benefits
SHARE OF MQB (ROUNDED) | TOTAL PRODUCTION VOLUME | VOLKSWAGEN PKW
20%40%
80%
202020172015
MQBOther
Deliveries & Global Trends Key Financials & Cash Brands / RegionsStrategic Outlook &
Milestones Diesel Remuneration Integrity & Compliance Commitment
37

All electric platform: The basis for profitable electric cars
Concept determined by: customer benefit and package for cost-optimized design of e-components
Economies of scale from use of MEB across entire Group
“Design for manufacturing“: higher productivity, shorter manufacturing time
Lower material and distribution costs
Significant reduction in variants
Early involvement of suppliers
Deliveries & Global Trends Key Financials & Cash Brands / RegionsStrategic Outlook &
Milestones Diesel Remuneration Integrity & Compliance Commitment
38

Three models of Volkswagen‘s “Starting Five“ for the Electric Age
Deliveries & Global Trends Key Financials & Cash Brands / RegionsStrategic Outlook &
Milestones Diesel Remuneration Integrity & Compliance Commitment
39

Core challenges in the commercial vehicle industry ...
Platooning and partly-autonomous driving as transition solutions
Data management for customers and traffic of broad interest
Europe with aggressive regulations, focus shifting to diesel lock-outs
BRIC trailing behind, but with ambitious roadmap
Local OEMs dominating in BRIC markets
Improving infrastructure, stronger regulations open opportunities for Volkswagen
Strong correlation to GDP in developed world
Not all regions hit by economic downturns at the same time
After sales increasingly important as alternative source of revenues
New business models (e.g. enhanced telematics) can stabilize revenues
Further globalization
Connectivity & digitalization
Emission regulations
Cyclical markets
After sales and new business
opportunities
Deliveries & Global Trends Key Financials & Cash Brands / RegionsStrategic Outlook &
Milestones Diesel Remuneration Integrity & Compliance Commitment
40

Material costs
Production costs /tooling
R&D
2025
Up to
1,000
2016
~200
€ million p.a.
Base engine After-treatment
Transmission Axles
Long-term synergy potential will enable savings of up to €1 bn p.a.
41
Deliveries & Global Trends Key Financials & Cash Brands / RegionsStrategic Outlook &
Milestones Diesel Remuneration Integrity & Compliance Commitment
Key common powertrain platformsSynergy potential from brand collaboration and expanded platform strategy

Strategic technology and supply cooperation2
Procurement joint venture3
Equity investment1
Governance4
16.9% equity stake in Navistar by way of capital increase*
Companies to collaborate on technology for powertrain systems, as well as other advanced technologies
Procurement joint venture is pursuing joint global sourcing opportunities
2 VW T&B representatives nominated to Navistar Board of Directors. Joint Alliance Board to govern overall alliance
Global expansion on track with Navistar alliance
42
Deliveries & Global Trends Key Financials & Cash Brands / RegionsStrategic Outlook &
Milestones Diesel Remuneration Integrity & Compliance Commitment
* As at 30.09.2017

1) incl. Hong Kong, excl. Ducati. Group numbers incl. MAN and Scania
Volkswagen Group China performance(January to September 2017 vs. 2016)
43
Deliveries & Global Trends Key Financials & Cash Brands / RegionsStrategic Outlook &
Milestones Diesel Remuneration Integrity & Compliance Commitment
2.854
2.133
440 225
49
2.895
2.200
419 213
54 0
500
1.000
1.500
2.000
2.500
3.000
‘000 unitsJan.- Sep. 2016
Jan.- Sep. 2017
1)
190
1.018
2.745
201
1.245
4.169
0
500
1.000
1.500
2.000
2.500
3.000
3.500
4.000
Units
+1.4%
+3.2%
-4.9%-5.6%
+9.9% +5.8%
+22.3%
+51.9%
Proportionate operating profit, January to September (in € million)
2016 2017
3,594 3,305
-8.0%

Regulatory environment for NEV and Fuel Consumption Credits in China
44
Deliveries & Global Trends Key Financials & Cash Brands / RegionsStrategic Outlook &
Milestones Diesel Remuneration Integrity & Compliance Commitment
- Independent management of CAFC1) and NEV credits
- Companies need to fulfill both requirements
CAFC1) Credits:- Transfer between affiliated companies- Credit carry-over to next 3 years with
depreciation- Option to use positive NEV credits
NEV Credits:- No transfer from CAFC credits to NEV credits- Carry-over of positive and negative NEV
credits from 2019 to 2020 - Trading of NEV credits allowed
The rules will be further supplemented.
CAFC and NEV Credit System MIIT2) draft for NEV Credit Calculation
min. NEV credit points = ICE3) Volume NEV credit
point ratiox
NEV Credit Point Attribution per NEV Type
1) CAFC – Corporate Average Fuel Consumption 2) MIIT – Ministry of Industry and Information Technology 3)ICE – Internal Combustion Engine 4)BEV – Battery Electric Vehicle 5)PHEV – Plug-in Hybrid Electric Vehicle
ICEsmin. NEV credit
Example 2019:1 million ICEs need100,000 NEV credit points
BEV4): Basic credit = 0.012 x Range + 0.8 (max. 5 basic credits) BEV additional factor for low electric consumption up to 1.2
PHEV5): Basic credit = 2 (min. e-Range 50km)PHEV credit = 1 if e-range 50-80km and consumption ≥70% ICE
2018 2019 2020
None 10% 12%
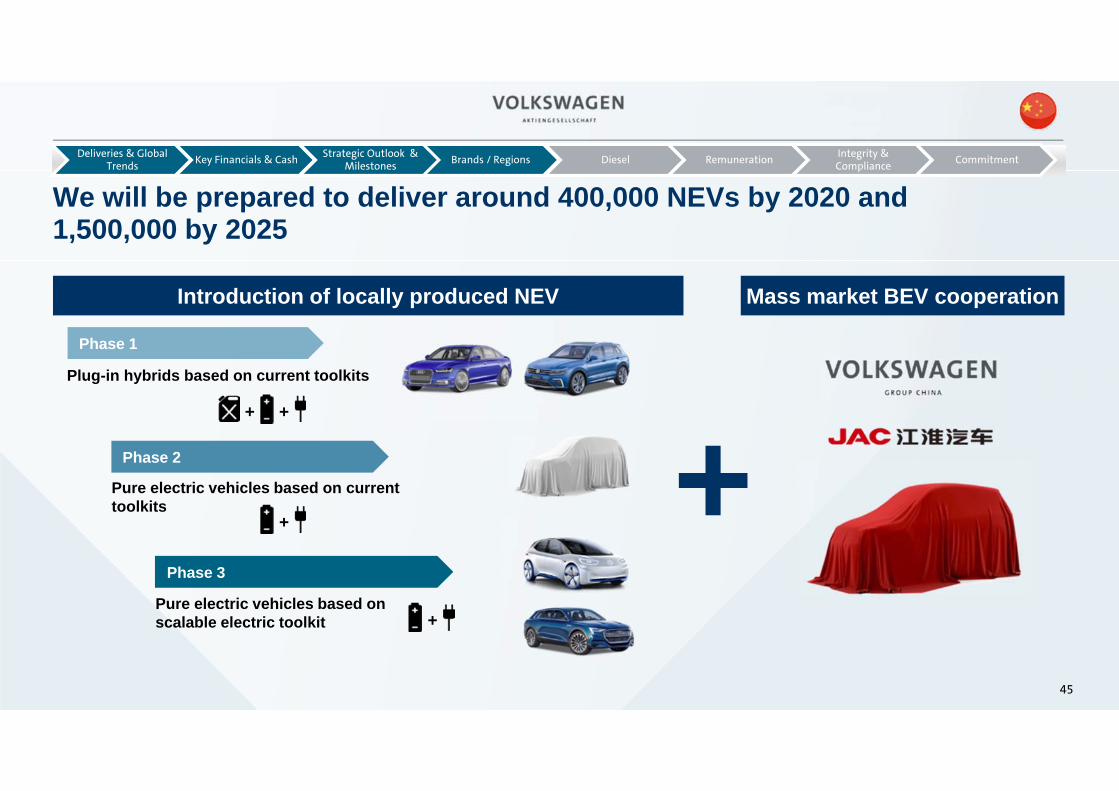
We will be prepared to deliver around 400,000 NEVs by 2020 and1,500,000 by 2025
Deliveries & Global Trends Key Financials & Cash Brands / RegionsStrategic Outlook &
Milestones Diesel Remuneration Integrity & Compliance Commitment
Plug-in hybrids based on current toolkits
Pure electric vehicles based on current toolkits
Pure electric vehicles based on scalable electric toolkit
Introduction of locally produced NEV Mass market BEV cooperation
+Phase 1
Phase 2
+ +
Phase 3
+
+
45

Confidential
New product offering with an expanded SUV line-up 1)
1) Source: IHS 2) Schematic overview – does not show all models
New vehicle launches 2017 and to follow2)Body style trends until 20201)
Others
SUV
R8 SpyderQ7 e-tron
Tiguan LWB
KODIAQTeramont Q5
KAROQ …
PanameraTurbo
2016 2020e
Rest
SUV
MPV
Notchback &Hatchback 53%
40%
47%
46%
Phideon PHEV
imported locally produced
Variant GTE BoraPanameraLWB
A5 Coupé TT Lavida
46
Deliveries & Global Trends Key Financials & Cash Brands / RegionsStrategic Outlook &
Milestones Diesel Remuneration Integrity & Compliance Commitment

3.163 3.567 3.712 3.930 4.551 4.946 5.560 5.833 6.155 6.3561.505 1.508 1.524 1.623 1.808 1.983 2.274 2.518 2.760 3.0161.964 2.148 2.246 2.691
3.281 3.7964.549
6.3227.218 7.568
2008 2009 2010 2011 2012 2013 2014 2015 2016 Jan-Sep2017Financing Leasing Insurance / Services
Volkswagen Financial Services1): global, well diversified and successfulContinuous portfolio expansionStrong global presence
Total portfolio 16,940
in ‘000 contracts
Rising penetration rates Diversified funding structure
19%
32%18%
31%
Customer deposits
Equity, liabilities to affiliated companies, other
Bonds,Commercial Paper,
liabilities to financialinstitutions
Asset backed securitization
30.09.2017: €181.1 bn
1) Excluding activities of Scania and Porsche Holding Salzburg; including Financial Services of Porsche AG and MAN Financial Services.
w/o China
with China
47
Deliveries & Global Trends Key Financials & Cash Brands / RegionsStrategic Outlook &
Milestones Diesel Remuneration Integrity & Compliance Commitment
32.5% 32.9% 34.9% 36.3%40.7% 44.3% 44.5% 46,9% 48,7% 47,5%
26.4% 25.0% 24.7% 25.4% 27.5% 28.9% 30.6% 31,3% 33,1% 33,5%

Deliveries & Global Trends Key Financials & Cash Brands / RegionsStrategic Outlook &
Milestones Diesel Remuneration Integrity & Compliance Commitment
48
VOLKSWAGEN Aktiengesellschaft
Volkswagen Financial Services AGVolkswagen Bank GmbH
Affiliates in: Asia-Pacific
Latin America
European credit business affiliates
European non-bank-related
affiliates
European VW Bank GmbH
branches
48
Optimized structure for Volkswagen Financial Services AG(Effective from 1. September 2017)
Organisational set-up of Volkswagen Financial Services
All the credit and deposit business within the European Economic Area (EEA) is bundled in Volkswagen Bank GmbH
Volkswagen Bank GmbH is a wholly owned subsidiary of Volkswagen AG
The credit business outside Europe - excluding NAR, Scania FS and PHS - as well as all other activities, such as the leasing, insurance, service and mobility business, remain with Volkswagen Financial Services AG
Advantages:
Optimized capital requirements Reduced complexity & improved transparency Supports future growth path
New Corporate Structure
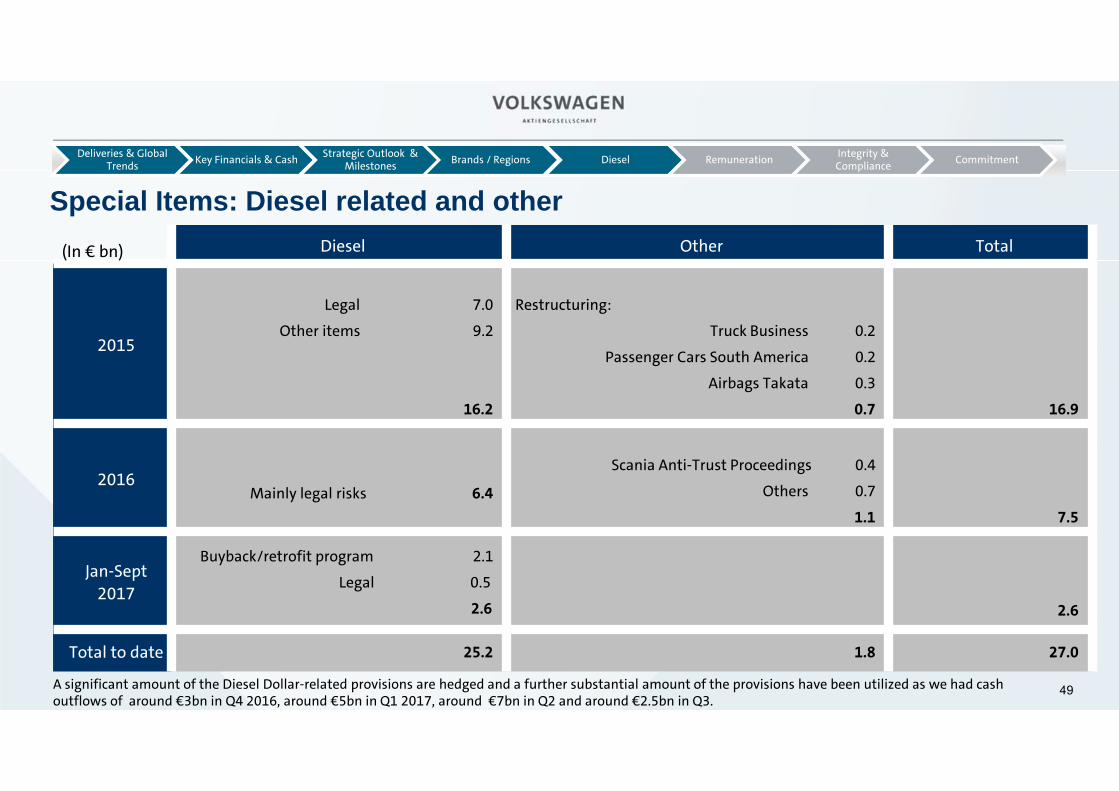
Special Items: Diesel related and other Diesel Other Total
2015
Legal 7.0
Other items 9.2
16.2
Restructuring:
Truck Business 0.2
Passenger Cars South America 0.2
Airbags Takata 0.3
0.7 16.9
2016 Mainly legal risks 6.4
Scania Anti-Trust Proceedings 0.4
Others 0.7
1.1 7.5
Jan-Sept 2017
Buyback/retrofit program 2.1
Legal 0.5
2.6 2.6
Total to date 25.2 1.8 27.0
(In € bn)
49
Deliveries & Global Trends Key Financials & Cash Brands / RegionsStrategic Outlook &
Milestones Diesel Remuneration Integrity & Compliance Commitment
A significant amount of the Diesel Dollar-related provisions are hedged and a further substantial amount of the provisions have been utilized as we had cash outflows of around €3bn in Q4 2016, around €5bn in Q1 2017, around €7bn in Q2 and around €2.5bn in Q3.

Technical solution in Europe/RoW simple and relatively easy to implement
Technical solution already generally confirmed for all concepts by KBA1
Gradual approval of clusters after cluster-specific KBAinspection1
Software update in < 30 min. for 2.0L and 1.2L TDI; also simple, very cost-effective hardware solution “flow rectifier” for 1.6L TDI in < 60 min.
1 KBA approval relevant for EU28 and ECE user states (e.g., Turkey)
Predominantly software-only solution
50
Almost 6.2m units have been updated(status 19 October 2017)
Update status
Deliveries & Global Trends Key Financials & Cash Brands / RegionsStrategic Outlook &
Milestones Diesel Remuneration Integrity & Compliance Commitment

51
Deliveries & Global Trends Key Financials & Cash Brands / RegionsStrategic Outlook &
Milestones Diesel Remuneration Integrity & Compliance Commitment
Integrity, Compliance & Culture: a selection of three current activity areas 1. Implementation of Holistic Integrity Programme:
Six action fields form the basis for a holistic integrity programme:
2. Evolution of Group Compliance:
Three areas were defined:
1. Development of Group Compliance Values
2. Clear definition of Group Compliance Objectives
3. Adjustment of Group Compliance structure
Compliance scope:
3. Development of Code of Cooperation:
Mutual rules and guidelines of working together were developed:
• Cross functional
• Aims at corporate culture
• Includes all brands
Anti-corruption
Fraud Prevention
Investigation of Compliance violations
Money laundering Prevention
Human Rights
Embezzlement Prevention

We know we have to earn your trust!
We are only promising what we have commitments for!
We will improve our targets once we make visible progress!
We have a plan and strongly believe in it!
In Summary:
52
Deliveries & Global Trends Key Financials & Cash Brands / RegionsStrategic Outlook &
Milestones Diesel Remuneration Integrity & Compliance Commitment

Investor Relations Team
Oliver Larkin (Wolfsburg / London office)Group Head of Investor RelationsE-Mail: [email protected] Telephone: +49 5361 9 49840
Helen Beckermann (Wolfsburg office) Senior Investor Relations ManagerE-Mail: [email protected]: +49 5361 9 49015
Alexander Hunger (Wolfsburg office)
Senior Investor Relations OfficerE-Mail: [email protected] Telephone: +49 5361 9 47420
Andreas Kowalczyk (Wolfsburg office) Investor Relations OfficerE-Mail: [email protected]: +49 5361 9 23183
Ulrich Hauswaldt (Wolfsburg office) Investor Relations OfficerE-Mail: [email protected]: +49 5361 9 42224
Andreas Buchta (Wolfsburg office) Investor Relations ManagerE-Mail: [email protected]: + 49 5361 9 40765
Lennart Schmidt (China office) Investor Relations ManagerE-Mail: [email protected]: + 86 10 6531 4732
Deliveries & Global Trends Key Financials & Cash Brands / RegionsStrategic Outlook &
Milestones Diesel Remuneration Integrity & Compliance Commitment
53

Current system: backward-looking Future: forward-looking
Special remuneration(2 years retrospectively)
PLB
LTI(4 years retrospectively)
Fixed remune-
ration
FYn-3 FYn-1 FYn FYn+1FYn-2 FYn+2
Annual Bonus
Performance Share Plan(3 years forward-looking)
Fixed remune-
ration
FYn-3 FYn-1 FYn FYn+1FYn-2 FYn+2
Payout after FYn
Payout after FYn+2
Adjusted recommendation of no. 4.2.3 sec. 2 German Corporate Governance Code
“Variable remuneration components shall generally be based on a multi-year assessment, which shall be materially related to the future.”
The new remuneration system is designed to be completely forward-looking
54
Deliveries & Global Trends Key Financials & Cash Brands / RegionsStrategic Outlook &
Milestones Diesel Remuneration Integrity & Compliance Commitment

… is common market practice and conforms to regulatory requirements
… is capital market-oriented and reflects human resource-related transformation objectives
… integrates strategic objectives of the TOGETHER strategy 2025
… sets ambitious objectives for sustainable corporate development
… incorporates a higher long-term orientation
… constitutes a core element of the realignment of the Group
… reflects no past events and is therefore completely forward-looking
… is based on a transparent target remuneration approach
… incorporates a total cap noticeably lower than the individual caps
… is based on clear remuneration policy guidelines
… is transparent and is easy to comprehend
The new remuneration system harmonizes the interests of differentstakeholder groups
55
Deliveries & Global Trends Key Financials & Cash Brands / RegionsStrategic Outlook &
Milestones Diesel Remuneration Integrity & Compliance Commitment

56
Volkswagen T-Roc

57
Volkswagen I.D.BUZZ

58
Audi Q5
58
AUDI Q5
5959
Porsche Cayenne

6060
ŠKODA Karoq
61
SEAT Arona
62
Bentley Bentayga
62
63
Lamborghini Centenario
63

64
Bugatti Chiron
64

65
Volkswagen Crafter
65

Volkswagen GroupFrank WitterChief Financial OfficerUS Roadshow with Goldman Sachs, New York & Boston, 30-31 October 2017