2012 google annual report
92
Here’s to Lady Ada Lovelace. In 1843, she foresaw the future of computing.
Transcript of 2012 google annual report

Here’s to Lady Ada Lovelace.In 1843, she foresaw the future of computing.

In 1843, Ada Lovelace imagined a machine capable of
extraordinary things, limited only by the creativity of its
programmer—nearly a century before the fi rst computers
were built.
Ada was inspired by her colleague Charles Babbage’s
Analytic Engine. She saw Babbage’s engine as a machine
that could manipulate symbols in accordance with a set
of rules, but eloquently observed that the symbols could
extend well beyond numbers and equations:
The Analytical Engine weaves algebraic patterns just as the Jacquard loom weaves fl owers and leaves.
In collaboration with Babbage, she contributed step-by-step
instructions for how the machine could calculate a sequence
of Bernoulli numbers. In effect, this was the world’s fi rst
published algorithm.
Ada imagined a device that could accomplish far more than
mathematics. She mused about its potential to compose music:
Supposing, for instance, that the fundamental relationsof pitched sounds in the science of harmony and of musical composition were susceptible of such expression and adaptations, the engine might compose elaborate and scientifi c pieces of music of any degree of complexity or extent.
We salute Ada Lovelace as computing’s visionary founder and
hope she’d be proud of the world she inspired.
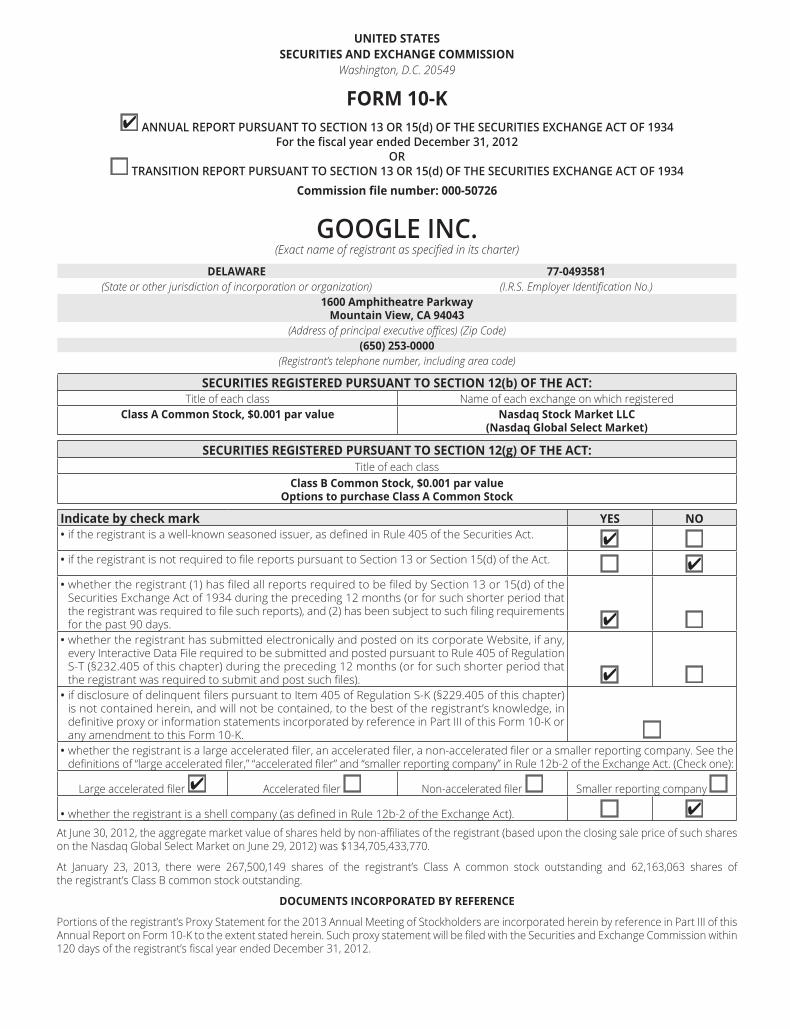
UNITED STATESSECURITIES AND EXCHANGE COMMISSION
Washington, D.C. 20549
FORM 10-K ANNUAL REPORT PURSUANT TO SECTION 13 OR 15(d) OF THE SECURITIES EXCHANGE ACT OF 1934
For the fi scal year ended December 31, 2012OR
TRANSITION REPORT PURSUANT TO SECTION 13 OR 15(d) OF THE SECURITIES EXCHANGE ACT OF 1934Commission fi le number: 000-50726
GOOGLE INC.(Exact name of registrant as specifi ed in its charter)
DELAWARE 77-0493581(State or other jurisdiction of incorporation or organization) (I.R.S. Employer Identifi cation No.)
1600 Amphitheatre ParkwayMountain View, CA 94043
(Address of principal executive offi ces) (Zip Code)(650) 253-0000
(Registrant’s telephone number, including area code)
SECURITIES REGISTERED PURSUANT TO SECTION 12(b) OF THE ACT:Title of each class Name of each exchange on which registered
Class A Common Stock, $0.001 par value Nasdaq Stock Market LLC(Nasdaq Global Select Market)
SECURITIES REGISTERED PURSUANT TO SECTION 12(g) OF THE ACT:Title of each class
Class B Common Stock, $0.001 par valueOptions to purchase Class A Common Stock
Indicate by check mark YES NO • if the registrant is a well-known seasoned issuer, as defi ned in Rule 405 of the Securities Act.
• if the registrant is not required to fi le reports pursuant to Section 13 or Section 15(d) of the Act.
• whether the registrant (1) has fi led all reports required to be fi led by Section 13 or 15(d) of the Securities Exchange Act of 1934 during the preceding 12 months (or for such shorter period that the registrant was required to fi le such reports), and (2) has been subject to such fi ling requirements for the past 90 days.
• whether the registrant has submitted electronically and posted on its corporate Website, if any, every Interactive Data File required to be submitted and posted pursuant to Rule 405 of Regulation S-T (§232.405 of this chapter) during the preceding 12 months (or for such shorter period that the registrant was required to submit and post such fi les).
• if disclosure of delinquent fi lers pursuant to Item 405 of Regulation S-K (§229.405 of this chapter) is not contained herein, and will not be contained, to the best of the registrant’s knowledge, in defi nitive proxy or information statements incorporated by reference in Part III of this Form 10-K or any amendment to this Form 10-K.
• whether the registrant is a large accelerated fi ler, an accelerated fi ler, a non-accelerated fi ler or a smaller reporting company. See the defi nitions of “large accelerated fi ler,” “accelerated fi ler” and “smaller reporting company” in Rule 12b-2 of the Exchange Act. (Check one):
Large accelerated fi ler Accelerated fi ler Non-accelerated fi ler Smaller reporting company
• whether the registrant is a shell company (as defi ned in Rule 12b-2 of the Exchange Act).
At June 30, 2012, the aggregate market value of shares held by non-affi liates of the registrant (based upon the closing sale price of such shares on the Nasdaq Global Select Market on June 29, 2012) was $134,705,433,770.
At January 23, 2013, there were 267,500,149 shares of the registrant’s Class A common stock outstanding and 62,163,063 shares of the registrant’s Class B common stock outstanding.
DOCUMENTS INCORPORATED BY REFERENCE
Portions of the registrant’s Proxy Statement for the 2013 Annual Meeting of Stockholders are incorporated herein by reference in Part III of this Annual Report on Form 10-K to the extent stated herein. Such proxy statement will be fi led with the Securities and Exchange Commission within 120 days of the registrant’s fi scal year ended December 31, 2012.


Table of Contents
Note About Forward-Looking Statements 1
Part I 2
ITEM 1. Business ...........................................................................................................................................................................................................................................................................................................2ITEM 1A. Risk Factors ................................................................................................................................................................................................................................................................................................9ITEM 1B. Unresolved Staff Comments ....................................................................................................................................................................................................................................20ITEM 2. Properties ..................................................................................................................................................................................................................................................................................................20ITEM 3. Legal Proceedings .......................................................................................................................................................................................................................................................................20ITEM 4. Mine Safety Disclosures ...................................................................................................................................................................................................................................................20
Part II 21
ITEM 5. Market for Registrant’s Common Equity, Related Stockholder Mattersand Issuer Purchases of Equity Securities .......................................................................................................................................................................................21
ITEM 6. Selected Financial Data .....................................................................................................................................................................................................................................................24ITEM 7. Management’s Discussion and Analysis of Financial Condition and Results of Operations ...................25ITEM 7A. Quantitative and Qualitative Disclosures About Market Risk ........................................................................................................................41ITEM 8. Financial Statements and Supplementary Data ....................................................................................................................................................................43ITEM 9. Changes in and Disagreements With Accountants on Accounting and Financial Disclosure ...............75ITEM 9A. Controls and Procedures ...............................................................................................................................................................................................................................................75ITEM 9B. Other Information ......................................................................................................................................................................................................................................................................75
Part III 76
ITEM 10. Directors, Executive Offi cers and Corporate Governance ...................................................................................................................................76ITEM 11. Executive Compensation ................................................................................................................................................................................................................................................76ITEM 12. Security Ownership of Certain Benefi cial Owners and Management
and Related Stockholder Matters ...................................................................................................................................................................................................................76ITEM 13. Certain Relationships and Related Transactions, and Director Independence ..............................................................76ITEM 14. Principal Accounting Fees and Services ...............................................................................................................................................................................................76
Part IV 77
ITEM 15. Exhibits, Financial Statement Schedules ............................................................................................................................................................................................77
Google Inc. Form 10-K For the Fiscal Year Ended December 31, 2012
Contents

Contents
1GOOGLE INC. | Form 10-K
Note About Forward-Looking StatementsThis Annual Report on Form 10-K contains forward-looking statements within the meaning of the Private Securities Litigation Reform Act of 1995. These statements include, among other things, statements regarding:
• the growth of our business and revenues and our expectations about the factors that infl uence our success and trends in our business;
• seasonal fl uctuations in internet usage and traditional retail seasonality, which are likely to cause fl uctuations in our quarterly results;
• our plans to continue to invest in systems, facilities, and infrastructure, to increase in our hiring and provide competitive compensation programs, as well as to continue our current pace of acquisitions;
• the potential for declines in our revenue growth rate;
• our expectation that growth in advertising revenues from our websites will continue to exceed that from our Google Network Members’ websites, which will have a positive impact on our operating margins;
• our expectation that we will continue to pay most of the fees we receive from advertisers to our Google Network Members;
• our expectations about the impact of our acquisition of Motorola Mobility Holdings, Inc. (Motorola) on our results and business and our ability to realize the expected benefi ts from the acquisition and successfully implement our plans and expectations for Motorola’s business;
• our expectation that we will continue to take steps to improve the relevance of the ads we deliver and to reduce the number of accidental clicks;
• fl uctuations in aggregate paid clicks and average cost-per-click;
• our belief that our foreign exchange risk management program will not fully off set the exposure to fl uctuations in foreign currency exchange rates;
• the increase of costs related to hedging activities under our foreign exchange risk management program;
• our expectation that our cost of revenues, research and development expenses, sales and marketing expenses, and general and administrative expenses will increase in dollars and may increase as a percentage of revenues;
• our potential exposure in connection with pending investigations and proceedings;
• our expectations about our board of directors’ intention to declare a dividend of shares of the new Class C capital stock, as well as the timing of that dividend, if declared and paid;
• our expectation that our traffi c acquisition costs will fl uctuate in the future;
• our continued investments in international markets;
• estimates of our future compensation expenses;
• fl uctuations in our eff ective tax rate;
• the suffi ciency of our sources of funding;
• our payment terms to certain advertisers, which may increase our working capital requirements;
• fl uctuations in our capital expenditures;
• our expectations about the timing of disposition of the Home business;
a s well as other statements regarding our future operations, fi nancial condition and prospects, and business strategies. Forward-looking statements may appear throughout this report, including without limitation, the following sections: Item 1 “Business,” Item 1A “Risk Factors,” and Item 7 “Management’s Discussion and Analysis of Financial Condition and Results of Operations.” Forward-looking statements generally can be identifi ed by words such as “anticipates,” “believes,” “estimates,” “expects,” “intends,” “plans,” “predicts,” “projects,” “will be,” “will continue,” “will likely result,” and similar expressions. These forward-looking statements are based on current expectations and assumptions that are subject to risks and uncertainties, which could cause our actual results to diff er materially from those refl ected in the forward-looking statements. Factors that could cause or contribute to such diff erences include, but are not limited to, those discussed in this Annual Report on Form 10-K, and in particular, the risks discussed under the caption “Risk Factors” in Item 1A and those discussed in other documents we fi le with the Securities and Exchange Commission (SEC). We undertake no obligation to revise or publicly release the results of any revision to these forward-looking statements, except as required by law. Given these risks and uncertainties, readers are cautioned not to place undue reliance on such forward-looking statements.
As used herein, “Google,” “we,” “our,” and similar terms include Google Inc. and its subsidiaries, unless the context indicates otherwise.
“Google” and other trademarks of ours appearing in this report are our property. This report contains additional trade names and trademarks of other companies. We do not intend our use or display of other companies’ trade names or trademarks to imply an endorsement or sponsorship of us by such companies, or any relationship with any of these companies.
Contents
2 GOOGLE INC. | Form 10-K
PART I ITEM 1. Business
PART I
ITEM 1. Business
Overview
Google is a global technology leader focused on improving the ways people connect with information. We aspire to build products and provide services that improve the lives of billions of people globally. Our mission is to organize the world’s information and make it universally accessible and useful. Our innovations in web search and advertising have made our website a top internet property and our brand one of the most recognized in the world.
Our Motorola business is comprised of two operating segments. The Mobile segment is focused on mobile wireless devices and related products and services. The Home segment is focused on technologies and devices that provide video entertainment services to consumers by enabling subscribers to access a variety of interactive digital television services.
We generate revenue primarily by delivering relevant, cost-eff ective online advertising. Businesses use our AdWords program to promote their products and services with targeted advertising. In addition, the third parties that comprise the Google Network use our AdSense program to deliver relevant ads that generate revenues and enhance the user experience. We also generate revenues from Motorola by selling hardware products.
In December 2012, we entered into an agreement with Arris Group, Inc. (Arris) and certain other persons providing for the disposition of our Motorola Home segment. The transaction is expected to close in 2013.
Our business is primarily focused around the following key areas: search, advertising, operating systems and platforms, enterprise and hardware products.
We were incorporated in California in September 1998 and reincorporated in Delaware in August 2003. Our headquarters are located at 1600 Amphitheatre Parkway, Mountain View, California 94043, and our telephone number is (650) 253-0000. We completed our initial public off ering in August 2004 and our Class A common stock is listed on the Nasdaq Global Select Market under the symbol “GOOG.”
2012 Corporate Highlights
• Android—The growth of our Android operating system continues to impress with approximately half a billion Android devices activated globally through September 2012.
• Google Play—We launched Google Play, an entirely cloud-based, digital entertainment destination with more than 700,000 apps and games plus music, movies and books that our users can fi nd, enjoy and share on the web and on their Android phone or tablet.
• Social—“Growing the + and shipping the Google.” In 2011, we launched Google+, a new way to share online just like users do in the real world, sharing diff erent things with diff erent people. In late 2011 and continuing in 2012, we have tightened integration between Google+ and our other Google properties, such as Gmail and YouTube and now have 235 million active users across our Google properties.
• Nexus 7 Tablet—We launched a powerful new tablet in June 2012 with a vibrant, 7” high-defi nition display. The Tegra-3 chipset, with a quad-core CPU and 12-core GPU, makes everything, including games, extremely fast. And at only 340 grams, lighter than most tablets, Nexus 7 was built to bring users the best of Google that can be held in the palm of the user’s hand.
• Google Now—We introduced Google Now, a predictive search feature that gets you just the right information at just the right time. It tells you the day’s weather before you start your day, how much traffi c to expect before you leave for work or school, when the next train will arrive as you’re standing on the platform, or your favorite team’s score while they’re playing – all automatically with cards appearing throughout the day at the moment you need them.
• Knowledge Graph—Google’s Knowledge Graph, introduced in 2012, enables the user to search for things, people or places that Google knows about – landmarks, celebrities, cities, sports teams, buildings, geographical features, movies, works of arts and more – and enhances Google Search by understanding the ambiguities in language and by better understanding a user’s query.
Contents

3GOOGLE INC. | Form 10-K
PART I ITEM 1. Business
On December 19, 2012, Google and Arris announced that Motorola Mobility had entered into an agreement (Motorola Agreement) with Arris and certain other persons providing for the disposition of the Home business for total consideration of approximately $2.35 billion in cash and common stock, subject to certain adjustments. Arris announced in January 2013 that it has agreed to sell approximately 10.6 million shares of its common stock, valued at $150.0 million, to Comcast Corporation with the closing of the Comcast investment and the Home business disposition expected to occur simultaneously. As provided for in the Motorola Agreement, the Comcast transaction will reduce the amount of stock consideration and increase the amount of cash consideration to be received by Google, but will not aff ect the total consideration. Specifi cally, the shares issued to Comcast will reduce, on a share-for-share basis, the number of shares of Arris common stock to be issued to Google and simultaneously increase the cash consideration to be received by Google by $150.0 million. Assuming the completion of the Comcast transaction, Comcast and Google will each own approximately 7.85% of the outstanding Arris common stock post-closing based on Arris’ capitalization as of the date of Arris’ announcement of the Comcast transaction. The disposition of the Home business to Arris is not contingent upon Arris’ sale of common stock to Comcast. In the event that Arris’ sale of common stock to Comcast does not close for any reason, there will be no reduction in the amount of shares of Arris common stock to be issued to Google and no corresponding increase in the amount of cash consideration. In that case, Google will own approximately 15.7% of the outstanding Arris common stock post-closing based on Arris’ capitalization as of the date of the Arris’ announced transaction with Google. The disposition of the Home business is expected to close in 2013.
In January 2013, the FTC closed its investigations into our business practices, including search and advertising. In connection with the closing of the investigation, we have voluntarily agreed to make certain product changes. In addition, we and Motorola have entered into a consent order with the FTC setting forth certain guidelines on our use of standards-essential patents in litigation.
Search
Our search technologies sort through an ever-growing amount of information to deliver relevant and useful search results in response to user queries. We integrate innovative features into our search service and off er specialized search services to help users tailor their search. In addition, we are constantly improving and adding to our products and services, to provide users with more relevant results so that users fi nd what they are looking for faster. For instance, when users want to plan a trip, Flight Search is a feature that makes it easy for users to fi nd fl ights that meet their needs. Whether they have a specifi c destination with dates in mind or not, Flight Search can help users quickly fi nd the best options for their trips. We also off er Product Listing Ads, which include richer product information, such as product image, price, and merchant information, without requiring additional keywords or ad text.
In January 2012, we launched Search plus Your World. Now, when a user performs a signed-in search on Google, the user’s results page may include Google+ content from people that the user is close to (or might be interested in following). Relevant Google+ profi les and Google+ pages related to a specifi c topic or area of interest may also appear on a user’s results page.
In 2012, we also introduced Google Now and Google’s Knowledge Graph. Google Now is a predictive search feature that gets you just the right information at just the right time. It tells you the day’s weather before you start your day, how much traffi c to expect before you leave for work or school, when the next train will arrive as you’re standing on the platform, or your favorite team’s score while they’re playing—all automatically with cards appearing throughout the day at the moment you need them. Google’s Knowledge Graph, introduced in 2012, enables the user to search for things, people or places that Google knows about – landmarks, celebrities, cities, sports teams, buildings, geographical features, movies, works of arts and more – and enhances Google Search in three main ways:
• Find the Right Thing—By understanding the ambiguities and nuances in language the way users do, the Knowledge Graph makes Google Search more intelligent and relevant.
• Get the Best Summary—With the Knowledge Graph, we can better understand a user’s query, so that we can summarize relevant content around that topic, including key facts users likely need for that particular query.
• Go Deeper and Broader—The Knowledge Graph can help you make some unexpected discoveries. We’ve always believed that the perfect search engine should understand exactly what you mean and give you back exactly what you want. And we can sometimes help answer your next question before you’ve asked it, because the facts we show are informed by what other people have searched for.
Advertising
Google Search
The goal of AdWords, our primary auction-based advertising program, is to deliver ads that are so useful and relevant to search queries or web content that they are a form of information in their own right. With AdWords, advertisers create simple text-based ads that then appear beside related search results or web content on our websites and on thousands of partner websites in our Google Network, which is the network of third parties that use our advertising programs to deliver relevant ads with their search
Contents
4 GOOGLE INC. | Form 10-K
PART I ITEM 1. Business
results and content. Most of our AdWords customers pay us on a cost-per-click basis, which means that an advertiser pays us only when a user clicks on one of its ads. We also off er AdWords on a cost-per-impression basis that enables advertisers to pay us based on the number of times their ads appear on our websites and our Google Network Members’ websites as specifi ed by the advertiser.
Our AdSense program enables websites that are part of the Google Network to deliver ads from our AdWords advertisers that are relevant to the search results or content on their websites. We share the majority of the revenues generated from these ads with the Google Network Members that display the ads. The AdSense program enables advertisers to extend the reach of their ad campaigns, improves our partners’ ability to generate revenue from their content, and delivers relevant ads for their users.
To make mobile ad buying seamless and accessible for more than a million AdWords advertisers, we integrated our AdMob technology directly into our AdWords system in June 2012. This enables advertisers to run eff ective campaigns across the more than 300,000 mobile applications running ads by AdMob – all from within the AdWords interface. AdWords advertisers can now manage, measure and adjust search, display and video ads, reaching people on more than 2 million websites and hundreds of thousands of apps, across all screens.
Google Display
Display advertising comprises the videos, text, images, and other interactive ads that run across the web on computers and mobile devices, including smart phones and handheld computers such as netbooks and tablets. The Google Display Network provides advertisers services related to the delivery of display advertising across publishers participating in our AdSense program, publishers participating in the DoubleClick Ad Exchange, and Google-owned sites such as YouTube and Google Finance.
Through our DoubleClick advertising technology, we provide to publishers, agencies, and advertisers the ad serving technology, which is the infrastructure that enables billions of ads to be served each day across the web. Our DoubleClick Ad Exchange creates a real-time auction marketplace for the trading of display ad space. We aim to simplify display advertising so it is easier for advertisers and publishers to manage campaigns across diff erent formats, on diff erent websites, and for diff erent devices.
In addition, YouTube provides a range of video, interactive, and other ad formats for advertisers to reach their intended audience. YouTube’s video advertising solutions give advertisers a way to promote their content to the YouTube community, as well as to associate with content being watched by their target audience. YouTube also off ers analytic tools to help advertisers understand their audience and derive general business intelligence. In the past year, YouTube has experienced strong growth in mobile viewers and has established key partnerships with content companies to help monetize mobile video.
Google Mobile
Mobile advertising is still in early innings, though the mobile device is quickly becoming the world’s newest gateway to information. Google is focused on developing easy-to-use ad products to help advertisers extend their reach, help create revenue opportunities for our publisher partners, and deliver relevant and useful ads to users on the go.
Google Mobile extends our products and services by providing mobile-specifi c features to mobile device users. Our mobile-specifi c search technologies include search by voice, search by sight, and search by location. Google Mobile also optimizes a large number of Google’s applications for mobile devices in both browser and downloadable form. In addition, we off er advertisers the ability to run search ad campaigns on mobile devices with popular mobile-specifi c ad formats, such as click-to-call ads in which advertisers can include a phone number within ad text. AdMob also off ers eff ective ad units and solutions for application developers and advertisers. We continue to invest in improving users’ access to Google services through their mobile devices.
Google Local
Google is committed to providing users with relevant local information. We’ve organized information around more than 80 million places globally from various sources across the web. Users can fi nd addresses, phone numbers, hours of operation, directions and more for millions of local queries like shops, restaurants, parks and landmarks right on Google.com, on Google Maps and on Google Maps for mobile. They can also discover more places that are right for them by rating the places they’ve been, and getting customized recommendations based on their tastes and those of their friends directly within Google Maps. Our products and services also help local business owners manage their online presence and connect with potential customers. Millions of business owners have verifi ed their free business listings via Google Places to ensure that users have up-to-date information about their establishments, and to contribute additional details such as photos and products/services off ered. Google Off ers brings people daily deals from local and national businesses, redeemable for discounted goods or services. From restaurants to spa treatments to outdoor adventures, Google has deals from the best businesses a city has to off er as well as popular national brands.
Contents
5GOOGLE INC. | Form 10-K
PART I ITEM 1. Business
Operating Systems and Platforms
Android
Working closely with the Open Handset Alliance, a business alliance of more than 75 technology and mobile companies, we developed Android, a free, fully open source mobile software platform that any developer can use to create applications for mobile devices and any handset manufacturer can install on a device. We believe Android will drive greater innovation and choice in the mobile device ecosystem, and provide consumers with a more powerful mobile experience.
Google Chrome OS and Google Chrome
Google Chrome OS is an open source operating system with the Google Chrome web browser as its foundation. Both the Google Chrome OS and the Google Chrome browser are built around the core tenets of speed, simplicity, and security. Designed for people who spend most of their time on the web, the Google Chrome OS is a new approach to operating systems. We are working with several original equipment manufacturers to bring computers running Google Chrome OS to users and businesses. The Chrome browser runs on Windows, Mac, and Linux computers.
Google+
Google+ is a new way to share online just like users do in the real world, sharing diff erent things with diff erent people. In late 2011 and continuing in 2012, we have tightened integration between Google+ and our other Google properties, such as Gmail and YouTube and now have 235 million active users across our Google properties.
Google Play
Google Play is an entirely cloud-based, digital entertainment destination with more than 700,000 apps and games plus music, movies and books that our users can fi nd, enjoy and share on the web and on their Android phone or tablet.
Google Drive
Google Drive is a place where users can create, share, collaborate, and keep all of their stuff . Google Docs is built right into Google Drive so users can work with others in real time on documents, spreadsheets and presentations and users’ fi les go everywhere they do. When users change a fi le on the web, on their computer, or on their mobile device, the fi le updates on every device where users have installed Google Drive.
Google Wallet
Google Wallet is a virtual wallet that securely stores your credit and debit cards, off ers, and rewards cards. Users can tap their phone to pay in-store using Google Wallet anywhere contactless payments are accepted – at over 200,000 merchants across the United States. Users can also pay online by signing into their Google Wallet account.
Google TV
Google TV is a platform that gives consumers the power to experience television and the internet on a single screen, with the ability to search and fi nd the content they want to watch. The Google TV platform is based on the Android operating system and runs the Google Chrome browser.
Enterprise
Google’s enterprise products provide familiar, easy-to-use Google technology for business settings. Through Google Apps, which includes Gmail, Google Docs, Google Calendar, and Google Sites, among other features, we provide hosted, web-based applications that people can use on any device with a browser and an internet connection. In addition, we provide our search technology for use within enterprises through the Google Search Appliance (real-time search of business applications, intranet applications, and public websites), on their public-facing sites with Google Site Search (custom search engine), and Google Commerce Search (for online retail enterprises). We also provide versions of our Google Maps Application Programming Interface (API) for businesses (including fully interactive Google Maps for public and internal websites), as well as Google Earth Enterprise (a behind-the-company-fi rewall software solution for imagery and data visualization). Our enterprise solutions have been adopted by a variety of businesses, governments, schools, and non-profi t organizations. Google Apps is the fi rst cloud computing suite of message and collaboration tools to receive U.S. government security certifi cation.
Contents

6 GOOGLE INC. | Form 10-K
PART I ITEM 1. Business
Motorola
Our Motorola Mobility business is comprised of two operating segments. The Mobile segment is focused on mobile wireless devices and related products and services. The Home segment is focused on technologies and devices that provide video entertainment services to consumers by enabling subscribers to access a variety of interactive digital television services. In December 2012, we entered into an agreement with Arris Group, Inc. and certain other persons providing for the disposition of our Home segment. The transaction is expected to close in 2013.
Research
We continue to develop new products and services and to enhance our existing ones through research and product development and the licensing and acquisition of third-party businesses and technology. Our product development philosophy is to launch innovative products early and often, and then iterate rapidly to make those products even better. We often post early stage products at test locations online or directly on Google.com. We then use data and user feedback to decide if and how to invest further in those products.
Our research and development expenses were $3.8 billion, $5.2 billion, and $6.8 billion in 2010, 2011, and 2012, respectively, which included stock-based compensation expense of $861 million, $1.1 billion, and $1.3 billion, respectively. We expect to continue to invest in building the employee and systems infrastructures needed to support the development of new products and services and to improve existing ones.
Intellectual Property
We rely on a combination of intellectual property laws, as well as confi dentiality procedures and contractual provisions, to protect our proprietary technology and our brand. We have registered, and applied for the registration of, U.S. and international trademarks, service marks, domain names, and copyrights. Additionally, we have fi led U.S. and international patent applications covering certain of our proprietary technology. Over time, we have assembled a portfolio of patents, trademarks, service marks, copyrights, domain names, and trade secrets covering our products and services. Our proprietary technology is not dependent on any single patent or copyright or groups of related patents or copyrights. We believe the duration of our patents is adequate relative to the expected lives of our products. Although we rigorously protect our proprietary technology, any signifi cant impairment of, or third-party claim against, our intellectual property rights could harm our business or our ability to compete.
Sales and Support
We continue to develop and grow our sales and support infrastructure. We have over 85 offi ces in over 40 countries, the large majority of which include sales people. Our global sales and support infrastructure has specialized teams across vertical markets. We bring businesses into our advertising network through direct, remote, and online sales channels, using technology and automation wherever possible to improve our customers’ experience and to grow our business cost-eff ectively. Our direct advertising and sales teams focus on building relationships with the largest advertisers and leading internet companies. We have built a multi-product sales force, with teams selling campaigns that include search, display (including DoubleClick and YouTube), and mobile advertising.
We provide customer service to our advertiser base through our global support organization. Our global support organization concentrates on helping our advertisers and Google Network Members get the most out of their relationship with us.
No individual customer or groups of affi liated customers represented more than 10% of our revenues in 2010, 2011, or 2012.
Government Contracts
No material portion of our business is subject to renegotiation of profi ts or termination of contracts or subcontracts at the election of the U.S. government.
Contents
7GOOGLE INC. | Form 10-K
PART I ITEM 1. Business
Marketing
Google’s global brand is well known. We believe that building a trusted, highly recognized brand begins with providing high-quality products and services that make a notable diff erence in people’s lives. Marketing is responsible for generating advertiser revenue through marketing campaigns to small businesses, as well as providing thought leadership to chief marketing offi cers through industry insight, research, and analysis. Our marketing, promotional, and public relations activities are designed to promote Google’s brand image and diff erentiate it from competitors.
Competition
Our business is characterized by rapid change and converging, as well as new and disruptive, technologies. We face formidable competition in every aspect of our business, particularly from companies that seek to connect people with information on the web and provide them with relevant advertising. We face competition from:
• General purpose search engines, such as Yahoo and Microsoft’s Bing.
• Vertical search engines and e-commerce websites, such as Kayak (travel queries), Monster.com (job queries), WebMD (for health queries), and Amazon.com and eBay (e-commerce). Some users will navigate directly to such websites rather than go through Google.
• Social networks, such as Facebook and Twitter. Some users are relying more on social networks for product or service referrals, rather than seeking information through general purpose search engines.
• Other forms of advertising, such as television, radio, newspapers, magazines, billboards, and yellow pages, for ad dollars. Our advertisers typically advertise in multiple media, both online and offl ine.
• Mobile applications on iPhone and Android devices, which allow users to access information directly from a publisher without using search engines.
• Providers of online products and services. A number of our online products and services, including Gmail, YouTube, and Google Docs, compete directly with new and established companies, which off er communication, information, and entertainment services integrated into their products or media properties.
We compete to attract and retain users, for whom other products and services are literally one click away, primarily on the basis of the relevance and usefulness of our search results and the features, availability, and ease of use of our products and services.
We also compete to attract and retain content providers (Google Network Members, as well as other content providers for whom we distribute or license content), primarily based on the size and quality of our advertiser base, our ability to help these partners generate revenues from advertising, and the terms of our agreements with them.
Government Regulation
We are subject to numerous domestic and foreign laws and regulations covering a wide variety of subject matter. New laws and regulations (or new interpretations of existing laws and regulations) may also impact our business. The costs of compliance with these laws and regulations are high and are likely to increase in the future and any failure on our part to comply with these laws may subject us to signifi cant liabilities and other penalties.
Culture and Employees
We take great pride in our culture. We embrace collaboration and creativity, and encourage the iteration of ideas to address complex technical challenges. Transparency and open dialog are central to us, and we like to ensure that company news reaches our employees fi rst through internal channels.
Despite our rapid growth, we still cherish our roots as a startup and give employees the freedom to act on their ideas regardless of role or function within the company. We strive to hire the best employees, with backgrounds and perspectives as diverse as our global users. We provide an environment where these talented people can have fulfi lling careers working on some of the biggest challenges in technology, and have a huge, positive impact on the world.
Contents

8 GOOGLE INC. | Form 10-K
PART I ITEM 1. Business
At December 31, 2012, we had 53,861 full-time employees, consisting of 19,746 in research and development, 15,306 in sales and marketing, 6,214 in general and administrative, and 12,595 in operations. All of Google’s full-time employees are also equityholders, with signifi cant collective employee ownership. Although we have works councils and statutory employee representation obligations in certain countries, our U.S. employees are not represented by a labor union and we consider our employee relations to be good. Competition for qualifi ed personnel in our industry is intense, particularly for software engineers, computer scientists, and other technical staff .
Global Operations and Geographic Data
We provide our products and services in more than 100 languages and in more than 50 countries, regions, and territories. On www.google.comor one of our other Google domains, users can fi nd information in many diff erent languages and in many diff erent formats. The United States accounted for approximately 47% of our revenues in 2012. Information regarding fi nancial data by geographic areas is set forth in Item 7 and Item 8 of this Annual Report on Form 10-K. See Note 15 of Notes to Consolidated Financial Statements under Item 8.
Seasonality
Our business is aff ected by both seasonal fl uctuations in internet usage and traditional retail seasonality. Internet usage generally slows during the summer months, and commercial queries typically increase signifi cantly in the fourth quarter of each year. These seasonal trends have caused and will likely continue to cause, fl uctuations in our quarterly results, including fl uctuations in sequential revenue growth rates.
Available Information
Our website is located at www.google.com, and our investor relations website is located at http://investor.google.com. The following fi lings are available through our investor relations website after we fi le them with the SEC: Annual Reports on Form 10-K, Quarterly Reports on Form 10-Q, and our Proxy Statements for our annual meetings of stockholders, for the last three years. These fi lings are also available for download free of charge on our investor relations website. We also provide a link to the section of the SEC’s website at www.sec.gov that has all of our public fi lings, including Annual Reports on Form 10-K, Quarterly Reports on Form 10-Q, Current Reports on Form 8-K, all amendments to those reports, our Proxy Statements, and other ownership related fi lings. Further, a copy of this Annual Report on Form 10-K is located at the SEC’s Public Reference Room at 100 F Street, NE, Washington, D.C. 20549. Information on the operation of the Public Reference Room can be obtained by calling the SEC at 1-800-SEC-0330.
We webcast our earnings calls and certain events we participate in or host with members of the investment community on our investor relations website. Additionally, we provide notifi cations of news or announcements regarding our fi nancial performance, including SEC fi lings, investor events, press and earnings releases, and blogs as part of our investor relations website as well as on our investor relations Google+ page (https://plus.google.com/+GoogleInvestorRelations/posts). Investors and others can receive notifi cations of new information posted on our investor relations website in real time by signing up for email alerts and RSS feeds. Further corporate governance information, including our certifi cate of incorporation, bylaws, governance guidelines, board committee charters, and code of conduct, is also available on our investor relations website under the heading “Corporate Governance.” The contents of our websites are not incorporated by reference into this Annual Report on Form 10-K or in any other report or document we fi le with the SEC, and any references to our websites are intended to be inactive textual references only.
Contents

9GOOGLE INC. | Form 10-K
PART I ITEM 1A. Risk Factors
ITEM 1A. Risk FactorsOur operations and fi nancial results are subject to various risks and uncertainties, including those described below, which could adversely aff ect our business, fi nancial condition, results of operations, cash fl ows, and the trading price of our common stock.
Risks Related to Our Business and Industry
We face intense competition. If we do not continue to innovate and provide products and services that are useful to users, we may not remain competitive, and our revenues and operating results could be adversely aff ected.
Our business is rapidly evolving and intensely competitive, and is subject to changing technologies, shifting user needs, and frequent introductions of new products and services. Our ability to compete successfully depends heavily on providing products and services that make using the internet a more useful and enjoyable experience for our users and delivering innovative products and technologies to the marketplace. With our acquisition of Motorola, the competitive pressure to innovate will now encompass a wider range of products and services, including products and services that may be outside of our historical core business.
We have many competitors in diff erent industries, including general purpose search engines, vertical search engines and e-commerce sites, social networking sites, traditional media companies, wireless mobile device companies, and providers of online products and services. Our current and potential competitors range from large and established companies to emerging start-ups. Established companies have longer operating histories and more established relationships with customers and users, and they can use their experience and resources in ways that could aff ect our competitive position, including by making acquisitions, investing aggressively in research and development, aggressively initiating intellectual property claims (whether or not meritorious) and competing aggressively for advertisers and websites. Emerging start-ups may be able to innovate and provide products and services faster than we can.
Our competitors are constantly developing innovations in web search, online advertising, wireless mobile devices, and web-based products and services. The research and development of new, technologically advanced products is also a complex and uncertain process requiring high levels of innovation and investment, as well as the accurate anticipation of technology, market trends and consumer needs. As a result, we must continue to invest signifi cant resources in research and development, including through acquisitions, in order to enhance our web search technology and our existing products and services, and introduce new products and services that people can easily and eff ectively use. If we are unable to provide quality products and services, then acceptance rates for our products and services could decline and aff ect consumer and advertiser perceptions of our brand. In addition, these new products and services may present new and diffi cult technological and legal challenges, and we may be subject to claims if users of these off erings experience service disruptions or failures or other issues. Our operating results would also suff er if our innovations are not responsive to the needs of our users, advertisers, and Google Network Members, are not appropriately timed with market opportunities, or are not eff ectively brought to market. As technology continues to develop, our competitors may be able to off er user experiences that are, or that are seen to be, substantially similar to or better than ours. This may force us to compete in diff erent ways and expend signifi cant resources in order to remain competitive. If our competitors are more successful than we are in developing compelling products or in attracting and retaining users, advertisers, and content providers, our revenues and operating results could be adversely aff ected.
Our ongoing investment in new business strategies and new products, services, and technologies is inherently risky, and could disrupt our ongoing businesses.
We have invested and expect to continue to invest in new business strategies, products, services, and technologies. Such endeavors may involve signifi cant risks and uncertainties, including distraction of management from current operations, insuffi cient revenues to off set liabilities assumed and expenses associated with these new investments, inadequate return of capital on our investments, and unidentifi ed issues not discovered in our due diligence of such strategies and off erings. Because these new ventures are inherently risky, no assurance can be given that such strategies and off erings will be successful and will not adversely aff ect our reputation, fi nancial condition, and operating results.
Contents

10 GOOGLE INC. | Form 10-K
PART I ITEM 1A. Risk Factors
Acquisitions and investments could result in operating diffi culties, dilution, and other harmful consequences that may adversely impact our business and results of operations.
Acquisitions are an important element of our overall corporate strategy and use of capital, and we expect our current pace of acquisitions to continue. These transactions could be material to our fi nancial condition and results of operations. We also expect to continue to evaluate and enter into discussions regarding a wide array of potential strategic transactions. The process of integrating an acquired company, business, or technology has created, and will continue to create, unforeseen operating diffi culties and expenditures. The areas where we face risks include:
• Diversion of management time and focus from operating our business to acquisition integration challenges.
• Failure to successfully further develop the acquired business or technology.
• Implementation or remediation of controls, procedures, and policies at the acquired company.
• Integration of the acquired company’s accounting, human resource, and other administrative systems, and coordination of product, engineering, and sales and marketing functions.
• Transition of operations, users, and customers onto our existing platforms.
• Failure to obtain required approvals on a timely basis, if at all, from governmental authorities, or conditions placed upon approval, under competition and antitrust laws which could, among other things, delay or prevent us from completing a transaction, or otherwise restrict our ability to realize the expected fi nancial or strategic goals of an acquisition.
• In the case of foreign acquisitions, the need to integrate operations across diff erent cultures and languages and to address the particular economic, currency, political, and regulatory risks associated with specifi c countries.
• Cultural challenges associated with integrating employees from the acquired company into our organization, and retention of employees from the businesses we acquire.
• Liability for activities of the acquired company before the acquisition, including patent and trademark infringement claims, violations of laws, commercial disputes, tax liabilities, and other known and unknown liabilities.
• Litigation or other claims in connection with the acquired company, including claims from terminated employees, customers, former stockholders, or other third parties.
Our failure to address these risks or other problems encountered in connection with our past or future acquisitions and investments could cause us to fail to realize the anticipated benefi ts of such acquisitions or investments, incur unanticipated liabilities, and harm our business generally.
Future acquisitions could also result in dilutive issuances of our equity securities, the incurrence of debt, contingent liabilities, or amortization expenses, or impairment of goodwill, and restructuring charges, any of which could harm our fi nancial condition or results. Also, the anticipated benefi t of many of our acquisitions may not materialize.
We generate a signifi cant portion of our revenues from advertising, and a reduction in spending by or loss of advertisers could seriously harm our business.
We generated 95% of Google revenues from our advertisers in 2012. Following our acquisition of Motorola, we still expect a signifi cant portion of our revenues to come from advertising. Our advertisers can generally terminate their contracts with us at any time. Advertisers will not continue to do business with us if their investment in advertising with us does not generate sales leads, and ultimately customers, or if we do not deliver their advertisements in an appropriate and eff ective manner. If we are unable to remain competitive and provide value to our advertisers, they may stop placing ads with us, which would adversely aff ect our revenues and business.
In addition, expenditures by advertisers tend to be cyclical, refl ecting overall economic conditions and budgeting and buying patterns. Adverse macroeconomic conditions can also have a material negative impact on the demand for advertising and cause our advertisers to reduce the amounts they spend on advertising, which could adversely aff ect our revenues and business.
Our revenue growth rate could decline over time, and we anticipate downward pressure on our operating margin in the future.
Our revenue growth rate could decline over time as a result of a number of factors, including increasing competition, changes in our product mix, including a signifi cant increase in mobile search queries and a deceleration in the growth of desktop queries if monetization stays at current levels, and how users make queries and act on them, the challenges in maintaining our growth rate as our revenues increase to higher levels, the evolution of the online advertising market, including the increasing variety of online platforms for advertising, and the other markets in which we participate and the success of our investments in new business strategies, products, services, and technologies, such as our acquisition of Motorola.
Contents

11GOOGLE INC. | Form 10-K
PART I ITEM 1A. Risk Factors
The revenue growth rate of our Motorola business will also depend on a number of factors, including the success of the new products we plan to introduce, our reliance on several large customers, the absence of long-term exclusivity arrangements with such customers, our ability to gain signifi cant market share in the mobile devices space, our reliance on third-party distributors, representatives and retailers to sell certain of its products and the successful implementation of our product and operating system strategies. Furthermore, industry consolidation in the telecommunications and cable industries could negatively impact Motorola’s business because there would be fewer network operators and it could be more diffi cult to replace any lost customers. Any of these factors could have a negative impact on Motorola’s business and have an adverse eff ect on our consolidated fi nancial results.
We believe our operating margin will experience downward pressure as a result of increasing competition and increased expenditures for many aspects of our business, including Motorola. For instance, our operating margin will experience downward pressure if a greater percentage of our revenues comes from ads placed on our Google Network Members’ websites compared to revenues generated through ads placed on our own websites or if we spend a proportionately larger amount to promote the distribution of certain products, including Google Chrome. Both the margin on revenues we generate from our Google Network Members and the margin on revenues from our Motorola business are signifi cantly less than the margin on revenues we generate from advertising on our websites. Also, the margins on advertising revenues from mobile devices and newer advertising formats are generally less than the margin on revenues we generate from advertising on our websites. Additionally, the margin we earn on revenues generated from our Google Network Members could decrease in the future if we pay an even larger percentage of advertising fees to our Google Network Members.
We are subject to increased regulatory scrutiny that may negatively impact our business.
The growth of our company and our expansion into a variety of new fi elds implicate a variety of new regulatory issues, and we have experienced increased regulatory scrutiny as we have grown. We continue to cooperate with the European Commission (EC), other international regulatory authorities, and several state attorneys general in investigations they are conducting with respect to our business and its impact on competition. Legislators and regulators, including those conducting investigations in the U.S. and Europe, may make legal and regulatory changes, or interpret and apply existing laws, in ways that make our products and services less useful to our users, require us to incur substantial costs, expose us to unanticipated civil or criminal liability, or cause us to change our business practices. These changes or increased costs could negatively impact our business and results of operations in material ways.
We are regularly subject to claims, suits, government investigations, and other proceedings that may result in adverse outcomes.
We are regularly subject to claims, suits, government investigations, and other proceedings involving competition and antitrust (such as the pending investigations by the EC), intellectual property, privacy, consumer protection, tax, labor and employment, commercial disputes, content generated by our users, goods and services off ered by advertisers or publishers using our platforms, and other matters. Our acquisition of Motorola and our sale of hardware products also expose us to the risk of product liability and other litigation involving assertions about product defects, as well as health and safety, hazardous materials usage, and other environmental concerns. In addition, our businesses face intellectual property litigation, as further discussed later, that exposes us to the risk of exclusion and cease and desist orders, which could limit our ability to sell products and services.
Such claims, suits, government investigations, and proceedings are inherently uncertain and their results cannot be predicted with certainty. Regardless of the outcome, such legal proceedings can have an adverse impact on us because of legal costs, diversion of management resources, and other factors. Determining reserves for our pending litigation is a complex, fact-intensive process that requires signifi cant judgment. It is possible that a resolution of one or more such proceedings could result in substantial fi nes and penalties that could adversely aff ect our business, consolidated fi nancial position, results of operations, or cash fl ows in a particular period. These proceedings could also result in reputational harm, criminal sanctions, consent decrees, or orders preventing us from off ering certain features, functionalities, products, or services, requiring a change in our business practices or product recalls or other fi eld action, or requiring development of non-infringing or otherwise altered products or technologies. Any of these consequences could adversely aff ect our business and results of operations.
More people are using devices other than personal computers to access the internet and accessing new platforms to make search queries. If manufacturers and users do not widely adopt versions of our web search technology, products, or operating systems developed for these devices, our business could be adversely aff ected.
The number of people who access the internet through devices other than personal computers, including mobile phones, smartphones, handheld computers such as netbooks and tablets, video game consoles, and television set-top devices, has increased dramatically in the past few years. The lower resolution, functionality, and memory associated with some alternative devices make the use of our products and services through such devices more diffi cult and the versions of our products and services developed for these devices may not be compelling to users, manufacturers, or distributors of alternative devices. Each manufacturer or distributor may establish unique technical standards for its devices, and our products and services may not work or be viewable on these devices as a result. Some manufacturers may also elect not to include our products on their devices. In addition, search queries are increasingly being undertaken via “apps” tailored to particular devices or social media platforms, which could aff ect our share of the search market over time. As new devices and platforms are continually being released, it is diffi cult to predict the problems we may encounter in adapting our products and services and developing competitive new products and services. We expect to continue to devote signifi cant resources to the creation, support, and maintenance of mobile products and services. If we are
Contents
12 GOOGLE INC. | Form 10-K
PART I ITEM 1A. Risk Factors
unable to attract and retain a substantial number of alternative device manufacturers, distributors, and users to our products and services, or if we are slow to develop products and technologies that are more compatible with alternative devices and platforms, we will fail to capture the opportunities available as consumers and advertisers transition to a dynamic, multi-screen environment.
Our business depends on a strong brand, and failing to maintain and enhance our brand would hurt our ability to expand our base of users, advertisers, Google Network Members, and other partners.
The brand identity that we have developed has signifi cantly contributed to the success of our business. Maintaining and enhancing the “Google” brand is critical to expanding our base of users, advertisers, Google Network Members, and other partners. We believe that the importance of brand recognition will increase due to the relatively low barriers to entry in the internet market. Our brand may be negatively impacted by a number of factors, including data protection and security issues, service outages, and product malfunctions. If we fail to maintain and enhance the “Google” brand, or if we incur excessive expenses in this eff ort, our business, operating results, and fi nancial condition will be materially and adversely aff ected. Maintaining and enhancing our brand will depend largely on our ability to be a technology leader and continue to provide high-quality innovative products and services, which we may not do successfully.
A variety of new and existing U.S. and foreign laws could subject us to claims or otherwise harm our business.
We are subject to numerous U.S. and foreign laws and regulations covering a wide variety of subject matters. New laws and regulations (or new interpretations of existing laws and regulations) may also impact our business. The costs of compliance with these laws and regulations are high and are likely to increase in the future. Any failure on our part to comply with these laws and regulations can result in negative publicity and diversion of management time and eff ort and may subject us to signifi cant liabilities and other penalties.
Furthermore, many of these laws were adopted prior to the advent of the internet and related technologies and, as a result, do not contemplate or address the unique issues of the internet and related technologies. The laws that do reference the internet are being interpreted by the courts, but their applicability and scope remain uncertain. For example, the laws relating to the liability of providers of online services are currently unsettled both within the U.S. and abroad. Claims have also been, or may be, threatened and fi led against us under both U.S. and foreign laws for defamation, invasion of privacy and other tort claims, unlawful activity, patent, copyright and trademark infringement, or other theories based on the nature and content of the materials searched and the ads posted by our users, our products and services, or content generated by our users. Moreover, recent amendments to U.S. patent laws may aff ect the ability of companies, including us, to protect their innovations and defend against claims of patent infringement.
In addition, the Digital Millennium Copyright Act has provisions that limit, but do not necessarily eliminate, our liability for caching or hosting, or for listing or linking to, third-party websites that include materials that infringe copyrights or other rights, so long as we comply with the statutory requirements of this act. Any future legislation impacting these safe harbors may adversely impact us. Various U.S. and international laws restrict the distribution of materials considered harmful to children and impose additional restrictions on the ability of online services to collect information from minors. In the area of data protection, many states have passed laws requiring notifi cation to users when there is a security breach for personal data, such as California’s Information Practices Act. We face similar risks and costs as our products and services are off ered in international markets and may be subject to additional regulations.
We are, and may in the future be, subject to intellectual property or other claims, which are costly to defend, could result in signifi cant damage awards, and could limit our ability to use certain technologies in the future.
Internet, technology, and media companies own large numbers of patents, copyrights, trademarks, and trade secrets and frequently enter into litigation based on allegations of infringement or other violations of intellectual property rights. In addition, patent holding companies may continue to seek to monetize patents they have purchased or otherwise obtained. As we have grown, the intellectual property rights claims against us have increased and may continue to increase as we develop new products, services, and technologies.
We have had patent, copyright, and trademark infringement lawsuits fi led against us claiming that certain of our products, services, and technologies, including Android, Google Search, Google AdWords, Google AdSense, Motorola products, Google Books, Google News, Google Image Search, Google Chrome, Google Talk, Google Voice, and YouTube, infringe the intellectual property rights of others. Third parties have also sought broad injunctive relief against us by fi ling claims in the U.S. International Trade Commission (ITC) for exclusion and cease and desist orders, which could limit our ability to sell our products or services in the U.S. or elsewhere if our products or services or those of our customers or suppliers are found to infringe the intellectual property subject to the claims. Adverse results in any of these lawsuits may include awards of substantial monetary damages, costly royalty or licensing agreements (if licenses are available at all), or orders preventing us from off ering certain features, functionalities, products, or services, and may also cause us to change our business practices, and require development of non-infringing products or technologies, which could result in a loss of revenues for us and otherwise harm our business.
In addition, many of our agreements with our customers and partners, including certain suppliers, require us to indemnify them for certain intellectual property infringement claims against them, which could increase our costs as a result of defending such claims, and may require that we pay signifi cant damages if there were an adverse ruling in any such claims. Such customers and partners may also discontinue the use of our products, services, and technologies, as a result of injunctions or otherwise, which could result in loss of revenues and adversely impact our business. Moreover, supplier provided intellectual property indemnities
Contents

13GOOGLE INC. | Form 10-K
PART I ITEM 1A. Risk Factors
to us, when obtainable, may not cover all damages and losses suff ered by us and our customers from covered products. In addition, in connection with the sale of Motorola’s Home business to Arris Group, Inc. (Arris), we agreed to indemnify Arris against certain intellectual property infringement litigation, including, among others, a patent infringement claim brought by TiVo relating to certain digital video recording equipment sold by Motorola Mobility.
Regardless of the merits of the claims, intellectual property claims are often time consuming, expensive to litigate or settle, and cause signifi cant diversion of management attention. To the extent such intellectual property infringement claims are successful, they may have an adverse eff ect on our business, consolidated fi nancial position, results of operations, or cash fl ows.
Our intellectual property rights are valuable, and any inability to protect them could reduce the value of our products, services, and brand.
Our patents, trademarks, trade secrets, copyrights, and other intellectual property rights are important assets for us. Various events outside of our control pose a threat to our intellectual property rights, as well as to our products, services and technologies. For example, eff ective intellectual property protection may not be available in every country in which our products and services are distributed or made available through the internet. Also, the eff orts we have taken to protect our proprietary rights may not be suffi cient or eff ective.
Although we seek to obtain patent protection for our innovations, it is possible we may not be able to protect some of these innovations. Moreover, because of our long-term interests in open source, we may not have adequate patent protection for certain innovations that later turn out to be important. Furthermore, there is always the possibility, despite our eff orts, that the scope of the protection gained will be insuffi cient or that an issued patent may be deemed invalid or unenforceable.
We also seek to maintain certain intellectual property as trade secrets. The secrecy could be compromised by outside parties, or by our employees, which could cause us to lose the competitive advantage resulting from these trade secrets.
We also face risks associated with our trademarks. For example, there is a risk that the word “Google” could become so commonly used that it becomes synonymous with the word “search.” If this happens, we could lose protection for this trademark, which could result in other people using the word “Google” to refer to their own products, thus diminishing our brand.
Any signifi cant impairment of our intellectual property rights could harm our business and our ability to compete. Also, protecting our intellectual property rights is costly and time consuming. Any increase in the unauthorized use of our intellectual property could make it more expensive to do business and harm our operating results.
We may be subject to legal liability associated with providing online services or content.
We host and provide a wide variety of services and products that enable users to exchange information, advertise products and services, conduct business, and engage in various online activities both domestically and internationally. The law relating to the liability of providers of these online services and products for activities of their users is still somewhat unsettled both within the U.S. and internationally. Claims have been threatened and have been brought against us for defamation, negligence, breaches of contract, copyright or trademark infringement, unfair competition, unlawful activity, tort, including personal injury, fraud, or other theories based on the nature and content of information which we publish or to which we provide links or that may be posted online or generated by us or by third parties, including our users. In addition, we are and have been and may again in the future be subject to domestic or international actions alleging that certain content we have generated or third-party content that we have made available within our services violates laws in domestic and international jurisdictions.
We also arrange for the distribution of third-party advertisements to third-party publishers and advertising networks, and we off er third-party products, services, or content. We may be subject to claims concerning these products, services, or content by virtue of our involvement in marketing, branding, broadcasting, or providing access to them, even if we do not ourselves host, operate, provide, or provide access to these products, services, or content. Defense of any such actions could be costly and involve signifi cant time and attention of our management and other resources, may result in monetary liabilities or penalties, and may require us to change our business in an adverse manner.
Privacy concerns relating to our technology could damage our reputation and deter current and potential users from using our products and services.
From time to time, concerns have been expressed by regulators and others about whether our products, services, or processes compromise the privacy of users and others. Concerns about, or regulatory actions involving our practices with regard to the collection, use, disclosure, or security of personal information or other privacy related matters, even if unfounded, could damage our reputation and adversely aff ect operating results. While we strive to comply with all applicable data protection laws and regulations, as well as our own posted privacy policies, the failure or perceived failure to comply may result, and in some cases has resulted, in inquiries and other proceedings or actions against us by government entities or others, or could cause us to lose users and customers, which could potentially have an adverse eff ect on our business.
In addition, as nearly all of our products and services are web-based, the amount of data we store for our users on our servers (including personal information) has been increasing. Any systems failure or compromise of our security that results in the release of our users’ data could seriously limit the adoption of our products and services, as well as harm our reputation and brand and,
Contents

14 GOOGLE INC. | Form 10-K
PART I ITEM 1A. Risk Factors
therefore, our business. We expect to continue to expend signifi cant resources to protect against security breaches. The risk that these types of events could seriously harm our business is likely to increase as we expand the number of web-based products and services we off er, and operate in more countries.
Regulatory authorities around the world are considering a number of legislative and regulatory proposals concerning data protection. In addition, the interpretation and application of consumer and data protection laws in the U.S., Europe and elsewhere are often uncertain and in fl ux. It is possible that these laws may be interpreted and applied in a manner that is inconsistent with our data practices. If so, in addition to the possibility of fi nes, this could result in an order requiring that we change our data practices, which could have an adverse eff ect on our business and results of operations. Complying with these various laws could cause us to incur substantial costs or require us to change our business practices in a manner adverse to our business.
With our acquisition of Motorola, we face a number of manufacturing and supply chain risks that, if not properly managed, could adversely impact our fi nancial results and prospects.
With our acquisition of Motorola, we face a number of risks related to manufacturing and supply chain management. For instance, the products we sell may have quality issues resulting from the design or manufacture of the product, or from the software used in the product. Sometimes, these issues may be caused by components we purchase from other manufacturers or suppliers. If the quality of our Motorola products does not meet our customers’ expectations or our products are found to be defective, then our sales and operating earnings, and ultimately our reputation, could be negatively impacted.
We rely on third parties to manufacture many of Motorola’s assemblies and fi nished products, and we have third-party arrangements for the design of some components and parts. Our Motorola business could be negatively aff ected if we are not able to engage third parties with the necessary capabilities or capacity on reasonable terms, or if those we engage fail to meet their obligations (whether due to fi nancial diffi culties or other reasons), or make adverse changes in the pricing or other materials terms of our arrangements with them.
Motorola, like many electronics manufacturers, has also experienced supply shortages and price increases in the past driven by raw material availability, manufacturing capacity, labor shortages, industry allocations, natural disasters and signifi cant changes in the fi nancial or business condition of its suppliers. Workaround plans to address shortages have entailed in the past, and could entail in the future, increased freight costs for expedited shipments. We cannot assure you that we will not experience shortages or other supply chain disruptions in the future or that they will not negatively impact our operations. In addition, some of the components we use in our Motorola products are available only from a single source or limited sources, and we cannot assure you that we would be able to fi nd replacement vendors on favorable terms or at all in the event of a supply chain disruption.
Additionally, because many of our supply contracts have volume-based pricing or minimum purchase requirements, if the volume of our Motorola sales decreases or does not reach projected targets, we could face increased materials and manufacturing costs or other fi nancial liabilities that could make our Motorola products more costly per unit to manufacture and therefore less competitive and negatively impact our fi nancial results. Further, certain of our competitors may negotiate more favorable contractual terms based on volume and other commitments that may provide them with competitive advantages and may impact our supply.
We also require our suppliers and business partners to comply with law and company policies regarding workplace and employment practices, environmental compliance and intellectual property licensing, but we do not control them or their practices. If any of them violates laws or implements practices regarded as unethical, we could experience supply chain disruptions, canceled orders, terminations of or damage to key relationships, and damage to our reputation. If any of them fails to procure necessary license rights to third-party intellectual property, legal action could ensue that could impact the salability of our products and expose us to fi nancial obligations to third parties.
The Dodd-Frank Wall Street Reform and Consumer Protection Act included disclosure requirements regarding the use of “confl ict” minerals mined from the Democratic Republic of Congo and adjoining countries (DRC) and procedures regarding a manufacturer’s eff orts to prevent the sourcing of such “confl ict” minerals. SEC rules implementing these requirements may have the eff ect of reducing the pool of suppliers who can supply DRC “confl ict free” components and parts, and we may not be able to obtain DRC confl ict free products or supplies in suffi cient quantities for our operations. Also, since our supply chain is complex, we may face reputational challenges with our customers, stockholders and other stakeholders if we are unable to suffi ciently verify the origins for the confl ict minerals used in our products.
If our security measures are breached, or if our services are subject to attacks that degrade or deny the ability of users to access our products and services, our products and services may be perceived as not being secure, users and customers may curtail or stop using our products and services, and we may incur signifi cant legal and fi nancial exposure.
Our products and services involve the storage and transmission of users’ and customers’ proprietary information, and security breaches expose us to a risk of loss of this information, litigation, and potential liability. We experience cyber attacks of varying degrees on a regular basis, and as a result, unauthorized parties have obtained, and may in the future obtain, access to our data or our users’ or customers’ data. Our security measures may also be breached due to employee error, malfeasance, or otherwise.
Contents

15GOOGLE INC. | Form 10-K
PART I ITEM 1A. Risk Factors
Additionally, outside parties may attempt to fraudulently induce employees, users, or customers to disclose sensitive information in order to gain access to our data or our users’ or customers’ data. Any such breach or unauthorized access could result in signifi cant legal and fi nancial exposure, damage to our reputation, and a loss of confi dence in the security of our products and services that could potentially have an adverse eff ect on our business. Because the techniques used to obtain unauthorized access, disable or degrade service, or sabotage systems change frequently and often are not recognized until launched against a target, we may be unable to anticipate these techniques or to implement adequate preventative measures. If an actual or perceived breach of our security occurs, the market perception of the eff ectiveness of our security measures could be harmed and we could lose users and customers.
Web spam and content farms could decrease our search quality, which could damage our reputation and deter our current and potential users from using our products and services.
“Web spam” refers to websites that attempt to violate a search engine’s quality guidelines or that otherwise seek to rank higher in search results than a search engine’s assessment of their relevance and utility would rank them. Although English-language web spam in our search results has been signifi cantly reduced, and web spam in most other languages is limited, we expect web spammers will continue to seek ways to improve their rankings inappropriately. We continuously combat web spam, including through indexing technology that makes it harder for spam-like, less useful web content to rank highly. We face challenges from low-quality and irrelevant content websites, including “content farms,” which are websites that generate large quantities of low-quality content to help them improve their search rankings. We are continually launching algorithmic changes focused on low-quality websites. If web spam and content farms continue to increase on Google, this could hurt our reputation for delivering relevant information or reduce user traffi c to our websites. In addition, as we continue to take actions to improve our search quality and reduce low-quality content, this may in the short run reduce our AdSense revenues, since some of these websites are AdSense partners.
Interruption or failure of our information technology and communications systems could hurt our ability to eff ectively provide our products and services, which could damage our reputation and harm our operating results.
The availability of our products and services depends on the continuing operation of our information technology and communications systems. Our systems are vulnerable to damage or interruption from earthquakes, terrorist attacks, fl oods, fi res, power loss, telecommunications failures, computer viruses, computer denial of service attacks, or other attempts to harm our systems. Some of our data centers are located in areas with a high risk of major earthquakes. Our data centers are also subject to break-ins, sabotage, and intentional acts of vandalism, and to potential disruptions if the operators of these facilities have fi nancial diffi culties. Some of our systems are not fully redundant, and our disaster recovery planning cannot account for all eventualities. The occurrence of a natural disaster, a decision to close a facility we are using without adequate notice for fi nancial reasons, or other unanticipated problems at our data centers could result in lengthy interruptions in our service. In addition, our products and services are highly technical and complex and may contain errors or vulnerabilities. Any errors or vulnerabilities in our products and services, or damage to or failure of our systems, could result in interruptions in our services, which could reduce our revenues and profi ts, and damage our brand.
Our international operations expose us to additional risks that could harm our business, operating results, and fi nancial condition.
Our international operations are signifi cant to our revenues and net income, and we plan to further expand internationally. International revenues accounted for approximately 53% of our consolidated revenues in 2012, and more than half of our user traffi c has been coming from outside the U.S. In certain international markets, we have limited operating experience and may not benefi t from any fi rst-to-market advantages or otherwise succeed.
Our Motorola business also has facilities outside the U.S., and nearly all of our Motorola products (other than some prototypes) are manufactured outside the U.S., primarily in China, Taiwan and Brazil. If our manufacturing in these countries is disrupted, our overall capacity could be reduced and sales or profi tability could be negatively impacted. We require these suppliers and business partners to comply with law and company policies regarding workplace and employment practices, environmental compliance and intellectual property licensing, but we do not control them or their practices. If any of them violates laws or implements practices regarded as unethical, we could experience supply chain disruptions, canceled orders, terminations of or damage to key relationships, and damage to our reputation. If any of them fails to procure necessary license rights to third-party intellectual property, legal action could ensue that could impact the salability of our products and expose us to fi nancial obligations to third parties.
Moreover, in connection with our operations in Brazil, we have had and continue to have legal disputes and controversies, including tax, labor and trade compliance controversies and other legal matters that take many years to resolve. We incur legal and other costs in managing and defending these matters and expect to continue to incur such costs. Based on our assessment of these matters, we have recorded reserves on only a small portion of the total potential exposure. It is, however, very diffi cult to predict the outcome of legal disputes and controversies, including litigation, in Brazil and our ultimate exposure may be greater than our current assessments and related reserves.
Contents

16 GOOGLE INC. | Form 10-K
PART I ITEM 1A. Risk Factors
In addition to risks described elsewhere in this section, our international operations expose us to other risks, including the following:
• Changes in local political, economic, social, and labor conditions, which may adversely harm our business.
• Restrictions on foreign ownership and investments, and stringent foreign exchange controls that might prevent us from repatriating cash earned in countries outside the U.S.
• Import and export requirements, tariff s, trade disputes and barriers, and customs classifi cations that may prevent us from off ering products or providing services to a particular market and may increase our operating costs.
• Potential injunctions from importation into the U.S. of our Motorola products manufactured outside the U.S. in an ITC matter.
• Longer payment cycles in some countries, increased credit risk, and higher levels of payment fraud.
• Still developing foreign laws and legal systems.
• Uncertainty regarding liability for services and content, including uncertainty as a result of local laws and lack of legal precedent.
• Diff erent employee/employer relationships, existence of workers’ councils and labor unions, and other challenges caused by distance, language, and cultural diff erences, making it harder to do business in certain jurisdictions.
• Natural disasters, military or political confl icts, including war and other hostilities, and public health issues and outbreaks.
In addition, compliance with complex foreign and U.S. laws and regulations that apply to our international operations increases our cost of doing business. These numerous and sometimes confl icting laws and regulations include internal control and disclosure rules, data privacy and fi ltering requirements, anti-corruption laws, such as the Foreign Corrupt Practices Act, and other local laws prohibiting corrupt payments to governmental offi cials, and antitrust and competition regulations, among others. Violations of these laws and regulations could result in fi nes and penalties, criminal sanctions against us, our offi cers, or our employees, prohibitions on the conduct of our business and on our ability to off er our products and services in one or more countries, and could also materially aff ect our brand, our international expansion eff orts, our ability to attract and retain employees, our business, and our operating results. Although we have implemented policies and procedures designed to ensure compliance with these laws and regulations, there can be no assurance that our employees, contractors, or agents will not violate our policies.
Finally, since we conduct business in currencies other than U.S. dollars but report our fi nancial results in U.S. dollars, we face exposure to fl uctuations in currency exchange rates. Although we hedge a portion of our international currency exposure, signifi cant fl uctuations in exchange rates between the U.S. dollar and foreign currencies may adversely aff ect our net income. Additionally, hedging programs are inherently risky and could expose us to additional risks that could adversely aff ect our fi nancial condition and results of operations.
Our operating results may fl uctuate, which makes our results diffi cult to predict and could cause our results to fall short of expectations.
Our operating results may fl uctuate as a result of a number of factors, many outside of our control. As a result, comparing our operating results on a period-to-period basis may not be meaningful, and you should not rely on our past results as an indication of our future performance. Our quarterly, year-to-date, and annual expenses as a percentage of our revenues may diff er signifi cantly from our historical or projected rates. Our operating results in future quarters may fall below expectations. Any of these events could cause our stock price to fall. Each of the risk factors listed in this section in addition to the following factors may aff ect our operating results:
• Our ability to continue to attract users to our websites and satisfy existing users on our websites.
• Our ability to monetize (or generate revenues from) traffi c on our websites and our Google Network Members’ websites.
• Our ability to attract advertisers to our AdWords program, and our ability to attract websites to our AdSense program.
• The mix in our revenues between those generated on our websites and those generated through our Google Network and other factors, such as changes in product mix, including a signifi cant increase in mobile search queries and a deceleration in the growth of desktop queries if monetization stays at current levels, and the geographic mix of our revenues that can aff ect revenue growth rates and margins.
• The amount of revenues and expenses generated and incurred in currencies other than U.S. dollars, and our ability to manage the resulting risk through our foreign exchange risk management program.
• The amount and timing of operating costs and expenses and capital expenditures related to the maintenance and expansion of our businesses, operations, and infrastructure.
• Our focus on long-term goals over short-term results.
• The results of our investments in risky projects, including new business strategies and new products, services, technologies and acquisitions.
Contents

17GOOGLE INC. | Form 10-K
PART I ITEM 1A. Risk Factors
• Our ability to keep our websites operational at a reasonable cost and without service interruptions.
• Our ability to generate signifi cant revenues from services in which we have invested considerable time and resources, such as Google Wallet.
Because our business is changing and evolving, our historical operating results may not be useful to you in predicting our future operating results. In addition, advertising spending has historically been cyclical in nature, refl ecting overall economic conditions, as well as budgeting and buying patterns. Also, user traffi c tends to be seasonal. Our rapid growth has tended to mask the cyclicality and seasonality of our business. As our growth rate has slowed, the cyclicality and seasonality in our business has become more pronounced and caused our operating results to fl uctuate.
If we were to lose the services of Larry, Sergey, Eric, or other key personnel, we may not be able to execute our business strategy.
Our future success depends in a large part upon the continued service of key members of our senior management team. In particular, Larry Page and Sergey Brin are critical to the overall management of Google and the development of our technology. Along with our Executive Chairman Eric E. Schmidt, they also play a key role in maintaining our culture and setting our strategic direction. All of our executive offi cers and key employees are at-will employees, and we do not maintain any key-person life insurance policies. The loss of key personnel could seriously harm our business.
We rely on highly skilled personnel and, if we are unable to retain or motivate key personnel, hire qualifi ed personnel, or maintain our corporate culture, we may not be able to grow eff ectively.
Our performance largely depends on the talents and eff orts of highly skilled individuals. Our future success depends on our continuing ability to identify, hire, develop, motivate, and retain highly skilled personnel for all areas of our organization. Competition in our industry for qualifi ed employees is intense, and certain of our competitors have directly targeted our employees. In addition, our compensation arrangements, such as our equity award programs, may not always be successful in attracting new employees and retaining and motivating our existing employees. Our continued ability to compete eff ectively depends on our ability to attract new employees and to retain and motivate our existing employees.
In addition, we believe that our corporate culture fosters innovation, creativity, and teamwork. As our organization grows, and we are required to implement more complex organizational management structures, we may fi nd it increasingly diffi cult to maintain the benefi cial aspects of our corporate culture. This could negatively impact our future success.
Our business depends on continued and unimpeded access to the internet by us and our users. Internet access providers may be able to block, degrade, or charge for access to certain of our products and services, which could lead to additional expenses and the loss of users and advertisers.
Our products and services depend on the ability of our users to access the internet, and certain of our products require signifi cant bandwidth to work eff ectively. Currently, this access is provided by companies that have signifi cant market power in the broadband and internet access marketplace, including incumbent telephone companies, cable companies, mobile communications companies, and government-owned service providers. Some of these providers have taken, or have stated that they may take, measures that could degrade, disrupt, or increase the cost of user access to certain of our products by restricting or prohibiting the use of their infrastructure to support or facilitate our off erings, or by charging increased fees to us or our users to provide our off erings. Such interference could result in a loss of existing users and advertisers, and increased costs, and could impair our ability to attract new users and advertisers, thereby harming our revenues and growth.
New technologies could block our ads, which would harm our business.
Technologies have been developed (including by us) that can block the display of our ads and that provide tools to users to opt out of our advertising products. Most of our revenues are derived from fees paid to us by advertisers in connection with the display of ads on web pages for our users. As a result, such technologies and tools could adversely aff ect our operating results.
We are exposed to fl uctuations in the market values of our investment portfolio.
Given the global nature of our business, we have investments both domestically and internationally. Credit ratings and pricing of these investments can be negatively impacted by liquidity, credit deterioration or losses, fi nancial results, or other factors. As a result, the value or liquidity of our cash equivalents and marketable securities could decline and result in a material impairment, which could materially adversely aff ect our fi nancial condition and operating results.
Contents

18 GOOGLE INC. | Form 10-K
PART I ITEM 1A. Risk Factors
We may have exposure to greater than anticipated tax liabilities.
Our future income taxes could be adversely aff ected by earnings being lower than anticipated in jurisdictions that have lower statutory tax rates and higher than anticipated in jurisdictions that have higher statutory tax rates, by changes in the valuation of our deferred tax assets and liabilities, as a result of gains on our foreign exchange risk management program, or changes in tax laws, regulations, or accounting principles, as well as certain discrete items. We are subject to regular review and audit by both domestic and foreign tax authorities. Any adverse outcome of such a review or audit could have a negative eff ect on our operating results and fi nancial condition. In addition, the determination of our worldwide provision for income taxes and other tax liabilities requires signifi cant judgment, and there are many transactions and calculations where the ultimate tax determination is uncertain. Although we believe our estimates are reasonable, the ultimate tax outcome may diff er from the amounts recorded in our fi nancial statements and may materially aff ect our fi nancial results in the period or periods for which such determination is made.
Risks Related to Ownership of Our Stock
The trading price for our Class A common stock may continue to be volatile, and if the shares of the new class of non-voting Class C capital stock are distributed as expected, the trading price of that class may also be volatile and may aff ect the trading price for the Class A common stock.
The trading price of our Class A common stock has at times experienced substantial price volatility and may continue to be volatile. For example, from January 1, 2012 through December 31, 2012, the closing price of our Class A common stock ranged from $559.05 per share to $768.05 per share. The trading price of our Class A common stock may fl uctuate widely in response to various factors, some of which are beyond our control. These factors include, among others:
• Quarterly variations in our results of operations or those of our competitors.
• Announcements by us or our competitors of acquisitions, new products, signifi cant contracts, commercial relationships, or capital commitments.
• Recommendations by securities analysts or changes in earnings estimates.
• Announcements about our earnings that are not in line with analyst expectations, the risk of which is enhanced because it is our policy not to give guidance on earnings.
• Announcements by our competitors of their earnings that are not in line with analyst expectations.
• Commentary by industry and market professionals about our products, strategies, and other matters aff ecting our business and results, regardless of its accuracy.
• The volume of shares of Class A common stock available for public sale.
• Sales of Class A common stock by us or by our stockholders (including sales by our directors, executive offi cers, and other employees).
• Short sales, hedging, and other derivative transactions on shares of our Class A common stock (including derivative transactions under our Transferable Stock Option program).
In addition, we have announced the intention of our board of directors to consider a distribution of shares of our non-voting Class C capital stock as a dividend to our holders of Class A and Class B common stock, pending resolution of litigation involving the authorization of that class.
Although we plan to list the Class C capital stock on The Nasdaq Stock Market, we cannot predict whether, or to what extent, a liquid trading market will develop for the Class C capital stock. If it does not or if the Class C capital stock is not attractive to targets as an acquisition currency or to our employees as an incentive, we may not achieve our objectives in creating this new class. As in the case of the Class A common stock, the trading price for the Class C capital stock may also be volatile and aff ected by the factors noted above, as well as by the diff erence in voting rights as between the Class A common stock and the Class C capital stock, the volume of Class C capital stock available for public sale and sales by us and our stockholders of Class C capital stock, including by institutional investors that may be unwilling, unable or choose not to hold non-voting shares they receive as part of the stock dividend, if it is declared and paid. Whether or not the Class C capital stock is included in stock indices in the future may also aff ect the trading prices of the Class A common stock and the Class C capital stock.
In addition, the stock market in general, and the market for technology companies in particular, have experienced extreme price and volume fl uctuations that have often been unrelated or disproportionate to the operating performance of those companies. These broad market and industry factors may harm the market price of our Class A common stock, and, if issued, our Class C capital Stock, regardless of our actual operating performance.
Contents

19GOOGLE INC. | Form 10-K
PART I ITEM 1A. Risk Factors
The concentration of our stock ownership limits our stockholders’ ability to infl uence corporate matters.
Our Class B common stock has 10 votes per share and our Class A common stock has one vote per share. As of December 31, 2012, Larry, Sergey, and Eric benefi cially owned approximately 92% of our outstanding Class B common stock, representing approximately 65% of the voting power of our outstanding capital stock. Larry, Sergey, and Eric therefore have signifi cant infl uence over management and aff airs and over all matters requiring stockholder approval, including the election of directors and signifi cant corporate transactions, such as a merger or other sale of our company or our assets, for the foreseeable future. In addition, because our Class C capital stock carries no voting rights (except as required by applicable law), the issuance of the Class C capital stock, including in future stock-based acquisition transactions and to fund employee equity incentive programs, could prolong the duration of Larry and Sergey’s current relative ownership of our voting power and their ability to elect all of our directors and to determine the outcome of most matters submitted to a vote of our stockholders. Together with Eric, they would also continue to be able to control any required stockholder vote with respect to certain change in control transactions involving Google (including an acquisition of Google by another company).
This concentrated control limits or severely restricts our stockholders’ ability to infl uence corporate matters and, as a result, we may take actions that our stockholders do not view as benefi cial. As a result, the market price of our Class A common stock and, if issued, our Class C capital stock could be adversely aff ected.
Provisions in our charter documents and under Delaware law could discourage a takeover that stockholders may consider favorable.
Provisions in our certifi cate of incorporation and bylaws may have the eff ect of delaying or preventing a change of control or changes in our management. These provisions include the following:
• Our certifi cate of incorporation provides for a dual class common stock structure. As a result of this structure, Larry, Sergey, and Eric have signifi cant infl uence over all matters requiring stockholder approval, including the election of directors and signifi cant corporate transactions, such as a merger or other sale of our company or our assets. This concentrated control could discourage others from initiating any potential merger, takeover, or other change of control transaction that other stockholders may view as benefi cial. As noted above, the issuance of the Class C capital stock could have the eff ect of prolonging the infl uence of Larry, Sergey, and Eric.
• Our board of directors has the right to elect directors to fi ll a vacancy created by the expansion of the Board of Directors or the resignation, death, or removal of a director, which prevents stockholders from being able to fi ll vacancies on our board of directors.
• Our stockholders may not act by written consent. As a result, a holder, or holders, controlling a majority of our capital stock would not be able to take certain actions without holding a stockholders’ meeting.
• Our certifi cate of incorporation prohibits cumulative voting in the election of directors. This limits the ability of minority stockholders to elect director candidates.
• Stockholders must provide advance notice to nominate individuals for election to the Board of Directors or to propose matters that can be acted upon at a stockholders’ meeting. These provisions may discourage or deter a potential acquirer from conducting a solicitation of proxies to elect the acquirer’s own slate of directors or otherwise attempting to obtain control of our company.
• Our board of directors may issue, without stockholder approval, shares of undesignated preferred stock. The ability to issue undesignated preferred stock makes it possible for our board of directors to issue preferred stock with voting or other rights or preferences that could impede the success of any attempt to acquire us.
As a Delaware corporation, we are also subject to certain Delaware anti-takeover provisions. Under Delaware law, a corporation may not engage in a business combination with any holder of 15% or more of its outstanding voting stock unless the holder has held the stock for three years or, among other things, the Board of Directors has approved the transaction. Our board of directors could rely on Delaware law to prevent or delay an acquisition of us.
Contents
20 GOOGLE INC. | Form 10-K
PART I ITEM 1B. Unresolved Staff Comments
ITEM 1B. Unresolved Staff CommentsNone.
ITEM 2. PropertiesOur headquarters are located in Mountain View, California, where we own approximately 3.5 million square feet of offi ce and building space and approximately seven acres of developable land to accommodate anticipated future growth. We also own a 2.3 million square feet offi ce building in New York, New York and 665,000 square feet of offi ce and building space in Paris, France and Dublin, Ireland. We also operate and own data centers in the U.S., Europe, and Asia pursuant to various lease agreements and co-location arrangements.
In addition, we lease approximately 3.8 million square feet of offi ce space and approximately 61 acres of undeveloped land in and near our headquarters in Mountain View, California. We also lease additional research and development, and sales and support offi ces throughout the United States and maintain leased facilities internationally in countries around the world. Larger leased sites include properties located in Dublin, Ireland; Zurich, Switzerland; London, UK; Hyderabad, India; San Francisco, CA; San Bruno, CA; Paris, France; Hamburg, Germany; Tel Aviv, Israel; Sao Paulo, Brazil; Ann Arbor, MI; Bothell, WA; Cambridge, MA; Chicago, IL; Kirkland, WA; Venice, CA; Pittsburgh, PA; Seattle, WA; Sydney, Australia; Beijing, China; Shanghai, China; Bangalore, India; Gurgaon, India; Tokyo, Japan; and Singapore.
Motorola also operates manufacturing facilities, research and development, administrative and sales offi ces in various U.S. locations and in many foreign countries. Motorola owns eight facilities (manufacturing, sales, service and offi ces), fi ve of which are located in the Americas Region (U.S., Canada, Mexico, Central America and South America) and three of which are located in other countries. As of December 31, 2012, Motorola leased 97 facilities, 31 of which are located in the Americas Region and 66 of which are located in other countries. Motorola Mobility owns three major facilities for the manufacturing and distribution of its products. These facilities are located in Tianjin, China; Hsin Tien, Taiwan; and Jaguariuna, Brazil. As previously reported, Motorola is executing a signifi cant consolidation of its portfolio, which will reduce the number of facilities worldwide, including manufacturing, sales and marketing, and research and development locations.
We believe our existing facilities, both owned and leased, are in good condition and suitable for the conduct of our business. Motorola generally considers the productive capacity of the plants operated by each of its business segments to be adequate and suffi cient for the requirements of each business group. The extent of utilization of such manufacturing facilities varies from plant to plant and from time to time during the year.
ITEM 3. Legal ProceedingsFor a description of our material pending legal proceedings, please see Note 11 “Commitments and Contingencies—Legal Matters” of the Notes to Consolidated Financial Statements included in Item 8 of this Annual Report on Form 10-K, which is incorporated herein by reference.
ITEM 4. Mine Safety DisclosuresNot applicable.
Contents

21GOOGLE INC. | Form 10-K
PART II ITEM 5. Market for Registrant’s Common Equity, Related Stockholder Matters and Issuer Purchases of Equity Securities
PART II
ITEM 5. Market for Registrant’s Common Equity, Related Stockholder Matters and Issuer Purchases of Equity Securities
Our Class A common stock has been listed on the Nasdaq Global Select Market under the symbol “GOOG” since August 19, 2004. Prior to that time, there was no public market for our stock. The following table sets forth for the indicated periods the high and low sales prices per share for our Class A common stock on the Nasdaq Global Select Market.
Fiscal Year 2012 Quarters Ended: High LowMarch 31, 2012 $670.25 $564.55June 30, 2012 653.14 556.52September 30, 2012 764.89 562.09December 31, 2012 774.38 636.00
Fiscal Year 2011 Quarters Ended: High LowMarch 31, 2011 $642.96 $551.28June 30, 2011 595.19 473.02September 30, 2011 627.50 490.86December 31, 2011 646.76 480.60
Our Class B common stock is neither listed nor traded.
Holders of Record
As of December 31, 2012, there were approximately, 2,689 stockholders of record of our Class A common stock, and the closing price of our Class A common stock was $707.38 per share as reported by the Nasdaq Global Select Market. Because many of our shares of Class A common stock are held by brokers and other institutions on behalf of stockholders, we are unable to estimate the total number of stockholders represented by these record holders. As of December 31, 2012, there were approximately 79 stockholders of record of our Class B common stock.
Dividend Policy
We have never declared or paid any cash dividend on our common stock. We intend to retain any future earnings and do not expect to pay any cash dividends in the foreseeable future.
PART II ITEM 5. Market for Registrant’s Common Equity, Related Stockholder Matters and Issuer Purchases of Equity Securities
Contents

22 GOOGLE INC. | Form 10-K
PART II ITEM 5. Market for Registrant’s Common Equity, Related Stockholder Matters and Issuer Purchases of Equity Securities
Stock Performance Graph
This performance graph shall not be deemed “fi led” for purposes of Section 18 of the Securities Exchange Act of 1934, as amended (the Exchange Act), or incorporated by reference into any fi ling of Google under the Securities Act of 1933, as amended, or the Exchange Act, except as shall be expressly set forth by specifi c reference in such fi ling.
The following graph compares the 5-year cumulative total return to shareholders on Google Inc.’s common stock relative to the cumulative total returns of the S&P 500 index, the RDG Internet Composite index, and the NASDAQ Composite index. An investment of $100 (with reinvestment of all dividends) is assumed to have been made in the company’s common stock and in each index on December 31, 2007 and its relative performance is tracked through December 31, 2012. The returns shown are based on historical results and are not intended to suggest future performance.
COMPARISON OF 5 YEAR CUMULATIVE TOTAL RETURN*Among Google Inc., the S&P 500 Index, the NASDAQ Composite Index,
and the RDG Internet Composite Index
12/07 3/08 6/08 9/08 12/08 3/09 6/09 9/09 12/09 3/10 6/10 9/10 12/10 3/11 6/11 9/11 12/11 3/12 6/12 9/12 12/12
* $100 invested on December 31, 2007 in stock or index, including reinvestment of dividends. Fiscal year ending December 31.
Copyright© 2013 S&P, a division of The McGraw-Hill Companies Inc. All rights reserved.
$0
$20
$40
$60
$80
$100
$120
$140
$160
Google Inc. S&P 500 NASDAQ Composite RDG Internet Composite
Contents
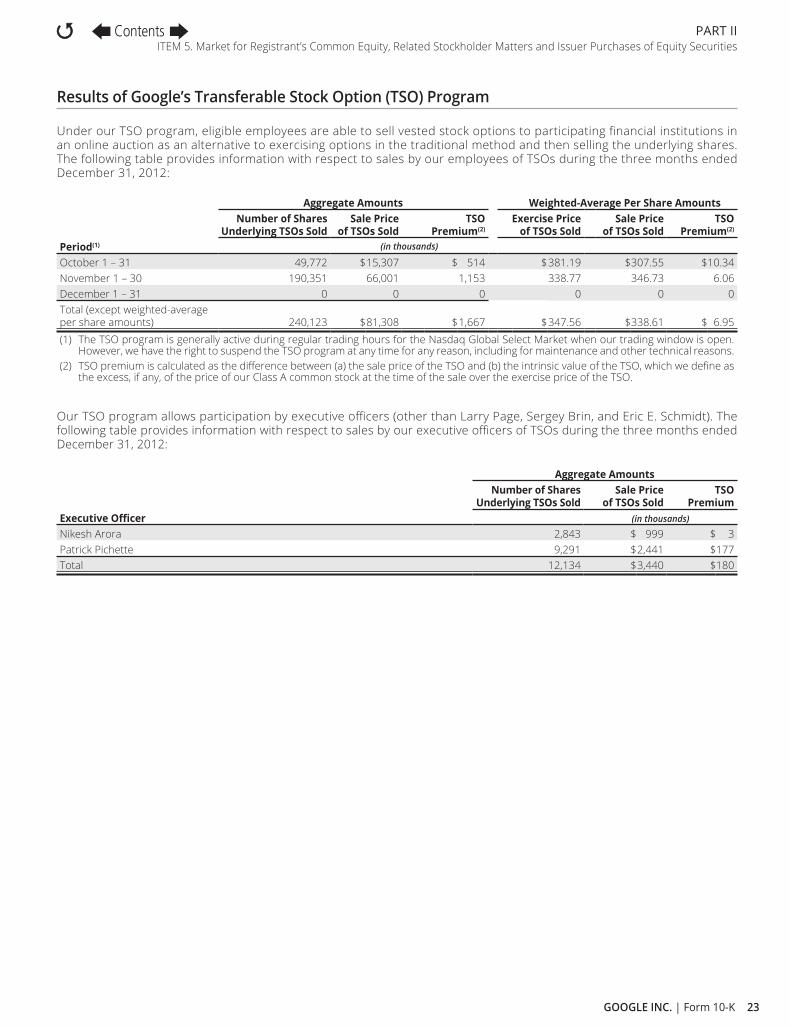
23GOOGLE INC. | Form 10-K
PART II ITEM 5. Market for Registrant’s Common Equity, Related Stockholder Matters and Issuer Purchases of Equity Securities
Results of Google’s Transferable Stock Option (TSO) Program
Under our TSO program, eligible employees are able to sell vested stock options to participating fi nancial institutions in an online auction as an alternative to exercising options in the traditional method and then selling the underlying shares. The following table provides information with respect to sales by our employees of TSOs during the three months ended December 31, 2012:
Period(1)
Aggregate Amounts Weighted-Average Per Share AmountsNumber of Shares
Underlying TSOs SoldSale Price
of TSOs SoldTSO
Premium(2)Exercise Price
of TSOs SoldSale Price
of TSOs SoldTSO
Premium(2)
(in thousands)
October 1 – 31 49,772 $15,307 $ 514 $381.19 $307.55 $10.34November 1 – 30 190,351 66,001 1,153 338.77 346.73 6.06December 1 – 31 0 0 0 0 0 0Total (except weighted-average per share amounts) 240,123 $81,308 $1,667 $347.56 $338.61 $ 6.95(1) The TSO program is generally active during regular trading hours for the Nasdaq Global Select Market when our trading window is open.
However, we have the right to suspend the TSO program at any time for any reason, including for maintenance and other technical reasons.(2) TSO premium is calculated as the difference between (a) the sale price of the TSO and (b) the intrinsic value of the TSO, which we define as
the excess, if any, of the price of our Class A common stock at the time of the sale over the exercise price of the TSO.
Our TSO program allows participation by executive offi cers (other than Larry Page, Sergey Brin, and Eric E. Schmidt). The following table provides information with respect to sales by our executive offi cers of TSOs during the three months ended December 31, 2012:
Executive Offi cer
Aggregate AmountsNumber of Shares
Underlying TSOs SoldSale Price
of TSOs SoldTSO
Premium(in thousands)
Nikesh Arora 2,843 $ 999 $ 3Patrick Pichette 9,291 $2,441 $177Total 12,134 $3,440 $180
Contents

24 GOOGLE INC. | Form 10-K
PART II ITEM 6. Selected Financial Data
ITEM 6. Selected Financial DataYou should read the following selected consolidated fi nancial data in conjunction with Item 7 “Management’s Discussion and Analysis of Financial Condition and Results of Operations” and our consolidated fi nancial statements and the related notes appearing in Item 8 “Financial Statements and Supplementary Data” of this Annual Report on Form 10-K.
The consolidated statements of income data for the years ended December 31, 2010, 2011, and 2012 and the consolidated balance sheet data at December 31, 2011, and 2012 are derived from our audited consolidated fi nancial statements appearing in Item 8 of this Annual Report on Form 10-K. The consolidated statements of income data for the years ended December 31, 2008 and 2009, and the consolidated balance sheet data at December 31, 2008, 2009, and 2010, are derived from our audited consolidated fi nancial statements that are not included in this Annual Report on Form 10-K. The historical results are not necessarily indicative of the results to be expected in any future period.
(in millions, except per share amounts)
Year Ended December 31,2008 2009 2010 2011 2012
Consolidated Statements of Income Data: Revenues $21,796 $23,651 $29,321 $37,905 $50,175 Income from operations 6,632 8,312 10,381 11,742 12,760 Net income from continuing operations 4,227 6,520 8,505 9,737 10,788 Net loss from discontinued operations 0 0 0 0 (51)Net income 4,227 6,520 8,505 9,737 10,737 Net income (loss) per share of Class A and Class B common stock—basic
Continuing operations $ 13.46 $ 20.62 $ 26.69 $ 30.17 $ 32.97 Discontinued operations 0 0 0 0 $ (0.16)
Net income per share of Class A and Class B common stock—basic $ 13.46 $ 20.62 $ 26.69 $ 30.17 $ 32.81 Net income (loss) per share of Class A and Class B common stock—diluted
Continuing operations $ 13.31 $ 20.41 $ 26.31 $ 29.76 $ 32.46 Discontinued operations 0 0 0 0 $ (0.15)
Net income per share of Class A and Class B common stock—diluted $ 13.31 $ 20.41 $ 26.31 $ 29.76 $ 32.31
(in millions)
As of December 31,2008 2009 2010 2011 2012
Consolidated Balance Sheet Data: Cash, cash equivalents, and marketable securities $15,846 $24,485 $34,975 $44,626 $48,088Total assets 31,768 40,497 57,851 72,574 93,798Total long-term liabilities 1,227 1,746 1,614 5,516 7,746Total stockholders’ equity 28,239 36,004 46,241 58,145 71,715
Contents
25GOOGLE INC. | Form 10-K
PART II ITEM 7. Management’s Discussion and Analysis of Financial Condition and Results of Operations
ITEM 7. Management’s Discussion and Analysis of Financial Condition and Results of Operations
The following discussion and analysis of our fi nancial condition and results of operations should be read together with our consolidated fi nancial statements and related notes included under Item 8 of this Annual Report on Form 10-K.
Overview
Google is a global technology leader focused on improving the ways people connect with information. We aspire to build products and provide services that improve the lives of billions of people globally. Our mission is to organize the world’s information and make it universally accessible and useful. Our innovations in web search and advertising have made our website a top internet property and our brand one of the most recognized in the world.
Our Motorola business is comprised of two operating segments. The Mobile segment is focused on mobile wireless devices and related products and services. The Home segment is focused on technologies and devices that provide video entertainment services to consumers by enabling subscribers to access a variety of interactive digital television services.
We generate revenue primarily by delivering relevant, cost-eff ective online advertising. Businesses use our AdWords program to promote their products and services with targeted advertising. In addition, the third parties that comprise the Google Network use our AdSense program to deliver relevant ads that generate revenues and enhance the user experience. We also generate revenues from Motorola by selling hardware products.
In December 2012, we entered into an agreement with Arris and certain other persons providing for the disposition of our Motorola Home segment. The transaction is expected to close in 2013.
Trends in Our Businesses
Advertising transactions continue to shift from offl ine to online as the digital economy evolves. This has contributed to the rapid growth of our business since inception, resulting in substantially increased revenues, and we expect that our business will continue to grow. However, our revenue growth rate has generally declined over time, and it could do so in the future as a result of a number of factors, including increasing competition, our investments in new business strategies, products, services, and technologies, changes in our product mix, query growth rates and how users make queries, challenges in maintaining our growth rate as our revenues increase to higher levels, and the evolution of the online advertising market, including the increasing variety of online platforms for advertising, and other markets in which we participate.
Mobile search queries and mobile commerce are growing dramatically around the world, and consumers are using multiple devices to access information. Over time these trends have resulted in changes in our product mix, including a signifi cant increase in mobile search queries and a deceleration in the growth of desktop queries. We expect that our revenue growth rate will continue to be aff ected by evolving consumer preferences, as well as by advertising trends, the acceptance by mobile users of our products and services, and our ability to create a seamless experience for both users and advertisers in a multi-screen environment. In addition, if there is a further general economic downturn, this may result in fewer commercial queries by our users and may cause advertisers to reduce the amount they spend on online advertising, including the amount they are willing to pay for each click or impression, which could negatively aff ect the growth rate of our revenues. We plan to continue to invest aggressively in our core areas of strategic focus.
The main focus of our advertising programs is to provide relevant and useful advertising to our users, refl ecting our commitment to constantly improve their overall web experience. As a result, we expect to continue to take steps to improve the relevance of the ads displayed on our websites and our Google Network Members’ websites. These steps include not displaying ads that generate low click-through rates or that send users to irrelevant or otherwise low quality websites, updating our advertising policies and ensuring their compliance, and terminating our relationships with those Google Network Members whose websites do not meet our quality requirements. We may also continue to take steps to reduce the number of accidental clicks by our users. These steps could negatively aff ect the growth rate of our revenues.
Both seasonal fl uctuations in internet usage and traditional retail seasonality have aff ected, and are likely to continue to aff ect, our business. Internet usage generally slows during the summer months, and commercial queries typically increase signifi cantly in the fourth quarter of each year. These seasonal trends have caused, and will likely continue to cause, fl uctuations in our quarterly results, including fl uctuations in sequential revenues, as well as aggregate paid click and average cost-per-click growth rates.
Contents
26 GOOGLE INC. | Form 10-K
PART II ITEM 7. Management’s Discussion and Analysis of Financial Condition and Results of Operations
The operating margin we realize on revenues generated from ads placed on our Google Network Members’ websites through our AdSense program is signifi cantly lower than the operating margin we realize from revenues generated from ads placed on our websites because most of the advertiser fees from ads served on Google Network Members’ websites are shared with our Google Network Members. For the past fi ve years, growth in advertising revenues from our websites has generally exceeded that from our Google Network Members’ websites. This trend has had a positive impact on our operating margins, and we expect that this will continue for the foreseeable future, although the relative rate of growth in revenues from our websites compared to the rate of growth in revenues from our Google Network Members’ websites may vary over time. Also, the margins on advertising revenues from mobile devices and other newer advertising formats are generally lower than those from desktop computers and tablets. We expect this trend to continue to pressure our margins, particularly if we fail to realize the opportunities we anticipate with the transition to a dynamic multi-screen environment.
We conduct our Motorola business in highly competitive markets, facing both new and established competitors. The markets for many of our products are characterized by rapidly changing technologies, frequent new product introductions, changing consumer trends, short product life cycles, consumer loyalty and evolving industry standards. Market disruptions caused by new technologies, the entry of new competitors, consolidations among our customers and competitors, changes in regulatory requirements, changes in economic conditions, supply chain interruptions or other factors, can introduce volatility into our businesses. Meeting all of these challenges requires consistent operational planning and execution and investment in technology, resulting in innovative products that meet the needs of our customers around the world.
From an overall business perspective, we continue to invest aggressively in our systems, data centers, corporate facilities, information technology infrastructure, and employees. We increased our hiring in 2012, and we may continue to do so and to provide competitive compensation programs for our employees. Our full-time employee headcount was 32,467 at December 31, 2011 and 53,861 at December 31, 2012, which includes 16,317 headcount from Motorola. Acquisitions will also remain an important component of our strategy and use of capital, and we expect our current pace of acquisitions to continue. We expect our cost of revenues will increase in dollars and may increase as a percentage of revenues in future periods, primarily as a result of forecasted increases in traffi c acquisition costs, manufacturing and inventory-related costs, data center costs, content acquisition costs, credit card and other transaction fees, and other costs. In particular, traffi c acquisition costs as a percentage of advertising revenues may increase in the future if we are unable to continue to improve the monetization or generation of revenues from traffi c on our websites and our Google Network Members’ websites.
As we expand our advertising programs and other products to international markets, we continue to increase our exposure to fl uctuations in foreign currency to U.S. dollar exchange rates. We have a foreign exchange risk management program that is designed to reduce our exposure to fl uctuations in foreign currency exchange rates. However, this program will not fully off set the eff ect of fl uctuations on our revenues and earnings.
Contents
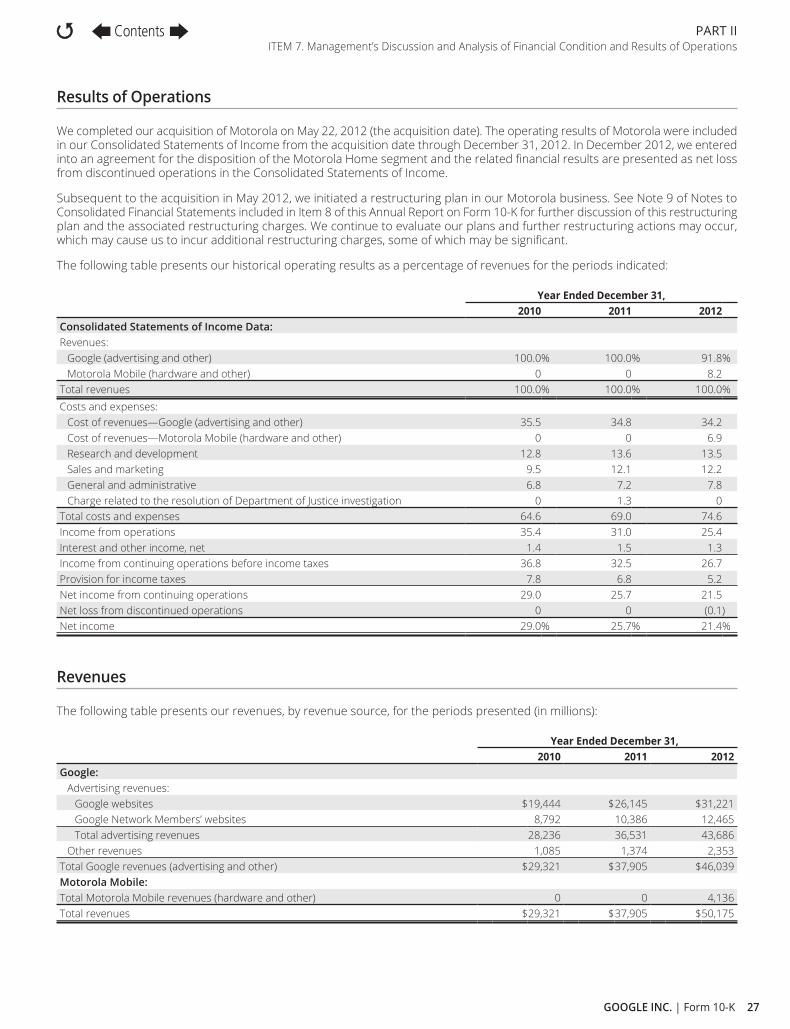
27GOOGLE INC. | Form 10-K
PART II ITEM 7. Management’s Discussion and Analysis of Financial Condition and Results of Operations
Results of Operations
We completed our acquisition of Motorola on May 22, 2012 (the acquisition date). The operating results of Motorola were included in our Consolidated Statements of Income from the acquisition date through December 31, 2012. In December 2012, we entered into an agreement for the disposition of the Motorola Home segment and the related fi nancial results are presented as net loss from discontinued operations in the Consolidated Statements of Income.
Subsequent to the acquisition in May 2012, we initiated a restructuring plan in our Motorola business. See Note 9 of Notes to Consolidated Financial Statements included in Item 8 of this Annual Report on Form 10-K for further discussion of this restructuring plan and the associated restructuring charges. We continue to evaluate our plans and further restructuring actions may occur, which may cause us to incur additional restructuring charges, some of which may be signifi cant.
The following table presents our historical operating results as a percentage of revenues for the periods indicated:
Year Ended December 31,2010 2011 2012
Consolidated Statements of Income Data: Revenues:
Google (advertising and other) 100.0% 100.0% 91.8%Motorola Mobile (hardware and other) 0 0 8.2
Total revenues 100.0% 100.0% 100.0%Costs and expenses:
Cost of revenues—Google (advertising and other) 35.5 34.8 34.2 Cost of revenues—Motorola Mobile (hardware and other) 0 0 6.9 Research and development 12.8 13.6 13.5 Sales and marketing 9.5 12.1 12.2 General and administrative 6.8 7.2 7.8 Charge related to the resolution of Department of Justice investigation 0 1.3 0
Total costs and expenses 64.6 69.0 74.6Income from operations 35.4 31.0 25.4 Interest and other income, net 1.4 1.5 1.3 Income from continuing operations before income taxes 36.8 32.5 26.7 Provision for income taxes 7.8 6.8 5.2 Net income from continuing operations 29.0 25.7 21.5 Net loss from discontinued operations 0 0 (0.1)Net income 29.0% 25.7% 21.4%
Revenues
The following table presents our revenues, by revenue source, for the periods presented (in millions):
Year Ended December 31,2010 2011 2012
Google: Advertising revenues:
Google websites $19,444 $26,145 $31,221Google Network Members’ websites 8,792 10,386 12,465Total advertising revenues 28,236 36,531 43,686
Other revenues 1,085 1,374 2,353Total Google revenues (advertising and other) $29,321 $37,905 $46,039Motorola Mobile: Total Motorola Mobile revenues (hardware and other) 0 0 4,136Total revenues $29,321 $37,905 $50,175
Contents

28 GOOGLE INC. | Form 10-K
PART II ITEM 7. Management’s Discussion and Analysis of Financial Condition and Results of Operations
The following table presents our revenues, by business, as a percentage of total revenues for the periods presented:
Year Ended December 31,2010 2011 2012
Google (advertising and other) 100% 100% 92%Motorola Mobile (hardware and other) 0% 0% 8%Total revenues 100% 100% 100%
The following table presents our Google revenues, by revenue source, as a percentage of total Google revenues for the periods presented:
Year Ended December 31,2010 2011 2012
Advertising revenues: Google websites 66% 69% 68%Google Network Members’ websites 30% 27% 27%
Total advertising revenues 96% 96% 95%Google websites as % of advertising revenues 69% 72% 71%Google Network Members’ websites as % of advertising revenues 31% 28% 29%
Other revenues 4% 4% 5%
Our revenues increased $12,270 million from 2011 to 2012. This increase resulted primarily from an increase in advertising revenues generated by Google websites and Google Network Members’ websites and, to a lesser extent, an increase in other revenues driven by hardware product sales. The increase in advertising revenues for Google websites and Google Network Members’ websites resulted primarily from an increase in the number of paid clicks through our advertising programs, partially off set by a decrease in the average cost-per-click paid by our advertisers. The increase in the number of paid clicks generated through our advertising programs was due to an increase in aggregate traffi c including mobile queries, certain monetization improvements including new ad formats, the continued global expansion of our products, advertisers, and user base, as well as an increase in the number of Google Network Members. The decrease in the average cost-per-click paid by our advertisers was driven by various factors, such as the general strengthening of the U.S dollar compared to certain foreign currencies (primarily the Euro), the revenue shift mix between Google websites and Google Network Members’ websites, the changes in platform mix due to traffi c growth in mobile devices, where the average cost-per-click is typically lower compared to desktop computers and tablets, and the changes in geographical mix due to traffi c growth in emerging markets, where the average cost-per-click is typically lower compared to more mature markets.
In addition, the increase in our revenues from 2011 to 2012 resulted from the inclusion of revenues from our Motorola Mobile business of $4,136 million.
Our revenues increased $8,584 million from 2010 to 2011. This increase resulted primarily from an increase in advertising revenues generated by Google websites and Google Network Members’ websites. The increase in advertising revenues for Google websites and Google Network Members’ websites resulted primarily from an increase in the number of paid clicks through our advertising programs and, to a lesser extent, an increase in the average cost-per-click paid by our advertisers. The increase in the number of paid clicks generated through our advertising programs was due to an increase in aggregate traffi c, certain monetization improvements including new ad formats, and the continued global expansion of our products, and our advertiser and user base, as well as an increase in the number of Google Network Members. The increase in the average cost-per-click paid by our advertisers was primarily driven by the increased spending from advertisers and a general weakening of the U.S dollar compared to foreign currencies (primarily the Euro, Japanese yen, and British pound), partially off set by the changes in geographical mix due to traffi c growth in emerging markets, where the average cost-per-click is typically lower, compared to more mature markets. In addition, the increase in advertising revenues for Google Network Members’ websites from 2010 to 2011 was partially off set by the loss of a search partnership and, to a lesser extent, by a search quality improvement made during the fi rst quarter of 2011.
Improvements in our ability to ultimately monetize increased traffi c primarily relate to enhancing the end user experience, including providing end users with ads that are more relevant to their search queries or to the content on the Google Network Members’ websites they visit. For instance, these improvements include increasing site links to be full size links with the URL (uniform resource locator), moving a portion of the fi rst line of the ad to the heading to better promote the content of the ad, providing an option to preview the ad, and moving the ad’s URL to a separate line below the heading for greater page format consistency.
Contents
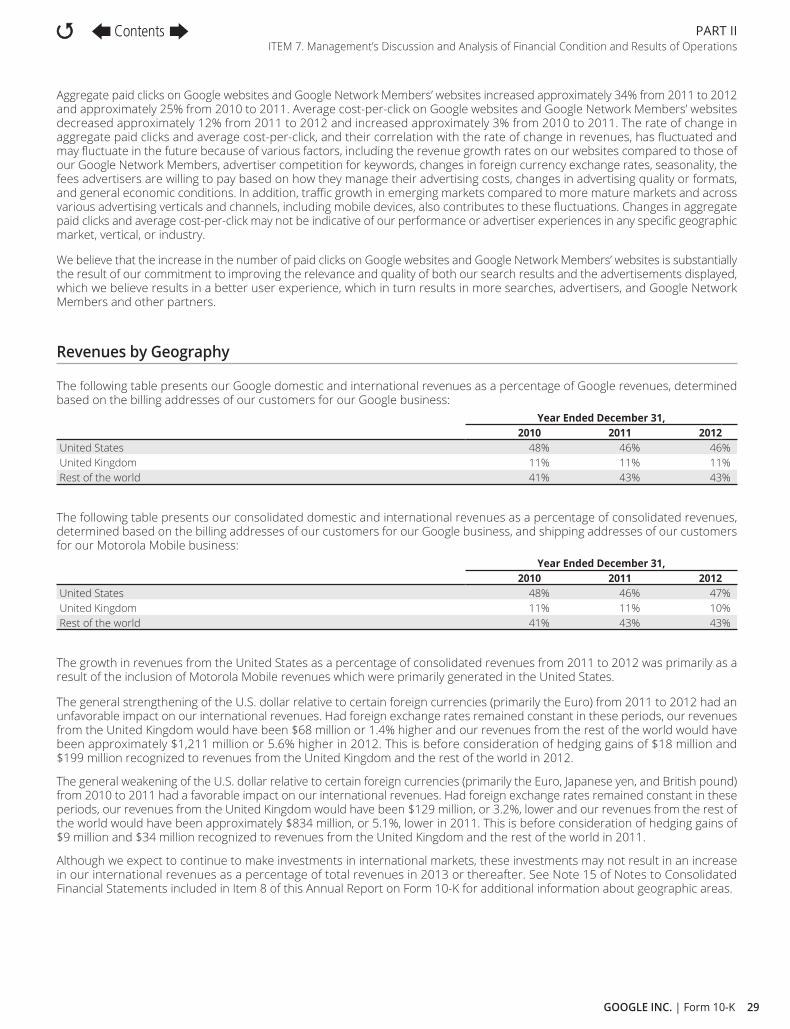
29GOOGLE INC. | Form 10-K
PART II ITEM 7. Management’s Discussion and Analysis of Financial Condition and Results of Operations
Aggregate paid clicks on Google websites and Google Network Members’ websites increased approximately 34% from 2011 to 2012 and approximately 25% from 2010 to 2011. Average cost-per-click on Google websites and Google Network Members’ websites decreased approximately 12% from 2011 to 2012 and increased approximately 3% from 2010 to 2011. The rate of change in aggregate paid clicks and average cost-per-click, and their correlation with the rate of change in revenues, has fl uctuated and may fl uctuate in the future because of various factors, including the revenue growth rates on our websites compared to those of our Google Network Members, advertiser competition for keywords, changes in foreign currency exchange rates, seasonality, the fees advertisers are willing to pay based on how they manage their advertising costs, changes in advertising quality or formats, and general economic conditions. In addition, traffi c growth in emerging markets compared to more mature markets and across various advertising verticals and channels, including mobile devices, also contributes to these fl uctuations. Changes in aggregate paid clicks and average cost-per-click may not be indicative of our performance or advertiser experiences in any specifi c geographic market, vertical, or industry.
We believe that the increase in the number of paid clicks on Google websites and Google Network Members’ websites is substantially the result of our commitment to improving the relevance and quality of both our search results and the advertisements displayed, which we believe results in a better user experience, which in turn results in more searches, advertisers, and Google Network Members and other partners.
Revenues by Geography
The following table presents our Google domestic and international revenues as a percentage of Google revenues, determined based on the billing addresses of our customers for our Google business:
Year Ended December 31,2010 2011 2012
United States 48% 46% 46%United Kingdom 11% 11% 11%Rest of the world 41% 43% 43%
The following table presents our consolidated domestic and international revenues as a percentage of consolidated revenues, determined based on the billing addresses of our customers for our Google business, and shipping addresses of our customers for our Motorola Mobile business:
Year Ended December 31,2010 2011 2012
United States 48% 46% 47%United Kingdom 11% 11% 10%Rest of the world 41% 43% 43%
The growth in revenues from the United States as a percentage of consolidated revenues from 2011 to 2012 was primarily as a result of the inclusion of Motorola Mobile revenues which were primarily generated in the United States.
The general strengthening of the U.S. dollar relative to certain foreign currencies (primarily the Euro) from 2011 to 2012 had an unfavorable impact on our international revenues. Had foreign exchange rates remained constant in these periods, our revenues from the United Kingdom would have been $68 million or 1.4% higher and our revenues from the rest of the world would have been approximately $1,211 million or 5.6% higher in 2012. This is before consideration of hedging gains of $18 million and $199 million recognized to revenues from the United Kingdom and the rest of the world in 2012.
The general weakening of the U.S. dollar relative to certain foreign currencies (primarily the Euro, Japanese yen, and British pound) from 2010 to 2011 had a favorable impact on our international revenues. Had foreign exchange rates remained constant in these periods, our revenues from the United Kingdom would have been $129 million, or 3.2%, lower and our revenues from the rest of the world would have been approximately $834 million, or 5.1%, lower in 2011. This is before consideration of hedging gains of $9 million and $34 million recognized to revenues from the United Kingdom and the rest of the world in 2011.
Although we expect to continue to make investments in international markets, these investments may not result in an increase in our international revenues as a percentage of total revenues in 2013 or thereafter. See Note 15 of Notes to Consolidated Financial Statements included in Item 8 of this Annual Report on Form 10-K for additional information about geographic areas.
Contents

30 GOOGLE INC. | Form 10-K
PART II ITEM 7. Management’s Discussion and Analysis of Financial Condition and Results of Operations
Costs and Expenses
Cost of Revenues
Cost of revenues consists primarily of traffi c acquisition costs. Traffi c acquisition costs consist of amounts ultimately paid to our Google Network Members under AdSense arrangements and to certain other partners (our distribution partners) who distribute our toolbar and other products (collectively referred to as access points) or otherwise direct search queries to our website (collectively referred to as distribution arrangements). These amounts are primarily based on the revenue share and fi xed fee arrangements with our Google Network Members and distribution partners.
Certain distribution arrangements require us to pay our partners based on a fee per access point delivered and not exclusively—or at all—based on revenue share. These fees are non-refundable. Further, these arrangements are terminable at will, although under the terms of certain contracts we or our distribution partners may be subject to penalties in the event of early termination. We recognize fees under these arrangements over the estimated useful lives of the access points (approximately two years) to the extent we can reasonably estimate those lives and they are longer than one year, or based on any contractual revenue share, if greater. Otherwise, the fees are charged to expense as incurred. The estimated useful life of the access points is based on the historical average period of time they generate traffi c and revenues.
Cost of revenues also includes the expenses associated with the operation of our data centers, including depreciation, labor, energy, and bandwidth costs, credit card and other transaction fees related to processing customer transactions, amortization of acquired intangible assets, as well as content acquisition costs. We have entered into arrangements with certain content providers under which we distribute or license their video and other content. In a number of these arrangements, we display ads on the pages of our websites from which the content is viewed and share most of the fees these ads generate with the content providers. We also license content on the pages of our web sites from which the content is sold and share most of the fees these sales generate with content providers. To the extent we are obligated to make guaranteed minimum revenue share payments to our content providers, we recognize as content acquisition costs the contractual revenue share amount or on a straight-line basis, whichever is greater, over the terms of the agreements.
In addition, cost of revenues includes manufacturing and inventory-related costs from our Motorola Mobile business.
The following tables present our cost of revenues and cost of revenues as a percentage of revenues by business, and our traffi c acquisition costs, and traffi c acquisition costs as a percentage of advertising revenues in the Google business, for the periods presented (dollars in millions):
Year Ended December 31,2010 2011 2012
Cost of revenues—Google (advertising and other) $10,417 $13,188 $17,176 Cost of revenues—Motorola Mobile (hardware and other) 0 0 3,458 Cost of revenues—Google (advertising and other) as a percentage of Google revenues 35.5% 34.8% 37.3%Cost of revenues—Motorola Mobile (hardware and other) as a percentage of Motorola Mobile revenues 0 0 83.6%
Year Ended December 31,2010 2011 2012
Traffi c acquisition costs related to AdSense arrangements $6,162 $7,294 $ 8,791 Traffi c acquisition costs related to distribution arrangements 1,155 1,517 2,165 Total traffi c acquisition costs $7,317 $8,811 $10,956Traffi c acquisition costs as a percentage of advertising revenues 25.9% 24.1% 25.1%
Cost of revenues increased $7,446 million from 2011 to 2012. The increase was primarily related to the inclusion of manufacturing and inventory-related costs from our Motorola Mobile business of $3,458 million. Additionally, there was an increase in traffi c acquisition costs of $2,145 million resulting from more advertiser fees generated through our AdSense program, more traffi c directed to our websites, as well as more distribution fees paid. The remaining increase was primarily driven by increase in data center costs, hardware product costs and content acquisition costs. The increase in traffi c acquisition costs as a percentage of advertising revenues was primarily the result of a greater increase in traffi c acquisition costs related to distribution arrangements compared to the increase in advertising revenues generated by Google websites. The increase in Google cost of revenues as a percentage of Google revenues was also driven by an increase in hardware product costs.
Cost of revenues increased $2,771 million from 2010 to 2011. The increase was primarily related to an increase in traffi c acquisition costs of $1,132 million resulting from more advertiser fees generated through our AdSense program. The increase was also related to an increase in traffi c acquisition costs of $362 million from our distribution arrangements as a result of more traffi c directed to our websites, as well as more distribution fees paid. The decrease in traffi c acquisition costs as a percentage of advertising revenues was primarily due to an increase in the proportion of advertising revenues from our websites compared to our Google Network
Contents

31GOOGLE INC. | Form 10-K
PART II ITEM 7. Management’s Discussion and Analysis of Financial Condition and Results of Operations
Members’ websites, more revenues realized from Google Network Members to whom we pay less revenue share, and, to a lesser extent, expiration of an AdSense arrangement under which we paid guaranteed minimum revenue share. In addition, there was an increase in data center costs of $784 million, primarily resulting from the depreciation of additional information technology assets and data center buildings and an increase in labor, energy, and bandwidth costs, and an increase in content acquisition costs of $236 million, primarily related to content displayed on YouTube, partially off set by a decrease in mobile phone costs.
We expect cost of revenues will increase in dollar amount and may increase as a percentage of total revenues in 2013 and in future periods, primarily as a result of increases in traffi c acquisition costs, data center costs, manufacturing and inventory-related costs, content acquisition costs, credit card and other transaction fees, and other costs. Traffi c acquisition costs as a percentage of advertising revenues may fl uctuate in the future based on a number of factors, including the following:
• The relative growth rates of revenues from our websites and from our Google Network Members’ websites.
• Whether we are able to enter into more AdSense arrangements that provide for lower revenue share obligations or whether increased competition for arrangements with existing and potential Google Network Members results in less favorable revenue share arrangements.
• Whether we are able to continue to improve the monetization of traffi c on our websites and our Google Network Members’ websites.
• The relative growth rates of expenses associated with distribution arrangements and the related revenues generated, including whether we share with certain existing and new distribution partners, including mobile distribution partners, proportionately more of the aggregate advertising fees that we earn from paid clicks derived from search queries these partners direct to our websites.
Research and Development
The following table presents our research and development expenses, and research and development expenses as a percentage of our revenues for the periods presented (dollars in millions):
Year Ended December 31,2010 2011 2012
Research and development expenses $3,762 $5,162 $6,793 Research and development expenses as a percentage of total revenues 12.8% 13.6% 13.5%
Research and development expenses consist primarily of compensation and related costs for personnel responsible for the research and development of new and existing products and services. We expense research and development costs as incurred.
Research and development expenses increased $1,631 million from 2011 to 2012, which includes $710 million related to Motorola Mobile. The remaining increase of $921 million was primarily due to an increase in labor and facilities-related costs of $359 million, largely as a result of a 15% increase in research and development headcount, an increase in stock-based compensation expense of $213 million, an increase in depreciation and equipment-related expenses of $147 million, and an increase in professional services expense of $66 million.
Research and development expenses increased $1,400 million from 2010 to 2011. This increase was primarily due to an increase in labor and facilities-related costs of $875 million, largely as a result of a 23% increase in research and development headcount, including headcount from acquisitions, as well as an increase in employee base salaries of approximately 10%. In addition, there was an increase in stock-based compensation expense of $200 million.
We expect that research and development expenses will increase in dollar amount and may increase as a percentage of total revenues in 2013 and future periods because we expect to continue to invest in building the necessary employee and system infrastructure required to support the development of new, and improve existing, products and services.
Sales and Marketing
The following table presents our sales and marketing expenses, and sales and marketing expenses as a percentage of total revenues for the periods presented (dollars in millions):
Year Ended December 31,2010 2011 2012
Sales and marketing expenses $2,799 $4,589 $6,143 Sales and marketing expenses as a percentage of total revenues 9.5% 12.1% 12.2%
Contents

32 GOOGLE INC. | Form 10-K
PART II ITEM 7. Management’s Discussion and Analysis of Financial Condition and Results of Operations
Sales and marketing expenses consist primarily of compensation and related costs for personnel engaged in customer service, sales, and sales support functions, as well as advertising and promotional expenditures.
Sales and marketing expenses increased $1,554 million from 2011 to 2012, which includes $678 million related to Motorola Mobile. The remaining increase of $876 million was primarily due to an increase in labor and facilities-related costs of $390 million, largely as a result of a 14% increase in sales and marketing headcount, as well as an increase in advertising and promotional expenses of $288 million. In addition, there was an increase in stock-based compensation expense of $87 million.
Sales and marketing expenses increased $1,790 million from 2010 to 2011. This increase was primarily due to an increase in labor and facilities-related costs of $787 million, largely as a result of a 36% increase in sales and marketing headcount, including headcount from acquisitions, as well as an increase in employee base salaries of approximately 10%. In addition, there was an increase in advertising and promotional expenses of $700 million.
We expect that sales and marketing expenses will increase in dollar amount and may increase as a percentage of total revenues in 2013 and future periods, as we expand our business globally, increase advertising and promotional expenditures in connection with new and existing products, and increase the level of service we provide to our advertisers, Google Network Members, and other partners.
General and Administrative
The following table presents our general and administrative expenses, and general and administrative expenses as a percentage of total revenues for the periods presented (dollars in millions):
Year Ended December 31,2010 2011 2012
General and administrative expenses $1,962 $2,724 $3,845 General and administrative expenses as a percentage of total revenues 6.8% 7.2% 7.8%
General and administrative expenses consist primarily of compensation and related costs for personnel and facilities, and include costs related to our facilities, fi nance, human resources, information technology, and legal organizations, and fees for professional services. Professional services are principally comprised of outside legal, audit, information technology consulting, and outsourcing services. General and administrative expenses also include amortization of certain acquired intangible assets.
General and administrative expenses increased $1,121 million from 2011 to 2012, which includes $364 million related to Motorola Mobile. The remaining increase of $757 million was primarily due to an increase in amortization of acquired intangible assets of $274 million, an increase in professional services expense of $147 million, the majority of which was related to legal costs, an increase in labor and facilities-related costs of $122 million, primarily as a result of a 11% increase in general and administrative headcount, as well as an increase in stock-based compensation expense of $89 million.
General and administrative expenses increased $762 million from 2010 to 2011. This increase was primarily due to an increase in labor and facilities-related costs of $350 million, primarily as a result of a 37% increase in general and administrative headcount and an increase in employee base salaries of approximately 10%, as well as an increase in expense related to professional services of $260 million, the majority of which were related to consulting services and legal costs. In addition, there was an increase in stock-based compensation of $116 million.
As we expand our business and incur additional expenses, we expect general and administrative expenses will increase in dollar amount and may increase as a percentage of total revenues in 2013 and future periods.
Charge Related to the Resolution of Department of Justice Investigation
In connection with a resolution of an investigation by the United States Department of Justice into the use of Google advertising by certain advertisers, we accrued $500 million during the fi rst quarter of 2011, which was paid in August 2011 upon fi nal resolution of that matter.
Contents

33GOOGLE INC. | Form 10-K
PART II ITEM 7. Management’s Discussion and Analysis of Financial Condition and Results of Operations
Stock-Based Compensation
The following table presents our stock-based compensation, and stock-based compensation as a percentage of revenues for the periods presented (dollars in millions):
Year Ended December 31,2010 2011 2012
Stock-based compensation $1,376 $1,974 $2,649 Stock-based compensation as a percentage of total revenues 4.7% 5.2% 5.3%
Stock-based compensation increased $675 million from 2011 to 2012. This increase was primarily due to additional stock awards issued to existing and new employees, awards issued in connection with the acquisition of Motorola, and acceleration of certain awards resulting from Motorola restructuring. Additionally, stock-based compensation expense for the Motorola Home segment was included in net loss from discontinued operations.
Stock-based compensation increased $598 million from 2010 to 2011. This increase was largely due to additional stock awards issued to existing and new employees.
We estimate stock-based compensation to be approximately $2.5 billion in 2013 and $2.7 billion thereafter. This estimate does not include expenses to be recognized related to employee stock awards that are granted after December 31, 2012 or non-employee stock awards that have been or may be granted. In addition, to the extent forfeiture rates are diff erent from what we have anticipated, stock-based compensation related to these awards will be diff erent from our expectations.
Interest and Other Income, Net
Interest and other income, net, increased $42 million from 2011 to 2012. This increase was primarily driven by a gain on divestiture of business of $188 million in 2012, an impairment charge related to equity investments of $110 million in 2011, partially off set by an increase in foreign currency exchange loss of $152 million and a decrease in interest income of $99 million.
Interest and other income, net increased $169 million from 2010 to 2011. This increase was primarily driven by an increase in interest income of $233 million due to an increase in our cash and investment balances and higher yields, as well as an increase in net realized gains on sales of available-for-sale investments of $69 million, partially off set by an increase in interest expense of $53 million primarily related to our long-term debt program. In addition, we recorded an impairment charge of $110 million related to certain equity investments during the year ended December 31, 2011.
The costs of our foreign exchange hedging activities that we recognized to interest and other income, net are primarily a function of the notional amount of the option and forward contracts and their related duration, the movement of the foreign exchange rates relative to the strike prices of the contracts, as well as the volatility of the foreign exchange rates.
As we expand our international business, we believe costs related to hedging activities under our foreign exchange risk management program may increase in dollar amount in 2013 and future periods.
Provision for Income Taxes
The following table presents our provision for income taxes, and eff ective tax rate for the periods presented (dollars in millions):Year Ended December 31,
2010 2011 2012Provision for income taxes $2,291 $2,589 $2,598 Eff ective tax rate 21.2% 21.0% 19.4%
Our provision for income taxes increased from 2011 to 2012, primarily as a result of increases in federal income taxes, driven by higher taxable income year over year and expiration of the federal research and development credit, partially off set by proportionately more earnings realized in countries that have lower statutory tax rates. Our eff ective tax rate decreased from 2011 to 2012, primarily as a result of proportionately more earnings realized in countries that have lower statutory tax rates as well as a discrete item related to an investigation by the Department of Justice recognized in 2011, which was not deductible for income tax purposes.
Our provision for income taxes increased from 2010 to 2011, primarily as a result of increases in federal income taxes, driven by higher taxable income year over year, partially off set by proportionately more earnings realized in countries that have lower statutory tax rates. Our eff ective tax rate decreased from 2010 to 2011, primarily as a result of proportionately more earnings
Contents
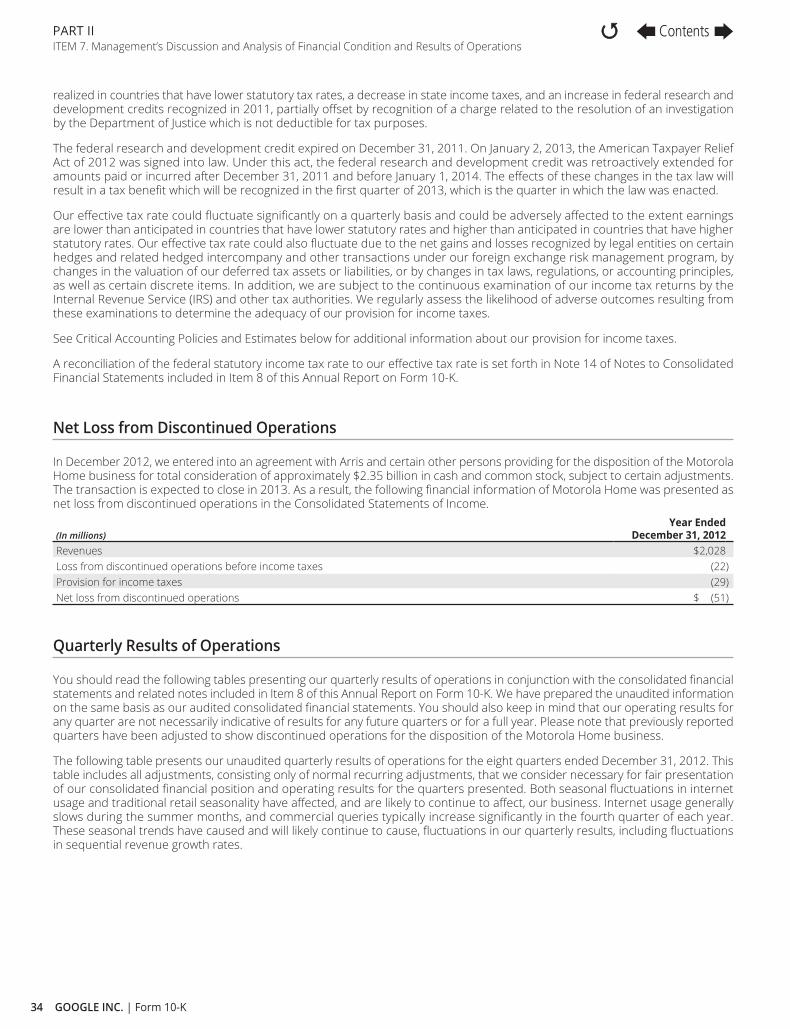
34 GOOGLE INC. | Form 10-K
PART II ITEM 7. Management’s Discussion and Analysis of Financial Condition and Results of Operations
realized in countries that have lower statutory tax rates, a decrease in state income taxes, and an increase in federal research and development credits recognized in 2011, partially off set by recognition of a charge related to the resolution of an investigation by the Department of Justice which is not deductible for tax purposes.
The federal research and development credit expired on December 31, 2011. On January 2, 2013, the American Taxpayer Relief Act of 2012 was signed into law. Under this act, the federal research and development credit was retroactively extended for amounts paid or incurred after December 31, 2011 and before January 1, 2014. The eff ects of these changes in the tax law will result in a tax benefi t which will be recognized in the fi rst quarter of 2013, which is the quarter in which the law was enacted.
Our eff ective tax rate could fl uctuate signifi cantly on a quarterly basis and could be adversely aff ected to the extent earnings are lower than anticipated in countries that have lower statutory rates and higher than anticipated in countries that have higher statutory rates. Our eff ective tax rate could also fl uctuate due to the net gains and losses recognized by legal entities on certain hedges and related hedged intercompany and other transactions under our foreign exchange risk management program, by changes in the valuation of our deferred tax assets or liabilities, or by changes in tax laws, regulations, or accounting principles, as well as certain discrete items. In addition, we are subject to the continuous examination of our income tax returns by the Internal Revenue Service (IRS) and other tax authorities. We regularly assess the likelihood of adverse outcomes resulting from these examinations to determine the adequacy of our provision for income taxes.
See Critical Accounting Policies and Estimates below for additional information about our provision for income taxes.
A reconciliation of the federal statutory income tax rate to our eff ective tax rate is set forth in Note 14 of Notes to Consolidated Financial Statements included in Item 8 of this Annual Report on Form 10-K.
Net Loss from Discontinued Operations
In December 2012, we entered into an agreement with Arris and certain other persons providing for the disposition of the Motorola Home business for total consideration of approximately $2.35 billion in cash and common stock, subject to certain adjustments. The transaction is expected to close in 2013. As a result, the following fi nancial information of Motorola Home was presented as net loss from discontinued operations in the Consolidated Statements of Income.
(In millions)Year Ended
December 31, 2012Revenues $2,028 Loss from discontinued operations before income taxes (22)Provision for income taxes (29)Net loss from discontinued operations $ (51)
Quarterly Results of Operations
You should read the following tables presenting our quarterly results of operations in conjunction with the consolidated fi nancial statements and related notes included in Item 8 of this Annual Report on Form 10-K. We have prepared the unaudited information on the same basis as our audited consolidated fi nancial statements. You should also keep in mind that our operating results for any quarter are not necessarily indicative of results for any future quarters or for a full year. Please note that previously reported quarters have been adjusted to show discontinued operations for the disposition of the Motorola Home business.
The following table presents our unaudited quarterly results of operations for the eight quarters ended December 31, 2012. This table includes all adjustments, consisting only of normal recurring adjustments, that we consider necessary for fair presentation of our consolidated fi nancial position and operating results for the quarters presented. Both seasonal fl uctuations in internet usage and traditional retail seasonality have aff ected, and are likely to continue to aff ect, our business. Internet usage generally slows during the summer months, and commercial queries typically increase signifi cantly in the fourth quarter of each year. These seasonal trends have caused and will likely continue to cause, fl uctuations in our quarterly results, including fl uctuations in sequential revenue growth rates.
Contents

35GOOGLE INC. | Form 10-K
PART II ITEM 7. Management’s Discussion and Analysis of Financial Condition and Results of Operations
Quarter EndedMar 31,
2011Jun 30,
2011Sep 30,
2011Dec 31,
2011Mar 31,
2012Jun 30,
2012Sep 30,
2012Dec 31,
2012(In millions, except per share amounts)
(unaudited)Consolidated Statements of Income Data: Revenues:
Google (advertising and other) $ 8,575 $ 9,026 $ 9,720 $10,584 $10,645 $10,964 $11,526 $12,905 Motorola Mobile (hardware and other) 0 0 0 0 0 843 1,778 1,514
Total revenues 8,575 9,026 9,720 10,584 10,645 11,807 13,304 14,419 Costs and expenses:
Cost of revenues—Google(advertising and other) 2,936 3,172 3,378 3,702 3,789 3,984 4,440 4,963 Cost of revenues—Motorola Mobile (hardware and other) 0 0 0 0 0 693 1,515 1,250 Research and development 1,226 1,234 1,404 1,298 1,441 1,538 1,879 1,935 Sales and marketing 1,026 1,091 1,204 1,268 1,269 1,413 1,710 1,751 General and administrative 591 648 676 809 757 942 1,020 1,126 Charge related to the resolution of Department of Justice investigation 500 0 0 0 0 0 0 0
Total costs and expenses 6,279 6,145 6,662 7,077 7,256 8,570 10,564 11,025 Income from operations 2,296 2,881 3,058 3,507 3,389 3,237 2,740 3,394 Interest and other income (expense), net 96 204 302 (18) 156 253 65 152 Income from continuing operations before income taxes 2,392 3,085 3,360 3,489 3,545 3,490 2,805 3,546 Provision for income taxes 594 580 631 784 655 657 647 639 Net income from continuing operations $ 1,798 $ 2,505 $ 2,729 $ 2,705 $ 2,890 $ 2,833 $ 2,158 $ 2,907 Net income (loss) from discontinued operations 0 0 0 0 0 (48) 18 (21)Net income $1,798 $2,505 $2,729 $ 2,705 $ 2,890 $ 2,785 $ 2,176 $ 2,886Net income (loss) per share—basic:
Continuing operations $ 5.59 $ 7.77 $ 8.44 $ 8.34 $ 8.88 $ 8.68 $ 6.59 $ 8.83 Discontinued operations 0 0 0 0 0 (0.14) 0.05 $ (0.06)
Net income per share—basic $ 5.59 $ 7.77 $ 8.44 $ 8.34 $ 8.88 $ 8.54 $ 6.64 $ 8.77Net income (loss) per share—diluted:
Continuing operations $ 5.51 $ 7.68 $ 8.33 $ 8.22 $ 8.75 $ 8.56 $ 6.48 $ 8.68 Discontinued operations 0 0 0 0 0 (0.14) 0.05 (0.06)
Net income per share—diluted $ 5.51 $ 7.68 $ 8.33 $ 8.22 $ 8.75 $ 8.42 $ 6.53 $ 8.62
Contents

36 GOOGLE INC. | Form 10-K
PART II ITEM 7. Management’s Discussion and Analysis of Financial Condition and Results of Operations
The following table presents our unaudited quarterly results of operations as a percentage of revenues for the eight quarters ended December 31, 2012:
Quarter EndedMar 31,
2011Jun 30,
2011Sep 30,
2011Dec 31,
2011Mar 31,
2012Jun 30,
2012Sep 30,
2012Dec 31,
2012Revenues:
Google (advertising and other) 100.0% 100.0% 100.0% 100.0% 100.0% 92.9% 86.6% 89.5%Motorola Mobile (hardware and other) 0 0 0 0 0 7.1 13.4 10.5
Total revenues 100.0% 100.0% 100.0% 100.0% 100.0% 100.0% 100.0% 100.0%Costs and expenses:
Cost of revenues—Google(advertising and other) 34.2 35.1 34.8 35.0 35.6 33.7 33.4 34.4 Cost of revenues—Motorola Mobile (hardware and other) 0 0 0 0 0 5.9 11.3 8.7 Research and development 14.3 13.7 14.4 12.3 13.5 13.0 14.1 13.4 Sales and marketing 12.0 12.1 12.4 12.0 11.9 12.0 12.9 12.2 General and administrative 6.9 7.2 6.9 7.6 7.2 8.0 7.7 7.8 Charge related to the resolution of Department of Justice investigation 5.8 0 0 0 0 0 0 0
Total costs and expenses 73.2 68.1 68.5 66.9 68.2 72.6 79.4 76.5 Income from operations 26.8 31.9 31.5 33.1 31.8 27.4 20.6 23.5 Interest and other income (expense), net 1.1 2.3 3.1 (0.1) 1.5 2.1 0.5 1.1 Income from continuing operations before income taxes 27.9 34.2 34.6 33.0 33.3 29.5 21.1 24.6 Provision for income taxes 6.9 6.4 6.5 7.4 6.2 5.5 4.9 4.4 Net income from continuing operations 21.0% 27.8% 28.1% 25.6% 27.1% 24.0% 16.2% 20.2%Net income (loss) from discontinued operations 0% 0% 0% 0% 0% (0.4%) 0.1% (0.2%)Net income 21.0% 27.8% 28.1% 25.6% 27.1% 23.6% 16.3% 20.0%
Liquidity and Capital Resources
In summary, our cash fl ows are as follows (in millions):Year Ended December 31,
2010 2011 2012Net cash provided by operating activities $ 11,081 $ 14,565 $ 16,619 Net cash used in investing activities (10,680) (19,041) (13,056)Net cash provided by fi nancing activities 3,050 807 1,229
At December 31, 2012, we had $48.1 billion of cash, cash equivalents, and marketable securities. Cash equivalents and marketable securities are comprised of time deposits, money market and other funds, including cash collateral received related to our securities lending program, highly liquid debt instruments of the U.S. government and its agencies, debt instruments issued by foreign governments, and municipalities in the U.S., corporate securities, mortgage-backed securities and asset-backed securities.
As of December 31, 2012, $31.4 billion of the $48.1 billion of cash, cash equivalents, and marketable securities was held by our foreign subsidiaries. If these funds are needed for our operations in the U.S., we would be required to accrue and pay U.S. taxes to repatriate these funds. However, our intent is to permanently reinvest these funds outside of the U.S. and our current plans do not demonstrate a need to repatriate them to fund our U.S. operations.
Our principal sources of liquidity are our cash, cash equivalents, and marketable securities, as well as the cash fl ow that we generate from our operations. At December 31, 2012, we had unused letters of credit for approximately $89 million. We believe that our sources of funding will be suffi cient to satisfy our currently anticipated cash requirements through at least the next 12 months. Our liquidity could be negatively aff ected by a decrease in demand for our products and services. In addition, we may make acquisitions or license products and technologies complementary to our business and may need to raise additional capital through future debt or equity fi nancing to provide for greater fl exibility to fund any such acquisitions and licensing activities. Additional fi nancing may not be available at all or on terms favorable to us.
We have a debt fi nancing program of up to $3.0 billion through the issuance of commercial paper. Net proceeds from this program are used for general corporate purposes. As of December 31, 2012, we had $2.5 billion of commercial paper outstanding recorded as short-term debt, with a weighted-average interest rate of 0.2% that mature at various dates through 2013. Average commercial
Contents
37GOOGLE INC. | Form 10-K
PART II ITEM 7. Management’s Discussion and Analysis of Financial Condition and Results of Operations
paper borrowings during the year were $2.2 billion and the maximum amount outstanding during the year was $2.7 billion. In conjunction with this program, we have a $3.0 billion revolving credit facility expiring in July 2016. The interest rate for the credit facility is determined based on a formula using certain market rates. As of December 31, 2012, we were in compliance with the fi nancial covenant in the credit facility and no amounts were outstanding.
In May 2011, we issued $3.0 billion of unsecured senior notes in three equal tranches, due in 2014, 2016, and 2021, with stated interest rates of 1.25%, 2.125%, and 3.625%. The net proceeds from the sale of the notes were used to repay a portion of our outstanding commercial paper and for general corporate purposes. As of December 31, 2012, the total carrying value and estimated fair value of these notes were $3.0 billion and $3.2 billion. The estimated fair value was based on quoted prices for our publicly-traded debt as of December 31, 2012. We are not subject to any fi nancial covenants under the notes.
Cash Provided by Operating Activities
Cash provided by operating activities consist of net income adjusted for certain non-cash items, including amortization, depreciation, deferred income taxes, excess tax benefi ts from stock-based award activities, stock-based compensation expense, as well as the eff ect of changes in working capital and other activities.
Cash provided by operating activities in 2012 was $16,619 million and consisted of net income of $10,737 million, adjustments for non-cash items of $5,172 million, a gain on divestiture of business of $188 million and increase in cash from changes in working capital and other activities of $898 million. Adjustments for non-cash items primarily consisted of $2,692 million of stock-based compensation expense, $1,988 million of depreciation and amortization expense on property and equipment, $974 million of amortization of intangible and other assets, and $188 million of excess tax benefi ts from stock-based award activities, partially off set by $266 million of deferred income taxes. In addition, the increase in cash from changes in working capital activities primarily consisted of an increase in income taxes, net, of $1,492 million including additional tax obligations accrued, partially off set by an increase in the amount of estimated income taxes we paid during the year, an increase in accrued expenses and other liabilities of $762 million, a decrease in inventories of $301 million, an increase accrued revenue share of $299 million, and an increase in deferred revenue of $163 million. These changes were partially off set by an increase in prepaid revenue share, expenses, and other assets of $833 million including prepayments for certain content arrangements, an increase of accounts receivable of $787 million due to growth in fees billed to our customers, and a decrease in accounts payable of $499 million due to the timing of invoice processing and payments.
Cash provided by operating activities in 2011 was $14,565 million and consisted of net income of $9,737 million, adjustments for non-cash items of $4,198 million, and increase in cash from changes in working capital and other activities of $630 million. Adjustments for non-cash items primarily consisted of $1,974 million of stock-based compensation expense, $1,396 million of depreciation and amortization expense of property and equipment, $455 million of amortization of intangible and other assets, $343 million of deferred income taxes, and $110 million related to impairment of equity investments. In addition, the increase in cash from changes in working capital activities primarily consisted of an increase in accrued expenses and other liabilities of $795 million, a net increase in income taxes payable and deferred income taxes of $731 million, an increase in accrued revenue share of $259 million, an increase of $162 million in deferred revenue, and an increase of $101 million in accounts payable. These increases were partially off set by an increase in accounts receivable of $1,156 million due to the growth in fees billed to our advertisers, and an increase in prepaid revenue share, expenses and other assets of $262 million. The increase in income taxes payable and deferred income taxes refl ected primarily additional tax obligations accrued, partially off set by estimated income taxes paid during 2011. In addition, we paid $500 million related to the resolution of a Department of Justice investigation during the year.
Cash provided by operating activities in 2010 was $11,081 million, and consisted of net income of $8,505 million, adjustments for non-cash items of $2,675 million, and decrease in cash from changes in working capital and other activities of $99 million. Adjustments for non-cash items primarily consisted of $1,376 million of stock-based compensation expense, $1,067 million of depreciation and amortization expense on property and equipment, and $329 million of amortization of intangible and other assets, partially off set by $94 million of excess tax benefi ts from stock-based award activities. In addition, the decrease in cash from changes in working capital activities primarily consisted of an increase of $1,129 million in accounts receivable due to the growth in fees billed to our advertisers and an increase of $414 million in prepaid revenue share, expenses and other assets. These increases were partially off set by an increase in accrued expenses and other liabilities of $745 million, an increase in accounts payable of $272 million, an increase in accrued revenue share of $214 million, an increase in deferred revenue of $111 million, and a net increase in income tax payable and deferred income taxes of $102 million, which includes the same $94 million of excess tax benefi ts from stock-based award activities included under adjustments for non-cash items. The increase in accrued expense and other liabilities, accounts payable, accrued revenue share, and deferred revenues are primarily a result of the growth in our business and headcount. The increase in net income taxes payable and deferred income taxes was primarily a result of additional tax obligations accrued, partially off set by the release of certain tax reserves as a result of the settlement of our tax audits for our 2005 and 2006 tax years.
As we expand our business internationally, we have off ered payment terms to certain advertisers that are standard in their locales but longer than terms we would generally off er to our domestic advertisers. In addition, we continue to evaluate our Motorola restructuring plan, and may incur additional charges, some of which may be signifi cant. This may increase our working capital requirements and may have a negative eff ect on cash provided by our operating activities.
Contents

38 GOOGLE INC. | Form 10-K
PART II ITEM 7. Management’s Discussion and Analysis of Financial Condition and Results of Operations
Cash Used In Investing Activities
Cash used in investing activities in 2012 of $13,056 million was primarily attributable to cash used in acquisitions and other investments of $11,264 million, including $9,518 million net cash paid in connection with the acquisition of Motorola, and capital expenditures of $3,273 million related primarily to our facilities, data centers, and related equipment. These decreases were partially off set by net maturities and sales of marketable securities of $1,770 million. Also, in connection with our securities lending program, we returned cash collateral of $334 million. See Note 3 of Notes to Consolidated Financial Statements included in Item 8 of this Annual Report on Form 10-K for further information about our securities lending program.
Cash used in investing activities in 2011 of $19,041 million was primarily attributable to net purchases of marketable securities of $12,926 million, capital expenditures of $3,438 million related principally to our facilities, data centers, and related equipment, and cash used in acquisitions and other investments of $2,328 million, including $676 million paid in connection with the acquisition of ITA Software, Inc. Also, in connection with our securities lending program, we returned $354 million of cash collateral.
Cash used in investing activities in 2010 of $10,680 million was primarily attributable to net purchases of marketable securities of $6,886 million, capital expenditures of $4,018 million of which $1.8 billion was for the purchase of an offi ce building in New York City in December 2010, and remaining amounts related principally to our data centers and related equipment, and cash consideration used in acquisitions and other investments of $1,067 million. Also, in connection with our securities lending program, we received $2,361 million of cash collateral which was invested in reverse repurchase agreements.
In order to manage expected increases in internet traffi c, advertising transactions, and new products and services, and to support our overall global business expansion, we expect to make signifi cant investments in our systems, data centers, corporate facilities, information technology infrastructure, and employees in 2013 and thereafter. However, the amount of our capital expenditures has fl uctuated and may continue to fl uctuate on a quarterly basis.
In addition, we expect to spend a signifi cant amount of cash on acquisitions and other investments from time to time. These acquisitions generally enhance the breadth and depth of our expertise in engineering and other functional areas, our technologies, and our product off erings.
In December 2012, we signed an agreement for the disposition of Motorola Home business for total consideration of approximately $2.35 billion in cash and stock subject to certain adjustments. We expect the transaction to close in 2013.
Cash Provided by Financing Activities
Cash provided by fi nancing activities in 2012 of $1,229 million was primarily driven by net proceeds of $1,328 million from short-term debt issued under our commercial paper program and excess tax benefi ts from stock-based award activities of $188 million. This was partially off set by net payments for stock-based award activities of $287 million.
Cash provided by fi nancing activities in 2011 of $807 million was primarily driven by net proceeds of $726 million of debt issued and excess tax benefi ts from stock-based award activities of $86 million.
Cash provided by fi nancing activities in 2010 of $3,050 million was primarily driven by $3,463 million of net cash proceeds from the issuance of commercial paper and a promissory note. This was partially off set by $801 million in stock repurchases in connection with our acquisitions of AdMob, Inc. and On2 Technologies, Inc., as well as net proceeds from stock-based award activities of $294 million, and excess tax benefi ts from stock-based award activities of $94 million.
Contractual Obligations as of December 31, 2012
(in millions)
Payments due by period
TotalLess than
1 year 1-3 years 3-5 yearsMore than
5 yearsOperating lease obligations, net of sublease income amounts $3,619 $ 466 $ 870 $ 688 $1,595Purchase obligations 2,123 942 943 119 119Long-term debt obligations 3,401 70 1,121 1,083 1,127Other long-term liabilities refl ected on our balance sheet 236 41 119 40 36Total contractual obligations $9,379 $1,519 $3,053 $1,930 $2,877
The above table does not include future rental income of $649 million related to the leases that we assumed in connection with our building purchases.
Contents

39GOOGLE INC. | Form 10-K
PART II ITEM 7. Management’s Discussion and Analysis of Financial Condition and Results of Operations
Operating Leases
We have entered into various non-cancelable operating lease agreements for certain of our offi ces, land, and data centers throughout the world with original lease periods expiring primarily between 2013 and 2063. We are committed to pay a portion of the related operating expenses under certain of these lease agreements. These operating expenses are not included in the above table. Certain of these leases have free or escalating rent payment provisions. We recognize rent expense under such leases on a straight-line basis over the term of the lease. Certain leases have adjustments for market provisions.
Purchase Obligations
Purchase obligations represent non-cancelable contractual obligations at December 31, 2012. These contracts are primarily related to distribution arrangements, video and other content licensing revenue sharing arrangements, data center operations and facility build-outs, as well as purchase of inventory.
Long-term Debt Obligations
Long-term debt obligations represent principal and interest payments to be made over the life of our unsecured senior notes issued in May 2011. Please see Note 4 of the Notes to Consolidated Financial Statements included in Item 8 of this Annual Report on Form 10-K for further details.
Other Long-Term Liabilities
Other long-term liabilities consist of cash obligations, primarily the legal settlement with the Authors Guild and the Association of American Publishers (AAP), asset retirement obligations, and milestone and royalty payments owed in connection with certain acquisitions and licensing agreements.
In addition to the amounts above, we had long-term taxes payable of $2.1 billion as of December 31, 2012 related to tax positions for which the timing of the ultimate resolution is uncertain. At this time, we are unable to make a reasonably reliable estimate of the timing of payments in individual years beyond 12 months due to uncertainties in the timing of tax audit outcomes. As a result, this amount is not included in the above table.
Off -Balance Sheet Entities
At December 31, 2012, we did not have any off -balance sheet arrangements, as defi ned in Item 303(a)(4)(ii) of Regulation S-K promulgated by the SEC, that have or are reasonably likely to have a current or future eff ect on our fi nancial condition, changes in our fi nancial condition, revenues, or expenses, results of operations, liquidity, capital expenditures, or capital resources that is material to investors.
Critical Accounting Policies and Estimates
We prepare our consolidated fi nancial statements in accordance with accounting principles generally accepted in the U.S. (U.S. GAAP). In doing so, we have to make estimates and assumptions that aff ect our reported amounts of assets, liabilities, revenues, and expenses, as well as related disclosure of contingent assets and liabilities. In some cases, we could reasonably have used diff erent accounting policies and estimates. In some cases, changes in the accounting estimates are reasonably likely to occur from period to period. Accordingly, actual results could diff er materially from our estimates. To the extent that there are material diff erences between these estimates and actual results, our fi nancial condition or results of operations will be aff ected. We base our estimates on past experience and other assumptions that we believe are reasonable under the circumstances, and we evaluate these estimates on an ongoing basis. We refer to accounting estimates of this type as critical accounting policies and estimates, which we discuss further below. We have reviewed our critical accounting policies and estimates with the audit committee of our board of directors.
Income Taxes
We are subject to income taxes in the U.S. and numerous foreign jurisdictions. Signifi cant judgment is required in evaluating our uncertain tax positions and determining our provision for income taxes.
Although we believe we have adequately reserved for our uncertain tax positions, no assurance can be given that the fi nal tax outcome of these matters will not be diff erent. We adjust these reserves in light of changing facts and circumstances, such as the closing of a tax audit or the refi nement of an estimate. To the extent that the fi nal tax outcome of these matters is diff erent than
Contents

40 GOOGLE INC. | Form 10-K
PART II ITEM 7. Management’s Discussion and Analysis of Financial Condition and Results of Operations
the amounts recorded, such diff erences will impact the provision for income taxes in the period in which such determination is made. The provision for income taxes includes the impact of reserve provisions and changes to reserves that are considered appropriate, as well as the related net interest.
Our eff ective tax rates have diff ered from the statutory rate primarily due to the tax impact of foreign operations, state taxes, certain benefi ts realized related to stock-based award activities, and research and experimentation tax credits. The eff ective tax rates were 21.2%, 21.0%, and 19.4% for 2010, 2011, and 2012. Our future eff ective tax rates could be adversely aff ected by earnings being lower than anticipated in countries that have lower statutory rates and higher than anticipated in countries that have higher statutory rates, the net gains and losses recognized by legal entities on certain hedges and related hedged intercompany and other transactions under our foreign exchange risk management program, changes in the valuation of our deferred tax assets or liabilities, or changes in tax laws, regulations, or accounting principles, as well as certain discrete items. In addition, we are subject to the continuous examination of our income tax returns by the IRS and other tax authorities. We regularly assess the likelihood of adverse outcomes resulting from these examinations to determine the adequacy of our provision for income taxes.
Loss Contingencies
We are regularly subject to claims, suits, government investigations, and other proceedings involving competition and antitrust, intellectual property, privacy, tax, labor and employment, commercial disputes, content generated by our users, goods and services off ered by advertisers or publishers using our platforms, and other matters. Certain of these matters include speculative claims for substantial or indeterminate amounts of damages. We record a liability when we believe that it is both probable that a loss has been incurred, and the amount can be reasonably estimated. We evaluate, on a monthly basis, developments in our legal matters that could aff ect the amount of liability that has been previously accrued, and make adjustments as appropriate. Signifi cant judgment is required to determine both likelihood of there being and the estimated amount of a loss related to such matters. Until the fi nal resolution of such matters, there may be an exposure to loss in excess of the amount recorded, and such amounts could be material. Should any of our estimates and assumptions change or prove to have been incorrect, it could have a material impact on our business, consolidated fi nancial position, results of operations, or cash fl ows. See Note 11 of Notes to Consolidated Financial Statements included in Item 8 of this Annual Report on Form 10-K for additional information regarding contingencies.
Business Combinations
We allocate the fair value of purchase consideration to the tangible assets acquired, liabilities assumed and intangible assets acquired based on their estimated fair values. The excess of the fair value of purchase consideration over the fair values of these identifi able assets and liabilities is recorded as goodwill. When determining the fair values of assets acquired and liabilities assumed, management makes signifi cant estimates and assumptions, especially with respect to intangible assets.
Critical estimates in valuing certain intangible assets include but are not limited to future expected cash fl ows from customer relationships and acquired patents and developed technology; and discount rates. Management’s estimates of fair value are based upon assumptions believed to be reasonable, but which are inherently uncertain and unpredictable and, as a result, actual results may diff er from estimates.
Other estimates associated with the accounting for acquisitions may change as additional information becomes available regarding the assets acquired and liabilities assumed, as more fully discussed in Note 6 of Notes to Consolidated Financial Statements included in Item 8 of this Annual Report on Form 10-K.
Impairment of Marketable and Non-Marketable Securities
We periodically review our marketable and non-marketable securities for impairment. If we conclude that any of these investments are impaired, we determine whether such impairment is other-than-temporary. Factors we consider to make such determination include the duration and severity of the impairment, the reason for the decline in value and the potential recovery period and our intent to sell. For marketable debt securities, we also consider whether (1) it is more likely than not that we will be required to sell the security before recovery of its amortized cost basis, and (2) the amortized cost basis cannot be recovered as a result of credit losses. If any impairment is considered other-than-temporary, we will write down the asset to its fair value and record the corresponding charge as interest and other income, net.
Prior period reclassifi cation
Prior period balance related to inventories has been reclassifi ed to conform to the current year presentation.
Contents

41GOOGLE INC. | Form 10-K
PART II ITEM 7A. Quantitative and Qualitative Disclosures About Market Risk
ITEM 7A. Quantitative and Qualitative Disclosures About Market Risk
We are exposed to fi nancial market risks, including changes in currency exchange rates and interest rates.
Foreign Currency Exchange Risk
Economic Exposure
We transact business in various foreign currencies and have signifi cant international revenues, as well as costs denominated in foreign currencies. This exposes us to the risk of fl uctuations in foreign currency exchange rates. We purchase foreign exchange option contracts to reduce the volatility of cash fl ows related to forecasted revenues denominated in certain foreign currencies. The objective of the foreign exchange contracts is to better ensure that the U.S. dollar-equivalent cash fl ows are not adversely aff ected by changes in the U.S. dollar/foreign currency exchange rates. These contracts are designated as cash fl ow hedges. The gain on the eff ective portion of a cash fl ow hedge is initially reported as a component of accumulated other comprehensive income (AOCI) and subsequently reclassifi ed into revenues when the hedged revenues are recorded or as interest and other income, net, if the hedged transaction becomes probable of not occurring. The notional principal of these contracts was approximately $6.5 billion and $9.5 billion as of December 31, 2011 and December 31, 2012. These foreign exchange contracts have maturities of 36 months or less.
We considered the historical trends in currency exchange rates and determined that it was reasonably possible that changes in exchange rates of 20% for our foreign currencies instruments could be experienced in the near term. If the U.S. dollar weakened by 20%, the amount recorded in AOCI before tax eff ect would have been approximately $132 million and $9 million lower at December 31, 2011 and December 31, 2012, and the total amount of expense recorded as interest and other income, net, would have been approximately $138 million and $140 million higher in the years ended December 31, 2011 and December 31, 2012. If the U.S. dollar strengthened by 20%, the amount recorded in accumulated AOCI before tax eff ect would have been approximately $1.2 billion and $1.7 billion higher at December 31, 2011 and December 31, 2012, and the total amount of expense recorded as interest and other income, net, would have been approximately $202 million and $159 million higher in the years ended December 31, 2011 and December 31, 2012.
Transaction Exposure
Our exposure to foreign currency transaction gains and losses is the result of certain net receivables due from our foreign subsidiaries and customers being denominated in currencies other than the functional currency of the subsidiary, primarily the Euro and the British pound. Our foreign subsidiaries conduct their businesses in local currency. We have entered into foreign exchange contracts to off set the foreign exchange risk on certain monetary assets and liabilities denominated in currencies other than the local currency of the subsidiary. The notional principal of foreign exchange contracts outstanding was $3.7 billion and $6.6 billion at December 31, 2011 and December 31, 2012.
We considered the historical trends in currency exchange rates and determined that it was reasonably possible that adverse changes in exchange rates of 20% for all currencies could be experienced in the near term. These changes would have resulted in an adverse impact on income before income taxes of approximately $27 million and $9 million at December 31, 2011 and December 31, 2012. The adverse impact at December 31, 2011 and December 31, 2012 is after consideration of the off setting eff ect of approximately $503 million and $731 million from foreign exchange contracts in place for the months of December 2011 and December 2012. These reasonably possible adverse changes in exchange rates of 20% were applied to total monetary assets and liabilities denominated in currencies other than the local currencies at the balance sheet dates to compute the adverse impact these changes would have had on our income before income taxes in the near term.
Interest Rate Risk
We invest our excess cash primarily in U.S. government and its agency securities, money market and other funds, corporate debt securities, mortgage-backed securities, debt instruments issued by foreign governments, municipal securities, time deposits, and asset backed securities. By policy, we limit the amount of credit exposure to any one issuer.
Investments in both fi xed rate and fl oating rate interest earning securities carry a degree of interest rate risk. Fixed rate securities may have their fair market value adversely impacted due to a rise in interest rates, while fl oating rate securities may produce less income than predicted if interest rates fall. Due in part to these factors, our income from investments may decrease in the future. However, we use certain interest rate derivative contracts to hedge interest rate risk of our fi xed income securities.
Contents
42 GOOGLE INC. | Form 10-K
PART II ITEM 7A. Quantitative and Qualitative Disclosures About Market Risk
During the second quarter of 2012, we began to hedge the variability of forecasted interest payments using forward-starting interest swaps. The total notional amount of these swaps was $1.0 billion as of December 31, 2012, with terms calling for us to receive interest at a variable rate and to pay interest at a fi xed rate. These forward-starting interest swaps eff ectively fi x the benchmark interest rate on an anticipated debt issuance of $1.0 billion in 2014, and they will be terminated upon issuance of the debt.
When entering into forward-starting interest rate swaps, we are subject to market risk with respect to changes in the underlying benchmark interest rate that impacts the fair value of the forward-starting interest swaps. We manage market risk by matching the terms of the swaps with the critical terms of the expected debt issuance.
We considered the historical volatility of short-term interest rates and determined that it was reasonably possible that an adverse change of 100 basis points could be experienced in the near term. A hypothetical 1.00% (100 basis points) increase in interest rates would have resulted in a decrease in the fair values of our marketable securities of approximately $934 million and $1.1 billion at December 31, 2011 and 2012, after taking into consideration the off setting eff ect from interest rate derivative contracts outstanding as of December 31, 2011 and 2012. A hypothetical 1.00% (100 basis points) decrease in interest rates would have resulted in a decrease in the fair values of our forward-starting interest swaps of approximately $107 million at December 31, 2012.
Contents

43GOOGLE INC. | Form 10-K
PART II ITEM 8. Financial Statements and Supplementary Data
ITEM 8. Financial Statements and Supplementary Data
Google Inc.
Index to Consolidated Financial Statements
Reports of Independent Registered Public Accounting Firm ...........................................................................................44Financial Statements:
Consolidated Balance Sheets ....................................................................................................................................46Consolidated Statements of Income ........................................................................................................................47Consolidated Statements of Comprehensive Income............................................................................................48Consolidated Statements of Stockholders’ Equity ..................................................................................................49Consolidated Statements of Cash Flows ..................................................................................................................50Notes to Consolidated Financial Statements ..........................................................................................................51
The supplementary fi nancial information required by this Item 8 is included in Item 7 under the caption “Quarterly Results of Operations.”
Contents

44 GOOGLE INC. | Form 10-K
PART II ITEM 8. Financial Statements and Supplementary Data
Report of Independent Registered Public Accounting Firm
The Board of Directors and Stockholders of Google Inc.
We have audited the accompanying consolidated balance sheets of Google Inc. as of December 31, 2011 and 2012, and the related consolidated statements of income, comprehensive income, stockholders’ equity, and cash fl ows for each of the three years in the period ended December 31, 2012. Our audits also included the fi nancial statement schedule listed in the Index at Item 15(a)2. These fi nancial statements and schedule are the responsibility of the Company’s management. Our responsibility is to express an opinion on these fi nancial statements and schedule based on our audits.
We conducted our audits in accordance with the standards of the Public Company Accounting Oversight Board (United States). Those standards require that we plan and perform the audit to obtain reasonable assurance about whether the fi nancial statements are free of material misstatement. An audit includes examining, on a test basis, evidence supporting the amounts and disclosures in the fi nancial statements. An audit also includes assessing the accounting principles used and signifi cant estimates made by management, as well as evaluating the overall fi nancial statement presentation. We believe that our audits provide a reasonable basis for our opinion.In our opinion, the fi nancial statements referred to above present fairly, in all material respects, the consolidated fi nancial position of Google Inc. at December 31, 2011 and 2012, and the consolidated results of its operations and its cash fl ows for each of the three years in the period ended December 31, 2012, in conformity with U.S. generally accepted accounting principles. Also, in our opinion, the related fi nancial statement schedule, when considered in relation to the basic fi nancial statements taken as a whole, presents fairly in all material respects the information set forth therein.
We also have audited, in accordance with the standards of the Public Company Accounting Oversight Board (United States), Google Inc.’s internal control over fi nancial reporting as of December 31, 2012, based on criteria established in Internal Control—Integrated Framework issued by the Committee of Sponsoring Organizations of the Treadway Commission and our report dated January 29, 2013 expressed an unqualifi ed opinion thereon.
/s/ ERNST & YOUNG LLPSan Jose, CaliforniaJanuary 29, 2013
Contents

45GOOGLE INC. | Form 10-K
PART II ITEM 8. Financial Statements and Supplementary Data
Report of Independent Registered Public Accounting Firm
The Board of Directors and Stockholders of Google Inc.
We have audited Google Inc.’s internal control over fi nancial reporting as of December 31, 2012, based on criteria established in Internal Control—Integrated Framework issued by the Committee of Sponsoring Organizations of the Treadway Commission (the COSO criteria). Google Inc.’s management is responsible for maintaining eff ective internal control over fi nancial reporting, and for its assessment of the eff ectiveness of internal control over fi nancial reporting included in the accompanying Management’s Report on Internal Control over Financial Reporting. Our responsibility is to express an opinion on the Company’s internal control over fi nancial reporting based on our audit.
We conducted our audit in accordance with the standards of the Public Company Accounting Oversight Board (United States). Those standards require that we plan and perform the audit to obtain reasonable assurance about whether eff ective internal control over fi nancial reporting was maintained in all material respects. Our audit included obtaining an understanding of internal control over fi nancial reporting, assessing the risk that a material weakness exists, testing and evaluating the design and operating eff ectiveness of internal control based on the assessed risk, and performing such other procedures as we considered necessary in the circumstances. We believe that our audit provides a reasonable basis for our opinion.
A company’s internal control over fi nancial reporting is a process designed to provide reasonable assurance regarding the reliability of fi nancial reporting and the preparation of fi nancial statements for external purposes in accordance with generally accepted accounting principles. A company’s internal control over fi nancial reporting includes those policies and procedures that (1) pertain to the maintenance of records that, in reasonable detail, accurately and fairly refl ect the transactions and dispositions of the assets of the company; (2) provide reasonable assurance that transactions are recorded as necessary to permit preparation of fi nancial statements in accordance with generally accepted accounting principles, and that receipts and expenditures of the company are being made only in accordance with authorizations of management and directors of the company; and (3) provide reasonable assurance regarding prevention or timely detection of unauthorized acquisition, use, or disposition of the company’s assets that could have a material eff ect on the fi nancial statements.
Because of its inherent limitations, internal control over fi nancial reporting may not prevent or detect misstatements. Also, projections of any evaluation of eff ectiveness to future periods are subject to the risk that controls may become inadequate because of changes in conditions, or that the degree of compliance with the policies or procedures may deteriorate.
In our opinion, Google Inc. maintained, in all material respects, eff ective internal control over fi nancial reporting as of December 31, 2012, based on the COSO criteria.
We also have audited, in accordance with the standards of the Public Company Accounting Oversight Board (United States), the consolidated balance sheets of Google Inc. as of December 31, 2011 and 2012, and the related consolidated statements of income, comprehensive income, stockholders’ equity, and cash fl ows for each of the three years in the period ended December 31, 2012 of Google Inc. and our report dated January 29, 2013 expressed an unqualifi ed opinion thereon.
/s/ ERNST & YOUNG LLPSan Jose, CaliforniaJanuary 29, 2013
Contents

46 GOOGLE INC. | Form 10-K
PART II ITEM 8. Consolidated Balance Sheets
Google Inc.Consolidated Balance Sheets
(In millions, except share and par value amounts which are refl ectedin thousands, and par value per share amounts)
As of December 31,
2011
As of December 31,
2012ASSETS Current assets:
Cash and cash equivalents $ 9,983 $14,778Marketable securities 34,643 33,310Total cash, cash equivalents, and marketable securities (including securities loaned of $2,778 and $3,160) 44,626 48,088Accounts receivable, net of allowance of $133 and $581 5,427 7,885Inventories 35 505Receivable under reverse repurchase agreements 745 700Deferred income taxes, net 215 1,144Prepaid revenue share, expenses and other assets 1,710 2,132Total current assets 52,758 60,454
Prepaid revenue share, expenses and other assets, non-current 499 2,011Non-marketable equity securities 790 1,469Property and equipment, net 9,603 11,854Intangible assets, net 1,578 7,473Goodwill 7,346 10,537Total assets $72,574 $93,798LIABILITIES AND STOCKHOLDERS’ EQUITY Current liabilities:
Accounts payable $ 588 $ 2,012Short-term debt 1,218 2,549Accrued compensation and benefi ts 1,818 2,239Accrued expenses and other current liabilities 1,370 3,258Accrued revenue share 1,168 1,471Securities lending payable 2,007 1,673Deferred revenue 547 895Income taxes payable, net 197 240Total current liabilities 8,913 14,337
Long-term debt 2,986 2,988Deferred revenue, non-current 44 100Income taxes payable, non-current 1,693 2,046Deferred income taxes, net, non-current 287 1,872Other long-term liabilities 506 740Commitments and contingencies Stockholders’ equity:
Convertible preferred stock, $0.001 par value per share, 100,000 shares authorized; no shares issued and outstanding 0 0Class A and Class B common stock and additional paid-in capital, $0.001 par value per share: 9,000,000 shares authorized (Class A 6,000,000, Class B 3,000,000) and 12,000,000 shares authorized (Class A 9,000,000, Class B 3,000,000); 324,895 (Class A 257,553, Class B 67,342) and par value of $325 (Class A $258, Class B $67) and 329,979 (Class A 267,448, Class B 62,531) and par value of $330 (Class A $267, Class B $63) shares issued and outstanding 20,264 22,835Class C capital stock, $0.001 par value per share, 3,000,000 shares authorized;no shares issued and outstanding 0 0Accumulated other comprehensive income 276 538Retained earnings 37,605 48,342
Total stockholders’ equity 58,145 71,715Total liabilities and stockholders’ equity $72,574 $93,798
See accompanying notes.
Contents

47GOOGLE INC. | Form 10-K
PART II ITEM 8. Consolidated Statements of Income
Google Inc. Consolidated Statements of Income
(In millions, except per share amounts)
Year Ended December 31,2010 2011 2012
Revenues: Google (advertising and other) $29,321 $37,905 $46,039 Motorola Mobile (hardware and other) 0 0 4,136
Total revenues $29,321 $37,905 $50,175 Costs and expenses:
Cost of revenues—Google (advertising and other)(1) $10,417 $ 13,188 $ 17,176 Cost of revenues—Motorola Mobile (hardware and other)(1) 0 0 3,458 Research and development(1) 3,762 5,162 6,793 Sales and marketing(1) 2,799 4,589 6,143 General and administrative(1) 1,962 2,724 3,845 Charge related to the resolution of Department of Justice investigation 0 500 0
Total costs and expenses 18,940 26,163 37,415 Income from operations 10,381 11,742 12,760 Interest and other income, net 415 584 626 Income from continuing operations before income taxes 10,796 12,326 13,386 Provision for income taxes 2,291 2,589 2,598 Net income from continuing operations $ 8,505 $ 9,737 $10,788 Net loss from discontinued operations 0 0 (51)Net income $ 8,505 $ 9,737 $10,737Net income (loss) per share of Class A and Class B common stock—basic:
Continuing operations $ 26.69 $ 30.17 $ 32.97 Discontinued operations 0.00 0.00 (0.16)
Net income per share of Class A and Class B common stock—basic $ 26.69 $ 30.17 $ 32.81Net income (loss) per share of Class A and Class B common stock—diluted:
Continuing operations $ 26.31 $ 29.76 $ 32.46 Discontinued operations 0.00 0.00 (0.15)
Net income per share of Class A and Class B common stock—diluted $ 26.31 $ 29.76 $ 32.31(1) Includes stock-based compensation expense as follows:
Cost of revenues—Google (advertising and other) $ 67 $ 249 $ 359Cost of revenues—Motorola Mobile (hardware and other) 0 0 14Research and development 861 1,061 1,325Sales and marketing 261 361 498General and administrative 187 303 453
$ 1,376 $ 1,974 $ 2,649
See accompanying notes.
Contents
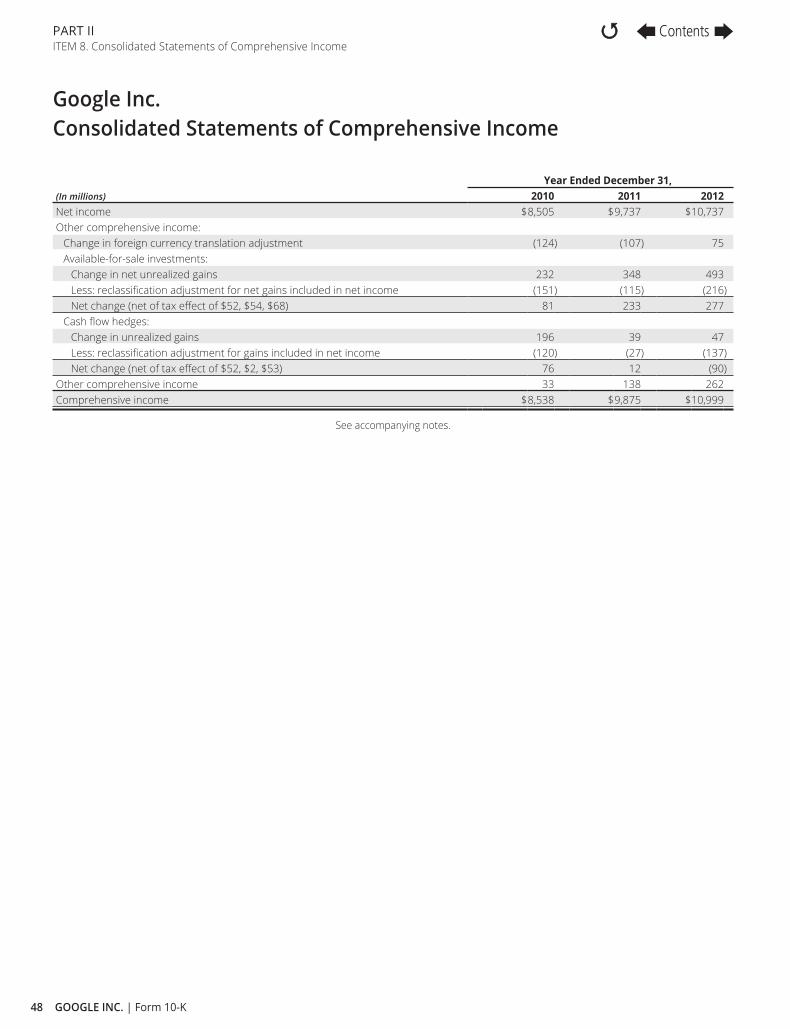
48 GOOGLE INC. | Form 10-K
PART II ITEM 8. Consolidated Statements of Comprehensive Income
Google Inc. Consolidated Statements of Comprehensive Income
(In millions)
Year Ended December 31,2010 2011 2012
Net income $8,505 $9,737 $10,737 Other comprehensive income:
Change in foreign currency translation adjustment (124) (107) 75 Available-for-sale investments:
Change in net unrealized gains 232 348 493 Less: reclassifi cation adjustment for net gains included in net income (151) (115) (216)Net change (net of tax eff ect of $52, $54, $68) 81 233 277
Cash fl ow hedges: Change in unrealized gains 196 39 47 Less: reclassifi cation adjustment for gains included in net income (120) (27) (137)Net change (net of tax eff ect of $52, $2, $53) 76 12 (90)
Other comprehensive income 33 138 262 Comprehensive income $8,538 $9,875 $10,999
See accompanying notes.
Contents

49GOOGLE INC. | Form 10-K
PART II ITEM 8. Consolidated Statements of Stockholders’ Equity
Google Inc. Consolidated Statements of Stockholders’ Equity
(In millions, except for share amountswhich are refl ected in thousands)
Class A and Class B Common Stock and Additional Paid-In Capital
AccumulatedOther
Comprehensive Income
Retained Earnings
TotalStockholders’
EquityShares AmountBalance at January 1, 2010 317,772 $15,817 $105 $ 20,082 $36,004 Common stock issued 5,126 1,412 0 0 1,412 Common stock repurchased (1,597) (82) 0 (719) (801)Stock-based compensation expense 1,376 0 0 1,376 Stock-based compensation tax benefi ts 72 0 0 72 Tax withholding related to vesting of restricted stock units (360) 0 0 (360)Net income 0 0 8,505 8,505 Other comprehensive income 0 33 0 33 Balance at December 31, 2010 321,301 18,235 138 27,868 46,241 Common stock issued 3,594 621 0 0 621 Stock-based compensation expense 1,974 0 0 1,974 Stock-based compensation tax benefi ts 60 0 0 60 Tax withholding related to vesting of restricted stock units (626) 0 0 (626)Net income 0 0 9,737 9,737 Other comprehensive income 0 138 0 138 Balance at December 31, 2011 324,895 20,264 276 37,605 58,145 Common stock issued 5,084 736 0 0 736 Stock-based compensation expense 2,692 0 0 2,692 Stock-based compensation tax benefi ts 166 0 0 166 Tax withholding related to vesting of restricted stock units (1,023) 0 0 (1,023)Net income 0 0 10,737 10,737 Other comprehensive income 0 262 0 262 Balance at December 31, 2012 329,979 $22,835 $538 $ 48,342 $71,715
See accompanying notes.
Contents
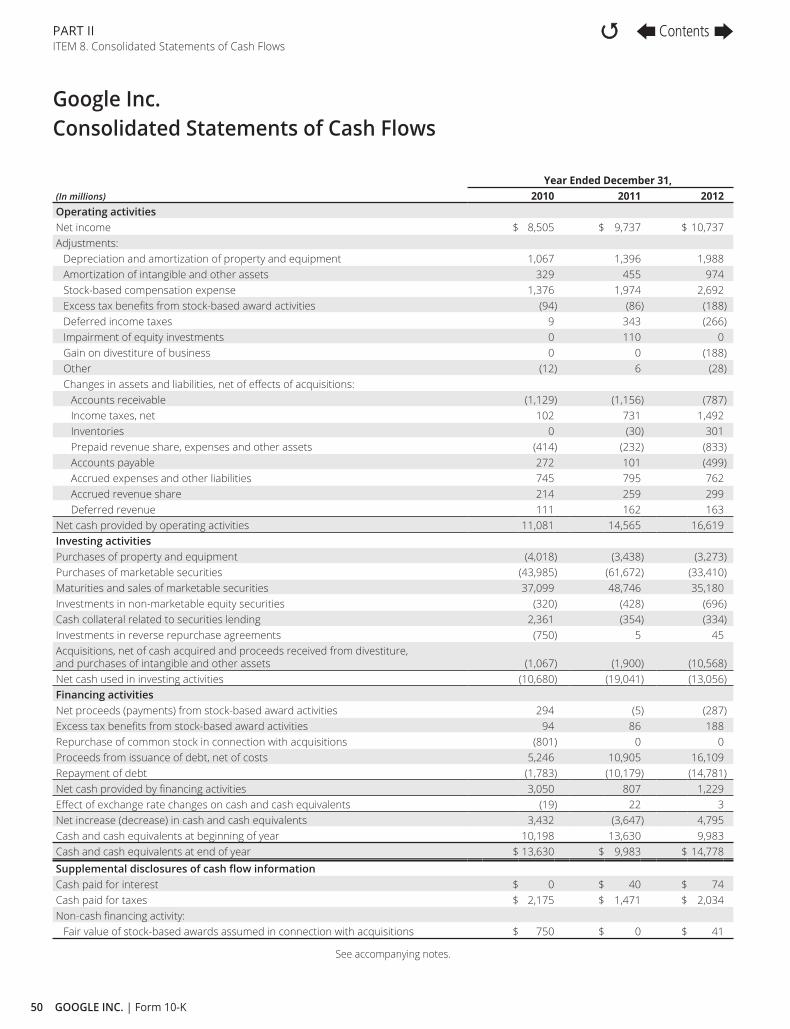
50 GOOGLE INC. | Form 10-K
PART II ITEM 8. Consolidated Statements of Cash Flows
Google Inc. Consolidated Statements of Cash Flows
(In millions)
Year Ended December 31,2010 2011 2012
Operating activities Net income $ 8,505 $ 9,737 $ 10,737 Adjustments:
Depreciation and amortization of property and equipment 1,067 1,396 1,988 Amortization of intangible and other assets 329 455 974 Stock-based compensation expense 1,376 1,974 2,692 Excess tax benefi ts from stock-based award activities (94) (86) (188)Deferred income taxes 9 343 (266)Impairment of equity investments 0 110 0 Gain on divestiture of business 0 0 (188)Other (12) 6 (28)Changes in assets and liabilities, net of eff ects of acquisitions:
Accounts receivable (1,129) (1,156) (787)Income taxes, net 102 731 1,492 Inventories 0 (30) 301 Prepaid revenue share, expenses and other assets (414) (232) (833)Accounts payable 272 101 (499)Accrued expenses and other liabilities 745 795 762 Accrued revenue share 214 259 299 Deferred revenue 111 162 163
Net cash provided by operating activities 11,081 14,565 16,619 Investing activities Purchases of property and equipment (4,018) (3,438) (3,273)Purchases of marketable securities (43,985) (61,672) (33,410)Maturities and sales of marketable securities 37,099 48,746 35,180 Investments in non-marketable equity securities (320) (428) (696)Cash collateral related to securities lending 2,361 (354) (334)Investments in reverse repurchase agreements (750) 5 45 Acquisitions, net of cash acquired and proceeds received from divestiture, and purchases of intangible and other assets (1,067) (1,900) (10,568)Net cash used in investing activities (10,680) (19,041) (13,056)Financing activities Net proceeds (payments) from stock-based award activities 294 (5) (287)Excess tax benefi ts from stock-based award activities 94 86 188 Repurchase of common stock in connection with acquisitions (801) 0 0 Proceeds from issuance of debt, net of costs 5,246 10,905 16,109 Repayment of debt (1,783) (10,179) (14,781)Net cash provided by fi nancing activities 3,050 807 1,229 Eff ect of exchange rate changes on cash and cash equivalents (19) 22 3 Net increase (decrease) in cash and cash equivalents 3,432 (3,647) 4,795 Cash and cash equivalents at beginning of year 10,198 13,630 9,983 Cash and cash equivalents at end of year $ 13,630 $ 9,983 $ 14,778Supplemental disclosures of cash fl ow information Cash paid for interest $ 0 $ 40 $ 74 Cash paid for taxes $ 2,175 $ 1,471 $ 2,034 Non-cash fi nancing activity:
Fair value of stock-based awards assumed in connection with acquisitions $ 750 $ 0 $ 41
See accompanying notes.
Contents

51GOOGLE INC. | Form 10-K
PART II ITEM 8. Notes to Consolidated Financial Statements
Google Inc. Notes to Consolidated Financial Statements
NOTE 1. Google Inc. and Summary of Signifi cant Accounting Policies
Nature of Operations
We were incorporated in California in September 1998. We were re-incorporated in the State of Delaware in August 2003. We generate revenues primarily by delivering relevant, cost-eff ective online advertising in our Google segment. In addition, as a result of our acquisition of Motorola Mobility Holdings, Inc. (Motorola) on May 22, 2012, we generate revenues from sales of mobile devices in our Motorola Mobile (Mobile) segment and digital set-top boxes in our Motorola Home (Home) segment. In December 2012, we entered into an agreement to dispose Home, and the related fi nancial results are presented as net loss from discontinued operations on the Consolidated Statements of Income. Assets and liabilities of Motorola Home are not presented as held for sale on the Consolidated Balance Sheets because they are not material.
Basis of Consolidation
The consolidated fi nancial statements include the accounts of Google Inc. and our wholly-owned subsidiaries. All intercompany balances and transactions have been eliminated.
Use of Estimates
The preparation of consolidated fi nancial statements in conformity with U.S. Generally Accepted Accounting Principles (GAAP) requires us to make estimates and assumptions that aff ect the amounts reported and disclosed in the fi nancial statements and the accompanying notes. Actual results could diff er materially from these estimates. On an ongoing basis, we evaluate our estimates, including those related to the accounts receivable and sales allowances, fair values of fi nancial instruments, intangible assets and goodwill, useful lives of intangible assets and property and equipment, fair values of stock-based awards, inventory valuations, income taxes, and contingent liabilities, among others. We base our estimates on historical experience and on various other assumptions that are believed to be reasonable, the results of which form the basis for making judgments about the carrying values of assets and liabilities.
Revenue Recognition
The following table presents our revenues by revenue source (in millions):Year Ended December 31,
2010 2011 2012Google: Advertising revenues:
Google websites $19,444 $26,145 $31,221Google Network Members’ websites 8,792 10,386 12,465
Total advertising revenues 28,236 36,531 43,686Other revenues 1,085 1,374 2,353Motorola Mobile: Total Motorola Mobile revenues (hardware and other) 0 0 4,136Total revenues $29,321 $37,905 $50,175
We recognize revenues when the services or products have been provided or delivered, the fees we charge are fi xed or determinable, we and our advertisers or other customers understand the specifi c nature and terms of the agreed upon transactions, and collectability is reasonably assured.
Google AdWords is our auction-based advertising program that enables advertisers to place text-based and display ads on our websites and our Google Network Members’ websites. Display advertising comprises the videos, text, images, and other interactive ads that run across the web on computers and mobile devices, including smart phones and handheld computers such as netbooks
Contents

52 GOOGLE INC. | Form 10-K
PART II ITEM 8. Notes to Consolidated Financial Statements
and tablets. Most of our customers pay us on a cost-per-click basis, which means that an advertiser pays us only when a user clicks on one of its ads. We also off er advertising on a cost-per-impression basis that enables advertisers to pay us based on the number of times their ads display on our websites and our Google Network Members’ websites as specifi ed by the advertisers.
Google AdSense refers to the online programs through which we distribute our advertisers’ AdWords ads for display on our Google Network Members’ websites.
We recognize as revenues the fees charged to advertisers each time a user clicks on one of the ads that appears next to the search results or content on our websites or our Google Network Members’ websites. For those advertisers using our cost-per-impression pricing, we recognize as revenues the fees charged to advertisers each time their ads are displayed on our websites or our Google Network Members’ websites. We report our Google AdSense revenues on a gross basis principally because we are the primary obligor to our advertisers.
We record deferred revenues upon invoicing or when cash payments are received in advance of our performance in the underlying agreement on the accompanying Consolidated Balance Sheets.
Motorola
For hardware product sales, where we sell directly to end customers or through distribution channels, revenue recognition generally occurs when products have been shipped, risk of loss has transferred to the customer, objective evidence exists that customer acceptance provisions have been met, no signifi cant obligations remain and allowances for discounts, price protection, returns and customer incentives can be reasonably and reliably estimated. Recorded revenues are reduced by these allowances. Where these allowances cannot be reasonably and reliably estimated, we recognize revenue at the time the product sells through the distribution channel to the end customer.
For arrangements that include multiple deliverables, primarily for products that contain software essential to the hardware products’ functionality and services, we allocate revenue to each unit of accounting based on their relative selling prices. In such circumstances, we use a hierarchy to determine the selling prices to be used for allocating revenue: (i) vendor-specifi c objective evidence of fair value (VSOE), (ii) third-party evidence of selling price, and (iii) best estimate of the selling price (ESP). VSOE generally exists only when we sell the deliverable separately and is the price actually charged by us for that deliverable. ESPs refl ect our best estimates of what the selling prices of elements would be if they were sold regularly on a stand-alone basis.
Revenues from Home are included in net loss from discontinued operations.
Cost of Revenues
Cost of revenues consists primarily of traffi c acquisition costs. Traffi c acquisition costs consist of amounts ultimately paid to our Google Network members under AdSense arrangements and to certain other partners (our distribution partners) who distribute our toolbar and other products (collectively referred to as access points) or otherwise direct search queries to our website (collectively referred to as distribution arrangements). These amounts are primarily based on the revenue share and fi xed fee arrangements with our Google Network Members and distribution partners.
Certain distribution arrangements require us to pay our partners based on a fee per access point delivered and not exclusively—or at all—based on revenue share. These fees are non-refundable. Further, these arrangements are terminable at will, although under the terms of certain contracts we or our distribution partners may be subject to penalties in the event of early termination. We recognize fees under these arrangements over the estimated useful lives of the access points (approximately two years) to the extent we can reasonably estimate those lives and they are longer than one year, or based on any contractual revenue share, if greater. Otherwise, the fees are charged to expense as incurred. The estimated useful life of the access points is based on the historical average period of time they generate traffi c and revenues. Further, we review the access points for impairment by distribution partner, type, and geography, and we have not made any impairment to date.
Cost of revenues also includes the expenses associated with the operation of our data centers, including depreciation, labor, energy, and bandwidth costs, credit card and other transaction fees related to processing customer transactions, amortization of acquired intangible assets, as well as content acquisition costs. We have entered into arrangements with certain content providers under which we distribute or license their video and other content. In a number of these arrangements, we display ads on the pages of our web sites from which the content is viewed and share most of the fees these ads generate with the content providers. To the extent we are obligated to make guaranteed minimum revenue share payments to our content providers, we recognize as content acquisition costs the contractual revenue share amount or the minimum guarantee on a straight-line basis, whichever is greater, over the terms of the agreements.
Prepaid revenue share and distribution fees are included in prepaid revenue share, expenses, and other assets on the accompanying Consolidated Balance Sheets.
Contents

53GOOGLE INC. | Form 10-K
PART II ITEM 8. Notes to Consolidated Financial Statements
Motorola
Cost of revenues from our Motorola business related to delivered hardware, including estimated warranty costs, are recognized at the time of sale. Cost of revenues from Home are included in net loss from discontinued operations.
Stock-based Compensation
We have elected to use the Black-Scholes-Merton (BSM) option pricing model to determine the fair value of stock options on the dates of grant. Restricted stock units (RSUs) are measured based on the fair market values of the underlying stock on the dates of grant. Shares are issued on the vesting dates net of the minimum statutory tax withholding requirements to be paid by us on behalf of our employees. As a result, the actual number of shares issued will be fewer than the actual number of RSUs outstanding. Furthermore, we record the liability for withholding amounts to be paid by us as a reduction to additional paid-in capital when paid. Also, we recognize stock-based compensation using the straight-line method.
We include as part of cash fl ows from fi nancing activities the benefi ts of tax deductions in excess of the tax-eff ected compensation of the related stock-based awards for options exercised and RSUs vested during the period. During the years ended December 31, 2010, December 31, 2011, and December 31, 2012, the amount of cash received from the exercise of stock options was $656 million, $621 million, and $736 million, and the total direct tax benefi t realized, including the excess tax benefi t, from stock-based award activities was $355 million, $451 million, and $747 million. We have elected to account for the indirect eff ects of stock-based awards—primarily the research and development tax credit—through the Consolidated Statements of Income.
For the years ended December 31, 2010, December 31, 2011, and December 31, 2012, we recognized stock-based compensation expense and related tax benefi ts of $1,376 million and $314 million, $1,974 million and $413 million, and $2,649 million and $591 million. Additionally, net loss from discontinued operations for the year ended December 31, 2012 includes stock-based compensation expense and related tax benefi ts of $43 million and $11 million.
Certain Risks and Concentrations
Our revenues are primarily derived from online advertising, the market for which is highly competitive and rapidly changing. In addition, our revenues are generated from a multitude of vertical market segments in countries around the world. Signifi cant changes in this industry or changes in customer buying or advertiser spending behavior could adversely aff ect our operating results. In addition, for our Motorola business, nearly all of our Motorola products (other than some prototypes) are manufactured outside the U.S., primarily in China, Taiwan and Brazil.
Financial instruments that potentially subject us to concentrations of credit risk consist principally of cash equivalents, marketable securities, foreign exchange contracts, and accounts receivable. Cash equivalents and marketable securities consist primarily of time deposits, money market and other funds, including cash collateral received related to our securities lending program, highly liquid debt instruments of the U.S. government and its agencies, debt instruments issued by foreign governments and municipalities in the U.S., corporate securities, mortgage-backed securities, and asset-backed securities. Foreign exchange contracts are transacted with various fi nancial institutions with high credit standing. Accounts receivable are typically unsecured and are derived from revenues earned from customers located around the world. In 2010, 2011, and 2012, we generated approximately 48%, 46%, and 47% of our revenues from customers based in the U.S., with the majority of customers outside of the U.S. located in Europe and Japan. Many of our Google Network Members are in the internet industry. We perform ongoing evaluations to determine customer credit and we limit the amount of credit we extend, but generally we do not require collateral from our customers. We maintain reserves for estimated credit losses and these losses have generally been within our expectations.
No individual customer or groups of affi liated customers represented more than 10% of our revenues in 2010, 2011, and 2012.
Fair Value of Financial Instruments
Our fi nancial assets and fi nancial liabilities that include cash equivalents, marketable securities, and foreign currency and interest rate derivative contracts are measured and recorded at fair value on a recurring basis. We measure certain other assets including our non-marketable equity securities at fair value on a nonrecurring basis when they are deemed to be other-than-temporarily impaired. Our other current fi nancial assets and our other current fi nancial liabilities have fair values that approximate their carrying value and are therefore not recorded at fair value.
Cash, Cash Equivalents, and Marketable Securities
We invest our excess cash primarily in time deposits, money market and other funds, including cash collateral received related to our securities lending program, highly liquid debt instruments of the U.S. government and its agencies, debt instruments issued by foreign governments and municipalities in the U.S., corporate securities, mortgage-backed securities, and asset-backed securities.
We classify all highly liquid investments with stated maturities of three months or less from date of purchase as cash equivalents and all highly liquid investments with stated maturities of greater than three months as marketable securities.
Contents

54 GOOGLE INC. | Form 10-K
PART II ITEM 8. Notes to Consolidated Financial Statements
We determine the appropriate classifi cation of our investments in marketable securities at the time of purchase and reevaluate such designation at each balance sheet date. We have classifi ed and accounted for our marketable securities as available-for-sale. We may or may not hold securities with stated maturities greater than 12 months until maturity. After consideration of our risk versus reward objectives, as well as our liquidity requirements, we may sell these securities prior to their stated maturities. As we view these securities as available to support current operations, we classify securities with maturities beyond 12 months as current assets under the caption marketable securities in the accompanying Consolidated Balance Sheets. We carry these securities at fair value, and report the unrealized gains and losses, net of taxes, as a component of stockholders’ equity, except for unrealized losses determined to be other-than-temporary, which we record as interest and other income, net. We determine any realized gains or losses on the sale of marketable securities on a specifi c identifi cation method, and we record such gains and losses as a component of interest and other income, net.
Non-Marketable Equity Securities
We have accounted for non-marketable equity securities either under the equity or cost method. Investments through which we exercise signifi cant infl uence but do not have control over the investee are accounted for under the equity method. Investments through which we are not able to exercise signifi cant infl uence over the investee are accounted for under the cost method.
Impairment of Marketable and Non-Marketable Securities
We periodically review our marketable and non-marketable securities for impairment. If we conclude that any of these investments are impaired, we determine whether such impairment is other-than-temporary. Factors we consider to make such determination include the duration and severity of the impairment, the reason for the decline in value and the potential recovery period and our intent to sell. For marketable debt securities, we also consider whether (1) it is more likely than not that we will be required to sell the security before recovery of its amortized cost basis, and (2) the amortized cost basis cannot be recovered as a result of credit losses. If any impairment is considered other-than-temporary, we will write down the asset to its fair value and record the corresponding charge as interest and other income, net.
Accounts Receivable
We record accounts receivable at the invoiced amount and we do not charge interest. We maintain an allowance for doubtful accounts to reserve for potentially uncollectible receivables. We review the accounts receivable by amounts due by customers which are past due to identify specifi c customers with known disputes or collectability issues. In determining the amount of the reserve, we make judgments about the creditworthiness of signifi cant customers based on ongoing credit evaluations. We also maintain a sales allowance to reserve for potential credits issued to customers. We determine the amount of the reserve based on historical credits issued.
Inventories
Inventories are stated at the lower of cost or market, computed using the fi rst-in, fi rst-out method.
Property and Equipment
We account for property and equipment at cost less accumulated depreciation and amortization. We compute depreciation using the straight-line method over the estimated useful lives of the assets, generally two to fi ve years. We depreciate buildings over periods up to 25 years. We amortize leasehold improvements over the shorter of the remaining lease term or the estimated useful lives of the assets. Construction in progress is related to the construction or development of property (including land) and equipment that have not yet been placed in service for our intended use. Depreciation for equipment commences once it is placed in service and depreciation for buildings and leasehold improvements commences once they are ready for our intended use. Land is not depreciated.
Software Development Costs
We expense software development costs, including costs to develop software products or the software component of products to be marketed to external users, before technological feasibility of such products is reached. We have determined that technological feasibility was reached shortly before the release of those products and as a result, the development costs incurred after the establishment of technological feasibility and before the release of those products were not material, and accordingly, were expensed as incurred. Software development costs also include costs to develop software programs to be used solely to meet our internal needs. The costs we incurred during the application development stage for these software programs were not material in the years presented.
Business Combinations
We include the results of operations of the businesses that we acquire as of the respective dates of acquisition. We allocate the fair value of the purchase price of our acquisitions to the tangible assets acquired, and liabilities assumed and intangible assets acquired, based on their estimated fair values. The excess of the fair value of purchase price over the fair values of these identifi able assets and liabilities is recorded as goodwill.
Contents
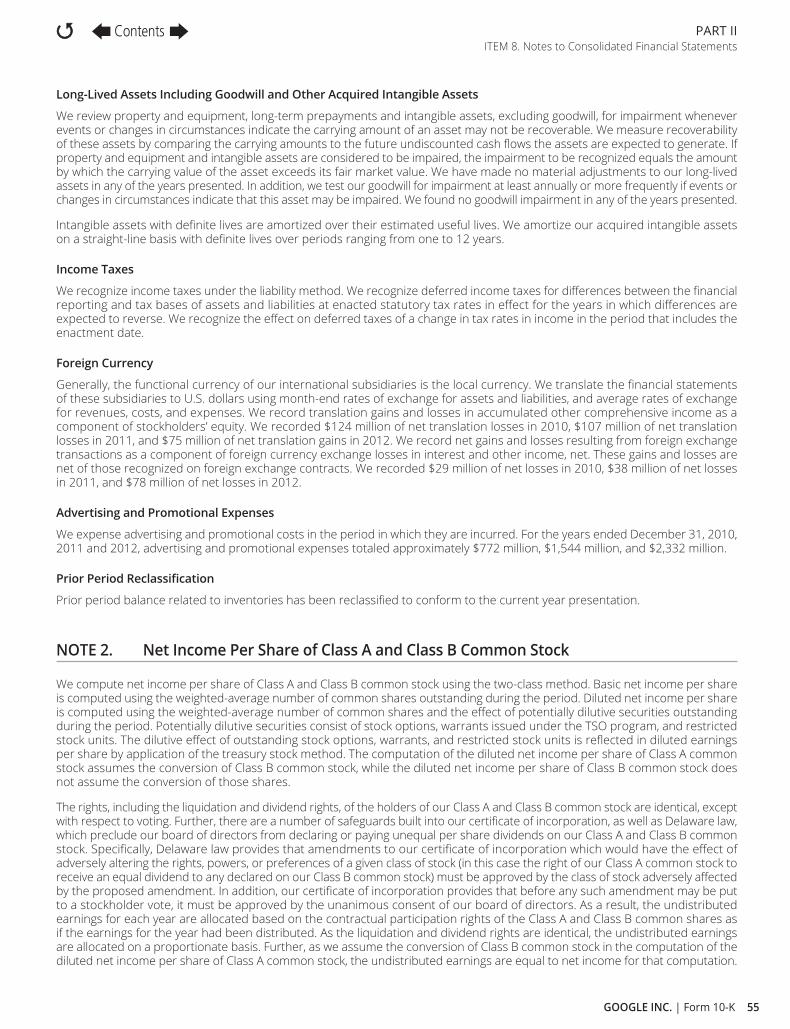
55GOOGLE INC. | Form 10-K
PART II ITEM 8. Notes to Consolidated Financial Statements
Long-Lived Assets Including Goodwill and Other Acquired Intangible Assets
We review property and equipment, long-term prepayments and intangible assets, excluding goodwill, for impairment whenever events or changes in circumstances indicate the carrying amount of an asset may not be recoverable. We measure recoverability of these assets by comparing the carrying amounts to the future undiscounted cash fl ows the assets are expected to generate. If property and equipment and intangible assets are considered to be impaired, the impairment to be recognized equals the amount by which the carrying value of the asset exceeds its fair market value. We have made no material adjustments to our long-lived assets in any of the years presented. In addition, we test our goodwill for impairment at least annually or more frequently if events or changes in circumstances indicate that this asset may be impaired. We found no goodwill impairment in any of the years presented.
Intangible assets with defi nite lives are amortized over their estimated useful lives. We amortize our acquired intangible assets on a straight-line basis with defi nite lives over periods ranging from one to 12 years.
Income Taxes
We recognize income taxes under the liability method. We recognize deferred income taxes for diff erences between the fi nancial reporting and tax bases of assets and liabilities at enacted statutory tax rates in eff ect for the years in which diff erences are expected to reverse. We recognize the eff ect on deferred taxes of a change in tax rates in income in the period that includes the enactment date.
Foreign Currency
Generally, the functional currency of our international subsidiaries is the local currency. We translate the fi nancial statements of these subsidiaries to U.S. dollars using month-end rates of exchange for assets and liabilities, and average rates of exchange for revenues, costs, and expenses. We record translation gains and losses in accumulated other comprehensive income as a component of stockholders’ equity. We recorded $124 million of net translation losses in 2010, $107 million of net translation losses in 2011, and $75 million of net translation gains in 2012. We record net gains and losses resulting from foreign exchange transactions as a component of foreign currency exchange losses in interest and other income, net. These gains and losses are net of those recognized on foreign exchange contracts. We recorded $29 million of net losses in 2010, $38 million of net losses in 2011, and $78 million of net losses in 2012.
Advertising and Promotional Expenses
We expense advertising and promotional costs in the period in which they are incurred. For the years ended December 31, 2010, 2011 and 2012, advertising and promotional expenses totaled approximately $772 million, $1,544 million, and $2,332 million.
Prior Period Reclassifi cation
Prior period balance related to inventories has been reclassifi ed to conform to the current year presentation.
NOTE 2. Net Income Per Share of Class A and Class B Common Stock
We compute net income per share of Class A and Class B common stock using the two-class method. Basic net income per share is computed using the weighted-average number of common shares outstanding during the period. Diluted net income per share is computed using the weighted-average number of common shares and the eff ect of potentially dilutive securities outstanding during the period. Potentially dilutive securities consist of stock options, warrants issued under the TSO program, and restricted stock units. The dilutive eff ect of outstanding stock options, warrants, and restricted stock units is refl ected in diluted earnings per share by application of the treasury stock method. The computation of the diluted net income per share of Class A common stock assumes the conversion of Class B common stock, while the diluted net income per share of Class B common stock does not assume the conversion of those shares.
The rights, including the liquidation and dividend rights, of the holders of our Class A and Class B common stock are identical, except with respect to voting. Further, there are a number of safeguards built into our certifi cate of incorporation, as well as Delaware law, which preclude our board of directors from declaring or paying unequal per share dividends on our Class A and Class B common stock. Specifi cally, Delaware law provides that amendments to our certifi cate of incorporation which would have the eff ect of adversely altering the rights, powers, or preferences of a given class of stock (in this case the right of our Class A common stock to receive an equal dividend to any declared on our Class B common stock) must be approved by the class of stock adversely aff ected by the proposed amendment. In addition, our certifi cate of incorporation provides that before any such amendment may be put to a stockholder vote, it must be approved by the unanimous consent of our board of directors. As a result, the undistributed earnings for each year are allocated based on the contractual participation rights of the Class A and Class B common shares as if the earnings for the year had been distributed. As the liquidation and dividend rights are identical, the undistributed earnings are allocated on a proportionate basis. Further, as we assume the conversion of Class B common stock in the computation of the diluted net income per share of Class A common stock, the undistributed earnings are equal to net income for that computation.
Contents

56 GOOGLE INC. | Form 10-K
PART II ITEM 8. Notes to Consolidated Financial Statements
The following table sets forth the computation of basic and diluted net income per share of Class A and Class B common stock (in millions, except share amounts which are refl ected in thousands and per share amounts):
Year Ended December 31,2010 2011 2012
Class A Class B Class A Class B Class A Class BBasic net income (loss) per share:
Numerator Allocation of undistributedearnings—continuing operations $ 6,569 $ 1,936 $ 7,658 $ 2,079 $ 8,641 $ 2,147 Allocation of undistributedearnings—discontinued operations 0 0 0 0 (41) (10)Total $ 6,569 $ 1,936 $ 7,658 $ 2,079 $ 8,600 $ 2,137
Denominator Weighted-average common shares outstanding 246,168 72,534 253,862 68,916 262,078 65,135
Number of shares used in per share computation 246,168 72,534 253,862 68,916 262,078 65,135Basic net income (loss) per share
Continuing operations $ 26.69 $ 26.69 $ 30.17 $ 30.17 $ 32.97 $ 32.97 Discontinued operations 0 0 0 0 (0.16) (0.16)
Basic net income per share $ 26.69 $ 26.69 $ 30.17 $ 30.17 $ 32.81 $ 32.81Diluted net income per share:
Numerator Allocation of undistributed earnings forbasic computation—continuing operations $ 6,569 $ 1,936 $ 7,658 $ 2,079 $ 8,641 $ 2,147
Reallocation of undistributed earnings as a result of conversion of Class B to Class A shares 1,936 0 2,079 0 2,147 0 Reallocation of undistributed earnings to Class B shares 0 (26) 0 (27) 0 (31)
Allocation of undistributedearnings—continuing operations $ 8,505 $ 1,910 $ 9,737 $ 2,052 $ 10,788 $ 2,116 Allocation of undistributed earnings for basic computation—discontinued operations $ 0 $ 0 $ 0 $ 0 $ (41) $ (10)
Reallocation of undistributed earnings as a result of conversion of Class B to Class A shares 0 0 0 0 (10) 0 Reallocation of undistributed earnings to Class B shares 0 0 0 0 0 0 Allocation of undistributedearnings—discontinued operations $ 0 $ 0 $ 0 $ 0 $ (51) $ (10)
Denominator Number of shares used in basic computation 246,168 72,534 253,862 68,916 262,078 65,135 Weighted-average eff ect of dilutive securities Add:
Conversion of Class B to Class A common shares outstanding 72,534 0 68,916 0 65,135 0 Employee stock options, including warrants issued under Transferable Stock Option program 3,410 71 2,958 46 2,944 34 Restricted stock units 1,139 0 1,478 0 2,148 0
Number of shares used in per share computation 323,251 72,605 327,214 68,962 332,305 65,169Diluted net income (loss) per share:
Continuing operations 26.31 26.31 29.76 29.76 32.46 32.46 Discontinued operations 0.00 0.00 0.00 0.00 (0.15) (0.15)
Diluted net income per share $ 26.31 $ 26.31 $ 29.76 $ 29.76 $ 32.31 $ 32.31
The net income per share amounts are the same for Class A and Class B common stock because the holders of each class are legally entitled to equal per share distributions whether through dividends or in liquidation.
Contents

57GOOGLE INC. | Form 10-K
PART II ITEM 8. Notes to Consolidated Financial Statements
NOTE 3. Financial Instruments
Fair Value Measurements
We measure our cash equivalents, marketable securities, and foreign currency and interest rate derivative contracts at fair value. Fair value is an exit price, representing the amount that would be received to sell an asset or paid to transfer a liability in an orderly transaction between market participants. As such, fair value is a market-based measurement that should be determined based on assumptions that market participants would use in pricing an asset or a liability. A three-tier fair value hierarchy is established as a basis for considering such assumptions and for inputs used in the valuation methodologies in measuring fair value:
Level 1—Observable inputs that refl ect quoted prices (unadjusted) for identical assets or liabilities in active markets.
Level 2—Include other inputs that are based upon quoted prices for similar instruments in active markets, quoted prices for identical or similar instruments in markets that are not active, and model-based valuation techniques for which all signifi cant inputs are observable in the market or can be derived from observable market data. Where applicable, these models project future cash fl ows and discount the future amounts to a present value using market-based observable inputs including interest rate curves, foreign exchange rates, and credit ratings.
Level 3—Unobservable inputs that are supported by little or no market activities.
The fair value hierarchy also requires an entity to maximize the use of observable inputs and minimize the use of unobservable inputs when measuring fair value.
Based on the fair value hierarchy, we classify our cash equivalents and marketable securities within Level 1 or Level 2. This is because we value our cash equivalents and marketable securities using quoted market prices or alternative pricing sources and models utilizing market observable inputs. We classify our foreign currency and interest rate derivative contracts primarily within Level 2 as the valuation inputs are based on quoted prices and market observable data of similar instruments.
Cash, Cash Equivalents and Marketable Securities
The following tables summarize our cash, cash equivalents and marketable securities measured at adjusted cost, gross unrealized gains, gross unrealized losses and fair value by signifi cant investment categories as of December 31, 2011 and December 31, 2012 (in millions):
As of December 31, 2011
AdjustedCost
Gross Unrealized
Gains
Gross Unrealized
LossesFair
Value
Cashand Cash
EquivalentsMarketable
SecuritiesCash $ 4,712 $ 0 $ 0 $ 4,712 $4,712 $ 0Level 1: Money market and other funds 3,202 0 0 3,202 3,202 0U.S. government notes 11,475 104 0 11,579 0 11,579Marketable equity securities 228 79 0 307 0 307 14,905 183 0 15,088 3,202 11,886Level 2: Time deposits 1,029 0 0 1,029 534 495Money market and other funds(1) 1,260 0 0 1,260 1,260 0U.S. government agencies 6,486 15 0 6,501 275 6,226Foreign government bonds 1,608 32 (11) 1,629 0 1,629Municipal securities 1,775 19 0 1,794 0 1,794Corporate debt securities 6,023 187 (98) 6,112 0 6,112Agency residential mortgage-backed securities 6,359 147 (5) 6,501 0 6,501 24,540 400 (114) 24,826 2,069 22,757
Total $44,157 $583 $(114 ) $44,626 $9,983 $ 34,643
Contents
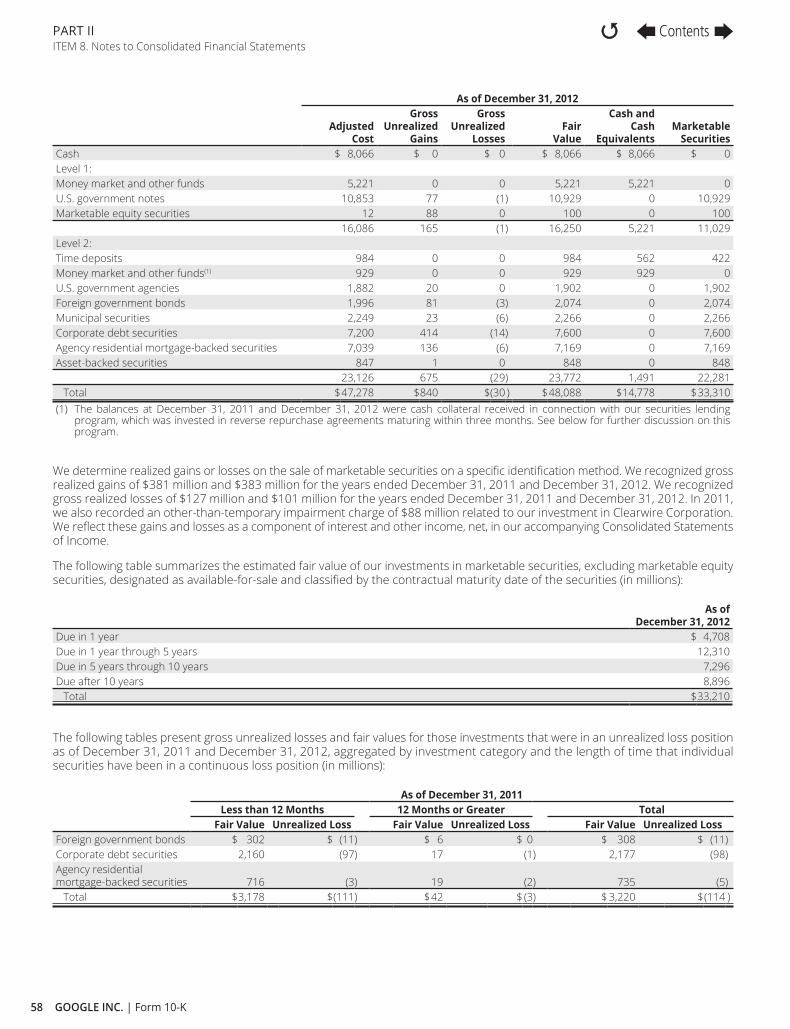
58 GOOGLE INC. | Form 10-K
PART II ITEM 8. Notes to Consolidated Financial Statements
As of December 31, 2012
AdjustedCost
Gross Unrealized
Gains
Gross Unrealized
LossesFair
Value
Cash and Cash
EquivalentsMarketable
SecuritiesCash $ 8,066 $ 0 $ 0 $ 8,066 $ 8,066 $ 0Level 1: Money market and other funds 5,221 0 0 5,221 5,221 0U.S. government notes 10,853 77 (1) 10,929 0 10,929Marketable equity securities 12 88 0 100 0 100 16,086 165 (1) 16,250 5,221 11,029Level 2: Time deposits 984 0 0 984 562 422Money market and other funds(1) 929 0 0 929 929 0U.S. government agencies 1,882 20 0 1,902 0 1,902Foreign government bonds 1,996 81 (3) 2,074 0 2,074Municipal securities 2,249 23 (6) 2,266 0 2,266Corporate debt securities 7,200 414 (14) 7,600 0 7,600Agency residential mortgage-backed securities 7,039 136 (6) 7,169 0 7,169Asset-backed securities 847 1 0 848 0 848 23,126 675 (29) 23,772 1,491 22,281
Total $47,278 $840 $(30 ) $48,088 $14,778 $33,310(1) The balances at December 31, 2011 and December 31, 2012 were cash collateral received in connection with our securities lending
program, which was invested in reverse repurchase agreements maturing within three months. See below for further discussion on this program.
We determine realized gains or losses on the sale of marketable securities on a specifi c identifi cation method. We recognized gross realized gains of $381 million and $383 million for the years ended December 31, 2011 and December 31, 2012. We recognized gross realized losses of $127 million and $101 million for the years ended December 31, 2011 and December 31, 2012. In 2011, we also recorded an other-than-temporary impairment charge of $88 million related to our investment in Clearwire Corporation. We refl ect these gains and losses as a component of interest and other income, net, in our accompanying Consolidated Statements of Income.
The following table summarizes the estimated fair value of our investments in marketable securities, excluding marketable equity securities, designated as available-for-sale and classifi ed by the contractual maturity date of the securities (in millions):
As of December 31, 2012
Due in 1 year $ 4,708Due in 1 year through 5 years 12,310Due in 5 years through 10 years 7,296Due after 10 years 8,896
Total $33,210
The following tables present gross unrealized losses and fair values for those investments that were in an unrealized loss position as of December 31, 2011 and December 31, 2012, aggregated by investment category and the length of time that individual securities have been in a continuous loss position (in millions):
As of December 31, 2011Less than 12 Months 12 Months or Greater Total
Fair Value Unrealized Loss Fair Value Unrealized Loss Fair Value Unrealized LossForeign government bonds $ 302 $ (11) $ 6 $ 0 $ 308 $ (11)Corporate debt securities 2,160 (97) 17 (1) 2,177 (98)Agency residential mortgage-backed securities 716 (3) 19 (2) 735 (5)
Total $3,178 $(111) $42 $ (3) $ 3,220 $(114 )
Contents
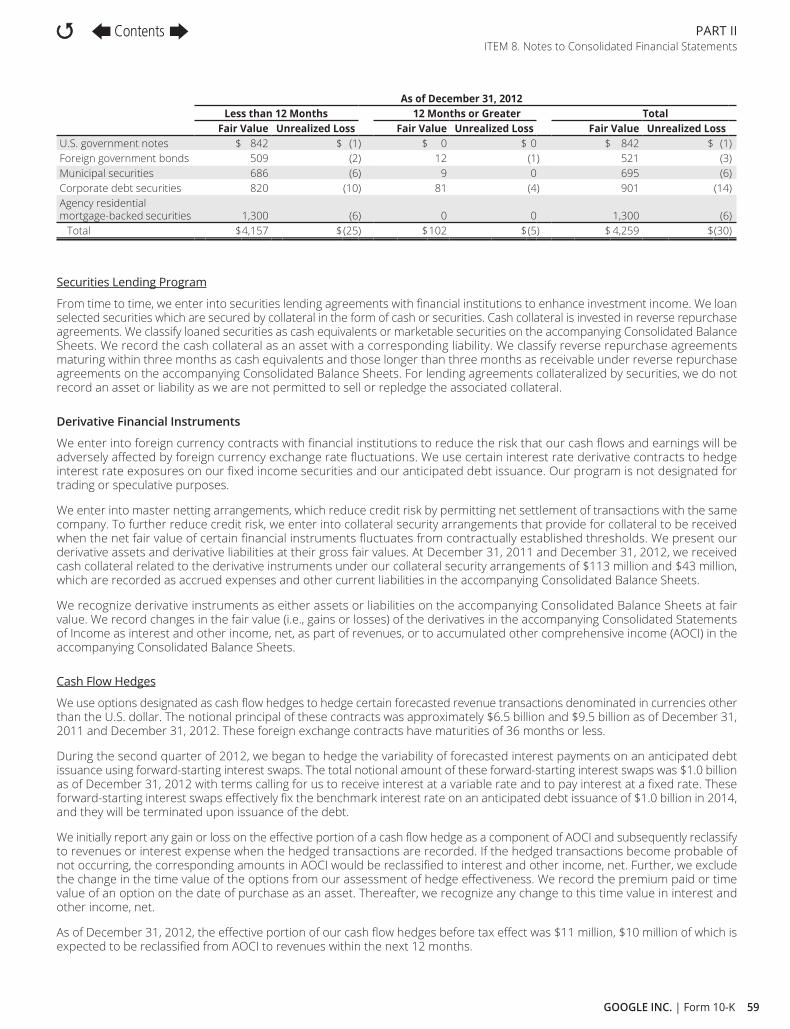
59GOOGLE INC. | Form 10-K
PART II ITEM 8. Notes to Consolidated Financial Statements
As of December 31, 2012Less than 12 Months 12 Months or Greater Total
Fair Value Unrealized Loss Fair Value Unrealized Loss Fair Value Unrealized LossU.S. government notes $ 842 $ (1) $ 0 $ 0 $ 842 $ (1)Foreign government bonds 509 (2) 12 (1) 521 (3)Municipal securities 686 (6) 9 0 695 (6)Corporate debt securities 820 (10) 81 (4) 901 (14)Agency residential mortgage-backed securities 1,300 (6) 0 0 1,300 (6)
Total $4,157 $(25) $102 $(5) $ 4,259 $(30)
Securities Lending Program
From time to time, we enter into securities lending agreements with fi nancial institutions to enhance investment income. We loan selected securities which are secured by collateral in the form of cash or securities. Cash collateral is invested in reverse repurchase agreements. We classify loaned securities as cash equivalents or marketable securities on the accompanying Consolidated Balance Sheets. We record the cash collateral as an asset with a corresponding liability. We classify reverse repurchase agreements maturing within three months as cash equivalents and those longer than three months as receivable under reverse repurchase agreements on the accompanying Consolidated Balance Sheets. For lending agreements collateralized by securities, we do not record an asset or liability as we are not permitted to sell or repledge the associated collateral.
Derivative Financial Instruments
We enter into foreign currency contracts with fi nancial institutions to reduce the risk that our cash fl ows and earnings will be adversely aff ected by foreign currency exchange rate fl uctuations. We use certain interest rate derivative contracts to hedge interest rate exposures on our fi xed income securities and our anticipated debt issuance. Our program is not designated for trading or speculative purposes.
We enter into master netting arrangements, which reduce credit risk by permitting net settlement of transactions with the same company. To further reduce credit risk, we enter into collateral security arrangements that provide for collateral to be received when the net fair value of certain fi nancial instruments fl uctuates from contractually established thresholds. We present our derivative assets and derivative liabilities at their gross fair values. At December 31, 2011 and December 31, 2012, we received cash collateral related to the derivative instruments under our collateral security arrangements of $113 million and $43 million, which are recorded as accrued expenses and other current liabilities in the accompanying Consolidated Balance Sheets.
We recognize derivative instruments as either assets or liabilities on the accompanying Consolidated Balance Sheets at fair value. We record changes in the fair value (i.e., gains or losses) of the derivatives in the accompanying Consolidated Statements of Income as interest and other income, net, as part of revenues, or to accumulated other comprehensive income (AOCI) in the accompanying Consolidated Balance Sheets.
Cash Flow Hedges
We use options designated as cash fl ow hedges to hedge certain forecasted revenue transactions denominated in currencies other than the U.S. dollar. The notional principal of these contracts was approximately $6.5 billion and $9.5 billion as of December 31, 2011 and December 31, 2012. These foreign exchange contracts have maturities of 36 months or less.
During the second quarter of 2012, we began to hedge the variability of forecasted interest payments on an anticipated debt issuance using forward-starting interest swaps. The total notional amount of these forward-starting interest swaps was $1.0 billion as of December 31, 2012 with terms calling for us to receive interest at a variable rate and to pay interest at a fi xed rate. These forward-starting interest swaps eff ectively fi x the benchmark interest rate on an anticipated debt issuance of $1.0 billion in 2014, and they will be terminated upon issuance of the debt.
We initially report any gain or loss on the eff ective portion of a cash fl ow hedge as a component of AOCI and subsequently reclassify to revenues or interest expense when the hedged transactions are recorded. If the hedged transactions become probable of not occurring, the corresponding amounts in AOCI would be reclassifi ed to interest and other income, net. Further, we exclude the change in the time value of the options from our assessment of hedge eff ectiveness. We record the premium paid or time value of an option on the date of purchase as an asset. Thereafter, we recognize any change to this time value in interest and other income, net.
As of December 31, 2012, the eff ective portion of our cash fl ow hedges before tax eff ect was $11 million, $10 million of which is expected to be reclassifi ed from AOCI to revenues within the next 12 months.
Contents

60 GOOGLE INC. | Form 10-K
PART II ITEM 8. Notes to Consolidated Financial Statements
Fair Value Hedges
We use forward contracts designated as fair value hedges to hedge foreign currency risks for our investments denominated in currencies other than the U.S. dollar. Gains and losses on these contracts are recognized in interest and other income, net, along with the off setting losses and gains of the related hedged items. We exclude changes in the time value for forward contracts from the assessment of hedge eff ectiveness and recognize them in interest and other income, net. The notional principal of these contracts was $1.0 billion and $1.1 billion as of December 31, 2011 and December 31, 2012.
Other Derivatives
Other derivatives not designated as hedging instruments consist of forward and option contracts that we use to hedge intercompany transactions and other monetary assets or liabilities denominated in currencies other than the local currency of a subsidiary. We recognize gains and losses on these contracts as well as the related costs in interest and other income, net, along with the gains and losses of the related hedged items. The notional principal of foreign exchange contracts outstanding was $3.7 billion and $6.6 billion at December 31, 2011 and December 31, 2012.
We also use exchange-traded interest rate futures contracts and “To Be Announced” (TBA) forward purchase commitments of mortgage-backed assets to hedge interest rate risks on certain fi xed income securities. The TBA contracts meet the defi nition of derivative instruments in cases where physical delivery of the assets is not taken at the earliest available delivery date. Our interest rate futures and TBA contracts (together interest rate contracts) are not designated as hedging instruments. We recognize gains and losses on these contracts as well as the related costs in interest and other income, net. The gains and losses are generally economically off set by unrealized gains and losses in the underlying available-for-sale securities, which are recorded as a component of AOCI until the securities are sold or other-than-temporarily impaired, at which time the amounts are moved from AOCI into interest and other income, net. The total notional amounts of interest rate contracts outstanding were $100 million and $25 million at December 31, 2011 and December, 31, 2012.
The fair values of our outstanding derivative instruments were as follows (in millions):
As of December 31, 2011
Balance Sheet Location
Fair Value of Derivatives Designated as
Hedging Instruments
Fair Valueof Derivatives
Not Designated as Hedging Instruments
Total Fair Value
Derivative Assets: Level 2: Foreign exchange contracts Prepaid revenue share, expenses and
other assets, current and non-current $333 $ 4 $337Derivative Liabilities: Level 2: Foreign exchange contracts Accrued expenses and other
current liabilities $ 5 $ 1 $ 6
As of December 31, 2012
Balance Sheet Location
Fair Value of Derivatives Designated as
Hedging Instruments
Fair Value of Derivatives
Not Designated as Hedging Instruments
Total Fair Value
Derivative Assets: Level 2: Foreign exchange contracts Prepaid revenue share, expenses and
other assets, current and non-current $164 $ 13 $177Interest rate contracts Prepaid revenue share, expenses and
other assets, current and non-current 1 0 1Total $165 $ 13 $178Derivative Liabilities: Level 2: Foreign exchange contracts Accrued expenses and other
current liabilities $ 3 $ 4 $ 7
Contents

61GOOGLE INC. | Form 10-K
PART II ITEM 8. Notes to Consolidated Financial Statements
The eff ect of derivative instruments in cash fl ow hedging relationships on income and other comprehensive income is summarized below (in millions):
Derivatives in Cash FlowHedging Relationship
Gains Recognized in OCI on Derivatives Before Tax Eff ect (Eff ective Portion)
Year Ended December 31,2010 2011 2012
Foreign exchange contracts $331 $54 $73Interest rate contracts 0 0 1Total $331 $54 $74
Derivatives in Cash FlowHedging Relationship
Gains Reclassifi ed from AOCI into Income (Eff ective Portion)
Year Ended December 31,Location 2010 2011 2012
Foreign exchange contracts Revenues $203 $43 $217
Derivatives in Cash FlowHedging Relationship
Losses Recognized in Income on Derivatives(Amount Excluded from Eff ectiveness Testing and
Ineff ective Portion)(1)
Year Ended December 31,Location 2010 2011 2012
Foreign exchange contracts Interest and other income, net $(320) $(323) $(447)(1) Gains (losses) related to the ineffective portion of the hedges were not material in all periods presented.
The eff ect of derivative instruments in fair value hedging relationships on income is summarized below (in millions):
Derivatives in Fair ValueHedging Relationship
Gains (Losses) Recognized in Income on Derivatives(2)
Year Ended December 31,Location 2010 2011 2012
Foreign exchange contracts Interest and other income, net $(35) $ (2) $(31)Hedged item Interest and other income, net 29 (12) 23 Total $ (6 ) $(14 ) $ (8 )(2) Losses related to the amount excluded from effectiveness testing of the hedges were $6 million, $14 million, and $8 million for the years
ended December 31, 2010, December 31, 2011, and December 31, 2012.
The eff ect of derivative instruments not designated as hedging instruments on income is summarized below (in millions):
Derivatives Not DesignatedAs Hedging Instruments
Gains (Losses) Recognized in Income on DerivativesYear Ended December 31,
Location 2010 2011 2012Foreign exchange contracts Interest and other income, net $(40) $ 29 $(67)Interest rate contracts Interest and other income, net 0 (19) (6)Total $(40 ) $ 10 $(73 )
NOTE 4. Debt
Short-Term Debt
We have a debt fi nancing program of up to $3.0 billion through the issuance of commercial paper. Net proceeds from this program are used for general corporate purposes. At December 31, 2011 and December 31, 2012, we had $750 million and $2.5 billion of outstanding commercial paper recorded as short-term debt with weighted-average interest rates of 0.1% and 0.2%. In conjunction with this program, we have a $3.0 billion revolving credit facility expiring in July 2016. The interest rate for the credit facility is determined based on a formula using certain market rates. At December 31, 2011 and December 31, 2012, we were in compliance with the fi nancial covenant in the credit facility, and no amounts were outstanding under the credit facility at December 31, 2011 and December 31, 2012.
Additionally, as of December 31, 2011, we had a $468 million secured promissory note outstanding recorded as short-term debt, with an interest rate of 1.0% that matured and was paid in December 2012.
The estimated fair value of the short-term debt approximated its carrying value at December 31, 2011 and December 31, 2012.
Contents

62 GOOGLE INC. | Form 10-K
PART II ITEM 8. Notes to Consolidated Financial Statements
Long-Term Debt
In May 2011, we issued $3.0 billion of unsecured senior notes in three tranches as described in the table below (collectively, the Notes) (in millions):
Years ending
OutstandingBalance as of
December 31, 2011
OutstandingBalance as of
December 31, 20121.25% Notes due on May 19, 2014 $1,000 $1,000 2.125% Notes due on May 19, 2016 1,000 1,000 3.625% Notes due on May 19, 2021 1,000 1,000 Unamortized discount for the Notes above (14) (12)
Total $2,986 $2,988
The eff ective interest yields of the 2014, 2016, and 2021 Notes were 1.258%, 2.241%, and 3.734%, respectively. Interest on the Notes is payable semi-annually in arrears on May 19 and November 19 of each year. We may redeem the Notes at any time in whole or from time to time in part at specifi ed redemption prices. We are not subject to any fi nancial covenants under the Notes. We used the net proceeds from the issuance of the Notes for general corporate purposes. The total estimated fair value of the Notes was approximately $3.2 billion at December 31, 2011 and December 31, 2012. The fair value of the Notes was determined based on observable market prices of identical instruments in markets that are not active and was categorized accordingly as Level 2 in the fair value hierarchy.
At December 31, 2012, future principal payments for the Notes were as follows (in millions):
Years ending2013 $ 02014 1,0002015 02016 1,000Thereafter 1,000
Total $3,000
NOTE 5. Balance Sheet Components
Inventories
Inventories consisted of the following (in millions):
As of December 31,
2011
As of December 31,
2012Raw materials and work in process $ 0 $ 77Finished goods 35 428Inventories $35 $505
Property and Equipment
Property and equipment consisted of the following (in millions):As of
December 31, 2011
As of December 31,
2012Information technology assets $ 6,060 $ 7,717Land and buildings 5,228 6,257Construction in progress 2,128 2,240Leasehold improvements 919 1,409Furniture and fi xtures 65 74
Total 14,400 17,697Less: accumulated depreciation and amortization 4,797 5,843Property and equipment, net $ 9,603 $11,854
Contents
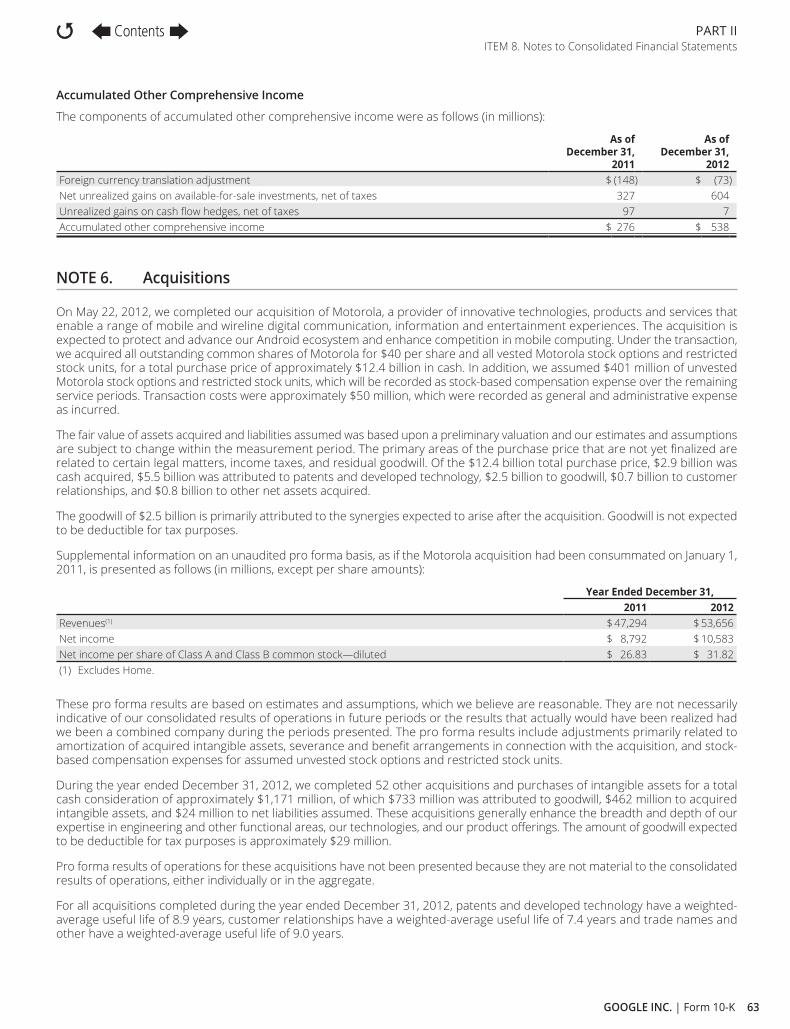
63GOOGLE INC. | Form 10-K
PART II ITEM 8. Notes to Consolidated Financial Statements
Accumulated Other Comprehensive Income
The components of accumulated other comprehensive income were as follows (in millions):
As of December 31,
2011
As of December 31,
2012Foreign currency translation adjustment $ (148) $ (73)Net unrealized gains on available-for-sale investments, net of taxes 327 604 Unrealized gains on cash fl ow hedges, net of taxes 97 7 Accumulated other comprehensive income $ 276 $ 538
NOTE 6. Acquisitions
On May 22, 2012, we completed our acquisition of Motorola, a provider of innovative technologies, products and services that enable a range of mobile and wireline digital communication, information and entertainment experiences. The acquisition is expected to protect and advance our Android ecosystem and enhance competition in mobile computing. Under the transaction, we acquired all outstanding common shares of Motorola for $40 per share and all vested Motorola stock options and restricted stock units, for a total purchase price of approximately $12.4 billion in cash. In addition, we assumed $401 million of unvested Motorola stock options and restricted stock units, which will be recorded as stock-based compensation expense over the remaining service periods. Transaction costs were approximately $50 million, which were recorded as general and administrative expense as incurred.
The fair value of assets acquired and liabilities assumed was based upon a preliminary valuation and our estimates and assumptions are subject to change within the measurement period. The primary areas of the purchase price that are not yet fi nalized are related to certain legal matters, income taxes, and residual goodwill. Of the $12.4 billion total purchase price, $2.9 billion was cash acquired, $5.5 billion was attributed to patents and developed technology, $2.5 billion to goodwill, $0.7 billion to customer relationships, and $0.8 billion to other net assets acquired.
The goodwill of $2.5 billion is primarily attributed to the synergies expected to arise after the acquisition. Goodwill is not expected to be deductible for tax purposes.
Supplemental information on an unaudited pro forma basis, as if the Motorola acquisition had been consummated on January 1, 2011, is presented as follows (in millions, except per share amounts):
Year Ended December 31,2011 2012
Revenues(1) $ 47,294 $ 53,656Net income $ 8,792 $ 10,583Net income per share of Class A and Class B common stock—diluted $ 26.83 $ 31.82(1) Excludes Home.
These pro forma results are based on estimates and assumptions, which we believe are reasonable. They are not necessarily indicative of our consolidated results of operations in future periods or the results that actually would have been realized had we been a combined company during the periods presented. The pro forma results include adjustments primarily related to amortization of acquired intangible assets, severance and benefi t arrangements in connection with the acquisition, and stock-based compensation expenses for assumed unvested stock options and restricted stock units.
During the year ended December 31, 2012, we completed 52 other acquisitions and purchases of intangible assets for a total cash consideration of approximately $1,171 million, of which $733 million was attributed to goodwill, $462 million to acquired intangible assets, and $24 million to net liabilities assumed. These acquisitions generally enhance the breadth and depth of our expertise in engineering and other functional areas, our technologies, and our product off erings. The amount of goodwill expected to be deductible for tax purposes is approximately $29 million.
Pro forma results of operations for these acquisitions have not been presented because they are not material to the consolidated results of operations, either individually or in the aggregate.
For all acquisitions completed during the year ended December 31, 2012, patents and developed technology have a weighted-average useful life of 8.9 years, customer relationships have a weighted-average useful life of 7.4 years and trade names and other have a weighted-average useful life of 9.0 years.
Contents

64 GOOGLE INC. | Form 10-K
PART II ITEM 8. Notes to Consolidated Financial Statements
NOTE 7. Goodwill and Other Intangible Assets
The changes in the carrying amount of goodwill for the year ended December 31, 2012 were as follows (in millions):
Balance as of December 31, 2011 $ 7,346 Goodwill acquired 3,230 Goodwill adjustment (39)Balance as of December 31, 2012 $10,537
Amounts of goodwill allocated to the Mobile and Home segments were not material. See Note 15 for further discussion of segment information.
Information regarding our acquisition-related intangible assets is as follows (in millions):As of December 31, 2011
Gross Carrying Amount
Accumulated Amortization
Net Carrying Amount
Patents and developed technology $1,451 $ 698 $ 753Customer relationships 1,288 573 715Trade names and other 359 249 110
Total $3,098 $1,520 $1,578
As of December 31, 2012Gross Carrying
AmountAccumulated Amortization
Net Carrying Value
Patents and developed technology $7,310 $1,323 $5,987Customer relationships 2,061 847 1,214Trade names and other 576 304 272
Total $9,947 $2,474 $7,473
Patents and developed technology, customer relationships, and trade names and other have weighted-average useful lives from the date of purchase of 8.1 years, 6.6 years, and 5.8 years. Amortization expense of acquisition-related intangible assets for the years ended December 31, 2010, 2011, and 2012 was $314 million, $441 million, and $884 million. For the year ended December 31, 2012, net loss from discontinued operations included $70 million of amortization expense related to Home intangible assets.
As of December 31, 2012, expected amortization expense for acquisition-related intangible assets for each of the next fi ve years and thereafter was as follows (in millions):
2013 $1,1882014 1,1152015 9562016 8792017 821Thereafter 2,514
$7,473
Contents

65GOOGLE INC. | Form 10-K
PART II ITEM 8. Notes to Consolidated Financial Statements
NOTE 8. Discontinued Operations
In December 2012, we entered into an agreement with Arris Group, Inc. and certain other persons providing for the disposition of the Motorola Home business for total consideration of approximately $2.35 billion in cash and common stock, subject to certain adjustments. The transaction is expected to close in 2013. Financial results of the Motorola Home business are presented as net loss from discontinued operations on the Consolidated Statements of Income.
The following table presents fi nancial results of the Motorola Home business for the period from May 22, 2012 to December 31, 2012 (in millions):
Revenues $ 2,028 Loss from discontinued operations before income taxes (22)Provision for income taxes (29)Net loss from discontinued operations $ (51)
NOTE 9. Restructuring Charges
Subsequent to our acquisition of Motorola in May 2012, we initiated a restructuring plan primarily in our Mobile segment to reduce workforce, reorganize management structure, close, consolidate and dispose certain facilities, as well as simplify our mobile product portfolio. These changes are designed to return Motorola’s Mobile segment to profi tability. For the year ended December 31, 2012, activities related to restructuring charges were summarized as below (in millions):
Severance and Related
OtherCharges Total
Balance as of December 31, 2011 $ 0 $ 0 $ 0 Charges(1) 572 59 631 Cash payments (189) (8) (197)Non-cash items(2) (145) (36) (181)Balance as of December 31, 2012 $ 238 $ 15 $ 253 (1) Includes restructuring charges related to Home of $55 million.(2) Non-cash items were primarily related to RSUs, stock options and asset impairments.
For the year ended December 31, 2012, restructuring charges were included in costs and expenses as follows (in millions):
Year Ended December 31, 2012Severance
and RelatedOther
Charges TotalCost of revenues—Motorola Mobile $ 88 $41 $ 129Research and development 195 5 200Sales and marketing 123 8 131General and administrative 114 2 116Total charges $520 $56 $ 576
Restructuring charges related to Home of $55 million were included in net loss from discontinued operations in the Consolidated Statements of Income.
We continue to evaluate our plans and further restructuring actions may occur which may cause us to incur additional restructuring charges, some of which may be signifi cant.
Contents

66 GOOGLE INC. | Form 10-K
PART II ITEM 8. Notes to Consolidated Financial Statements
NOTE 10. Interest and Other Income, Net
The components of interest and other income, net were as follows (in millions):Year Ended December 31,
2010 2011 2012Interest income $ 579 $ 812 $ 713 Interest expense (5) (58) (84)Realized gains on available-for-sale investments, net 185 254 282 Impairment of equity investments 0 (110) 0 Foreign currency exchange losses (355) (379) (531)Gain on divestiture of business 0 0 188 Other 11 65 58
Interest and other income, net $ 415 $ 584 $ 626
NOTE 11. Commitments and Contingencies
Operating Leases
We have entered into various non-cancelable operating lease agreements for certain of our offi ces, land, and data centers throughout the world with original lease periods expiring primarily between 2013 and 2063. We are committed to pay a portion of the actual operating expenses under certain of these lease agreements. These operating expenses are not included in the table below. Certain of these arrangements have free or escalating rent payment provisions. We recognize rent expense under such arrangements on a straight-line basis.
At December 31, 2012, future minimum payments under non-cancelable operating leases, net of sublease income amounts, were as follows over each of the next fi ve years and thereafter (in millions):
Operating Leases
Sub-lease Income
Net Operating Leases
2013 $ 492 $ 26 $ 4662014 475 22 4532015 434 17 4172016 374 12 3622017 333 7 326Thereafter 1,596 1 1,595Total minimum payments $3,704 $85 $3,619
Certain leases have adjustments for market provisions. Amounts in the above table represent our best estimates of future payments to be made under these leases. In addition, the above table does not include future rental income of $649 million related to the leases that we assumed in connection with our building purchases. Rent expense under operating leases, including co-location arrangements, was $293 million, $380 million, and $448 million in 2010, 2011, and 2012.
Purchase Obligations
At December 31, 2012, we had $2.1 billion of other non-cancelable contractual obligations, primarily related to certain of our distribution arrangements, video and other content licensing revenue sharing arrangements, as well as data center operations and facility build-outs.
Letters of Credit
At December 31, 2012, we had unused letters of credit for $89 million, of which $45 million related to our Mobile segment.
Indemnifi cations
In the normal course of business to facilitate transactions in our services and products, we indemnify certain parties, including advertisers, Google Network Members, and lessors with respect to certain matters. We have agreed to hold certain parties harmless against losses arising from a breach of representations or covenants, or out of intellectual property infringement or other claims made against certain parties. Several of these agreements limit the time within which an indemnifi cation claim can be made and the amount of the claim. In addition, we have entered into indemnifi cation agreements with our offi cers and directors, and our bylaws contain similar indemnifi cation obligations to our agents.
Contents

67GOOGLE INC. | Form 10-K
PART II ITEM 8. Notes to Consolidated Financial Statements
It is not possible to make a reasonable estimate of the maximum potential amount under these indemnifi cation agreements due to the unique facts and circumstances involved in each particular agreement. Additionally, we have a limited history of prior indemnifi cation claims and the payments we have made under such agreements have not had a material adverse eff ect on our results of operations, cash fl ows, or fi nancial position. However, to the extent that valid indemnifi cation claims arise in the future, future payments by us could be signifi cant and could have a material adverse eff ect on our results of operations or cash fl ows in a particular period. As of December 31, 2012, we did not have any material indemnifi cation claims that were probable or reasonably possible.
Legal Matters
Antitrust Investigations
In June 2011, we received a Civil Investigative Demand (CID) from the U.S. Federal Trade Commission’s (FTC) Bureau of Competition and a subpoena from the FTC’s Bureau of Consumer Protection relating to a review by the FTC of our business practices, including search and advertising. In June 2012, we also received a CID and a subpoena duces tecum from the FTC’s Bureau of Competition seeking documents and information broadly related to Motorola’s licensing practices for standards-essential patents and use of standards-essential patents in litigation. In January 2013, the FTC closed its investigations into our business practices, including search and advertising. In connection with the closing of the investigation, we have voluntarily agreed to make certain product changes. In addition, we and Motorola have entered into a consent order with the FTC setting forth certain guidelines on our use of standards-essential patents in litigation.
State attorneys general from the states of Texas, Ohio, and Mississippi have issued similar CIDs relating to our business practices. We are cooperating with the state attorneys general and are responding to their information requests on an ongoing basis.
The European Commission’s (EC) Directorate General for Competition has also opened an investigation into various antitrust-related complaints against us. Since February 2010, we have received a number of notifi cations from the EC about antitrust complaints fi led against us. On November 30, 2010, the EC formally opened proceedings against us. We believe we have adequately responded to all of the allegations made against us. We continue to cooperate with the EC and are pursuing a potential resolution that would avoid a fi nding of infringement and a fi ne. The EC has also opened an investigation into Motorola’s licensing practices for standards-essential patents and use of standards-essential patents in litigation on the basis of complaints brought by Microsoft and Apple. We are cooperating with the EC and responding to the information requests on an ongoing basis.
The Comision Nacional de Defensa de la Competencia in Argentina, the Competition Commission of India, and the Korea Fair Trade Commission in South Korea have also opened investigations into certain business practices.
EPA Investigation
In February 2009, we learned of a U.S. Environmental Protection Agency (EPA) investigation into an alleged release of refrigerant at one of our smaller data center facilities, which we acquired from DoubleClick, and the accuracy of related statements and records. We are cooperating with the EPA and have provided documents and other materials.
Patent and Intellectual Property Claims
We have had patent, copyright, and trademark infringement lawsuits fi led against us claiming that certain of our products, services, and technologies, including Android, Google Search, Google AdWords, Google AdSense, Google Books, Google News, Google Image Search, Google Chrome, Google Talk, Google Voice, Motorola devices and YouTube, infringe the intellectual property rights of others. Adverse results in these lawsuits may include awards of substantial monetary damages, costly royalty or licensing agreements, or orders preventing us from off ering certain features, functionalities, products, or services, and may also cause us to change our business practices, and require development of non-infringing products or technologies, which could result in a loss of revenues for us and otherwise harm our business. In addition, the U.S. International Trade Commission (ITC) has increasingly become an important forum to litigate intellectual property disputes because an ultimate loss for a company or its suppliers in an ITC action could result in a prohibition on importing infringing products into the U.S. Since the U.S. is an important market, a prohibition on importation could have an adverse eff ect on us, including preventing us from importing many important products into the U.S. or necessitating workarounds that may limit certain features of our products.
Furthermore, many of our agreements with our customers and partners require us to indemnify them for certain intellectual property infringement claims against them, which would increase our costs as a result of defending such claims, and may require that we pay signifi cant damages if there were an adverse ruling in any such claims. Our customers and partners may discontinue the use of our products, services, and technologies, as a result of injunctions or otherwise, which could result in loss of revenues and adversely impact our business.
In December 2012, we announced that Motorola Mobility had entered into an agreement with Arris Group, Inc. and certain other persons providing for the disposition of Motorola’s Home business for total consideration of approximately $2.35 billion, subject to certain adjustments. Under the agreement, we have agreed to indemnify Arris Group for potential liability from certain intellectual property infringement litigation, including, among others, a patent infringement claim brought by TiVo relating to certain digital video recording equipment sold by Motorola Mobility.
Contents

68 GOOGLE INC. | Form 10-K
PART II ITEM 8. Notes to Consolidated Financial Statements
Other
We are also regularly subject to claims, suits, government investigations, and other proceedings involving competition and antitrust (such as the pending investigations by the FTC and the EC described above), intellectual property, privacy, tax, labor and employment, commercial disputes, content generated by our users, goods and services off ered by advertisers or publishers using our platforms, personal injury, consumer protection, and other matters. Such claims, suits, government investigations, and other proceedings could result in fi nes, civil or criminal penalties, or other adverse consequences.
Certain of our outstanding legal matters include speculative claims for substantial or indeterminate amounts of damages. We record a liability when we believe that it is both probable that a loss has been incurred, and the amount can be reasonably estimated. We evaluate, on a monthly basis, developments in our legal matters that could aff ect the amount of liability that has been previously accrued, and make adjustments as appropriate. Signifi cant judgment is required to determine both likelihood of there being and the estimated amount of a loss related to such matters.
With respect to our outstanding legal matters, based on our current knowledge, we believe that the amount or range of reasonably possible loss will not, either individually or in the aggregate, have a material adverse eff ect on our business, consolidated fi nancial position, results of operations, or cash fl ows. However, the outcome of such legal matters is inherently unpredictable and subject to signifi cant uncertainties.
We expense legal fees in the period in which they are incurred.
Income Taxes
We are under audit by the Internal Revenue Service (IRS) and various other tax authorities. We have reserved for potential adjustments to our provision for income taxes that may result from examinations by, or any negotiated agreements with, these tax authorities, and we believe that the fi nal outcome of these examinations or agreements will not have a material eff ect on our results of operations. If events occur which indicate payment of these amounts is unnecessary, the reversal of the liabilities would result in the recognition of tax benefi ts in the period we determine the liabilities are no longer necessary. If our estimates of the federal, state, and foreign income tax liabilities are less than the ultimate assessment, a further charge to expense would result.
NOTE 12. Stockholders’ Equity
Convertible Preferred Stock
Our board of directors has authorized 100,000,000 shares of convertible preferred stock, $0.001 par value, issuable in series. At December 31, 2011 and 2012, there were no shares issued or outstanding.
Class A and Class B Common Stock
Our board of directors has authorized two classes of common stock, Class A and Class B. At December 31, 2012, there were 9,000,000,000 and 3,000,000,000 shares authorized and there were 267,448,281 and 62,530,474 shares outstanding of Class A and Class B common stock, $0.001 par value. The rights of the holders of Class A and Class B common stock are identical, except with respect to voting. Each share of Class A common stock is entitled to one vote per share. Each share of Class B common stock is entitled to 10 votes per share. Shares of Class B common stock may be converted at any time at the option of the stockholder and automatically convert upon sale or transfer to Class A common stock. We refer to Class A and Class B common stock as common stock throughout the notes to these fi nancial statements, unless otherwise noted.
Stock Dividend
In April 2012, our board of directors approved amendments to our certifi cate of incorporation that would, among other things, create a new class of non-voting capital stock (Class C capital stock). The amendments authorized 3 billion shares of Class C capital stock and also increased the authorized shares of Class A common stock from 6 billion to 9 billion. The amendments are refl ected in our Fourth Amended and Restated Certifi cate of Incorporation (New Charter), the adoption of which was approved by stockholders at our 2012 Annual Meeting of Stockholders held on June 21, 2012. We have announced the intention of our board of directors to consider a distribution of shares of the Class C capital stock as a dividend to our holders of Class A and Class B common stock (Dividend). The Class C capital stock will have no voting rights, except as required by applicable law. Except as expressly provided in the New Charter, shares of Class C capital stock will have the same rights and privileges and rank equally, share ratably and be identical in all other respects to the shares of Class A common stock and Class B common stock as to all matters.
The par value per share of our shares of Class A common stock and Class B common stock will remain unchanged at $0.001 per share after the Dividend. On the eff ective date of the Dividend, there will be a transfer between retained earnings and common stock and the amount transferred will be equal to the $0.001 par value of the Class C capital stock that is issued. We will give retroactive eff ect to prior period share and per share amounts in our consolidated fi nancial statements for the eff ect of the Dividend, such that prior periods are comparable to current period presentation.
Contents

69GOOGLE INC. | Form 10-K
PART II ITEM 8. Notes to Consolidated Financial Statements
Stock Plans
We maintain the 1998 Stock Plan, the 2000 Stock Plan, the 2003 Stock Plan, the 2003 Stock Plan (No. 2), the 2003 Stock Plan (No. 3), the 2004 Stock Plan, and plans assumed through acquisitions, all of which are collectively referred to as the “Stock Plans.” Under our Stock Plans, incentive and non-qualifi ed stock options or rights to purchase common stock may be granted to eligible participants. Options are generally granted for a term of 10 years. Under the Stock Plans, we have also issued RSUs. An RSU award is an agreement to issue shares of our stock at the time the award vests. Except for options granted pursuant to our stock option exchange program completed in March 2009 (the Exchange), options granted and RSUs issued to participants under the Stock Plans generally vest over four years contingent upon employment or service with us on the vesting date.
At December 31, 2011 and December 31, 2012, there were 21,794,492 and 15,833,050 shares of common stock reserved for future issuance under our Stock Plans.
We estimated the fair value of each option award on the date of grant using the BSM option pricing model. Our assumptions about stock-price volatility have been based exclusively on the implied volatilities of publicly traded options to buy our stock with contractual terms closest to the expected life of options granted to our employees. We estimate the expected term based upon the historical exercise behavior of our employees. The risk-free interest rate for periods within the contractual life of the award is based on the U.S. Treasury yield curve in eff ect at the time of grant.
The following table presents the weighted-average assumptions used to estimate the fair values of the stock options granted in the periods presented:
Year Ended December 31,2010 2011 2012
Risk-free interest rate 1.9% 2.3% 1.0%Expected volatility 35% 33% 29%Expected life (in years) 5.4 5.9 5.2 Dividend yield 0 0 0 Weighted-average estimated fair value of options granted during the year $216.43 $210.07 $194.27
The following table summarizes the activities for our options for the year ended December 31, 2012:
Options Outstanding
Numberof Shares
Weighted-Average
Exercise Price
Weighted-Average Remaining Contractual
Term (in years)
Aggregate Intrinsic Value
(in millions)(1)
Balance at December 31, 2011 9,807,252 $357.92 Granted(2) 1,392,191 $580.45 Exercised (2,409,331) $305.81 Forfeited/canceled (238,717) $460.45
Balance at December 31, 2012 8,551,395 $405.98 5.2 $2,516Vested and exercisable as of December 31, 2012 6,023,559 $351.44 4.1 $2,099Vested and exercisable as of December 31, 2012 and expected to vest thereafter(3) 8,218,732 $400.72 5.2 $2,461
(1) The aggregate intrinsic value is calculated as the difference between the exercise price of the underlying awards and the closing stock price of $707.38 of our Class A common stock on December 31, 2012.
(2) Includes options granted in connection with the acquisition of Motorola.(3) Options expected to vest reflect an estimated forfeiture rate.
Contents
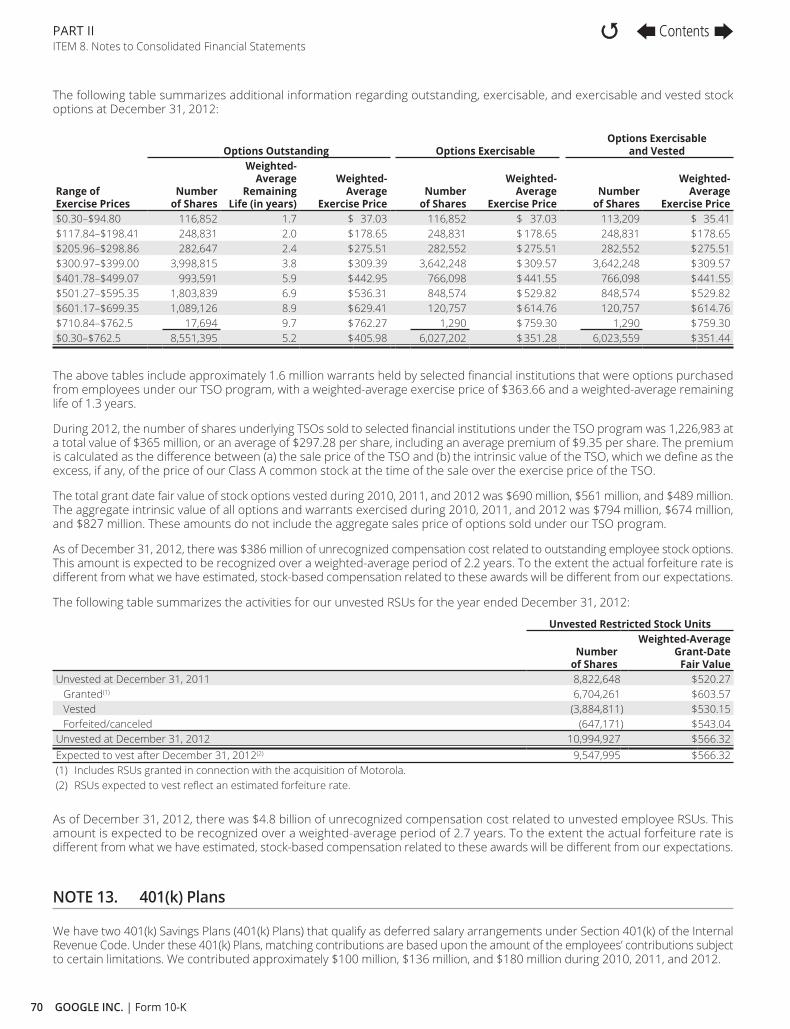
70 GOOGLE INC. | Form 10-K
PART II ITEM 8. Notes to Consolidated Financial Statements
The following table summarizes additional information regarding outstanding, exercisable, and exercisable and vested stock options at December 31, 2012:
Range of Exercise Prices
Options Outstanding Options ExercisableOptions Exercisable
and Vested
Numberof Shares
Weighted-Average
Remaining Life (in years)
Weighted-Average
Exercise PriceNumber
of Shares
Weighted-Average
Exercise PriceNumber
of Shares
Weighted-Average
Exercise Price$0.30–$94.80 116,852 1.7 $ 37.03 116,852 $ 37.03 113,209 $ 35.41$117.84–$198.41 248,831 2.0 $178.65 248,831 $ 178.65 248,831 $178.65$205.96–$298.86 282,647 2.4 $275.51 282,552 $ 275.51 282,552 $275.51$300.97–$399.00 3,998,815 3.8 $309.39 3,642,248 $ 309.57 3,642,248 $309.57$401.78–$499.07 993,591 5.9 $442.95 766,098 $ 441.55 766,098 $441.55$501.27–$595.35 1,803,839 6.9 $536.31 848,574 $ 529.82 848,574 $529.82$601.17–$699.35 1,089,126 8.9 $629.41 120,757 $ 614.76 120,757 $614.76$710.84–$762.5 17,694 9.7 $762.27 1,290 $ 759.30 1,290 $759.30$0.30–$762.5 8,551,395 5.2 $405.98 6,027,202 $ 351.28 6,023,559 $351.44
The above tables include approximately 1.6 million warrants held by selected fi nancial institutions that were options purchased from employees under our TSO program, with a weighted-average exercise price of $363.66 and a weighted-average remaining life of 1.3 years.
During 2012, the number of shares underlying TSOs sold to selected fi nancial institutions under the TSO program was 1,226,983 at a total value of $365 million, or an average of $297.28 per share, including an average premium of $9.35 per share. The premium is calculated as the diff erence between (a) the sale price of the TSO and (b) the intrinsic value of the TSO, which we defi ne as the excess, if any, of the price of our Class A common stock at the time of the sale over the exercise price of the TSO.
The total grant date fair value of stock options vested during 2010, 2011, and 2012 was $690 million, $561 million, and $489 million. The aggregate intrinsic value of all options and warrants exercised during 2010, 2011, and 2012 was $794 million, $674 million, and $827 million. These amounts do not include the aggregate sales price of options sold under our TSO program.
As of December 31, 2012, there was $386 million of unrecognized compensation cost related to outstanding employee stock options. This amount is expected to be recognized over a weighted-average period of 2.2 years. To the extent the actual forfeiture rate is diff erent from what we have estimated, stock-based compensation related to these awards will be diff erent from our expectations.
The following table summarizes the activities for our unvested RSUs for the year ended December 31, 2012:
Unvested Restricted Stock Units
Numberof Shares
Weighted-Average Grant-Date
Fair ValueUnvested at December 31, 2011 8,822,648 $520.27
Granted(1) 6,704,261 $603.57Vested (3,884,811) $530.15Forfeited/canceled (647,171) $543.04
Unvested at December 31, 2012 10,994,927 $566.32Expected to vest after December 31, 2012(2) 9,547,995 $566.32(1) Includes RSUs granted in connection with the acquisition of Motorola.(2) RSUs expected to vest reflect an estimated forfeiture rate.
As of December 31, 2012, there was $4.8 billion of unrecognized compensation cost related to unvested employee RSUs. This amount is expected to be recognized over a weighted-average period of 2.7 years. To the extent the actual forfeiture rate is diff erent from what we have estimated, stock-based compensation related to these awards will be diff erent from our expectations.
NOTE 13. 401(k) Plans
We have two 401(k) Savings Plans (401(k) Plans) that qualify as deferred salary arrangements under Section 401(k) of the Internal Revenue Code. Under these 401(k) Plans, matching contributions are based upon the amount of the employees’ contributions subject to certain limitations. We contributed approximately $100 million, $136 million, and $180 million during 2010, 2011, and 2012.
Contents
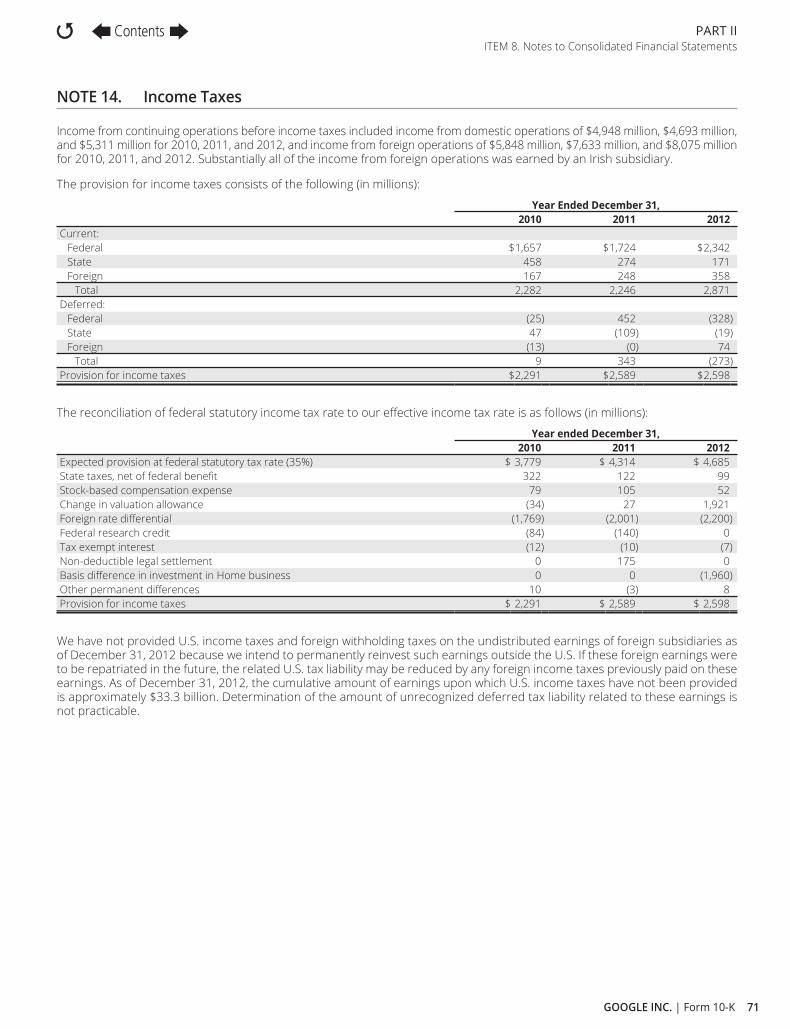
71GOOGLE INC. | Form 10-K
PART II ITEM 8. Notes to Consolidated Financial Statements
NOTE 14. Income Taxes
Income from continuing operations before income taxes included income from domestic operations of $4,948 million, $4,693 million, and $5,311 million for 2010, 2011, and 2012, and income from foreign operations of $5,848 million, $7,633 million, and $8,075 million for 2010, 2011, and 2012. Substantially all of the income from foreign operations was earned by an Irish subsidiary.
The provision for income taxes consists of the following (in millions):
Year Ended December 31,2010 2011 2012
Current: Federal $1,657 $1,724 $2,342 State 458 274 171 Foreign 167 248 358
Total 2,282 2,246 2,871 Deferred:
Federal (25) 452 (328)State 47 (109) (19)Foreign (13) (0) 74
Total 9 343 (273)Provision for income taxes $2,291 $2,589 $2,598
The reconciliation of federal statutory income tax rate to our eff ective income tax rate is as follows (in millions):
Year ended December 31,2010 2011 2012
Expected provision at federal statutory tax rate (35%) $ 3,779 $ 4,314 $ 4,685 State taxes, net of federal benefi t 322 122 99 Stock-based compensation expense 79 105 52 Change in valuation allowance (34) 27 1,921 Foreign rate diff erential (1,769) (2,001) (2,200)Federal research credit (84) (140) 0 Tax exempt interest (12) (10) (7)Non-deductible legal settlement 0 175 0 Basis diff erence in investment in Home business 0 0 (1,960)Other permanent diff erences 10 (3) 8 Provision for income taxes $ 2,291 $ 2,589 $ 2,598
We have not provided U.S. income taxes and foreign withholding taxes on the undistributed earnings of foreign subsidiaries as of December 31, 2012 because we intend to permanently reinvest such earnings outside the U.S. If these foreign earnings were to be repatriated in the future, the related U.S. tax liability may be reduced by any foreign income taxes previously paid on these earnings. As of December 31, 2012, the cumulative amount of earnings upon which U.S. income taxes have not been provided is approximately $33.3 billion. Determination of the amount of unrecognized deferred tax liability related to these earnings is not practicable.
Contents

72 GOOGLE INC. | Form 10-K
PART II ITEM 8. Notes to Consolidated Financial Statements
Deferred Tax Assets
Deferred income taxes refl ect the net eff ects of temporary diff erences between the carrying amounts of assets and liabilities for fi nancial reporting purposes and the amounts used for income tax purposes. Signifi cant components of our deferred tax assets and liabilities are as follows (in millions):
As of December 31,2011 2012
Deferred tax assets: Stock-based compensation expense $ 288 $ 311 State taxes 138 184 Capital loss carryforward 285 236 Settlement with the Authors Guild and AAP 35 28 Vacation accruals 52 67 Deferred rent 43 50 Accruals and reserves not currently deductible 268 688 Acquired net operating losses 156 505 Tax credit 55 274 Basis diff erence in investment in Home business 0 2,043 Other 11 128
Total deferred tax assets 1,331 4,514 Valuation allowance (333) (2,629)Total deferred tax assets net of valuation allowance 998 1,885
Deferred tax liabilities: Depreciation and amortization (479) (761)Identifi ed intangibles (398) (1,496)Unrealized gains on investments and other (90) (105)Other prepaids (70) (118)Other (33) (133)
Total deferred tax liabilities (1,070) (2,613)Net deferred tax liabilities $ (72 ) $ (728 )
As of December 31, 2012, our federal, state and foreign net operating loss carryforwards for income tax purposes were approximately $1,048 million, $333 million and $384 million. If not utilized, the federal net operating loss carryforwards will begin to expire in 2017 and the state net operating loss carryforwards will begin to expire in 2013. The foreign net operating loss can be carried forward indefi nitely, however it is more likely than not that it will not be realized, therefore we have recorded a full valuation allowance. The net operating loss carryforwards are subject to various annual limitations under Section 382 of the Internal Revenue Code and similar limitations under the tax laws of the foreign jurisdictions.
As of December 31, 2012, our California research and development credit carryforwards for income tax purposes were approximately $146 million that can be carried over indefi nitely. We believe it is more likely than not that a portion of the state tax credit will not be realized. Therefore, we have recorded a valuation allowance on the state tax credit carryforward in the amount of $130 million. We will reassess the valuation allowance quarterly and if future evidence allows for a partial or full release of the valuation allowance, a tax benefi t will be recorded accordingly.
As of December 31, 2012, our federal and state capital loss carryforwards for income tax purposes were approximately $483 million and $612 million. We also have deferred tax assets for impairment losses that, if recognized, will be capital in nature. We believe that it is more likely than not that our deferred tax assets for capital losses and impairment losses will not be realized. Therefore, we have recorded a valuation allowance on both our federal and state deferred tax assets for these items in the amount of $205 million. We will reassess the valuation allowance quarterly and if future evidence allows for a partial or full release of the valuation allowance, a tax benefi t will be recorded accordingly.
In December 2012, we entered into an agreement with Arris Group Inc. (Arris) for the disposition of the Motorola Home business. A deferred tax asset was established for the book to tax basis diff erence in our investment in the Motorola Home Business upon signing the agreement. When the disposition event actually occurs in the foreseeable future, some or all of the basis diff erence in the Home business will become a basis diff erence in Google’s investment in Arris. Since any future losses to be recognized upon sale of the Home business or Arris Shares will be capital losses and Google already has an excess capital loss carryforward, a full valuation allowance was recorded against this deferred tax asset. We will reassess the valuation allowance quarterly and if future evidence allows for a partial or full release of the valuation allowance, a tax benefi t will be recorded accordingly.
Contents

73GOOGLE INC. | Form 10-K
PART II ITEM 8. Notes to Consolidated Financial Statements
Uncertain Tax Positions
The following table summarizes the activity related to our gross unrecognized tax benefi ts from January 1, 2010 to December 31, 2012 (in millions):
Balance as of January 1, 2010 $1,188Increases related to prior year tax positions 37 Decreases related to prior year tax positions (197)Decreases related to settlement with tax authorities (47)Decreases as a result of a lapse of applicable statute of limitation (97)Increases related to current year tax positions 256 Balance as of December 31, 2010 1,140 Increases related to prior year tax positions 77 Decreases related to prior year tax positions (9)Increases related to current year tax positions 361 Decreases related to settlement with tax authorities (5)Balance as of December 31, 2011 1,564 Increases related to prior year tax positions 43 Decreases related to prior year tax positions (40)Decreases related to settlement with tax authorities (62)Increases related to acquisition 17 Increases related to current year tax positions 411 Balance as of December 31, 2012 $1,933
Our total unrecognized tax benefi ts that, if recognized, would aff ect our eff ective tax rate were $951 million, $1,350 million, and $1,749 million as of December 31, 2010, 2011, and 2012.
As of December 31, 2011 and 2012, we had accrued $129 million and $139 million for payment of interest and penalties. Interest and penalties included in our provision for income taxes were not material in all the periods presented.
We and our subsidiaries are routinely examined by various taxing authorities. Although we fi le U.S. federal, U.S. state, and foreign tax returns, our two major tax jurisdictions are the U.S. and Ireland. During the three months ended December 31, 2007, the IRS completed its examination of our 2003 and 2004 tax years. We have fi led an appeal with the IRS for certain issues related to this audit and settlements were reached in 2012 on all but one issue which we plan to litigate in court. As a result we released the related reserves in the three month ended December 31, 2012. The IRS is currently in examination of our 2007, 2008, and 2009 tax years. We expect the examination to be completed within the next 12 months, but we do not anticipate any signifi cant impact to our unrecognized tax benefi t balance as of December 31, 2012, related to our 2007, 2008, and 2009 tax years.
Our 2010, 2011 and 2012 tax years remain subject to examination by the IRS for U.S. federal tax purposes, and our 2006 through 2012 tax years remain subject to examination by the appropriate governmental agencies for Irish tax purposes. There are various other ongoing audits in various other jurisdictions that are not material to our fi nancial statements.
Contents

74 GOOGLE INC. | Form 10-K
PART II ITEM 8. Notes to Consolidated Financial Statements
NOTE 15. Information about Segments and Geographic Areas
Prior to the second quarter of 2012, our chief operating decision makers (i.e., the chief executive offi cer and his direct reports) reviewed fi nancial information presented on a consolidated basis, accompanied by disaggregated information about revenues by geographic region for purposes of allocating resources and evaluating fi nancial performance. As a result of our Motorola acquisition in the second quarter of 2012, our chief operating decision makers review fi nancial information for the following three operating segments:
• Google—includes our advertising and other non-advertising businesses
• Mobile—includes our mobile devices business acquired from Motorola
• Home—includes our digital set-top box business acquired from Motorola
In December 2012, as a result of an agreement for the disposition of the Home segment, the Home segment is presented as discontinued operations and therefore is not included in the segment report.
Our chief operating decision makers do not evaluate operating segments using asset information.
The following table sets forth revenues and operating income (loss) by operating segment (in millions):
Year Ended December 31,2010 2011 2012
Google: Revenues $29,321 $37,905 $ 46,039 Income from operations 11,757 14,216 16,308
Mobile: Revenues 0 0 4,136 Loss from operations 0 0 (393)
A reconciliation of the total segment income from operations to the consolidated income from operations is as follows (in millions):
Year Ended December 31,2010 2011 2012
Total segment income from operations $11,757 $14,216 $15,915 Unallocated items (1,376) (2,474) (3,155)
Consolidated income from operations $10,381 $11,742 $12,760
Unallocated items, including stock-based compensation expense, restructuring and other charges related to our Mobile segment, and a charge related to the resolution of a Department of Justice investigation, are not allocated to each segment because we do not include this information in our measurement of the performance of our operating segments.
Revenues by geography are based on the billing addresses of our customers for the Google segment and the ship-to-addresses of our customers for the Mobile segment. The following tables set forth revenues and long-lived assets by geographic area (in millions):
Year Ended December 31,2010 2011 2012
Revenues: United States $14,056 $17,560 $23,502United Kingdom 3,329 4,057 4,872Rest of the world 11,936 16,288 21,801
Total revenues $29,321 $37,905 $50,175
As of December 31,2011 2012
Long-lived assets(1) : United States $15,963 $20,985International 3,853 12,359
Total long-lived assets $19,816 $33,344(1) Includes Home segment.
Contents

75GOOGLE INC. | Form 10-K
PART II ITEM 9. Changes i n and Disagreements With Accountants on Accounting and Financial Disclosure
ITEM 9. Changes i n and Disagreements With Accountants on Accounting and Financial Disclosure
None.
ITEM 9A. Controls and Procedures
Evaluation of Disclosure Controls and Procedures
Our management, with the participation of our chief executive offi cer and chief fi nancial offi cer, evaluated the eff ectiveness of our disclosure controls and procedures pursuant to Rule 13a-15 under the Exchange Act, as of the end of the period covered by this Annual Report on Form 10-K.
Based on this evaluation, our chief executive offi cer and chief fi nancial offi cer concluded that, as of December 31, 2012, our disclosure controls and procedures are designed at a reasonable assurance level and are eff ective to provide reasonable assurance that information we are required to disclose in reports that we fi le or submit under the Exchange Act is recorded, processed, summarized, and reported within the time periods specifi ed in the SEC’s rules and forms, and that such information is accumulated and communicated to our management, including our chief executive offi cer and chief fi nancial offi cer, as appropriate, to allow timely decisions regarding required disclosure.
Changes in Internal Control over Financial Reporting
There were no changes in our internal control over fi nancial reporting that occurred during the quarter ended December 31, 2012 that have materially aff ected, or are reasonably likely to materially aff ect, our internal control over fi nancial reporting.
Management’s Report on Internal Control over Financial Reporting
Our management is responsible for establishing and maintaining adequate internal control over fi nancial reporting, as defi ned in Rule 13a-15(f) of the Exchange Act. Our management conducted an evaluation of the eff ectiveness of our internal control over fi nancial reporting based on the framework in Internal Control—Integrated Framework issued by the Committee of Sponsoring Organizations of the Treadway Commission. Based on this evaluation, management concluded that our internal control over fi nancial reporting was eff ective as of December 31, 2012. Management reviewed the results of its assessment with our Audit Committee. The eff ectiveness of our internal control over fi nancial reporting as of December 31, 2012 has been audited by Ernst & Young LLP, an independent registered public accounting fi rm, as stated in its report which is included in Item 8 of this Annual Report on Form 10-K.
Limitations on Eff ectiveness of Controls and Procedures
In designing and evaluating the disclosure controls and procedures, management recognizes that any controls and procedures, no matter how well designed and operated, can provide only reasonable assurance of achieving the desired control objectives. In addition, the design of disclosure controls and procedures must refl ect the fact that there are resource constraints and that management is required to apply its judgment in evaluating the benefi ts of possible controls and procedures relative to their costs.
ITEM 9B. Other InformationNone.
Contents
76 GOOGLE INC. | Form 10-K
PART III ITEM 10. Directors, Executive Offi cers and Corporate Governance
PART III
ITEM 10. Directors, Executive Offi cers and Corporate GovernanceThe information required by this item will be included under the caption “Directors, Executive Offi cers and Corporate Governance” in our Proxy Statement for the 2013 Annual Meeting of Stockholders to be fi led with the SEC within 120 days of the fi scal year ended December 31, 2012 (2013 Proxy Statement) and is incorporated herein by reference. The information required by this item regarding delinquent fi lers pursuant to Item 405 of Regulation S-K will be included under the caption “Section 16(a) Benefi cial Ownership Reporting Compliance” in the 2013 Proxy Statement and is incorporated herein by reference.
ITEM 11. Executive CompensationThe information required by this item will be included under the captions “Director Compensation,” “Executive Compensation” and “Directors, Executive Offi cers and Corporate Governance—Corporate Governance and Board Matters—Compensation Committee Interlocks and Insider Participation” in the 2013 Proxy Statement and is incorporated herein by reference.
ITEM 12. Security Ownership of Certain Benefi cial Owners and Management and Related Stockholder Matters
The information required by this item will be included under the captions “Common Stock Ownership of Certain Benefi cial Owners and Management” and “Equity Compensation Plan Information” in the 2013 Proxy Statement and is incorporated herein by reference.
ITEM 13. Certain Relationships and Related Transactions, and Director Independence
The information required by this item will be included under the captions “Certain Relationships and Related Transactions” and “Directors, Executive Offi cers and Corporate Governance—Corporate Governance and Board Matters—Director Independence” in the 2013 Proxy Statement and is incorporated herein by reference.
ITEM 14. Principal Accounting Fees and ServicesThe information required by this item will be included under the caption “Independent Registered Public Accounting Firm” in the 2013 Proxy Statement and is incorporated herein by reference.
PART III ITEM 10. Directors, Executive Offi cers and Corporate Governance
Contents
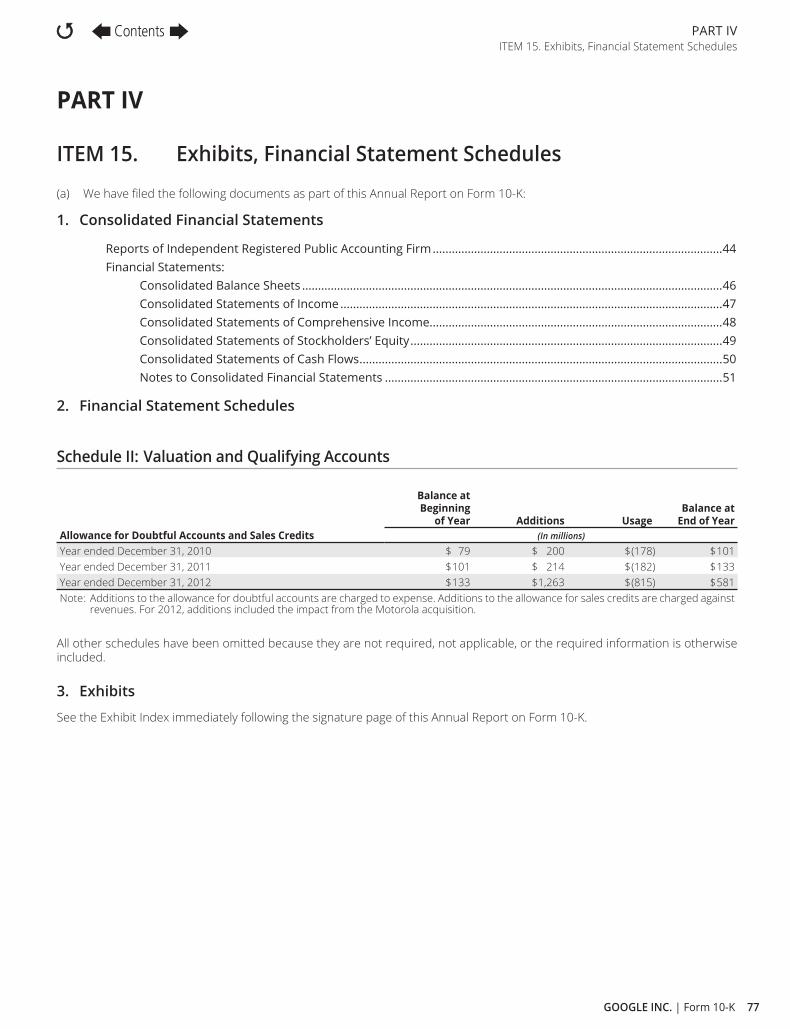
77GOOGLE INC. | Form 10-K
PART IV ITEM 15. Exhibits, Financial Statement Schedules
PART IV
ITEM 15. Exhibits, Financial Statement Schedules
(a) We have fi led the following documents as part of this Annual Report on Form 10-K:
1. Consolidated Financial Statements
Reports of Independent Registered Public Accounting Firm ...........................................................................................44Financial Statements:
Consolidated Balance Sheets ....................................................................................................................................46Consolidated Statements of Income ........................................................................................................................47Consolidated Statements of Comprehensive Income............................................................................................48Consolidated Statements of Stockholders’ Equity ..................................................................................................49Consolidated Statements of Cash Flows ..................................................................................................................50Notes to Consolidated Financial Statements ..........................................................................................................51
2. Financial Statement Schedules
Schedule II: Valuation and Qualifying Accounts
Allowance for Doubtful Accounts and Sales Credits
Balance at Beginning
of Year Additions UsageBalance at
End of Year(In millions)
Year ended December 31, 2010 $ 79 $ 200 $(178) $101Year ended December 31, 2011 $101 $ 214 $(182) $133Year ended December 31, 2012 $133 $1,263 $(815) $581Note: Additions to the allowance for doubtful accounts are charged to expense. Additions to the allowance for sales credits are charged against
revenues. For 2012, additions included the impact from the Motorola acquisition.
All other schedules have been omitted because they are not required, not applicable, or the required information is otherwise included.
3. Exhibits
See the Exhibit Index immediately following the signature page of this Annual Report on Form 10-K.
PART IV ITEM 15. Exhibits, Financial Statement Schedules
Contents

78 GOOGLE INC. | Form 10-K
Signatures and Power o f Attorney
Signatures
Pursuant to the requirements of Section 13 or 15(d) of the Securities Exchange Act of 1934, the registrant has duly caused this Annual Report on Form 10-K to be signed on its behalf by the undersigned, thereunto duly authorized.
Date: January 29, 2013
GOOGLE INC.By: /s/ LARRY PAGE Larry Page Chief Executive Offi cer
Power o f Attorney
KNOW ALL PERSONS BY THESE PRESENTS, that each person whose signature appears below constitutes and appoints Larry Page and Patrick Pichette, jointly and severally, his or her attorney-in-fact, with the power of substitution, for him or her in any and all capacities, to sign any amendments to this Annual Report on Form 10-K and to fi le the same, with exhibits thereto and other documents in connection therewith, with the Securities and Exchange Commission, hereby ratifying and confi rming all that each of said attorneys-in-fact, or his or her substitute or substitutes, may do or cause to be done by virtue hereof.
Pursuant to the requirements of the Securities Exchange Act of 1934, this Annual Report on Form 10-K has been signed below by the following persons on behalf of the registrant and in the capacities and on the dates indicated.
Signature Title Date
/s/ LARRY PAGE Chief Executive Offi cer, Co-Founder and Director (Principal Executive Offi cer) January 29, 2013Larry Page
/s/ PATRICK PICHETTE Senior Vice President and Chief Financial Offi cer (Principal Financial and Accounting Offi cer) January 29, 2013Patrick Pichette
/s/ ERIC E. SCHMIDT Executive Chairman January 29, 2013Eric E. Schmidt
/s/ SERGEY BRIN Co-Founder and Director January 29, 2013Sergey Brin
/s/ L. JOHN DOERR Director January 29, 2013L. John Doerr
/s/ DIANE B. GREENE Director January 29, 2013Diane B. Greene
/s/ JOHN L. HENNESSY Director January 29, 2013John L. Hennessy
/s/ ANN MATHER Director January 29, 2013Ann Mather
/s/ PAUL S. OTELLINI Director January 29, 2013Paul S. Otellini
/s/ K. RAM SHRIRAM Director January 29, 2013K. Ram Shriram
/s/ SHIRLEY M. TILGHMAN Director January 29, 2013Shirley M. Tilghman
Contents

79GOOGLE INC. | Form 10-K
Exhibit Index
Exhibit Index
Exhibit Number Description
Incorporated by reference hereinForm Date
1.01 Form of Distribution Agreement, dated April 20, 2007, among Google Inc., Morgan Stanley & Co. Incorporated, Citigroup Global Markets Inc., Credit Suisse Securities (USA) LLC and UBS Securities LLC (Distribution Agreement)
Current Report on Form 8-K (File No. 000-50726)
April 23, 2007
1.01.1 Amendment No. 1 to the Distribution Agreement among Google Inc. and J.P. Morgan Securities Inc. entered into as of July 20, 2007
Quarterly Report on Form 10-Q (File No. 000-50726)
August 9, 2007
1.01.2 Amendment Agreement, dated as of July 12, 2011, among Google Inc., Morgan Stanley & Co. LLC, Citigroup Global Markets Inc., Credit Suisse Management LLC, Credit Suisse Securities (USA) LLC, UBS AG, London Branch, and UBS Securities LLC
Current Report on Form 8-K (File No. 000-50726)
July 12, 2011
1.02 Form of Bidding Rules Agreement, dated April 20, 2007, among Google Inc., Morgan Stanley & Co. Incorporated, as Auction Manager and Bidder, Citigroup Global Markets Inc. as Warrant Agent and Bidder and Credit Suisse Securities (USA) LLC and UBS Securities LLC, as Bidders (Bidding Rules Agreement)
Current Report on Form 8-K (File No. 000-50726)
April 23, 2007
1.02.1 Amendment No. 1 to the Bidding Rules Agreement among Google Inc. and J.P. Morgan Securities Inc., as Bidder entered into as of July 20, 2007
Quarterly Report on Form 10-Q (File No. 000-50726)
August 9, 2007
2.01 Agreement and Plan of Merger, by and among Google Inc., RB98 Inc., and Motorola Mobility Holdings, Inc., dated as of August 15, 2011
Current Report on Form 8-K (File No. 000-50726)
August 18, 2011
3.01 Fourth Amended and Restated Certifi cate of Incorporation of Registrant
Quarterly Report on Form 10-Q (File No. 000-50726)
July 24, 2012
3.02 Amended and Restated Bylaws of Registrant Quarterly Report on Form 10-Q (File No. 000-50726)
July 24, 2012
4.01 Specimen Class A Common Stock certifi cate Registration Statement on Form S-1, as amended (File No. 333-114984)
August 18, 2004
4.02 Form of Warrant Agreement, dated April 20, 2007, among Google Inc., Citigroup Global Markets Inc. as Warrant Agent, and Morgan Stanley & Co. Incorporated, Citigroup Global Markets Inc., Credit Suisse Management LLC, and UBS AG, London Branch, as Warrantholders (Warrant Agreement)
Current Report on Form 8-K (File No. 000-50726)
April 23, 2007
4.02.1 Amendment No. 1 to the Warrant Agreement among Google Inc. and J.P. Morgan Securities Inc., as Warrantholder entered into as of July 20, 2007
Quarterly Report on Form 10-Q (File No. 000-50726)
August 9, 2007
4.03 Indenture, dated as of May 19, 2011 between Google Inc.and The Bank of New York Mellon Trust Company, N.A., as trustee
Current Report on Form 8-K (File No. 000-50726)
May 19, 2011
4.04 Form of 1.250% Note due 2014 Current Report on Form 8-K (File No. 000-50726)
May 19, 2011
4.05 Form of 2.125% Note due 2016 Current Report on Form 8-K (File No. 000-50726)
May 19, 2011
4.06 Form of 3.625% Note due 2021 Current Report on Form 8-K (File No. 000-50726)
May 19, 2011
4.07 ♥ Deferred Compensation Plan Registration Statement on Form S-8 (File No. 333-175180)
June 28, 2011
4.07.1 ♥ Amendment No. 1 to the Deferred Compensation Plan Annual Report on Form 10-K (File No. 000-50726)
January 26, 2012
10.01 Form of Indemnifi cation Agreement entered into between Registrant, its affi liates and its directors and offi cers
Registration Statement on Form S-1, as amended (File No. 333-114984)
July 12, 2004
10.02 ♥ Google Executive Bonus Plan Current Report on Form 8-K (File No. 000-50726)
March 28, 2007
10.03 ♥ Letter Agreement, dated August 16, 2005, between Shirley M. Tilghman and Google Inc.
Current Report on Form 8-K (File No. 000-50726)
October 6, 2005
10.04 ♥ Off er Letter, dated June 6, 2008, between Patrick Pichette and Google Inc.
Current Report on Form 8-K (File No. 00050726)
June 25, 2008
10.05 ♥ Letter Agreement dated January 11, 2012, between Diane B. Greene and Google Inc.
Current Report on Form 8-K (File No. 00050726)
January 12, 2012
Contents

80 GOOGLE INC. | Form 10-K
Exhibit Index
Exhibit Number Description
Incorporated by reference hereinForm Date
10.06 ♥ Agreement dated April 27, 2012, between Nikesh Arora and Google Inc.
Current Report on Form 8-K (File No. 00050726)
April 30, 2012
10.07 ♥ 1998 Stock Plan, as amended Quarterly Report on Form 10-Q (File No. 000-50726)
August 9, 2006
10.07.1 ♥ 1998 Stock Plan—Form of stock option agreement Registration Statement on Form S-1, as amended (File No. 333-114984)
April 29, 2004
10.08 ♥ 2000 Stock Plan, as amended Quarterly Report on Form 10-Q (File No. 000-50726)
August 9, 2006
10.08.1 ♥ 2000 Stock Plan—Form of stock option agreement Registration Statement on Form S-1, as amended (File No. 333-114984)
April 29, 2004
10.09 ♥ 2003 Stock Plan, as amended Quarterly Report on Form 10-Q (File No. 000-50726)
May 10, 2007
10.09.1 ♥ 2003 Stock Plan—Form of stock option agreement Registration Statement on Form S-1, as amended (File No. 333-114984)
April 29, 2004
10.10 ♥ 2003 Stock Plan (No. 2), as amended Quarterly Report on Form 10-Q (File No. 000-50726)
May 10, 2007
10.10.1 ♥ 2003 Stock Plan (No. 2)—Form of stock option agreement Registration Statement on Form S-1, as amended (File No. 333-114984)
April 29, 2004
10.11 ♥ 2003 Stock Plan (No. 3), as amended Quarterly Report on Form 10-Q (File No. 000-50726)
May 10, 2007
10.11.1 ♥ 2003 Stock Plan (No. 3)—Form of stock option agreement Registration Statement on Form S-1, as amended (File No. 333-114984)
April 29, 2004
10.12 ♥ 2004 Stock Plan, as amended Current Report on Form 8-K (File No. 000-50726)
June 7, 2011
10.12.1 ♥ 2004 Stock Plan—Form of stock option agreement Annual Report on Form 10-K (File No. 000-50726)
March 30, 2005
10.12.2 ♥ 2004 Stock Plan—Form of restricted stock unit agreement Annual Report on Form 10-K (File No. 000-50726)
March 30, 2005
10.12.3 ♥ 2004 Stock Plan—Amendment to stock option agreements Registration Statement on Form S-3 (File No. 333-142243)
April 20, 2007
10.12.4 ♥ 2004 Stock Plan—Form of stock option agreement (TSO Program) Registration Statement on Form S-3 (File No. 333-142243)
April 20, 2007
10.13 ♥ Google Inc. 2012 Stock Plan Current Report on Form 8-K (File No. 333-00050726)
June 26, 2012
10.14 ♥ Google Inc. 2012 Incentive Compensation Plan for Employees and Consultants of Motorola Mobility
Current Report on Form 8-K (File No. 333-00050726)
June 26, 2012
10.15 ♥ Motorola Mobility Holdings, Inc. 2011 Incentive Compensation Plan Registration Statement on Form S-8 (File No. 333-181661)
May 24, 2012
10.16 ♥ AdMob, Inc. 2006 Stock Plan and UK Sub-Plan of the AdMob, Inc. 2006 Stock Plan
Registration Statement on Form S-8 fi led (File No. 333-167411)
June 9, 2010
10.17 ♥ Applied Semantics, Inc. 1999 Stock Option/Stock Issuance Plan, as amended
Quarterly Report on Form 10-Q (File No. 000-50726)
August 9, 2006
10.18 ♥ Click Holding Corp. 2005 Stock Incentive Plan Registration Statement on Form S-8 (File No. 333-149956)
March 28, 2008
10.19 ♥ Keyhole, Inc. 2000 Equity Incentive Plan, as amended Quarterly Report on Form 10-Q (File No. 000-50726)
August 9, 2006
10.20 ♥ Picasa, Inc. Employee Bonus Plan Registration Statement on Form S-8 (File No. 333-119378)
September 29, 2004
10.21 ♥ YouTube, Inc. 2005 Stock Plan Registration Statement on Form S-8 (File No. 333-138848)
November 20, 2006
10.22 Letter from Google Inc. to U.S. FTC Current Report on Form 8-K (File No. 000-50726)
January 3, 2013
10.23 Agreement containing consent order regarding Motorola Mobility LLC and Google Inc.
Current Report on Form 8-K (File No. 000-50726)
January 3, 2013
12 * Computation of Earnings to Fixed Charge Ratios 21.01 * Subsidiaries of the Registrant 23.01 * Consent of Independent Registered Public Accounting Firm
Contents
81GOOGLE INC. | Form 10-K
Exhibit Index
Exhibit Number Description
Incorporated by reference hereinForm Date
24.01 * Power of Attorney (incorporated by reference to the signature page of this Annual Report on Form 10-K)
31.01 * Certifi cation of Chief Executive Offi cer pursuant to Exchange Act Rules 13a-14(a) and 15d-14(a), as adopted pursuant to Section 302 of the Sarbanes-Oxley Act of 2002
31.02 * Certifi cation of Chief Financial Offi cer pursuant to Exchange Act Rules 13a-14(a) and 15d-14(a), as adopted pursuant to Section 302 of the Sarbanes-Oxley Act of 2002
32.01 ‡ Certifi cations of Chief Executive Offi cer and Chief Financial Offi cer pursuant to 18 U.S.C. Section 1350, as adopted pursuant to Section 906 of the Sarbanes-Oxley Act of 2002
101.INS XBRL Instance Document 101.SCH XBRL Taxonomy Extension Schema Document 101.CAL XBRL Taxonomy Extension Calculation Linkbase Document 101.DEF XBRL Taxonomy Extension Defi nition Linkbase Document 101.LAB XBRL Taxonomy Extension Label Linkbase Document 101.PRE XBRL Taxonomy Extension Presentation Linkbase Document ♥ Indicates management compensatory plan, contract, or arrangement.* Filed herewith.‡ Furnished herewith.
Contents
82 GOOGLE INC. | Form 10-K
EXHIBIT 31.01 CERTIFICATION OF CHIEF EXECUTIVE OFFICER PURSUANT TO EXCHANGE ACT RULES 13a-14(a) AND 15d-14(a), AS ADOPTED PURSUANT TO SECTION 302 OF THE SARBANES-OXLEY ACT OF 2002
I, Larry Page, certify that:
1. I have reviewed this Annual Report on Form 10-K of Google Inc.;
2. Based on my knowledge, this report does not contain any untrue statement of a material fact or omit to state a material fact necessary to make the statements made, in light of the circumstances under which such statements were made, not misleading with respect to the period covered by this report;
3. Based on my knowledge, the fi nancial statements, and other fi nancial information included in this report, fairly present in all material respects the fi nancial condition, results of operations and cash fl ows of the registrant as of, and for, the periods presented in this report;
4. The registrant’s other certifying offi cer and I are responsible for establishing and maintaining disclosure controls and procedures (as defi ned in Exchange Act Rules 13a-15(e) and 15d-15(e)) and internal control over fi nancial reporting (as defi ned in Exchange Act Rules 13a-15(f) and 15d-15(f)) for the registrant and have:
(a) Designed such disclosure controls and procedures, or caused such disclosure controls and procedures to be designed under our supervision, to ensure that material information relating to the registrant, including its consolidated subsidiaries, is made known to us by others within those entities, particularly during the period in which this report is being prepared;
(b) Designed such internal control over fi nancial reporting, or caused such internal control over fi nancial reporting to be designed under our supervision, to provide reasonable assurance regarding the reliability of fi nancial reporting and the preparation of fi nancial statements for external purposes in accordance with generally accepted accounting principles;
(c) Evaluated the eff ectiveness of the registrant’s disclosure controls and procedures and presented in this report our conclusions about the eff ectiveness of the disclosure controls and procedures, as of the end of the period covered by this report based on such evaluation; and
(d) Disclosed in this report any change in the registrant’s internal control over fi nancial reporting that occurred during the registrant’s most recent fi scal quarter (the registrant’s fourth fi scal quarter in the case of an annual report) that has materially aff ected, or is reasonably likely to materially aff ect, the registrant’s internal control over fi nancial reporting; and
5. The registrant’s other certifying offi cer and I have disclosed, based on our most recent evaluation of internal control over fi nancial reporting, to the registrant’s auditors and the audit committee of the registrant’s board of directors (or persons performing the equivalent functions):
(a) All signifi cant defi ciencies and material weaknesses in the design or operation of internal control over fi nancial reporting which are reasonably likely to adversely aff ect the registrant’s ability to record, process, summarize and report fi nancial information; and
(b) Any fraud, whether or not material, that involves management or other employees who have a signifi cant role in the registrant’s internal control over fi nancial reporting.
Date: January 29, 2013
/s/ LARRY PAGELarry Page
Chief Executive Offi cer(Principal Executive Offi cer)
Contents
83GOOGLE INC. | Form 10-K
EXHIBIT 31.02 CERTIFICATION OF CHIEF FINANCIAL OFFICER PURSUANT TO EXCHANGE ACT RULES 13a-14(a) AND 15d-14(a), AS ADOPTED PURSUANT TO SECTION 302 OF THE SARBANES-OXLEY ACT OF 2002
I, Patrick Pichette, certify that:
1. I have reviewed this Annual Report on Form 10-K of Google Inc.;
2. Based on my knowledge, this report does not contain any untrue statement of a material fact or omit to state a material fact necessary to make the statements made, in light of the circumstances under which such statements were made, not misleading with respect to the period covered by this report;
3. Based on my knowledge, the fi nancial statements, and other fi nancial information included in this report, fairly present in all material respects the fi nancial condition, results of operations and cash fl ows of the registrant as of, and for, the periods presented in this report;
4. The registrant’s other certifying offi cer and I are responsible for establishing and maintaining disclosure controls and procedures (as defi ned in Exchange Act Rules 13a-15(e) and 15d-15(e)) and internal control over fi nancial reporting (as defi ned in Exchange Act Rules 13a-15(f) and 15d-15(f)) for the registrant and have:
(a) Designed such disclosure controls and procedures, or caused such disclosure controls and procedures to be designed under our supervision, to ensure that material information relating to the registrant, including its consolidated subsidiaries, is made known to us by others within those entities, particularly during the period in which this report is being prepared;
(b) Designed such internal control over fi nancial reporting, or caused such internal control over fi nancial reporting to be designed under our supervision, to provide reasonable assurance regarding the reliability of fi nancial reporting and the preparation of fi nancial statements for external purposes in accordance with generally accepted accounting principles;
(c) Evaluated the eff ectiveness of the registrant’s disclosure controls and procedures and presented in this report our conclusions about the eff ectiveness of the disclosure controls and procedures, as of the end of the period covered by this report based on such evaluation; and
(d) Disclosed in this report any change in the registrant’s internal control over fi nancial reporting that occurred during the registrant’s most recent fi scal quarter (the registrant’s fourth fi scal quarter in the case of an annual report) that has materially aff ected, or is reasonably likely to materially aff ect, the registrant’s internal control over fi nancial reporting; and
5. The registrant’s other certifying offi cer and I have disclosed, based on our most recent evaluation of internal control over fi nancial reporting, to the registrant’s auditors and the audit committee of the registrant’s board of directors (or persons performing the equivalent functions):
(a) All signifi cant defi ciencies and material weaknesses in the design or operation of internal control over fi nancial reporting which are reasonably likely to adversely aff ect the registrant’s ability to record, process, summarize and report fi nancial information; and
(b) Any fraud, whether or not material, that involves management or other employees who have a signifi cant role in the registrant’s internal control over fi nancial reporting.
Date: January 29, 2013
/s/ PATRICK PICHETTEPatrick Pichette
Senior Vice President and Chief Financial Offi cer
(Principal Financial Offi cer)
Contents

84 GOOGLE INC. | Form 10-K
EXHIBIT 32.01 CERTIFICATIONS OF CHIEF EXECUTIVE OFFICER AND CHIEF FINANCIAL OFFICER PURSUANT TO 18 U.S.C. SECTION 1350, AS ADOPTED PURSUANT TO SECTION 906 OF THE SARBANES-OXLEY ACT OF 2002
I, Larry Page, certify pursuant to 18 U.S.C. Section 1350, as adopted pursuant to Section 906 of the Sarbanes-Oxley Act of 2002, that the Annual Report on Form 10-K of Google Inc. for the fi scal year ended December 31, 2012, fully complies with the requirements of Section 13(a) or 15(d) of the Securities Exchange Act of 1934 and that information contained in such Annual Report on Form 10-K fairly presents, in all material respects, the fi nancial condition and results of operations of Google Inc.
Date: January 29, 2013
By: /s/ LARRY PAGEName: Larry PageTitle: Chief Executive Offi cer
(Principal Executive Offi cer)
I, Patrick Pichette, certify pursuant to 18 U.S.C. Section 1350, as adopted pursuant to Section 906 of the Sarbanes-Oxley Act of 2002, that the Annual Report on Form 10-K of Google Inc. for the fi scal year ended December 31, 2012, fully complies with the requirements of Section 13(a) or 15(d) of the Securities Exchange Act of 1934 and that information contained in such Annual Report on Form 10-K fairly presents, in all material respects, the fi nancial condition and results of operations of Google Inc.
Date: January 29, 2013
By: /s/ PATRICK PICHETTEName: Patrick PichetteTitle: Senior Vice President
and Chief Financial Offi cer(Principal Financial Offi cer)
The foregoing certifi cations are not deemed fi led with the Securities and Exchange Commission for purposes of Section 18 of the Securities Exchange Act of 1934, as amended (Exchange Act), and are not to be incorporated by reference into any fi ling of Google Inc. under the Securities Act of 1933, as amended, or the Exchange Act, whether made before or after the date hereof, regardless of any general incorporation language in such fi ling.
Contents

DIRECTORS AND OFFICERSAS OF APRIL 2013
Directors
Larry Page
Chief Executive Offi cer and Co-FounderGoogle Inc.
Eric E. Schmidt
Executive Chairman of theBoard of DirectorsGoogle Inc.
Sergey Brin
Co-FounderGoogle Inc.
L. John Doerr
General PartnerKleiner Perkins Caufi eld & Byers
Diane B. Greene
Former Chief Executive Offi cerand PresidentVMware, Inc.
John L. Hennessy
PresidentStanford University
Ann Mather
Former Chief Financial Offi cerPixar
Paul S. Otellini
Chief Executive Offi cer and PresidentIntel Corporation
K. Ram Shriram
Managing PartnerSherpalo Ventures
Shirley M. Tilghman
PresidentPrinceton University
Executive Offi cers
Larry Page
Chief Executive Offi cer and Co-Founder
Eric E. Schmidt
Executive Chairman of theBoard of Directors
Sergey Brin
Co-Founder
Nikesh Arora
Senior Vice President andChief Business Offi cer
David C. Drummond
Senior Vice President, Corporate Development,Chief Legal Offi cer, and Secretary
Patrick Pichette
Senior Vice President andChief Financial Offi cer
STOCKHOLDER INFORMATION
For further information about Google,
contact:
Investor RelationsGoogle Inc.
1600 Amphitheatre Parkway
Mountain View, California 94043
You may also reach us by visiting the
investor relations portion of our website at:
http://investor.google.com
If you wish to receive stockholder
information online, you can register at:
http://investor.google.com/notify.html
Google’s stock trades on the NASDAQ
Global Select Market under the ticker
symbol “GOOG”.
Transfer Agent and RegistrarComputershare Trust Company, N.A.
P.O. Box 43078
Providence, Rhode Island 02940
(866) 298-8535
(781) 575-2879
http://www.computershare.com
Independent Registered PublicAccounting FirmErnst & Young LLP