2012 Annual Report - Investor relations
104
2012 Annual Notice of 2013 Annual Meeting & Proxy Statement Report
-
Upload
khangminh22 -
Category
Documents
-
view
0 -
download
0
Transcript of 2012 Annual Report - Investor relations

2012 AnnualNotice of 2013 Annual Meeting & Proxy Statement
244816_TI_AR_CVR_R3.indd 1 2/21/13 9:12 AM
Report

To our shareholders
We performed well in 2012, despite strong headwinds from a weak and uncertain economy. It was also the year we completed our strategic journey to make Texas Instruments an Analog and Embedded Processing company.
In 2012, 70 percent of our revenue came from Analog and Embedded Processing; just five years ago, less than half our revenue originated here. With no major impediments diverting our resources and energies, this trajectory should continue in the years ahead, and with it, the benefits that accrue to TI and its shareholders.
Analog and Embedded Processing share some characteristics that make our business model one that generates sustainably high cash flows against a backdrop of growth and stability. Both are large markets with lots of players, none of which is dominant. This translates into ample opportunity to grow and gain share. Both serve a broad customer base that numbers in the tens of thousands with target-rich opportunities across a range of applications. This means we can participate in the most exciting opportunities without becoming overly dependent on any single one. Both have product life cycles typically measured in years, if not decades, which boost returns on investment and enable a stable base of revenue. And, both have low capital requirements because their manufacturing equipment and process technologies are long lived.
Manufacturing is a big part of what allows Analog and Embedded Processing to generate high financial returns. The associated manufacturing process technologies allow our designers to create innovative chips that are highly differentiated, but the factories themselves last for decades. That dramatically increases our flexibility around when we buy these assets and when we put them into production. For example, during the past few years, we have had the opportunity to significantly expand our manufacturing footprint by acquiring capacity for pennies on the dollar. As a result, we can now support more than $5 billion of additional revenue with the
capacity we have on hand without making additional large capital outlays. Today, these investments are benefiting the company, its cash flow, its returns – and TI’s shareholders – and will continue to benefit us for many years to come.
So where are we now?
In Analog, we are the market leader with about 18 percent share. We have gained share in four of the past five years, even without the contribution that resulted from our acquisition of National Semiconductor, which broadened our product lines and gave us a stronger presence in the important industrial markets. In Embedded Processing, we hold the No. 2 position with about 12 percent share. For the past few years, we have focused on new product development to ensure a broad portfolio that can serve many customer needs, ranging from the industry’s lowest power-consuming microcontroller to multi-core DSPs for the next wave of the communications infrastructure build-out.
2012 showed what our Analog and Embedded Processing business model can deliver, even in a weak economy. We generated almost $3 billion in free cash flow and returned 90 percent of it to shareholders through dividends and share repurchases. We raised our quarterly dividend 24 percent, our tenth increase in the last nine years. And, we repurchased $1.8 billion worth of shares, further contributing to a 36 percent reduction in shares outstanding since the beginning of 2005.
Now that we’ve completed our strategic transition, we’re further honing our execution so we can deliver on the promise of TI: revenue growth and market share gains in Analog and Embedded Processing, cash flows at historic levels, and strong returns to our shareholders. Analog and Embedded Processing are where we are investing our resources. This is where we are committed to succeed.
Richard K. TempletonChairman, President andChief Executive Officer
Note: Free cash flow (non-GAAP) = Cash flow from operations minus capital expenditures. See page 48 for details.
244816_TI_AR_CVR_R3.indd 2 2/21/13 9:12 AM

T E X A S I N S T R U M E N T S 2 0 1 2 A N N U A L R E P O R T • 1
AN
NU
AL
RE
PO
RT
Financial statements table of contents
Consolidated statements of income . . . . . . . . . . . . . . . . . . . . . . . . . . . . . . . . . . . . . . . . . 2
Consolidated statements of comprehensive income . . . . . . . . . . . . . . . . . . . . . . . . . . . . . . . . . 3
Consolidated balance sheets . . . . . . . . . . . . . . . . . . . . . . . . . . . . . . . . . . . . . . . . . . . . . 4
Consolidated statements of cash flows . . . . . . . . . . . . . . . . . . . . . . . . . . . . . . . . . . . . . . . 5
Consolidated statements of stockholders’ equity . . . . . . . . . . . . . . . . . . . . . . . . . . . . . . . . . . . 6
Notes to financial statements . . . . . . . . . . . . . . . . . . . . . . . . . . . . . . . . . . . . . . . . . . . . 7
Description of business and significant accounting policies and practices
Acquisition-related charges
Restructuring charges/other
Losses associated with the 2011 earthquake in Japan
Stock-based compensation
Profit sharing plans
Income taxes
Financial instruments and risk concentration
Report of independent registered public accounting firm . . . . . . . . . . . . . . . . . . . . . . . . . . . . . . 36
Report by management on internal control over financial reporting . . . . . . . . . . . . . . . . . . . . . . . . 37
Report of independent registered public accounting firm on internal control over financial reporting . . . . . . . . 38
Summary of selected financial data . . . . . . . . . . . . . . . . . . . . . . . . . . . . . . . . . . . . . . . . 39
Management’s discussion and analysis of financial condition and results of operations . . . . . . . . . . . . . . 40
Overview
Results of operations
Prior results of operations - 2011 compared with 2010
Financial condition
Liquidity and capital resources
Long-term contractual obligations
Quarterly financial data . . . . . . . . . . . . . . . . . . . . . . . . . . . . . . . . . . . . . . . . . . . . . . 52
Common stock prices and dividends . . . . . . . . . . . . . . . . . . . . . . . . . . . . . . . . . . . . . . . . 53
Comparison of total shareholder return . . . . . . . . . . . . . . . . . . . . . . . . . . . . . . . . . . . . . . 53
Safe Harbor statement . . . . . . . . . . . . . . . . . . . . . . . . . . . . . . . . . . . . . . . . . . . . . . . 54
Notice of 2013 annual meeting of stockholders and proxy statement
Notice of annual meeting of stockholders . . . . . . . . . . . . . . . . . . . . . . . . . . . . . . . . . . . . . 55
Proxy statement table of contents . . . . . . . . . . . . . . . . . . . . . . . . . . . . . . . . . . . . . . . . . 56
Valuation of debt and equity investments and certain liabilities
Goodwill and acquisition-related intangibles
Postretirement benefit plans
Debt and lines of credit
Commitments and contingencies
Stockholders’ equity
Supplemental financial information
Segment and geographic area data
Critical accounting policies
Changes in accounting standards
Off-balance sheet arrangements
Commitments and contingencies
Quantitative and qualitative disclosures about market risk

T E X A S I N S T R U M E N T S2 • 2 0 1 2 A N N U A L R E P O R T
AN
NU
AL
RE
PO
RT
For Years EndedDecember 31,
Consolidated statements of income 2012 2011 2010
[Millions of dollars, except share and per-share amounts]
Revenue $12,825 $13,735 $13,966Cost of revenue (COR) 6,457 6,963 6,474Gross profit 6,368 6,772 7,492Research and development (R&D) 1,877 1,715 1,570Selling, general and administrative (SG&A) 1,804 1,638 1,519Acquisition charges 450 315 —Restructuring charges/other 264 112 (111)Operating profit 1,973 2,992 4,514Other income (expense) net (OI&E) 47 5 37Interest and debt expense 85 42 —Income before income taxes 1,935 2,955 4,551Provision for income taxes 176 719 1,323
Net income $ 1,759 $ 2,236 $ 3,228
Earnings per common share: Basic $ 1.53 $ 1 91 $ 2 66
Diluted $ 1.51 $ 1 88 $ 2 62
Average shares outstanding (millions): Basic 1,132 1,151 1,199
Diluted 1,146 1,171 1,213
Cash dividends declared per share of common stock $ 0.72 $ 0 56 $ 0 49
See accompanying notes
T E X A S I N S T R U M E N T S 2 0 1 2 A N N U A L R E P O R T • 3
AN
NU
AL
RE
PO
RT
For Years EndedDecember 31,
Consolidated statements of comprehensive income 2012 2011 2010
[Millions of dollars]
Net income $ 1,759 $ 2,236 $ 3,228Other comprehensive income (loss):
Available-for-sale investments:Unrealized gains (losses), net of tax benefit (expense) of ($1), $1 and ($3) 3 (2) 7Reclassification of recognized transactions, net of tax benefit (expense)
of $0, ($7) and $0 — 12 —Net actuarial gains (losses) of defined benefit plans:
Adjustment, net of tax benefit (expense) of $29, $65 and $61 (81) (124) (154)Reclassification of recognized transactions, net of tax benefit (expense)
of ($104), ($28) and ($36) 160 48 65Prior service cost of defined benefit plans:
Adjustment, net of tax benefit (expense) of $1, $5 and ($1) (2) (9) 2Reclassification of recognized transactions, net of tax benefit (expense)
of $0, ($1) and $0 — 2 —Change in fair value of derivative instrument, net of tax benefit (expense) of $1, $1 and $0 (3) (2) —Other comprehensive income (loss), net of taxes 77 (75) (80)
Total comprehensive income $1,836 $ 2,161 $ 3,148
See accompanying notes

T E X A S I N S T R U M E N T S4 • 2 0 1 2 A N N U A L R E P O R T
AN
NU
AL
RE
PO
RT
December 31,
Consolidated balance sheets 2012 2011
[Millions of dollars, except share amounts]
AssetsCurrent assets:
Cash and cash equivalents $ 1,416 $ 992Short-term investments 2,549 1,943Accounts receivable, net of allowances of ($31) and ($19) 1,230 1,545
Raw materials 116 115Work in process 935 1,004Finished goods 706 669
Inventories 1,757 1,788Deferred income taxes 1,044 1,174Prepaid expenses and other current assets 234 386Total current assets 8,230 7,828
Property, plant and equipment at cost 6,891 7,133Less accumulated depreciation (2,979) (2,705)
Property, plant and equipment, net 3,912 4,428Long-term investments 215 265Goodwill 4,362 4,452Acquisition-related intangibles, net 2,558 2,900Deferred income taxes 280 321Capitalized software licenses, net 142 206Overfunded retirement plans 68 40Other assets 254 57Total assets $ 20,021 $ 20,497
Liabilities and stockholders’ equityCurrent liabilities:
Commercial paper borrowings $ — $ 999Current portion of long-term debt 1,500 382Accounts payable 444 625Accrued compensation 524 597Income taxes payable 79 101Deferred income taxes 2 —Accrued expenses and other liabilities 881 795Total current liabilities 3,430 3,499
Long-term debt 4,186 4,211Underfunded retirement plans 269 701Deferred income taxes 572 607Deferred credits and other liabilities 603 527Total liabilities 9,060 9,545Stockholders’ equity:
Preferred stock, $25 par value Authorized – 10,000,000 shares Participating cumulative preferred None issued — —
Common stock, $1 par value Authorized – 2,400,000,000 shares Shares issued: 2012 – 1,740,815,939; 2011 – 1,740,630,391 1,741 1,741
Paid-in capital 1,176 1,194Retained earnings 27,205 26,278Less treasury common stock at cost
Shares: 2012 – 632,636,970; 2011 – 601,131,631 (18,462) (17,485)Accumulated other comprehensive income (loss), net of taxes (699) (776)Total stockholders’ equity 10,961 10,952
Total liabilities and stockholders’ equity $ 20,021 $ 20,497
See accompanying notes

T E X A S I N S T R U M E N T S 2 0 1 2 A N N U A L R E P O R T • 5
AN
NU
AL
RE
PO
RT
For Years Ended December 31,
Consolidated statements of cash flows 2012 2011 2010
[Millions of dollars]
Cash flows from operating activities:Net income $ 1,759 $ 2,236 $ 3,228
Adjustments to net income:Depreciation 957 904 865Amortization of acquisition-related intangibles 342 111 48Stock-based compensation 263 269 190Gain on sales of assets and divestiture — (5) (144)Deferred income taxes 65 (119) (188)Gain on transfer of Japan substitutional pension (144) — —
Increase (decrease) from changes in:Accounts receivable 311 112 (231)Inventories 5 (17) (304)Prepaid expenses and other current assets 227 (29) (8)Accounts payable and accrued expenses 99 2 57Accrued compensation (82) (77) 246Income taxes payable (229) (85) (19)
Changes in funded status of retirement plans (198) (7) 26Other 39 (39) 54
Cash flows from operating activities 3,414 3,256 3,820
Cash flows from investing activities:Additions to property, plant and equipment (495) (816) (1,199)Proceeds from insurance recovery, asset sales and divestiture — 16 148Purchases of short-term investments (2,802) (3,653) (2,510)Proceeds from short-term investments 2,198 3,555 2,564Purchases of long-term investments (1) (6) (8)Proceeds from long-term investments 61 157 147Business acquisitions, net of cash acquired — (5,425) (199)
Cash flows from investing activities (1,039) (6,172) (1,057)
Cash flows from financing activities:Proceeds from issuance of long-term debt and commercial paper borrowings 1,492 4,697 —Repayment of debt and commercial paper borrowings (1,375) (200) —Dividends paid (819) (644) (592)Stock repurchases (1,800) (1,973) (2,454)Proceeds from common stock transactions 523 690 407Excess tax benefit from share-based payments 38 31 13Other (10) (12) —
Cash flows from financing activities (1,951) 2,589 (2,626)
Net change in cash and cash equivalents 424 (327) 137Cash and cash equivalents at beginning of year 992 1,319 1,182Cash and cash equivalents at end of year $ 1,416 $ 992 $ 1,319
See accompanying notes
T E X A S I N S T R U M E N T S6 • 2 0 1 2 A N N U A L R E P O R T
AN
NU
AL
RE
PO
RT
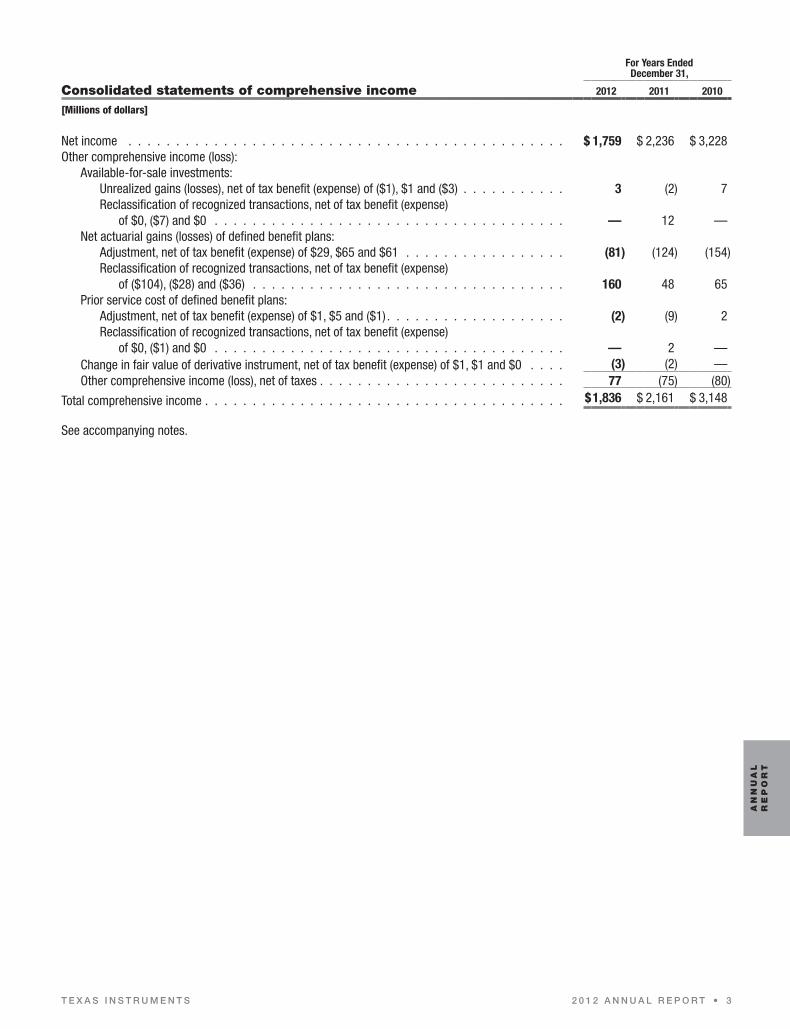
Consolidated statements of stockholders’ equityCommon
StockPaid-in Capital
RetainedEarnings
TreasuryCommon
Stock
Accumulated OtherComprehensiveIncome (Loss)
[Millions of dollars, except per-share amounts]
Balance, December 31, 2009 $1,740 $1,086 $ 22,066 $(14,549) $ (621)
2010Net income — — 3,228 — —Dividends declared and paid ($ 49 per share) — — (592) — —Common stock issued for stock-based awards — (182) — 588 —Stock repurchases — — — (2,450) —Stock-based compensation — 190 — — —Tax impact from exercise of options — 21 — — —Other comprehensive income (loss), net of taxes — — — — (80)Other — (1) (7) — —
Balance, December 31, 2010 1,740 1,114 24,695 (16,411) (701)
2011Net income — — 2,236 — —Dividends declared and paid ($ 56 per share) — — (644) — —Common stock issued for stock-based awards 1 (252) — 898 —Stock repurchases — — — (1,973) —Stock-based compensation — 269 — — —Tax impact from exercise of options — 45 — — —Other comprehensive income (loss), net of taxes — — — — (75)Other — 18 (9) 1 —
Balance, December 31, 2011 1,741 1,194 26,278 (17,485) (776)
2012Net income — — 1,759 — —Dividends declared and paid ($.72 per share) — — (819) — —Common stock issued for stock-based awards — (337) — 823 —Stock repurchases — — — (1,800) —Stock-based compensation — 263 — — —Tax impact from exercise of options — 56 — — —Other comprehensive income (loss), net of taxes — — — — 77Other — — (13) — —
Balance, December 31, 2012 $1,741 $1,176 $ 27,205 $(18,462) $(699)
See accompanying notes

AN
NU
AL
RE
PO
RT
T E X A S I N S T R U M E N T S 2 0 1 2 A N N U A L R E P O R T • 7
Notes to financial statements
1. Description of business and significant accounting policies and practices
BusinessAt Texas Instruments (TI), we design and make semiconductors that we sell to electronics designers and manufacturers all over the world. As of December 31, 2012, we have three reportable segments, which are established along major categories of products as follows:
• Analog – consists of the following major product lines: High Volume Analog & Logic (HVAL), Power Management (Power), High Performance Analog (HPA) and Silicon Valley Analog (SVA). SVA consists of products that we acquired through our purchase of National Semiconductor Corporation (National) in 2011.
• Embedded Processing – consists of digital signal processors (DSPs) and microcontrollers used in catalog, communications infrastructure and automotive applications; and
• Wireless – consists of OMAP™ applications processors, connectivity products and baseband products.
We report the results of our remaining business activities in Other. As previously announced, the Wireless segment will be eliminated due to the decision to wind down certain of its product lines. As a result, we will restructure our reportable segments beginning January 1, 2013, and we will report our first quarter of 2013 financial results accordingly. See Note 16 for additional information on our business segments.
Basis of presentationThe consolidated financial statements have been prepared in accordance with accounting principles generally accepted in the United States (U.S. GAAP). The basis of these financial statements is comparable for all periods presented herein.
The consolidated financial statements include the accounts of all subsidiaries. All intercompany balances and transactions have been eliminated in consolidation. All dollar amounts in the financial statements and tables in these notes, except per-share amounts, are stated in millions of U.S. dollars unless otherwise indicated. We have reclassified certain amounts in the prior periods’ financial statements to conform to the 2012 presentation. The preparation of financial statements requires the use of estimates from which final results may vary.
On September 23, 2011, we completed the acquisition of National. We accounted for this transaction under Accounting Standards Codification (ASC) 805 – Business Combinations, and the consolidated financial statements include the balances and results of operations of National from the date of acquisition. See Note 2 for more detailed information.
Revenue recognitionWe recognize revenue from direct sales of our products to our customers, including shipping fees, when title and risk of loss pass to the customer, which usually occurs upon shipment or delivery, depending upon the terms of the sales order; when persuasive evidence of an arrangement exists; when sales amounts are fixed or determinable; and when collectability is reasonably assured. Revenue from sales of our products that are subject to inventory consignment agreements is recognized consistent with the principles discussed above, but delivery occurs when the customer pulls product from consignment inventory that we store at designated locations. Estimates of product returns for quality reasons and of price allowances (based on historical experience, product shipment analysis and customer contractual arrangements) are recorded when revenue is recognized. Allowances include volume-based incentives and special pricing arrangements. In addition, we record allowances for accounts receivable that we estimate may not be collected.
We recognize revenue from direct sales of our products to our distributors, net of allowances, consistent with the principles discussed above. Title transfers to the distributors at delivery or when the products are pulled from consignment inventory, and payment is due on our standard commercial terms; payment terms are not contingent upon resale of the products. We calculate credit allowances based on historical data, current economic conditions and contractual terms. For instance, we sell to distributors at standard published prices, but we may grant them price adjustment credits in response to individual competitive opportunities they may have. To estimate allowances, we use statistical percentages of revenue, determined quarterly, based upon recent historical adjustment trends. We also provide allowances for certain growth-based incentives.
We provide distributors an allowance to scrap certain slow-selling or obsolete products in their inventory, estimated as a negotiated fixed percentage of each distributor’s purchases from us. In addition, if we publish a new price for a product that is lower than that paid by distributors for the same product still remaining in each distributor’s on-hand inventory, we may credit them for the difference between those prices. The allowance for this type of credit is based on the identified product price difference applied to our estimate of each distributor’s on-hand inventory of that product. We believe we can reasonably and reliably estimate allowances for credits to distributors in a timely manner.

AN
NU
AL
RE
PO
RT
T E X A S I N S T R U M E N T S8 • 2 0 1 2 A N N U A L R E P O R T
We determine the amount and timing of royalty revenue based on our contractual agreements with intellectual property licensees. We recognize royalty revenue when earned under the terms of the agreements and when we consider realization of payment to be probable. Where royalties are based on a percentage of licensee sales of royalty-bearing products, we recognize royalty revenue by applying this percentage to our estimate of applicable licensee sales. We base this estimate on historical experience and an analysis of each licensee’s sales results. Where royalties are based on fixed payment amounts, we recognize royalty revenue ratably over the term of the royalty agreement. Where warranted, revenue from licensees may be recognized on a cash basis.
We include shipping and handling costs in COR.
Advertising costsWe expense advertising and other promotional costs as incurred. This expense was $46 million in 2012, $43 million in 2011 and $44 million in 2010.
Income taxesWe account for income taxes using an asset and liability approach. We record the amount of taxes payable or refundable for the current year and the deferred tax assets and liabilities for future tax consequences of events that have been recognized in the financial statements or tax returns. We record a valuation allowance when it is more likely than not that some or all of the deferred tax assets will not be realized.
Other assessed taxesSome transactions require us to collect taxes such as sales, value-added and excise taxes from our customers. These transactions are presented in our statements of income on a net (excluded from revenue) basis.
Earnings per share (EPS)Unvested awards of share-based payments with rights to receive dividends or dividend equivalents, such as our restricted stock units (RSUs), are considered to be participating securities and the two-class method is used for purposes of calculating EPS. Under the two-class method, a portion of net income is allocated to these participating securities and, therefore, is excluded from the calculation of EPS allocated to common stock, as shown in the table below.
Computation and reconciliation of earnings per common share are as follows (shares in millions):
2012 2011 2010
Net Income Shares EPS Net Income Shares EPS Net Income Shares EPS
Basic EPS:Net income . . . . . . . . . . . . . . . . . . . $1,759 $2,236 $3,228Less income allocated to RSUs . . . . . . . . . (31) (35) (44)Income allocated to common stock for basic
EPS calculation . . . . . . . . . . . . . . . $1,728 1,132 $1.53 $2,201 1,151 $1.91 $3,184 1,199 $2.66
Adjustment for dilutive shares:Stock-based compensation plans . . . . . 14 20 14
Diluted EPS:Net income . . . . . . . . . . . . . . . . . . . $1,759 $2,236 $3,228Less income allocated to RSUs . . . . . . . . . (31) (34) (44)Income allocated to common stock for diluted
EPS calculation . . . . . . . . . . . . . . . $1,728 1,146 $1.51 $2,202 1,171 $1.88 $3,184 1,213 $2.62
Potentially dilutive securities representing 52 million, 24 million and 66 million shares of common stock that were outstanding during 2012, 2011 and 2010, respectively, were excluded from the computation of diluted earnings per common share for these periods because their effect would have been anti-dilutive.

AN
NU
AL
RE
PO
RT
T E X A S I N S T R U M E N T S 2 0 1 2 A N N U A L R E P O R T • 9
InvestmentsWe present investments on our balance sheets as cash equivalents, short-term investments or long-term investments. Specific details are as follows:
• Cash equivalents and short-term investments: We consider investments in debt securities with maturities of 90 days or less from the date of our investment to be cash equivalents. We consider investments in debt securities with maturities beyond 90 days from the date of our investment as being available for use in current operations and include these investments in short-term investments. The primary objectives of our cash equivalent and short-term investment activities are to preserve capital and maintain liquidity while generating appropriate returns.
• Long-term investments: Long-term investments consist of mutual funds, venture capital funds and non-marketable equity securities. Prior to the fourth quarter of 2012, this also included auction-rate securities.
• Classification of investments: Depending on our reasons for holding the investment and our ownership percentage, we classify investments in securities as available for sale, trading, or equity- or cost-method investments, which are more fully described in Note 9. We determine cost or amortized cost, as appropriate, on a specific identification basis.
InventoriesInventories are stated at the lower of cost or estimated net realizable value. Cost is generally computed on a currently adjusted standard cost basis, which approximates cost on a first-in first-out basis. Standard cost is based on the normal utilization of installed factory capacity. Cost associated with underutilization of capacity is expensed as incurred. Inventory held at consignment locations is included in our finished goods inventory. Consigned inventory was $169 million and $129 million as of December 31, 2012 and 2011, respectively.
We review inventory quarterly for salability and obsolescence. A specific allowance is provided for inventory considered unlikely to be sold. Remaining inventory includes a salability and obsolescence allowance based on an analysis of historical disposal activity. We write off inventory in the period in which disposal occurs.
Property, plant and equipment; acquisition-related intangibles and other capitalized costsProperty, plant and equipment are stated at cost and depreciated over their estimated useful lives using the straight-line method. Our cost basis includes certain assets acquired in business combinations that were initially recorded at fair value as of the date of acquisition. Leasehold improvements are amortized using the straight-line method over the shorter of the remaining lease term or the estimated useful lives of the improvements. We amortize acquisition-related intangibles on a straight-line basis over the estimated economic life of the assets. Capitalized software licenses generally are amortized on a straight-line basis over the term of the license. Fully depreciated or amortized assets are written off against accumulated depreciation or amortization.
Impairments of long-lived assetsWe regularly review whether facts or circumstances exist that indicate the carrying values of property, plant and equipment or other long-lived assets, including intangible assets, are impaired. We assess the recoverability of assets by comparing the projected undiscounted net cash flows associated with those assets to their respective carrying amounts. Any impairment charge is based on the excess of the carrying amount over the fair value of those assets. Fair value is determined by available market valuations, if applicable, or by discounted cash flows.
Goodwill and indefinite-lived intangiblesGoodwill is not amortized but is reviewed for impairment annually or more frequently if certain impairment indicators arise. We perform our annual goodwill impairment tests as of October 1 for our reporting units. The test compares the fair value for each reporting unit to its associated carrying value including goodwill. See Note 10 for additional information.
Foreign currencyThe functional currency for our non-U.S. subsidiaries is the U.S. dollar. Accounts recorded in currencies other than the U.S. dollar are remeasured into the functional currency. Current assets (except inventories), deferred income taxes, other assets, current liabilities and long-term liabilities are remeasured at exchange rates in effect at the end of each reporting period. Property, plant and equipment with associated depreciation and inventories are remeasured at historic exchange rates. Revenue and expense accounts other than depreciation for each month are remeasured at the appropriate daily rate of exchange. Currency exchange gains and losses from remeasurement are credited or charged to OI&E.

AN
NU
AL
RE
PO
RT
T E X A S I N S T R U M E N T S10 • 2 0 1 2 A N N U A L R E P O R T
Derivatives and hedgingIn connection with the issuance of variable-rate long-term debt in May 2011, as more fully described in Note 12, we entered into an interest rate swap designated as a hedge of the variability of cash flows related to interest payments. Gains and losses from changes in the fair value of the interest rate swap are credited or charged to Accumulated other comprehensive income (loss), net of taxes (AOCI).
We also use derivative financial instruments to manage exposure to foreign exchange risk. These instruments are primarily forward foreign currency exchange contracts that are used as economic hedges to reduce the earnings impact exchange rate fluctuations may have on our non-U.S. dollar net balance sheet exposures. Gains and losses from changes in the fair value of these forward foreign currency exchange contracts are credited or charged to OI&E. We do not apply hedge accounting to our foreign currency derivative instruments.
We do not use derivatives for speculative or trading purposes.
Changes in accounting standardsAs of December 31, 2012, the Financial Accounting Standards Board had issued several accounting standards that we have not yet been required to adopt. None of these standards would have a material effect on our financial condition, results of operations or financial disclosures.
2. Acquisition-related charges
National acquisitionOn September 23, 2011, we completed the acquisition of National by acquiring all issued and outstanding common shares in exchange for total consideration of $6.56 billion. We recognized $3.528 billion of goodwill, which was applied to the Analog segment. None of the goodwill related to the National acquisition was deductible for tax purposes.
We incurred various costs as a result of the acquisition of National that are included in Other consistent with how management measures the performance of its segments. These total acquisition-related charges are as follows:
For Years Ended December 31,
2012 2011
Distributor contract termination . . . . . . . . . . . . . . . . . . . . . . . . . . . . . . . . . . . . . . . . . . . $ 21 $ —Inventory related . . . . . . . . . . . . . . . . . . . . . . . . . . . . . . . . . . . . . . . . . . . . . . . . . . . — 96Property, plant and equipment related . . . . . . . . . . . . . . . . . . . . . . . . . . . . . . . . . . . . . . . . — 15
As recorded in COR . . . . . . . . . . . . . . . . . . . . . . . . . . . . . . . . . . . . . . . . . . . . . . . . . . . 21 111Amortization of intangible assets . . . . . . . . . . . . . . . . . . . . . . . . . . . . . . . . . . . . . . . . . . 325 87Retention bonuses . . . . . . . . . . . . . . . . . . . . . . . . . . . . . . . . . . . . . . . . . . . . . . . . . . 57 46Stock-based compensation . . . . . . . . . . . . . . . . . . . . . . . . . . . . . . . . . . . . . . . . . . . . . 17 50Severance and other benefits:
Employment reductions announced at closing . . . . . . . . . . . . . . . . . . . . . . . . . . . . . . . . . . 16 29Change of control . . . . . . . . . . . . . . . . . . . . . . . . . . . . . . . . . . . . . . . . . . . . . . . . — 41
Transaction and other costs . . . . . . . . . . . . . . . . . . . . . . . . . . . . . . . . . . . . . . . . . . . . . 35 62As recorded in Acquisition charges . . . . . . . . . . . . . . . . . . . . . . . . . . . . . . . . . . . . . . . . . . . . 450 315Total acquisition-related charges . . . . . . . . . . . . . . . . . . . . . . . . . . . . . . . . . . . . . . . . . . . . $471 $426
In 2011, we discontinued using one of National’s distributors. We acquired the distributor’s inventory at fair value, resulting in an incremental charge of $21 million to COR upon sale of the inventory in 2012.
At acquisition, we recognized costs associated with the adjustments to write up the value of acquired inventory and property, plant and equipment to fair value. These costs are in addition to the normal expensing of the acquired assets based on their carrying or book value prior to the acquisition. The total fair-value write-up of $96 million for the acquired inventory was expensed as that inventory was sold. The total fair-value write-up for the acquired property, plant and equipment was $436 million. In the fourth quarter of 2011, depreciation was $15 million. It continues at a declining rate and is no longer separately disclosed as an acquisition-related charge.

AN
NU
AL
RE
PO
RT
T E X A S I N S T R U M E N T S 2 0 1 2 A N N U A L R E P O R T • 1 1
The amount of recognized amortization of acquired intangible assets resulting from the National acquisition is based on estimated useful lives varying between two and ten years. See Note 10 for additional information.
Retention bonuses reflect amounts already or expected to be paid to former National employees who fulfill agreed-upon service period obligations and are recognized ratably over the required service period.
Stock-based compensation was recognized for the accelerated vesting of equity awards upon the termination of employees, with additional compensation being recognized over the applicable vesting period for the remaining grantees.
Severance and other benefits costs were for former National employees who were terminated after the closing date. These costs totaled $70 million for the year ended December 31, 2011, with $41 million in charges related to change of control provisions under existing employment agreements and $29 million in charges for announced employment reductions affecting about 350 jobs. All of these jobs were eliminated by the end of 2012 as a result of redundancies and cost efficiency measures, with approximately $16 million of additional expense recognized in 2012. Of the $86 million in cumulative charges recognized through December 31, 2012, $65 million was paid in 2012 and $14 million was paid in 2011.
Transaction and other costs include various expenses incurred in connection with the National acquisition. In 2011, we also incurred bridge financing costs.
In conformance with Accounting Standards Codification (ASC) 805 – Business Combinations, the following unaudited summaries of pro forma combined results of operation for the years ended December 31, 2011 and 2010, give effect to the acquisition as if it had been completed on January 1, 2010. These pro forma summaries do not reflect any operating efficiencies, cost savings or revenue enhancements that may be achieved by the combined companies. In addition, certain non-recurring expenses, such as restructuring charges and retention bonuses, are not reflected in the pro forma summaries. These pro forma summaries are presented for informational purposes only and are not indicative of what the actual results of operations would have been had the acquisition taken place as of that date, nor are they indicative of future consolidated results of operations.
For Years Ended December 31,
2011 2010(Unaudited)
Revenue . . . . . . . . . . . . . . . . . . . . . . . . . . . . . . . . . . . . . . . . . . . . . . . . . . . . . $14,805 $15,529Net income . . . . . . . . . . . . . . . . . . . . . . . . . . . . . . . . . . . . . . . . . . . . . . . . . . . 2,438 3,218Earnings per common share – diluted . . . . . . . . . . . . . . . . . . . . . . . . . . . . . . . . . . . . . . $ 2.05 $ 2.61
Other acquisitionsIn October 2010, we acquired our first semiconductor manufacturing site in China, located in the Chengdu High-tech Zone. This acquisition, which was recorded as a business combination, used net cash of $140 million. As contractually agreed, we made an additional payment of $35 million to the seller in October 2011.
In August 2010, we completed the acquisition of two wafer fabs and equipment in Aizu-Wakamatsu, Japan, for net cash of $130 million. The acquisition of the fabs and related 200-millimeter equipment was recorded as a business combination for net cash of $59 million. We also settled a contractual arrangement with a third party for our benefit for net cash of $12 million, which was recorded as a charge in COR in Other. Additionally, we incurred acquisition-related costs of $1 million, which were recorded in SG&A. This acquisition also included 300-millimeter production tools, which we recorded as a capital purchase for net cash of $58 million.
The results of operations for these acquisitions have been included in our financial statements from their respective acquisition dates. Operating results for transitional supply agreements are included in Other. Pro forma financial information for these acquisitions would not be materially different from amounts reported.

AN
NU
AL
RE
PO
RT
T E X A S I N S T R U M E N T S12 • 2 0 1 2 A N N U A L R E P O R T
3. Restructuring charges/other
Restructuring charges/other is comprised of the following components:
For Years Ended December 31,
2012 2011 2010
Restructuring charges by action:Restructuring charges . . . . . . . . . . . . . . . . . . . . . . . . . . . . . . . . . . . . . . . . $ 261 $ — $ —Goodwill impairment . . . . . . . . . . . . . . . . . . . . . . . . . . . . . . . . . . . . . . . . . 90 — —
2012 Wireless action . . . . . . . . . . . . . . . . . . . . . . . . . . . . . . . . . . . . . . . . . . . 351 — —2011 action . . . . . . . . . . . . . . . . . . . . . . . . . . . . . . . . . . . . . . . . . . . . . . . 49 112 —2008/2009 actions . . . . . . . . . . . . . . . . . . . . . . . . . . . . . . . . . . . . . . . . . . . . — — 33
Other:Gain on transfer of Japan substitutional pension . . . . . . . . . . . . . . . . . . . . . . . . . . . . . (144) — —Gain on divested product line . . . . . . . . . . . . . . . . . . . . . . . . . . . . . . . . . . . . . . . — — (144)Other . . . . . . . . . . . . . . . . . . . . . . . . . . . . . . . . . . . . . . . . . . . . . . . . . . . 8 — —Restructuring charges/other . . . . . . . . . . . . . . . . . . . . . . . . . . . . . . . . . . . . . . . $ 264 $112 $ (111)
Restructuring charges/other recognized by segment are as follows:
For Years Ended December 31,
2012 2011 2010
Analog . . . . . . . . . . . . . . . . . . . . . . . . . . . . . . . . . . . . . . . . . . . . . . . . . . $ — $ — $ 13Embedded Processing . . . . . . . . . . . . . . . . . . . . . . . . . . . . . . . . . . . . . . . . . . — — 6Wireless . . . . . . . . . . . . . . . . . . . . . . . . . . . . . . . . . . . . . . . . . . . . . . . . . 351 — 10Other . . . . . . . . . . . . . . . . . . . . . . . . . . . . . . . . . . . . . . . . . . . . . . . . . . . (87) 112 (140)Total . . . . . . . . . . . . . . . . . . . . . . . . . . . . . . . . . . . . . . . . . . . . . . . . . . . $ 264 $112 $ (111)
Restructuring chargesRestructuring charges may consist of voluntary or involuntary severance-related charges, asset-related charges and other costs to exit activities. We recognize voluntary termination benefits when the employee accepts the offered benefit arrangement. We recognize involuntary severance-related charges depending on whether the termination benefits are provided under an ongoing benefit arrangement or under a one-time benefit arrangement. If the former, we recognize the charges once they are probable and the amounts are estimable. If the latter, we recognize the charges once the benefits have been communicated to employees.
Restructuring activities associated with assets are recorded as an adjustment to the basis of the asset, not as a liability. When we commit to a plan to abandon a long-lived asset before the end of its previously estimated useful life, we accelerate the recognition of depreciation to reflect the use of the asset over its shortened useful life. When an asset is held to be sold, we write down the carrying value to its net realizable value and cease depreciation. Restructuring actions may be viewed as an impairment indicator requiring testing of the recoverability of intangible assets, including goodwill.
2012 Wireless actionIn November 2012, we announced an action concerning our Wireless business that, when complete, is expected to reduce annualized expenses by about $450 million and will focus our investments on embedded markets with greater potential for sustainable growth. About 1,700 jobs worldwide are expected to be eliminated. The total restructuring charges related to this action will be about $360 million, of which about $245 million will be for severance and related benefits. We recognized $351 million of these costs in the fourth quarter of 2012 consisting of: $245 million for severance and benefit costs and other non-cash items of $3 million of accelerated depreciation of the affected facilities’ assets, $13 million for other exit costs and $90 million for the non-tax deductible impairment of goodwill. See Note 10 for additional information on the goodwill impairment charge. We estimate that this action will be substantially complete by the end of 2013. As of December 31, 2012, $4 million has been paid to terminated employees for severance and benefits related to this action.

AN
NU
AL
RE
PO
RT
T E X A S I N S T R U M E N T S 2 0 1 2 A N N U A L R E P O R T • 1 3
2011 actionBeginning in the fourth quarter of 2011, we recognized restructuring charges associated with the announced plans to close two older semiconductor manufacturing facilities in Hiji, Japan, and Houston, Texas, in 2013. Each facility employed about 500 people. The total charge for these closures is estimated at $215 million, of which $161 million has been recognized through December 31, 2012, consisting of: $113 million for severance and benefit costs, $23 million of accelerated depreciation of the facilities’ assets and $25 million for other exit costs. Of the estimated $215 million total cost, about $135 million will be for severance and related benefits, about $30 million will be for accelerated depreciation of facility assets and about $50 million will be for other exit costs. In 2012, $11 million was paid to terminated employees for severance and benefits related to this action.
The restructuring action related to the acquisition of National is discussed in Note 2 and is reflected in Acquisition charges in our Consolidated statements of income.
2008/2009 actionsIn October 2008, we announced actions to reduce expenses in our Wireless segment, especially our baseband operation. In January 2009, we announced actions that included broad-based employment reductions to align our spending with weakened demand. Combined, these actions eliminated about 3,900 jobs; they were completed in 2009.
The table below reflects the changes in accrued restructuring balances associated with these actions:
2012 Action 2011 Action 2008/2009 Actions
Severance and Benefits
Other Charges
Severance and Benefits
Other Charges
Severance and Benefits
Other Charges Total
Accrual at December 31, 2009 . . . . . . . . . . $ — $ — $ — $ — $ 84 $ 10 $ 94Restructuring charges . . . . . . . . . . . . . . . — — — — 33 — 33Non-cash items (a) . . . . . . . . . . . . . . . . — — — — (33) — (33)Payments . . . . . . . . . . . . . . . . . . . . . — — — — (62) (2) (64)Remaining accrual at December 31, 2010 . . . . . — — — — 22 8 30
Restructuring charges . . . . . . . . . . . . . . . — — 107 5 — — 112Non-cash items (a) . . . . . . . . . . . . . . . . — — (11) (5) — — (16)Payments . . . . . . . . . . . . . . . . . . . . . — — — — (9) (1) (10)Remaining accrual at December 31, 2011 . . . . . — — 96 — 13 7 116
Restructuring charges . . . . . . . . . . . . . . 245 106 6 43 — — 400Non-cash items (a) . . . . . . . . . . . . . . . . — (106) 3 (18) — — (121)Payments . . . . . . . . . . . . . . . . . . . . . (4) — (11) (22) (8) (1) (46)Remaining accrual at December 31, 2012 . . . . $241 $ — $ 94 $ 3 $ 5 $ 6 $ 349
(a) Reflects charges for goodwill impairment, stock-based compensation, impacts of postretirement benefit plans and accelerated depreciation.
The accrual balances above are a component of Accrued expenses and other liabilities or Deferred credits and other liabilities on our Consolidated balance sheets, depending on the expected timing of payment.
Other
Gain on transfer of Japan substitutional pensionDuring the third quarter of 2012, we transferred the obligations and assets of the substitutional portion of our Japan pension program from the pension trust to the government of Japan, resulting in a net gain of $144 million. See Note 11 for additional details.
Gain on divested product lineIn November 2010, we divested a product line previously included in Other for $148 million and recognized a gain in operating profit of $144 million.

AN
NU
AL
RE
PO
RT
T E X A S I N S T R U M E N T S14 • 2 0 1 2 A N N U A L R E P O R T
4. Losses associated with the 2011 earthquake in Japan
On March 11, 2011, a magnitude 9.0 earthquake struck near two of our three semiconductor manufacturing facilities in Japan. Our manufacturing site in Miho suffered substantial damage during the earthquake, our facility in Aizu experienced significantly less damage and our site in Hiji was undamaged. We maintain earthquake insurance policies in Japan for limited coverage for property damage and business interruption losses.
In 2011, we incurred cumulative gross operating losses of $101 million related to the earthquake and associated events in Japan. These losses related to property damage, the underutilization expense we incurred from having our manufacturing assets only partially loaded and costs associated with recovery teams assembled from across the world. Gross operating losses do not comprehend any lost revenue.
These losses have been offset by $36 million in cumulative insurance proceeds related to property damage claims ($23 million received in 2011 and $13 million for 2012). Almost all of these costs and proceeds are included in COR in our Consolidated statements of income and are recorded in Other.
In addition, we recognized $172 million in cumulative insurance proceeds through December 31, 2012, ($135 million received in 2012 and $37 million received in 2011) related to business interruption claims. These proceeds are recorded as revenue in our Consolidated statements of income and in Other.
In the third quarter of 2012, we completed discussions with our insurers and their advisors, settling all associated claims against our policies. All claims related to these events have been settled and the proceeds received.
5. Stock-based compensation
We have stock options outstanding to participants under various long-term incentive plans. We also have assumed stock options that were granted by companies that we later acquired. Unless the options are acquisition-related replacement options, the option price per share may not be less than 100 percent of the fair market value of our common stock on the date of the grant. Substantially all the options have a ten-year term and vest ratably over four years. Our options generally continue to vest after the option recipient retires.
We also have RSUs outstanding under the long-term incentive plans. Each RSU represents the right to receive one share of TI common stock on the vesting date, which is generally four years after the date of grant. Upon vesting, the shares are issued without payment by the grantee. RSUs generally do not continue to vest after the recipient’s retirement date. Holders of most RSUs receive an annual cash payment equal to the dividends paid on our common stock.
We have options and RSUs outstanding to non-employee directors under various director compensation plans. The plans generally provide for annual grants of stock options and RSUs, a one-time grant of RSUs to each new non-employee director and the issuance of TI common stock upon the distribution of stock units credited to deferred compensation accounts established for such directors.
We also have an employee stock purchase plan under which options are offered to all eligible employees in amounts based on a percentage of the employee’s compensation, subject to a cap. Under the plan, the option price per share is 85 percent of the fair market value on the exercise date, and options have a three-month term.
Total stock-based compensation expense recognized was as follows:
For Years Ended December 31,
2012 2011 2010
Stock-based compensation expense recognized in:Cost of revenue (COR) . . . . . . . . . . . . . . . . . . . . . . . . . . . . . . . . . . . . . . . . . . . $ 48 $ 40 $ 36Research and development (R&D) . . . . . . . . . . . . . . . . . . . . . . . . . . . . . . . . . . . . . 71 58 53Selling, general and administrative (SG&A) . . . . . . . . . . . . . . . . . . . . . . . . . . . . . . . . . 127 121 101Acquisition charges . . . . . . . . . . . . . . . . . . . . . . . . . . . . . . . . . . . . . . . . . . . . 17 50 —
Total . . . . . . . . . . . . . . . . . . . . . . . . . . . . . . . . . . . . . . . . . . . . . . . . . . . . . . $263 $269 $190
These amounts include expense related to non-qualified stock options, RSUs and stock options offered under our employee stock purchase plan and are net of expected forfeitures.
We issue awards of non-qualified stock options generally with graded vesting provisions (e.g., 25 percent per year for four years). We recognize the related compensation cost on a straight-line basis over the minimum service period required for vesting of the award. For awards to employees who are retirement eligible or nearing retirement eligibility, we recognize compensation cost on a straight-line basis over the longer of the service period required to be performed by the employee in order to earn the award, or a six-month period.
Our RSUs generally vest four years after the date of grant. We recognize the related compensation costs on a straight-line basis over the vesting period.

AN
NU
AL
RE
PO
RT
T E X A S I N S T R U M E N T S 2 0 1 2 A N N U A L R E P O R T • 1 5
Fair-value methods and assumptionsWe account for all awards granted under our various stock-based compensation plans at fair value. We estimate the fair values for non-qualified stock options under long-term incentive and director compensation plans using the Black-Scholes option-pricing model with the following weighted average assumptions.
2012 2011 2010
Weighted average grant date fair value, per share . . . . . . . . . . . . . . . . . . . . . . . . . . . $8.31 $10.37 $6.61Weighted average assumptions used:
Expected volatility . . . . . . . . . . . . . . . . . . . . . . . . . . . . . . . . . . . . . . . . . 30% 30% 32%Expected lives (in years) . . . . . . . . . . . . . . . . . . . . . . . . . . . . . . . . . . . . . . 7.1 6.9 6.4Risk-free interest rates . . . . . . . . . . . . . . . . . . . . . . . . . . . . . . . . . . . . . . . 1.40% 2.61% 2.83%Expected dividend yields . . . . . . . . . . . . . . . . . . . . . . . . . . . . . . . . . . . . . . 2.10% 1.51% 2.08%
We determine expected volatility on all options granted after July 1, 2005, using available implied volatility rates. We believe that market-based measures of implied volatility are currently the best available indicators of the expected volatility used in these estimates.
We determine expected lives of options based on the historical option exercise experience of our optionees using a rolling ten-year average. We believe the historical experience method is the best estimate of future exercise patterns currently available.
Risk-free interest rates are determined using the implied yield currently available for zero-coupon U.S. government issues with a remaining term equal to the expected life of the options.
Expected dividend yields are based on the approved annual dividend rate in effect and the current market price of our common stock at the time of grant. No assumption for a future dividend rate change is included unless there is an approved plan to change the dividend in the near term.
The fair value per share of RSUs that we grant is determined based on the closing price of our common stock on the date of grant.Our employee stock purchase plan is a discount-purchase plan and consequently the Black-Scholes option-pricing model is not
used to determine the fair value per share of these awards. The fair value per share under this plan equals the amount of the discount.
Long-term incentive and director compensation plansStock option and RSU transactions under our long-term incentive and director compensation plans during 2012 were as follows:
Stock Options RSUs
Shares
Weighted Average Exercise Price per Share Shares
Weighted Average Grant Date
Fair Value per Share
Outstanding grants, December 31, 2011 . . . . . . . . . . . . . 113,273,394 $ 25.79 23,358,846 $ 25.09Granted . . . . . . . . . . . . . . . . . . . . . . . . . . . . . 13,508,034 32.35 5,617,150 31.60Vested RSUs . . . . . . . . . . . . . . . . . . . . . . . . . . . — — (4,182,928) 28.66Expired and forfeited . . . . . . . . . . . . . . . . . . . . . . (4,732,514) 29.78 (1,417,834) 26.76Exercised . . . . . . . . . . . . . . . . . . . . . . . . . . . . (22,409,816) 20.32 — —Outstanding grants, December 31, 2012 . . . . . . . . . . . . 99,639,098 $ 27.73 23,375,234 $ 25.91
The weighted average grant date fair value of RSUs granted during the years 2012, 2011 and 2010 was $31.60, $33.20 and $23.47 per share, respectively. For the years ended December 31, 2012, 2011 and 2010, the total fair value of shares vested from RSU grants was $120 million, $155 million and $51 million, respectively.
Summarized information about stock options outstanding at December 31, 2012, is as follows:
Stock Options Outstanding Options Exercisable
Range of Exercise
Price
Number Outstanding
(Shares)
Weighted Average Remaining Contractual
Life (Years)
Weighted Average Exercise Price per
Share
Number Exercisable
(Shares)
Weighted Average Exercise Price per
Share
$ 9.56 to 10.00 4,882 0.8 $ 9.56 4,882 $ 9.5610.01 to 20.00 13,179,570 4.5 15.32 9,619,657 15.4320.01 to 30.00 34,637,310 4.8 24.86 27,154,258 25.3330.01 to 38.40 51,817,336 4.9 32.81 31,755,628 32.59
$ 9.56 to 38.40 99,639,098 4.8 $ 27.73 68,534,425 $27.30
During the years ended December 31, 2012, 2011 and 2010, the aggregate intrinsic value (i.e., the difference in the closing market price and the exercise price paid by the optionee) of options exercised was $244 million, $231 million and $140 million, respectively.

AN
NU
AL
RE
PO
RT
T E X A S I N S T R U M E N T S16 • 2 0 1 2 A N N U A L R E P O R T
Summarized information as of December 31, 2012, about outstanding stock options that are vested and expected to vest, as well as stock options that are currently exercisable, is as follows:
Outstanding Stock Options (Fully Vested and Expected to Vest) (a)
OptionsExercisable
Number of outstanding (shares) . . . . . . . . . . . . . . . . . . . . . . . . . . . . . . . 96,121,395 68,534,425Weighted average remaining contractual life (in years) . . . . . . . . . . . . . . . . . . . 4.7 3.3Weighted average exercise price per share . . . . . . . . . . . . . . . . . . . . . . . . . $ 28.75 $ 27.30Intrinsic value (millions of dollars) . . . . . . . . . . . . . . . . . . . . . . . . . . . . . . $ 398 $ 300
(a) Includes effects of expected forfeitures of approximately 4 million shares. Excluding the effects of expected forfeitures, the aggregate intrinsic value of stock options outstanding was $414 million.
As of December 31, 2012, the total future compensation cost related to equity awards not yet recognized in the Consolidated statements of income was $460 million, consisting of $143 million related to unvested stock options and $317 million related to RSUs. The $460 million will be recognized as follows: $205 million in 2013, $153 million in 2014, $94 million in 2015 and $8 million in 2016.
Employee stock purchase planOptions outstanding under the employee stock purchase plan at December 31, 2012, had an exercise price of $27.47 per share (85 percent of the fair market value of TI common stock on the date of automatic exercise). Of the total outstanding options, none were exercisable at year-end 2012.
Employee stock purchase plan transactions during 2012 were as follows:
Employee Stock Purchase Plan
(Shares) Exercise Price
Outstanding grants, December 31, 2011 . . . . . . . . . . . . . . . . . . . . . . . . . . . . . . . . 580,095 $25.29Granted . . . . . . . . . . . . . . . . . . . . . . . . . . . . . . . . . . . . . . . . . . . . . . . . 2,931,354 25.64Exercised . . . . . . . . . . . . . . . . . . . . . . . . . . . . . . . . . . . . . . . . . . . . . . . (2,829,498) 25.12Outstanding grants, December 31, 2012 . . . . . . . . . . . . . . . . . . . . . . . . . . . . . . . 681,951 $27.47
The weighted average grant date fair value of options granted under the employee stock purchase plans during the years 2012, 2011 and 2010 was $4.52, $4.59 and $3.97 per share, respectively. During the years ended December 31, 2012, 2011 and 2010, the total intrinsic value of options exercised under these plans was $13 million, $10 million and $9 million, respectively.
Effect on shares outstanding and treasury sharesOur practice is to issue shares of common stock upon exercise of stock options generally from treasury shares and, on a limited basis, from previously unissued shares. We settled stock option plan exercises using treasury shares of 25,064,951 in 2012; 27,308,311 in 2011 and 19,077,274 in 2010; and previously unissued common shares of 180,955 in 2012; 390,438 in 2011 and 342,380 in 2010.
Upon vesting of RSUs, we issued treasury shares of 3,187,490 in 2012; 3,748,623 in 2011 and 1,392,790 in 2010, and previously unissued common shares of 4,593 in 2012; 73,852 in 2011, with none in 2010.
Shares available for future grant and reserved for issuance are summarized below:
As of December 31, 2012
Shares
Long-term Incentive and Director
Compensation PlansEmployee Stock Purchase Plan Total
Reserved for issuance (a) . . . . . . . . . . . . . . . . . . . . . . . . . . . . 197,554,600 25,137,819 222,692,419Shares to be issued upon exercise of outstanding options and RSUs . . . . . (123,143,365) (681,951) (123,825,316)Available for future grants . . . . . . . . . . . . . . . . . . . . . . . . . . . . 74,411,235 24,455,868 98,867,103
(a) Includes 129,033 shares credited to directors’ deferred compensation accounts that settle in shares of TI common stock. These shares are not included as grants outstanding at December 31, 2012.
Effect on cash flowsCash received from the exercise of options was $523 million in 2012, $690 million in 2011 and $407 million in 2010. The related net tax impact realized was $56 million, $45 million and $21 million (which includes excess tax benefits realized of $38 million, $31 million and $13 million) in 2012, 2011 and 2010, respectively.

AN
NU
AL
RE
PO
RT
T E X A S I N S T R U M E N T S 2 0 1 2 A N N U A L R E P O R T • 1 7
6. Profit sharing plans
Profit sharing benefits are generally formulaic and determined by one or more subsidiary or company-wide financial metrics. We pay profit sharing benefits primarily under the company-wide TI Employee Profit Sharing Plan. This plan provides for profit sharing to be paid based solely on TI’s operating margin for the full calendar year. Under this plan, TI must achieve a minimum threshold of 10 percent operating margin before any profit sharing is paid. At 10 percent operating margin, profit sharing will be 2 percent of eligible payroll. The maximum amount of profit sharing available under the plan is 20 percent of eligible payroll, which is paid only if TI’s operating margin is at or above 35 percent for a full calendar year.
We recognized $96 million, $143 million and $279 million of profit sharing expense under the TI Employee Profit Sharing Plan in 2012, 2011 and 2010, respectively.
7. Income taxes
Income before income taxes U.S. Non-U.S. Total
2012 . . . . . . . . . . . . . . . . . . . . . . . . . . . . . . . . . . . . . . . . . . . . . . . . . . $ 319 $1,616 $ 1,9352011 . . . . . . . . . . . . . . . . . . . . . . . . . . . . . . . . . . . . . . . . . . . . . . . . . . 1,791 1,164 2,9552010 . . . . . . . . . . . . . . . . . . . . . . . . . . . . . . . . . . . . . . . . . . . . . . . . . . 3,769 782 4,551
Provision (benefit) for income taxes U.S. Federal Non-U.S. U.S. State Total
2012:Current . . . . . . . . . . . . . . . . . . . . . . . . . . . . . . . . . . . . . . . . . $ (43) $ 156 $ (2) $ 111Deferred . . . . . . . . . . . . . . . . . . . . . . . . . . . . . . . . . . . . . . . . . — 65 — 65
Total . . . . . . . . . . . . . . . . . . . . . . . . . . . . . . . . . . . . . . . . . . . . . $ (43) $ 221 $ (2) $ 176
2011:Current . . . . . . . . . . . . . . . . . . . . . . . . . . . . . . . . . . . . . . . . . . $ 692 $ 138 $ 8 $ 838Deferred . . . . . . . . . . . . . . . . . . . . . . . . . . . . . . . . . . . . . . . . . (154) 24 11 (119)
Total . . . . . . . . . . . . . . . . . . . . . . . . . . . . . . . . . . . . . . . . . . . . . $ 538 $ 162 $ 19 $ 719
2010:Current . . . . . . . . . . . . . . . . . . . . . . . . . . . . . . . . . . . . . . . . . . $1,401 $ 92 $ 18 $ 1,511Deferred . . . . . . . . . . . . . . . . . . . . . . . . . . . . . . . . . . . . . . . . . (188) (2) 2 (188)
Total . . . . . . . . . . . . . . . . . . . . . . . . . . . . . . . . . . . . . . . . . . . . . $1,213 $ 90 $ 20 $ 1,323
Principal reconciling items from income tax computed at the statutory federal rate follow:
2012 2011 2010
Computed tax at statutory rate . . . . . . . . . . . . . . . . . . . . . . . . . . . . . . . . . . . . . $ 677 $1,034 $1,593Non-U.S. effective tax rates . . . . . . . . . . . . . . . . . . . . . . . . . . . . . . . . . . . . . . (345) (245) (184)U.S. tax benefit for manufacturing . . . . . . . . . . . . . . . . . . . . . . . . . . . . . . . . . . . (158) (31) (63)Impact of changes to uncertain tax positions . . . . . . . . . . . . . . . . . . . . . . . . . . . . . . (88) — —Non-deductible expenses. . . . . . . . . . . . . . . . . . . . . . . . . . . . . . . . . . . . . . . . 42 27 10U.S. R&D tax credit . . . . . . . . . . . . . . . . . . . . . . . . . . . . . . . . . . . . . . . . . . . — (58) (54)Other . . . . . . . . . . . . . . . . . . . . . . . . . . . . . . . . . . . . . . . . . . . . . . . . . . 48 (8 ) 21Total provision for income taxes . . . . . . . . . . . . . . . . . . . . . . . . . . . . . . . . . . . . $ 176 $ 719 $1,323
The total provision for 2012 in the reconciliation above includes $252 million of discrete tax benefits primarily for additional U.S. tax benefits for manufacturing related to the years 2000 through 2011.

AN
NU
AL
RE
PO
RT
T E X A S I N S T R U M E N T S18 • 2 0 1 2 A N N U A L R E P O R T
The primary components of deferred income tax assets and liabilities were as follows:
December 31,
2012 2011
Deferred income tax assets:Inventories and related reserves . . . . . . . . . . . . . . . . . . . . . . . . . . . . . . . . . . . . . . $ 734 $ 913Deferred loss and tax credit carryforwards . . . . . . . . . . . . . . . . . . . . . . . . . . . . . . . . . 382 400Stock-based compensation. . . . . . . . . . . . . . . . . . . . . . . . . . . . . . . . . . . . . . . . . 366 357Postretirement benefit costs recognized in AOCI . . . . . . . . . . . . . . . . . . . . . . . . . . . . . . 357 431Accrued expenses . . . . . . . . . . . . . . . . . . . . . . . . . . . . . . . . . . . . . . . . . . . . . 331 322Other . . . . . . . . . . . . . . . . . . . . . . . . . . . . . . . . . . . . . . . . . . . . . . . . . . . . 209 122
2,379 2,545Less valuation allowance . . . . . . . . . . . . . . . . . . . . . . . . . . . . . . . . . . . . . . . . . . (221) (178)
2,158 2,367Deferred income tax liabilities:
Acquisition-related intangibles and fair-value adjustments . . . . . . . . . . . . . . . . . . . . . . . . . (921) (1,030)Accrued retirement costs (defined benefit and retiree health care) . . . . . . . . . . . . . . . . . . . . . (243) (180)Property, plant and equipment . . . . . . . . . . . . . . . . . . . . . . . . . . . . . . . . . . . . . . . (131) (141)International earnings . . . . . . . . . . . . . . . . . . . . . . . . . . . . . . . . . . . . . . . . . . . (102) (92)Other . . . . . . . . . . . . . . . . . . . . . . . . . . . . . . . . . . . . . . . . . . . . . . . . . . . . (11) (36)
(1,408) (1,479)Net deferred income tax asset . . . . . . . . . . . . . . . . . . . . . . . . . . . . . . . . . . . . . . . . . $ 750 $ 888
The deferred income tax assets and liabilities based on tax jurisdictions are presented on the Consolidated balance sheets as follows:
December 31,
2012 2011
Current deferred income tax assets . . . . . . . . . . . . . . . . . . . . . . . . . . . . . . . . . . . . $ 1,044 $ 1,174Noncurrent deferred income tax assets . . . . . . . . . . . . . . . . . . . . . . . . . . . . . . . . . . 280 321Current deferred income tax liabilities . . . . . . . . . . . . . . . . . . . . . . . . . . . . . . . . . . . (2) —Noncurrent deferred income tax liabilities . . . . . . . . . . . . . . . . . . . . . . . . . . . . . . . . . (572) (607)
Net deferred income tax asset . . . . . . . . . . . . . . . . . . . . . . . . . . . . . . . . . . . . . . . . . $ 750 $ 888
We make an ongoing assessment regarding the realization of U.S. and non-U.S. deferred tax assets. In 2012, we recognized a net increase of $43 million in our valuation allowance. This increase was due to valuation allowances on unutilized tax credits. While the net deferred tax assets of $2.16 billion at December 31, 2012, are not assured of realization, our assessment is that a valuation allowance is not required on this balance. This assessment is based on our evaluation of relevant criteria including the existence of deferred tax liabilities that can be used to absorb deferred tax assets, taxable income in prior carryback years and expectations for future taxable income.
We have U.S. and non-U.S. tax loss carryforwards of approximately $175 million, none of which will expire before the year 2023.A provision has been made for deferred taxes on undistributed earnings of non-U.S. subsidiaries to the extent that dividend
payments from these subsidiaries are expected to result in additional tax liability. The remaining undistributed earnings (approximately $5.54 billion at December 31, 2012) have been indefinitely reinvested; therefore, no provision has been made for taxes due upon remittance of these earnings. The indefinitely reinvested earnings of our non-U.S. subsidiaries are primarily invested in tangible assets such as inventory and property, plant and equipment. Determination of the amount of unrecognized deferred income tax liability is not practical because of the complexities associated with its hypothetical calculation.
Cash payments made for income taxes, net of refunds, were $171 million, $902 million and $1.47 billion for the years ended December 31, 2012, 2011 and 2010, respectively.
AN
NU
AL
RE
PO
RT
T E X A S I N S T R U M E N T S 2 0 1 2 A N N U A L R E P O R T • 1 9
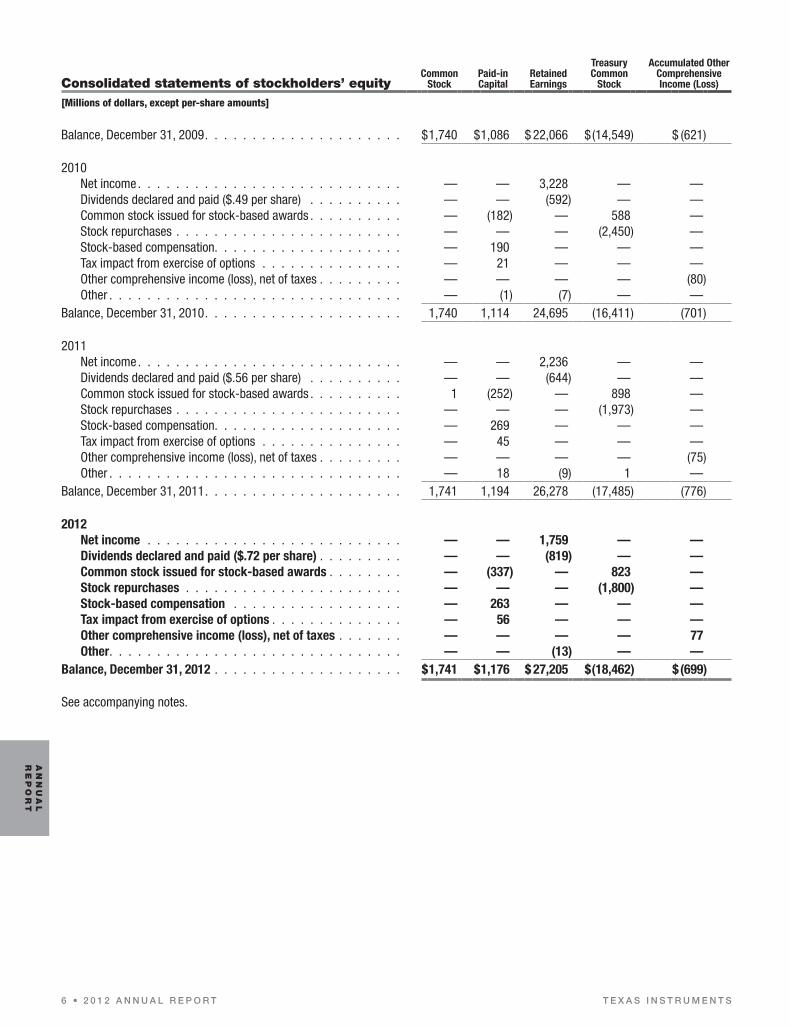
Uncertain tax positionsWe operate in a number of tax jurisdictions, and our income tax returns are subject to examination by tax authorities in those jurisdictions who may challenge any item on these tax returns. Because the matters challenged by authorities are typically complex, their ultimate outcome is uncertain. Before any benefit can be recorded in the financial statements, we must determine that it is “more likely than not” that a tax position will be sustained by the appropriate tax authorities. We recognize accrued interest related to uncertain tax positions and penalties as components of OI&E.
The changes in the total amounts of uncertain tax positions are summarized as follows:
2012 2011 2010
Balance, January 1 . . . . . . . . . . . . . . . . . . . . . . . . . . . . . . . . . . . . . . . . . . . . $210 $103 $ 56Additions based on tax positions related to the current year . . . . . . . . . . . . . . . . . . . . . . . 12 15 12Additions from the acquisition of National . . . . . . . . . . . . . . . . . . . . . . . . . . . . . . . . — 132 —Additions for tax positions of prior years . . . . . . . . . . . . . . . . . . . . . . . . . . . . . . . . . 45 3 50Reductions for tax positions of prior years . . . . . . . . . . . . . . . . . . . . . . . . . . . . . . . . (92) (39) (12)Settlements with tax authorities . . . . . . . . . . . . . . . . . . . . . . . . . . . . . . . . . . . . . 39 (4) (3)Expiration of the statute of limitations for assessing taxes . . . . . . . . . . . . . . . . . . . . . . . . (30) — —Balance, December 31 . . . . . . . . . . . . . . . . . . . . . . . . . . . . . . . . . . . . . . . . . . $184 $210 $103
Interest income (expense) recognized in the year ended December 31 . . . . . . . . . . . . . . . . . . $ 32 $ 1 $ (2)
Interest receivable (payable) as of December 31 . . . . . . . . . . . . . . . . . . . . . . . . . . . . . $ 8 $ (3) $ 5
The liability for uncertain tax positions is a component of Deferred credits and other liabilities on our December 31, 2012, balance sheet. The interest receivable is a component of Other assets on our December 31, 2012, balance sheet.
Within the $184 million liability for uncertain tax positions as of December 31, 2012, are positions totaling $159 million that, if recognized, would impact the tax rate. If these tax liabilities are ultimately realized, $78 million of existing deferred tax assets would also be realized, primarily related to refunds from counterparty jurisdictions resulting from procedures for relief from double taxation. Regarding the $184 million liability:
• About$60millionoftheliabilityrepresentsuncertaintaxpositionsfortaxyearsinjurisdictionsinwhichauditassessmentshavenot been made. The liability is primarily related to transfer pricing issues for which procedures for relief from double taxation will mitigate the tax rate impact of any difference between the actual tax assessments and our estimates. The increase in the liability for transfer pricing issues for the next 12 months is expected to be about $10 million.
• About$30millionoftheliabilityrepresentsauditassessmentssubjecttoongoingproceduresforrelieffromdoubletaxation.Settlement of the $30 million is subject to timely completion of the tax treaty processes and may be settled within the next 12 months. Settlement would not have a significant tax rate impact, as the tax rates of the counterparty jurisdictions are similar.
• Thebalanceoftheliabilityrepresentstaxadjustmentsthatareknownandcurrentlybeforethetaxauthoritiesorotherwiseidentified by the company as adjustments to filed returns. Settlement of these matters at the known amounts will not have any additional tax rate impact. Based on the expected settlement dates of various income tax examinations, the anticipated reduction in these uncertain tax positions during the next 12 months could range between about $30 million and $60 million.
Within the $210 million liability for uncertain tax positions as of December 31, 2011, are uncertain tax positions totaling $233 million that, if recognized, would impact the tax rate. If these tax liabilities are ultimately realized, $83 million of deferred tax assets would also be realized, primarily related to refunds from counterparty jurisdictions resulting from procedures for relief from double taxation.
As of December 31, 2012, the statute of limitations remains open for U.S. federal tax returns for 2000 and following years. Audit activities related to our U.S. federal tax returns through 2008 have been completed except for certain pending tax treaty procedures for relief from double taxation. These procedures pertain to U.S. federal tax returns for the years 2003 through 2008. U.S. federal tax returns for National are currently under audit for tax years through fiscal year 2012.
In non-U.S. jurisdictions, the years open to audit represent the years still open under the statute of limitations. With respect to major jurisdictions outside the U.S., our subsidiaries are no longer subject to income tax audits for years before 2005.

AN
NU
AL
RE
PO
RT
T E X A S I N S T R U M E N T S20 • 2 0 1 2 A N N U A L R E P O R T
8. Financial instruments and risk concentration
Financial instrumentsWe hold derivative financial instruments such as forward foreign currency exchange contracts and interest rate swaps, the fair value of which was not material as of December 31, 2012. Our forward foreign currency exchange contracts outstanding as of December 31, 2012, had a notional value of $305 million to hedge our non-U.S. dollar net balance sheet exposures, including $140 million to sell Japanese yen, $26 million to sell Chinese yuan and $26 million to sell British pound sterling.
Our investments in cash equivalents, short-term investments and certain long-term investments, as well as our postretirement plan assets and deferred compensation liabilities, are carried at fair value, which is described in Note 9. The carrying values for other current financial assets and liabilities, such as accounts receivable and accounts payable, approximate fair value due to the short maturity of such instruments. The carrying value of our long-term debt approximates the fair value as measured using broker-dealer quotes, which are Level 2 inputs. See Note 9 for the definition of Level 2 inputs.
Risk concentrationFinancial instruments that could subject us to concentrations of credit risk are primarily cash, cash equivalents, short-term investments and accounts receivable. To manage our credit risk exposure, we place cash investments in investment-grade debt securities and limit the amount of credit exposure to any one issuer. We also limit counterparties on financial derivative contracts to financial institutions with investment-grade ratings.
Concentrations of credit risk with respect to accounts receivable are limited due to our large number of customers and their dispersion across different industries and geographic areas. We maintain allowances for expected returns, disputes, adjustments, incentives and collectability. These allowances are deducted from accounts receivable on our Consolidated balance sheets.
Details of these Accounts receivable allowances are as follows:
Accounts receivable allowancesBalance at
Beginning of Year
Additions Charged (Credited) to
Operating ResultsRecoveries and Write-offs, Net
Balance at End of Year
2012 . . . . . . . . . . . . . . . . . . . . . . . . . . . . . . . . . . $19 $12 $ — $312011 . . . . . . . . . . . . . . . . . . . . . . . . . . . . . . . . . . 18 1 — 192010 . . . . . . . . . . . . . . . . . . . . . . . . . . . . . . . . . . 23 (4) (1) 18
9. Valuation of debt and equity investments and certain liabilities
Debt and equity investmentsWe classify our investments as available for sale, trading, equity method or cost method. Most of our investments are classified as available for sale.
Available-for-sale and trading securities are stated at fair value, which is generally based on market prices, broker quotes or, when necessary, financial models (see fair-value discussion below). Unrealized gains and losses on available-for-sale securities are recorded as an increase or decrease, net of taxes, in AOCI on our Consolidated balance sheets. We record other-than-temporary impairments on available-for-sale securities in OI&E in our Consolidated statements of income.
We classify certain mutual funds as trading securities. These mutual funds hold a variety of debt and equity investments intended to generate returns that offset changes in certain deferred compensation liabilities. We record changes in the fair value of these mutual funds and the related deferred compensation liabilities in SG&A. Changes in the fair value of debt securities classified as trading securities are recorded in OI&E.
Our other investments are not measured at fair value but are accounted for using either the equity method or cost method. These investments consist of interests in venture capital funds and other non-marketable equity securities. Gains and losses from equity-method investments are reflected in OI&E based on our ownership share of the investee’s financial results. Gains and losses on cost-method investments are recorded in OI&E when realized or when an impairment of the investment’s value is warranted based on our assessment of the recoverability of each investment.
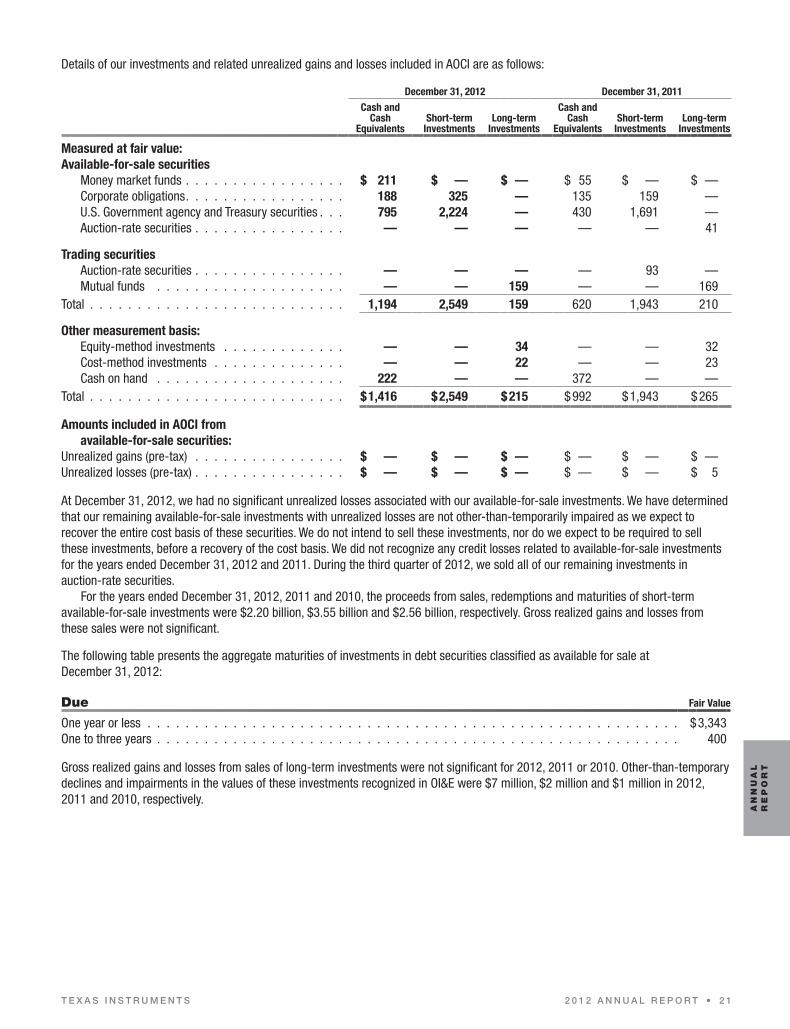
AN
NU
AL
RE
PO
RT
T E X A S I N S T R U M E N T S 2 0 1 2 A N N U A L R E P O R T • 2 1
Details of our investments and related unrealized gains and losses included in AOCI are as follows:
December 31, 2012 December 31, 2011
Cash and Cash
EquivalentsShort-term
InvestmentsLong-term
Investments
Cash and Cash
EquivalentsShort-term
InvestmentsLong-term
Investments
Measured at fair value:Available-for-sale securities
Money market funds . . . . . . . . . . . . . . . . . $ 211 $ — $ — $ 55 $ — $ —Corporate obligations . . . . . . . . . . . . . . . . . 188 325 — 135 159 —U.S. Government agency and Treasury securities . . . 795 2,224 — 430 1,691 —Auction-rate securities . . . . . . . . . . . . . . . . — — — — — 41
Trading securitiesAuction-rate securities . . . . . . . . . . . . . . . . — — — — 93 —Mutual funds . . . . . . . . . . . . . . . . . . . . — — 159 — — 169
Total . . . . . . . . . . . . . . . . . . . . . . . . . . . 1,194 2,549 159 620 1,943 210
Other measurement basis:Equity-method investments . . . . . . . . . . . . . — — 34 — — 32Cost-method investments . . . . . . . . . . . . . . — — 22 — — 23Cash on hand . . . . . . . . . . . . . . . . . . . . 222 — — 372 — —
Total . . . . . . . . . . . . . . . . . . . . . . . . . . . $1,416 $2,549 $215 $992 $1,943 $265
Amounts included in AOCI from available-for-sale securities:
Unrealized gains (pre-tax) . . . . . . . . . . . . . . . . $ — $ — $ — $ — $ — $ —Unrealized losses (pre-tax) . . . . . . . . . . . . . . . . $ — $ — $ — $ — $ — $ 5
At December 31, 2012, we had no significant unrealized losses associated with our available-for-sale investments. We have determined that our remaining available-for-sale investments with unrealized losses are not other-than-temporarily impaired as we expect to recover the entire cost basis of these securities. We do not intend to sell these investments, nor do we expect to be required to sell these investments, before a recovery of the cost basis. We did not recognize any credit losses related to available-for-sale investments for the years ended December 31, 2012 and 2011. During the third quarter of 2012, we sold all of our remaining investments in auction-rate securities.
For the years ended December 31, 2012, 2011 and 2010, the proceeds from sales, redemptions and maturities of short-term available-for-sale investments were $2.20 billion, $3.55 billion and $2.56 billion, respectively. Gross realized gains and losses from these sales were not significant.
The following table presents the aggregate maturities of investments in debt securities classified as available for sale at December 31, 2012:
Due Fair Value
One year or less . . . . . . . . . . . . . . . . . . . . . . . . . . . . . . . . . . . . . . . . . . . . . . . . . . . . . . . . $3,343One to three years . . . . . . . . . . . . . . . . . . . . . . . . . . . . . . . . . . . . . . . . . . . . . . . . . . . . . . . 400
Gross realized gains and losses from sales of long-term investments were not significant for 2012, 2011 or 2010. Other-than-temporary declines and impairments in the values of these investments recognized in OI&E were $7 million, $2 million and $1 million in 2012, 2011 and 2010, respectively.
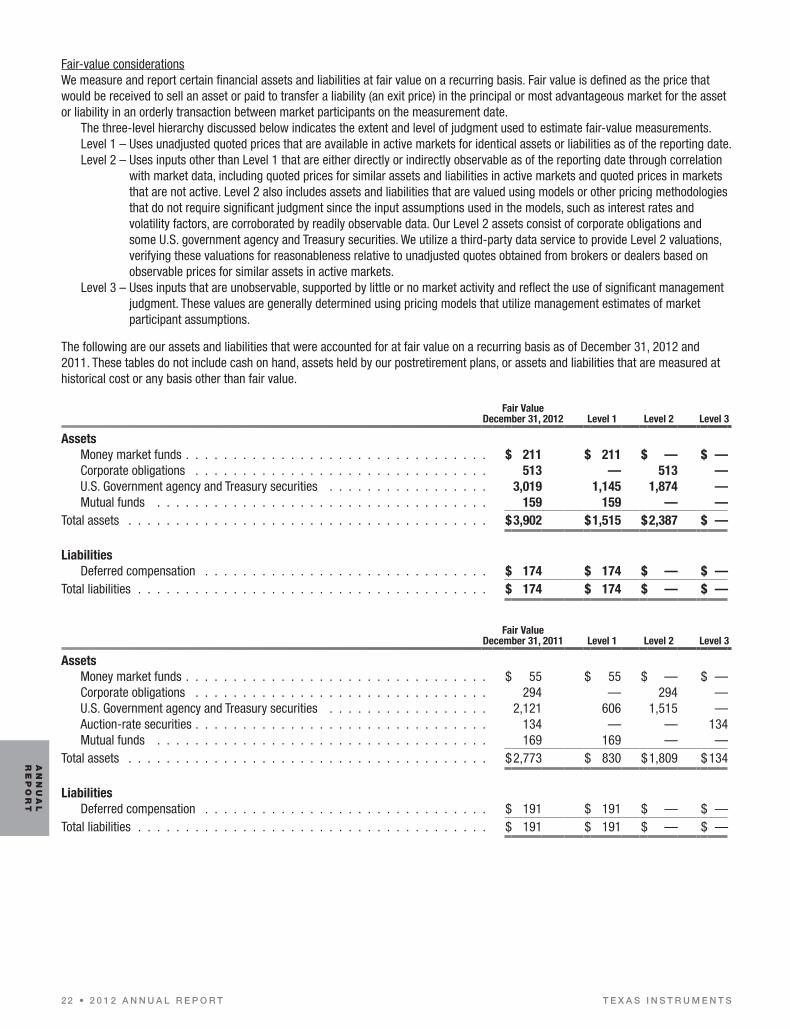
AN
NU
AL
RE
PO
RT
T E X A S I N S T R U M E N T S22 • 2 0 1 2 A N N U A L R E P O R T
Fair-value considerationsWe measure and report certain financial assets and liabilities at fair value on a recurring basis. Fair value is defined as the price that would be received to sell an asset or paid to transfer a liability (an exit price) in the principal or most advantageous market for the asset or liability in an orderly transaction between market participants on the measurement date.
The three-level hierarchy discussed below indicates the extent and level of judgment used to estimate fair-value measurements.Level 1 – Uses unadjusted quoted prices that are available in active markets for identical assets or liabilities as of the reporting date.Level 2 – Uses inputs other than Level 1 that are either directly or indirectly observable as of the reporting date through correlation
with market data, including quoted prices for similar assets and liabilities in active markets and quoted prices in markets that are not active. Level 2 also includes assets and liabilities that are valued using models or other pricing methodologies that do not require significant judgment since the input assumptions used in the models, such as interest rates and volatility factors, are corroborated by readily observable data. Our Level 2 assets consist of corporate obligations and some U.S. government agency and Treasury securities. We utilize a third-party data service to provide Level 2 valuations, verifying these valuations for reasonableness relative to unadjusted quotes obtained from brokers or dealers based on observable prices for similar assets in active markets.
Level 3 – Uses inputs that are unobservable, supported by little or no market activity and reflect the use of significant management judgment. These values are generally determined using pricing models that utilize management estimates of market participant assumptions.
The following are our assets and liabilities that were accounted for at fair value on a recurring basis as of December 31, 2012 and 2011. These tables do not include cash on hand, assets held by our postretirement plans, or assets and liabilities that are measured at historical cost or any basis other than fair value.
Fair Value December 31, 2012 Level 1 Level 2 Level 3
AssetsMoney market funds . . . . . . . . . . . . . . . . . . . . . . . . . . . . . . . . $ 211 $ 211 $ — $ —Corporate obligations . . . . . . . . . . . . . . . . . . . . . . . . . . . . . . . 513 — 513 —U.S. Government agency and Treasury securities . . . . . . . . . . . . . . . . . 3,019 1,145 1,874 —Mutual funds . . . . . . . . . . . . . . . . . . . . . . . . . . . . . . . . . . . 159 159 — —
Total assets . . . . . . . . . . . . . . . . . . . . . . . . . . . . . . . . . . . . . . $3,902 $1,515 $2,387 $ —
LiabilitiesDeferred compensation . . . . . . . . . . . . . . . . . . . . . . . . . . . . . . $ 174 $ 174 $ — $ —
Total liabilities . . . . . . . . . . . . . . . . . . . . . . . . . . . . . . . . . . . . . $ 174 $ 174 $ — $ —
Fair Value December 31, 2011 Level 1 Level 2 Level 3
AssetsMoney market funds . . . . . . . . . . . . . . . . . . . . . . . . . . . . . . . . $ 55 $ 55 $ — $ —Corporate obligations . . . . . . . . . . . . . . . . . . . . . . . . . . . . . . . 294 — 294 —U.S. Government agency and Treasury securities . . . . . . . . . . . . . . . . . 2,121 606 1,515 —Auction-rate securities . . . . . . . . . . . . . . . . . . . . . . . . . . . . . . . 134 — — 134Mutual funds . . . . . . . . . . . . . . . . . . . . . . . . . . . . . . . . . . . 169 169 — —
Total assets . . . . . . . . . . . . . . . . . . . . . . . . . . . . . . . . . . . . . . $2,773 $ 830 $1,809 $134
LiabilitiesDeferred compensation . . . . . . . . . . . . . . . . . . . . . . . . . . . . . . $ 191 $ 191 $ — $ —
Total liabilities . . . . . . . . . . . . . . . . . . . . . . . . . . . . . . . . . . . . . $ 191 $ 191 $ — $ —

AN
NU
AL
RE
PO
RT
T E X A S I N S T R U M E N T S 2 0 1 2 A N N U A L R E P O R T • 2 3
The following table summarizes the change in the fair values for Level 3 assets and liabilities for the years ended December 31, 2012 and 2011.
Level 3
Auction-rate Securities
Contingent Consideration
Balance, December 31, 2010 . . . . . . . . . . . . . . . . . . . . . . . . . . . . . . . . . . . . . . . . $ 257 $ 8Change in fair value of contingent consideration – included in operating profit . . . . . . . . . . . . . . . . — (8)Change in unrealized loss – included in AOCI . . . . . . . . . . . . . . . . . . . . . . . . . . . . . . . . (1) —Redemptions and sales . . . . . . . . . . . . . . . . . . . . . . . . . . . . . . . . . . . . . . . . . . . (122) —Balance, December 31, 2011 . . . . . . . . . . . . . . . . . . . . . . . . . . . . . . . . . . . . . . . . 134 —
Change in unrealized loss – included in AOCI . . . . . . . . . . . . . . . . . . . . . . . . . . . . . . . 13 —Redemptions . . . . . . . . . . . . . . . . . . . . . . . . . . . . . . . . . . . . . . . . . . . . . . . . (84) —Sales . . . . . . . . . . . . . . . . . . . . . . . . . . . . . . . . . . . . . . . . . . . . . . . . . . . . (63) —Balance, December 31, 2012 . . . . . . . . . . . . . . . . . . . . . . . . . . . . . . . . . . . . . . . . $ — $ —
10. Goodwill and acquisition-related intangibles
The following table summarizes the changes in goodwill by segment for the years ended December 31, 2012 and 2011.
AnalogEmbedded Processing Wireless Other Total
Goodwill, December 31, 2010 . . . . . . . . . . . . . . . . . . . . . . . . . $ 630 $172 $ 90 $ 32 $ 924Additions from acquisitions . . . . . . . . . . . . . . . . . . . . . . . . . . 3,528 — — — 3,528Goodwill, December 31, 2011 . . . . . . . . . . . . . . . . . . . . . . . . . 4,158 172 90 32 4,452
Impairment . . . . . . . . . . . . . . . . . . . . . . . . . . . . . . . . . . — — (90) — (90)Goodwill, December 31, 2012 . . . . . . . . . . . . . . . . . . . . . . . . $4,158 $172 $ — $ 32 $4,362
We performed our annual goodwill impairment test as of October 1, 2012, and determined the fair value of each of our reporting units was in excess of its carrying value. Determination of fair value was based upon management estimates and judgment, using unobservable inputs in discounted cash flow models to calculate the fair value of each reporting unit. These unobservable inputs are considered Level 3 measurements.
In November 2012, as a result of unsuccessful efforts to divest certain product lines in the Wireless business and the subsequent decision to restructure and wind down those product lines, we reassessed the recoverability of the goodwill associated with the Wireless segment. We determined its fair value, using a discounted cash flow analysis, was less than the carrying amount and, therefore, performed the required second step of the impairment analysis to determine the amount of the impairment charge. We deducted the fair value of the Wireless segment from the total of the estimated fair values of the segment’s identifiable assets and liabilities, including intangible assets with no carrying value. This calculation resulted in an implied negative fair value of goodwill. As a result, we recognized a non-cash, non-tax deductible impairment charge of $90 million for all the associated goodwill of this segment. We recognized this impairment in Restructuring charges/other in the Consolidated statements of income, as discussed in Note 3. There was no impairment of goodwill during 2011 or 2010.

AN
NU
AL
RE
PO
RT
T E X A S I N S T R U M E N T S24 • 2 0 1 2 A N N U A L R E P O R T
The addition to Analog goodwill in 2011 was from the National acquisition. We also recognized other intangible assets associated with this acquisition of $2.96 billion, primarily for developed technology and customer relationships. In 2012, we had no additional intangible assets from an acquisition. The components of acquisition-related intangible assets as of December 31, 2012 and 2011, are as follows:
December 31, 2012 December 31, 2011
Amortization Period (Years)
Gross Carrying Amount
Accumulated Amortization Net
Gross Carrying Amount
Accumulated Amortization Net
Acquisition-related intangibles:Developed technology . . . . . . . . . . . . . . . 4 - 10 $2,145 $312 $1,833 $2,089 $ 91 $1,998Customer relationships . . . . . . . . . . . . . . . 5 - 8 821 137 684 822 34 788Other intangibles . . . . . . . . . . . . . . . . . 2 - 7 46 36 10 50 29 21In-process R&D . . . . . . . . . . . . . . . . . . (a) 31 n/a 31 93 n/a 93
Total . . . . . . . . . . . . . . . . . . . . . . . . . . $3,043 $485 $2,558 $3,054 $154 $2,900
(a) In-process R&D is not amortized until the associated project has been completed. Alternatively, if the associated project is determined not to be viable, it will be expensed.
Amortization of acquisition-related intangibles was $342 million, $111 million and $48 million for 2012, 2011 and 2010, respectively, primarily related to developed technology. Amortization expenses related to the National acquisition were $325 million and $87 million for 2012 and 2011, respectively. Future estimated amortization of acquisition-related intangibles for the years ended December 31 is as follows:
2013 . . . . . . . . . . . . . . . . . . . . . . . . . . . . . . . . . . . . . . . . . . . . . . . . . . . . . . . . . . . . . . . $3352014 . . . . . . . . . . . . . . . . . . . . . . . . . . . . . . . . . . . . . . . . . . . . . . . . . . . . . . . . . . . . . . . 3212015 . . . . . . . . . . . . . . . . . . . . . . . . . . . . . . . . . . . . . . . . . . . . . . . . . . . . . . . . . . . . . . . 3192016 . . . . . . . . . . . . . . . . . . . . . . . . . . . . . . . . . . . . . . . . . . . . . . . . . . . . . . . . . . . . . . . 3192017 . . . . . . . . . . . . . . . . . . . . . . . . . . . . . . . . . . . . . . . . . . . . . . . . . . . . . . . . . . . . . . . 318Thereafter . . . . . . . . . . . . . . . . . . . . . . . . . . . . . . . . . . . . . . . . . . . . . . . . . . . . . . . . . . . . 946
11. Postretirement benefit plans
Plan descriptionsWe have various employee retirement plans including defined benefit, defined contribution and retiree health care benefit plans. For qualifying employees, we offer deferred compensation arrangements. As a part of the National acquisition, we assumed the assets and liabilities of its defined benefit plans, primarily those associated with the United Kingdom and Germany.
U.S. retirement plans:Our principal retirement plans in the U.S. are qualified and non-qualified defined benefit pension plans (all of which were closed to new participants after November 1997), a defined contribution plan and an enhanced defined contribution plan. The defined benefit pension plans include employees still accruing benefits as well as employees and participants who no longer accrue service-related benefits, but instead, may participate in the enhanced defined contribution plan.
Both defined contribution plans offer an employer-matching savings option that allows employees to make pre-tax contributions to various investment choices, including a TI common stock fund. Employees who elected to continue accruing a benefit in the qualified defined benefit pension plans may also participate in the defined contribution plan, where employer-matching contributions are provided for up to 2 percent of the employee’s annual eligible earnings. Employees who elected not to continue accruing a benefit in the defined benefit pension plans, and employees hired after November 1997 and through December 31, 2003, may participate in the enhanced defined contribution plan. This plan provides for a fixed employer contribution of 2 percent of the employee’s annual eligible earnings, plus an employer-matching contribution of up to 4 percent of the employee’s annual eligible earnings. Employees hired after December 31, 2003, do not receive the fixed employer contribution of 2 percent of the employee’s annual eligible earnings.
At December 31, 2012 and 2011, as a result of employees’ elections, TI’s U.S. defined contribution plans held shares of TI common stock totaling 20 million shares and 22 million shares valued at $610 million and $639 million, respectively. Dividends paid on these shares for 2012 and 2011 were $16 million and $13 million, respectively.
Our aggregate expense for the U.S. defined contribution plans was $70 million in 2012, $55 million in 2011 and $50 million in 2010.

AN
NU
AL
RE
PO
RT
T E X A S I N S T R U M E N T S 2 0 1 2 A N N U A L R E P O R T • 2 5
Benefits under the qualified defined benefit pension plan are determined using a formula based upon years of service and the highest five consecutive years of compensation. We intend to contribute amounts to this plan to meet the minimum funding requirements of applicable local laws and regulations, plus such additional amounts as we deem appropriate. The non-qualified defined benefit plans are unfunded and closed to new participants.
U.S. retiree health care benefit plan:U.S. employees who meet eligibility requirements are offered medical coverage during retirement. We make a contribution toward
the cost of those retiree medical benefits for certain retirees and their dependents. The contribution rates are based upon various factors, the most important of which are an employee’s date of hire, date of retirement, years of service and eligibility for Medicare benefits. The balance of the cost is borne by the plan’s participants. Employees hired after January 1, 2001, are responsible for the full cost of their medical benefits during retirement.
Non-U.S. retirement plans:We provide retirement coverage for non-U.S. employees, as required by local laws or to the extent we deem appropriate, through a number of defined benefit and defined contribution plans. Retirement benefits are generally based on an employee’s years of service and compensation. Funding requirements are determined on an individual country and plan basis and are subject to local country practices and market circumstances.
As of December 31, 2012 and 2011, as a result of employees’ elections, TI’s non-U.S. defined contribution plans held TI common stock valued at $13 million and $12 million, respectively. Dividends paid on these shares of TI common stock for 2012 and 2011 were not material.
Effect on the statements of income and balance sheets
Expense related to defined benefit and retiree health care benefit plans was as follows:
U.S. Defined Benefit U.S. Retiree Health Care Non-U.S. Defined Benefit
2012 2011 2010 2012 2011 2010 2012 2011 2010
Service cost . . . . . . . . . . . . . . . . . . . . . . . . $ 24 $ 22 $ 20 $ 5 $ 4 $ 4 $ 45 $ 41 $ 37Interest cost . . . . . . . . . . . . . . . . . . . . . . . . 44 46 45 25 25 26 75 69 62Expected return on plan assets . . . . . . . . . . . . . . (50) (45) (49) (23) (21) (23) (78) (83) (73)Amortization of prior service cost (credit) . . . . . . . . . 1 1 1 3 2 2 (4) (4) (3)Recognized net actuarial loss . . . . . . . . . . . . . . . 16 23 22 13 13 12 41 40 30Net periodic benefit costs . . . . . . . . . . . . . . . . . 35 47 39 23 23 21 79 63 53
Settlement charges (a) (b) . . . . . . . . . . . . . . . . . — — 37 — — — 193 — —Curtailment charges (credits) . . . . . . . . . . . . . . . — — — (1) 5 — — 2 —Special termination benefit charges (credits) (b) . . . . . . (1) 4 — — — — (337) — —Total, including charges . . . . . . . . . . . . . . . . . . $ 34 $ 51 $ 76 $ 22 $ 28 $ 21 $ (65) $ 65 $ 53
(a) Includes restructuring and non-restructuring-related settlement charges.(b) In Japan, we maintain employee pension fund plans (EPFs) pursuant to the Japanese Welfare Pension Insurance Law (JWPIL). An
EPF consists of two portions: a substitutional portion based on JWPIL-determined minimum old-age pension benefits similar to Social Security benefits in the United States; and a corporate portion established at the discretion of each employer. Employers and employees are exempt from contributing to the Japanese Pension Insurance (JPI) if the substitutional portion is funded by an EPF.
The JWPIL was amended to permit each EPF to separate the substitutional portion and transfer those obligations and related assets to the government of Japan. After such a transfer, the employer is required to contribute periodically to JPI, and the government of Japan is responsible for future benefit payments relating to the substitutional portion.
During the third quarter of 2012, our EPF received final approval for such a separation and transferred the obligations and assets of its substitutional portion to the government of Japan. On a pre-tax basis, this resulted in a net gain of $144 million recorded in Restructuring charges/other on our Consolidated statements of income and included in Other. This net gain of $144 million consisted of two parts – a gain of $337 million, representing the difference between the fair values of the obligations settled ($533 million) and the assets transferred from the pension trust to the government of Japan ($196 million), offset by a settlement loss of $193 million related to the recognition of previously unrecognized actuarial losses included in AOCI.
For the U.S. qualified pension and retiree health care plans, the expected return on the plan assets component of net periodic benefit cost is based upon a market-related value of assets. In accordance with U.S. GAAP, the market-related value of assets is adjusted by a smoothing technique whereby certain gains and losses are phased in over a period of three years.

AN
NU
AL
RE
PO
RT
T E X A S I N S T R U M E N T S26 • 2 0 1 2 A N N U A L R E P O R T
Changes in the benefit obligations and plan assets for the defined benefit and retiree health care benefit plans were as follows:
U.S. Defined Benefit
U.S. Retiree Health Care
Non-U.S. Defined Benefit
2012 2011 2012 2011 2012 2011
Change in plan benefit obligation:Benefit obligation at beginning of year . . . . . . . . . . . . . . . . . . . . $ 959 $880 $521 $473 $2,748 $2,217
Service cost . . . . . . . . . . . . . . . . . . . . . . . . . . . . . . . 24 22 5 4 45 41Interest cost . . . . . . . . . . . . . . . . . . . . . . . . . . . . . . . 44 46 25 25 75 69Participant contributions . . . . . . . . . . . . . . . . . . . . . . . . . — — 17 18 1 1Benefits paid . . . . . . . . . . . . . . . . . . . . . . . . . . . . . . . (45) (52) (47) (43) (83) (72)Medicare subsidy . . . . . . . . . . . . . . . . . . . . . . . . . . . . — — 5 4 — —Actuarial (gain) loss . . . . . . . . . . . . . . . . . . . . . . . . . . . 116 61 (17) 19 222 91Settlements . . . . . . . . . . . . . . . . . . . . . . . . . . . . . . . — — — — (533) (1)Curtailments . . . . . . . . . . . . . . . . . . . . . . . . . . . . . . . 1 (2) (1) 4 — (3)Assumed with National acquisition . . . . . . . . . . . . . . . . . . . . — — — — — 301Special termination benefit charges (credits) . . . . . . . . . . . . . . . (1) 4 — — — —Plan amendments . . . . . . . . . . . . . . . . . . . . . . . . . . . . — — 1 17 — —Effects of exchange rate changes . . . . . . . . . . . . . . . . . . . . — — — — (61) 104
Benefit obligation at end of year (BO) . . . . . . . . . . . . . . . . . . . . $1,098 $959 $509 $521 $2,414 $2,748
Change in plan assets:Fair value of plan assets at beginning of year . . . . . . . . . . . . . . . . $ 914 $833 $431 $404 $2,211 $1,835
Actual return on plan assets . . . . . . . . . . . . . . . . . . . . . . . 95 106 37 6 207 53Employer contributions (funding of qualified plans) . . . . . . . . . . . . 104 25 78 46 134 72Employer contributions (payments for non-qualified plans) . . . . . . . . 3 2 — — — —Participant contributions . . . . . . . . . . . . . . . . . . . . . . . . . — — 17 18 1 1Assumed with National acquisition . . . . . . . . . . . . . . . . . . . . — — — — — 235Benefits paid . . . . . . . . . . . . . . . . . . . . . . . . . . . . . . . (45) (52) (46) (43) (83) (72)Settlements . . . . . . . . . . . . . . . . . . . . . . . . . . . . . . . — — — — (196) (1)Effects of exchange rate changes . . . . . . . . . . . . . . . . . . . . — — — — (56) 88
Fair value of plan assets at end of year (FVPA) . . . . . . . . . . . . . . . . $1,071 $914 $517 $431 $2,218 $2,211
Funded status (FVPA – BO) at end of year . . . . . . . . . . . . . . . . . . $ (27) $ (45) $ 8 $ (90) $ (196) $ (537)
Amounts recognized on the balance sheet as of December 31, 2012, were as follows:
U.S. Defined Benefit
U.S. Retiree Health Care
Non-U.S. Defined Benefit Total
Overfunded retirement plans . . . . . . . . . . . . . . . . . . . . . . . . . . . . . . . $ 34 $ 12 $ 22 $ 68Accrued expenses and other liabilities . . . . . . . . . . . . . . . . . . . . . . . . . . (8) — (6) (14)Underfunded retirement plans . . . . . . . . . . . . . . . . . . . . . . . . . . . . . . . (53) (4) (212) (269)Funded status (FVPA – BO) at end of year . . . . . . . . . . . . . . . . . . . . . . . . . $(27) $ 8 $(196) $(215)
Amounts recognized on the balance sheet as of December 31, 2011, were as follows:
U.S. Defined Benefit
U.S. Retiree Health Care
Non-U.S. Defined Benefit Total
Overfunded retirement plans . . . . . . . . . . . . . . . . . . . . . . . . . . . . . . . . . $ 11 $ — $ 29 $ 40Accrued expenses and other liabilities . . . . . . . . . . . . . . . . . . . . . . . . . . . . (2) — (9) (11)Underfunded retirement plans . . . . . . . . . . . . . . . . . . . . . . . . . . . . . . . . (54) (90) (557) (701)Funded status (FVPA – BO) at end of year . . . . . . . . . . . . . . . . . . . . . . . . . . $(45) $(90) $(537) $(672)
Contributions to the plans meet or exceed all minimum funding requirements. We expect to contribute about $100 million to our retirement benefit plans in 2013. The amounts shown for underfunded U.S. defined benefit plans were for non-qualified pension plans. Because contributions to those non-qualified plans are not tax deductible until the benefit is actually paid to the employee, we do not fund them. As of December 31, 2012 and 2011, the unfunded benefit obligations of those non-qualified plans were $61 million and $56 million, respectively.

AN
NU
AL
RE
PO
RT
T E X A S I N S T R U M E N T S 2 0 1 2 A N N U A L R E P O R T • 2 7
Accumulated benefit obligations, which represent the benefit obligations excluding the impact of future salary increases, were $1.01 billion and $875 million at year-end 2012 and 2011, respectively, for the U.S. defined benefit plans, and $2.23 billion and $2.54 billion at year-end 2012 and 2011, respectively, for the non-U.S. defined benefit plans.
The amounts recorded in AOCI for the years ended December 31, 2012 and 2011, are detailed below by plan type:
U.S. Defined Benefit
U.S. Retiree Health Care
Non-U.S. Defined Benefit Total
Net Actuarial
Loss
Prior Service
Cost
Net Actuarial
Loss
Prior Service
Cost
Net Actuarial
Loss
Prior Service
Cost
Net Actuarial
Loss
Prior Service
Cost
AOCI balance, December 31, 2011, net of taxes . . . . . $140 $ — $140 $14 $ 500 $(23) $ 780 $ (9)
Changes in AOCI by category in 2012:Annual adjustments . . . . . . . . . . . . . . . . 72 — (31) 1 68 2 109 3Reclassification of recognized transactions . . . . (16) (1) (13) (3) (234) 4 (263) —Less tax expense (benefit) . . . . . . . . . . . . . (20) — 16 1 79 (2) 75 (1)Total change to AOCI in 2012 . . . . . . . . . . . . 36 (1) (28) (1) (87) 4 (79) 2
AOCI balance, December 31, 2012, net of taxes . . . . $176 $ (1) $112 $13 $ 413 $(19) $ 701 $ (7)
The estimated amounts of net actuarial loss and unrecognized prior service cost (credit) included in AOCI as of December 31, 2012, that are expected to be amortized into net periodic benefit cost over the next fiscal year are: $23 million and $1 million for the U.S. defined benefit plans; $11 million and $4 million for the U.S. retiree health care plan; and $39 million and ($4) million for the non-U.S. defined benefit plans.
Information on plan assetsWe report and measure the plan assets of our defined benefit pension and other postretirement plans at fair value. The tables below set forth the fair value of our plan assets as of December 31, 2012 and 2011, using the same three-level hierarchy of fair-value inputs described in Note 9.
Fair Value December 31, 2012 Level 1 Level 2 Level 3
Assets of U.S. defined benefit planMoney market collective trusts . . . . . . . . . . . . . . . . . . . . . . . . . . $ 119 $ — $ 119 $ —U.S. Government agency and Treasury securities . . . . . . . . . . . . . . . . . 247 — 247 —U.S. bond funds . . . . . . . . . . . . . . . . . . . . . . . . . . . . . . . . . . 368 — 368 —U.S. equity funds and option collars . . . . . . . . . . . . . . . . . . . . . . . . 219 — 219 —International equity funds . . . . . . . . . . . . . . . . . . . . . . . . . . . . . 81 — 81 —Limited partnerships . . . . . . . . . . . . . . . . . . . . . . . . . . . . . . . . 37 — — 37
Total . . . . . . . . . . . . . . . . . . . . . . . . . . . . . . . . . . . . . . . . . . $1,071 $ — $1,034 $ 37
Assets of U.S. retiree health care planMoney market collective trusts . . . . . . . . . . . . . . . . . . . . . . . . . . . $ 49 $ — $ 49 $ —U.S. bond funds . . . . . . . . . . . . . . . . . . . . . . . . . . . . . . . . . . 205 205 — —U.S. equity funds and option collars . . . . . . . . . . . . . . . . . . . . . . . . 197 46 151 —International equity funds . . . . . . . . . . . . . . . . . . . . . . . . . . . . . 66 — 66 —
Total . . . . . . . . . . . . . . . . . . . . . . . . . . . . . . . . . . . . . . . . . . $ 517 $251 $ 266 $ —
Assets of non-U.S. defined benefit plansCash and money market collective trusts . . . . . . . . . . . . . . . . . . . . . . $ 133 $ 88 $ 45 $ —Local market bond funds . . . . . . . . . . . . . . . . . . . . . . . . . . . . . 942 183 759 —International/global bond funds . . . . . . . . . . . . . . . . . . . . . . . . . . 343 19 324 —Local market equity funds . . . . . . . . . . . . . . . . . . . . . . . . . . . . . 204 20 184 —International/global equity funds . . . . . . . . . . . . . . . . . . . . . . . . . . 564 — 564 —Other investments . . . . . . . . . . . . . . . . . . . . . . . . . . . . . . . . . 32 — 13 19
Total . . . . . . . . . . . . . . . . . . . . . . . . . . . . . . . . . . . . . . . . . . $2,218 $310 $1,889 $ 19

AN
NU
AL
RE
PO
RT
T E X A S I N S T R U M E N T S28 • 2 0 1 2 A N N U A L R E P O R T
Fair Value December 31, 2011 Level 1 Level 2 Level 3
Assets of U.S. defined benefit planMoney market collective trusts . . . . . . . . . . . . . . . . . . . . . . . . . . . . $ 23 $ — $ 23 $ —U.S. Government agency and Treasury securities . . . . . . . . . . . . . . . . . . 266 244 22 —U.S. bond funds . . . . . . . . . . . . . . . . . . . . . . . . . . . . . . . . . . . 309 — 309 —U.S. equity funds and option collars . . . . . . . . . . . . . . . . . . . . . . . . . 229 — 229 —International equity funds . . . . . . . . . . . . . . . . . . . . . . . . . . . . . . 52 — 52 —Limited partnerships . . . . . . . . . . . . . . . . . . . . . . . . . . . . . . . . . 35 — — 35
Total . . . . . . . . . . . . . . . . . . . . . . . . . . . . . . . . . . . . . . . . . . . $ 914 $244 $ 635 $ 35
Assets of U.S. retiree health care planMoney market collective trusts . . . . . . . . . . . . . . . . . . . . . . . . . . . . $ 50 $ — $ 50 $ —U.S. bond funds . . . . . . . . . . . . . . . . . . . . . . . . . . . . . . . . . . . 175 175 — —U.S. equity funds and option collars . . . . . . . . . . . . . . . . . . . . . . . . . 159 40 119 —International equity funds . . . . . . . . . . . . . . . . . . . . . . . . . . . . . . 47 — 47 —
Total . . . . . . . . . . . . . . . . . . . . . . . . . . . . . . . . . . . . . . . . . . . $ 431 $215 $ 216 $ —
Assets of non-U.S. defined benefit plansCash and money market collective trusts . . . . . . . . . . . . . . . . . . . . . . . $ 50 $ 41 $ 9 $ —Local market bond funds . . . . . . . . . . . . . . . . . . . . . . . . . . . . . . 1,129 209 920 —International/global bond funds . . . . . . . . . . . . . . . . . . . . . . . . . . . 335 3 332 —Local market equity funds . . . . . . . . . . . . . . . . . . . . . . . . . . . . . . 133 13 120 —International/global equity funds . . . . . . . . . . . . . . . . . . . . . . . . . . . 521 136 385 —Other investments . . . . . . . . . . . . . . . . . . . . . . . . . . . . . . . . . . 43 — 25 18
Total . . . . . . . . . . . . . . . . . . . . . . . . . . . . . . . . . . . . . . . . . . . $2,211 $402 $1,791 $ 18
The investments in our major benefit plans largely consist of low-cost, broad-market index funds to mitigate risks of concentration within market sectors. In recent years, our investment policy has shifted toward a closer matching of the interest rate sensitivity of the plan assets and liabilities. The appropriate mix of equity and bond investments is determined primarily through the use of detailed asset-liability modeling studies that look to balance the impact of changes in the discount rate against the need to provide asset growth to cover future service cost. Most of our plans around the world have added a greater proportion of fixed income securities with return characteristics that are more closely aligned with changes in the liabilities caused by discount rate volatility. For the U.S. plans, we utilize an option collar strategy to reduce the volatility of returns on investments in U.S. equity funds.
The only Level 3 assets in our worldwide benefit plans are certain private equity limited partnerships in our U.S. pension plan and diversified hedge and property funds in a non-U.S. pension plan. These investments are valued using inputs from the fund managers and internal models. The following table summarizes the change in the fair values for Level 3 plan assets for the years ending December 31, 2012 and 2011:
Level 3 Plan Assets
U.S. Defined Benefit
Non-U.S. Defined Benefit
Balance, December 31, 2010 . . . . . . . . . . . . . . . . . . . . . . . . . . . . . . . . . . . . . . . . . . . . $ 34 $ 51Redemptions . . . . . . . . . . . . . . . . . . . . . . . . . . . . . . . . . . . . . . . . . . . . . . . . . . — (51)Unrealized gain . . . . . . . . . . . . . . . . . . . . . . . . . . . . . . . . . . . . . . . . . . . . . . . . . 1 —Assumed with National acquisition . . . . . . . . . . . . . . . . . . . . . . . . . . . . . . . . . . . . . . . — 18
Balance, December 31, 2011 . . . . . . . . . . . . . . . . . . . . . . . . . . . . . . . . . . . . . . . . . . . . 35 18Redemptions . . . . . . . . . . . . . . . . . . . . . . . . . . . . . . . . . . . . . . . . . . . . . . . . . (2) —Unrealized gain . . . . . . . . . . . . . . . . . . . . . . . . . . . . . . . . . . . . . . . . . . . . . . . . 4 1
Balance, December 31, 2012 . . . . . . . . . . . . . . . . . . . . . . . . . . . . . . . . . . . . . . . . . . . $ 37 $ 19

AN
NU
AL
RE
PO
RT
T E X A S I N S T R U M E N T S 2 0 1 2 A N N U A L R E P O R T • 2 9
Assumptions and investment policies
Defined BenefitU.S. Retiree Health Care
2012 2011 2012 2011
Weighted average assumptions used to determine benefit obligations:U.S. discount rate . . . . . . . . . . . . . . . . . . . . . . . . . . . . . . . . . . . . . . . . . 4.16% 4.92% 3.97% 4.89%Non-U.S. discount rate . . . . . . . . . . . . . . . . . . . . . . . . . . . . . . . . . . . . . . . 2.80% 2.89%
U.S. average long-term pay progression . . . . . . . . . . . . . . . . . . . . . . . . . . . . . . 3.50% 3.50%Non-U.S. average long-term pay progression . . . . . . . . . . . . . . . . . . . . . . . . . . . 3.10% 3.18%
Weighted average assumptions used to determine net periodic benefit cost:U.S. discount rate . . . . . . . . . . . . . . . . . . . . . . . . . . . . . . . . . . . . . . . . . 4.92% 5.58% 4.86% 5.48%Non-U.S. discount rate . . . . . . . . . . . . . . . . . . . . . . . . . . . . . . . . . . . . . . . 2.88% 2.79%
U.S. long-term rate of return on plan assets . . . . . . . . . . . . . . . . . . . . . . . . . . . . 6.00% 6.25% 5.50% 5.50%Non-U.S. long-term rate of return on plan assets . . . . . . . . . . . . . . . . . . . . . . . . . 3.83% 4.17%
U.S. average long-term pay progression . . . . . . . . . . . . . . . . . . . . . . . . . . . . . . 3.50% 3.40%Non-U.S. average long-term pay progression . . . . . . . . . . . . . . . . . . . . . . . . . . . 3.17% 3.24%
We utilize a variety of methods to select an appropriate discount rate depending on the depth of the corporate bond market in the country in which the benefit plan operates. In the U.S., we use a settlement approach whereby a portfolio of bonds is selected from the universe of actively traded high-quality U.S. corporate bonds. The selected portfolio is designed to provide cash flows sufficient to pay the plan’s expected benefit payments when due. The resulting discount rate reflects the rate of return of the selected portfolio of bonds. For our non-U.S. locations with a sufficient number of actively traded high-quality bonds, an analysis is performed in which the projected cash flows from the defined benefit plans are discounted against a yield curve constructed with an appropriate universe of high-quality corporate bonds available in each country. In this manner, a present value is developed. The discount rate selected is the single equivalent rate that produces the same present value. Both the settlement approach and the yield curve approach produce a discount rate that recognizes each plan’s distinct liability characteristics. For countries that lack a sufficient corporate bond market, a government bond index adjusted for an appropriate risk premium is used to establish the discount rate.
Assumptions for the expected long-term rate of return on plan assets are based on future expectations for returns for each asset class and the effect of periodic target asset allocation rebalancing. We adjust the results for the payment of reasonable expenses of the plan from plan assets. We believe our assumptions are appropriate based on the investment mix and long-term nature of the plans’ investments. Assumptions used for the non-U.S. defined benefit plans reflect the different economic environments within the various countries.
The table below shows target allocation ranges for the plans that hold a substantial majority of the defined benefit assets.
Asset categoryU.S. Defined
BenefitU.S. Retiree Health Care
Non-U.S. Defined Benefit
Equity securities . . . . . . . . . . . . . . . . . . . . . . . . . . . . . . . . . . . . . . . . 35% 50% 25% - 60%Fixed income securities and cash equivalents . . . . . . . . . . . . . . . . . . . . . . . . . 65% 50% 40% - 75%
We intend to rebalance the plans’ investments when they are not within the target allocation ranges. Additional contributions are invested consistent with the target ranges and may be used to rebalance the portfolio. The investment allocations and individual investments are chosen with regard to the duration of the obligations of each plan.
Weighted average asset allocations as of December 31, are as follows:
U.S. Defined Benefit
U.S. RetireeHealth Care
Non-U.S.Defined Benefit
Asset category 2012 2011 2012 2011 2012 2011
Equity securities . . . . . . . . . . . . . . . . . . . . . . . . . . . . . . . . . . 31% 35% 51% 48% 36% 32%Fixed income securities . . . . . . . . . . . . . . . . . . . . . . . . . . . . . . 58% 63% 40% 41% 58% 66%Cash equivalents . . . . . . . . . . . . . . . . . . . . . . . . . . . . . . . . . . 11% 2% 9% 11% 6% 2%
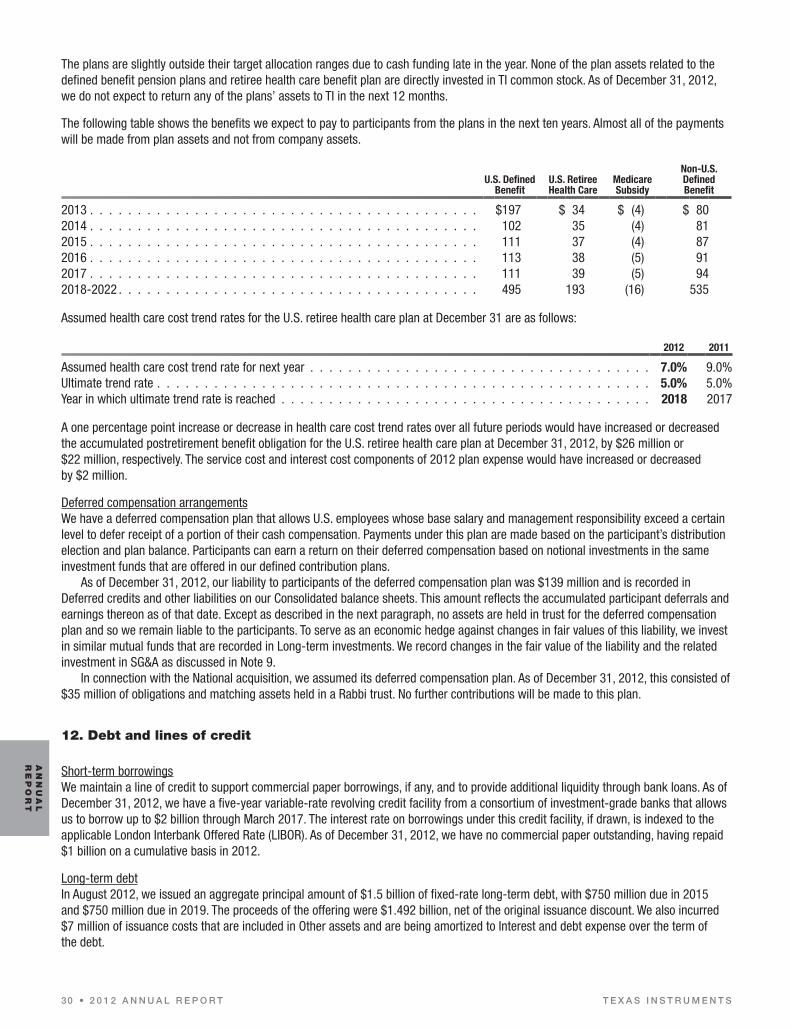
AN
NU
AL
RE
PO
RT
T E X A S I N S T R U M E N T S30 • 2 0 1 2 A N N U A L R E P O R T
The plans are slightly outside their target allocation ranges due to cash funding late in the year. None of the plan assets related to the defined benefit pension plans and retiree health care benefit plan are directly invested in TI common stock. As of December 31, 2012, we do not expect to return any of the plans’ assets to TI in the next 12 months.
The following table shows the benefits we expect to pay to participants from the plans in the next ten years. Almost all of the payments will be made from plan assets and not from company assets.
U.S. Defined Benefit
U.S. RetireeHealth Care
MedicareSubsidy
Non-U.S. Defined Benefit
2013 . . . . . . . . . . . . . . . . . . . . . . . . . . . . . . . . . . . . . . . . . $197 $ 34 $ (4) $ 802014 . . . . . . . . . . . . . . . . . . . . . . . . . . . . . . . . . . . . . . . . . 102 35 (4) 812015 . . . . . . . . . . . . . . . . . . . . . . . . . . . . . . . . . . . . . . . . . 111 37 (4) 872016 . . . . . . . . . . . . . . . . . . . . . . . . . . . . . . . . . . . . . . . . . 113 38 (5) 912017 . . . . . . . . . . . . . . . . . . . . . . . . . . . . . . . . . . . . . . . . . 111 39 (5) 942018-2022 . . . . . . . . . . . . . . . . . . . . . . . . . . . . . . . . . . . . . . 495 193 (16) 535
Assumed health care cost trend rates for the U.S. retiree health care plan at December 31 are as follows:
2012 2011
Assumed health care cost trend rate for next year . . . . . . . . . . . . . . . . . . . . . . . . . . . . . . . . . . . . 7.0% 9.0%Ultimate trend rate . . . . . . . . . . . . . . . . . . . . . . . . . . . . . . . . . . . . . . . . . . . . . . . . . . . . 5.0% 5.0%Year in which ultimate trend rate is reached . . . . . . . . . . . . . . . . . . . . . . . . . . . . . . . . . . . . . . . 2018 2017
A one percentage point increase or decrease in health care cost trend rates over all future periods would have increased or decreased the accumulated postretirement benefit obligation for the U.S. retiree health care plan at December 31, 2012, by $26 million or $22 million, respectively. The service cost and interest cost components of 2012 plan expense would have increased or decreased by $2 million.
Deferred compensation arrangementsWe have a deferred compensation plan that allows U.S. employees whose base salary and management responsibility exceed a certain level to defer receipt of a portion of their cash compensation. Payments under this plan are made based on the participant’s distribution election and plan balance. Participants can earn a return on their deferred compensation based on notional investments in the same investment funds that are offered in our defined contribution plans.
As of December 31, 2012, our liability to participants of the deferred compensation plan was $139 million and is recorded in Deferred credits and other liabilities on our Consolidated balance sheets. This amount reflects the accumulated participant deferrals and earnings thereon as of that date. Except as described in the next paragraph, no assets are held in trust for the deferred compensation plan and so we remain liable to the participants. To serve as an economic hedge against changes in fair values of this liability, we invest in similar mutual funds that are recorded in Long-term investments. We record changes in the fair value of the liability and the related investment in SG&A as discussed in Note 9.
In connection with the National acquisition, we assumed its deferred compensation plan. As of December 31, 2012, this consisted of $35 million of obligations and matching assets held in a Rabbi trust. No further contributions will be made to this plan.
12. Debt and lines of credit
Short-term borrowingsWe maintain a line of credit to support commercial paper borrowings, if any, and to provide additional liquidity through bank loans. As of December 31, 2012, we have a five-year variable-rate revolving credit facility from a consortium of investment-grade banks that allows us to borrow up to $2 billion through March 2017. The interest rate on borrowings under this credit facility, if drawn, is indexed to the applicable London Interbank Offered Rate (LIBOR). As of December 31, 2012, we have no commercial paper outstanding, having repaid $1 billion on a cumulative basis in 2012.
Long-term debtIn August 2012, we issued an aggregate principal amount of $1.5 billion of fixed-rate long-term debt, with $750 million due in 2015 and $750 million due in 2019. The proceeds of the offering were $1.492 billion, net of the original issuance discount. We also incurred $7 million of issuance costs that are included in Other assets and are being amortized to Interest and debt expense over the term of the debt.
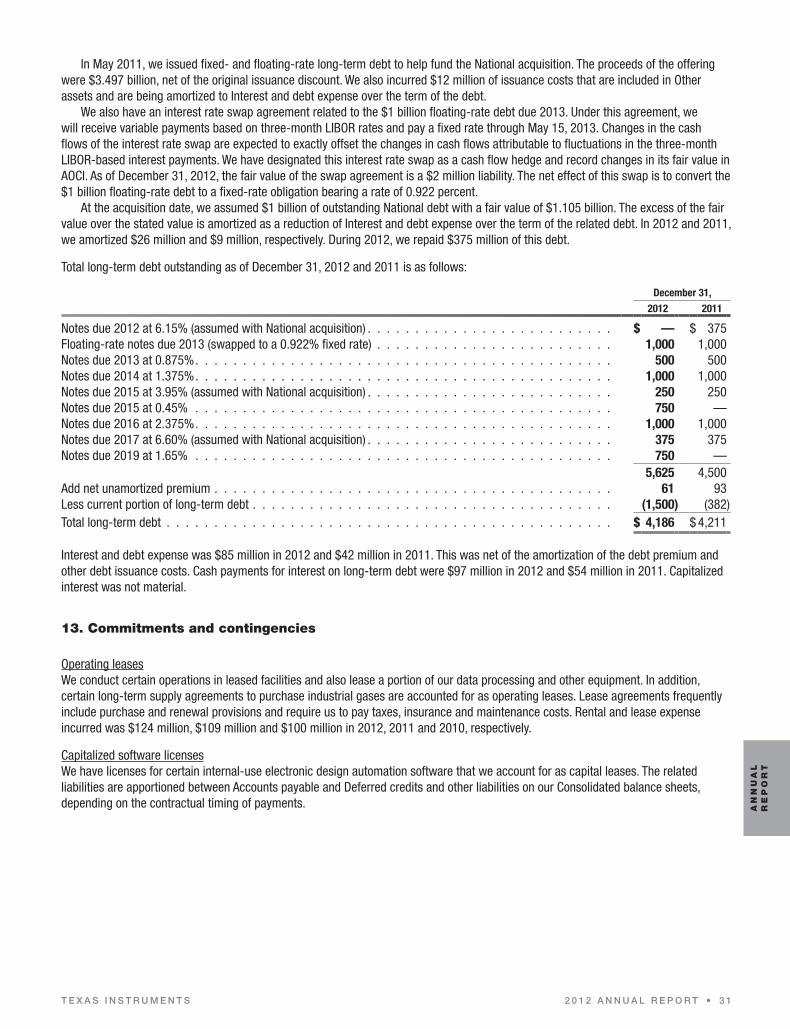
AN
NU
AL
RE
PO
RT
T E X A S I N S T R U M E N T S 2 0 1 2 A N N U A L R E P O R T • 3 1
In May 2011, we issued fixed- and floating-rate long-term debt to help fund the National acquisition. The proceeds of the offering were $3.497 billion, net of the original issuance discount. We also incurred $12 million of issuance costs that are included in Other assets and are being amortized to Interest and debt expense over the term of the debt.
We also have an interest rate swap agreement related to the $1 billion floating-rate debt due 2013. Under this agreement, we will receive variable payments based on three-month LIBOR rates and pay a fixed rate through May 15, 2013. Changes in the cash flows of the interest rate swap are expected to exactly offset the changes in cash flows attributable to fluctuations in the three-month LIBOR-based interest payments. We have designated this interest rate swap as a cash flow hedge and record changes in its fair value in AOCI. As of December 31, 2012, the fair value of the swap agreement is a $2 million liability. The net effect of this swap is to convert the $1 billion floating-rate debt to a fixed-rate obligation bearing a rate of 0.922 percent.
At the acquisition date, we assumed $1 billion of outstanding National debt with a fair value of $1.105 billion. The excess of the fair value over the stated value is amortized as a reduction of Interest and debt expense over the term of the related debt. In 2012 and 2011, we amortized $26 million and $9 million, respectively. During 2012, we repaid $375 million of this debt.
Total long-term debt outstanding as of December 31, 2012 and 2011 is as follows:
December 31,
2012 2011
Notes due 2012 at 6.15% (assumed with National acquisition) . . . . . . . . . . . . . . . . . . . . . . . . . . $ — $ 375Floating-rate notes due 2013 (swapped to a 0.922% fixed rate) . . . . . . . . . . . . . . . . . . . . . . . . . 1,000 1,000Notes due 2013 at 0.875% . . . . . . . . . . . . . . . . . . . . . . . . . . . . . . . . . . . . . . . . . . . . 500 500Notes due 2014 at 1.375% . . . . . . . . . . . . . . . . . . . . . . . . . . . . . . . . . . . . . . . . . . . . 1,000 1,000Notes due 2015 at 3.95% (assumed with National acquisition) . . . . . . . . . . . . . . . . . . . . . . . . . . 250 250Notes due 2015 at 0.45% . . . . . . . . . . . . . . . . . . . . . . . . . . . . . . . . . . . . . . . . . . . . 750 —Notes due 2016 at 2.375% . . . . . . . . . . . . . . . . . . . . . . . . . . . . . . . . . . . . . . . . . . . . 1,000 1,000Notes due 2017 at 6.60% (assumed with National acquisition) . . . . . . . . . . . . . . . . . . . . . . . . . . 375 375Notes due 2019 at 1.65% . . . . . . . . . . . . . . . . . . . . . . . . . . . . . . . . . . . . . . . . . . . . 750 —
5,625 4,500Add net unamortized premium . . . . . . . . . . . . . . . . . . . . . . . . . . . . . . . . . . . . . . . . . . 61 93Less current portion of long-term debt . . . . . . . . . . . . . . . . . . . . . . . . . . . . . . . . . . . . . . (1,500) (382)Total long-term debt . . . . . . . . . . . . . . . . . . . . . . . . . . . . . . . . . . . . . . . . . . . . . . . $ 4,186 $ 4,211
Interest and debt expense was $85 million in 2012 and $42 million in 2011. This was net of the amortization of the debt premium and other debt issuance costs. Cash payments for interest on long-term debt were $97 million in 2012 and $54 million in 2011. Capitalized interest was not material.
13. Commitments and contingencies
Operating leasesWe conduct certain operations in leased facilities and also lease a portion of our data processing and other equipment. In addition, certain long-term supply agreements to purchase industrial gases are accounted for as operating leases. Lease agreements frequently include purchase and renewal provisions and require us to pay taxes, insurance and maintenance costs. Rental and lease expense incurred was $124 million, $109 million and $100 million in 2012, 2011 and 2010, respectively.
Capitalized software licensesWe have licenses for certain internal-use electronic design automation software that we account for as capital leases. The related liabilities are apportioned between Accounts payable and Deferred credits and other liabilities on our Consolidated balance sheets, depending on the contractual timing of payments.

AN
NU
AL
RE
PO
RT
T E X A S I N S T R U M E N T S32 • 2 0 1 2 A N N U A L R E P O R T
Purchase commitmentsSome of our purchase commitments entered in the ordinary course of business provide for minimum payments. At December 31, 2012, we had committed to make the following minimum payments under our non-cancellable operating leases, capitalized software licenses and purchase commitments:
Operating Leases
Capitalized Software Licenses
Purchase Commitments
2013 . . . . . . . . . . . . . . . . . . . . . . . . . . . . . . . . . . . . . . . . . . . . . . $102 $ 46 $ 772014 . . . . . . . . . . . . . . . . . . . . . . . . . . . . . . . . . . . . . . . . . . . . . . 77 33 542015 . . . . . . . . . . . . . . . . . . . . . . . . . . . . . . . . . . . . . . . . . . . . . . 66 14 252016 . . . . . . . . . . . . . . . . . . . . . . . . . . . . . . . . . . . . . . . . . . . . . . 49 — 182017 . . . . . . . . . . . . . . . . . . . . . . . . . . . . . . . . . . . . . . . . . . . . . . 32 — 10Thereafter . . . . . . . . . . . . . . . . . . . . . . . . . . . . . . . . . . . . . . . . . . . 80 — 22
Indemnification guaranteesWe routinely sell products with an intellectual property indemnification included in the terms of sale. Historically, we have had only minimal, infrequent losses associated with these indemnities. Consequently, we cannot reasonably estimate or accrue for any future liabilities that may result.
Warranty costs/product liabilitiesWe accrue for known product-related claims if a loss is probable and can be reasonably estimated. During the periods presented, there have been no material accruals or payments regarding product warranty or product liability. Historically, we have experienced a low rate of payments on product claims. Although we cannot predict the likelihood or amount of any future claims, we do not believe they will have a material adverse effect on our financial condition, results of operations or liquidity. Consistent with general industry practice, we enter into formal contracts with certain customers that include negotiated warranty remedies. Typically, under these agreements our warranty for semiconductor products includes three years of coverage; an obligation to repair, replace or refund; and a maximum payment obligation tied to the price paid for our products. In some cases, product claims may exceed the price of our products.
GeneralWe are subject to various legal and administrative proceedings. Although it is not possible to predict the outcome of these matters, we believe that the results of these proceedings will not have a material adverse effect on our financial condition, results of operations or liquidity. From time to time, we also negotiate contingent consideration payment arrangements associated with certain acquisitions, which are recorded at fair value.
Discontinued operations indemnityIn connection with the 2006 sale of the former Sensors & Controls (S&C) business, we have agreed to indemnify Sensata Technologies, Inc., for specified litigation matters and certain liabilities, including environmental liabilities. In a settlement with a third party, we have agreed to indemnify that party for certain events relating to S&C products, which events we consider remote. We believe our total remaining potential exposure from both of these indemnities will not exceed $200 million. As of December 31, 2012, we believe future payments related to these indemnity obligations will not have a material effect on our financial condition, results of operations or liquidity.
14. Stockholders’ equity
We are authorized to issue 10,000,000 shares of preferred stock. No preferred stock is currently outstanding.Treasury shares acquired in connection with the board-authorized stock repurchase program in 2012, 2011 and 2010 were
59,757,780 shares, 59,466,168 shares and 93,522,896 shares, respectively. As of December 31, 2012, $3.9 billion of stock repurchase authorizations remain, and no expiration date has been specified.

AN
NU
AL
RE
PO
RT
T E X A S I N S T R U M E N T S 2 0 1 2 A N N U A L R E P O R T • 3 3
15. Supplemental financial information
Other income (expense) net 2012 2011 2010
Interest income . . . . . . . . . . . . . . . . . . . . . . . . . . . . . . . . . . . . . . . . . . . . . . . . $ 8 $ 11 $13Net gains on investments . . . . . . . . . . . . . . . . . . . . . . . . . . . . . . . . . . . . . . . . . . . 18 6 11Tax interest (expense) . . . . . . . . . . . . . . . . . . . . . . . . . . . . . . . . . . . . . . . . . . . . 32 1 (2)Other (a) . . . . . . . . . . . . . . . . . . . . . . . . . . . . . . . . . . . . . . . . . . . . . . . . . . . (11) (13) 15Total . . . . . . . . . . . . . . . . . . . . . . . . . . . . . . . . . . . . . . . . . . . . . . . . . . . . . $ 47 $ 5 $37
(a) Includes lease income of approximately $15 million per year, primarily from the purchaser of a former business. As of December 31, 2012, the aggregate amount of non-cancellable future lease payments to be received from these leases is $66 million. These leases contain renewal options. Other also includes miscellaneous non-operational items such as realized gains and losses associated with former equity investments; gains and losses related to former businesses, including settlements in 2012 and 2011; gains and losses from currency exchange rate changes; and gains and losses from our derivative financial instruments, primarily forward foreign currency exchange contracts.
December 31,
Property, plant and equipment at costDepreciable Lives (Years) 2012 2011
Land . . . . . . . . . . . . . . . . . . . . . . . . . . . . . . . . . . . . . . . . . . . . . . . . . — $ 189 $ 188Buildings and improvements . . . . . . . . . . . . . . . . . . . . . . . . . . . . . . . . . . . . . 5 - 40 3,006 2,998Machinery and equipment . . . . . . . . . . . . . . . . . . . . . . . . . . . . . . . . . . . . . . 3 - 10 3,696 3,947Total . . . . . . . . . . . . . . . . . . . . . . . . . . . . . . . . . . . . . . . . . . . . . . . . . $6,891 $ 7,133
Authorizations for property, plant and equipment expenditures in future years were $234 million at December 31, 2012.
December 31,
Accrued expenses and other liabilities 2012 2011
Customer incentive programs and allowances . . . . . . . . . . . . . . . . . . . . . . . . . . . . . . . . . . . $ 213 $ 190Severance and related expenses . . . . . . . . . . . . . . . . . . . . . . . . . . . . . . . . . . . . . . . . . . 217 140Property and other non-income taxes . . . . . . . . . . . . . . . . . . . . . . . . . . . . . . . . . . . . . . . 127 98Other . . . . . . . . . . . . . . . . . . . . . . . . . . . . . . . . . . . . . . . . . . . . . . . . . . . . . . . . 324 367Total . . . . . . . . . . . . . . . . . . . . . . . . . . . . . . . . . . . . . . . . . . . . . . . . . . . . . . . . $ 881 $ 795
December 31,
Accumulated other comprehensive income (loss), net of taxes 2012 2011
Unrealized losses on available-for-sale investments . . . . . . . . . . . . . . . . . . . . . . . . . . . . . . . . $ — $ (3)Postretirement benefit plans:
Net actuarial loss . . . . . . . . . . . . . . . . . . . . . . . . . . . . . . . . . . . . . . . . . . . . . . . . (701) (780)Net prior service credit . . . . . . . . . . . . . . . . . . . . . . . . . . . . . . . . . . . . . . . . . . . . . 7 9
Cash flow hedge derivative . . . . . . . . . . . . . . . . . . . . . . . . . . . . . . . . . . . . . . . . . . . . . (5) (2)Total . . . . . . . . . . . . . . . . . . . . . . . . . . . . . . . . . . . . . . . . . . . . . . . . . . . . . . . . $ (699) $ (776)

AN
NU
AL
RE
PO
RT
T E X A S I N S T R U M E N T S34 • 2 0 1 2 A N N U A L R E P O R T
16. Segment and geographic area data
Reportable segmentsThe information presented in our Notes to financial statements is based on our segment structure existing as of December 31, 2012. This structure is comprised of three reportable segments: Analog, Embedded Processing and Wireless. These reportable segments represent groups of similar products that are combined on the basis of similar design and development requirements, product characteristics, manufacturing processes and distribution channels. A summary of each reportable segment follows:
• Analog – Analog semiconductors change real-world signals – such as sound, temperature, pressure or images – by conditioning them, amplifying them and often converting them to a stream of digital data that can be processed by other semiconductors, such as digital signal processors (DSPs). Analog semiconductors are also used to manage power in every electronic device, whether plugged into a wall or running off of a battery. Analog includes the following major product lines: HVAL, Power, HPA and SVA.
• Embedded Processing – Our Embedded Processing products include our DSPs and microcontrollers. DSPs perform mathematical computations almost instantaneously to process or improve digital data. Microcontrollers are designed to control a set of specific tasks for electronic equipment. We make and sell catalog Embedded Processing products used in many different applications and application-specific Embedded Processing products used in specific applications, such as communications infrastructure equipment and automotive.
• Wireless – Our Wireless products consist of OMAP applications processors, connectivity products and baseband products. We concentrated our Wireless investments on OMAP applications processors and connectivity products for the smartphone and consumer tablet markets.
As previously announced, the Wireless segment will be eliminated due to the decision to wind down certain of its product lines. As a result, we will restructure our reportable segments beginning January 1, 2013, and we will report our first quarter of 2013 financial results accordingly. Financial results for Wireless products for the smartphone and consumer tablet markets will be included in Other. Financial results for Wireless products that address embedded applications, a strategic focus for the company, will be reported in the Embedded Processing segment.
OtherOther includes other operating segments that neither meet the quantitative thresholds for individually reportable segments nor are they aggregated with other operating segments. These operating segments primarily include our smaller semiconductor product lines such as DLP® products (primarily used in projectors to create high-definition images), custom semiconductors known as application-specific integrated circuits (ASICs) and calculators.
Other also includes royalties received for our patented technology that we license to other electronics companies and revenue from transitional supply agreements related to acquisitions and divestitures. Other may also include certain unallocated income and expenses such as gains and losses on sales of assets; sales tax refunds; and certain litigation costs, settlements or reserves. Except for these few unallocated items, we allocate all of our expenses associated with corporate activities to our operating segments based on specific methodologies, such as percentage of operating expenses or headcount.
Acquisition-related charges related to National are also recorded in Other in 2012 and 2011, as detailed in Note 2.Restructuring charges related to the 2011 announced action in Hiji, Japan, and Houston, Texas; losses and insurance proceeds
associated with the 2011 earthquake in Japan; and the 2012 gain on the transfer of the Japan substitutional pension are also included in Other. In 2010, the gain related to a divestiture of a product line is included in Other. See Notes 3 and 4 for additional information.
We use centralized manufacturing and facilities organizations to provide products and support to our operating segments. Costs incurred by these organizations, including depreciation, are charged to the segments on a per-unit basis. Consequently, depreciation expense is not an independently identifiable component within the segments’ results and therefore is not provided.
With the exception of goodwill, we do not identify or allocate assets by operating segment, nor does the chief operating decision maker evaluate operating segments using discrete asset information. There was no significant intersegment revenue. The accounting policies of the segments are the same as those described in the summary of significant accounting policies.

AN
NU
AL
RE
PO
RT
T E X A S I N S T R U M E N T S 2 0 1 2 A N N U A L R E P O R T • 3 5
Segment information
AnalogEmbedded Processing Wireless Other Total
Revenue2012 . . . . . . . . . . . . . . . . . . . . . . . . . . . . . . . . . . . . . $6,998 $1,971 $1,357 $2,499 $12,8252011 . . . . . . . . . . . . . . . . . . . . . . . . . . . . . . . . . . . . . 6,375 2,110 2,518 2,732 13,7352010 . . . . . . . . . . . . . . . . . . . . . . . . . . . . . . . . . . . . . 5,979 2,073 2,978 2,936 13,966
Operating profit (loss)2012 . . . . . . . . . . . . . . . . . . . . . . . . . . . . . . . . . . . . . $1,650 $ 166 $ (525) $ 682 $ 1,9732011 . . . . . . . . . . . . . . . . . . . . . . . . . . . . . . . . . . . . . 1,693 368 412 519 2,9922010 . . . . . . . . . . . . . . . . . . . . . . . . . . . . . . . . . . . . . 1,876 491 683 1,464 4,514
Geographic area informationThe following geographic area data include revenue, based on product shipment destination and royalty payor location, and property, plant and equipment, based on physical location:
U.S. Asia (a) Europe JapanRest of World Total
Revenue2012 . . . . . . . . . . . . . . . . . . . . . . . . . . . . . . . . . . $1,596 $7,808 $1,861 $1,357 $203 $12,8252011 . . . . . . . . . . . . . . . . . . . . . . . . . . . . . . . . . . 1,468 8,619 1,822 1,462 364 13,7352010 . . . . . . . . . . . . . . . . . . . . . . . . . . . . . . . . . . 1,539 8,903 1,760 1,366 398 13,966
Property, plant and equipment, net2012 . . . . . . . . . . . . . . . . . . . . . . . . . . . . . . . . . . $1,931 $1,547 $ 241 $ 174 $ 19 $ 3,9122011 . . . . . . . . . . . . . . . . . . . . . . . . . . . . . . . . . . 2,159 1,739 276 228 26 4,4282010 . . . . . . . . . . . . . . . . . . . . . . . . . . . . . . . . . . 1,694 1,575 139 249 23 3,680
(a) Revenue from products shipped into China (including Hong Kong) was $5.38 billion in 2012, $5.83 billion in 2011 and $5.69 billion in 2010.
Major customerNo customer accounts for 10 percent or more of 2012 revenue. Sales to the Nokia group of companies, including sales to indirect contract manufacturers, accounted for 13 percent and 19 percent of our 2011 and 2010 revenue, respectively. Revenue from sales to Nokia is reflected primarily in our Wireless segment.
AN
NU
AL
RE
PO
RT
T E X A S I N S T R U M E N T S36 • 2 0 1 2 A N N U A L R E P O R T
Report of independent registered public accounting firm
The Board of Directors and Stockholders Texas Instruments Incorporated
We have audited the accompanying consolidated balance sheets of Texas Instruments Incorporated and subsidiaries (the Company) as of December 31, 2012 and 2011, and the related consolidated statements of income, comprehensive income, stockholders’ equity, and cash flows for each of the three years in the period ended December 31, 2012. These financial statements are the responsibility of the Company’s management. Our responsibility is to express an opinion on these financial statements based on our audits.
We conducted our audits in accordance with the standards of the Public Company Accounting Oversight Board (United States). Those standards require that we plan and perform the audit to obtain reasonable assurance about whether the financial statements are free of material misstatement. An audit includes examining, on a test basis, evidence supporting the amounts and disclosures in the financial statements. An audit also includes assessing the accounting principles used and significant estimates made by management, as well as evaluating the overall financial statement presentation. We believe that our audits provide a reasonable basis for our opinion.
In our opinion, the financial statements referred to above present fairly, in all material respects, the consolidated financial position of Texas Instruments Incorporated and subsidiaries at December 31, 2012 and 2011, and the consolidated results of their operations and their cash flows for each of the three years in the period ended December 31, 2012, in conformity with U.S. generally accepted accounting principles.
We also have audited, in accordance with the standards of the Public Company Accounting Oversight Board (United States), the Company’s internal control over financial reporting as of December 31, 2012, based on criteria established in Internal Control-Integrated Framework issued by the Committee of Sponsoring Organizations of the Treadway Commission and our report dated February 22, 2013, expressed an unqualified opinion thereon.
Dallas, Texas February 22, 2013

AN
NU
AL
RE
PO
RT
T E X A S I N S T R U M E N T S 2 0 1 2 A N N U A L R E P O R T • 3 7
Report by management on internal control over financial reporting
The management of TI is responsible for establishing and maintaining effective internal control over financial reporting. TI’s internal control system was designed to provide reasonable assurance regarding the reliability of financial reporting and the preparation and fair presentation of financial statements issued for external purposes in accordance with generally accepted accounting principles. There has been no change in our internal control over financial reporting (as defined in Rule 13a-15(f) and 15d-15(f) under the Securities Exchange Act of 1934) that occurred during the fourth quarter of 2012 that has materially affected, or is reasonably likely to materially affect, our internal control over financial reporting.
All internal control systems, no matter how well designed, have inherent limitations and may not prevent or detect misstatements. Also, projections of any evaluation of effectiveness to future periods are subject to the risk that controls may become inadequate because of changes in conditions, or that the degree of compliance with the policies or procedures may deteriorate.
TI management assessed the effectiveness of internal control over financial reporting as of December 31, 2012. In making this assessment, we used the criteria set forth by the Committee of Sponsoring Organizations of the Treadway Commission (the COSO criteria) in Internal Control – Integrated Framework.
Based on our assessment we believe that, as of December 31, 2012, our internal control over financial reporting is effective based on the COSO criteria.
TI’s independent registered public accounting firm, Ernst & Young LLP, has issued an audit report on the effectiveness of our internal control over financial reporting, which immediately follows this report.
AN
NU
AL
RE
PO
RT
T E X A S I N S T R U M E N T S38 • 2 0 1 2 A N N U A L R E P O R T
Report of independent registered public accounting firm on internal control over financial reporting
The Board of Directors and Stockholders Texas Instruments Incorporated
We have audited Texas Instruments Incorporated’s internal control over financial reporting as of December 31, 2012, based on criteria established in Internal Control – Integrated Framework issued by the Committee of Sponsoring Organizations of the Treadway Commission (the COSO criteria). Texas Instruments Incorporated’s management is responsible for maintaining effective internal control over financial reporting, and for its assessment of the effectiveness of internal control over financial reporting included in the accompanying Report by management on internal control over financial reporting. Our responsibility is to express an opinion on the Company’s internal control over financial reporting based on our audit.
We conducted our audit in accordance with the standards of the Public Company Accounting Oversight Board (United States). Those standards require that we plan and perform the audit to obtain reasonable assurance about whether effective internal control over financial reporting was maintained in all material respects. Our audit included obtaining an understanding of internal control over financial reporting, assessing the risk that a material weakness exists, testing and evaluating the design and operating effectiveness of internal control based on the assessed risk, and performing such other procedures as we considered necessary in the circumstances. We believe that our audit provides a reasonable basis for our opinion.
A company’s internal control over financial reporting is a process designed to provide reasonable assurance regarding the reliability of financial reporting and the preparation of financial statements for external purposes in accordance with generally accepted accounting principles. A company’s internal control over financial reporting includes those policies and procedures that (1) pertain to the maintenance of records that, in reasonable detail, accurately and fairly reflect the transactions and dispositions of the assets of the company; (2) provide reasonable assurance that transactions are recorded as necessary to permit preparation of financial statements in accordance with generally accepted accounting principles, and that receipts and expenditures of the company are being made only in accordance with authorizations of management and directors of the company; and (3) provide reasonable assurance regarding prevention or timely detection of unauthorized acquisition, use, or disposition of the company’s assets that could have a material effect on the financial statements.
Because of its inherent limitations, internal control over financial reporting may not prevent or detect misstatements. Also, projections of any evaluation of effectiveness to future periods are subject to the risk that controls may become inadequate because of changes in conditions, or that the degree of compliance with the policies or procedures may deteriorate.
In our opinion, Texas Instruments Incorporated maintained, in all material respects, effective internal control over financial reporting as of December 31, 2012, based on the COSO criteria.
We also have audited, in accordance with the standards of the Public Company Accounting Oversight Board (United States), the consolidated balance sheets of Texas Instruments Incorporated and subsidiaries as of December 31, 2012 and 2011, and the related consolidated statements of income, comprehensive income, stockholders’ equity, and cash flows for each of the three years in the period ended December 31, 2012, and our report dated February 22, 2013, expressed an unqualified opinion thereon.
Dallas, Texas February 22, 2013

AN
NU
AL
RE
PO
RT
T E X A S I N S T R U M E N T S 2 0 1 2 A N N U A L R E P O R T • 3 9
For Years Ended December 31,
Summary of selected financial data 2012 2011 2010 2009 2008
[Millions of dollars, except share and per-share amounts]
Revenue . . . . . . . . . . . . . . . . . . . . . . . . . . . $ 12,825 $ 13,735 $ 13,966 $ 10,427 $ 12,501Operating costs and expenses (a) (b) . . . . . . . . . . . . . 10,852 10,743 9,452 8,436 10,064Operating profit . . . . . . . . . . . . . . . . . . . . . . . 1,973 2,992 4,514 1,991 2,437Interest and debt expense . . . . . . . . . . . . . . . . . . (85) (42) — — —Other income (expense) net . . . . . . . . . . . . . . . . . 47 5 37 26 44Income before income taxes . . . . . . . . . . . . . . . . . 1,935 2,955 4,551 2,017 2,481Provision for income taxes . . . . . . . . . . . . . . . . . . 176 719 1,323 547 561Net income . . . . . . . . . . . . . . . . . . . . . . . . . $ 1,759 $ 2,236 $ 3,228 $ 1,470 $ 1,920
Basic earnings per common share . . . . . . . . . . . . . . $ 1.53 $ 1.91 $ 2.66 $ 1.16 $ 1.46
Diluted earnings per common share . . . . . . . . . . . . . $ 1.51 $ 1.88 $ 2.62 $ 1.15 $ 1.44
Dividends declared per common share . . . . . . . . . . . $ 0.72 $ 0.56 $ 0.49 $ 0.45 $ 0.41
Average dilutive potential common shares outstanding during year, in thousands . . . . . . . . . . . . . . . . 1,146,035 1,171,364 1,212,940 1,268,533 1,321,250
(a) Includes Acquisition-related charges of $471 million in 2012 and $426 million in 2011 associated with our 2011 acquisition of National.
(b) Includes Restructuring charges/other of $264 million, $112 million, ($111) million, $212 million and $254 million in 2012, 2011, 2010, 2009 and 2008 respectively. The $264 million for 2012 includes a gain on the transfer of a Japan substitutional pension of $144 million, and the ($111) million for 2010 includes a $144 million gain from the divestiture of a product line.
December 31,
2012 2011 2010 2009 2008
Working capital . . . . . . . . . . . . . . . . . . . . . . . . . . . . . . . . . $ 4,800 $ 4,329 $ 5,079 $ 4,527 $ 4,258Property, plant and equipment, net . . . . . . . . . . . . . . . . . . . . . . . 3,912 4,428 3,680 3,158 3,304Total assets . . . . . . . . . . . . . . . . . . . . . . . . . . . . . . . . . . 20,021 20,497 13,401 12,119 11,923Long-term debt . . . . . . . . . . . . . . . . . . . . . . . . . . . . . . . . . 4,186 4,211 — — —Stockholders’ equity . . . . . . . . . . . . . . . . . . . . . . . . . . . . . . 10,961 10,952 10,437 9,722 9,326
Number of:Employees . . . . . . . . . . . . . . . . . . . . . . . . . . . . . . . . . 34,151 34,759 28,412 26,584 29,537Stockholders of record . . . . . . . . . . . . . . . . . . . . . . . . . . . 18,128 19,733 20,525 24,190 25,107
For Years Ended December 31,
2012 2011 2010 2009 2008
Net cash provided by operating activities . . . . . . . . . . . . . . . . . . . . $3,414 $3,256 $3,820 $2,643 $3,330Capital expenditures (Additions to property, plant and equipment) . . . . . . . 495 816 1,199 753 763Dividends paid . . . . . . . . . . . . . . . . . . . . . . . . . . . . . . . . . 819 644 592 567 537Stock repurchases . . . . . . . . . . . . . . . . . . . . . . . . . . . . . . . 1,800 1,973 2,454 954 2,122
See Notes to financial statements and Management’s discussion and analysis of financial condition and results of operations.

AN
NU
AL
RE
PO
RT
T E X A S I N S T R U M E N T S40 • 2 0 1 2 A N N U A L R E P O R T
Management’s discussion and analysis of financial condition and results of operations
The following should be read in conjunction with the financial statements and the related notes that appear elsewhere in this document. All dollar amounts in the tables in this discussion are stated in millions of U.S. dollars, except per-share amounts.
Overview
We design and make semiconductors that we sell to electronics designers and manufacturers all over the world. We began operations in 1930. We are incorporated in Delaware, headquartered in Dallas, Texas, and have design, manufacturing or sales operations in more than 35 countries. We have four segments: Analog, Embedded Processing, Wireless and Other. We expect Analog and Embedded Processing to be our primary growth engines in the years ahead, and we therefore focus our resources on these segments.
We were the world’s fourth largest semiconductor company in 2012 as measured by revenue, according to preliminary estimates from an external source.
Product informationSemiconductors are electronic components that serve as the building blocks inside modern electronic systems and equipment. Semiconductors come in two basic forms: individual transistors and integrated circuits (generally known as “chips”) that combine multiple transistors on a single piece of material to form a complete electronic circuit. Our products, more than 100,000 orderable parts, are integrated circuits that are used to accomplish many different things, such as converting and amplifying signals, interfacing with other devices, managing and distributing power, processing data, canceling noise and improving signal resolution. This broad portfolio includes products that are integral to almost all electronic equipment.
We sell catalog and, to a lesser extent, custom semiconductor products. Catalog products are designed for use by many customers and/or many applications and are sold through both distribution and direct channels. The majority of our catalog products are proprietary, but some are commodity products. The life cycles of catalog products generally span multiple years, with some products continuing to sell for decades after their initial release. Custom products are designed for a specific customer for a specific application, are sold only to that customer and are typically sold directly to the customer. The life cycles of custom products are generally determined by end-equipment upgrade cycles and can be as short as 12 to 24 months.
Our segments represent groups of similar products that are combined on the basis of similar design and development requirements, product characteristics, manufacturing processes and distribution channels, and how management allocates resources and measures results. Additional information regarding each segment’s products follows.
AnalogAnalog semiconductors change real-world signals – such as sound, temperature, pressure or images – by conditioning them, amplifying them and often converting them to a stream of digital data that can be processed by other semiconductors, such as digital signal processors (DSPs). Analog semiconductors are also used to manage power in every electronic device, whether plugged into a wall or running off a battery. We estimate that we sell our Analog products to more than 100,000 customers. These sales generated about 55 percent of our revenue in 2012. According to external sources, the worldwide market for analog semiconductors was about $39 billion in 2012. Our Analog segment’s revenue in 2012 was about $7.0 billion, or about 18 percent of this fragmented market, the leading position. We believe that we are well positioned to increase our market share over time.
Our Analog segment includes the following major product lines: High Volume Analog & Logic (HVAL), Power Management (Power), High Performance Analog (HPA) and Silicon Valley Analog (SVA).
HVAL products: These include both high-volume analog and logic products. High-volume analog includes integrated analog products for specific applications, including custom products. End markets for high-volume analog products include communications, automotive, computing and many consumer electronics products. Logic includes some commodity products marketed to many different customers for many different applications.
Power products: These include both catalog and application-specific products that help customers manage power in any type of electronic system. We design and manufacture power management semiconductors for both portable devices (battery-powered devices, such as handheld consumer electronics, laptop computers and cordless power tools) and line-powered systems (products that require an external electrical source, such as computers, digital TVs, wireless basestations and high-voltage industrial equipment).
HPA products: These include catalog analog products, such as amplifiers, data converters and interface semiconductors, that we market to many different customers who use them in manufacturing a wide range of products sold in many end markets, including the industrial, communications, computing and consumer electronics markets. HPA products generally have long life cycles, often more than 10 years.
SVA products: These consist of products that we acquired through our purchase of National Semiconductor Corporation (National) in 2011. These include power management, data converter, interface and operational amplifier catalog analog products, nearly all of which are complementary to our other Analog products. This portfolio of thousands of products is marketed to many different customers who use them in manufacturing a wide range of products sold in many end markets. SVA products generally have long life cycles, often more than 10 years.

AN
NU
AL
RE
PO
RT
T E X A S I N S T R U M E N T S 2 0 1 2 A N N U A L R E P O R T • 4 1
Embedded ProcessingOur Embedded Processing products include our DSPs and microcontrollers. DSPs perform mathematical computations almost instantaneously to process or improve digital data. Microcontrollers are designed to control a set of specific tasks for electronic equipment. Sales of Embedded Processing products generated about 15 percent of our revenue in 2012. According to external sources, the worldwide market for embedded processors was about $17 billion in 2012. Our Embedded Processing segment’s revenue in 2012 was about $2.0 billion. This was the number two position and represented about 12 percent of this fragmented market. We believe we are well positioned to increase our market share over time.
An important characteristic of our Embedded Processing products is that our customers often invest their own research and development (R&D) to write software that operates on our products. This investment tends to increase the length of our customer relationships because customers prefer to re-use software from one product generation to the next. We make and sell catalog Embedded Processing products used in many different applications and application-specific Embedded Processing products used in communications infrastructure equipment and automotive applications.
WirelessDuring 2012, our Wireless products consisted of OMAP™ applications processors, connectivity products and baseband products. We concentrated our Wireless investments on OMAP applications processors and connectivity products for the smartphone and consumer tablet markets. Sales of Wireless products generated about $1.4 billion, or about 11 percent, of our revenue for 2012, of which OMAP and connectivity products represented about $1.1 billion. We had $0.3 billion in revenue from baseband products, a product line that we have previously announced we are exiting.
In November 2012, we announced that we would restructure our Wireless business to focus investments on embedded markets with greater potential for sustainable growth. Specifically, we now focus our OMAP applications processors and connectivity products on embedded applications with long life cycles instead of on the smartphone and consumer tablet markets, where large customers are increasingly developing their own custom chips. These changes will result in lower resource and investment demands and, as we have previously announced, elimination of the Wireless segment. As a result of the Wireless restructuring, we recorded a $351 million charge in the fourth quarter of 2012, of which $245 million was for severance and benefit costs and $106 million was for non-cash items, which includes a non-tax deductible goodwill impairment of $90 million. We expect about 1,700 jobs to be eliminated and about $450 million in annualized cost savings to be realized by the time this action is completed in 2013.
Embedded OMAP applications processors, which often use a standard operating system such as Android, Linux, QNX or Windows, are used in applications that are multi-function, need a graphically intensive user interface and often are connected to the Internet. Embedded connectivity products include low-power wireless network standards like Zigbee®, and other technologies such as Bluetooth®, WiFi, GPS and Near Field Communications. Both of these product lines have many of the same characteristics as those in our Embedded Processing segment and will be reported in that segment beginning with our first-quarter 2013 financial report. In 2012, sales of these products were about $150 million.
We expect our revenue from OMAP and connectivity products sold into smartphone and consumer tablet applications to decline rapidly in 2013 and to substantially cease by the end of the year. We also expect baseband revenue to be essentially zero in 2013. Beginning with our first-quarter 2013 financial report, financial results for Wireless products for the smartphone and consumer tablet markets will be included in Other.
OtherOther includes revenue from our smaller product lines, such as DLP® (primarily used in projectors to create high-definition images), custom semiconductors known as application-specific integrated circuits (ASICs) and calculators. It also includes royalties received for our patented technology that we license to other electronics companies and revenue from transitional supply agreements related to acquisitions and divestitures. Other generated about $2.5 billion, or about 19 percent of our revenue, in 2012. We also include in Other certain acquisition-related charges that are not used in evaluating results of and allocating resources to our Analog, Embedded Processing and Wireless segments. These charges include certain fair-value adjustments, restructuring charges, transaction expenses, acquisition-related retention bonuses and amortization of intangible assets. Other also includes certain corporate-level items, such as litigation and environmental costs, insurance proceeds, and assets and liabilities associated with our centralized operations, such as our worldwide manufacturing, facilities and procurement operations.
InventoryOur inventory practices differ by product, but we generally maintain inventory levels that are consistent with our expectations of customer demand. Because of the longer product life cycles of catalog products and their inherently lower risk of obsolescence, we generally carry more inventory of those products than custom products. Additionally, we sometimes maintain catalog-product inventory in unfinished wafer form, as well as higher finished-goods inventory of low-volume products, allowing greater flexibility in periods of high demand. We also have consignment inventory programs in place for our largest customers and some distributors.
AN
NU
AL
RE
PO
RT
T E X A S I N S T R U M E N T S42 • 2 0 1 2 A N N U A L R E P O R T
ManufacturingSemiconductor manufacturing begins with a sequence of photo-lithographic and chemical processing steps that fabricate a number of semiconductor devices on a thin silicon wafer. Each device on the wafer is tested, the wafer is cut into individual units and each unit is assembled into a package that then is usually retested. The entire process takes place in highly specialized facilities and requires an average of 12 weeks, with most products completing within 8 to 16 weeks.
The cost and lifespan of the equipment and processes we use to manufacture semiconductors vary by technology. Our Analog products and most of our Embedded Processing products can be manufactured using mature and stable, and therefore less expensive, equipment than is needed for manufacturing advanced CMOS logic products, such as our Wireless products.
We own and operate semiconductor manufacturing facilities in North America, Asia, Japan and Europe. These include both wafer fabrication and assembly/test facilities. Our facilities require substantial investment to construct and are largely fixed-cost assets once in operation. Because we own much of our manufacturing capacity, a significant portion of our operating cost is fixed. In general, these fixed costs do not decline with reductions in customer demand or utilization of capacity, potentially hurting our profit margins. Conversely, as product demand rises and factory utilization increases, the fixed costs are spread over increased output, potentially benefiting our profit margins.
We expect to maintain sufficient internal wafer fabrication capacity to meet the vast majority of our production needs. To supplement our internal wafer fabrication capacity and maximize our responsiveness to customer demand and return on capital, our wafer manufacturing strategy utilizes the capacity of outside suppliers, commonly known as foundries, and subcontractors. In 2012, we sourced about 20 percent of our total wafers and about 75 percent of our advanced CMOS logic needs from external foundries.
In 2011, we initiated closure of an older wafer fabrication facility in Hiji, Japan, and another in Houston, Texas. We expect to complete these plant closures in 2013.
Product cycleThe global semiconductor market is characterized by constant, though generally incremental, advances in product designs and manufacturing processes. Semiconductor prices and manufacturing costs tend to decline over time as manufacturing processes and product life cycles mature.
Market cycleThe “semiconductor cycle” is an important concept that refers to the ebb and flow of supply and demand. The semiconductor market historically has been characterized by periods of tight supply caused by strengthening demand and/or insufficient manufacturing capacity, followed by periods of surplus inventory caused by weakening demand and/or excess manufacturing capacity. These are typically referred to as upturns and downturns in the semiconductor cycle. The semiconductor cycle is affected by the significant time and money required to build and maintain semiconductor manufacturing facilities.
SeasonalityOur revenue and operating results are subject to some seasonal variation. Our semiconductor sales generally are seasonally weaker in the first and fourth quarters and stronger in the second and third quarters, as manufacturers prepare for the major holiday selling seasons. Calculator revenue is tied to the U.S. back-to-school season and is therefore at its highest in the second and third quarters.
Tax considerationsWe operate in a number of tax jurisdictions and are subject to several types of taxes including those that are based on income, capital, property and payroll, as well as sales and other transactional taxes. The timing of the final determination of our tax liabilities varies by jurisdiction and taxing authority. As a result, during any particular reporting period we may reflect in our financial statements one or more tax refunds or assessments, or changes to tax liabilities, involving one or more taxing authorities.
Results of operations
The information presented in this Management’s discussion and analysis of financial condition and results of operations (MD&A) is based on our segment structure as it existed as of December 31, 2012. Additionally, the MD&A reflects our reclassification of certain amounts in the prior periods’ financial statements to conform to the 2012 presentation. Throughout the following discussion of our results of operations, unless otherwise noted, changes in our revenue are attributable to changes in customer demand, which are evidenced by fluctuations in shipment volumes. New products tend not to have a significant impact because our revenue is derived from such a large number of products. From time to time, our revenue and gross profit are affected by changes in demand for higher-priced or lower-priced products, which we refer to as changes in the “mix” of products shipped.

AN
NU
AL
RE
PO
RT
T E X A S I N S T R U M E N T S 2 0 1 2 A N N U A L R E P O R T • 4 3
2012 compared with 2011During 2012, we faced a weak demand environment, but our operations performed well and we strengthened our strategic position. We reached a milestone in 2012, with 70 percent of our revenue coming from our core businesses of Analog and Embedded Processing. Also during the year, we successfully integrated National into our operations and increased the diversity of our customer base, especially in the industrial sector. Despite lower revenue that resulted primarily from our exit from Wireless baseband products, we grew our free cash flow to almost $3 billion, or 23 percent of revenue. Our free cash flow was the result of more of our revenue coming from Analog and Embedded Processing, which offer solid growth and high margins and have low capital needs. We returned 90 percent of this free cash flow to stockholders through our continued share repurchases and higher dividend payments. Free cash flow will continue to benefit from our strategic purchases of manufacturing capacity during the past few years. (Free cash flow is a non-GAAP financial measure. For a reconciliation to GAAP and an explanation of the purpose for providing this non-GAAP measure, see the Non-GAAP financial information section after the Liquidity and capital resources section.)
For Years Ended December 31,
2012 2011 2010
Revenue by segment:Analog . . . . . . . . . . . . . . . . . . . . . . . . . . . . . . . . . . . . . . . . . . $ 6,998 $ 6,375 $ 5,979 Embedded Processing . . . . . . . . . . . . . . . . . . . . . . . . . . . . . . . . . . 1,971 2,110 2,073 Wireless . . . . . . . . . . . . . . . . . . . . . . . . . . . . . . . . . . . . . . . . . 1,357 2,518 2,978 Other . . . . . . . . . . . . . . . . . . . . . . . . . . . . . . . . . . . . . . . . . . . 2,499 2,732 2,936
Revenue . . . . . . . . . . . . . . . . . . . . . . . . . . . . . . . . . . . . . . . . . . . 12,825 13,735 13,966 Cost of revenue (COR) . . . . . . . . . . . . . . . . . . . . . . . . . . . . . . . . . . . . 6,457 6,963 6,474 Gross profit . . . . . . . . . . . . . . . . . . . . . . . . . . . . . . . . . . . . . . . . . . 6,368 6,772 7,492 Research and development (R&D) . . . . . . . . . . . . . . . . . . . . . . . . . . . . . . 1,877 1,715 1,570 Selling, general and administrative (SG&A) . . . . . . . . . . . . . . . . . . . . . . . . . . 1,804 1,638 1,519 Acquisition charges . . . . . . . . . . . . . . . . . . . . . . . . . . . . . . . . . . . . . 450 315 —Restructuring charges/other . . . . . . . . . . . . . . . . . . . . . . . . . . . . . . . . . 264 112 (111)Operating profit. . . . . . . . . . . . . . . . . . . . . . . . . . . . . . . . . . . . . . . . 1,973 2,992 4,514 Other income (expense) net (OI&E) . . . . . . . . . . . . . . . . . . . . . . . . . . . . . . 47 5 37 Interest and debt expense . . . . . . . . . . . . . . . . . . . . . . . . . . . . . . . . . . 85 42 —Income before income taxes . . . . . . . . . . . . . . . . . . . . . . . . . . . . . . . . . 1,935 2,955 4,551 Provision for income taxes . . . . . . . . . . . . . . . . . . . . . . . . . . . . . . . . . . 176 719 1,323 Net income . . . . . . . . . . . . . . . . . . . . . . . . . . . . . . . . . . . . . . . . . . $ 1,759 $ 2,236 $ 3,228
Diluted earnings per common share . . . . . . . . . . . . . . . . . . . . . . . . . . . . . $ 1.51 $ 1.88 $ 2.62
Percentage of revenue:Gross profit . . . . . . . . . . . . . . . . . . . . . . . . . . . . . . . . . . . . . . . . 49.6 % 49.3 % 53.6 %R&D . . . . . . . . . . . . . . . . . . . . . . . . . . . . . . . . . . . . . . . . . . . 14.6 % 12.5 % 11.2 %SG&A . . . . . . . . . . . . . . . . . . . . . . . . . . . . . . . . . . . . . . . . . . . 14.1 % 11.9 % 10.9 %Operating profit . . . . . . . . . . . . . . . . . . . . . . . . . . . . . . . . . . . . . 15.4 % 21.8 % 32.3 %
As required by accounting rule ASC 260, net income allocated to unvested restricted stock units (RSUs), on which we pay dividend equivalents, is excluded from the calculation of earnings per share (EPS). The amount excluded was $31 million, $34 million and $44 million for the years ended December 31, 2012, 2011 and 2010, respectively.
Details of 2012 financial resultsRevenue in 2012 was $12.82 billion, down $910 million, or 7 percent, from 2011 primarily due to a weak demand environment. Revenue from a full year’s inclusion of SVA slightly more than offset lower revenue from Wireless baseband products.
Gross profit in 2012 was $6.37 billion, a decrease of $404 million, or 6 percent, from 2011. The decrease was primarily due to lower revenue. Gross profit margin in 2012 was 49.6 percent of revenue compared with 49.3 percent in 2011.
Operating expenses were $1.88 billion for R&D and $1.80 billion for SG&A. R&D expense increased $162 million, or 9 percent, from 2011 primarily due to the inclusion of a full year of SVA. R&D expense as a percent of revenue was 14.6 percent compared with 12.5 percent in 2011. SG&A expense increased $166 million, or 10 percent, from 2011 due to the inclusion of a full year of SVA. SG&A expense as a percent of revenue was 14.1 percent compared with 11.9 percent in 2011.
Acquisition charges related to the National acquisition were $450 million in 2012 and $315 million in 2011. The increase was due to a full year of amortization of acquired intangible assets. See Notes 2 and 10 to the financial statements for details.

AN
NU
AL
RE
PO
RT
T E X A S I N S T R U M E N T S44 • 2 0 1 2 A N N U A L R E P O R T
Restructuring charges/other were $264 million in 2012 and $112 million in 2011. The increase was primarily due to the restructuring action in the Wireless segment, partially offset by a $144 million gain we recognized from the transfer of the obligations and assets of a portion of our Japan pension program from the pension trust to the government of Japan. See Note 3 to the financial statements for details.
Operating profit was $1.97 billion, or 15.4 percent of revenue, compared with $2.99 billion, or 21.8 percent of revenue, in 2011. The decrease was due to, in decreasing order, lower gross profit, higher operating expenses, higher restructuring charges and higher acquisition charges.
OI&E for 2012 was income of $47 million compared with $5 million for 2011. The increase was primarily due to tax-related interest income.
Interest and debt expense was $85 million compared with $42 million in the year-ago period. The increase over 2011 was primarily due to having debt outstanding for a full year in 2012 compared with about eight months in 2011. We issued debt in May 2011 and assumed debt in September 2011, both in connection with our acquisition of National. See Note 12 to the financial statements for details.
The annual effective tax rate for 2012 was 22 percent. Taxes at this rate were reduced by discrete tax benefits of $252 million, resulting in a total tax provision for 2012 of $176 million compared with a total tax provision of $719 million for the prior year. The decrease in the total tax provision was due to the combination of lower income before income taxes and the impact of the discrete tax benefits. The decrease was partially offset by the impact of the expiration of the federal research tax credit at the end of 2011. The discrete tax benefits in 2012 were primarily due to additional U.S. tax benefits for manufacturing related to the years 2000 through 2011. The tax provision for 2012 did not include the January 2013 reinstatement of the federal research tax credit. The effect of the reinstatement of about $65 million for 2012 will be recorded as a discrete tax benefit in the first quarter of 2013.
See Note 7 to the financial statements for a reconciliation of effective tax rates to the statutory federal tax rate.Net income was $1.76 billion, a decrease of $477 million, or 21 percent, from 2011. EPS for 2012 was $1.51 compared with $1.88
for 2011. The decline in EPS was due to lower net income. EPS benefitted $0.03 from 2011 due to a lower number of average shares outstanding as a result of our stock repurchase program.
Segment resultsA detailed discussion of our segment results appears below.
Analog 2012 2011 Change
Revenue . . . . . . . . . . . . . . . . . . . . . . . . . . . . . . . . . . . . . . . . . . . . . . $6,998 $6,375 10%Operating profit. . . . . . . . . . . . . . . . . . . . . . . . . . . . . . . . . . . . . . . . . . . 1,650 1,693 -3%
Operating profit % of revenue . . . . . . . . . . . . . . . . . . . . . . . . . . . . . . . . . 23.6% 26.6%
Analog revenue increased $623 million, or 10 percent, from 2011 primarily due to the inclusion of a full year of SVA, and to a lesser
extent, growth in Power Management. Partially offsetting the increase was lower revenue from High Performance Analog. Revenue from High Volume Analog & Logic products was about even.
Operating profit was $1.65 billion, or 23.6 percent of revenue. This was a decrease of $43 million, or 3 percent, compared with 2011 primarily due to higher operating expenses from the inclusion of a full year of SVA, partially offset by higher gross profit.
Embedded Processing 2012 2011 Change
Revenue . . . . . . . . . . . . . . . . . . . . . . . . . . . . . . . . . . . . . . . . . . . . . . $1,971 $2,110 -7%Operating profit. . . . . . . . . . . . . . . . . . . . . . . . . . . . . . . . . . . . . . . . . . . 166 368 -55%
Operating profit % of revenue . . . . . . . . . . . . . . . . . . . . . . . . . . . . . . . . . 8.4% 17.4%
Embedded Processing revenue decreased $139 million, or 7 percent, compared with 2011 due to lower revenue from products sold into communications infrastructure applications and, to a lesser extent, a less favorable mix of catalog products shipped. The decrease was partially offset by revenue from products sold into automotive applications.
Operating profit was $166 million, or 8.4 percent of revenue. This was a decrease of $202 million, or 55 percent, compared with 2011 primarily due to lower gross profit.

AN
NU
AL
RE
PO
RT
T E X A S I N S T R U M E N T S 2 0 1 2 A N N U A L R E P O R T • 4 5
Wireless 2012 2011 Change
Revenue . . . . . . . . . . . . . . . . . . . . . . . . . . . . . . . . . . . . . . . . . . . . . . $1,357 $2,518 -46%Operating profit (loss) . . . . . . . . . . . . . . . . . . . . . . . . . . . . . . . . . . . . . . . (525) 412 n/a
Operating profit (loss)% of revenue . . . . . . . . . . . . . . . . . . . . . . . . . . . . . . . (38.7)% 16.4% Restructuring charges/other* . . . . . . . . . . . . . . . . . . . . . . . . . . . . . . . . . . . . $ 351 $ —
* Included in Operating profit (loss)
Wireless revenue decreased $1.16 billion, or 46 percent, from 2011 primarily due to our planned exit from baseband products. Revenue from connectivity products, and to a lesser extent, OMAP applications processors also declined. Baseband revenue for 2012 was $294 million, a decrease of $810 million, or 73 percent, compared with 2011. We expect revenue from Wireless products for the smartphone and consumer tablet markets to wind down to essentially zero by the end of 2013.
Wireless had an operating loss of $525 million for 2012, compared with operating profit of $412 million in 2011. The decrease was primarily due to lower revenue and associated gross profit, and to a lesser extent, restructuring charges.
Other 2012 2011 Change
Revenue . . . . . . . . . . . . . . . . . . . . . . . . . . . . . . . . . . . . . . . . . . . . . . $2,499 $2,732 -9%Operating profit. . . . . . . . . . . . . . . . . . . . . . . . . . . . . . . . . . . . . . . . . . . 682 519 31%
Operating profit % of revenue . . . . . . . . . . . . . . . . . . . . . . . . . . . . . . . . . 27.3% 19.0% Restructuring charges/other* . . . . . . . . . . . . . . . . . . . . . . . . . . . . . . . . . . . . $ (87) $ 112 Acquisition charges* . . . . . . . . . . . . . . . . . . . . . . . . . . . . . . . . . . . . . . . . 450 315
* Included in Operating profit
Revenue from Other was $2.50 billion in 2012. This was a decrease of $233 million, or 9 percent, from 2011 primarily due to the expiration of transitional supply agreements and, to a lesser extent, a less favorable mix of DLP products shipped. Revenue from calculators and royalties also declined. The decrease was partially offset by business interruption insurance proceeds resulting from the 2011 Japan earthquake and increased revenue from custom ASIC products.
Operating profit for 2012 from Other was $682 million, or 27.3 percent of revenue. This was an increase of $163 million, or 31 percent, compared with 2011 due to lower restructuring charges, partially offset by higher acquisition charges. Included in Restructuring charges/other for 2012 was a $144 million gain from the Japan pension program change. The increase in acquisition charges was due to a full year of increased amortization expense for acquired intangible assets.
Prior results of operations - 2011 compared with 2010
Our 2011 revenue was $13.73 billion, net income was $2.24 billion and EPS was $1.88.Although 2011 started strong, global economic uncertainty and the March 2011 earthquake in Japan impacted TI, our customers
and our suppliers. Despite these challenges, we successfully completed the acquisition of National, we gained share in the Analog and Embedded Processing markets, and we continued to wind down our baseband operations.
Revenue in 2011 was $13.73 billion, down $231 million, or 2 percent, from 2010 due to lower revenue from Wireless baseband products.Gross profit in 2011 was $6.77 billion, a decrease of $720 million, or 10 percent, from 2010. The decrease was primarily due to a
combination of, in decreasing order, lower revenue, lower average levels of factory utilization as we reduced production in response to weaker demand, acquisition-related charges reflected in COR and inventory charges. Lower factory utilization decreased our gross profit by $175 million from 2010. Gross profit margin was 49.3 percent of revenue compared with 53.6 percent in 2010.
Operating expenses were $1.72 billion for R&D and $1.64 billion for SG&A. R&D expense increased $145 million, or 9 percent, from 2010 due to the addition of a partial year of SVA and higher product development costs in our other major Analog product lines, Embedded Processing and Wireless. R&D expense as a percent of revenue was 12.5 percent compared with 11.2 percent in 2010.
SG&A expense increased $119 million, or 8 percent, from 2010 primarily due to the addition of a partial year of SVA, and to a lesser extent, higher investments in sales and marketing in support of our other major Analog product lines, Embedded Processing and Wireless. SG&A expense as a percent of revenue was 11.9 percent compared with 10.9 percent in 2010.
Acquisition charges were $315 million in 2011. There were no acquisition charges in 2010.
AN
NU
AL
RE
PO
RT
T E X A S I N S T R U M E N T S46 • 2 0 1 2 A N N U A L R E P O R T
Restructuring charges/other of $112 million for 2011 were associated with the action initiated to close certain manufacturing facilities in Texas and Japan. Restructuring charges/other for 2010 included $33 million of restructuring charges associated with pension benefit settlements related to actions taken in 2009, offset by a gain of $144 million from the divestiture of a product line included in Other.
Operating profit was $2.99 billion, or 21.8 percent of revenue, compared with $4.51 billion, or 32.3 percent of revenue, in 2010. The decrease was due to, in decreasing order, lower gross profit, higher total acquisition-related charges, higher operating expenses and a gain on the divestiture of a product line in 2010.
OI&E for 2011 was income of $5 million. This was $32 million lower than in 2010 due to an expense in 2011 associated with a settlement related to a divested business.
Interest and debt expense was $42 million. This included interest and amortization of debt expense associated with our issuance of new debt in 2011 and the assumption of debt as a result of our acquisition of National.
The tax provision for 2011 was $719 million compared with $1.32 billion for the prior year. The decrease was primarily due to lower income before income taxes.
Net income was $2.24 billion, a decrease of $992 million from 2010. EPS for 2011 was $1.88 compared with $2.62 for 2010. EPS benefited $0.07 from 2010 due to a lower number of average shares outstanding as a result of our stock repurchase program.
Segment resultsA detailed discussion of our segment results appears below.
Analog 2011 2010 Change
Revenue . . . . . . . . . . . . . . . . . . . . . . . . . . . . . . . . . . . . . . . . . . . . . . $6,375 $5,979 7%Operating profit. . . . . . . . . . . . . . . . . . . . . . . . . . . . . . . . . . . . . . . . . . . 1,693 1,876 -10%
Operating profit % of revenue . . . . . . . . . . . . . . . . . . . . . . . . . . . . . . . . . 26.6% 31.4% Restructuring charges/other* . . . . . . . . . . . . . . . . . . . . . . . . . . . . . . . . . . . . $ — $ 13
* Included in Operating profit
Analog revenue increased $396 million, or 7 percent, from 2010 primarily due to the inclusion of a partial year of SVA, and to a lesser extent, increased shipments of Power Management and High Volume Analog & Logic products. Partially offsetting these increases was lower revenue from High Performance Analog due to normal price declines.
Operating profit was $1.69 billion, or 26.6 percent of revenue. This was a decrease of $183 million, or 10 percent, compared with 2010 due to higher operating expenses from the inclusion of a partial year of SVA and, to a lesser extent, lower gross profit resulting from lower factory utilization.
Embedded Processing 2011 2010 Change
Revenue . . . . . . . . . . . . . . . . . . . . . . . . . . . . . . . . . . . . . . . . . . . . . . $2,110 $2,073 2%Operating profit. . . . . . . . . . . . . . . . . . . . . . . . . . . . . . . . . . . . . . . . . . . 368 491 -25%
Operating profit % of revenue . . . . . . . . . . . . . . . . . . . . . . . . . . . . . . . . . 17.4% 23.7% Restructuring charges/other* . . . . . . . . . . . . . . . . . . . . . . . . . . . . . . . . . . . . $ — $ 6
* Included in Operating profit
Embedded Processing revenue increased $37 million, or 2 percent, compared with 2010 due to increased shipments of products sold into automotive and communications infrastructure applications. Partially offsetting these increases was lower revenue from catalog products resulting from a less favorable mix of catalog products shipped.
Operating profit was $368 million, or 17.4 percent of revenue. This was a decrease of $123 million, or 25 percent, compared with 2010 primarily due to lower gross profit, and to a lesser extent, higher operating expenses. Lower gross profit was primarily due to lower factory utilization and the effect of the mix of products, which contributed about equally to the change.
Wireless 2011 2010 Change
Revenue . . . . . . . . . . . . . . . . . . . . . . . . . . . . . . . . . . . . . . . . . . . . . . $2,518 $2,978 -15%Operating profit. . . . . . . . . . . . . . . . . . . . . . . . . . . . . . . . . . . . . . . . . . . 412 683 -40%
Operating profit % of revenue . . . . . . . . . . . . . . . . . . . . . . . . . . . . . . . . . 16.4% 22.9% Restructuring charges/other* . . . . . . . . . . . . . . . . . . . . . . . . . . . . . . . . . . . . $ — $ 10
* Included in Operating profit

AN
NU
AL
RE
PO
RT
T E X A S I N S T R U M E N T S 2 0 1 2 A N N U A L R E P O R T • 4 7
Wireless revenue decreased $460 million, or 15 percent, from 2010 due to decreased shipments of baseband products, and to a much lesser extent, connectivity products. Partially offsetting these decreases was growth in revenue from OMAP applications processors due to a more favorable mix of products shipped. Baseband revenue for 2011 was $1.10 billion, a decrease of $609 million, or 36 percent, compared with 2010.
Operating profit was $412 million, or 16.4 percent of revenue. This was a decrease of $271 million, or 40 percent, compared with 2010 primarily due to lower revenue and associated gross profit.
Other 2011 2010 Change
Revenue . . . . . . . . . . . . . . . . . . . . . . . . . . . . . . . . . . . . . . . . . . . . . . $2,732 $2,936 -7%Operating profit. . . . . . . . . . . . . . . . . . . . . . . . . . . . . . . . . . . . . . . . . . . 519 1,464 -65%
Operating profit % of revenue . . . . . . . . . . . . . . . . . . . . . . . . . . . . . . . . . 19.0% 49.9% Restructuring charges/other* . . . . . . . . . . . . . . . . . . . . . . . . . . . . . . . . . . . . $ 112 $ (140) Acquisition charges* . . . . . . . . . . . . . . . . . . . . . . . . . . . . . . . . . . . . . . . . 315 —
* Included in Operating profit
Revenue from Other was $2.73 billion in 2011. This was a decrease of $204 million, or 7 percent, from 2010 primarily due to decreased shipments across most areas.
Operating profit for 2011 from Other was $519 million, or 19.0 percent of revenue. This was a decrease of $945 million, or 65 percent, compared with 2010 due to charges associated with the National acquisition; the absence of a gain on divestiture; lower revenue and associated gross profit; restructuring charges related to the action initiated in 2011 to close certain manufacturing facilities in Texas and Japan; and the net losses associated with the Japan earthquake.
Financial condition
At the end of 2012, total cash (Cash and cash equivalents plus Short-term investments) was $3.96 billion, an increase of $1.03 billion from the end of 2011.
Accounts receivable were $1.23 billion at the end of 2012. This was a decrease of $315 million compared with the end of 2011. The decrease in accounts receivable was due to lower revenue in December 2012 than in December 2011. Days sales outstanding were 37 at the end of 2012 compared with 41 at the end of 2011.
Inventory was $1.76 billion at the end of 2012. This was a decrease of $31 million from the end of 2011. Days of inventory at the end of 2012 were 103 compared with 86 at the end of 2011. Our days of inventory increased in order to support higher customer service levels.
Liquidity and capital resources
Our primary source of liquidity is cash flow from operations. Additional sources of liquidity are Cash and cash equivalents, Short-term investments and revolving credit facilities. Cash flow from operations for 2012 was $3.41 billion, an increase of $158 million from the prior year due to an increase in cash provided by working capital.
We had $1.416 billion of Cash and cash equivalents and $2.549 billion of Short-term investments as of December 31, 2012.We have a variable-rate revolving credit facility with a consortium of investment-grade banks that allows us to borrow up to
$2 billion until March 2017. This credit facility also serves as support for the issuance of commercial paper. As of December 31, 2012, we had no commercial paper outstanding.
In 2012, investing activities used $1.04 billion. This compares with $6.17 billion used in 2011 primarily for the National acquisition, net of cash acquired. See Note 2 to the financial statements for details. For 2012, capital expenditures (Additions to property, plant and equipment) were $495 million compared with $816 million in 2011. Capital expenditures in 2012 were primarily for semiconductor manufacturing equipment. We used cash of $604 million to make net purchases of short-term investments in 2012 compared with $98 million in 2011.
In 2012, financing activities used net cash of $1.95 billion and provided $2.59 billion in 2011. In 2012, we received proceeds of $1.49 billion from the issuance of fixed-rate long-term debt (net of original issuance discount). This compares with proceeds in 2011 of $3.50 billion we received from the issuance of fixed- and variable-rate long-term debt (net of the original issuance discount) and $1.20 billion from the issuance of commercial paper. The 2011 issuance of long-term debt was used in the National acquisition. The commercial paper was issued for general corporate purposes and to maintain cash balances at desired levels. See Note 12 to the financial statements for additional details. We used $1.38 billion to repay debt and commercial paper in 2012 compared with

AN
NU
AL
RE
PO
RT
T E X A S I N S T R U M E N T S48 • 2 0 1 2 A N N U A L R E P O R T
$200 million used to repay commercial paper in 2011. Dividends paid in 2012 of $819 million compared with $644 million in 2011, reflecting increases in the dividend rate in each year. In September 2012, we announced a 24 percent increase in our quarterly cash dividend. The quarterly dividend increased from $0.17 to $0.21 per share, resulting in an annualized dividend payment of $0.84 per share. We used $1.80 billion to repurchase 59.8 million shares of our common stock in 2012 compared with $1.97 billion used to repurchase 59.5 million shares in 2011. Employee exercises of stock options are also reflected in cash from financing activities. In 2012, these exercises provided cash proceeds of $523 million compared with $690 million in 2011.
We believe we have the necessary financial resources and operating plans to fund our working capital needs, capital expenditures, dividend and debt-related payments, and other business requirements for at least the next 12 months.
Non-GAAP financial informationThis MD&A includes a discussion of free cash flow, a measure that was not prepared in accordance with generally accepted accounting principles in the United States (non-GAAP measure). We provide this measure to give investors insight into the company’s liquidity and cash-generating capability and the amount of its cash available to return to investors. It is supplemental to the comparable GAAP measure.
Free cash flow was calculated by subtracting capital expenditures (Additions to property, plant and equipment) from Cash flows from operating activities. The components of this calculation are included in the table below.
For Years Ended December 31,
2012 2011
Cash flows from operating activities (GAAP) . . . . . . . . . . . . . . . . . . . . . . . . . . . . . . . . . . . . $3,414 $3,256Less capital expenditures (Additions to property, plant and equipment) . . . . . . . . . . . . . . . . . . . . . . . 495 816Free cash flow (non-GAAP) . . . . . . . . . . . . . . . . . . . . . . . . . . . . . . . . . . . . . . . . . . . . . $2,919 $2,440
Long-term contractual obligations
Payments Due by Period
Contractual obligations 2013 2014/2015 2016/2017 Thereafter Total
Long-term debt obligations (a) . . . . . . . . . . . . . . . . . . . . . . . . $1,500 $2,000 $1,375 $750 $5,625 Operating lease obligations (b) . . . . . . . . . . . . . . . . . . . . . . . . 102 143 81 80 406 Software license obligations (c). . . . . . . . . . . . . . . . . . . . . . . . 46 47 — — 93 Purchase obligations (d) . . . . . . . . . . . . . . . . . . . . . . . . . . . 77 79 28 22 206 Deferred compensation plan (e) . . . . . . . . . . . . . . . . . . . . . . . 12 31 30 66 139Total (f) . . . . . . . . . . . . . . . . . . . . . . . . . . . . . . . . . . . . $1,737 $2,300 $1,514 $918 $6,469
(a) Long-term debt obligations include amounts classified as the current portion of long-term debt, i.e., obligations that will be retired within 12 months. The related interest payments are not included.
(b) Includes minimum payments for leased facilities and equipment, as well as purchases of industrial gases under contracts accounted for as an operating lease.
(c) Includes payments under license agreements for electronic design automation software.(d) Includes contractual arrangements with suppliers where there is a fixed non-cancellable payment schedule or minimum payments
due with a reduced delivery schedule. Excluded from the table are cancellable arrangements. However, depending on when certain purchase arrangements may be cancelled, an additional $10 million of cancellation penalties may be required to be paid, which are not reflected in the table.
(e) Includes an estimate of payments under this plan for the liability that existed at December 31, 2012.(f) Excluded from the table are $184 million of uncertain tax liabilities under ASC 740, as well as any planned, future funding
contributions to retirement benefit plans. Amounts associated with uncertain tax liabilities have been excluded because of the difficulty in making reasonably reliable estimates of the timing of cash settlements with the respective taxing authorities. Regarding future funding of retirement benefit plans, we plan to contribute about $100 million in 2013, but funding projections beyond 2013 are not practical to estimate due to the rules affecting tax-deductible contributions and the impact from the plans’ asset performance, interest rates and potential U.S. and non-U.S. legislation.

AN
NU
AL
RE
PO
RT
T E X A S I N S T R U M E N T S 2 0 1 2 A N N U A L R E P O R T • 4 9
Critical accounting policies
In preparing our consolidated financial statements in conformity with accounting principles generally accepted in the United States, we use statistical analyses, estimates and projections that affect the reported amounts and related disclosures and may vary from actual results. We consider the following accounting policies to be both those that are most important to the portrayal of our financial condition and that require the most subjective judgment. If actual results differ significantly from management’s estimates and projections, there could be a significant effect on our financial statements.
Revenue recognitionRevenue from sales of our products, including sales to our distributors, is recognized upon shipment or delivery, depending upon the terms of the sales order, provided that persuasive evidence of a sales arrangement exists, title and risk of loss have transferred to the customer, the sales amounts are fixed or determinable, and collection of the revenue is reasonably assured. Revenue from sales of our products that are subject to inventory consignment agreements is recognized when the customer or distributor pulls product from consignment inventory that we store at designated locations.
We reduce revenue based on estimates of future credits to be granted to customers. Credits include volume-based incentives, other special pricing arrangements and product returns due to quality issues. Our estimates of future credits are based on historical experience, analysis of product shipments and contractual arrangements with customers and distributors.
In 2012, about 50 percent of our revenue was generated from sales of our products to distributors. We recognize distributor revenue net of allowances, which are management’s estimates based on analysis of historical data, current economic conditions and contractual terms. These allowances recognize the impact of credits granted to distributors under certain programs common in the semiconductor industry whereby distributors receive certain price adjustments to meet individual competitive opportunities, or are allowed to return or scrap a limited amount of product in accordance with contractual terms agreed upon with the distributor, or receive price protection credits when our standard published prices are lowered from the price the distributor paid for product still in its inventory, or other incentives designed to maximize growth opportunities. Historical claims data are maintained for each of the programs, with differences among geographic regions taken into consideration. We continually monitor the actual claimed allowances against our estimates, and we adjust our estimates as appropriate to reflect trends in distributor revenue and inventory levels. Allowances are also adjusted when recent historical data do not represent anticipated future activity. About 40 percent of our distributor revenue is generated from sales of consigned inventory, and we expect this proportion to grow over time. The allowances we record against this revenue are not material.
In addition, we monitor collectability of accounts receivable primarily through review of the accounts receivable aging. When collection is at risk, we assess the impact on amounts recorded for bad debts and, if necessary, will record a charge in the period such determination is made.
Income taxesIn determining net income for financial statement purposes, we must make certain estimates and judgments in the calculation of tax provisions and the resultant tax liabilities, and in the recoverability of deferred tax assets that arise from temporary differences between the tax and financial statement recognition of revenue and expense.
In the ordinary course of global business, there may be many transactions and calculations where the ultimate tax outcome is uncertain. The calculation of tax liabilities involves dealing with uncertainties in the application of complex tax laws. We recognize potential liabilities for anticipated tax audit issues in the U.S. and other tax jurisdictions based on an estimate of the ultimate resolution of whether, and the extent to which, additional taxes will be due. Although we believe the estimates are reasonable, no assurance can be given that the final outcome of these matters will not be different than what is reflected in the historical income tax provisions and accruals.
As part of our financial process, we must assess the likelihood that our deferred tax assets can be recovered. If recovery is not likely, the provision for taxes must be increased by recording a reserve in the form of a valuation allowance for the deferred tax assets that are estimated not to be ultimately recoverable. In this process, certain relevant criteria are evaluated including the existence of deferred tax liabilities that can be used to absorb deferred tax assets, the taxable income in prior years that can be used to absorb net operating losses and credit carrybacks, and taxable income in future years. Our judgment regarding future recoverability of our deferred tax assets based on these criteria may change due to various factors, including changes in U.S. or international tax laws and changes in market conditions and their impact on our assessment of taxable income in future periods. These changes, if any, may require material adjustments to the deferred tax assets and an accompanying reduction or increase in net income in the period when such determinations are made.
In addition to the factors described above, the effective tax rate reflected in forward-looking statements is based on then-current tax law. Significant changes in tax law enacted during the year could affect these estimates. Retroactive changes in tax law enacted subsequent to the end of a reporting period are reflected in the period of enactment as a discrete tax item.

AN
NU
AL
RE
PO
RT
T E X A S I N S T R U M E N T S50 • 2 0 1 2 A N N U A L R E P O R T
Inventory valuation allowancesInventory is valued net of allowances for unsalable or obsolete raw materials, work-in-process and finished goods. Allowances are determined quarterly by comparing inventory levels of individual materials and parts to historical usage rates, current backlog and estimated future sales and by analyzing the age of inventory, in order to identify specific components of inventory that are judged unlikely to be sold. Allowances are also calculated quarterly for instances where inventoried costs for individual products are in excess of market prices for those products. In addition to this specific identification process, statistical allowances are calculated for remaining inventory based on historical write-offs of inventory for salability and obsolescence reasons. Actual future write-offs of inventory for salability and obsolescence reasons may differ from estimates and calculations used to determine valuation allowances due to changes in customer demand, customer negotiations, technology shifts and other factors.
Impairment of acquisition-related intangibles and goodwillWe review acquisition-related intangible assets for impairment when certain indicators suggest the carrying amount may not be recoverable. Factors considered include the underperformance of an asset compared with expectations and shortened useful lives due to planned changes in the use of the assets. Recoverability is determined by comparing the carrying amount of the assets to estimated future undiscounted cash flows. If future undiscounted cash flows are less than the carrying amount, an impairment charge would be recognized for the excess of the carrying amount over fair value, determined by utilizing a discounted cash flow technique. Additionally, in the case of intangible assets that will continue to be used in future periods, a shortened useful life may be utilized if appropriate, resulting in accelerated amortization based upon the expected net realizable value of the asset at the date the asset will no longer be utilized.
We review goodwill for impairment annually, or more frequently if certain impairment indicators arise, such as significant changes in business climate, operating performance or competition, or upon the disposition of a significant portion of a reporting unit. A significant amount of judgment is involved in determining if an indicator of impairment has occurred between annual test dates. This impairment review compares the fair value for each reporting unit containing goodwill to its carrying value. Determining the fair value of a reporting unit involves the use of significant estimates and assumptions, including projected future cash flows, discount rates based on weighted average cost of capital and future economic and market conditions. We base our fair-value estimates on assumptions we believe to be reasonable.
Actual cash flow amounts for future periods may differ from estimates used in impairment testing.
Business combinationsThe acquisition method of accounting requires that we recognize the assets acquired and liabilities assumed at their acquisition date fair values. Goodwill is measured as the excess of consideration transferred over the acquisition date net fair values of the assets acquired and the liabilities assumed.
The measurement of the fair values of assets acquired and liabilities assumed requires considerable judgment. Although independent appraisals may be used to assist in the determination of the fair values of certain assets and liabilities, those determinations are usually based on significant estimates provided by management, such as forecasted revenue or profit. In determining the fair value of intangible assets, an income approach is generally used and may incorporate the use of a discounted cash flow method. In applying the discounted cash flow method, the estimated future cash flows and residual values for each intangible asset are discounted to a present value using a discount rate based on an estimated weighted average cost of capital for the semiconductor industry. These cash flow projections are based on management’s estimates of economic and market conditions including revenue growth rates, operating margins, capital expenditures and working capital requirements.
While we use our best estimates and assumptions as part of the process to value assets acquired and liabilities assumed at the acquisition date, our estimates are inherently uncertain and subject to refinement. During the measurement period, which occurs before finalization of the purchase price allocation, changes in assumptions and estimates that result in adjustments to the fair values of assets acquired and liabilities assumed are recorded on a retrospective basis as of the acquisition date, with the corresponding offset to goodwill. Upon the conclusion of the measurement period, any subsequent adjustments will be recorded to our Consolidated statements of income. The measurement period for the National acquisition concluded on December 31, 2011.

AN
NU
AL
RE
PO
RT
T E X A S I N S T R U M E N T S 2 0 1 2 A N N U A L R E P O R T • 5 1
Changes in accounting standards
As of December 31, 2012, the Financial Accounting Standards Board had issued several accounting standards that we have not yet been required to adopt. None of these standards would have a material effect on our financial condition, results of operations or financial disclosures.
Off-balance sheet arrangements
As of December 31, 2012, we had no significant off-balance sheet arrangements as defined in Item 303(a)(4)(ii) of SEC Regulation S-K.
Commitments and contingencies
See Note 13 to the financial statements for a discussion of our commitments and contingencies.
Quantitative and qualitative disclosures about market risk
Foreign exchange riskThe U.S. dollar is the functional currency for financial reporting. We use forward currency exchange contracts to reduce the earnings impact exchange rate fluctuations may have on our non-U.S. dollar net balance sheet exposures. For example, at year-end 2012, we had forward currency exchange contracts outstanding with a notional value of $305 million to hedge net balance sheet exposures (including $140 million to sell Japanese yen, $26 million to sell Chinese yuan and $26 million to sell British pound sterling). Similar hedging activities existed at year-end 2011.
Because most of the aggregate non-U.S. dollar balance sheet exposure is hedged by these forward currency exchange contracts, based on year-end 2012 balances and currency exchange rates, a hypothetical 10 percent plus or minus fluctuation in non-U.S. currency exchange rates would result in a pre-tax currency exchange gain or loss of approximately $1 million.
Interest rate riskWe have the following potential exposure to changes in interest rates: (1) the effect of changes in interest rates on the fair value of our investments in cash equivalents and short-term investments, which could produce a gain or a loss; and (2) the effect of changes in interest rates on the fair value of our debt and an associated interest rate swap.
As of December 31, 2012, a hypothetical 100 basis point increase in interest rates would decrease the fair value of our investments in cash equivalents and short-term investments by $13 million and decrease the fair value of our long-term debt and the associated interest rate swap by $140 million. Because interest rates on our long-term debt are fixed or have been swapped to fixed rates, changes in interest rates would not affect the cash flows associated with long-term debt.
Equity riskLong-term investments at year-end 2012 include the following:
• Investmentsinmutualfunds–includesmutualfundsthatwereselectedtogeneratereturnsthatoffsetchangesincertainliabilities related to deferred compensation arrangements. The mutual funds hold a variety of debt and equity investments.
• Investmentsinventurecapitalfunds–includesinvestmentsinlimitedpartnerships(accountedforundereithertheequityorcost method).
• Equityinvestments–includesnon-marketable(non-publiclytraded)equitysecurities.
Investments in mutual funds are stated at fair value. Changes in prices of the mutual fund investments are expected to offset related changes in deferred compensation liabilities such that a 10 percent increase or decrease in the investments’ fair values would not materially affect operating results. Non-marketable equity securities and some venture capital funds are stated at cost. Impairments deemed to be other-than-temporary are expensed in net income. Investments in the remaining venture capital funds are stated using the equity method. See Note 9 to the financial statements for details of equity and other long-term investments.

AN
NU
AL
RE
PO
RT
T E X A S I N S T R U M E N T S52 • 2 0 1 2 A N N U A L R E P O R T
Quarterly financial data[Millions of dollars, except per-share amounts]
Quarter
2012 1st 2nd 3rd 4th
Revenue . . . . . . . . . . . . . . . . . . . . . . . . . . . . . . . . . . . . . . . . . . . $ 3,121 $ 3,335 $ 3,390 $2,979 Gross profit . . . . . . . . . . . . . . . . . . . . . . . . . . . . . . . . . . . . . . . . . 1,531 1,651 1,740 1,445 Operating profit . . . . . . . . . . . . . . . . . . . . . . . . . . . . . . . . . . . . . . 397 598 840 139Net income . . . . . . . . . . . . . . . . . . . . . . . . . . . . . . . . . . . . . . . . . $ 265 $ 446 $ 784 $ 264Earnings per common share:
Basic earnings per common share . . . . . . . . . . . . . . . . . . . . . . . . . . . $ 0.23 $ 0.38 $ 0.68 $ 0.23 Diluted earnings per common share . . . . . . . . . . . . . . . . . . . . . . . . . . $ 0.22 $ 0.38 $ 0.67 $ 0.23
Quarter
2011 1st 2nd 3rd 4th
Revenue . . . . . . . . . . . . . . . . . . . . . . . . . . . . . . . . . . . . . . . . . . . $ 3,392 $ 3,458 $ 3,466 $3,420 Gross profit . . . . . . . . . . . . . . . . . . . . . . . . . . . . . . . . . . . . . . . . . 1,728 1,753 1,744 1,548 Operating profit . . . . . . . . . . . . . . . . . . . . . . . . . . . . . . . . . . . . . . . 908 905 814 365 Net income . . . . . . . . . . . . . . . . . . . . . . . . . . . . . . . . . . . . . . . . . . $ 666 $ 672 $ 601 $ 298 Earnings per common share:
Basic earnings per common share . . . . . . . . . . . . . . . . . . . . . . . . . . . . $ 0.56 $ 0.57 $ 0.52 $ 0.26 Diluted earnings per common share . . . . . . . . . . . . . . . . . . . . . . . . . . . $ 0.55 $ 0.56 $ 0.51 $ 0.25
Included in the results above were the following items:Quarter
2012 1st 2nd 3rd 4th
Acquisition-related charges (a) . . . . . . . . . . . . . . . . . . . . . . . . . . . . . . $ 174 $ 104 $ 106 $ 88Recorded as Cost of revenue . . . . . . . . . . . . . . . . . . . . . . . . . . . . . . . 21 — — —Recorded as Acquisition charges . . . . . . . . . . . . . . . . . . . . . . . . . . . . . 153 104 106 88
Restructuring charges/other (b) . . . . . . . . . . . . . . . . . . . . . . . . . . . . . . $ 10 $ 13 $ (122) $ 363
Quarter
2011 1st 2nd 3rd 4th
Acquisition-related charges (a) . . . . . . . . . . . . . . . . . . . . . . . . . . . . . . . . $ 2 $ 13 $ 154 $ 256Recorded as Cost of revenue . . . . . . . . . . . . . . . . . . . . . . . . . . . . . . . — — 7 103Recorded as Acquisition charges . . . . . . . . . . . . . . . . . . . . . . . . . . . . . 2 13 147 153
Restructuring charges/other (b) . . . . . . . . . . . . . . . . . . . . . . . . . . . . . . . . $ — $ — $ — $ 112
(a) See Note 2 to the financial statements for additional information.(b) See Note 3 to the financial statements for additional information.
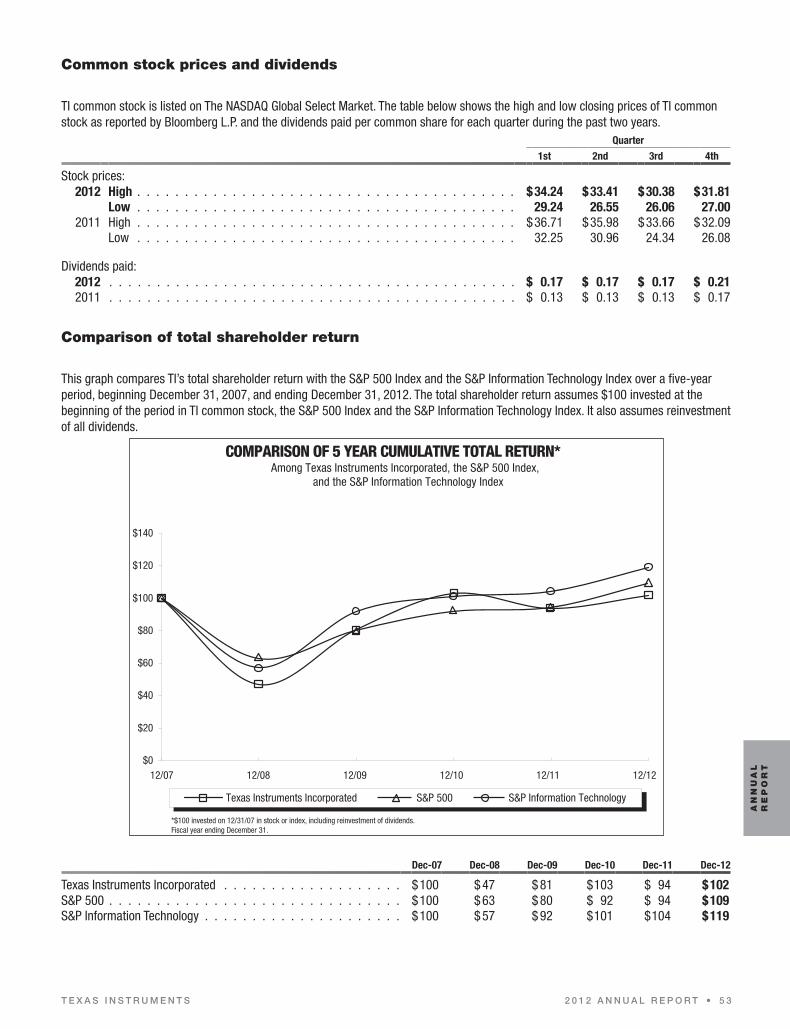
AN
NU
AL
RE
PO
RT
T E X A S I N S T R U M E N T S 2 0 1 2 A N N U A L R E P O R T • 5 3
Common stock prices and dividends
TI common stock is listed on The NASDAQ Global Select Market. The table below shows the high and low closing prices of TI common stock as reported by Bloomberg L.P. and the dividends paid per common share for each quarter during the past two years.
Quarter
1st 2nd 3rd 4th
Stock prices: 2012 High . . . . . . . . . . . . . . . . . . . . . . . . . . . . . . . . . . . . . . . . $34.24 $33.41 $30.38 $31.81
Low . . . . . . . . . . . . . . . . . . . . . . . . . . . . . . . . . . . . . . . . 29.24 26.55 26.06 27.002011 High . . . . . . . . . . . . . . . . . . . . . . . . . . . . . . . . . . . . . . . . $36.71 $35.98 $33.66 $32.09
Low . . . . . . . . . . . . . . . . . . . . . . . . . . . . . . . . . . . . . . . . 32.25 30.96 24.34 26.08
Dividends paid:2012 . . . . . . . . . . . . . . . . . . . . . . . . . . . . . . . . . . . . . . . . . . . $ 0.17 $ 0.17 $ 0.17 $ 0.212011 . . . . . . . . . . . . . . . . . . . . . . . . . . . . . . . . . . . . . . . . . . . $ 0.13 $ 0.13 $ 0.13 $ 0.17
Comparison of total shareholder return
This graph compares TI’s total shareholder return with the S&P 500 Index and the S&P Information Technology Index over a five-year period, beginning December 31, 2007, and ending December 31, 2012. The total shareholder return assumes $100 invested at the beginning of the period in TI common stock, the S&P 500 Index and the S&P Information Technology Index. It also assumes reinvestment of all dividends.
COMPARISON OF 5 YEAR CUMULATIVE TOTAL RETURN*Among Texas Instruments Incorporated, the S&P 500 Index,
and the S&P Information Technology Index
$0
$20
$40
$60
$80
$100
$120
$140
*$100 invested on 12/31/07 in stock or index, including reinvestment of dividends. Fiscal year ending December 31.
12/1212/07 12/08 12/09 12/10 12/11
Texas Instruments Incorporated S&P 500 S&P Information Technology
Dec-07 Dec-08 Dec-09 Dec-10 Dec-11 Dec-12
Texas Instruments Incorporated . . . . . . . . . . . . . . . . . . . $ 100 $ 47 $ 81 $ 103 $ 94 $ 102S&P 500 . . . . . . . . . . . . . . . . . . . . . . . . . . . . . . . $ 100 $ 63 $ 80 $ 92 $ 94 $ 109S&P Information Technology . . . . . . . . . . . . . . . . . . . . . $ 100 $ 57 $ 92 $ 101 $ 104 $ 119

AN
NU
AL
RE
PO
RT
T E X A S I N S T R U M E N T S54 • 2 0 1 2 A N N U A L R E P O R T
“Safe Harbor” Statement under the Private Securities Litigation Reform Act of 1995:
This report includes forward-looking statements intended to qualify for the safe harbor from liability established by the Private Securities Litigation Reform Act of 1995. These forward-looking statements generally can be identified by phrases such as TI or its management “believes,” “expects,” “anticipates,” “foresees,” “forecasts,” “estimates” or other words or phrases of similar import. Similarly, statements herein that describe TI’s business strategy, outlook, objectives, plans, intentions or goals also are forward-looking statements. All such forward-looking statements are subject to certain risks and uncertainties that could cause actual results to differ materially from those in forward-looking statements.
We urge you to carefully consider the following important factors that could cause actual results to differ materially from the expectations of TI or its management:
• Marketdemandforsemiconductors,particularlyinkeymarketssuchascommunications,computing,industrial, consumer electronics and automotive;
• TI’sabilitytomaintainorimproveprofitmargins,includingitsabilitytoutilizeitsmanufacturingfacilitiesatsufficientlevelstocover its fixed operating costs, in an intensely competitive and cyclical industry;
• TI’sabilitytodevelop,manufactureandmarketinnovativeproductsinarapidlychangingtechnologicalenvironment;• TI’sabilitytocompeteinproductsandpricesinanintenselycompetitiveindustry;• TI’sabilitytomaintainandenforceastrongintellectualpropertyportfolioandobtainneededlicensesfromthirdparties;• ExpirationoflicenseagreementsbetweenTIanditspatentlicensees,andmarketconditionsreducingroyaltypaymentstoTI;• Economic,socialandpoliticalconditionsinthecountriesinwhichTI,itscustomersoritssuppliersoperate,includingsecurity
risks, health conditions, possible disruptions in transportation, communications and information technology networks and fluctuations in foreign currency exchange rates;
• NaturaleventssuchassevereweatherandearthquakesinthelocationsinwhichTI,itscustomersoritssuppliersoperate;• Availabilityandcostofrawmaterials,utilities,manufacturingequipment,third-partymanufacturingservicesand
manufacturing technology;• ChangesinthetaxrateapplicabletoTIastheresultofchangesintaxlaw,thejurisdictionsinwhichprofitsaredeterminedtobe
earned and taxed, the outcome of tax audits and the ability to realize deferred tax assets;• ChangesinlawsandregulationstowhichTIoritssuppliersareormaybecomesubject,suchasthoseimposingfeesorreporting
or substitution costs relating to the discharge of emissions into the environment or the use of certain raw materials in our manufacturing processes;
• Lossesorcurtailmentsofpurchasesfromkeycustomersandthetimingandamountofdistributorandothercustomerinventory adjustments;
• Customerdemandthatdiffersfromourforecasts;• ThefinancialimpactofinadequateorexcessTIinventorythatresultsfromdemandthatdiffersfromprojections;• Impairmentsofournon-financialassets;• Productliabilityorwarrantyclaims,claimsbasedonepidemicordeliveryfailureorrecallsbyTIcustomersforaproduct
containing a TI part; • TI’sabilitytorecruitandretainskilledpersonnel;• Timelyimplementationofnewmanufacturingtechnologiesandinstallationofmanufacturingequipment,andtheabilitytoobtain
needed third-party foundry and assembly/test subcontract services;• TI’sobligationtomakeprincipalandinterestpaymentsonitsdebt;• TI’sabilitytosuccessfullyintegrateandrealizeopportunitiesforgrowthfromacquisitions,andourabilitytorealizeour
expectations regarding the amount and timing of restructuring charges and associated cost savings; and• Breachesofourinformationtechnologysystems.
For a more detailed discussion of these factors see the Risk Factors discussion in Item 1A of our most recent Form 10-K. The forward-looking statements included in this report are made only as of the date of this report (March 2013), and we undertake no obligation to update the forward-looking statements to reflect subsequent events or circumstances.

T E X A S I N S T R U M E N T S 2 0 1 3 P R O X Y S TAT E M E N T • 5 5
PR
OX
Y
ST
AT
EM
EN
T
Notice of annual meeting of stockholdersApril 18, 2013
Dear Stockholder:
You are cordially invited to attend the 2013 annual meeting of stockholders on Thursday, April 18, 2013, at the cafeteria on our property at 12500 TI Boulevard, Dallas, Texas, at 10:00 a.m. (Central time). At the meeting we will consider and act upon the following matters:
• theelectionofdirectorsforthenextyear,• advisoryapprovalofthecompany’sexecutivecompensation,• ratificationoftheappointmentofErnst&YoungLLPasthecompany’sindependentregisteredpublicaccountingfirmfor2013,and• suchothermattersasmayproperlycomebeforethemeeting.
StockholdersofrecordatthecloseofbusinessonFebruary19,2013,areentitledtovoteattheannualmeeting.
We urge you to vote your shares as promptly as possible by: (1) accessing the Internet website, (2) calling the toll-free number or (3) signing, dating and mailing the enclosed proxy.
Sincerely,
JosephF.Hubach SeniorVicePresident, Secretary and General Counsel
Dallas, Texas March 5, 2013

T E X A S I N S T R U M E N T S56 • 2 0 1 3 P R O X Y S TAT E M E N T
PR
OX
Y
ST
AT
EM
EN
T
Voting procedures and quorum . . . . . . . . . . . . . . . . . . . . . . . . 56Electionofdirectors . . . . . . . . . . . . . . . . . . . . . . . . . . . . . . . . . 57 Nominees for directorship . . . . . . . . . . . . . . . . . . . . . . . . . . 57 Director nomination process . . . . . . . . . . . . . . . . . . . . . . . . 58 Board diversity and nominee qualifications . . . . . . . . . . . . . 58 Communicationswiththeboard . . . . . . . . . . . . . . . . . . . . . 60 Corporate governance . . . . . . . . . . . . . . . . . . . . . . . . . . . . 60 Annual meeting attendance . . . . . . . . . . . . . . . . . . . . . . . . 60 Director independence . . . . . . . . . . . . . . . . . . . . . . . . . . . . 60Board organization . . . . . . . . . . . . . . . . . . . . . . . . . . . . . . . . . 61 Board and committee meetings . . . . . . . . . . . . . . . . . . . . . 61 Committeesoftheboard . . . . . . . . . . . . . . . . . . . . . . . . . . 61 Board leadership structure . . . . . . . . . . . . . . . . . . . . . . . . . 63 Riskoversightbytheboard . . . . . . . . . . . . . . . . . . . . . . . . 64Director compensation . . . . . . . . . . . . . . . . . . . . . . . . . . . . . . 64 2012 director compensation . . . . . . . . . . . . . . . . . . . . . . . . 65Executivecompensation . . . . . . . . . . . . . . . . . . . . . . . . . . . . . 67 Proposalregardingadvisoryapprovalof thecompany’sexecutivecompensation . . . . . . . . . . . . 67Compensation discussion and analysis . . . . . . . . . . . . . . . . . . 68Compensation Committee report . . . . . . . . . . . . . . . . . . . . . . . 802012summarycompensationtable . . . . . . . . . . . . . . . . . . . . 80 Grantsofplan-basedawardsin2012 . . . . . . . . . . . . . . . . . 82
Outstanding equity awards at fiscal year-end 2012 . . . . . . . 83 2012 option exercises and stock vested . . . . . . . . . . . . . . . 86 2012pensionbenefits . . . . . . . . . . . . . . . . . . . . . . . . . . . . 86 2012 non-qualified deferred compensation . . . . . . . . . . . . 88 Potentialpaymentsuponterminationor change in control . . . . . . . . . . . . . . . . . . . . . . . . . . . . . 89Audit Committee report . . . . . . . . . . . . . . . . . . . . . . . . . . . . . . 93Proposaltoratifyappointmentofindependent registeredpublicaccountingfirm . . . . . . . . . . . . . . . . . . . . 93Additional information . . . . . . . . . . . . . . . . . . . . . . . . . . . . . . . 94 Voting securities . . . . . . . . . . . . . . . . . . . . . . . . . . . . . . . . . 94 Securityownershipofcertainbeneficialowners . . . . . . . . . 94 Security ownership of directors and management . . . . . . . 95 Related person transactions . . . . . . . . . . . . . . . . . . . . . . . . 96 Compensation committee interlocks and insider participation . . . . . . . . . . . . . . . . . . . . . . . . . . . . 97 Cost of solicitation . . . . . . . . . . . . . . . . . . . . . . . . . . . . . . . 97 Stockholder proposals for 2014 . . . . . . . . . . . . . . . . . . . . . 97 Benefit plan voting . . . . . . . . . . . . . . . . . . . . . . . . . . . . . . . 97 Section16(a)beneficialownershipreportingcompliance . . 98 Telephone and Internet voting . . . . . . . . . . . . . . . . . . . . . . . 98 Stockholders sharing the same address . . . . . . . . . . . . . . . 98 Electronicdeliveryofproxymaterials . . . . . . . . . . . . . . . . . 98
Table of contents
Executive offices12500TIBOULEVARD,DALLAS,TEXAS75243 MAILINGADDRESS:P.O.BOX660199,DALLAS,TEXAS75266-0199
Voting procedures and quorum
TI’sboardofdirectorsrequestsyourproxyfortheannualmeetingofstockholdersonApril18,2013.Ifyousignandreturntheenclosedproxy,orvotebytelephoneorontheInternet,youauthorizethepersonsnamedintheproxytorepresentyouandvoteyoursharesforthepurposesmentionedinthenoticeofannualmeeting.ThisproxystatementandrelatedproxyarebeingdistributedonoraboutMarch 5,2013.Ifyoucometothemeeting,youcanvoteinperson.Ifyoudonotcometothemeeting,yoursharescanbevotedonlyifyouhavereturnedaproperlysignedproxyorfollowedthetelephoneorInternetvotinginstructions,whichcanbefoundontheenclosedproxy.Ifyousignandreturnyourproxybutdonotgivevotinginstructions,thesharesrepresentedbythatproxywillbevotedasrecommendedbytheboardofdirectors.Youcanrevokeyourauthorizationatanytimebeforethesharesarevotedatthemeeting.
A quorum of stockholders is necessary to hold a valid meeting. If at least a majority of the shares of TI common stock issued and outstandingandentitledtovotearepresentinpersonorbyproxy,aquorumwillexist.Abstentionsandbrokernon-votesarecountedaspresentforpurposesofestablishingaquorum.Brokernon-votesoccurwhenabeneficialownerwhoholdscompanystockthroughabrokerdoesnotprovidethebrokerwithvotinginstructionsastoanymatteronwhichthebrokerisnotpermittedtoexerciseitsdiscretion and vote without specific instruction.
Scheduledtobeconsideredatthemeetingaretheelectionofdirectors,anadvisoryvoteregardingapprovalofthecompany’sexecutivecompensation,andratificationoftheappointmentofourindependentregisteredpublicaccountingfirm.Eachofthesemattersis discussed elsewhere in this proxy statement.
Anyothermatterthatmayproperlybesubmittedatthemeetingisapprovedifamajorityofthevotespresentatthemeetingvote“for”theproposal.Onsuchmattersyoumayvote“for,”“against”or“abstain”;abstentionsandbrokernon-voteshavethesameeffectas votes “against.”
Proxy statement – March 5, 2013

T E X A S I N S T R U M E N T S 2 0 1 3 P R O X Y S TAT E M E N T • 5 7
PR
OX
Y
ST
AT
EM
EN
T
Directors are elected at the annual meeting to hold office until the next annual meeting and until their successors are elected andqualified.Theboardofdirectorshasdesignatedthefollowingpersonsasnominees:RALPHW.BABB,JR.,MARKA.BLINN,DANIELA.CARP,CARRIES.COX,PAMELAH.PATSLEY,ROBERTE.SANCHEZ,WAYNER.SANDERS,RUTHJ.SIMMONS,RICHARDK.TEMPLETONandCHRISTINETODDWHITMAN.
Ifyoureturnaproxythatisnototherwisemarked,yourshareswillbevotedFOReachofthenominees.Directorsmustbeelectedbyamajorityofthevotespresentatthemeetingandentitledtobecastintheelection.Youmayvote
“for,”“against,”or“abstain.”Abstentionshavethesameeffectasvotes“against.”Brokernon-votesarenotcountedasvotes“for”or “against.”
Nominees for directorship
Allofthenomineesfordirectorshiparedirectorsofthecompany.Foradiscussionofeachnominee’squalificationstoserveasadirectorof the company, please see pages 58-60.Ifanynomineebecomesunabletoservebeforethemeeting,thepersons named as proxies mayvoteforasubstituteorthenumberofdirectorswillbereducedaccordingly.
DirectorsRALPH W. BABB, JR.Age 64 Director since 2010 Member, Audit Committee
MARK A. BLINNAge 51 DirectorsinceFebruary21,2013
DANIEL A. CARPAge 64 Directorsince1997 Member, Governance and Stockholder Relations Committee
CARRIE S. COXAge 55 Director since 2004 Chair, Compensation Committee
PAMELA H. PATSLEYAge 56 Director since 2004 Lead Director; Chair, Audit Committee
ROBERT E. SANCHEZAge 47 Director since 2011 Member, Audit Committee
WAYNE R. SANDERSAge 65 Directorsince1997 Member, Compensation Committee
RUTH J. SIMMONSAge 67 Directorsince1999 Member, Compensation Committee
RICHARD K. TEMPLETONAge 54 Chairman since 2008 and director since 2003
CHRISTINE TODD WHITMANAge 66 Director since 2003 Chair, Governance and Stockholder Relations Committee
Election of directors

T E X A S I N S T R U M E N T S58 • 2 0 1 3 P R O X Y S TAT E M E N T
PR
OX
Y
ST
AT
EM
EN
T
Director nomination process
Theboardisresponsibleforapprovingnomineesforelectionasdirectors.Toassistinthistask,theboardhasdesignatedastandingcommittee,theGovernanceandStockholderRelationsCommittee(theG&SRCommittee),whichisresponsibleforreviewingandrecommendingnomineestotheboard.TheG&SRCommitteeiscomprisedsolelyofindependentdirectorsasdefinedbytherulesofTheNASDAQStockMarket(NASDAQ)andtheboard’scorporategovernanceguidelines.OurboardofdirectorshasadoptedawrittencharterfortheG&SRCommittee.Itcanbefoundonourwebsiteatwww.ti.com/corporategovernance.
Itisalong-standingpolicyoftheboardtoconsiderprospectiveboardnomineesrecommendedbystockholders.AstockholderwhowishestorecommendaprospectiveboardnomineefortheG&SRCommittee’sconsiderationcanwritetotheSecretaryoftheG&SRCommittee,TexasInstrumentsIncorporated,P.O.Box655936,MS8658,Dallas,TX75265-5936.TheG&SRCommitteewillevaluatethestockholder’sprospectiveboardnomineeinthesamemannerasitevaluatesothernominees.
Inevaluatingprospectivenominees,theG&SRCommitteelooksforthefollowingminimumqualifications,qualitiesandskills:• Outstandingachievementintheindividual’spersonalcareer.• Breadthofexperience.• Soundnessofjudgment.• Abilitytomakeindependent,analyticalinquiries.• Abilitytocontributetoadiversityofviewpointsamongboardmembers.• Willingnessandabilitytodevotethetimerequiredtoperformboardactivitiesadequately(inthisregard,theG&SRCommittee
willconsiderthenumberofotherboardsonwhichtheindividualservesasadirector,andinparticulartheboard’spolicythatdirectorsshouldnotserveontheboardsofmorethanthreeotherpubliccompanies).
• AbilitytorepresentthetotalcorporateinterestsofTI(adirectorwillnotbeselectedto,norwillheorshebeexpectedto,represent the interests of any particular group).
Stockholders,non-employeedirectors,managementandothersmaysubmitrecommendationstotheG&SRCommittee.Mr.BlinnwaselectedtotheboardeffectiveFebruary21,2013.Heistheonlydirectornomineeat the 2013 annual meeting of
stockholderswhoisstandingforelectionbythestockholdersforthefirsttime.AsearchfirmretainedbythecompanytoassisttheG&SRCommitteeinidentifyingandevaluatingpotentialnomineesinitiallyidentifiedMr.Blinnasapotentialdirectorcandidate.Thesearchfirmconductedresearchtoidentifyanumberofpotentialcandidates,basedonqualificationsandskillstheG&SRCommitteedeterminedthatcandidatesshouldpossess.ItthenconductedfurtherresearchonthecandidatesinwhomtheG&SRCommitteehadthemost interest.
Theboardbelievesitscurrentsizeiswithinthedesiredrangeasstatedintheboard’scorporategovernanceguidelines.
Board diversity and nominee qualifications
Asindicatedbythecriteriaabove,theboardprefersamixofbackgroundandexperienceamongitsmembers.Theboarddoesnotfollowanyratioorformulatodeterminetheappropriatemix.Rather,itusesitsjudgmenttoidentifynomineeswhosebackgrounds,attributesandexperiences,takenasawhole,willcontributetothehighstandardsofboardserviceatthecompany.Theeffectivenessofthisapproachisevidencedbythedirectors’participationintheinsightfulandrobustyetcollegialdeliberationthatoccursatboardandcommittee meetings and in shaping the agendas for those meetings.
Asitconsidereddirectornomineesforthe2013annualmeeting,theboardkeptinmindthatthemostimportantissuesitconsiderstypicallyrelatetothecompany’sstrategicdirection;successionplanningforseniorexecutivepositions;thecompany’sfinancialperformance;thechallengesofrunningalarge,complexenterprise,includingthemanagementofitsrisks;majoracquisitionsanddivestitures;andsignificantresearchanddevelopment(R&D)andcapitalinvestmentdecisions.Theseissuesariseinthecontextofthecompany’soperations,whichprimarilyinvolvethemanufactureandsaleofsemiconductorsallovertheworldintocommunications,computing, industrial, consumer electronics and automotive end markets.
Asdescribedbelow,eachofourdirectornomineeshasachievedanextremelyhighlevelofsuccessinhisorhercareer,whetheratmulti-billiondollarmultinationalcorporateenterprises,majorU.S.universitiesorlargegovernmentalorganizations.Inthesepositions,eachhasbeendirectlyinvolvedinthechallengesrelatingtosettingthestrategicdirectionandmanagingthefinancialperformance,personnelandprocessesoflarge,complexorganizations.Eachhashadexposuretoeffectiveleadersandhasdevelopedtheabilitytojudge leadership qualities. Nineofthemhaveexperienceinservingontheboardofdirectorsofatleastoneothermajorcorporation,andone has served in high political office, all of which provides additional relevant experience on which each nominee can draw.
Inconcludingthateachnomineeshouldserveasadirector,theboardreliedonthespecificexperiencesandattributeslistedbelowandonthedirectpersonalknowledge(exceptastoMr.Blinn,whojoinedtheboardonFebruary21,2013)bornofpreviousserviceontheboard,thateachofthenomineesbringsinsightandcollegialitytoboarddeliberations.

T E X A S I N S T R U M E N T S 2 0 1 3 P R O X Y S TAT E M E N T • 5 9
PR
OX
Y
ST
AT
EM
EN
T
Mr.Babb• AschairmanandCEOofComericaIncorporatedandComericaBank(2002-present)andthroughalongcareerinbanking,has
gained first-hand experience in managing large, complex institutions, as well as insight into financial markets, which experience isparticularlyrelevanttothecompanyduetoitsglobalpresence.
• AschieffinancialofficerofComericaIncorporatedandComericaBank(1995-2002),controllerandlaterchieffinancialofficerofMercantileBancorporation(1978-1995),andauditorandlaterauditmanagerattheaccountingfirmofPeatMarwickMitchell&Co.(1971-1978),gainedextensiveauditknowledgeandexperienceinaudit-andfinancialcontrol-relatedmatters.
Mr. Blinn• AsCEOandadirectorofFlowserveCorporation(2009-present),hasgainedfirst-handexperienceinmanagingalarge,
multinationalcorporationoperatinginglobalindustrialmarkets,withultimatemanagementresponsibilityfortheorganization’sfinancialperformanceandsignificantcapitalandR&Dinvestments.
• AschieffinancialofficerofFlowserveCorporation(2004-2009),chieffinancialofficerofFedExKinko’sOfficeandPrintServicesInc. (2003-2004) and vice president and controller of Centex Corporation (2000-2002), developed a keen appreciation for audit- and financial control-related matters.
Mr. Carp• AschairmanandCEO(2000-2005)andpresident(1997-2001,2002-2003)ofEastmanKodakCompany,gainedfirst-hand
experience in managing a large, multinational corporation focused on worldwide electronic consumer markets (which are ofrelevancetothecompany),withultimatemanagementresponsibilityforthecorporation’sfinancialperformanceanditssignificantinvestmentsincapitalandR&D.
• AschairmanoftheboardofdirectorsofDeltaAirLines,Inc.(2007-present),adirectorofNorfolkSouthernCorporation(2006-present)andaformerdirectorofLizClaiborne,Inc.(2006-2009),hashelpedoverseethestrategyandoperationsofmajormultinational corporations in various industries, including some that are capital-intensive.
Ms. Cox• Aschairman(January2013-present),CEOandadirector(2010-present)ofHumacyte,Inc.,executivevicepresidentand
presidentofGlobalPharmaceuticalsatSchering-PloughCorporation(2003-2009)andexecutivevicepresidentandpresidentofGlobalPrescriptionBusinessatPharmaciaCorporation(1997-2003),hasgainedfirst-handexperienceinmanaginglarge,multinationalorganizationsfocusedonmedical-relatedmarkets(whichareofrelevancetothecompany),withresponsibilityforthoseorganizations’financialperformanceandsignificantcapitalandR&Dinvestments.IsalsoadirectorofCardinalHealth,Inc.(2009-present)andCelgeneCorporation(2009-present).
Ms.Patsley• AschairmanandCEO(2009-present)ofMoneyGramInternational,Inc.,seniorexecutivevicepresidentofFirstDataCorporation
(2000-2007)andpresidentandCEOofPaymentech,Inc.(1991-2000),hasgainedfirst-handexperienceinmanaginglarge,multinational organizations, including the application of technology in the financial services sector, with ultimate management responsibilityfortheirfinancialperformanceandsignificantcapitalinvestments.
• AsAuditCommitteechairatthecompany,amemberoftheauditcommitteeatDrPepperSnappleGroup,Inc.,chieffinancialofficerofFirstUSA,Inc.(1987-1994)andaformerauditoratKPMGPeatMarwickforalmostsixyearsbeforejoiningFirstUSA,has developed a keen appreciation for audit- and financial control-related matters.
• AsadirectorofDrPepperSnappleGroup,Inc.(2008-present)andaformerdirectorofMolsonCoorsBrewingCompany(2005-2009),hashelpedoverseethestrategyandoperationsofothermajormultinationalcorporations.
Mr. Sanchez• AsCEOand a director (January 2013-present), president (2012 to present) and chief operating officer (2012) of Ryder System,
Inc., and as president of itsGlobalFleetManagementSolutionsbusinesssegment(2010-2012), has gained first-hand experience inmanagingalarge,multinational,transportation-relatedorganization,withresponsibilityfortheorganization’sfinancialperformance and significant capital investments.
• Asexecutivevicepresidentandchieffinancialofficer(2007-2010)andasseniorvicepresidentandchiefinformationofficer(2003-2005) of Ryder System, Inc., developed a keen appreciation for audit- and financial control-related issues and gained first-hand experience with all technology-related functions of a large, multinational corporation focused on transportation and logistics.
Mr. Sanders• Aschairman(1992-2003)andCEO(1991-2002)ofKimberly-ClarkCorporation,gainedfirst-handexperienceinmanaginga
large,multinationalconsumergoodscorporation,withultimatemanagementresponsibilityforitsfinancialperformanceanditssignificantcapitalandR&Dinvestments.
• AschairmanofDrPepperSnappleGroup,Inc.(2008-present)andadirectorofBeloCorporation(2003-present),hashelpedoversee the strategy and operations of other large corporations.

T E X A S I N S T R U M E N T S60 • 2 0 1 3 P R O X Y S TAT E M E N T
PR
OX
Y
ST
AT
EM
EN
T
Ms. Simmons• AspresidentofBrownUniversity(2001-2012)andpresidentofSmithCollege(1995-2001),gainedfirst-handexperiencein
managing large, complex institutions, and developed deep insight into the development and training of professionals, including engineers, scientists and technologists, on whom the company relies for its next generation of employees.
• AsadirectorofChryslerGroupLLC(2012-present)andMondelezInternational,Inc.(2012-present)andasaformerdirectorofThe Goldman Sachs Group, Inc. (2000-2010), helped oversee the strategy and operations of other large corporations.
Mr. Templeton• Asa32-yearveteranofthesemiconductorindustry,servingthelast17yearsataseniorlevelatthecompany,includingas
chairmansinceApril2008,CEOsince2004anddirectorsince2003,hasdevelopedadeepknowledgeofallaspectsofthecompany and of the semiconductor industry.
Ms.Whitman• AsAdministratoroftheEnvironmentalProtectionAgency(2001-2003)andGovernorofthestateofNewJersey(1994-2000),
gained first-hand experience managing a large, complex organization and developed keen insight into the workings of government on the federal and state level and how they might impact company operations.
• AsadirectorofS.C.Johnson&Son,Inc.(2003-present)andUnitedTechnologiesCorp.(2003-present),hashelpedoverseethestrategy and operations of other large corporations.
Communications with the board
Stockholdersandotherswhowishtocommunicatewiththeboardasawhole,ortoindividualdirectors,maywritetothemat:P.O.Box655936,MS8658,Dallas,TX75265-5936.Allcommunicationssenttothisaddresswillbesharedwiththeboardortheindividualdirector, if so addressed.
Corporate governance
Theboardhasalong-standingcommitmenttoresponsibleandeffectivecorporategovernance.Theboard’scorporategovernanceguidelines(whichincludethedirectorindependencestandards),thechartersofeachoftheboard’scommittees,TI’scodeofbusinessconductandourcodeofethicsforourCEOandseniorfinancialofficersareavailableonourwebsiteatwww.ti.com/corporategovernance.StockholdersmayrequestcopiesofthesedocumentsfreeofchargebywritingtoTexasInstrumentsIncorporated,P.O.Box660199,MS8657,Dallas,TX75266-0199,Attn:InvestorRelations.
Annual meeting attendance
Itisapolicyoftheboardtoencouragedirectorstoattendeachannualmeetingofstockholders.Suchattendanceallowsfordirectinteractionbetweenstockholdersandboardmembers.In2012,alldirectorsattendedTI’sannualmeetingofstockholders.
Director independence
TheboardhasdeterminedthateachofourdirectorsisindependentexceptforMr.Templeton.Inconnectionwiththisdetermination,informationwasreviewedregardingdirectors’businessandcharitableaffiliations,directors’immediatefamilymembersandtheiremployers,andanytransactionsorarrangementsbetweenthecompanyandsuchpersonsorentities.Theboardhas adopted the following standards for determining independence.
A.Innoeventwilladirectorbeconsideredindependentif: 1.Heorsheisacurrentpartneroforisemployedbythecompany’sindependentauditors; 2.Afamilymemberofthedirectoris(a)acurrentpartnerofthecompany’sindependentauditorsor(b)currentlyemployedbythe
company’sindependentauditorsandpersonallyworksonthecompany’saudit; 3.Withinthecurrentorprecedingthreefiscalyearsheorshewas,andremainsatthetimeofthedetermination,apartnerinora
controlling shareholder, an executive officer or an employee of an organization that in the current year or any of the past three fiscal years (a) made payments to, or received payments from, the companyforpropertyorservices,(b)extendedloanstoorreceivedloans from, the company,or(c)receivedcharitablecontributionsfromthe company, in an amount or amounts which, in the aggregate in such fiscal year,exceededthegreaterof$200,000or2percentoftherecipient’sconsolidatedgrossrevenuesforthat year(forpurposesofthisstandard,“payments”excludespaymentsarisingsolelyfrominvestmentsinthecompany’ssecuritiesandpaymentsundernon-discretionarycharitablecontributionmatchingprograms);or
T E X A S I N S T R U M E N T S 2 0 1 3 P R O X Y S TAT E M E N T • 6 1
PR
OX
Y
ST
AT
EM
EN
T
4.Withinthecurrentorprecedingthreefiscalyearsa family memberofthedirectorwas,andremainsatthetimeofthedetermination, a partner in or a controlling shareholder or an executive officer of an organization that in the current year or any of the past three fiscal years (a) made payments to, or received payments from, the companyforpropertyorservices,(b)extendedloans to or received loans from the company,or(c)receivedcharitablecontributionsfromthe company, in an amount or amounts which, in the aggregate in such fiscalyear,exceededthegreaterof$200,000or2percentoftherecipient’sconsolidatedgrossrevenues for that year (for purposes of this standard, “payments” excludes payments arising solely from investments in the company’ssecuritiesandpaymentsundernon-discretionarycharitablecontributionmatchingprograms).
B.Innoeventwilladirectorbeconsideredindependentif,withintheprecedingthreeyears: 1.Heorshewasemployedbythecompany(exceptinthecapacityofinterimchairmanoftheboard,chiefexecutiveofficerorother
executive officer, provided the interim employment did not last longer than one year); 2.Heorshereceivedmorethan$120,000duringanytwelve-monthperiodincompensationfromthe company (other than (a)
compensationforboardorboardcommitteeservice,(b)compensationreceivedforformerservicelasting no longer than one year as aninterimchairmanoftheboard,chiefexecutiveofficerorotherexecutiveofficerand(c)benefitsunderatax-qualifiedretirementplan,ornon-discretionarycompensation);
3.Afamilymemberofthedirectorwasemployedasanexecutiveofficerbythecompany; 4.Afamilymemberofthedirectorreceivedmorethan$120,000duringanytwelve-monthperiodincompensationfromthe company
(excludingcompensationasanon-executiveofficeremployeeofthecompany); 5.Heorshewas(butisnolonger)apartneroremployeeofthecompany’sindependentauditorsandworkedonthecompany’saudit
withinthattime; 6.Afamilymemberofthedirectorwas(butisnolonger)apartneroremployeeofthecompany’sindependentauditorsandworked
onthecompany’sauditwithinthattime; 7.Heorshewasanexecutiveofficerofanotherentity at which any of the company’scurrent executive officers at any time during the
past three years served on that entity’scompensationcommittee;or 8.Afamilymemberofthedirectorwasanexecutiveofficerofanotherentity at which any of the company’scurrent executive officers
at any time during the past three years served on that entity’s compensation committee.C. NomemberoftheAudit Committee or Compensation Committee may accept directly or indirectly any consulting, advisory or
other compensatory fee from the company, other than in his or her capacity as a memberoftheboardoranyboardcommittee.Compensatory fees do not include the receipt of fixed amounts of compensation under a retirement plan (including deferred compensation) for prior service with the company (provided that such compensation is not contingent in any way on continued service). In addition, nomemberoftheAuditCommitteemaybean affiliated person of the company except in his or her capacity as a director.
D.IndeterminingwhetheradirectoriseligibletoserveontheCompensationCommittee,theboardalsowillconsiderwhetherthedirectorisaffiliatedwithTI,asubsidiaryofTIoranaffiliateofasubsidiaryofTItodeterminewhethersuchaffiliationwouldimpairthedirector’sjudgmentasamemberofthecommittee.
E.Foranyotherrelationship,thedeterminationofwhetheritwouldinterferewiththedirector’sexerciseofindependentjudgmentincarryingouthisorherresponsibilities,andconsequentlywhetherthedirectorinvolvedisindependent,willbemadebydirectorswhosatisfy the independence criteria set forth in this section.
Forpurposesoftheseindependencedeterminations,“company” and “familymember”willhavethesamemeaningasunderNASDAQrules.
Board organization
Board and committee meetings
During2012,theboardheldtenmeetings.Theboardhasthreestandingcommitteesdescribedbelow.Thecommitteesoftheboardcollectivelyheld19meetingsin2012.Eachdirectorattendedatleast94percentofboardandrelevantcommitteemeetingscombined.Overallattendanceatboardandcommitteemeetingswasapproximately99percent.
Committees of the board
Audit CommitteeTheAuditCommitteeisaseparatelydesignatedstandingcommitteeestablishedinaccordancewithSection3(a)(58)(A)oftheSecuritiesExchangeActof1934,asamended.AllmembersoftheAuditCommitteeareindependentunderNASDAQrulesandtheboard’scorporategovernance guidelines.SinceApril2011,thecommitteemembershavebeenMs.Patsley(Chair),Mr.BabbandMr.Sanchez.TheAuditCommitteeisgenerallyresponsiblefor:
• Appointing,compensating,retainingandoverseeingTI’sindependentregisteredpublicaccountingfirm.• ReviewingtheannualreportofTI’sindependentregisteredpublicaccountingfirmrelatedtoqualitycontrol.• ReviewingTI’sannualreportstotheSEC,includingthefinancialstatementsandthe“Management’sDiscussionandAnalysis”
portionofthosereports,andrecommendingappropriateactiontotheboard.• ReviewingTI’sauditplans.• ReviewingbeforeissuanceTI’snewsreleasesregardingannualandinterimfinancialresultsanddiscussingwithmanagement

T E X A S I N S T R U M E N T S62 • 2 0 1 3 P R O X Y S TAT E M E N T
PR
OX
Y
ST
AT
EM
EN
T
anyrelatedearningsguidancethatmaybeprovidedtoanalystsandratingagencies.• DiscussingTI’sauditedfinancialstatementswithmanagementandtheindependentregisteredpublicaccountingfirm,including
adiscussionwiththefirmregardingthemattersrequiredtobereviewedunderapplicablelegalorregulatoryrequirements.• ReviewingrelationshipsbetweentheindependentregisteredpublicaccountingfirmandTI.• ReviewinganddiscussingtheadequacyofTI’sinternalaccountingcontrolsandotherfactorsaffectingtheintegrityofTI’s
financialreportswithmanagementandwiththeindependentregisteredpublicaccountingfirm.• CreatingandperiodicallyreviewingTI’swhistleblowerpolicy.• ReviewingTI’sriskassessmentandriskmanagementpolicies.• ReviewingTI’scomplianceandethicsprogram.• ReviewingareportofcomplianceofmanagementandoperatingpersonnelwithTI’scodeofbusinessconduct,includingTI’s
conflict of interest policy. • ReviewingTI’snon-employee-relatedinsuranceprograms.• Reviewingchanges,ifany,inmajoraccountingpoliciesofthecompany.• Reviewingtrendsinaccountingpolicychangesthatarerelevanttothecompany.• Reviewingthecompany’spolicyregardinginvestmentsandfinancialderivativeproducts.TheboardhasdeterminedthatallmembersoftheAuditCommitteearefinanciallysophisticated,astheboardhasinterpretedsuch
qualificationsinitsbusinessjudgment.Inaddition,theboardhasdesignatedMs.PatsleyastheauditcommitteefinancialexpertasdefinedintheSecuritiesExchangeActof1934,asamended.
The Audit Committee met six times in 2012. The Audit Committee holds regularly scheduled meetings and reports its activities to theboard.Thecommitteealsocontinueditslong-standingpracticeofmeetingdirectlywithourinternalauditstafftodiscusstheauditplanandtoallowfordirectinteractionbetweenAuditCommitteemembersandourinternalauditors.Pleaseseepage93 for a report of the committee.
Compensation CommitteeAllmembersoftheCompensationCommitteeareindependent.FromApril2011toFebruary17,2012,thecommitteememberswereMs.Cox(Chair),StephenP.MacMillan(an independent director whoresignedfromtheboardinFebruary2012)andMs.Simmons.FromFebruary17,2012,toApril20,2012,thecommitteememberswereMs.Cox(Chair)andMs.Simmons.SinceApril20,2012,thecommitteemembershavebeenMs.Cox(Chair),Mr.SandersandMs.Simmons.Thecommitteeisresponsiblefor:
• ReviewingtheperformanceoftheCEOanddetermininghiscompensation.• Settingthecompensationofthecompany’sotherexecutiveofficers.• Overseeingadministrationofemployeebenefitplans.• Makingrecommendationstotheboardregarding:
○ Institutionandterminationof,revisionsinandactionsunderemployeebenefitplansthat(i)increasebenefitsonlyforofficersofthecompanyordisproportionatelyincreasebenefitsforofficersofthecompanymorethanotheremployeesofthecompany,(ii)requireorpermittheissuanceofthecompany’sstockor(iii)theboardmustapprove.
○ Reservationofcompanystockforuseasawardsofgrantsunderplansorascontributionsorsalestoanytrusteeofanyemployeebenefitplan.
• Takingactionasappropriateregardingtheinstitutionandterminationof,revisionsinandactionsunderemployeebenefitplansthatarenotrequiredtobeapprovedbytheboard.
TheCompensationCommitteeholdsregularlyscheduledmeetings,reportsitsactivitiestotheboard,andconsultswiththeboardbeforesettingannualexecutivecompensation.During2012,thecommitteemetseventimes.Pleaseseepage80 for a report of the committee.
Inperformingitsfunctions,thecommitteeissupportedbythecompany’sHumanResourcesorganization.Thecommitteehastheauthoritytoretainanyadvisorsitdeemsappropriatetocarryoutitsresponsibilities.ThecommitteeretainedPearlMeyer&Partnersasits compensation consultant for the 2012 compensation cycle. The committee instructed the consultant to advise it directly on executive compensationphilosophy,strategies,paylevels,decision-makingprocessesandothermatterswithinthescopeofthecommittee’scharter.Additionally,thecommitteeinstructedtheconsultanttoassistthecompany’sHumanResourcesorganizationinitssupportof the committee in these matters with such items as peer-group assessment, analysis of the executive compensation market, and compensation recommendations.
TheCompensationCommitteeconsidersitimportantthatitscompensationconsultant’sobjectivitynotbecompromisedbyotherbusinessengagementswiththecompanyoritsmanagement.Insupportofthisbelief,thecommitteehasapolicyoncompensationconsultants,acopyofwhichmaybefoundonwww.ti.com/corporategovernance.During2012,neithertheconsultantnoranyofitsaffiliatesperformedservicesforTIotherthanpursuanttotheengagementbythecommittee.Further,thecommitteedeterminedthattheconsultant had no conflict of interest.
The Compensation Committee considers executive compensation in a multistep process that involves the review of market information,performancedataandpossiblecompensationlevelsoverseveralmeetingsleadingtotheannualdeterminationsinJanuary.Beforesettingexecutivecompensation,thecommitteereviewsthetotalcompensationandbenefitsoftheexecutiveofficersandconsiderstheimpactthattheirretirement,orterminationundervariousotherscenarios,wouldhaveontheircompensationandbenefits.

T E X A S I N S T R U M E N T S 2 0 1 3 P R O X Y S TAT E M E N T • 6 3
PR
OX
Y
ST
AT
EM
EN
T
TheCEOandtheseniorvicepresidentresponsibleforHumanResources,whoisanexecutiveofficer,areregularlyinvitedtoattendmeetingsofthecommittee.TheCEOisexcusedfromthemeetingduringanydeliberationsorvoteonhiscompensation.Noexecutiveofficerdetermineshisorherowncompensationorthecompensationofanyotherexecutiveofficer.Asmembersoftheboard,themembersofthecommitteereceiveinformationconcerningtheperformanceofthecompanyduringtheyearandinteractwithourmanagement.Duringthecommittee’sdeliberationsonexecutivecompensation,theCEOgivesthecommitteeandtheboardanassessmentofhisownperformanceduringtheyearjustended.Healsoreviewstheperformanceoftheotherexecutiveofficerswiththecommitteeandmakesrecommendationsregardingtheircompensation.TheseniorvicepresidentresponsibleforHumanResourcesassists in the preparation of and reviews the compensation recommendations made to the committee other than for her compensation.
TheCompensationCommittee’scharterprovidesthatitmaydelegateitspower,authorityandrightswithrespecttoTI’slong-termincentiveplans,employeestockpurchaseplanandemployeebenefitplansto(i)oneormorecommitteesoftheboardestablishedordelegatedauthorityforthatpurpose;or(ii)employeesorcommitteesofemployeesexceptthatnosuchdelegationmaybemadewithrespecttocompensationofthecompany’sexecutiveofficers.
Pursuanttothatauthority,theCompensationCommitteehasdelegatedtoaspecialcommitteeestablishedbytheboardtheauthoritytograntalimitednumberofstockoptionsandrestrictedstockunitsunderthecompany’slong-termincentiveplans.ThesolememberofthespecialcommitteeisMr.Templeton.Thespecialcommitteehasnoauthoritytogrant,amendorterminateanyformofcompensationtoTI’sexecutiveofficers.TheCompensationCommitteereviewsthegrantactivityofthespecialcommittee.
Governance and Stockholder Relations CommitteeAllmembersoftheG&SRCommitteeareindependent.FromJanuary1toApril20,2012,thecommitteememberswereMs.Whitman(Chair), Mr. Carp and Mr. Sanders. Since April 2012,thecommitteemembershavebeenMs.Whitman(Chair)andMr.Carp.TheG&SRCommitteeisgenerallyresponsiblefor:
• Makingrecommendationstotheboardregarding:○ The development and revision of our corporate governance principles. ○ Thesize,compositionandfunctioningoftheboardandboardcommittees.○ Candidatestofillboardpositions.○ Nomineestobedesignatedforelectionasdirectors.○ Compensationofboardmembers.○ Organizationandresponsibilitiesofboardcommittees.○ Successionplanningbythecompany.○ IssuesofpotentialconflictsofinterestinvolvingaboardmemberraisedunderTI’sconflictofinterestpolicy.○ Electionofexecutiveofficersofthecompany.○ Topicsaffectingtherelationshipbetweenthecompanyandstockholders.○ Publicissueslikelytoaffectthecompany.○ Responsestoproposalssubmittedbystockholders.
• Reviewing:○ ContributionpoliciesofthecompanyandoftheTIFoundation.○ RevisionstoTI’scodeofethics.
• Electingofficersofthecompanyotherthantheexecutiveofficers.• Overseeinganannualevaluationoftheboardandthecommittee.TheG&SRCommitteemetsixtimesin2012.TheG&SRCommitteeholdsregularlyscheduledmeetingsandreportsitsactivitiestothe
board.Pleaseseepage58 for a discussion of stockholder nominations and page 60foradiscussionofcommunicationswiththeboard.
Board leadership structure
Theboard’scurrentleadershipstructurecombinesthepositionsofchairmanandCEO,andincludesaleaddirectorwhopresidesatexecutivesessionsandperformsthedutieslistedbelow.Theboardbelievesthatthisstructure,combinedwithitsotherpractices(suchas(a)includingoneachboardagendaanopportunityfortheindependentdirectorstocommentonandinfluencetheproposedstrategicagendaforfuturemeetingsand(b)holdinganexecutivesessionateachboardmeeting),allowsittomaintaintheactiveengagementofindependent directors and appropriate oversight of management.
TheindependentdirectorshaveelectedMs.PatsleytoserveasleaddirectorthroughApril2013.Thereafter,theleaddirectorwillbeelectedbytheindependentdirectorsannually.Thedutiesoftheleaddirectorareto:
• Presideatallmeetingsoftheboardatwhichthechairmanisnotpresent,includingexecutivesessionsoftheindependentdirectors;
• Serveasliaisonbetweenthechairmanandtheindependentdirectors;• Approveinformationsenttotheboard;• Approvemeetingagendasfortheboard;• Approvemeetingschedulestoassurethatthereissufficienttimefordiscussionofallagendaitems;and• Ifrequestedbymajorshareholders,ensurethatheorsheisavailableforconsultationanddirectcommunication.

T E X A S I N S T R U M E N T S64 • 2 0 1 3 P R O X Y S TAT E M E N T
PR
OX
Y
ST
AT
EM
EN
T
In addition, the lead director has authority to call meetings of the independent directors.Theboard,ledbyitsG&SRCommittee,regularlyreviewstheboard’sleadershipstructure.Theboard’sconsiderationisguidedby
twoquestions:wouldstockholdersbebetterservedandwouldtheboardbemoreeffectivewithadifferentstructure.Theboard’sviewsareinformedbyareviewofthepracticesofothercompaniesandinsightintothepreferencesoftopstockholders,asgatheredfromface-to-facedialogueandreviewofpublishedguidelines.Theboardalsoconsidershowboardrolesandinteractionswouldchangeifitsleadershipstructurechanged.Theboard’sgoalisforeachdirectortohaveanequalstakeintheboard’sactionsandequalaccountabilityto the corporation and its stockholders.
Theboardcontinuestobelievethatthereisnouniformsolutionforaboardleadershipstructure.Indeed,thecompanyhashadvaryingboardleadershipmodelsoveritshistory,attimesseparatingthepositionsofchairmanandCEOandattimescombiningthetwo,and now utilizing a lead director.
Risk oversight by the board
Itismanagement’sresponsibilitytoassessandmanagethevariousrisksTIfaces.Itistheboard’sresponsibilitytooverseemanagementinthiseffort.Inexercisingitsoversight,theboardhasallocatedsomeareasoffocustoitscommitteesandhasretainedareasoffocusforitself,asmorefullydescribedbelow.
Management generally views the risks TI faces as falling into the following categories: strategic, operational, financial and compliance.Theboardasawholehasoversightresponsibilityforthecompany’sstrategicandoperationalrisks(e.g.,majorinitiatives,competitivemarketsandproducts,salesandmarketing,andresearchanddevelopment).ThroughouttheyeartheCEOdiscussestheseriskswiththeboardduringstrategyreviewsthatfocusonaparticularbusinessorfunction.Inaddition,attheendoftheyear,theCEOprovides a formal report on the top strategic and operational risks.
TI’sAuditCommitteehasoversightresponsibilityforfinancialrisk(suchasaccounting,finance,internalcontrolsandtaxstrategy).Oversightresponsibilityforcomplianceriskissharedbytheboardcommittees.Forexample,theAuditCommitteeoverseescompliancewiththecompany’scodeofconductandfinance-andaccounting-relatedlawsandpolicies,aswellasthecompany’scomplianceprogramitself;theCompensationCommitteeoverseescompliancewiththecompany’sexecutivecompensationplansandrelatedlawsandpolicies;andtheG&SRCommitteeoverseescompliancewithgovernance-relatedlawsandpolicies,includingthecompany’scorporate governance guidelines.
TheAuditCommitteeoverseesthecompany’sapproachtoriskmanagementasawhole.Itreviewsthecompany’sriskmanagementprocessatleastannuallybymeansofapresentationbytheCFO.
Theboard’sleadershipstructureisconsistentwiththeboardandcommittees’rolesinriskoversight.Asdiscussedabove,theboardhas found that its current structure and practices are effective in fully engaging the independent directors. Allocating various aspects of riskoversightamongthecommitteesprovidesforsimilarengagement.HavingthechairmanandCEOreviewstrategicandoperationalriskswiththeboardensuresthatthedirectormostknowledgeableaboutthecompany,theindustryinwhichitoperatesandthecompetitionandotherchallengesitfacessharesthoseinsightswiththeboard,providingforathoroughandefficientprocess.
Director compensation
TheG&SRCommitteehasresponsibilityforreviewingandmakingrecommendationstotheboardoncompensationfornon-employeedirectors,withtheboardmakingthefinaldetermination.Thecommitteehasnoauthoritytodelegateitsresponsibilityregardingdirectorcompensation.Incarryingoutthisresponsibility,itissupportedbyTI’sHumanResourcesorganization.TheCEO,theseniorvicepresidentresponsibleforHumanResourcesandtheSecretaryreviewtherecommendationsmadetothecommittee.TheCEOalsovotes,asamemberoftheboard,onthecompensationofnon-employeedirectors.
The compensation arrangements in 2012 for the non-employee directors were:• Annualretainerof$80,000forboardandcommitteeservice.• Additionalannualretainerof$30,000forserviceaschairoftheAuditCommittee;$20,000forserviceaschairofthe
CompensationCommittee;and$15,000forserviceaschairoftheG&SRCommittee.• Additionalannualretainerof$25,000forserviceastheleaddirector.• Annualgrantofa10-yearoptiontopurchaseTIcommonstockpursuanttothetermsoftheTexasInstruments2009Director
CompensationPlan(DirectorPlan),whichwasapprovedbystockholdersinApril2009.Thegrantdatevalueis$100,000,determinedusingaBlack-Scholesoption-pricingmodel(subjecttotheboard’sabilitytoadjustthegrantdownward).Thesenon-qualified(NQ)optionsbecomeexercisableinfourequalannualinstallmentsbeginningonthefirstanniversaryofthegrantandalsowillbecomefullyexercisableintheeventofterminationofservicefollowingachangeincontrol(asdefinedintheDirectorPlan)ofTI.Ifadirector’sserviceterminatesduetodeath,disabilityorineligibilitytostandforre-electionunderthecompany’sby-laws,orafterthedirectorhascompletedeightyearsofservice,thenalloutstandingoptionsheldbythedirectorshallcontinuetofullterm.Ifadirector’sserviceterminatesforanyotherreason,alloutstandingoptionsheldbythedirectorshallbeexercisablefor30daysafterthedateoftermination,butonlytotheextentsuchoptionswereexercisableonthedateoftermination.

T E X A S I N S T R U M E N T S 2 0 1 3 P R O X Y S TAT E M E N T • 6 5
PR
OX
Y
ST
AT
EM
EN
T
• AnnualgrantofrestrictedstockunitspursuanttotheDirectorPlanwithagrantdatevalueof$100,000(subjecttotheboard’sabilitytoadjustthegrantdownward).TherestrictedstockunitsvestonthefourthanniversaryoftheirdateofgrantanduponachangeincontrolasdefinedintheDirectorPlan.Ifadirectorisnotamemberoftheboardonthefourthanniversaryofthegrant,restricted stock units will nonetheless settle (i.e., the shares will issue) on such anniversary date if the director has completed eightyearsofservicepriortoterminationorthedirector’sterminationwasduetodeath,disabilityorineligibilitytostandforre-electionunderthecompany’sby-laws.Thedirectormaydefersettlementoftherestrictedstockunitsathisorherelection.Upon settlement, the director will receive one share of TI common stock for each restricted stock unit. Dividend equivalents are paid on the restricted stock units at the same rate as dividends on TI common stock. The director may defer receipt of dividend equivalents.
• $1,000perdaycompensationforotheractivitiesdesignatedbythechairman.
Theboardhasdeterminedthatgrantsofequitycompensationtonon-employeedirectorswillbetimedtooccurwhengrantsaremadeto our U.S. employees in connection with the annual compensation review process. Accordingly, equity grants to non-employee directors aremadeinJanuary.Pleaseseethediscussionregardingthetimingofequitycompensationgrantsonpage77.
Directorsarenotpaidafeeformeetingattendance,butwereimbursenon-employeedirectorsfortheirtravel,lodgingandrelatedexpensesincurredinconnectionwithattendingboard,committeeandstockholdersmeetingsandotherdesignatedTIevents.Inaddition, non-employee directors may travel on company aircraft to and from these meetings and other designated events. On occasion, directors’spousesareinvitedtoattendboardevents;thespouses’expensesincurredinconnectionwithattendanceatthoseeventsarealsoreimbursed.
UndertheDirectorPlan,somedirectorshavechosentodeferallorpartoftheircashcompensationuntiltheyleavetheboard(orcertain other specified times). These deferred amounts were credited to either a cash account or stock unit account. Cash accounts earninterestfromTIataratecurrentlybasedonMoody’sSeasonedAaaCorporateBonds.For2012,thatratewas3.96percent.StockunitaccountsfluctuateinvaluewiththeunderlyingsharesofTIcommonstock,whichwillbeissuedafterthedeferralperiod.Dividendequivalents are paid on these stock units. Directors may also defer settlement of the restricted stock units they receive.
WehavearrangementswithcertaincustomerswherebyouremployeesmaypurchaseconsumerproductscontainingTIcomponentsatdiscountedpricing.Inaddition,theTIFoundationhasaneducationalandculturalmatchinggiftprogram.Inbothcases,directorsareentitledtoparticipateonthesametermsandconditionsavailabletoemployees.
Non-employeedirectorsarenoteligibletoparticipateinanyTI-sponsoredpensionplan.
2012 director compensation
Thefollowingtableshowsthecompensationofallpersonswhowerenon-employeemembersoftheboardduring2012forservicesinall capacities to TI in 2012.
Name (1)
Fees Earned orPaid in
Cash ($)(2)
Stock Awards($)(3)
Option Awards($)(4)
Non-Equity Incentive Plan Compensation
($)
Change in Pension
Value and Non-qualified
Deferred Compensation
Earnings
All OtherCompensation
($)(5) Total ($)
R.W.Babb,Jr. . . . . . . . . . . . . . . . $ 80,000 $ 99,992 $101,096 — — $ 20 $281,108D. A. Carp . . . . . . . . . . . . . . . . . $ 80,000 $ 99,992 $101,096 — — $ 655 $281,743C. S. Cox . . . . . . . . . . . . . . . . . . $100,000 $ 99,992 $101,096 — — $ 20 $301,108S.P.MacMillan . . . . . . . . . . . . . . . $ 6,667 — — — — $ 20 $ 6,687P.H.Patsley . . . . . . . . . . . . . . . . $135,000 $ 99,992 $101,096 — — $ 20 $336,108R.E.Sanchez . . . . . . . . . . . . . . . . $ 80,000 $ 99,992 $101,096 — — $10,020 $291,108W.R.Sanders . . . . . . . . . . . . . . . $ 80,000 $ 99,992 $101,096 — — $ 655 $281,743R. J. Simmons . . . . . . . . . . . . . . . $ 80,000 $ 99,992 $101,096 — — $ 20 $281,108C.T.Whitman . . . . . . . . . . . . . . . . $ 95,000 $ 99,992 $101,096 — — $26,880 $322,968
(1) Mr.MacMillanresignedeffectiveFebruary17,2012.Mr.BlinnwaselectedeffectiveFebruary21,2013,andaccordinglyreceivednocompensation for services as a TI director in 2012.
(2) Includesamountsdeferredatthedirector’selection.
(3) Shownistheaggregategrantdatefairvalueofawardsgrantedin2012calculatedinaccordancewithFinancialAccountingStandards Board Accounting Standards CodificationTM Topic 718, Compensation-Stock Compensation (ASC 718). The discussion of theassumptionsusedforpurposesofcalculatingthegrantdatefairvalueappearsinnote5ofExhibit13toTI’sannualreportonForm10-KfortheyearendedDecember31,2012.

T E X A S I N S T R U M E N T S66 • 2 0 1 3 P R O X Y S TAT E M E N T
PR
OX
Y
ST
AT
EM
EN
T
ThetablebelowshowstheaggregatenumberofsharesunderlyingoutstandingrestrictedstockunitsheldbythenamedindividualsasofDecember31,2012.
Name
Restricted Stock Units (in Shares)
R.W.Babb,Jr. . . . . . . . . . . . . . . . . . . . . . . . . . . . . . . . . . . . . . . . . . . . 7,977D. A. Carp . . . . . . . . . . . . . . . . . . . . . . . . . . . . . . . . . . . . . . . . . . . . . 24,641C. S. Cox . . . . . . . . . . . . . . . . . . . . . . . . . . . . . . . . . . . . . . . . . . . . . . 17,977S.P.MacMillan . . . . . . . . . . . . . . . . . . . . . . . . . . . . . . . . . . . . . . . . . . . —P.H.Patsley . . . . . . . . . . . . . . . . . . . . . . . . . . . . . . . . . . . . . . . . . . . . 12,977R.E.Sanchez . . . . . . . . . . . . . . . . . . . . . . . . . . . . . . . . . . . . . . . . . . . . 5,090W.R.Sanders . . . . . . . . . . . . . . . . . . . . . . . . . . . . . . . . . . . . . . . . . . . 20,577R. J. Simmons . . . . . . . . . . . . . . . . . . . . . . . . . . . . . . . . . . . . . . . . . . . 23,977C.T.Whitman . . . . . . . . . . . . . . . . . . . . . . . . . . . . . . . . . . . . . . . . . . . . 17,977
EachrestrictedstockunitrepresentstherighttoreceiveoneshareofTIcommonstock.Forrestrictedstockunitsgrantedpriorto2007,sharesareissuedatthetimeofmandatoryretirementfromtheboard(age70)orupontheearlierofterminationofservicefromtheboardaftercompletingeightyearsofserviceordeathordisability.Forinformationregardingshareissuancesunderrestricted stock units granted after 2006, please see the discussion on page 65.
(4) Shown is the aggregate grant date fair value of awards granted in 2012 calculated in accordance with ASC 718. The discussion of theassumptionsusedforpurposesofcalculatingthegrantdatefairvalueappearsinnote5ofExhibit13toTI’sannualreportonForm10-KfortheyearendedDecember31,2012.
ThetablebelowshowstheaggregatenumberofsharesunderlyingoutstandingstockoptionsheldbythenamedindividualsasofDecember31,2012.
NameOptions
(in Shares)
R.W.Babb,Jr. . . . . . . . . . . . . . . . . . . . . . . . . . . . . . . . . . . . . . . . . . . . 22,158D. A. Carp . . . . . . . . . . . . . . . . . . . . . . . . . . . . . . . . . . . . . . . . . . . . . . 95,158C. S. Cox . . . . . . . . . . . . . . . . . . . . . . . . . . . . . . . . . . . . . . . . . . . . . . 80,158S.P.MacMillan . . . . . . . . . . . . . . . . . . . . . . . . . . . . . . . . . . . . . . . . . . . —P.H.Patsley . . . . . . . . . . . . . . . . . . . . . . . . . . . . . . . . . . . . . . . . . . . . . 80,158R.E.Sanchez . . . . . . . . . . . . . . . . . . . . . . . . . . . . . . . . . . . . . . . . . . . . 12,156W.R.Sanders . . . . . . . . . . . . . . . . . . . . . . . . . . . . . . . . . . . . . . . . . . . 74,908R. J. Simmons . . . . . . . . . . . . . . . . . . . . . . . . . . . . . . . . . . . . . . . . . . . 95,158C.T.Whitman . . . . . . . . . . . . . . . . . . . . . . . . . . . . . . . . . . . . . . . . . . . . 95,158
The terms of these options are as set forth on page 64exceptthatforoptionsgrantedbeforeNovember2006,theexercisepriceis the average of the high and low price of TI commonstockonthedateofgrant,andforoptionsgrantedbefore2010,thegrantbecomesfullyexercisableuponachangeincontrolofTI.
(5) Consistsof(a)theannualcost($20perdirector)ofpremiumsfortravelandaccidentinsurancepolicies,(b)contributionsundertheTIFoundationmatchinggiftprogramof$10,000forMr.Sanchezand$5,000forMs.Whitman,(c)forMs.Whitman,reimbursementof$21,860fortaxexpensesresultingfromanerror(subsequentlycorrected)intheadministrationofarestrictedstockunitaward,and(d)forMessrs.CarpandSanders,third-partyadministrationfeesfortheDirectorAwardProgram.EachdirectorwhoseservicecommencedpriortoJune20,2002,iseligibletoparticipateintheDirectorAwardProgram,acharitabledonationprogramunderwhichwewillcontributeatotalof$500,000pereligibledirectortoasmanyasthreeeducationalinstitutionsrecommendedbythedirectorandapprovedbyus.Thecontributionsaremadefollowingthedirector’sdeath.Directorsreceivenofinancialbenefitfromtheprogram,andallcharitabledeductionsbelongtothecompany.InaccordancewithSECrules,wehaveincludedthecompany’sannualcostsundertheprograminAllOtherCompensationofthedirectorswhoparticipate.ThecostattributabletoeachofMessrs.Carp and Sanders for their participation in this program was $635.
T E X A S I N S T R U M E N T S 2 0 1 3 P R O X Y S TAT E M E N T • 6 7
PR
OX
Y
ST
AT
EM
EN
T
Executive compensation
WeareprovidingthefollowingadvisoryvoteonnamedexecutiveofficercompensationasrequiredbySection14AoftheSecuritiesExchangeAct.
AtTI’s2011annualmeeting,anon-bindingadvisoryvotewastakenonthefrequencyoffutureadvisoryvotesregardingnamedexecutive officer compensation. A majority of the shares cast on the matter were in favor of holding such an advisory vote on an annual basis.Asaresult,TI’sboardofdirectorsdecidedtoholdfutureadvisoryvotesonnamedexecutivecompensationonanannualbasis.
Proposal regarding advisory approval of the company’s executive compensation
Theboardaskstheshareholderstocastanadvisoryvoteonthecompensationofournamedexecutiveofficers.The“namedexecutiveofficers” are the five executive officers, consisting of the chief executive officer, chief financial officer and three other most highly compensatedexecutiveofficers,namedinthecompensationtablesonpages80-92.
Specifically, we ask the shareholders to approve the following resolution:RESOLVED,thatthecompensationpaidtothecompany’snamedexecutiveofficers,asdisclosedinthisproxystatementpursuanttotheSecuritiesandExchangeCommission’scompensationdisclosurerules,includingtheCompensationDiscussionandAnalysis,compensationtablesandnarrativediscussiononpages68-92ofthisproxystatement,isherebyapproved.
WeencourageshareholderstoreviewtheCompensationDiscussionandAnalysissectionoftheproxystatement,whichfollows.Itdiscusses our executive compensation policies and programs and explains the compensation decisions relating to the named executive officersfor2012.Webelievethatthepoliciesandprogramsservetheinterestsofourshareholdersandthatthecompensationreceivedbythenamedexecutiveofficersiscommensuratewiththeperformanceandstrategicpositionofthecompany.
Althoughtheoutcomeofthisvoteisnotbindingonthecompanyortheboard,theCompensationCommitteeoftheboardwillconsider it when setting future compensation for the executive officers.
The board of directors recommends a vote FOR the resolution approving the named executive officer compensation for 2012, as disclosed in this proxy statement.

T E X A S I N S T R U M E N T S68 • 2 0 1 3 P R O X Y S TAT E M E N T
PR
OX
Y
ST
AT
EM
EN
T
Compensation discussion and analysis
ThissectiondescribesTI’scompensationprogramforexecutiveofficers.Itwillprovideinsightintothefollowing:• Theelementsofthe2012compensationprogram,whyweselectedthemandhowtheyrelatetooneanother;and• Howwedeterminedtheamountofcompensationfor2012.Currently,TIhas15executiveofficers.Theseexecutiveshavethebroadestjobresponsibilitiesandpolicy-makingauthorityin
thecompany.Weholdthemaccountableforthecompany’sperformanceandformaintainingacultureofstrongethics.DetailsofcompensationforourCEO,CFOandthethreeotherhighestpaidindividualswhowereexecutiveofficersin2012(collectivelycalledthe“namedexecutiveofficers”)canbefoundinthetablesbeginningonpage80.
Executive summary
• TI’s compensation program is structured to pay for performance and deliver rewards that encourage executives to think and act in both the short- and long-term interests of our shareholders. The majority of total compensation for our executives each year comes in the form of variable cash and equity compensation. Variable cash is tied to the short-term performance of the company, and the value of equity is tied to the long-term performance of the company. We believe our compensation program holds our executive officers accountable for the financial and competitive performance of TI.
• 2012 compensation decisions for the CEO:○ Basesalarywasincreasedby5percentover2011tomaintainitatalevelbelowtheestimatedmedianoftheCEOsinour
paycomparatorgroup.In2011,basesalarywasunchangedfromtheprioryear.○ Thegrantdatefairvalueofequitycompensationawardedin2012was8percentlowerthanin2011.Thenumberofshares
was 6 percent higher than in 2011.○ Thebonusdecisionwasbasedprimarilyonthefollowingperformanceresultsin2012:
2012AbsolutePerformance 2012RelativePerformance**
Revenue Growth: Total TI RevenueGrowthwithoutbaseband*
-6.6%-0.8%
Below MedianAboveMedian
ProfitfromOperationsasa%ofRevenue(PFO%) 15.4% AboveMedian
Total Shareholder Return (TSR) 8.7% AboveMedian
Year-on-YearChangeinCEOBonus (2012bonuscomparedto2011)
0% change
* RevenuegrowthfortotalTI,excludingdigitalbaseband,aproductlineforwhichTIhasapubliclystatedexitplan.Seenote3on page 74.
** Relativetosemiconductorcompetitorsasoutlinedonpage73.Includesestimatesandprojectionsofcertaincompetitors’financial results.
• Our executive compensation program is designed to encourage executive officers to pursue strategies that serve the interests of thecompanyandshareholders,andnottopromoteexcessiverisk-takingbyourexecutives.Itisbuiltonafoundationofsoundcorporate governance and includes:○ Executiveofficersdonothaveemploymentcontractsandarenotguaranteedsalaryincreasesorbonusamounts.○ Wehaveneverrepricedstockoptions.Wedonotgrantreloadoptions.Wegrantequitycompensationwithdouble-trigger
change-in-controlterms,whichacceleratethevestingofgrantsonlyifthegranteehasbeenterminatedinvoluntarilywithina limited time after a change in control of the company.
○ Bonusandequitycompensationawardsaresubjecttoclawbackunderthecommittee’spolicydescribedonpage77.○ Wedonotprovideexcessiveperquisites.Weprovidenotaxgross-upsforperquisites.○ Wedonotguaranteeareturnorprovideabove-marketreturnsoncompensationthathasbeendeferred.○ Pensionbenefitsarecalculatedonsalaryandbonusonly;theproceedsearnedonequityorotherperformanceawardsare
not part of the pension calculation.
T E X A S I N S T R U M E N T S 2 0 1 3 P R O X Y S TAT E M E N T • 6 9
PR
OX
Y
ST
AT
EM
EN
T
Thecommittee’sstrategyforsettingcashandnon-cashcompensationisdescribedinthetablethatfollowsimmediatelybelow.Itscompensation decisions for the named executive officers for 2012 are discussed on pages 70-77. Benefit programs in which the executive officers participate are discussed on pages 78-79.Perquisitesarediscussedonpage79.
Detailed Discussion
Compensation philosophy and elementsTheCompensationCommitteeofTI’sboardofdirectorsisresponsibleforsettingthecompensationofallTIexecutiveofficers.Thecommitteeconsultswiththeotherindependentdirectorsanditscompensationconsultant,PearlMeyer&Partners,beforesettingannualcompensationfortheexecutives.Thecommitteechairregularlyreportsoncommitteeactionsatboardmeetings.
The primary elements of our executive compensation program are as follows:
Near-term compensation, paid in cash
Element Purpose Strategy Terms
Base salary Basic,leastvariableformof compensation
Paybelowmarketmedianinorderto weight total compensation to the performance-basedelementsdescribedbelowinthischart.
Paidtwicemonthly
Profitsharing Broad-basedprogramdesignedto emphasize that each employee contributestothecompany’sprofitabilityandcanshareinit
Payaccordingtoaformulathatfocusesemployees on a company goal, and at a levelthatwillaffectbehavior.Profitsharingis paid in addition to any performance bonusawardedfortheyear.
Forthelasteightyears,theformulahasbeenbasedoncompany-levelannualoperating profit margin. The formula was setbytheTIboard.Thecommittee’spracticehasbeennottoadjustamountsearned under the formula.
Payableinasinglecashpaymentshortly after the end of the performance year
As in recent years, the formula for 2012 was:• Below10%company-level
annual operating profit as a percentage of revenue (“Margin”): no profit sharing
• At10%Margin:profitsharing=2%ofbasesalary
• AtMarginabove10%:profitsharingincreasesby0.5%ofbasesalaryforeachpercentage point of Margin between10%and24%,and1%ofbasesalaryforeachpercentage point of Margin above24%.Themaximumprofit sharing is 20% of basesalary.
In 2012, TI delivered Margin of 15.4%.Asaresult,alleligibleemployees, including executive officers, received profit sharing of 4.7%ofbasesalary.

T E X A S I N S T R U M E N T S70 • 2 0 1 3 P R O X Y S TAT E M E N T
PR
OX
Y
ST
AT
EM
EN
T
Element Purpose Strategy Terms
Performancebonus
To motivate executives and reward them according to the company’srelativeandabsoluteperformanceandtheexecutive’sindividual performance
Determinedprimarilyonthebasisofone-year and three-year company performance on certain measures (revenue growth percent, operating margin and total shareholder return1) as compared to competitors and on our strategic progress in key markets and withcustomers.Thesefactorshavebeenchosen to reflect our near-term financial performance as well as our progress in buildinglong-termshareholdervalue.
The committee aims to pay total cashcompensation(basesalary,profitsharingandbonus)appropriatelyabovemedian if company performance is abovethatofcompetitors,andpaytotalcashcompensationappropriatelybelowthe median if company performance is belowcompetitors.
The committee does not rely on formulas or performance targets or thresholds. Instead it uses its judgment basedonitsassessmentofthefactorsdescribedabove.
Determinedbythecommitteeand paid in a single payment after the performance year
Long-term compensation, awarded in equity
Stock options and restricted stock units
Alignmentwithshareholders;long-termfocus;retention,particularlywith respect to restricted stock units
Wegrantacombinationofnonqualified(NQ) stock options and restricted stock units, generally targeted at the median level of equity compensation awarded to executives in similar positions at the Comparator Group.
The terms and conditions of stock options and restricted stock units are summarized on page 85.Thecommittee’sgrantproceduresaredescribedon page 77.
Comparator groupTheCompensationCommitteeconsidersthemarketlevelofcompensationwhensettingthesalary,bonusesandequitycompensationoftheexecutiveofficers.Thecommitteetargetssalarybelowmarketmedianinordertoweighttotalcompensationtoperformance-basedelements.Toestimatethemarketlevelofpay,thecommitteeusesinformationprovidedbyitscompensationconsultantandTI’sCompensationandBenefitsorganizationaboutcompensationpaidtoexecutivesinsimilarpositionsatapeergroupofcompanies(the“Comparator Group”).
ThecommitteesetstheComparatorGroup.Ingeneral,theComparatorGroupcompanies(1)areU.S.-based,(2)engageinthesemiconductorbusinessorotherelectronicsorinformationtechnologyactivities,(3)haveexecutivepositionscomparableincomplexitytothoseofTIand(4)useformsofexecutivecompensationcomparabletoTI’s.
1 Totalshareholderreturnreferstothepercentagechangeinthevalueofastockholder’sinvestmentinacompanyovertherelevanttimeperiod,asdeterminedbydividendspaidandthechangeinthecompany’ssharepriceduringtheperiod.Seepage74.
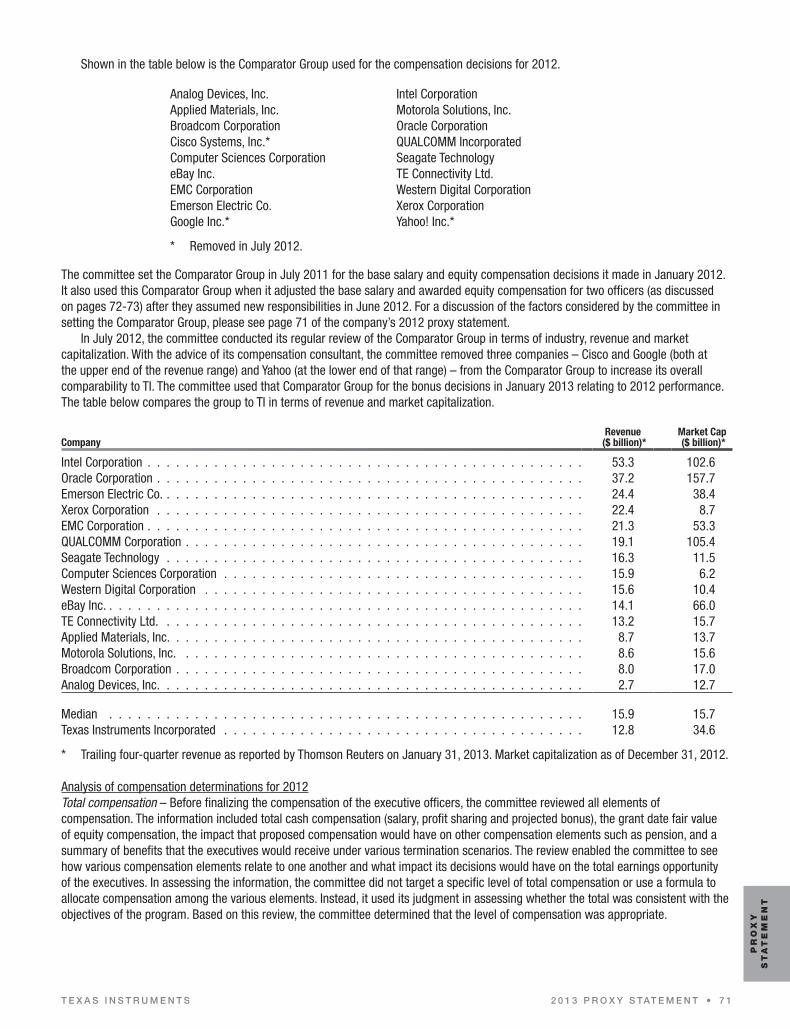
T E X A S I N S T R U M E N T S 2 0 1 3 P R O X Y S TAT E M E N T • 7 1
PR
OX
Y
ST
AT
EM
EN
T
ShowninthetablebelowistheComparatorGroupusedforthecompensationdecisionsfor2012.
Analog Devices, Inc.Applied Materials, Inc.Broadcom CorporationCiscoSystems,Inc.*Computer Sciences CorporationeBay Inc.EMCCorporationEmersonElectricCo.GoogleInc.*
Intel CorporationMotorola Solutions, Inc.Oracle CorporationQUALCOMMIncorporatedSeagate TechnologyTEConnectivityLtd.WesternDigitalCorporationXeroxCorporationYahoo!Inc.*
* RemovedinJuly2012.
ThecommitteesettheComparatorGroupinJuly2011forthebasesalaryandequitycompensationdecisionsitmadeinJanuary2012.ItalsousedthisComparatorGroupwhenitadjustedthebasesalaryandawardedequitycompensationfortwoofficers(asdiscussedon pages 72-73)aftertheyassumednewresponsibilitiesinJune2012.ForadiscussionofthefactorsconsideredbythecommitteeinsettingtheComparatorGroup,pleaseseepage71ofthecompany’s2012proxystatement.
In July 2012, the committee conducted its regular review of the Comparator Group in terms of industry, revenue and market capitalization.Withtheadviceofitscompensationconsultant,thecommitteeremovedthreecompanies–CiscoandGoogle(bothattheupperendoftherevenuerange)andYahoo(atthelowerendofthatrange)–fromtheComparatorGrouptoincreaseitsoverallcomparabilitytoTI.ThecommitteeusedthatComparatorGroupforthebonusdecisionsinJanuary2013relatingto2012performance.ThetablebelowcomparesthegrouptoTIintermsofrevenueandmarketcapitalization.
CompanyRevenue
($ billion)*Market Cap ($ billion)*
Intel Corporation . . . . . . . . . . . . . . . . . . . . . . . . . . . . . . . . . . . . . . . . . . . . . . 53.3 102.6Oracle Corporation . . . . . . . . . . . . . . . . . . . . . . . . . . . . . . . . . . . . . . . . . . . . . 37.2 157.7EmersonElectricCo. . . . . . . . . . . . . . . . . . . . . . . . . . . . . . . . . . . . . . . . . . . . . 24.4 38.4XeroxCorporation . . . . . . . . . . . . . . . . . . . . . . . . . . . . . . . . . . . . . . . . . . . . . 22.4 8.7EMCCorporation . . . . . . . . . . . . . . . . . . . . . . . . . . . . . . . . . . . . . . . . . . . . . . 21.3 53.3QUALCOMMCorporation . . . . . . . . . . . . . . . . . . . . . . . . . . . . . . . . . . . . . . . . . . 19.1 105.4Seagate Technology . . . . . . . . . . . . . . . . . . . . . . . . . . . . . . . . . . . . . . . . . . . . 16.3 11.5Computer Sciences Corporation . . . . . . . . . . . . . . . . . . . . . . . . . . . . . . . . . . . . . . 15.9 6.2WesternDigitalCorporation . . . . . . . . . . . . . . . . . . . . . . . . . . . . . . . . . . . . . . . . 15.6 10.4eBay Inc. . . . . . . . . . . . . . . . . . . . . . . . . . . . . . . . . . . . . . . . . . . . . . . . . . . 14.1 66.0TEConnectivityLtd. . . . . . . . . . . . . . . . . . . . . . . . . . . . . . . . . . . . . . . . . . . . . 13.2 15.7Applied Materials, Inc. . . . . . . . . . . . . . . . . . . . . . . . . . . . . . . . . . . . . . . . . . . . 8.7 13.7Motorola Solutions, Inc. . . . . . . . . . . . . . . . . . . . . . . . . . . . . . . . . . . . . . . . . . . 8.6 15.6Broadcom Corporation . . . . . . . . . . . . . . . . . . . . . . . . . . . . . . . . . . . . . . . . . . . 8.0 17.0Analog Devices, Inc. . . . . . . . . . . . . . . . . . . . . . . . . . . . . . . . . . . . . . . . . . . . . 2.7 12.7
Median . . . . . . . . . . . . . . . . . . . . . . . . . . . . . . . . . . . . . . . . . . . . . . . . . . 15.9 15.7Texas Instruments Incorporated . . . . . . . . . . . . . . . . . . . . . . . . . . . . . . . . . . . . . . 12.8 34.6
* Trailingfour-quarterrevenueasreportedbyThomsonReutersonJanuary31,2013.MarketcapitalizationasofDecember31,2012.
Analysis of compensation determinations for 2012Total compensation–Beforefinalizingthecompensationoftheexecutiveofficers,thecommitteereviewedallelementsofcompensation.Theinformationincludedtotalcashcompensation(salary,profitsharingandprojectedbonus),thegrantdatefairvalueof equity compensation, the impact that proposed compensation would have on other compensation elements such as pension, and a summaryofbenefitsthattheexecutiveswouldreceiveundervariousterminationscenarios.Thereviewenabledthecommitteetoseehow various compensation elements relate to one another and what impact its decisions would have on the total earnings opportunity of the executives. In assessing the information, the committee did not target a specific level of total compensation or use a formula to allocate compensation among the various elements. Instead, it used its judgment in assessing whether the total was consistent with the objectivesoftheprogram.Basedonthisreview,thecommitteedeterminedthatthelevelofcompensationwasappropriate.

T E X A S I N S T R U M E N T S72 • 2 0 1 3 P R O X Y S TAT E M E N T
PR
OX
Y
ST
AT
EM
EN
T
Base salary–Thecommitteesetthe2012rateofbasesalaryforthenamedexecutiveofficersasfollows:
Officer 2012 Annual Rate Change from 2011 Annual Rate
R.K.Templeton . . . . . . . . . . . . . . . . . . . . . . . . . . . . . . . . . . . . . . $1,040,000 5.0%K.P.March . . . . . . . . . . . . . . . . . . . . . . . . . . . . . . . . . . . . . . . . $ 590,000 4.4%B. T. Crutcher . . . . . . . . . . . . . . . . . . . . . . . . . . . . . . . . . . . . . . . $ 630,000* 29.9%*R. G. Delagi . . . . . . . . . . . . . . . . . . . . . . . . . . . . . . . . . . . . . . . . $ 600,000* 17.6%*K.J.Ritchie . . . . . . . . . . . . . . . . . . . . . . . . . . . . . . . . . . . . . . . $ 600,000 9.1%
* IncludessalaryincreaseinJune2012.TheJanuary2012increaseforMr.CrutcherandMr.Delagiwas13.4and4.9percent,respectively, as compared to their 2011 annual rate.
Thecommitteesetthe2012base-salaryrateforeachofthenamedexecutiveofficersinJanuary2012.Inkeepingwithitsstrategy,thecommitteesettheannualbase-salaryratestobebelowtheestimatedmedianlevelofsalariesexpectedtobepaidtosimilarlysituatedexecutives of the Comparator Group in 2012.
In June 2012, the committee increased the salary rate for Mr. Crutcher and Mr. Delagi as they assumed new leadership roles. The salaryadjustmentwasconsistentwiththepolicydescribedintheprecedingparagraph.
Thesalarydifferencesbetweenthenamedexecutiveofficersweredrivenprimarilybythemarketrateofpayforeachofficer,andnottheapplicationofaformuladesignedtomaintainadifferentialbetweentheofficers.
Equity compensation–In2012,thecommitteeawardedequitycompensationtoeachofthenamedexecutiveofficers.Thegrantsareshowninthegrantsofplan-basedawardsin2012tableonpage82.Thegrantdatefairvalueoftheawardsisreflectedinthattableandinthe“StockAwards”and“OptionAwards”columnsofthesummarycompensationtableonpage80.Thetablebelowisprovidedtoassistthereaderincomparingthenumberofshares,grantdatefairvaluesand“NQEquivalent”levelsforeachoftheyearsshowninthesummarycompensationtable.NQEquivalentsarecalculatedbytreatingeachrestrictedstockunitas3NQEquivalentsandeachoptionshareas1NQEquivalent.This3:1ratiogenerallyapproximatestherelativeaccountingexpenseofgrantingonerestrictedstockunit as compared with an option for one share.
Officer YearStock Options
(In Shares)
Restricted Stock Units (In Shares) NQ Equivalents
Grant Date Fair Value*
R.K.Templeton . . . . . . . . . . . . . . . . . . . . . . . . 2012 475,000 158,334 950,002 $9,074,0352011 450,000 150,000 900,000 $9,883,5752010 540,000 180,000 1,080,000 $7,715,066
K.P.March . . . . . . . . . . . . . . . . . . . . . . . . . . 2012 150,000 50,000 300,000 $2,865,4782011 137,500 45,834 275,002 $3,020,0042010 161,250 53,751 322,503 $2,303,828
B. T. Crutcher . . . . . . . . . . . . . . . . . . . . . . . . . 2012 187,500 62,500 375,000 $3,581,8482011 — 100,000** 300,000** $2,760,000**2010 162,500 54,167 325,001 $3,569,080
— 100,000*** 300,000*** $2,498,000***
R. G. Delagi . . . . . . . . . . . . . . . . . . . . . . . . . . 2012 175,000 58,334 350,002 $3,343,079— 50,000** 150,000** $1,380,000**
K.J.Ritchie . . . . . . . . . . . . . . . . . . . . . . . . . . 2012 175,000 58,334 350,002 $3,343,0792011 162,500 54,167 325,001 $3,569,0802010 187,500 62,501 375,003 $2,678,865
* Seenotes 2 and 3tothesummarycompensationtableonpage80 for information on how grant date fair value was calculated.** RetentiongrantmadeinJune2012,whenMr.CrutcherandMr.Delagiassumednewresponsibilities.*** ShownistheawardmadetoMr.CrutcherinSeptember2010,whenhebecameanexecutiveofficer.Thegrantsthathereceived
beforehebecameanexecutiveofficerweremadeunderproceduresapplicabletonon-executiveofficers.

T E X A S I N S T R U M E N T S 2 0 1 3 P R O X Y S TAT E M E N T • 7 3
PR
OX
Y
ST
AT
EM
EN
T
InJanuary2012,thecommitteeawardedequitycompensationtoeachofthenamedexecutiveofficers.Thecommittee’sobjectivewasto award to those officers equity compensation that had a grant date fair value at approximately the median market level, in this case the 40th to 60thpercentileofthe3-yearaverageofequitycompensation(includinganestimateofamountsfor2012)grantedbytheComparator Group.
Inassessingthemarketlevel,thecommitteeconsideredinformationpresentedbyTI’sCompensationandBenefitsorganization(preparedusingdataprovidedbythecommittee’scompensationconsultant)ontheestimatedvalueoftheawardsexpectedtobegrantedbytheComparatorGrouptosimilarlysituatedexecutives.Theawardvaluewasestimatedusingthesamemethodologyusedfor financial accounting.
Foreachofficer,thecommitteesetanumberofNQEquivalentstoachievethedesiredgrantvalue.ThecommitteedecidedtoallocatetheNQEquivalentsforeachofficerequallybetweenrestrictedstockunitsandoptionstogiveequalemphasistopromotingretention, motivating the executive and aligning his interests with those of shareholders.
Beforeapprovingthegrants,thecommitteereviewedtheamountofunvestedequitycompensationheldbytheofficerstoassessitsretention value. In making this assessment, the committee used its judgment and did not apply any formula, threshold or maximum. This reviewdidnotresultinanincreaseordecreaseoftheawardsfromthelevelsdescribedabove.
The exercise price of the options was the closing price of TI stock on January 26, 2012, the third trading day after the company releaseditsannualandfourthquarterfinancialresultsfor2011.Allgrantsweremadeunderthe2009TexasInstrumentsLong-TermIncentivePlan(the“2009Plan”),whichshareholdersapprovedinApril2009.Allgrantshavethetermsdescribedonpage85.
Thedifferencesintheequityawardsbetweenthenamedexecutiveofficerswereprimarilytheresultofdifferencesintheapplicableestimated market level of equity compensation for their positions, and not the application of any formula designed to maintain differentialsbetweentheofficers.
InadditiontotheJanuary2012awardsdescribedabove,thecommitteeawardedrestrictedstockunitstoMr.CrutcherandMr.DelagiastheyassumednewandbroaderresponsibilitiesinJune2012.Theawardswereintendedtoincreasetheretentionvalueoftheiroutstandingequitycompensation.Thenumberofrestrictedstockunitswasbasedonthecommittee’sjudgmentfollowingareviewofmarketdata;noformulaorthresholdwasapplied.
Bonus–InJanuary2013,thecommitteesetthe2012bonuscompensationforexecutiveofficersbasedonitsassessmentof2012performance.Insettingthebonuses,thecommitteeusedthefollowingperformancemeasurestoassessthecompany:
• Therelativeone-yearandthree-yearperformanceofTIascomparedwithcompetitorcompanies,asmeasuredby○ revenue growth,○ operating profit as a percentage of revenue,○ totalshareholderreturn;and
• Theabsoluteone-yearandthree-yearperformanceofTIontheabovemeasures.
Inaddition,thecommitteeconsideredourstrategicprogressbyreviewinghowcompetitiveweareinkeymarketswithourcoreproducts and technologies, as well as the strength of our relationships with key customers.
One-year relative performance on the three measures and one-year strategic progress were the primary considerations in the committee’sassessmentofthecompany’s2012performance.Inassessingperformance,thecommitteedidnotuseformulas,thresholdsormultiples.Becausemarketconditionscanquicklychangeinourindustry,thresholdsestablishedatthebeginningofayearcouldproveirrelevantbyyear-end.Thecommitteebelievesitsapproach,whichassessesthecompany’srelativeperformancein hindsight after year-end, gives it the insight to most effectively and critically judge results and encourages executives to pursue strategies that serve the long-term interests of the company and its shareholders.
In the comparison of relative performance, the committee used the following companies (the “competitor companies”):2
Advanced Micro Devices, Inc.Altera CorporationAnalog Devices, Inc.Atmel CorporationBroadcom CorporationFairchildSemiconductorInternational,Inc.FreescaleSemiconductor,Ltd.Infineon Technologies AGIntel CorporationIntersil CorporationLinearTechnologyCorporation
LSILogicCorporationMarvellTechnologyGroupLtd.MaximIntegratedProducts,Inc.Microchip Technology IncorporatedNVIDIA CorporationNXPSemiconductorsN.V.ON Semiconductor CorporationQUALCOMMIncorporatedSTMicroelectronics N.V.Xilinx,Inc.
2 Totheextentthecompanieshadnotreleasedfinancialresultsfortheyearormostrecentquarter,thecommitteebaseditsevaluationonestimatesandprojectionsofthecompanies’financialresultsfor2012.
T E X A S I N S T R U M E N T S74 • 2 0 1 3 P R O X Y S TAT E M E N T
PR
OX
Y
ST
AT
EM
EN
T
Thesecompaniesincludebothbroad-basedandnichesuppliersthatoperateinourkeymarketsoroffertechnologythatcompeteswith our products. The committee considers annually whether the list is still appropriate in terms of revenue, market capitalization and changesinbusinessactivitiesofthecompanies.InJuly2012,thecommitteedecidedtoaddFreescale,aTIcompetitorthathaditsinitialpublicofferingin2011,toincreasetheoverallcomparabilityofthegrouptoTI.
Assessment of 2012 performanceThecommitteespentextensivetimeinDecemberandJanuaryassessingTI’sresultsandstrategicprogressfor2012.Thecommitteeconsideredbothquantitativeandqualitativedata,anditappliedjudgmentinitsassessment.Overall,thecommitteedeterminedthatTI’sperformancewasaboutthesameastheprioryear,withabsoluteperformanceslightlydownandrelativeperformanceagainabovemedianinmostcompetitorcomparisons(seelistofcompetitorcompaniesabove).ThecommitteealsonotedthecontinuedstrengthofTI’sstrategicposition.Commensuratewiththisperformance,thecommitteesetbonusesforexecutiveofficersgenerallyatthesamelevelastheprioryear.Belowaredetailsofthecommittee’sperformanceassessment.
Revenue and margin• TIrevenuedeclined7percent,whichwasslightlybelowthemediangrowthrateofcompetitorcompanies.Thisincludedan
$800milliondeclineinrevenuefromwirelessbasebandoperations,forwhichthecompanyhashadapubliclystatedexitplanforanumberofyears.Withoutthesewirelessoperations,TI’srevenuedeclined1percent,betterthanthemedianrateofcompetitors.3Revenueforthecompany’scorebusinessesofAnalogandEmbeddedProcessingwasup10percentanddown7percent,respectively.ThisresultedinastrongsharegaininAnalogandaslightsharedeclineinEmbeddedProcessing.
• Operatingprofitmarginwas15percent,abovemedianascomparedwithcompetitors.Returnoninvestedcapitalwas11percent,abovethecompany’scostofcapital.
• Three-yearmetricswere7percentcompoundedannualrevenuegrowthand23percentaverageoperatingprofitmargin,belowandwellabovethemedian,respectively,ascomparedwithcompetitors.(Withouttheimpactofthewirelessoperationsmentionedabove,three-yearcompoundedrevenuegrowthwas13percent,abovethemediancomparisonwithcompetitors.)
Total shareholder return (TSR)• TSRincreased9percent,whichwasslightlybetterthanthemedianperformanceofcompetitors.• Thecompanyagaingeneratedstrongcash,withfreecashflowat23percentofrevenue.4 Ninety percent of free cash flow
wasreturnedtoshareholdersin2012throughsharerepurchasesanddividends.Sharerepurchasesof$1.8billionreducedoutstandingsharesby3percent(netofstockissuancesduringtheyear),andthequarterlydividendrateincreased24percent(the tenth increase in nine years).
• Thebalancesheetremainedrobust,endingtheyearwithcashandshort-terminvestmentsof$4billion,up35percentfromtheprior year.
• Three-yearTSRincreased8percent,aboutthemedianperformanceofcompetitors.
3 Revenueexcludingbasebandproductsisanon-GAAPfinancialmeasurethatprovidesinsightintothecompany’sunderlyingbusinessresults.FollowingisareconciliationtoTIrevenueasreportedonaGAAPbasis(amountsinmillionsofdollars):
For Years Ended,
Dec. 31, 2012
Dec. 31, 2011
Dec. 31,2010
Dec. 31,2009
Three-Year CAGR
Revenue as reported . . . . . . . . . . . . . . . . . . . . . . . . . . $12,825 $13,735 $13,966 $10,427 7%Lessbasebandrevenue . . . . . . . . . . . . . . . . . . . . . . . . 294 1,104 1,714 1,725Revenueexcludingbaseband . . . . . . . . . . . . . . . . . . . . . $12,531 $12,631 $12,252 $ 8,702 13%
CAGR(compoundannualgrowthrate)iscalculatedusingtheformula(EndingValue/BeginningValue)1/numberofyears-1.
4 Freecashflowisanon-GAAPfinancialmeasurecalculatedbysubtractingcapitalexpenditures(Additionstoproperty,plantandequipment)fromtheGAAP-basedCashflowsfromoperatingactivities.Itprovidesinsightintothecompany’sliquidity,itscash-generatingcapabilityandtheamountofcashavailabletoreturntoinvestors.ForareconciliationtoGAAP,seeExhibit13toTI’sannualreportonForm10-KfortheyearendedDecember31,2012(page51).

T E X A S I N S T R U M E N T S 2 0 1 3 P R O X Y S TAT E M E N T • 7 5
PR
OX
Y
ST
AT
EM
EN
T
Strategic progress• Thecompanyreachedamilestonein2012,with70percentofitsrevenuenowcomingfromitscorebusinessesofAnalogand
EmbeddedProcessingsemiconductors.Thesebusinessesservemarketsthatareamongthebestintheindustry,withthousandsofpossibleapplicationsanddependablelong-termgrowthopportunities.
• AlsoofnotewasthesuccessfulintegrationofNationalSemiconductor,whichwasacquiredinSeptember2011;thereadinessoflow-costcapacityforrevenuegrowth;theincreasingdiversityofthecustomerbase,especiallyintheindustrialsector;andthecompany’sstrongcustomerandmarketsharepositioninChina.
• Inall,thecommitteeconcludedthatthestrategicconditionofthecompanycontinuestoprovideasustainablecompetitive advantage.
Performance Summary1-Year 3-Year
Revenue growth . . . . . . . . . . . . . . . . . . . . . . . . . . . . . . . . . . . . . . . . . . . . . . . -7 % 7% CAGROperating margin . . . . . . . . . . . . . . . . . . . . . . . . . . . . . . . . . . . . . . . . . . . . . . . 15% 23% averageReturn on invested capital (ROIC) . . . . . . . . . . . . . . . . . . . . . . . . . . . . . . . . . . . . . . . 11% 17% averageIncrease in quarterly dividend rate . . . . . . . . . . . . . . . . . . . . . . . . . . . . . . . . . . . . . . 24% 75%Total shareholder return (TSR) . . . . . . . . . . . . . . . . . . . . . . . . . . . . . . . . . . . . . . . . 9% 8% CAGR
CAGR = compound annual growth rate
ROIC=operatingmarginx(1–taxrate)/(assets–non-debtliabilities)
One-year TSR % = (adjustedclosingpriceofthecompany’sstockatyear-end2012,dividedby2011year-endadjustedclosingprice)minus1.TheadjustedclosingpriceisasshownunderHistoricalPricesforthecompany’sstockonYahooFinanceand reflects stock splits and reinvestment of dividends.
Three-year TSR CAGR % = (adjustedclosingpriceofthecompany’sstockatyear-end2012,dividedby2009year-endadjustedclosingprice)1/3minus1.Adjustedclosingpriceisasdescribedabove.
Beforesettingthebonusesforthenamedexecutiveofficers,thecommitteeconsideredtheofficers’individualperformance.TheperformanceoftheCEOwasjudgedaccordingtotheperformanceofthecompany.Fortheotherofficers,thecommitteeconsideredthefactorsdescribedbelowinassessingindividualperformance.Inmakingthisassessment,thecommitteedidnotapplyanyformulaorperformance targets.
Mr. March is the chief financial officer. The committee noted the financial management of the company.Mr.Crutcherwasresponsibleforthecompany’sembeddedprocessingandcustomproductlinesuntilJune2012,whenhebecame
responsibleforthecompany’sanalogsemiconductorproductlines.Thecommitteenotedthefinancialperformanceandstrategicposition of the product lines.
Mr.Delagiisresponsibleforthecompany’swirelesssemiconductorproductlines.Inaddition,beginninginJune2012hebecameresponsibleforitsembeddedprocessingandcustomproductlines.Thecommitteenotedthefinancialperformanceandstrategicposition of the product lines.
Mr.Ritchieisresponsibleforthecompany’ssemiconductormanufacturingoperations.Thecommitteenotedtheperformanceofthose operations, including their cost-competitiveness and inventory management.
Thebonusesawardedfor2012performanceareshowninthetableonpage76. The differences in the amounts awarded to the namedexecutiveofficerswereprimarilytheresultofdifferencesintheofficers’levelofresponsibilityandtheapplicablemarketleveloftotalcashcompensationexpectedtobepaidtosimilarlysituatedofficersintheComparatorGroup.TheincreaseinMr.Crutcher’sbonusfor2012ascomparedto2011reflectsthesubstantialincreaseinhislevelofresponsibilityduring2012.ThebonusofeachnamedexecutiveofficerwaspaidundertheExecutiveOfficerPerformancePlandescribedonpages79 and 82.

T E X A S I N S T R U M E N T S76 • 2 0 1 3 P R O X Y S TAT E M E N T
PR
OX
Y
ST
AT
EM
EN
T
Results of the compensation decisions–Resultsofthecompensationdecisionsmadebythecommitteerelatingtothenamedexecutiveofficersfor2012aresummarizedinthefollowingtable.Thistableisprovidedasasupplementtothesummarycompensationtableonpage 80 for investors who may find it useful to see the data presented in this form. Although the committee does not target a specific leveloftotalcompensation,itconsidersinformationsimilartothatinthetabletoensurethatthesumoftheseelementsis,initsjudgment,inareasonablerange.Theprincipaldifferencesbetweenthistableandthesummarycompensationtableareexplainedinfootnote 5below.5
Officer YearSalary
(Annual Rate) Profit Sharing Bonus
Equity Compensation (Grant Date Fair Value) Total
R.K.Templeton . . . . . . . . . . . . . . . . . 2012 $ 1,040,000 $ 48,581 $ 2,700,000 $ 9,074,035 $12,862,6162011 $ 990,087 $ 78,118 $ 2,700,000 $ 9,883,575 $13,651,7802010 $ 990,087 $ 171,094 $ 3,000,000 $ 7,715,066 $11,876,247
K.P.March . . . . . . . . . . . . . . . . . . . 2012 $ 590,000 $ 27,573 $ 875,000 $ 2,865,478 $ 4,358,0512011 $ 565,008 $ 44,349 $ 875,000 $ 3,020,004 $ 4,504,3612010 $ 530,004 $ 90,858 $ 975,000 $ 2,303,828 $ 3,899,690
B. T. Crutcher . . . . . . . . . . . . . . . . . . 2012 $ 630,000* $ 27,573 $ 1,100,000 $ 6,341,848 $ 8,099,4212011 $ 485,004 $ 37,873 $ 925,000 $ 3,569,080 $ 5,016,9572010 $ 425,040 $ 62,508 $ 750,000 $ 4,641,074 $ 5,878,622
R. G. Delagi . . . . . . . . . . . . . . . . . . . 2012 $ 600,000* $ 26,645 $ 825,000 $ 4,723,079 $ 6,174,724
K.J.Ritchie . . . . . . . . . . . . . . . . . . 2012 $ 600,000 $ 27,945 $ 1,000,000 $ 3,343,079 $ 4,971,0242011 $ 550,020 $ 42,873 $ 1,000,000 $ 3,569,080 $ 5,161,9732010 $ 470,400 $ 81,151 $ 1,100,000 $ 2,678,865 $ 4,330,416
* AnnualrateasofJune2012.
ForMr.Crutcher,the“Total”ishigherfor2012primarilyduetotherestrictedstockunitawardhereceivedinJune2012(discussedon page 73).ForMessrs.Templeton,MarchandRitchie,the“Total”waslowerfor2012duetothelowergrantdatefairvalueoftheirequity compensation.
5 Thistableshowstheannualrateofbasesalaryassetbythecommittee.Inthesummarycompensationtable,the“Salary”columnshowstheactualsalarypaidintheyear.Thistablehasseparatecolumnsforprofitsharingandbonus.Inthesummarycompensationtable,profitsharingandbonusareaggregatedinthecolumnfor“Non-EquityIncentivePlanCompensation,”inaccordancewithSECrequirements.Pleaseseenotes2 and 3tothesummarycompensationtableforinformationabouthowgrantdate fair value was calculated.

T E X A S I N S T R U M E N T S 2 0 1 3 P R O X Y S TAT E M E N T • 7 7
PR
OX
Y
ST
AT
EM
EN
T
Thecompensationdecisionsshownaboveresultedinthefollowing2012compensationmixforthenamedexecutiveofficers:
Other NEOs*CEO
<1%
21%8%
71%
<1%
16% 10%
73%
Base Salary Equity Compensation Profit Sharing Bonus
* Average data for the named executive officers other than Mr. Templeton. Salary includes the annual rate for Mr. Crutcher and Mr. Delagi as of June 2012. Totals may not equal 100 percent, due to rounding.
EquitydilutionTheCompensationCommittee’sgoalistokeepnetannualdilutionfromequitycompensationunder2percent.“Netannualdilution”meansthenumberofsharesunderequityawardsgrantedbythecommitteeeachyeartoallemployees(netofawardforfeitures)asapercentageofthesharesofthecompany’soutstandingcommonstock.Equityawardsgrantedin2012underthecompany’sequity-compensation program resulted in 1.2 percent net annual dilution.
ProcessforequitygrantsThe Compensation Committee makes grant decisions for equity compensation at its January meeting each year. The dates on which thesemeetingsoccuraregenerallysetthreeyearsinadvance.TheJanuarymeetingsoftheboardandthecommitteegenerallyoccurintheweekortwobeforeweannounceourfinancialresultsforthepreviousquarterandyear.
Onoccasion,thecommitteemaygrantstockoptionsorrestrictedstockunitstoexecutivesattimesotherthanJanuary.Forexample,ithasdonesoinconnectionwithjobpromotionsandforpurposesofretention.
Wedonotback-datestockoptionsorrestrictedstockunits.Wedonotaccelerateordelaythereleaseofinformationduetoplansformaking equity grants.
Underthecommittee’spolicy,ifthecommitteemeetingfallsinthesamemonthasthereleaseofthecompany’sfinancialresults,thegrantsapprovedatthemeetingwillbemadeeffectiveonthelaterof(i)themeetingdayor(ii)thethirdtradingdayafterthereleaseofresults.Otherwisetheywillbemadeeffectiveonthedayofcommitteeaction.Theexercisepriceofstockoptionsistheclosingpriceof TI stock on the effective date of the grant.
Recoupment policyThecommitteehasapolicyconcerningrecoupment(“clawback”)ofexecutivebonusesandequitycompensation.Underthepolicy,intheeventofamaterialrestatementofTI’sfinancialresultsduetomisconduct,thecommitteewillreviewthefactsandcircumstancesand take the actions it considers appropriate with respect to the compensation of any executive officer whose fraud or willful misconductcontributedtotheneedforsuchrestatement.Suchactionmayinclude(a)seekingreimbursementofanybonuspaidtosuchofficerexceedingtheamountthat,inthejudgmentofthecommittee,wouldhavebeenpaidhadthefinancialresultsbeenproperlyreportedand(b)seekingtorecoverprofitsreceivedbysuchofficerduringthetwelvemonthsaftertherestatedperiodunderequitycompensationawards.Alldeterminationsbythecommitteewithrespecttothispolicyarefinalandbindingonallinterestedparties.
Most recent stockholder advisory vote on executive compensationInApril2012,ourshareholderscastanadvisoryvoteonthecompany’sexecutivecompensationdecisionsandpoliciesasdisclosedintheproxystatementissuedbythecompanyinMarch2012.Approximately95percentofthesharesvotedonthematterwerecastin support of the compensation decisions and policies as disclosed. The committee considered this result and determined that it was notnecessaryatthistimetomakeanymaterialchangestothecompany’scompensationpoliciesandpracticesinresponsetotheadvisory vote.

T E X A S I N S T R U M E N T S78 • 2 0 1 3 P R O X Y S TAT E M E N T
PR
OX
Y
ST
AT
EM
EN
T
Benefits
Retirement plansTheexecutiveofficersparticipateinourretirementplansunderthesamerulesthatapplytootherU.S.employees.Wemaintaintheseplanstohaveacompetitivebenefitsprogramandforretention.
LikeotherestablishedU.S.manufacturers,wehavehadaU.S.qualifieddefinedbenefitpensionplanformanyyears.Atitsorigin,theplanwasdesignedtobeconsistentwiththoseofferedbyotheremployersinthediversemarketsinwhichweoperated,whichatthe time included consumer and defense electronics as well as semiconductors and materials products. In order to limit the cost of the plan,weclosedtheplantonewparticipantsin1997.WegaveU.S.employeesasofNovember1997thechoicetoremainintheplan,ortohavetheirplanbenefitsfrozen(i.e.,nobenefitincreaseattributabletoyearsofserviceorchangeineligibleearnings)andbeginparticipatinginanenhanceddefinedcontributionplan.Mr.TempletonandMr.Crutcherchosenottoremaininthedefinedbenefitplan.Asaresult,theirbenefitsunderthatplanwerefrozenin1997andtheyparticipateintheenhanceddefinedcontributionplan.Theothernamedexecutiveofficershavecontinuedtheirparticipationinthedefinedbenefitpensionplan.
TheInternalRevenueCode(IRC)imposescertainlimitsontheretirementbenefitsthatmaybeprovidedunderaqualifiedplan.Tomaintainthedesiredlevelofbenefits,wehavenon-qualifieddefinedbenefitpensionplansforparticipantsinthequalifiedpensionplan.Underthenon-qualifiedplans,participantsreceivebenefitsthatwouldordinarilybepaidunderthequalifiedpensionplanbutforthelimitationsundertheIRC.Foradditionalinformationaboutthedefinedbenefitplans,pleaseseepages 86-89.
Employeesaccruingbenefitsinthequalifiedpensionplan,includingthenamedexecutiveofficersotherthanMr.TempletonandMr.Crutcher,alsoareeligibletoparticipateinaqualifieddefinedcontributionplanthatprovidesemployermatchingcontributions.Theenhanceddefinedcontributionplan,inwhichMr.TempletonandMr.Crutcherparticipate,providesforafixedemployercontributionplusanemployermatchingcontribution.
Ingeneral,ifanemployeewhoparticipatesinthepensionplan(includinganemployeewhosebenefitsarefrozenasdescribedabove)diesafterhavingmettherequirementsfornormalorearlyretirement,hisorherbeneficiarywillreceiveabenefitequaltothelump-sumamountthattheparticipantwouldhavereceivedifheorshehadretiredbeforedeath.In2011,havingreachedtheageof55with at least 20 years of employment, Mr. Ritchie met the requirements for early retirement under the pension plans. In 2012, none of theothernamedexecutiveofficerswasretirement-eligibleundertheplans.
Becausebenefitsunderthequalifiedandnon-qualifieddefinedbenefitpensionplansarecalculatedonthebasisofeligibleearnings(salaryandbonus),anincreaseinsalaryorbonusmayresultinanincreaseinbenefitsundertheplans.SalaryorbonusincreasesforMr.TempletonandMr.Crutcherdonotresultingreaterbenefitsforthemunderthecompany’sdefinedbenefitpensionplansbecausetheirbenefitsunderthoseplanswerefrozenin1997.Thecommitteeconsidersthepotentialeffectontheexecutives’retirementbenefitswhenitsetssalaryandperformancebonuslevels.
Deferred compensationAnyU.S.employeewhosebasesalaryandmanagementresponsibilityexceedacertainlevelmaydeferthereceiptofaportionofhisorhersalary,bonusandprofitsharing.RulesoftheU.S.DepartmentofLaborrequirethatthisplanbelimitedtoaselectgroupofmanagement or highly compensated employees. The plan allows employees to defer the receipt of their compensation in a tax-efficient manner.Eligibleemployeesinclude,butarenotlimitedto,theexecutiveofficers.Wehavetheplantobecompetitivewiththebenefitspackagesofferedbyothercompanies.
Theexecutiveofficers’deferredcompensationaccountbalancesareunsecuredandallamountsremainpartofthecompany’soperatingassets.Thevalueofthedeferredamountstrackstheperformanceofinvestmentalternativesselectedbytheparticipant.Thesealternativesareasubsetofthoseofferedtoparticipantsinthedefinedcontributionplansdescribedabove.Thecompanydoesnotguaranteeanyminimumreturnontheamountsdeferred.InaccordancewithSECrules,noearningsondeferredcompensationareshowninthesummarycompensationtableonpage80for2012becauseno“abovemarket”rateswereearnedondeferredamountsinthat year.
Employee stock purchase planOurshareholdersapprovedtheTIEmployees2005StockPurchasePlaninApril2005.Undertheplan,allemployeesintheU.S.andcertainothercountriesmaypurchasealimitednumberofsharesofthecompany’scommonstockata15percentdiscount.Theplanisdesignedtoofferthebroad-basedemployeepopulationanopportunitytoacquireanequityinterestinthecompanyandtherebyaligntheirinterestswiththoseofshareholders.Consistentwithourgeneralapproachtobenefitprograms,executiveofficersarealsoeligibleto participate.

T E X A S I N S T R U M E N T S 2 0 1 3 P R O X Y S TAT E M E N T • 7 9
PR
OX
Y
ST
AT
EM
EN
T
Health-related benefitsExecutiveofficersareeligibleunderthesameplansasallotherU.S.employeesformedical,dental,vision,disabilityandlifeinsurance.Thesebenefitsareintendedtobecompetitivewithbenefitsofferedinthesemiconductorindustry.
Other benefitsExecutiveofficersreceiveonlyafewbenefitsthatarenotavailabletoallotherU.S.employees.TheCEOiseligibleforacompany-paidphysicalandfinancialcounseling.Inaddition,theboardofdirectorshasdeterminedthatforsecurityreasons,itisinthecompany’sinteresttorequiretheCEOtousecompanyaircraftforpersonalairtravel.Pleaseseepages 81(footnote6)and90 for further details. The company provides no tax gross-ups for perquisites to any of the executive officers.
Compensation following employment termination or change in controlNoneoftheexecutiveofficershasanemploymentcontract.ExecutiveofficersareeligibleforbenefitsonthesametermsasotherU.S.employeesuponterminationofemploymentorachangeincontrolofthecompany.ThecurrentprogramsaredescribedundertheheadingPotentialPaymentsuponTerminationorChangeinControlbeginningonpage89.Noneofthefewadditionalbenefitsthatthe executive officers receive continue after termination of employment, except the amount for financial counseling is provided in the followingyearintheeventofretirement.Thecommitteereviewsthepotentialimpactoftheseprogramsbeforefinalizingtheannualcompensationforthenamedexecutiveofficers.Thecommitteedidnotraiseorlowercompensationfor2012basedonthisreview.
TheTexasInstruments2009Long-TermIncentivePlangenerallyestablishesdouble-triggerchange-in-controltermsforgrantsmadein2010andlateryears.Underthoseterms,optionsbecomefullyexercisableandsharesareissuedunderrestrictedstockunitawards(totheextentpermittedbySection409AoftheIRC)ifthegranteeisinvoluntarilyterminatedwithin24monthsafterachangeincontrolof TI. These terms are intended to encourage employees to remain with the company through a transaction while reducing employee uncertainty and distraction in the period leading up to any such event.
Stock ownership guidelines and policy against hedgingOurboardofdirectorshasestablishedstockownershipguidelinesforexecutiveofficers.TheguidelinefortheCEOisfourtimesbasesalaryor125,000shares,whicheverisless.Theguidelineforotherexecutiveofficersisthreetimesbasesalaryor25,000shares,whicheverisless.Executiveofficershavefiveyearsfromtheirelectionasexecutiveofficerstoreachthesetargets.Directlyownedshares and restricted stock units count toward satisfying the guidelines.
ShortsalesofTIstockbyourexecutiveofficersareprohibited.ItisagainstTIpolicyforanyemployee,includinganexecutiveofficer,toengageintradingin“puts”(optionstosellatafixedpriceonorbeforeacertaindate),“calls”(similaroptionstobuy),orotheroptionsor hedging techniques on TI stock.
Consideration of tax and accounting treatment of compensationSection162(m)oftheIRCgenerallydeniesadeductiontoanypubliclyheldcorporationforcompensationpaidinataxableyeartothecompany’sCEOandfourotherhighestcompensatedofficerstotheextentthattheofficer’scompensation(otherthanqualifiedperformance-basedcompensation)exceeds$1million.TheCompensationCommitteeconsiderstheimpactofthisdeductibilitylimiton the compensation that it intends to award. The committee exercises its discretion to award compensation that does not meet the requirementsofSection162(m)whenapplyingthelimitsofSection162(m)wouldfrustrateorbeinconsistentwithourcompensationpoliciesand/orwhenthevalueoftheforegonedeductionwouldnotbematerial.Thecommitteehasexercisedthisdiscretionwhenawardingrestrictedstockunitsthatvestovertime,withoutperformanceconditionstovesting.Thecommitteebelievesitisinthebestinterest of the company and its shareholders that restricted stock unit awards provide for the retention of our executive officers in all market conditions.
TheTexasInstrumentsExecutiveOfficerPerformancePlanisintendedtoensurethatperformancebonusesundertheplanarefullytaxdeductibleunderSection162(m).Theplan,whichshareholdersapprovedin2002,isfurtherdescribedonpage82.Thecommittee’sgeneralpolicyistoawardbonuseswithintheplan,althoughthecommitteereservesthediscretiontopayabonusoutsidetheplanifitdeterminesthatitisinourshareholders’bestinteresttodoso.Thecommitteesetthebonusesofthenamedexecutiveofficersfor2012performanceatthelevelsdescribedonpages 74 and 76.Thebonuseswereawardedwithintheplan.
Whensettingequitycompensation,thecommitteeconsiderstheestimatedcostforfinancialreportingpurposesofequitycompensation it intends to grant. Its consideration of the estimated cost of grants made in 2012 is discussed on page 73above.

T E X A S I N S T R U M E N T S80 • 2 0 1 3 P R O X Y S TAT E M E N T
PR
OX
Y
ST
AT
EM
EN
T
Compensation Committee report
TheCompensationCommitteeoftheboardofdirectorshasfurnishedthefollowingreport:ThecommitteehasreviewedanddiscussedtheCompensationDiscussionandAnalysis(CD&A)withthecompany’smanagement.
Basedonthatreviewanddiscussion,thecommitteehasrecommendedtotheboardofdirectorsthattheCD&Abeincludedinthecompany’sannual reportonForm10-Kfor2012andthecompany’sproxystatementforthe2013annualmeetingofstockholders.
Carrie S. Cox, Chair WayneR.Sanders Ruth J. Simmons
2012 summary compensation table
Thetablebelowshowsthecompensationofthecompany’sCEO,CFOandeachoftheotherthreemosthighlycompensatedindividualswho were executive officers during 2012 (collectively called the “named executive officers”) for services in all capacities to the company in2012.Foradiscussionoftheamountofanamedexecutiveofficer’ssalaryandbonusinproportiontohistotalcompensation,pleaseseetheCD&Aonpages68-79.
Name and Principal Position Year
Salary ($)
Bonus ($)(1)
Stock Awards ($)(2)
Option Awards ($)(3)
Non-Equity Incentive Plan Compensation
($)(4)
Change in Pension Value
and Non-qualified
Deferred Compensation Earnings ($)(5)
All Other Compensation
($)(6) Total ($)
RichardK.Templeton . . . . 2012 $1,035,841 — $ 5,123,688 $ 3,950,347 $ 2,748,581 $ 185,472 $ 272,710 $13,316,639Chairman,President 2011 $ 990,087 — $ 5,194,500 $ 4,689,075 $ 2,778,118 $ 149,704 $ 254,283 $14,055,767&ChiefExecutiveOfficer 2010 $ 987,840 — $ 4,149,000 $ 3,566,066 $ 3,171,094 $ 98,899 $ 240,521 $12,213,420
KevinP.March . . . . . . . 2012 $ 587,917 — $ 1,618,000 $ 1,247,478 $ 902,573 $1,065,717 $ 20,244 $ 5,441,929
SeniorVicePresident 2011 $ 562,091 — $ 1,587,231 $ 1,432,773 $ 919,349 $ 896,326 $ 39,925 $ 5,437,695&ChiefFinancialOfficer 2010 $ 524,587 — $ 1,238,961 $ 1,064,867 $ 1,065,858 $ 558,705 $ 19,995 $ 4,472,973
Brian T. Crutcher . . . . . . 2012 $ 587,917 — $ 4,782,500 $ 1,559,348 $ 1,127,573 $ 1,005 $ 95,375 $ 8,153,718SeniorVicePresident 2011 $ 480,007 — $ 1,875,803 $ 1,693,277 $ 962,873 $ 696 $ 49,540 $ 5,062,196
2010 $ 360,903 — $ 3,650,500 $ 990,574 $ 812,508 $ 402 $ 30,468 $ 5,845,355 R. Gregory Delagi . . . . . . 2012 $ 568,125 — $ 3,267,688 $ 1,455,391 $ 851,645 $ 990,491 $ 23,282 $ 7,156,622
SeniorVicePresident KevinJ.Ritchie . . . . . . . 2012 $ 595,835 — $ 1,887,688 $ 1,455,391 $ 1,027,945 $1,371,918 $ 19,847 $ 6,358,624
SeniorVicePresident 2011 $ 543,385 — $ 1,875,803 $ 1,693,277 $ 1,042,873 $1,143,408 $ 13,855 $ 6,312,6012010 $ 468,540 — $ 1,440,648 $ 1,238,217 $ 1,181,151 $ 630,532 $ 13,520 $ 4,972,608
(1) Performancebonusesfor2012werepaidundertheTexasInstrumentsExecutiveOfficerPerformancePlan.InaccordancewithSECrequirements,theseamountsarereportedintheNon-EquityIncentivePlanCompensationcolumn.
(2) Shown is the aggregate grant date fair value of restricted stock unit (RSU) awards calculated in accordance with ASC 718. The discussionoftheassumptionsusedforpurposesofthevaluationoftheawardsgrantedin2012appearsinnote5ofExhibit13toTI’sannualreportonForm10-KfortheyearendedDecember31,2012.Foradescriptionofthegrantterms,pleaseseepage85. Thediscussionoftheassumptionsusedforpurposesofthevaluationoftheawardsgrantedin2011and2010appearsinExhibit13to,respectively,TI’sannualreportonForm10-KfortheyearendedDecember31,2011(pages14-16)andtoTI’sannualreportonForm10-KfortheyearendedDecember31,2010(pages11-14).
(3) Shown is the aggregate grant date fair value of options calculated in accordance with ASC 718. The discussion of the assumptions usedforpurposesofthevaluationofoptionsgrantedin2012appearsinnote5ofExhibit13toTI’sannualreportonForm10-KfortheyearendedDecember31,2012.Foradescriptionofthegrantterms,pleaseseepage85. The discussion of the assumptions usedforpurposesofthevaluationoftheawardsgrantedin2011and2010appearsinExhibit13to,respectively,TI’sannualreportonForm10-KfortheyearendedDecember31,2011(pages14-16)andtoTI’sannualreportonForm10-KfortheyearendedDecember31,2010(pages11-14).

T E X A S I N S T R U M E N T S 2 0 1 3 P R O X Y S TAT E M E N T • 8 1
PR
OX
Y
ST
AT
EM
EN
T
(4) Consistsofperformancebonusandprofitsharingfor2012.Pleaseseepage76fortheamountsofbonusandprofitsharingpaidtoeach of the named executive officers for 2012.
(5) Thecompanydoesnotpayabove-marketearningsondeferredcompensation.Therefore,noamountsarereportedinthiscolumnfordeferredcompensation.Theamountsinthiscolumnrepresentthechangeintheactuarialvalueofthenamedexecutiveofficers’benefitsunderthequalifieddefinedbenefitpensionplan(TIEmployeesPensionPlan)andthenon-qualifieddefinedbenefitpensionplans(TIEmployeesNon-QualifiedPensionPlanandTIEmployeesNon-QualifiedPensionPlanII)fromDecember31,2011,throughDecember31,2012.This“changeintheactuarialvalue”isthedifferencebetweenthe2011and2012presentvalueofthepensionbenefitaccumulatedasofyear-endbythenamedexecutiveofficer,assumingthatbenefitisnotpaiduntilage65.Mr.Templeton’sandMr.Crutcher’sbenefitsunderthecompany’spensionplanswerefrozenasofDecember31,1997.
(6) Consistsof(i)theamountsinthetablebelowand(ii)perquisitesandpersonalbenefitsthatmeetthedisclosurethresholdsestablishedbytheSECandaredetailedintheparagraphbelow.
Name Insurance401(k)
Contribution
Defined Contribution Retirement
Plan (a)
Unused Vacation Time (b)
R.K.Templeton . . . . . . . . . . . . . . . . . . . . . . . . . . . . . . . . . . . . . $250 $10,000 $83,074 $10,567K.P.March . . . . . . . . . . . . . . . . . . . . . . . . . . . . . . . . . . . . . . . . $250 $ 5,000 N/A $14,994B. T. Crutcher . . . . . . . . . . . . . . . . . . . . . . . . . . . . . . . . . . . . . . $250 $10,000 $57,241 —R. G. Delagi . . . . . . . . . . . . . . . . . . . . . . . . . . . . . . . . . . . . . . . . $250 $ 5,000 N/A $ 7,650K.J.Ritchie . . . . . . . . . . . . . . . . . . . . . . . . . . . . . . . . . . . . . . . $250 $ 5,000 N/A $14,597
(a) Consistsof(i)contributionsunderthecompany’senhanceddefinedcontributionretirementplanof$5,000,and(ii)anadditionalamount of $78,074 for Mr. Templeton and $52,241forMr.CrutcheraccruedbyTItooffsetIRClimitationsonamountsthatcouldbecontributedtotheenhanceddefinedcontributionretirementplan,whichamountisalsoshownintheNon-qualified Deferred Compensationtableonpage88.
(b) Representspaymentsforunusedvacationtimethatcouldnotbecarriedforward.
Theperquisitesandpersonalbenefitsareasfollows:$168,819forMr.Templeton,consistingofpersonaluseofcompanyaircraft($157,753),financialcounselingandanexecutivephysical;$27,884forMr.Crutcher,consistingofpersonaluseofcompanyaircraft,financialcounselingandanexecutivephysical;and$10,382forMr.Delagi,consistingoffinancialcounselingandanexecutivephysical.Eachamountshownforpersonaluseofaircraftistheincrementalcost,whichwevaluedusingamethodthattakesintoaccount:landing,parkingandflightplanningservicesexpenses;crewtravelexpenses;suppliesandcateringexpenses;aircraftfuelandoilexpensesperhourofflight;communicationscosts;aportionofongoingmaintenance;andanycustoms,foreignpermitandsimilarfees.Becausecompanyaircraftareprimarilyusedforbusinesstravel,thismethodologyexcludesthefixedcosts,whichdonotchangebasedonusage,suchaspilots’salariesandtheleasecostofthecompanyaircraft.

T E X A S I N S T R U M E N T S82 • 2 0 1 3 P R O X Y S TAT E M E N T
PR
OX
Y
ST
AT
EM
EN
T
Grants of plan-based awards in 2012
Thefollowingtableshowsthegrantsofplan-basedawardstothenamedexecutiveofficersin2012.
NameGrant Date
Date of Committee
Action
Estimated Possible Payouts under Non-Equity Incentive
Plan Awards
Estimated Future Payouts under Equity Incentive
Plan Awards
All Other Stock
Awards: Number of Shares of Stock or
Units (#)(2)
All Other Option
Awards: Number of Securities Underlying
Options(#)(3)
Exercise or Base Price of Option Awards ($/Sh)
(4)
Grant Date Fair Value of Stock
and Option Awards (5)
Threshold ($)
Target ($)
Maximum($)
Threshold(#)
Target (#)
Maximum (#)
R.K.Templeton . . 1/26/2012 (1) 1/19/2012 * * * — — — 475,000 $32.36 $3,950,3471/26/2012 (1) 1/19/2012 158,334 $5,123,688
K.P.March . . . . 1/26/2012 (1) 1/19/2012 * * * — — — 150,000 $32.36 $1,247,4781/26/2012 (1) 1/19/2012 50,000 $1,618,000
B. T. Crutcher . . . 1/26/2012 (1) 1/19/2012 * * * — — — 187,500 $32.36 $1,559,3481/26/2012 (1) 1/19/2012 62,500 $2,022,5006/21/2012 6/21/2012 100,000 $2,760,000
R. G. Delagi . . . . 1/26/2012 (1) 1/19/2012 * * * — — — 175,000 $32.36 $1,455,3911/26/2012 (1) 1/19/2012 58,334 $1,887,6886/21/2012 6/21/2012 50,000 $1,380,000
K.J.Ritchie . . . 1/26/2012 (1) 1/19/2012 * * * — — — 175,000 $32.36 $1,455,3911/26/2012 (1) 1/19/2012 58,334 $1,887,688
* TIdidnotuseformulasorpre-setthresholdsormultiplestodetermineincentiveawards.UnderthetermsoftheExecutiveOfficerPerformancePlan,eachnamedexecutiveofficeriseligibletoreceiveacashbonusequalto0.5percentofthecompany’sconsolidatedincome(asdefinedintheplan).However,theCompensationCommitteehasthediscretiontosetbonusesatalowerlevel if it decides it is appropriate to do so. The committee decided to do so for 2012.
(1) InaccordancewiththegrantpolicyoftheCompensationCommitteeoftheboard(describedonpage77),thegrantsbecameeffective on the third trading day after the company released its financial results for the fourth quarter and year 2011. The company released these results on January 23, 2012.
(2) The stock awards granted to the named executive officers in 2012 were RSU awards. These awards were made under the company’s2009Long-TermIncentivePlan.ForinformationonthetermsandconditionsoftheseRSUawards,pleaseseethediscussion on page 85.
(3) Theoptionsweregrantedunderthecompany’s2009Long-TermIncentivePlan.Forinformationonthetermsandconditionsofthese options, please see the discussion on page 85.
(4) The exercise price of the options is the closing price of TI common stock on January 26, 2012.
(5) Shown is the aggregate grant date fair value computed in accordance with ASC 718 for stock and option awards in 2012. The discussionoftheassumptionsusedforpurposesofthevaluationappearsinnote5ofExhibit13toTI’sannualreportonForm10-KfortheyearendedDecember31,2012.
Noneoftheoptionsorotherequityawardsgrantedtothenamedexecutiveofficerswasrepricedormodifiedbythecompany.
ForadditionalinformationregardingTI’sequitycompensationgrantpractices,pleaseseepages70, 72-73, 77 and 85.

T E X A S I N S T R U M E N T S 2 0 1 3 P R O X Y S TAT E M E N T • 8 3
PR
OX
Y
ST
AT
EM
EN
T
Outstanding equity awards at fiscal year-end 2012
ThefollowingtableshowstheoutstandingequityawardsforeachofthenamedexecutiveofficersasofDecember31,2012.
Name
Option Awards Stock Awards
Number of Securities Underlying
Unexercised Options (#) Exercisable
Number of Securities Underlying
Unexercised Options (#)
Unexercisable
Equity Incentive
Plan Awards:
Number of Securities Underlying
Unexercised Unearned
Options (#)
Option Exercise Price ($)
Option Expiration
Date
Number of Shares or
Units of Stock That Have Not
Vested (#)
Market Value of Shares or
Units of Stock That Have Not
Vested ($)(1)
Equity Incentive
Plan Awards:
Number of Unearned Shares, Units or Other
Rights That Have Not Vested (#)
Equity Incentive
Plan Awards: Market or
Payout Value of Unearned Shares, Units
or Other Rights That
Have Not Vested ($)
R.K.Templeton . . . — 475,000 (2) — $32.36 1/26/2022 158,334 (6) $4,890,937 — —112,500 337,500 (3) — $34.63 1/27/2021 150,000 (7) $4,633,500 — —270,000 270,000 (4) — $23.05 1/28/2020 180,000 (8) $5,560,200 — —498,345 166,116 (5) — $14.95 1/29/2019 221,487 (9) $6,841,733 — —270,000 — — $29.79 1/25/2018 — — — —270,000 — — $28.32 1/18/2017 — — — —350,000 — — $32.55 1/19/2016 — — — —500,000 — — $21.55 1/20/2015 — — — —700,000 — — $32.39 1/14/2014 — — — —
K.P.March . . . . . . — 150,000 (2) — $32.36 1/26/2022 50,000 (6) $1,544,500 — —34,375 103,125 (3) — $34.63 1/27/2021 45,834 (7) $1,415,812 — —80,625 80,625 (4) — $23.05 1/28/2020 53,751 (8) $1,660,368 — —
142,500 47,500 (5) — $14.95 1/29/2019 63,334 (9) $1,956,387 — —85,000 — — $29.79 1/25/2018 — — — —85,000 — — $28.32 1/18/2017 — — — —85,000 — — $32.55 1/19/2016 — — — —80,000 — — $21.55 1/20/2015 — — — —
120,000 — — $32.39 1/14/2014 — — — —
B. T. Crutcher . . . . — 187,500 (2) — $32.36 1/26/2022 62,500 (6) $1,930,625 — — 40,625 121,875 (3) — $34.63 1/27/2021 54,167 (7) $1,673,219 — — 75,000 75,000 (4) — $23.05 1/28/2020 50,000 (8) $1,544,500 — — — 25,000 (5) — $14.95 1/29/2019 33,334 (9) $1,029,687 — — 30,000 — — $29.79 1/25/2018 100,000 (10) $3,089,000 — — 30,000 — — $28.32 1/18/2017 100,000 (11) $3,089,000 — — 8,000 — — $32.55 1/19/2016 — — — —
R. G. Delagi . . . . . — 175,000 (2) — $32.36 1/26/2022 58,334 (6) $1,801,937 — —40,625 121,875 (3) — $34.63 1/27/2021 54,167 (7) $1,673,219 — —91,875 91,875 (4) — $23.05 1/28/2020 61,251 (8) $1,892,043 — —80,000 55,000 (5) — $14.95 1/29/2019 73,334 (9) $2,265,287 — —20,000 — — $29.79 1/25/2018 50,000 (10) $1,544,500 — —

T E X A S I N S T R U M E N T S84 • 2 0 1 3 P R O X Y S TAT E M E N T
PR
OX
Y
ST
AT
EM
EN
T
Name
Option Awards Stock Awards
Number of Securities Underlying
Unexercised Options (#) Exercisable
Number of Securities Underlying
Unexercised Options (#)
Unexercisable
Equity Incentive
Plan Awards:
Number of Securities Underlying
Unexercised Unearned
Options (#)
Option Exercise Price ($)
Option Expiration
Date
Number of Shares or
Units of Stock That Have Not
Vested (#)
Market Value of Shares or
Units of Stock That Have Not
Vested ($)(1)
Equity Incentive
Plan Awards:
Number of Unearned Shares, Units or Other
Rights That Have Not Vested (#)
Equity Incentive
Plan Awards: Market or
Payout Value of Unearned Shares, Units
or Other Rights That
Have Not Vested ($)
K.J.Ritchie . . . . . — 175,000 (2) — $32.36 1/26/2022 58,334 (6) $1,801,937 — —40,625 121,875 (3) — $34.63 1/27/2021 54,167 (7) $1,673,219 — —93,750 93,750 (4) — $23.05 1/28/2020 62,501 (8) $1,930,656 — —
187,500 62,500 (5) — $14.95 1/29/2019 83,334 (9) $2,574,187 — —100,000 — — $29.79 1/25/2018 — — — —100,000 — — $28.32 1/18/2017 — — — —100,000 — — $32.55 1/19/2016 — — — —100,000 — — $21.55 1/20/2015 — — — —150,000 — — $32.39 1/14/2014 — — — —
(1) CalculatedbymultiplyingthenumberofRSUsbytheclosingpriceofTIcommonstockonDecember31,2012($30.89).
(2) One-quarterofthesharesbecameexercisableonJanuary26,2013,andone-thirdoftheremainingsharesbecomeexercisableoneach of January 26, 2014, January 26, 2015, and January 26, 2016.
(3) One-thirdofthesharesbecameexercisableonJanuary27,2013,andone-halfoftheremainingsharesbecomeexercisableoneach of January 27, 2014, and January 27, 2015.
(4) One-halfofthesharesbecameexercisableonJanuary28,2013,andtheremainingone-halfbecomeexercisableonJanuary28,2014.
(5) BecamefullyexercisableonJanuary29,2013.
(6) VestingdateisJanuary29,2016.
(7) Vesting date is January 30, 2015.
(8) Vesting date is January 31, 2014.
(9) VestedonJanuary31,2013.
(10)VestingdateisJuly29,2016.
(11)VestingdateisOctober31,2014.
Outstanding equity awards at fiscal year-end 2012 (continued)

T E X A S I N S T R U M E N T S 2 0 1 3 P R O X Y S TAT E M E N T • 8 5
PR
OX
Y
ST
AT
EM
EN
T
The “Option Awards”showninthetableabovearenon-qualifiedstockoptions,eachofwhichrepresentstherighttopurchasesharesofTIcommonstockatthestatedexerciseprice.Forgrantsbefore2007,theexercisepriceistheaverageofthehighandlowpriceofTIcommonstockonthegrantdate.Forgrantsafter2006,theexercisepriceistheclosingpriceofTIcommonstockonthegrantdate.Thetermofeachoptionistenyearsunlesstheoptionisterminatedearlierpursuanttoprovisionssummarizedinthechartbelowandintheparagraphfollowingthechart.Optionsvest(becomeexercisable)inincrementsof25percentperyearbeginningonthefirstanniversaryofthedateofthegrant.Thechartbelowshowstheterminationprovisionsrelatingtostockoptionsoutstanding as ofDecember31,2012.TheCompensationCommitteeoftheboardofdirectorsestablishedtheseterminationprovisionstopromoteemployee retention while offering competitive terms.
Employment Termination Due to Death or Permanent
Disability
Employment Termination (at Least 6 Months after Grant)
When Retirement Eligible
Employment Termination (at Least 6 Months after Grant)
with 20 Years of Credited Service, but Not Retirement
Eligible
Employment Termination for
Cause
Other Circumstances of Employment
Termination
Vestingcontinues;option remains in effect to end of term
Vestingcontinues;option remains in effect to end of term
Option remains in effect to the end of theterm;vestingdoesnotcontinueafteremployment termination
Option cancels Option remains exercisablefor30 days
OptionsmaybecancelledifthegranteecompeteswithTIduringthetwoyearsafteremploymentterminationordisclosesTItradesecrets.Inaddition,foroptionsreceivedwhilethegranteewasanexecutiveofficer,thecompanymayreclaim(or“clawback”)profitsearned under grants if the officer engages in such conduct. These provisions are intended to strengthen retention and provide a reasonableremedytoTIincaseofcompetitionordisclosureofourconfidentialinformation.
Optionsgrantedafter2009becomefullyvestedifthegranteeisinvoluntarilyterminatedfromemploymentwithTI(otherthanforcause)within24monthsafterachangeincontrolofTI.“Changeincontrol”isdefinedasprovidedintheTexasInstruments2009Long-TermIncentivePlanandoccursupon(1)acquisitionofmorethan50percentofthevotingstockoratleast80percentoftheassetsofTIor(2)changeofamajorityoftheboardofdirectorsina12-monthperiodunlessamajorityofthedirectorstheninofficeendorsedtheappointmentorelectionofthenewdirectors(“Plandefinition”).Thesetermsareintendedtoreduceemployeeuncertaintyanddistractionintheperiodleadinguptoachangeincontrol,ifsuchaneventweretooccur.Foroptionsgrantedbefore2010,thestockoptiontermsprovidethatuponachangeincontrolofTI,theoptionbecomesfullyvestedtotheextentitisthenoutstanding;andifemploymenttermination(exceptforcause)hasoccurredwithin30daysbeforethechangeincontrol,thechangeincontrolisdeemedtohave occurred first. “Change in control” is defined in these pre-2010 options as (1) acquisition of 20 percent of TI common stock other thanthroughatransactionapprovedbytheboardofdirectors,or(2)changeofamajorityoftheboardofdirectorsina24-monthperiodunless a majority of the directors then in office have elected or nominated the new directors (together, the “pre-2010 definition”).
The “Stock Awards”inthetableofoutstandingequityawardsatfiscalyear-end2012areRSUawards.EachRSUrepresentstherightto receive one share of TI common stock on a stated date (the “vesting date”) unless the award is terminated earlier under terms summarizedbelow.Ingeneral,thevestingdateisapproximatelyfouryearsafterthegrantdate.EachRSUincludestherighttoreceivedividendequivalents,whicharepaidannuallyincashatarateequaltotheamountpaidtostockholdersindividends.Thetablebelowshows the termination provisions of RSUs outstanding asofDecember31,2012.
Employment Termination Due to Death or Permanent Disability
Employment Termination When Retirement Eligible
Other Circumstances of Employment Termination
Vestingcontinues;sharesarepaidatthe scheduled vesting date
Grant stays in effect and pays out shares at the scheduled vestingdate.Numberofsharesreducedaccordingtothedurationofemploymentoverthevestingperiod*
Grantcancels;nosharesareissued
* CalculatedbymultiplyingthenumberofRSUsbyafractionequaltothenumberofwhole365-dayperiodsfromthegrantdatetotheemploymentterminationdate(orfirstdayofanybridgeleaveofabsenceleadingtoretirement),dividedbythenumberof years in the vesting period.
Theseterminationprovisionsareintendedtopromoteretention.AllRSUawardscontaincancellationandclawbackprovisionslikethosedescribedaboveforstockoptions.Forawardsgrantedafter2009,thetermsprovidethat,totheextentpermittedbySection409Aofthe IRC, the award vests upon involuntary termination of TI employment within 24 months after a change in control. Change in control isthePlandefinition.ThetermsofearlierRSUawardsprovideforfullvestingoftheawarduponachangeincontrolofTI.Changeincontrolisthepre-2010definitionunlessthegrantissubjecttoSection409A,inwhicheventthedefinitionunderSection409Aapplies.Section409Adefinesachangeincontrolasachangeintheownershiporeffectivecontrolofacorporationorachangeintheownershipofasubstantialportionoftheassetsofacorporation.Thesecancellation,clawbackandchange-in-controltermsareintendedtoconformRSUtermswiththoseofstockoptions(totheextentpermittedbytheIRC)andtoachievetheobjectivesdescribedaboveinthediscussionofstockoptions.

T E X A S I N S T R U M E N T S86 • 2 0 1 3 P R O X Y S TAT E M E N T
PR
OX
Y
ST
AT
EM
EN
T
Inadditiontothe“StockAwards”shownintheoutstandingequityawardsatfiscalyear-end2012tableon pages 83 and 84, Mr. TempletonholdsanawardofRSUsthatwasgrantedin1995.Theaward,for120,000sharesofTIcommonstock,vestedin2000.Undertheawardterms,theshareswillbeissuedtoMr.TempletoninMarchoftheyearafterhisterminationofemploymentforanyreason.Thesetermsweredesignedtoprovideataxbenefittothecompanybypostponingtherelatedcompensationexpenseuntilitwaslikelytobefullydeductible.InaccordancewithSECrequirements,thisawardisreflectedinthe2012non-qualifieddeferredcompensationtableon page 88.
2012 option exercises and stock vested
Thefollowingtableliststhenumberofsharesacquiredandthevaluerealizedasaresultofoptionexercisesbythenamedexecutiveofficersin2012andthevalueofanyRSUsthatvestedin2012.Foroptionexercises,thevaluerealizediscalculatedbymultiplyingthenumberofsharesacquiredbythedifferencebetweentheexercise price and the market price of TI common stock on the exercise date. ForRSUs,thevaluerealizediscalculatedbymultiplyingthenumberofRSUsthatvestedbythemarketprice of TI common stock on the vesting date.
Name
Option Awards Stock Awards
Number of Shares Acquired on Exercise (#)
Value Realized on Exercise ($)
Number of Shares Acquired
on Vesting (#)Value Realized on Vesting ($)
R.K.Templeton . . . . . . . . . . . . . . . . . . . . . . . . . . 1,000,000 $15,807,500 150,000 $ 4,827,000K.P.March . . . . . . . . . . . . . . . . . . . . . . . . . . . . . –– –– 35,000 $ 1,126,300B. T. Crutcher . . . . . . . . . . . . . . . . . . . . . . . . . . . 25,000 $ 441,500 20,000 $ 643,600R. G. Delagi . . . . . . . . . . . . . . . . . . . . . . . . . . . . . –– –– 40,000 $ 1,287,200K.J.Ritchie . . . . . . . . . . . . . . . . . . . . . . . . . . . . 100 $ 299 50,000 $ 1,609,000
2012 pension benefits
ThefollowingtableshowsthepresentvalueasofDecember31,2012,ofthebenefitofthenamedexecutiveofficersunderourqualifieddefinedbenefitpensionplan(TIEmployeesPensionPlan)andnon-qualifieddefinedbenefitpensionplans(TIEmployeesNon-QualifiedPensionPlan(whichgovernsamountsearnedbefore2005)andTIEmployeesNon-QualifiedPensionPlanII(whichgovernsamountsearnedafter2004)).InaccordancewithSECrequirements,theamountsshowninthetabledonotreflectanynamedexecutiveofficer’sretirementeligibilityoranyincreaseinbenefitsthatmayresultfromthenamedexecutiveofficer’scontinuedemploymentafterDecember31,2012.
Name Plan Name
Number of Years Credited
Service (#)
Present Value of
Accumulated Benefit ($)(5)
Payments During
Last Fiscal
Year ($)
R.K.Templeton(1) . . . . . . . . . . . . . . . . TIEmployeesPensionPlan 16 (2) $ 604,392 — TIEmployeesNon-QualifiedPensionPlan 16 (2) $ 356,234 —
TIEmployeesNon-QualifiedPensionPlanII 16 (4) $ 89,489 ——
K.P.March . . . . . . . . . . . . . . . . . . . . TIEmployeesPensionPlan 27 (2) $ 735,609 — TIEmployeesNon-QualifiedPensionPlan 19 (3) $ 212,394 — TIEmployeesNon-QualifiedPensionPlanII 27 (4) $ 3,281,795 —
—B. T. Crutcher (1) . . . . . . . . . . . . . . . . TIEmployeesPensionPlan 0.9 (2) $ 3,934 —
—R. G. Delagi . . . . . . . . . . . . . . . . . . . TIEmployeesPensionPlan 27 (2) $ 702,873 — TIEmployeesNon-QualifiedPensionPlan 19 (3) $ 257,583 — TIEmployeesNon-QualifiedPensionPlanII 27 (4) $ 2,441,585 —
—K.J.Ritchie . . . . . . . . . . . . . . . . . . . TIEmployeesPensionPlan 33 (2) $ 1,149,329 — TIEmployeesNon-QualifiedPensionPlan 25 (3) $ 406,793 — TIEmployeesNon-QualifiedPensionPlanII 33 (4) $ 4,332,417 —
(1) In1997,TI’sU.S.employeesweregiventhechoicebetweencontinuingtoparticipateinthedefinedbenefitpensionplansorparticipatinginanewenhanceddefinedcontributionretirementplan.Messrs.TempletonandCrutcherchosetoparticipateinthedefinedcontributionplan.Accordingly,theiraccruedpensionbenefitsunderthequalifiedandnon-qualifiedplanswerefrozen

T E X A S I N S T R U M E N T S 2 0 1 3 P R O X Y S TAT E M E N T • 8 7
PR
OX
Y
ST
AT
EM
EN
T
(i.e.,theywillexperiencenoincreaseattributabletoyearsofserviceorchangeineligibleearnings)asofDecember31,1997.ContributionstothedefinedcontributionplanforMr.Templeton’sandMr.Crutcher’sbenefitsareincludedinthe2012summarycompensationtable.
(2) Foreachofthenamedexecutiveofficers,creditedservicebeganonthedatetheofficerbecameeligibletoparticipateintheplan.ForMr.Crutcher,eligibilitytoparticipatebeganonthefirstdayofthemonthfollowingcompletionofoneyearofemployment.Foreachoftheothernamedexecutiveofficers,eligibilitytoparticipatebeganontheearlierof18monthsofemployment,orJanuary1followingthecompletionofoneyearofemployment.Accordingly,eachofthenamedexecutiveofficershasbeenemployedbyTIforlongerthantheyearsofcreditedserviceshownabove.
(3) CreditedservicebeganonthedatethenamedexecutiveofficerbecameeligibletoparticipateintheTIEmployeesPensionPlanasdescribedinnote2aboveandceasedatDecember31,2004.
(4) CreditedservicebeganonthedatethenamedexecutiveofficerbecameeligibletoparticipateintheTIEmployeesPensionPlanasdescribedinnote2above.
(5) TheassumptionsandvaluationmethodsusedtocalculatethepresentvalueoftheaccumulatedpensionbenefitsshownarethesameasthoseusedbyTIforfinancialreportingpurposesandaredescribedinnote11inExhibit13toTI’sannualreportonForm10-KfortheyearendedDecember31,2012,exceptthatanamedexecutiveofficer’sretirementisassumed(inaccordancewithSECrules)forpurposesofthistabletooccuratage65andnoassumptionforterminationpriortothatdateisused.Theamountofthelump-sumbenefitearnedasofDecember31,2012,isdeterminedusingeither(i)thePensionBenefitGuarantyCorporation(PBGC)interestassumptionof2.50percentor(ii)thePensionProtectionActof2006(PPA)corporatebondyieldinterestassumptionof4.16percentfortheTIEmployeesPensionPlanand4.17percentfortheTIEmployeesNon-QualifiedPensionPlans,whicheverrateproducesthehigherlumpsumamount.Adiscountrateassumptionof4.16percentfortheTIEmployeesPensionPlanand4.17 percent for the non-qualified pension plans was used to determine the present value of each lump sum.
TIEmployeesPensionPlanTheTIEmployeesPensionPlanisaqualifieddefinedbenefitpensionplan.Pleaseseepage78 for a discussion of the origin and purpose oftheplan.EmployeeswhojoinedtheU.S.payrollafterNovember30,1997,arenoteligibletoparticipateinthisplan.
Aplanparticipantiseligiblefornormalretirementunderthetermsoftheplanifheisatleast65yearsofagewithoneyearofcreditedservice.Aparticipantiseligibleforearlyretirementifheisatleast55yearsofagewith20yearsofemploymentor60yearsofagewithfiveyearsofemployment.AsofDecember31,2012,Mr.Ritchiewastheonlynamedexecutiveofficereligibleforearlyornormal retirement.
Aparticipantmayrequestpaymentofhisaccruedbenefitatterminationoranytimethereafter.Participantsmaychoosealumpsumpayment or one of six forms of annuity. In order of largest to smallest periodic payment, the forms of annuity are: (i) single life annuity, (ii) 5-year certain and life annuity, (iii) 10-year certain and life annuity, (iv) qualified joint and 50 percent survivor annuity, (v) qualified joint and 75 percent survivor annuity, and (vi) qualified joint and 100 percent survivor annuity. If the participant does not request payment,hewillbegintoreceivehisbenefitinApriloftheyearafterhereachestheageof70½intheformofannuityrequiredunderthe IRC.
Thepensionformulaforthequalifiedplanisintendedtoprovideaparticipantwithanannualretirementbenefitequalto1.5percentmultipliedbytheproductof(i)yearsofcreditedserviceand(ii)theaverageofthefivehighestconsecutiveyearsofhisbasesalaryplusbonusuptoalimitimposedbytheIRS,lessapercentage(basedonhisyearofbirth,whenheelectstoretireandhisyearsofservicewithTI)oftheamountofcompensationonwhichhisSocialSecuritybenefitisbased.
Ifanindividualtakesearlyretirementandchoosestobeginreceivinghisannualretirementbenefitatthattime,suchbenefitisreducedbyanearlyretirementfactor.Asaresult,theannualbenefitislowerthantheonehewouldhavereceivedatage65.
Iftheparticipant’semploymentterminatesduetodisability,theparticipantmaychoosetoreceivehisaccruedbenefitatanytimepriortoage65.Alternatively,theparticipantmaychoosetodeferreceiptoftheaccruedbenefituntilreachingage65andthentakeadisabilitybenefit.Thedisabilitybenefitpaidatage65isbasedonsalaryandbonus,yearsofcreditedservicetheparticipantwouldhaveaccruedtoage65hadhenotbecomedisabledanddisabledstatus.
Thebenefitpayableintheeventofdeathisbasedonsalaryandbonus,yearsofcreditedserviceandageatthetimeofdeath,andmaybeintheformofalumpsumorannuityattheelectionofthebeneficiary.Theearliestdateofpaymentisthefirstdayofthesecondcalendar month following the month of death.
Leavesofabsence,includingabridgetoretirement,arecreditedtoyearsofserviceunderthequalifiedpensionplan.Pleaseseethediscussionofleavesofabsenceonpage90.
TIEmployeesNon-QualifiedPensionPlansTIhastwonon-qualifiedpensionplans:theTIEmployeesNon-QualifiedPensionPlan(PlanI),whichgovernsamountsearnedbefore2005;andtheTIEmployeesNon-QualifiedPensionPlanII(PlanII),whichgovernsamountsearnedafter2004.Eachisanon-qualifieddefinedbenefitpensionplan.Pleaseseepage78foradiscussionofthepurposeoftheplans.Aswiththequalifieddefinedbenefit

T E X A S I N S T R U M E N T S88 • 2 0 1 3 P R O X Y S TAT E M E N T
PR
OX
Y
ST
AT
EM
EN
T
pensionplan,employeeswhojoinedtheU.S.payrollafterNovember30,1997,arenoteligibletoparticipateinPlanIorPlanII.Eligibilityfornormalandearlyretirementundertheseplansisthesameasunderthequalifiedplan(pleaseseeabove).Benefitsarepaidinalump sum.
Aparticipant’sbenefitsunderPlanIandPlanIIarecalculatedusingthesameformulaasdescribedabovefortheTIEmployeesPensionPlan.However,theIRSlimitontheamountofcompensationonwhichaqualifiedpensionbenefitmaybecalculateddoesnotapply.Additionally,theIRSlimitontheamountofqualifiedbenefittheparticipantmayreceivedoesnotapplytotheseplans.Oncethisnon-qualifiedbenefitamounthasbeendeterminedusingtheformuladescribedabove,theindividual’squalifiedbenefitissubtractedfromit.Theresultingdifferenceismultipliedbyanage-basedfactortoobtaintheamountofthelump-sumbenefitpayabletoanindividual under the non-qualified plans.
AmountsunderPlanIwillbedistributedwhenpaymentoftheparticipant’sbenefitunderthequalifiedpensionplancommences.AmountsunderPlanIIwillbedistributedsubjecttotherequirementsofSection409AoftheIRC.Becausethenamedexecutiveofficersareamongthe50mosthighlycompensatedofficersofthecompany,Section409AoftheIRCrequiresthattheynotreceiveanylumpsumdistributionpaymentunderPlanIIbeforethefirstdayoftheseventhmonthfollowingterminationofemployment.
Ifaparticipantterminatesduetodisability,amountsunderPlanIwillbedistributedwhenpaymentoftheparticipant’sbenefitunderthequalifiedplancommences.ForamountsunderPlanII,distributionisgovernedbySection409AoftheIRC,andthedisabilitybenefitisreducedtoreflectthepaymentofthebenefitpriortoage65.
Intheeventofdeath,paymentunderbothplansisbasedonsalaryandbonus,yearsofcreditedserviceandageatthetimeofdeathandwillbeintheformofalumpsum.Theearliestdateofpaymentisthefirstdayofthesecondcalendarmonthfollowingthemonthof death.
Balancesintheplansareunsecuredobligationsofthecompany.ForamountsunderPlanI,intheeventofachangeincontrol,thepresentvalueoftheindividual’sbenefitwouldbepaidnotlaterthanthemonthfollowingthemonthinwhichthechangeincontroloccurred.Forsuchamounts,thepre-2010definitionofachangeincontrol(pleaseseepage85)applies.Forallamountsaccruedunderthisplan,ifasaleofsubstantiallyalloftheassetsofthecompanyoccurred,thepresentvalueoftheindividual’sbenefitwouldbedistributedinalumpsumassoonasreasonablypracticablefollowingthesaleofassets.ForamountsunderPlanII,nodistributionofbenefitsistriggeredbyachangeincontrol.
Leavesofabsence,includingabridgetoretirement,arecreditedtoyearsofserviceunderthenon-qualifiedpensionplans.Foradiscussionofleavesofabsence,pleaseseepage90.
TIEmployeesSurvivorBenefitPlanTI’squalifiedandnon-qualifiedpensionplansprovidethatuponthedeathofaretirement-eligibleemployee,theemployee’sbeneficiaryreceivesapaymentequaltohalfofthebenefittowhichtheemployeewouldhavebeenentitledunderthepensionplanshadheretiredinsteadofdied.Wehaveasurvivorbenefitplanthatpaysthebeneficiaryalumpsumthat,whenaddedtothereducedamountsthebeneficiaryreceivesunderthepensionplans,equalsthebenefittheemployeewouldhavebeenentitledtoreceivehadheretiredinsteadofdied.BecauseMr.Ritchiebecameeligibleforearlyretirementin2011,hisbeneficiarywouldbeeligibleforabenefitunderthesurvivorbenefitplanifheweretodie.
2012 non-qualified deferred compensation
Thefollowingtableshowscontributionstothenamedexecutiveofficer’sdeferredcompensationaccountin2012andtheaggregateamountofhisdeferredcompensationasofDecember31,2012.
Name
Executive Contributions
in Last FY ($)(1)
Registrant Contributions in
Last FY ($)(2)Aggregate Earnings in
Last FY ($)
Aggregate Withdrawals/
Distributions ($)
Aggregate Balance at Last
FYE ($)(5)
R.K.Templeton . . . . . . . . . . . . . . . $ 41,434 $ 78,074 $328,299 (3) $1,384,342 (4) $3,982,172 (6)K.P.March . . . . . . . . . . . . . . . . . . — — — — —B. T. Crutcher . . . . . . . . . . . . . . . . $ 46,250 $ 52,241 $ 35,083 — $ 367,874R. G. Delagi . . . . . . . . . . . . . . . . . — — $ 704 $ 49,311 —K.J.Ritchie . . . . . . . . . . . . . . . . . — — — — —
(1) AmountshownforMr.Templetonisaportionofhis2012salary;amountshownforMr.Crutcherisaportionofhisbonusfor2011performance, which was paid in 2012.
(2) Companymatchingcontributionspursuanttothedefinedcontributionplan.TheseamountsareincludedintheAllOtherCompensationcolumnofthe2012summarycompensationtableonpage80.

T E X A S I N S T R U M E N T S 2 0 1 3 P R O X Y S TAT E M E N T • 8 9
PR
OX
Y
ST
AT
EM
EN
T
(3) Consistsof:(a)$86,400individendequivalentspaidunderthe120,000-share1995RSUawarddiscussedonpage86, settlement ofwhichhasbeendeferreduntilafterterminationofemployment;(b)a$213,600increaseinthevalueoftheRSUaward(calculatedbysubtracting$3,493,200(thevalueoftheawardatyear-end2011)from$3,706,800(thevalueoftheawardatyear-end2012)(inbothcases,thenumberofRSUsismultipliedbytheclosingpriceofTIcommonstockonthelasttradingdateoftheyear));and(c)a$28,299gaininMr.Templeton’sdeferredcompensationaccountin2012.Dividendequivalentsarepaidatthesamerateasdividends on TI common stock.
(4) ConsistsofdividendequivalentspaidontheRSUsdiscussedinnote3andascheduleddistributionofaportionofMr.Templeton’sdeferredcompensationbalance.
(5) IncludesamountsreportedintheSummaryCompensationTableinthecurrentorprior-yearproxystatementsasfollows:Mr.Templeton,$275,372;andMr.Crutcher,$367,874.
(6) Ofthisamount,$3,706,800isattributabletoMr.Templeton’s1995RSUaward,calculatedasdescribedinnote3.Theremainderisthebalanceofhisdeferredcompensationaccount.
Pleaseseepage78foradiscussionofthepurposeoftheplan.Anemployee’sdeferredcompensationaccountcontainseligiblecompensationtheemployeehaselectedtodeferandcontributionsbythecompanythatareinexcessoftheIRSlimitson(i)contributionsthecompanymaymaketotheenhanceddefinedcontributionplanand(ii)matchingcontributionsthecompanymaymakerelatedtocompensation the executive officer deferred into his deferred compensation account.
Participantsinthedeferredcompensationplanmaychoosetodeferupto(i)25percentoftheirbasesalary,(ii)90percentoftheirperformancebonus,and(iii)90percentofprofitsharing.Electionstodefercompensationmustbemadeinthecalendaryearpriortotheyearinwhichthecompensationwillbeearned.
During 2012, participants could choose to have their deferred compensation mirror the performance of one or more of the following mutualfunds,eachofwhichismanagedbyathirdparty(thesealternatives,whichmaybechangedatanytime,areasubsetofthoseofferedtoparticipantsinthedefinedcontributionplans):NorthernTrustShortTermInvestmentFund,NorthernTrustAggregateBondIndexFund-Lending,NorthernTrustRussell1000ValueIndexFund-Lending,NorthernTrustRussell1000GrowthIndexFund-Lending,NorthernTrustRussell2000IndexFund-Lending,NorthernTrustMidCap400IndexFund-Lending,FidelityPuritanFund,BlackRockEquityIndexFundF,BlackRock(EAFE)(Europe,Australia,FarEast)EquityIndexFundF,BlackRockLifepathIndex2020FundF,BlackRockLifepathIndex2030FundF,BlackRockLifepathIndex2040FundF,BlackRockLifepathIndex2050FundFandBlackRockLifepathIndexRetirementFundF.Fromamongtheavailableinvestmentalternatives,participantsmaychangetheirinstructionsrelatingtotheirdeferredcompensationdaily.Earningsonaparticipant’sbalancearedeterminedsolelybytheperformanceoftheinvestmentsthattheparticipanthaschosenforhisplanbalance.Thecompanydoesnotguaranteeanyminimumreturnoninvestments.Athirdpartyadministersthecompany’sdeferredcompensationprogram.
Aparticipantmayrequestdistributionfromtheplaninthecaseofanunforeseeableemergency.Toobtainanunforeseeableemergencywithdrawal,aparticipantmustmeettherequirementsofSection409AoftheIRC.Otherwise,aparticipant’sbalanceispaidpursuanttohisdistributionelectionandissubjecttoapplicableIRClimitations.
Amountscontributedbythecompany,andamountsearnedanddeferredbytheparticipantforwhichthereisavaliddistributionelectiononfile,willbedistributedinaccordancewiththeparticipant’selection.Annuallyparticipantsmayelectseparatedistributiondatesfordeferredcompensationattributabletoaparticipant’s(i)bonusandprofitsharingand(ii)salary.Participantsmayelectthatthesedistributionsbeintheformofalumpsumorannualinstallmentstobepaidoutoveraperiodoffiveortenconsecutiveyears.Amountsforwhichnovaliddistributionelectionisonfilewillbedistributedthreeyearsfromthedateofdeferral.
Intheeventoftheparticipant’sdeath,paymentwillbeintheformofalumpsumandtheearliestdateofpaymentisthefirstdayofthe second calendar month following the month of death.
Likethebalancesunderthenon-qualifieddefinedbenefitpensionplans,deferredcompensationbalancesareunsecuredobligationsofthecompany.Foramountsearnedanddeferredpriorto2010,achangeincontroldoesnottriggeradistributionundertheplan.Foramountsearnedanddeferredafter2009,distributionoccurs,totheextentpermittedbySection409AoftheIRC,iftheparticipantisinvoluntarilyterminatedwithin24monthsafterachangeincontrol.ChangeincontrolisthePlandefinition.
Potential payments upon termination or change in control
Noneofthenamedexecutiveofficershasanemploymentcontractwiththecompany.TheyareeligibleforbenefitsongenerallythesametermsasotherU.S.employeesuponterminationofemploymentorchangeincontrolofthecompany.TIdoesnotreimburseexecutiveofficersforanyincomeorexcisetaxesthatarepayablebytheexecutiveasaresultofpaymentsrelatingtoterminationorchange in control.

T E X A S I N S T R U M E N T S90 • 2 0 1 3 P R O X Y S TAT E M E N T
PR
OX
Y
ST
AT
EM
EN
T
TerminationThe following programs may result in payments to a named executive officer whose employment terminates. Most of these programs have beendiscussedabove.Foradiscussionoftheimpactoftheseprogramsonthecompensationdecisionsfor2012,pleaseseepage79.
Bonus.Ourpoliciesconcerningbonusandthetimingofpaymentsaredescribedonpage70.Whetherabonuswouldbeawardedunderothercircumstancesandinwhatamountwoulddependonthefactsandcircumstancesofterminationandissubjecttothecompensationcommittee’sdiscretion.Ifawarded,bonusesarepaidbythecompany.
Qualified and non-qualified defined benefit pension plans.Thepurposesoftheseplansaredescribedonpage78. The formula for determiningbenefits,theformsofbenefitandthetimingofpaymentsaredescribedonpages87-88.Theamountsdisbursedunderthequalifiedandnon-qualifiedplansarepaid,respectively,bytheTIEmployeesPensionTrustandthecompany.
Survivor benefit plan.Thepurposeofthisplanisdescribedonpage88.Theformulafordeterminingtheamountofbenefit,theformofbenefitandthetimingofpaymentsaredescribedonpage88.AmountsdistributedarepaidbytheTIEmployeesHealthBenefitTrust.
Deferred compensation plan.Thepurposeofthisplanisdescribedonpage78.Theamountspayableunderthisprogramdependsolelyontheperformanceofinvestmentsthattheparticipanthaschosenforhisplanbalance.Thetimingofpaymentsisdiscussedonpage 89.Amountsdistributedarepaidbythecompany.
Equity compensation. Depending on the circumstances of termination, grantees whose employment terminates may retain the right to exercisepreviouslygrantedstockoptionsandreceivesharesunderoutstandingRSUawards.Pleaseseepage85. RSU awards include a righttoreceivedividendequivalents.Thedividendequivalentsarepaidannuallybythecompanyinasinglecashpaymentafterthelastdividend payment of the year.
Perquisites.Financialcounselingisavailabletoexecutiveofficersintheyearafterretirement.Otherwise,noperquisitescontinueaftertermination of employment.
Inthecaseofaresignationpursuanttoaseparationarrangement,anexecutiveofficer(likeotheremployeesaboveacertainjobgradelevel)willtypicallybeoffereda12-monthpaidleaveofabsencebeforetermination,inexchangeforanon-competeandnon-solicitationcommitmentandareleaseofclaimsagainstthecompany.Theleaveperiodwillbecreditedtoyearsofserviceunderthepensionplansdescribedabove.Duringtheleave,theexecutiveofficer’sstockoptionswillcontinuetobecomeexercisableandhisRSUswillcontinuetovest.Amountspaidtoanindividualduringapaidleaveofabsencearenotcountedwhencalculatingbenefitsunderthequalifiedandnon-qualified pension plans.
Inthecaseofaseparationarrangementinwhichthepaidleaveofabsenceexpireswhentheexecutiveofficerwillbeatleast50 years old and have at least 15 years of employment with the company, the separation arrangement will typically include an unpaid leaveofabsence,tocommenceattheendofthepaidleaveandendwhentheexecutiveofficerhasreachedtheearlierofage55withatleast20yearsofemploymentorage60(bridgetoretirement).Thebridgetoretirementwillbecreditedtoyearsofserviceunderthequalifiedandnon-qualifieddefinedbenefitplansdescribedabove.StockoptionswillcontinuetobecomeexercisableandRSUswillremainineffect,butthenumberofRSUswillbereducedasdescribedinnote*onpage85.
Change in ControlWehavenoprogram,planorarrangementprovidingbenefitstriggeredbyachangeincontrolexceptasdescribedbelow.Infact,theonlyconsequencesofachangeincontrolaretheaccelerationofpaymentofexistingbalancesandthefullvestingofcertainoutstandingequity awards.
AchangeincontrolatDecember31,2012,wouldhavetriggeredpaymentofthebalanceundertheTIEmployeesNon-QualifiedPensionPlan.Pleaseseepages88-89 for a discussion of the purpose of change in control provisions relating to the non-qualified definedbenefitplansandthedeferredcompensationplanaswellasthecircumstancesandthetimingofpayment.
Aninvoluntarytermination(notforcause)within24monthsafterachangeincontrolofTIwillaccelerate,totheextentpermittedbySection409AoftheIRC,thevestingofoptionsandRSUsgrantedafter2009.
Pleaseseepage85 for further information concerning change in control provisions relating to stock options and RSU awards.Foradiscussionoftheimpactoftheseprogramsonthecompensationdecisionsfor2012,pleaseseepage79.
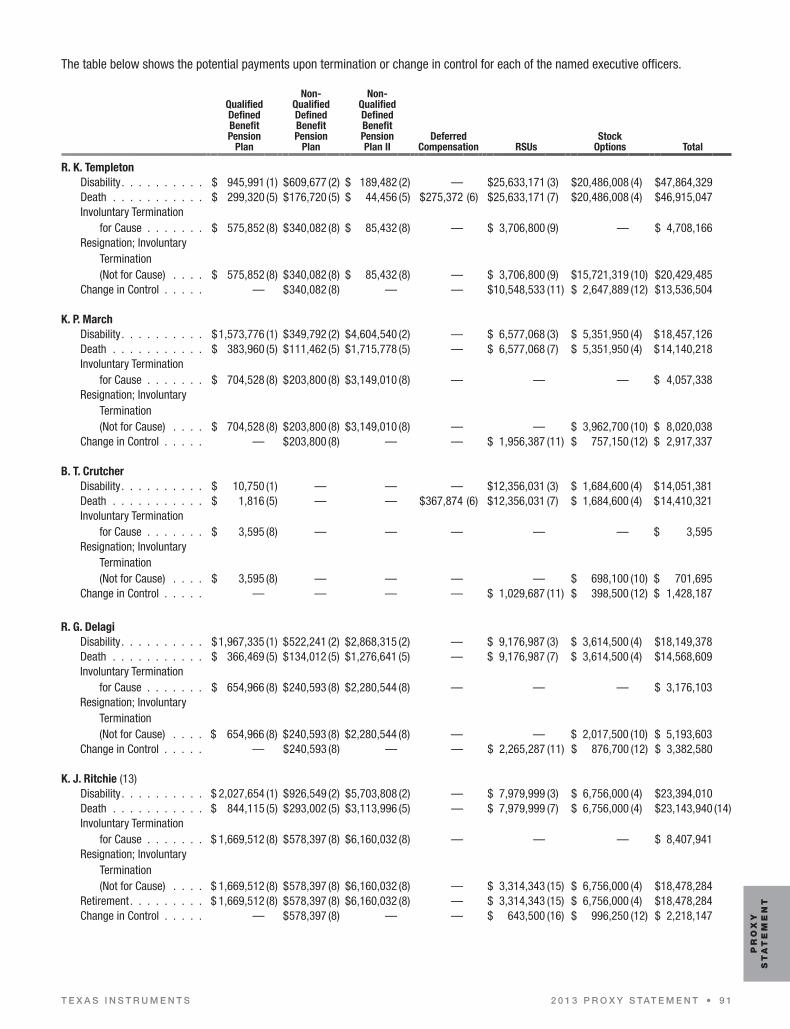
T E X A S I N S T R U M E N T S 2 0 1 3 P R O X Y S TAT E M E N T • 9 1
PR
OX
Y
ST
AT
EM
EN
T
Thetablebelowshowsthepotentialpaymentsuponterminationorchangeincontrolforeachofthenamedexecutiveofficers.
Qualified Defined Benefit Pension
Plan
Non- Qualified Defined Benefit Pension
Plan
Non- Qualified Defined Benefit Pension Plan II
Deferred Compensation RSUs
Stock Options Total
R. K. TempletonDisability . . . . . . . . . . $ 945,991 (1) $609,677 (2) $ 189,482 (2) — $25,633,171 (3) $20,486,008 (4) $47,864,329Death . . . . . . . . . . . $ 299,320 (5) $176,720 (5) $ 44,456 (5) $275,372 (6) $25,633,171 (7) $20,486,008 (4) $46,915,047Involuntary Termination
for Cause . . . . . . . $ 575,852 (8) $340,082 (8) $ 85,432 (8) — $ 3,706,800 (9) — $ 4,708,166Resignation;Involuntary
Termination (Not for Cause) . . . . $ 575,852 (8) $340,082 (8) $ 85,432 (8) — $ 3,706,800 (9) $15,721,319 (10) $20,429,485
Change in Control . . . . . — $340,082 (8) — — $10,548,533 (11) $ 2,647,889 (12) $13,536,504
K. P. MarchDisability . . . . . . . . . . $1,573,776 (1) $349,792 (2) $4,604,540 (2) — $ 6,577,068 (3) $ 5,351,950 (4) $18,457,126Death . . . . . . . . . . . $ 383,960 (5) $111,462 (5) $1,715,778 (5) — $ 6,577,068 (7) $ 5,351,950 (4) $14,140,218Involuntary Termination
for Cause . . . . . . . $ 704,528 (8) $203,800 (8) $3,149,010 (8) — — — $ 4,057,338Resignation;Involuntary
Termination (Not for Cause) . . . . $ 704,528 (8) $203,800 (8) $3,149,010 (8) — — $ 3,962,700 (10) $ 8,020,038
Change in Control . . . . . — $203,800 (8) — — $ 1,956,387 (11) $ 757,150 (12) $ 2,917,337
B. T. CrutcherDisability . . . . . . . . . . $ 10,750 (1) — — — $12,356,031 (3) $ 1,684,600 (4) $14,051,381Death . . . . . . . . . . . $ 1,816 (5) — — $367,874 (6) $12,356,031 (7) $ 1,684,600 (4) $14,410,321Involuntary Termination
for Cause . . . . . . . $ 3,595 (8) — — — — — $ 3,595Resignation;Involuntary
Termination (Not for Cause) . . . . $ 3,595 (8) — — — — $ 698,100 (10) $ 701,695
Change in Control . . . . . — — — — $ 1,029,687 (11) $ 398,500 (12) $ 1,428,187
R. G. DelagiDisability . . . . . . . . . . $1,967,335 (1) $522,241 (2) $2,868,315 (2) — $ 9,176,987 (3) $ 3,614,500 (4) $18,149,378Death . . . . . . . . . . . $ 366,469 (5) $134,012 (5) $1,276,641 (5) — $ 9,176,987 (7) $ 3,614,500 (4) $14,568,609Involuntary Termination
for Cause . . . . . . . $ 654,966 (8) $240,593 (8) $2,280,544 (8) — — — $ 3,176,103Resignation;Involuntary
Termination (Not for Cause) . . . . $ 654,966 (8) $240,593 (8) $2,280,544 (8) — — $ 2,017,500 (10) $ 5,193,603
Change in Control . . . . . — $240,593 (8) — — $ 2,265,287 (11) $ 876,700 (12) $ 3,382,580
K. J. Ritchie (13)Disability . . . . . . . . . . $ 2,027,654 (1) $926,549 (2) $5,703,808 (2) — $ 7,979,999 (3) $ 6,756,000 (4) $23,394,010Death . . . . . . . . . . . $ 844,115 (5) $293,002 (5) $3,113,996 (5) — $ 7,979,999 (7) $ 6,756,000 (4) $23,143,940 (14)Involuntary Termination
for Cause . . . . . . . $ 1,669,512 (8) $578,397 (8) $6,160,032 (8) — — — $ 8,407,941Resignation;Involuntary
Termination (Not for Cause) . . . . $ 1,669,512 (8) $578,397 (8) $6,160,032 (8) — $ 3,314,343 (15) $ 6,756,000 (4) $18,478,284
Retirement . . . . . . . . . $ 1,669,512 (8) $578,397 (8) $6,160,032 (8) — $ 3,314,343 (15) $ 6,756,000 (4) $18,478,284Change in Control . . . . . — $578,397 (8) — — $ 643,500 (16) $ 996,250 (12) $ 2,218,147

T E X A S I N S T R U M E N T S92 • 2 0 1 3 P R O X Y S TAT E M E N T
PR
OX
Y
ST
AT
EM
EN
T
(1) Theamountshownisthelump-sumbenefitpayableatage65tothenamedexecutiveofficerintheeventofterminationasofDecember31,2012,duetodisability,assumingthenamedexecutiveofficerdoesnotrequestpaymentofhisdisabilitybenefituntilage 65. The assumptions used in calculating these amounts are the same as the age-65 lump-sum assumptions used for financial reportingpurposesforthecompany’sauditedfinancialstatementsfor2012andaredescribedinnote5tothe2012pensionbenefitstableonpage87.
(2) Theamountshownisthelump-sumbenefitpayableatage65,inthecaseoftheNon-QualifiedDefinedBenefitPensionPlan, or separationfromserviceinthecaseofPlanII.Theassumptionsusedarethesameasthosedescribedinnote1above.
(3) CalculatedbymultiplyingthenumberofoutstandingRSUsbytheclosingpriceofTIcommonstockasofDecember31,2012($30.89).BecausetheexecutiveofficerwillretainhisRSUawardsintheeventofterminationduetodisabilityandtheywillcontinuetovestaccordingtotheirterms,alloutstandingRSUsareassumedtobevested.PleaseseetheOutstandingEquityAwardsatFiscalYear-End2012tableonpages83-84forthenumberofunvestedRSUsasofDecember31,2012,andpage86 for a discussion of anadditionaloutstandingRSUawardheldbyMr.Templeton.
(4) Calculatedasthedifferencebetweenthegrantpriceofalloutstandingin-the-moneyoptionsandtheclosingpriceofTIcommonstockasofDecember31,2012($30.89),multipliedbythenumberofsharesundersuchoptionsasofDecember31,2012.
(5) Valueofthebenefitpayableinalumpsumtotheexecutiveofficer’sbeneficiarycalculatedasrequiredbythetermsoftheplanassumingtheearliestpossiblepaymentdate.Theplanprovidesthatintheeventofdeath,thebeneficiaryreceives50percentoftheparticipant’saccruedbenefit,reducedbytheage-applicablejointand50percentsurvivorfactor.
(6) BalanceasofDecember31,2012,underthenon-qualified deferred compensation plan.
(7) CalculatedbymultiplyingthenumberofoutstandingRSUsbytheclosingpriceofTIcommonstockasofDecember31,2012($30.89).AlloutstandingRSUsareassumedtobevested.PleaseseetheOutstandingEquityAwardsatFiscalYear-End2012tableon pages 83-84forthenumberofunvestedRSUsasofDecember31,2012,andseepage86 for a discussion of an additional outstandingRSUawardheldbyMr.Templeton.
(8) Lump-sum value of the accruedbenefitasofDecember31,2012,calculatedasrequiredbythetermsoftheplansassumingtheearliestpossiblepaymentdate.
(9) Calculatedbymultiplying120,000vestedRSUsbytheclosingpriceofTI commonstockasofDecember31,2012($30.89). See page 86 forfurtherinformationaboutthisaward.
(10)Calculatedasthedifferencebetweenthegrantpriceofallexercisablein-the-moneyoptionsandtheclosingpriceofTIcommonstockasofDecember31,2012($30.89),multipliedbythenumberofsharesundersuchoptionsasofDecember31,2012.
(11)CalculatedbymultiplyingthenumberofRSUsgrantedpriorto2010bytheclosingpriceofTI commonstockasofDecember31,2012($30.89).
(12) Upon a change in control meeting the pre-2010 definition (please see page 85), all outstanding options granted prior to 2010 becomeimmediatelyexercisable.Calculatedasthedifferencebetweenthegrantpriceofin-the-moneyoptionsnotalreadyexercisableandtheclosingpriceofTI commonstockasofDecember31,2012($30.89),multipliedbythenumberofthoseoptionsasofDecember31,2012.
(13)Mr.RitchiewastheonlynamedexecutiveofficereligibletoretireasofDecember31,2012.
(14)BecauseMr.Ritchiewasretirementeligible,thetotalincludesthevalueofthebenefitpayableinalumpsum($4,156,828)undertheSurvivorBenefitPlantoMr.Ritchie’sbeneficiarycalculatedasrequiredbythetermsoftheplanassumingtheearliestpossiblepayment date.
(15)BecauseMr.Ritchiewasretirementeligible,calculatedbymultiplyingthenumberofoutstandingRSUsheldbyMr.RitchieatsuchterminationbytheclosingpriceofTIcommonstockasofDecember31,2012($30.89).HisRSUgrantsstayineffectandpayoutsharesaccordingtothevestingschedule,althoughthenumberofsharesisreducedaccordingtothedurationofemploymentoverthe vesting period. See page 85 for additional details.
(16)Calculatedbymultiplying25 percent ofthenumberofsharesunderMr.Ritchie’soutstandingpre-2010award(becausehewasretirementeligible,theother75 percentwaspayableattheregularlyscheduledvestingdateevenwithouttheeffectofachangeincontrol)bytheclosingpriceofTIcommonstockasofDecember31,2012($30.89).

T E X A S I N S T R U M E N T S 2 0 1 3 P R O X Y S TAT E M E N T • 9 3
PR
OX
Y
ST
AT
EM
EN
T
Audit Committee report
TheAuditCommitteeoftheboardofdirectorshasfurnishedthefollowingreport:Asnotedinthecommittee’scharter,TImanagementisresponsibleforpreparingthecompany’sfinancialstatements.Thecompany’s
independentregisteredpublicaccountingfirmisresponsibleforauditingthefinancialstatements.Theactivitiesofthecommitteeareinnowaydesignedtosupersedeoralterthosetraditionalresponsibilities.Thecommittee’sroledoesnotprovideanyspecialassuranceswithregardtoTI’sfinancialstatements,nordoesitinvolveaprofessionalevaluationofthequalityoftheauditsperformedbytheindependentregisteredpublicaccountingfirm.
The committee has reviewed and discussed with management and the independent accounting firm, as appropriate, (1) the audited financialstatementsand(2)management’sreportoninternalcontroloverfinancialreportingandtheindependentaccountingfirm’srelated opinions.
Thecommitteehasdiscussedwiththeindependentregisteredpublicaccountingfirm,Ernst&Young,therequiredcommunicationsspecifiedbyauditingstandardstogetherwithguidelinesestablishedbytheSECandtheSarbanes-OxleyAct.
ThecommitteehasreceivedthewrittendisclosuresandtheletterfromtheindependentregisteredpublicaccountingfirmrequiredbytheapplicablerequirementsofthePublicCompanyAccountingOversightBoard,regardingtheindependentregisteredpublicaccountingfirm’scommunicationswiththeAuditCommitteeconcerningindependence,andhasdiscussedwithErnst&Youngthefirm’sindependence.
Basedonthereviewanddiscussionsreferredtoabove,thecommitteerecommendedtotheboardofdirectorsthattheauditedfinancialstatementsbeincludedinthecompany’sannual reportonForm10-Kfor2012forfilingwiththeSEC.
PamelaH.Patsley,Chair RalphW.Babb,Jr. RobertE.Sanchez
Proposal to ratify appointment of independent registered public accounting firm
TheAuditCommitteeoftheboardhasappointedErnst&YoungLLPtobeTI’sindependentregisteredpublicaccountingfirmfor2013.TheboardasksthestockholderstoratifytheappointmentofErnst&Young.Ifthestockholdersdonotratifytheappointment,the
AuditCommitteewillconsiderwhetheritshouldappointanotherindependentregisteredpublicaccountingfirm.RepresentativesofErnst&Youngareexpectedtobepresent,andtobeavailabletorespondtoappropriatequestions,attheannual
meeting.Theyhavetheopportunitytomakeastatementiftheydesiretodoso;theyhaveindicatedthat,asofthisdate,theydonot.ThecompanyhaspaidfeestoErnst&Youngfortheservicesdescribedbelow:
Audit fees.Ernst&Young’sAuditFeeswere$8,384,000in2012and$8,435,000in2011.Theservicesprovidedinexchangeforthesefeeswereourannualaudit,includingtheauditofinternalcontroloverfinancialreporting,reportsonForm10-Q,assistancewithpublicdebtofferings,andstatutoryauditsrequiredinternationally.
Audit-related fees.InadditiontotheAuditFees,thecompanypaidErnst&Young$761,000in2012and$846,000in2011.Theservicesprovidedinexchangeforthesefeesincludedacquisitionduediligenceandrelatedprocedures,employeebenefitplanaudits,financialreportingsystemaccesstesting,accesstoErnst&Young’sonlineresearchtooland,forvariousnon-U.S.subsidiaries,auditsrelatingtocompliance with local-government standards.
Tax fees.Ernst&Young’sfeesforprofessionalservicesrenderedfortaxcompliance(preparationandreviewofincometaxreturnsandother tax-related filings), tax advice on U.S. and foreign tax matters, and tax assistance related to acquisitions were $4,380,000 in 2012 and $1,371,000 in 2011.
All other fees.Ernst&Young’sfeesforallotherprofessionalservicesrenderedwere$635,000in2012and$323,000in2011forassistancewithinsuranceclaims,theTIFoundationaudit,andtraining.
Pre-approvalpolicy.TheAuditCommitteeisrequiredtopre-approvetheauditandnon-auditservicestobeperformedbytheindependentregisteredpublicaccountingfirminordertoassurethattheprovisionofsuchservicesdoesnotimpairthefirm’sindependence.
AnnuallytheindependentregisteredpublicaccountingfirmandthedirectorofinternalauditspresenttotheAuditCommitteeservicesexpectedtobeperformedbythefirmoverthenext12months.TheAuditCommitteereviewsand,asitdeemsappropriate,pre-approves those services. The services and estimated fees are presented to the Audit Committee for consideration in the following categories: Audit, Audit-related, Tax and All other(eachasdefinedinSchedule14AoftheSecuritiesExchangeAct).Foreachservicelistedinthosecategories,theCommitteereceivesdetaileddocumentationindicatingthespecificservicestobeprovided.Thetermof any pre-approval is 12 months from the date of pre-approval, unless the Audit Committee specifically provides for a different period.TheAuditCommitteereviewsonatleastaquarterlybasistheservicesprovidedtodatebythefirmandthefeesincurred

T E X A S I N S T R U M E N T S94 • 2 0 1 3 P R O X Y S TAT E M E N T
PR
OX
Y
ST
AT
EM
EN
T
forthoseservices.TheAuditCommitteemayrevisethelistofpre-approvedservicesandrelatedfeesfromtimetotime,basedonsubsequentdeterminations.
Inordertorespondtotime-sensitiverequestsforservicesthatmayarisebetweenregularlyscheduledmeetingsoftheAuditCommittee, the Committee has delegated pre-approval authority to its Chair (the Audit Committee does not delegate to management its responsibilitiestopre-approveservices).TheChairreportspre-approvaldecisionstotheAuditCommitteeandseeksratificationofsuchdecisionsattheAuditCommittee’snextscheduledmeeting.
TheAuditCommitteeoritsChairpre-approvedallservicesprovidedbyErnst&Youngduring2012.
The board of directors recommends a vote FOR ratification of the appointment of Ernst & Young LLP as the company’s independent registered public accounting firm for 2013.
Additional information
Voting securities
AsofFebruary19,2013,1,106,586,604 shares of TI common stock were outstanding. This is the only class of capital stock entitled to vote atthemeeting.Eachholderofcommonstockhasonevoteforeachshareheld.Asstatedinthenoticeofannualmeeting,holdersofrecordofthecommonstockatthecloseofbusinessonFebruary19,2013,mayvoteatthemeetingoranyadjournmentofthemeeting.
Security ownership of certain beneficial owners
Thefollowingtableshowstheonlypersonswhohavereportedbeneficialownershipofmorethan5percentofthecommonstockofthecompany.Personsgenerally“beneficiallyown”sharesiftheyhavetherighttoeithervotethosesharesordisposeofthem.Morethanonepersonmaybeconsideredtobeneficiallyownthesameshares.
Name and AddressShares Owned at
December 31, 2012Percentof Class
CapitalWorldInvestors(1)333SouthHopeStreetLosAngeles,CA90071 . . . . . . . . . . . . . . . . . . . . . . . . . . . . . . . . . . . . . . . . . 116,618,462 (2) 10.40%
Capital ResearchGlobalInvestors (1)333SouthHopeStreetLosAngeles,CA90071 . . . . . . . . . . . . . . . . . . . . . . . . . . . . . . . . . . . . . . . . . 67,962,000 (3) 6.10%
BlackRock, Inc.40East52ndStreetNew York, NY 10022 . . . . . . . . . . . . . . . . . . . . . . . . . . . . . . . . . . . . . . . . . . . 61,637,232 (4) 5.50%
PRIMECAPManagementCompany225SouthLakeAve., # 400Pasadena,CA91101 . . . . . . . . . . . . . . . . . . . . . . . . . . . . . . . . . . . . . . . . . . . 57,763,753 (5) 5.15%
(1) A division of Capital Research and Management Company (CRMC).
(2) TIunderstandsthatCapitalWorldInvestorsisdeemedtobethebeneficialownerofthesesharesasaresultofCRMCactingasaninvestmentadvisortovariousinvestmentcompanies.CapitalWorldInvestorshassolevotingpowerfor97,165,962 and sole dispositive power for 116,618,462 of these shares.
(3) TI understands that Capital Research GlobalInvestorsisdeemedtobethebeneficial owner of these shares as a result of CRMC acting as an investment advisor to various investment companies. Capital Research GlobalInvestorshassole dispositive power and sole voting power for these shares.
(4) TI understands that BlackRock, Inc. has sole dispositive power and sole voting power for these shares.
(5) TIunderstandsthatPRIMECAPManagementCompanyhassolevotingpowerfor14,737,028 and sole dispositive power for 57,763,753 of these shares.

T E X A S I N S T R U M E N T S 2 0 1 3 P R O X Y S TAT E M E N T • 9 5
PR
OX
Y
ST
AT
EM
EN
T
Security ownership of directors and management
ThefollowingtableshowsthebeneficialownershipofTIcommonstockbydirectors,thenamedexecutiveofficersandallexecutiveofficersanddirectorsasagroup.Eachdirectorandnamedexecutiveofficerhassolevotingpower(exceptforsharesobtainablewithin60days,sharessubjecttoRSUsandsharescreditedtodeferredcompensationaccountsasdetailedinthefootnotestothetable)andsoleinvestmentpowerwithrespecttothesharesowned.Thetableexcludessharesheldbyafamilymemberifadirectororexecutiveofficerhasdisclaimedbeneficialownership.NodirectororexecutiveofficerhaspledgedsharesofTIcommonstock.
NameShares Owned at
December 31, 2012Percent of Class
Directors (1)R.W.Babb,Jr. . . . . . . . . . . . . . . . . . . . . . . . . . . . . . . . . . . . . . . . . . . . . . . . 24,993 *M. A. Blinn . . . . . . . . . . . . . . . . . . . . . . . . . . . . . . . . . . . . . . . . . . . . . . . . . — *D. A. Carp . . . . . . . . . . . . . . . . . . . . . . . . . . . . . . . . . . . . . . . . . . . . . . . . . 138,083 *C. S. Cox . . . . . . . . . . . . . . . . . . . . . . . . . . . . . . . . . . . . . . . . . . . . . . . . . . 86,209 *P.H.Patsley . . . . . . . . . . . . . . . . . . . . . . . . . . . . . . . . . . . . . . . . . . . . . . . . 113,976 *R.E.Sanchez . . . . . . . . . . . . . . . . . . . . . . . . . . . . . . . . . . . . . . . . . . . . . . . 8,129 *W.R.Sanders . . . . . . . . . . . . . . . . . . . . . . . . . . . . . . . . . . . . . . . . . . . . . . . 91,671 *R. J. Simmons . . . . . . . . . . . . . . . . . . . . . . . . . . . . . . . . . . . . . . . . . . . . . . . 120,285 *R.K.Templeton . . . . . . . . . . . . . . . . . . . . . . . . . . . . . . . . . . . . . . . . . . . . . . 4,763,975 *C.T.Whitman . . . . . . . . . . . . . . . . . . . . . . . . . . . . . . . . . . . . . . . . . . . . . . . 105,590 * Management (2)K.P.March . . . . . . . . . . . . . . . . . . . . . . . . . . . . . . . . . . . . . . . . . . . . . . . . . 1,188,655 *B. T. Crutcher . . . . . . . . . . . . . . . . . . . . . . . . . . . . . . . . . . . . . . . . . . . . . . . 735,969 *R. G. Delagi . . . . . . . . . . . . . . . . . . . . . . . . . . . . . . . . . . . . . . . . . . . . . . . . . 728,451 *K.J.Ritchie . . . . . . . . . . . . . . . . . . . . . . . . . . . . . . . . . . . . . . . . . . . . . . . . 1,339,345 *
All executive officers and directors as a group (3) . . . . . . . . . . . . . . . . . . . . . . . . . . . . . 14,100,313 1.27%
* lessthan1percent
(1) Includedinthesharesownedshownaboveare:
Directors (a)
Shares Obtainable
within 60 Days
Shares Credited to
401(k) AccountRSUs
(in Shares) (b)
Shares Credited
to Deferred Compensation Accounts (c)
R.W.Babb,Jr. . . . . . . . . . . . . . . . . . . . . . . . . . . . 8,040 — 7,977 7,976D. A. Carp . . . . . . . . . . . . . . . . . . . . . . . . . . . . . 79,290 — 24,641 34,152C. S. Cox . . . . . . . . . . . . . . . . . . . . . . . . . . . . . . 64,290 — 17,977 803P.H.Patsley . . . . . . . . . . . . . . . . . . . . . . . . . . . . 64,290 — 12,977 31,709R.E.Sanchez . . . . . . . . . . . . . . . . . . . . . . . . . . . 3,039 — 5,090 —W.R.Sanders . . . . . . . . . . . . . . . . . . . . . . . . . . . 59,040 — 20,577 1,454R. J. Simmons . . . . . . . . . . . . . . . . . . . . . . . . . . . 79,290 — 23,977 17,018R.K.Templeton . . . . . . . . . . . . . . . . . . . . . . . . . . 3,503,422 12,266 829,821 —C.T.Whitman . . . . . . . . . . . . . . . . . . . . . . . . . . . 79,290 — 17,977 7,323
(a) Mr.BlinnwaselectedtotheboardeffectiveFebruary21,2013.Onthatdatehewasgranted2,000RSUs pursuant to the 2009DirectorCompensationPlan.Foradiscussionofthatplan,pleaseseepages64-65.
(b) Thenon-employeedirectors’RSUsgrantedbefore2007aresettledinTIcommon stockgenerallyuponthedirector’sterminationofserviceprovidedheorshehasservedatleasteightyearsorhasreachedthecompany’sretirementagefordirectors. RSUs granted after 2006 are settled in TI common stock generally upon the fourth anniversary of the grant date.
(c) Thesharesindeferredcompensationaccountsareissuedfollowingthedirector’sterminationofservice.

T E X A S I N S T R U M E N T S96 • 2 0 1 3 P R O X Y S TAT E M E N T
PR
OX
Y
ST
AT
EM
EN
T
(2) Includedinthesharesownedshownaboveare:
Executive Officer
Shares Obtainable
within 60 Days
Shares Credited to
401(k) AccountRSUs
(in Shares)
K.P.March . . . . . . . . . . . . . . . . . . . . . . . . . . . . . . . . . . . . . 872,398 1,977 212,919B. T. Crutcher . . . . . . . . . . . . . . . . . . . . . . . . . . . . . . . . . . . 333,835 1,907 400,001R. G. Delagi . . . . . . . . . . . . . . . . . . . . . . . . . . . . . . . . . . . . 417,931 11,448 297,086K.J.Ritchie . . . . . . . . . . . . . . . . . . . . . . . . . . . . . . . . . . . . 1,065,625 8,601 258,336
(3) Includes:
(a) 9,901,788sharesobtainablewithin60days;
(b) 45,650sharescreditedto401(k)accounts;
(c) 3,466,177sharessubjecttoRSUawards;forthetermsoftheseRSUs,pleaseseepages65 and 85;and
(d) 100,435sharescreditedtocertainnon-employeedirectors’deferredcompensationaccounts;sharesindeferredcompensationaccountsareissuedfollowingadirector’sterminationofservice.
Related person transactions
Thecompanyhasnoreportablerelatedpersontransactions.BecausewebelievethatcompanytransactionswithdirectorsandexecutiveofficersofTIorwithpersonsrelatedtoTIdirectorsand
executive officers present a heightened risk of creating or appearing to create a conflict of interest, we have a written related person transactionpolicythathasbeenapprovedbytheboardofdirectors.ThepolicystatesthatTIdirectorsandexecutiveofficersshouldobtaintheapprovalsspecifiedbelowinconnectionwithanyrelatedpersontransaction.Thepolicyappliestotransactionsinwhich:
1. TIoranyTIsubsidiaryisorwillbeaparticipant;2. Theamountinvolvedexceedsorisexpectedtoexceed$100,000inafiscalyear;and3. Any of the following (a “related person”) has or will have a direct or indirect interest: (a) ATIdirectororexecutiveofficer,oranImmediateFamilyMemberofadirectororexecutiveofficer; (b) Astockholderowningmorethan5percentofthecommonstockofTIoranImmediateFamilyMemberofsuch
stockholder,or,ifthe5percentstockholderisnotanaturalperson,anypersonorentitydesignatedintheForm13Gor13DfiledundertheSECrulesandregulationsbythe5percentstockholderashavinganownershipinterestinTIstock(individuallyorcollectively,a“5percentholder”);or
(c) Anentityinwhichsomeonelistedin(a)or(b)abovehasa5percentorgreaterownershipinterest,bywhichsomeonelistedin(a)or(b)isemployed,orofwhichsomeonelistedin(a)or(b)isadirector,principalorpartner.
Forpurposesofthepolicy,an“ImmediateFamilyMember”isanychild,stepchild,parent,stepparent,spouse,sibling,mother-in-law,father-in-law,son-in-law,daughter-in-law,brother-in-law,sister-in-laworanyperson(otherthanatenantoremployee)sharingthehousehold of a TI director, executive officer or 5 percent holder.
Thepolicyspecifiesthatarelatedpersontransactionincludes,butisnotlimitedto,anyfinancialtransaction,arrangementorrelationship(includinganyindebtednessorguaranteeofindebtedness)oranyseriesofsimilartransactionsorarrangements.
The required approvals are as follows:
Arrangement involving: Approval required by:
ExecutiveofficerwhoisalsoamemberoftheTIboard,anImmediateFamilyMemberofsuchperson,oranentityinwhichanyoftheforegoinghas a 5 percent or greater ownership interest
G&SRCommittee
ChairoftheG&SRCommittee,chiefcomplianceofficer,anyofhisorherImmediateFamilyMembers,oranentityinwhichanyoftheforegoinghasa 5 percent or greater ownership interest
G&SRCommittee
Anyotherdirectororexecutiveofficer,anImmediateFamilyMemberofsuch person, or an entity in which any of the foregoing has a 5 percent or greater ownership interest
Chief compliance officer in consultation with the Chair of theG&SRCommittee
A 5 percent holder G&SRCommittee

T E X A S I N S T R U M E N T S 2 0 1 3 P R O X Y S TAT E M E N T • 9 7
PR
OX
Y
ST
AT
EM
EN
T
NomemberoftheG&SRCommitteewillparticipateintheconsiderationofarelatedpersonarrangementinwhichsuchmemberoranyofhisorherImmediateFamilyMembersistherelatedperson.
Theapprovingbodyorpersonswillconsideralloftherelevantfactsandcircumstancesavailabletothem,including(ifapplicable)butnotlimitedto:thebenefitstothecompanyofthearrangement;theimpactonadirector’sindependence;theavailabilityofothersourcesforcomparableproductsorservices;thetermsofthearrangement;andthetermsavailabletounrelatedthirdpartiesortoemployeesgenerally.TheprimaryconsiderationiswhetherthetransactionbetweenTIandtherelatedperson(a)wastheresultofundueinfluencefromtherelatedpersonor(b)couldadverselyinfluenceorappeartoadverselyinfluencethejudgment,decisionsoractionsofthedirectororexecutiveofficerinmeetingTIresponsibilitiesorcreateobligationstootherorganizationsthatmaycomeinconflictwithresponsibilitiestoTI.
Norelatedpersonarrangementwillbeapprovedunlessitisdeterminedtobein,ornotinconsistentwith,thebestinterestsofthecompanyanditsstockholders,astheapprovingbodyorpersonsshalldetermineingoodfaith.
The chief compliance officer will provide periodic reports to the committee on related person transactions. Any related person transactionbroughttotheattentionofthechiefcomplianceofficerorofwhichthechiefcomplianceofficerbecomesawarethatisnotapprovedpursuanttotheprocesssetforthaboveshallbeterminatedassoonaspracticable.
Compensation committee interlocks and insider participation
During 2012, Mses. Cox and Simmons and Messrs. MacMillan and Sanders served on the Compensation Committee. No committee member(i)wasanofficeroremployeeofTI,(ii)wasformerlyanofficerofTIor(iii)hadanyrelationshiprequiringdisclosureundertheSEC’srulesgoverningdisclosureofrelatedpersontransactions(Item404ofRegulationS-K).NoexecutiveofficerofTIservedasadirectorormemberofthecompensationcommitteeofanotherentity,oneofwhosedirectorsorexecutiveofficersservedasamemberofourboardofdirectorsoramemberoftheCompensationCommittee.
Cost of solicitation
Thesolicitationismadeonbehalfofourboardofdirectors.TIwillpaythecostofsolicitingtheseproxies.Wewillreimbursebrokeragehousesandothercustodians,nomineesandfiduciariesforreasonableexpensestheyincurinsendingtheseproxymaterialstoyouifyouareabeneficialholderofourshares.
Withoutreceivingadditionalcompensation,officialsandregularemployeesofTImaysolicitproxiespersonally,bytelephone,faxore-mail,fromsomestockholdersifproxiesarenotpromptlyreceived.WehavealsohiredGeorgesonInc.toassistinthesolicitationofproxies at a cost of $12,000 plus out-of-pocket expenses.
Stockholder proposals for 2014
IfyouwishtosubmitaproposalforpossibleinclusioninTI’s2014proxymaterial,wemustreceiveyournotice,inaccordancewiththerulesoftheSEC,onorbeforeNovember5,2013.Proposalsaretobesentto:TexasInstrumentsIncorporated,12500TIBoulevard,MS8658,Dallas,TX75243,Attn:Secretary.
Ifyouwishtosubmitaproposalatthe2014annualmeeting(butnotseekinclusionoftheproposalinthecompany’sproxymaterial),wemustreceiveyournotice,inaccordancewiththecompany’sby-laws,onorbeforeJanuary18,2014.
Allsuggestionsfromstockholdersconcerningthecompany’sbusinessarewelcomeandwillbecarefullyconsideredbyTI’smanagement.Toensurethatyoursuggestionsreceiveappropriatereview,theG&SRCommitteefromtimetotimereviewscorrespondencefromstockholdersandmanagement’sresponses.Stockholdersaretherebygivenaccessattheboardlevelwithouthavingtoresorttoformalstockholderproposals.Generally,theboardprefersyoupresentyourviewsinthismannerratherthanthroughtheprocessofformalstockholderproposals.Pleaseseepage60forinformationoncontactingtheboard.
Benefit plan voting
IfyouareaparticipantintheTIContributionand401(k)SavingsPlan,ortheTI401(k)SavingsPlan,youarea“namedfiduciary”undertheplansandareentitledtodirectthevotingofsharesallocabletoyouraccountsundertheseplans.Thetrusteeadministeringyourplan will vote your shares in accordance with your instructions. If you wish to instruct the trustee on the voting of shares held for your accounts,youshoulddosobyApril15,2013,inthemannerdescribedinthenoticeofannualmeeting.
Additionally, participants under the plans are designated as “named fiduciaries” for the purpose of voting TI stock held under the plansforwhichnovotingdirectionisreceived.TIsharesheldbytheTI401(k)savingsplansforwhichnovotinginstructionsarereceivedbyApril15,2013,willbevotedinthesameproportionsasthesharesintheplansforwhichvotinginstructionshavebeenreceivedbythat date.

T E X A S I N S T R U M E N T S98 • 2 0 1 3 P R O X Y S TAT E M E N T
PR
OX
Y
ST
AT
EM
EN
T
Section 16(a) beneficial ownership reporting compliance
Section16(a)oftheSecuritiesExchangeActrequirescertainpersons,includingthecompany’sdirectorsandexecutiveofficers,tofilereportswiththeSECregardingbeneficialownershipofcertainequitysecuritiesofthecompany.Thecompanybelievesthatduring2012,allreportsweretimelyfiledbyitsdirectorsandexecutiveofficers.
Telephone and Internet voting
Registeredstockholdersandbenefitplanparticipants.StockholderswithsharesregistereddirectlywithComputershare(TI’stransferagent)andparticipantswhobeneficiallyownsharesinaTIbenefitplanmayvotetelephonicallybycalling(800)690-6903(withintheU.S. and Canada only, toll-free) or via the Internet at www.proxyvote.com.
ThetelephoneandInternetvotingproceduresaredesignedtoauthenticatestockholders’identities,toallowstockholderstogivetheirvotinginstructionsandtoconfirmthatstockholders’instructionshavebeenrecordedproperly.TIhasbeenadvisedbycounselthatthetelephoneandInternetvotingprocedures,whichhavebeenmadeavailablethroughBroadridgeFinancial Solutions, Inc., are consistentwiththerequirementsofapplicablelaw.
Stockholderswithsharesregisteredinthenameofabrokeragefirmorbank.AnumberofbrokeragefirmsandbanksoffertelephoneandInternetvotingoptions.Theseprogramsmaydifferfromtheprogramprovidedtoregisteredstockholdersandbenefitplanparticipants.Checktheinformationforwardedbyyourbank,brokerorotherholderofrecordtoseewhichoptionsareavailabletoyou.
StockholdersvotingviatheInternetshouldunderstandthattheremaybecostsassociatedwithelectronicaccess,suchasusagechargesfromtelephonecompaniesandInternetaccessproviders,thatmustbebornebythestockholder.
Stockholders sharing the same address
Toreducetheexpensesofdeliveringduplicatematerials,wetakeadvantageoftheSEC’s“householding”ruleswhichpermitustodeliveronlyonesetofproxymaterials(oroneNoticeofInternetAvailabilityofProxyMaterials)tostockholderswhoshareanaddressunless otherwise requested. If you share an address with another stockholder and have received only one set of these materials, youmayrequestaseparatecopyatnocosttoyoubycallingInvestorRelationsat214-479-3773orbywritingtoTexasInstrumentsIncorporated,P.O.Box660199,MS8657,Dallas,TX75266-0199,Attn:InvestorRelations.Forfutureannualmeetings,youmayrequestseparatematerials,orrequestthatwesendonlyonesetofmaterialstoyouifyouarereceivingmultiplecopies,bycalling(800)542-1061orwritingtoInvestorRelationsattheaddressgivenabove.
Electronic delivery of proxy materials
As an alternative to receiving printed copies of these materials in future years, we are pleased to offer stockholders the opportunity to receive proxy mailings electronically. To request electronic delivery, please vote via the Internet at www.proxyvote.com and, when prompted, enroll to receive or access proxy materials electronically in future years. After the meeting date, stockholders holding sharesthroughabrokerorbankmayrequestelectronicdeliverybyvisitingwww.icsdelivery.com/tiandenteringinformationforeachaccountheldbyabankorbroker.Ifyouarearegisteredstockholderandwouldliketorequestelectronicdelivery,pleasevisitwww-us.computershare.com/investororcallTIInvestorRelationsat214-479-3773for more information. If you are a participant in a TI benefitplanandwouldliketorequestelectronicdelivery,pleasecallTIInvestorRelationsformoreinformation.
Important Notice Regarding the Availability of Proxy Materials for the Stockholder Meeting to be held on April 18, 2013. This 2013 proxy statement and the company’s 2012 annual report are accessible at: www.proxyvote.com.
Sincerely,
JosephF.HubachSeniorVicePresident,Secretary and General Counsel
March 5, 2013 Dallas, Texas

T E X A S I N S T R U M E N T S 2 0 1 3 P R O X Y S TAT E M E N T • 9 9
PR
OX
Y
ST
AT
EM
EN
T
Directions and other annual meeting information
Directions
From DFW airport: TaketheNorthAirportexittoIH-635E.TakeIH-635EtotheGreenvilleAvenueexit.Turnright(South)onGreenville.Turnright(West)onForestLane.TexasInstrumentswillbeonyourrightatthesecondtrafficlight.PleaseusetheNorthentrancetothebuilding.
From Love Field airport:TakeMockingbirdLaneEasttoUS-75N(CentralExpressway).TravelNorthon75NtotheForestLaneexit.Turnright(East)onForestLane.Youwillpasstwotrafficlights.Atthethirdlight,theentrancetoTexasInstrumentswillbeonyourleft.PleaseusetheNorthentrancetothebuilding.
ParkingTherewillbereservedparkingforallvisitorsattheNorthLobby.VisitorswithspecialneedsrequiringassistancewillbeaccommodatedattheSouthLobbyentrance.
SecurityPleasebeadvisedthatTI’ssecuritypolicyforbidsweapons,camerasandaudio/videorecordingdevicesinsideTIbuildings.Allbagswillbesubjecttosearchuponentryintothebuilding.

(This page intentionally left blank.)

DirectorsRichard K. TempletonChairman of the Board,President and Chief Executive Officer,Texas Instruments Incorporated
Ralph W. Babb, Jr.Chairman of the Board and Chief Executive Officer,Comerica Incorporated and Comerica Bank
Mark A. BlinnPresident and Chief Executive Officer,Flowserve Corporation
Daniel A. CarpRetired Chairman of the Board and Chief Executive Officer,Eastman Kodak Company
Carrie S. CoxChairman of the Board and Chief Executive Officer,Humacyte, Inc.
Pamela H. PatsleyChairman of the Board and Chief Executive Officer, MoneyGram International, Inc.
Robert E. SanchezPresident andChief Executive Officer,Ryder System, Inc.
Wayne R. SandersRetired Chairman of the Board and Chief Executive Officer,Kimberly-Clark Corporation
Ruth J. SimmonsPresident Emerita,Brown University
Christine Todd Whitman President, The WhitmanStrategy Group
Executive officersRichard K. TempletonChairman of the Board,President and Chief Executive Officer
Niels AnderskouvSenior Vice President
Stephen A. AndersonSenior Vice President
Brian T. CrutcherSenior Vice President
R. Gregory Delagi Senior Vice President
David K. HeacockSenior Vice President
Joseph F. HubachSenior Vice President, Secretary and General Counsel
Sami KiriakiSenior Vice President
Melendy E. LovettSenior Vice President; President, Education Technology
Kevin P. MarchSenior Vice President and Chief Financial Officer
Robert K. NovakSenior Vice President
Kevin J. RitchieSenior Vice President
John J. Szczsponik, Jr.Senior Vice President
Teresa L. WestSenior Vice President
Darla H. WhitakerSenior Vice President
TI Fellows are engineers, scientists or technologists who are recognized by peers and TI management for outstanding performance. Fellows are elected based on exceptional technical contributions that significantly contribute to TI’s shareholder value.
DLP, OMAP and the platform bar are trademarks of Texas Instruments. All other trademarks are the property of their respective owners.
TI Fellows announced in 2012:Andrew MarshallKrishnaswamy NagarajLuu NguyenLars RisboScott Summerfelt
Board of directors, executive officers
TI Fellows
Stockholder and other information
Stockholder records informationFirst-class, registered and certified mail:Computershare Trust Company, N.A. P. O. Box 43078Providence, RI 02940-3078
Overnight delivery:Computershare Trust Company, N.A. 250 Royall Street, Mail Stop 1ACanton, MA 02021
Toll free: 800-981-8676Phone: 781-575-2000
For general information:www.computershare.com/contactuswww-us.computershare.com
SEC Form 10-KStockholders may obtain a copy of the company’sannual report to the Securities and ExchangeCommission on Form 10-K (except for exhibits)and its audited financial statements withoutcharge by writing to:Investor RelationsP.O. Box 660199, MS 8657Dallas, TX 75266-0199
244816_TI_AR_CVR_R3.indd 3 2/21/13 9:12 AM

Texas Instruments Incorporated
P.O. Box 660199
Dallas, TX 75266-0199
www.ti.com
An equal opportunity employer
© 2013 Texas Instruments IncorporatedTI-30001N
244816_TI_AR_CVR_R3.indd 4 2/21/13 9:12 AM