11,940,133 Shares - Investor Relations - ServiceSource
176
Table of Contents Filed pursuant to Rule 424(b)(4) Registration No. 333-171271 PROSPECTUS 11,940,133 Shares COMMON STOCK ServiceSource International, Inc. is offering 8,000,000 shares of common stock and the selling stockholders are offering 3,940,133 shares of common stock. We will not receive any proceeds from the sale of shares by the selling stockholders. This is our initial public offering and no public market exists for our shares. Our common stock has been approved for listing on The Nasdaq Global Market under the symbol “SREV.” Investing in our common stock involves risks. See “ Risk Factors” beginning on page 10. PRICE $10.00 A SHARE Price to Public Underwriting Discounts and Commissions Proceeds to ServiceSource Proceeds to Selling Stockholders Per share $10.00 $0.70 $9.30 $9.30 Total $119,401,330 $8,358,093 $74,400,000 $36,643,237 We have granted the underwriters the right to purchase up to an additional 1,791,020 shares of common stock to cover over-allotments. The Securities and Exchange Commission and state securities regulators have not approved or disapproved these securities or determined if this prospectus is truthful or complete. Any representation to the contrary is a criminal offense. The underwriters expect to deliver the shares of common stock to purchasers on March 30, 2011. MORGAN STANLEY DEUTSCHE BANK SECURITIES WILLIAM BLAIR & COMPANY LAZARD CAPITAL MARKETS PIPER JAFFRAY JMP SECURITIES March 24, 2011
-
Upload
khangminh22 -
Category
Documents
-
view
0 -
download
0
Transcript of 11,940,133 Shares - Investor Relations - ServiceSource

Table of Contents
Filed pursuant to Rule 424(b)(4)Registration No. 333-171271
PROSPECTUS
11,940,133 Shares
COMMON STOCK
ServiceSource International, Inc. is offering 8,000,000 shares of common stock and the selling stockholders are offering 3,940,133 shares of common stock.We will not receive any proceeds from the sale of shares by the selling stockholders. This is our initial public offering and no public market exists for ourshares. Our common stock has been approved for listing on The Nasdaq Global Market under the symbol “SREV.” Investing in our common stock involves risks. See “Risk Factors” beginning on page 10.
PRICE $10.00 A SHARE
Price toPublic
UnderwritingDiscounts andCommissions
Proceeds toServiceSource
Proceeds toSelling Stockholders
Per share $10.00 $0.70 $9.30 $9.30Total $119,401,330 $8,358,093 $74,400,000 $36,643,237 We have granted the underwriters the right to purchase up to an additional 1,791,020 shares of common stock to cover over-allotments. The Securities and Exchange Commission and state securities regulators have not approved or disapproved these securities or determined if this prospectus istruthful or complete. Any representation to the contrary is a criminal offense. The underwriters expect to deliver the shares of common stock to purchasers on March 30, 2011. MORGAN STANLEY DEUTSCHE BANK SECURITIES WILLIAM BLAIR & COMPANY LAZARD CAPITAL MARKETS PIPER JAFFRAY
JMP SECURITIESMarch 24, 2011
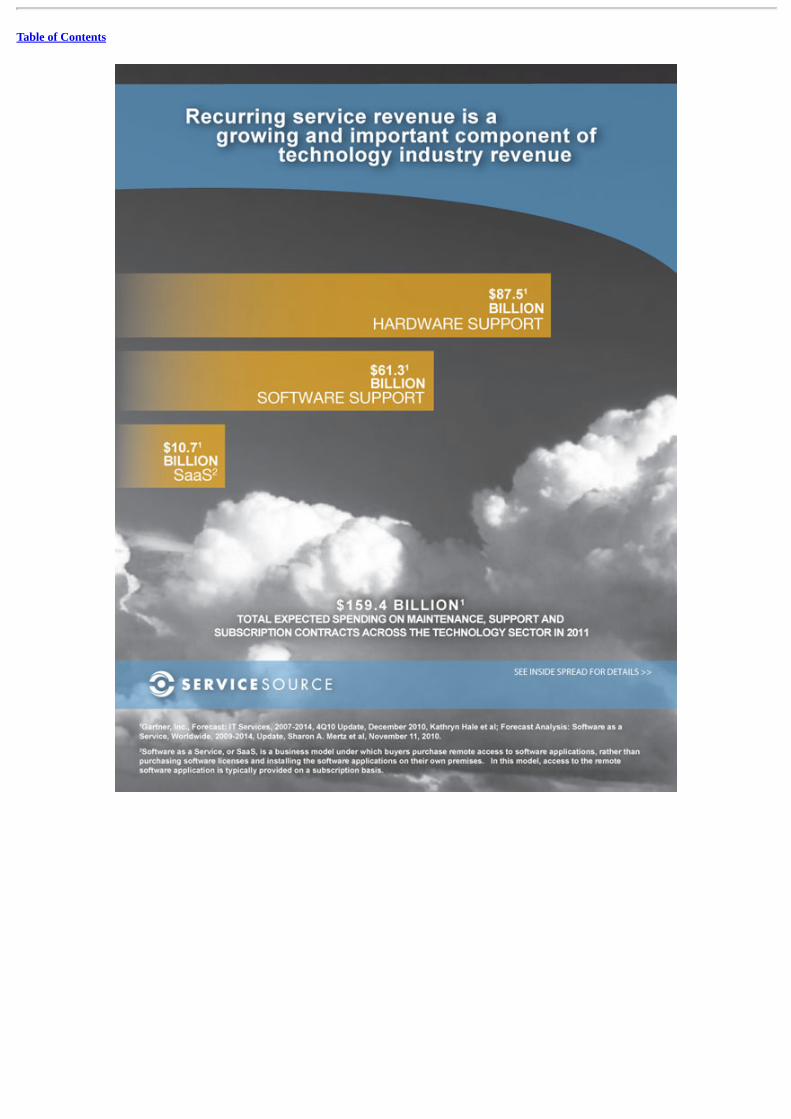
Table of Contents
SEE INSIDE SPREAD FOR DETAILS >>SaaS$10.7*BILLIONTOTAL EXPECTED SPENDING ON MAINTENANCE, SUPPORT ANDSUBSCRIPTION CONTRACTS ACROSS THE TECHNOLOGY SECTOR IN 2011$61.3*BILLIONHARDWARE SUPPORT$87.5*BILLIONSOFTWARE SUPPORT$159.4 BILLION*Recurring service revenue is agrowing and important component oftechnology industry revenue*Gartner, Inc., Forecast: IT Services, 2007-2014, 4Q10 Update, December 2010, Kathryn Hale et al; Forecast Analysis: Software as aService, Worldwide, 2009-2014, Update, Sharon A. Mertz et al, November 11, 2010.SERVICESOURCE

Table of Contents
OUR CUSTOMERSINCLUDE INDUSTRYLEADERS LIKE THESE:In fact, our customers include:5 of the top 5 Fortune 100 Technology-based Companies3 of the top 5 Global Enterprise Software Companies (1)5 of the top 5 Enterprise Network Storage Companies (2)2 of the top 3 Medical Device Companies (2)2 of the top 3 High-end Server OEMs (2)(1) Based on Top 100 Research Corporation,Enterprise Software Top 10.(2) Based on CRN 2010 Annual Report Card.WE MANAGE SERVICE ANDMAINTENANCE REVENUE STREAMSIN OVER 100 ENGAGEMENTSServiceSourceis the pioneer in this marketPay-for-performance model2 0 0 6 2 0 0 7 2 0 0 8 2 0 0 9 2 0 1 0We achieved 35% compounded annual revenue growth in the last _ve _scal years.REVENUE _IN MILLIONS_$ 4 5 . 9 $ 7 5 . 2 $ 1 0 0 . 3 $ 1 1 0 . 7 $ 1 5 2 . 9Agilent Technologies Blue Coat GE Helathcare Hitachi Data Systems Increased service revenueIncreased margin and profitabilityImproved end customer satisfactionGreater business insight and analyticsGreater visibility and forecasting toolsFOR CUSTOMERS, WE DELIVERMEANINGFUL BENEFITSLOOK INTO THE PROSPECTUS FOR DETAILS >>* Based on our analysis of customer renewal rates for new engagements added in 2009, we generated renewal rates on contracts deliveredto us in the first half of 2010 that on a dollar value basis increased by an average of over 15 percentage points over historicalcustomer renewal rates calculated in our Service Performance Analysis.Our pay-for-performance model meansno large upfront investment for cuomersCloud-based servicesOver 15 percentagepoint increase inrenewal rates*SERVICESOURCE
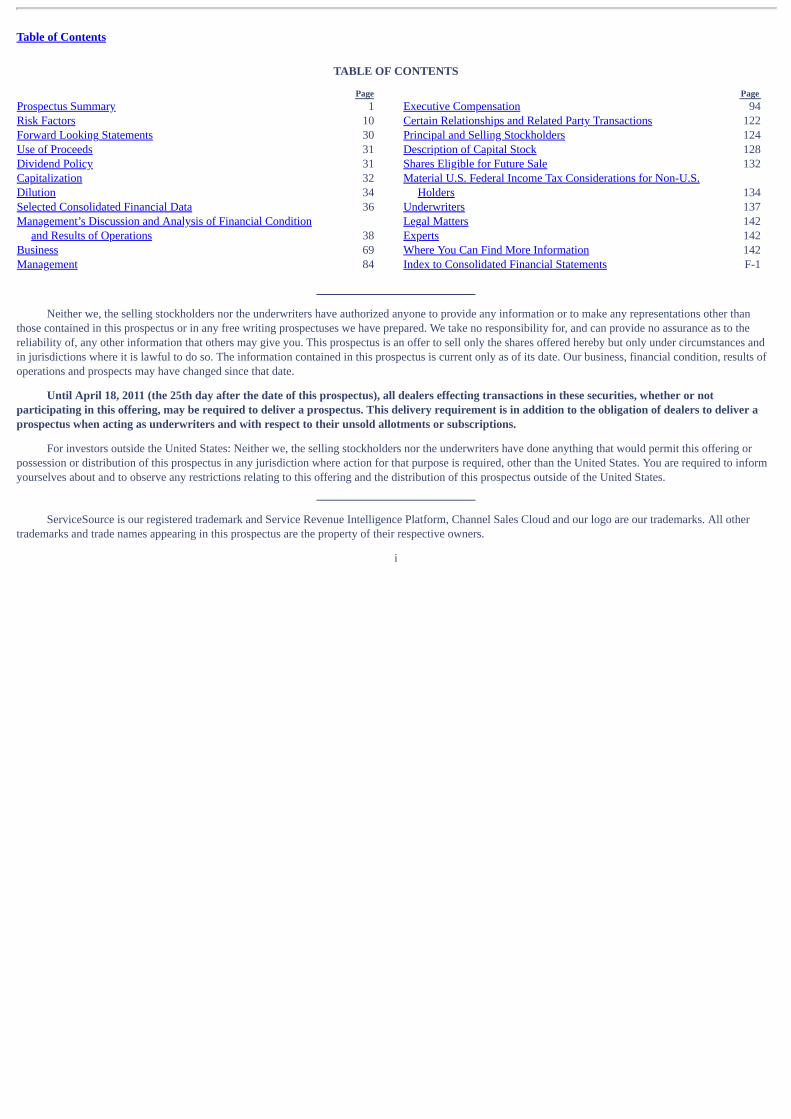
Table of Contents
TABLE OF CONTENTS
Neither we, the selling stockholders nor the underwriters have authorized anyone to provide any information or to make any representations other thanthose contained in this prospectus or in any free writing prospectuses we have prepared. We take no responsibility for, and can provide no assurance as to thereliability of, any other information that others may give you. This prospectus is an offer to sell only the shares offered hereby but only under circumstances andin jurisdictions where it is lawful to do so. The information contained in this prospectus is current only as of its date. Our business, financial condition, results ofoperations and prospects may have changed since that date.
Until April 18, 2011 (the 25th day after the date of this prospectus), all dealers effecting transactions in these securities, whether or notparticipating in this offering, may be required to deliver a prospectus. This delivery requirement is in addition to the obligation of dealers to deliver aprospectus when acting as underwriters and with respect to their unsold allotments or subscriptions.
For investors outside the United States: Neither we, the selling stockholders nor the underwriters have done anything that would permit this offering orpossession or distribution of this prospectus in any jurisdiction where action for that purpose is required, other than the United States. You are required to informyourselves about and to observe any restrictions relating to this offering and the distribution of this prospectus outside of the United States.
ServiceSource is our registered trademark and Service Revenue Intelligence Platform, Channel Sales Cloud and our logo are our trademarks. All othertrademarks and trade names appearing in this prospectus are the property of their respective owners.
i
Page Prospectus Summary 1 Risk Factors 10 Forward Looking Statements 30 Use of Proceeds 31 Dividend Policy 31 Capitalization 32 Dilution 34 Selected Consolidated Financial Data 36 Management’s Discussion and Analysis of Financial Condition
and Results of Operations 38 Business 69 Management 84
Page Executive Compensation 94 Certain Relationships and Related Party Transactions 122 Principal and Selling Stockholders 124 Description of Capital Stock 128 Shares Eligible for Future Sale 132 Material U.S. Federal Income Tax Considerations for Non-U.S.
Holders 134 Underwriters 137 Legal Matters 142 Experts 142 Where You Can Find More Information 142 Index to Consolidated Financial Statements F-1

Table of Contents
PROSPECTUS SUMMARY This summary highlights information contained elsewhere in this prospectus and does not contain all of the information you should consider in makingyour investment decision. Before deciding to invest in shares of our common stock, you should read this summary together with the more detailedinformation, including our consolidated financial statements and the related notes, elsewhere in this prospectus. You should carefully consider, among otherthings, the matters discussed in “Risk Factors,” our consolidated financial statements and related notes, and “Management’s Discussion and Analysis ofFinancial Condition and Results of Operations,” in each case included elsewhere in this prospectus.
Except where the context otherwise requires or where otherwise indicated, the terms “ServiceSource,” “we,” “us,” “our,” “our company” and “ourbusiness” refer to ServiceSource International, Inc., together with its consolidated subsidiaries as a combined entity.
SERVICESOURCE INTERNATIONAL, INC. Overview ServiceSource is a leader in service revenue management, providing solutions that drive increased renewals of maintenance, support and subscriptionagreements for technology companies. Our integrated solution consists of a suite of cloud applications, dedicated service sales teams working under ourcustomers’ brands and a proprietary Service Revenue Intelligence Platform. By integrating software, managed services and data, we provide end-to-endmanagement and optimization of the service contract renewals process, including data management, quoting, selling and service revenue businessintelligence. Our business is built on our pay-for-performance model, whereby customers pay us based on renewal sales that we generate on their behalf. Asof December 31, 2010, we managed over 100 engagements across more than 55 customers, representing over $5 billion in service revenue opportunity undermanagement. During the years ended December 31, 2008, 2009 and 2010, the actual value of qualified end customer contracts delivered to us totaled $1.9billion, $2.8 billion and $3.7 billion, respectively.
According to Gartner, total spending on maintenance and support agreements as well as software-as-a-service/subscription contracts across thetechnology sector is expected to total $159 billion in 2011. We define service revenue as the revenue companies earn from the sale of maintenance andsupport agreements, as well as subscription contracts. Service revenue has become increasingly important for technology companies as it represents asignificant and growing portion of total revenue, drives margin expansion and incremental profitability, can be highly recurring and correlates with endcustomer satisfaction. However, we believe the complexity of effective service revenue management, coupled with underinvestment in this area has led tosuboptimal renewal rates on service contracts. Many technology companies lack the resources needed to maximize service revenue performance. Theseresources include enterprise systems and applications built specifically for service revenue data management as well as global service sales teams with theexpertise to sell service contracts directly and through channel partners.
The foundation of our solution is our proprietary Service Revenue Intelligence Platform, a data warehouse that incorporates transactional, analyticaland industry data gathered from over two million service renewal transactions since our inception. The data housed within this platform fuels ourapplications, enables our service sales teams to improve service revenue performance, and allows us to provide analytical insights that we believe other third-party or internally-developed alternatives do not provide. Our suite of cloud applications increases visibility and control of service revenue management andis utilized by customers, channel partners, end
Gartner, Inc., Forecast: IT Services, 2007-2014, 4Q10 Update, December 2010, Kathryn Hale et al; Forecast Analysis: Software as a Service, Worldwide, 2009-2014, Update, Sharon A. Mertz et al,November 11, 2010.
1
1
1

Table of Contents
customers and our service sales teams. Our dedicated service sales teams have specific expertise in our customers’ businesses, are deployed under ourcustomers’ brands and follow a sales process tailored specifically to increase service contract renewals. Taken together, these elements of our solution helpus increase our customers’ service revenue, drive their profitability and improve end customer satisfaction. Based on our analysis of customer renewal ratesfor new engagements added in 2009, we generated renewal rates on contracts delivered to us in the first half of 2010 that on a dollar value basis increased byan average of over 15 percentage points over historical customer renewal rates calculated in our Service Performance Analysis (“SPA”).
Our total revenue was $100.3 million, $110.7 million and $152.9 million for the years ended December 31, 2008, 2009 and 2010 respectively. We hadapproximately 60, 80 and 100 engagements as of December 31, 2008, 2009 and 2010 respectively. In 2010, Oracle acquired our then-largest customer, SunMicrosystems, and terminated our contract with Sun Microsystems effective as of September 30, 2010. Sun Microsystems accounted for $22.8 million, $26.3million and $19.6 million, or 23%, 24% and 13%, of our total revenue for the years ended December 31, 2008, 2009 and 2010, respectively. Our Solution We have developed an end-to-end solution to increase service revenue performance for our customers. The components of our integrated solutionconsist of a suite of cloud applications, dedicated service sales teams and our proprietary Service Revenue Intelligence Platform. We deploy our solutionthrough offerings that are tailored either to address specific challenges of the renewals process or to provide end-to-end management of this process. Ourhighly scalable solution allows us to sell globally on behalf of our customers in over 30 languages. It is designed to provide effective service revenuemanagement irrespective of revenue models, distribution models, and segments within the technology and technology-enabled healthcare and life sciencesindustries, including hardware, software and software-as-a-service.
Key benefits of our solution include:
Financial Benefits
• Increased service revenue. Our solution is designed to increase customers’ service revenues. We actively monitor the service contract renewal
rates we drive on behalf of our customers in each engagement. When we generate higher renewal rates, we drive incremental service revenue forboth the associated period as well as for subsequent periods due to the recurring nature of service contracts.
• Increased margin and profitability. We believe that the costs associated with delivering maintenance, support and subscription services by many
of our customers can be relatively fixed, and thus growth of service revenue can benefit our customers’ bottom line. As a result, eachincremental dollar of service revenue generated by our solution can drive greater profitability for our customers.
Operational Benefits
• Improved end customer satisfaction. Our regular dialogue with end customers allows us to communicate the value of our customers’maintenance, support and subscription services, and capture and address questions and concerns about our customers’ products.
• Greater business insight and analytics. Our Service Revenue Intelligence Platform allows us to analyze our customers’ renewals against similartransactions and to identify areas for improvement, enabling greater insight into their renewals business. By tracking transactions in ourintelligence platform, we are able to provide benchmarking, end customer metrics, sales efficiency data and insight into successful andunsuccessful renewal efforts. The breadth of our data allows us to provide analysis across regions, industries, channel partners and productsegments.
2

Table of Contents
• Greater visibility and forecasting tools. Our cloud applications deliver real-time analytics and visibility into a customer’s service revenue
performance, sales efficiency and forecasts. CFOs and other executives utilize our cloud applications to assist in forecasting their company’sservice revenue and to measure progress against their forecasts on a real-time basis.
• Strengthened channel loyalty. Our Channel Sales Cloud application and service sales teams empower our customers’ channel partners to
generate higher service sales by providing accurate, real-time data on their renewal opportunities and performance as well as tools to sell moreeffectively to end customers. These cloud applications help our customers develop a closer relationship with their channel partners.
• Global consistency. We maintain a globally consistent renewals process for our customers as we leverage a unified intelligence platform. Oursolution automates the application of best practices to the renewals process and provides a consistent view of the data.
Our Competitive Advantages We believe our business is difficult to replicate, as it incorporates a combination of several important and differentiated elements, including:
• Proprietary Service Revenue Intelligence Platform. Our proprietary Service Revenue Intelligence Platform aggregates transactional, analyticaland industry data from over two million service renewal transactions. This intelligence platform allows us to improve service revenueperformance for each customer’s unique business, enabling us to increase the effectiveness and accuracy of our SPA, the pricing and scoping ofour solutions and customer benchmarking. We continue to enhance our intelligence platform with each renewal transaction.
• Pay-for-performance business model. With our pay-for-perfomance business model, customers pay us based on the renewal sales that wegenerate on their behalf, with little or no upfront customer investment. This business model directly aligns our interests with our customers’interests to drive greater service revenue. Our Service Revenue Intelligence Platform is the critical element that allows us to price effectively ona pay-for-performance basis.
• Industry leadership. Our industry leadership, based on our nearly decade-long history, enables us to innovate best practices, continue to enhanceour intelligence platform and attract new customers.
• Service revenue focused solution. Our entire solution, combining software, managed services and data, is built from the ground up to deliverindustry-leading service revenue performance across the key elements of the renewals process.
• Renewal sales methodology. Our service sales teams leverage our intelligence platform, sales processes and best practices to manage the end
customer relationship and enhance service contract renewal rates. We engage in extensive ongoing training of our service sales teams to ensureconsistency of execution across our entire organization.
• Global scale and expertise. Our service sales teams sell in over 30 languages from six sales centers around the globe, enabling them to deliverlocalized capabilities to better serve the increasingly global nature of our customers’ businesses.
3

Table of Contents
Our Strategy We intend to continue our industry leadership in service revenue management. The key elements of our strategy include: • expanding our customer base within existing industry verticals; • continuing to build, deploy and increase the revenue we generate from our cloud applications; • increasing our footprint with existing customers to drive greater revenue per customer; • increasing our operating efficiency by developing additional technology; and • adding new customers from additional industry verticals and geographic markets. Selected Risk Factors Investing in our common stock involves risks. You should carefully read “Risk Factors” beginning on page 10 for an explanation of these risks beforeinvesting in our common stock. In particular, the following considerations, among others, may offset our competitive strengths or have a negative effect onour growth strategy, which could cause a decline in the price of our common stock and result in a loss of all or a portion of your investment: • our quarterly results of operations may fluctuate as a result of numerous factors, many of which may be outside of our control; • the market for our solution is relatively undeveloped and may not grow; • our estimates of service revenue opportunity under management and our analysis of renewal rates and other metrics may prove inaccurate;
• if close rates fall short of our predictions, our revenue will suffer and our ability to grow and achieve broader market acceptance of our solutioncould be harmed;
• our revenue will decline if there is a decrease in the overall demand for our customers’ products and services for which we provide servicerevenue management;
• if there is a widespread shift away from business consumers purchasing maintenance and support service contracts, we could be adverselyimpacted if we are not able to adapt to new trends or expand our target market;
• if we are unable to compete effectively against current and future competitors, our business and operating results will be harmed;
• the loss of one or more of our significant customers as a result of consolidation in the technology sector or otherwise, as occurred when Oracle
acquired Sun Microsystems in 2010 and terminated its contract with us effective as of September 30, 2010, could adversely impact our revenueand margins; and
• upon the closing of this offering, our directors and executive officers and their affiliates will beneficially own a significant percentage of our
outstanding common stock, and may, as a result, be able to determine substantially all matters requiring stockholder approval, including theelection of directors and approval of significant corporate transactions.
Key Business Metrics We refer to various key business metrics, including service revenue opportunity under management, actual value of qualified end customer contractsdelivered to us, engagements and renewal rates, in this Prospectus Summary and elsewhere in this prospectus. We describe how we calculate these and othermetrics and material aspects and limitations of these metrics in “Management’s Discussion and Analysis of Financial Condition and Results of Operations—Key Business Metrics.”
4

Table of Contents
Conversion to a Corporation On the date hereof, we converted from a limited liability company into a Delaware corporation and changed our name from ServiceSourceInternational, LLC to ServiceSource International, Inc. In conjunction with the conversion, all of our outstanding common shares automatically convertedinto shares of our common stock. See “Description of Capital Stock” for additional information regarding a description of the terms of our common stockfollowing the conversion and the terms of our certificate of incorporation and bylaws as will be in effect upon the closing of this offering. While as a limitedliability company our outstanding equity was called our common shares, in this prospectus for ease of comparison we refer to such common shares as ourcommon stock for periods prior to the conversion, unless otherwise indicated in this prospectus. Similarly, unless otherwise indicated, we refer to members’equity in this prospectus as stockholders’ equity. In this prospectus, we refer to all of the transactions related to our conversion to a corporation as the“Conversion.” See “Certain Relationships and Related Party Transactions—Conversion to a Corporation.” Corporate Information Our principal executive offices are located at 634 Second Street, San Francisco, California 94107, and our telephone number is (415) 901-6030. Ourwebsite address is www.servicesource.com. Information contained on or accessible through our website is not incorporated by reference into this prospectus,and should not be considered to be part of this prospectus.
5

Table of Contents
THE OFFERING Shares of common stock offered by us 8,000,000 shares Shares of common stock offered by the selling stockholders 3,940,133 shares
Total 11,940,133 shares Over-allotment option to be offered by us 1,791,020 shares Shares of common stock to be outstanding after this offering 65,506,343 shares (67,297,363 shares if the over-allotment option
is exercised in full) Use of proceeds We expect our net proceeds from this offering will be
approximately $71.4 million after deducting underwriting discountsand commissions and estimated offering expenses payable by us.We intend to use the net proceeds of the offering to repay the loanbalances outstanding under our credit facility and for workingcapital and other general corporate purposes. We may also use aportion of the proceeds from the offering to acquire otherbusinesses or technologies. We will not receive any of the proceedsfrom the shares of common stock sold by the selling stockholders.See “Use of Proceeds.”
Risk factors You should read the “Risk Factors” section of this prospectus for a
discussion of factors to consider carefully before deciding to investin shares of our common stock.
Nasdaq Global Market symbol “SREV”
The number of shares of our common stock to be outstanding following this offering is based on 57,506,343 shares of our common stock outstandingas of December 31, 2010 after giving effect to the Conversion described under “Certain Relationships and Related Party Transactions—Conversion to aCorporation” and excludes:
• 17,722,947 shares of common stock issuable upon the exercise of options outstanding as of December 31, 2010, with a weighted averageexercise price of $4.32 per share;
• 530,625 shares of common stock issuable upon the exercise of options granted after December 31, 2010, at an exercise price of $6.20 per share;
• 5,760,000 shares of common stock, plus any shares that have been reserved but not issued pursuant to awards granted under our 2004 Omnibus
Share Plan and our 2008 Option Plan, reserved for issuance under our 2011 Equity Incentive Plan, which will become effective in connectionwith this offering; and
• 900,000 shares of common stock reserved for issuance under our 2011 Employee Stock Purchase Plan, which will become effective inconnection with this offering.
Unless otherwise noted, the information in this prospectus reflects and assumes the following:
• the consummation of the Conversion on the date hereof; • no exercise of outstanding options; and • no exercise by the underwriters of their over-allotment option.
6

Table of Contents
SUMMARY CONSOLIDATED FINANCIAL DATA
We have derived the summary consolidated statements of operations data for the years ended December 31, 2008, 2009 and 2010, and summaryconsolidated balance sheet data as of December 31, 2010 from our audited consolidated financial statements included elsewhere in this prospectus. Ourhistorical results are not necessarily indicative of the results that may be expected in the future. The following summary consolidated financial data should beread in conjunction with “Management’s Discussion and Analysis of Financial Condition and Results of Operations” and our consolidated financialstatements and related notes included elsewhere in this prospectus. The additional financial data presented is used in addition to the financial measuresreflected in the consolidated statements of operations and balance sheet data to help us evaluate our business. Years Ended December 31, 2008 2009 2010 (in thousands, except per share data) Consolidated Statements of Operations Data: Net revenue $100,280 $110,676 $152,935 Cost of revenue 56,965 58,877 90,048
Gross profit 43,315 51,799 62,887
Operating expenses Sales and marketing 20,486 23,182 35,119 Research and development 1,160 2,054 7,188 General and administrative 10,571 13,777 19,378 Amortization of intangible assets 857 68 —
Total operating expenses 33,074 39,081 61,685
Income from operations 10,241 12,718 1,202 Interest expense (2,209) (1,116) (1,271) Loss on extinguishment/modification of debt (561) — (144) Other income (expense), net (1,497) 639 (207)
Income (loss) before provision for income taxes 5,974 12,241 (420) Income tax provision 1,153 1,866 2,147
Net income (loss) $ 4,821 $ 10,375 $ (2,567)
Net income (loss) per common share : Basic $ 0.09 $ 0.18 $ (0.04)
Diluted $ 0.08 $ 0.18 $ (0.04)
Cash distributions per common share $ 0.09 $ — $ 0.04
Weighted-average shares used in computing net income (loss) per common share : Basic 56,209 56,750 57,284
Diluted 58,733 58,912 57,284
Pro forma net loss per common share : Basic $ 0.00
Diluted $ 0.00
Pro forma weighted-average shares used in computing net loss per common share : Basic 59,242
Diluted 59,242
7
(1)
(1)
(1)
(1)
(2)
(3)
(2)
(4)
(4)

Table of Contents
(1) Reported amounts include stock-based compensation expense as follows: Year Ended December 31, 2008 2009 2010 (in thousands)
Cost of revenue $ 1,271 $ 914 $ 1,126 Sales and marketing 1,570 2,340 2,993 Research and development — 541 803 General and administrative 2,608 2,265 3,167
Total stock-based compensation $ 5,449 $ 6,060 $ 8,089
(2) Our basic net income (loss) per common share is calculated by dividing the net income (loss) by the weighted-average number of shares of common stock outstanding for the period.(3) Pursuant to our limited liability company agreement, we were required to pay cash distributions to our members to fund their tax obligations in respect of their equity interests. Tax distributions to
members were $5.2 million, $0 and $2.5 million in 2008, 2009 and 2010, respectively.(4) Our pro forma net loss per common share gives effect to the Conversion and to an assumed issuance of only that number of shares that would have been required to be issued to repay the loan
balances outstanding under our credit facility as of December 31, 2010 assuming the issuance (net of offering costs) of such shares at the initial public offering price of $10.00 per share. The dilutedpro forma net loss per common share calculation also assumes the conversion, exercise, or issuance of all potential common shares, unless the effect of inclusion would result in the reduction of aloss or the increase in net income per common share.
Other Financial Data: Years Ended December 31, 2008 2009 2010 (in thousands) Adjusted EBITDA $19,046 $22,305 $15,428 (1) We present Adjusted EBITDA, which we define as net income (loss), plus: income tax provision; loss on extinguishment/modification of debt; interest expense; other (income) expense, net;
depreciation; amortization of intangible assets; and stock-based compensation. Adjusted EBITDA is a financial measure that is not calculated in accordance with generally accepted accountingprinciples (“GAAP”). We have provided a reconciliation of Adjusted EBITDA, a non-GAAP financial measure, to net income (loss), the most directly comparable financial measure calculated andpresented in accordance with GAAP. Adjusted EBITDA should not be considered as an alternative to net income (loss), operating income or any other measure of financial performance calculatedand presented in accordance with GAAP. Our Adjusted EBITDA may not be comparable to similarly titled measures of other organizations because other organizations may not calculate AdjustedEBITDA in the same manner as we do. We have included Adjusted EBITDA in this prospectus because it is a basis upon which our management assesses financial performance and it eliminates theimpact of items that we do not consider indicative of our core operating performance. In evaluating Adjusted EBITDA, you should be aware that in the future we will incur expenses similar to theadjustments in this presentation. Our presentation of Adjusted EBITDA should not be construed as an inference that our future results will be unaffected by these expenses or any unusual or non-recurring items.
(2) We reconcile net income (loss) to Adjusted EBITDA as follows: Years Ended December 31,
2008 2009 2010 (in thousands) Net income (loss) $ 4,821 $ 10,375 $ (2,567) Income tax provision 1,153 1,866 2,147 Loss on extinguishment / modification of debt 561 — 144 Interest expense 2,209 1,116 1,271 Other (income) expense net 1,497 (639) 207 Depreciation 2,499 3,459 6,137 Amortization of intangible assets 857 68 — Stock-based compensation 5,449 6,060 8,089
Adjusted EBITDA $ 19,046 $ 22,305 $ 15,428
8
(1)(2)

Table of Contents
As of December 31, 2010
Actual Pro Forma Pro Forma
As Adjusted (in thousands) Consolidated Balance Sheet Data: Cash $ 22,652 $ 22,652 $ 78,554 Working capital 18,135 17,517 74,934 Total assets 108,103 136,780 192,409 Term loan, current and non-current 15,459 15,459 — Obligations under capital leases, current and non-current 1,759 1,759 1,759 Total members’/stockholders’ equity 33,884 62,561 133,664 (1) The pro forma column in the summary consolidated balance sheet data above reflects the effect of the Conversion. See note 4 “Pro Forma Information (unaudited)” to our Consolidated Financial
Statements included elsewhere in this prospectus.(2) The pro forma as adjusted column in the summary consolidated balance sheet data above reflects the effect of: (i) the Conversion; (ii) our sale of 8,000,000 shares of common stock in this offering at
the initial public offering price of $10.00 per share, after deducting underwriting discounts and commissions and estimated offering expenses payable by us; and (iii) the repayment of the $15.5million outstanding under our loans as of December 31, 2010 with a portion of the net proceeds from this offering. See “Use of Proceeds” for additional information.
(3) See note 14 of our consolidated financial statements and “Management’s Discussion and Analysis of Financial Condition and Results of Operations—Liquidity and Capital Resources” for adiscussion of $18.1 million of cash (including $6.9 million drawn down under our credit facility) paid to Oracle in the first quarter of 2011 in connection with the termination of our engagementswith Sun Microsystems.
(4) Working capital is defined as current assets less current liabilities.
9
(1) (2)
(3)
(4)

Table of Contents
RISK FACTORS
Investing in our common stock involves a high degree of risk. You should consider carefully the risks and uncertainties described below, together with all ofthe other information in this prospectus, including our consolidated financial statements and related notes, before deciding whether to purchase shares of ourcommon stock. If any of the following risks is realized, our business, financial condition, results of operations and prospects could be materially and adverselyaffected. In that event, the price of our common stock could decline and you could lose part or all of your investment. Risks Related to Our Business and Industry Our quarterly results of operations may fluctuate as a result of numerous factors, many of which may be outside of our control. Our quarterly operating results are likely to fluctuate. Some of the important factors that may cause our revenue, operating results and cash flows tofluctuate from quarter to quarter include: • our ability to attract new customers and retain existing customers; • fluctuations in the value of end customer contracts delivered to us; • fluctuations in close rates; • changes in our commission rates; • seasonality; • loss of customers for any reason including due to acquisition; • the mix of new customers as compared to existing customers;
• the length of the sales cycle for our solution, and our level of upfront investments prior to the period we begin generating sales associated with suchinvestments;
• the timing of customer payments and payment defaults by customers; • the amount and timing of operating costs and capital expenditures related to the operations of our business; • the rate of expansion and productivity of our direct sales force; • the cost and timing of the introduction of new technologies or new services, including additional investments in our cloud applications; • general economic conditions; • technical difficulties or interruptions in delivery of our solution; • changes in foreign currency exchange rates; • changes in the effective tax rates; • regulatory compliance costs, including with respect to data privacy; • costs associated with acquisitions of companies and technologies; • extraordinary expenses such as litigation or other dispute-related settlement payments; and • the impact of new accounting pronouncements.
Many of the above factors are discussed in more detail elsewhere in these Risk Factors. Many of these factors are outside our control, and the variabilityand unpredictability of such factors could result in our failing to meet our revenue or operating results expectations for a given period. In addition, the occurrenceof one or more of these factors might cause our operating results to vary widely which could lead to negative impacts on
10

Table of Contents
our margins, short-term liquidity or ability to retain or attract key personnel, and could cause other unanticipated issues. Accordingly, we believe that quarter-to-quarter comparisons of our revenue, operating results and cash flows may not be meaningful and should not be relied upon as an indication of future performance. The market for our solution is relatively undeveloped and may not grow. The market for service revenue management is still relatively undeveloped, has not yet achieved widespread acceptance and may not grow quickly or at all.Our success will depend to a substantial extent on the willingness of companies to engage a third party such as us to manage the sales of their support,maintenance and subscription contracts. Many companies have invested substantial personnel, infrastructure and financial resources in their own internal servicerevenue organizations and therefore may be reluctant to switch to a solution such as ours. Companies may not engage us for other reasons, including a desire tomaintain control over all aspects of their sales activities and customer relations, concerns about end customer reaction, a belief that they can sell their support,maintenance and subscription services more cost-effectively using their internal sales organizations, perceptions about the expenses associated with changing to anew approach and the timing of expenses once they adopt a new approach, general reluctance to adopt any new and different approach to old ways of doingbusiness, or other considerations that may not always be evident. New concerns or considerations may also emerge in the future. Particularly because our marketis undeveloped, we must address our potential customers concerns and explain the benefits of our approach in order to convince them to change the way that theymanage the sales of support, maintenance and subscription contracts. If companies are not sufficiently convinced that we can address their concerns and that thebenefits of our solution are sufficient, then the market for our solution may not develop as we anticipate and our business will not grow. Our estimates of service revenue opportunity under management and our analysis of renewal rates and other metrics may prove inaccurate. We use various estimates in formulating our business plans and analyzing our potential and historical performance, including our estimate of servicerevenue opportunity under management. We base our estimates upon a number of assumptions that are inherently subject to significant business and economicuncertainties and contingencies, many of which are beyond our control. Our estimates therefore may prove inaccurate.
Service revenue opportunity under management (“opportunity under management”) is a forward-looking metric and is our estimate, as of a given date, ofthe value of all end customer service contracts that we will have the opportunity to sell on behalf of our customers over the subsequent twelve-month period. Weestimate the value of such end customer contracts based on a combination of factors, including the value of end customer contracts made available to us bycustomers in past periods, the minimum value of end customer contracts that our customers are required to give us the opportunity to sell pursuant to the terms oftheir contracts with us, periodic internal business reviews of our expectations as to the value of end customer contracts that will be made available to us bycustomers, the value of end customer contracts included in the SPA and collaborative discussions with our customers assessing their expectations as to the valueof service contracts that they will make available to us for sale. While the minimum value of end customer contracts that our customers are required to give usrepresents a portion of our estimated opportunity under management, a significant portion of the opportunity under management is estimated based on the otherfactors described above.
When estimating service revenue opportunity under management, we must, to a large degree, rely on the assumptions described above, which may proveincorrect. These assumptions are inherently subject to significant business and economic uncertainties and contingencies, many of which are beyond our control.Our estimates therefore may prove inaccurate, causing the actual value of end customer contracts delivered to us in a given twelve-month period to differ fromour estimate of opportunity under management. These factors include: • the extent to which customers deliver a greater or lesser value of end customer contracts than may be required or otherwise expected; • roll-overs of unsold service contract renewals from prior periods to the current period or future periods;
11

Table of Contents
• changes in the pricing or terms of service contracts offered by our customers; • increases or decreases in the end customer base of our customers;
• the extent to which the renewal rates we achieve on behalf of a customer early in an engagement affect the amount of opportunity that the customermakes available to us later in the engagement;
• customer cancellations of their contracts with us due to acquisitions or otherwise; and • changes in our customers’ businesses, sales organizations, sales processes or priorities.
In addition, opportunity under management reflects our estimate for a forward twelve-month period and should not be used to estimate our opportunity forany particular quarter within that period. The value of end customer contracts actually delivered during a twelve-month period should not be expected to occur ineven quarterly increments due to seasonality and other factors impacting our customers and their end customers.
In addition, we analyze various metrics in evaluating our potential and historical performance. We analyze the renewal rates we achieve on behalf of ourcustomers. We compare the renewal rates we achieve on behalf of our customers to the renewal rates that we calculate during the SPA, based on the data providedto us by the customer. In calculating renewal rates, we cannot provide any assurance as to the accuracy or completeness of the customer renewal data we receiveduring the SPA. To the extent that the actual data and information provided by our customers for use in the SPA is inaccurate, insufficient or misrepresents thecontracts we would receive for renewal in future periods, our calculation of renewal rates may be inaccurate.
We also analyze our contribution margin for a period as the excess of the revenue recognized from a customer over the estimated expenses for the periodassociated with supporting the customer and managing the service contract renewals process for them, expressed as a percentage of associated revenue. Althoughwe believe the estimates and assumptions we use in calculating contribution margin are reasonable, the estimated expenses and resulting contribution margincould vary significantly from the amounts disclosed herein had we used different estimates and assumptions. Moreover, we cannot assure you that we willexperience similar contribution margins from customers added in other years or in future periods. You should not rely on the estimated expenses or contributionmargin as being indicative of our future performance. Because of our growing customer base, we expect that there will be times when large numbers of ourcustomers are in the initial phases of their customer relationship with us or have a material expansion of their existing engagements with us. In these scenarios, wemay not be able to achieve profitability even if many of our customer relationships generate a positive contribution margin. If close rates fall short of our predictions, our revenue will suffer and our ability to grow and achieve broader market acceptance of our solution could beharmed. Given our pay-for-performance pricing model, our revenue is directly tied to close rates. Close rates represent the percentage of the actual opportunitydelivered that we renew on behalf of our customers. If the close rate for a particular customer is lower than anticipated, then our revenue for that customer willalso be lower than projected. If close rates fall short of expectations across a broad range of customers, or if they fall below expectations for a particularly largecustomer, then the impact on our revenue and our overall business will be significant. In the event close rates are lower than expected for a given customer, ourmargins will suffer because we will have already incurred a certain level of costs in both personnel and infrastructure to support the engagement. This risk iscompounded by the fact that many of our customer relationships are terminable if we fail to meet certain specified sales targets over a sustained period of time. Ifactual close rates fall to a level at which our revenue and customer contracts are at risk, then our financial performance will decline and we will be severelycompromised in our ability to retain and attract customers. Increasing our customer base and achieving broader market acceptance of our solution depends, to alarge extent, on how effectively our solution increases service sales. As a result, poor performance with respect to our close rates, in addition to causing ourrevenue, margins and earnings to suffer, will likely damage our reputation and prevent us from effectively developing and
12

Table of Contents
maintaining awareness of our brand or achieving widespread acceptance of our solution, in which case we could fail to grow our business and our revenue,margins and earnings would suffer. Our revenue will decline if there is a decrease in the overall demand for our customers’ products and services for which we provide service revenuemanagement. Our revenue is based on a pay-for-performance model under which we are paid a percentage commission based on the service contracts we sell on behalfof our customers. If a particular customer’s products or services fail to appeal to its end customers, our revenue may decline. In addition, if end customer demanddecreases for other reasons, such as negative news regarding our customers or their products, unfavorable economic conditions, shifts in strategy by ourcustomers away from promoting the service contracts we sell in favor of selling their other products or services to their end customers, or if end customersexperience financial constraints and fail to renew the service contracts we sell, we may experience a decrease in our revenue as the demand for our customers’service contracts declines. If there is a widespread shift away from business consumers purchasing maintenance and support service contracts, we could be adversely impacted if we arenot able to adapt to new trends or expand our target markets. As a result of our historical concentration in the software and hardware industries, a significant portion of our revenue comes from the sale of maintenanceand support service contracts for the software and hardware products used by our customers’ end customers. Although we also sell other types of renewals, suchas subscriptions to software-as-a-service offerings, those sales have to date constituted a relatively small portion of our revenue. The emergence of cloudcomputing and other alternative technology purchasing models, in which technology services are provided on a remote-access basis, may have a significantimpact on the size of the market for traditional maintenance and support contracts. If these alternative models continue gaining traction and reduce the size of ourtraditional market, we will need to continue to adapt our solution to capitalize on these trends or our results of operations will suffer. If we are unable to compete effectively against current and future competitors, our business and operating results will be harmed. The market for service revenue management is evolving. Historically, technology companies have managed their service renewals through internalpersonnel and relied upon technology ranging from Excel spreadsheets to internally-developed software to customized versions of traditional businessintelligence tools and CRM or ERP software from vendors such as Oracle, SAP, salesforce.com and NetSuite. Some companies have made further investments inthis area using firms such as Accenture and McKinsey for technology consulting and education services focused on service renewals. These internally-developedsolutions represent the primary alternative to our integrated approach. We also face direct competition from smaller companies that offer specialized servicerevenue management solutions, typically providing technology for their customers to use internal personnel for their sales efforts.
We believe the principal competitive factors in our markets include the following: • service revenue industry expertise, best practices, and benchmarks; • performance-based pricing of solutions; • ability to increase service revenue, renewal rates, and close rates; • global capabilities; • completeness of solution; • ability to effectively represent customer brands to end customers and channel partners;
13

Table of Contents
• size of upfront investment; and • size and financial stability of operations.
We believe that more competitors will emerge. These competitors may have greater name recognition, longer operating histories, well-establishedrelationships with customers in our markets and substantially greater financial, technical, personnel and other resources than we have. Potential competitors ofany size may be able to respond more quickly and effectively than we can to new or changing opportunities, technologies, standards or customer or end customerrequirements. Even if our solution is more effective than competing solutions, potential customers might choose new entrants unless we can convince them of theadvantages of our integrated solution. We expect competition and competitive pressure, from both new and existing competitors, to increase in the future. The loss of one or more of our key customers could slow our revenue growth or cause our revenue to decline. A substantial portion of our revenue has to date come from a relatively small number of customers. During the year ended December 31, 2010, our top tencustomers accounted for 54% of our revenue, with our largest customer, Sun Microsystems, accounting for 13% of our revenue. Oracle terminated our contractswith Sun Microsystems effective as of September 30, 2010. A relatively small number of customers may continue to account for a significant portion of ourrevenue for the foreseeable future. The loss of any of our significant customers for any reason, including the failure to renew our contracts, a change ofrelationship with any of our key customers or their acquisition as discussed below, may cause a significant decrease in our revenue. Consolidation in the technology sector is continuing at a rapid pace, which could harm our business in the event that our customers are acquired and theircontracts are cancelled. Consolidation among technology companies in our target market has been robust in recent years, and this trend poses a risk for us. Acquisitions of ourcustomers could lead to cancellation of our contracts with those customers by the acquiring companies and could reduce the number of our existing and potentialcustomers. For example, Oracle has acquired a number of our customers in recent years, including our then largest customer, Sun Microsystems, in January 2010,and another customer, BEA Systems, in April 2008. Oracle has elected to terminate our service contracts with each customer because Oracle conducts its servicerevenue management internally. If mergers and acquisitions in the technology industry continue unabated or increase, we expect that some of the acquiringcompanies, and Oracle in particular, will terminate, renegotiate and/or elect not to renew our contracts with the companies they acquire, which could reduce ourrevenue. Supporting our existing and growing customer base could strain our personnel resources and infrastructure, and if we cannot scale our operations andincrease productivity, we may be unsuccessful in implementing our business plan. Since 2003, we have experienced significant growth in our customer base, which has placed a strain on our management, administrative, operational andfinancial infrastructure. We anticipate that additional investments in sales personnel, infrastructure and research and development spending will be required to: • scale our operations and increase productivity; • address the needs of our customers; • further develop and enhance our solution and offerings; • develop new technology; and • expand our markets and opportunity under management, including into new industry verticals and geographic areas.
14

Table of Contents
Our success will depend in part upon our ability to manage our growth effectively. To do so, we must continue to increase the productivity of our existingemployees and to hire, train and manage new employees as needed. To manage domestic and international growth of our operations and personnel, we will needto continue to improve our operational, financial and management controls and our reporting processes and procedures, and implement more extensive andintegrated financial and business information systems. These additional investments will increase our operating costs, which will make it more difficult for us tooffset any future revenue shortfalls by reducing expenses in the short term. Moreover, if we fail to scale our operations successfully and increase productivity, ouroverall business will be at risk. We enter into long-term, commission-based contracts with our customers, and our failure to correctly price these contracts may negatively affect ourprofitability. We enter into long-term contracts with our customers that are priced based on multiple factors determined in large part by the SPA we conduct for ourcustomers. These factors include opportunity size, anticipated close rates and expected commission rates at various levels of sales performance. Some of thesefactors require forward looking assumptions that may prove incorrect. If our assumptions are inaccurate, or if we otherwise fail to correctly price our customercontracts, particularly those with lengthy contract terms, then our revenue, profitability and overall business operations may suffer. Further, if we fail to anticipateany unexpected increase in our cost of providing services, including the costs for employees, office space or technology, we could be exposed to risks associatedwith cost overruns related to our required performance under our contracts, which could have a negative effect on our margins and earnings. Many of our customer contracts allow termination for failure to meet certain performance conditions. Although most of our customer contracts are subject to multi-year terms, these agreements often have termination rights if we fail to meet specified salestargets. During the SPA and contract negotiation phase with a customer, we typically negotiate minimum performance levels for the engagement. If we fail tomeet our required targets and our customers choose to exercise their termination rights, our revenue could decline. These termination rights may also createinstability in our revenue forecasts and other forward looking financial metrics. Our business may be harmed if our customers rely upon our service revenue forecasts in their business and actual results are materially different. The contracts that we enter into with our customers provide for sharing of information with respect to forecasts and plans for the renewal of maintenance,support and subscription agreements of our customers. Our customers may use such forecasted data for a variety of purposes related to their business. Ourforecasts are based upon the data our customers provide to us, and are inherently subject to significant business, economic and competitive uncertainties, many ofwhich are beyond our control. In addition, these forecasted expectations are based upon historical trends and data that may not be true in subsequent periods. Anymaterial inaccuracies related to these forecasts could lead to claims on the part of our customers related to the accuracy of the forecasted data we provide to them,or the appropriateness of our methodology. Any liability that we incur or any harm to our brand that we suffer because of inaccuracies in the forecasted data weprovide to our customers could impact our ability to retain existing customers and harm our brand and, ultimately, our business. Changing global economic conditions and large scale economic shifts may impact our business. Our overall performance depends in part on worldwide economic conditions that impact the technology and technology-enabled healthcare and lifesciences industries. For example, the recent economic downturn resulted in many businesses deferring technology investments, including purchases of newsoftware, hardware and other equipment, and purchases of additional or supplemental maintenance, support and subscription services. To a certain extent, thesebusinesses also slowed the rate of renewals of maintenance, support and subscription
15

Table of Contents
services for their existing technology base. A future downturn could cause business customers to stop renewing their existing maintenance, support andsubscription agreements or contracting for additional maintenance services as they look for ways to further cut expenses, in which case our business could suffer.
Conversely, a significant upturn in global economic conditions could cause business purchasers to purchase new hardware, software and other technologyproducts, which we generally do not sell, instead of renewing or otherwise purchasing maintenance, support and subscription services for their existing products.A general shift toward new product sales could reduce our near term opportunities for these contracts, which could lead to a decline in our revenue. Our inability to expand our target markets could adversely impact our business and operating results. We derive substantially all of our revenue from customers in certain sectors in the technology and technology-enabled healthcare and life sciencesindustries, and an important part of our strategy is to expand our existing customer base and win new customers in these industries. In addition, because of theservice revenue opportunities that we believe exist beyond these industries, we intend to target new customers in additional industry vertical markets. Inconnection with the expansion of our target markets, we may not have familiarity with such additional industry verticals, and our execution of such expansioncould face risks where our Service Revenue Intelligence Platform is less developed within a particular new vertical. We may encounter customers in thesepreviously untapped markets that have different pricing and other business sensitivities than we are used to managing. As a result of these and other factors, ourefforts to expand our solution to additional industry vertical markets may not succeed, may divert management resources from our existing operations and mayrequire us to commit significant financial resources to unproven parts of our business, all of which may harm our financial performance. Our business and growth depend substantially on customers renewing their agreements with us and expanding their use of our solution for additionalavailable markets. Any decline in our customer renewals or failure to expand their relationships with us could harm our future operating results. In order for us to improve our operating results and grow, it is important that our customers renew their agreements with us when the initial contract termexpires and that we expand our customer relationships to add new market opportunities and related service revenue opportunity under management. Ourcustomers have no obligation to renew their contracts with us after the initial terms have expired, and we cannot assure you that our customers will renew servicecontracts with us at the same or higher level of service, if at all, or provide us with the opportunity to manage additional opportunity. Although our renewal rateshave been historically higher than those achieved by our customers prior to their using our solution, some customers have elected not to renew their agreementswith us. Our customers’ renewal rates may decline or fluctuate as a result of a number of factors, including their satisfaction or dissatisfaction with our solutionand results, our pricing, mergers and acquisitions affecting our customers or their end customers, the effects of economic conditions or reductions in ourcustomers’ or their end customers’ spending levels. If our customers do not renew their agreements with us, renew on less favorable terms or fail to contract withus for additional service revenue management opportunities, our revenue may decline and we may not realize improved operating results and growth from ourcustomer base. A substantial portion of our business consists of supporting our customers’ channel partners in the sale of service contracts. If those channel partnersbecome unreceptive to our solution, our business could be harmed. Many of our customers, including some of our largest customers, sell service contracts through their channel partners and engage our solution to help thosechannel partners become more effective at selling service contract renewals. These channel partners may have access to some of our cloud applications, such asour Channel Sales Cloud, in addition to other sales support services we provide. In this context, the ultimate buyers of the service contracts are end customers ofthose channel partners, who then receive the actual services from our customers.
16

Table of Contents
In the event our customers’ channel partners become unreceptive to our involvement in the renewals process, those channel partners could discourage our currentor future customers from engaging our solution to support channel sales. This risk is compounded by the fact that large channel partners may have relationshipswith more than one of our customers or prospects, in which case the negative reaction of one or more of those large channel partners could impact multiplecustomer relationships. Accordingly, with respect to those customers and prospective customers who sell service contracts through channel partners, anysignificant resistance to our solution by their channel partners could harm our ability to attract or retain customers, which would damage our overall businessoperations. We face long sales cycles to secure new customer contracts, making it difficult to predict the timing of specific new customer relationships. We face a variable selling cycle to secure new customer agreements, typically spanning a number of months and requiring our effort to obtain and analyzeour prospect’s business through the SPA, for which we are not paid. Moreover, even if we succeed in developing a relationship with a potential new customer, thescope of the potential service revenue management engagement frequently changes over the course of the business discussions and, for a variety of reasons, oursales discussions may fail to result in new customer acquisitions. Consequently, we have only a limited ability to predict the timing and size of specific newcustomer relationships. If we experience significant fluctuations in our anticipated growth rate and fail to balance our expenses with our revenue forecasts, our results could beharmed. Due to our evolving business model, the uncertain size of our markets and the unpredictability of future general economic and financial market conditions,we may not be able to accurately forecast our growth rate. We plan our expense levels and investments based on estimates of future sales performance for ourcustomers with respect to their end customers, future revenue and future customer acquisition. If our assumptions prove incorrect, we may not be able to adjustour spending quickly enough to offset the resulting decline in growth and revenue. Consequently, we expect that our gross margins, operating margins and cashflows may fluctuate significantly on a quarterly basis. If we cannot efficiently implement our offering for customers, we may be delayed in generating revenue, fail to generate revenue and/or incur significantcosts. In general, our customer engagements are complex and may require lengthy and significant work to implement our offerings. As a result, we generallyincur sales and marketing expenses related to the commissions owed to our sales representatives and make upfront investments in technology and personnel tosupport the engagements one to three months before we begin selling end customer contracts. Each customer’s situation may be different, and unanticipateddifficulties and delays may arise as a result of our failure, or that of our customer, to meet respective implementation responsibilities. If the customerimplementation process is not executed successfully or if execution is delayed, we could incur significant costs without yet generating revenue, and ourrelationships with some of our customers may be adversely impacted. Delayed or unsuccessful investment in new technology, services and markets may harm our financial results. We plan to continue to invest significant resources in research and development in order to enhance our existing offerings and introduce new offerings thatwill appeal to customers and potential customers. We have undertaken the development of new technology to offer improved and more scalable service revenuemanagement, including enhancements to our applications. The development of new products and services entails a number of risks that could adversely affect ourbusiness and operating results, including: • the risk of diverting the attention of our management and our employees from the day-to-day operations of the business;
17

Table of Contents
• insufficient revenue to offset increased expenses associated with research, development, operational and marketing activities; and • write-offs of the value of such technology investments as a result of unsuccessful implementation or otherwise.
If our new or modified technology does not work as intended, is not responsive to user preferences or industry or regulatory changes, is not appropriatelytimed with market opportunity, or is not effectively brought to market, we may lose existing and potential customers or related service revenue opportunities, inwhich case our results of operations may suffer. The cost of future development of new service revenue management offerings or technologies also could requireus to raise additional debt or equity financing. These actions could negatively impact the ownership percentages of our existing stockholders, our financialcondition or our results of operations. The length of time it takes our newly-hired sales representatives to become productive could adversely impact our success rate, the execution of our overallbusiness plan and our costs. It can take twelve months or longer before our sales representatives are fully trained and productive in selling our solution to prospects and customers. Thislong ramp period presents a number of operational challenges as the cost of recruiting, hiring and carrying new sales representatives cannot be offset by therevenue such new sales representatives produce until after they complete their long ramp periods. Further, given the length of the ramp period, we often cannotdetermine if a sales representative will succeed until he or she has been employed for a year or more. If we cannot reliably develop our sales representatives to aproductive level, or if we lose productive representatives in whom we have heavily invested, our future growth rates and revenue will suffer. If we lose our top executives, or if we are unable to attract, hire, integrate and retain key personnel and other necessary employees, our business will beharmed. Our future success depends on the continued contributions of our executives, each of whom may be difficult to replace. Our future success also depends inpart on our ability to attract, hire, integrate and retain qualified service sales personnel, sales representatives and management level employees to oversee suchsales forces. In particular, Michael Smerklo, our chairman of the board of directors and chief executive officer, is critical to the management of our business andoperations and the development of our strategic direction. The loss of Mr. Smerklo’s services or those of our other executives, or our inability to continue toattract and retain high-quality talent, could harm our business. Because competition for our target employees is intense, we may be unable to attract and retain the highly skilled employees we need to support our plannedgrowth. To continue to execute on our growth plan, we must attract and retain highly qualified sales representatives, engineers and other key employees in theinternational markets in which we have operations. Competition for these personnel is intense, especially for highly educated, qualified sales representatives. Wehave from time to time in the past experienced, and we expect to continue to experience in the future, difficulty in hiring and retaining highly skilled keyemployees with appropriate qualifications. If we fail to attract new sales representatives, engineers and other key employees, or fail to retain and motivate ourmost successful employees, our business and future growth prospects could be harmed. We depend on revenue from sources outside the United States, and our international business operations and expansion plans are subject to risks related tointernational operations, and may not increase our revenue growth or enhance our business operations. For the year ended December 31, 2010, approximately 34% of our revenue was generated from sales centers located outside of the United States. As aresult of our continued focus on international markets, we expect that future revenue derived from international sources will continue to represent a significantportion of our total revenue.
18

Table of Contents
A portion of the sales commissions paid by our international customers is paid in foreign currencies. As a result, fluctuations in the value of these foreigncurrencies may make our solution more expensive or cause resulting fluctuations in cost for international customers, which could harm our business. We currentlydo not undertake hedging activities to manage these currency fluctuations. In addition, if the effective price of the contracts we sell to the end customers were toincrease as a result of fluctuations in the exchange rate of the relevant currencies, demand for such contracts could fall, which in turn would reduce our revenue.
Our growth strategy includes further expansion into international markets. Our international expansion may require significant additional financialresources and management attention, and could negatively affect our financial condition, cash flows and operating results. In addition, we may be exposed toassociated risks and challenges, including: • the need to localize and adapt our solution for specific countries, including translation into foreign languages and associated expenses; • difficulties in staffing and managing foreign operations; • different pricing environments, longer sales cycles and longer accounts receivable payment cycles and difficulties in collecting accounts receivable; • new and different sources of competition; • weaker protection for our intellectual property than in the United States and practical difficulties in enforcing our rights abroad; • laws and business practices favoring local competitors;
• compliance obligations related to multiple, conflicting and changing foreign governmental laws and regulations, including employment, tax, privacyand data protection laws and regulations;
• increased financial accounting and reporting burdens and complexities; • restrictions on the transfer of funds; • adverse tax consequences; and • unstable regional and economic political conditions.
We cannot assure you we will succeed in creating additional international demand for our solution or that we will be able to effectively sell serviceagreements in all of the international markets we enter. If we do not adequately protect our intellectual property rights, our competitive position and our business may suffer. We rely upon a combination of trademark, copyright and trade secret law and contractual terms to protect our intellectual property rights, all of whichprovide only limited protection. Our success depends, in part, upon our ability to establish, protect and enforce our intellectual property and other proprietaryrights. If we fail to protect or effectively enforce our intellectual property rights, others may be able to compete against us using intellectual property that is thesame as or similar to our own. In addition, we cannot assure you that our intellectual property rights are sufficient to provide us with a competitive advantageagainst others who offer services similar to ours.
While we have no patents or pending patent applications, we may file patent applications in the future. If we do file patent applications, we cannot assureyou that any issued patents arising from future applications will provide the protection we seek, or that any future patents issued to us will not be challenged,invalidated or circumvented. Also, we cannot assure you that we will obtain any copyright or trademark registrations from our pending or future applications orthat any of our trademarks will be enforceable or provide adequate protection of our proprietary rights.
19

Table of Contents
We also rely in some circumstances on trade secrets to protect our technology. Trade secrets may lose their value if not properly protected. We endeavor toenter into non-disclosure agreements with our employees, customers, contractors and business partners to limit access to and disclosure of our proprietaryinformation. The steps we have taken, however, may not prevent unauthorized use of our technology, and adequate remedies may not be available in the event ofunauthorized use or disclosure of our trade secrets and proprietary technology. However, trade secret protection does not prevent others from reverse engineeringor independently developing similar technologies. In addition, reverse engineering, unauthorized copying or other misappropriation of our trade secrets couldenable third parties to benefit from our technology without paying for it.
Accordingly, despite our efforts, we may be unable to prevent third parties from infringing or misappropriating our intellectual property and using ourtechnology for their competitive advantage. Any such infringement or misappropriation could have a material adverse effect on our business, results of operationsand financial condition. Monitoring infringement of our intellectual property rights can be difficult and costly, and enforcement of our intellectual property rightsmay require us to bring legal actions against infringers. Infringement actions are inherently uncertain and therefore may not be successful, even when our rightshave been infringed. Even if such actions are successful, they may require a substantial amount of resources and divert our management’s attention. Claims by others that we infringe or violate their intellectual property could force us to incur significant costs and require us to change the way we conductour business. Numerous technology companies including potential competitors protect their intellectual property rights by means such as patents, trade secrets,copyrights and trademarks. We have not conducted an independent review of patents issued to third parties. Additionally, because patent applications in theUnited States and many other jurisdictions are kept confidential for 18 months before they are published, we may be unaware of pending patent applications thatrelate to our proprietary technology. From time to time we may receive letters from other parties alleging, or inquiring about, possible breaches of theirintellectual property rights.
Any party asserting that we infringe its proprietary rights would force us to defend ourselves, and possibly our customers, against the alleged infringement.The technology industry is characterized by the existence of a large number of patents, copyrights, trademarks and trade secrets and by frequent litigation basedon allegations of infringement or other violations of intellectual property rights. Moreover, the risk of such a lawsuit will likely increase as we become larger, thescope of our solution and technology expands and the number of competitors in our market increases. Any such claims or litigation could: • be time-consuming and expensive to defend, and deplete our financial resources, whether meritorious or not; • require us to stop providing the services that use the technology that infringes the other party’s intellectual property; • divert the attention of our technical and managerial resources away from our business; • require us to enter into royalty or licensing agreements with third parties, which may not be available on terms that we deem acceptable, if at all;
• prevent us from operating all or a portion of our business or force us to redesign our technology, which could be difficult and expensive and maymake the performance or value of our solution less attractive;
• subject us to significant liability for damages or result in significant settlement payments; or
• require us to indemnify our customers as we are required by contract to indemnify some of our customers for certain claims based upon theinfringement or alleged infringement of any third party’s intellectual property rights resulting from our customers’ use of our intellectual property.
During the course of any intellectual property litigation, confidential information may be disclosed in the form of documents or testimony in connection
with discovery requests, depositions or trial testimony. Disclosure
20

Table of Contents
of our confidential information and our involvement in intellectual property litigation could harm us. In addition, any uncertainties resulting from the initiationand continuation of any litigation could significantly limit our ability to continue our operations and could harm our relationships with current and prospectivecustomers. Any of the foregoing could disrupt our business and have a material adverse effect on our operating results and financial condition.
In addition, we may incorporate open source software into our technology solution. The terms of many open source licenses have not been interpreted byUnited States or foreign courts, and there is a risk that such licenses could be construed in a manner that imposes unanticipated conditions or restrictions on ourcommercialization of any of our solutions that may include open source software. As a result, we will be required to analyze and monitor our use of open sourcesoftware closely. As a result of the use of open source software, we could be required to seek licenses from third parties in order to develop such future products,re-engineer our products, discontinue sales of our solutions or release our software code under the terms of an open source license to the public. Given the natureof open source software, there is also a risk that third parties may assert copyright and other intellectual property infringement claims against us based on any useof such open source software, as more generally discussed with respect to general intellectual property claims. Changes in the U.S. and foreign legal and regulatory environment that affect our operations, including those relating to privacy, data security and cross-border data flows, could pose a significant risk to our company by disrupting our business and increasing our expenses. We are subject to a wide variety of laws and regulations in the United States and the other jurisdictions in which we operate, and changes in the level ofgovernment regulation of our business have the potential to materially alter our business practices with resultant increases in costs and decreases in profitability.Depending on the jurisdiction, those changes may come about through new legislation, the issuance of new regulations or changes in the interpretation of existinglaws and regulations by a court, regulatory body or governmental official. Sometimes those changes may have both prospective and retroactive effect, which isparticularly true when a change is made through reinterpretation of laws or regulations that have been in effect for some time.
Privacy and data security are rapidly evolving areas of regulation, and additional regulation in those areas, some of it potentially difficult and costly for usto accommodate, is frequently proposed and occasionally adopted. Laws in many countries and jurisdictions, particularly in the European Union and Canada,govern the requirements related to how we store, transfer or otherwise process the private data provided to us by our customers. In addition, the centralized natureof our information systems at the data and operations centers that we use requires the routine flow of data relating to our customers and their respective endcustomers across national borders, both with respect to the jurisdictions within which we have operations and the jurisdictions in which we provide services to ourcustomers. If this flow of data becomes subject to new or different restrictions, our ability to serve our customers and their respective customers could beseriously impaired for an extended period of time. For example, we participate in the U.S. Department of Commerce’s safe harbor program to govern ourtreatment of data and data flow with respect to our customers and their respective customers across various jurisdictions. We also have entered into various modelcontracts and related contractual provisions to enable these data flows. For any jurisdictions in which these measures are not recognized or otherwise notcompliant with the laws of the countries in which we process data, or where more stringent data privacy laws are enacted irrespective of the guidelines, we couldface increased compliance expenses and face penalties for violating such laws or be excluded from those markets altogether, in which case our operations couldbe materially damaged. Various risks could affect our worldwide operations, including numerous events outside of our control, exposing us to significant costs that could adverselyaffect our operations and customer confidence. We conduct operations throughout the world, including our headquarters in the United States and various operations in Ireland, Malaysia, Singapore andthe United Kingdom. Such worldwide operations expose us to potential operational disruptions and costs as a result of a wide variety of events, including localinflation or
21

Table of Contents
economic downturn, currency exchange fluctuations, political turmoil, labor issues, terrorism, natural disasters and pandemics. Any such disruptions or costscould have a negative effect on our ability to provide our solution or meet our contractual obligations, the cost of our solution, customer satisfaction, our ability toattract or maintain customers, and, ultimately, our profits.
Natural disasters or other catastrophic events may cause damage or disruption to our operations, international commerce and the global economy, and thuscould have a strong negative effect on us. Our business operations are subject to interruption by natural disasters, fire, power shortages, pandemics and otherevents beyond our control. Such events could make it difficult or impossible for us to deliver our solution to our customers, and could decrease demand for oursolution. The majority of our research and development activities, corporate headquarters, information technology systems and other critical business operationsare located near major seismic faults in the San Francisco Bay Area. Because we may not have insurance coverage that would cover quake-related losses, andsignificant recovery time could be required to resume operations, our financial condition and operating results could be materially adversely affected in the eventof a major earthquake or catastrophic event.
Terrorist attacks and other acts of violence or war may adversely affect worldwide financial markets and could potentially lead to economic recession,which could adversely affect our business, results of operations, financial condition and cash flows. These events could adversely affect our customers’ levels ofbusiness activity and precipitate sudden significant changes in regional and global economic conditions and cycles. If our security measures are breached or fail, resulting in unauthorized access to customer data, our solution may be perceived as insecure, the attractivenessof our solution to current or potential customers may be reduced and we may incur significant liabilities. Our solution involves the storage and transmission of the proprietary information and protected data that we receive from our customers. We rely onproprietary and commercially available systems, software, tools and monitoring, as well as other processes, to provide security for processing, transmission andstorage of such information. If our security measures are breached or fail as a result of third-party action, employee negligence, error, malfeasance or otherwise,unauthorized access to customer or end customer data may occur. Improper activities by third parties, advances in computer and software capabilities andencryption technology, new tools and discoveries and other events or developments may facilitate or result in a compromise or breach of our computer systems.Techniques used to obtain unauthorized access or to sabotage systems change frequently and generally are not recognized until launched against a target, and wemay be unable to anticipate these techniques or implement adequate preventive measures. Our security measures may not be effective in preventing these types ofactivities, and the security measures of our third-party data centers and service providers may not be adequate.
Our customer contracts generally provide that we will indemnify our customers for data privacy breaches. If such a breach occurs, we could facecontractual damages, damages and fees arising from our indemnification obligations, penalties for violation of applicable laws or regulations, possible lawsuits byaffected individuals and significant remediation costs and efforts to prevent future occurrences. In addition, whether there is an actual or a perceived breach of oursecurity, the market perception of the effectiveness of our security measures could be harmed significantly and we could lose current or potential customers. We may be liable to our customers or third parties if we make errors in providing our solution or fail to properly safeguard their confidential information. The solution we offer is complex, and we make errors from time to time. These may include human errors made in the course of managing the salesprocess for our customers as we interact with their end customers, or errors arising from our technology solution as it interacts with our customers’ systems andthe disparate data contained on such systems. The costs incurred in correcting any material errors may be substantial. In addition, as part of our business, wecollect, process and analyze confidential information provided by our customers and prospective customers. Although we take significant steps to safeguard theconfidentiality of customer
22

Table of Contents
information, we could be subject to claims that we disclosed their information without appropriate authorization or used their information inappropriately. Anyclaims based on errors or unauthorized disclosure or use of information could subject us to exposure for damages, significant legal defense costs, adversepublicity and reputational harm, regardless of the merits or eventual outcome of such claims. The technology we currently use may not operate properly, which could damage our reputation, give rise to claims against us or divert application of ourresources from other purposes, any of which could harm our business and operating results. The technology we currently use, which includes our cloud based applications as well as the technology components of our Service Revenue IntelligencePlatform, may contain or develop unexpected defects or errors. There can be no assurance that performance problems or defects in our technology will not arisein the future. Errors may result from receipt, entry or interpretation of customer or end customer information or from the interface of our technology with legacysystems and data that are outside of our control. Despite testing, defects or errors may arise in our solution. Any defects and errors that we discover in ourtechnology and any failure by us to identify and effectively address them could result in loss of revenue or market share, liability to customers or others, failure toachieve market acceptance or expansion, diversion of development resources, injury to our reputation, and increased costs. Defects or errors in our technologymay discourage existing or potential customers from contracting with us. Correction of defects or errors could prove impossible or impracticable. The costsincurred in correcting any defects or errors or in responding to resulting claims or liability may be substantial and could adversely affect our operating results. Disruptions in service or damage to the data center that hosts our data and our locations could adversely affect our business. Our operations depend on our ability to maintain and protect our data servers and cloud applications, which are located in a data center operated for us by athird party. We cannot control or assure the continued or uninterrupted availability of this third-party data center. In addition, our information technologies andsystems, as well as our data center, are vulnerable to damage or interruption from various causes, including natural disasters, war and acts of terrorism and powerlosses, computer systems failures, Internet and telecommunications or data network failures, operator error, losses of and corruption of data and similar events.Although we conduct business continuity planning and maintain certain insurance for certain events, the situations for which we plan, and the amount ofinsurance coverage we maintain, may prove inadequate in any particular case. In addition, the occurrence of any of these events could result in interruptions,delays or cessations in the delivery of the solutions we offer to our customers. Any of these events could impair or prohibit our ability to provide our solution,reduce the attractiveness of our solution to current or potential customers and adversely impact our financial condition and results of operations.
In addition, despite the implementation of security measures, our infrastructure, data center, operations and other centers or systems that we interface with,including the Internet and related systems, may be vulnerable to physical intrusions, hackers, improper employee or contractor access, computer viruses,programming errors, denial-of-service attacks or other attacks by third parties. Any failure or interruptions in the Internet infrastructure, bandwidth providers, data center providers, other third parties or our own systems for providingour solution to customers could negatively impact our business. Our ability to deliver our solution is dependent on the development and maintenance of the infrastructure of the Internet and other telecommunicationsservices by third parties. Such services include maintenance of a reliable network backbone with the necessary speed, data capacity and security for providingreliable Internet access and services and reliable telecommunications systems that connect our global operations. While our solution is designed to operatewithout interruption, we have experienced and expect that we will in the future experience interruptions and delays in services and availability from time to time.We rely on internal systems as
23

Table of Contents
well as third-party vendors, including data center, bandwidth, and telecommunications equipment providers, to provide our solution. We do not maintainredundant systems or facilities for some of these services. In the event of a catastrophic event with respect to one or more of these systems or facilities, we mayexperience an extended period of system unavailability, which could negatively impact our relationship with our customers. Additional government regulations may reduce the size of market for our solution, harm demand for our solution and increase our costs of doing business. Any changes in government regulations that impact our customers or their end customers could have a harmful effect on our business by reducing the sizeof our addressable market or otherwise increasing our costs. For example, with respect to our technology-enabled healthcare and life sciences customers, anychange in U.S. Food and Drug Administration or foreign equivalent regulation of, or denial, withholding or withdrawal of approval of, our customers’ productscould lead to a lack of demand for service revenue management with respect to such products. Other changes in government regulations, in areas such as privacy,export compliance or anti-bribery statutes, such as the U.S. Foreign Corrupt Practices Act, could require us to implement changes in our services or operationsthat increase our cost of doing business and thereby hurt our financial performance.
The future success of our business depends upon the continued use of the Internet as a primary medium for commerce, communication and businessapplications. Federal, state or foreign government bodies or agencies have in the past adopted, and may in the future adopt, laws or regulations affecting dataprivacy and the use of the Internet as a commercial medium. In addition, government agencies or private organizations may begin to impose taxes, fees or othercharges for accessing the Internet. These laws or charges could limit the growth of Internet-related commerce or communications generally, result in a decline inthe use of the Internet and the viability of Internet-based applications such as ours and reduce the demand for our solution. We operate and offer our services in many jurisdictions and, therefore, may be subject to state, local and foreign taxes that could harm our business. We operate service sales centers in multiple locations. Some of the jurisdictions in which we operate, such as Ireland, give us the benefit of either relativelylow tax rates, tax holidays or government grants, in each case that are dependent on how we operate or how many jobs we create and employees we retain. Weplan on utilizing such tax incentives in the future as opportunities are made available to us. Any failure on our part to operate in conformity with applicablerequirements to remain qualified for any such tax incentives or grants may result in an increase in our taxes. In addition, jurisdictions may choose to increase ratesat any time due to economic or other factors, such as the current economic situation in Ireland. Any such rate increases may harm our results of operations.
In addition, we may lose sales or incur significant costs should various tax jurisdictions impose taxes on either a broader range of services or services thatwe have performed in the past. We may be subject to audits of the taxing authorities in any such jurisdictions that would require us to incur costs in responding tosuch audits. Imposition of such taxes on our services could result in substantial unplanned costs, would effectively increase the cost of such services to ourcustomers and may adversely affect our ability to retain existing customers or to gain new customers in the areas in which such taxes are imposed. We may choose to sell subscriptions to our cloud applications separately from our integrated solution, which may not be successful and could impact revenuefrom our existing solution. We currently derive a small portion of our revenue from subscriptions to our cloud applications for a few customers, and we are exploring alternatives forpackaging and pricing these applications to generate more revenues from them. In the event we choose to expand our technology subscriptions in this manner, wemay not find a successful market for our applications. In addition, because we have limited prior experience selling technology subscriptions on a stand-alonebasis, we may encounter technical and execution challenges that undermine the quality of the technology offering or cause us to fall short of customerexpectations. We also have
24

Table of Contents
little experience in pricing our technology subscriptions separately, which could result in underpricing that damages our profit margins and other financialperformance. It is also possible that selling a technology solution separate from our integrated solution will result in a reduction in sales of our current offeringsthat we might otherwise have sold. An unsuccessful expansion of our business to promote a stand-alone subscription model for any of the foregoing reasons orotherwise would lead to a diversion of financial and managerial resources from our existing business and an inability to generate sufficient revenue to offset ourinvestment costs. If we acquire companies or technologies in the future, they could prove difficult to integrate, disrupt our business, dilute stockholder value and adverselyaffect our operating results and the value of our common stock. As part of our business strategy, we may acquire, enter into joint ventures with, or make investments in companies, services and technologies that webelieve to be complementary. Acquisitions and investments involve numerous risks, including: • difficulties in identifying and acquiring technologies or businesses that will help our business; • difficulties in integrating operations, technologies, services and personnel; • diversion of financial and managerial resources from existing operations; • the risk of entering new markets in which we have little to no experience; • risks related to the assumption of known and unknown liabilities; • potential litigation by third parties, such as claims related to intellectual property or other assets acquired or liabilities assumed; • the risk of write-offs of goodwill and other intangible assets; • delays in customer engagements due to uncertainty and the inability to maintain relationships with customers of the acquired businesses; • inability to generate sufficient revenue to offset acquisition or investment costs; • incurrence of acquisition-related costs; • harm to our existing business relationships with business partners and customers as a result of the acquisition; • the key personnel of the acquired entity or business may decide not to work for us or may not perform according to our expectations; and • use of substantial portions of our available cash or dilutive issuances of equity securities or the incurrence of debt to consummate the acquisition.
As a result, if we fail to properly evaluate acquisitions or investments, we may not achieve the anticipated benefits of any such acquisitions, we may incurcosts in excess of what we anticipate and management resources and attention may be diverted from other necessary or valuable activities. Risks Relating to Owning Our Common Stock and this Offering Our share price may be volatile, and you may be unable to sell your shares at or above the offering price. Our common stock has no prior trading history, and an active public market for these shares may not develop or be sustained after this offering. The initialpublic offering price for our common stock was determined through negotiations with the representatives of the underwriters. This price does not necessarilyreflect the price at which investors in the market will be willing to buy and sell our shares following this offering. In addition, the trading price of our commonstock is likely to be highly volatile and could be subject to wide fluctuations in
25

Table of Contents
response to various factors. In addition to the risks described in this section, factors that may cause the market price of our common stock to fluctuate include:
• fluctuations in our quarterly financial results or the quarterly financial results of companies perceived to be similar to us as discussed in more detailelsewhere in “Risk Factors;”
• failing to achieve our revenue or earnings expectations, or those of investors or analysts; • changes in estimates of our financial results or recommendations by securities analysts; • recruitment or departure of key personnel; • investors’ general perception of us; • volatility inherent in prices of technology company stocks; • adverse publicity; • the volume of trading in our common stock, including sales upon exercise of outstanding options; • regulatory developments in our target markets affecting us, our customers or our competitors; • terrorist attacks or natural disasters or other such events impacting countries where we or our customers have operations; and • actual or perceived changes in general economic, industry and market conditions.
In addition, if the stock market in general experiences a loss of investor confidence, the trading price of our common stock could decline for reasonsunrelated to our business, financial condition or results of operations.
Some companies that have had volatile market prices for their securities have had securities class actions filed against them. If a suit were filed against us,regardless of its merits or outcome, it would likely result in substantial costs and divert management’s attention and resources. This could have a material adverseeffect on our business, operating results and financial condition. No public market for our common stock currently exists, and an active trading market may not develop or be sustained following this offering. Prior to this offering, there has been no public market for shares of our common stock. Although our common stock has been approved for listing on TheNasdaq Global Market, an active public trading market for our common stock may not develop or, if it develops, may not be maintained after this offering. Forexample, The Nasdaq Global Market imposes certain securities trading requirements, including minimum trading price, minimum number of stockholders andminimum market capitalization. Failure to meet those requirements for prolonged periods could result in delisting, which could further lower our stock price andtrading volumes. We and the representatives of the underwriters negotiated to determine the initial public offering price. The initial public offering price may behigher than the trading price of our common stock following this offering. Our actual results may differ significantly from any guidance that we may issue in the future. From time to time, we may release earnings guidance or other forward looking statements in our earnings releases, earnings conference calls or otherwise,regarding our future performance that represent our management’s estimates as of the date of release. If given, this guidance will be based on forecasts preparedby our management. These forecasts are not prepared with a view toward compliance with published accounting guidelines, and neither our registered publicaccountants nor any other independent expert or outside party compiles or examines the forecasts and, accordingly, no such person expresses any opinion or anyother form of assurance with respect to such forecasts. The principal reason that we may release guidance is to provide a basis for our management to discuss ourbusiness outlook with analysts and investors. We do not accept any
26

Table of Contents
responsibility for any projections or reports published by any such third persons. Guidance is necessarily speculative in nature, and it can be expected that someor all of the assumptions of any future guidance furnished by us may not materialize or may vary significantly from actual future results. We will incur increased costs and demands upon management as a result of complying with the laws and regulations affecting public companies, which couldadversely affect our operating results. As a public company, we will incur significant legal, accounting and other expenses that we did not incur as a private company, and greater expendituresmay be necessary in the future with the advent of new laws, regulations and stock exchange listing requirements pertaining to public companies. The Sarbanes-Oxley Act of 2002 and the Dodd-Frank Act of 2010, as well as rules subsequently implemented by the Securities and Exchange Commission and The NASDAQStock Market LLC, impose various requirements on public companies, including establishing effective internal controls and certain corporate governancepractices. Our management and other personnel have begun to devote a substantial amount of time to these compliance initiatives, and additional laws andregulations may divert further management resources. Moreover, if we are not able to comply with the requirements of new compliance initiatives in a timelymanner, the market price of our stock could decline, and we could be subject to investigations and other actions by The NASDAQ Stock Market LLC, theSecurities and Exchange Commission, or other regulatory authorities, which would require additional financial and management resources.
In particular, we will need to evaluate our internal controls over financial reporting in connection with Section 404 of the Sarbanes-Oxley Act, and ourauditors will be required to attest to our internal controls over financial reporting starting with our annual report for 2012. This assessment will need to includedisclosure of any material weaknesses in our internal control over financial reporting identified by our management, as well as our auditors’ attestation report onour internal controls over financial reporting. We are just beginning the costly and challenging process of compiling the system and processing documentationneeded to comply with such requirements, and as a public company and to manage our growth, we will be required to implement and maintain various othercontrol and business systems related to our equity, finance, treasury, information technology, other recordkeeping systems and other operations. We may not beable to complete our evaluation, testing and any required remediation in a timely fashion. During the evaluation and testing processes, if we identify one or morematerial weaknesses in our internal control over financial reporting, we will be unable to assert that our internal control over financial reporting is effective. If weare unable to assert that our internal control over financial reporting is effective, if our auditors are unable to express an opinion on the effectiveness of ourinternal control over financial reporting, or if we are unable to remedy any material weakness in our internal controls or to implement or maintain other effectivecontrol or business systems, our financial statements may be inaccurate, we may face restricted access to the capital markets and our stock price may be adverselyaffected. Concentration of ownership among our existing executive officers, directors and their affiliates may prevent new investors from influencing significantcorporate decisions. Upon the closing of this offering, our directors and executive officers and their affiliates will beneficially own, in the aggregate, approximately 58% of ouroutstanding common stock, assuming no exercise of the underwriters’ overallotment option. As a result, these stockholders will be able to determine substantiallyall matters requiring stockholder approval, including the election of directors and approval of significant corporate transactions, such as a merger or other sale ofour company or its assets. This concentration of ownership could limit the ability of other stockholders to influence corporate matters and may have the effect ofdelaying or preventing a third party from acquiring control over us. For information regarding the ownership of our outstanding stock by our executive officersand directors and their affiliates, see “Principal and Selling Stockholders.”
27

Table of Contents
Anti-takeover provisions contained in our certificate of incorporation, as well as provisions of Delaware law, could impair a takeover attempt. Our certificate of incorporation and Delaware law contain provisions that could have the effect of rendering more difficult or discouraging an acquisitiondeemed undesirable by our board of directors. Our corporate governance documents include provisions:
• authorizing blank check preferred stock, which could be issued by our board of directors without stockholder approval, with voting, liquidation,dividend and other rights superior to our common stock;
• classifying our board of directors, staggered into three classes, only one of which is elected at each annual meeting; • limiting the liability of, and providing indemnification to, our directors and officers; • limiting the ability of our stockholders to call and bring business before special meetings and to take action by written consent in lieu of a meeting;
• requiring advance notice of stockholder proposals for business to be conducted at meetings of our stockholders and for nominations of candidates forelection to our board of directors;
• controlling the procedures for the conduct and scheduling of stockholder meetings;
• providing the board of directors with the express power to postpone previously scheduled annual meetings and to cancel previously scheduled specialmeetings;
• limiting the determination of the number of directors on our board and the filling of vacancies or newly created seats on the board to our board ofdirectors then in office; and
• providing that directors may be removed by stockholders only for cause.
These provisions, alone or together, could delay hostile takeovers and changes in control or changes in our management.
As a Delaware corporation, we are also subject to provisions of Delaware law, including Section 203 of the Delaware General Corporation law, whichlimits the ability of stockholders owning in excess of 15% of our outstanding common stock to merge or combine with us.
Any provision of our certificate of incorporation or Delaware law that has the effect of delaying or deterring a change in control could limit the opportunityfor our stockholders to receive a premium for their shares of our common stock, and could also affect the price that some investors are willing to pay for ourcommon stock. Future sales of our common stock in the public market could cause our share price to fall. If our existing stockholders sell, or indicate an intent to sell, substantial amounts of our common stock in the public market, the trading price of ourcommon stock may be adversely affected and our ability to raise capital through the issuance of equity securities may be impeded. Based on the number of sharesoutstanding as of December 31, 2010, upon the closing of this offering, we will have 65,506,343 shares of our common stock outstanding, assuming no exerciseof our outstanding options.
All of these shares will be immediately freely tradeable without restrictions or further registration under the Securities Act of 1933, as amended, except forany shares held by our affiliates as defined in Rule 144 under the Securities Act. After giving effect to this offering, our affiliates, which include GA SS HoldingLLC, controlled by General Atlantic LLC, SSLLC Holdings, Inc., controlled by Benchmark Capital, certain entities affiliated with Housatonic Partners and ourofficers and directors beneficially will own in the aggregate 40,645,651 shares of common stock, representing beneficial ownership of approximately 58% of ouroutstanding stock. Such equityholders will be able to sell their common stock in the public market from time to time without registering them, subject to the lock-up agreements and certain limitations on the timing, amount and method of those sales
28

Table of Contents
imposed by Rule 144 under the Securities Act. Most of the remaining shares will be restricted as a result of securities laws, lock-up agreements as describedelsewhere in this prospectus or other contractual restrictions that restrict transfers for at least 180 days after the date of this prospectus subject to extension.However, these lock-up agreements are subject to various exceptions and in any event Morgan Stanley & Co. Incorporated may, in its sole discretion, release allor a portion of the shares subject to the lock-up agreements. See “Shares Eligible for Future Sale.”
Affiliates of Benchmark Capital, General Atlantic LLC and Housatonic Partners and certain other stockholders have contractual registration rights, subjectto certain conditions, to require us to file registration statements covering all of the shares of common stock (including restricted shares) that they own or toinclude their common stock in registration statements that we may file for ourselves or other stockholders. Following their registration and sale under theapplicable registration statement, those shares will become freely tradable. By exercising their registration rights and selling a large number of shares of commonstock, these holders could cause the price of our common stock to decline. In addition, the perception in the public markets that sales by them might occur couldalso adversely affect the market price of our common stock. Purchasers in this offering will experience immediate and substantial dilution in the book value of their investment. The initial public offering price per share is substantially higher than the pro forma net tangible book value per share of our common stock outstandingprior to this offering. As a result, investors purchasing common stock in this offering will experience immediate dilution of $8.06 per share. This dilution is due inlarge part to the fact that our earlier investors paid substantially less than the initial public offering price when they purchased their shares of common stock. Inaddition, we have issued options to acquire common stock at prices significantly below the initial public offering price. To the extent outstanding options areultimately exercised, there will be further dilution to investors in this offering. In addition, if the underwriters exercise their option to purchase additional sharesfrom us or if we issue additional equity securities, you will experience additional dilution. If securities or industry analysts do not publish or cease publishing research or reports about us, our business or our market, or if they change theirrecommendations regarding our stock, our stock price and trading volume could decline. The trading market for our common stock will depend in part on the research and reports that securities or industry analysts publish about us or ourbusiness. If any of these analysts cease coverage of our company, the trading price and trading volume of our stock could be negatively impacted. If analystsdowngrade our stock or publish unfavorable research about our business, our stock price would also likely decline. Our management will have broad discretion over the use of the proceeds we receive in this offering and might not apply the proceeds in ways that increasethe value of your investment. We expect to use the net proceeds from this offering to repay debt and for general corporate purposes, including possible investments in, or acquisitions of,businesses, joint ventures, services or technologies, working capital and capital expenditures. Our management will have broad discretion in the use of the netproceeds from this offering, and you will be relying on the judgment of our management regarding the application of these proceeds. The net proceeds may beused for corporate purposes that ultimately fail to increase the value of our business, which could cause the price of our common stock to decline. We do not expect to declare any dividends in the foreseeable future. We do not expect to pay cash dividends on our common stock in the foreseeable future following the closing of this offering. Any future dividend paymentswill be within the discretion of our board of directors and will depend on, among other things, our financial condition, results of operations, capital requirements,capital expenditure requirements, contractual restrictions, provisions of applicable law and other factors that our board of directors may deem relevant. We maynot generate sufficient cash from operations in the future to pay dividends on our common stock. See “Dividend Policy.”
29

Table of Contents
FORWARD LOOKING STATEMENTS
This prospectus contains forward looking statements that are based on our management’s beliefs and assumptions and on information currently available toour management. The forward looking statements are contained principally in “Prospectus Summary,” “Risk Factors,” “Management’s Discussion and Analysisof Financial Condition and Results of Operations,” “Business” and “Executive Compensation.” Forward looking statements include information concerning ourpossible or assumed future results of operations; estimates of service revenue opportunity under management; our ability to improve our customers’ renewal rates,margins and profitability; our ability to increase our revenue and contribution margin over time from new and existing customers; business strategies; technologydevelopment; protection of our intellectual property; investment and financing plans; liquidity; competitive position; the effects of competition; industryenvironment; and potential growth opportunities. Forward looking statements include all statements that are not historical facts and can be identified by termssuch as “anticipates,” “believes,” “could,” “estimates,” “expects,” “intends,” “may,” “might,” “likely,” “plans,” “potential,” “predicts, “projects,” “seeks,”“should,” “will,” “would” or similar expressions and the negatives of those terms.
Forward looking statements involve known and unknown risks, uncertainties and other factors that may cause our actual results, performance orachievements to be materially different from any future results, performance or achievements expressed or implied by the forward looking statements. We discussthese risks in greater detail in “Risk Factors” and elsewhere in this prospectus. Given these uncertainties, you should not place undue reliance on these forwardlooking statements. Also, forward looking statements represent our management’s beliefs and assumptions only as of the date of this prospectus. You should readthis prospectus and the documents that we have filed as exhibits to the registration statement, of which this prospectus is a part, completely and with theunderstanding that our actual future results may be materially different from what we expect.
Except as required by law, we assume no obligation to update these forward looking statements publicly, or to update the reasons actual results could differmaterially from those anticipated in these forward looking statements, even if new information becomes available in the future.
In addition, projections, assumptions and estimates of our future performance and the future performance of the industry in which we operate is necessarilysubject to a high degree of uncertainty and risk due to a variety of factors, including those described in “Risk Factors” and elsewhere in this prospectus. These andother factors could cause results to differ materially from those expressed in the estimates made by the independent parties and by us.
30

Table of Contents
USE OF PROCEEDS
We estimate that the net proceeds from our sale of 8,000,000 shares of common stock in this offering, after deducting underwriting discounts andcommissions and estimated offering expenses, will be approximately $71.4 million, or $88.0 million if the underwriters’ option to purchase additional shares isexercised in full.
We intend to use the net proceeds we receive from this offering to repay the loan balances outstanding under our revolving credit facility. As of March 2,2011, we had total indebtedness of $22.4 million outstanding under our revolving credit facility. The revolving credit facility has a maturity date of February 25,2013. Borrowings under the revolving credit facility bear interest at a base LIBOR rate plus a margin. The annual interest rate was equal to 5.75% as of March 2,2011. We amended our credit facility on February 24, 2011, as described under “Management’s Discussion and Analysis of Financial Condition and Results ofOperations—Liquidity and Capital Resources.” In the first quarter of 2011, borrowings under our revolving credit facility were used to repay the $15.5 millionbalance outstanding on our term loan and to remit $6.9 million of our $18.1 million payment to Oracle to settle amounts we owed to Sun Microsystems, net ofamounts Sun Microsystems owed us.
We expect to use the remaining net proceeds from this offering for working capital and other general corporate purposes, which may include sales andmarketing expenditures, general and administrative expenditures, developing new technologies and funding capital expenditures. In addition, if opportunitiesarise to acquire or invest in companies, businesses or technologies that we believe to be complementary, we may use a portion of the net proceeds for suchacquisition or investment. However, we do not have agreements or commitments for any specific acquisitions at this time. The amount and timing of any of theseexpenditures could vary depending on a number of factors, including developments related to our business and events outside of our control. Pending their use,we plan to invest our net proceeds from this offering in short-term, interest-bearing obligations, investment-grade instruments, certificates of deposit or direct orguaranteed obligations of the U.S. government. This offering is also intended to facilitate our future access to public markets.
We will not receive any proceeds from the sale of shares of common stock by the selling stockholders, including any shares of common stock sold by theselling stockholders in connection with the underwriters’ exercise of their option to purchase additional shares of common stock, although we will bear the costs,other than underwriting discounts and commissions, associated with the sale of these shares. The selling stockholders may include certain entities affiliated withor controlled by members of our board of directors.
DIVIDEND POLICY
We currently intend to retain all available funds and any future earnings for use in the operation of our business and do not anticipate paying any dividendson our common stock in the foreseeable future. Any future determination to declare dividends will be made at the discretion of our board of directors and willdepend on our financial condition, operating results, capital requirements, general business conditions and other factors that our board of directors may deemrelevant. In addition, our credit facility contains restrictions on our ability to declare and pay cash dividends on our capital stock.
31
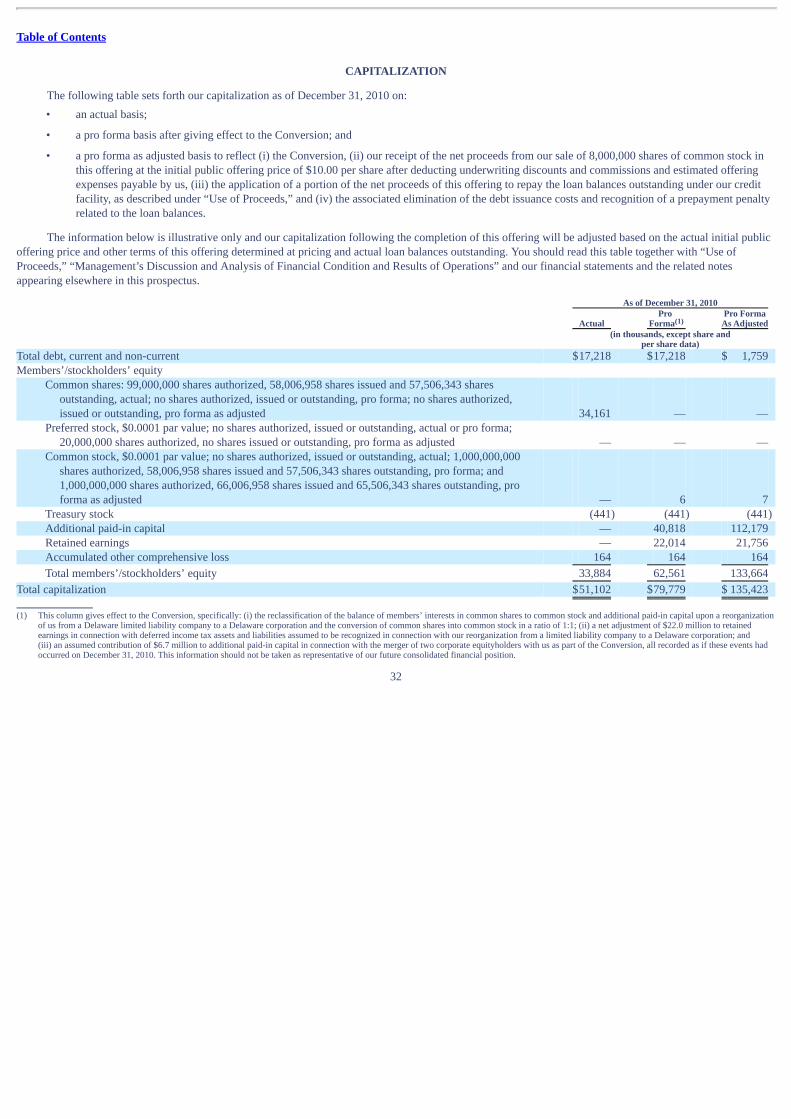
Table of Contents
CAPITALIZATION
The following table sets forth our capitalization as of December 31, 2010 on: • an actual basis; • a pro forma basis after giving effect to the Conversion; and
• a pro forma as adjusted basis to reflect (i) the Conversion, (ii) our receipt of the net proceeds from our sale of 8,000,000 shares of common stock inthis offering at the initial public offering price of $10.00 per share after deducting underwriting discounts and commissions and estimated offeringexpenses payable by us, (iii) the application of a portion of the net proceeds of this offering to repay the loan balances outstanding under our creditfacility, as described under “Use of Proceeds,” and (iv) the associated elimination of the debt issuance costs and recognition of a prepayment penaltyrelated to the loan balances.
The information below is illustrative only and our capitalization following the completion of this offering will be adjusted based on the actual initial public
offering price and other terms of this offering determined at pricing and actual loan balances outstanding. You should read this table together with “Use ofProceeds,” “Management’s Discussion and Analysis of Financial Condition and Results of Operations” and our financial statements and the related notesappearing elsewhere in this prospectus. As of December 31, 2010
Actual Pro
Forma Pro Forma
As Adjusted
(in thousands, except share and
per share data) Total debt, current and non-current $17,218 $17,218 $ 1,759 Members’/stockholders’ equity
Common shares: 99,000,000 shares authorized, 58,006,958 shares issued and 57,506,343 sharesoutstanding, actual; no shares authorized, issued or outstanding, pro forma; no shares authorized,issued or outstanding, pro forma as adjusted 34,161 — —
Preferred stock, $0.0001 par value; no shares authorized, issued or outstanding, actual or pro forma;20,000,000 shares authorized, no shares issued or outstanding, pro forma as adjusted — — —
Common stock, $0.0001 par value; no shares authorized, issued or outstanding, actual; 1,000,000,000shares authorized, 58,006,958 shares issued and 57,506,343 shares outstanding, pro forma; and1,000,000,000 shares authorized, 66,006,958 shares issued and 65,506,343 shares outstanding, proforma as adjusted — 6 7
Treasury stock (441) (441) (441) Additional paid-in capital — 40,818 112,179 Retained earnings — 22,014 21,756 Accumulated other comprehensive loss 164 164 164
Total members’/stockholders’ equity 33,884 62,561 133,664
Total capitalization $51,102 $79,779 $ 135,423
(1) This column gives effect to the Conversion, specifically: (i) the reclassification of the balance of members’ interests in common shares to common stock and additional paid-in capital upon a reorganization
of us from a Delaware limited liability company to a Delaware corporation and the conversion of common shares into common stock in a ratio of 1:1; (ii) a net adjustment of $22.0 million to retainedearnings in connection with deferred income tax assets and liabilities assumed to be recognized in connection with our reorganization from a limited liability company to a Delaware corporation; and(iii) an assumed contribution of $6.7 million to additional paid-in capital in connection with the merger of two corporate equityholders with us as part of the Conversion, all recorded as if these events hadoccurred on December 31, 2010. This information should not be taken as representative of our future consolidated financial position.
32
(1)

Table of Contents
The number of shares of our common stock to be outstanding following this offering is based on 57,506,343 shares of our common stock outstanding as ofDecember 31, 2010 and excludes:
• 17,722,947 shares of common stock issuable upon the exercise of options outstanding as of December 31, 2010, with a weighted average exerciseprice of $4.32 per share;
• 530,625 shares of common stock issuable upon the exercise of options granted after December 31, 2010, at an exercise price of $6.20 per share;
• 5,760,000 shares of common stock, plus any shares that have been reserved but not issued pursuant to awards granted under our 2004 Omnibus Share
Plan and our 2008 Option Plan, reserved for issuance under our 2011 Equity Incentive Plan, which will become effective in connection with thisoffering; and
• 900,000 shares of common stock reserved for issuance under our 2011 Employee Stock Purchase Plan, which will become effective in connectionwith this offering.
Pursuant to the limited liability company agreement of ServiceSource International, LLC in existence prior to our conversion to a corporation, we were
required to pay cash distributions to our equityholders to fund their tax obligations in respect of their equity interests in 2008 and 2010 in aggregate amounts of$5.2 million and $2.5 million, respectively. Distributions to equityholders for the period from January 1, 2011 to the date of the Conversion are dependent ontaxable income, if any, attributable to the equityholders for such period.
33

Table of Contents
DILUTION
If you invest in our common stock, your interest will be diluted to the extent of the difference between the amount per share paid by purchasers of shares ofcommon stock in this offering and the pro forma as adjusted net tangible book value per share of common stock immediately after completion of this offering.
At December 31, 2010, our pro forma net tangible book value was approximately $56.0 million, or $0.97 per share of common stock. Pro forma nettangible book value per share represents the amount of our tangible assets less our liabilities, divided by the shares of common stock outstanding at December 31,2010 after giving effect to the Conversion. After giving effect to our sale of 8.0 million shares of common stock in this offering at the initial public offering priceof $10.00 per share, and after deducting underwriting discounts and commissions and estimated offering expenses, our pro forma as adjusted net tangible bookvalue at December 31, 2010 would have been $127.2 million, or $1.94 per share of common stock. This represents an immediate increase in pro forma asadjusted net tangible book value of $0.97 per share to existing stockholders and immediate dilution of $8.06 per share to new investors.
The following table illustrates this dilution:
Initial public offering price per share $10.00 Pro forma net tangible book value per share as of December 31, 2010 $0.97 Increase per share attributed to this offering 0.97
Pro forma as adjusted net tangible book value per share 1.94
Dilution per share to new investors $ 8.06
(1) Our pro forma net tangible book value and pro forma net book value per share as of December 31, 2010 were calculated as follows (in thousands, except per share amount): Stockholders’ equity $ 33,884
Adjustments to deferred income tax assets and deferred income tax liabilities obtained in connection with the merger that is part of our Conversion, reflected as additional contributionfrom certain shareholders and a net adjustment to additional paid-in capital 6,663
Adjustments to deferred income tax assets and deferred income tax liabilities in connection with the Conversion, with a resulting net adjustment to retained earnings 22,014 Goodwill (6,334) Deferred debt issuance costs (273)
Pro forma net tangible book value $ 55,954
Pro forma shares outstanding 57,506 Pro forma net tangible book value per share $ 0.97
(2) Our pro forma as adjusted net tangible net book value and pro forma as adjusted net book value per share as of December 31, 2010 were calculated as follows (in thousands, except per share amount): Pro forma net tangible book value $ 55,954
Net proceeds from initial public offering 71,361 Recognition of a pre-payment penalty related to the retirement of our term loan, net of tax (92)
Pro forma net tangible book value $127,223
Pro forma as adjusted shares of common stock outstanding 65,506 Pro forma as adjusted net tangible book value per share $ 1.94
If the underwriters exercise their option to purchase additional shares of our common stock from us in full, the pro forma as adjusted net tangible book
value per share would be $2.14, the increase in pro forma net tangible book value per share to existing stockholders would be $1.17 and the dilution per share tonew investors purchasing shares in this offering would be $7.86.
34
(1)
(2)
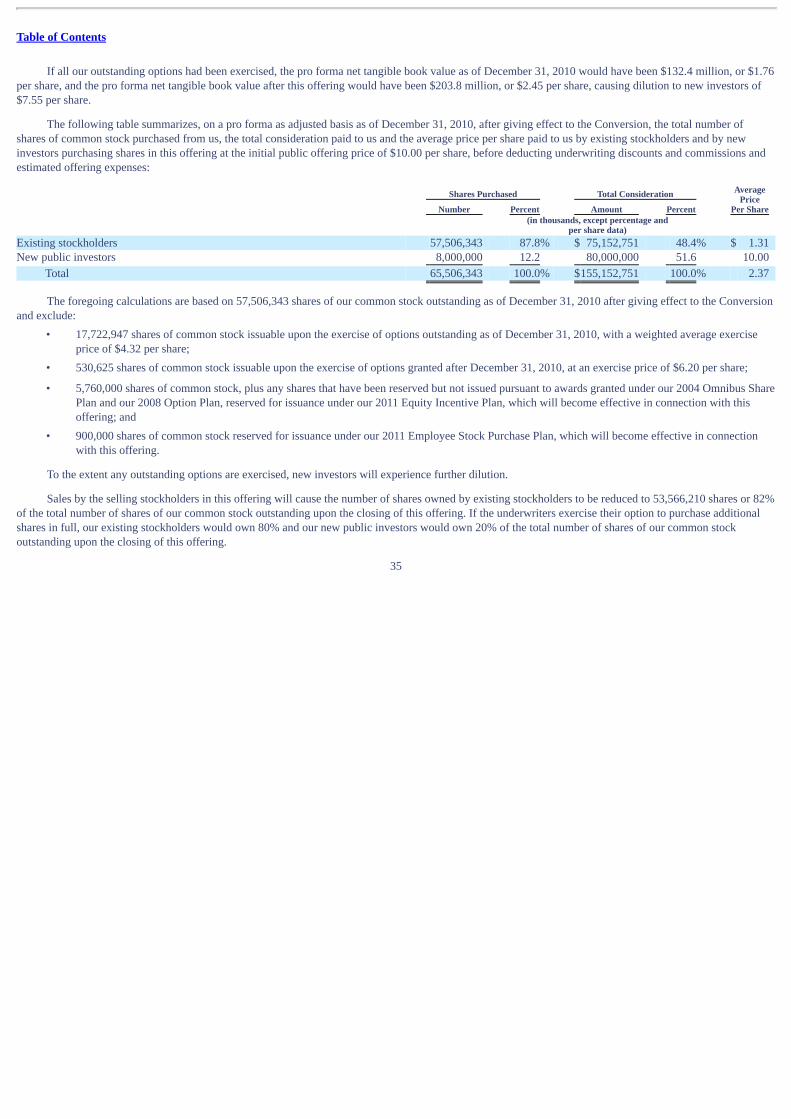
Table of Contents
If all our outstanding options had been exercised, the pro forma net tangible book value as of December 31, 2010 would have been $132.4 million, or $1.76per share, and the pro forma net tangible book value after this offering would have been $203.8 million, or $2.45 per share, causing dilution to new investors of$7.55 per share.
The following table summarizes, on a pro forma as adjusted basis as of December 31, 2010, after giving effect to the Conversion, the total number ofshares of common stock purchased from us, the total consideration paid to us and the average price per share paid to us by existing stockholders and by newinvestors purchasing shares in this offering at the initial public offering price of $10.00 per share, before deducting underwriting discounts and commissions andestimated offering expenses:
Shares Purchased Total Consideration AveragePrice
Per Share Number Percent Amount Percent
(in thousands, except percentage and
per share data) Existing stockholders 57,506,343 87.8% $ 75,152,751 48.4% $ 1.31 New public investors 8,000,000 12.2 80,000,000 51.6 10.00
Total 65,506,343 100.0% $155,152,751 100.0% 2.37
The foregoing calculations are based on 57,506,343 shares of our common stock outstanding as of December 31, 2010 after giving effect to the Conversion
and exclude:
• 17,722,947 shares of common stock issuable upon the exercise of options outstanding as of December 31, 2010, with a weighted average exerciseprice of $4.32 per share;
• 530,625 shares of common stock issuable upon the exercise of options granted after December 31, 2010, at an exercise price of $6.20 per share;
• 5,760,000 shares of common stock, plus any shares that have been reserved but not issued pursuant to awards granted under our 2004 Omnibus Share
Plan and our 2008 Option Plan, reserved for issuance under our 2011 Equity Incentive Plan, which will become effective in connection with thisoffering; and
• 900,000 shares of common stock reserved for issuance under our 2011 Employee Stock Purchase Plan, which will become effective in connectionwith this offering.
To the extent any outstanding options are exercised, new investors will experience further dilution.
Sales by the selling stockholders in this offering will cause the number of shares owned by existing stockholders to be reduced to 53,566,210 shares or 82%
of the total number of shares of our common stock outstanding upon the closing of this offering. If the underwriters exercise their option to purchase additionalshares in full, our existing stockholders would own 80% and our new public investors would own 20% of the total number of shares of our common stockoutstanding upon the closing of this offering.
35

Table of Contents
SELECTED CONSOLIDATED FINANCIAL DATA
We have derived the selected consolidated statements of operations data for the years ended December 31, 2008, 2009 and 2010 and selected consolidatedbalance sheet data as of December 31, 2009 and 2010 from our audited consolidated financial statements and related notes included elsewhere in this prospectus.We have derived the selected consolidated statements of operations data for the years ended December 31, 2006 and 2007 and the balance sheet data as ofDecember 31, 2006, 2007 and 2008 from our audited consolidated financial statements not included in this prospectus. Our historical results are not necessarilyindicative of the results to be expected for any future period. The following selected consolidated financial data should be read in conjunction with“Management’s Discussion and Analysis of Financial Condition and Results of Operations” and our consolidated financial statements and related notes includedelsewhere in this prospectus. Years Ended December 31, 2006 2007 2008 2009 2010 (in thousands, except per share amounts) Net revenue $45,918 $75,189 $100,280 $110,676 $152,935 Cost of revenue 22,442 39,224 56,965 58,877 90,048
Gross profit 23,476 35,965 43,315 51,799 62,887
Operating expenses Sales and marketing 6,107 13,119 20,486 23,182 35,119 Research and development — — 1,160 2,054 7,188 General and administrative 12,268 10,475 10,571 13,777 19,378 Amortization of intangible assets 1,677 912 857 68 —
Total operating expenses 20,052 24,506 33,074 39,081 61,685
Income from operations 3,424 11,459 10,241 12,718 1,202 Interest expense (2,060) (2,305) (2,209) (1,116) (1,271) Loss on extinguishment/modification of debt — — (561) — (144) Other income (expense), net (33) (118) (1,497) 639 (207)
Income (loss) before provision for (benefit from) income taxes 1,331 9,036 5,974 12,241 (420) Income tax (benefit) provision — (632) 1,153 1,866 2,147
Net income (loss) $ 1,331 $ 9,668 $ 4,821 $ 10,375 $ (2,567)
Net income (loss) per common share : Basic $ 0.03 $ 0.17 $ 0.09 $ 0.18 $ (0.04)
Diluted $ 0.02 $ 0.16 $ 0.08 $ 0.18 $ (0.04)
Cash distributions per common share $ 0.43 $ 0.09 $ 0.09 $ — $ 0.04
Weighted-average shares used in computing net income (loss) per common share : Basic 45,908 55,936 56,209 56,750 57,284
Diluted 56,461 58,706 58,733 58,912 57,284
Pro forma net loss per common share : Basic $ 0.00
Diluted $ 0.00
Pro forma weighted-average shares used in computing net loss per common share : Basic 59,242
Diluted 59,242
36
(1)
(1)
(1)
(1)
(1)
(2)
(3)
(2)
(4)
(4)

Table of Contents
(1) Effective January 1, 2006, we adopted FASB ASC Topic 718, Accounting for Stock-Based Compensation. Reported amounts include stock-based compensation expense as follows:
Years Ended December 31, 2006 2007 2008 2009 2010 (in thousands) Cost of revenue $ 114 $1,096 $1,271 $ 914 $1,126 Sales and marketing 264 1,100 1,570 2,340 2,993 Research and development — — — 541 803 General and administrative 383 1,680 2,608 2,265 3,167
Total stock-based compensation $ 761 $3,876 $5,449 $6,060 $8,089
(2) Our basic net income (loss) per common share is calculated by dividing the net income (loss) by the weighted-average number of shares of common stock outstanding for the period.(3) Pursuant to our limited liability company agreement, we were required to pay cash distributions to our members to fund their tax obligations in respect of their equity interests. All other distributions are
determined by our directors in their sole discretion. Tax distributions to members were $4.9 million, $5.1 million, $5.2 million, $0 and $2.5 million in 2006, 2007, 2008, 2009, and 2010, respectively. In2006, the directors approved an additional $15.0 million discretionary aggregate distribution to all members.
(4) Our pro forma net loss per common share gives effect to the Conversion and to an assumed issuance of only that number of shares that would have been required to be issued to repay the loan balancesoutstanding under our credit facility as of December 31, 2010 assuming the issuance of such shares at the initial public offering price of $10.00 per share net of offering costs. The diluted pro forma net lossper common share calculation also assumes the conversion, exercise, or issuance of all potential common shares, unless the effect of inclusion would result in the reduction of a loss or the increase in netincome per common share. See note 4 “Pro Forma Information (Unaudited)” to our Consolidated Financial Statements included elsewhere in this prospectus. As the Company was at a net loss position in2010, there was no dilutive effect on net loss per common share. Therefore, both basic and dilutive pro forma net loss per common share were $0.00 for 2010.
As of December 31, 2006 2007 2008 2009 2010 (in thousands) Consolidated Balance Sheet Data: Cash $ 4,491 $13,147 $ 3,780 $13,169 $ 22,652 Working capital 6,883 15,175 12,319 19,099 18,135 Total assets 31,154 45,367 51,712 69,580 108,103 Term loan, current and non-current 20,069 20,000 19,625 16,835 15,459 Obligations under capital leases, current and non-current 113 — 151 773 1,759 Total members’/stockholders’ equity (deficit) (799) 7,937 13,482 30,331 33,884 (1) Working capital is defined as current assets less current liabilities.
37
(1)

Table of Contents
MANAGEMENT’S DISCUSSION AND ANALYSIS OF FINANCIAL CONDITIONAND RESULTS OF OPERATIONS
The following Management’s Discussion and Analysis of Financial Condition and Results of Operations should be read together with “Prospectus
Summary—Summary Consolidated Financial Data,” “Selected Consolidated Financial Data” and our consolidated financial statements and accompanyingnotes included elsewhere within this prospectus. This discussion includes both historical information and forward-looking information that involves risks,uncertainties and assumptions. Our actual results may differ materially from management’s expectations as a result of various factors, including but not limited tothose discussed in the sections titled “Risk Factors” and “Special Note Regarding Forward Looking Statements.” While our outstanding equity as a limitedliability company prior to the Conversion was called “common shares,” unless otherwise indicated in this prospectus, we refer to such common shares in thisprospectus as common stock for the periods prior to the Conversion for ease of comparison. Similarly, we refer to members’ equity in this prospectus asstockholders’ equity. Overview We manage the service contract renewals process for renewals of maintenance, support and subscription agreements on behalf of our customers. Ourintegrated solution consists of a suite of cloud applications, dedicated service sales teams working under our customers’ brands and a proprietary Service RevenueIntelligence Platform. By integrating software, managed services and data, we address the critical steps of the renewals process including data management,quoting, selling and service revenue business intelligence. Our business is built on our pay-for-performance model, whereby our revenues are based on the servicerenewals customers achieve with our solution. As of December 31, 2010, we managed over 100 engagements across more than 55 customers, representing over$5 billion in service revenue opportunity under management. During the years ended December 31, 2008, 2009 and 2010, the actual value of qualified endcustomer contracts delivered to us totaled $1.9 billion, $2.8 billion and $3.7 billion, respectively. We had approximately 60 and 80 engagements as ofDecember 31, 2008 and 2009, respectively.
We were formed in November 2002 as a limited liability company, and shortly thereafter we purchased certain assets of a business originally started byservice sales representatives from a major technology company. Since then we have refined our business model, developed and expanded our service sales teams,our suite of cloud based applications and our Service Revenue Intelligence Platform, and opened additional sales centers in the United States, Europe and Asiaand a global sales operations center in Kuala Lumpur, Malaysia. We broadened our customer focus from technology companies to also include technology-enabled healthcare and life sciences companies. We have experienced rapid growth in our operations in recent periods, as indicated by the following:
• Our revenue has increased from $45.9 million in 2006 to $152.9 million in 2010, representing a compound annual growth rate of 35%. During 2010,our revenue represented an increase of 38% as compared to 2009.
• Our engagements have grown from approximately 40 as of December 31, 2006 to over 100 as of December 31, 2010.
• As of December 31, 2010, we had more than 1,500 employees, with offices in Colorado, Tennessee, the United Kingdom, Ireland, Malaysia andSingapore in addition to our corporate headquarters in San Francisco.
In 2010, Oracle acquired our then largest customer, Sun Microsystems, and terminated our contract with Sun Microsystems effective as of September 30,
2010. Sun Microsystems accounted for $22.8 million, $26.3 million and $19.6 million, or 23%, 24% and 13%, of our total revenue for the years ended December31, 2008, 2009 and 2010, respectively. While the loss of revenues from Sun Microsystems is significant, we have added
38

Table of Contents
additional customers and engagements throughout 2010 and expect to continue to expand our business irrespective of the loss of Sun Microsystems. In the nearterm, however, we expect the loss of Sun Microsystems to have an adverse effect on our gross margins, operating margins and cash flows.
We are currently in the midst of a significant investment cycle in which we have taken steps designed to drive our future growth and profitability. We planto further build out our infrastructure, develop our technology, offer additional cloud based applications and hire additional sales, service sales and otherpersonnel.
We initially funded our business primarily with investments from our founders, certain other small investors and the venture capital firm HousatonicPartners. As our business has grown, we have funded our business primarily with cash flows from operations, and returned capital to equityholders, including ourfounders. Affiliates of Benchmark Capital and General Atlantic LLC invested in our company in 2004 and 2007, respectively, and Housatonic made an additionalinvestment in 2008. All of these investments involved the direct or indirect purchase of equity from our existing equityholders, including our founders. We drewdown funds from a term loan in 2006, with the proceeds used primarily to fund distributions to our equityholders as required under our limited liability companyagreement, and remaining proceeds used for general corporate purposes. In April 2008, we entered into a five year credit facility agreement with various financialinstitutions, the proceeds of which were primarily used to refinance outstanding debt under several prior debt agreements. We were originally formed as aDelaware limited liability company. On the date hereof, we completed the Conversion pursuant to which ServiceSource International, LLC converted toServiceSource International, Inc., a Delaware corporation. Key Business Metrics In assessing the performance of our business, we consider a variety of business metrics in addition to the financial metrics discussed below under “—Basisof Presentation.” These key metrics include service revenue opportunity under management and number of engagements.
Service Revenue Opportunity Under Management. At December 31, 2010, we estimated our opportunity under management to be over $5 billion. Servicerevenue opportunity under management (“opportunity under management”) is a forward-looking metric and is our estimate, as of a given date, of the value of allend customer service contracts that we will have the opportunity to sell on behalf of our customers over the subsequent twelve-month period. Opportunity undermanagement is not a measure of our expected revenue.
We estimate the value of such end customer contracts based on a combination of factors, including the value of end customer contracts made available to usby customers in past periods, the minimum value of end customer contracts that our customers are required to give us the opportunity to sell pursuant to the termsof their contracts with us, periodic internal business reviews of our expectations as to the value of end customer contracts that will be made available to us bycustomers, the value of end customer contracts included in the SPA and collaborative discussions with our customers assessing their expectations as to the valueof service contracts that they will make available to us for sale. While the minimum value of end customer contracts that our customers are required to give usrepresents a portion of our estimated opportunity under management, a significant portion of the opportunity under management is estimated based on the otherfactors described above. As our experience with our business, our customers and their contracts has grown, we have continually refined the process, improved theassumptions and expanded the data related to our calculation of opportunity under management. As a result, because opportunity under management is inherentlyan estimate based on the process, assumptions and data at the relevant time, the metric is not amenable to retroactive revision and we cannot meaningfullydetermine what we would have estimated if we had followed different processes or used different assumptions and data in the past. We thus have not presentedopportunity under management for any periods prior to December 31, 2010. For prior periods, we have instead provided the actual value of qualified endcustomer contracts delivered to us in such periods. The actual value of qualified end customer contracts delivered to us is a historical metric.
39

Table of Contents
When estimating service revenue opportunity under management, we must, to a large degree, rely on the assumptions described above, which may proveincorrect. These assumptions are inherently subject to significant business and economic uncertainties and contingencies, many of which are beyond our control.Our estimates therefore may prove inaccurate, causing the actual value of end customer contracts delivered to us in a given twelve-month period to differ fromour estimate of opportunity under management. These factors include: • the extent to which customers deliver a greater or lesser value of end customer contracts than may be required or otherwise expected; • roll-overs of unsold service contract renewals from prior periods to the current period or future periods; • changes in the pricing or terms of service contracts offered by our customers; • increases or decreases in the end customer base of our customers;
• the extent to which the renewal rates we achieve on behalf of a customer early in an engagement affect the amount of opportunity that the customermakes available to us later in the engagement;
• customer cancellations of their contracts with us due to acquisitions or otherwise; and • changes in our customers’ businesses, sales organizations, sales processes or priorities.
In addition, opportunity under management reflects our estimate for a forward twelve-month period and should not be used to estimate our opportunity forany particular quarter within that period. The value of end customer contracts actually delivered during a twelve-month period should not be expected to occur ineven quarterly increments due to seasonality and other factors impacting our customers and their end customers.
The actual value of qualified end customer contracts delivered to us by our customers affects the amount of revenue we can earn in a given period. Theactual value of qualified end customer contracts delivered to us is a historical metric. For a given period, it is a measure of the aggregate value of all end customercontracts identified for us by our customers, reviewed by us for accuracy, uploaded to our service revenue management platform and made available for renewalon behalf of our customers during the period. During the years ended December 31, 2008, 2009 and 2010, the actual value of qualified end customer contractsdelivered to us totaled $1.9 billion, $2.8 billion and $3.7 billion, respectively. The actual value of qualified end customer contracts delivered to us is calculatedirrespective of whether we renew the contracts.
Service revenue opportunity under management is a forward-looking estimate of the end customer contracts that we will have the opportunity to sell overthe subsequent twelve-month period, while the actual value of qualified end customer contracts is a historical measure of the amount of contracts we actually hadthe opportunity to sell over the previous twelve-month period.
Our revenue also depends upon our close rates and commissions. Our close rate is the percentage of our opportunity under management that we renew onbehalf of our customers. Our commission rate is an agreed-upon percentage of the renewal value of end customer contracts that we sell on behalf of ourcustomers.
Our close rate is impacted principally by our ability to successfully sell service contracts on behalf of our customers. Other factors impacting our close rateinclude: the manner in which our customers price their service contracts for sale to their end customers; the stage of life-cycle associated with the products andunderlying technologies covered by the service contracts offered to the end customer; the extent to which our customers or their competitors introduce newproducts or underlying technologies; the nature, size and age of the service contracts; and the extent to which we have managed the renewals process for similarproducts and underlying technologies in the past.
In determining commission rates for an individual engagement, various factors, including our close rates, as described above, are evaluated. These factorsinclude: historical, industry-specific and customer-specific renewal rates for similar service contracts; the magnitude of the opportunity under management in aparticular engagement; the number of end customers associated with these opportunities; and the opportunity to receive
40

Table of Contents
additional performance commissions when we exceed certain renewal levels. We endeavor to set our commission rates at levels commensurate with these factorsand other factors that may be relevant to a particular engagement. Accordingly, our commission rates vary, often significantly, from engagement to engagement.In addition, we sometimes agree to lower commission rates for engagements with significant opportunity under management.
Renewal Rates. Our ability to attract and retain new customers and add new engagements depends in part on the degree to which we improve renewal ratesfor our customers as compared to their historical renewal rates. In general, we calculate renewal rates for new customers or engagements by looking at the dollarvalue of end customer contracts delivered to us for renewal and the dollar value of the portion of those end customer contracts that were actually renewed. Theserenewals can occur over the course of several quarters. We then compare the renewal rates we generate to the renewal rates achieved over prior periods by thecustomer based on the data provided by the customer during the SPA.
To calculate the renewal rate for each customer, we take the value of the end customer contracts, including upsells, that were renewed and divide it by thevalue of contracts that were provided for renewal. The renewal rate can exceed 100% when an existing service contract is renewed for an amount greater than theoriginal value of the contract. We calculate improvement in renewal rates for a given period by taking a simple average of the improvement in the renewal rate foreach customer.
For example, for new engagements added in 2009, we generated renewal rates that increased by an average of over 15 percentage points over the renewalrates achieved by the customer based on the SPA data. This renewal rate increase is based on the value of end customer contracts delivered to us for renewalpursuant to such engagements during the first six months of 2010 and renewed in 2010.
In calculating the historical renewal rates of customers, we rely on the accuracy and completeness of the customer renewal data we receive during the SPA.Changes in renewal rates may result from several external factors unrelated to our performance, including the nature of the contracts, the popularity of theproducts and changing economic conditions, among others. While we believe the example provided above is representative of our renewal rate capabilities,changes in renewal rates have varied widely and will continue to vary widely from period to period and from customer to customer. We cannot assure you thatsimilar improvements in renewal rates will occur in the future.
In this prospectus, we use “renewal rate” and “close rate” interchangeably.
Number of Engagements. We track the number of engagements we have with our customers. We often have multiple engagements with a single customer,particularly where we manage the sales of service renewals relating to different product lines, technologies, types of contracts or geographies for the customer.When the set of renewals we manage on behalf of a customer is associated with a separate customer contract or a distinct product set, type of end customercontract or geography and therefore requires us to assign a dedicated service sales team to manage the renewals, we designate the set of renewals, and associatedrevenues and costs to us as a unique engagement. For example, we may have one engagement consisting of a dedicated service sales team selling maintenancecontract renewals of a particular product for a customer in the United States and another engagement consisting of a dedicated sales team selling warrantycontract renewals of a different product for the same customer in Europe. These would count as two engagements. We had approximately 60, 80 and 100engagements as of December 31, 2008, 2009 and 2010, respectively.
Transactions. Since our inception, we have managed over two million service renewal transactions. Our references to transactions in this prospectusinclude interactions with end customers that led to successful renewals and those that did not. Factors Affecting our Performance Sales Cycle. We sell our integrated solution to our customers through a sales organization. At the beginning of the sales process, our quota-carrying salesrepresentatives contact prospective customers and educate them
41

Table of Contents
about our offerings. Educating prospective customers about the benefits of our solution can take time, as many of these prospects have not historically relied uponintegrated solutions like ours for service revenue management, nor have they typically put out a formal request for proposal or otherwise made a decision to focuson this area. As part of the education process, we utilize our solutions design team to perform the SPA of our prospect’s service revenue. The SPA includes ananalysis of best practices and benchmarks the prospect’s service revenue against industry peers. Through the SPA process, which typically takes several weeks,we are able to assess the characteristics and size of the prospect’s service revenue, identify potential areas of performance improvement and formulate ourproposal for managing the prospect’s service revenue. The length of our sales cycle for a new customer, inclusive of the SPA process and measured from our firstformal discussion with the customer until execution of a new customer contract, is typically longer than six months.
We generally contract with new customers to manage a specified portion of their service revenue opportunity, such as the opportunity associated with aparticular product line or technology, contract type or geography. We negotiate the customized terms of our customer contracts, including commission rates, basedon the output of the SPA, including the areas identified for improvement. Once we demonstrate success to a customer with respect to the opportunity undercontract, we seek to expand the scope of our engagement to include other opportunities with the customer. For some customers, we manage all or substantially allof their service contract renewals.
Implementation Cycle. After entering into an engagement with a new customer, and to a lesser extent after adding an engagement with an existingcustomer, we incur sales and marketing expenses related to the commissions owed to our sales personnel. The commissions are based on the estimated totalcontract value, a material portion of which is expensed upfront and the remaining portion of which is expensed over a period of eight to fourteen months,including commissions paid on multi-year contracts. We also make upfront investments in technology and personnel to support the engagement. These expensesare typically incurred one to three months before we begin generating sales and recognizing revenue. Accordingly, in a given quarter, an increase in newcustomers, and, to a lesser extent, an increase in engagements with existing customers, or a significant increase in the contract value associated with such newcustomers and engagements, will negatively impact our gross margin and operating margins until we begin to achieve anticipated sales levels associated with thenew engagements.
Although we expect new customer engagements to contribute to our operating profitability over time, in the initial periods of a customer relationship, thenear term impact on our profitability can be negative due to upfront costs we incur, the lower initial level of associated service sales team productivity and lack ofmature data and technology integration with the customer. As a result, an increase in the mix of new customers as a percentage of total customers may initiallyhave a negative impact on our operating results. Similarly, a decline in the ratio of new customers to total customers may positively impact our operating results.This is illustrated by our analysis of new customers signed in 2007, which generated a modest contribution margin (as defined below) of 1% for the 2007 fiscalyear. However, during 2010, the same set of customers generated a contribution margin of approximately 50%. The initial lower margin is attributable in largepart to the fact that we incurred significant costs in 2007 to hire and train the service sales teams for the new customer engagements, in addition to payingcommissions to our own sales representatives for signing the new customers, prior to generating meaningful revenues from these customer engagements. Theimprovement in contribution margin over time is due primarily to the ramping of service sales team productivity, the decrease or absence of additional salesrepresentative commission payments, and, to a lesser extent, improvement in data accuracy through technology and automation of processes.
We define contribution margin for a period as the excess of the revenue recognized from the customer over the estimated expenses for the period associatedwith supporting the customer and managing the service contract renewals process for them, expressed as a percentage of associated revenue. The expensesallocated to the customer include personnel costs associated with the service sales teams who support that customer, such as salaries and benefits, allocatedmanagement overhead expenses based on a percentage of revenue and service sales commissions. These expenses exclude the allocation of costs associated withuse of infrastructure, facilities and company-wide resources that are available to all service sales teams.
42

Table of Contents
Although we believe the estimates and assumptions we used to estimate the expenses are reasonable, the estimated expenses and resulting contributionmargin could vary significantly from the amounts disclosed above had we used different estimates and assumptions. Moreover, we cannot assure you that we willexperience similar contribution margins from customers added in other years or in future periods. You should not rely on the estimated expenses or contributionmargin as being indicative of our future performance. Because of our growing customer base, we expect that there will be times when large numbers of ourcustomers are in the initial phases of their relationship with us or have a material expansion of their existing engagements with us. In these scenarios, ouroperating results will be negatively impacted over the near term.
Contract Terms. Under our pay-for-performance model, we earn commissions based on the value of service contracts we sell on behalf of our customers. Insome cases, we earn additional performance-based commissions for exceeding pre-determined service renewal targets. These commissions, includingperformance-based commissions, represent substantially all of our revenue.
Since 2009, our new customer contracts have typically had a term of 36 months, although we sometimes have contract terms of up to 60 months. Oldercustomer contracts typically have a term of 12 months. Our contracts generally require our customers to deliver a minimum value of qualifying service revenuecontracts for us to renew on their behalf during a specified period. To the extent that our customers do not meet their minimum contractual commitments over aspecified period, they may be subject to fees for the shortfall. Our customer contracts are cancelable on relatively short notice, subject in most cases to thepayment of an early termination fee by the customer. The amount of this fee is based on the length of the remaining term and value of the contract.
We typically invoice our customers on a monthly basis based on commissions we earn during the prior month, and with respect to performance-basedcommissions, on a quarterly basis based on our overall performance during the prior quarter. Amounts invoiced to our customers are recognized as revenue in theperiod in which our services are performed or, in the case of performance commissions, when the performance condition is determinable. Because the invoicingfor our services generally coincides with or immediately follows the sale of service contracts on behalf of our customers, we do not generate or report asignificant deferred revenue balance. However, the combination of minimum contractual commitments, combined with our success in generating improvedrenewal rates for our customers, and our customers’ historical renewal rates, provides us with revenue visibility. In addition, the performance improvementpotential identified by our SPA process provides us with revenue visibility for new customers.
M&A Activity. Our customers in the technology sector participate in an active environment for mergers and acquisitions. Large technology companies havemaintained active acquisition programs to increase the breadth and depth of their product and service offerings and small and mid-sized companies havecombined to better compete with large technology companies. A number of our customers have merged, purchased other companies or been acquired by othercompanies. We expect merger and acquisition activity to continue to occur in the future.
The impact of these transactions on our business can vary. Acquisitions of other companies by our customers can provide us with the opportunity to pursueadditional business to the extent the acquired company is not already one of our customers. Similarly, when a customer is acquired, we may be able to use ourrelationship with the acquired company to build a relationship with the acquirer. In some cases we have been able to maintain our relationship with an acquiredcustomer even where the acquiring company handles its other service contract renewals through internal resources. In other cases, however, acquirers haveelected to terminate or not renew our contract with the acquired company. For example, Oracle terminated our contracts with Sun Microsystems effective as ofSeptember 30, 2010, as discussed in more detail under “Results of Operations—Years Ended December 31, 2010 and 2009—Net Revenue,” and had previouslyterminated our contract with another customer, BEA Systems, in April 2008.
43

Table of Contents
Economic Conditions. An improving economic outlook generally has a positive, but mixed, impact on our business. As with most businesses, improvedeconomic conditions can lead to increased end customer demand and sales. In particular, within the technology sector, we believe that the recent economicdownturn led many companies to cut their expenses by choosing to let their existing maintenance, support and subscription agreements lapse. An improvingeconomy may have the converse effect.
However, an improving economy may also cause companies to purchase new hardware, software and other technology products, which we generally do notsell on behalf of our customers, instead of purchasing maintenance, support and subscription services for existing products. To the extent this occurs, it wouldhave a negative impact on our opportunities in the near term that would partially offset the benefits of an improving economy.
Adoption of “Software-as-a-Service” Solutions. Within the software industry, there is a growing trend toward providing software to customers using asoftware-as-a-service model. Under this model, software-as-a-service companies provide access to software applications to customers on a remote basis, andprovide their customers with a subscription to use the software, rather than licensing software to their customers. Software-as-a-service companies face a distinctset of challenges with respect to customer renewals, given the potentially lower switching costs for customers utilizing their solutions, and are more reliant onrenewals for their long-term revenues than traditional software companies. Given the strategic importance of renewals to their model, software-as-a-servicecompanies may be less inclined than traditional software companies to rely on third-party solutions such as ours to manage the sale of renewals of subscriptioncontracts. We have tailored our solution to address the needs of software-as-a-service companies in this area and expect to continue to develop and enhance oursolution as this market grows. Basis of Presentation Net Revenue Substantially all of our net revenue is attributable to commissions we earn from the sale of renewals of maintenance, support and subscription agreementson behalf of our customers. We generally invoice our customers for our services in arrears on a monthly basis for sales commissions, and on a quarterly basis forcertain performance sales commissions; accordingly, we typically have no deferred revenue related to these services. We do not set the price, terms or scope ofservices in the service contracts with end customers and do not have any obligations related to the underlying service contracts between our customers and theirend customers.
For a limited number of historical engagements, our services included the sale of service contracts as well as the related invoicing and cash collections onbehalf of customers. Under these arrangements, commissions are considered earned when we receive cash payment from end customers. As of December 31,2010, we no longer had any such customer engagements.
We also earn revenue from the sale of subscriptions to our cloud based applications. To date, subscription revenue has been insignificant. Subscription feesare accounted for separately from commissions and they are billed on either a monthly or quarterly basis in advance and revenue is recognized ratably over therelated subscription term.
We have generated a significant portion of our revenue from a limited number of customers. For the years ended December 31, 2008, 2009 and 2010, ourtop ten customers in each period accounted for 67%, 65% and 54% of our net revenue, respectively. In addition, during the same periods, Sun Microsystemsaccounted for 23%, 24%, and 13% of our net revenue, respectively. As discussed above, Oracle terminated our contracts with Sun Microsystems effective as ofSeptember 30, 2010. In connection with a settlement agreement with Oracle on February 28, 2011, we expect to recognize net revenue of approximately $2.0million to $2.5 million from Sun Microsystems from fees associated with the transition of remaining active end user contracts to Oracle, the termination of therelated account management services and as a result of our net final payment to Oracle being less than estimated as of December 31, 2010.
44

Table of Contents
Our business is geographically diversified. During 2010, 67% of our net revenue was earned in North America and Latin America (“NALA”), 28% inEurope, Middle East and Africa (“EMEA”) and 5% in Asia Pacific Japan (“APJ”). Net revenue for a particular geography generally reflects commissions earnedfrom sales of service contracts managed from our sales center in that geography. Predominantly all of the service contracts sold and managed by our sales centersrelate to end customers located in the same geography. Cost of Revenue and Gross Profit Our cost of revenue consists primarily of compensation, which includes salary, bonuses, benefits and stock-based compensation related to our service salesteams. Cost of revenue also includes allocated overhead costs for facilities, information technology and depreciation, including amortization of internal-usesoftware associated with our service revenue technology platform and cloud applications. Allocated costs for facilities consist of rent, maintenance andcompensation of personnel in our facilities departments. Our allocated costs for information technology include costs associated with a third-party data centerwhere we maintain our data servers, compensation of our information technology personnel and the cost of support and maintenance contracts associated withcomputer hardware and software. Our overhead costs are allocated to all departments based on headcount. To the extent our customer base or opportunity undermanagement expands, we may need to hire additional service sales personnel and invest in infrastructure to support such growth. We currently expect that ourcost of revenue will fluctuate significantly and may increase on an absolute basis and as a percentage of revenue in the near term, including for the reasonsdiscussed above under “—Factors Affecting Our Performance—Implementation Cycle.” Operating Expenses Sales and Marketing. Sales and marketing expenses are the largest component of our operating expenses and consist primarily of compensation and salescommissions for our sales and marketing staff, allocated expenses and marketing programs and events. We sell our solutions through our global salesorganization, which is organized across three geographic regions: NALA, EMEA and APJ. Our commission plans provide that payment of commissions to oursales representatives is contingent on their continued employment and we recognize expense over a period that is generally between eight and fourteen monthsfollowing the execution of the applicable contract. We currently expect sales and marketing expense to increase on an absolute basis and as a percentage ofrevenue in the near term based on commissions earned on customer contracts entered into in prior periods, as well as continued investments in sales andmarketing personnel and programs as we expand our business domestically and internationally.
Research and Development. Research and development expenses consist primarily of compensation, allocated costs and the cost of third-party serviceproviders. We focus our research and development efforts on developing new products and adding new features to our existing technology platform. In addition,we capitalize certain expenditures related to the development and enhancement of internal-use software related to our technology platform, as discussed in moredetail under “—Critical Accounting Policies and Estimates—Capitalized Internal-Use Software” below. We expect research and development spending, and therelated expenses and capitalized costs, to increase on an absolute basis as a percentage of revenue in the near term as we continue to invest in our technologyplatform and cloud applications.
General and Administrative. General and administrative expenses consist primarily of compensation for our executive, human resources, finance and legalfunctions, and related expenses for professional fees for accounting, tax and legal services, as well as allocated expenses. We expect that our general andadministrative expenses will increase on an absolute basis and as a percentage of revenue in the near term as our operations continue to expand and as a result ofincremental costs associated with being a publicly-traded company.
Amortization of Intangible Assets. Our intangible assets consist of goodwill, customer contracts and related relationships, trademarks and trade names and anon-competition agreement. Except for goodwill, which is not amortized, all of our intangible assets were fully amortized as of March 31, 2009.
45

Table of Contents
Other Income (Expense) Other income (expense) consists primarily of interest expense associated with borrowings under our credit facility and foreign exchange transaction gainsand losses, partially offset by interest income, which has been insignificant in recent periods. Income Tax (Benefit) Provision Since inception through December 31, 2007 we conducted our U.S. operations through ServiceSource International, LLC (“LLC”), a pass-through entityfor tax purposes that files its income tax return as a partnership for federal and state income tax purposes. The LLC is not subject to income taxes other thanannual California limited liability company fees based on revenue. The members of the LLC, not the LLC itself, are subject to income taxes on their allocatedshare of the LLC’s earnings. The LLC is required to pay cash distributions to the members to fund members’ tax obligations in respect of the members’ allocatedshare of the LLC’s net income, if applicable. Effective January 1, 2008, the LLC transferred a portion of its U.S. operations to a wholly-owned U.S. taxablesubsidiary. We also have several subsidiaries formed in foreign jurisdictions, which are subject to local income taxes.
For a description of our accounting practices relating to income taxes, see “—Critical Accounting Policies and Estimates—Income Taxes” below.
46

Table of Contents
Results of Operations The table below sets forth our consolidated results of operations for the periods presented. The period-to-period comparison of financial results presentedbelow is not necessarily indicative of financial results to be achieved in future periods. Years Ended December 31, 2008 2009 2010 (in thousands) Consolidated statement of operations data: Net revenue $100,280 $110,676 $152,935 Cost of revenue 56,965 58,877 90,048
Gross profit 43,315 51,799 62,887
Operating expenses: Sales and marketing 20,486 23,182 35,119 Research and development 1,160 2,054 7,188 General and administrative 10,571 13,777 19,378 Amortization of intangible assets 857 68 —
Total operating expenses 33,074 39,081 61,685
Income from operations 10,241 12,718 1,202 Other expense, net (4,267) (477) (1,622)
Income (loss) before provision for income taxes 5,974 12,241 (420) Income tax provision 1,153 1,866 2,147
Net income (loss) $ 4,821 $ 10,375 $ (2,567)
Years Ended December 31, 2008 2009 2010 (in thousands) Includes stock-based compensation of:
Cost of revenue $ 1,271 $ 914 $ 1,126 Sales and marketing 1,570 2,340 2,993 Research and development — 541 803 General and administrative 2,608 2,265 3,167
Total $ 5,449 $ 6,060 $ 8,089
47
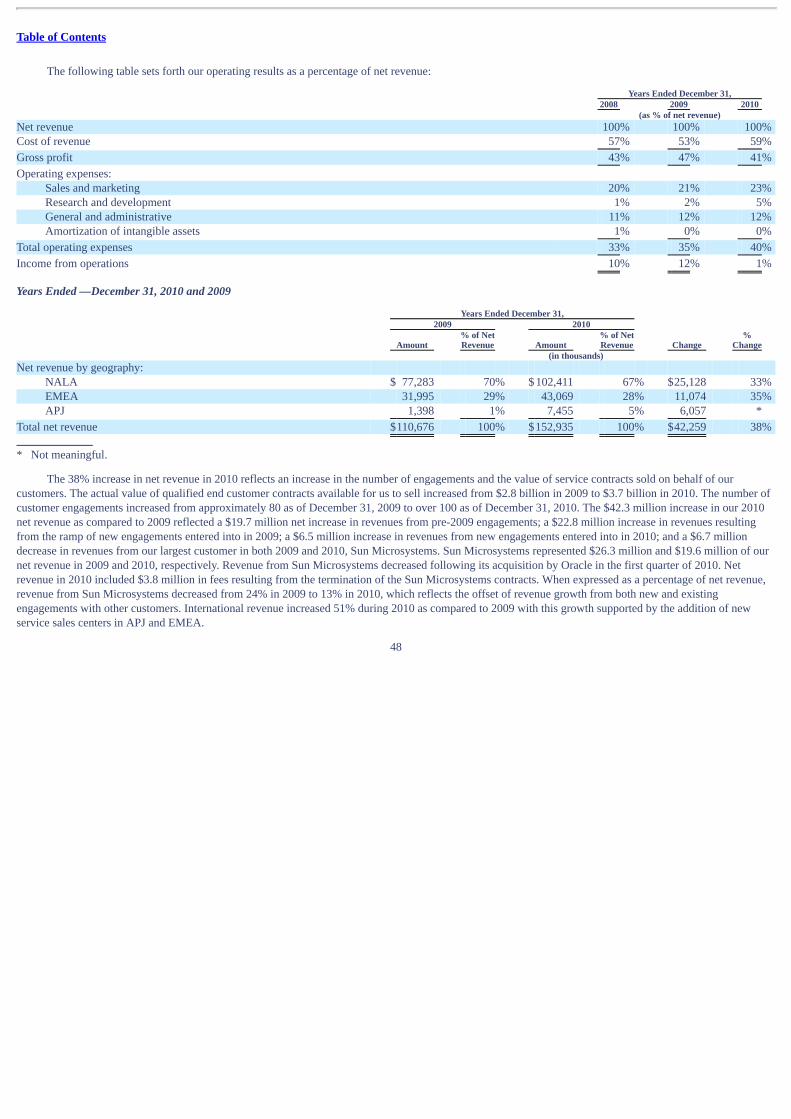
Table of Contents
The following table sets forth our operating results as a percentage of net revenue: Years Ended December 31, 2008 2009 2010 (as % of net revenue) Net revenue 100% 100% 100% Cost of revenue 57% 53% 59%
Gross profit 43% 47% 41%
Operating expenses: Sales and marketing 20% 21% 23% Research and development 1% 2% 5% General and administrative 11% 12% 12% Amortization of intangible assets 1% 0% 0%
Total operating expenses 33% 35% 40%
Income from operations 10% 12% 1%
Years Ended —December 31, 2010 and 2009 Years Ended December 31,
Change
%Change
2009 2010
Amount % of NetRevenue Amount
% of NetRevenue
(in thousands) Net revenue by geography:
NALA $ 77,283 70% $ 102,411 67% $25,128 33% EMEA 31,995 29% 43,069 28% 11,074 35% APJ 1,398 1% 7,455 5% 6,057 *
Total net revenue $110,676 100% $152,935 100% $42,259 38%
* Not meaningful.
The 38% increase in net revenue in 2010 reflects an increase in the number of engagements and the value of service contracts sold on behalf of ourcustomers. The actual value of qualified end customer contracts available for us to sell increased from $2.8 billion in 2009 to $3.7 billion in 2010. The number ofcustomer engagements increased from approximately 80 as of December 31, 2009 to over 100 as of December 31, 2010. The $42.3 million increase in our 2010net revenue as compared to 2009 reflected a $19.7 million net increase in revenues from pre-2009 engagements; a $22.8 million increase in revenues resultingfrom the ramp of new engagements entered into in 2009; a $6.5 million increase in revenues from new engagements entered into in 2010; and a $6.7 milliondecrease in revenues from our largest customer in both 2009 and 2010, Sun Microsystems. Sun Microsystems represented $26.3 million and $19.6 million of ournet revenue in 2009 and 2010, respectively. Revenue from Sun Microsystems decreased following its acquisition by Oracle in the first quarter of 2010. Netrevenue in 2010 included $3.8 million in fees resulting from the termination of the Sun Microsystems contracts. When expressed as a percentage of net revenue,revenue from Sun Microsystems decreased from 24% in 2009 to 13% in 2010, which reflects the offset of revenue growth from both new and existingengagements with other customers. International revenue increased 51% during 2010 as compared to 2009 with this growth supported by the addition of newservice sales centers in APJ and EMEA.
48

Table of Contents
Cost of Revenue and Gross Profit Years Ended December 31,
Change %
Change 2009 2010 (in thousands) Cost of revenue $ 58,877 $ 90,048 $31,171 53%
Includes stock-based compensation of: 914 1,126 212 23% Gross profit 51,799 62,887 11,088 21% Gross profit percentage 47% 41% (6)%
The 53% increase in our cost of revenue in 2010 reflected an increase in the number of service sales personnel, primarily in NALA and APJ, resulting in a$22.9 million increase in compensation, a $4.3 million increase in allocated costs for facilities (due to opening of new offices in EMEA and APJ), andinformation technology and depreciation and a $1.4 million increase in outside fees primarily due to the recruitment of service sales personnel. Gross profitpercentage decreased from 47% in 2009 to 41% in 2010. The decrease in gross profit percentage reflects additional compensation associated with staffing newand expanded engagements which typically have minimal revenue during the initial start-up phase and facility costs associated with the opening of two newinternational sales centers, partially offset by the favorable gross margin impact resulting from the Sun Microsystems termination fees. Operating Expenses Years Ended December 31,
Change
%Change
2009 2010
Amount % of NetRevenue Amount
% of NetRevenue
(in thousands) Operating expenses:
Sales and marketing $23,182 21% $35,119 23% $11,937 51% Research and development 2,054 2% 7,188 5% 5,134 * General and administrative 13,777 12% 19,378 12% 5,601 41% Amortization of intangible assets 68 0% — 0% (68) (100)%
Total operating expenses $39,081 35% $61,685 40% $22,604 58%
Includes stock-based compensation of: Sales and marketing $ 2,340 $ 2,993 $ 653 Research and development 541 803 262 General and administrative 2,265 3,167 902
Total $ 5,146 $ 6,963 $ 1,817
* Not meaningful. Sales and marketing expenses The 51% increase in sales and marketing expenses in 2010 reflected an increase in the number of sales and marketing personnel, primarily in NALA andAPJ, and higher sales commissions for new multi-year customer engagements, resulting in a $7.9 million increase in compensation. The increase also resultedfrom a $0.9 million increase in expenses due to marketing programs, a $0.9 million increase in allocated costs and a $0.8 million increase in outside feesprimarily due to the recruitment of sales and marketing personnel. The increase in headcount reflected our investment in sales and marketing resources aimed atexpanding our customer base.
49
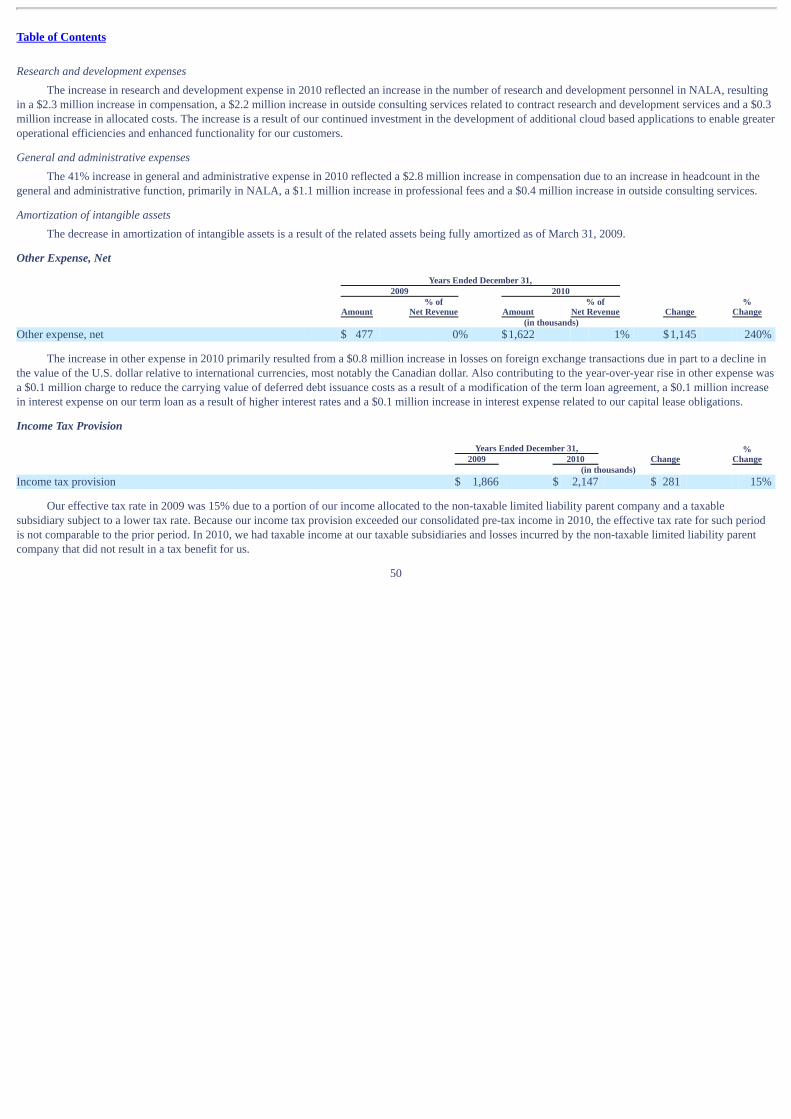
Table of Contents
Research and development expenses The increase in research and development expense in 2010 reflected an increase in the number of research and development personnel in NALA, resultingin a $2.3 million increase in compensation, a $2.2 million increase in outside consulting services related to contract research and development services and a $0.3million increase in allocated costs. The increase is a result of our continued investment in the development of additional cloud based applications to enable greateroperational efficiencies and enhanced functionality for our customers. General and administrative expenses The 41% increase in general and administrative expense in 2010 reflected a $2.8 million increase in compensation due to an increase in headcount in thegeneral and administrative function, primarily in NALA, a $1.1 million increase in professional fees and a $0.4 million increase in outside consulting services. Amortization of intangible assets The decrease in amortization of intangible assets is a result of the related assets being fully amortized as of March 31, 2009. Other Expense, Net Years Ended December 31,
Change
%Change
2009 2010
Amount % of
Net Revenue Amount % of
Net Revenue (in thousands) Other expense, net $ 477 0% $1,622 1% $1,145 240%
The increase in other expense in 2010 primarily resulted from a $0.8 million increase in losses on foreign exchange transactions due in part to a decline inthe value of the U.S. dollar relative to international currencies, most notably the Canadian dollar. Also contributing to the year-over-year rise in other expense wasa $0.1 million charge to reduce the carrying value of deferred debt issuance costs as a result of a modification of the term loan agreement, a $0.1 million increasein interest expense on our term loan as a result of higher interest rates and a $0.1 million increase in interest expense related to our capital lease obligations. Income Tax Provision
Years Ended December 31,
Change %
Change 2009 2010 (in thousands) Income tax provision $ 1,866 $ 2,147 $ 281 15%
Our effective tax rate in 2009 was 15% due to a portion of our income allocated to the non-taxable limited liability parent company and a taxablesubsidiary subject to a lower tax rate. Because our income tax provision exceeded our consolidated pre-tax income in 2010, the effective tax rate for such periodis not comparable to the prior period. In 2010, we had taxable income at our taxable subsidiaries and losses incurred by the non-taxable limited liability parentcompany that did not result in a tax benefit for us.
50
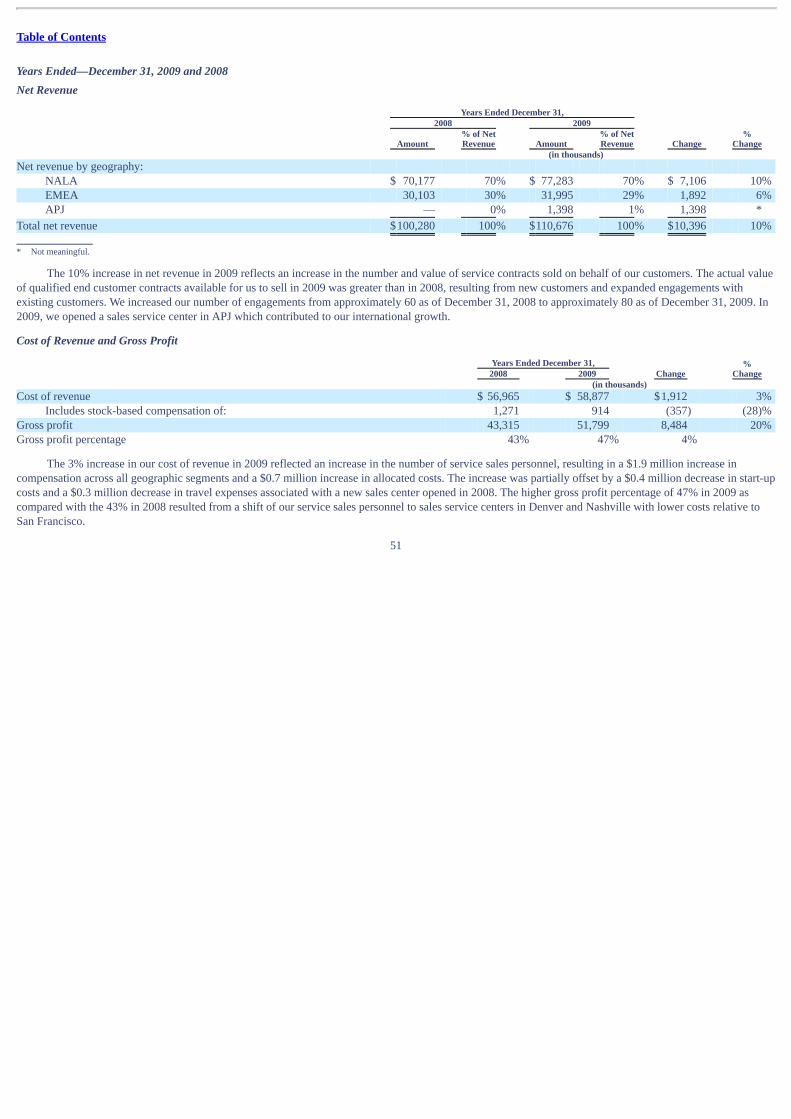
Table of Contents
Years Ended—December 31, 2009 and 2008 Net Revenue
Years Ended December 31,
Change
%Change
2008 2009
Amount % of NetRevenue Amount
% of NetRevenue
(in thousands) Net revenue by geography:
NALA $ 70,177 70% $ 77,283 70% $ 7,106 10% EMEA 30,103 30% 31,995 29% 1,892 6% APJ — 0% 1,398 1% 1,398 *
Total net revenue $100,280 100% $110,676 100% $10,396 10%
* Not meaningful.
The 10% increase in net revenue in 2009 reflects an increase in the number and value of service contracts sold on behalf of our customers. The actual valueof qualified end customer contracts available for us to sell in 2009 was greater than in 2008, resulting from new customers and expanded engagements withexisting customers. We increased our number of engagements from approximately 60 as of December 31, 2008 to approximately 80 as of December 31, 2009. In2009, we opened a sales service center in APJ which contributed to our international growth. Cost of Revenue and Gross Profit
Years Ended December 31,
Change %
Change 2008 2009 (in thousands) Cost of revenue $ 56,965 $ 58,877 $1,912 3%
Includes stock-based compensation of: 1,271 914 (357) (28)% Gross profit 43,315 51,799 8,484 20% Gross profit percentage 43% 47% 4%
The 3% increase in our cost of revenue in 2009 reflected an increase in the number of service sales personnel, resulting in a $1.9 million increase incompensation across all geographic segments and a $0.7 million increase in allocated costs. The increase was partially offset by a $0.4 million decrease in start-upcosts and a $0.3 million decrease in travel expenses associated with a new sales center opened in 2008. The higher gross profit percentage of 47% in 2009 ascompared with the 43% in 2008 resulted from a shift of our service sales personnel to sales service centers in Denver and Nashville with lower costs relative toSan Francisco.
51

Table of Contents
Operating Expenses Years Ended December 31,
Change
%Change
2008 2009
Amount % of NetRevenue Amount
% of NetRevenue
(in thousands) Operating expenses:
Sales and marketing $20,486 20% $23,182 21% $2,696 13% Research and development 1,160 1% 2,054 2% 894 77% General and administrative 10,571 11% 13,777 12% 3,206 30% Amortization of intangible assets 857 1% 68 0% (789) (92)%
Total operating expenses $33,074 33% $39,081 35% $6,007 18%
Includes stock-based compensation of: Sales and marketing $ 1,570 $ 2,340 $ 770 Research and development — 541 541 General and administrative 2,608 2,265 (343)
Total $ 4,178 $ 5,146 $ 968
Sales and marketing expenses The 13% increase in sales and marketing expenses in 2009 reflected an increase in the number of sales and marketing personnel, resulting in a $0.9 millionincrease in compensation, a $0.3 million increase in allocated costs, and a $0.1 million increase in travel expenses associated with our global expansion,particularly in APJ. Research and development expenses The 77% increase in research and development expenses in 2009 reflected an increase in the number of research and development personnel in NALA,resulting in a $0.3 million increase in compensation, a $0.3 million increase in allocated costs and a $0.2 million increase in travel expenses. General and administrative expenses The 30% increase in general and administrative expenses in 2009 reflected an increase in headcount in the general and administrative functions, resulting ina $3.5 million increase in compensation and a $0.2 million increase in travel expenses, partially offset by a $0.5 million decrease in bad debt expense. Amortization of intangible assets The decrease in amortization of intangible assets resulted from the related assets being fully amortized as of March 31, 2009. Other Expense, Net Years Ended December 31,
Change
%Change
2008 2009
Amount % of NetRevenue Amount
% of NetRevenue
(in thousands) Other expense, net $4,267 4% $ 477 0% $(3,790) (89)%
52
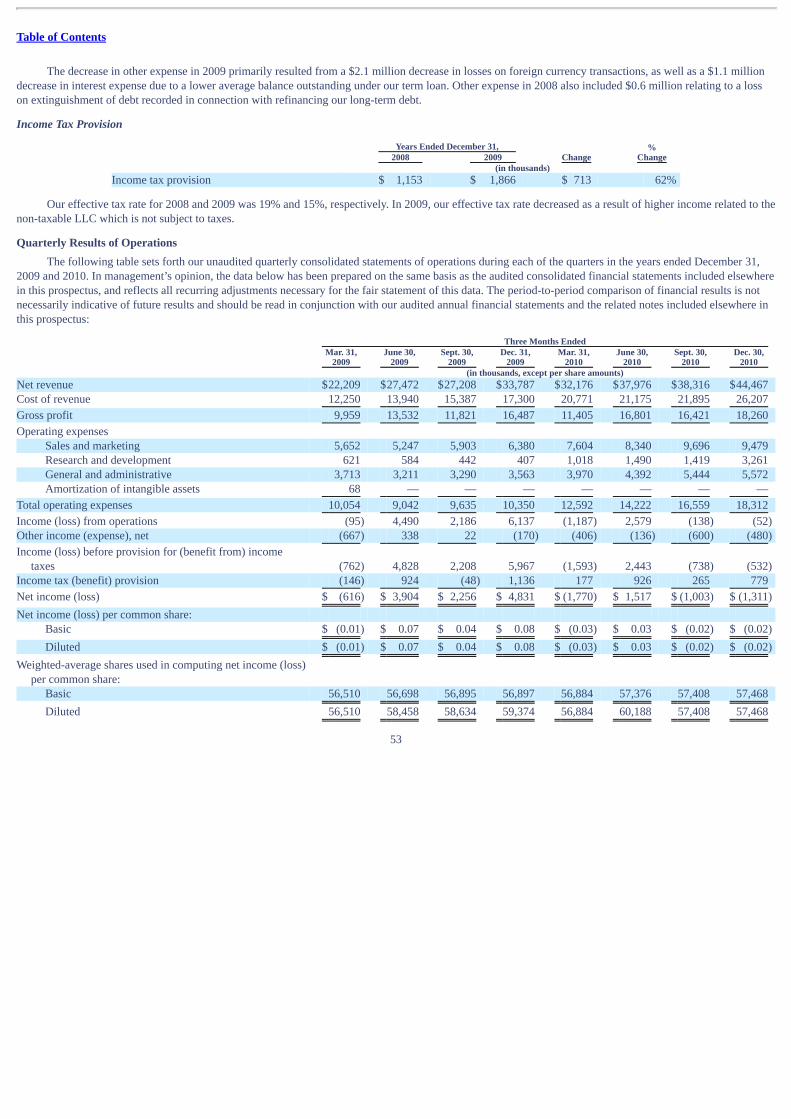
Table of Contents
The decrease in other expense in 2009 primarily resulted from a $2.1 million decrease in losses on foreign currency transactions, as well as a $1.1 milliondecrease in interest expense due to a lower average balance outstanding under our term loan. Other expense in 2008 also included $0.6 million relating to a losson extinguishment of debt recorded in connection with refinancing our long-term debt. Income Tax Provision
Years Ended December 31,
Change %
Change 2008 2009 (in thousands) Income tax provision $ 1,153 $ 1,866 $ 713 62%
Our effective tax rate for 2008 and 2009 was 19% and 15%, respectively. In 2009, our effective tax rate decreased as a result of higher income related to the
non-taxable LLC which is not subject to taxes. Quarterly Results of Operations The following table sets forth our unaudited quarterly consolidated statements of operations during each of the quarters in the years ended December 31,2009 and 2010. In management’s opinion, the data below has been prepared on the same basis as the audited consolidated financial statements included elsewherein this prospectus, and reflects all recurring adjustments necessary for the fair statement of this data. The period-to-period comparison of financial results is notnecessarily indicative of future results and should be read in conjunction with our audited annual financial statements and the related notes included elsewhere inthis prospectus: Three Months Ended
Mar. 31,
2009 June 30,
2009 Sept. 30,
2009 Dec. 31,
2009 Mar. 31,
2010 June 30,
2010 Sept. 30,
2010 Dec. 30,
2010 (in thousands, except per share amounts) Net revenue $22,209 $27,472 $27,208 $33,787 $32,176 $37,976 $38,316 $44,467 Cost of revenue 12,250 13,940 15,387 17,300 20,771 21,175 21,895 26,207
Gross profit 9,959 13,532 11,821 16,487 11,405 16,801 16,421 18,260
Operating expenses Sales and marketing 5,652 5,247 5,903 6,380 7,604 8,340 9,696 9,479 Research and development 621 584 442 407 1,018 1,490 1,419 3,261 General and administrative 3,713 3,211 3,290 3,563 3,970 4,392 5,444 5,572 Amortization of intangible assets 68 — — — — — — —
Total operating expenses 10,054 9,042 9,635 10,350 12,592 14,222 16,559 18,312
Income (loss) from operations (95) 4,490 2,186 6,137 (1,187) 2,579 (138) (52) Other income (expense), net (667) 338 22 (170) (406) (136) (600) (480)
Income (loss) before provision for (benefit from) incometaxes (762) 4,828 2,208 5,967 (1,593) 2,443 (738) (532)
Income tax (benefit) provision (146) 924 (48) 1,136 177 926 265 779
Net income (loss) $ (616) $ 3,904 $ 2,256 $ 4,831 $ (1,770) $ 1,517 $ (1,003) $ (1,311)
Net income (loss) per common share: Basic $ (0.01) $ 0.07 $ 0.04 $ 0.08 $ (0.03) $ 0.03 $ (0.02) $ (0.02)
Diluted $ (0.01) $ 0.07 $ 0.04 $ 0.08 $ (0.03) $ 0.03 $ (0.02) $ (0.02)
Weighted-average shares used in computing net income (loss)per common share:
Basic 56,510 56,698 56,895 56,897 56,884 57,376 57,408 57,468
Diluted 56,510 58,458 58,634 59,374 56,884 60,188 57,408 57,468
53

Table of Contents
Three Months Ended
Mar.31,
2009 June 30,
2009
Sept.30,
2009 Dec. 31,
2009
Mar.31,
2010 June 30,
2010
Sept.30,
2010 Dec. 30,
2010 (in thousands) Includes stock-based compensation of:
Cost of revenue $ 219 $ 222 $ 231 $ 242 $ 274 $ 299 $ 270 $ 283 Sales and marketing 490 599 617 634 703 742 769 779 Research and development 131 130 138 142 149 144 305 205 General and administrative 549 542 572 602 845 733 784 805
Total $1,389 $1,493 $1,558 $1,620 $1,971 $1,918 $2,128 $2,072
The following table sets forth our unaudited quarterly consolidated statements of operations as a percentage of revenue:
Three Months Ended
Mar. 31,
2009 June 30,
2009 Sept. 30,
2009 Dec. 31
2009 Mar. 31,
2010 June 30,
2010 Sept. 30,
2010 Dec. 31,
2010 (as % of net revenue) Net revenue 100% 100% 100% 100% 100% 100% 100% 100% Cost of revenue 55% 51% 57% 51% 65% 56% 57% 59%
Gross profit 45% 49% 43% 49% 35% 44% 43% 41%
Operating expenses Sales and marketing 25% 19% 21% 19% 24% 21% 25% 21% Research and development 3% 2% 2% 1% 3% 4% 4% 7% General and administrative 17% 12% 12% 11% 12% 12% 14% 13% Amortization of intangible assets 0% 0% 0% 0% 0% 0% 0% 0%
Total operating expenses 45% 33% 35% 31% 39% 37% 43% 41%
Income (loss) from operations 0% 16% 8% 18% (4)% 7% 0% 0%
We have generally experienced growth in quarterly revenue resulting from an increase in new engagements with new and existing customers. Quarterly
revenue is directly correlated with the value of service contracts provided to us by our customers for a given quarterly period. Many of our customers operate on acalendar year basis and, because of the seasonal nature of their revenue and the propensity for many of their end customers to make IT and other technologypurchases and renewals during the fourth quarter, have a greater proportion of contract renewals in the fourth quarter as compared to the first three quarters of theyear. As a result, revenue earned in our fourth quarter has historically represented a larger portion of our annual revenue as compared to the other three quarters ofthe year and has typically exceeded revenue in the first quarter of the following year. Revenue in the fourth quarter of 2009 and 2010 represented 31% and 29%,respectively, of our revenue for 2009 and 2010. In addition, our third quarter revenue is affected by the slowed economic activity in the summer, particularly inEurope.
Our quarterly gross profit percentage in 2009 and 2010 has varied from 35% to 49% and is impacted by a number of factors, including: the hiring ofservice sales personnel to support new engagements ahead of recognizing revenue from those engagements, the number and size of engagements in start-upphase, during which we earn minimal revenue, and the opening of new facilities in Liverpool and Kuala Lumpur. In addition, our gross profit percentage isimpacted by the seasonality of our revenue, as discussed above.
Our operating expenses have increased in each of the past several quarters and reflect increased expenses associated with hiring additional sales andmarketing personnel to support our global expansion, sales commission expense related to multi-year customer contracts, increased spending to hire research and
54

Table of Contents
development personnel related to the development of cloud applications, and increased costs for facilities, information technology and administrative functions tosupport this growth. We experienced a net loss in the first quarter of 2009 and 2010 and in the third and fourth quarters of 2010, and we currently expect that ourcost of revenue and operating expenses will fluctuate from quarter to quarter and increase on an absolute basis and as a percentage of revenue resulting in netlosses in future periods as we continue to expand our businesses. Liquidity and Capital Resources As of December 31, 2010, our principal sources of liquidity were our cash of $22.7 million and $5.9 million available under our revolving credit facility.Our primary operating cash requirements include the payment of compensation and related costs, working capital requirements related to advances and accruedpayables to customers, as well as costs for our facilities and information technology infrastructure. Historically, we have financed our operations principally fromcash provided by our operating activities and to a lesser extent from borrowings under our credit facility.
In April 2008, we entered into a five year credit facility with various financial institutions. The credit facility initially provided for a $20.0 million termloan and a $25.0 million revolving credit facility, which included letters of credit in a face amount up to $7.5 million. The proceeds from the term loan were usedprimarily to fund tax distributions to our equityholders as required under our limited liability company agreement and the remaining proceeds were used forgeneral corporate purposes. Borrowing under the revolving credit facility were subject to limitations imposed by collateral agreements and certain otherconditions in the credit facility.
In March 2010, we obtained a waiver from the requirement to make additional principal payments in 2010 based on 2009 excess cash flow levels asdefined in the credit facility. The credit facility was amended in April 2010 to, among other things, reduce the commitment amount of the revolving credit facilityto $15.0 million and to change the borrowing base calculation. In December 2010, the credit facility was amended to reduce the maximum amount available forborrowing under the revolving credit facility from $15.0 million to $7.5 million, subject to certain limitations related to our consolidated revenues and bankreserves, and to ease a financial covenant applicable as of December 31, 2010. We also amended our fee arrangement with the lenders such that any terminationof or prepayment in full of the obligations under the credit facility on or prior to December 31, 2011, would result in us being subject to a prepayment premiumbased on the sum of the maximum revolver amount, as defined in the agreement, and the then-outstanding principal balance on the term loan. In January 2011, thecredit facility was amended to (i) increase the maximum commitment amount under the revolving credit facility from $7.5 million to $12.5 million, (ii) eliminatethe fixed charge coverage ratio test for the twelve month period ending March 31, 2011 only, (iii) require the Company to maintain a minimum liquidity level of$10 million based on unrestricted cash balances held in the U.S. and available borrowings under the revolving credit facility, as defined therein, from and afterMay 15, 2011, and (iv) allow for the planned conversion to a taxable corporation, initial public offering of the Company’s stock and other specified transactionsrelated to us.
As of December 31, 2010, we had $15.5 million outstanding under our term loan. No balance was outstanding under the revolving credit facility,$5.9 million was available for borrowing under the revolving credit facility and we were in compliance with all covenants. Additionally, as of December 31, 2010we had a $1.6 million letter of credit outstanding relating to our office space at our San Francisco headquarters.
On February 24, 2011, we entered into a Second Amended and Restated Credit Agreement with the same financial institution that replaced our prior creditfacility and all of the amendments to the prior credit facility. The primary purpose of the amendment and restatement was, among other things, to provide certainprovisions in contemplation of our initial public offering, consolidate all previous amendments that were in effect, retire and eliminate the term loan under thecredit facility and increase the revolving credit facility from $15.0 million to $30.0 million.
The amended and restated credit agreement expires on February 24, 2013. We have the option within 90 days of this offering to reduce the revolving creditfacility commitment by up to $10.0 million.
55

Table of Contents
The amended and restated credit facility also has various restrictive financial covenants, which include maintaining a minimum fixed charge coverage ratio,a maximum consolidated leverage ratio, a minimum liquidity ratio and restrictions, subject to certain exceptions, under which we can make distributions to ourequityholders. Distributions to fund tax obligations of our equityholders are permitted so long as there are no events of default, including compliance withfinancial covenants, immediately prior to or after giving effect to any such distribution. Distributions other than those to fund our equityholders’ tax obligationsare, among other things, subject to us achieving specified levels of earnings before interest, taxes, depreciation and amortization or maintaining minimum levelsof cash as defined in the credit facility.
In addition to converting the $15.5 million outstanding on our term loan to a balance outstanding under the new credit facility, we also drew down anadditional $6.9 million in connection with payments to Oracle in connection with the termination of our engagements with Sun Microsystems.
At March 2, 2011, borrowing outstanding on our revolving credit facility totaled $22.4 million, $1.6 million of which was in support of a letter of credit.
If our financial results in future periods were to deteriorate and result in non-compliance with the financial covenants of the amended and restated creditfacility, we could attempt to obtain covenant relief or obtain a waiver from the lenders for specific non-compliance matters. We can give no assurance that wecould obtain covenant relief or obtain waivers from the lenders in the event of non-compliance with financial or other covenant requirements in the amended andrestated credit facility. In the event of non-compliance with the covenants provided for in the amended and restated credit facility, the lenders could declare all orany outstanding borrowings immediately due and payable or terminate the agreement.
We intend to use a portion of the net proceeds we receive from this offering to repay the balance outstanding under the amended and restated credit facility.
We believe our existing cash, cash flows from operating activities, our currently available credit facility and proceeds from this offering will be sufficient tomeet our working capital and capital expenditure needs for at least the next fifteen months. Continued availability of borrowings under our current or any futurecredit facilities will be dependent upon our compliance with the applicable financial covenants and other contractual terms under such facilities. Our future capitalrequirements will depend on many factors, including revenue growth, costs incurred to support new customers and new engagements from existing customers, thetiming and extent of spending to support development and expansion into new territories, continued investment in our technology platform and increased generaland administrative expenses to support the anticipated growth in our operations. Our capital expenditures in future periods are expected to grow in line with ourbusiness. To the extent that proceeds resulting from this offering, together with existing cash and cash from operations, are not sufficient to fund our futureoperations, we may need to raise additional funds through public or private equity or additional debt financing.
For a limited number of historical customer arrangements that include both sales of customer service contracts and other account management services, werecord advances to and accrued payables to customers to account for the timing differences between when we collect cash from end customers and when we makepayments to our customers. The $30.6 million accrued payable to customers balance at December 31, 2010 consists primarily of net payments due to SunMicrosystems from end customers renewing their service contracts with Sun Microsystems through us. Oracle terminated our contracts with Sun Microsystemseffective as of September 30, 2010. In the first quarter of 2011, we cash settled amounts we owed to Sun Microsystems, net of amounts they owed to us. The$30.6 million accrued payable to Oracle/Sun as of December 31, 2010 was reduced by a $12.5 million decrease in our accounts receivable for amounts owed tous by Oracle/Sun, resulting in cash payments by us to Oracle/Sun of approximately $18.1 million which were funded from existing cash and borrowings underour revolving credit facility. We do not currently record a material amount of advances or payables to our other customers pursuant to such arrangements.
56

Table of Contents
ServiceSource International, LLC is required to make tax distributions to equityholders to the extent that it has taxable income attributable to theequityholders. Distributions to equityholders for the period from January 1, 2011 to the date of the Conversion are dependent on taxable income, if any,attributable to the equityholders for such periods.
Although we are currently not a party to any agreement or letter of intent with respect to potential investments in, or acquisitions of, businesses ortechnologies, we may enter into these types of arrangements in the future, which could also require us to seek additional equity or debt financing. Additionalfunds may not be available on terms favorable to us or available at all. Summary Cash Flows The following table sets forth a summary of our cash flows for the periods indicated: Years Ended December 31, 2008 2009 2010 Net cash provided by operating activities $ 3,232 $19,504 $22,630 Net cash used in investing activities (6,806) (7,476) (9,170) Net cash used in financing activities (5,951) (2,379) (4,139) Net increase (decrease) in cash, net of impact of exchange charges on cash $(9,367) $ 9,389 $ 9,483 Operating Activities In 2010, cash inflows from our operating activities were $22.6 million. Our net loss during the period was $2.6 million, adjusted by non-cash charges of$6.1 million for depreciation and amortization and $8.1 million for stock-based compensation. Additional sources of net cash inflows were from changes in ourworking capital, including a $23.6 million increase in accrued payables to customers, consisting of amounts owed to Oracle from end customers with respect toour Sun Microsystems engagements that terminated effective September 30, 2010, a $4.9 million increase in other accrued liabilities and a $4.4 million increasein accrued compensation and benefits, partially offset by a $21.2 million increase in accounts receivable.
In 2009, cash inflows from our operating activities of $19.5 million primarily resulted from our net income of $10.4 million, adjusted by non-cash chargesof $6.1 million for stock-based compensation and $3.5 million for depreciation and amortization. The remainder of our sources of net cash inflows was fromchanges in our working capital, including a decrease in advances to customers of $3.6 million, an increase in other accrued liabilities of $2.5 million and anincrease in accrued payables to customers of $2.5 million, partially offset by an increase in accounts receivable of $4.5 million and a decrease in accrued taxes of$1.9 million. The decrease in our advances to customers was due to the loss of a significant customer with whom this type of arrangement was agreed upon,hence fewer payments were due to customers before the receipt of the related amounts due from end customers. The increase in accrued payables to customers,which are reported net of our commissions, was due to an increase in the amounts of payments received from end customers which we had not yet remitted to ourcustomers at year end. The increase in our accounts receivable reflects growth in our service revenue in the fourth quarter of 2009 as compared to the fourthquarter in 2008.
In 2008, cash inflows from our operating activities of $3.2 million primarily resulted from our net income of $4.8 million, adjusted by non-cash charges of$5.4 million for stock-based compensation and $3.4 million for depreciation and amortization. The sources of net cash inflows were partially offset by an increasein accounts receivable of $6.4 million and an increase in advances to customers of $3.2 million.
57

Table of Contents
Investing Activities In 2010, 2009 and 2008, net cash used in investing activities was $9.2 million, $7.5 million and $6.8 million, respectively, and related to the purchase ofproperty and equipment, including costs capitalized for development of internal-use software. Financing Activities In 2010 and 2009, cash used in financing activities was $4.1 million and $2.4 million, respectively, primarily resulting from principal payments on our termloan. Additionally, during 2010 we had a $2.5 million cash distribution to our equityholders as required under our limited liability company agreement.
In 2008, cash used in financing activities was $6.0 million, resulting primarily from cash distributions to our equityholders as required under our limitedliability company agreement. Additionally, during 2008 we entered into a new credit facility and used the proceeds to retire several prior debt agreements. Off-Balance Sheet Arrangements We do not have any relationships with other entities or financial partnerships, such as entities often referred to as structured finance or special-purposeentities, which have been established for the purpose of facilitating off-balance sheet arrangements or other contractually narrow or limited purposes. Contractual Obligations and Commitments Our principal commitments consist of obligations under operating leases for office space and computer equipment. At December 31, 2010, the futureminimum payments under these commitments, as well as repayments of our term loan, were as follows: Payments Due by Period
Total Less than
1 year 1-3 years 3-5 years More than
5 years Term loan $15,459 $ 1,500 $13,959 $ — $ — Expected interest payments on term loan 1,858 856 1,002 — — Obligations under capital leases 1,759 779 598 155 227 Operating lease obligations 25,060 5,361 13,732 3,905 2,062
$44,136 $ 8,496 $29,291 $ 4,060 $ 2,289
(1) We have calculated the expected interest payments on our term loan based on an interest rate of 5.75% in effect at December 31, 2010 applied to the
principal balance of the term loan scheduled to be outstanding during the relevant interest period.
The contractual commitment amounts in the table above are associated with agreements that are enforceable and legally binding, which specify significantterms including payment terms, related services and the approximate timing of the transaction. Obligations under contracts that we can cancel without asignificant penalty are not included in the table above. Quantitative and Qualitative Disclosure about Market Risk We have operations both within the United States and internationally, and we are exposed to market risks in the ordinary course of our business. These risksprimarily include foreign currency exchange and inflation risks, as well as risks relating to changes in the general economic conditions in the countries where weconduct business. To date, we have not used derivative instruments to mitigate the impact of our market-risk exposures. We have also not used, nor do we intendto use, derivatives for trading or speculative purposes.
58
(1)

Table of Contents
Foreign Currency Exchange Risk Our results of operations and cash flows are subject to fluctuations due to changes in foreign currency exchange rates, particularly changes in the euro,British pound, Canadian dollar, Singapore dollar and Japanese Yen. To date, we have not entered into any foreign currency hedging contracts, but may considerentering into such contracts in the future. We believe our operating activities act as a natural hedge for a substantial portion of our foreign currency exposurebecause we typically collect revenue and incur costs in the currency in the location in which we provide our solution from our sales centers. However, our globalsales operations center in Kuala Lumpur incurs costs in the Malaysian Ringgit but we do not generate revenue or cash proceeds in this currency and, as a result,have some related foreign currency risk exposure. As our international operations grow, we will continue to reassess our approach to managing our risk relating tofluctuations in currency rates. Inflation Risk We do not believe that inflation has had a material effect on our business, financial condition or results of operations. Nonetheless, if our costs were tobecome subject to significant inflationary pressures, we may not be able to fully offset such higher costs through price increases. Our inability or failure to do socould harm our business, financial condition and results of operations. Critical Accounting Policies and Estimates Revenue Recognition Substantially all of our revenue is generated from commissions earned from selling renewals of maintenance, support and subscription agreements onbehalf of our customers. We recognize revenue upon acceptance of end customer purchase orders by our customers.
We recognize revenue when persuasive evidence of an arrangement exists, services have been provided, the sales price is fixed and determinable andcollectability is reasonably assured from our customer and no significant obligations remain unfulfilled. Customer contracts are generally used to determine theexistence of an arrangement. Under the terms of our customer contracts, our service obligations are completed when end customer purchase orders are acceptedby our customers. We assess whether our fee is fixed or determinable based on the payment terms with our customers and whether any part of our fee is subject torefund or adjustment. We assess collectability based primarily on the creditworthiness of the customer as determined by credit checks and analysis as well as thecustomer’s payment history.
Our revenue management services are limited to renewing contracts on behalf of our customers. Therefore, we have no other obligations or responsibilitiesto our customers after they accept purchase orders from end customers. Moreover, we do not set the sales price, terms or scope of services contained in the servicecontracts we sell on behalf of our customers to their end customers, and we are not a party to contracts between our customers and their end customers.
Some of our customer agreements include performance-based commissions that we earn for exceeding pre-determined performance targets, including theachievement of renewal rates for contracts in excess of specified targets. Our customer arrangements also entitle us to fees and adjustments which are invoked invarious circumstances, including the failure of our customers to provide us with a specified minimum value of service contracts. Our agreements generallycontain early termination fees. Revenue related to performance-based commissions, adjustments and early termination fees is recorded when the performancecriteria have been met, or the triggering event has occurred, and the amount earned is not subject to claw-back or future adjustment.
For multiple element arrangements, including deliverables such as sales of service contracts, account management services and/or subscriptions to ourhosted technology platform, we separate each revenue stream at the inception of the arrangement on a relative fair value basis, provided that each service elementmeets the
59

Table of Contents
criteria for treatment as a separate unit of accounting. An item is considered a separate unit of accounting if it has value to the customer on a stand-alone basis andthere is objective and reliable fair value of the undelivered services. The fair value of the undelivered elements is determined by the price charged when theelement is sold separately, or in the cases where the item is not sold separately, by using other acceptable objective evidence.
We have a limited number of multiple-element arrangements where we are responsible for selling service contracts and we provide a subscription to ourcloud applications. In these limited instances, our service sales revenue is recognized on a monthly basis as services are performed while subscription revenue isrecognized ratably over the subscription term, generally a year. To date, subscription revenue earned from access to our cloud applications has been insignificant.
Under a limited number of historical customer engagements, we were responsible for selling service contracts and the related invoicing and cashcollections from end customers. Under these arrangements, we collected the gross amount of payment due from end customers and remitted to our customers anamount equal to the gross billing less our sales commission and sales taxes or other indirect taxes invoiced to the end customers. Under these arrangements,revenue is recognized when the service has been delivered and the fee is fixed or determinable, which is upon receipt of cash payment from the end customer. Stock-Based Compensation We measure and recognize compensation expense for all stock-based payment made to employees and directors based on the grant date fair values of theawards. For stock–based awards with service-based vesting conditions, the fair value is estimated using the Black-Scholes option pricing model. The value ofawards that are ultimately expected to vest is recognized as expense on a straight-line basis, net of estimated forfeitures, over the requisite service period. Stock-based compensation expenses are classified in the statements of operations based on the functional area to which the related recipients belong.
The Black-Scholes option pricing model requires management to make assumptions and to apply judgment in determining the fair value of our awards. Themost significant assumptions and judgments include estimating the fair value of our common stock, expected volatility of our common stock and estimated termbetween the grant date and settlement date, as discussed below. In addition, the recognition of stock-based compensation expense is impacted by estimatedforfeiture rates. We estimated the fair value of each stock option granted for 2008, 2009 and 2010 using the following assumptions: Years Ended December 31, 2008 2009 2010Expected term (in years) 4.6 4.8 5.4Expected volatility 55% 56% 54%Risk-free interest rate 2.45-3.07% 2.17-2.68% 1.75-2.43%Expected dividend yield — — —
The expected option term was estimated by analyzing the historical period from grant to settlement of the stock option. This analysis includes exercise andforfeitures and also gives consideration to the expected holding period for those options that are still outstanding. The risk-free interest rate is based on a dailytreasury yield curve rate that has a term consistent with the expected life of the stock option. We have not paid and do not anticipate paying cash dividends on ourcommon stock, and therefore our expected dividend yield is assumed to be zero. We are required to estimate forfeiture rates at the time of grant and suchestimates are revised in subsequent periods if actual forfeitures differ from those estimates. We apply an estimated forfeiture rate based on our historical forfeitureexperience, which has been stratified into two relatively homogeneous groups.
As there has been no public market for our common stock prior to this offering, and therefore a lack of company-specific historical and implied volatilitydata, we have determined the share price volatility for options
60

Table of Contents
granted based on an analysis of reported data for a self-designated peer group of companies that grant options with substantially similar terms and conditions. Theexpected volatility of options granted has been determined using a simple average of the historical volatility measures of this peer group of companies for aperiod equal to the expected life of the option. We intend to continue to consistently apply this process using the same or similar entities until a sufficient amountof historical information regarding the volatility of our own common stock share price becomes available, or unless circumstances change such that the identifiedentities are no longer similar to us, in which case, more suitable entities whose share prices are publicly available would be utilized in the calculation.
We have historically granted stock options at exercise prices equal to the fair market value as determined by our board of directors on the date of grant,with input from management. Because our common stock is not publicly traded, our board of directors exercises significant judgment in determining the fairvalue of our common stock on the date of grant based on a number of objective and subjective factors. Factors considered by our board of directors included: • contemporaneous independent valuations performed at periodic intervals by outside firms; • our performance, our financial condition and future financial projections at the approximate time of the option grant; • trends in the technology and technology-enabled service company industries;
• the value of companies that we consider peers based on a number of factors including, but not limited to, similarity to us with respect to industry,business model, stage of growth, geographic diversification, profitability, company size, financial risk or other factors;
• changes since the last time the board of directors approved option grants and made a determination of fair value, including changes in plannedbusiness from new engagements and anticipated business from existing engagements;
• amounts paid by investors for our common stock in arm’s-length purchases from our founders and employees;
• the likelihood of achieving a liquidity event, such as an initial public offering or sale given prevailing market conditions and the nature and history ofour business; and
• any adjustment necessary to recognize a lack of marketability for our common stock.
The valuation of our common stock was performed in accordance with the guidelines outlined in the American Institute of Certified Public AccountantsPractice Aid, Valuation of Privately-Held-Company Equity Securities Issued as Compensation. In order to value our common stock, we first determined ourbusiness enterprise value and then allocated this business enterprise value to our common stock and common stock equivalents. Our business enterprise value wasestimated using a combination of two generally accepted approaches: the income approach and the market-based approach. The income approach estimatesenterprise value based on the estimated present value of future net cash flows the business is expected to generate over its remaining life. The estimated presentvalue is calculated using a discount rate reflective of the risks associated with an investment in a similar company in a similar industry. The market approachmeasures the value of a business through an analysis of recent sales or offerings of comparable investments or assets, and in our case, focused on comparing us tothe group of peer companies described above. In applying this method, valuation multiples are derived from historical operating data of the peer company group.We then apply multiples to our operating data to arrive at a range of indicated values of the company.
For each valuation, we prepared a financial forecast to be used in the computation of the value of invested capital for both the market approach and incomeapproach. The financial forecast took into account our past results and expected future financial performance. The risk associated with achieving this forecast wasassessed in selecting the appropriate discount rate. There is inherent uncertainty in these estimates as the assumptions used
61

Table of Contents
are highly subjective and subject to changes as a result of new operating data and economic and other conditions that impact our business.
As an additional indicator of fair value, we considered arm’s-length transactions involving sales and purchases of our common stock occurring near therespective valuation dates. The most recent such transaction occurred in December 2008 when an existing stockholder purchased shares from our founders andcertain employees at a price of $4.26 per share.
We also utilize a probability-weighted expected return method (“PWERM”) to estimate the fair value of our common stock using the methods discussedabove. The recent growth and expansion of our business in 2009 and 2010, combined with a continuing trend of general improvement in the capital marketsduring the same period, provided us better visibility into the likelihood of achieving a liquidity event in the next one to two years.
Under the PWERM, the value of our common stock is estimated based upon an analysis of values for our common stock assuming the following possiblefuture events for the company: • initial public offering; • strategic merger or sale; • remaining a private company; and • dissolution of the company.
For each of the possible events, a range of future equity values is estimated, based on the market, income or cost approaches and over a range of possibleevent dates, all discounted for the time-value of money. The timing of these events is based on management’s estimates. For each future equity value scenario, wedetermine the appropriate allocation of value to holders of our shares of common stock. The value of each share of common stock is then multiplied by a discountfactor derived from the calculated discount rate and the expected timing of the event. The value per share of common stock is then multiplied by an estimatedprobability for each of the possible events based on management’s estimates. The calculated value per share of common stock under each scenario is thendiscounted for a lack of marketability. A probability-weighted value per share of common stock is then determined.
When using the PWERM, a market-comparable approach and an income approach were used to estimate our aggregate enterprise value at each valuationdate. When choosing the market-comparable companies to be used for the market-comparable approach, we focused on the peer group of comparable companiesdescribed above operating within the technology and technology-enabled service sectors. The income approach involves applying an appropriate risk-adjusteddiscount rate to our projected debt-free cash flows, based on forecasted revenue and costs.
We also prepared financial forecasts for each valuation report date used in the computation of the enterprise value for both the market-comparable approachand the income approach. The financial forecasts were based on assumed revenue growth rates that took into account our past experience and contemporaneousfuture expectations of revenue from new and existing engagements. The risks associated with achieving these forecasts were assessed in selecting the appropriatecost of capital, which ranged from 16% to 18%.
In identifying other indicators of fair value, we considered transactions involving purchases and sales of shares, with the most recent being the previouslymentioned transaction in December 2008.
62

Table of Contents
Since January 1, 2009 through December 31, 2010, we granted stock options with exercise prices as follows:
Grant Date Number of Options
Granted Exercise Price
Per Option
Common StockFair Value atGrant Date
(in thousands) February 4, 2009 186 $ 4.26 $ 4.26 February 27, 2009 1,695 $ 4.26 $ 4.26 May 8, 2009 148 $ 4.26 $ 4.26 July 28, 2009 638 $ 4.26 $ 4.26 November 4, 2009 983 $ 4.60 $ 4.60 January 27, 2010 284 $ 4.65 $ 4.65 February 9, 2010 1,863 $ 4.65 $ 4.65 May 7, 2010 854 $ 4.70 $ 4.70 July 28, 2010 1,678 $ 4.95 $ 4.95 December 16, 2010 2,315 $ 5.80 $ 7.25 Common Stock Valuations The most significant factors considered by our board of directors in determining the fair value of our common stock at these grant dates were as follows: Grants on February 4, February 27, May 8 and July 28, 2009
• The most recent independent contemporaneous valuation report was prepared as of December 1, 2008 utilizing the PWERM approach resulting in an
indicated fair value of $4.05 to $4.26 per share of our common stock. The high end of the indicated fair value range reflects the price paid in anarm’s-length sale of our common stock by founders and certain employees to an existing stockholder in December 2008.
• The PWERM approach scenario probabilities used in the valuation report were based on our business outlook. Our management estimated a25%-30% probability of an initial public offering, a 25%-30% probability of a sale or merger and a 40%-50% probability that we would continue as aprivate company. A bankruptcy scenario was deemed not probable and was assigned a 0% probability. In addition, our board recognized thatmanagement forecasts had not changed materially since the December 1, 2008 valuation report.
• In determining the fair value of option awards on July 28, 2009, our board specifically considered the April 2009 public announcement by Oracle
that it had entered into an agreement to acquire Sun Microsystems, our largest customer and the potential impact to our operations if this customerterminated its contracts with us.
• Our board of directors determined the fair value per share of stock to be $4.26, the high end of the indicated range of value reflected in the valuationanalysis.
Grants on November 4, 2009
• The most recent independent contemporaneous valuation report was prepared as of September 30, 2009 utilizing the PWERM approach resulting inan indicated fair value of $4.55 to $4.75 per share of our common stock.
• The PWERM approach scenario probabilities used in the valuation report were based on our business outlook. Our management estimated a
30%-35% probability of an initial public offering, an increase of five percentage points from the prior valuation; a 30%-35% probability of a sale ormerger, also a five percentage point increase from the prior valuation; and a ten percentage decrease in the probability that
63

Table of Contents
we continue as a private company to an estimated range of 30%-40%. A bankruptcy scenario was deemed not probable and was assigned a 0%probability. In addition, our board recognized that management forecasts had not changed materially since the September 30, 2009 valuation report.
• Management’s business outlook which considered the growth in revenue resulting from new customer arrangements as well as the potential impact toour business if Sun Microsystems were to terminate its relationship with us as a result of being acquired by Oracle.
• The fair value per share of stock on November 4, 2009 was determined by our board to be $4.60 per share, the low end of the range of indicated fairvalue reflected in the valuation analysis.
Grants on January 27 and February 9, 2010
• The most recent independent contemporaneous valuation report was prepared as of December 31, 2009 utilizing the PWERM approach resulting inan indicated fair value of $4.65 to $4.80 per share of our common stock.
• The PWERM approach scenario probabilities used in the valuation report were based on our business outlook. Management estimated a 30%-35%probability of an initial public offering, a 30%-35% probability of a sale or merger and a 30%-40% probability that we would continue as a privatecompany. A bankruptcy scenario was deemed not probable and was assigned a 0% probability. In addition, our board recognized that managementforecasts had not changed materially since the December 31, 2009 valuation report.
• Management’s business outlook continued to reflect revenue growth anticipated from new customer engagements and expected revenue fromexisting engagements, as well as uncertainty surrounding continuation of the Sun Microsystems engagements.
• Our board of directors determined the fair value per share of stock to be $4.65, the low end of the indicated range of fair value reflected in thevaluation analysis, which reflected the continued uncertainty to our business following the acquisition of Sun Microsystems by Oracle.
Grants on May 7, 2010
• The most recent independent contemporaneous valuation report was prepared as of March 31, 2010 utilizing the PWERM approach resulting in anindicated fair value of $4.70 per share of our common stock.
• The PWERM approach scenario probabilities used in the valuation report were based on our business outlook. Management estimated a 33%probability of an initial public offering, a 33% probability of a sale or merger and a 33% probability that we would continue as a private company. Abankruptcy scenario was deemed not probable and was assigned a 0% probability. In addition, our board recognized that management forecasts hadnot changed materially since the March 31, 2010 valuation report.
• Management’s business outlook continued to reflect revenue growth anticipated from new customer engagements and expected revenue fromexisting engagements, as well as uncertainty surrounding continuation of the Sun Microsystems engagements.
• Our board of directors determined the fair value per share of stock to be $4.70, consistent with the indicated fair value reflected in the valuationanalysis.
Grants on July 28, 2010 • The most recent independent contemporaneous valuation report was prepared as of June 30, 2010 and indicated a fair value of $4.95 per share.
64

Table of Contents
• PWERM approach scenario probabilities used in the valuation report were based upon our business outlook. Our management estimated a 40%probability of an initial public offering, an increase from the 33% assumption in the prior valuation; a 30% probability of a sale or merger, downfrom a 33% probability used in the prior valuation; and a 30% probability that we would continue as a private company, a decrease from the 33%probability used in the prior valuation. A bankruptcy scenario was deemed not probable and was assigned a 0% probability. In addition, our boardrecognized that management forecasts had not changed materially since the June 30, 2010 valuation report.
• While our financial forecast remained unchanged from the forecast utilized in the March 31, 2010 valuation, the increase in the fair value of our
common stock as compared to the prior valuation resulted principally from the increased probability of an initial public offering as we undertookactivities in this area.
• Management’s business outlook continued to reflect revenue growth from new customer engagements and anticipated revenue from new
engagements or revenue from expanded engagements with existing customers. Our financial forecast decreased as a result of the notice ofcancellation of the Sun Microsystems contracts.
• Our board of directors determined the fair value per share of stock to be $4.95, consistent with the indicated fair value reflected in the valuationanalysis.
Grants on December 16, 2010 • The most recent independent contemporaneous valuation report was prepared as of September 30, 2010 and indicated a fair value of $5.80 per share.
• PWERM approach scenario probabilities used in the valuation report were based upon our business outlook. Our management estimated a 50%probability of an initial public offering, an increase from the 40% assumption in the prior valuation; a 25% probability of a sale or merger, downfrom a 30% probability used in the prior valuation; and a 25% probability that we would continue as a private company, a decrease from the 30%probability used in the prior valuation. A bankruptcy scenario was deemed not probable and was assigned a 0% probability.
• While our financial forecast remained unchanged from the forecast utilized in the March 31, 2010 valuation, the increase in the fair value of our
common stock as compared to the prior valuation resulted principally from the increased probability of an initial public offering as we undertookactivities in this area.
• Our board of directors determined the fair value per share of stock to be $5.80, consistent with the indicated fair value reflected in the valuationanalysis.
• On January 25, 2011, an independent valuation specialist issued a report as of December 31, 2010 that indicated a fair value per share of stock of$6.20. Based on the proximity of this valuation report relative to the December 16, 2010 grants and in connection with the preparation of our 2010financial statements in anticipation of a potential initial public offering, we reassessed for financial reporting purposes the estimate of fair value pershare of the December 16, 2010 grants. Various factors were considered. For example, in mid-February 2011, prior to issuing our 2010 financialstatements, our underwriters provided us with an estimated range of value for an initial public offering of $7.50 to $9.00 per share. Based on thisestimated range, we evaluated the impact on the valuation specialist’s report as of December 31, 2010 using an IPO value of $8.25 per share, themidpoint of the underwriters’ initial public offering range. We evaluated the fair value of the Company’s common stock based on linear interpolationfrom a fair value of $4.95 per share as estimated by the valuation specialist as of June 30, 2010 to a fair value of $8.25. In addition, we alsoconsidered the impact of using $8.25 as the estimated fair value in an IPO scenario in the PWERM analysis, maintaining a 70% probability of suchoutcome, consistent with the valuation specialist’s report, which demonstrated the reasonableness of the fair value of $7.25 at December 31, 2010.While there can be no certainty of
65
Table of Contents
completing an IPO, a re-assessed fair value that considered the proposed pricing range was appropriate in concluding that the estimated per-sharevalue of the underlying common shares for options granted on December 16, 2010 was $7.25 per share for financial reporting purposes.
Nonemployee Stock-Based Compensation We account for stock options issued to nonemployees based on the estimated fair value of the awards using the Black-Scholes option pricing model. Themeasurement of stock based compensation is subject to periodic adjustments as the underlying equity instruments vest, and the resulting change in value, if any, isrecognized in our consolidated statements of operations during the period the related services are rendered.
Stock-based compensation expense for options granted to nonemployees in 2010 was $0.1 million. The amount for 2008 was insignificant. There were nooptions granted to nonemployees in 2009.
There is inherent uncertainty in these estimates and if different assumptions had been used, the fair value of the equity instruments issued to nonemployeeconsultants could have been significantly different. Capitalized Internal-Use Software Commencing in 2007, we began incurring costs related to the development of our technology platform. In connection with these efforts, we capitalizedexternal costs as well as internal labor costs related to the development of internal-use software associated with our technology platform. During 2008, 2009 and2010, we capitalized $2.8 million, $5.0 million and $4.7 million, respectively, primarily related to the development of our technology platform and cloudapplications. Capitalized amounts included costs of internal labor totaling $0.9 million and $0.8 million in 2009 and 2010, respectively, while the remainder ofamounts capitalized during the periods related to costs of third-party developers. The higher spending during 2009 relative to 2010 reflects increased costs relatedto the development of our channel sales and analytics and reporting applications.
We capitalize certain internal and external costs related to the development and enhancement of our internal-use software when we enter the applicationdevelopment stage and until software is substantially complete and is ready for its intended use. These capitalized costs include direct external costs of servicesutilized in developing or obtaining internal-use software, compensation and related expenses of employees who are directly associated with, and who devote timeto, internal-use software projects. Capitalization of these costs ceases once the project is substantially complete and the software is ready for its intended use andthe related costs are amortized over estimated useful lives ranging from 24 to 60 months. Post-implementation training and maintenance costs are expensed asincurred. We initiate our review of potential impairment whenever events or changes in circumstances indicate that the carrying amount of the capitalizedinternal-use software may not be recoverable. Recoverability of assets is assessed by a comparison of the carrying amount of an asset to the expected futureundiscounted cash flows expected to be generated by the asset. If it is determined that the carrying value of the internal-use software is not recoverable, animpairment loss is recorded in the amount by which the carrying amount of the asset exceeds the fair value of the asset. There were no impairments to internal-use software in 2008, 2009 or 2010. Income Taxes Since inception through December 31, 2007 we conducted our U.S. operations through the LLC, a pass-through entity for tax purposes. Under thisstructure, we file our income tax return as a partnership for federal and state income tax purposes. The LLC is not subject to income taxes other than annualCalifornia limited liability company fees based on revenues. The members of the LLC, not the LLC itself, are subject to income taxes on their allocated share ofthe LLC’s earnings. The LLC is required to pay cash distributions to the members to fund members’ tax obligations based on the members’ allocated share of theLLC’s net income, if applicable. Effective January 1, 2008, the LLC transferred a significant portion of its U.S. operations to a wholly-
66

Table of Contents
owned U.S. taxable subsidiary. We also have several subsidiaries formed in foreign jurisdictions, which are subject to local income taxes.
We account for income taxes for our taxable subsidiaries using an asset and liability method, which requires the recognition of taxes payable or refundablefor the current year and deferred tax assets and liabilities for the expected future tax consequences of temporary differences that currently exist between the taxbasis and the financial reporting basis of our taxable subsidiaries’ assets and liabilities using the enacted tax rates in effect for the year in which the differences areexpected to reverse. The effect of a change in tax rates on deferred tax assets and liabilities is recognized in operations in the period that includes the enactmentdate. The measurement of deferred tax assets is reduced, if necessary, by the amount of any tax benefits that, based on available evidence, are not expected to berealized.
We adopted FASB ASC Topic 740 (“ASC 740”) on unrecognized tax benefits on January 1, 2007. The adoption of ASC 740 did not have an impact on theJanuary 1, 2007 stockholders’ equity because we believe there were no uncertain tax positions for tax years prior to 2007. As of December 31, 2009 and 2010, wedid not have any unrecognized tax benefits that if recognized would impact our annual effective tax rate. We account for unrecognized tax benefits using a more-likely-than-not threshold for financial statement recognition and measurement of tax positions taken or expected to be taken in a tax return. We establish reservesfor tax-related uncertainties based on estimates of whether, and the extent to which, additional taxes will be due. We record an income tax liability, if any, for thedifference between the benefit recognized and measured and the tax position taken or expected to be taken on our tax returns. To the extent that the assessment ofsuch tax positions change, the change in estimate is recorded in the period in which the determination is made. The reserves are adjusted in light of changing factsand circumstances, such as the outcome of a tax audit. The provision for income taxes includes the impact of reserve provisions and changes to reserves that areconsidered appropriate. As of December 31, 2009 and 2010, we have not recorded any liabilities for unrecognized tax benefits. Income Tax Accounting Related to the Conversion We have prepared and provided unaudited pro forma disclosures in our consolidated statements of operations and consolidated balance sheets as if theentire company was taxable as a corporation beginning on January 1, 2010 with respect to our statement of operations and as of December 31, 2010 with respectto our balance sheet. The pro forma income tax expense was $0.4 million in 2010, and the pro forma deferred tax asset on our balance sheet at December 31,2010 was $33.6 million. In connection with our conversion from an LLC into a corporation, we expect to record a non-cash income tax benefit equal to theamount of the net adjustment to the deferred tax balances, which would have been $22.0 million on a pro forma basis as of December 31, 2010.
Pro forma deferred income taxes reflect the net tax effects of temporary differences between the pro forma carrying amounts of our assets and liabilitiescalculated for financial reporting purposes and the amounts that would have been calculated for our income tax returns in accordance with tax regulations and thenet pro forma tax effects of operating loss and tax credit carryforwards if we had been a taxable entity.
The ultimate realization of deferred tax assets depends on the generation of sufficient taxable income of the appropriate character and in the appropriatetaxing jurisdictions during the future periods in which the related temporary differences become deductible. We determined the valuation allowance on our proforma deferred tax assets is in accordance with the accounting standard for income taxes, which require weight of both positive and negative evidence in order toascertain whether it is more likely than not that the pro forma deferred tax assets would be realized. We evaluated all significant available positive and negativeevidence, including the existence of cumulative net income, benefits that could be realized from available tax strategies and forecasts of future taxable income, indetermining the need for a valuation allowance on our pro forma deferred tax assets. After applying the evaluation guidance of the accounting standard forincome taxes we determined that it was more likely than not that the pro forma deferred tax assets will be realized, and as such, a valuation allowance is notrequired.
67

Table of Contents
Our pro forma gross, tax effected, deferred tax assets were approximately $33.6 million as of December 31, 2010. Our pro forma net deferred tax liabilitieswere $0 as of December 31, 2010. Recent Accounting Pronouncements In October 2009, Financial Accounting Standards Board, (“FASB”) issued a new accounting standard that changes the accounting for arrangements withmultiple deliverables. The new standard requires an entity to allocate arrangement consideration at the inception of an arrangement to all of its deliverables basedon their relative selling prices. This standard will become effective for us beginning January 1, 2011. This Accounting Standards Update (“ASU”) removed theprevious separation criteria that objective and reliable evidence of the fair value of any undelivered items must exist for the delivered item to be considered aseparate unit or units of accounting. Given our current contractual arrangements, the adoption of this standard is not expected to have a material impact on ourconsolidated financial statements.
In January 2010, the FASB issued amended guidance on fair value measurements and disclosures. The new guidance requires additional disclosuresregarding fair value measurements, amends disclosures about postretirement benefit plan assets, and provides clarification regarding the level of disaggregation offair value disclosures by investment class. This guidance is effective for interim and annual reporting periods beginning after December 15, 2009, except forcertain Level 3 activity disclosure requirements that will be effective for reporting periods beginning after December 15, 2010. Accordingly, we adopted thisamendment in 2010, except for the additional Level 3 requirements which will be adopted in 2011. Level 3 assets and liabilities are those whose fair market valueinputs are unobservable and reflect management’s best estimate of what market participants would use in pricing the asset or liability at the measurement date.The adoption of this guidance did not have a material impact on our consolidated financial statements.
In February 2010, the FASB issued ASU No. 2010-09 Subsequent Events (FASB ASC Topic 855): Amendments to Certain Recognition and DisclosureRequirements. ASU 2010-09 requires an entity that is a filer with the Securities and Exchange Commission (“SEC”) to evaluate subsequent events through thedate that the financial statements are issued and removes the requirement for an SEC filer to disclose a date, in both issued and revised financial statements,through which the filer had evaluated subsequent events. The adoption of this standard did not have a significant impact on our consolidated financial statements.
In April 2010, the FASB issued ASU No. 2010-13, Compensation—Stock Compensation (Topic 718)—Effect of Denominating the Exercise Price of aShare-Based Payment Award in the Currency of the Market in Which the Underlying Equity Security Trades. ASU 2010-13 provides amendments to Topic 718 toclarify that an employee share-based payment award with an exercise price denominated in the currency of a market in which a substantial portion of the entity’sequity securities trades should not be considered to contain a condition that is not a market, performance, or service condition. Therefore, an entity would notclassify such an award as a liability if it otherwise qualifies as equity. The amendments in ASU 2010-13 will be effective for us beginning January 1, 2011. Theadoption of this standard is not expected to have a material impact on our consolidated financial statements.
68

Table of Contents
BUSINESS Overview ServiceSource is a leader in service revenue management, providing solutions that drive increased renewals of maintenance, support and subscriptionagreements for technology companies. Our integrated solution consists of a suite of cloud applications, dedicated service sales teams working under ourcustomers’ brands and a proprietary Service Revenue Intelligence Platform. By integrating software, managed services and data, we provide end-to-endmanagement and optimization of the service contract renewals process, including data management, quoting, selling and service revenue business intelligence.Our business is built on our pay-for-performance model, whereby customers pay us based on renewal sales that we generate on their behalf. As of December 31,2010, we managed over 100 engagements across more than 55 customers, representing over $5 billion in service revenue opportunity under management. Duringthe years ended December 31, 2008, 2009 and 2010, the actual value of qualified end customer contracts delivered to us totaled $1.9 billion, $2.8 billion and $3.7billion, respectively. We had approximately 60 and 80 engagements as of December 31, 2008 and 2009, respectively.
We deploy our solution through offerings that provide end-to-end management of the renewals process or that are tailored to address specific challenges ofthis process. Our highly scalable solution allows us to sell in over 30 languages from six sales centers around the globe. It is designed to provide optimizedservice revenue performance irrespective of revenue models, distribution models, and segments within the technology and technology-enabled healthcare and lifesciences industries, including hardware, software and software-as-a-service. Based on our analysis of customer renewal rates for new engagements added in 2009,we generated renewal rates on contracts delivered to us in the first half of 2010 that on a dollar value basis increased by an average of over 15 percentage pointsover historical customer renewal rates calculated in our Service Performance Analysis (“SPA”).
Our total revenue was $100.3 million, $110.7 million and $152.9 million for the years ended December 31, 2008, 2009 and 2010, respectively. In 2010,Oracle acquired our then-largest customer, Sun Microsystems, and terminated our contract with Sun Microsystems effective as of September 30, 2010. SunMicrosystems accounted for $22.8 million, $26.3 million and $19.6 million, or 23%, 24% and 13%, of our total revenue for the years ended December 31, 2008,2009 and 2010, respectively. For summarized financial information by geographic area, see Note 13 of the Notes to Consolidated Financial Statements.
For a discussion of the development of our business over the last five years, see “Management’s Discussion and Analysis of Financial Condition andResults of Operations—Overview.” Industry Background The Importance of Service Revenue As the technology industry matures and companies search for new drivers of growth and profitability, a new focus is emerging: service revenue. We defineservice revenue as the revenue companies earn from the sale of maintenance and support agreements, as well as subscription contracts. Service revenue hasbecome increasingly important for technology companies as it represents a significant portion of total revenue, drives incremental profitability, can be highlyrecurring and correlates with customer satisfaction.
• Service revenue is a dramatically growing component of technology industry revenue. Over the last decade, service revenue has surpassed newproduct and license revenue for many technology companies. The advent of software-as-a-service and cloud based solutions has further increased thecontribution of service revenue to technology industry revenue. According to Gartner, total spending on maintenance and support agreements as wellas SaaS/subscription contracts across the technology sector is expected to total $159 billion in 2011, including approximately $87 billion on hardwaresupport, approximately
69

Table of Contents
$61 billion on software support and approximately $11 billion on software-as-a-service. Software as a Service, or SaaS, is a business model underwhich buyers purchase remote access to software applications, rather than purchasing software licenses and installing the software applications ontheir own premises. In this model, access to the remote software application is typically provided on a subscription basis.
• Service revenue can deliver enhanced profitability. Service revenue is a significant contributor to the profitability of technology companies. Forexample, one large technology company reported approximately 90% in gross margin from support and updates revenue compared to 43% grossmargin for license and product revenue for its fiscal year 2010. We believe that the support costs associated with service revenue can be relativelyfixed, which allows each incremental dollar generated from improved renewal rates to fall to the bottom line without significant cost.
• Service revenue is predictable and recurring. Service revenue is typically based on annual or multi-year contracts to provide ongoing maintenanceand support for existing technology investments or subscriptions for continued access to products and services. Continued successful renewal ofservice contracts provides technology companies with highly predictable service revenue streams as well as the ongoing opportunity to renewcontracts.
• Service relationships increase end customer satisfaction. Service relationships allow technology companies to maintain an active dialogue with theirend customers. By regularly interacting with end customers, providing them with effective service, communicating to them the value of that serviceand better understanding their needs, companies can increase customer satisfaction and retention. Greater customer satisfaction increases theprobability of future contract renewals and new product sales.
Effective Service Revenue Management is Complex and Challenging Just as service revenue has become increasingly important to technology companies, service revenue management has also become more complex andchallenging. While technology companies have generally increased their focus on renewal rates associated with service contracts, we believe many have beenunable to optimize their service revenue performance due to limited expertise in effective service revenue management and historical underinvestment inassociated infrastructure. In addition, multiple factors have made effective service revenue management challenging for technology companies, including thefollowing:
• Fragmented service revenue data. Effective service revenue management requires more extensive data management than new product or license
sales. Service renewals utilize data from CRM, contract, quoting, entitlement, asset management and support systems, among others. The data isoften duplicative, error prone, incomplete or simply outdated and it may be cobbled together from half a dozen or more enterprise systems.
• Existing infrastructure ill-equipped to optimize service revenue. Many companies have not invested in the enterprise systems, data warehouses,analytical applications and sales teams needed to optimize service revenue performance. As service contract renewals often encompass differentprocesses and rely on information attributes not typically captured by existing systems, such as aging, contract entitlements and warrantyconsiderations, traditional business applications are not designed to support end-to-end service revenue management. Additionally, sales teams areoften not effectively trained or sufficiently incentivized to drive sales of service contracts, and are focused instead on product or license sales.
• Channel complexity and misaligned incentives. Many technology companies have hundreds, if not thousands, of channel partners across one or more
distribution tiers. This structure increases management complexity and can be exacerbated by misalignment of incentives and limited channeltransparency. For example, companies typically measure and incentivize channel partners based on
Gartner, Inc., Forecast: IT Services, 2007-2014, 4Q10 Update, December 2010, Kathryn Hale et al; Forecast Analysis: Software as a Service, Worldwide, 2009-2014, Update, Sharon A. Mertz et al,
November 11, 2010.
70
1
1

Table of Contents
new product and license sales, not service revenue renewals. Also, channel partners sometimes may be reluctant to share end customer information,making it difficult for technology companies to maximize service revenue through the channel.
• Savvy IT buyers with limited budgets. The macroeconomic landscape has put significant pressure on enterprise technology budgets, causing ITbuyers to push back on service contract pricing and seek discounts. Additionally, a new group of advisors has emerged to help IT buyers betternegotiate service contracts with technology companies. Furthermore, the rise of third-party vendors who provide independent maintenance andsupport has put further pressure on renewals.
• Lack of industry standards and benchmarks. Consistent definitions for renewal rates and meaningful benchmarks are necessary for companies to
determine how they are performing relative to industry peers and how they can employ best practices to improve their service revenue performance.However, there are currently no widely accepted industry metrics for service revenue management, nor is there easy access to best practices.
• Complexity due to mergers and acquisitions and global scale. Mergers and acquisitions create a unique challenge for service revenue management asthe complete view of the customer and its service contracts requires the integration of disparate systems and data between merging companies, whichis often fraught with challenges. Optimizing service revenue requires overcoming these challenges to gain a complete and accurate view of thecustomer base and develop a consistent approach to selling renewals. The global scale of many technology companies adds further complexity, aseffective service revenue management requires diverse strategies and tactics across different geographies. Maintaining a global service sales effortrequires significant investment in infrastructure and personnel to have the language and local selling capabilities required to engage with and sell toend customers.
Significant Opportunity for Service Revenue Management According to Gartner, total spending on maintenance and support agreements as well as SaaS/subscription contracts across the technology sector isexpected to total $159 billion in 2011, including approximately $87 billion on hardware support, approximately $61 billion on software support andapproximately $11 billion on software-as-a-service. Despite this market opportunity, we believe the complexity of effective service revenue management,coupled with underinvestment in this area has led to suboptimal renewal rates on service contracts. Lower renewal rates result in significant lost revenue and maygive the impression that products and services are not viewed positively by end customers.
Effective service revenue management requires a focused and differentiated approach as well as resources that many technology companies lack. Theseresources include enterprise systems built specifically for service revenue data management, analytical applications that monitor service revenue performance,sales processes tailored specifically to increase service contract renewals and global service sales teams with the expertise to sell service contracts.
Most technology companies focus their internal investments on developing and selling new products. The historical lack of investment in service revenueperformance solutions presents a compelling opportunity for us. By improving renewal rates, technology companies can generate higher service revenue,profitability and end customer satisfaction. We believe optimized service revenue performance can be a powerful earnings growth engine for the technologyindustry. Business Customers are Increasingly Turning to Cloud Based Technology and Performance Based Solutions Companies are rapidly adopting cloud based solutions as management teams strive to reduce the risk of technology implementation, focus on corecompetencies and improve financial performance. Cloud based solutions refers to software applications and other services delivered over the Internet, typically inplace of on-premise software applications.
Gartner, Inc., Forecast: IT Services, 2007-2014, 4Q10 Update, December 2010, Kathryn Hale et al; Forecast Analysis: Software as a Service, Worldwide, 2009-2014, Update, Sharon A. Mertz et al,November 11, 2010.
71
1
1

Table of Contents
Historically, enterprises have deployed home-grown or third-party software applications on site and managed business processes internally. More recently,however, businesses have become increasingly convinced that cloud based solutions are less expensive, can be deployed more rapidly and with less risk, and haveincreased data analysis capability and functionality.
Recently, companies are also realizing the value of solutions that integrate software, managed services and data to deliver a business outcome. Rather thaninvesting in infrastructure based on an assumed return on investment or incurring significant fees that are not tied to performance, companies are recognizing thevalue of paying for solutions based on business outcomes. An example of this trend is the market for Internet search, in which companies pay for a combinationof advertising services, data and a technology platform, and pay for this solution on a per-click or performance basis. Our Solution Our solution is based on nearly a decade of experience pioneering the service revenue management category and is designed to optimize service revenueperformance for our customers. It addresses the critical elements of the renewals process, including data management, quoting, selling, and service revenuebusiness intelligence. We believe our solution, which tightly integrates software, managed services and data, reflects the growing trend of delivering enterpriseservices via the cloud. We believe this approach is critical to addressing the unique requirements of effective service revenue management.
The components of our solution consist of our proprietary Service Revenue Intelligence Platform, our suite of cloud applications, and our dedicated servicesales teams. The foundation of our solution is our Service Revenue Intelligence Platform, a data warehouse of transactional, analytical and industry data thatgrows with each service renewal transaction and customer. Our suite of cloud applications increase visibility and control of service revenue management and areutilized by customers, channel partners, end customers and our service sales teams. Our dedicated service sales teams have specific expertise in our customers’businesses, are deployed under our customers’ brands and follow a sales process tailored specifically to increase service contact renewals.
We deploy our solution through five offerings to address specific needs of our customers’ different business and selling models: Direct Sales, ChannelEnablement, Reseller Sales, Subscription Lifecycle Management and Enterprise. For example, the Subscription Lifecycle Management solution incorporatescritical product adoption business processes unique to the software-as-a-service market that have been effective in increasing renewal rates. Likewise, theChannel Enablement solution deploys a Channel Sales application and specialized channel enablement service sales teams to navigate the challenges associatedwith optimizing renewal rates in a complex, multi-tier channel distribution environment.
Key benefits of our solution include:
Financial Benefits
• Increased service revenue. Our solution is designed to increase customers’ service revenues. Each customer engagement begins with an in-depthanalysis of customers’ current renewal rates, which we call our SPA. We actively monitor the service contract renewal rates we drive on behalf of ourcustomers in each engagement. When we generate higher renewal rates, we not only drive incremental service revenue for the associated period, butalso have a compounding effect in increasing the base number of contracts eligible for renewal in subsequent periods, which expands the opportunityto generate greater revenue in future periods.
• Increased margin and profitability. We believe that the costs associated with delivering maintenance, support and subscription services by many of
our customers can be relatively fixed, and thus growth of service revenue can benefit our customers’ bottom line. In addition, customers that deployour solution
72

Table of Contents
can avoid infrastructure expenditures and personnel costs that would otherwise be associated with managing service renewals internally. As a result,each incremental dollar of service revenue generated by our solution can drive greater profitability for our customers.
Operational Benefits
• Improved end customer satisfaction. Our regular dialogue with end customers allows us to communicate the value of our customers’ maintenance,support and subscription services, and capture and address questions and concerns about our customers’ products.
• Greater business insight and analytics. Our Service Revenue Intelligence Platform allows us to analyze our customers’ renewals against similartransactions and to identify areas for improvement, enabling greater insight into their renewals business. All transactions, whether or not resulting ina successful renewal by an end customer, are recorded in our intelligence platform. We leverage this platform to provide benchmarking, end customermetrics, sales efficiency data and insight into successful and unsuccessful renewal efforts. The breadth of our data allows us to provide powerfulanalysis across regions, industries, channel partners and product segments.
• Greater visibility and forecasting tools. Our cloud applications deliver real-time analytics and visibility into a customer’s service revenueperformance, sales efficiency and forecasts. We measure service revenue performance across over 100 Key Performance Indicators (“KPIs”) that arehoused in our intelligence platform and provide real-time data to our customers through a clear and impactful web-based interface. CFOs and otherexecutives utilize our applications to assist in forecasting their results and to measure progress against their forecasts on a real-time basis.
• Strengthened channel loyalty. Our Channel Sales Cloud application and service sales teams empower our customers’ channel partners to generatehigher sales by providing accurate, real-time data on their renewal opportunities and performance relative to quota as well as tools to sell moreeffectively to end customers. These cloud applications help our customers develop a closer relationship with their channel partners and enable ourcustomers to increase renewals through the channel.
• Global consistency. We are able to maintain a globally consistent renewals process for our customers as all of our six sales centers leverage a unified
intelligence platform. Our solution automates the application of best practices to the service renewals process and provides all relevant constituencieswith a consistent view of the data. This facilitates service renewals and provides reliable performance management and analytics.
73

Table of Contents
Our Competitive Advantages We believe our business is difficult to replicate, as it incorporates a combination of several important and differentiated elements, including:
• Proprietary Service Revenue Intelligence Platform. We have built a proprietary Service Revenue Intelligence Platform that aggregates thetransactional, analytical and industry data we have gathered from over two million service renewal transactions. This information and associatedbusiness insight allows us to improve service revenue performance for each customer’s unique business. The intelligence platform powerssubstantially all of our business, including our SPA, the pricing and scoping of our solutions, performance optimization, customer benchmarking, andindustry thought leadership, and influences the way in which we develop our cloud applications and our sales process tailored specifically to increaseservice contract renewals. We continue to enhance our intelligence platform as we grow our service revenue opportunity under management.
• Pay-for-performance business model. Our customers pay us based on the renewal sales that we generate on their behalf. Our business model directlyaligns our interests with our customers’ interests to drive greater service revenue. This self-funding model also eliminates the need for our customersto make large upfront investments in infrastructure that offer no guarantee of improved service revenue performance. Our Service RevenueIntelligence Platform is the critical element that allows us to price effectively on a pay-for-performance basis.
• Industry leadership. We were founded nearly a decade ago and we believe that we have more service revenue opportunity under management and
more service revenue performance data than any other third-party provider. Our industry leadership enables us to innovate best practices, continue toenhance our intelligence platform and attract new customers.
• Service revenue focused solution. Our entire solution is built from the ground up to deliver industry-leading service revenue performance across the
key elements of the renewals process. We believe our combination of software, managed services and data is unmatched by any other third-partysolution.
74

Table of Contents
• Renewal sales methodology. Our service sales teams leverage our intelligence platform, sales processes and best practices to manage the end
customer relationship and enhance service contract renewal rates. We engage in extensive ongoing training of our service sales teams to ensureconsistency of execution across our entire organization.
• Global scale and expertise. Our service sales teams sell in over 30 languages from six sales centers around the globe. Our sales footprint andlocalized capabilities enable us to better serve the increasingly global nature of our customers’ businesses.
Our Strategy We intend to continue our industry leadership in service revenue management with the following strategies:
• Expand customer base within existing industry verticals. We believe there is a significant opportunity to increase our service revenue opportunityunder management. According to Gartner, total spending on maintenance and support agreements as well as SaaS/subscription contracts across thetechnology sector is expected to total $159 billion in 2011, including approximately $87 billion on hardware support, approximately $61 billion onsoftware support and approximately $11 billion on software-as-a-service. We intend to increase investment in our sales and marketing organizationto win new customers in the technology and technology-enabled healthcare and life sciences industries.
• Continue to build, deploy and increase the revenue we generate from our cloud applications. We intend to continue to invest in our cloudapplications. We have created a variety of applications for channel partners, direct sellers and end customers that we provide as part of our offerings.In addition to extending and strengthening our suite of applications, we are exploring alternatives for packaging and pricing these applications tofurther monetize them.
• Increase footprint with existing customers to drive greater revenue per customer. Our goal is to manage a greater portion of each customer’s servicerevenue. Typically, we initially manage one component of a customer’s service revenue, such as a specific product, market segment or geographicregion. With our pay-for-performance model, we are able to quantify our results for the customer, frequently leading to an increase of service revenueopportunity under management for that customer, and ultimately greater revenue.
• Increase our operating efficiency by developing additional technology. We have developed an intelligence platform and suite of applications thatdrive increases in efficiency and help to automate tasks associated with service revenue management. For example, we have created a quotingapplication to automate the service contract quoting process. By continuing to automate processes, we can lower operating costs, increase theefficiency of our solutions and ultimately enhance our profitability and cash flow.
• Add new customers from additional industry verticals and geographic markets. We recognize that service revenue opportunities exist in sectorsbeyond the technology industry. We currently have a small number of technology-enabled healthcare and life sciences customers for whom wemanage medical equipment maintenance and support contracts. We believe there are additional industry verticals and geographic markets that canbenefit from our expertise and best practices, and we intend to pursue these opportunities.
Gartner, Inc., Forecast: IT Services, 2007-2014, 4Q10 Update, December 2010, Kathryn Hale et al; Forecast Analysis: Software as a Service, Worldwide, 2009-2014, Update, Sharon A. Mertz et al,
November 11, 2010.
75
1
1

Table of Contents
The Components of Our Solution Our solution consists of our Service Revenue Intelligence Platform, cloud applications and dedicated service sales teams. The following diagram illustratesthe elements of our solution:
Service Revenue Intelligence Platform Since our inception, we have developed and evolved our Service Revenue Intelligence Platform, a data warehouse of transactional, analytical and industrydata that powers our solution, provides insight into the business we manage on behalf of our customers, and enables us to deliver higher performance for thosecustomers.
• Transactional data. An integral part of our renewals process is the broad data capture we perform to ensure we have documented the important
information about each transaction. With over two million transactions completed since inception, we have been able to build a robust datawarehouse of service revenue and renewals information.
• Analytical data. We track and leverage the 100 KPIs and benchmarks in our intelligence platform across our business. The data has been analyzedacross a number of dimensions, such as by region, customer segment, and contract dollar value, among others.
• Industry data. At the core of the intelligence platform is a service revenue-specific data model and benchmarking database that allows us to extract
transactional data from customers and capture other structured and unstructured analytical data in a consistent manner. This allows us to benchmarkperformance across industries and perform cohort analyses to understand where we can apply best practices to increase performance.
The intelligence platform improves with every renewal we manage, every customer we engage, and every benchmarking study we complete. We believe
this is the most comprehensive data warehouse built exclusively for managing and optimizing service revenue from maintenance, support and subscriptionagreements on behalf of third-party customers.
Supporting the intelligence platform is our Data Management Engine. We have found that customer service renewals source data is almost universallyembedded in fragmented information technology systems. Our Data
76

Table of Contents
Management Engine extracts data from enterprise systems, such as ERP, CRM, billing and order management. This data is typically contained in differentformats with disparate levels of completeness, quality and freshness. After loading the data into our system, the Data Management Engine reconciles, cleansesand reorganizes our customers’ data providing our service sales teams with more accurate and relevant data, such as an inventory of the assets owned by endusers, service quote history, and current service contract terms.
We leverage our Service Revenue Intelligence Platform across critical business processes, including:
• Service Performance Analysis. During the SPA process, we conduct interviews of our prospective customers, analyze their historical performanceand future opportunity, and evaluate their service revenue business on a number of dimensions. The intelligence platform enables us to benchmarkand identify service renewal opportunities and calculate our ability to improve performance based on our performance on similar types of businessesand opportunities.
• Business Case, Pricing and Contract Structuring. We utilize our reservoir of data and benchmarks from the intelligence platform to estimate the
critical components of the business case and pricing model that we use in discussions with prospective customers. This intelligence is fundamental toour pay-for-performance business model.
• Service Revenue Performance. Once a partnership is in place with our customer, we leverage the intelligence platform to help enable, measure,analyze, benchmark, optimize, and continuously improve the performance of our service sales teams.
• Customer Benchmarking and Continuous Improvement. Our intelligence platform serves as the foundation to benchmark our customers’ evolvingservice revenue performance against industry peers and previous period performance. As a component of our “Clients for Life” methodology, weconvene quarterly business review meetings and annual partnership reviews with our customers to review performance, identify potential weaknessesand opportunities, and make recommendations that we believe will allow our customers and us to achieve higher levels of performance andefficiencies.
• Developing and Delivering Applications. The intelligence platform includes the data warehouse that fuels the opportunity data, sales methodologies,
metrics, and reporting dashboards that we engineer into our applications. Accordingly, we design our applications to leverage the transactional,analytical and industry data housed in our intelligence platform.
Cloud Applications We have developed a suite of applications designed to optimize specific elements of the renewals process. Our applications reflect our experience inoptimizing service revenue and are tested for usability and impact inside our own operations. Our suite of applications includes:
• Analytics Cloud. Our Analytics Cloud serves as an analytics and reporting application. It provides customers with dashboards to view and analyzeservice revenue performance by customer, revenue tier, channel partner, product line and region. It also provides real-time visibility into expectedresults, conversion and up-sells, territory analysis, benchmarking and other trending reports. This tool enables the executive staff of our customers toidentify trends and update sales strategies.
• Service Sales Cloud. Our Service Sales Cloud provides renewals analytics and pipeline management used by our service sales teams. It includes ananalytics dashboard for our teams to view their current sales pipeline, top deals and overall performance. It also includes an opportunity managementview that incorporates our best practice renewal sales methodology to enable teams to focus on selling by quickly accessing quotes and customerinformation to maximize performance.
• Channel Sales Cloud. Our Channel Sales Cloud provides channel partners and resellers with online access to their specific renewals opportunities
and their performance. The application includes an executive dashboard that enables partners to view their renewals pipeline, their performanceagainst
77

Table of Contents
key performance targets and how they are trending compared to previous quarters. In addition, an opportunity view allows partners to manage eachupcoming renewal opportunity, find account, contact and asset information specific to that opportunity, download pre-built quotes and requestassistance from ServiceSource to support the sales process.
• eCommerce Cloud. Our eCommerce Cloud provides self-service capabilities to end customers through a secure, online portal. End customers can
view their support contract information, modify their support coverage, obtain updated quotes and renew service contracts through online paymentprocesses. In addition, it allows end customers to reach our service sales team should they require assistance or wish to make a purchase offline.
Service Sales Teams The service sales teams consist of individuals with specific expertise in our customers’ businesses, are deployed under our customers’ brand and followsales processes tailored specifically to increase contract renewals, which is aimed at maximizing the value of the service revenue opportunity. These teams aredeployed in direct sales or channel enablement models, and in each case manage the key components of the renewals process. Our service sales teams currentlysell in over 30 languages from six sales centers around the globe. They are grouped into two primary areas:
• Global Selling. We employ service sales personnel that interact directly with end customers to sell service renewals. They also provide active salesenablement, support and management of channel partners. Our service sales teams act as an extension of our customers’ brands.
• Sales Operations. We provide service revenue forecasting tailored to fit our customers’ bookings, revenue targets and specific reportingrequirements. We supply a dedicated team of resources and tools to build and update customer and channel partner quotes and distribute them to thesales teams, channel partners and customers. Finally, we offer a business analytics team that provides analysis to maximize service revenueperformance and provide insight into end customers, competitors and channel partners.
Our Offerings We deploy our solution through five offerings aimed at addressing specific industry needs. In each of these offerings, the specific deployment of software,managed services and data is tailored to address unique challenges. These offerings include:
• Direct Sales. Our direct sales offering is for customers who sell directly to their end customers. It includes teams skilled in sales of service contractswho are deployed under the customers’ brand and trained in the customers’ products, our data management infrastructure and applications to enableend customer self-service. Our dedicated service sales teams utilize sales process tailored specifically to increase contract renewals, as well asrelevant best practices, to monitor each service revenue opportunity to drive higher service revenue renewals.
• Channel Enablement. For customers who sell through single- or multi-tier channel distribution, our offering includes service sales teams skilled in
channel enablement and management, and our Channel Sales Cloud. We help drive greater channel productivity and increased service revenue, whilealso enabling our customers to offload to us the complexity of managing service revenue through channel partners around the globe.
• Reseller Sales. We manage service contract sales on behalf of large value-added resellers, such as leading telecom service providers responsible forselling products and services for multiple large technology vendors. We enable resellers to rely on us for sales and renewals of service contractsacross their OEM partners, enabling the resellers to focus on their core business of providing services. An increase in renewal rates can impact theproduct discounts our resellers receive from OEMs in a financially meaningful way.
78

Table of Contents
• Subscription Lifecycle Management. For software-as-a-service and other companies selling subscriptions, our offering includes custom applicationsand service sales teams focused not just on the renewal but on the adoption behavior critical to the renewal. Software-as-a-service companies face adistinct set of challenges with respect to customer renewals, given the lower switching cost and associated higher churn rates. Our service sales teamsstrive to improve customer adoption, reduce churn, increase cross-sell and up-sell opportunities and provide a detailed review of service revenueperformance through our cloud based applications.
• Enterprise. Our Enterprise solution typically encompasses a combination of all of our offerings listed above as a single package. For our Enterprisecustomers, we manage and sell all service revenue renewals for the customer on a global basis, which allows the customer to focus on productdevelopment and sales of new products and services. Our Enterprise engagements are often the result of our success in engaging with customers onone or more of the first four offerings, which may enable us to expand our service into a broader Enterprise relationship. In some instances, we mayalso enter directly into an Enterprise agreement without having previously provided a smaller set of solutions.
How We Engage With Our Customers The following illustrates the various elements of our customer engagement process:
• Service Performance Analysis. As part of our pre-sales process, our solution design team works with prospects to identify aspects of their servicerevenue performance where we can drive incremental revenue, visibility, efficiency and end customer and channel partner satisfaction. We do thisthrough an SPA, which is a thorough and collaborative assessment of the prospect’s renewal data that leverages our proprietary intelligence platform.The SPA includes a comparative analysis against best practices and industry peers to better assess the prospect’s service revenue performance,identify recommendations and provide the foundation for a proposed solution and business case of how we might engage with the prospect tomanage their service revenue.
• Implementation of our solution. Once we have engaged a new customer, we implement our solution by building out a dedicated service sales team,integrating our customer’s enterprise systems and data into our systems, and deploying applications. We recruit our sales team members based on arefined set of attributes, competencies and characteristics that typically correlate with successful service sales personnel. We couple this knowledgewith a global recruiting network to build out a team of service sales personnel that acts as an extension of our customers’ brands. Our projectmanagement organization works closely with our customers to consolidate, cleanse and manage customer data from disparate systems into our datawarehouse. Our implementation team configures the applications for our customer, providing the reporting capabilities and systems access to enableour service sales team to start generating revenue for our customers as little as one month after entering into the engagement.
• Account management. We provide active account management, including weekly forecast reviews, issue management, and quarterly forecast andperformance reviews. We hold quarterly performance reviews with customer executives that include insights into channel performance, customerloss analytics and comparisons to benchmarks from our intelligence platform. We also regularly provide tailored recommendations for generatingadditional increases in service revenue, profitability, and end customer satisfaction.
Customers We sell our solutions to technology and technology-enabled healthcare and life sciences companies. As of December 31, 2010, we managed over 100engagements across more than 55 customers, representing over $5 billion in service revenue opportunity under management. During the years ended December31, 2008, 2009 and 2010, the actual value of qualified end customer contracts delivered to us totaled $1.9 billion, $2.8 billion and $3.7 billion, respectively. Wehad approximately 60 and 80 engagements as of December 31, 2008 and 2009, respectively.
79

Table of Contents
Our top ten customers accounted for approximately 65% and 54% of our revenue in 2009 and 2010, respectively. Sun Microsystems accounted for 24%and 13% of our revenue in 2009 and 2010, respectively.
The following table presents a list of five of our principal customers across our key sectors during the year ended December 31, 2010:
Hardware Hardware - Networking Software Resellers Technology-Enabled
HealthcareHitachi Data Systems
Intermac Technologies Isilon NetApp Tandberg
Alcatel–Lucent Avaya Blue Coat Systems Juniper Networks Motorola
Adobe Intergraph Sage Software VMWare WebEx
Bell Canada NEC Qwest
Communications Telus Verizon
InformationSystems
Abbott Agilent Technologies GE Healthcare Maquet Roche Diagnostics
Customer Case Studies The following are examples of how we partner with our customers to drive incremental service revenue.
Direct Sales. A large medical diagnostics company had low service renewal rates, leading to lost service revenue and customer frustration. Trying to buildan in-house solution produced limited results, as the company did not have adequate resources, technology tools, or insight into their performance. The companyengaged us to renew existing service contracts and convert warranties into comprehensive service contracts. We drove increases of over 40 percentage points inservice renewal rates and warranty sales - generating a growing service revenue annuity stream. In addition, we have improved the client’s visibility into theirservice revenue business with the Analytics Cloud application. We also provide data management services to ensure accurate, up to date information aboutservice revenue opportunity.
Channel Enablement. A global provider of networking infrastructure was not meeting expectations on service renewals and had limited visibility into itschannel partners’ service revenue performance. As a result, it was difficult to hold channel partners accountable for their performance on service renewals. Thecompany partnered with us to provide managed services and technology to drive increased service revenue through the channel. Over the history of therelationship, we have increased renewal rates over 20 percentage points and improved channel partner accountability by deploying our managed sales solution,introducing best practices and deploying our channel enablement solution. The channel enablement solution includes: timely service renewal quotes for thousandsof channel partners around the world, the Channel Sales Cloud application to provide partners a comprehensive view of service revenue opportunities, and achannel partner scorecard to provide improved visibility into partner performance on service renewals.
Reseller Sales. A reseller of networking and telecom equipment struggled with low service contract renewal rates and limited visibility into their renewalperformance. As a result, the company could not meet the performance thresholds required to obtain rebates and discounts, which negatively impacted margins.We were engaged to handle renewals for a variety of service contracts and drove an increase in renewal rates of over 20 percentage points. This improvement alsoenabled the customer to meet vendor performance thresholds required for rebates and higher discounts. In addition, we have driven increased up-sell of thecustomer’s own branded services, which now represent a more significant portion of its quarterly revenue. Finally, the customer has been able to refocus theirinternal resources on more strategic priorities, such as signing new accounts.
Subscription Lifecycle Management. A large software-as-a-service company was faced with low solution adoption and high churn in their small tomedium sized customer accounts. The company’s employees who
80

Table of Contents
handled renewals, training, and customer service were overburdened with the activities required to drive increased retention in these segments. The companypartnered with us to increase adoption and reduce churn. We drove proactive touchpoints with customers to increase solution adoption (such as customer healthchecks), managed the entire renewal process of the solution, and provided improved data quality and visibility into customer metrics. In addition, the customerhas been able to redeploy their internal resources to focus on larger accounts.
The foregoing descriptions, including the specific renewal rate increases experienced by the customers, have been approved by the applicable customers. Sales and Marketing We sell our solutions through our global sales organization. Our sales representatives are organized by geographic regions, including NALA, EMEA andAPJ, and by industry verticals. We deploy quota-carrying sales and solution design professionals to target specific regions and industry verticals.
We generate customer leads, accelerate sales opportunities and build brand awareness through our marketing programs. Our marketing programs targetsales, services, and finance executives within technology and technology-enabled healthcare and life sciences industries. Our marketing teams and programs areorganized by geography and industry segment to focus on the unique needs of customers within the specific target markets.
We host an annual executive summit in each of our three sales geographic regions where customers and industry players participate in a variety ofprograms designed to share information about the issues of service revenue performance. The summit features a variety of prominent keynote and customerspeakers, panelists and presentations. The event also brings together partners, customers and other key participants in the service revenue management industry.Attendees gain insight into our technology roadmap and participate in interactive sessions that encourage them to express opinions on new features andfunctionality.
We are actively involved in the Service Executive Industry Board (“SEIB”), an independent industry board we founded to share best practices and addressissues impacting the industry. The founding board members consist of 15 senior executives, including three of our executives, who manage and grow servicerevenue at leading technology-based hardware, software, and healthcare companies. SEIB meets regularly to establish industry standards and best practices forbenchmarking and measuring the health of global maintenance, support and subscription service revenue and customer satisfaction. Operations Our cloud based solution is hosted in a secure third-party data center in the San Francisco Bay Area of California. Physical security features at this facilityinclude 24x7 manned security with biometric access controls. Our technical redundancy features include redundant power, on-site backup generators, andenvironmental controls and monitoring. Our technology employs a wide range of security features, such as firewalls, server and user authentication accesscontrols, data encryption, secured hosting, multi-tenant database, a global redundant network and secure encrypted offsite backup of sensitive data. We conductregular security audits and tests for vulnerability and analysis of our infrastructure. We adhere to strict change management procedures and security policies whenupdating our technology. We proactively monitor and manage our infrastructure at all times for capacity, security and reliability. Our applications are secured viaSSL protocols with data contained in a storage area network for high availability and security. Data backups are offsite, encrypted both during the transmissionand at rest. Research and Development We focus our research and development efforts on enhancing our product and service offerings as well as complementary new capabilities as part of ourproprietary solution. Our development strategy is to identify features, business intelligence, applications and other technology elements that are, or are expectedto be, needed
81

Table of Contents
by service sales professionals, customers, channel partners and end customers to optimize service revenue performance. We are also investing in the developmentof additional cloud applications to serve our customers’ needs and enable greater operational efficiencies in our organization.
Our research and development expenses were $1.2 million in 2008, $2.1 million in 2009 and $7.2 million in 2010. In addition, we capitalize certainexpenditures related to the development and enhancement of internal-use software. Capitalized software expenses were $2.8 million in 2008, $5.0 million in2009, and $4.7 million in 2010. Competition The market for service revenue management is evolving. Historically, technology companies have managed their service renewals through internalpersonnel and relied upon technology ranging from Excel spreadsheets to internally-developed software to customized versions of traditional businessintelligence tools and CRM or ERP software from vendors such as Oracle, SAP, salesforce.com and NetSuite. Some companies have made further investments inthis area using firms such as Accenture and McKinsey for technology consulting and education services focused on service renewals. These internally-developedsolutions represent the primary alternative to our integrated approach of combining software, managed services and data to provide end-to-end optimized servicerevenue performance.
We believe the principal competitive factors in our markets include the following: • service revenue industry expertise, best practices, and benchmarks; • performance-based pricing of solutions; • ability to increase service revenue, renewal rates and close rates; • global capabilities; • completeness of solution; • ability to effectively represent customer brands to end customers and channel partners; • size of upfront investment; and • size and financial stability of operations.
Although we believe we compete favorably with respect to many of these factors and currently have few direct competitors that offer integrated solutions atour scale, we believe that other competitors will emerge who have greater name recognition, longer operating histories, well-established relationships withcustomers in our markets and substantially greater financial, technical, personnel and other resources than we have. We expect competition and competitivepressure, from both new and existing competitors, to increase in the future. Intellectual Property We rely upon a combination of copyrights, trade secrets and trademarks, in addition to contractual restrictions such as confidentiality agreements, toestablish and protect our proprietary rights. We currently have one registered copyright in the United States, and have registered trademarks for “ServiceSource”in the United States, the European Community, and Singapore. We also have pending trademark applications for the name ServiceSource in other locations andfor other trade names in various locations.
Despite our efforts to protect our proprietary rights, unauthorized parties may attempt to copy or obtain and use our technology and/or brand names todevelop products with the same functionality as our solution. Policing unauthorized use of our technology is difficult. The laws of other countries in which wemarket our solutions may offer little or no effective protection of our proprietary technology. Our competitors could also
82

Table of Contents
independently develop technologies equivalent to ours, and our intellectual property rights may not be broad enough for us to prevent competitors from sellingproducts incorporating those technologies. Reverse engineering, unauthorized copying or other misappropriation of our proprietary technology could enable thirdparties to benefit from our technology without paying us for it, which would significantly harm our business.
We expect that technology solutions in our industry may be increasingly subject to third-party patent infringement claims as the number of competitorsgrows and the functionality of products in different industry segments overlaps. Such competitors could make a claim alleging that we infringe one or more oftheir patents, and we do not own any patents which could be asserted against them. Third parties may currently have, or may eventually be issued, patents uponwhich our current solution or future technology infringe. Any of these third parties might make a claim of infringement against us at any time. Employees As of December 31, 2010, we had 1,536 employees including 33 in research and development, 96 in sales and marketing, 1,323 in our service salesorganization and 84 in a general and administrative capacity. As of December 31, 2010, we had 847 employees in the United States, 154 in Singapore, 71 in theUnited Kingdom, 100 in Malaysia and 364 in Ireland.
None of our employees is represented by a labor union with respect to his or her employment with us. Facilities Our corporate headquarters occupy approximately 45,800 square feet in San Francisco, California under a lease that expires in June 2015.
We also have six globally distributed sales centers. We have three sales centers in North America: one at our corporate headquarters in San Francisco, andone in each of Denver and Nashville. We have additional international sales centers in Dublin, Ireland; Liverpool, United Kingdom; and Singapore. As ofDecember 31, 2010, we have leased approximately 46,100 square feet in Denver expiring in 2012; approximately 73,000 square feet in Nashville expiring in2018; approximately 38,000 square feet in Dublin expiring in 2019; approximately 11,800 square feet in Liverpool expiring in 2012; and approximately 13,300square feet in Singapore expiring in 2013.
We recently opened a global sales operations center in Kuala Lumpur, Malaysia. We use this center to centralize key contract renewal processes that do notrequire regional expertise, such as customer data management and quoting. We have leased approximately 10,100 square feet in Kuala Lumpur under a leaseexpiring in 2011.
83

Table of Contents
MANAGEMENT
The following table sets forth the names, ages and positions of our executive officers, other members of executive management and directors as of the datehereof: Name Age PositionExecutive Officers:
Michael A. Smerklo 41 Chief Executive Officer and Chairman of the BoardJeffrey M. Bizzack 50 PresidentDavid S. Oppenheimer 54 Chief Financial OfficerRobert J. Sturgeon 49 Chief Delivery OfficerGanesh Bell 39 Executive Vice President, ProductsRaymond M. Martinelli 52 Chief People OfficerNatalie A. McCullough 38 Chief Marketing OfficerPaul D. Warenski 46 Senior Vice President and General Counsel
Other Executive Management: Stephen M. Unterberger 53 Chief Solutions OfficerJay R. Ackerman 43 Chief Services OfficerMatt Rosenberg 39 Senior Vice President, Worldwide Sales
Non-Employee Directors: Steven M. Cakebread 59 DirectorMarc F. McMorris 42 DirectorBruce W. Dunlevie 54 DirectorAnthony Zingale 55 DirectorJames C. Madden, V 49 DirectorBarry D. Reynolds 48 DirectorThomas F. Mendoza 60 Director
(1) Member of the audit committee(2) Member of the compensation committee(3) Member of the nominating and corporate governance committee Executive Officers Michael A. Smerklo has served as our Chief Executive Officer since January 2003 and as Chairman of our board of directors since November 2008. Prior tojoining us, Mr. Smerklo served as Director of Business Development at Opsware, Inc., a software company, from 2000 to 2001. From 1998 to 2000, he served asan Associate at Morgan Stanley & Co. Incorporated, a financial services firm. We believe that Mr. Smerklo possesses specific attributes that qualify him to serveas a member of our board of directors. Specifically, as our founder and the longest serving member of our board of directors, Mr. Smerklo possesses a deepunderstanding of our business as it has evolved over time. Of particular value is the operational experience and perspective he brings as our Chief ExecutiveOfficer. We believe Mr. Smerklo is a highly regarded leader in the service revenue management industry and that his operational experience greatly enhances theoverall skill set of our board.
Jeffrey M. Bizzack has served as our President since February 2009. Prior to joining us, Mr. Bizzack served as Managing Director and Chief ExecutiveOfficer for Finance, Accounting and Human Resources Outsourcing at Accenture BPO Services LLC, a management consulting, technology services andoutsourcing company, from May 2006 to May 2008. From April 2004 to April 2006, he served as Chief Executive Officer of Savista LLC, an outsourcing firmthat provides business process outsourcing services for the finance and accounting sectors. From October 1988, Mr. Bizzack served in various positions withProBusiness Services Inc., a human resources business process outsourcing company, with his last position being its Executive Vice President, Sales and Serviceswhen it was acquired by Automatic Data Processing Inc. in early 2003.
84
(1)
(1)(2)
(3)
(3)
(2)
(1)

Table of Contents
David S. Oppenheimer has served as our Chief Financial Officer since July 2010. Prior to joining us, Mr. Oppenheimer served as Chief Financial Officer ofMindjet Corporation, a desktop software company, from July 2007 to July 2010. From July 2005 to January 2007, he served as Chief Financial Officer of Hands-On Mobile, Inc., a mobile content company. From July 1999 to May 2005, he served as Chief Financial Officer of Digital Impact, Inc., an internet marketingcompany prior to its acquisition by Acxiom Corporation.
Robert J. Sturgeon has served as our Chief Delivery Officer since November 2010. Prior to that, he served as our Executive Vice President, Client Deliveryfrom January 2009. He has also served as our Worldwide Executive Vice President, Client Operations from October 2007 to December 2008. Prior to joining us,Mr. Sturgeon served as Executive Vice President and General Manager of the Security Products Group for Juniper Networks, Inc., an information technology andcomputer networking products company, from August 2005 to May 2007, and as Juniper Networks, Inc.’s Vice President, Worldwide Customer Service fromDecember 2001 to August 2005. Mr. Sturgeon also served as Vice President of Customer Service for Lucent Technologies, Inc., a provider of solutions to delivervoice, data and video communication services, from May 2000 to December 2001.
Ganesh Bell has served as our Executive Vice President, Products since May 2010. Prior to joining us, Mr. Bell served in various management positions atSAP AG, an enterprise software company, from January 2006 to April 2010, including Vice President of Product Strategy & Management for the BusinessIntelligence & Technology Platform Group and Vice President of Portfolio Strategy. Prior to that, Mr. Bell served as Chief Technologist for PeopleSoft, Inc., asoftware company that was acquired by Oracle, and as Chief Software Architect for J.D. Edwards & Company, an enterprise resource planning software companythat was acquired by PeopleSoft, Inc.
Raymond M. Martinelli has served as our Chief People Officer since November 2010. Prior to that, Mr. Martinelli was our Executive Vice President ofHuman Resources since April 2006. Prior to joining us, Mr. Martinelli served as the Senior Vice President of Human Resources for Macromedia, Inc., a providerof web publishing products and solutions, from 2005 to 2006, before it was acquired by Adobe Systems Incorporated. From 2000 to 2005, Mr. Martinelli servedas the Vice President of Human Resources for Juniper Networks, Inc., an information technology and computer networking products company.
Natalie A. McCullough has served as our Chief Marketing Officer since November 2010. Prior to that, Ms. McCullough was our Executive Vice Presidentof Marketing from June 2010. She has also served as our Senior Vice President, Go To Market, from June 2009 to June 2010, our Senior Vice President of SalesEffectiveness, from March 2008 to June 2009, our Vice President of Sales Effectiveness, from December 2007 to March 2008, and our Vice President of StrategyOperations from August 2006 to December 2007. Prior to joining us, Ms. McCullough served as an Associate Principal at McKinsey & Company, a managementconsulting firm, where she worked from August 2000 to December 2005.
Paul D. Warenski has served as our Senior Vice President and General Counsel since May 2008. Prior to joining us, Mr. Warenski served as Senior VicePresident and General Counsel of BenefitStreet, Inc., a provider of solutions for corporate benefit plans, from June 2007 to November 2007. From March 2006 toMay 2007, Mr. Warenski served as Senior Vice President and General Counsel of Intraware, Inc., a software-as-a-service company. Prior to that, Mr. Warenskiserved as Senior Vice President, General Counsel, and Secretary of Commerce One, Inc., an e-commerce software company, which filed a voluntary petition forbankruptcy under Chapter 11 of the United States Bankruptcy Code in October 2004, serving as the Responsible Person for Commerce One in its bankruptcyproceeding. Prior to becoming General Counsel of Commerce One in September 2004, Mr. Warenski served at Commerce One as Associate General Counsel andSenior Counsel, beginning in February 2001. Mr. Warenski also was an associate, and later a partner, at the law firm of Schachter, Kristoff, Orenstein andBerkowitz in San Francisco, from 1996 to 2000.
85

Table of Contents
Other Executive Management Stephen M. Unterberger has served as our Chief Solutions Officer since September 2007. Prior to joining us, Mr. Unterberger served as Vice President ofHRO Strategy Services of Hewitt Associates, Inc., a provider of human resource business process outsourcing and consulting services, from October 2004 toApril 2007. Mr. Unterberger has also served as the Business Model Architecture President for Exult, Inc., a provider of business services related to humanresources and business process outsourcing, from June 2003 until it was acquired by Hewitt Associates, Inc. in October 2004. Prior to that, Mr. Unterbergerserved in various executive positions for Exult, Inc., including Corporate Executive Vice President, Business Model Operations from January 2003 to June 2003,Chief of Service Delivery from June 2001 to January 2003, and Executive Vice President and Chief Operating Officer from February 1999 to June 2001.
Jay R. Ackerman has served as our Chief Services Officer since December 2009. He has also served as our Executive Vice President of Client Care fromDecember 2005 to November 2009. Prior to joining us, Mr. Ackerman served as Chief Executive Officer and President of WNS North America Inc., a businessprocessing outsourcing company, from 2003 to 2005. From 1999 to 2003, Mr. Ackerman served as Vice President Client Accounts and Sales for Exult, Inc., aprovider of business services related to human resource and business process outsourcing.
Matt Rosenberg has served as our Senior Vice President, Worldwide Sales since July 2010. Prior to that, he served as our Senior Vice President of NorthAmerica Sales since December 2008, and our Vice President of Sales since March 2007. Prior to joining us, Mr. Rosenberg served as Vice President of Sales ofVisage Mobile Inc., a wireless mobility management solutions provider that was acquired by Convergys Corporation, from August 2003 to March 2007. FromJune 2001 to July 2003, he served as Director, Sales and Strategic Alliances of Vividence Corporation, a provider of market information services and evaluationapplications to e-businesses, before it was acquired by Keynote Systems, Inc. From May 1999 to June 2001, Mr. Rosenberg served as Senior Director, Sales andBusiness Development of PeoplePC Inc., an internet service provider, before it was acquired by Earthlink, Inc. Non-Employee Directors Steven M. Cakebread has served as a member of our board of directors since January 2010. Since March 2010, Mr. Cakebread has served as ChiefFinancial Officer of Pandora Media, Inc., a provider of personalized internet radio and music discovery services. He has also served as a member of the board ofdirectors of Solar Winds, Inc., a provider of information technology management software, since January 2008, and as a member of the board of directors ofeHealth, Inc., an online provider of health insurance for individuals, families and small businesses, since June 2006. From August 2009 to March 2010,Mr. Cakebread was a Principal with J. Stevens & Co. LLC, a consulting company. From February 2009 to December 2009, Mr. Cakebread served as Senior VicePresident, Chief Accounting Officer and Chief Financial Officer of Xactly Corporation, a provider of on-demand sales performance management software.Mr. Cakebread also served as President and Chief Strategy Officer of salesforce.com, inc., a CRM service provider, from March 2008 to February 2009, and assalesforce.com, inc.’s Chief Financial Officer from May 2002 to March 2008. From April 1997 to April 2002, Mr. Cakebread served as Senior Vice President andChief Financial Officer at Autodesk, a software company. We believe that Mr. Cakebread possesses specific attributes that qualify him to serve as a member ofour board of directors. In particular, Mr. Cakebread has deep experience in the software industry, including software-as-a-service, which gives him a strongexpertise on our business model and a valuable understanding of a large segment of our customer base. Mr. Cakebread also possesses financial expertise due tohis experience as Chief Financial Officer at several technology companies and his past service as director of other technology firms.
Marc F. McMorris has served as a member of our board of directors since January 2007. Mr. McMorris is a Managing Director of General Atlantic LLC, aprivate equity firm, where he joined in August 1999. He has also served as a member of the board of directors of SSA Global Technologies, Inc., an enterprisesoftware company, from 2003 to 2006. From May 1998 to August 1999, Mr. McMorris served as a Vice President in the High
86

Table of Contents
Technology Group at Goldman Sachs & Co, an investment banking and securities firm, and as an Associate in the same group from June 1996 to May 1998. Webelieve Mr. McMorris possesses specific attributes that qualify him to serve as a member of our board of directors, including his overall knowledge of publicmarkets and the technology industry, and his experience as an investor in numerous other private and public companies on behalf of General Atlantic, includingtechnology firms. Mr. McMorris also has many professional relationships in the technology industry, both individually and through his firm, General AtlanticLLC, and those relationships have proven highly valuable in providing us access to prospective customers.
Bruce W. Dunlevie has served as a member of our board of directors since December 2004. Since May 1995, Mr. Dunlevie has been a General Partner ofBenchmark Capital, a venture capital firm. He has also served as a member of the board of directors of Rambus Inc., a technology licensing company, sinceMarch 1990. From October 2003 to October 2007, Mr. Dunlevie was a member of the board of directors of Palm, Inc., a provider of mobile products. We believethat Mr. Dunlevie possesses specific attributes that qualify him to serve as a member of our board of directors. In particular, Mr. Dunlevie is a longstandingmember of our board of directors with a deep understanding of our business and our customer base, and he has extensive experience as an investor in technologycompanies on behalf of Benchmark Capital. Mr. Dunlevie brings the experience of having served on the board of several other technology companies. In addition,his professional network has given us access to numerous prospective customers.
Anthony Zingale has served as a member of our board of directors since July 2009. Since April 2010, Mr. Zingale has served as Chief Executive Officer ofJive Software, Inc., an independent social business software company, and from February 2010 to April 2010 he served as Jive Software, Inc.’s Interim ChiefExecutive Officer. Mr. Zingale also served as a member of the board of directors of McAfee, Inc., a supplier of computer security solutions, from May 2008 toFebruary 2011, before it was acquired by Intel Corporation. From November 2005 to November 2006, he served as President and Chief Executive Officer ofMercury Interactive Corporation, a provider of business technology optimization solutions that included the quality, performance, availability and governance ofenterprise software applications, and as Mercury Interactive Corporation’s President and Chief Operating Officer from December 2004 to November 2005. FromJuly 2002 to November 2006, Mr. Zingale served as a member of the board of directors of Mercury Interactive Corporation. We believe Mr. Zingale possessesspecific attributes that qualify him to serve as a member of our board of directors. Of particular value is Mr. Zingale’s operational experience, which he hasobtained by leading and managing multiple technology firms, including publicly traded companies. Mr. Zingale has also served as a director of other private andpublicly traded technology companies. We believe he is a highly regarded leader in the technology industry and that his operational experience greatly enhancesthe overall skill set of our board.
James C. Madden, V has served as a member of our board of directors since January 2007. Since January 2007, Mr. Madden has been a General Partner ofAccretive LLC, a private equity firm. He has also served as a member of the board of directors of Genpact Limited, a business process and technologymanagement provider, since January 2005. From January 2005 to January 2007, Mr. Madden was a Special Advisor to General Atlantic LLC, a private equityfirm. Mr. Madden also served as Chief Executive Officer of Exult, Inc., a provider of outsourced human resource services, from November 1998 to October 2004,and as Exult, Inc.’s Chairman of the Board, from February 2000 to October 2004 and as its President, from November 1998 to May 2003. We believe that Mr.Madden possesses specific attributes that qualify him to serve as a member of our board of directors. Specifically, as the founder, Chief Executive Officer andChairman of Exult, Inc., Mr. Madden possesses valuable operational and director experience leading a publicly traded company, and also brings the importantperspective of running a company that was an external service provider of key business processes. We believe that perspective complements the technology-oriented background of most of our other board members. Mr. Madden also provides a formidable professional network, which has served us well. We also valueMr. Madden’s perspective as a director of a business process and technology management company.
Barry D. Reynolds has served as a member of our board of directors since January 2003. Since January 1998, Mr. Reynolds has been a General Partner ofHousatonic Partners, a private equity firm. We believe that
87

Table of Contents
Mr. Reynolds possesses specific attributes that qualify him to serve as a member of our board of directors. Mr. Reynolds has served as a member of our board ofdirectors longer than any other non-management director and has a thorough understanding of our business as it has evolved over time. Mr. Reynolds also bringsvaluable insight as an experienced investor on behalf of his private equity firm, Housatonic Partners, and as a respected business leader.
Thomas F. Mendoza has served as a member of our board of directors since March 2011. Since March 2008, Mr. Mendoza has served as vice chairman ofNetApp, Inc., a storage and data management solutions provider. From October 2000 to March 2008, Mr. Mendoza served as president of NetApp, Inc. Prior toMarch 2000, he served in various capacities at NetApp, Inc., including senior vice president, worldwide sales and marketing, senior vice president, worldwidesales and vice president, North American sales. Mr. Mendoza also served as a member of the board of directors of NetScreen Technologies Inc., an internetsecurity systems and appliances provider, from June 1999 until it was acquired by Juniper Networks, Inc. in April 2004. We believe that Mr. Mendoza hasspecific attributes that qualify him to serve as a member of our board of directors. In particular, he brings to our board over thirty years of operational experiencehe gained from holding various executive positions at technology companies, including a publicly traded company. Mr. Mendoza has also served as a director ofmany other technology companies. We believe that Mr. Mendoza’s strong mix of operational experience and deep understanding of the technology industry addsto our board’s collective level of expertise, skill and qualifications. Mr. Mendoza also brings an important customer prospective to our board of directors as theVice Chairman of one of our largest customers.
There are no family relationships among any of our directors or executive officers. Code of Business Conduct and Ethics Our board of directors has adopted a code of business conduct and ethics that applies to all of our employees, officers and directors, including our chiefexecutive officer, chief financial officer and other principal executive and senior financial officers. The code of business conduct and ethics will be available onour website at www.servicesource.com. We expect that any amendments to the code, or any waivers of its requirements, will be disclosed on our website. Board Composition and Risk Oversight Our board of directors is currently composed of seven members. Our bylaws permit our board of directors to establish by resolution the authorized numberof directors, and nine directors are currently authorized.
As of the closing of this offering, our certificate of incorporation and bylaws will provide for a classified board of directors consisting of three classes ofdirectors, each serving staggered three-year terms, as follows: • the Class I directors will be Bruce Dunlevie and Barry Reynolds, and their terms will expire at the annual meeting of stockholders to be held in 2012;
• the Class II directors will be Anthony Zingale, James Madden and Thomas Mendoza, and their terms will expire at the annual meeting ofstockholders to be held in 2013; and
• the Class III directors will be Steven Cakebread, Marc McMorris and Michael Smerklo, and their terms will expire at the annual meeting ofstockholders to be held in 2014.
Upon expiration of the term of a class of directors, directors for that class will be elected for three-year terms at the annual meeting of stockholders in the
year in which that term expires. Each director’s term continues until the election and qualification of his successor, or his earlier death, resignation or removal.Any increase or decrease in the number of directors will be distributed among the three classes so that, as nearly as possible, each class will consist of one-third ofthe directors. This classification of our board of directors may have the effect of delaying or preventing changes in control of our company.
88

Table of Contents
Our board of directors is responsible for, among other things, overseeing the conduct of our business, reviewing and, where appropriate, approving ourlong-term strategic, financial and organizational goals and plans, and reviewing the performance of our chief executive officer and other members of seniormanagement. Following the end of each year, our board of directors will conduct an annual self-evaluation, which includes a review of any areas in which theboard of directors or management believes the board of directors can make a better contribution to our corporate governance, as well as a review of the committeestructure and an assessment of the board of directors’ compliance with corporate governance principles. In fulfilling the board of directors’ responsibilities,directors have full access to our management and independent advisors.
Our board of directors, as a whole and through its committees, has responsibility for the oversight of risk management. Our senior management isresponsible for assessing and managing our risks on a day-to-day basis. Our audit committee oversees and reviews with management our policies with respect torisk assessment and risk management and our significant financial risk exposures and the actions management has taken to limit, monitor or control suchexposures, and our compensation committee oversees risk related to compensation policies. Both our audit and compensation committees report to the full boardof directors with respect to these matters, among others. Director Independence We intend to list our common stock on The Nasdaq Global Market. Under the rules of The NASDAQ Stock Market LLC, independent directors mustcomprise a majority of a listed company’s board of directors within a specified period of the completion of this offering. In addition, the rules of The NASDAQStock Market LLC require that, subject to specified exceptions, each member of a listed company’s audit, compensation and nominating and corporategovernance committees be independent. Audit committee members must also satisfy the independence criteria set forth in Rule 10A-3 under the SecuritiesExchange Act of 1934, as amended. Under the rules of The NASDAQ Stock Market LLC, a director will only qualify as an “independent director” if, in theopinion of that company’s board of directors, that person does not have a relationship that would interfere with the exercise of independent judgment in carryingout the responsibilities of a director.
In order to be considered to be independent for purposes of Rule 10A-3, a member of an audit committee of a listed company may not, other than in his orher capacity as a member of the audit committee, the board of directors, or any other board committee: (1) accept, directly or indirectly, any consulting, advisory,or other compensatory fee from the listed company or any of its subsidiaries; or (2) be an affiliated person of the listed company or any of its subsidiaries.
Our board of directors undertook a review of its composition, the composition of its committees and the independence of each director. Based uponinformation requested from and provided by each director concerning his background, employment and affiliations, including family relationships, our board ofdirectors has determined that none of the following non-employee directors has a relationship that would interfere with the exercise of independent judgment incarrying out the responsibilities of a director and that each of these directors is “independent” as that term is defined under the rules of The NASDAQ StockMarket LLC: Messrs. Cakebread, McMorris, Dunlevie, Zingale, Madden and Reynolds. Our board of directors also determined that Messrs. Cakebread,McMorris and Reynolds, who compose our audit committee, Messrs. McMorris and Madden, who compose our compensation committee, and Messrs. Dunlevieand Zingale, who compose our nominating and corporate governance committee, satisfy the independence standards for those committees established by theapplicable rules and regulations of the SEC and The NASDAQ Stock Market LLC. In making these determinations, our board of directors considered therelationships that each non-employee director has with our company and all other facts and circumstances our board of directors deemed relevant in determiningtheir independence, including the beneficial ownership of our capital stock by each non-employee director.
89

Table of Contents
Committees of the Board of Directors Our board of directors has established the following committees: an audit committee, compensation committee and a nominating and corporate governancecommittee. The composition and primary responsibilities of each committee are described below. Members serve on these committees until their resignation oruntil otherwise determined by our board of directors. Audit Committee Our audit committee consists of Messrs. Cakebread, McMorris and Reynolds, each of whom is a non-employee member of our board of directors. Allmembers of our audit committee meet the requirements for financial literacy established by the applicable rules and regulations of the SEC and The NASDAQStock Market LLC. Mr. Cakebread is the chairperson of our audit committee, is our audit committee financial expert, as that term is defined under the SEC rulesimplementing Section 407 of the Sarbanes-Oxley Act of 2002, and possesses financial sophistication as defined under the rules of The NASDAQ Stock MarketLLC. Our audit committee oversees our corporate accounting and financial reporting process and is responsible for, among other things:
• evaluating our independent auditors’ qualifications, independence and performance and approving the audit and non-audit services to be performedby our independent auditors;
• monitoring the integrity of our financial statements and our compliance with legal and regulatory requirements as they relate to financial statementsor accounting matters;
• reviewing the adequacy and effectiveness of our internal control policies and procedures;
• discussing the scope and results of the audit with the independent auditors and reviewing with management and the independent auditors our interimand year-end operating results;
• preparing the audit committee report that the SEC requires in our annual proxy statement; and • reviewing annually the audit committee charter and the committee’s performance.
The audit committee will operate under a written charter that satisfies the applicable standards of the SEC and The NASDAQ Stock Market LLC. Compensation Committee Our compensation committee consists of Messrs. McMorris and Madden, each of whom is a non-employee member of our board of directors.Mr. McMorris is the chairperson of our compensation committee. All of the members of our compensation committee meet the definition of outside directorsunder Section 162(m) of the Internal Revenue Code of 1986, as amended. Our compensation committee reviews and recommends policies relating to thecompensation and benefits of our officers and employees and is responsible for, among other things: • overseeing our compensation policies, plans and benefit programs;
• reviewing and approving for our executive officers: the annual base salary, the annual incentive bonus, including the specific goals and amount,
equity compensation, employment agreements, severance arrangements and change in control arrangements and any other benefits, compensation orarrangements;
• preparing the compensation committee report that the SEC requires to be included in our annual proxy statement; • administering, reviewing and making recommendations with respect to our equity compensation plans; and • reviewing annually the compensation committee charter and the committee’s performance.
90

Table of Contents
Nominating and Corporate Governance Committee Our nominating and corporate governance committee consists of Messrs. Dunlevie and Zingale. Mr. Dunlevie is the chairperson of our nominating andcorporate governance committee. Our nominating and corporate governance committee oversees and assists our board of directors in reviewing andrecommending nominees for election as directors and is responsible for, among other things: • evaluating and making recommendations regarding the organization and governance of our board of directors and its committees; • assessing the performance of members of our board of directors and making recommendations regarding committee and chair assignments; • recommending desired qualifications for board membership and conducting searches for potential board members; and • reviewing and making recommendations with regard to our corporate governance guidelines. Compensation Committee Interlocks and Insider Participation None of the members of our compensation committee is currently, or has been at any time, an officer or employee of ours. None of our executive officerscurrently serves or in the past year has served as a member of the board of directors or compensation committee of any entity that has one or more executiveofficers serving on our board of directors or compensation committee. Director Compensation Our compensation committee has approved an outside director compensation policy that will become applicable to all of our non-employee directorseffective upon the completion of this offering. This policy provides that each such non-employee director will receive the following compensation for boardservices: • an annual cash retainer of $20,000 for board service;
• an annual cash retainer for serving as the chairman of the audit committee of $25,000, for serving as chairman of the compensation committee of$25,000, and for serving as chairman of the nominating and corporate governance committee of $10,000;
• an annual cash retainer for serving as a member of the audit committee of $17,500, for serving as a member of the compensation committee of$17,500, and for serving as a member of the nominating and corporate governance committee of $7,500; and
• upon first joining the board of directors, an automatic initial stock option grant for the purchase of 75,000 shares of common stock.
Directors who are employees do not receive any compensation for their service on our board of directors. We currently pay each of Messrs. Dunlevie,Madden and Reynolds $5,000 per meeting of the board of directors for regularly scheduled quarterly meetings. We have a policy of reimbursing directors fortravel, lodging and other reasonable expenses incurred in connection with their attendance at board or committee meetings.
During the year ended December 31, 2009, one of our non-employee directors received options to purchase shares of common stock under the 2008 ShareOption Plan. In July 2009, we granted an option to purchase 284,481 shares of common stock at an exercise price of $4.26 per share to Mr. Zingale in connectionwith his appointment to the board of directors. This option vests as to twenty-five percent of the shares as of one year from the date of grant and then in equalmonthly installments over the subsequent three years.
During the year ended December 31, 2010, two of our non-employee directors received options to purchase shares of common stock of ServiceSourceInternational, LLC under the 2008 Share Option Plan. In January
91
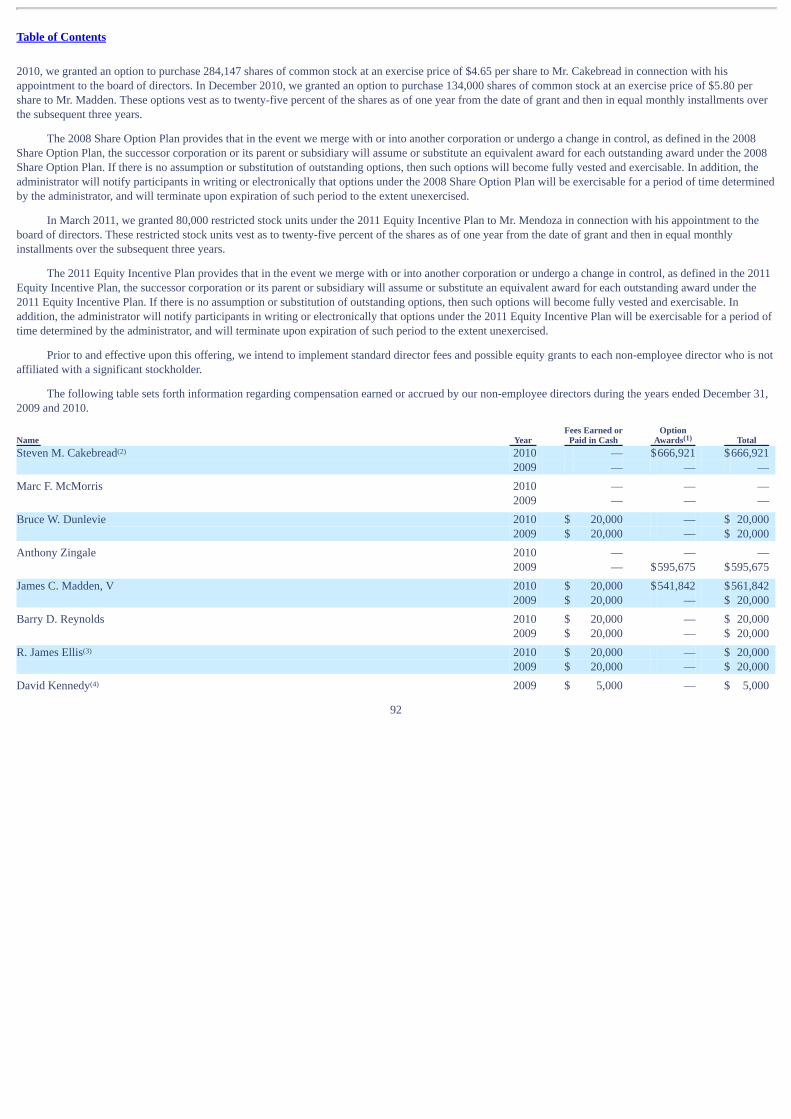
Table of Contents
2010, we granted an option to purchase 284,147 shares of common stock at an exercise price of $4.65 per share to Mr. Cakebread in connection with hisappointment to the board of directors. In December 2010, we granted an option to purchase 134,000 shares of common stock at an exercise price of $5.80 pershare to Mr. Madden. These options vest as to twenty-five percent of the shares as of one year from the date of grant and then in equal monthly installments overthe subsequent three years.
The 2008 Share Option Plan provides that in the event we merge with or into another corporation or undergo a change in control, as defined in the 2008Share Option Plan, the successor corporation or its parent or subsidiary will assume or substitute an equivalent award for each outstanding award under the 2008Share Option Plan. If there is no assumption or substitution of outstanding options, then such options will become fully vested and exercisable. In addition, theadministrator will notify participants in writing or electronically that options under the 2008 Share Option Plan will be exercisable for a period of time determinedby the administrator, and will terminate upon expiration of such period to the extent unexercised.
In March 2011, we granted 80,000 restricted stock units under the 2011 Equity Incentive Plan to Mr. Mendoza in connection with his appointment to theboard of directors. These restricted stock units vest as to twenty-five percent of the shares as of one year from the date of grant and then in equal monthlyinstallments over the subsequent three years.
The 2011 Equity Incentive Plan provides that in the event we merge with or into another corporation or undergo a change in control, as defined in the 2011Equity Incentive Plan, the successor corporation or its parent or subsidiary will assume or substitute an equivalent award for each outstanding award under the2011 Equity Incentive Plan. If there is no assumption or substitution of outstanding options, then such options will become fully vested and exercisable. Inaddition, the administrator will notify participants in writing or electronically that options under the 2011 Equity Incentive Plan will be exercisable for a period oftime determined by the administrator, and will terminate upon expiration of such period to the extent unexercised.
Prior to and effective upon this offering, we intend to implement standard director fees and possible equity grants to each non-employee director who is notaffiliated with a significant stockholder.
The following table sets forth information regarding compensation earned or accrued by our non-employee directors during the years ended December 31,2009 and 2010.
Name Year Fees Earned or
Paid in Cash Option
Awards Total Steven M. Cakebread 2010 — $666,921 $666,921
2009 — — —
Marc F. McMorris 2010 — — — 2009 — — —
Bruce W. Dunlevie 2010 $ 20,000 — $ 20,000 2009 $ 20,000 — $ 20,000
Anthony Zingale 2010 — — — 2009 — $595,675 $595,675
James C. Madden, V 2010 $ 20,000 $541,842 $561,842 2009 $ 20,000 — $ 20,000
Barry D. Reynolds 2010 $ 20,000 — $ 20,000 2009 $ 20,000 — $ 20,000
R. James Ellis 2010 $ 20,000 — $ 20,000 2009 $ 20,000 — $ 20,000
David Kennedy 2009 $ 5,000 — $ 5,000
92
(1)
(2)
(3)
(4)
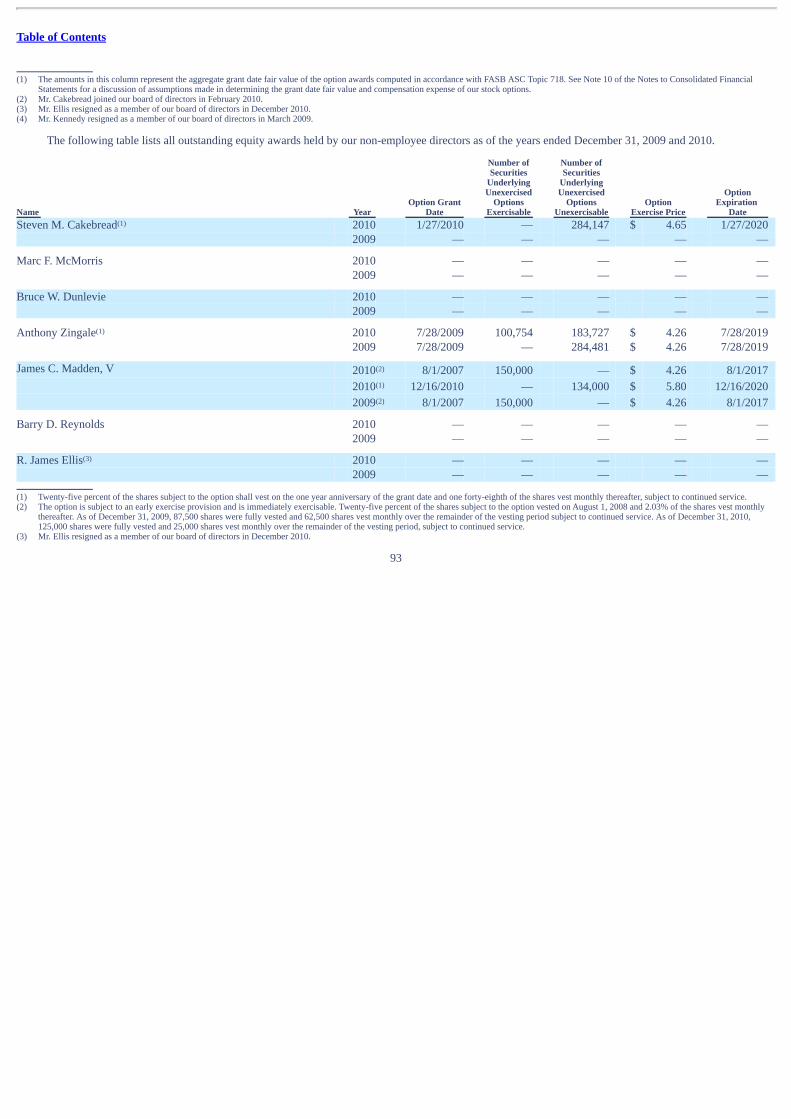
Table of Contents
(1) The amounts in this column represent the aggregate grant date fair value of the option awards computed in accordance with FASB ASC Topic 718. See Note 10 of the Notes to Consolidated Financial
Statements for a discussion of assumptions made in determining the grant date fair value and compensation expense of our stock options.(2) Mr. Cakebread joined our board of directors in February 2010.(3) Mr. Ellis resigned as a member of our board of directors in December 2010.(4) Mr. Kennedy resigned as a member of our board of directors in March 2009.
The following table lists all outstanding equity awards held by our non-employee directors as of the years ended December 31, 2009 and 2010.
Name Year Option Grant
Date
Number ofSecurities
UnderlyingUnexercised
OptionsExercisable
Number ofSecurities
UnderlyingUnexercised
OptionsUnexercisable
OptionExercise Price
OptionExpiration
Date Steven M. Cakebread 2010 1/27/2010 — 284,147 $ 4.65 1/27/2020
2009 — — — — —
Marc F. McMorris 2010 — — — — — 2009 — — — — —
Bruce W. Dunlevie 2010 — — — — — 2009 — — — — —
Anthony Zingale 2010 7/28/2009 100,754 183,727 $ 4.26 7/28/2019 2009 7/28/2009 — 284,481 $ 4.26 7/28/2019
James C. Madden, V 2010 8/1/2007 150,000 — $ 4.26 8/1/2017 2010 12/16/2010 — 134,000 $ 5.80 12/16/2020 2009 8/1/2007 150,000 — $ 4.26 8/1/2017
Barry D. Reynolds 2010 — — — — — 2009 — — — — —
R. James Ellis 2010 — — — — — 2009 — — — — —
(1) Twenty-five percent of the shares subject to the option shall vest on the one year anniversary of the grant date and one forty-eighth of the shares vest monthly thereafter, subject to continued service.(2) The option is subject to an early exercise provision and is immediately exercisable. Twenty-five percent of the shares subject to the option vested on August 1, 2008 and 2.03% of the shares vest monthly
thereafter. As of December 31, 2009, 87,500 shares were fully vested and 62,500 shares vest monthly over the remainder of the vesting period subject to continued service. As of December 31, 2010,125,000 shares were fully vested and 25,000 shares vest monthly over the remainder of the vesting period, subject to continued service.
(3) Mr. Ellis resigned as a member of our board of directors in December 2010.
93
(1)
(1)
(2)
(1)
(2)
(3)
Table of Contents
EXECUTIVE COMPENSATION Compensation Discussion and Analysis The following discussion and analysis of compensation arrangements of our named executive officers for 2009 and 2010 should be read together with thecompensation tables and related disclosures presented below. This discussion contains forward looking statements that are based on our current plans,considerations, expectations and determinations regarding future compensation programs.
For 2009, our named executive officers were:
Michael A. Smerklo, our Chief Executive Officer and Chairman of the Board; Jeffrey M. Bizzack, who joined us in February 2009 as our President; Charles D. Boynton, our Chief Financial Officer during 2009; Robert J. Sturgeon, our Chief Delivery Officer; Raymond M. Martinelli, our Chief People Officer; and Crosbie Burns, our current Executive Vice President, EMEA, who held the position of Executive Vice President, Worldwide Sales in 2009.
For 2010, our named executive officers were:
Michael A. Smerklo, our Chief Executive Officer and Chairman of the Board; Jeffrey M. Bizzack, our President; David S. Oppenheimer, who joined us in July 2010 as our Chief Financial Officer; Charles D. Boynton, our former Chief Financial Officer, who departed in June 2010; Robert J. Sturgeon, our Chief Delivery Officer; and Ganesh Bell, who joined us in May 2010 as our Executive Vice President, Products. Objectives and Principles of Our Executive Compensation Our compensation philosophy is based on the following objectives and principles: • attract, retain and motivate top-level executive talent; • provide compensation levels and structures that are both fiscally responsible and competitive within our industry and geography; • create a culture in which executive compensation aligns with our overall philosophy and pay-for-performance business model; • maintain simplicity, transparency and ease of administration; and
• align the interests of our management team and shareholders by providing equity incentives, while avoiding unreasonable levels of shareholderdilution.
Compensation Decision Process Role of the Board of Directors and Compensation Committee. We established our compensation committee several years ago to take on the responsibilityof compensation matters for all of our employees, including our executives. Our board of directors formally approved a charter for our compensation committeein November
94

Table of Contents
2008, and we have adopted a new charter in connection with this offering to comply with the applicable rules and regulations of a public company listed on TheNasdaq Global Market. In the past several years, including 2009, 2010 and 2011 our compensation committee has met and approved compensation decisions withrespect to our executive officers at the beginning of each year, typically in January or February, including approval of cash incentive bonus payments based on theresults of the previously completed year. Our compensation committee deliberates with respect to compensation decisions and then recommends to the full boardof directors the ratification of such compensation decisions. Our full board of directors has ratified all of such decisions to date. For a description of thecomposition of our compensation committee upon the completion of the offering, see “Management—Committees of the Board of Directors—CompensationCommittee.” In December 2010 and February 2011, our compensation committee made certain decisions with respect to 2011 executive compensation, asdescribed below.
Role of Executive Officers. Our compensation committee generally seeks input from our Chief Executive Officer and our Chief People Officer whendiscussing the performance of and compensation levels for named executive officers (other than their own compensation). Our Chief People Officer has theresponsibility to advise the compensation committee and coordinate with third-party compensation advisors. The compensation committee also works with ourChief Financial Officer to evaluate the financial, accounting and tax implications, and with our General Counsel to evaluate legal matters, all related to ourvarious compensation programs. None of our named executive officers participates in deliberations regarding his or her own compensation. Our compensationcommittee charter also specifies that our compensation committee deliberates and determines compensation decisions related to our Chief Executive Officer inexecutive session, outside of the presence of our Chief Executive Officer.
Role of Compensation Advisors. For 2009 and 2010, we retained Syzygy Consulting Group, an independent compensation consulting firm, to provideadvice with respect to executive compensation decisions and comparison benchmarking. Working with management, Syzygy met with our compensationcommittee and provided various data and recommendations. In 2010, our compensation committee retained Compensia, an independent compensation consultingfirm. Compensia advised the compensation committee for the compensation decisions with respect to 2011. Our compensation committee retains the authority toretain and dismiss any compensation consultants pursuant to its charter.
Benchmarking. Given that we compete for executive officer talent with companies in the technology sector and companies that provide other professionalservices, we rely on certain compensation benchmarking in making our compensation decisions. To determine what constitutes competitive compensation, weengaged Syzygy to benchmark our cash and equity compensation levels for each executive against data from market surveys. For the past two years we have usedmarket compensation surveys from Aon Consulting, with its Radford Executive Compensation Survey, and Culpepper, with its Culpeper Executive CompensationSurvey.
Using that market data, we then determined individual compensation for each executive. Although our practice has been to benchmark to the fiftiethpercentile of market-data survey compensation, we did not automatically tie compensation to that benchmark level for each member of our executivemanagement team. Rather, we considered a number of individualized factors that are unique to our business, including individual performance, skill set, industryknowledge and experience, prior employment history, compensation at previous companies, recruiting efforts and negotiations, retention risk and an executive’soverall compensation level relative to his or her peers. The specific compensation data upon which we relied for benchmarking in 2009 and 2010 are described inmore detail below.
For 2009, Syzygy provided competitive total cash and stock compensation data for our executive positions using multiple published compensation surveysof comparable software, services and general high-technology companies. Syzygy furnished and analyzed cash and stock compensation data from its 2008proprietary database of private companies that reflect the pay practices of a broad number of technology companies. The ultimate data
95

Table of Contents
used for comparison for 2009 consisted of total cash and stock compensation pay practices for executives of 164 software and services companies that: • privately raised a median of $53 million in capital since formation; • generated a median of $122 million in annual revenues in the last year; and • reported a median market valuation of $270 million.
In addition, for 2009 Syzygy sourced private company total cash and stock compensation data from the 2008 Culpepper Executive Compensation Survey,which consisted of survey results from a group of 146 private software companies with annual revenues from $60 million to $200 million. Syzygy also providedpublic company data for total cash and stock compensation from the 2008 Culpepper Executive Compensation Survey and the Aon Consulting 2008 RadfordExecutive Compensation Survey. For the 2008 Culpepper Executive Compensation Survey, the public company data that was benchmarked came from 63domestic software companies with annual revenues from $60 million to $200 million. For the Aon Consulting 2008 Radford Executive Compensation Survey, thedomestic public company data came from: • 61 software companies with annual revenues less than $200 million; • 98 Northern California technology companies with annual revenues under $200 million; and • all technology companies with annual revenues from $50 million to $200 million, which comprised 126 companies.
One of our named executive officers for 2009 was based in the United Kingdom. For this individual, Syzygy sourced total cash and stock compensationdata using comparable Culpepper and Radford United Kingdom surveys.
In comparing the total market-based compensatory stock ownership data of our executives to the various surveys, we assumed one new-hire equity grantfor each executive plus one follow-on equity grant for each 18 months of service of such executive, all measured as of July 1, 2009.
In recognition that we were growing in size and beginning to move closer to initiating an initial public offering, our initial benchmarking for 2010compensation decisions was based upon placing each executive at the mid-point between private and public pay practices at the fiftieth percentile. As a result, for2010, Syzygy also provided cash and stock compensation data using multiple published compensation surveys of comparable software, services and general high-technology companies. Private company compensation data was primarily sourced from Syzygy’s 2009 proprietary database of private companies. The data usedfor comparison consisted of total cash and stock compensation pay practices for executives of 178 software and professional services companies that: • privately raised a median of $67.5 million in capital since formation; • generated a median of $127 million in annual revenue in the last year; and • reported a median market valuation of $272.5 million.
In addition, for 2010, Syzygy used for benchmarking purposes the Culpepper Executive Compensation Survey, which consisted of survey results from agroup of 146 private and 63 public software companies, and the Aon Consulting Radford Executive Compensation Survey, which consisted of survey results froma group of approximately 215 public companies. For the 2009 Culpepper Executive Compensation Survey, the public company data that was benchmarked camefrom domestic software companies with annual revenues from $60 million to $200 million. For the Aon Consulting 2009 Radford Executive CompensationSurvey, the domestic public company data came from: • software companies with annual revenues less than $200 million;
96

Table of Contents
• all Northern California technology companies; • Northern California technology companies with annual revenues less than $200 million; and • all technology companies with annual revenues from $50 million to $200 million.
The specific comparison data for cash and equity compensation for 2010 was measured using the same methodology as 2009, with the measurement datesas of July 1, 2010. Our Compensation Programs The four elements of our executive compensation package are base salary, variable incentive pay, equity-based rewards and employee-benefits programs.We view these components of compensation as related in reviewing the total compensation packages of our executive officers. We determine the appropriate levelfor each compensation component based in part, but not exclusively, on information from analysis of third-party compensation surveys consistent with ourrecruiting and retention goals, our view of internal equity and consistency and overall company and individual performance. We compete with many othercompanies in seeking to attract and retain a skilled workforce, particularly companies in the technology sector. We have not adopted any formal or informalpolicies or guidelines for allocating compensation between long-term and currently paid-out compensation, between cash and non-cash compensation or amongdifferent forms of non-cash compensation. However, in line with our overall pay-for-performance philosophy of rewarding our employees for results that benefitus and our customers, the compensation committee’s practice has been to make a significant portion of an employee’s total compensation performance-based, sothat the employee will be rewarded through bonuses and equity if we perform well in the near term and over time. We also believe that, for technologycompanies, stock-based compensation continues to be a primary motivator in attracting employees.
On Target Earnings—Base Salary and Variable Incentive Compensation. When analyzing the cash compensation of our executive leadership team, we haveviewed the total cash compensation of base salary plus the variable incentive plan compensation as the on target earnings for each of such executive officers. Inanalyzing this figure, we assume that we will meet the targets necessary for our executives to earn their on target bonuses. For 2009 and 2010, we analyzed theseon target cash earnings as the benchmark by which to measure our named executive officers’ compensation compared to the comparable positions identified inthe market surveys provided by Syzygy. While we target the fiftieth percentile of the compensation levels of the companies in such surveys, we find that the datasets for private and public technology companies vary. Overall, for 2009 and 2010, our named executive officers as a group have ranged from approximately thetwentieth to the fiftieth percentiles when their on target cash earnings are compared to public companies in such surveys, but have ranged generally from thefiftieth to the one hundredth percentile compared to private companies in such surveys. Overall, the percentiles vary in range significantly based on the individualpositions of our named executive officers. As noted above, given our age as a company, our size, our results and our plans to pursue our initial public offering, webelieve that the on target earnings for our named executive officers have been reasonable and appropriate for 2009 and 2010.
Base Salary. We establish base pay that is both reasonable and competitive in relation to the market, including the benchmarking data described above. Weregularly monitor competitive base pay levels and make adjustments to base pay as appropriate. In general, a named executive officer’s base pay level shouldreflect the executive’s overall performance and contribution to us over time. We also seek to structure competitive base pay for our named executive officersbased upon applicable market data analysis. As described below, we design base pay to provide the ongoing reward for each named executive officer’s work andcontribution and to be competitive in attracting or retaining the executive. We do not provide automatic salary increases for our executive team. Once base paylevels are initially determined, however, we conduct salary reviews each year based upon current market data and the executive’s specific performanceachievements. We also take into account salary levels for their retention effect. Salaries are also determined based on negotiations with our executive officers. Webelieve this pay-for-performance approach reflects our cultural values and our business model.
97

Table of Contents
The following are the effective annual base salaries for each of our named executive officers for 2008, 2009, 2010 and 2011: Annual Base Salary Executive Officer 2008 2009 2010 2011 Michael A. Smerklo $ 383,250 $ 393,000 $ 410,000 $ 450,000 Jeffrey M. Bizzack — $ 375,000 $ 375,000 $ 400,000 David S. Oppenheimer — — $ 300,000 $ 307,500 Charles D. Boynton $ 275,000 $ 275,000 $ 295,000 — Robert J. Sturgeon $ 275,000 $ 275,000 $ 275,000 $ 275,000 Ganesh Bell — — $ 260,000 $ 260,000 Raymond M. Martinelli $ 250,000 $ 250,000 — — (1) Reflects effective annual base salary. Actual amounts earned vary for those named executive officers that either joined or departed during the years specified as described above. Data not provided for any
period in which an individual was not a named executive officer.
For the 2009 base salary compensation decisions, as a result of company performance and the levels of base compensation in relation to the benchmarkingof the on target cash earnings discussed above, the compensation committee and the board determined to keep most salaries flat, with a modest increase in basesalary for Mr. Smerklo. For the 2010 compensation decisions, Messrs. Smerklo and Boynton received modest increases in their base salaries as a result of thecompensation committee and board acknowledgement of a mix of continued effective performance and the benchmarking analysis reflected above. Also, asMr. Bizzack started with us in 2009 and Messrs. Oppenheimer and Bell commenced employment in 2010, their initial base salary levels reflect marketbenchmarking and negotiations with these individuals prior to their agreement to join us. For the 2011 compensation decisions made in December 2010, the boardof directors determined to make modest increases in the base salaries of Messrs. Smerklo, Bizzack and Oppenheimer as an acknowledgement of performance andto further adjust salaries based on benchmarking provided by Compensia to comparable pre-IPO and public companies, given the developing plans for thisoffering. In addition, Mr. Burns’ annual base salary was £200,000 for both 2008 and 2009, denominated in British pounds given his location in the UnitedKingdom.
Variable Pay. Consistent with our pay-for-performance philosophy, we link a significant portion of our named executive officers’ cash compensation toindividual and company performance. We design our variable pay programs to provide reasonable and competitive earnings potential relative to our industry andgeography. For most of our named executive officers, we have implemented our corporate incentive bonus program as a motivational tool to achieve and exceedindividual and company goals by paying for outstanding results. For those named executive officers who are sales executives, we have sales commission plansthat serve as the primary motivational tool for achieving our company goals. Our variable pay programs are typically based on a formulaic assessment of ourfinancial performance, giving consideration to an assessment of each individual’s performance. Our programs are designed to avoid entitlements, and to alignactual payouts with actual results based on clearly understood metrics.
Our compensation committee reviews the structure and design of our variable pay plans on an annual basis, typically at the beginning of each year. For2009 and 2010, our variable pay plans have been designed to be evaluated after the first half and the end of the applicable year. The overall business plan andrelated goals of our variable pay plans will be determined at the start of the year, typically in January or February. Once first half results are available, ourcompensation committee and board review these results and approve any payout under each plan for such first half results, typically in July of each year. Once thefull-year results are available, the compensation committee and board review and approve the final, second half payouts under each plan for the full year results,typically in January or February of the following year. The compensation committee and the board of directors have the discretion to increase or decrease apayout under the variable pay plans in the event that they determine that circumstances warrant adjustment. The compensation committee and the board did notexercise any such discretion with respect to 2009. As described below, the compensation committee and the
98
(1)

Table of Contents
board modified the design of our variable pay plans in connection with analyzing the results for the first half of 2010 and setting the goals for the full year 2010,and exercised discretion in approving the final payment for the full year 2010, although we did not meet the pre-established financial goal under the plan for suchpayment. 2009 Corporate Incentive Bonus Plan. For 2009, all of our named executive officers participated in our 2009 Corporate Incentive Bonus Plan, which
we refer to as the 2009 CIP. The 2009 CIP was designed for non-commissioned employees, generally at the manager level and above. For the namedexecutive officers, the 2009 CIP bonus targets are set forth as a percentage of base salary, which range from approximately 30% to approximately45% for most executives. Mr. Burns’ variable pay was based 35% upon the 2009 CIP and 65% upon a sales commission plan tied to the amount ofnew projected revenue sold by our worldwide service sales team in 2009. The actual targets are reflected below under “Executive Compensation—Grants of Plan-Based Awards.”
The 2009 CIP was designed for semi-annual payments, with funding based upon the company achieving certain Adjusted EBITDA targets. TheAdjusted EBITDA targets were set by our board of directors in early February 2009. For the six months ended June 30, 2009, the Adjusted EBITDAtarget was $5.9 million, which was derived from a targeted net income of $0.1 million. The following table reconciles targeted net income to theAdjusted EBITDA target for the 2009 CIP of $5.9 million for the six months ended June 30, 2009:
Targeted Net income $ 0.1 million Adjusted for:
Stock-based compensation 3.2 Deprecation and amortization 1.8 Interest expense 0.8
Adjusted EBITDA Target $ 5.9 million
The following table reconciles targeted net income to the Adjusted EBITDA target for the 2009 CIP as set by our board of directors in earlyFebruary 2009 for the year ended December 31, 2009:
Targeted Net income $10.1 million Adjusted for:
Stock-based compensation 6.4 Deprecation and amortization 3.8 Interest expense 1.5 Other income 0.1
Adjusted EBITDA Target $21.9 million
In July 2009, in connection with our mid-year evaluation of our business and targets for the 2009 CIP, the board of directors set a revised full year2009 Adjusted EBITDA target for the 2009 CIP of $23.0 million.
To fund the 2009 CIP, the company was required to meet 85% of its Adjusted EBITDA target for the applicable period. Upon reaching the 85%level, we would pay bonuses at 50% of target. Funding then increased as Adjusted EBIDTA achievement increased, as shown in the table below.
The 2009 CIP also provided upside potential if we exceeded our Adjusted EBITDA targets. If we achieved 110% of our Adjusted EBITDA target forthe first half of the year, we would fund the 2009 CIP in full for the first half, and the remaining 10% over achievement would be available forpayment at the end of the year provided that we met 100% of our Adjusted EBITDA target for the full year. Similarly, if we met our goal for the firsthalf of the year, and then overachieved for the full year, we would fund the 2009 CIP based on the full year overachievement. To the extent wemissed our
99

Table of Contents
Adjusted EBITDA target in the first half of the year, any overachievement for the full year would be offset by the amount of the first half shortfall.Funding for overachievement in any 2009 CIP bonus period was capped at 200% of target.
The following table illustrates potential payouts at different levels of achievement under the 2009 CIP.
Adjusted EBITDA Target Achievement 2009 CIP Funding PercentageBelow 85% No Payout
85% 50%88% 60%91% 70%94% 80%97% 90%100% 100%110% 133%120% 166%
130% and above 200%
Performance goals were assessed quarterly and paid semi-annually, subject to the company achieving the necessary Adjusted EBITDA targets tofund the 2009 CIP. Under the 2009 CIP, individual bonus payments were calculated as follows for each bonus period, with any payment for the firsthalf of the year taken into account with respect to the payment for the full year:
(% Company Bonus Pool Funded) x (% Individual Performance Goals Achieved) x (Individual Salary x Individual Semi-Annual Bonus %)= Aggregate Employee Payment
We made semi-annual bonus payments to the participating named executive officers, and to other 2009 CIP participants, in August 2009 andFebruary 2010 after we had results for the applicable bonus periods. For the first half of 2009 semi-annual bonus period, we achieved approximately110% against the 2009 CIP targets, and funded the bonus pool at a 100% level, with possible upside potential that carried into the full yearassessment. For the full year, we achieved approximately 88% of our Adjusted EBITDA target, and funded the bonus pool at an 80% level (basedupon 60% achievement in the second half of 2009). In addition, the overachievement in the first half of 2009 did not result in any additionalpayments at the end of the 2009 CIP year because any overachievement payments arising from the first half year were dependent upon our achieving100% of our Adjusted EBITDA target for the full year. As noted above, we only attained 88% of our Adjusted EBITDA target for the full year underthe 2009 CIP, which negated the first-half overachievement. For the targets related to the specific named executive officers under the 2009 CIP, see“Executive Compensation—Grants of Plan-Based Awards,” and for total annual payments made under the 2009 CIP for each named executiveofficer, see “Executive Compensation—Summary Compensation Tables.”
2010 Corporate Incentive Bonus Plan. For 2010, all of our named executive officers were eligible to participate in the 2010 Corporate IncentivePlan, to which we refer as the 2010 CIP. Like the 2009 CIP, the 2010 CIP is designed for non-commissioned employees, generally at the managerlevel and above. Employees paid by commission are not eligible to participate in the 2010 CIP. For the named executive officers, the 2010 CIP bonustargets are set forth as a percentage of base salary, which range from approximately 37% to approximately 49% for most executives. Mr. Sturgeon’svariable compensation for 2010 is based on a mixed target in which 60% of his overall target bonus amount is tied to the 2010 CIP and 40% is tied toa separate measurement of performance described below.
The 2010 CIP was designed with semi-annual payments. Unlike the 2009 CIP, however, funding for the 2010 CIP was based upon our achievingcertain revenue targets, subject to a minimum level of Adjusted EBITDA. Those targets were set by our board of directors in late January 2010 forthe six months ended June 30, 2010, and in July 2010 for the full year. For the six months ended June 30,
100

Table of Contents
2010, the revenue threshold was $63.5 million representing 95% of the 2010 first half target of $66.8 million and the Adjusted EBITDA minimumwas $4.5 million representing 80% of the 2010 first half target of $5.6 million. The following table reconciles our targeted net loss of $0.6 million tothe Adjusted EBITDA target for the 2010 CIP of $5.6 million for the six months ended June 30, 2010:
Targeted Net loss $(0.6) million Adjusted for:
Stock-based compensation 3.2 Deprecation and amortization 2.4 Interest expense 0.6
Adjusted EBITDA Target $ 5.6 million
For the year ending December 31, 2010, the revenue threshold was $140.6 million representing 95% of the annual target of $148.0 million and theAdjusted EBITDA minimum was $21.4 million, representing 80% of the annual target of $26.8 million. The following table reconciles our targetednet income of $9.1 million to the Adjusted EBITDA target for the 2010 CIP of $26.8 million for the year ending December 31, 2010:
Targeted Net income $ 9.1 million Adjusted for:
Stock-based compensation 6.7 Deprecation and amortization 5.5 Interest expense 1.2 Provision for income taxes 4.3
Adjusted EBITDA Target $26.8 million
For the full year 2010 target, the board determined in July 2010 that the payment of certain sales commissions to our sales force, which wereresulting from increased commission rates due to increased performance of our overall business, and certain previously unplanned expensesattributable to the planning and preparation for our initial public offering, would not be included as expenses in calculating the Adjusted EBITDAtarget. This was based on the rationale that the named executive officers and other employees eligible for the 2010 CIP should not be penalized foran otherwise lower Adjusted EBITDA due to the increased commission rates due to sales overachievement or for the added costs of pursuing thisoffering.
To fund the 2010 CIP, we were required to meet at least 80% of the Adjusted EBITDA target for the applicable period. Assuming we reached 80% ofthe Adjusted EBITDA target, we would fund the bonus pool based upon the level of revenue achieved, as shown in the table below.
Revenue Target Achievement 2010 CIP Funding Percentage
Below 95% No Payout³ 95% 50%³ 96% 60%³ 97% 70%³ 98% 80%³ 99% 90%100% 100%
101

Table of Contents
The 2010 CIP also allowed for additional upside payments in the event that we exceed our targets for full year 2010, subject to the followingconditions:
• we must have achieved 100% of our Adjusted EBITDA target for the full year in order to make any upside payments; • upside payments were capped at 200% of 2010 CIP; • no more than 50% of Adjusted EBITDA overachievement could be spent on bonuses under the 2010 CIP; and • upside payments would be determined based on the full year 2010 results after the year was completed. Subject to those conditions, the potential upside payments under the 2010 CIP were as follows:
Annual Revenue Target Overachievement Annual 2010 CIP Funding Percentage³ 102% 120%³ 104% 140%³ 106% 160%³ 108% 180%
110% and above 200%
For purposes of the 2010 CIP, performance goals are assessed quarterly and bonuses are paid semi-annually, subject to our achieving the necessaryAdjusted EBITDA and revenue targets to fund the 2010 CIP. Under the 2010 CIP, individual bonus payments are calculated as follows for eachbonus period, with any payment for the first half of the year taken into account with respect to the payment for the full year:
(% Company Bonus Pool Funded) × (% Individual Performance Goal Achieved) × (Individual Salary × Individual Semi-Annual Bonus %)= Employee Payment
Given Mr. Sturgeon’s role and responsibility as a key manager of our service sales teams, our compensation committee and board of directorsdetermined that Mr. Sturgeon’s 2010 bonus structure would include a separate 40% pay-for-performance target component that was tied to hisoperating unit, while 60% of his target bonus would continue to be tied to overall corporate performance under the 2010 CIP. This 40% targetcomponent is measured based on a gross margin statistic applicable to the service sales teams. The gross margin statistic is determined as the revenuegenerated by the service sales teams minus all of the direct and management costs for the service sales teams. This specific gross margin statistic isan internal financial metric that we use for measuring the performance of our service sales teams. This metric is not disclosed publicly by us and isconfidential financial information to us, such that the disclosure of this metric would cause competitive harm to us. We believe this gross marginelement for Mr. Sturgeon was challenging but achievable with strong performance by our service sales teams for the full year 2010.
We made semi-annual bonus payments to the participating named executive officers, and to other 2010 CIP participants, in July 2010. For the firstsemi-annual bonus period, we achieved 138% against the 2010 CIP targets, and therefore funded the bonus pool at a 100% level. We also carried theupside into the full year bonus period.
For the full year 2010 results, we achieved approximately 67.8% of the 2010 CIP Adjusted EBITDA target, and 102.8% of the 2010 CIP revenuetarget. Under the terms of the 2010 CIP as written, we would not have funded the 2010 CIP because we did not meet the 80% threshold for theAdjusted EBITDA target. Our compensation committee and board, in considering our results for the full year, the incremental costs and expensesassociated with the process for preparing for this offering and various other unplanned expenses during the 2010 fiscal year, determined in February2011 to use its discretion to fund the 2010 CIP for the full year at 100% of the targeted amount. Therefore, our named
102

Table of Contents
executive officers will be treated as having received discretionary bonuses for the payments relating to this full year evaluation of the 2010 CIP. For the targets related to the specific named executive officers under the 2010 CIP, see “Executive Compensation—Grants of Plan-Based Awards,”
and for the payments made under the 2010 CIP for each named executive officer, see “Executive Compensation—Summary Compensation Tables.” 2011 Corporate Incentive Bonus Plan. In February 2011, our compensation committee and board approved a 2011 Corporate Incentive Plan, or 2011
CIP, on terms similar to the 2010 CIP. For the named executive officers, the 2011 CIP bonus targets are set forth as a percentage of base salary,which range from approximately 37% to approximately 58% for most executives, and 80% for Mr. Smerklo. Mr. Sturgeon’s CIP bonus is also setforth as a percentage of his salary, but unlike the other named executive officers, his funding threshold is not tied to a minimum EBITDAachievement. Rather, it is tied to a separate measurement of performance described below. In addition, in view of the overall design of the 2011 CIPtogether with the 2011 Incremental Bonus Plan described below, the compensation committee and the board decided to increase the bonusopportunity of Mr. Oppenheimer (and certain other senior executives who are not named executive officers) in the 2011 CIP in the amount of$25,000, and to deem him (and the other senior executives) not eligible to participate in the 2011 Incremental Bonus Plan. This decision was made asa matter of corporate governance in that Mr. Oppenheimer and the other affected senior executives are responsible for approving new customercontracts and/or forecasting the metrics on which the 2011 Incremental Bonus Plan is measured. The following are the target bonuses at 100%funding for each 2010 named executive officer under the 2011 CIP: Mr. Smerklo: $360,000; Mr. Bizzack: $175,000; Mr. Oppenheimer: $178,750;Mr. Sturgeon: $225,000; and Mr. Bell: $117,000.
The 2011 CIP was designed with semi-annual payments, with up to 35% of the annual bonus payable for the first half of the year and the rest,including any overachievement payments, payable after completion of the full year. Similar to the 2010 CIP, funding for the 2011 CIP is based uponour achieving certain revenue targets, subject to a minimum level of EBITDA. While the revenue and EBITDA targets were set in February 2011,the disclosure of these targets at this time so early in the year would cause competitive harm to us. We believe these targets are challenging becausethey require meaningful growth in our business for 2011.
To fund the 2011 CIP, we are required to meet at least 80% of the EBITDA target for the applicable period. Assuming we reach 80% of the EBITDAtarget, we would fund the bonus pool based upon the level of revenue achieved, as shown in the table below.
Revenue Target Achievement 2011 CIP Funding Percentage
Below 95% No Payout95% 50%96% 60%97% 70%98% 80%99% 90%100% 100%
The 2011 CIP also allows for additional upside payments in the event that we exceed our targets for full year 2011, subject to the followingconditions:
• we must have achieved 100% of our EBITDA target for the full year in order to make any upside payments; • upside payments are capped at 150% of 2011 CIP (which is a decrease from the 200% cap in the 2010 CIP); • no more than half of EBITDA overachievement may be spent on bonuses under the 2011 CIP; and
103

Table of Contents
• upside payments will be determined based on the full year 2011 results after the year is completed. Subject to those conditions, the potential upside payments under the 2011 CIP are as follows:
Annual Revenue Target Overachievement Annual 2011 CIP Funding Percentage102% 110%104% 120%106% 130%108% 140%
110% and above 150% For purposes of the 2011 CIP, performance goals are assessed quarterly and bonuses are paid semi-annually, subject to our achieving the necessary
EBITDA and revenue targets to fund the 2011 CIP. Under the 2011 CIP, individual bonus payments are calculated as follows for each bonus period,with any payment for the first half of the year taken into account with respect to the payment for the full year:
(% Company Bonus Pool Funded) × (% Individual Performance Goal Achieved) × (Individual Salary × Individual Semi-Annual Bonus %)= Employee Payment
Mr. Sturgeon’s 2011 bonus structure is identical to the general 2011 CIP in all respects, except that instead of achieving a minimum EBITDA levelfor the applicable period, he must achieve 95% of adjusted contribution margin for the applicable period in order to receive payment. This adjustedcontribution margin is a non-GAAP measure of revenue less direct and indirect client delivery costs, client delivery management costs, businessoptimization costs, transformation savings and sales enablement training costs. This adjusted contribution margin statistic is an internal financialmetric that we use for measuring the performance of our service sales teams. This metric is not disclosed publicly by us and is confidential financialinformation to us, such that the disclosure of this metric would cause competitive harm to us. We believe this adjusted contribution margin elementfor Mr. Sturgeon is challenging but achievable with strong performance by our service sales teams for 2011. If Mr. Sturgeon achieves 95% ofadjusted contribution margin for the applicable period, he will then receive a 2011 CIP payment based on the same level of revenue achievement asall of our other named executive officers under the 2011 CIP.
2010 Incremental Incentive Bonus Plan. In addition to our 2010 CIP, our compensation committee and board of directors approved a special variablecash incentive plan for 2010 for certain of our named executive officers and a few other senior executives. This plan, which we refer to as the 2010Incremental Bonus Plan, was designed to award exceptional corporate performance based on a stretch target measuring our success with customersin 2010. The specific target that we use as the measurement for the 2010 Incremental Bonus Plan is an internal financial metric that we use formeasuring certain customer contractual commitments based on a net recurring revenue amount in which we measure customer revenue gains offsetby losses in the given measurement period. This metric is not disclosed publicly by us and is confidential financial information to us, such that thedisclosure of this metric would cause competitive harm to us. We believe this target was challenging because it required achieving exceptional salesand revenue results for 2010. Of our 2010 named executive officers, Jeffrey Bizzack, David Oppenheimer, Robert Sturgeon and Ganesh Bell wereeligible for the 2010 Incremental Bonus Plan. We implemented the 2010 Incremental Bonus Plan in order to incentivize these senior executives todrive customer acquisition and retention. Payment under the 2010 Incremental Bonus Plan was designed to be in a lump sum if the stretch target wasachieved by us. In February 2011, our compensation committee and board evaluated the results and our target under the 2010 Incremental BonusPlan and determined that we had obtained approximately 97.8% of the target metric required to fund the plan. As a result of this strong performanceand the general accomplishments of the senior management team throughout the year, our compensation committee and board determined to usetheir discretion to fund the 2010 Incremental Bonus Plan at 90% of the funding level that had originally been designed. Therefore, our namedexecutive officers will be treated as having received discretionary bonuses for the payments relating to the 2010 Incremental Bonus Plan.
104

Table of Contents
For detailed targets of each of these named executive officers under the 2010 Incremental Bonus Plan, see “Executive Compensation—Grants ofPlan-Based Awards,” and for the payments made under the 2010 Incremental Bonus Plan for each named executive officer, see “ExecutiveCompensation—Summary Compensation Tables.”
2011 Incremental Incentive Bonus Plan. In February 2011, our compensation committee and board approved a 2011 Incremental Bonus Plan onsubstantially the same terms as the 2010 Incremental Bonus Plan. The 2011 Incremental Bonus Plan is designed to reward certain of our namedexecutive officers and a few other senior executives for exceptional corporate performance based on a stretch target measuring our success withcustomers in 2011. The specific target that we use as the measurement for the 2011 Incremental Bonus Plan is the same internal financial metric thatwe used for the 2010 Incremental Bonus Plan, with the actual target metric higher than the target metric in 2010. This metric is not disclosedpublicly by us and is confidential financial information to us, such that the disclosure of this metric would cause competitive harm to us. We believethis target is challenging because it requires achieving exceptional sales and revenue results for 2011. Of our 2010 named executive officers, JeffreyBizzack ($100,000), Robert Sturgeon ($50,000) and Ganesh Bell ($50,000) are eligible for the 2011 Incremental Bonus Plan, with the target bonusamounts for each individual noted in the parenthesis next to his name. As mentioned above under the discussion of the 2011 CIP, Mr. Oppenheimeris not eligible to participate in the 2011 Incremental Bonus Plan due to his role in approving and signing customer contracts. As in 2010, weimplemented the 2011 Incremental Bonus Plan in order to incentivize these senior executives to drive customer acquisition and retention. Paymentunder the 2011 Incremental Bonus Plan is designed to be in a lump sum if the stretch target is achieved by us, which will be assessed after the resultsfor 2011 are available.
Equity-Based Rewards. We design our equity programs to be both responsible and competitive in relation to the market. We monitor the market and
applicable laws and regulations and adjust our equity programs as appropriate. Stock options are designed to reflect and reward a high level of sustainedindividual performance over time, as reflected in improved overall company value. As described in more detail below, we design equity-based compensation tohelp retain talent over a period of time and to provide named executive officers with a long-term reward that aligns their interests with those of our stockholders.
We historically have used stock option grants as the primary vehicle for equity compensation to our named executive officers and other employees. In orderto promote the long-term incentive and retention features of equity compensation, we have typically issued our stock option grants subject to our standard one-year cliff vesting and four year vesting schedule. Under the vesting schedule, 25% of the stock option becomes exercisable one year after a specified vestingcommencement date, and then vesting occurs monthly thereafter over the remaining three year period, which we believe is a common default vesting term in thetechnology industry. On occasion, we have also granted stock options with non-standard vesting or early exercise features, mostly in case-by-case situations forsenior and other employees or candidates in high demand.
We anticipate using restricted stock units in addition to stock options upon becoming a publicly traded company for equity compensation, primarily toreduce the dilution associated with our equity compensation programs. We will be able to grant fewer shares of stock but still incent our executive officers basedon the fact that restricted stock units will have value to the recipients in the absence of stock price appreciation.
We consider a number of factors to determine the size of all grants, including competitive market factors, named executive officer performance, retentionvalue and a review of the named executive officer’s overall compensation package. Traditionally, equity awards to our named executive officers have beenrecommended by the compensation committee to our board of directors, which then makes the final determination as to whether to grant any equity award to anamed executive officer. We anticipate that after our initial public offering, our compensation committee will make all equity grants.
105

Table of Contents
Initial option grants upon hire are generally designed to attract experienced executives with established records of success and help retain them over thelong term. The size of new hire grants has been evaluated by our compensation committee in light of the Syzygy-provided benchmarking data, and as a result ofthe negotiations with potential executive officers. Mr. Bizzack in 2009 and Messrs. Oppenheimer and Bell in 2010 each received new hire grants as part of theircompensation packages upon joining us, the terms of which are reflected in the “Grants of Plan-Based Awards” table below.
Subsequent grants to named executive officers are intended to ensure that equity compensation remains competitive within our industry group andgeography. Named executive officers whose skills and results we deem essential to our long-term success are eligible to receive higher equity grants. The decisionto make such refresh grants has traditionally been based on rewarding performance, consistent with our pay-for-performance philosophy, and the benchmarkingposition of equity ownership of our named executive officers against the market surveys, taking into account the number of vested stock options that our namedexecutive officers hold and the situation of our company as a mature private company approaching its initial public offering. Based on the benchmarking data, wedetermined that certain of our named executive officers in 2009, including our Chief Executive Officer, Chief Financial Officer and Chief People Officer, heldequity compensation positions that were below the fiftieth percentile of the benchmarking private company group, but were above the fiftieth percentile of thepublic company group. At that time in 2009, we determined not to make any additional refresh grants to those named executive officers. In connection with our2010 compensation review for our named executive officers and other employees, our compensation committee and board of directors determined to implementan annual refresh review for all employees, with emphasis on our senior employees, in order to award future performance and potential for future contributions toour company. We also took into account the market benchmarking for private companies in evaluating the size of potential refresh grants for our executiveofficers, especially given our plans to pursue this offering. As a result, our compensation committee and board approved refresh stock option grants to Messrs.Smerklo and Sturgeon in February 2010, the terms of which are reflected on the “Grants of Plan-Based Awards” table below.
Currently, we do not have any policy in place that requires us to grant equity compensation on specified dates. As noted above, we have traditionally madeour equity grants to our named executive officers at the next board meeting, in the case of new hires, and in our annual review of compensation by ourcompensation committee and our board of directors, typically in January or February of each year.
We traditionally have not had any equity security ownership guidelines or requirements for our executive officers or directors.
Benefits Programs. We provide our employees with retirement, health and welfare benefits, such as our group health insurance plans, 401(k) retirementplan, life, disability and accidental death insurance plans and our 2011 Employee Stock Purchase Plan. Those plans, which are available to all employeesincluding our named executive officers, are designed to provide a stable array of support to our employees and their families and are not performance based. Ourbenefits programs are generally established and adjusted by our human resources department with approval, as necessary, from senior management, thecompensation committee or the board of directors, as appropriate. Employment Agreements and Post-Employment Compensation We enter into employment agreements with certain of our named executive officers, sometimes as part of the hiring process, that provide for at-willemployment, base salary, eligibility to participate in the executive incentive bonus plan, standard employee benefit plan participation and recommendations forinitial stock option grants. These agreements are subject to our standard proprietary information and invention assignment terms. Certain of the employmentagreements contain certain severance and change of control benefits in favor of certain named executive officers, including our most senior executives. Thesearrangements provide for payments and benefits upon termination of their employment in specified circumstances, including following a
106

Table of Contents
change of control. These arrangements (including potential payments and terms) are discussed in more detail in the “Executive Compensation—EmploymentAgreements and Potential Payments upon Termination or Change-in-Control” section below. We believe that these agreements are an important retention tool,and will incent the named executive officers to maintain continued focus and dedication to their assigned duties to maximize stockholder value. The terms ofthese agreements were determined after review by the compensation committee of our retention goals for each named executive officer, as well as analysis ofmarket data, similar agreements established in our industry and as a result of negotiations with certain of the executives. Other Compensation Matters and Policies Tax and Accounting Considerations. Internal Revenue Code Section 162(m) limits the amount that we may deduct for compensation paid to our ChiefExecutive Officer and to each of our four most highly compensated officers to $1,000,000 per person, unless certain exemption requirements are met. Exemptionsto this deductibility limit may be made for various forms of “performance-based” compensation. In addition to salary and bonus compensation, upon the exerciseof stock options that are not treated as incentive stock options, the excess of the current market price over the option price, or option spread, is treated ascompensation and accordingly, in any year, such exercise may cause an officer’s total compensation to exceed $1,000,000. Under certain regulations, optionspread compensation from options that meet certain requirements will not be subject to the $1,000,000 cap on deductibility, and in the past, we have grantedoptions that we believe satisfy those requirements. While the compensation committee cannot predict how the deductibility limit may impact our compensationprogram in future years, the compensation committee intends to maintain an approach to executive compensation that follows our pay-for-performancephilosophy. While the compensation committee has not adopted a formal policy regarding tax deductibility of compensation paid to our Chief Executive Officerand our four most highly compensated officers, the compensation committee intends to consider tax deductibility under Section 162(m) as a factor incompensation decisions.
Section 409A of the Internal Revenue Code imposes additional significant taxes in the event that an executive officer, director or other service providerreceives “deferred compensation” that does not satisfy the requirements of Section 409A. Although we do not maintain traditional nonqualified deferredcompensation plans, Section 409A may apply to certain arrangements we enter into with our executive officers, including our change of control severancearrangements. Consequently, to assist in avoiding additional tax under Section 409A, our intent is to design any such arrangements in a manner to avoid theapplication of Section 409A.
Adjustment or Recovery of Compensation. We do not have a formal policy regarding adjustment or recovery of awards or payments if the relevantperformance measures upon which they are based are restated or otherwise adjusted in a manner that would reduce the size of the award or payment. Compensation Risk Assessment The compensation committee believes that although a portion of compensation provided to our executive officers is performance-based, our compensationprograms do not encourage excessive or unnecessary risk taking. In fact, the design of our compensation programs encourage our executives to remain focused onboth short-term and long-term strategic goals, in particular in connection with our pay-for-performance business model.
107

Table of Contents
Summary Compensation Tables The following tables provide information regarding the compensation of our named executive officers during the years ended December 31, 2009 and2010.
Name and Principal Position Year Salary Bonus Option
Awards
Non-EquityIncentive Plan
Compensation All Other
Compensation Total Michael A. Smerklo
Chief Executive Officer
20102009
$$
410,000393,300
$100,000
$
2,484,170—
$$
100,000146,400
$$
2,000 2,000
$$
3,096,170541,700
Jeffrey M. BizzackPresident
20102009
$$
375,000313,942
$177,500
$$
808,7203,527,334
$$
87,500110,833
——
$$
1,448,7203,952,109
David S. OppenheimerChief Financial Officer
2010
$128,409
$ 70,000
$1,735,001
—
—
$1,933,410
Charles D. Boyntonformer Chief Financial Officer
20102009
$$
144,285275,000
—
$
85,837—
$$
66,000100,000
$$
215,500 2,000
$$
511,622377,000
Robert J. SturgeonChief Delivery Officer
20102009
$$
275,000275,000
$ 112,500
$
510,590—
$$
112,500180,000
——
$$
1,010,590455,000
Ganesh BellExecutive Vice President, Products
2010
$157,576
$ 84,750
$ 876,976
$ 9,750
—
$1,129,052
Raymond M. MartinelliChief People Officer
2009
$250,000
—
$ 60,000
$ 2,000
$ 312,000
Crosbie BurnsExecutive Vice President, EMEA
2009
$324,400
—
$ 292,878
—
$ 617,278
(1) For 2010, all amounts represent payments earned under the 2010 CIP for the full year 2010 results plus all amounts earned under the 2010 Incremental Bonus Plan which were granted on a discretionary
basis as discussed under “Executive Compensation—Compensation Discussion and Analysis—Our Compensation Programs—Variable Pay—2010 Corporate Incentive Bonus Plan” and “—2010Incremental Incentive Bonus Plan.” All amounts were paid in March 2011.
(2) The amounts in this column represent the aggregate grant date fair value of the option awards computed in accordance with FASB ASC Topic 718. See Note 10 of the Notes to Consolidated FinancialStatements for a discussion of assumptions made in determining the grant date fair value and compensation expense of our stock options.
(3) For 2009, all amounts represent payments under either the 2009 CIP or our sales commission plan earned with respect to 2009, and paid in July 2009 and February 2010. For 2010, all amounts representpayments under the 2010 CIP or our sales commission plan earned with respect to the six months ended June 30, 2010. See the “Grants of Plan-Based Awards” table for additional information.
(4) Represents matching contributions made by us with respect to the named executive officer’s 401(k) contributions. We match a maximum of $2,000 per year.(5) Mr. Bizzack joined us as our President in February 2009 and received a prorated base salary based on an annual base salary of $375,000.(6) Mr. Oppenheimer joined us as our Chief Financial Officer in July 2010 and received a prorated base salary based on an annual base salary of $300,000.(7) Mr. Boynton left the company in June 2010 and received a prorated base salary based on an annual base salary of $295,000. In June 2010, we modified the vesting of 260,416 options granted to
Mr. Boynton such that the cancellation of the vested shares occurs twelve months after termination.(8) Includes a severance payment in the amount of $213,500 described further under “Executive Compensation—Employment Agreements and Potential Payments upon Termination or Change-in-Control”
and 401(k) company matching contributions of $2,000.(9) Mr. Bell joined us as our Executive Vice President of Products in May 2010 and received a prorated base salary based on an annual base salary of $260,000.(10) Mr. Burns was a named executive officer for part of 2009 when he held the title of Executive Vice President of Worldwide Sales. Since 2009, he has been our Executive Vice President of EMEA.
Mr. Burns receives his cash compensation in British pounds. The amounts reported above were converted to U.S. dollars using a rate of £1.00 per $1.622, which was the exchange rate as of December 31,2009.
108
(1) (2) (3)
(4)
(4)
(5)
(6)
(7) (7)(8)
(4)
(9)
(4)
(10) (10) (10) (10)

Table of Contents
Grants of Plan-Based Awards The following table presents information concerning grants of plan-based awards to each of our named executive officers during the years endedDecember 31, 2009 and December 31, 2010.
Estimated Future Payouts UnderNon-Equity Incentive Plan
Awards
All OtherOption Awards:
Number ofSecurities
Underlying Options
Exerciseor BasePrice ofOptionAwards
Grant DateFair Value
OptionAwards Name Grant Date Threshold Target Maximum
Michael A. Smerklo 12/16/2010 — — — 325,000 $ 5.80 $1,314,170 1/27/2010 $100,000 $200,000 $400,000 2/4/2009 $ 91,500 $183,000 $366,000 2/9/2010 500,000 $ 4.65 $1,170,000
Jeffrey M. Bizzack 12/16/2010 — — — 200,000 $ 5.80 $ 808,720 1/27/2010 $ 87,500 $175,000 $350,000
1/27/2010 — $100,000 — 2/11/2009 $ 87,500 $175,000 $350,000 2/27/2009 1,695,372 $ 4.26 $3,527,334
David S. Oppenheimer 12/16/2010 — — — 35,000 $ 5.80 $ 141,526 7/7/2010 $ 25,000 $ 50,000 $100,000
7/7/2010 — $ 20,000 — 7/28/2010 650,000 $ 4.95 $1,593,475
Charles D. Boynton 1/27/2010 $ 66,000 $132,000 $264,000
1/27/2010 — $ 50,000 — 2/4/2009 $ 62,500 $125,000 $250,000 6/25/2010 — — — 260,416 $ 4.26 $ 85,837
Robert J. Sturgeon 12/16/2010 — — — 25,000 $ 5.80 $ 101,090 1/27/2010 $ 112,500 $225,000 $450,000
1/27/2010 — $ 50,000 — 2/4/2009 $ 112,500 $225,000 $450,000 2/9/2010 175,000 $ 4.65 $ 409,500
Ganesh Bell 12/16/2010 — — — 35,000 $ 5.80 $ 141,526 7/28/2010 $ 58,500 $ 117,000 $234,000
7/28/2010 — $ 30,000 300,000 $ 4.95 $ 735,450 Raymond M. Martinelli 2/4/2009 $ 37,500 $ 75,000 $150,000 Crosbie Burns 2/4/2009 $121,650 $243,300 $486,600 (1) Represents awards granted under our 2009 CIP, 2010 CIP or 2010 Incremental Bonus Plan, which were or are based on achievement of certain levels of performance for 2009 and 2010. These columns
show the awards that were possible at the threshold, target and maximum levels of performance to the extent applicable.(2) Reflects the grant date fair value of each award computed in accordance with FASB ASC Topic 718. These amounts do not necessarily correspond to the actual value that will be recognized by the named
executive officers. The assumptions used in the valuation of these awards are consistent with the valuation methodologies specified in the notes to our consolidated financial statements.(3) Reflects amount payable under the 2010 Incremental Bonus Plan. The target amount is a lump sum amount payable if certain financial goals are achieved as measured at the end of 2010. For a further
discussion, see “Executive Compensation—Compensation Discussion and Analysis—Our Compensation Programs—Variable Pay—2010 Incremental Incentive Bonus Plan.”(4) Mr. Oppenheimer joined us as our Chief Financial Officer in July 2010 and the 2010 CIP amount is a pro rated amount given his partial year of service.(5) Mr. Boynton left the company in June 2010 and no longer qualifies for any further payments under the 2010 CIP or the 2010 Incremental Bonus Plan. In June 2010, we modified the post-termination
exercise period of 260,416 options granted to Mr. Boynton such that the cancellation of the vested shares occurs twelve months after termination.(6) For the 2010 CIP, reflects a blended target. Mr. Sturgeon is subject to an allocation of 60% of his target bonus based on corporate performance under the 2010 CIP and 40% of his target bonus based on a
gross margin statistic applicable to the inside sales organization. For further discussion, see “Executive Compensation—Compensation Discussion and Analysis—Our Compensation Programs—VariablePay—2010 Corporate Incentive Bonus Plan.”
(7) Mr. Burns receives his cash compensation in British pounds. The amounts reported were converted to U.S. dollars using a rate of £1.00 per $1.622, which was the exchange rate as of December 31, 2009.
109
(1)
(2)
(3)
(4)
(3)
(5)
(3)
(6)
(3)
(3)
(7)

Table of Contents
Outstanding Equity Awards at Fiscal Year-End The following table presents certain information concerning equity awards held by our named executive officers at the end of 2009 and 2010.
Name Year
VestingCommencement
Date
Number ofSecurities
UnderlyingUnexercised
OptionsExercisable
Number ofSecurities
UnderlyingUnexercised
OptionsUnexercisable
OptionExercise
Price
OptionExpiration
Date Michael A. Smerklo
2010
2009
1/1/20071/27/2010
12/16/20101/1/2007
1,800,000——
1,800,000
—500,000325,000
—
$$$$
4.264.655.804.26
1/31/20172/9/2020
12/16/20201/31/2017
Jeffrey M. Bizzack
2010
2009
2/27/200912/16/2010
2/27/2009
518,030——
1,177,342200,000
1,695,372
$$$
4.265.804.26
2/27/201912/16/2020
2/27/2019
David S. Oppenheimer
2010
2009
7/28/201012/16/2010
—
———
650,00035,000
—
$$
4.955.80
—
7/28/202012/16/2020
—
Charles D. Boynton
20102009
4/28/20084/28/2008
260,416208,333
—291,667
$$
4.264.26
4/30/20184/30/2018
Robert J. Sturgeon
2010
2009
10/1/20071/27/2010
12/16/201010/1/2007
525,000——
525,000
—175,000
25,000—
$$$$
4.264.655.804.26
11/7/20172/9/2020
12/16/202011/7/2017
Ganesh Bell
2010
2009
5/24/201012/16/2010
—
———
300,00035,000
—
$$
4.955.80
—
7/28/202012/16/2020
—
Raymond M. Martinelli
2009
5/1/200611/1/20061/1/2008
185,000 15,00075,000
———
$$$
1.201.494.26
6/1/20146/1/2014
1/30/2018
Crosbie Burns
2009
6/1/200511/1/20061/1/2008
431,000 90,00075,000
———
$$$
0.251.494.26
6/1/20146/1/2014
1/30/2018
(1) The option is subject to an early exercise provision and is immediately exercisable. Twenty-five percent of the shares subject to the option vested on January 1, 2008 and 2.083% of the shares vest monthly
thereafter. As of December 31, 2010, 1,762,500 shares were fully vested and 37,500 shares vest ratably over the remainder of the vesting period, subject to continued service to us. As of December 31,2009, 1,312,500 shares were fully vested and 487,500 shares vest ratably over the remainder of the vesting period, subject to continued service to us.
(2) One-fourth of the shares subject to the option shall vest on the one year anniversary of the vesting commencement date and one forty-eighth of the shares vest monthly thereafter, subject to continuedservice to us.
(3) Of the shares awarded, 1,130,248 shares subject to the option vest over four years, with 25% of the shares subject to the option vesting on February 27, 2010 and the remainder vest ratably over thefollowing 36 months, and 565,124 shares subject to the option vest over five years with 25% of the shares subject to the option vesting on February 27, 2011 and the remainder vest ratably over thefollowing 36 months, in each case subject to continued service with us.
(4) Mr. Boynton left the company in June 2010. Shares subject to the option no longer vest. As a result of his separation and pursuant to his release agreement with us, the option is exercisable until June 24,2011.
(5) The option is subject to an early exercise provision and is immediately exercisable. Twenty-five percent of the shares subject to the option vested on October 1, 2008 and 2.083% of the shares vest monthlythereafter. As of December 31, 2010, 415,625 shares were fully vested and 109,375 shares vest ratably over the remainder of the vesting period. As of December 31, 2009, 284,375 shares were fully vestedand 240,625 shares vest ratably over the remainder of the vesting period, subject to continued service to us.
(6) The option is subject to an early exercise provision and is immediately exercisable. Twenty-five percent of the shares subject to the option vested on May 1, 2007 and 2.083% of the shares vest monthlythereafter. As of December 31, 2009, 158,958 shares were fully vested and 26,042 shares vest ratably over the remainder of the vesting period, subject to continued service to us.
(7) The option is subject to an early exercise provision and is immediately exercisable. Twenty-five percent of the shares subject to the option vested on November 1, 2007 and 2.083% of the shares vestmonthly thereafter. As of December 31, 2009, 11,562 shares were fully vested and 3,438 shares vest ratably over the remainder of the vesting period, subject to continued service to us.
110
(1)
(1)
(2)
(2)
(3)
(2)
(3)
(2)
(2)
(4)
(2)
(5)
(5)
(2)
(2)
(2)
(2)
(6)
(7)
(8)
(9)
(10)
(11)

Table of Contents
(8) The option is subject to an early exercise provision and is immediately exercisable. Twenty-five percent of the shares subject to the option vested on January 1, 2009 and 2.083% of the shares vest monthlythereafter, subject to continued service to us. As of December 31, 2009, 35,937 shares were fully vested and 39,063 shares will vest ratably over the remainder of the vesting period, subject to continuedservice to us.
(9) The option is subject to an early exercise provision and is immediately exercisable. Twenty-five percent of the shares subject to the option vested on June 1, 2006 and 2.083% of the shares vest monthlythereafter. As of December 31, 2009, 431,000 shares were fully vested.
(10) The option is subject to an early exercise provision and is immediately exercisable. Twenty-five percent of the shares subject to the option vested on November 1, 2007 and 2.083% of the shares vestmonthly thereafter. As of December 31, 2009, 69,375 shares were fully vested and 20,625 shares vest monthly thereafter, subject to continued service to us.
(11) The option is subject to an early exercise provision and is immediately exercisable. Twenty-five percent of the shares subject to the option vested on January 1, 2009 and 2.083% of the shares vest monthlythereafter. As of December 31, 2009, 35,937 shares were fully vested and 39,063 shares vest ratably over the remainder of the vesting period, subject to continued service to us.
Option Exercises and Stock Vested at Fiscal Year-End None of the named executive officers exercised options or vested in shares of our common stock during the specified years. Other Plans We do not have any qualified or non-qualified defined benefit plans, any traditional non-qualified deferred compensation plans or other deferredcompensation plans. Employment Agreements and Potential Payments upon Termination or Change-in-Control Employment Agreements We have entered into employment agreements with Messrs. Smerklo, Bizzack, Oppenheimer, Sturgeon, Bell and Martinelli that provide for certainseverance payments and equity vesting upon termination of their employment in specified circumstances. We believe that these agreements are an importantretention tool, and will incent the named executive officers to maintain continued focus and dedication to their assigned duties to maximize stockholder value.The terms of these agreements were determined after review by the compensation committee of our retention goals for each named executive officer, as well asanalysis of market data, similar agreements established within our industry, and applicable law. The employment agreements for Messrs. Smerklo, Bizzack andSturgeon were effective in 2009. The employment agreements for Mr. Oppenheimer and Mr. Bell became effective in 2010 upon their joining the company. Inaddition, we entered into a separation agreement with Mr. Boynton in connection with his cessation of employment from us.
Michael A. Smerklo. We have entered into an employment agreement, dated July 6, 2007, amended and restated June 8, 2010, with Michael A. Smerklo,our Chairman and Chief Executive Officer. The agreement sets forth Mr. Smerklo’s annual base salary of $410,000 and a target bonus of $200,000, both amountsto be reviewed annually and subject to adjustment by the board of directors. The agreement also sets forth a grant of options to purchase 1,800,000 shares of ourcommon stock vesting over four years. Mr. Smerklo’s agreement provides further that if we terminate his employment without Cause, or if he terminates hisemployment with us for Good Reason, either prior to a Change of Control or within twelve months following a Change of Control, he will be entitled to aseverance payment in the amount of his earned, but not-yet-paid, annual target bonus for the year in which his separation occurs. In addition, if Mr. Smerklo isterminated without Cause, or if he terminates his employment with us for Good Reason, within one year following a Change of Control, in addition to receivinghis earned but not-yet-paid annual target bonus, Mr. Smerklo’s outstanding equity compensation awards will immediately become vested in full. The foregoingseparation payments and benefits are conditioned on Mr. Smerklo executing a general release of claims in our favor. In the event any payment to Mr. Smerkloprovided in the agreement would constitute a “parachute payment” as defined in 280G(b)(2) of the Internal Revenue Code, then Mr. Smerklo will be entitled toreceive the amount of such payment that would provide him the greatest after-tax benefit of either the full payment or a lesser payment which would result in noportion of such severance benefits being subject to excise tax.
111

Table of Contents
Jeffrey M. Bizzack. We have entered into an employment agreement, dated February 27, 2009, amended and restated December 8, 2010, with JeffreyBizzack, our President. The agreement sets forth Mr. Bizzack’s annual base salary of $375,000, target bonus of $175,000 and grant of options to purchase1,695,372 shares of our common stock vesting as to 1,130,248 shares over four years and 565,124 shares over five years. If, during the first year of employment,we were to terminate Mr. Bizzack’s employment without Cause or he terminated his employment with us for Good Reason, then 282,562 shares subject to theforegoing option grant would become vested on the termination date; this provision was not triggered, however, as Mr. Bizzack has been employed with us forover a year. Mr. Bizzack’s agreement provides further that if we terminate his employment without Cause, or if he terminates his employment with us for GoodReason, either prior to a Change of Control or within twelve months following a Change of Control, he will be entitled to a lump-sum severance payment equal tosix months of his then current base salary, as well as six months target bonus, if any (subject to applicable tax withholdings), and the payment of premiums for upto 12 months of group health plan coverage, assuming that Mr. Bizzack has timely elected COBRA continuation coverage. In addition, if we terminateMr. Bizzack’s employment without Cause, or if he terminates his employment with us for Good Reason, within one year following a Change of Control, inaddition to receiving the severance payments described above, Mr. Bizzack’s outstanding equity compensation awards will immediately become vested in full.The foregoing separation payments and benefits are conditioned on Mr. Bizzack executing a general release of claims in our favor. In the event any payment toMr. Bizzack provided in the agreement would constitute a “parachute payment” as defined in 280G(b)(2) of the Internal Revenue Code, then Mr. Bizzack will beentitled to receive the amount of such payment that would provide him the greatest after-tax benefit of either the full payment or a lesser payment which wouldresult in no portion of such severance benefits being subject to excise tax.
David S. Oppenheimer. We have entered into an employment agreement, dated July 7, 2010, with David Oppenheimer, our Chief Financial Officer, whocommenced employment in July 2010. The agreement sets forth Mr. Oppenheimer’s annual base salary of $300,000, target bonus of 40% of his annual salary tobe pro rated for 2010 based on actual length of service pursuant to the 2010 CIP, eligibility for participation in the one-time 2010 special incentive bonus plan upto a level of $20,000 and grant of options to purchase 650,000 shares of our common stock vesting over four years. Mr. Oppenheimer’s agreement provides that ifwe terminate his employment without Cause, or if he terminates his employment with us for Good Reason, he will be entitled to a lump-sum severance paymentequal to six months of his then current base salary, as well as 50% of his target bonus, if any (subject to applicable tax withholdings), the payment of premiumsfor up to 12 months of group health plan coverage, assuming that Mr. Oppenheimer has timely elected COBRA continuation coverage, and up to nine monthsfrom his termination date to exercise any stock option in which he has vested as of his termination date (which is six months longer than his stock optionagreement would otherwise permit). In addition, if we terminate Mr. Oppenheimer’s employment without Cause, or if he terminates his employment with us forGood Reason, within one year following a Change of Control, in addition to the severance payments described above, all of Mr. Oppenheimer’s outstandingequity compensation awards will immediately vest. The foregoing separation payments and benefits are conditioned on Mr. Oppenheimer executing a generalrelease of claims in our favor. In the event any payment to Mr. Oppenheimer provided in the agreement would constitute a “parachute payment” as defined in280G(b)(2) of the Internal Revenue Code, then Mr. Oppenheimer will be entitled to receive the amount of such payment that would provide him the greatest after-tax benefit of either the full payment or a lesser payment which would result in no portion of such severance benefits being subject to excise tax.
Robert J. Sturgeon. We have entered into an employment agreement, dated September 17, 2007, amended and restated December 8, 2010, with RobertSturgeon, our Chief Delivery Officer. The agreement sets forth Mr. Sturgeon’s annual base salary of $275,000, target bonus of $225,000 and grant of options topurchase 525,000 shares of our common stock vesting over four years. Mr. Sturgeon’s agreement provides that if we terminate his employment without Cause, orif he terminates his employment with us for Good Reason, within one year following a Change of Control, his outstanding equity compensation awards willimmediately become vested in full. The foregoing acceleration benefit is conditioned on Mr. Sturgeon executing a general release of claims in our favor. In theevent any payment to Mr. Sturgeon provided in the agreement would constitute a “parachute payment” as
112

Table of Contents
defined in 280G(b)(2) of the Internal Revenue Code, then Mr. Sturgeon will be entitled to receive the amount of such payment that would provide him thegreatest after-tax benefit of either the full payment or a lesser payment which would result in no portion of such severance benefits being subject to excise tax.
Ganesh Bell. We have entered into an employment agreement, dated April 13, 2010, with Ganesh Bell, our Executive Vice President, Products, whocommenced employment in May 2010. The agreement sets forth Mr. Bell’s annual base salary of $260,000, target bonus of $117,000, to be pro rated based onactual length of service pursuant to the 2010 CIP, and grant of options to purchase 300,000 shares of our common stock vesting over four years. Mr. Bell’sagreement provides that if we terminate his employment without Cause, or if he terminates his employment with us for Good Reason, within one year following aChange of Control, his outstanding equity compensation awards will immediately become vested in full. The foregoing acceleration benefit is conditioned onMr. Bell executing a general release of claims in our favor. In the event any payment to Mr. Bell provided in the agreement would constitute a “parachutepayment” as defined in 280G(b)(2) of the Internal Revenue Code, then Mr. Bell will be entitled to receive the amount of such payment that would provide him thegreatest after-tax benefit of either the full payment or a lesser payment which would result in no portion of such severance benefits being subject to excise tax.
Raymond M. Martinelli. We have entered into an employment agreement, dated April 19, 2006, amended and restated December 8, 2010, with RaymondM. Martinelli, our Chief People Officer. The agreement sets forth Mr. Martinelli’s annual base salary of $270,000, potential bonus of $100,000 annually and grantof options to purchase 250,000 shares of our common stock vesting over four years. Mr. Martinelli’s agreement provides that if we terminate his employmentwithout Cause, or if he terminates his employment with us for Good Reason, within one year following a Change of Control, his outstanding equity compensationawards will immediately become vested in full. The foregoing acceleration benefit is conditioned on Mr. Martinelli executing a general release of claims in ourfavor. In the event any payment to Mr. Martinelli provided in the agreement would constitute a “parachute payment” as defined in 280G(b)(2) of the InternalRevenue Code, then Mr. Martinelli will be entitled to receive the amount of such payment that would provide him the greatest after-tax benefit of either the fullpayment or a lesser payment which would result in no portion of such severance benefits being subject to excise tax.
For purposes of the employment agreements described above, the following definitions apply:
“Change of Control” means the a sale of all or substantially all of our equity interests; a merger, consolidation or similar transaction involving us followingwhich the persons entitled to elect a majority of the members of our board of directors immediately before the transaction are not entitled to elect a majority of themembers of the board of directors of the surviving entity following the transaction; or a sale of all or substantially all of our assets.
“Cause” means (1) the employee’s commission of any felony or any crime involving fraud or dishonesty under the laws of the United States or any statethereof; (2) the employee’s commission of, or participation in, a fraud or act of dishonesty against us; (3) the employee’s intentional, material violation of anycontract or agreement between the employee and us or any statutory duty owed to us; (4) the employee’s unauthorized use or disclosure of Proprietary andConfidential Information; or (5) the employee’s gross misconduct.
“Good Reason” means the occurrence of any one of the following events without the employee’s written consent: (1) a material, adverse change in theemployee’s job title; (2) a material, adverse change in the employee’s job responsibilities; (3) any reduction in the employees’ base salary, target bonus oraggregate level of benefits; or (4) in most cases, a relocation of the employee’s principal place of employment beyond a specified radius of between 30 and 50miles from the company’s location at the time the agreement is entered into; provided that the employee has notified us in writing of the event described in (1),(2), (3) or (4) above and within 30 days thereafter we have to restore the executive to the appropriate job title, responsibility, compensation or location. In the caseof severance or vesting following a Change of Control, “Good Reason” is determined based on a change to the above factors as in effect immediately prior to aChange of Control.
113
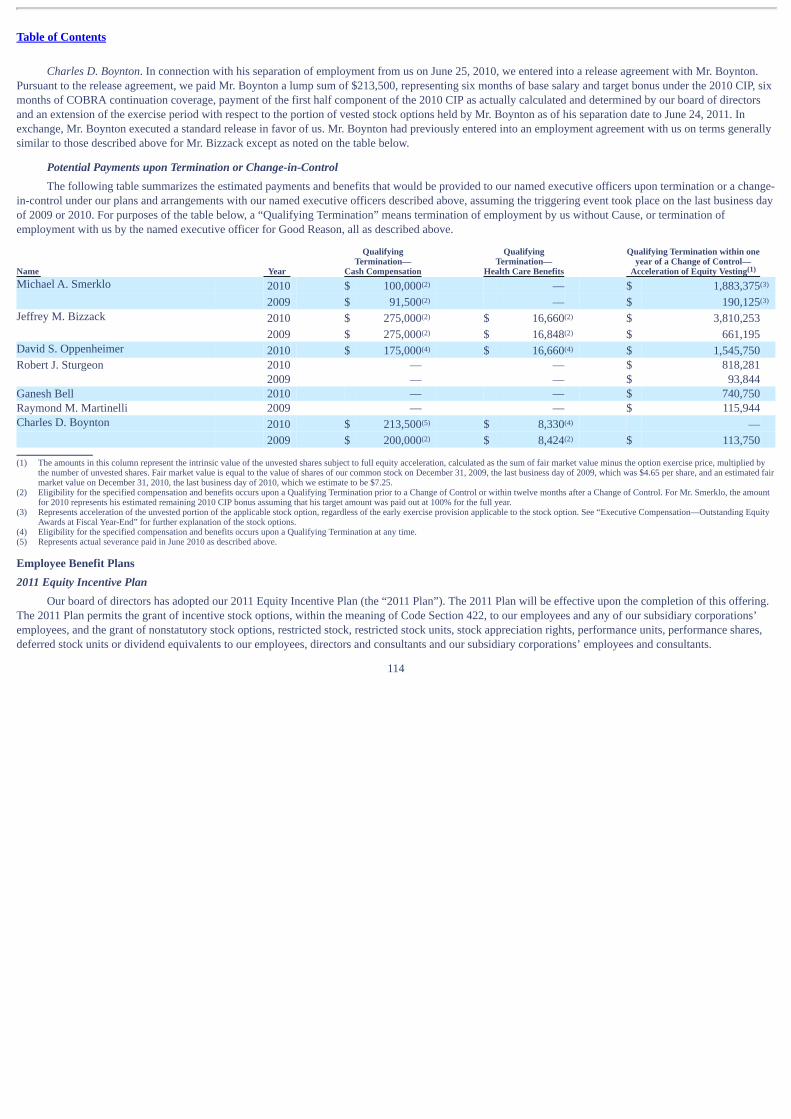
Table of Contents
Charles D. Boynton. In connection with his separation of employment from us on June 25, 2010, we entered into a release agreement with Mr. Boynton.Pursuant to the release agreement, we paid Mr. Boynton a lump sum of $213,500, representing six months of base salary and target bonus under the 2010 CIP, sixmonths of COBRA continuation coverage, payment of the first half component of the 2010 CIP as actually calculated and determined by our board of directorsand an extension of the exercise period with respect to the portion of vested stock options held by Mr. Boynton as of his separation date to June 24, 2011. Inexchange, Mr. Boynton executed a standard release in favor of us. Mr. Boynton had previously entered into an employment agreement with us on terms generallysimilar to those described above for Mr. Bizzack except as noted on the table below.
Potential Payments upon Termination or Change-in-Control The following table summarizes the estimated payments and benefits that would be provided to our named executive officers upon termination or a change-in-control under our plans and arrangements with our named executive officers described above, assuming the triggering event took place on the last business dayof 2009 or 2010. For purposes of the table below, a “Qualifying Termination” means termination of employment by us without Cause, or termination ofemployment with us by the named executive officer for Good Reason, all as described above.
Name Year
QualifyingTermination—
Cash Compensation
QualifyingTermination—
Health Care Benefits
Qualifying Termination within oneyear of a Change of Control—
Acceleration of Equity Vesting Michael A. Smerklo 2010 $ 100,000 –– $ 1,883,375
2009 $ 91,500 –– $ 190,125 Jeffrey M. Bizzack 2010 $ 275,000 $ 16,660 $ 3,810,253
2009 $ 275,000 $ 16,848 $ 661,195 David S. Oppenheimer 2010 $ 175,000 $ 16,660 $ 1,545,750 Robert J. Sturgeon 2010 — — $ 818,281
2009 — — $ 93,844 Ganesh Bell 2010 — — $ 740,750 Raymond M. Martinelli 2009 — — $ 115,944 Charles D. Boynton 2010 $ 213,500 $ 8,330 —
2009 $ 200,000 $ 8,424 $ 113,750 (1) The amounts in this column represent the intrinsic value of the unvested shares subject to full equity acceleration, calculated as the sum of fair market value minus the option exercise price, multiplied by
the number of unvested shares. Fair market value is equal to the value of shares of our common stock on December 31, 2009, the last business day of 2009, which was $4.65 per share, and an estimated fairmarket value on December 31, 2010, the last business day of 2010, which we estimate to be $7.25.
(2) Eligibility for the specified compensation and benefits occurs upon a Qualifying Termination prior to a Change of Control or within twelve months after a Change of Control. For Mr. Smerklo, the amountfor 2010 represents his estimated remaining 2010 CIP bonus assuming that his target amount was paid out at 100% for the full year.
(3) Represents acceleration of the unvested portion of the applicable stock option, regardless of the early exercise provision applicable to the stock option. See “Executive Compensation—Outstanding EquityAwards at Fiscal Year-End” for further explanation of the stock options.
(4) Eligibility for the specified compensation and benefits occurs upon a Qualifying Termination at any time.(5) Represents actual severance paid in June 2010 as described above. Employee Benefit Plans 2011 Equity Incentive Plan Our board of directors has adopted our 2011 Equity Incentive Plan (the “2011 Plan”). The 2011 Plan will be effective upon the completion of this offering.The 2011 Plan permits the grant of incentive stock options, within the meaning of Code Section 422, to our employees and any of our subsidiary corporations’employees, and the grant of nonstatutory stock options, restricted stock, restricted stock units, stock appreciation rights, performance units, performance shares,deferred stock units or dividend equivalents to our employees, directors and consultants and our subsidiary corporations’ employees and consultants.
114
(1)
(2) (3)
(2) (3)
(2) (2)
(2) (2)
(4) (4)
(5) (4)
(2) (2)

Table of Contents
Shares Under the Plan. The maximum aggregate number of shares issuable under the 2011 Plan is 5,760,000 shares of our common stock. In addition,shares issuable under the 2011 Plan will include (i) any shares that, as of the completion of this offering, have been reserved but not issued pursuant to awardsgranted under our 2004 Omnibus Share Plan (the “2004 Plan”) or 2008 Share Option Plan (the “2008 Plan”) and are not subject to any awards granted thereunder,(ii) any shares subject to stock options or similar awards granted under the 2004 Plan or 2008 Plan that expire or terminate without having been exercised in fulland (iii) any unvested shares issued pursuant to awards granted under the 2004 Plan or 2008 Plan that are forfeited to or repurchased by us, with the maximumnumber of shares to be added to the 2011 Plan pursuant to (i) through (iii) above equal to 20,462,031 shares. In addition, the number of shares available forissuance under the 2011 Plan will be annually increased on the first day of each of our fiscal years, beginning with 2012, by an amount equal to the least of: • 3,840,000 shares; • 4% of the outstanding shares of our common stock as of the last day of our immediately preceding fiscal year; or • such other amount as our board of directors may determine.
Shares issued pursuant to awards under the 2011 Plan that we repurchase or that expire or are forfeited, as well as shares tendered in payment of theexercise price of an award or to satisfy the tax withholding obligations related to an award, will become available for future grant or sale under the 2011 Plan. Inaddition, to the extent that an award is paid out in cash rather than shares, such cash payment will not reduce the number of shares available for issuance under the2011 Plan.
Plan Administration. The 2011 Plan will be administered by our board of directors which, at its discretion or as legally required, may delegate suchadministration to our compensation committee and/or one or more additional committees (referred to as the “Administrator”). In the case of awards intended toqualify as “performance-based compensation” within the meaning of Code Section 162(m), the committee will consist of two or more “outside directors” withinthe meaning of Code Section 162(m).
Subject to the provisions of the 2011 Plan, the Administrator has the power to determine the terms of awards, including the recipients, the exercise price, ifany, the number of shares covering each award, the fair market value of a share of our common stock, the vesting schedule applicable to the awards, together withany vesting acceleration, the form of consideration, if any, payable upon exercise of the award and the terms of the award agreement for use under the 2011 Plan.The Administrator also has the authority, subject to the terms of the 2011 Plan, to amend existing awards to reduce or increase their exercise price, to allowparticipants the opportunity to transfer outstanding awards to a financial institution or other person or entity selected by the Administrator, to institute anexchange program by which outstanding awards may be surrendered in exchange for awards that may have different exercise prices and terms, to prescribe rulesand to construe and interpret the 2011 Plan and awards granted under the 2011 Plan.
Stock Options. The Administrator may grant incentive and/or nonstatutory stock options under the 2011 Plan, provided that incentive stock options are onlygranted to employees. The exercise price of such options must equal at least the fair market value of our common stock on the date of grant. The term of anincentive stock option may not exceed ten years; provided, however, that an incentive stock option held by a participant who owns more than 10% of the totalcombined voting power of all classes of our common stock, or of certain of our subsidiary corporations, may not have a term in excess of five years and musthave an exercise price of at least 110% of the fair market value of our common stock on the grant date. The Administrator will determine the methods of paymentof the exercise price of an option, which may include cash, shares, broker-assisted cashless exercise or other consideration permitted by applicable law andacceptable to the Administrator. Subject to the provisions of the 2011 Plan, the Administrator determines the remaining terms of the options (e.g., vesting). Afterthe termination of service of an employee, director or consultant, the participant may exercise his or her options, to the extent vested as of such date oftermination, for the period of time stated in his or her award
115

Table of Contents
agreement. However, in no event may an option be exercised later than the expiration of its term. The specific terms will be set forth in an award agreement.
Restricted Stock. Restricted stock may be granted under the 2011 Plan. Restricted stock awards are grants of shares of our common stock that are subject tovarious restrictions, including restrictions on transferability and forfeiture provisions. Shares of restricted stock will vest, and the restrictions on such shares willlapse, in accordance with terms and conditions established by the Administrator. The Administrator, in its sole discretion, may accelerate the time at which anyrestrictions will lapse or be removed. Recipients of restricted stock awards generally will have voting and dividend rights with respect to such shares upon grantwithout regard to vesting, unless the Administrator provides otherwise. Shares of restricted stock that do not vest for any reason will be forfeited by the recipientand will revert to us. The specific terms will be set forth in an award agreement.
Restricted Stock Units. Restricted stock units may be granted under the 2011 Plan. Each restricted stock unit granted is a bookkeeping entry representing anamount equal to the fair market value of one share of our common stock. The Administrator determines the terms and conditions of restricted stock unitsincluding the vesting criteria, which may include achievement of specified performance criteria or continued service to us, and the form and timing of payment.The Administrator, in its sole discretion, may reduce or waive any vesting criteria that must be met to receive a payout. The Administrator determines in its solediscretion whether an award will be settled in stock, cash or a combination of both. The specific terms will be set forth in an award agreement.
Stock Appreciation Rights. Stock appreciation rights may be granted under the 2011 Plan. Stock appreciation rights allow the recipient to receive theappreciation in the fair market value of our common stock between the exercise date and the date of grant. Subject to the provisions of the 2011 Plan, theAdministrator determines the terms of stock appreciation rights, including when such rights vest and become exercisable and whether to settle such awards incash or with shares of our common stock, or a combination thereof, except that the per share exercise price for the shares to be issued pursuant to the exercise of astock appreciation right will be no less than 100% of the fair market value per share on the date of grant. The specific terms will be set forth in an awardagreement.
Performance Units/Performance Shares. Performance units and performance shares may be granted under our 2011 Plan. Performance units andperformance shares are awards that will result in a payment to a participant only if performance goals established by the Administrator are achieved or the awardsotherwise vest. The Administrator determines the terms and conditions of performance units and performance shares including the vesting criteria, which mayinclude achievement of specified performance criteria or continued service, which, depending on the extent to which they are met, will determine the numberand/or value of performance units and performance shares to be paid out to participants. After the grant of a performance unit or performance share, theAdministrator, in its sole discretion, may reduce or waive any performance objectives or other vesting provisions for such performance units or performanceshares. Performance units shall have an initial dollar value established by the Administrator prior to the grant date. Performance shares will have an initial valueequal to the fair market value of our common stock on the grant date. The Administrator, in its sole discretion, may pay earned performance units or performanceshares in the form of cash, in shares or in any combination thereof. The specific terms will be set forth in an award agreement.
Deferred Stock Units. Deferred Stock Units may be granted under the 2011 Plan. Deferred Stock Units are restricted shares, restricted stock units,performance shares or performance units granted under the 2011 Plan that the Administrator permits to be paid out on an installment or deferred basis, inaccordance with rules and procedures determined by the Administrator.
Dividend Equivalents. Dividend Equivalents may be granted under the 2011 Plan. Dividend Equivalents are credits, paid in cash, equal to the amount ofcash dividends paid on shares represented by awards held by participants. Dividend Equivalents may be subject to the same vesting restrictions as the sharessubject to an award.
116

Table of Contents
Transferability of Awards. Unless the Administrator provides otherwise, the 2011 Plan generally does not allow for the transfer of awards and only therecipient of an option or stock appreciation right may exercise such an award during his or her lifetime.
Certain Adjustments. In the event of certain changes in our capitalization, to prevent diminution or enlargement of the benefits or potential benefitsavailable under the 2011 Plan, the Administrator will make adjustments to one or more of the number and class of shares that may be delivered under the 2011Plan and/or the number, class and price of shares covered by each outstanding award. In the event of a proposed dissolution or liquidation, the Administrator willnotify participants as soon as practicable prior to the effective date of such proposed transaction, and all awards, to the extent not previously exercised, willterminate immediately prior to the consummation of such proposed transaction.
Merger or Change in Control. The 2011 Plan provides that in the event of a merger or Change in Control, as defined under the 2011 Plan, each outstandingaward will be treated as the Administrator determines, except that if a successor corporation or its parent or subsidiary does not assume or substitute an equivalentaward for any outstanding award, then such award will fully vest, all restrictions on such award will lapse, all performance goals or other vesting criteriaapplicable to such award will be deemed achieved at 100% of target levels and such award will become fully exercisable, if applicable, for a specified periodprior to the transaction. The award will then terminate to the extent unexercised upon the expiration of the specified period of time. If the service of an outsidedirector is terminated on or following a merger or Change in Control, other than pursuant to a voluntary resignation, his or her awards will become fully vestedand exercisable, and all performance goals or other vesting requirements will be deemed achieved at 100% of target levels.
Clawback Requirement. The 2011 Plan provides that if the company is required to restate its financial statements due to material noncompliance withfinancial reporting requirements under the securities laws, executive officers will be required to repay compensation received pursuant to awards under the 2011Plan during the three years preceding the restatement that is in excess of the amount to which they would be entitled under the restated financial statements, inaccordance with Section 10D of the Securities Exchange Act of 1934.
Plan Amendment, Termination. Our board of directors has the authority to amend, alter, suspend or terminate the 2011 Plan provided such action does notimpair the existing rights of any participant. The 2011 Plan will automatically terminate in 2021, unless terminated earlier by our board of directors. 2011 Employee Stock Purchase Plan Our board of directors adopted, and our stockholders approved, our 2011 Employee Stock Purchase Plan in February 2011. Our executive officers and allof our other employees will be allowed to participate in our 2011 Employee Stock Purchase Plan, which will be offered effective upon the completion of thisoffering. We believe that providing them the opportunity to participate in the 2011 Employee Stock Purchase Plan provides them with a further incentive towardsensuring our success and accomplishing our corporate goals. The specific provisions of our 2011 Employee Stock Purchase Plan are as provided for below.
A total of 900,000 shares of our common stock will be made available for sale under the plan. In addition, our 2011 Employee Stock Purchase Planprovides for annual increases in the number of shares available for issuance under the 2011 Employee Stock Purchase Plan on the first day of each fiscal yearbeginning in 2012, equal to the lesser of: • 1% of the outstanding shares of our common stock on the last day of the immediately preceding fiscal year; • 1,500,000 shares; or • such other amount as may be determined by our board of directors.
117

Table of Contents
Our compensation committee administers the 2011 Employee Stock Purchase Plan. Our compensation committee has full and exclusive authority tointerpret the terms of the 2011 Employee Stock Purchase Plan and determine eligibility to participate subject to the conditions of our 2011 Employee Stock Planas described below.
All of our employees are eligible to participate if they are employed by us, or any participating subsidiary, for at least 20 hours per week and more thanfive months in any calendar year. However, an employee may not be granted an option to purchase stock under the 2011 Employee Stock Purchase Plan ifsuch employee:
• immediately after the grant would own stock possessing 5% or more of the total combined voting power or value of all classes of our capitalstock; or
• hold rights to purchase stock under all of our employee stock purchase plans that accrue at a rate that exceeds $25,000 worth of stock for eachcalendar year.
Our 2011 Employee Stock Purchase Plan is intended to qualify under Section 423 of the Code. Each offering period includes purchase periods, which will
be the approximately six-month periods commencing with one exercise date and ending with the next exercise date. The offering periods are scheduled to start onthe first trading day on or after February 15 and August 15 of each year, except for the first such offering period, which will commence on the first trading day onor after completion of this offering and will end on the first trading day on or after August 15, 2011.
Our 2011 Employee Stock Purchase Plan permits participants to purchase common stock through payroll deductions of up to 10% of their eligiblecompensation, which includes a participant’s base salary, incentive compensation, bonuses and certain other compensation. A participant may purchase amaximum of 1,000 shares during a six-month purchase period. Amounts deducted and accumulated by the participant are used to purchase shares of our commonstock at the end of each six-month purchase period.
The purchase price of the shares will be 85% of the lower of the fair market value of our common stock on the first trading day of each offering period oron the exercise date. Participants may end their participation at any time during an offering period, and will be paid their accrued payroll deductions that have notyet been used to purchase shares of common stock. Participation ends automatically upon termination of employment with us.
A participant may not transfer rights granted under the 2011 Employee Stock Purchase Plan other than by will, the laws of descent and distribution, or asotherwise provided under the 2011 Employee Stock Purchase Plan.
In the event of our merger or change in control, as defined under the 2011 Employee Stock Purchase Plan, a successor corporation may assume orsubstitute for each purchase right. If the successor corporation refuses to assume or substitute for the purchase rights under the plan, the offering period then inprogress will be shortened, and a new exercise date will be set. The administrator will notify each participant that the exercise date has been changed and that theparticipant’s election to purchase will be exercised automatically on the new exercise date unless prior to such date the participant has withdrawn from theoffering period.
Our 2011 Employee Stock Purchase Plan will automatically terminate in 2021, unless we terminate it sooner. Our board of directors has the authority toamend, suspend or terminate our 2011 Employee Stock Purchase Plan, except that, subject to certain exceptions described in the 2011 Employee Stock PurchasePlan, no such action may adversely affect any outstanding rights to purchase stock under our 2011 Employee Stock Purchase Plan. 2008 Share Option Plan The 2008 Plan was adopted by our board of directors in December 2008 and approved by our equityholders in December 2008. The 2008 Plan was mostrecently amended in February 2009 to permit transfers of options for
118

Table of Contents
estate planning purposes. The 2008 Plan provides for the grant of stock options to our employees, directors and consultants and any of our subsidiary’s employeesand consultants. As of the effective date of this offering, the 2008 Plan will be terminated and we will not grant any additional awards under the 2008 Plan.However, the 2008 Plan will continue to govern the terms and conditions of outstanding awards granted thereunder.
Shares Under the Plan. As of December 31, 2010, there were 10,177,171 options to purchase shares of our common stock outstanding and 2,871,848shares were available for future grant under the 2008 Plan. Shares subject to options that expire or become unexercisable without having been exercised in full, orthat are used to pay the exercise price of an option or to satisfy the tax withholding obligations related to an option (including any shares subject to options orsimilar awards granted under our 2004 Plan that expire or terminate without having been forfeited to or repurchased by us), will become available for future grantunder the 2008 Plan, or, following this offering, under the 2011 Plan.
Plan Administration. Our board of directors or a committee appointed by our board of directors administers the 2008 Plan. Under the 2008 Plan, theadministrator has the power to determine the terms of the options, including the recipients, the exercise price, the number of shares covering each option award,the fair market value of a share of our common stock, the form of consideration payable upon exercise of the option and the terms of the option agreement for useunder the 2008 Plan. The administrator also has the authority, subject to the terms of the 2008 Plan, to amend existing options (including to reduce the option’sexercise price), to institute an exchange program by which outstanding options may be surrendered in exchange for options that may have different exerciseprices and terms, to prescribe rules and to construe and interpret the 2008 Plan and options granted under the 2008 Plan.
Option Terms. The 2008 Plan permits the grant of stock options. The exercise price of such options must at least be equal to 100% of the fair market valueof our common stock on the date of grant, and the term of the options may not exceed ten years. After termination of service of an employee, director orconsultant, he or she may exercise his or her options, to the extent vested and exercisable as of such date of termination, for the period of time stated in the optionagreement (which period of time must be at least three months). If termination is due to disability, or in the event of death, the options will remain exercisable fortwelve months. However, in each case, an option may not be exercised later than the expiration of its term. The 2008 Plan generally does not allow for the transferof options other than by will or the laws of descent and distribution, as permitted by Rule 701 under the Securities Act or into trust for estate planning purposes,unless the administrator otherwise determines.
Certain Adjustments. In the event of certain changes in our capitalization, the administrator will make adjustments to the number and class of shares andexercise price of shares subject to outstanding options and the number and class of shares that may be delivered under the 2008 Plan. In the event of a proposedliquidation or dissolution, the administrator will notify participants as soon as practicable and all options will terminate to the extent unexercised immediatelyprior to the consummation of such proposed transaction.
Merger or Change in Control. The 2008 Plan provides that in the event of our merger or change in control, the successor corporation or its parent orsubsidiary will assume or substitute an equivalent award for each outstanding option. If there is no assumption or substitution of outstanding options, the optionswill become fully vested and exercisable. In addition, the administrator will notify participants in writing or electronically that options under the 2008 Plan will beexercisable for a period of time determined by the administrator, and will terminate to the extent unexercised upon expiration of such period.
Plan Amendment, Termination. Our board of directors has the authority to amend or terminate the 2008 Plan provided such action does not impair the rightsof any participant, and subject to approval by our members, as defined in the LLC Agreement, if required by law. The 2008 Plan will terminate as of the effectivedate of this offering, unless terminated earlier by our board of directors.
119

Table of Contents
2004 Omnibus Share Plan The 2004 Plan was adopted by our board of directors and approved by our equityholders in May 2004. The 2004 Plan was most recently amended inFebruary 2009 to permit transfers of options for estate planning purposes. The 2004 Plan expired in December 2008 upon adoption of the 2008 Plan. However,the 2004 Plan will continue to govern the terms and conditions of outstanding awards granted thereunder. The 2004 Plan provided for the grant of stock optionsand restricted stock to employees, officers, directors and consultants of us and our related companies.
Shares Under the Plan. As of December 31, 2010, there were 7,545,776 options to purchase shares of our common stock outstanding under the 2004 Plan.Shares subject to options or restricted stock that expire or otherwise terminate without having been forfeited to or repurchased by us will become available forfuture grant under the 2008 Plan, or, following this offering, under the 2011 Plan.
Plan Administration. Our board of directors or a committee appointed by our board of directors administered the 2004 Plan. Under the 2004 Plan, theadministrator had the power to determine the terms and conditions of the awards, including the recipients, the exercise price, the number of shares covering eachaward and the vesting schedule of awards. The administrator also had the authority, subject to the terms of the 2004 Plan, to prescribe rules and to construe andinterpret the 2004 Plan and awards granted under the 2004 Plan.
Option Terms. The 2004 Plan permitted the grant of stock options. The exercise price of such options had to be at least equal to 85% of the fair marketvalue of a share of our common membership interests on the date of grant except that the price could not be less than 110% of such fair market value with respectto any person who owned securities of more than 10% of the total combined voting power of all classes of our securities and any securities of our subsidiaries.The option term may not exceed ten years.
After termination of continuous service with us or a related company, an optionee may exercise his or her option, to the extent vested as of such date oftermination, for the period of time stated in the option agreement (which period of time must not be less than 30 days and will be three months if no period isspecified). Generally, if termination is due to disability, or in the event of death, the options will remain exercisable for one year. However, an option may not beexercised later than the expiration of its term. The 2004 Plan generally does not allow for the transfer of options other than by will or the laws of descent anddistribution, and during the optionee’s lifetime, may only be exercised by the optionee.
Restricted Stock. The 2004 Plan permitted the grant of restricted stock awards. After the administrator determined that it would grant a restricted stockaward, the terms, conditions and restrictions related to the award were set forth in a restricted stock agreement. The 2004 Plan generally does not allow thetransfer of restricted stock other than by will or the laws of descent and distribution, unless the administrator determines otherwise.
Certain Adjustments. In the event of certain changes in our capitalization, the administrator will make adjustments to the number and type of shares andexercise price of shares subject to outstanding options and the number and type of shares that may be delivered under the 2004 Plan. If we issue any of our sharesas a share dividend while options are outstanding, then each optionee, upon exercising such outstanding option, will receive such share dividends that weredeclared or paid while the option was outstanding.
Merger or Other Transaction. The 2004 Plan provides that in the event of our merger into or consolidation with another entity in which we are not thesurviving entity, or we are liquidated or we sell or dispose of all or substantially all of our assets to another entity, then the administrator will determine thetreatment of awards, which may be any of the following: (i) subject to (iii) through (v) below, upon exercise of options, optionees may receive the sameconsideration as holders of our common stock receive pursuant to the transaction, (ii) all options will become fully vested, (iii) all optionees will be given a 30-day period prior to the transaction to exercise their options in full, subsequent to which all unexercised options will be cancelled, (iv) optionees may exercise their
120

Table of Contents
options prior to the transaction to the extent such options otherwise are exercisable according to their vesting schedule, and all options will be cancelled uponconsummation of the transaction, or (v) all options are cancelled in exchange for payment of the value of the option minus the exercise price.
Plan Amendment, Termination. Our board of directors has the authority to amend or terminate the 2004 Plan provided such action does not adversely affectthe rights of any award holder. The 2004 Plan terminated in December 2008 upon adoption of the 2008 Plan. 401(k) Plan We have established a tax-qualified Section 401(k) retirement savings plan for all employees who satisfy certain eligibility requirements. Under this plan,participants may elect to make pre-tax contributions to the plan of up to a certain portion of their current compensation, not to exceed the applicable statutoryincome tax limitation. Currently, we match contributions made by participants in an amount up to $2,000 per annum. We intend for the plan to qualify underSection 401(a) of the Internal Revenue Code, such that contributions to the plan, and income earned on those contributions, are not taxable to participants untilwithdrawn from the plan. Limitation on Liability and Indemnification Matters Our certificate of incorporation, which will be in effect upon the completion of this offering, contains provisions that limit the liability of our directors formonetary damages to the fullest extent permitted by Delaware law. Consequently, our directors will not be personally liable to us or our stockholders formonetary damages for any breach of fiduciary duties as directors, except liability for: • any breach of the director’s duty of loyalty to us or our stockholders; • any act or omission not in good faith or that involves intentional misconduct or a knowing violation of law;
• unlawful payments of dividends or unlawful stock repurchases or redemptions as provided in Section 174 of the Delaware General Corporation Law;or
• any transaction from which the director derived an improper personal benefit.
Our certificate of incorporation and bylaws to be in effect upon the completion of this offering provide that we are required to indemnify our directors andofficers, in each case to the fullest extent permitted by Delaware law. Our bylaws also provide that we are obligated to advance expenses incurred by a director orofficer in advance of the final disposition of any action or proceeding, and permit us to secure insurance on behalf of any officer, director, employee or other agentfor any liability arising out of his or her actions in that capacity regardless of whether we would otherwise be permitted to indemnify him or her under theprovisions of Delaware law. We have entered and expect to continue to enter into agreements to indemnify our directors, executive officers and other employeesas determined by our board of directors. With specified exceptions, these agreements provide for indemnification for related expenses including, among otherthings, attorneys’ fees, judgments, fines and settlement amounts incurred by any of these individuals in any action or proceeding. We believe that these certificateof incorporation and bylaw provisions and indemnification agreements are necessary to attract and retain qualified persons as directors and officers. We alsomaintain directors’ and officers’ liability insurance.
The limitation of liability and indemnification provisions in our certificate of incorporation and bylaws may discourage stockholders from bringing alawsuit against our directors and officers for breach of their fiduciary duty. They may also reduce the likelihood of derivative litigation against our directors andofficers, even though an action, if successful, might benefit us and other stockholders. Further, a stockholder’s investment may be adversely affected to the extentthat we pay the costs of settlement and damage awards against directors and officers as required by these indemnification provisions. At present, there is nopending litigation or proceeding involving any of our directors, officers or employees for which indemnification is sought, and we are not aware of any threatenedlitigation that may result in claims for indemnification.
121

Table of Contents
CERTAIN RELATIONSHIPS AND RELATED PARTY TRANSACTIONS
The following is a description of certain relationships and transactions since January 1, 2007 involving our directors, executive officers, beneficial holdersof more than 5% of our capital stock, or entities affiliated with them. Conversion to a Corporation On the date hereof, we converted from a Delaware limited liability company into a Delaware corporation and changed our name from ServiceSourceInternational, LLC to ServiceSource International, Inc. This conversion to a corporate form in connection with this offering occurred pursuant to our LimitedLiability Company Agreement (“LLC Agreement”) and has been approved by our board of directors. As a result, we entered into a conversion agreement withcertain of our equityholders that provided that the conversion to a corporation take the form of a statutory conversion, and also provided that the conversion occurprior to the declaration of effectiveness by the SEC of our registration statement related to this offering without any further action on the part of our board ofdirectors or equityholders. In conjunction with the Conversion, all of our outstanding common shares automatically converted into shares of our common stockbased on their relative rights as set forth in our LLC Agreement. See “Description of Capital Stock” for additional information regarding a description of theterms of our common stock following the Conversion and the terms of our certificate of incorporation and bylaws as will be in effect upon the closing of thisoffering. Also, as part of the Conversion and as contemplated by our LLC Agreement, two of our equityholders, GA SS Holding LLC, and entities controlled byinvestment funds controlled by General Atlantic LLC, and SSLLC Holdings, Inc., controlled by Benchmark Capital, have each elected to merge with and intoServiceSource International, Inc. In the merger, the equity interests of GA Holdings LLC and SSLLC Holdings, Inc. were canceled and extinguished in exchangefor shares of common stock of ServiceSource International, Inc. In the merger agreement, the companies that merged into us represented and warranted that theydid not have any liabilities, operations or businesses other than activities related to holding our common stock and other than liabilities for certain tax matters withrespect to the periods prior to the merger which are not yet due and payable, and will provide us with certain indemnities. Concurrently with the consummation ofthe conversion to a corporation, the LLC Agreement was terminated other than certain provisions relating to certain pre-termination tax matters and liabilities.
ServiceSource International, LLC may be required to make tax distributions to these equityholders for the portion of 2011 prior to the Conversion. Thesedistributions would be made within 90 days after the Conversion. ServiceSource International, LLC does not expect to make further tax distribution with respectto 2010 in 2011. Transactions with Directors and Their Affiliates A member of our board of directors, Thomas Mendoza, is the former President and current Vice Chairman of NetApp, a customer of ours. Our revenuesfrom NetApp were $0, $0, $0.4 million and $5.1 million in 2007, 2008, 2009 and 2010, respectively. Historical Transactions Registration Rights Agreements We have entered into a Registration and Information Rights Agreement with GA SS Holding LLC, and entities controlled by investment funds controlledby General Atlantic, LLC, SSLLC Holdings, Inc., controlled by Benchmark Capital, and certain entities affiliated with Housatonic Partners, each a holder of ourcommon stock. We have also entered into a securities purchase agreement that includes registration rights with certain of our stockholders. These agreementsprovide for certain rights relating to the registration of their shares of common stock. See “Description of Capital Stock—Registration Rights” below foradditional information. In addition, these agreements provide for certain information rights. Following the completion of this offering, these agreements willcontinue in effect.
122

Table of Contents
LLC Agreement Our directors and members entered into the LLC Agreement which governs our operations. On the date hereof, we converted into a corporation, and theLLC Agreement no longer governs our operations and does not govern the rights of our stockholders.
ServiceSource International, LLC created a board of directors to manage our business affairs. Under the LLC Agreement, there shall be up to a maximumof nine directors of the board of directors and the specific number of directors shall be set by resolution of the board of directors. Pursuant to the LLC Agreement,each member shall vote to cause and to maintain the election to the board of directors one director selected by GA SS Holding LLC, one director selected byHousatonic Equity Investors SBIC, L.P. and Housatonic Micro Fund SBIC, L.P., and one director selected by SSLLC Holdings, Inc. or its affiliates. Theremainder of the directors shall be selected by the holders of a majority of the then outstanding common shares.
Under the LLC Agreement, there is one class of shares designated as common shares. Each equityholder has one vote for each common share held. TheLLC Agreement also sets forth the rights of and restrictions on common shareholders, including certain rights of first refusal in favor of us and our ChiefExecutive Officer with respect to proposed transfers of common shares held by any officer of ServiceSource International, LLC, and certain preemptive and co-sale rights in favor of each member holding at least 5% of the equity securities of ServiceSource International, LLC that are not subject to vesting forfeiture orrepurchase conditions. In addition, the LLC Agreement places certain transfer restrictions on the holders of common shares. The LLC agreement also authorizescertain equity incentive plans pursuant to which unvested common shares have been granted. In accordance with the LLC Agreement, the common shares will beconverted into shares of our common stock in connection with the Conversion. The LLC Agreement includes indemnification provisions obligatingServiceSource International, LLC to indemnify its board of directors, officers, members, employees and agents.
Concurrently with the consummation of the Conversion on the date hereof, the LLC Agreement terminated other than certain provisions relating to certainpre-termination tax matters and liabilities and certain indemnification provisions. Policies and Procedures for Related Party Transactions We have adopted a formal written policy that our executive officers, directors, holders of more than 5% of any class of our voting securities, and anymember of the immediate family of and any entity affiliated with any of the foregoing persons, are not permitted to enter into a related party transaction with uswithout the prior consent of our audit committee, or other independent members of our board of directors in situations in which it is inappropriate for our auditcommittee to review such transaction due to a conflict of interest. Any request for us to enter into a transaction with an executive officer, director, principalstockholder, or any of their immediate family members or affiliates, in which the amount involved exceeds $120,000, must first be presented to our auditcommittee for review, consideration and approval. In approving or rejecting any such proposal, our audit committee is to consider the relevant facts andcircumstances available and deemed relevant to the audit committee, including, but not limited to, whether the transaction is on terms no less favorable than termsgenerally available to an unaffiliated third party under the same or similar circumstances and the extent of the related party’s interest in the transaction. All of thetransactions described above were entered into prior to the adoption of this policy.
123

Table of Contents
PRINCIPAL AND SELLING STOCKHOLDERS
The following table sets forth information regarding beneficial ownership of our common stock as of December 31, 2010, after giving effect to theConversion, and as adjusted to reflect the shares of common stock to be issued and sold in the offering assuming no exercise of the underwriters’ overallotmentoption, by: • each person or group of affiliated persons known by us to be the beneficial owner of more than 5% of our common stock; • each of our named executive officers; • each of our directors; • all executive officers and directors as a group; and • all selling stockholders.
This beneficial ownership information is presented on the following bases: We have determined beneficial ownership in accordance with SEC rules. The information does not necessarily indicate beneficial ownership for any otherpurpose. Under these rules, the number of shares of common stock deemed outstanding includes shares issuable upon exercise of options held by the respectiveperson or group which may be exercised within 60 days after December 31, 2010. For purposes of calculating each person’s or group’s percentage ownership,stock options exercisable within 60 days after December 31, 2010 are included for that person or group. These shares are not deemed outstanding, however, forthe purpose of calculating the percentage ownership of any other person or group.
Applicable percentage ownership is based on 57,506,343 shares of common stock outstanding at December 31, 2010 after giving effect to the Conversion.For purposes of the table below, we have assumed that 65,506,343 shares of common stock will be outstanding upon completion of this offering.
124

Table of Contents
Unless otherwise indicated by the footnotes below and subject to applicable community property laws, to our knowledge, each stockholder named in thefollowing table possesses sole voting and investment power over the shares listed. Unless otherwise indicated by the footnotes below, the address of each personlisted in the table is c/o ServiceSource, 634 Second Street, San Francisco, California 94107.
Shares beneficially
owned prior to the offering
Numberof shares
beingoffered
Shares beneficially
owned after the offering Name of beneficial owner Number Percentage Number Percentage 5% Stockholders: GA SS Holding II LLC 15,553,573 27.0 2,000,000 13,553,573 20.7 Benchmark Capital Partners V, L.P. 11,150,740 19.4 0 11,150,740 7.0 Entities affiliated with Housatonic Partners 9,552,500 16.6 0 9,552,500 14.6 Michael A. Smerklo 4,663,705 7.8 500,000 4,163,705 6.2
Executive Officers and Directors: Michael A. Smerklo 4,663,705 7.8 500,000 4,163,705 6.2 Jeffrey M. Bizzack 706,405 1.2 0 706,405 1.1 David S. Oppenheimer 0 * 0 0 * Charles D. Boynton 260,416 * 0 260,416 * Robert J. Sturgeon 572,395 * 0 572,395 * Ganesh Bell 0 * 0 0 * Steven M. Cakebread 76,956 * 0 76,956 * Marc F. McMorris 15,553,573 27.0 2,000,000 13,553,573 20.7 Bruce W. Dunlevie 11,150,740 19.4 0 11,150,740 17.0 Anthony Zingale 112,607 * 0 112,607 * James C. Madden, V 150,000 * 0 150,000 * Barry D. Reynolds 9,552,500 16.6 0 9,552,500 14.6 Thomas F. Mendoza 0 * 0 0 * All executive officers and directors as a group (15 persons) 43,145,651 70.0 2,500,000 40,645,651 58.3
Other Selling Stockholders: Kennedy Family Trust u/a/d, July 2, 2005 1,518,573 2.6 197,414 1,321,159 2.0 The Matthew Burr 1985 Trust dated November 7, 1985 1,110,312 1.9 144,341 965,971 1.5 The Lander Burr 1985 Trust dated November 7, 1985 1,110,312 1.9 144,341 965,971 1.5 William L. Thornton Trust dated July 30, 2008 890,258 1.5 115,734 774,524 1.2 Russell James Ellis 550,000 1.0 71,500 478,500 * Aspen Florence Group, L.P. 510,875 * 66,414 444,461 * AOC Partners #1, LP 510,000 * 66,300 443,700 * Kennedy Family Irrevocable Trust u/a/d October 22, 2005 500,000 * 65,000 435,000 * The Dooley Family Trust dated September 11, 1997 425,000 * 55,250 369,750 * William P. Egan 333,750 * 43,388 290,362 * William P. Egan 2010 Qualified Annuity Trust - ServiceSource International,
LLC dated August 23, 2010 333,750 * 43,388 290,362 * Ross M. Jones 250,000 * 32,500 217,500 * Robert J. Small 250,000 * 32,500 217,500 * Garth H. Greimann 250,000 * 32,500 217,500 * Kevin T. Callaghan 250,000 * 32,500 217,500 * William P. Egan 1985 Children’s Trust f/b/o Kristen Reed dated December 16,
1985 225,000 * 29,250 195,750 * William P. Egan 1985 Children’s Trust f/b/o William P. Egan III dated December
16, 1985 225,000 * 29,250 195,750 * William P. Egan 1985 Children’s Trust f/b/o Mark P. Egan dated December 16,
1985 225,000 * 29,250 195,750 * William P. Egan 1985 Children’s Trust f/b/o Gregory J. Egan dated December
16, 1985 225,000 * 29,250 195,750 * Central Illinois Anesthesia Services Ltd. Profit Sharing Plan 200,000 * 26,000 174,000 * 1998 Taweel Family Trust dated February 12, 1998 187,500 * 24,375 163,125 * Dennis Kinnaird and Constance McCreight Community Property 160,000 * 20,000 140,000 * Anthony Hanlon 150,000 * 19,500 130,500 * All other selling stockholders 500,719 * 90,188 410,531 * (*) Less than 1%.(1) GA SS Holding II LLC (“GA SS II”) directly owns these shares of common stock after giving effect to the merger which is part of the Conversion. GA SS II is wholly-owned by investment funds affiliated
with and controlled by General Atlantic LLC (“General Atlantic”) and/or certain of its managing directors. Specifically, General Atlantic Partners 83, L.P. (“GAP 83”) owns 90.71% of GA SS II, GAPCoinvestments CDA, L.P. (“CDA”) owns 0.13% of GA SS II, GapStar, LLC (“GapStar”) owns 1.50% of GA SS II, GAP Coinvestments III, LLC (“GAPCO III”) owns 5.98% of GA SS II, GAPCoinvestments IV, LLC (“GAPCO IV”) owns 1.40% of GA SS II, GAPCO GmbH & Co. KG (“KG”, and,
125
(1)
(2)
(3)
(4)
(4)
(5)
(6)
(7)
(9)
(10)
(11)
(12)
(13)
(14)
(15)
(16)
(17)
(18)
(19)
(20)
(21)
(22)
(23)
(24)
(25)
(26)
(27)
(28)
(29)
(30)

Table of Contents
together with GAP 83, CDA, GapStar, GAPCO III and GAPCO IV, “General Atlantic Stockholders”) owns 0.28% of GA SS II. General Atlantic is the general partner of General Atlantic GenPar, L.P.(“GA GenPar”) and CDA. GA GenPar is the general partner of GAP 83. The officers of GapStar and managing members of GAPCO III and GAPCO IV are managing directors of General Atlantic.GAPCO Management GmbH (“GmbH Management”) is the general partner of KG. Certain managing directors of General Atlantic make investment decisions for GmbH Management. General Atlantic,GA GenPar, GAP 83, CDA, GapStar, GAPCO III, GAPCO IV, KG and GmbH Management are a “group” within the meaning of Rule 13d-5 promulgated under the Securities Exchange Act of 1934, asamended. Mr. McMorris, one of the members of our board of directors, is a managing director of General Atlantic LLC and disclaims beneficial ownership of any shares listed in the table above as ownedby GA SS II except to the extent of his pecuniary interest therein. The 26 other managing directors of General Atlantic LLC are Steven A. Denning (Chairman), William E. Ford (Chief Executive Officer),John Bernstein, Gabriel Caillaux, Alexander A. Chulack, Mark F. Dzialga, Cory A. Eaves, Abhay Havaldar, Patricia L. Hedley, David C. Hodgson, Rene M. Kern, Jonathan Korngold, Christopher G.Lanning, Jeff X. Leng, Anton J. Levy, Adrianna Ma, Hans Morris, Thomas J. Murphy, Matthew Nimetz, Fernando M. Oliveira, Ranjit Pandit, Andrew C. Pearson, Brett B. Rochkind, David A. Rosenstein,Sunish Sharma and Philip P. Trahanas. Each of these managing directors disclaims ownership of the shares owned by GA SS II except to the extent he or she has a pecuniary interest therein. Other thantheir interest in General Atlantic LLC and its investment entities, these individuals are not affiliated with us, our management or any of the named underwriters for this offering. The address for the GeneralAtlantic Stockholders (other than KG) is c/o General Atlantic Service Company, LLC, 3 Pickwick Plaza, Greenwich, CT 06830. The mailing address for KG and GmbH Management is c/o GeneralAtlantic GmbH, Koenigsallee 63, 40212 Düsseldorf, Germany.
(2) Consists of 11,150,740 shares held by Benchmark Capital Partners V, L.P. (“BCP V”), as nominee for Benchmark Capital Partners V, L.P., Benchmark Founders’ Fund V, L.P., Benchmark Founders’ FundV-A, L.P., Benchmark Founders’ Fund V-B, L.P., and related individuals, or Benchmark Funds. Benchmark Capital Management Co. V, L.L.C., or BCMC V, is the general partner of BCP V. BCMC V’smanaging members of the general partner are Alexandre Balkanski, Bruce W. Dunlevie, J. William Gurley, Kevin R. Harvey, Robert C. Kagle, Steven M. Spurlock, Peter H. Fenton and Mitchell H. Lasky.These individuals may be deemed to have shared voting and investment power over the shares held by the Benchmark Funds. Each of these individuals disclaims beneficial ownership of such shares,except to the extent of his pecuniary interest therein. The address for these entities and individuals is 2480 Sand Hill Road, Suite 200, Menlo Park, California.
(3) Includes (i) 6,084,000 shares held of record by Housatonic Micro Fund SBIC, LP (“HMF SBIC”); (ii) 2,248,829 shares held of record by Housatonic Equity Investors IV, LP (“HEI IV”); (iii) 1,116,000shares held of record by Housatonic Equity Investors SBIC, LP (“HEI SBIC”); and (iv) 103,671 shares held of record by Housatonic Equity Affiliates IV, LP (“HEA IV”). Housatonic Micro Partners SBIC,LLC is the General Partner of HMF SBIC; Housatonic Equity Partners IV, LLC is the General Partner of HEI IV and HEA IV; and Housatonic Equity Partners SBIC, LLC is the General Partner of HEISBIC. William N. Thorndike, Jr., Barry D. Reynolds, Joseph M. Niehaus, Mark G. Hilderbrand, Jill A. Raimondi, James L. Wilder, III, Karen E. Liesching, Michael C. Jackson and Eliot Wadsworth, II aremanaging members of one or more of the entities, or general partners of the entities, that directly or indirectly hold such shares, and as such, may be deemed to have voting and investment power withrespect to shares held by one or more of these entities. Each of these individuals disclaims beneficial ownership with respect to such shares except to the extent of their pecuniary interest therein. Theaddress for these entities and individuals is 44 Montgomery Street, Suite 4010, San Francisco, California 94104.
(4) Includes (i) 2,278,289 shares held of record by Michael A. Smerklo, Trustee of The True North Trust dated July 25, 2008; (ii) 450,000 shares held of record by Michael A. Smerklo, Trustee of the 2010Michael Smerklo Granor Retained Annuity Trust dated November 23, 2010; and (iii) 1,935,416 shares issuable upon exercise of options exercisable within 60 days of December 31, 2010.
(5) Consists of 706,405 shares issuable upon exercise of options exercisable within 60 days of December 31, 2010.(6) Consists of 260,416 shares issuable upon exercise of options exercisable within 60 days of December 31, 2010.(7) Consists of 572,395 shares issuable upon exercise of options exercisable within 60 days of December 31, 2010, of which 495,832 are fully vested.(8) Consists of 76,956 shares issuable upon exercise of options exercisable within 60 days of December 31, 2010.(9) Consists of the shares listed in footnote 1 which are held of record by GA SS II after giving effect to the merger which is part of the Conversion. Mr. McMorris is a managing director of General Atlantic
and may be deemed to have shared voting and dispositive power over the shares held by GA SS II. Mr. McMorris disclaims beneficial ownership of such shares, except to the extent of his individualpecuniary interest therein.
(10) Consists of the shares listed in footnote 2 above, which are held of record by BCP V. Mr. Dunlevie is a managing member of Benchmark Capital Management Co. V, L.P. and may be deemed to haveshared voting and dispositive power over the shares held by BCP V. Mr. Dunlevie disclaims beneficial ownership of such shares, except to the extent of his individual pecuniary interest therein.
(11) Consists of 112,607 shares issuable upon exercise of options exercisable within 60 days of December 31, 2010.(12) Consists of 150,000 shares issuable to the James C. Madden, V Living Trust for which Mr. Madden serves as trustee, upon exercise of options exercisable within 60 days of December 31, 2010, of which
134,375 are fully vested.(13) Consists of the shares listed in footnote 3 above, which are held by entities affiliated with Housatonic Partners. Mr. Reynolds is a managing or general partner of the Housatonic entities that directly or
indirectly hold such shares, and as such, may be deemed to have voting and investment power with respect to shares held by one or more of the entities affiliated with Housatonic Partners. Mr. Reynoldsdisclaims beneficial ownership of the shares held by the entities affiliated with Housatonic Partners, except to the extent of his individual pecuniary interest therein.
(14) Includes (i) 4,160,549 shares issuable upon exercise of options held by our current executive officers and directors exercisable within 60 days of December 31, 2010, of which 4,048,569 are fully vested.(15) David P. Kennedy and Andrea D. Kennedy serve as trustees of the Kennedy Family Trust u/a/d July 2, 2005 (the “Kennedy Trust”) and may be deemed to share voting and dispositive power over the
shares held by the Kennedy Trust.(16) Bettina L. Burr and Marc J. Bloostein serve as trustees of the Matthew Burr 1985 Trust and may be deemed to share voting and dispositive power over the shares held by the Matthew Burr 1985 Trust.(17) Bettina L. Burr and Marc J. Bloostein serve as trustees of the Lander Burr 1985 Trust and may be deemed to share voting and dispositive power over the shares held by the Lander Burr 1985 Trust.
126

Table of Contents
(18) William L. Thornton serves as trustee of the William L. Thornton Trust and may be deemed to have sole voting and dispositive power over the shares held by the William L. Thornton Trust.(19) The Dempsey 1996 Revocable Trust (the “Dempsey Trust”) serves as the General Partner of Aspen Florence Group, L.P. (“Aspen”). Neal Dempsey serves as trustee of the Dempsey Trust and may be
deemed to have sole voting power over the shares held by Aspen. The address of Aspen is 490 S. California Avenue, Palo Alto, California 94306.(20) Adams O’Connell, Inc. serves as the General Partner of AOC Partners #1, LP. Mary A. O’Connell, Liesel Reinisch and Dana Reinisch in their respective capacities as president, vice president and
treasurer, and secretary of Adams O’Connell, Inc. may be deemed to have shared voting and dispositive power over the shares held by AOC Partners #1, LP. The address of these entities is 800 WilshireBoulevard, Suite 730, Los Angeles, California 90017.
(21) Darby L. Limkakeng and Ishmael T. Limkakeng III serve as the trustee of the Kennedy Family Irrevocable Trust u/a/d October 22, 2005 (the “Kennedy Irrevocable Trust”) and may be deemed to have solevoting and dispositive power over the shares held by the Kennedy Irrevocable Trust.
(22) Justin R. Dooley and Maralyn M. Dooley serve as trustees of the Dooley Family Trust and may be deemed to have shared voting and dispositive power over the shares held by the Dooley Family Trust.(23) Francis F. Kingsley serves as trustee of the William P. Egan 2010 Qualified Annuity Trust – ServiceSource International LLC and may be deemed to have sole voting and dispositive power over the shares
held by the by the William P. Egan 2010 Qualified Annuity Trust – ServiceSource International, LLC.(24) Kristen Reed and Charles A. Cheever serve as trustees of the William P. Egan 1985 Children’s Trust f/b/o Kristen E. Reed and may be deemed to share voting and dispositive power over the shares held by
the William P. Egan 1985 Children’s Trust f/b/o Kristen E. Reed.(25) William P. Egan III and Charles A. Cheever serve as trustees of the William P. Egan 1985 Children’s Trust f/b/o William P. Egan III and may be deemed to share voting and dispositive power over the
shares held by the William P. Egan 1985 Children’s Trust f/b/o William P. Egan III.(26) Craig L. Burr and Charles A. Cheever serve as trustees of the William P. Egan 1985 Children’s Trust f/b/o Mark P. Egan and may be deemed to share voting and dispositive power over the shares held by
the William P. Egan 1985 Children’s Trust f/b/o Mark P. Egan.(27) Gregory J. Egan and Charles A. Cheever serve as trustees of the William P. Egan 1985 Children’s Trust f/b/o Gregory J. Egan and may be deemed to share voting and dispositive power over the shares held
by the William P. Egan 1985 Children’s Trust f/b/o Gregory J. Egan.(28) Michael de Anda serves as trustee of the Central Illinois Anesthesia Services, Ltd. Profit Sharing Plan (“Central Anesthesia”) and may be deemed to have sole voting and dispositive power over the shares
held by Central Anesthesia. The address of Central Anesthesia is 350 Marine Parkway, Suite 200, Redwood Shores, California 94065.(29) Kevin Taweel and Debra D. Taweel serve as trustees of the 1998 Taweel Family Trust (the “Taweel Trust”) and may be deemed to have shared voting and dispositive power over the shares held by the
Taweel Trust.(30) Includes each other selling stockholder who in the aggregate beneficially owns less than 1.0% of our common stock.
127

Table of Contents
DESCRIPTION OF CAPITAL STOCK General The following is a summary of our capital stock and certain provisions of our certificate of incorporation and bylaws, as they will be in effect upon theclosing of this offering. This summary does not purport to be complete and is qualified in its entirety by the provisions of our certificate of incorporation andbylaws, copies of which have been filed as exhibits to the registration statement of which this prospectus is a part. The description of our common stock reflectsthe completion of the Conversion which occurred on the date hereof.
Upon the closing of this offering, our authorized capital stock will consist of 1,020,000,000 shares, with a par value of $0.0001 per share, of which: • 1,000,000,000 shares are designated as common stock; and • 20,000,000 shares are designated as preferred stock.
As of December 31, 2010, and after giving effect to the Conversion, we had outstanding 57,506,343 shares of common stock, held of record by 212stockholders, and no shares of preferred stock were outstanding. In addition, as of December 31, 2010, and after giving effect to the Conversion, 17,722,947shares of our common stock were subject to outstanding options. For more information on our capitalization, see “Capitalization” above. Common Stock The holders of our common stock are entitled to one vote per share on all matters submitted to a vote of our stockholders. Subject to preferences that maybe applicable to any preferred stock outstanding at the time, the holders of outstanding shares of common stock are entitled to receive ratably any dividendsdeclared by our board of directors out of assets legally available therefor. In the event that we liquidate, dissolve or wind up, holders of our common stock areentitled to share ratably in all assets remaining after payment of liabilities and the liquidation preference of any then outstanding shares of preferred stock.Holders of common stock have no preemptive or conversion rights or other subscription rights. There are no redemption or sinking fund provisions applicable tothe common stock. All outstanding shares of common stock are, and all shares of common stock to be outstanding upon completion of this offering will be, fullypaid and nonassessable. Preferred Stock After the closing of this offering, no shares of preferred stock will be outstanding. Pursuant to our certificate of incorporation, our board of directors willhave the authority, without further action by our stockholders, to issue from time to time up to 20,000,000 shares of preferred stock in one or more series. Ourboard of directors may designate the rights, preferences, privileges and restrictions of the preferred stock, including dividend rights, conversion rights, votingrights, terms of redemption, liquidation preference, sinking fund terms and the number of shares constituting any series or the designation of any series. Theissuance of preferred stock could have the effect of restricting dividends on our common stock, diluting the voting power of our common stock, impairing theliquidation rights of our common stock or delaying, deterring or preventing a change in control. Such issuance could have the effect of decreasing the marketprice of the common stock. The issuance of preferred stock or even the ability to issue preferred stock could also have the effect of delaying, deterring orpreventing a change in control. We currently have no plans to issue any shares of preferred stock. Registration Rights GA SS Holding LLC, controlled by General Atlantic, LLC, SSLLC Holdings, Inc., controlled by Benchmark Capital, and certain entities affiliated withHousatonic Partners (together, the “Significant Holders”) and certain of our other stockholders (the “2003 Holders”) are entitled to the following rights withrespect to the registration of their shares of our common stock under the Securities Act. For the Significant Holders, these
128

Table of Contents
rights are provided under the terms of a Registration and Information Rights Agreement (the “Registration Rights Agreement”). For the 2003 Holders, theserights are provided under the terms of a Registration Rights Schedule to a Securities Purchase Agreement (the “Registration Rights Schedule”). Both agreementsinclude demand registration rights, piggyback registration rights and Form S-3 registration rights. For the 2003 Holders, registration rights are only granted toeach 2003 Holder that would own at least 1% of our outstanding common stock after giving effect to this offering. In connection with the offering, the 2003holders agreed to waive, to the extent necessary, their piggyback registration rights such that the inclusion of up to 13% of their holdings in the offering shallsatisfy their piggyback registration rights under the Registration Rights Schedule. We refer to these shares collectively as “registrable securities.” All fees, costsand expenses of underwritten registrations will be borne by us and selling expenses, including underwriting discounts and selling commissions, will generally beborne by the holders of the shares being registered pro rata on the basis of the number of shares to be registered.
Demand Registration Rights. The Significant Holders and the 2003 Holders are entitled to demand registration rights. If the Significant Holders request inwriting that we effect a registration that has an anticipated aggregate offering price to the public of at least $10 million or if the 2003 Holders request in writing aregistration that has an anticipated aggregate offering price to the public of at least $7.5 million, then we will be required, at our expense, to register all registrablesecurities that these respective holders request to be registered. We are required to effect only two registrations for the Significant Holders pursuant to thisprovision of the Registration Rights Agreement and only two registrations for the 2003 Holders pursuant to this provision of the Registration Rights Schedule.Depending on certain conditions, however, we may defer such registration for a specified number of days. The underwriters of any underwritten offering have theright to limit the number of shares registered by these holders for marketing reasons, subject to certain limitations.
Piggyback Registration Rights. The Significant Holders and the 2003 Holders, respectively, are entitled to piggyback registration rights. If we register anyof our securities either for our own account or for the account of other security holders, after the completion of this offering the Significant Holders and the 2004Holders are entitled to include all or part of their shares in the registration at our expense. The underwriters of any underwritten offering have the right to limit thenumber of shares registered by these holders for marketing reasons, subject to certain limitations.
Form S-3 Registration Rights. The Significant Holders and the 2003 Holders, respectively, are also currently entitled to short-form registration rights. If weare eligible to file a registration statement on Form S-3, these holders have the right to have all or part of their shares registered by us at our expense, subject tocertain exceptions. The underwriters of any underwritten offering have the right to limit the number of shares registered by these holders for marketing reasons,subject to certain limitations. Anti-Takeover Effects of Delaware General Corporation Law and Our Certificate of Incorporation and Bylaws Our certificate of incorporation and our bylaws contain certain provisions that could have the effect of delaying, deterring or preventing another party fromacquiring control of us. These provisions and certain provisions of Delaware Law, which are referred to below, are expected to discourage coercive takeoverpractices and inadequate takeover bids. These provisions are also designed, in part, to encourage persons seeking to acquire control of us to negotiate first withour board of directors. We believe that the benefits of increased protection of our potential ability to negotiate more favorable terms with an unfriendly orunsolicited acquirer outweigh the disadvantages of potentially discouraging a proposal to acquire us.
Undesignated Preferred Stock. As discussed above, our board of directors has the ability to issue preferred stock with voting or other rights or preferencesthat could impede the success of any attempt to acquire control of our company. These and other provisions may have the effect of deterring hostile takeovers ordelaying changes in control or management of our company.
129
Table of Contents
Limits on Ability of Stockholders to Act by Written Consent or Call a Special Meeting. Our certificate of incorporation provides that our stockholders maynot act by written consent, which may lengthen the amount of time required to take stockholder actions. As a result, a holder controlling a majority of our capitalstock would not be able to amend our bylaws or remove directors without holding a meeting of our stockholders called in accordance with our bylaws.
In addition, our bylaws provide that special meetings of the stockholders may be called only by the chairperson of the board, the chief executive officer orour board of directors. Stockholders may not call a special meeting, which may delay the ability of our stockholders to force consideration of a proposal or forholders controlling a majority of our capital stock to take any action, including the removal of directors.
Requirements for Advance Notification of Stockholder Nominations and Proposals. Our bylaws establish advance notice procedures with respect tostockholder proposals and the nomination of candidates for election as directors, other than nominations made by or at the direction of our board of directors or acommittee of our board of directors. These provisions may have the effect of precluding the conduct of certain business at a meeting if the proper procedures arenot followed. These provisions may also discourage or deter a potential acquirer from conducting a solicitation of proxies to elect the acquirer’s own slate ofdirectors or otherwise attempting to obtain control of our company.
Board Classification. Our board of directors is divided into three classes, one class of which is elected each year by our stockholders. The directors in eachclass will serve for a three-year term. For more information on the classified board, see “Management—Board Composition and Risk Oversight.” In addition, ourcertificate of incorporation and bylaws provide that directors may be removed only for cause. The classification of our board of directors and the limitations onthe ability of our stockholders to remove directors could make it more difficult for a third party to acquire, or discourage a third party from seeking to acquire,control of our company.
No Cumulative Voting. Our certificate of incorporation and bylaws do not permit cumulative voting in the election of directors. Cumulative voting allows astockholder to vote a portion or all of its shares for one or more candidates for seats on the board of directors. Without cumulative voting, a minority stockholdermay not be able to gain as many seats on our board of directors as such stockholder would be able to gain if cumulative voting were permitted. The absence ofcumulative voting makes it more difficult for a minority stockholder to gain a seat on our board of directors to influence our board of director’s decisionsregarding a takeover or otherwise.
Amendment of Charter Provisions. The amendment of the above provisions of our certificate of incorporation and bylaws requires approval by holders of atleast two-thirds of our outstanding capital stock entitled to vote generally in the election of directors.
Delaware Anti-Takeover Statute. Upon the completion of this offering, we will be subject to the provisions of Section 203 of the Delaware GeneralCorporation Law regulating corporate takeovers. In general, Section 203 prohibits a publicly held Delaware corporation from engaging, under certaincircumstances, in a business combination with an interested stockholder for a period of three years following the date the person became an interested stockholderunless: • the transaction is approved by our board of directors prior to the date the interested stockholder obtained such status;
• upon completion of the transaction that resulted in the stockholder becoming an interested stockholder, the interested stockholder owned at least 85%of the voting stock of the corporation outstanding at the time the transaction commenced, calculated as provided under Section 203; or
• at or subsequent to the date of the transaction, the business combination is approved by our board of directors and authorized at an annual or special
meeting of our stockholders, and not by written consent, by the affirmative vote of at least two-thirds of the outstanding voting stock which is notowned by the interested stockholder.
130

Table of Contents
Generally, a business combination includes a merger, asset or stock sale, or other transaction resulting in a financial benefit to the interested stockholder.An interested stockholder is a person who, together with affiliates and associates, owns or, within three years prior to the determination of interested stockholderstatus, did own 15% or more of a corporation’s outstanding voting stock. We expect the existence of this provision to have an anti-takeover effect with respect totransactions our board of directors does not approve in advance. We also anticipate that Section 203 may discourage takeover attempts that might result in apremium over the market price for the shares of common stock held by our stockholders.
The provisions of Delaware law and our certificate of incorporation and bylaws, as amended upon the closing of this offering, could have the effect ofdiscouraging others from attempting unsolicited takeovers and, as a consequence, they might also inhibit temporary fluctuations in the market price of ourcommon stock that often result from actual or rumored unsolicited takeover attempts. These provisions might also have the effect of preventing changes in ourmanagement. It is possible that these provisions could make it more difficult to accomplish transactions that our stockholders might otherwise deem to be in theirbest interests. Direct Registration System From and after the time of this offering, we intend to issue our common stock to stockholders that are not affiliates of ours in book-entry form withoutstock certificates. As a result, upon completion of this offering, we will issue our common stock to such stockholders through the Direct Registration System, andsuch stockholders’ shares will be recorded and maintained on stock records maintained by us and our transfer agent and registrar, without the issuance of physicalstock certificates. In addition to such statements as they or their brokers may from time to time request, such stockholders will be provided an account statementreflecting their ownership upon acquiring shares of our common stock and will be provided annual account statements reflecting their ownership positions. Transfer Agent and Registrar Upon the completion of this offering, the transfer agent and registrar for our common stock will be Wells Fargo Shareowner Services. The transfer agent’saddress is 161 N. Concord Exchange St. South St. Paul, MN 55075, and its telephone number is (800) 468-9716. Listing Our common stock has been approved for listing on The Nasdaq Global Market under the trading symbol “SREV.”
131
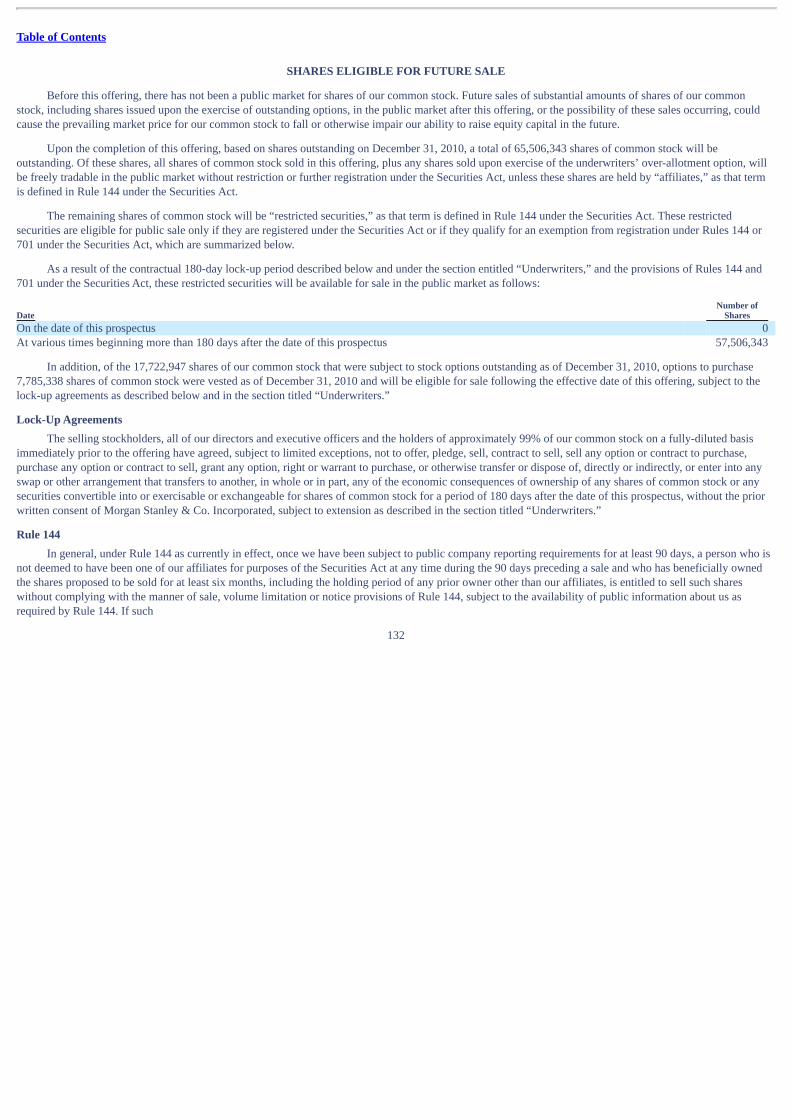
Table of Contents
SHARES ELIGIBLE FOR FUTURE SALE
Before this offering, there has not been a public market for shares of our common stock. Future sales of substantial amounts of shares of our commonstock, including shares issued upon the exercise of outstanding options, in the public market after this offering, or the possibility of these sales occurring, couldcause the prevailing market price for our common stock to fall or otherwise impair our ability to raise equity capital in the future.
Upon the completion of this offering, based on shares outstanding on December 31, 2010, a total of 65,506,343 shares of common stock will beoutstanding. Of these shares, all shares of common stock sold in this offering, plus any shares sold upon exercise of the underwriters’ over-allotment option, willbe freely tradable in the public market without restriction or further registration under the Securities Act, unless these shares are held by “affiliates,” as that termis defined in Rule 144 under the Securities Act.
The remaining shares of common stock will be “restricted securities,” as that term is defined in Rule 144 under the Securities Act. These restrictedsecurities are eligible for public sale only if they are registered under the Securities Act or if they qualify for an exemption from registration under Rules 144 or701 under the Securities Act, which are summarized below.
As a result of the contractual 180-day lock-up period described below and under the section entitled “Underwriters,” and the provisions of Rules 144 and701 under the Securities Act, these restricted securities will be available for sale in the public market as follows:
Date Number of
Shares On the date of this prospectus 0 At various times beginning more than 180 days after the date of this prospectus 57,506,343
In addition, of the 17,722,947 shares of our common stock that were subject to stock options outstanding as of December 31, 2010, options to purchase7,785,338 shares of common stock were vested as of December 31, 2010 and will be eligible for sale following the effective date of this offering, subject to thelock-up agreements as described below and in the section titled “Underwriters.” Lock-Up Agreements The selling stockholders, all of our directors and executive officers and the holders of approximately 99% of our common stock on a fully-diluted basisimmediately prior to the offering have agreed, subject to limited exceptions, not to offer, pledge, sell, contract to sell, sell any option or contract to purchase,purchase any option or contract to sell, grant any option, right or warrant to purchase, or otherwise transfer or dispose of, directly or indirectly, or enter into anyswap or other arrangement that transfers to another, in whole or in part, any of the economic consequences of ownership of any shares of common stock or anysecurities convertible into or exercisable or exchangeable for shares of common stock for a period of 180 days after the date of this prospectus, without the priorwritten consent of Morgan Stanley & Co. Incorporated, subject to extension as described in the section titled “Underwriters.” Rule 144 In general, under Rule 144 as currently in effect, once we have been subject to public company reporting requirements for at least 90 days, a person who isnot deemed to have been one of our affiliates for purposes of the Securities Act at any time during the 90 days preceding a sale and who has beneficially ownedthe shares proposed to be sold for at least six months, including the holding period of any prior owner other than our affiliates, is entitled to sell such shareswithout complying with the manner of sale, volume limitation or notice provisions of Rule 144, subject to the availability of public information about us asrequired by Rule 144. If such
132

Table of Contents
a person has beneficially owned the shares proposed to be sold for at least one year, including the holding period of any prior owner other than our affiliates, thensuch person is entitled to sell such shares without complying with any of the requirements of Rule 144.
In general, under Rule 144, as currently in effect, our affiliates or persons selling shares on behalf of our affiliates will be entitled to sell within any three-month period beginning 90 days after the date of this prospectus, a number of shares that does not exceed the greater of: • 1% of the number of shares of common stock then outstanding, which will equal approximately 655,063 shares immediately after this offering; or
• the average weekly trading volume of the common stock during the four calendar weeks preceding the filing of a notice on Form 144 with respect tosuch sale.
Sales under Rule 144 by our affiliates or persons selling shares on behalf of our affiliates are also subject to certain manner of sale provisions and notice
requirements and to the availability of current public information about us as required by Rule 144. The shares that may be sold in compliance with Rule 144 thatare subject to lock-up agreements as described above and under the section titled “Underwriters” below, will not become eligible for sale until the expiration orwaiver of the restrictions set forth in those agreements. Rule 701 Rule 701 generally allows a stockholder who purchased shares of our common stock pursuant to a written compensatory plan or contract and who is notdeemed to have been an affiliate of our company during the immediately preceding 90 days to sell these shares in reliance upon Rule 144, but without beingrequired to comply with the public information, holding period, volume limitation, or notice provisions of Rule 144. Rule 701 also permits affiliates of ourcompany to sell their Rule 701 shares under Rule 144 without complying with the holding period requirements of Rule 144. All holders of Rule 701 shares,however, are required to wait until 90 days after the date of this prospectus before selling such shares pursuant to Rule 701. The shares that may be sold incompliance with Rule 701 that are subject to lock-up agreements as described above and under the section titled “Underwriters” below will not become eligiblefor sale until expiration or waiver of the restrictions set forth in those agreements.
As of December 31, 2010, 2,286,068 shares of our outstanding common stock had been issued in reliance on Rule 701. Stock Options We intend to file a registration statement on Form S-8 under the Securities Act covering all of the shares of our common stock subject to optionsoutstanding or reserved for issuance under our stock option plans and shares of our common stock issued upon the exercise of options by employees. We expectto file this registration statement as soon as practicable after this offering. Shares issuable upon exercise of the stock options that we have granted that are subjectto lock-up agreements as described above and under the section titled “Underwriters” below will not become eligible for sale until the expiration or waiver of therestrictions set forth in those agreements. Registration Rights Upon completion of this offering, the holders of approximately 40 million shares of our common stock or their transferees will be entitled to variouscontractual registration rights with respect to the registration of these shares under the Securities Act. All of these shares are subject to certain restrictionsincluding the lock-agreements as described above and under the section titled “Underwriters” below, and the holders of these shares will not be entitled toexercise their registration rights until the expiration or waiver of such restrictions. Registration of these shares under the Securities Act would result in theseshares becoming fully tradable without restriction under the Securities Act immediately upon the effectiveness of the registration, except for shares purchased byaffiliates. See “Description of Capital Stock — Registration Rights” for additional information.
133

Table of Contents
MATERIAL U.S. FEDERAL INCOME TAX CONSIDERATIONS FOR NON-U.S. HOLDERS
The following discussion is a summary of the material U.S. federal income tax consequences of the acquisition, ownership and disposition of our commonstock to non-U.S. holders, but does not purport to be a complete analysis of all the potential tax considerations relating thereto. This summary is based upon theprovisions of the Internal Revenue Code of 1986, as amended, or the Internal Revenue Code, Treasury Regulations promulgated thereunder, administrativerulings and judicial decisions, all as of the date hereof. These authorities may be changed, possibly retroactively, so as to result in U.S. federal income taxconsequences different from those set forth below.
This summary is limited to non-U.S. holders who purchase our common stock pursuant to this offering and who hold our common stock as a capital assetwithin the meaning of Section 1221 of the Internal Revenue Code (generally, property held for investment). This summary does not address any U.S. federal non-income tax considerations or any tax considerations arising under the laws of any foreign, state or local jurisdiction. In addition, this discussion does not addresstax considerations applicable to an investor’s particular circumstances or to investors that may be subject to special tax rules, including, without limitation: • banks, insurance companies or other financial institutions; • persons subject to the alternative minimum tax; • tax-exempt organizations; • dealers in securities or currencies; • traders in securities that elect to use a mark-to-market method of accounting for their securities holdings; • persons that own, or are deemed to own, more than five percent of our capital stock (except to the extent specifically set forth below); • certain former citizens or long-term residents of the United States;
• persons who hold our common stock as a position in a hedging transaction, “straddle,” “conversion transaction” or other risk reduction transaction;or
• persons deemed to sell our common stock under the constructive sale provisions of the Internal Revenue Code.
In addition, if a partnership holds our common stock, the tax treatment of a partner generally will depend on the status of the partner and upon the activitiesof the partnership. Accordingly, partnerships that hold our common stock, and partners in such partnerships, should consult their tax advisors regarding thespecific U.S. federal income tax consequences to them of acquiring, owning or disposing of our common stock.
YOU ARE URGED TO CONSULT YOUR TAX ADVISOR WITH RESPECT TO THE APPLICATION OF THE U.S. FEDERAL INCOMETAX LAWS TO YOUR PARTICULAR SITUATION, AS WELL AS ANY TAX CONSEQUENCES OF THE ACQUISITION, OWNERSHIP ORDISPOSITION OF OUR COMMON STOCK ARISING UNDER THE U.S. FEDERAL NON-INCOME TAX RULES OR UNDER THE LAWS OFANY STATE, LOCAL, FOREIGN OR OTHER TAXING JURISDICTION OR UNDER ANY APPLICABLE TAX TREATY. Non-U.S. Holder Defined For purposes of this discussion, you are a non-U.S. holder if you are a holder that, for U.S. federal income tax purposes, is not a U.S. person or apartnership or entity taxable as a partnership. For purposes of this discussion, you are a U.S. person if you are: • an individual citizen or resident of the United States;
134

Table of Contents
• a corporation or other entity taxable as a corporation for U.S. federal income tax purposes, created or organized in the United States or under the laws
of the United States or any political subdivision thereof; • an estate whose income is subject to U.S. federal income tax regardless of its source; or
• a trust (x) whose administration is subject to the primary supervision of a U.S. court and which has one or more U.S. persons who have the authorityto control all substantial decisions of the trust or (y) which has made an election to be treated as a U.S. person for U.S. federal income tax purposes.
Distributions We have not made any distributions on our common stock, and we do not plan to make any distributions for the foreseeable future. However, if we domake distributions on our common stock, those payments will constitute dividends for U.S. tax purposes to the extent paid from our current or accumulatedearnings and profits, as determined under U.S. federal income tax principles. To the extent those distributions exceed both our current and our accumulatedearnings and profits, they will constitute a return of capital and will first reduce your basis in our common stock, but not below zero, and then will be treated asgain from the sale of stock.
Any dividend paid to you generally will be subject to U.S. withholding tax either at a rate of 30% of the gross amount of the dividend or such lower rate asmay be specified by an applicable income tax treaty. In order to receive a reduced treaty rate, you must provide us with an Internal Revenue Service (“IRS”) FormW-8BEN or other appropriate version of IRS Form W-8 certifying qualification for the reduced rate.
Dividends received by you that are effectively connected with your conduct of a U.S. trade or business and, if required by an applicable income tax treaty,attributed to a permanent establishment in the United States, are exempt from such withholding tax. In order to obtain this exemption, you must provide us withan IRS Form W-8ECI properly certifying such exemption. Such effectively connected dividends, although not subject to withholding tax, are taxed at the samegraduated rates generally applicable to U.S. persons, net of certain deductions and credits. In addition, if you are a corporate non-U.S. holder, dividends youreceive that are effectively connected with your conduct of a U.S. trade or business may also be subject to a branch profits tax at a rate of 30% or such lower rateas may be specified by an applicable income tax treaty.
If you are eligible for a reduced rate of withholding tax pursuant to a tax treaty, you may obtain a refund of any excess amounts currently withheld if youfile an appropriate claim for refund with the IRS. Gain on Disposition of Common Stock You generally will not be required to pay U.S. federal income tax on any gain realized upon the sale or other disposition of our common stock unless:
• the gain is effectively connected with your conduct of a U.S. trade or business and, if required by an applicable income tax treaty, attributed to apermanent establishment in the United States;
• you are an individual who is present in the United States for a period or periods aggregating 183 days or more during the calendar year in which thesale or disposition occurs and certain other conditions are met; or
• our common stock constitutes a U.S. real property interest by reason of our status as a “United States real property holding corporation” for U.S.
federal income tax purposes (a “USRPHC”) at any time within the shorter of the five-year period preceding the disposition or your holding period forour common stock.
We believe that we are not currently and will not become a USRPHC. However, because the determination of whether we are a USRPHC depends on the
fair market value of our U.S. real property relative to the fair
135

Table of Contents
market value of our other business assets, there can be no assurance that we will not become a USRPHC in the future. Even if we become a USRPHC, however,as long as our common stock is regularly traded on an established securities market, such common stock will be treated as U.S. real property interests only if youactually or constructively hold more than five percent of such regularly traded common stock at any time during the applicable period described above.
If you are a non-U.S. holder described in the first bullet above, you will generally be required to pay tax on the gain derived from the sale (net of certaindeductions and credits) under regular graduated U.S. federal income tax rates, and corporate non-U.S. holders described in the first bullet above may be subject tobranch profits tax at a 30% rate or such lower rate as may be specified by an applicable income tax treaty. If you are an individual non-U.S. holder described inthe second bullet above, you will be required to pay a flat 30% tax on the gain derived from the sale, which tax may be offset by U.S. source capital losses (eventhough you are not considered a resident of the United States). You should consult any applicable income tax or other treaties that may provide for different rules. Backup Withholding and Information Reporting Generally, we must report annually to the IRS the amount of dividends paid to you, your name and address and the amount of tax withheld, if any. Asimilar report will be sent to you. Pursuant to applicable income tax treaties or other agreements, the IRS may make these reports available to tax authorities inyour country of residence.
Payments of dividends or of proceeds on the disposition of stock made to you may be subject to additional information reporting and backup withholding ata current rate of 28% unless you establish an exemption, for example by properly certifying your non-U.S. status on a Form W-8BEN or another appropriateversion of IRS Form W-8. Notwithstanding the foregoing, backup withholding and information reporting may apply if either we or our paying agent has actualknowledge, or reason to know, that you are a U.S. person.
Backup withholding is not an additional tax; rather, the U.S. income tax liability of persons subject to backup withholding will be reduced by the amount oftax withheld. If withholding results in an overpayment of taxes, a refund or credit may generally be obtained from the IRS, provided that the required informationis furnished to the IRS in a timely manner. New Legislation Relating to Foreign Accounts Newly enacted legislation may impose withholding taxes on certain types of payments made to “foreign financial institutions” (as specially defined underthese rules) and certain other non-U.S. entities. Under this legislation, the failure to comply with additional certification, information reporting and other specifiedrequirements could result in withholding tax being imposed on payments of dividends and sales proceeds to foreign intermediaries and certain non-U.S. holders.The legislation imposes a 30% withholding tax on dividends on, or gross proceeds from the sale or other disposition of, our common stock paid to a foreignfinancial institution or to a foreign non-financial entity, unless (i) the foreign financial institution undertakes certain diligence and reporting obligations or (ii) theforeign non-financial entity either certifies it does not have any substantial U.S. owners or furnishes identifying information regarding each substantial U.S.owner. If the payee is a foreign financial institution, it must enter into an agreement with the U.S. Treasury requiring, among other things, that it undertake toidentify accounts held by certain U.S. persons or U.S.-owned foreign entities, annually report certain information about such accounts, and withhold 30% onpayments to account holders whose actions prevent it from complying with these reporting and other requirements. The legislation would apply to paymentsmade after December 31, 2012. Prospective investors should consult their tax advisors regarding this legislation.
136

Table of Contents
UNDERWRITERS
Under the terms and subject to the conditions contained in an underwriting agreement dated the date of this prospectus, the underwriters named below, forwhom Morgan Stanley & Co. Incorporated and Deutsche Bank Securities Inc. are serving as the representatives, have severally agreed to purchase, and we andthe selling stockholders have agreed to sell to them, severally, the number of shares indicated below:
Underwriters Numberof Shares
Morgan Stanley & Co. Incorporated 5,611,863 Deutsche Bank Securities Inc. 2,149,224 William Blair & Company, L.L.C. 1,134,313 Lazard Capital Markets LLC 1,134,313 Piper Jaffray & Co. 955,210 JMP Securities LLC 955,210
Total 11,940,133
The underwriters and the representatives are collectively referred to as the “underwriters” and the “representatives,” respectively. The underwriters are
offering the shares of common stock subject to their acceptance of the shares from us and the selling stockholders and subject to prior sale. The underwritingagreement provides that the obligations of the several underwriters to pay for and accept delivery of the shares of common stock offered by this prospectus aresubject to the approval of certain legal matters by their counsel and to certain other conditions. The underwriters are obligated to take and pay for all of the sharesof common stock offered by this prospectus if any such shares are taken. However, the underwriters are not required to take or pay for the shares covered by theunderwriters’ over-allotment option described below. If an underwriter defaults, the underwriting agreement provides that the purchase commitments of the non-defaulting underwriters may be increased.
The underwriters initially propose to offer part of the shares of common stock directly to the public at the initial public offering price listed on the coverpage of this prospectus and part to certain dealers at a price that represents a concession not in excess of $0.42 a share under the initial public offering price. Afterthe initial offering of the shares of common stock, the offering price and other selling terms may from time to time be varied by the representatives.
We have granted to the underwriters an option, exercisable for 30 days from the date of this prospectus, to purchase up to an aggregate of 1,791,020additional shares of our common stock at the public offering price listed on the cover page of this prospectus, less underwriting discounts and commissions. Theunderwriters may exercise this option solely for the purpose of covering over-allotments, if any, made in connection with the offering of the shares of commonstock offered by this prospectus. To the extent the option is exercised, each underwriter will become obligated, subject to certain conditions, to purchase about thesame percentage of the additional shares of common stock as the number listed next to the underwriter’s name in the preceding table bears to the total number ofshares of common stock listed next to the names of all underwriters in the preceding table.
137

Table of Contents
The following table shows the per share and total public offering price, underwriting discounts and commissions, and proceeds before expenses to us andthe selling stockholders. These amounts are set forth assuming both no exercise and full exercise of the underwriters’ option to purchase up to anadditional shares of our common stock from us and the selling stockholders. Total Per Share No Exercise Full Exercise
Public offering price $ 10.00 $119,401,330 $137,311,530 Underwriting discounts and commissions to be paid by:
Us $ 0.70 $ 5,600,000 $ 6,853,714 The selling stockholders $ 0.70 $ 2,758,093 $ 2,758,093
Proceeds before expenses, to us $ 9.30 $ 74,400,000 $ 91,056,486 Proceeds before expenses, to selling stockholders $ 9.30 $ 36,643,237 $ 36,643,237
The expenses of this offering payable by us, not including underwriting discounts and commissions, are estimated to be approximately $3.0 million, whichincludes legal, accounting and printing costs and various other fees associated with the registration and listing of our common stock.
The underwriters have informed us and the selling stockholders that they do not intend sales to discretionary accounts to exceed five percent of the totalnumber of shares of common stock offered by them.
Our common stock as been approved for listing on The Nasdaq Global Market under the symbol “SREV.”
We, the selling stockholders, all of our directors and executive officers and the holders of approximately 99% of our outstanding stock on a fully dilutedbasis immediately prior to this offering have agreed that, subject to certain exceptions, without the prior written consent of Morgan Stanley & Co. Incorporated onbehalf of the underwriters, we and they will not, during the period ending 180 days after the date of this prospectus:
• offer, pledge, sell, contract to sell, sell any option or contract to purchase, purchase any option or contract to sell, grant any option, right or warrant to
purchase, lend, or otherwise transfer or dispose of, directly or indirectly, any shares of our common stock or any securities convertible into orexercisable or exchangeable for our common stock;
• enter into any swap or other arrangement that transfers to another, in whole or in part, any of the economic consequences of ownership of ourcommon stock; or
• in the case of us, file any registration statement with the SEC relating to the offering of any shares of our common stock or any securities convertibleinto or exercisable or exchangeable for our common stock;
whether any such transaction described in the first two bullet points above is to be settled by delivery of shares of common stock or such other securities, in cashor otherwise. In addition, we and each such person agree that, without the prior written consent of Morgan Stanley & Co. Incorporated on behalf of theunderwriters, not to make any demand for, or exercise any right with respect to, the registration of any shares of common stock or any security convertible into orexercisable or exchangeable for common stock during the period ending 180 days after the date of this prospectus.
The restrictions described in the immediately preceding paragraph do not apply to:
• transactions relating to shares of common stock or other securities acquired in open market transactions after the completion of the offering, provided
that no filing under Section 16(a) of the Exchange Act shall be required or shall be voluntarily made in connection with subsequent sales of commonstock or other securities acquired in such open market transactions;
138

Table of Contents
• transfers of shares of common stock or any security convertible into common stock as a bona fide gift or gifts or to any trust for the direct or indirect
benefit of the holder or the immediate family of the holder;
• distributions of shares of common stock or any security convertible into common stock to limited partners or stockholders of the holder or to theholder’s affiliates or to any investment fund or other entity controlled or managed by the holder;
• transfers or distributions of shares of common stock to a corporation or other entity of which the holder and/or the holder’s immediate family are atall times the direct or indirect legal and beneficial owners of all the outstanding equity securities or similar interests of such corporation or otherentity; provided that in the case of any transfer or distribution pursuant to this exception or the prior two exceptions above, (i) each donee ordistributee shall sign and deliver a lock-up letter agreement and (ii) no filing under Section 16(a) of the Exchange Act, reporting a reduction inbeneficial ownership of shares of common stock, shall be required or shall be voluntarily made during the restricted period;
• dispositions to us pursuant to our right to repurchase from the holder (or the obligation of the holder to sell or transfer to us) shares of common stockissued under our equity incentive plans or under agreements pursuant to which such shares were issued, provided that no filing under Section 16(a)of the Exchange Act, reporting a reduction in beneficial ownership of shares of common stock, shall be required or shall be voluntarily made duringthe restricted period referred to in the foregoing sentence;
• the receipt by the holder from us of shares of common stock upon the exercise of an option or warrant, provided that no filing under Section 16(a) ofthe Exchange Act shall be required or shall be voluntarily made;
• the establishment of a trading plan pursuant to Rule 10b5-1 under the Exchange Act for the transfer of shares of common stock, provided that such
plan does not provide for the transfer of common stock during the restricted period and no public announcement or filing under the Exchange Actregarding the establishment of such plan shall be required of or voluntarily made by or on behalf of the holder or ServiceSource;
• our issuance of shares of common stock, or other securities convertible into or exercisable for shares of common stock, in connection withacquisitions, joint ventures, commercial relationships or other strategic transactions, in an aggregate number of shares not to exceed 5% of the totalnumber of shares of common stock outstanding immediately following the completion of this offering, provided that each recipient of these shares ofcommon stock shall be subject to the lock-up restrictions described herein; or
• in the case of GA SS Holding LLC, pledges of up to 5% of the shares held by GA SS Holding LLC in favor of the lenders under its existing creditfacility, or any transfer of such shares in connection with such pledge.
The 180-day restricted period described in the preceding paragraphs will be extended if:
• during the last 17 days of the 180-day restricted period, we issue an earnings release or material news or a material event relating to our companyoccurs; or
• prior to the expiration of the 180-day restricted period, we announce that we will release earnings results during the 16-day period beginning on thelast day of the 180-day period;
in which case the restrictions described in the preceding paragraphs will continue to apply until the expiration of the 18-day period beginning on the issuance ofthe earnings release or the occurrence of the material news or material event.
In order to facilitate this offering of the common stock, the underwriters may engage in transactions that stabilize, maintain or otherwise affect the price ofthe common stock. Specifically, the underwriters may sell
139

Table of Contents
more shares than they are obligated to purchase under the underwriting agreement, creating a short position. A short sale is covered if the short position is nogreater than the number of shares available for purchase by the underwriters under the over-allotment option. The underwriters can close out a covered short saleby exercising the over-allotment option or purchasing shares in the open market. In determining the source of shares to close out a covered short sale, theunderwriters will consider, among other things, the open market price of shares compared to the price available under the over-allotment option. The underwritersmay also sell shares in excess of the over-allotment option, creating a naked short position. The underwriters must close out any naked short position bypurchasing shares in the open market. A naked short position is more likely to be created if the underwriters are concerned that there may be downward pressureon the price of the common stock in the open market after pricing that could adversely affect investors who purchase in this offering. In addition, to stabilize theprice of the common stock, the underwriters may bid for, and purchase, shares of common stock in the open market. The underwriting syndicate may also reclaimselling concessions allowed to an underwriter or a dealer for distributing the common stock in this offering if the syndicate repurchases previously distributedcommon stock to cover syndicate short positions or to stabilize the price of the common stock. These activities may raise or maintain the market price of thecommon stock above independent market levels or prevent or retard a decline in the market price of the common stock. The underwriters are not required toengage in these activities and may end any of these activities at any time.
We, the selling stockholders and the underwriters have agreed to indemnify each other against certain liabilities, including liabilities under the SecuritiesAct, or to contribute to payments required in connection with such liabilities.
A prospectus in electronic format may be made available on the websites maintained by one or more underwriters. The underwriters may agree to allocate anumber of shares to underwriters for sale to their online brokerage account holders. Internet distributions will be allocated by Morgan Stanley & Co. Incorporatedto underwriters that may make Internet distributions on the same basis as other allocations.
Lazard Frères & Co. LLC referred this transaction to Lazard Capital Markets LLC and will receive a referral fee from Lazard Capital Markets LLC inconnection therewith. Pricing of the Offering Prior to this offering, there has been no public market for our common stock. The initial public offering price will be determined by negotiations among us,the selling stockholders and the representatives of the underwriters. Among the factors to be considered in determining the initial public offering price will be ourfuture prospects and those of our industry in general, our sales, earnings and certain other financial and operating information in recent periods, and the priceearnings ratios, price sales ratios and market prices of securities and certain financial and operating information of companies engaged in activities similar to ours.The estimated initial public offering price range set forth on the cover page of this preliminary prospectus is subject to change as a result of market conditions andother factors. Directed Share Program At our request, the underwriters have reserved less than five percent of the shares of common stock to be issued by us and offered by this prospectus forsale, at the initial public offering price, to directors, officers, employees, business associates, customers and related persons of ServiceSource International, Inc. Ifpurchased by these persons, these shares will be subject to a 180-day lock-up restriction. This lock-up period will be extended if, during the last 17 days of the180-day restricted period, we issue an earnings release or material news or a material event relating to us occurs or, if prior to the expiration of the 180-dayrestricted period, we announce that we will release earnings results during the 16-day period beginning on the last day of the 180-day period, in which case therestrictions described in the preceding sentence will continue to apply until the expiration of the 18-day period beginning on the issuance of the release or theoccurrence of the material news or
140

Table of Contents
material event. The number of shares of our common stock available for sale to the general public will be reduced to the extent these individuals purchase suchreserved shares. Any reserved shares that are not so purchased will be offered by the underwriters to the general public on the same basis as the other sharesoffered by this prospectus. We have agreed to indemnify the underwriters against certain liabilities and expenses, including liabilities under the Securities Act, inconnection with the sales of directed shares. Other Relationships Certain of the underwriters and their respective affiliates may in the future perform various financial advisory services for us. European Economic Area In relation to each Member State of the European Economic Area which has implemented the Prospectus Directive (each, a “Relevant Member State”) anoffer to the public of any shares which are the subject of the offering contemplated by this Prospectus (the “Shares”) may not be made in that Relevant MemberState, except that an offer to the public in that Relevant Member State of any Shares may be made at any time under the following exemptions under theProspectus Directive, if they have been implemented in that Relevant Member State: • to any legal entity which is a qualified investor as defined in the Prospectus Directive;
• to fewer than 100 or, if the Relevant Member State has implemented the relevant provision of the 2010 PD Amending Directive, 150, natural or legal
persons (other than qualified investors as defined in the Prospectus Directive), as permitted under the Prospectus Directive, subject to obtaining theprior consent of Morgan Stanley & Co. Incorporated for any such offer; or
• in any other circumstances falling within Article 3(2) of the Prospectus Directive, provided that no such offer of Shares shall result in a requirementfor the publication by us or any of the underwriters of a prospectus pursuant to Article 3 of the Prospectus Directive.
For the purposes of this provision, the expression an “offer to the public” in relation to any Shares in any Relevant Member State means the communication
in any form and by any means of sufficient information on the terms of the offer and any Shares to be offered so as to enable an investor to decide to purchase anyShares, as the same may be varied in that Member State by any measure implementing the Prospectus Directive in that Member State, the expression “ProspectusDirective” means Directive 2003/71/EC (and amendments thereto, including the 2010 PD Amending Directive, to the extent implemented in the RelevantMember State), and includes any relevant implementing measure in the Relevant Member State, and the expression “2010 PD Amending Directive” meansDirective 2010/73/EU. United Kingdom Each underwriter has represented and agreed that:
• it has only communicated or caused to be communicated and will only communicate or cause to be communicated an invitation or inducement to
engage in investment activity (within the meaning of Section 21(1) of the FSMA) received by it in connection with the issue or sale of the Shares incircumstances in which Section 21(I) of the FSMA does not apply to us; and
• it has complied and will comply with all applicable provisions of the FSMA with respect to anything done by it in relation to the Shares in, from orotherwise involving the United Kingdom.
141

Table of Contents
LEGAL MATTERS
The validity of the shares of common stock offered hereby will be passed upon for us by Wilson Sonsini Goodrich & Rosati, Professional Corporation,Palo Alto, California. Davis Polk & Wardwell LLP, Menlo Park, California, is acting as counsel to the underwriters.
EXPERTS
The consolidated financial statements as of December 31, 2009 and 2010 and for each of the three years in the period ended December 31, 2010 includedin this prospectus have been so included in reliance on the report of PricewaterhouseCoopers LLP, an independent registered public accounting firm, given on theauthority of said firm as experts in auditing and accounting.
WHERE YOU CAN FIND MORE INFORMATION
We have filed with the SEC a registration statement on Form S-1 under the Securities Act with respect to the shares of common stock offered hereby. Thisprospectus, which constitutes a part of the registration statement, does not contain all of the information set forth in the registration statement or the exhibits andschedules filed therewith. For further information about us and the common stock offered hereby, we refer you to the registration statement and the exhibits andschedules filed therewith. Statements contained in this prospectus regarding the contents of any contract or any other document that is filed as an exhibit to theregistration statement are not necessarily complete, and each such statement is qualified in all respects by reference to the full text of such contract or otherdocument filed as an exhibit to the registration statement. Following this offering, we will be required to file periodic reports, proxy statements, and otherinformation with the SEC pursuant to the Securities Exchange Act of 1934. You may read and copy this information at the Public Reference Room of the SEC,100 F Street, N.E., Washington, D.C. 20549. You may obtain information on the operation of the Public Reference Room by calling the SEC at 1-800-SEC-0330.The SEC also maintains a website that contains registration statements, reports, proxy statements and other information filed electronically with the SEC. Theaddress of that site is www.sec.gov.
142

Table of Contents
SERVICESOURCE INTERNATIONAL, LLC INDEX TO CONSOLIDATED FINANCIAL STATEMENTS Page
Report of Independent Registered Public Accounting Firm F-2
Consolidated Balance Sheets F-3
Consolidated Statements of Operations F-4
Consolidated Statements of Members’ Equity and Comprehensive Income (Loss) F-5
Consolidated Statements of Cash Flows F-6
Notes to Consolidated Financial Statements F-7
F-1

Table of Contents
Report of Independent Registered Public Accounting Firm To the Board of Directors and Members ofServiceSource International, LLC and Subsidiaries
In our opinion, the accompanying consolidated balance sheets and the related consolidated statements of operations, of members’ equity andcomprehensive income (loss) and of cash flows present fairly, in all material respects, the financial position of ServiceSource International, LLC and itssubsidiaries at December 31, 2010 and 2009, and the results of their operations and their cash flows for each of the three years in the period ended December 31,2010 in conformity with accounting principles generally accepted in the United States of America. These financial statements are the responsibility of theCompany’s management. Our responsibility is to express an opinion on these financial statements based on our audits. We conducted our audits of thesestatements in accordance with the standards of the Public Company Accounting Oversight Board (United States). Those standards require that we plan andperform the audit to obtain reasonable assurance about whether the financial statements are free of material misstatement. An audit includes examining, on a testbasis, evidence supporting the amounts and disclosures in the financial statements, assessing the accounting principles used and significant estimates made bymanagement, and evaluating the overall financial statement presentation. We believe that our audits provide a reasonable basis for our opinion. /s/ PRICEWATERHOUSECOOPERS LLP February 25, 2011 San Francisco, California
F-2

Table of Contents
ServiceSource International, LLC and Subsidiaries Consolidated Balance Sheets
(In thousands, except per share amounts)
December 31, 2009 2010 2010
Pro Forma Assets Current assets:
Cash $13,169 $ 22,652 $ 22,652 Accounts receivable, net 28,015 49,237 49,237 Advances to customers 741 18 18 Current portion of deferred income taxes 713 1,155 537 Prepaid expenses and other 1,087 3,326 3,326
Total current assets 43,725 76,388 75,770 Property and equipment, net 14,001 19,418 19,418 Goodwill 6,334 6,334 6,334 Deferred debt issuance costs, net 423 273 — Deferred income taxes, net of current portion 2,882 3,780 33,075 Other assets, net 2,215 1,910 1,910
Total assets $69,580 $108,103 $136,507
Liabilities and Members’/Stockholders’ Equity Current liabilities:
Accounts payable $ 1,124 $ 3,710 $ 3,710 Accrued taxes 2,679 2,233 2,066 Accrued compensation and benefits 7,780 12,170 12,170 Accrued payables to customers 5,979 30,640 30,640 Other accrued liabilities 3,742 7,221 7,373 Current portion of long-term debt 3,322 2,279 779
Total current liabilities 24,626 58,253 56,738 Long-term debt, net of current portion 14,286 14,939 980 Other long-term liabilities 337 1,027 1,027
Total liabilities 39,249 74,219 58,745
Commitments and contingencies (Notes 7 and 8) Members’/stockholders’ equity:
Common shares: 99,000 authorized; 57,299 and 58,007 issued; 56,885 and 57,506 outstanding as ofDecember 31, 2009 and 2010, respectively zero authorized, issued and outstanding, pro forma (unaudited) 30,506 34,161 —
Common stock; $0.0001 par value; 1,000,000 shares authorized, 59,965 shares issued and 59,464 sharesoutstanding, pro forma (unaudited) — — 6
Treasury shares/stock (126) (441) (441) Additional paid-in capital — — 56,277 Retained earnings — — 21,756 Accumulated other comprehensive (loss) income (49) 164 164
Total members’/stockholders’ equity 30,331 33,884 77,762
Total liabilities and members’/stockholders’ equity $69,580 $108,103 $136,507
The accompanying notes are an integral part of these consolidated financial statements.
F-3

Table of Contents
ServiceSource International, LLC and Subsidiaries Consolidated Statements of Operations
(In thousands, except per share amounts) Years Ended December 31, 2008 2009 2010 Net revenue $100,280 $110,676 $152,935 Cost of revenue 56,965 58,877 90,048
Gross profit 43,315 51,799 62,887
Operating expenses Sales and marketing 20,486 23,182 35,119 Research and development 1,160 2,054 7,188 General and administrative 10,571 13,777 19,378 Amortization of intangible assets 857 68 —
Total operating expenses 33,074 39,081 61,685
Income from operations 10,241 12,718 1,202 Interest expense (2,209) (1,116) (1,271) Loss on extinguishment/modification of debt (561) — (144) Other (expense) income, net (1,497) 639 (207)
Income (loss) before provision for income taxes 5,974 12,241 (420) Income tax provision 1,153 1,866 2,147
Net income (loss) $ 4,821 $ 10,375 $ (2,567)
Pro forma income before income taxes (Note 4, unaudited) $ 857 Pro forma provision for income taxes (Note 4, unaudited) 889
Pro forma net loss (Note 4, unaudited) $ (32)
Net income (loss) per common share: Basic $ 0.09 $ 0.18 $ (0.04)
Diluted $ 0.08 $ 0.18 $ (0.04)
Weighted-average shares used in computing net income (loss) per common share: Basic 56,209 56,750 57,284
Diluted 58,733 58,912 57,284
Pro forma net loss per common share (unaudited) (Note 4): Basic $ 0.00
Diluted $ 0.00
Pro forma weighted-average shares used in computing net loss per common share (unaudited) (Note 4): Basic 59,242
Diluted 59,242
The accompanying notes are an integral part of these consolidated financial statements.
F-4

Table of Contents
ServiceSource International, LLC and Subsidiaries Consolidated Statements of Members’ Equity and Comprehensive Income (Loss)
(In thousands)
Common Shares Treasury Shares Accumulated
OtherComprehensiveIncome (Loss)
Total Shares Amount Shares Amount Balances at December 31, 2007 56,093 $ 7,887 — $ — $ 50 $ 7,937 Cash distributions to members — (5,201) — — — (5,201) Issuance of common shares from exercise of share options 305 207 — — — 207 Vesting of share options subject to repurchase 63 16 — — — 16 Share-based compensation expense — 5,449 — — — 5,449 Excess tax benefits from exercise of share options — 178 — — — 178 Comprehensive income: —
Net income — 4,821 — — — 4,821 Foreign currency translation adjustments — — — — 75 75
Total comprehensive income 4,896
Balance at December 31, 2008 56,461 13,357 — — 125 13,482 Issuance of common shares from exercise of share options 459 585 — — — 585 Repurchase of common shares — — (35) (126) — (126) Share-based compensation expense — 6,060 — — — 6,060 Excess tax benefits from exercise of share options — 129 — — — 129 Comprehensive income:
Net income — 10,375 — — — 10,375 Foreign currency translation adjustments — — — — (174) (174)
Total comprehensive income 10,201
Balance at December 31, 2009 56,920 30,506 (35) (126) (49) 30,331 Cash distributions to members — (2,517) — — — (2,517) Issuance of common shares from exercise of share options 707 556 — — 556 Repurchase of common shares — — (86) (315) — (315) Share-based compensation expense — 8,089 — — — 8,089 Excess tax benefits from exercise of share options — 94 — — — 94 Comprehensive loss:
Net loss — (2,567) — — — (2,567) Foreign currency translation adjustments — — — — 213 213
Total comprehensive loss (2,354)
Balances at December 31, 2010 57,627 $34,161 (121) $ (441) $ 164 $33,884
The accompanying notes are an integral part of these consolidated financial statements.
F-5
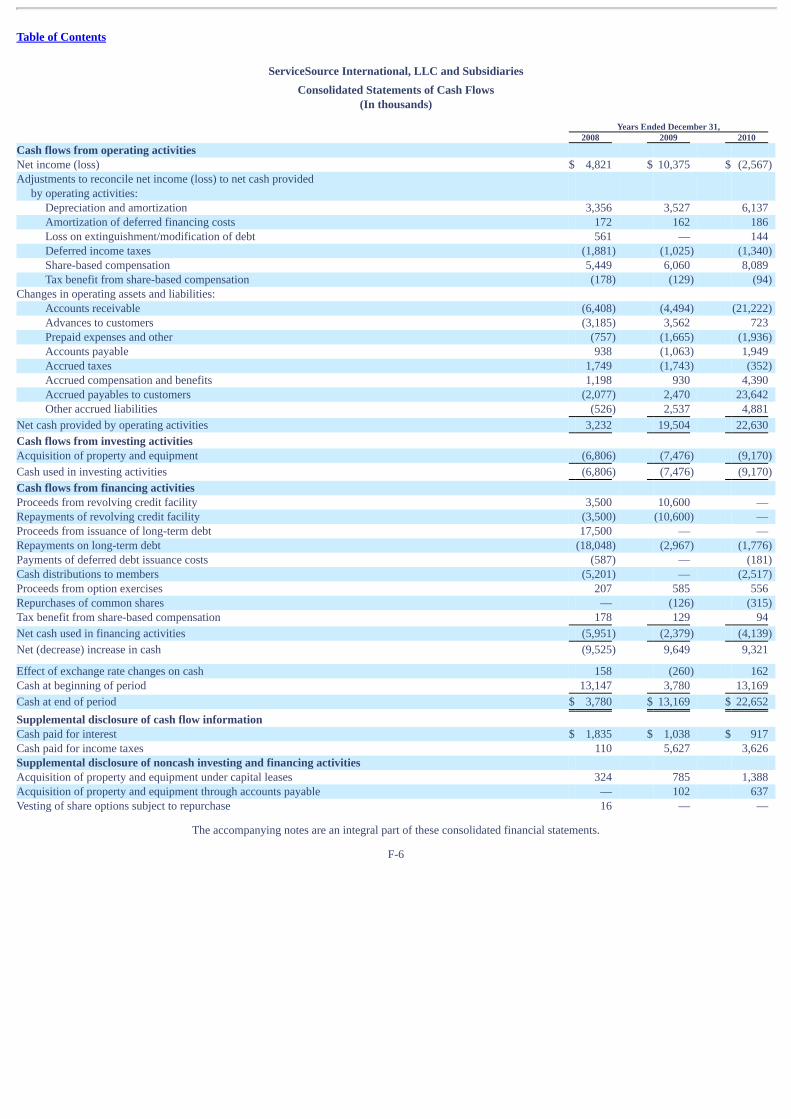
Table of Contents
ServiceSource International, LLC and Subsidiaries Consolidated Statements of Cash Flows
(In thousands) Years Ended December 31, 2008 2009 2010 Cash flows from operating activities Net income (loss) $ 4,821 $ 10,375 $ (2,567) Adjustments to reconcile net income (loss) to net cash provided
by operating activities: Depreciation and amortization 3,356 3,527 6,137 Amortization of deferred financing costs 172 162 186 Loss on extinguishment/modification of debt 561 — 144 Deferred income taxes (1,881) (1,025) (1,340) Share-based compensation 5,449 6,060 8,089 Tax benefit from share-based compensation (178) (129) (94)
Changes in operating assets and liabilities: Accounts receivable (6,408) (4,494) (21,222) Advances to customers (3,185) 3,562 723 Prepaid expenses and other (757) (1,665) (1,936) Accounts payable 938 (1,063) 1,949 Accrued taxes 1,749 (1,743) (352) Accrued compensation and benefits 1,198 930 4,390 Accrued payables to customers (2,077) 2,470 23,642 Other accrued liabilities (526) 2,537 4,881
Net cash provided by operating activities 3,232 19,504 22,630
Cash flows from investing activities Acquisition of property and equipment (6,806) (7,476) (9,170)
Cash used in investing activities (6,806) (7,476) (9,170)
Cash flows from financing activities Proceeds from revolving credit facility 3,500 10,600 — Repayments of revolving credit facility (3,500) (10,600) — Proceeds from issuance of long-term debt 17,500 — — Repayments on long-term debt (18,048) (2,967) (1,776) Payments of deferred debt issuance costs (587) — (181) Cash distributions to members (5,201) — (2,517) Proceeds from option exercises 207 585 556 Repurchases of common shares — (126) (315) Tax benefit from share-based compensation 178 129 94
Net cash used in financing activities (5,951) (2,379) (4,139)
Net (decrease) increase in cash (9,525) 9,649 9,321
Effect of exchange rate changes on cash 158 (260) 162 Cash at beginning of period 13,147 3,780 13,169
Cash at end of period $ 3,780 $ 13,169 $ 22,652
Supplemental disclosure of cash flow information Cash paid for interest $ 1,835 $ 1,038 $ 917 Cash paid for income taxes 110 5,627 3,626 Supplemental disclosure of noncash investing and financing activities Acquisition of property and equipment under capital leases 324 785 1,388 Acquisition of property and equipment through accounts payable — 102 637 Vesting of share options subject to repurchase 16 — —
The accompanying notes are an integral part of these consolidated financial statements.
F-6

Table of Contents
ServiceSource International, LLC and Subsidiaries Notes to Consolidated Financial Statements 1. The Company ServiceSource International, LLC (the “Company,” “LLC” or “ServiceSource”) manages the service contract renewals process of maintenance, support andsubscription agreements on behalf of its customers. The Company’s integrated solution consists of a suite of cloud applications, dedicated service sales teamsworking under its customers’ brands and a proprietary Service Revenue Intelligence Platform. By integrating software, managed services and data, the Companyprovides end-to-end management and optimization of the service contract renewals process, including data management, quoting, selling and service revenuebusiness intelligence. The Company’s business is built on a pay-for-performance model, whereby customers pay the Company based on renewal sales that theCompany generates on the customers’ behalf. The Company’s corporate headquarters are located in San Francisco, California. The Company has additionaloffices in Colorado, Tennessee, the United Kingdom, Ireland, Malaysia and Singapore.
The Company is currently established as a limited liability company and the members’ units of interest are defined as shares or common shares in thelimited liability company agreement. 2. Summary of Significant Accounting Policies Basis of Consolidation The accompanying consolidated financial statements include the accounts of ServiceSource International, LLC and its wholly-owned subsidiaries. Allintercompany balances and transactions have been eliminated in consolidation. Use of Estimates The preparation of consolidated financial statements in conformity with accounting principles generally accepted in the United States of America(“GAAP”) requires management to make estimates and assumptions that affect the reported amounts of assets and liabilities and disclosure of contingent assetsand liabilities at the date of the consolidated financial statements and the reported amount of net revenue and expenses during the reporting period.
The Company’s significant accounting judgments and estimates include: revenue recognition; the determination and assessment of fair value of theCompany’s common shares and related share-based compensation expense, realizability of deferred tax assets and uncertain tax positions, and capitalization ofinternal-use software.
The Company bases its estimates and judgments on historical experience and on various assumptions that it believes are reasonable under thecircumstances. However, future events are subject to change and estimates and judgments routinely require adjustment. Actual results may differ from theseestimates, and these differences may be material. Segments The Company defines an operating segment on the same basis that it uses internally to evaluate performance. Management has determined that theCompany operates in three segments, as it reports financial information across three geographic regions to its chief executive officer, who is the Company’s chiefoperating decision maker. The Company’s three operating and reportable segments are NALA (North America and Latin America), EMEA (Europe and MiddleEast) and APJ (Asia Pacific and Japan).
F-7

Table of Contents
Significant Risks and Uncertainties The Company is subject to certain risks and uncertainties that could have a material and adverse effect on its future financial position or results ofoperations. The Company’s customers are primarily high technology companies and any downturn in these industries, changes in customers’ sales strategies, orwidespread shift away from end customers purchasing maintenance and support contracts could have an adverse impact on the Company’s consolidated results ofoperations and financial condition.
Financial instruments that potentially subject the Company to concentration of credit risk consist principally of cash, accounts receivable and advances tocustomers. The Company is also exposed to a variety of market risks, including the effects of changes in foreign currency exchange rates and interest rates.
Cash is maintained in demand accounts at U.S., European and Asian financial institutions that management believes are credit worthy. Deposits in theseinstitutions may exceed the amount of insurance provided on these deposits.
Accounts receivable are derived from services performed for customers located primarily in the U.S., Europe and Asia. The Company attempts to mitigatethe concentration of credit risk in its trade receivables through its ongoing credit evaluation process and historical collection experience. The Company maintainsan allowance for doubtful accounts based upon the expected collectibility of all accounts receivable, which takes into consideration an analysis of historical baddebts and other available information.
The following table summarizes net revenue and accounts receivable from customers, as included in the NALA and EMEA geographic segments (Note13), in excess of 10% of total net revenue and accounts receivable, respectively: Revenue Accounts Receivable Years Ended December 31, December 31, 2008 2009 2010 2009 2010 Sun Microsystems, Inc 23% 24% 13% 19% 20% VMWare, Inc * * 11% * 10% * Amounts represent less than 10% in the respective year.
The following table summarizes advances to customers and accrued payables to customers in excess of 10% of total advances and accrued payables tocustomers, respectively:
Advances to Customers Accrued
Payables to Customers December 31, December 31, 2009 2010 2009 2010 Sun Microsystems, Inc 100% 100% 99% 100%
In January 2010, Oracle Corporation (“Oracle”) acquired the Company’s then-largest customer, Sun Microsystems, Inc. (“Sun”). In July 2010, Oraclenotified the Company that it was terminating the Sun agreements with the Company, effective in the third quarter of 2010. As of September 30, 2010, the Sunagreements were terminated. A settlement agreement in regards to the Sun termination is being negotiated between Oracle and the Company. The Company hasreflected its best estimate of the expected results of the settlement as of December 31, 2010. This estimate is subject to change.
F-8

Table of Contents
Fair Value Measurements Effective January 1, 2008, the Company adopted Accounting Standards Codification (“ASC”) 820, Fair Value Measurements and Disclosures. Under thisstandard, fair value is defined as the price that would be received by selling an asset or paid by transferring a liability (an exit price) in the principal or mostadvantageous market for the asset or liability in an orderly transaction between market participants on the measurement date. The fair value hierarchy requires anentity to maximize the use of the observable inputs and minimize the use of unobservable inputs when measuring fair value. The three levels of the hierarchy areas follows: Level 1 Quoted prices in active markets that are accessible at the measurement date for identical, unrestricted assets or liabilities.
Level 2
Quoted prices for similar assets and liabilities in active markets; quoted prices for identical or similar assets and liabilities inmarkets that are not active; and model-derived valuations in which all significant inputs and significant value drivers areobservable in active markets.
Level 3
Unobservable inputs that are supported by little or no market activity and that are significant to the fair value of the assets orliabilities. Level 3 assets and liabilities include financial instruments whose value is determined using pricing models,discounted cash flow methodologies, or similar techniques, as well as instruments for which the determination of fair valuerequires significant management judgment or estimation.
A financial instrument’s level within the fair value hierarchy is based on the lowest level of input that is significant to the fair value measurement.
The adoption of ASC 820 had no impact on members’ equity as of January 1, 2008.
Fair Value of Financial Instruments The carrying amounts of certain financial instruments, which include cash, restricted cash, accounts receivable, accounts payable, advances to customers,accrued payables to customers and other accrued liabilities approximates fair value due to their short-term nature. Based on borrowing rates currently available tothe Company for loans with similar terms, the carrying value of long-term debt approximates fair value, assuming minimal credit risk and nonperformance risk. Foreign Currency Translation and Remeasurement Assets and liabilities of non-U.S. subsidiaries that operate in a local currency environment, where that local currency is the functional currency, aretranslated to U.S. dollars at exchange rates in effect at the balance sheet date. Net revenue and expenses are translated at monthly average exchange rates. TheCompany accumulates net translation adjustments in members’ equity as a component of accumulated other comprehensive income (loss). For non-U.S.subsidiaries whose functional currency is the U.S. dollar, transactions that are denominated in foreign currencies have been remeasured in U.S. dollars, and anyresulting gains and losses are reported in the accompanying consolidated statements of operations. Foreign currency transaction (losses) gains of $(1.5) million,$0.6 million, and $(0.2) million were included in other (expense) income, net during 2008, 2009 and 2010, respectively. Cash, Cash Equivalents and Restricted Cash Cash and cash equivalents include highly liquid investments with an original maturity of ninety days or less at the time of purchase. The Company did nothave any cash equivalents at December 31, 2009 and 2010. The Company had $0.1 million in cash held as collateral at a major financial institution which hasbeen classified as restricted cash at December 31, 2009. The balance of restricted cash was not significant at December 31, 2010. The restricted cash included inprepaid expenses and other on the accompanying consolidated balance sheets represented cash held for collateral pledged for corporate credit cards.
F-9
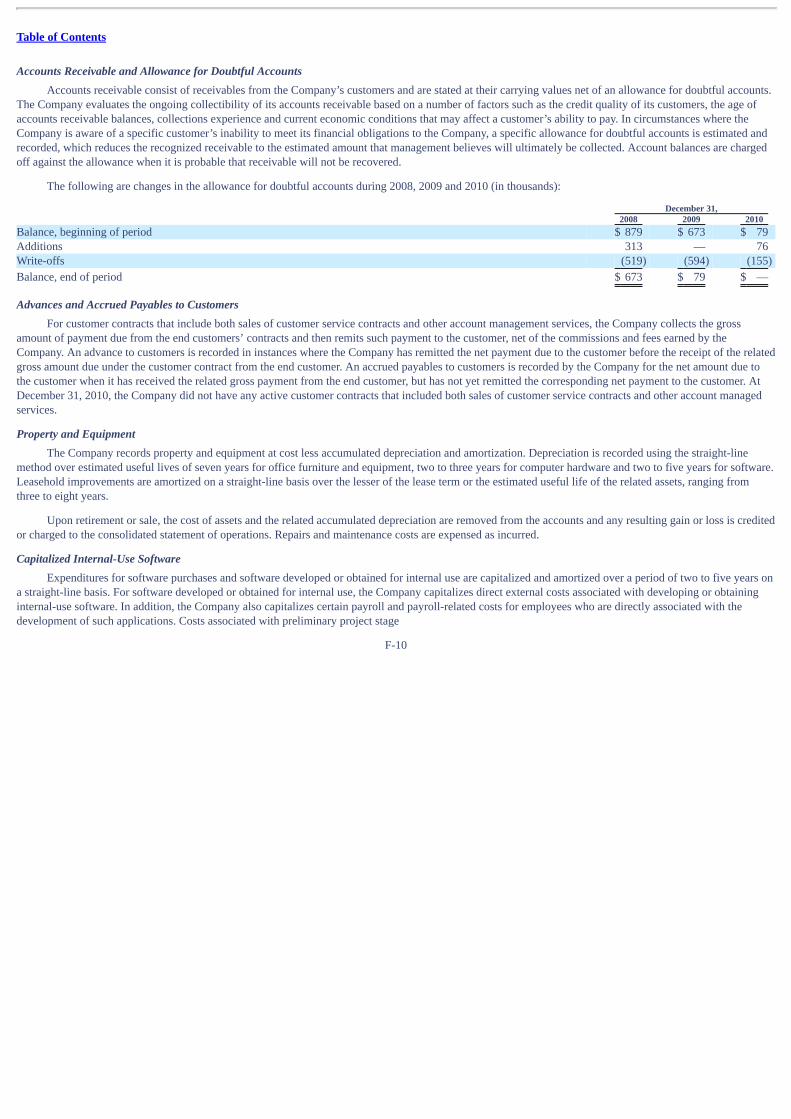
Table of Contents
Accounts Receivable and Allowance for Doubtful Accounts Accounts receivable consist of receivables from the Company’s customers and are stated at their carrying values net of an allowance for doubtful accounts.The Company evaluates the ongoing collectibility of its accounts receivable based on a number of factors such as the credit quality of its customers, the age ofaccounts receivable balances, collections experience and current economic conditions that may affect a customer’s ability to pay. In circumstances where theCompany is aware of a specific customer’s inability to meet its financial obligations to the Company, a specific allowance for doubtful accounts is estimated andrecorded, which reduces the recognized receivable to the estimated amount that management believes will ultimately be collected. Account balances are chargedoff against the allowance when it is probable that receivable will not be recovered.
The following are changes in the allowance for doubtful accounts during 2008, 2009 and 2010 (in thousands):
December 31, 2008 2009 2010
Balance, beginning of period $ 879 $ 673 $ 79 Additions 313 — 76 Write-offs (519) (594) (155)
Balance, end of period $ 673 $ 79 $ —
Advances and Accrued Payables to Customers For customer contracts that include both sales of customer service contracts and other account management services, the Company collects the grossamount of payment due from the end customers’ contracts and then remits such payment to the customer, net of the commissions and fees earned by theCompany. An advance to customers is recorded in instances where the Company has remitted the net payment due to the customer before the receipt of the relatedgross amount due under the customer contract from the end customer. An accrued payables to customers is recorded by the Company for the net amount due tothe customer when it has received the related gross payment from the end customer, but has not yet remitted the corresponding net payment to the customer. AtDecember 31, 2010, the Company did not have any active customer contracts that included both sales of customer service contracts and other account managedservices. Property and Equipment The Company records property and equipment at cost less accumulated depreciation and amortization. Depreciation is recorded using the straight-linemethod over estimated useful lives of seven years for office furniture and equipment, two to three years for computer hardware and two to five years for software.Leasehold improvements are amortized on a straight-line basis over the lesser of the lease term or the estimated useful life of the related assets, ranging fromthree to eight years.
Upon retirement or sale, the cost of assets and the related accumulated depreciation are removed from the accounts and any resulting gain or loss is creditedor charged to the consolidated statement of operations. Repairs and maintenance costs are expensed as incurred. Capitalized Internal-Use Software Expenditures for software purchases and software developed or obtained for internal use are capitalized and amortized over a period of two to five years ona straight-line basis. For software developed or obtained for internal use, the Company capitalizes direct external costs associated with developing or obtaininginternal-use software. In addition, the Company also capitalizes certain payroll and payroll-related costs for employees who are directly associated with thedevelopment of such applications. Costs associated with preliminary project stage
F-10

Table of Contents
activities, training, maintenance and all other post-implementation stage activities are expensed as incurred and are recorded in research and development on theaccompanying consolidated statements of operations. Capitalized costs related to internal-use software under development are treated as construction-in-progressuntil the program, feature or functionality is ready for its intended use, at which time amortization commences. Goodwill and Intangible Assets In connection with an acquisition in 2003 the Company acquired certain intangible assets consisting of goodwill, customer contracts and relatedrelationships, trade names and noncompete agreements in the NALA reporting unit. Goodwill is not amortized. Intangible assets are carried at cost, lessaccumulated amortization. Intangible assets are amortized using the straight-line method over estimated useful lives of six years for customer contracts andrelated relationships, and five years for trade name and noncompete agreements. As of December 31, 2009, the intangible assets were fully amortized.
Goodwill is tested for impairment annually in the fourth quarter of each fiscal year or whenever events or changes in circumstances indicate the carryingvalue of goodwill may not be recoverable. Triggering events that may indicate impairment include, but are not limited to, a significant adverse change incustomer demand or business climate that could affect the value of an asset or a significant decrease in expected cash flows at a reporting unit. When impaired,the carrying value of goodwill is written down to fair value. The goodwill impairment test involves a two-step process. The first step, identifying a potentialimpairment, compares the fair value of a reporting unit with its carrying amount, including goodwill. If the carrying value of the reporting unit exceeds its fairvalue, the second step would need to be conducted; otherwise, no further steps are necessary as no potential impairment exists. The second step, measuring theimpairment loss, compares the implied fair value of the reporting unit goodwill with the carrying amount of that goodwill. Any excess of the reporting unitgoodwill carrying value over the respective implied fair value is recognized as an impairment loss. There was no impairment of goodwill identified during 2008,2009 or 2010. As of December 31, 2010, the latest impairment testing date, the estimated fair value of NALA exceeds the carrying value by 461%. Impairment of Long-Lived Assets The Company’s long-lived assets consist of property and equipment, including internal-use software, and intangible assets. The Company initiates itsreview of potential impairment whenever events or changes in circumstances indicate that the carrying amount of a long-lived asset may not be recoverable.Conditions that may indicate impairment include, but are not limited to, significant negative industry or economic trends which may affect operating income.Determination of recoverability of long-lived assets is based on an estimate of the undiscounted future cash flows resulting from the use of the asset and itseventual disposition. Measurement of an impairment loss for long-lived assets that management expects to hold and use is based on the difference between thefair value of the asset and its carrying value. Long-lived assets to be disposed of are reported at the lower of carrying amount or fair value, less costs to sell. Noimpairment charge was recorded for long-lived assets in 2008, 2009 or 2010. Operating Leases The Company’s operating lease agreements include provisions for certain rent holidays, tenant incentives and escalations in the base price of the rentpayment. The Company records rent holidays and rent escalations on a straight-line basis over the lease term and records the difference between expense and cashpayments as deferred rent. The tenant incentives are recorded as deferred rent and amortized on a straight-line basis over the lease term. Deferred rent is includedin other accrued liabilities on the accompanying consolidated balance sheets.
F-11

Table of Contents
Deferred Debt Issuance Costs The Company defers debt issuance costs, which consist primarily of bank and legal fees. Such costs related to the term loan (Note 7) are amortized usingthe effective-interest method over the term of the debt agreement. Costs related to the revolving credit facility (Note 7) are amortized using the straight-linemethod over the term of the credit facility. The amortization of deferred debt issuance costs is recorded as interest expense. Unamortized deferred debt issuancecosts were $0.4 million and $0.3 million at December 31, 2009 and 2010, respectively. Amortization of deferred debt issuance costs was $0.2 million in each ofthe years 2008, 2009 and 2010. Estimated future amortization of deferred debt issuance costs expense will approximate $0.2 million in 2011 and 2012 and $0.1million in 2013. Comprehensive Income (Loss) Comprehensive income (loss) consists of two components, net income (loss) and other comprehensive income (loss). Other comprehensive income (loss)refers to revenue, expenses, gains and losses recorded as an element of members’ equity but are excluded from net income (loss). The Company’s othercomprehensive income (loss) consists of foreign currency translation adjustments from those subsidiaries not using the U.S. dollar as their functional currency.The Company has disclosed accumulated comprehensive other income (loss) as a separate component of members’ equity. Revenue Recognition Substantially all of the Company’s revenue is generated from commissions earned from sales of renewals of maintenance, support and subscriptioncontracts on behalf of its customers. Commissions are generally a fixed percentage of the overall sales value associated with the service revenue contracts sold bythe Company on behalf of its customers. Revenue is recognized when persuasive evidence of an arrangement exists, services have been provided, the sales priceis fixed or determinable and collectibility is reasonably assured from customers and no significant obligations remain unfulfilled by the Company. Customercontracts are used to determine the existence of an arrangement. Under the terms of the Company’s customer contracts, the Company’s service obligations arecompleted when the Company’s customers accept purchase orders from their end customers and no significant post-delivery obligations of the Company remainunfulfilled. The Company assesses whether the fee is fixed or determinable based on the payment terms with customers and whether any part of the fee is subjectto refund or adjustment. The Company assesses collectibility based primarily on the creditworthiness of customers as determined by credit checks and analyses aswell as the payment history of its customers. Revenue is recognized on a net basis primarily because the Company is not a party to the contracts between thecustomers and the end customers and does not provide actual services to the end customers. Also, the Company does not set the price, terms or scope of servicesin the contracts with end customers.
Some customer agreements include performance-based commissions based on attainment of certain performance targets, including the achievement ofcontract renewal rates in excess of specified targets. Certain customer arrangements also entitle the Company to fees and adjustments which are invoked invarious circumstances, including the failure of customers to provide the Company with a specified minimum value of service contracts to sell on their behalf. TheCompany’s contracts generally contain termination fees should customers elect to cancel agreements prior to their expiration. Revenue related to commissionincentives and early termination fees are recorded in the period when the performance criteria have been met, or the triggering event has occurred, and the amountearned is not subject to claw-back or future adjustment. Some customers may cancel their contracts if the Company is out of compliance with certain performanceobligations, as defined in the relevant customer agreement. In addition, the Company estimates an allowance for potential cancellation of service contracts andunpaid invoices from end customers, which is calculated based on historical results and the aging of the outstanding invoices and constitutes a reduction of therevenue recorded upon the sale of service contracts.
F-12

Table of Contents
For multiple element arrangements including deliverables such as sales of service contracts, account management services and subscriptions to theCompany’s service revenue management solutions, the Company separates each revenue stream at the inception of the arrangement on a relative fair value basis,provided that each service element meets the criteria for treatment as a separate unit of accounting. An item is considered a separate unit of accounting if it hasvalue to the customer on a stand-alone basis and there is objective and reliable fair value of the undelivered services. The fair value of the undelivered elements isdetermined by the price charged when the element is sold separately, or in cases where the item is not sold separately, by using other acceptable objectiveevidence.
For a limited number of customer arrangements, the Company is responsible for selling service contracts and for providing account management servicessuch as invoicing and cash collections from end customers. Under these arrangements, revenue is recognized when the service has been delivered and the fee isfixed or determinable, which is upon receipt of cash payment from the end customer. Revenue is also reported net of sales taxes collected from end customers andremitted to state and local government authorities.
For a limited number of customer engagements that include sales of service contracts and subscription fees to the Company’s hosted technology platform,fees earned for selling service contracts are recognized as revenue as services are performed, while hosting revenue is recognized ratably over the subscriptionterm, which term is generally one year. Cost of Revenue Cost of revenue includes compensation and related personnel expenses directly related to service contract sales and account management servicespersonnel. The Company allocates overhead expenses related to facilities, information technology and depreciation, including amortization of internal-usesoftware to all departments based on headcount. As a result, allocated overhead costs are reflected in cost of revenues, sales and marketing, research anddevelopment and general administrative expenses. Sales Commissions Sales commissions earned by the Company’s sales representatives are generally paid in two or three installments with an initial payment shortly afterentering into a new customer agreement and a final payment approximately twelve months after the Company begins to sell service contracts on behalf of thecustomer. Commission payments are contingent upon continued employment by the sales representatives and subject to adjustments during the service periodbased on the estimated value of service contracts received from the customer for sale. Commission expense is recognized over the employment service period,generally eight to fourteen months. At the time of each payment, sales commission expense recorded is in excess of each payment. Advertising Costs The Company expenses advertising costs as incurred. Advertising expenses were insignificant for all periods presented. Income Taxes ServiceSource International, LLC, as the parent company, files its income tax return as a partnership for federal and state income tax purposes. The LLCrecognizes no federal, state, or local income taxes, as the members of the LLC, and not the LLC itself, are subject to income tax on their allocated share of theLLC’s earnings. The Company’s taxable subsidiaries are included in the provision for income taxes in the accompanying consolidated financial statements asfurther described below. The Company is subject to an annual California LLC registration fee based on revenue. The Company generally makes an annualdistribution to its limited liability company members for their estimated tax liability on allocated net income under the terms of the limited liability companyagreement.
F-13

Table of Contents
Income taxes for the Company’s taxable subsidiaries, consisting of ServiceSource International, Inc and several subsidiaries formed in foreign jurisdictionsare accounted for using an asset and liability method, which requires the recognition of taxes payable or refundable for the current year and deferred tax assetsand liabilities for the expected future tax consequences of temporary differences that currently exist between the tax basis and the financial reporting basis of theCompany’s taxable subsidiaries’ assets and liabilities using the enacted tax rates in effect for the year in which the differences are expected to reverse. The effectof a change in tax rates on deferred tax assets and liabilities is recognized in operations in the period that includes the enactment date. The measurement ofdeferred tax assets is reduced, if necessary, by the amount of any tax benefits that, based on available evidence, are not expected to be realized.
The Company accounts for unrecognized tax benefits using a more-likely-than-not threshold for financial statement recognition and measurement of taxpositions taken or expected to be taken in a tax return. The Company establishes reserves for tax-related uncertainties based on estimates of whether, and theextent to which, additional taxes will be due. The Company records an income tax liability, if any, for the difference between the benefit recognized and measuredand the tax position taken or expected to be taken on the Company’s tax returns. To the extent that the assessment of such tax positions changes, the change inestimate is recorded in the period in which the determination is made. The reserves are adjusted in light of changing facts and circumstances, such as the outcomeof a tax audit. The provision for income taxes includes the impact of reserve provisions and changes to reserves that are considered appropriate. As ofDecember 31, 2009 and 2010, the Company has not recorded any liabilities for unrecognized tax benefits.
The Company recognizes interest accrued related to unrecognized tax benefits in interest expense and tax penalties in general and administrative expense inthe consolidated statements of operations. The Company did not accrue or pay any interest or penalties related to unrecognized tax benefits during 2008, 2009 or2010.
In general, it is the practice and intention of the Company to permanently reinvest the undistributed earnings of its non-US subsidiaries. Should theCompany repatriate undistributed earnings, such amounts become subject to U.S. taxation giving recognition to current tax expense and foreign tax credits uponremittance of dividends and under certain other circumstances. As of December 31, 2009 and 2010, the Company did not have any significant undistributedearnings from its foreign subsidiaries. Share-Based Compensation The Company measures and recognizes compensation expense for all share-based awards made to employees and directors based on estimated fair values.The fair value of employee and director options is estimated on the date of grant using the Black-Scholes option-pricing model. The value of awards that areultimately expected to vest is recognized as expense over the requisite service periods. Since share-based compensation expense is based on awards ultimatelyexpected to vest, it is reduced for expected forfeitures.
For awards that are expected to result in a tax deduction, a deferred tax asset is established as the Company recognizes compensation expense. If the taxdeduction exceeds the cumulative recorded compensation expense, the tax benefit associated with the excess deduction is considered a windfall benefit. Theexcess tax benefit from share compensation plans is recorded in members’ equity and classified as a financing cash flow on the consolidated statements of cashflows. The Company has elected to use the short-cut method for determining the historical pool of windfall tax benefits that accumulated prior to January 1, 2006. Net Income (Loss) Per Common Share Basic net income (loss) per common share is computed using the weighted-average number of common shares outstanding during the period. Diluted netincome (loss) per common share is computed using the weighted-average number of common shares and potentially dilutive common shares outstanding duringthe period. Potential diluted shares include the dilutive effect of in-the-money options. The dilutive effect of such
F-14

Table of Contents
equity awards is calculated based on the average share price for each period using the treasury-stock method. Under the treasury-stock method, the amount theemployee must pay for exercising options, the amount of compensation cost for future service that the Company has not yet recognized, and the amount of taxbenefits that would be recorded in members’ equity when the award becomes deductible, are collectively assumed to be used to repurchase shares. Recent Accounting Pronouncements In October 2009, Financial Accounting Standards Board (“FASB”) issued a new accounting standard that changes the accounting for arrangements withmultiple deliverables. The new standard requires an entity to allocate arrangement consideration at the inception of an arrangement to all of its deliverables basedon their relative selling prices. This standard will be effective for the Company beginning January 1, 2011. This Accounting Standards Update (“ASU”) removedthe previous separation criteria that objective and reliable evidence of the fair value of any undelivered items must exist for the delivered item to be considered aseparate unit or units of accounting. Given the Company’s current contractual arrangements, the adoption of this standard is not expected to have a materialimpact on the Company’s consolidated financial statements.
In January 2010, the FASB issued amended guidance on fair value measurements and disclosures. The new guidance requires additional disclosuresregarding fair value measurements, amends disclosures about postretirement benefit plan assets, and provides clarification regarding the level of disaggregation offair value disclosures by investment class. This guidance is effective for interim and annual reporting periods beginning after December 15, 2009, except forcertain Level 3 activity disclosure requirements that will be effective for reporting periods beginning after December 15, 2010. Accordingly, the Companyadopted this in 2010, except for the additional Level 3 requirements which will be adopted in 2011. Level 3 assets and liabilities are those whose fair market valueinputs are unobservable and reflect management’s best estimate of what market participants would use in pricing the asset or liability at the measurement date.The adoption of this guidance did not have a material impact on the Company’s consolidated financial statements.
In February 2010, the FASB issued ASU No. 2010-09 Subsequent Events (ASC Topic 855): Amendments to Certain Recognition and DisclosureRequirements. ASU 2010-09 requires an entity that is a filer with the Securities and Exchange Commission (“SEC”) to evaluate subsequent events through thedate that the financial statements are issued and removes the requirement for an SEC filer to disclose a date, in both issued and revised financial statements,through which the filer had evaluated subsequent events. The adoption of this standard did not have a significant impact on the Company’s consolidated financialstatements.
In April 2010, the FASB issued ASU No. 2010-13, Compensation—Stock Compensation (Topic 718)—Effect of Denominating the Exercise Price of aShare-Based Payment Award in the Currency of the Market in Which the Underlying Equity Security Trades. ASU 2010-13 provides amendments to Topic 718 toclarify that an employee share-based payment award with an exercise price denominated in the currency of a market in which a substantial portion of the entity’sequity securities trades should not be considered to contain a condition that is not a market, performance, or service condition. Therefore, an entity would notclassify such an award as a liability if it otherwise qualifies as equity. The amendments in ASU 2010-13 will be effective for the Company beginning January 1,2011. The adoption of this standard is not expected to have a material impact on the Company’s consolidated financial statements. Reclassifications Certain amounts in the 2008 and 2009 financial statements have been reclassified in order to conform to the 2010 presentation. Such reclassifications donot have a material impact on the Company’s consolidated members’ equity, results of operations or cash flows.
F-15

Table of Contents
3. Net Income (Loss) Per Common Share The basic and diluted net income per share calculations are presented below (in thousands, except for per share amounts): Years Ended December 31, 2008 2009 2010 Basic net income (loss) per common share Net income (loss) $ 4,821 $10,375 $ (2,567)
Weighted-average common shares outstanding 56,209 56,750 57,284
Basic net income (loss) per share $ 0.09 $ 0.18 $ (0.04)
(1) Outstanding unvested common shares purchased by employees are subject to repurchase by the Company and therefore are not included in the calculation of the weighted-average shares outstanding for
basic net income (loss) per common share. Years Ended December 31, 2008 2009 2010 Diluted net income (loss) per common share Net income (loss) used to determine diluted earnings per common shares $ 4,821 $10,375 $ (2,567)
Weighted-average common shares outstanding 56,209 56,750 57,284 Adjustment for incremental shares arising from assumed exercise of options 2,524 2,162 —
Weighted-average common shares for diluted net income (loss) per share 58,733 58,912 57,284
Diluted net income (loss) per share $ 0.08 $ 0.18 $ (0.04)
(1) As the Company was in a net loss position in 2010, there was no dilutive effect on net loss per common share. Therefore, both basic and diluted net loss per common share were $(0.04) for 2010. 4. Pro Forma Information (Unaudited) The pro forma information has been computed to give effect to the pro forma adjustments discussed below: Pro forma stockholders’ equity and pro forma deferred income tax assets and liabilities as of December 31, 2010 have been computed to give effect to theconversion of the Company’s common shares into shares of common stock and repayment of the loan balances using proceeds from the offering of common stockand accordingly reflect:
• the reclassification of the balance of members’ interests in common shares to common stock and additional paid-in capital upon a reorganization of
the Company from a Delaware limited liability company to a Delaware corporation and the conversion of common shares into common stock in aratio of 1:1 based on amounts outstanding as of December 31, 2010;
• adjustments to deferred income tax assets and deferred income tax liabilities in connection with the Company’s reorganization from a limited liabilitycompany to a Delaware corporation, with a resulting net adjustment of $22.0 million to retained earnings;
• adjustments to deferred income tax assets and deferred income tax liabilities obtained in connection with the merger of two corporate equityholders
with the Company as part of the Company’s reorganization, which are being reflected as additional contribution from certain shareholders andresulted in a net adjustment of $6.7 million to additional paid-in capital;
• the write-off, net of taxes, of deferred debt issuance costs of $0.2 million, recognition of a prepayment penalty of $0.2 million and repayment of theloan balance of $15.5 million outstanding under the Credit Facility (Note 7) based on amounts outstanding as of December 31, 2010; and
• the issuance of 1,957,994 shares of common stock at the initial offering price of $10.00 per share net of offering costs of $4.1 million, where the netproceeds of such issuance of shares would have been sufficient to repay outstanding loan balances as of December 31, 2010.
F-16
(1)
(1)
(1)

Table of Contents
All of the aforementioned adjustments have been reflected in the pro forma balance sheet as if these events all occurred on December 31, 2010.
The Company does not expect to make further tax distributions based on its 2010 results, and therefore there is no corresponding adjustment that has beenmade to pro forma stockholders’ equity.
The pro forma net loss applied in computing the unaudited pro forma basic and diluted loss per share for the year ended December 31, 2010 is based uponthe Company’s historical net loss as adjusted to reflect the following:
• the conversion of the Company from a LLC to a C corporation. Prior to such conversion, the LLC was treated as a partnership and generally notsubject to income taxes. The pro forma net loss, therefore, includes adjustments for income tax expense (benefit) as if the LLC had been acorporation and subject to income taxes at an assumed combined federal, state, and local income tax rate of 39.3%. Upon the conversion of the LLCto a Delaware corporation, the Company expects to record a non-cash income tax benefit equal to the amount of the net adjustment to the deferredtax balances, which is estimated would have been $22.0 million on a pro forma basis as of December 31, 2010, which has not been reflected in theadjustment to pro forma net loss for the year ended December 31, 2010; and
• the elimination of historical interest expense, including the amortization of debt issuance costs related to the loan balances under the Company’scredit facility which is assumed to be repaid using a portion of the net proceeds of the Company’s initial public offering of its common stock.
The basic and diluted pro forma per common share calculations are presented below (in thousands, except per share amounts). The calculation of weighted
average common shares used in the calculation give effect on a pro forma basis to only that number of additional shares that would have been required to beissued to prepay the loan balances outstanding under the Company’s credit facility as of December 31, 2010 assuming the issuance of such shares at the initialoffering price of $10.00 per share net of offering costs. The diluted pro forma per common share calculation also assumes the conversion, exercise, or issuance ofall potential common shares, unless the effect of inclusion would result in the reduction of a net loss per common share or the increase in net income per commonshare. (in thousands, except per share amounts)
Year EndedDecember 31,
2010 Basic and Diluted pro forma net loss per common share Net loss $ (2,567) Adjustment for pro forma income tax expense 1,760 Adjustment to interest expense related to prepayment of loan balances, net of tax of 502 775
Pro forma net loss $ (32)
Weighted-average common shares outstanding 57,284 Adjustment for additional shares arising from assumed exercise of options — Adjustment to include the additional shares required to be issued to generate proceeds sufficient to prepay the outstanding loan balances 1,958
Pro forma weighted-average common shares outstanding for basic and diluted net loss per common share 59,242
Pro forma basic and diluted net loss per common share $ 0.00
(1) As the Company was at a net loss position in 2010, there was no dilutive effect on net loss per common share. Therefore, both basic and dilutive pro forma net loss per common share were $0.00 for
2010.
F-17
(1)
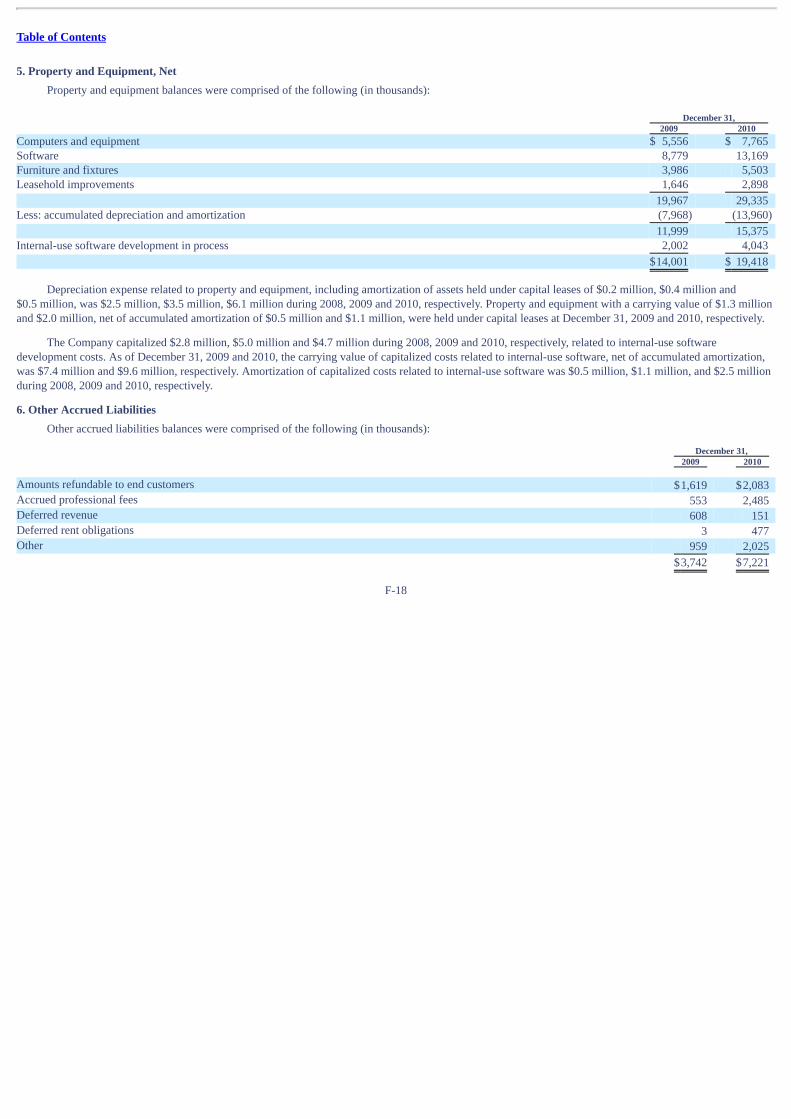
Table of Contents
5. Property and Equipment, Net Property and equipment balances were comprised of the following (in thousands): December 31, 2009 2010 Computers and equipment $ 5,556 $ 7,765 Software 8,779 13,169 Furniture and fixtures 3,986 5,503 Leasehold improvements 1,646 2,898
19,967 29,335 Less: accumulated depreciation and amortization (7,968) (13,960)
11,999 15,375 Internal-use software development in process 2,002 4,043
$14,001 $ 19,418
Depreciation expense related to property and equipment, including amortization of assets held under capital leases of $0.2 million, $0.4 million and
$0.5 million, was $2.5 million, $3.5 million, $6.1 million during 2008, 2009 and 2010, respectively. Property and equipment with a carrying value of $1.3 millionand $2.0 million, net of accumulated amortization of $0.5 million and $1.1 million, were held under capital leases at December 31, 2009 and 2010, respectively.
The Company capitalized $2.8 million, $5.0 million and $4.7 million during 2008, 2009 and 2010, respectively, related to internal-use softwaredevelopment costs. As of December 31, 2009 and 2010, the carrying value of capitalized costs related to internal-use software, net of accumulated amortization,was $7.4 million and $9.6 million, respectively. Amortization of capitalized costs related to internal-use software was $0.5 million, $1.1 million, and $2.5 millionduring 2008, 2009 and 2010, respectively. 6. Other Accrued Liabilities Other accrued liabilities balances were comprised of the following (in thousands): December 31, 2009 2010 Amounts refundable to end customers $1,619 $2,083 Accrued professional fees 553 2,485 Deferred revenue 608 151 Deferred rent obligations 3 477 Other 959 2,025
$3,742 $7,221
F-18

Table of Contents
7. Long-Term Debt and Subsequent Events Long-term debt balances were comprised of the following (in thousands): December 31, 2009 2010 Current:
Term loan $ 3,251 $ 1,500 Capital lease obligations 71 779
3,322 2,279 Non-current:
Term loan 13,584 13,959 Capital lease obligations 702 980
14,286 14,939
Total long-term debt $17,608 $17,218
Term Loan and Revolving Credit Facility In April 2008, the Company entered into a credit facility (the “Credit Facility”), with various financial institutions that replaced several prior debtagreements. The Credit Facility initially provided for (i) a $20.0 million term loan and (ii) a $25.0 million revolving credit facility consisting of direct loans,standby letters of credit and trade letters of credit. The Credit Facility expires in April 2013, and is collateralized by substantially all of the Company’s assets.During 2010, the Credit Facility was amended to reduce the maximum amount available for borrowing under the revolving credit facility to $7.5 million as ofDecember 31, 2010.
The repayment terms of the term loan require quarterly installments of specified amounts from June 30, 2008 to April 29, 2013. If the Company exceeds acertain level of excess cash flow, as defined in the Credit Facility, for the current year, then the Credit Facility requires additional principal payments in the nextyear. In March 2010, the Company obtained a waiver from the requirement to make additional principal payments in 2010 based on 2009 excess cash flow levelsas defined in the Credit Facility. In December 2010, the company amended its fee arrangement with the lenders such that upon the termination of or prepaymentsin full of the obligations under the Credit Facility on or prior to December 31, 2011, the Company would be subject to a prepayment premium of 0.5% on the sumof the maximum revolver amount as defined in the agreement and the then-outstanding principal balance on the term loan.
Borrowing under the revolving credit facility is subject to limitations imposed by collateral agreements and certain other conditions in the Credit Facility.Availability under the revolving credit facility is subject to certain limitations related to the Company’s consolidated revenue, as defined in the Credit Facility.There was no amount outstanding under the revolving credit facility at December 31, 2009 or 2010. The Company had an outstanding letter of credit of $1.6million at both December 31, 2009 and 2010, respectively, as required under an operating lease agreement for office space.
The term loan and revolving credit facility bear interest at either: (i) the Base LIBOR Rate plus an additional margin; or, (ii) the Base Rate (i.e., prime rate)plus an additional margin. The Base LIBOR Rate is to be equal to the greater of 2% or the published U.S. Dollar LIBOR rate. Prior to April 2010, the Companyhad elected to borrow at the Base Rate plus the additional margin as defined in the Credit Facility. In April 2010, the Company elected to borrow at the BaseLIBOR Rate plus an additional margin. At December 31, 2009 and 2010, the applicable interest rate under the Credit Facility was 5.25% and 5.75%, respectively.The Company is also required to pay a letter of credit fee calculated based upon 0.825% of the average daily outstanding balance of letters of credit.
F-19

Table of Contents
The Credit Facility also has various restrictive financial covenants, which include maintaining a minimum fixed charge coverage ratio, a maximumconsolidated leverage ratio and restrictions, subject to certain exceptions, under which the Company can make distributions to its members. Distributions to fundtax obligations of members are permitted so long as there are no events of default, including compliance with financial covenants, immediately prior to or aftergiving effect to any such distribution. Distributions other than those to fund members’ tax obligations are subject to the Company achieving specified levels ofearnings before interest, taxes, depreciation and amortization or maintaining minimum levels of cash, as defined in the Credit Facility. As of December 31, 2009and 2010, the Company was in compliance with its borrowing covenants.
In January 2011 the Credit Facility was amended to (i) increase the maximum commitment amount under the revolving credit facility from $7.5 million to$12.5 million, (ii) eliminate the fixed charge coverage ratio test for the twelve month period ending March 31, 2011 only, (iii) require the Company to maintain aminimum liquidity level of $10 million based on unrestricted cash balances held in the U.S. and available borrowings under the revolving credit facility, asdefined therein, from and after May 15, 2011, and (iv) allow for the planned conversion of the LLC to a taxable corporation, initial public offering of theCompany’s stock and other specified transactions related to the Company.
On February 24, 2011, the Company entered into the Second Amended and Restated Credit Agreement (the “New Revolver”) with two financialinstitutions that replaces the Credit Facility and prior amendments and increases the revolving credit facility from $15.0 million to $30.0 million. The NewRevolver also retired the term loan under the Credit Facility and converted such balances to a balance outstanding under the revolving credit facility. Balancesoutstanding on the New Revolver are collateralized by substantially all of the Company’s assets. The New Revolver provides letters of credit for the account ofthe Company up to a maximum of $5.0 million. Outstanding letters of credit reduce the maximum available borrowing under the New Revolver. The NewRevolver expires on February 25, 2013.
Borrowings on the New Revolver, including amounts outstanding under letter of credit, bear interest at either: (i) the LIBOR Rate plus an additionalmargin; or (ii) the Base Rate (i.e., prime rate) plus an additional margin. The additional margin is determined based on the Company’s financial leverage ratio.
The New Revolver provides for a non-use fee of 0.50% per annum based on the average monthly available borrowing base and a fee on the unused portionof the letter of credit commitment, accruing at a rate per annum ranging from 3.00% to 3.75% based on the Company’s leverage ratio and whether the Companyhas consummated an initial public offering of its shares.
The Company has the option to reduce the maximum New Revolver commitment. Each reduction must be in an amount not less than $5.0 million and inaggregate not more than $10.0 million. Once reduced, commitments under the New Revolver cannot be increased. No reductions will be permitted 90 days afterthe consummation of an initial public offering of the Company’s stock. The lenders also have the option to reduce the commitment under the New Revolver in theevent a contract with a customer who represented 15% of revenue for any consecutive twelve-month period is terminated or in the event of a series of customercontract terminations, which in the aggregate represented more than 20% of consolidated revenues for the most recent twelve-month period. Under thesecircumstances, the lenders would have the discretion to reduce the commitment under the New Revolver by the aggregate amount of termination fees receivedthat are related to the cancelled contracts. The New Revolver can be terminated by the Company and is subject to a fee if terminated on or before February 24,2013 equal to 1.0% of the revolver commitment in effect on the date of termination.
The New Revolver has various restrictive financial covenants, which include maintaining minimum fixed charge coverage and liquidity ratios as well as amaximum consolidated leverage ratio. The New Revolver also contains restrictions on additional indebtedness and, subject to certain exceptions, circumstancesunder which the Company can make a distribution to its members. Distributions to fund tax obligations of members are permitted so long as there are no events ofdefault, including those related to compliance with financial covenants,
F-20

Table of Contents
immediately prior to or after giving effect to any such distribution. Distributions other than those to fund members’ tax obligations are subject to the Companyachieving specified levels of earnings before interest, taxes, depreciation and amortization or maintaining minimum levels of cash, as defined in the NewRevolver.
If the Company’s financial results in future periods were to deteriorate and result in non-compliance with the financial covenants of the New Revolver, theCompany could attempt to obtain covenant relief or obtain a waiver from the lenders for specific non-compliance matters. The Company can give no assurancethat it could obtain covenant relief or obtain waivers from the lenders in the event of non-compliance with financial or other covenant requirements in the NewRevolver. In the event of non-compliance with the covenants provided for in the New Revolver, the lenders could declare all or any outstanding borrowingsimmediately due and payable or terminate the agreement. Capital Leases The Company has capital lease agreements that are collateralized by the underlying property and equipment and expire through September 2019. Theweighted-average imputed interest rates for the capital lease agreements were 9.8%, 5.9%, and 5.6% at December 31, 2008, 2009 and 2010, respectively.
The future contractual maturities of long-term debt, including the term loan and capital lease obligations, as of December 31, 2010 are as follows (inthousands): 2011 $ 2,279 2012 1,950 2013 12,533 2014 74 2015 76 Thereafter 306
$17,218
8. Commitments and Contingencies Operating Leases The Company leases its office space and certain equipment under noncancelable operating lease agreements with various expiration dates through August2018. As of December 31, 2010, future minimum payments under operating leases were as follows (in thousands): 2011 $ 5,361 2012 5,294 2013 4,347 2014 4,091 2015 2,693 Thereafter 3,274
$25,060
Rent expense during 2008, 2009 and 2010 was $4.2 million, $3.8 million, and $5.1 million, respectively.
During 2010, the Company entered into eight new operating leases resulting in aggregate future lease commitments of $6.6 million over lease periods
ranging from one to three years. In February 2010, the Company recorded a $0.4 million charge to terminate an office lease prior to its expiration.
F-21

Table of Contents
Other Matters The Company may be subject to litigation or other claims in the normal course of business. In the opinion of management, the Company’s ultimate liability,if any, related to pending or threatened litigation or claims would not materially affect its consolidated financial position, results of operations or cash flows. 9. Members’ Equity Members’ equity consists of one class of common shares. Income is allocated pro rata to members as defined in the limited liability company agreement.The holder of each common share is entitled to one vote. Members are entitled to mandatory distributions for their respective income tax expense resulting fromthe operations of the LLC and other distributions as and when declared by the board of directors.
The Company repurchased 35,000 shares and 86,157 shares during 2009 and 2010, respectively, at the then estimated fair value. All of the acquired sharesare held as treasury shares on the accompanying statements of members’ equity and comprehensive income (loss).
Other than distributions upon a redemption or liquidation event, as defined in the Company’s limited liability company Agreement, funds and assets of theCompany determined by the Company’s board of directors to be available for distribution shall be distributed to all of the members, pro rata in proportion to thenumber of vested common shares held by each member. 10. Share-Based Compensation and Subsequent Event Share Option Plans The Company has granted options through two approved plans, the Company’s 2004 Omnibus Share Plan and the 2008 Option Plan (collectively, the“Option Plans”). The Company’s 2004 Omnibus Share Plan (the “2004 Plan”) authorizes the granting of options and restricted shares to directors, officers,employees and consultants of the Company. During 2008, the board of directors increased the number of authorized common shares under the 2004 Plan by2,566,000 shares to a total of 12,950,000 shares. In December 2008, the Company adopted the 2008 Option Plan (the “2008 Plan”), and currently grants optionsonly through the 2008 Plan. A total of 10,000,000 common shares have been reserved for issuance under the 2008 Plan. The Company’s board of directorsadministers the Option Plans and has authority to determine the directors, officers, employees and consultants to whom options or restricted shares may begranted, the option price or restricted share purchase price, the timing of when each share is exercisable and the duration of the exercise period and the nature ofany restrictions or vesting periods applicable to an option or restricted share grant.
Under the Option Plans, options granted are generally subject to a four-year vesting period whereby options become 25% vested after a one-year periodand then vest monthly through the end of the vesting period. Vested options may be exercised up to ten years from the vesting commencement date, as defined inthe Option Plans. Vested but unexercised options expire three months after termination of employment with the Company. Certain grants are exercisable beforebecoming vested, but the unvested optioned shares are subject to a repurchase agreement in the event the employee is terminated either voluntarily orinvoluntarily whereby the repurchase price is equal to the option exercise price. Proceeds from the exercise of unvested options are classified as a liability uponexercise and are reclassified to equity as the underlying shares vest to the employee. The liability for exercises of unvested options was not significant for any ofthe periods reported on. There were no shares subject to repurchase outstanding at December 31, 2009 or 2010.
There were no significant modifications or repurchases in 2008 or 2009. In June 2010, the Company modified the vesting of 260,416 share options grantedto one employee such that the cancellation of the vested shares occurred 12 months after termination of the employee. This transaction was accounted for as amodification and total incremental compensation cost resulting from the modification amounted to $0.1 million.
F-22

Table of Contents
The Company has elected to recognize the compensation cost of all share-based awards on a straight-line basis over the vesting period of the award.Further, the Company applied an estimated forfeiture rate to unvested awards when computing the share compensation expenses. The Company estimated theforfeiture rate for unvested awards based on its historical experience on employee turnover behavior and other factors during the preceding three calendar years. Employee Stock Purchase Plan On February 9, 2011, the Company’s board of directors approved the 2011 Employee Stock Purchase Plan, under which 900,000 shares have been reservedfor issuance. The 2011 Employee Stock Purchase Plan contains successive six-month offering periods and the share price of stock purchased under the plan is85% of the lower of the fair value of the common stock either at the beginning or the end of the period. At the end of each fiscal year, the share reserve willincrease automatically by an amount equal to 1% outstanding shares as of the end of that most recently completed fiscal year. Share Awards Issued to Non Employees During 2008 and 2010, the Company granted share options to purchase 8,333, and 25,000 common shares, respectively, to non employees for professionalservices at exercise prices ranging from $4.26 to $4.95 per share under the 2008 Plan. Share-based compensation expense related to share options granted to nonemployees was $0.1 million during 2010 and insignificant in 2008. The weighted-average remaining contractual terms at December 31, 2010 for the two optionsgrants was 7.1 years and 9.6 years, respectively. Determining Fair Value of Share Options The estimated fair value of share options granted during 2008, 2009 and 2010, was approximately $6.6 million, $7.7 million and $20.5 million,respectively. The fair value of the share options was estimated by using the Black-Scholes option- pricing model, which takes into account inputs such as theexercise price, the value of the underlying common shares at the grant date, expected term, expected volatility, risk-free interest rate and dividend yield. The fairmarket value of each grant of options during 2008, 2009 and 2010 was determined by the Company using the methods and assumptions discussed below. TheCompany stratifies its population of outstanding share options into two relatively homogeneous groups to estimate the expected term and forfeiture rate of optionsgrants. Each of these inputs is subjective and generally requires significant judgment to determine.
Expected Term—The expected term represents the period that the Company’s share-based awards are expected to be outstanding. The Company calculatedthe expected term of share options using four data points: options exercised, options expired, options forfeited and options outstanding. The weighted-average ofthe four data points were used to calculate the expected term.
Expected Volatility—The expected volatility was based on the historical stock volatility of several of the Company’s self-designated publicly listedcomparable companies over a period equal to the expected terms of the options, as the Company does not have any trading history to use the volatility of its owncommon shares.
Risk-Free Interest Rate—The risk-free interest rate was based on the implied yield on U.S. Treasury zero-coupon issues for each option grant date withmaturities approximately equal to the option’s contractual term.
Expected Dividend Yield—The Company has not paid dividends on its common shares nor does it expect to pay dividends in the foreseeable future beyondannual tax distributions to LLC members.
Forfeiture Rate—The Company estimated its forfeiture rate based on an analysis of its actual forfeitures and will continue to evaluate the adequacy of theforfeiture rate based on actual forfeiture experience, analysis of employee turnover behavior, and other factors. The impact from a forfeiture-rate adjustment willbe recognized
F-23
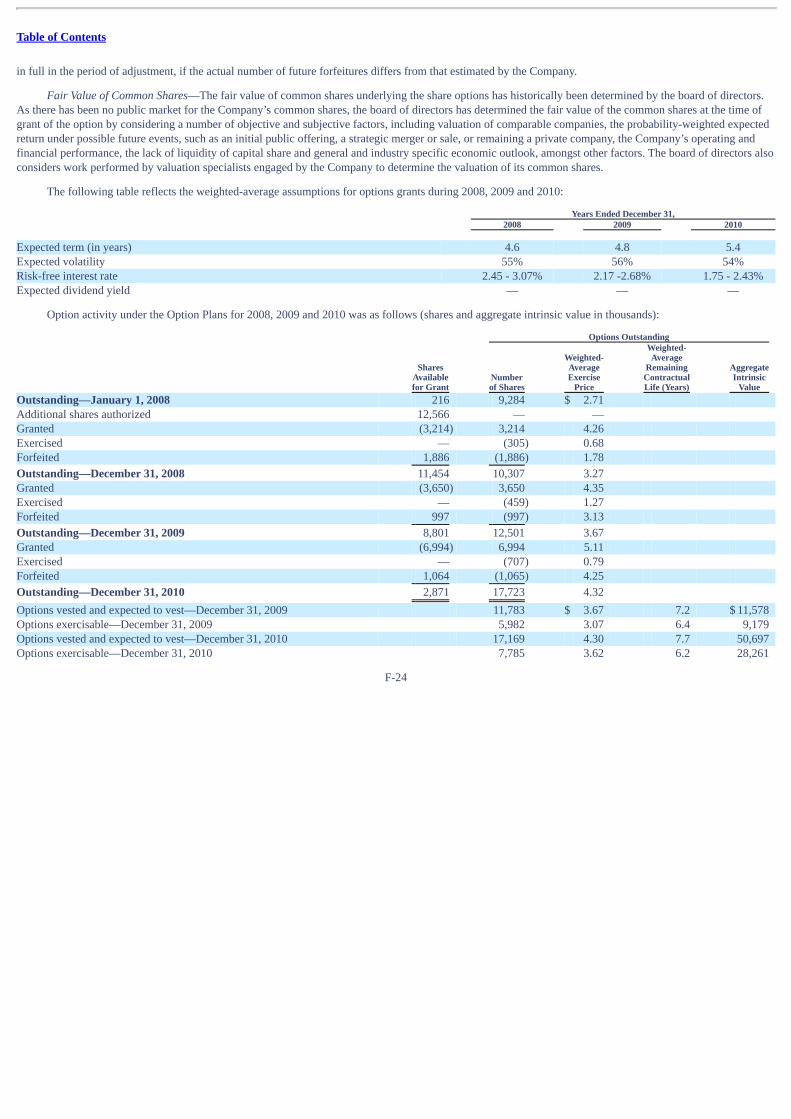
Table of Contents
in full in the period of adjustment, if the actual number of future forfeitures differs from that estimated by the Company.
Fair Value of Common Shares—The fair value of common shares underlying the share options has historically been determined by the board of directors.As there has been no public market for the Company’s common shares, the board of directors has determined the fair value of the common shares at the time ofgrant of the option by considering a number of objective and subjective factors, including valuation of comparable companies, the probability-weighted expectedreturn under possible future events, such as an initial public offering, a strategic merger or sale, or remaining a private company, the Company’s operating andfinancial performance, the lack of liquidity of capital share and general and industry specific economic outlook, amongst other factors. The board of directors alsoconsiders work performed by valuation specialists engaged by the Company to determine the valuation of its common shares.
The following table reflects the weighted-average assumptions for options grants during 2008, 2009 and 2010: Years Ended December 31, 2008 2009 2010 Expected term (in years) 4.6 4.8 5.4Expected volatility 55% 56% 54%Risk-free interest rate 2.45 - 3.07% 2.17 -2.68% 1.75 - 2.43%Expected dividend yield — — —
Option activity under the Option Plans for 2008, 2009 and 2010 was as follows (shares and aggregate intrinsic value in thousands): Options Outstanding
SharesAvailablefor Grant
Numberof Shares
Weighted-AverageExercise
Price
Weighted-Average
RemainingContractualLife (Years)
AggregateIntrinsic
Value Outstanding—January 1, 2008 216 9,284 $ 2.71 Additional shares authorized 12,566 — — Granted (3,214) 3,214 4.26 Exercised — (305) 0.68 Forfeited 1,886 (1,886) 1.78
Outstanding—December 31, 2008 11,454 10,307 3.27 Granted (3,650) 3,650 4.35 Exercised — (459) 1.27 Forfeited 997 (997) 3.13
Outstanding—December 31, 2009 8,801 12,501 3.67 Granted (6,994) 6,994 5.11 Exercised — (707) 0.79 Forfeited 1,064 (1,065) 4.25
Outstanding—December 31, 2010 2,871 17,723 4.32
Options vested and expected to vest—December 31, 2009 11,783 $ 3.67 7.2 $ 11,578 Options exercisable—December 31, 2009 5,982 3.07 6.4 9,179 Options vested and expected to vest—December 31, 2010 17,169 4.30 7.7 50,697 Options exercisable—December 31, 2010 7,785 3.62 6.2 28,261
F-24

Table of Contents
The weighted-average grant date fair value of options granted during 2008, 2009 and 2010 was $2.05, $2.12 and $2.93, respectively. The aggregateintrinsic value of options exercised under the Option Plans was $1.1 million, $1.4 million and $2.8 million in 2008, 2009 and 2010, respectively, determined as ofthe date of option exercise. The intrinsic value is calculated as the difference between the fair value of the common shares on the exercise date and the exerciseprice of the option shares. The total estimated fair value of share options vested in 2008, 2009 and 2010 was $6.6 million, $8.5 million and $6.9 million,respectively.
Share-based compensation expense is based on applying calculated fair values determined at the grant date to those options granted in the year that areultimately expected to vest. Accordingly, the fair values calculated on the total population of grants have been reduced for estimated forfeitures expected to occurin the future. The Company’s share-based compensation expense during 2008, 2009 and 2010 was $5.4 million, $6.1 million and $8.1 million, respectively.During 2008, 2009 and 2010 the tax benefit related to share-based compensation expense was $0.2 million, $0.1 million and $0.1 million, respectively.
The table below summarizes share-based compensation expense as allocated within the Company’s consolidated statements of operations (in thousands): Years Ended December 31, 2008 2009 2010 Cost of revenue $1,271 $ 914 $1,126 Sales and marketing 1,570 2,340 2,993 Research and development — 541 803 General and administrative 2,608 2,265 3,167
$5,449 $6,060 $8,089
The following table summarizes information about share options outstanding at December 31, 2010 (shares in thousands):
Options Outstanding Options Exercisable
Range of Exercise Prices
Number ofShares
Outstanding
Weighted-Average
RemainingContractLife (inYears)
Weighted-AverageExercisePrice per
Share
Number ofShares
Exercisable
WeightedAverageExercise
Price $0.20 to $1.49 1,605 5.1 $ 1.08 1,605 $ 1.08 $4.26 8,405 6.8 4.26 5,862 4.26 $4.60 to $5.80 7,713 9.3 5.06 318 4.64
17,723 7.8 4.32 7,785 3.62
As of December 31, 2009 and 2010 there was $12.0 million and $22.6 million of unrecognized compensation expense related to nonvested share-based
compensation arrangements granted under the Option Plans, which is expected to be recognized over a weighted-average period of 1.7 years and 3.1 years,respectively. 11. Employee Benefit Plan The Company maintains a 401(k) defined contribution benefit plan that covers all eligible domestic employees who have attained 21 years of age andprovide at least 20 hours of service per week. This plan allows U.S. employees to contribute up to 90% of their pre-tax salary in certain investments at thediscretion of the employee, up to maximum annual contribution limits established by the U.S. Department of Treasury. During
F-25

Table of Contents
2008, 2009 and 2010, the Company matched, up to an annual limit of $2,000, the first 3% of a participant’s contributions. Matching contributions by theCompany are fully vested upon completion of the first year of employment. Employer matching contributions, which may be discontinued at the Company’sdiscretion, amounted to $0.5 million, $0.6 million, and $0.7 million during 2008, 2009 and 2010, respectively. 12. Income Taxes Income from continuing operations before provision for income taxes for the Company’s domestic and international operations was as follows (inthousands): Years Ended December 31, 2008 2009 2010 Domestic $4,295 $ 9,562 $(1,734) International 1,679 2,679 1,314
Income (loss) before provision for income taxes $5,974 $12,241 $ (420)
The income tax provision consisted of the following (in thousands):
Years Ended December 31, 2008 2009 2010 Current:
Federal $ 2,431 $ 2,244 $ 2,448 Foreign 32 280 567 State and local 571 367 472
Total current income tax provision 3,034 2,891 3,487 Deferred:
Federal (1,608) (585) (687) Foreign 514 264 — State and local (787) (704) (653)
Total deferred income tax benefit (1,881) (1,025) (1,340)
Income tax provision $ 1,153 $ 1,866 $ 2,147
The following table provides a reconciliation of income taxes provided at the federal statutory rate of 34% to the income tax provision (in thousands):
Years Ended December 31, 2008 2009 2010 U.S. income tax at federal statutory rate for LLC $ — $ — $ — U.S. income tax at federal statutory rate for taxable subsidiaries 2,031 4,151 (143) (Benefit) provision from (income) loss attributable to LLC (118) (1,432) 1,711 Benefit from change in tax status (758) — — State income taxes, net of federal benefit 277 241 153 Foreign tax rate differential (305) (476) 40 Permanent differences 282 266 536 State tax credits (249) (413) (330) Other, net (7) (471) 180
$1,153 $ 1,866 $2,147
F-26

Table of Contents
At January 1, 2008, the Company transferred a portion of its U.S. operations from its LLC to a wholly-owned U.S. taxable subsidiary. As the companiesare part of this consolidated group, the amounts were eliminated in consolidation and the transaction effectively was accounted for as a change in tax status inthese consolidated financial statements. For tax purposes however, the assets were transferred to the U.S. taxable subsidiary at their current book and tax basis,thereby creating new net deferred tax assets at the U.S. taxable subsidiary. As such, deferred tax assets and liabilities were established on the basis of thetransferred assets and liabilities and the Company recorded an income tax benefit of $0.8 million from the change in income tax status as of January 1, 2008.
The following table provides the effect of temporary differences that created deferred income taxes as of December 31, 2009 and 2010. Deferred tax assetsand (liabilities) represent the future effects on income taxes resulting from temporary differences and carry-forwards at the end of the respective periods (inthousands): December 31, 2009 2010 Current
Accrued liabilities $ 392 $1,062 State taxes 129 93 Allowance for doubtful accounts 192 —
Current deferred tax assets 713 1,155
Non-current Share-based compensation expense 2,546 3,622 State tax credits 609 847 Unrealized loss on foreign exchange transactions 93 46 Property & equipment (366) (735)
Non-current deferred tax assets, net 2,882 3,780
Total deferred tax assets, net $3,595 $4,935
As of December 31, 2009 and 2010, management assessed the realizability of deferred tax assets and determined that based on the available evidence,
including a history of taxable income and estimates of future taxable income, it is more likely than not that the deferred tax assets will be realized. AtDecember 31, 2010, the Company had $0.9 million of state tax credits which expire beginning in 2023 if not utilized.
The Company files U.S. federal and state and foreign income tax returns in jurisdictions with varying statutes of limitations. In the normal course ofbusiness the Company is subject to examination by taxing authorities throughout the world. These audits include questioning the timing and amount ofdeductions, the allocation of income among various tax jurisdictions and compliance with federal, state, local and foreign tax laws. In November 2010, theCompany concluded an IRS audit of the 2008 tax year which resulted in a change to a temporary difference but with no impact on the 2008 income tax provisionas previously reported. The 2006 through 2009 tax years generally remain subject to examination by federal, state, and foreign tax authorities. As of December31, 2008, 2009 and 2010, the Company did not have any unrecognized tax benefits that if recognized would impact the annual effective tax rate.
It is difficult to predict the final timing and resolution of any particular uncertain tax position. Based on the Company’s assessment of many factors,including past experience and complex judgments about future events, the Company does not expect that changes in the liability for unrecognized tax benefitsduring the next twelve months will have a significant impact on the Company’s consolidated financial position or results of operations.
F-27
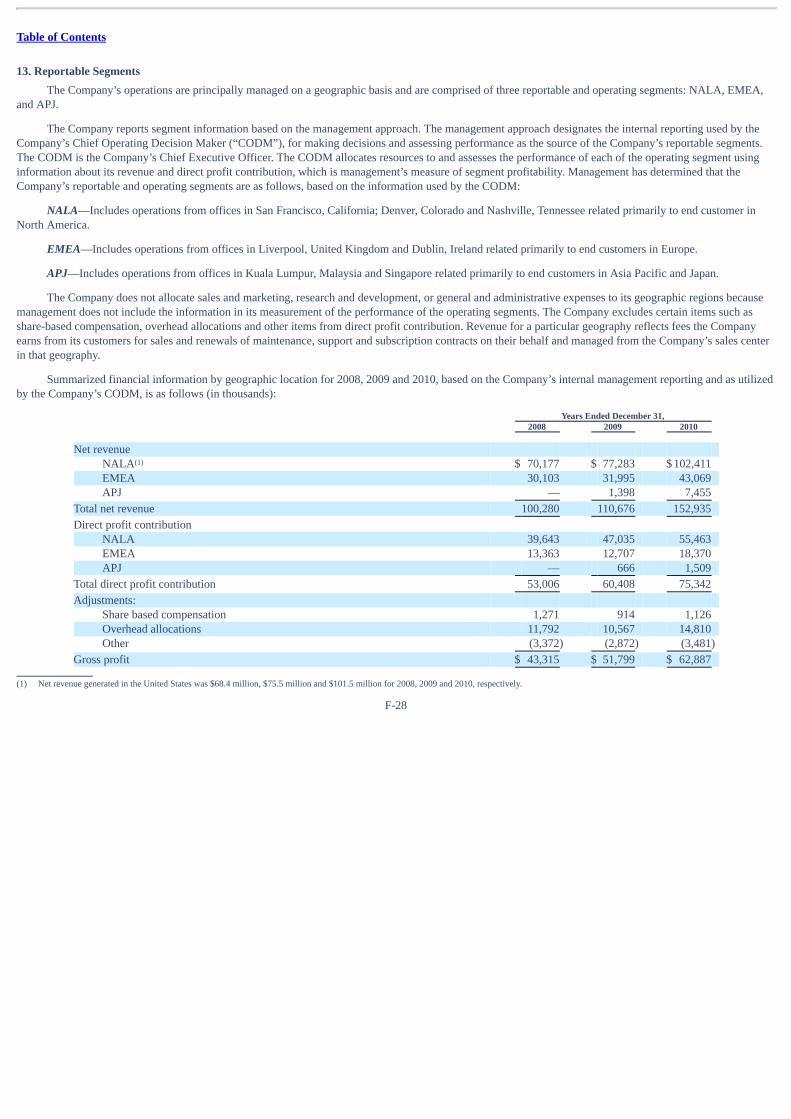
Table of Contents
13. Reportable Segments The Company’s operations are principally managed on a geographic basis and are comprised of three reportable and operating segments: NALA, EMEA,and APJ.
The Company reports segment information based on the management approach. The management approach designates the internal reporting used by theCompany’s Chief Operating Decision Maker (“CODM”), for making decisions and assessing performance as the source of the Company’s reportable segments.The CODM is the Company’s Chief Executive Officer. The CODM allocates resources to and assesses the performance of each of the operating segment usinginformation about its revenue and direct profit contribution, which is management’s measure of segment profitability. Management has determined that theCompany’s reportable and operating segments are as follows, based on the information used by the CODM:
NALA—Includes operations from offices in San Francisco, California; Denver, Colorado and Nashville, Tennessee related primarily to end customer inNorth America.
EMEA—Includes operations from offices in Liverpool, United Kingdom and Dublin, Ireland related primarily to end customers in Europe.
APJ—Includes operations from offices in Kuala Lumpur, Malaysia and Singapore related primarily to end customers in Asia Pacific and Japan.
The Company does not allocate sales and marketing, research and development, or general and administrative expenses to its geographic regions becausemanagement does not include the information in its measurement of the performance of the operating segments. The Company excludes certain items such asshare-based compensation, overhead allocations and other items from direct profit contribution. Revenue for a particular geography reflects fees the Companyearns from its customers for sales and renewals of maintenance, support and subscription contracts on their behalf and managed from the Company’s sales centerin that geography.
Summarized financial information by geographic location for 2008, 2009 and 2010, based on the Company’s internal management reporting and as utilizedby the Company’s CODM, is as follows (in thousands):
Years Ended December 31, 2008 2009 2010 Net revenue
NALA $ 70,177 $ 77,283 $ 102,411 EMEA 30,103 31,995 43,069 APJ — 1,398 7,455
Total net revenue 100,280 110,676 152,935
Direct profit contribution NALA 39,643 47,035 55,463 EMEA 13,363 12,707 18,370 APJ — 666 1,509
Total direct profit contribution 53,006 60,408 75,342
Adjustments: Share based compensation 1,271 914 1,126 Overhead allocations 11,792 10,567 14,810 Other (3,372) (2,872) (3,481)
Gross profit $ 43,315 $ 51,799 $ 62,887
(1) Net revenue generated in the United States was $68.4 million, $75.5 million and $101.5 million for 2008, 2009 and 2010, respectively.
F-28
(1)

Table of Contents
The majority of the Company’s assets were attributable to its U.S. operations at December 31, 2009 and 2010. Property and equipment information is basedon the physical location of the assets. The following table presents the long-lived assets, consisting principally of property and equipment, by geographic location(in thousands):
December 31, 2009 2010 NALA $12,658 $16,844 EMEA 1,123 1,444 APJ 220 1,130
Total property and equipment, net $14,001 $19,418
14. Subsequent Events The Company has evaluated subsequent events through February 25, 2011, which is the date the consolidated financial statements for the year endedDecember 31, 2010 were issued.
On February 28, 2011, the Company reached an agreement to settle amounts owed to Oracle/Sun as reported in accrued payables to customers, net ofamounts owed to the Company from Oracle/Sun as reported in advances to customers and accounts receivable, on the accompanying consolidated balance sheetat December 31, 2010. This agreement also released the Company from providing any further account management services for end customers. In connectionwith this agreement, the Company made cash payments to Oracle of approximately $18.1 million to settle the outstanding accrued payables and advances toOracle/Sun and the Company expects to recognize net revenue of approximately $2.0 million to $2.5 million during 2011 (unaudited).
F-29

Table of Contents